paper aceite calor
TRANSCRIPT
7/30/2019 Paper Aceite Calor
http://slidepdf.com/reader/full/paper-aceite-calor 1/8
Original article
Effect of pan-frying in extra-virgin olive oil on odour profile, volatile
compounds and vitamins
Valeria Messina,1* Andrea Biolatto,2 Adriana Descalzo,2 Ana Sancho,2 Rosa Baby1 & Noemı Walso ¨ e de Reca1
1 CINSO (Centro de Investigaciones en SOlidos), CITEFA-CONICET, Juan Bautista de la Salle 4970, Villa Martelli, Buenos Aires, Argentina
2 Instituto Tecnologı ´a de Alimentos, Centro de Investigacio ´ n de Agroindustria, Instituto Nacional de Tecnologı ´a Agropecuaria (INTA), CC 77
(B1708WAB) Moro ´ n, Buenos Aires, Argentina
(Received 11 December 2007; Accepted in revised form 18 August 2008)
Summary Changes in odour of Arauco (ARA) and Arbequina (ARB) extra-virgin olive oil (OO) were monitored
during frying by electronic nose (EN) and solid-phase microextraction–gas chromatography methodologies.
Degradation of a- and c-tocopherols was monitored by HPLC. Electronic nose data and volatile compounds
were analysed at intervals of 15 min (t15) during 60 min of frying (t60). a- and c-tocopherols were determined
at intervals of 5 min (t5) during 30 min of frying (t30). Principal components analysis applied to EN data
showed one component, PC1 which accounted 96.6% of the total odour variation. SnO2 sensors had apositive correlation with PC1. ARA variety corresponding to frying t60 had the highest positive correlation
with PC1. Analysis of variance results for volatile compounds showed an increase on production for: 3-
methyl butanal, n-pentanal, n-hexanal, n-heptanal and n-nonanal at 15 min of frying for ARB OO and at
30 min for ARA OO. a-tocopherol and c-tocopherol showed an important decrease after the first 5 min of
frying for ARB OO and at 15 min for ARA OO.
Keywords Electronic nose, extra-virgin olive oil, solid-phase microextraction–gas chromatography, vitamin E, volatile compounds.
Introduction
Aroma, taste, colour and nutritive properties of virginolive oil (OO) distinguish it from other edible vegetableoils. The complex flavour, the combination of odourand taste, of virgin OO is mainly produced by volatileand phenol compounds (Guth & Grosch, 1993; Aparicioet al., 1996).
Virgin OO is considered to be stable oil, but it issusceptible to oxidation because of this reason thatpleasant sensory characteristics of the oil change tounpleasant ones (off-flavour) (Tsimidou et al., 1992).
Oxidation process can be promoted by the presence of atmospheric triplet oxygen (3O2), which reacts with lipidradicals and causes oxidation (a free radical chainreaction including different steps, initiation, propaga-
tion and termination). The primary oxidation products,lipid hydroperoxides, are stable at room temperatureand in the absence of metals (iron and copper). Presenceof high temperature and metals promote decompositionof lipid hydroperoxides to alkoxy radicals, and thenform secondary products such as aldehydes, ketones,
acids, esters, alcohols and short-chain hydrocarbons(Min & Bradley, 1992; Vaisey-Genser et al., 1999;
Velasco et al., 2004).Morales et al. (1997) reported that when oxidationprocess proceeds, some specific volatile compound suchas n-nonanal can be used as a marker of oxidationprocess in virgin OO.
On the contrary, edible oils naturally contain antiox-idants such as tocopherols, tocotrienols, carotenoids,phenolic compounds and sterols. Antioxidants arecompounds that extend the induction period of oxida-tion or slow down the oxidation rate. Antioxidantsscavenge free radicals such as lipid alkyl radicals or lipidperoxy radicals, control transition metals (iron andcopper), quench singlet oxygen and inactivate sensitisers(Vercelloti et al., 1992; Aparicio et al., 2000; Gutierrez
et al., 2002; Chloe & Min, 2006). Products of oxidationmay also decrease nutritional quality and safety (Vichiet al ., 2003b).
Flavour analysis has been commonly carried out byhuman assessment. Trained panels can determinedescriptors to better assess a certain product qualityand detect modification due to taints, off-odours oroff-flavours. Nevertheless, sensory panels are time-consuming and have limitations related to human
*Correspondent: Fax: +54 11 4709 8241;
e-mail: [email protected]
International Journal of Food Science and Technology 2009, 44, 552–55952
doi:10.1111/j.1365-2621.2008.01844.x
Ó 2009 The Authors. Journal compilation Ó 2009 Institute of Food Science and Technology
7/30/2019 Paper Aceite Calor
http://slidepdf.com/reader/full/paper-aceite-calor 2/8
susceptibility and variability (Pearce & Gardner, 1998).As stated by Piggott (1994), each sensory character canbe viewed as being a single and important part in theentire set of quality features. Because of these reasons,there is great interest in using electronic nose (EN) formeasuring odour. EN is characterised for being rapid,
quantitative, reproductive and objective. Severalauthors have reported application of EN on differentfields such as food industry, especially OO (Di Nataleet al., 1998; Aparicio et al., 2000; Stella et al., 2000),medicinal plants (Baby et al., 2005), environmental(Baby et al., 2000), etc.
The aim of this work was to study changes in theodour caused by thermal oxidation (pan-frying). In firststep, sensory evaluation results were compared to ENresults. In the second step, varieties of extra-virgin oliveoil (EVOO) were monitored during frying by an ENapproach complemented with the determination of volatile aldehydes and a- and c-tocopherol content.
Materials and methods
The experimental part was divided into two steps. In thefirst step, sensors response of EN was evaluated andexperimental conditions of EN were optimised usingedible oils.
Once established the experimental conditions andmethodology of EN, sensory evaluation was studiedusing fresh EVOO and OO obtained from grocery, andheated (pan-frying) extra-virgin olive oil (EVOOH) andolive oil (OOH) in order to be able to compare resultswith those obtained with the EN.
The methodology and experimental conditions of EN
established in the first step was applied in the secondstep to evaluate changes in the odour, caused by thermaloxidation (pan-frying), of Arauco (ARA) and Arbequ-ina (ARB) EVOO.
First step
Edible oil samplesEdible oils: soya oil (SO), sunflower oil (SON), EVOOand OO were obtained from grocery.
Extra-virgin olive oil and olive oil pan-frying processFor thermal oxidation, frying pans were filled with600 mL of each oil (EVOO and OO) and heated at
180 °C during 60 min. Oil samples were obtained at thebeginning of the experiment and then at 60 min (t60) of pan-frying for sensory evaluation and EN. Samples werecooled at room temperature.
MethodologiesElectronic nose. An electronic nose MOSES II (ModularSensor System) was used to discriminate odours of edible oils. MOSES II contains two modules of gas
sensors, one of them composed of eight quartzmicrobalance sensors (QMB). This type of sensorsconsists of vibrating quartz crystals covered withpolymeric selective coatings, on which gases areadsorbed. The initial vibration frequency (m 0) of crystals decreases according to the mass increase
because of the gases adsorption and the differencebetween m 0 and the final frequency (m f ) resultsproportional to the adsorbed gas concentration. Theother module of sensors (SnO2) is composed by eightpure and doped semiconductive SnO2 sensors. Dopingwith different elements increases SnO2 selectivity fordifferent gases. The SnO2 surface conductivity changesas the semiconductor adsorbs oxidising or reductivegases (Walso ¨ e de Reca et al., 2000). The adoptedconfiguration results very flexible for general purposesand convenient for a wide range of applications.
The EN provides data generally in bidimensionalplots using the PCA statistical method. PCA algorithmmakes use of the advantage that sensors are relatively
non-specific and that it can combine the signals of all thesensors in a unique signal. Employing this method,similar odours tend to be grouped in clusters and theresult is a bidimensional plot (axes are the componentswhich contribute most to the odour expresses inpercentage).
Samples. Samples of 3 ± 0.005 g for each quality of edible oil (SO, SON, EVOO and OO) were placed in five10-mL glass vial equipped with a screw cap and siliconseptum. Samples were stabilised at 40 °C for 10 min(incubation time) in an 86.50 Dani Headspace samplerand introduced into the MOSES II. Synthetic air was
employed as carrier gas with a flow of 30 mL min
)1
.Sensory evaluation for extra-virgin olive oil and olive oil samples (pan-frying)Assessors. Fourty-five assessors (all Argentine females,age ranged from 20 to 22 years) took part in theexperiment. Triangle test (ASTM, 1977) was performedto compare OO odours. During the two testing sessions(first session: EVOO vs. EVOOH; second session: OOvs. OOH), assessors were required to pick the samplewhich they believed was different. Olive oils (120 mL)were placed in a sealed glass flask (250 mL, 3 cmdiameter opening) and presented to assessors identifiedwith random three-digit codes. Evaluation wasperformed only by sniffing the headspace in order to
be compared with EN.
Second step
Extra-virgin olive oil varieties samplesExtra-virgin olive oil from ARA and ARB varieties wereproperly obtained from fresh, mature fruits of goodquality provided by an OO mill from Chacras de Coria(Mendoza, Argentina) from March 2005 crop season.
Effect of pan-frying in extra-virgin olive oil V. Messina et al.
Ó 2009 The Authors. Journal compilation Ó 2009 Institute of Food Science and Technology International Journal of Food Science and Technology 2009
7/30/2019 Paper Aceite Calor
http://slidepdf.com/reader/full/paper-aceite-calor 3/8
Pan-frying processFor thermal oxidation, frying pans were filled with600 mL of EVOO (ARB and ARA) and heated at180 °C. Oil samples were obtained at the beginning of the experiment and then, four times at intervals of 15 min (t15) during 60 min (t60) for EN and volatile
compounds determination. Besides, for determinationof a- and c-tocopherol content, oil samples were alsoobtained at the beginning of the experiment and atintervals of 5 min (t5) during 30 min (t30).
Samples were cooled at room temperature and storedunder nitrogen atmosphere at )20 ± 1 °C until analy-sis. Frying procedure was repeated thrice and triplicatesamples were taken each time.
MethodologiesElectronic nose. The methodology and experimentalconditions of EN established in the first step wasapplied in the second step. Analyses were carried outby triplicate.
Extraction of a- and c-tocopherols. a- and c-tocopherolswere extracted as described by Deiana et al. (2002).EVOO (ARB and ARA) samples were homogenised for2 min at 3000 r.p.m. with an Ultra Turrax typehomogeniser with 1% of pyrogallol in ethanol.Saponification was performed for 30 min at 70 °Cwith 1 mL of 12 N KOH. Then, the samples wereextracted twice with n-hexane after the addition of distillate water, evaporated under nitrogen flow,resuspended in absolute ethanol and filtered through a0.45-micropore nylon membrane before injection.
HPLC analysis of a- and c-tocopherols. The HPLC pump
(model P400) with a membrane vacuum degasser and a20-lL loop injector (TSP –Thermo Separation ProductsInc., Riviera Beach, FL, USA) was connected toan Alltima C18 column (250 mm · 4.6 mm), 5 lmparticle size. The electrochemical detector wasequipped with a flowcell with Ag ⁄ AgCl and glassycarbon reference and working electrodes, respectively.The mobile phase used for electrochemical detection wasmodified by the technique described by Gimeno et al.(2002). The flow rate was 1 mL min)1 and the referencecell was set at 700 mV. Recovery of a-tocopherol was98%. Calibration curves were performed with DL-a-tocopherol and c-tocopherol diluted in absolute ethanol.Volatile aldehydes by solid-phase microextraction–gas
chromatography. Aliquots of 5 ± 0.05 g of EVOO(ARB and ARA) were placed into 10 mL headspacevials, adding 100 lL of internal standard solution(100 lg g)1 4-methyl-2-pentanone). Vials were sealedwith crimp-top caps with TFE-silicone septa seals.
The volatile compounds in the headspace of EVOOwere extracted using Divinylbenzene ⁄ Carboxen ⁄ Poly-dimethylsiloxane (DVB ⁄ CAR ⁄ PDMS) 50 ⁄ 30 lm fibre(Vichi et al., 2003b). The setting on the solid-phase
microextraction (SPME) holder assembly scale wasadjusted to 1.0 scale unit to ensure that the fibre waspositioned in the headspace above the sample in exactlythe same way from run to run. SPME extractions werecarried out placing the sample vial in a water bath at50 °C for 40 min. Then, the fibre was retracted into the
needle assembly and removed from the vial. The settingon the SPME holder assembly was changed to 4.4 scaleunits prior to injection into the gas chromatography(GC) injector port, which was fitted with a special insertfor SPME analysis. For thermal desorption, the SPMEfibre remained in the injector for 5 min. Three separateSPME extractions were collected from each sample.
GC analysis of volatile compounds. A Shimadzu series 14Bgas–liquid chromatograph, equipped with a flameionisation detector was used. The injector was operatedin the splitless mode at a temperature of 260 °C and thedetector at 280 °C. Nitrogen was used as carrier gas at aflow of 1 mL min)1. A 30 m · 0.32 mm id · 1.00 lm
ATM5 capillary column was used. The following columntemperature-programming sequence was used: an initialtemperature of 40 °C was maintained for 5 min beforebeing increased to 80 °C a t 2°°C min)1 then, it wasraised from 80 °C to 150 °C at 4 °C min)1 and, finally,from 150 °C to 280 °C at a rate of 10 °C min)1 and heldfor 10 min. Peak identifications were based oncomparison of retention time of unknowns withauthentic compounds. The relative concentrations of individual compounds were determined by comparingthe peak area of the compound in each chromatogramwith that of the added 4-methyl-2-pentanone internalstandard (100 lL of 100 lg g)1 4-methyl-2-pentanone
solution) and considering the relative response factors of each studied compound. The internal standardquantification method was based on that described byVichi et al. (2003a) with the following modifications:standard mixtures with concentration in the range of 0.2–1.0 lg g)1 for 3-methyl butanal, n-pentanal, n-hexanal, n-heptanal and n-nonanal and were analysedunder the conditions described earlier; the absoluteresponse factors for each compound were thenobtained from the slope of the linear regression of thetotal peak area as a function of the concentration and therelative response factors were calculated as the ratiobetween the absolute response factors of each compoundto that of the internal standard. The relative
concentrations are the average of three separate SPMEextractions collected from each sample.
Statistical analysis
Principal components analysis was applied, on EN data,to describe the relation between variables and theirinfluence on frying time and EVOO varieties samplesusing the statistical software SPSS v. 12.
Effect of pan-frying in extra-virgin olive oil V. Messina et al.54
International Journal of Food Science and Technology 2009 Ó 2009 The Authors. Journal compilation Ó 2009 Institute of Food Science and Technology

7/30/2019 Paper Aceite Calor
http://slidepdf.com/reader/full/paper-aceite-calor 4/8
A fixed effect factorial model, using general linearmodel (GLM) procedure (SAS 8.0, SAS Institute Inc.,Cary, NC, USA) with two EVOO variety and sevenfrying times’ levels,
yijk = mean + EVOO varietyi + frying time j +(EVOO variety · frying time)ij + eijk
was applied on volatile compounds and a- and c-tocopherol levels. Volatile compounds and a- and c-tocopherols were reported as the mean value ± SD.Mean values were compared using the Tukey’s test at asignificance level of 0.05 (Weber & Skillings, 2000).
Results and discussion
First step
Selection of sensors of electronic nose (edible oils)Arrays of sixteen sensors (eight pure and doped SnO2
and eight QMB) were employed to evaluate the responseof odour of different edible oils obtained from grocery,
as stated in ‘Materials and methods’ section.SnO2 sensor array was chosen, because it showed
higher response to these oils compared to the responseof QMB array (data not shown).
SnO2 sensors are doped with different elements,increasing selectivity of the sensors for different gases.When gases are selected by SnO2 sensors, surface
conductivity of the sensors changes as the semiconduc-tor adsorbs oxidising or reductive compounds.
Figure 1 shows the capacity to differentiate oil sam-ples of different origin (seeds and fruits). The resultingdendrogram clearly separated two clusters. In the firstcluster, SON and SO are grouped; EVOO and OO are
grouped in another cluster. Separations are attributed inthis case to differences in the composition of the edibleoils studied. The quality of OO was not differentiatedwithin this assay.
Figure 1 Dendrogram of electronic nose data
using Ward Method for edible oils: sunflower
oil (SON), soya oil (SO), extra-virgin olive oil
(EVOO) and olive oil (OO) using doped
SnO2.
Figure 2 Sensory evaluation using Triangle test for fresh oils [extra-
virgin olive oil (EVOO) and olive oil (OO)] and heated oils at 180 °C
during 60 min (extra-virgin olive oil (EVOOH) and olive oil (OOH)).
(*** P < 0.001).
Effect of pan-frying in extra-virgin olive oil V. Messina et al.
Ó 2009 The Authors. Journal compilation Ó 2009 Institute of Food Science and Technology International Journal of Food Science and Technology 2009
7/30/2019 Paper Aceite Calor
http://slidepdf.com/reader/full/paper-aceite-calor 5/8
Electronic nose and sensory evaluation of extra-virgin oliveoil and olive oil samples (pan-frying)
Triangle test (sensory evaluation)Figure 2 shows the result for the triangle test corre-sponding to EVOO vs. EVOOH and OO vs. OOH
samples. As it can clearly be seen, samples showedsignificance differences (P < 0.001) between fresh oils(EVOO and OO) and heated samples (EVOOH andOOH), corresponding with 64.4% of hits for EVOO vs.EVOOH and 68.9% of hits for OO vs.OOH.
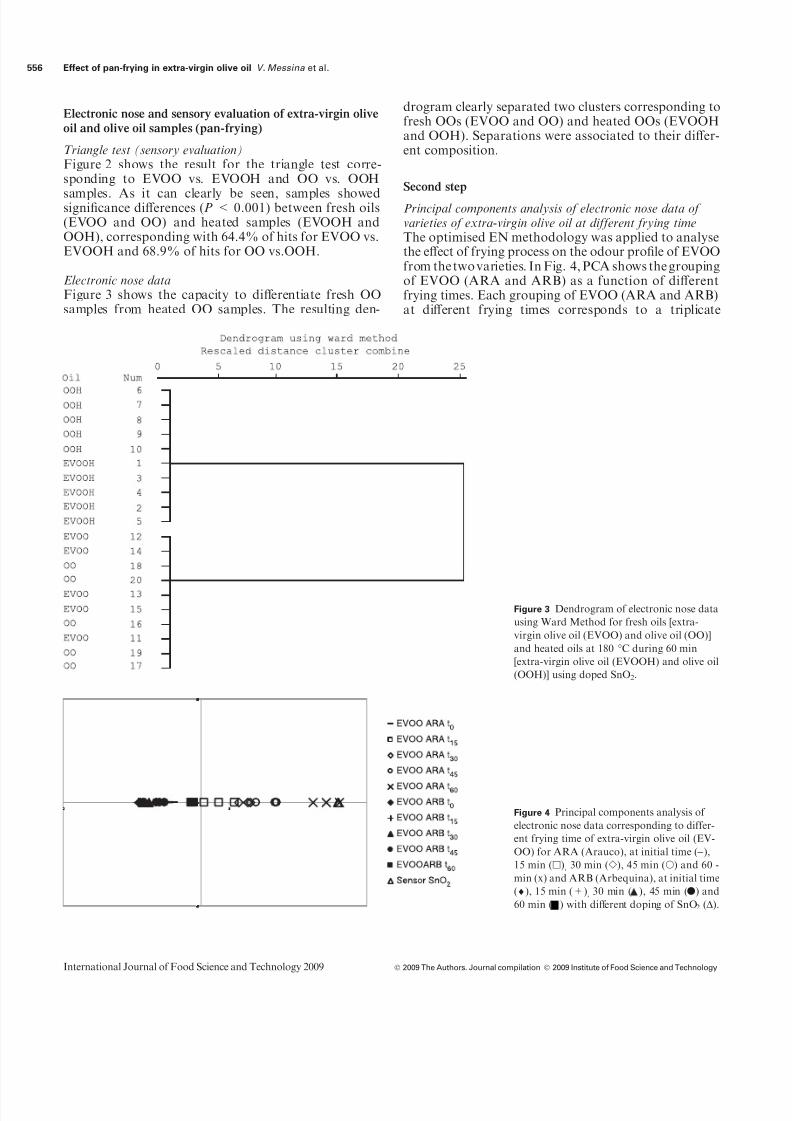
Electronic nose dataFigure 3 shows the capacity to differentiate fresh OOsamples from heated OO samples. The resulting den-
drogram clearly separated two clusters corresponding tofresh OOs (EVOO and OO) and heated OOs (EVOOHand OOH). Separations were associated to their differ-ent composition.
Second step
Principal components analysis of electronic nose data of varieties of extra-virgin olive oil at different frying timeThe optimised EN methodology was applied to analysethe effect of frying process on the odour profile of EVOOfrom the two varieties. In Fig. 4, PCA shows the groupingof EVOO (ARA and ARB) as a function of differentfrying times. Each grouping of EVOO (ARA and ARB)at different frying times corresponds to a triplicate
Figure 3 Dendrogram of electronic nose data
using Ward Method for fresh oils [extra-
virgin olive oil (EVOO) and olive oil (OO)]
and heated oils at 180 °C during 60 min
[extra-virgin olive oil (EVOOH) and olive oil
(OOH)] using doped SnO2.
Figure 4 Principal components analysis of
electronic nose data corresponding to differ-
ent frying time of extra-virgin olive oil (EV-
OO) for ARA (Arauco), at initial time ()),
15 min (h), 30 min (e), 45 min (s) and 60 -
min (x) and ARB (Arbequina), at initial time
(¤), 15 min (+), 30 min ( ), 45 min (d) and
60 min ( ) with different doping of SnO2 (D).
Effect of pan-frying in extra-virgin olive oil V. Messina et al.56
International Journal of Food Science and Technology 2009 Ó 2009 The Authors. Journal compilation Ó 2009 Institute of Food Science and Technology
7/30/2019 Paper Aceite Calor
http://slidepdf.com/reader/full/paper-aceite-calor 6/8
measurement (as described in ‘Materials and methods’).One PC1 was found, accounting 96.6% of the totalvariation. PC1 showed a positive correlation betweendoped SnO2 sensors (D) and EVOO (ARA) for all fryingtimes (15 min (h), 30 min (e), 45 min (s) and 60 min(x)). Conversely, EVOO (ARB) showed a negative corre-
lationwith doped SnO2 sensors forall fryingtimes[15 min(+), 30 min ( ), 45 min (d) and 60 min ( )]. Freshsamples for EVOO (ARA ()) and ARB (¤)) were locatedon negative PC1. EVOO (ARA) corresponding to frying
time t60 (x) showed the highest positive scoresrepresentingthe highest sensors response (D). These results could beattributed to differences in thecompositionof each varietythat may be related to changes in their odour.
Volatile aldehydes of extra-virgin olive oil varieties
Volatile aldehydes (lg g)1
of olive oil) produced duringthe frying process are shown in Figs 5 and 6a–d.
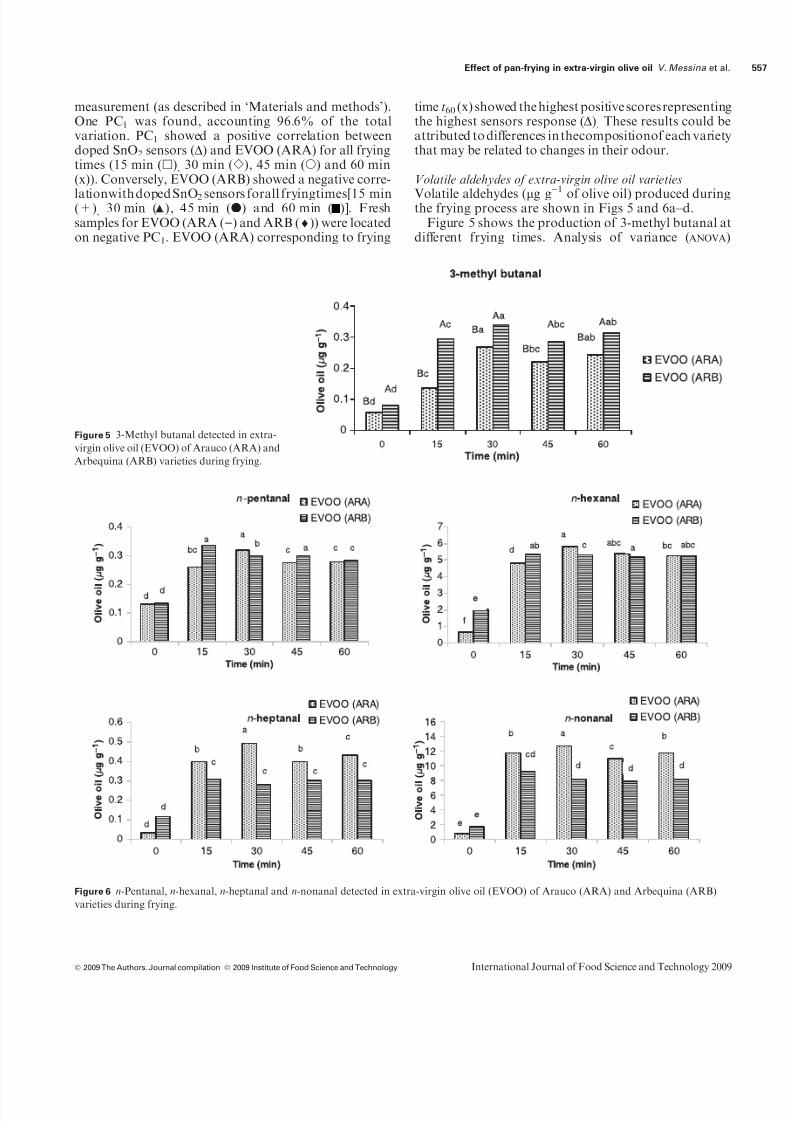
Figure 5 shows the production of 3-methyl butanal atdifferent frying times. Analysis of variance (anova)
Figure 5 3-Methyl butanal detected in extra-
virgin olive oil (EVOO) of Arauco (ARA) and
Arbequina (ARB) varieties during frying.
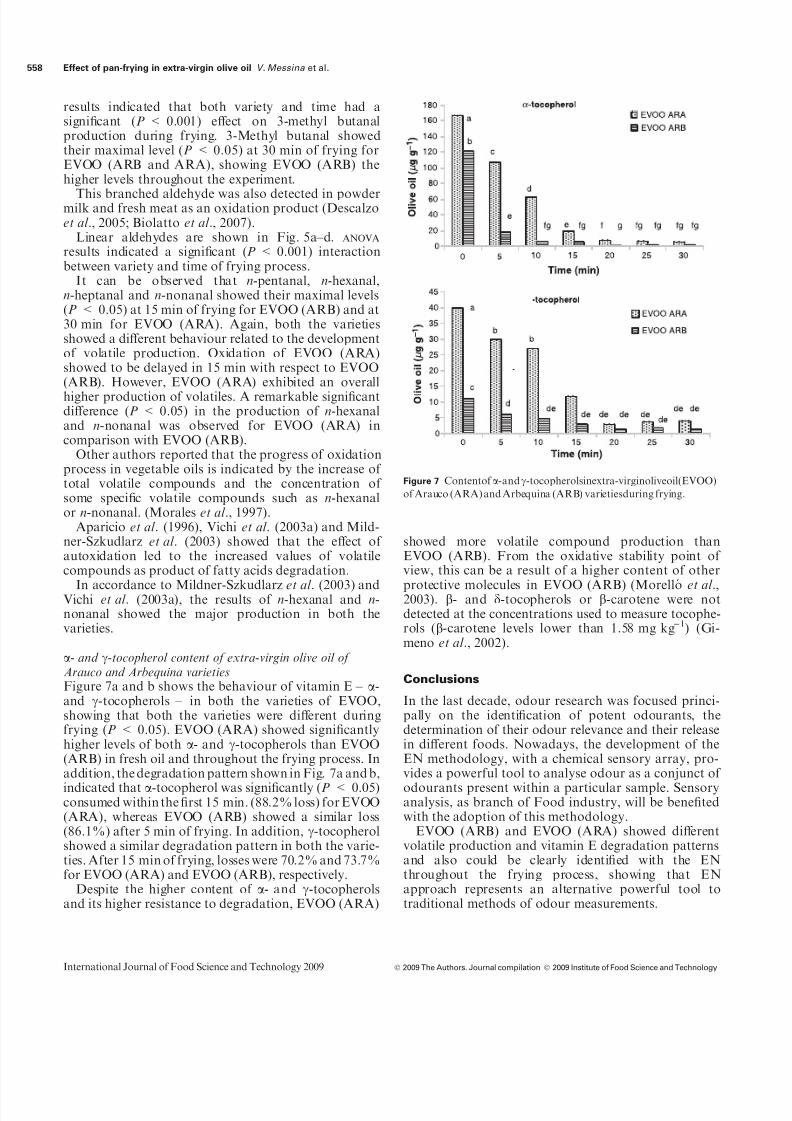
Figure 6 n-Pentanal, n-hexanal, n-heptanal and n-nonanal detected in extra-virgin olive oil (EVOO) of Arauco (ARA) and Arbequina (ARB)
varieties during frying.
Effect of pan-frying in extra-virgin olive oil V. Messina et al.
Ó 2009 The Authors. Journal compilation Ó 2009 Institute of Food Science and Technology International Journal of Food Science and Technology 2009
7/30/2019 Paper Aceite Calor
http://slidepdf.com/reader/full/paper-aceite-calor 7/8
results indicated that both variety and time had asignificant (P < 0.001) effect on 3-methyl butanalproduction during frying. 3-Methyl butanal showedtheir maximal level (P < 0.05) at 30 min of frying forEVOO (ARB and ARA), showing EVOO (ARB) thehigher levels throughout the experiment.
This branched aldehyde was also detected in powdermilk and fresh meat as an oxidation product (Descalzoet al., 2005; Biolatto et al., 2007).
Linear aldehydes are shown in Fig. 5a–d. anova
results indicated a significant (P < 0.001) interactionbetween variety and time of frying process.
It can be observed that n-pentanal, n-hexanal,n-heptanal and n-nonanal showed their maximal levels(P < 0.05) at 15 min of frying for EVOO (ARB) and at30 min for EVOO (ARA). Again, both the varietiesshowed a different behaviour related to the developmentof volatile production. Oxidation of EVOO (ARA)showed to be delayed in 15 min with respect to EVOO(ARB). However, EVOO (ARA) exhibited an overall
higher production of volatiles. A remarkable significantdifference (P < 0.05) in the production of n-hexanaland n-nonanal was observed for EVOO (ARA) incomparison with EVOO (ARB).
Other authors reported that the progress of oxidationprocess in vegetable oils is indicated by the increase of total volatile compounds and the concentration of some specific volatile compounds such as n-hexanalor n-nonanal. (Morales et al., 1997).
Aparicio et al. (1996), Vichi et al. (2003a) and Mild-ner-Szkudlarz et al. (2003) showed that the effect of autoxidation led to the increased values of volatilecompounds as product of fatty acids degradation.
In accordance to Mildner-Szkudlarz et al. (2003) andVichi et al. (2003a), the results of n-hexanal and n-nonanal showed the major production in both thevarieties.
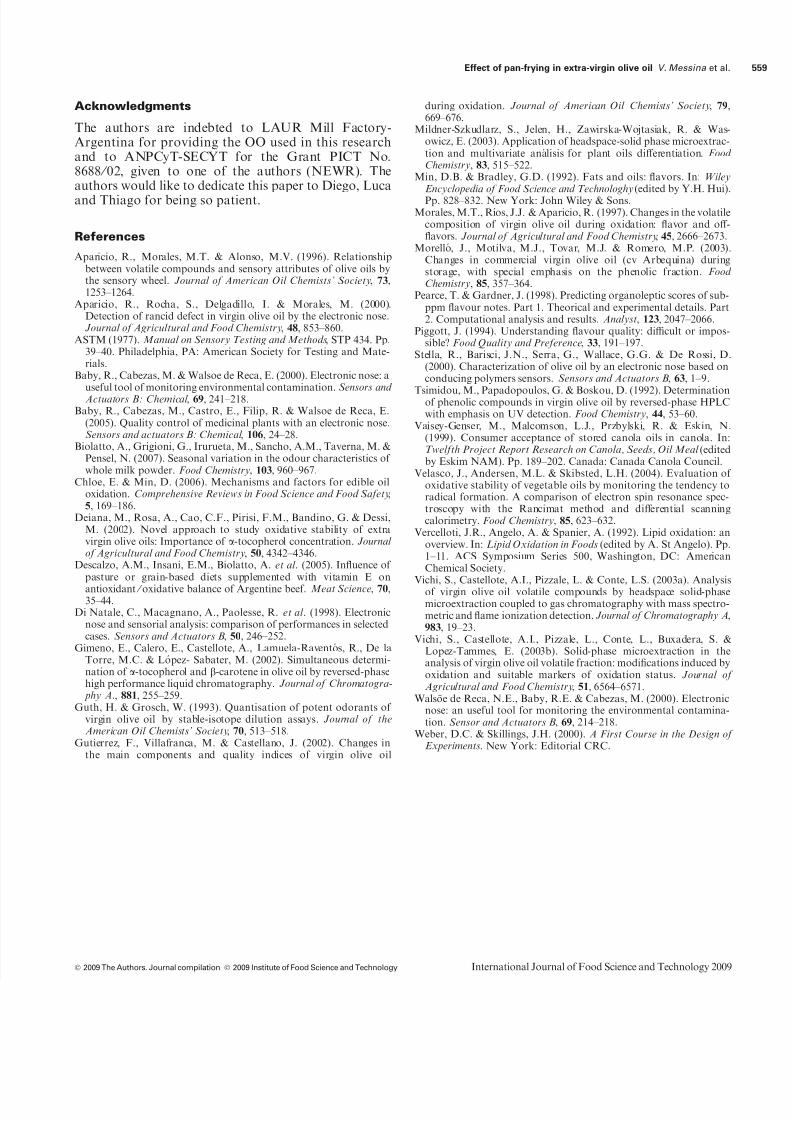
a- and c-tocopherol content of extra-virgin olive oil of Arauco and Arbequina varietiesFigure 7a and b shows the behaviour of vitamin E – a-and c-tocopherols – in both the varieties of EVOO,showing that both the varieties were different duringfrying (P < 0.05). EVOO (ARA) showed significantlyhigher levels of both a- and c-tocopherols than EVOO(ARB) in fresh oil and throughout the frying process. Inaddition, the degradation pattern shown in Fig. 7a and b,
indicated that a-tocopherol was significantly (P < 0.05)consumed within the first 15 min. (88.2% loss) for EVOO(ARA), whereas EVOO (ARB) showed a similar loss(86.1%) after 5 min of frying. In addition, c-tocopherolshowed a similar degradation pattern in both the varie-ties. After 15 min of frying, losses were 70.2% and 73.7%for EVOO (ARA) and EVOO (ARB), respectively.
Despite the higher content of a- and c-tocopherolsand its higher resistance to degradation, EVOO (ARA)
showed more volatile compound production thanEVOO (ARB). From the oxidative stability point of view, this can be a result of a higher content of other
protective molecules in EVOO (ARB) (Morello ´ et al.,2003). b- and d-tocopherols or b-carotene were notdetected at the concentrations used to measure tocophe-rols (b-carotene levels lower than 1.58 mg kg)1) (Gi-meno et al., 2002).
Conclusions
In the last decade, odour research was focused princi-pally on the identification of potent odourants, thedetermination of their odour relevance and their releasein different foods. Nowadays, the development of theEN methodology, with a chemical sensory array, pro-vides a powerful tool to analyse odour as a conjunct of
odourants present within a particular sample. Sensoryanalysis, as branch of Food industry, will be benefitedwith the adoption of this methodology.
EVOO (ARB) and EVOO (ARA) showed differentvolatile production and vitamin E degradation patternsand also could be clearly identified with the ENthroughout the frying process, showing that ENapproach represents an alternative powerful tool totraditional methods of odour measurements.
Figure 7 Contentof a-andc-tocopherolsinextra-virginoliveoil(EVOO)
of Arauco (ARA) and Arbequina (ARB) varietiesduring frying.
Effect of pan-frying in extra-virgin olive oil V. Messina et al.58
International Journal of Food Science and Technology 2009 Ó 2009 The Authors. Journal compilation Ó 2009 Institute of Food Science and Technology
7/30/2019 Paper Aceite Calor
http://slidepdf.com/reader/full/paper-aceite-calor 8/8
Acknowledgments
The authors are indebted to LAUR Mill Factory-Argentina for providing the OO used in this researchand to ANPCyT-SECYT for the Grant PICT No.8688 ⁄ 02, given to one of the authors (NEWR). Theauthors would like to dedicate this paper to Diego, Luca
and Thiago for being so patient.
References
Aparicio, R., Morales, M.T. & Alonso, M.V. (1996). Relationshipbetween volatile compounds and sensory attributes of olive oils bythe sensory wheel. Journal of American Oil Chemists’ Society, 73,1253–1264.
Aparicio, R., Rocha, S., Delgadillo, I. & Morales, M. (2000).Detection of rancid defect in virgin olive oil by the electronic nose.Journal of Agricultural and Food Chemistry, 48, 853–860.
ASTM (1977). Manual on Sensory Testing and Methods, STP 434. Pp.39–40. Philadelphia, PA: American Society for Testing and Mate-rials.
Baby, R., Cabezas, M. & Walsoe de Reca, E. (2000). Electronic nose: a
useful tool of monitoring environmental contamination.Sensors and
Actuators B: Chemical , 69, 241–218.Baby, R., Cabezas, M., Castro, E., Filip, R. & Walsoe de Reca, E.
(2005). Quality control of medicinal plants with an electronic nose.Sensors and actuators B: Chemical , 106, 24–28.
Biolatto, A., Grigioni, G., Irurueta, M., Sancho, A.M., Taverna, M. &Pensel, N. (2007). Seasonal variation in the odour characteristics of whole milk powder. Food Chemistry, 103, 960–967.
Chloe, E. & Min, D. (2006). Mechanisms and factors for edible oiloxidation. Comprehensive Reviews in Food Science and Food Safety,5, 169–186.
Deiana, M., Rosa, A., Cao, C.F., Pirisi, F.M., Bandino, G. & Dessi,M. (2002). Novel approach to study oxidative stability of extravirgin olive oils: Importance of a-tocopherol concentration. Journal of Agricultural and Food Chemistry, 50, 4342–4346.
Descalzo, A.M., Insani, E.M., Biolatto, A. et al. (2005). Influence of pasture or grain-based diets supplemented with vitamin E on
antioxidant ⁄ oxidative balance of Argentine beef. Meat Science, 70,35–44.
Di Natale, C., Macagnano, A., Paolesse, R. et al. (1998). Electronicnose and sensorial analysis: comparison of performances in selectedcases. Sensors and Actuators B, 50, 246–252.
Gimeno, E., Calero, E., Castellote, A., Lamuela-Raventos, R., De laTorre, M.C. & Lo ´ pez- Sabater, M. (2002). Simultaneous determi-nation of a-tocopherol and b-carotene in olive oil by reversed-phasehigh performance liquid chromatography. Journal of Chromatogra- phy A., 881, 255–259.
Guth, H. & Grosch, W. (1993). Quantisation of potent odorants of virgin olive oil by stable-isotope dilution assays. Journal of theAmerican Oil Chemists’ Society, 70, 513–518.
Gutierrez, F., Villafranca, M. & Castellano, J. (2002). Changes inthe main components and quality indices of virgin olive oil
during oxidation. Journal of American Oil Chemists’ Society, 79,669–676.
Mildner-Szkudlarz, S., Jelen, H., Zawirska-Wojtasiak, R. & Was-owicz, E. (2003). Application of headspace-solid phase microextrac-tion and multivariate ana ´ lisis for plant oils differentiation. Food Chemistry, 83, 515–522.
Min, D.B. & Bradley, G.D. (1992). Fats and oils: flavors. In: WileyEncyclopedia of Food Science and Technologhy (edited by Y.H. Hui).Pp. 828–832. New York: John Wiley & Sons.
Morales, M.T., Rıos, J.J. & Aparicio, R. (1997). Changes in the volatilecomposition of virgin olive oil during oxidation: flavor and off-flavors. Journal of Agricultural and Food Chemistry, 45, 2666–2673.
Morello ´ , J., Motilva, M.J., Tovar, M.J. & Romero, M.P. (2003).Changes in commercial virgin olive oil (cv Arbequina) duringstorage, with special emphasis on the phenolic fraction. Food Chemistry, 85, 357–364.
Pearce, T. & Gardner, J. (1998). Predicting organoleptic scores of sub-ppm flavour notes. Part 1. Theorical and experimental details. Part2. Computational analysis and results. Analyst, 123, 2047–2066.
Piggott, J. (1994). Understanding flavour quality: difficult or impos-sible? Food Quality and Preference, 33, 191–197.
Stella, R., Barisci, J.N., Serra, G., Wallace, G.G. & De Rossi, D.(2000). Characterization of olive oil by an electronic nose based onconducing polymers sensors. Sensors and Actuators B, 63, 1–9.
Tsimidou, M., Papadopoulos, G. & Boskou, D. (1992). Determinationof phenolic compounds in virgin olive oil by reversed-phase HPLCwith emphasis on UV detection. Food Chemistry, 44, 53–60.
Vaisey-Genser, M., Malcomson, L.J., Przbylski, R. & Eskin, N.(1999). Consumer acceptance of stored canola oils in canola. In:Twelfth Project Report Research on Canola, Seeds, Oil Meal (editedby Eskim NAM). Pp. 189–202. Canada: Canada Canola Council.
Velasco, J., Andersen, M.L. & Skibsted, L.H. (2004). Evaluation of oxidative stability of vegetable oils by monitoring the tendency toradical formation. A comparison of electron spin resonance spec-troscopy with the Rancimat method and differential scanningcalorimetry. Food Chemistry, 85, 623–632.
Vercelloti, J.R., Angelo, A. & Spanier, A. (1992). Lipid oxidation: anoverview. In: Lipid Oxidation in Foods (edited by A. St Angelo). Pp.1–11. ACS Symposium Series 500, Washington, DC: AmericanChemical Society.
Vichi, S., Castellote, A.I., Pizzale, L. & Conte, L.S. (2003a). Analysis
of virgin olive oil volatile compounds by headspace solid-phasemicroextraction coupled to gas chromatography with mass spectro-metric and flame ionization detection. Journal of Chromatography A,983, 19–23.
Vichi, S., Castellote, A.I., Pizzale, L., Conte, L., Buxadera, S. &Lopez-Tammes, E. (2003b). Solid-phase microextraction in theanalysis of virgin olive oil volatile fraction: modifications induced byoxidation and suitable markers of oxidation status. Journal of Agricultural and Food Chemistry, 51, 6564–6571.
Walso ¨ e de Reca, N.E., Baby, R.E. & Cabezas, M. (2000). Electronicnose: an useful tool for monitoring the environmental contamina-tion. Sensor and Actuators B, 69, 214–218.
Weber, D.C. & Skillings, J.H. (2000). A First Course in the Design of Experiments. New York: Editorial CRC.
Effect of pan-frying in extra-virgin olive oil V. Messina et al.
Ó 2009 The Authors. Journal compilation Ó 2009 Institute of Food Science and Technology International Journal of Food Science and Technology 2009