banco itaú holding financeira s.a.ww13.itau.com.br/portalri/html/port/download/roberto_itau... ·...
TRANSCRIPT
1
Banco ItaúHolding Financeira S.A.
Ouvidora Corporativa Itaú 00
Roberto SetubalCEO
3rd Annual Brazil Conference
Itaú Securities
NYC – May 21, 2008
Ouvidora Corporativa Itaú 11
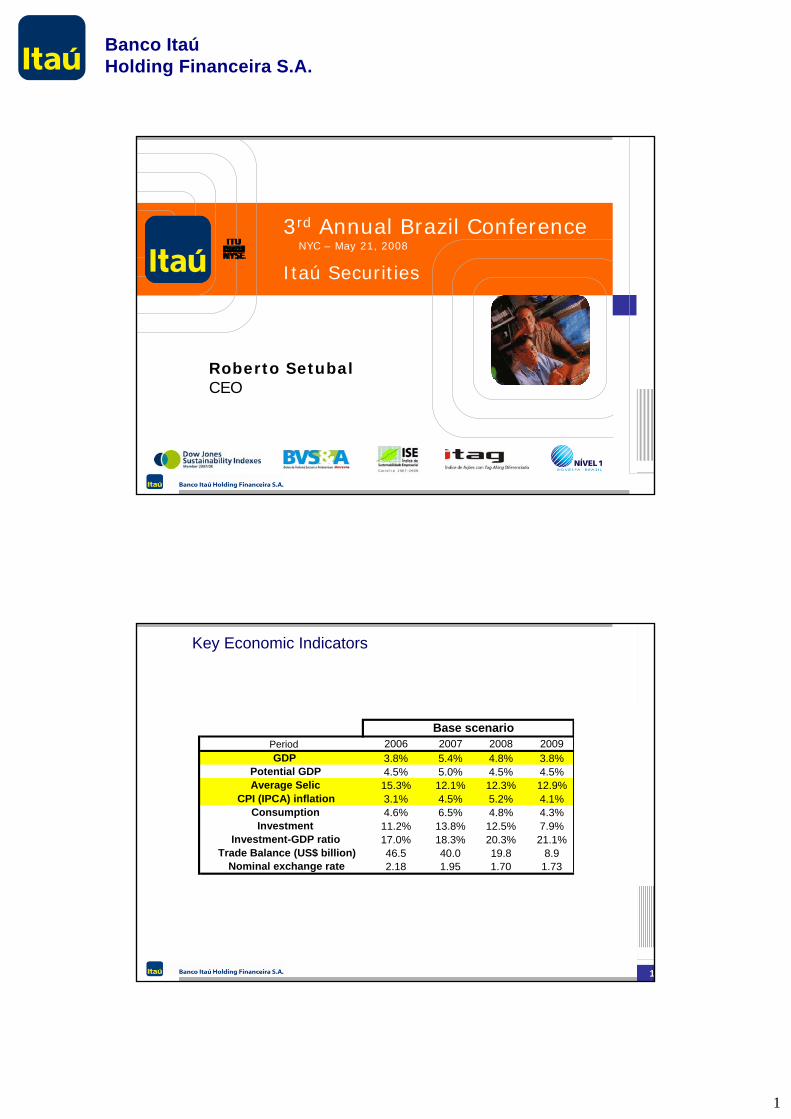
Key Economic Indicators
Period 2006 2007 2008 2009 2008 20GDP 3.8% 5.4% 4.8% 3.8% 4.7% 3
Potential GDP 4.5% 5.0% 4.5% 4.5% 4.3% 4Average Selic 15.3% 12.1% 12.3% 12.9% 12.6% 13
CPI (IPCA) inflation 3.1% 4.5% 5.2% 4.1% 6.1% 4Consumption 4.6% 6.5% 4.8% 4.3% 4.0% 3
Investment 11.2% 13.8% 12.5% 7.9% 9.1% 3Investment-GDP ratio 17.0% 18.3% 20.3% 21.1% 20.1% 20
Trade Balance (US$ billion) 46.5 40.0 19.8 8.9 17.4 4Nominal exchange rate 2.18 1.95 1.70 1.73 1.95 2
Base scenario External cr
2
Banco ItaúHolding Financeira S.A.
Total: 45.16 %Common Shares: 86.36 %
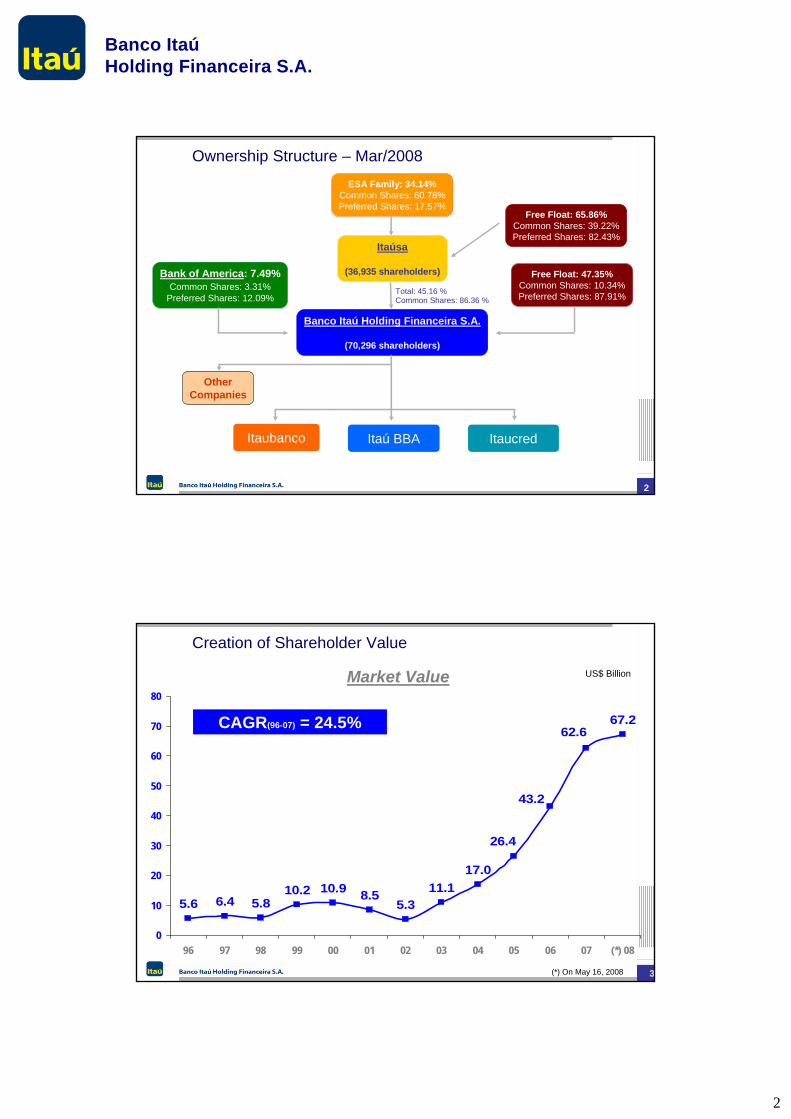
Ownership Structure – Mar/2008ESA Family: 34.14%
Common Shares: 60.78%Preferred Shares: 17.57%
Free Float: 65.86%Common Shares: 39.22%Preferred Shares: 82.43%
Itaúsa
(36,935 shareholders) Free Float: 47.35%Common Shares: 10.34%Preferred Shares: 87.91%
Bank of America: 7.49%Common Shares: 3.31%
Preferred Shares: 12.09%
Banco Itaú Holding Financeira S.A.
(70,296 shareholders)
OtherCompanies
2
ItaucredItaubanco Itaú BBA
Ouvidora Corporativa Itaú 33
Creation of Shareholder Value
5.6 6.4 5.810.2 10.9 8.5
5.311.1
17.0
67.262.6
43.2
26.4
0
10
20
30
40
50
60
70
80
96 97 98 99 00 01 02 03 04 05 06 07 (*) 08
Market Value US$ Billion
CAGR(96-07) = 24.5%
(*) On May 16, 2008
3
Banco ItaúHolding Financeira S.A.
44
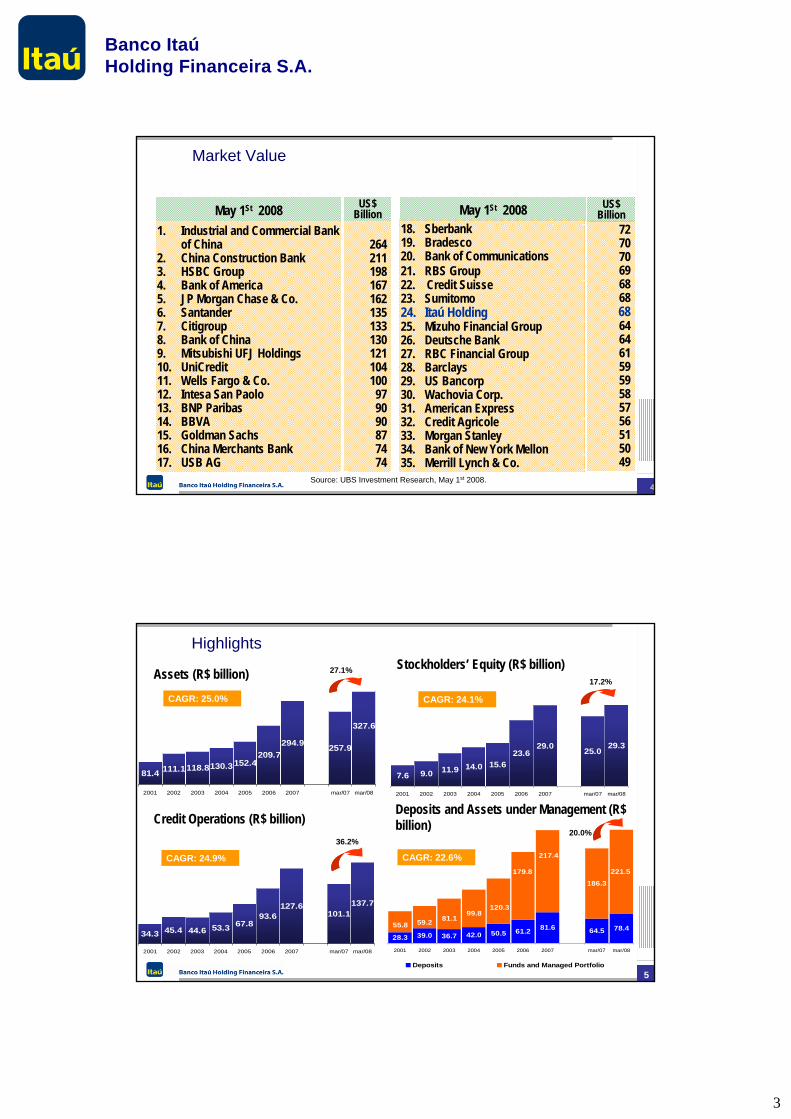
1. Industrial and Commercial Bank of China
2. China Construction Bank3. HSBC Group 4. Bank of America5. JP Morgan Chase & Co.6. Santander7. Citigroup8. Bank of China9. Mitsubishi UFJ Holdings10. UniCredit11. Wells Fargo & Co.12. Intesa San Paolo13. BNP Paribas14. BBVA15. Goldman Sachs16. China Merchants Bank17. USB AG
May 1St 2008
264211198167162135133130121104100979090877474
US$ Billion May 1St 2008
18. Sberbank19. Bradesco20. Bank of Communications21. RBS Group22. Credit Suisse23. Sumitomo24. Itaú Holding25. Mizuho Financial Group26. Deutsche Bank27. RBC Financial Group28. Barclays29. US Bancorp30. Wachovia Corp.31. American Express32. Credit Agricole33. Morgan Stanley34. Bank of New York Mellon35. Merrill Lynch & Co.
727070696868686464615959585756515049
US$ Billion
Source: UBS Investment Research, May 1st 2008.
Market Value
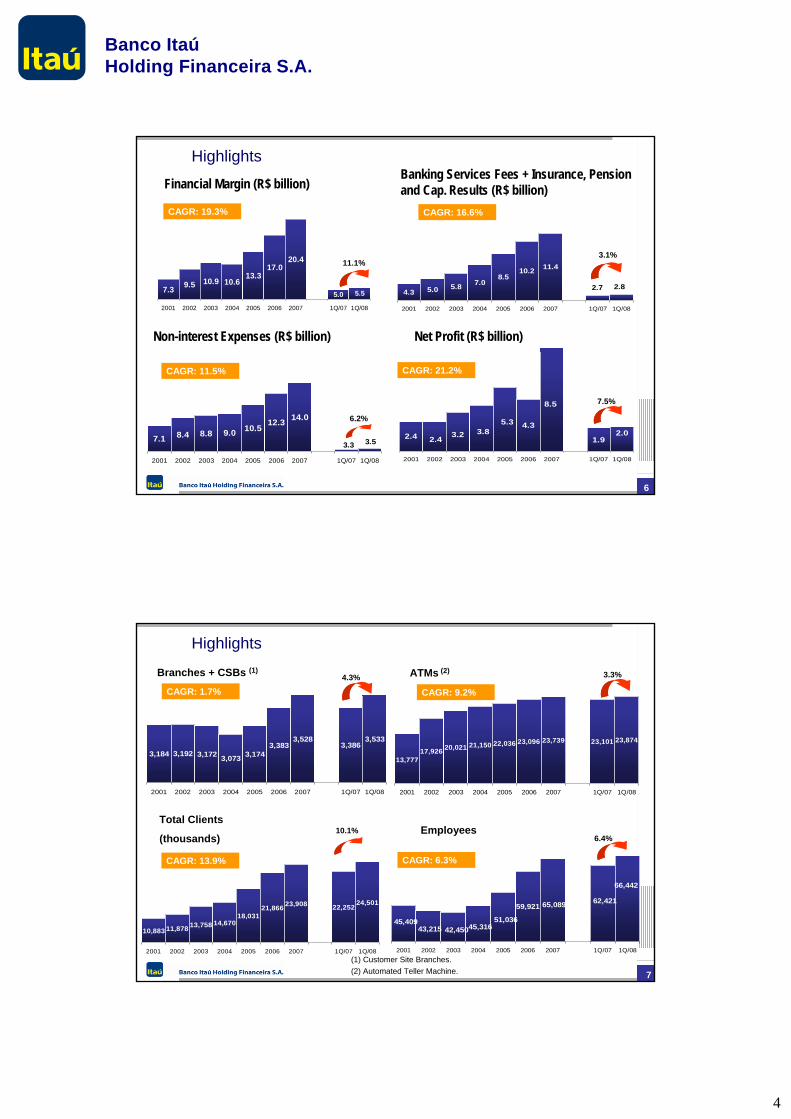
Highlights
Assets (R$ billion)
Credit Operations (R$ billion)
Stockholders’ Equity (R$ billion)
Deposits and Assets under Management (R$ billion)
5
81.4 111.1118.8130.3152.4209.7
294.9 257.9
327.6
2001 2002 2003 2004 2005 2006 2007 mar/07 mar/08
27.1%
7.6 9.0 11.9 14.0 15.6
29.0 25.029.3
23.6
2001 2002 2003 2004 2005 2006 2007 mar/07 mar/08
17.2%
34.3 45.4 44.6 53.3 67.893.6
127.6101.1
137.7
2001 2002 2003 2004 2005 2006 2007 mar/07 mar/08
36.2%
39.0 61.2 81.6 64.5 78.4
186.3
221.5
28.3 36.7 42.0 50.5
217.4
179.8
81.1120.3
99.859.255.8
0
5 0
10 0
15 0
2 0 0
2 5 0
3 0 0
2001 2002 2003 2004 2005 2006 2007 mar/07 mar/08
Deposits Funds and Managed Portfolio
20.0%
CAGR: 25.0% CAGR: 24.1%
CAGR: 24.9% CAGR: 22.6%
4
Banco ItaúHolding Financeira S.A.
Net Profit (R$ billion)Non-interest Expenses (R$ billion)
Banking Services Fees + Insurance, Pension and Cap. Results (R$ billion)Financial Margin (R$ billion)
Highlights
6
5.07.3 9.5 10.913.3
10.6
20.417.0
5.5
2001 2002 2003 2004 2005 2006 2007 1Q/07 1Q/08
11.1%
2.74.3 5.0 5.88.5
7.0
11.410.2
2.8
2001 2002 2003 2004 2005 2006 2007 1Q/07 1Q/08
3.1%
3.37.1 8.4 8.8 10.59.0
14.012.3
3.5
2001 2002 2003 2004 2005 2006 2007 1Q/07 1Q/08
6.2%
1.92.03.8
5.3
8.5
3.22.42.44.3
2001 2002 2003 2004 2005 2006 2007 1Q/07 1Q/08
7.5%
CAGR: 19.3% CAGR: 16.6%
CAGR: 11.5% CAGR: 21.2%
Branches + CSBs (1)
Total Clients
(thousands)
ATMs (2)
Employees
Highlights
(1) Customer Site Branches.(2) Automated Teller Machine. 7
3,5333,383
3,528
3,073 3,1743,1723,1923,1843,386
2001 2002 2003 2004 2005 2006 2007 1Q/07 1Q/08
4.3%
23,87423,096 23,73921,150 22,03620,02117,926
13,777
23,101
2001 2002 2003 2004 2005 2006 2007 1Q/07 1Q/08
3.3%
24,50121,866 23,908
14,67018,031
13,75811,87810,883
22,252
2001 2002 2003 2004 2005 2006 2007 1Q/07 1Q/08
10.1%
62,42159,921
45,40943,215 42,450
65,089
51,03645,316
66,442
2001 2002 2003 2004 2005 2006 2007 1Q/07 1Q/08
6.4%
CAGR: 1.7% CAGR: 9.2%
CAGR: 13.9% CAGR: 6.3%
5
Banco ItaúHolding Financeira S.A.
8
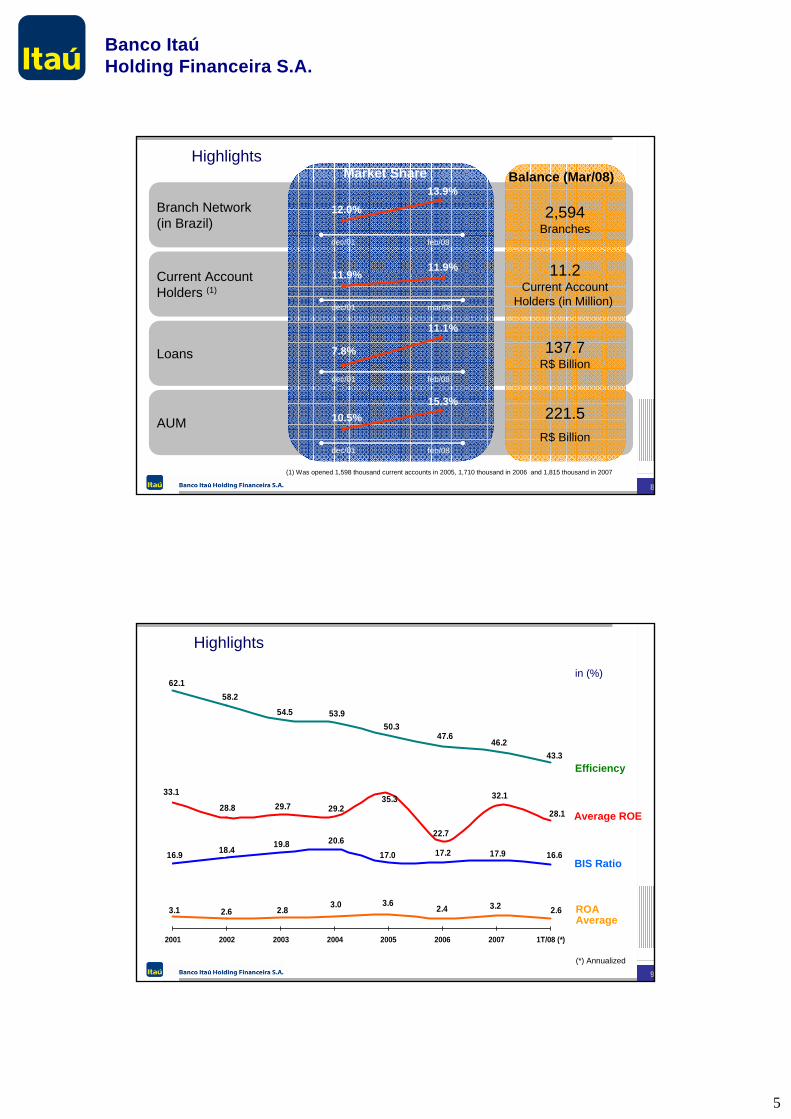
Branch Network(in Brazil)
Current Account Holders (1)
Loans
AUM
Balance (Mar/08)Market Share
2,594Branches
11.2Current Account
Holders (in Million)
137.7R$ Billion
221.5R$ Billion
dec/01 feb/08
12.0%13.9%
dec/01 mar/08
11.9%11.9%
dec/01 feb/08
7.8%
11.1%
dec/01 feb/08
10.5%15.3%
(1) Was opened 1,598 thousand current accounts in 2005, 1,710 thousand in 2006 and 1,815 thousand in 2007
Highlights
9
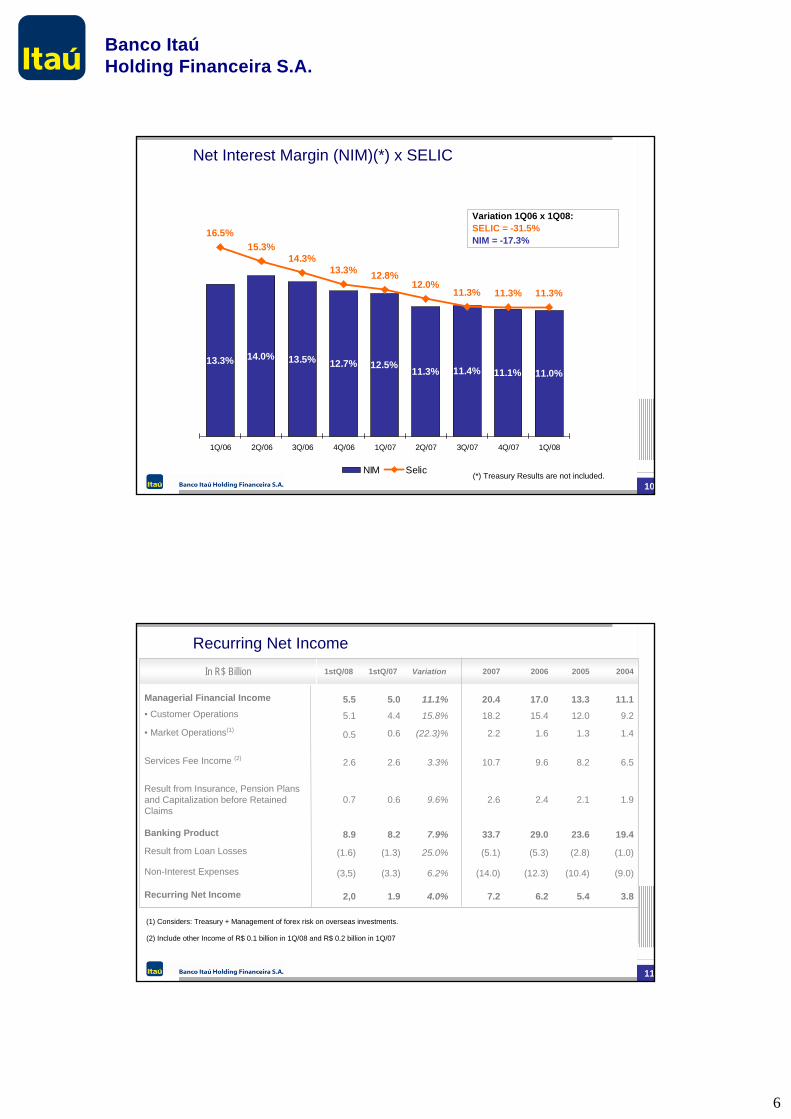
28.1
33.1 32.1
22.7
35.329.229.728.8
2.62.43.63.02.82.6 3.23.1
16.617.917.217.020.619.818.416.9
43.346.2
47.650.3
53.954.5
58.262.1
2001 2002 2003 2004 2005 2006 2007 1T/08 (*)
in (%)
Efficiency
ROA Average
BIS Ratio
Average ROE
(*) Annualized
Highlights
6
Banco ItaúHolding Financeira S.A.
Ouvidora Corporativa Itaú 1010
Net Interest Margin (NIM)(*) x SELIC
13.3% 14.0% 13.5% 12.7% 12.5% 11.3% 11.4% 11.1% 11.0%
16.5%15.3%
14.3%13.3% 12.8%
12.0%11.3% 11.3% 11.3%
1Q/06 2Q/06 3Q/06 4Q/06 1Q/07 2Q/07 3Q/07 4Q/07 1Q/08
NIM Selic
Variation 1Q06 x 1Q08:SELIC = -31.5%NIM = -17.3%
(*) Treasury Results are not included.
Ouvidora Corporativa Itaú 1111
• Market Operations(1) 2.2(22.3)% 1.6 1.3 1.40.60.5
Recurring Net IncomeR$ Billion
7.2
(14.0)
(5.1)
33.7
2.6
10.7
18.2
20.4
2007
1.92.12.49.6%0.60.7Result from Insurance, Pension Plans and Capitalization before Retained Claims
6.58.29.63.3%2.62.6Services Fee Income (2)
19.423.629.07.9%8.28.9Banking Product
4.0%
6.2%
25.0%
15.8%
11.1%
Variation
6.2
(12.3)
(5.3)
15.4
17.0
2006
5.4
(10.4)
(2.8)
12.0
13.3
2005
3.81.92,0Recurring Net Income
(9.0)(3.3)(3,5)Non-Interest Expenses
(1.0)(1.3)(1.6)Result from Loan Losses
9.24.45.1• Customer Operations11.15.05.5Managerial Financial Income
20041stQ/071stQ/08In R$ Billion
(1) Considers: Treasury + Management of forex risk on overseas investments.
(2) Include other Income of R$ 0.1 billion in 1Q/08 and R$ 0.2 billion in 1Q/07
7
Banco ItaúHolding Financeira S.A.
12
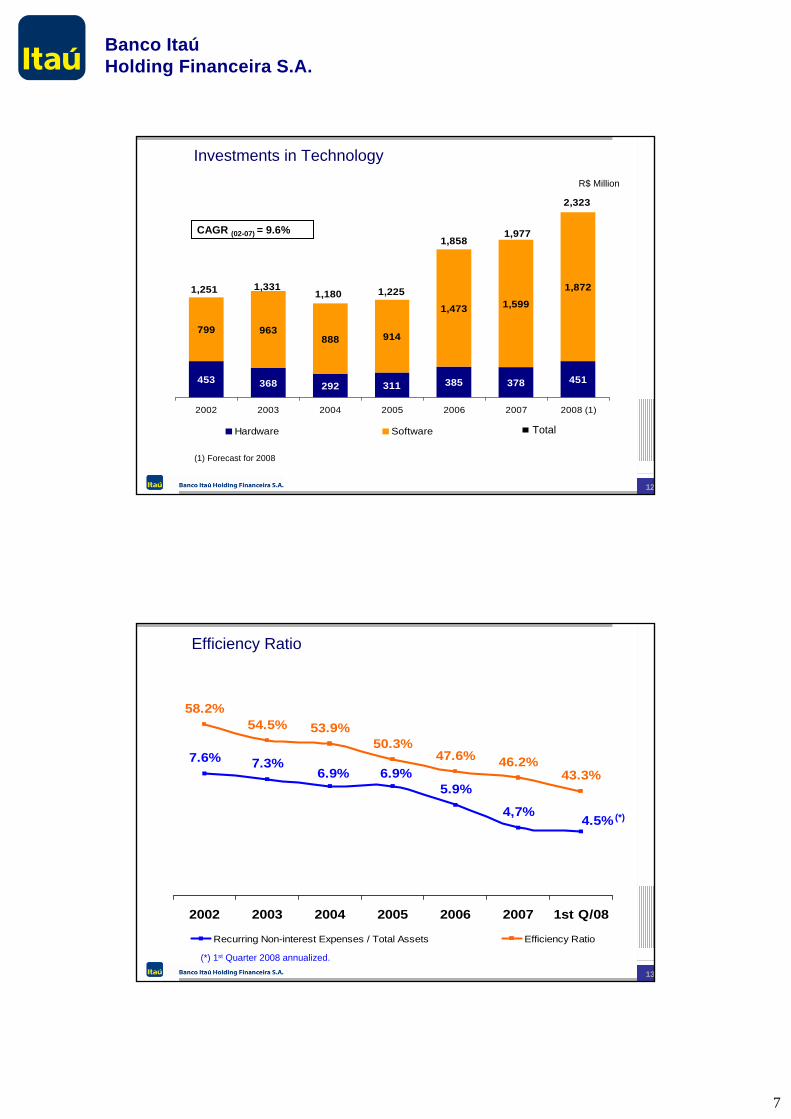
453 368 292 311 385 378
799 963888 914
1,473 1,599
1,872
451
1,251 1,3311,180 1,225
1,8581,977
2,323
2002 2003 2004 2005 2006 2007 2008 (1)
Hardware Software
R$ Million
Total
(1) Forecast for 2008
CAGR (02-07) = 9.6%
Investments in Technology
13
Efficiency Ratio
7.6%
5.9%6.9% 6.9%
4.5%4,7%
7.3%
58.2%54.5% 53.9%
50.3%47.6% 46.2%
43.3%
1 %
3 %
5 %
7 %
9 %
1 1 %
2002 2003 2004 2005 2006 2007 1st Q/082 0.0%
3 0.0%
4 0 .0%
5 0 .0%
6 0 .0%
7 0 .0%
Recurring Non-interest Expenses / Total Assets Efficiency Ratio
(*)
(*) 1st Quarter 2008 annualized.
8
Banco ItaúHolding Financeira S.A.
Ouvidora Corporativa Itaú 1414
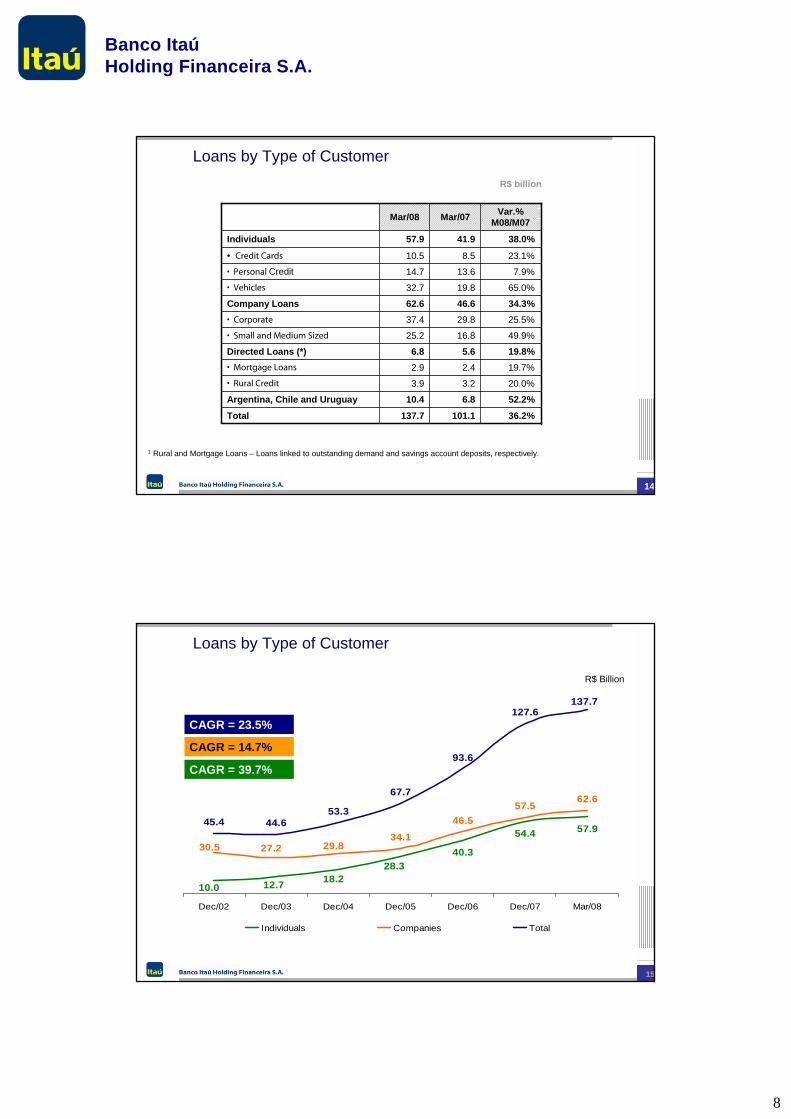
19.7%2.42.9• Mortgage Loans
20.0%3.23.9• Rural Credit
52.2%6.810.4Argentina, Chile and Uruguay
36.2%101.1137.7Total
19.8%5.66.8Directed Loans (*)49.9%16.825.2• Small and Medium Sized
25.5%29.837.4• Corporate
34.3%46.662.6Company Loans65.0%19.832.7• Vehicles
7.9%13.614.7• Personal Credit
23.1%8.510.5• Credit Cards
38.0%41.957.9Individuals
Var.%M08/M07Mar/07Mar/08
1 Rural and Mortgage Loans – Loans linked to outstanding demand and savings account deposits, respectively.
R$ billion
Loans by Type of Customer
15
40.3
54.4 57.934.1
46.557.5
62.6
45.4 44.653.3
67.7
93.6
127.6
28.318.212.710.0
30.5 27.2 29.8
137.7
Dec/02 Dec/03 Dec/04 Dec/05 Dec/06 Dec/07 Mar/08
Individuals Companies Total
CAGR = 23.5%
CAGR = 14.7%
CAGR = 39.7%
R$ Billion
Loans by Type of Customer
9
Banco ItaúHolding Financeira S.A.
Ouvidora Corporativa Itaú 1616
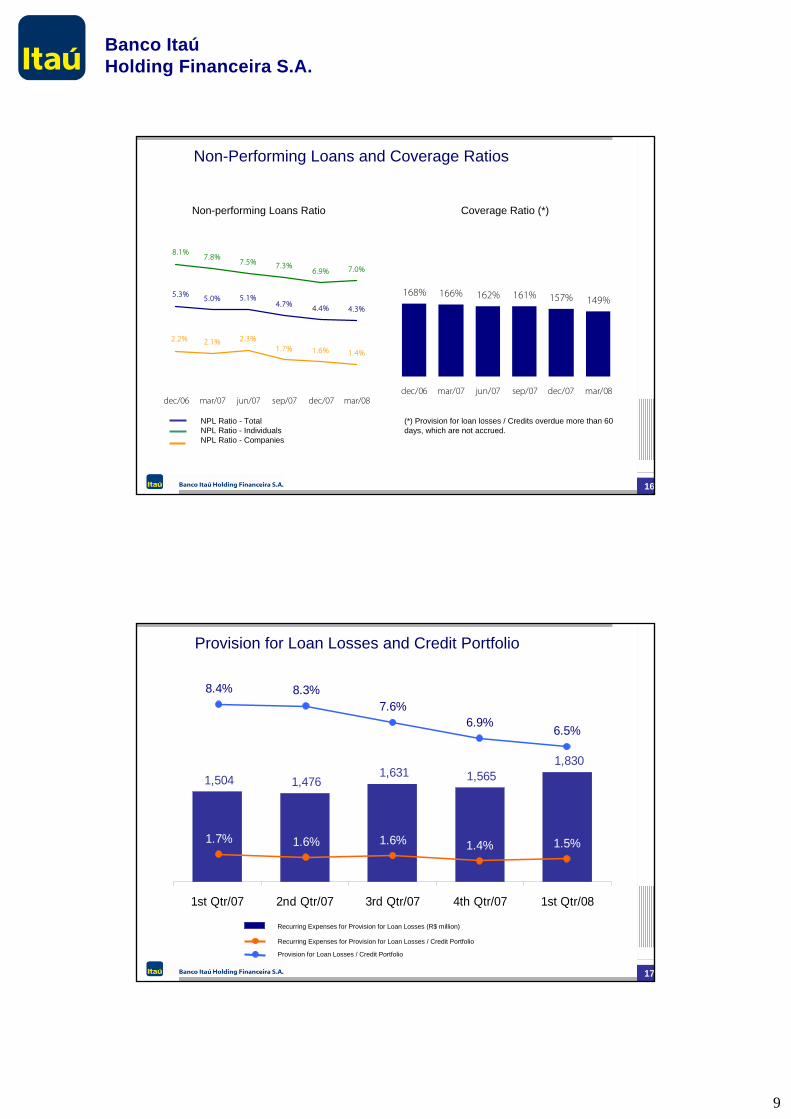
Non-Performing Loans and Coverage Ratios
(*) Provision for loan losses / Credits overdue more than 60 days, which are not accrued.
Non-performing Loans Ratio
NPL Ratio - TotalNPL Ratio - IndividualsNPL Ratio - Companies
Coverage Ratio (*)
149%157%161%162%166%168%
mar/08dec/07sep/07jun/07mar/07dec/06
1.6% 1.4%1.7%2.3%2.2% 2.1%
4.3%4.4%4.7%5.1%5.3% 5.0%
7.0%6.9%7.3%7.5%
7.8%8.1%
dec/06 mar/07 jun/07 sep/07 dec/07 mar/08
Ouvidora Corporativa Itaú 1717
Provision for Loan Losses and Credit Portfolio
Recurring Expenses for Provision for Loan Losses (R$ million)
Recurring Expenses for Provision for Loan Losses / Credit Portfolio
Provision for Loan Losses / Credit Portfolio
1,565 1,830
1,631 1,476 1,504
1st Qtr/07 2nd Qtr/07 3rd Qtr/07 4th Qtr/07 1st Qtr/08
1.7% 1.6% 1.6% 1.4% 1.5%
8.4% 8.3%7.6%
6.9%6.5%
10
Banco ItaúHolding Financeira S.A.
Ouvidora Corporativa Itaú 1818
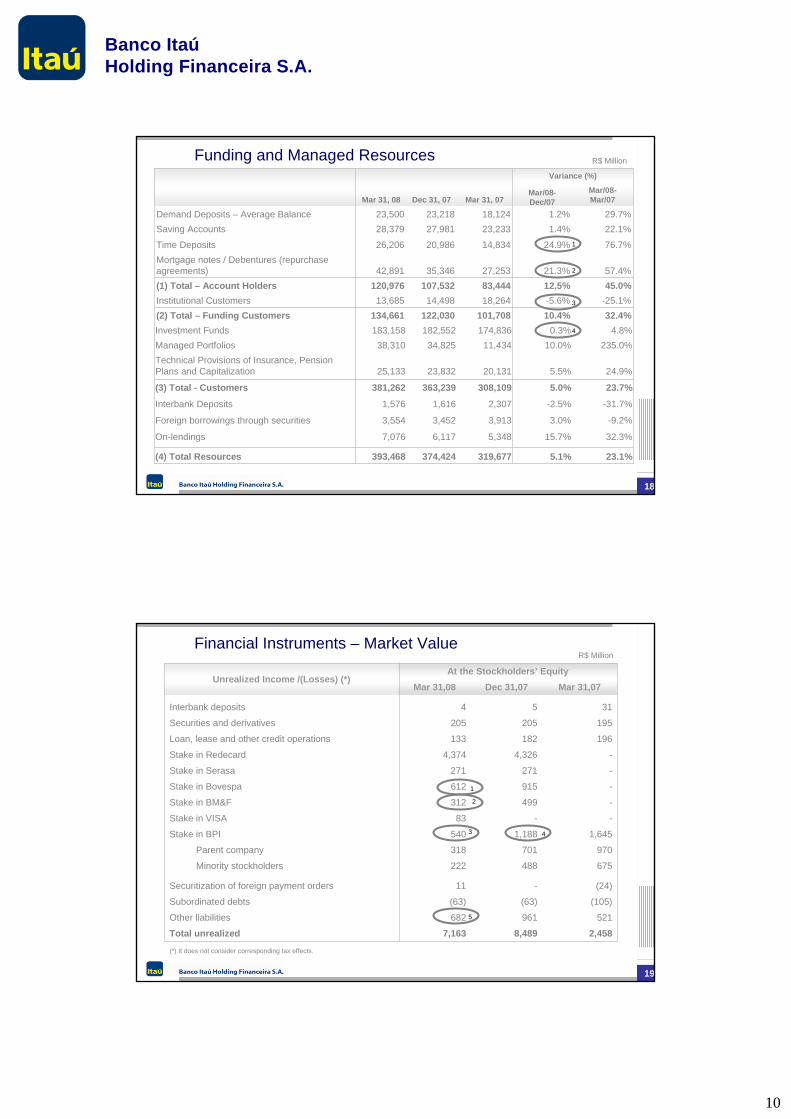
Funding and Managed Resources R$ Million
24.9%5.5%20,13123,83225,133Technical Provisions of Insurance, Pension Plans and Capitalization
23.7%5.0%308,109363,239381,262(3) Total - Customers
-31.7%-2.5%2,3071,6161,576Interbank Deposits
-9.2%3.0%3,9133,4523,554Foreign borrowings through securities
32.3%15.7%5,3486,1177,076On-lendings
57.4%21.3%27,25335,34642,891Mortgage notes / Debentures (repurchase agreements)
76.7%24.9%14,83420,98626,206Time Deposits
22.1%1.4%23,23327,98128,379Saving Accounts
23.1%5.1%319,677374,424393,468(4) Total Resources
235.0%10.0%11,43434,82538,310Managed Portfolios4.8%0.3%174,836182,552183,158Investment Funds
32.4%10.4%101,708122,030134,661(2) Total – Funding Customers-25.1%-5.6%18,26414,49813,685Institutional Customers45.0%12.5%83,444107,532120,976(1) Total – Account Holders
29.7%1.2%18,12423,21823,500Demand Deposits – Average Balance
Mar/08-Mar/07
Mar/08-Dec/07
Variance (%)
Mar 31, 07Dec 31, 07Mar 31, 08
2
1
3
4
Ouvidora Corporativa Itaú 1919
R$ Million
--83 Stake in VISA
2,4588,4897,163Total unrealized521 961 682 Other liabilities
(105)(63)(63)Subordinated debts
(24)-11 Securitization of foreign payment orders
675 488 222 Minority stockholders
970 701 318 Parent company
1,645 1,188 540 Stake in BPI
-499 312 Stake in BM&F
-915 612 Stake in Bovespa
-271 271Stake in Serasa
-4,326 4,374 Stake in Redecard
196 182 133 Loan, lease and other credit operations
195 205 205 Securities and derivatives
31 5 4 Interbank deposits
Mar 31,07Dec 31,07Mar 31,08At the Stockholders’ Equity
Unrealized Income /(Losses) (*)
Financial Instruments – Market Value
(*) It does not consider corresponding tax effects.
1
2
3
5
4
11
Banco ItaúHolding Financeira S.A.
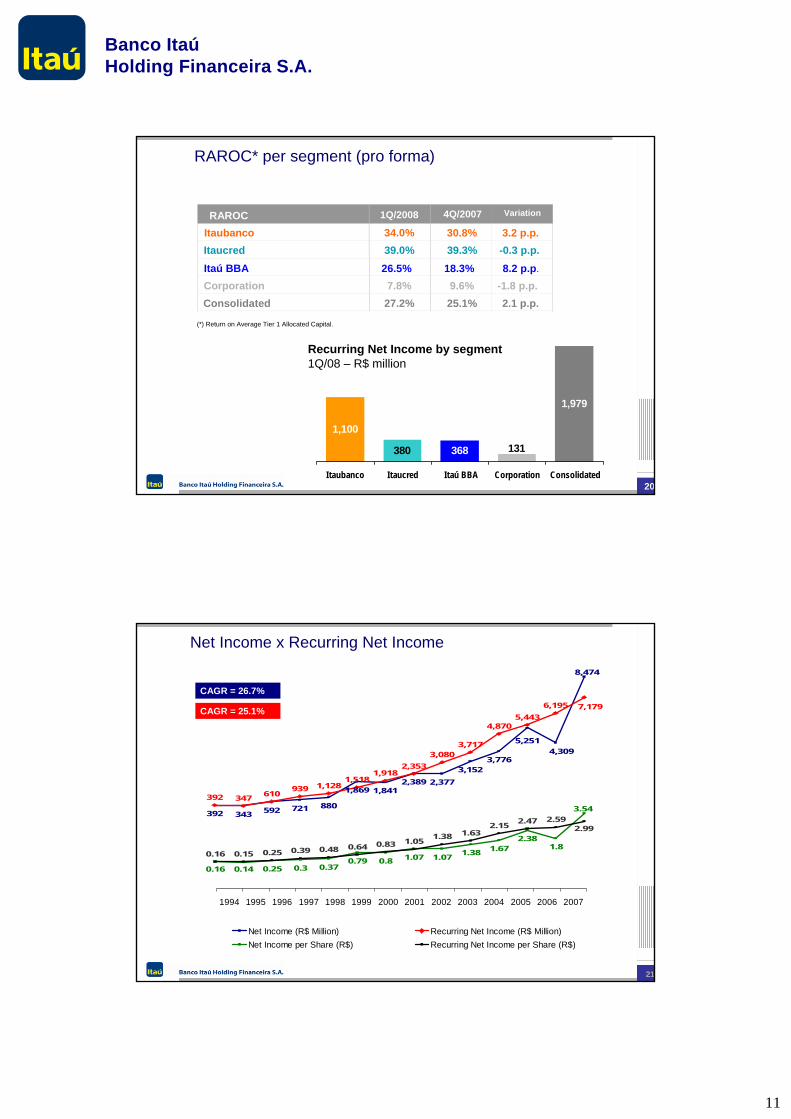
Ouvidora Corporativa Itaú 2020
1,100
1,979
131368380
I taubanco Itaucred Itaú BBA Corporation Consolidated
(*) Return on Average Tier 1 Allocated Capital.
Recurring Net Income by segment1Q/08 – R$ million
RAROC 4Q/2007 Variation
ItaubancoItaucred
CorporationConsolidated
1Q/2008
30.8% 3.2 p.p.39.3% -0.3 p.p.
9.6% -1.8 p.p.25.1% 2.1 p.p.
34.0%
Itaú BBA 18.3% 8.2 p.p.26.5%39.0%
7.8%27.2%
RAROC* per segment (pro forma)
21
1994 1995 1996 1997 1998 1999 2000 2001 2002 2003 2004 2005 2006 2007
Net Income (R$ Million) Recurring Net Income (R$ Million)Net Income per Share (R$) Recurring Net Income per Share (R$)
392 343 592 721 880
1,869 1,8412,389 2,377
3,1523,776
392 347 610 939 1,1281,518
1,9182,353
3,0803,717
4,8705,443
6,195
4,3095,251
8,474
7,179
Net Income x Recurring Net Income
0.16 0.14 0.25 0.3 0.370.79 0.8 1.07 1.07 1.38 1.67
2.381.8
0.16 0.15 0.25 0.39 0.48 0.64 0.83 1.05 1.38 1.632.15 2.47 2.59
3.54
2.99
CAGR = 26.7%
CAGR = 25.1%
12
Banco ItaúHolding Financeira S.A.
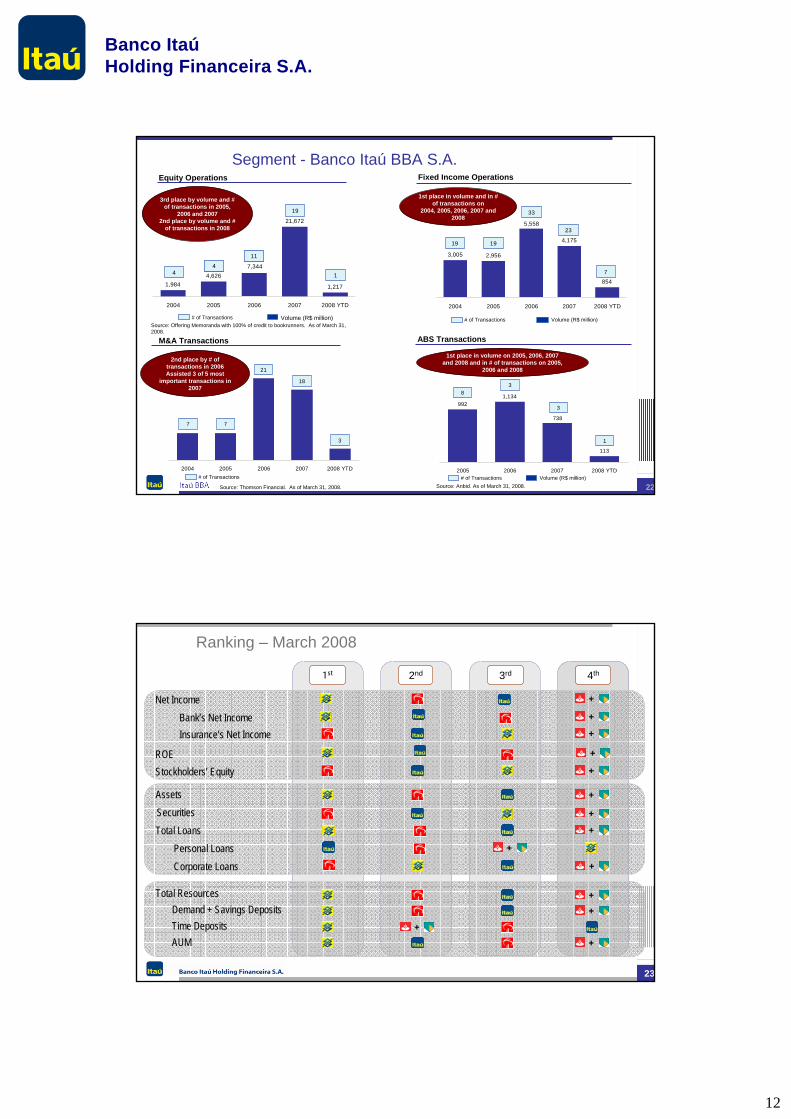
22Source: Anbid. As of March 31, 2008.
Equity Operations
Segment - Banco Itaú BBA S.A.
Volume (R$ million)# of Transactions
3rd place by volume and # of transactions in 2005,
2006 and 20072nd place by volume and #
of transactions in 2008
Source: Offering Memoranda with 100% of credit to bookrunners. As of March 31, 2008.
2nd place by # of transactions in 2006Assisted 3 of 5 most
important transactions in 2007
Source: Thomson Financial. As of March 31, 2008.
Fixed Income Operations
# of Transactions Volume (R$ million)
1st place in volume and in # of transactions on
2004, 2005, 2006, 2007 and 2008
1st place in volume on 2005, 2006, 2007 and 2008 and in # of transactions on 2005,
2006 and 2008
ABS Transactions
# of Transactions Volume (R$ million)
3,005 2,956
4,175
854
5,558
2004 2005 2006 2007 2008 YTD
19 19
33
23
7
9921,134
113
738
2005 2006 2007 2008 YTD
83
1
3
2004 2005 2006 2007 2008 YTD
7 7
21
18
3
# of Transactions
1,9844,626
21,672
1,217
7,344
2004 2005 2006 2007 2008 YTD
4
11
41
19
11
4
M&A Transactions
Ouvidora Corporativa Itaú 2323
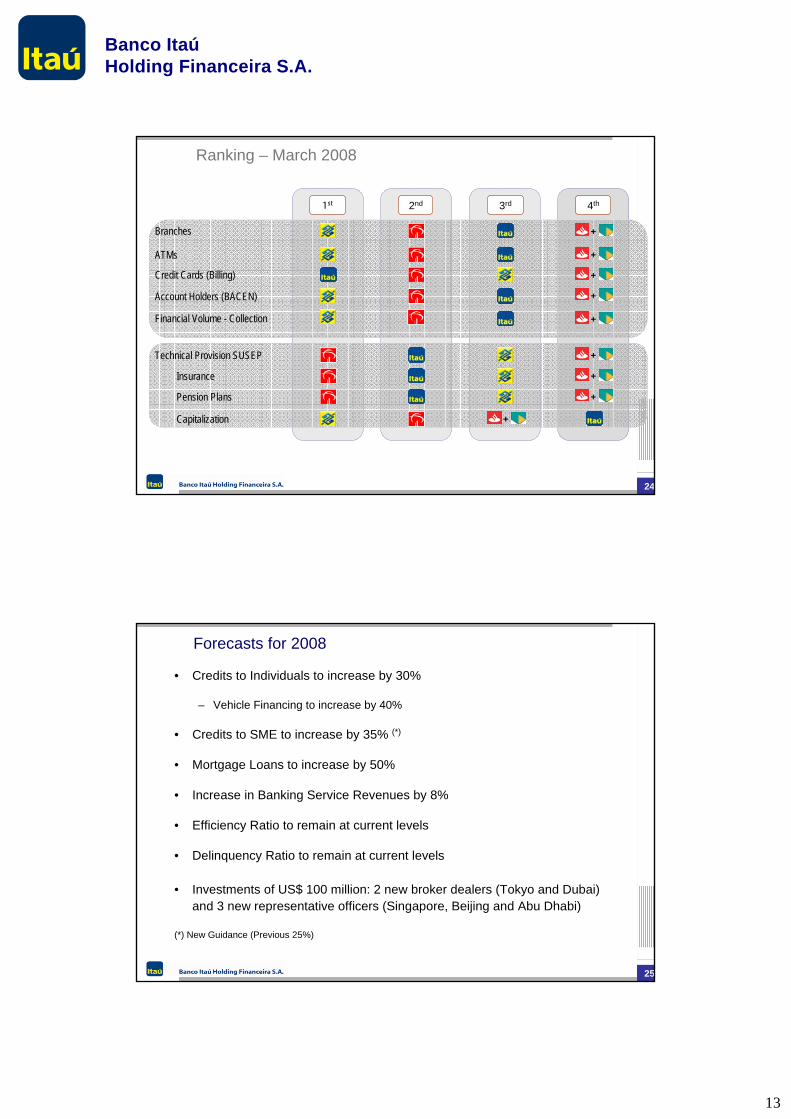
Ranking – March 2008
+
+
+
+
+
+
+
++
++
+
+
3rd1st 2nd 4th
Time Deposits
Total ResourcesDemand + Savings Deposits
AUM
Stockholders’ EquityROE
Net IncomeBank’s Net IncomeInsurance’s Net Income
Corporate Loans
Total LoansPersonal Loans
AssetsSecurities
+
13
Banco ItaúHolding Financeira S.A.
Ouvidora Corporativa Itaú 2424
3rd1st 2nd 4th
+
+
+
+
+
+
+
+
+
Ranking – March 2008
Financial Volume - Collection
Account Holders (BACEN)
Branches
ATMs
Credit Cards (Billing)
Pension Plans
Capitalization
Technical Provision SUSEP
Insurance
Ouvidora Corporativa Itaú 2525
Forecasts for 2008
• Credits to Individuals to increase by 30%
– Vehicle Financing to increase by 40%
• Credits to SME to increase by 35% (*)
• Mortgage Loans to increase by 50%
• Increase in Banking Service Revenues by 8%
• Efficiency Ratio to remain at current levels
• Delinquency Ratio to remain at current levels
• Investments of US$ 100 million: 2 new broker dealers (Tokyo and Dubai) and 3 new representative officers (Singapore, Beijing and Abu Dhabi)
(*) New Guidance (Previous 25%)
14
Banco ItaúHolding Financeira S.A.
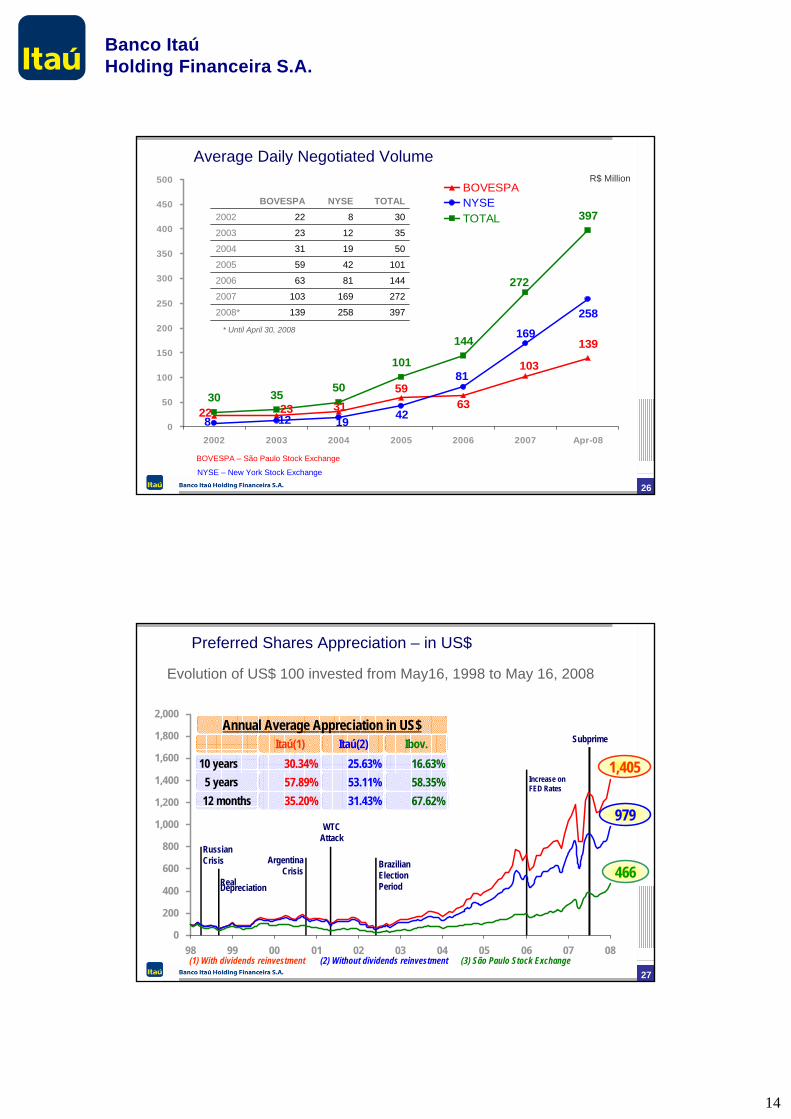
139
258
30 35 50
101
144
397
593122 23
103
6319 42128
169
81
272
0
50
100
150
200
250
300
350
400
450
500
2002 2003 2004 2005 2006 2007 Apr-08
BOVESPANYSETOTAL
2721691032007
3972581392008*
14481632006
10142592005
5019312004
3512232003
308222002
TOTALNYSEBOVESPA
* Until April 30, 2008
Average Daily Negotiated Volume
BOVESPA – São Paulo Stock Exchange
NYSE – New York Stock Exchange
R$ Million
26
0
200
400
600
800
1,000
1,200
1,400
1,600
1,800
2,000
98 99 00 01 02 03 04 05 06 07 08
979
466
1,405
RussianCrisis
Real Depreciation
Argentina Crisis
WTC Attack
BrazilianElectionPeriod
SubprimeAnnual Average Appreciation in US$
Itaú(1) Itaú(2) Ibov.10 years
5 years12 months
30.34%57.89%35.20%
25.63%53.11%31.43%
16.63%58.35%67.62%
Preferred Shares Appreciation – in US$
Evolution of US$ 100 invested from May16, 1998 to May 16, 2008
(1) With dividends reinvestment (2) Without dividends reinvestment (3) São Paulo Stock Exchange
Increase on FED Rates
27
15
Banco ItaúHolding Financeira S.A.
Ouvidora Corporativa Itaú 2828
Roberto SetubalCEO
3rd Annual Brazil Conference
Itaú Securities
NYC – May 21, 2008