apresentação resultados 3 t12 inglês
DESCRIPTION
TRANSCRIPT

1
3Q12 Presentation
Presenters
Marcos Lopes – CEO
Francisco Lopes – COO
Marcello Leone – CFO and IRO
Bruno Gama - COO CrediPronto!
2
This presentation does not constitute or form part of any offer, or invitation or solicitation of any offer to purchase,
sell or subscribe for shares or other securities of the Company, nor shall this presentation or any information
contained herein form the basis of, or act as inducement to enter into, any contract or commitment whatsoever.
This presentation contains financial and other information related to the business operations of Lopes –LPS Brasil
Consultoria de Imóveis S.A and its subsidiaries (“LPS” or the “Company”) as of and for the period ended
September 30th 2012. It should not be considered as a recommendation for prospective investors to sell,
purchase or subscribe for securities of the Company. The information presented herein is in summary form and
does not purport to be complete. No reliance should be placed on the accuracy completeness of the
information contained herein, and no representation or warranty, express or implied, is given on behalf of the
Company or its subsidiaries as to the accuracy completeness of the information presented herein.
This presentation contains forward-looking statements. Investors are advised that whilst the Company believes
they are based on reasonable assumptions by Management, forward-looking statements rely on current
expectations and projections about future events and financial trends, and are not a guarantee of future results.
Forward-looking statements are subject to risks and uncertainties that affect or may affect business conditions
and results of operations, which therefore could materially differ from those anticipated in forward-looking
statements due to several factors, including competitive pressures, Brazilian macroeconomic conditions,
performance of the industry, changes in market conditions, and other factors expressed or implied in these
forward-looking statements or disclosed by the Company elsewhere, factors currently deemed immaterial.
The forward-looking statements contained herein speak only as of the date they are made and neither
Management, nor the Company or its subsidiaries undertake any obligation to release publicly any revision to
these forward-looking statements after the date of this presentation or to reflect the occurrence of unanticipated
events.
Forward-looking statements
3
Schedule
I. Highlights
II. Operational Results
III. Credipronto!
IV. Financial Results

4
Highlights
Highlights
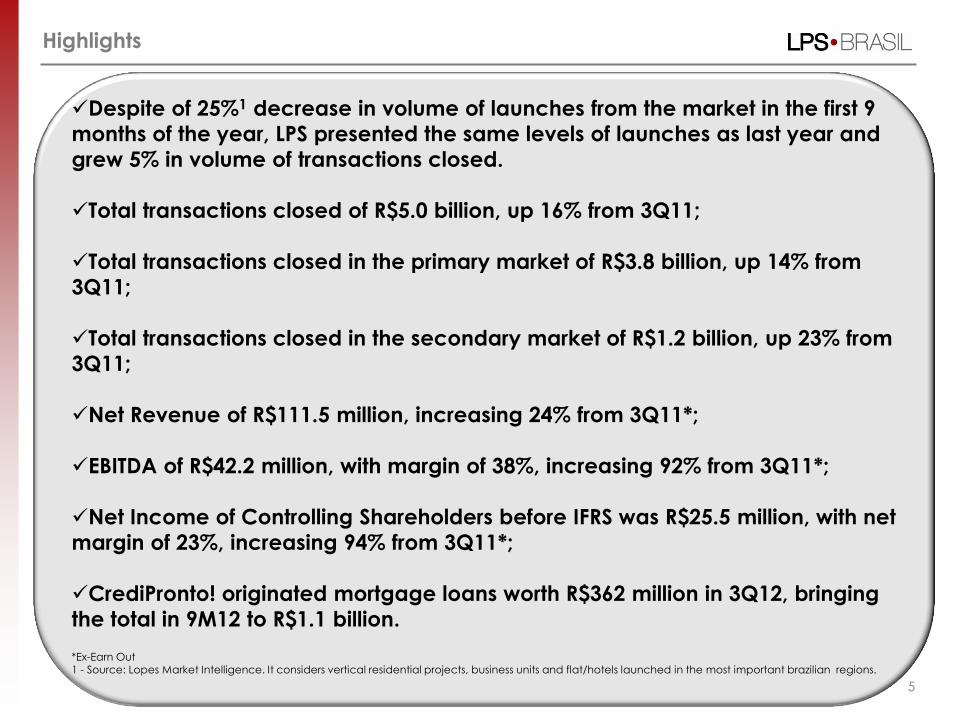
Despite of 25%1 decrease in volume of launches from the market in the first 9
months of the year, LPS presented the same levels of launches as last year and
grew 5% in volume of transactions closed.
Total transactions closed of R$5.0 billion, up 16% from 3Q11;
Total transactions closed in the primary market of R$3.8 billion, up 14% from
3Q11;
Total transactions closed in the secondary market of R$1.2 billion, up 23% from
3Q11;
Net Revenue of R$111.5 million, increasing 24% from 3Q11*;
EBITDA of R$42.2 million, with margin of 38%, increasing 92% from 3Q11*;
Net Income of Controlling Shareholders before IFRS was R$25.5 million, with net
margin of 23%, increasing 94% from 3Q11*;
CrediPronto! originated mortgage loans worth R$362 million in 3Q12, bringing
the total in 9M12 to R$1.1 billion.
*Ex-Earn Out
1 - Source: Lopes Market Intelligence. It considers vertical residential projects, business units and flat/hotels launched in the most important brazilian regions.
5
6
Operational Results
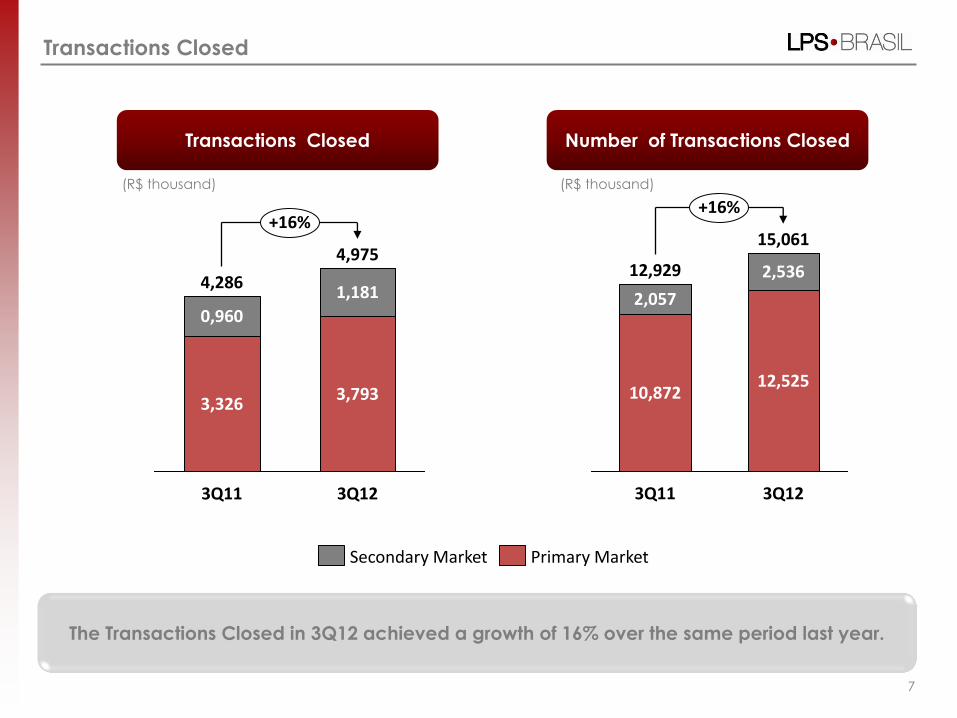
Transactions Closed
(R$ thousand)
Transactions Closed
7
Number of Transactions Closed
+16%
3Q12
4,975
3,793
1,181
3Q11
4,286
3,326
0,960
Primary Market Secondary Market
+16%
3Q12
15,061
12,525
2,536
3Q11
12,929
10,872
2,057
The Transactions Closed in 3Q12 achieved a growth of 16% over the same period last year.
(R$ thousand)
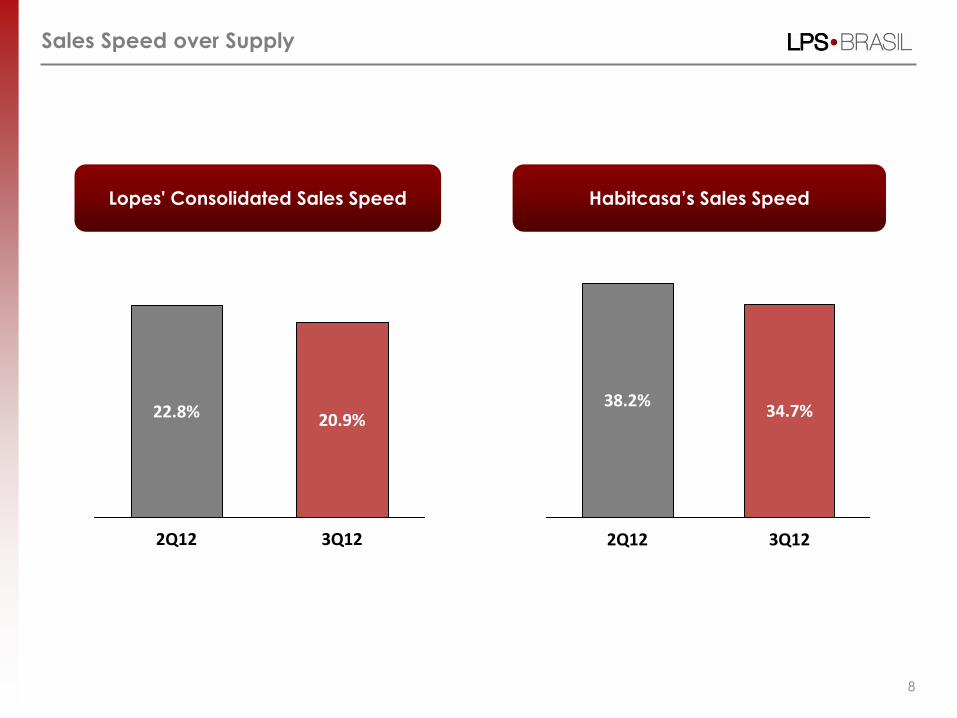
Sales Speed over Supply
Lopes' Consolidated Sales Speed Habitcasa’s Sales Speed
8
3Q12
22.8%
2Q12
20.9%
3Q12
34.7%
2Q12
38.2%
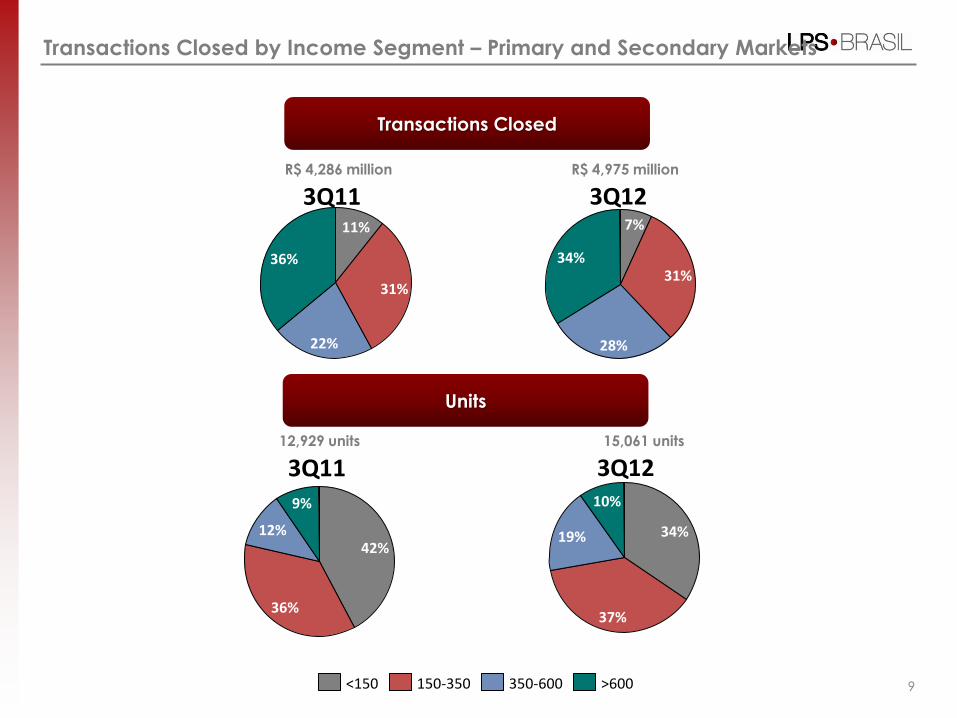
Units
Transactions Closed
9
15,061 units
R$ 4,975 million
Transactions Closed by Income Segment – Primary and Secondary Markets
36%
22%
31%
11%
34%
28%
31%
7%
9%
36%
12% 42%
>600 <150 150-350 350-600
10%
37%
19% 34%
R$ 4,286 million
12,929 units
3Q12
3Q12
3Q11
3Q11
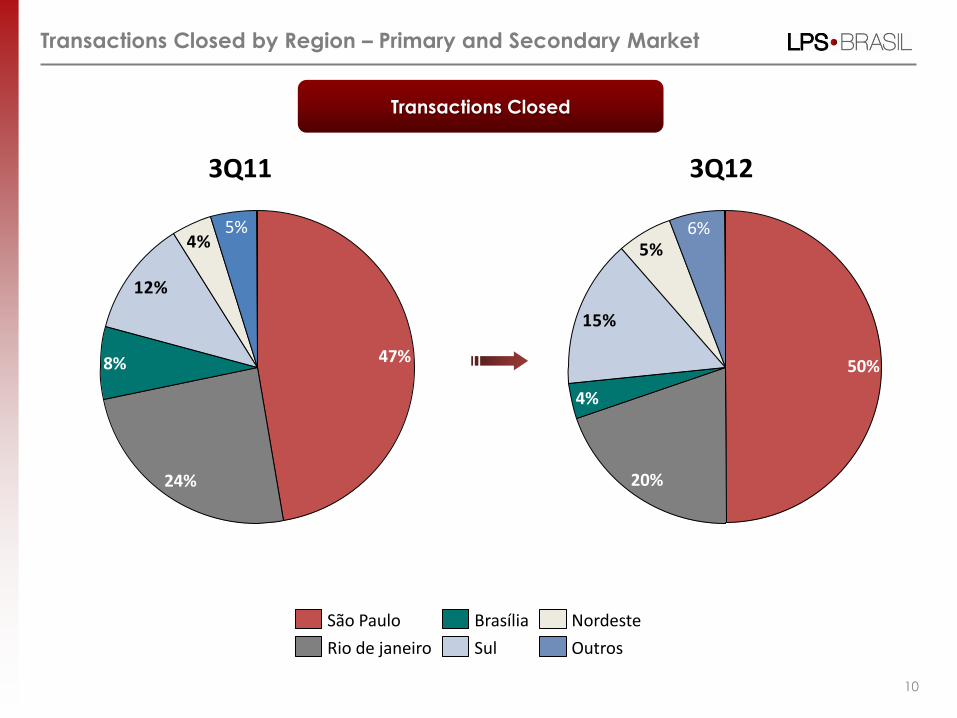
Transactions Closed by Region – Primary and Secondary Market
Transactions Closed
10
4%
12%
8%
24%
47%
5% 5%
15%
4%
20%
50%
6%
Nordeste
Sul
Brasília
Rio de janeiro
São Paulo
Outros
3Q11 3Q12
11
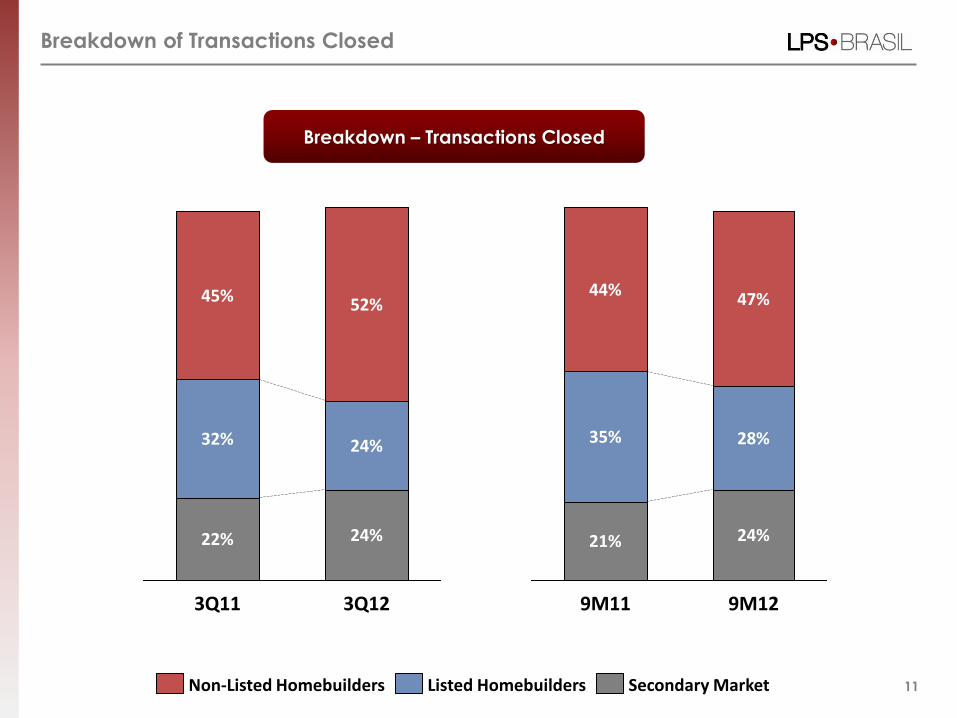
Breakdown of Transactions Closed
Breakdown – Transactions Closed
3Q12
24%
24%
52%
3Q11
22%
32%
45%
9M12
24%
28%
47%
9M11
21%
35%
44%
Secondary Market Listed Homebuilders Non-Listed Homebuilders
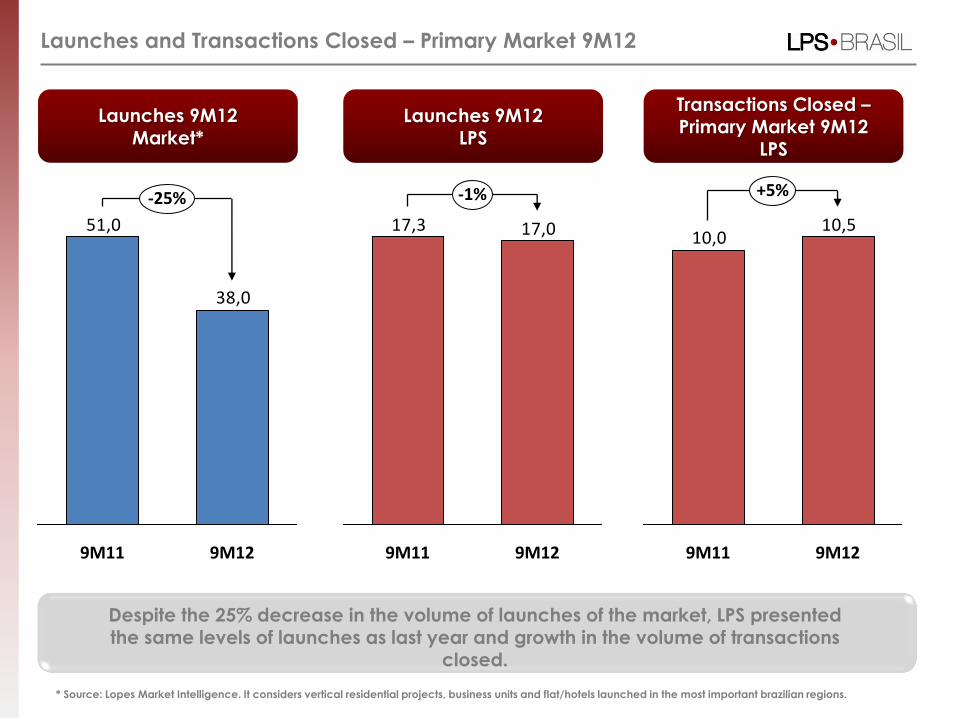
38,0
51,0
-25%
9M12 9M11
* Source: Lopes Market Intelligence. It considers vertical residential projects, business units and flat/hotels launched in the most important brazilian regions.
Launches and Transactions Closed – Primary Market 9M12
10,510,0
+5%
9M12 9M11
Launches 9M12 Market*
Transactions Closed – Primary Market 9M12
LPS
Despite the 25% decrease in the volume of launches of the market, LPS presented the same levels of launches as last year and growth in the volume of transactions
closed.
Launches 9M12 LPS
17,017,3
-1%
9M12 9M11
13
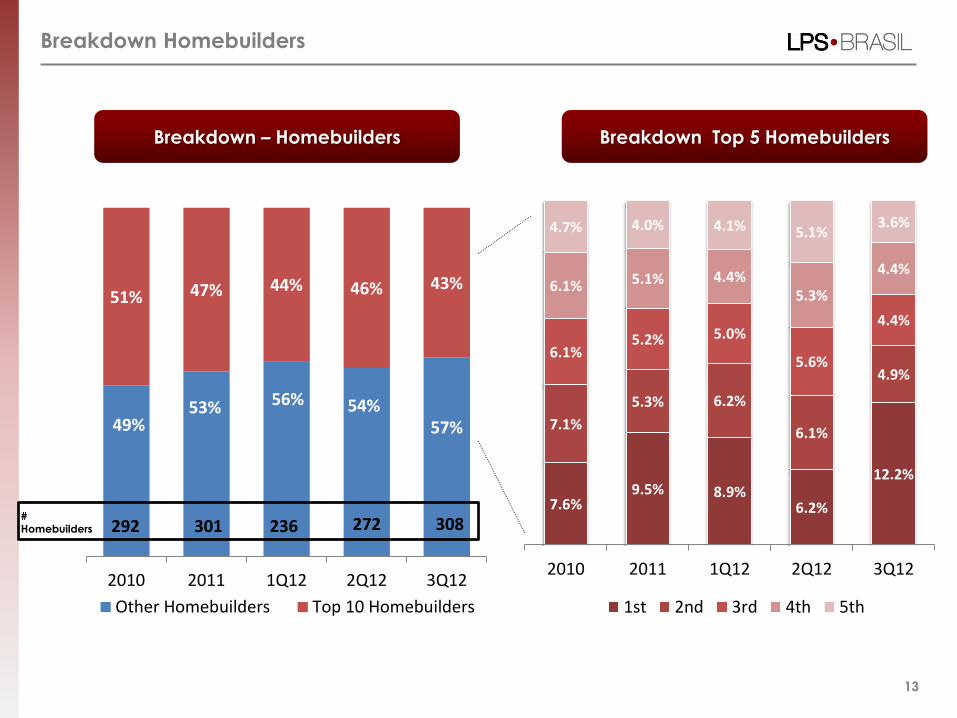
Breakdown Homebuilders
Breakdown Top 5 Homebuilders Breakdown – Homebuilders
49% 53% 56% 54%
57%
51% 47% 44% 46% 43%
2010 2011 1Q12 2Q12 3Q12
Other Homebuilders Top 10 Homebuilders
292 236 301 7.6%
9.5% 8.9% 6.2%
12.2%
7.1%
5.3% 6.2%
6.1%
4.9%
6.1% 5.2% 5.0%
5.6%
4.4%
6.1% 5.1% 4.4% 5.3%
4.4%
4.7% 4.0% 4.1% 5.1% 3.6%
2010 2011 1Q12 2Q12 3Q12
1st 2nd 3rd 4th 5th
# Homebuilders 272 308

LPS Brasil in the Mortgage Market
CrediPronto!
14
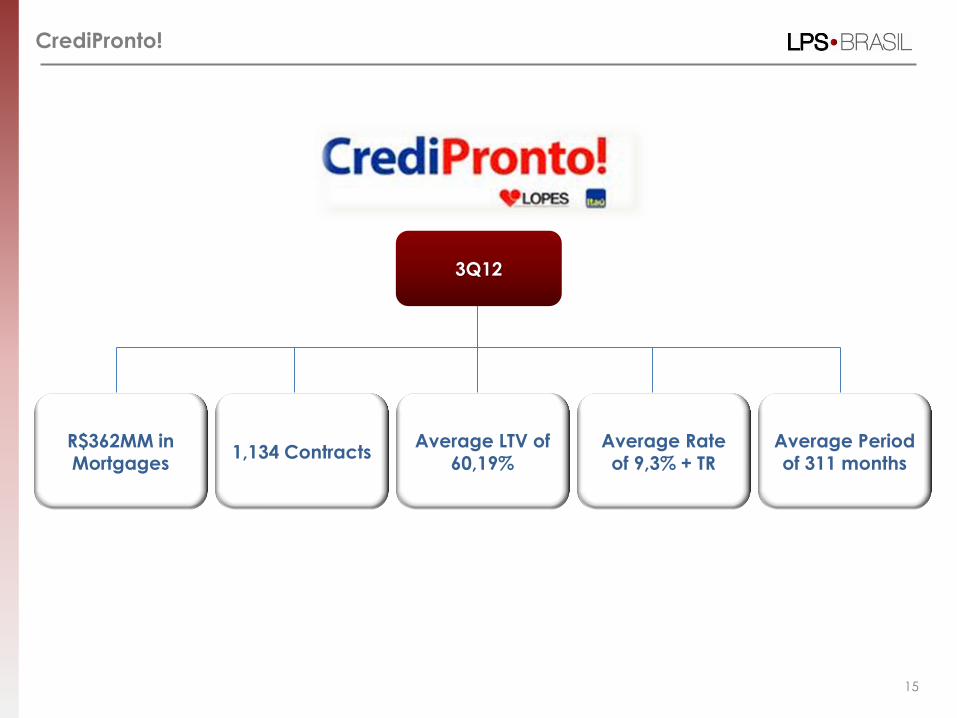
CrediPronto!
15
R$362MM in Mortgages
Average LTV of 60,19%
1,134 Contracts Average Period of 311 months
Average Rate of 9,3% + TR
3Q12
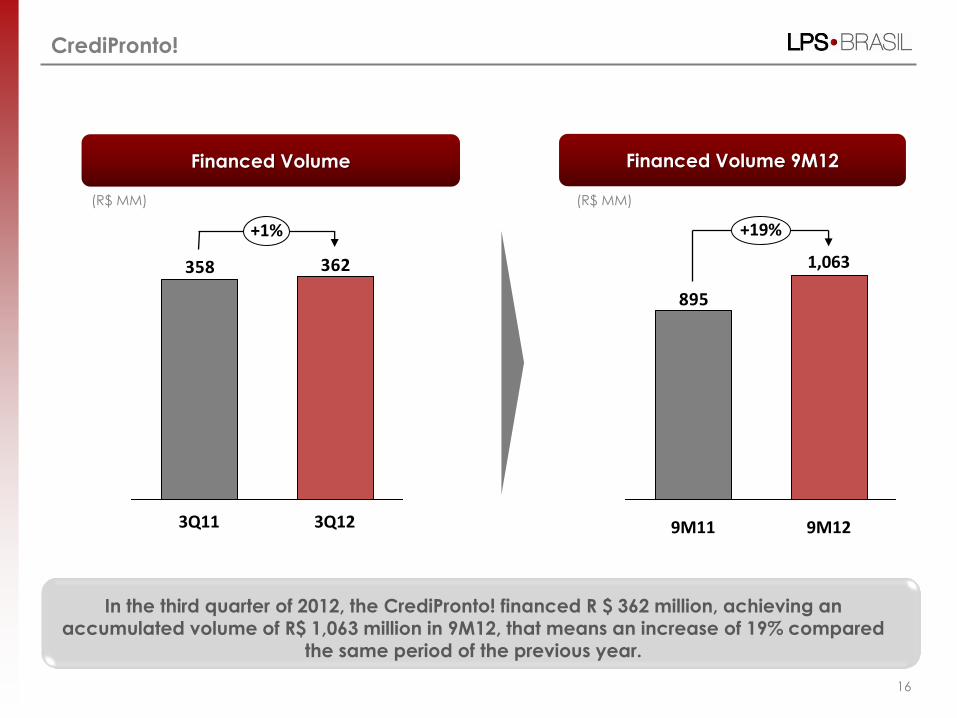
Financed Volume
CrediPronto!
(R$ MM)
16
(R$ MM)
Financed Volume 9M12
In the third quarter of 2012, the CrediPronto! financed R $ 362 million, achieving an accumulated volume of R$ 1,063 million in 9M12, that means an increase of 19% compared
the same period of the previous year.
362358
+1%
3Q12 3Q11
895
+19%
9M12
1,063
9M11
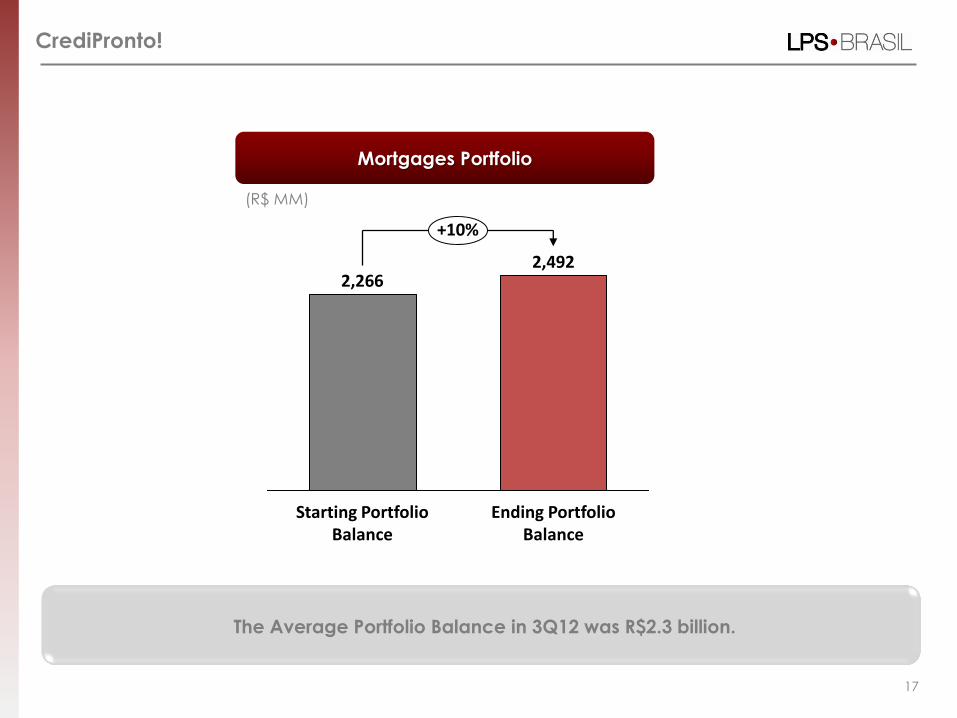
Mortgages Portfolio
CrediPronto!
The Average Portfolio Balance in 3Q12 was R$2.3 billion.
(R$ MM)
17
+10%
Ending Portfolio Balance
2,492
Starting Portfolio Balance
2,266
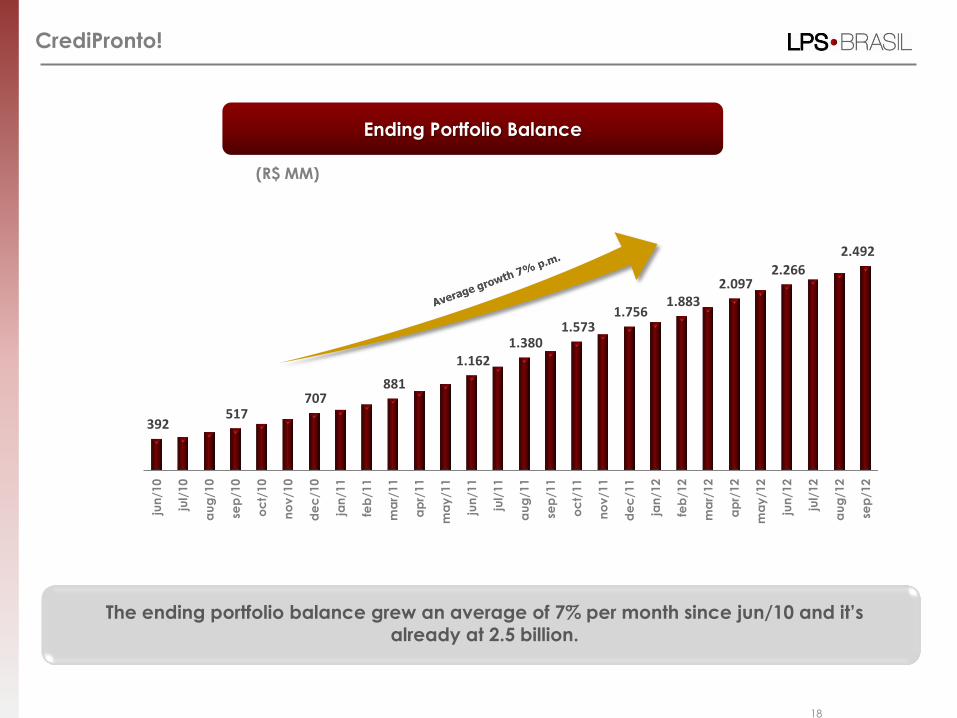
Ending Portfolio Balance
CrediPronto!
(R$ MM)
18
The ending portfolio balance grew an average of 7% per month since jun/10 and it’s already at 2.5 billion.
392 517
707 881
1.162 1.380
1.573 1.756
1.883 2.097
2.266
2.492
jun
/10
jul/
10
au
g/1
0
sep
/10
oc
t/10
no
v/1
0
de
c/1
0
jan
/11
feb
/11
ma
r/11
ap
r/11
ma
y/1
1
jun
/11
jul/
11
au
g/1
1
sep
/11
oc
t/11
no
v/1
1
de
c/1
1
jan
/12
feb
/12
ma
r/12
ap
r/12
ma
y/1
2
jun
/12
jul/
12
au
g/1
2
sep
/12
Financial Results
19
20
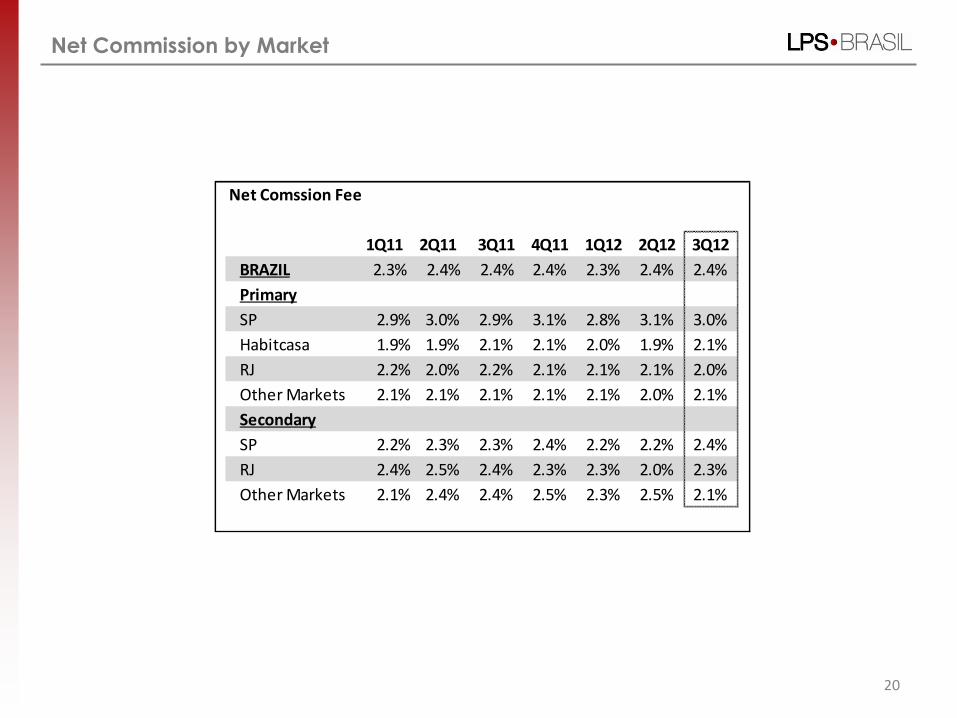
Net Commission by Market
Net Comssion Fee
1Q11 2Q11 3Q11 4Q11 1Q12 2Q12 3Q12
BRAZIL 2.3% 2.4% 2.4% 2.4% 2.3% 2.4% 2.4%
Primary
SP 2.9% 3.0% 2.9% 3.1% 2.8% 3.1% 3.0%
Habitcasa 1.9% 1.9% 2.1% 2.1% 2.0% 1.9% 2.1%
RJ 2.2% 2.0% 2.2% 2.1% 2.1% 2.1% 2.0%
Other Markets 2.1% 2.1% 2.1% 2.1% 2.1% 2.0% 2.1%
Secondary
SP 2.2% 2.3% 2.3% 2.4% 2.2% 2.2% 2.4%
RJ 2.4% 2.5% 2.4% 2.3% 2.3% 2.0% 2.3%
Other Markets 2.1% 2.4% 2.4% 2.5% 2.3% 2.5% 2.1%
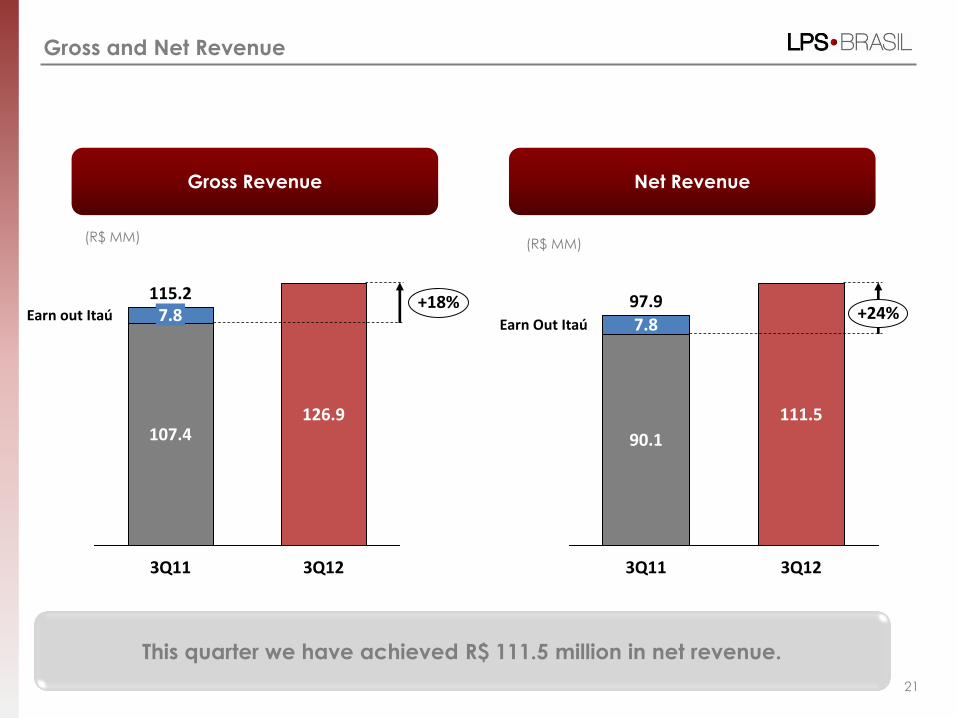
Gross and Net Revenue
Net Revenue
21
(R$ MM)
Gross Revenue
(R$ MM)
This quarter we have achieved R$ 111.5 million in net revenue.
+18% Earn out Itaú
3Q12
126.9
3Q11
115.2
107.4
7.8 +24% Earn Out Itaú
3Q12
111.5
3Q11
97.9
90.1
7.8
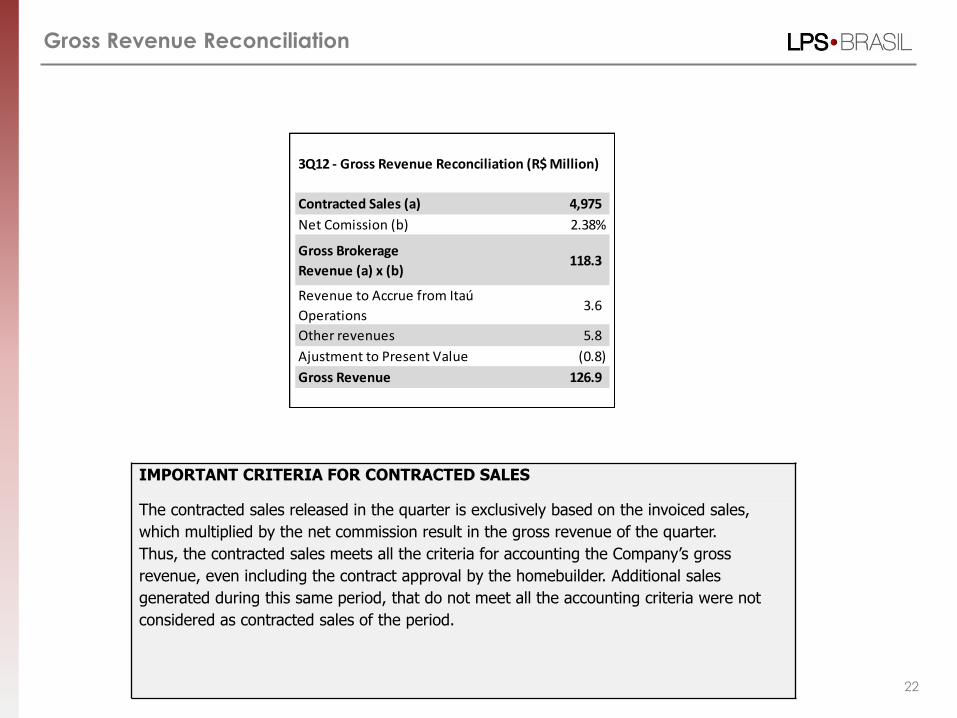
Gross Revenue Reconciliation
IMPORTANT CRITERIA FOR CONTRACTED SALES
The contracted sales released in the quarter is exclusively based on the invoiced sales,
which multiplied by the net commission result in the gross revenue of the quarter.
Thus, the contracted sales meets all the criteria for accounting the Company’s gross
revenue, even including the contract approval by the homebuilder. Additional sales
generated during this same period, that do not meet all the accounting criteria were not
considered as contracted sales of the period.
22
3Q12 - Gross Revenue Reconciliation (R$ Million)
Contracted Sales (a) 4,975
Net Comission (b) 2.38%
Gross Brokerage
Revenue (a) x (b)118.3
Revenue to Accrue from Itaú
Operations3.6
Other revenues 5.8
Ajustment to Present Value (0.8)
Gross Revenue 126.9
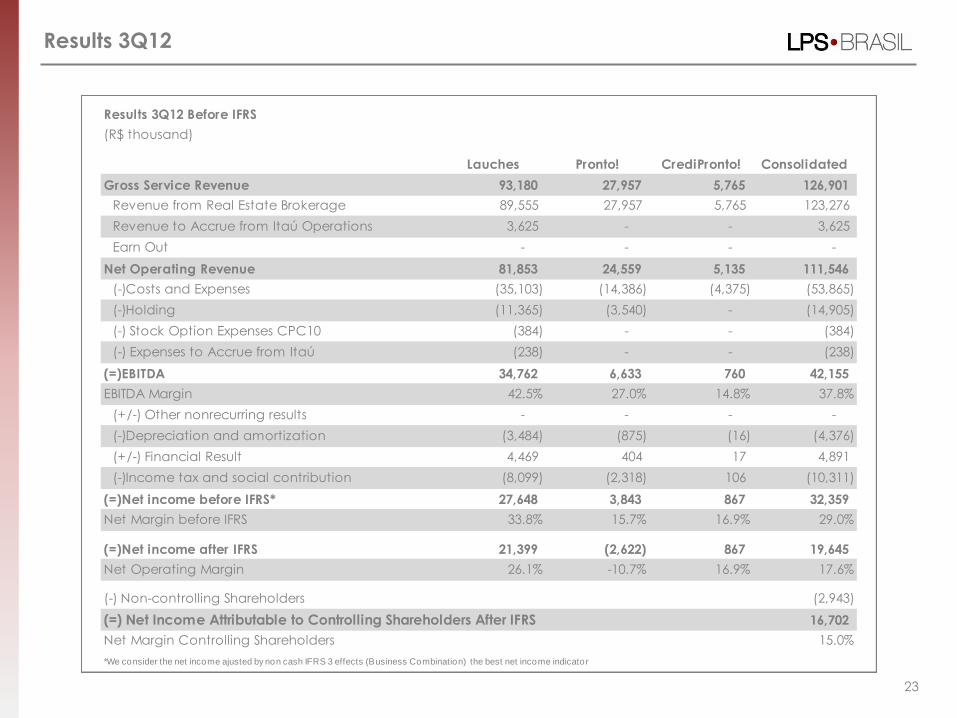
Results 3Q12
23
Results 3Q12 Before IFRS
(R$ thousand)
Lauches Pronto! CrediPronto! Consolidated
Gross Service Revenue 93,180 27,957 5,765 126,901
Revenue from Real Estate Brokerage 89,555 27,957 5,765 123,276
Revenue to Accrue from Itaú Operations 3,625 - - 3,625
Earn Out - - - -
Net Operating Revenue 81,853 24,559 5,135 111,546
(-)Costs and Expenses (35,103) (14,386) (4,375) (53,865)
(-)Holding (11,365) (3,540) - (14,905)
(-) Stock Option Expenses CPC10 (384) - - (384)
(-) Expenses to Accrue from Itaú (238) - - (238)
(=)EBITDA 34,762 6,633 760 42,155
EBITDA Margin 42.5% 27.0% 14.8% 37.8%
(+/-) Other nonrecurring results - - - -
(-)Depreciation and amortization (3,484) (875) (16) (4,376)
(+/-) Financial Result 4,469 404 17 4,891
(-)Income tax and social contribution (8,099) (2,318) 106 (10,311)
(=)Net income before IFRS* 27,648 3,843 867 32,359
Net Margin before IFRS 33.8% 15.7% 16.9% 29.0%
(=)Net income after IFRS 21,399 (2,622) 867 19,645
Net Operating Margin 26.1% -10.7% 16.9% 17.6%
(-) Non-controlling Shareholders (2,943)
(=) Net Income Attributable to Controlling Shareholders After IFRS 16,702
Net Margin Controlling Shareholders 15.0%
*We consider the net income ajusted by non cash IFRS 3 effects (Business Combination) the best net income indicator
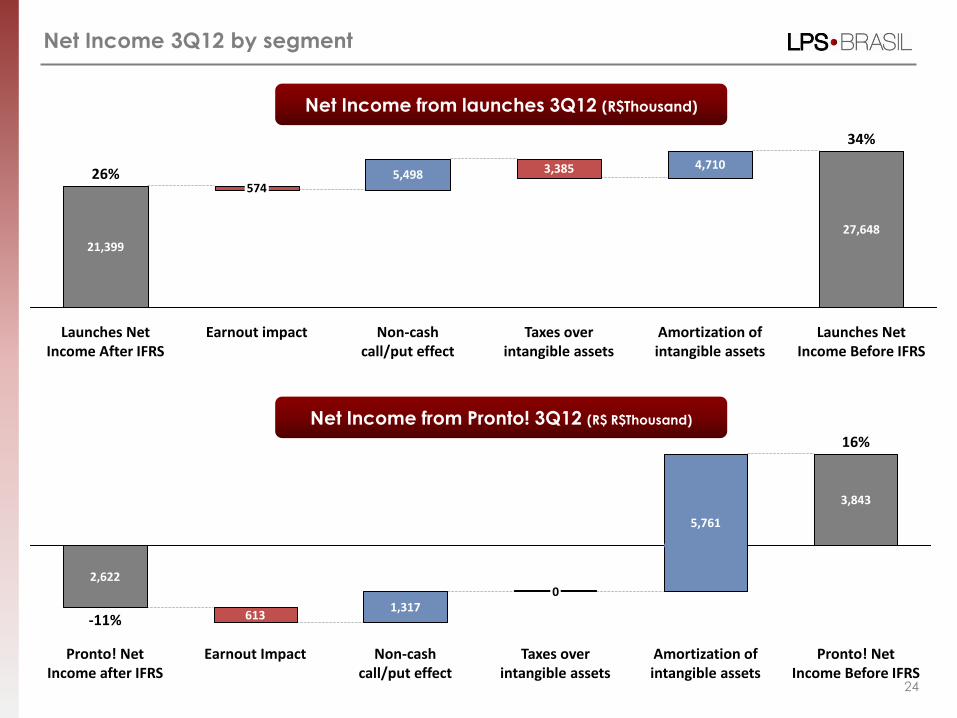
Net Income 3Q12 by segment
24
Launches Net Income Before IFRS
34%
27,648
Amortization of intangible assets
4,710
Taxes over intangible assets
3,385
Non-cash call/put effect
5,498
Earnout impact
574
Launches Net Income After IFRS
26%
21,399
Pronto! Net Income Before IFRS
16%
3,843
Amortization of intangible assets
5,761
Taxes over intangible assets
0
Non-cash call/put effect
1,317
Earnout Impact
613
Pronto! Net Income after IFRS
-11%
2,622
Net Income from launches 3Q12 (R$Thousand)
Net Income from Pronto! 3Q12 (R$ R$Thousand)
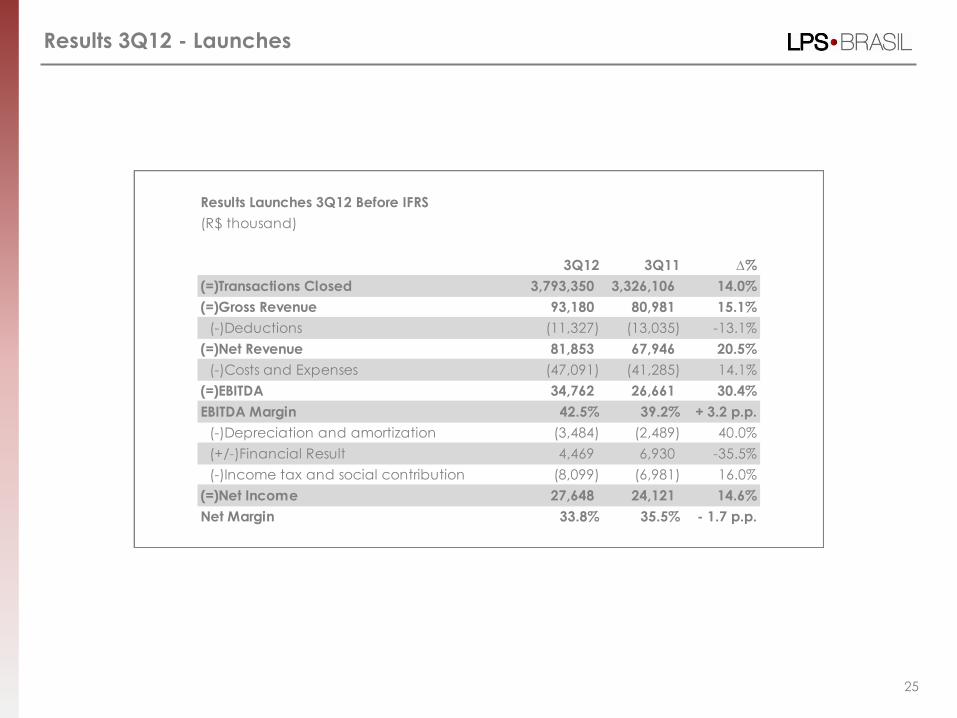
Results 3Q12 - Launches
25
Results Launches 3Q12 Before IFRS
(R$ thousand)
3Q12 3Q11 ∆%
(=)Transactions Closed 3,793,350 3,326,106 14.0%
(=)Gross Revenue 93,180 80,981 15.1%
(-)Deductions (11,327) (13,035) -13.1%
(=)Net Revenue 81,853 67,946 20.5%
(-)Costs and Expenses (47,091) (41,285) 14.1%
(=)EBITDA 34,762 26,661 30.4%
EBITDA Margin 42.5% 39.2% + 3.2 p.p.
(-)Depreciation and amortization (3,484) (2,489) 40.0%
(+/-)Financial Result 4,469 6,930 -35.5%
(-)Income tax and social contribution (8,099) (6,981) 16.0%
(=)Net Income 27,648 24,121 14.6%
Net Margin 33.8% 35.5% - 1.7 p.p.
26
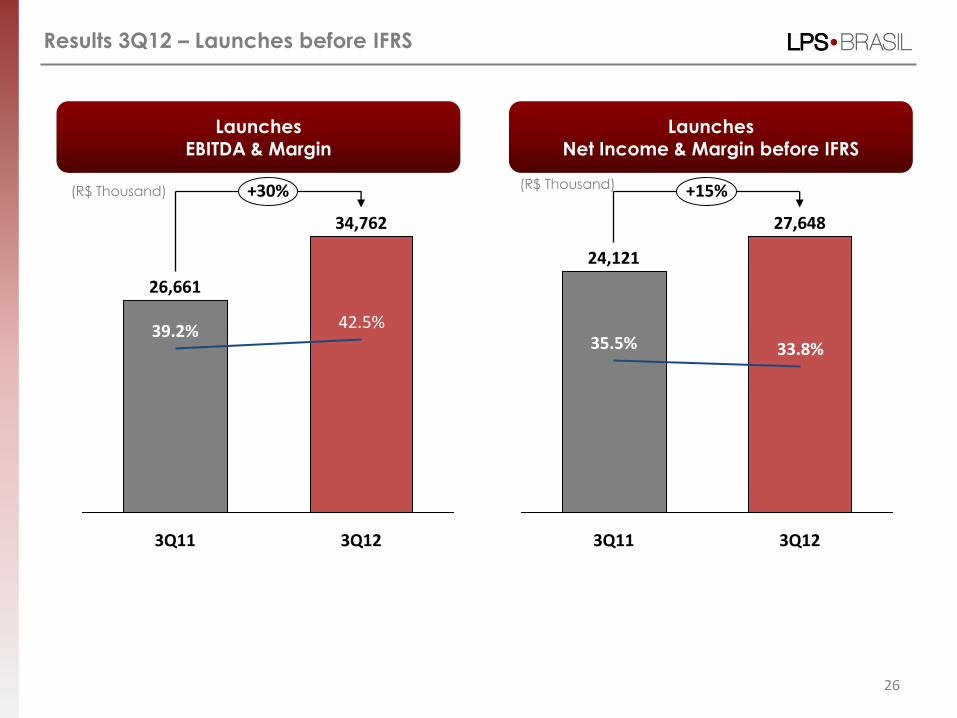
Results 3Q12 – Launches before IFRS
Launches EBITDA & Margin
Launches Net Income & Margin before IFRS
+15%
3Q12
27,648
33.8%
3Q11
24,121
35.5%
(R$ Thousand) (R$ Thousand) +30%
3Q12
34,762
42.5%
3Q11
26,661
39.2%
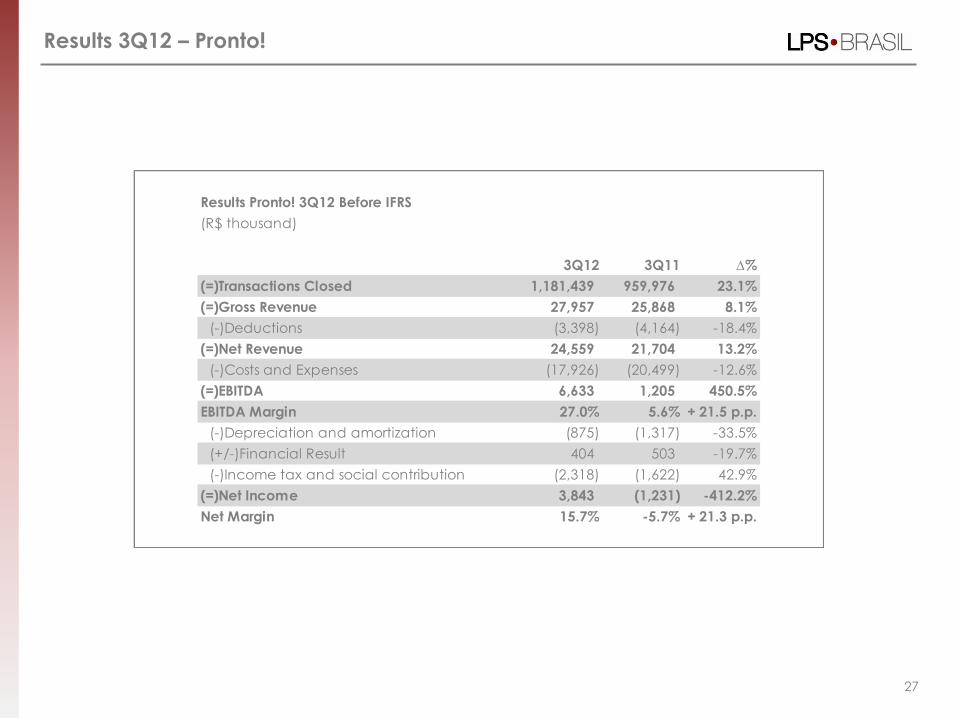
Results 3Q12 – Pronto!
27
Results Pronto! 3Q12 Before IFRS
(R$ thousand)
3Q12 3Q11 ∆%
(=)Transactions Closed 1,181,439 959,976 23.1%
(=)Gross Revenue 27,957 25,868 8.1%
(-)Deductions (3,398) (4,164) -18.4%
(=)Net Revenue 24,559 21,704 13.2%
(-)Costs and Expenses (17,926) (20,499) -12.6%
(=)EBITDA 6,633 1,205 450.5%
EBITDA Margin 27.0% 5.6% + 21.5 p.p.
(-)Depreciation and amortization (875) (1,317) -33.5%
(+/-)Financial Result 404 503 -19.7%
(-)Income tax and social contribution (2,318) (1,622) 42.9%
(=)Net Income 3,843 (1,231) -412.2%
Net Margin 15.7% -5.7% + 21.3 p.p.

28
Results 3Q12 – Pronto! Before IFRS
+450%
3Q12
6,633
27.0%
3Q11
1,205
5.6%
Pronto! EBITDA & Margin
Pronto! Net Income & Margin before IFRS
+412%
3Q12
3,843
15.7%
3Q11
-1,231
-5.7%
(R$ Thousand) (R$ Thousand)

29
Operational Expenses
* Does not consider IFRS
Evolution of Operational Expenses*
(R$ MM) +1%
3Q12
69.4
65.0
4.4
3Q11
68.5
64.8
3.7
Launches + Secondary (Pronto!)
CrediPronto!
Non recurring expenses 3Q12
(R$ million)
M&A Costs 2,0
Consulting Services 0,4
Total 2,4
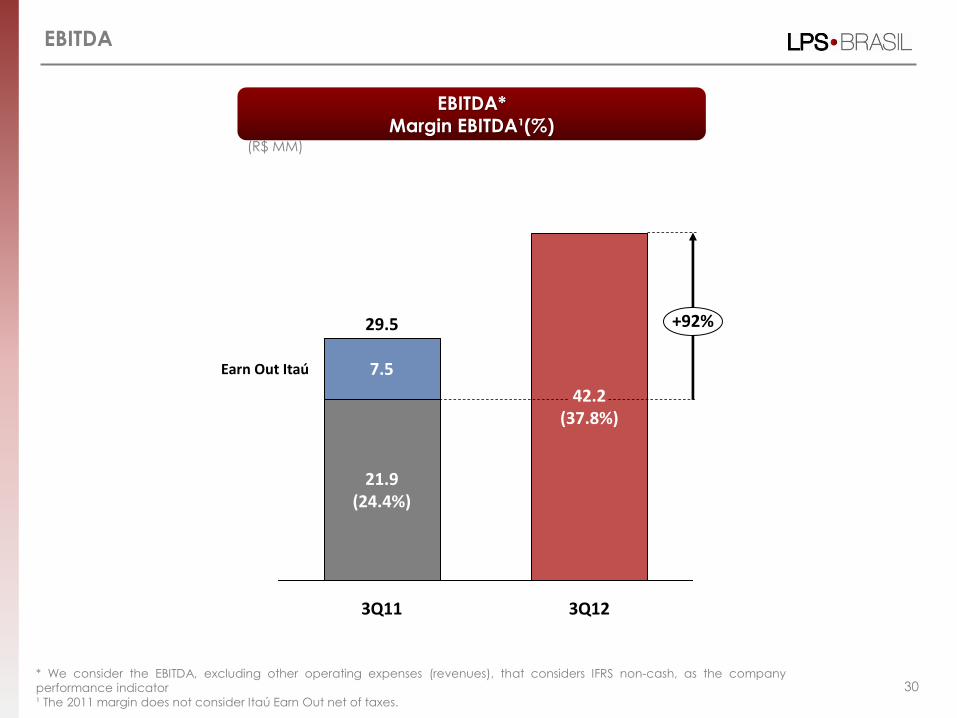
EBITDA
EBITDA* Margin EBITDA¹(%)
(R$ MM)
30 * We consider the EBITDA, excluding other operating expenses (revenues), that considers IFRS non-cash, as the company
performance indicator
¹ The 2011 margin does not consider Itaú Earn Out net of taxes.
+92%
Earn Out Itaú
3Q12
42.2 (37.8%)
3Q11
29.5
21.9 (24.4%)
7.5
31
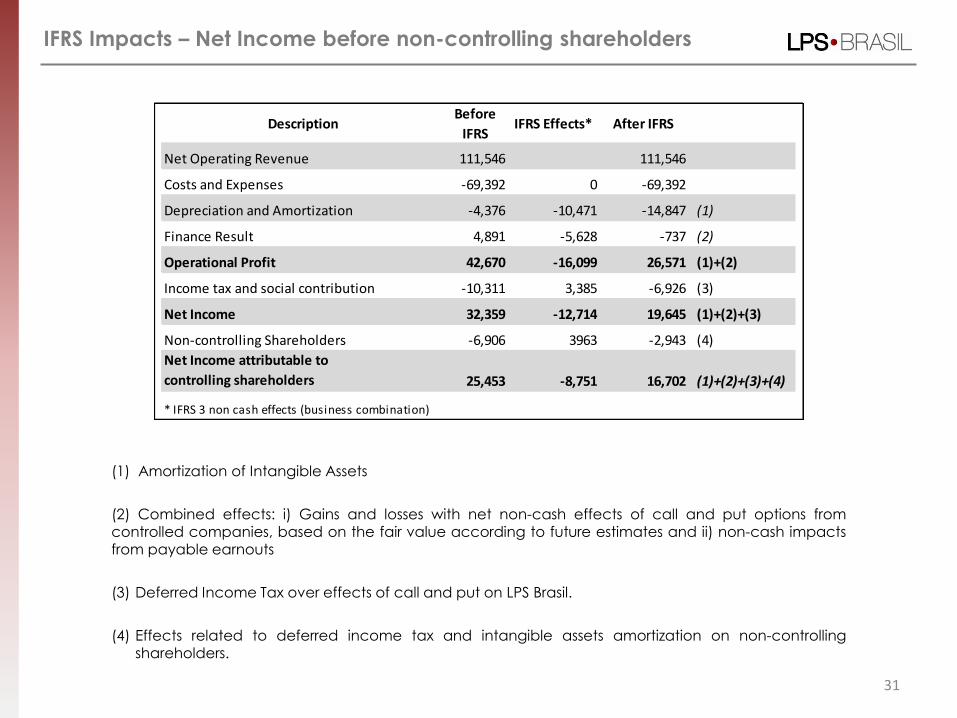
IFRS Impacts – Net Income before non-controlling shareholders
(1) Amortization of Intangible Assets
(2) Combined effects: i) Gains and losses with net non-cash effects of call and put options from controlled companies, based on the fair value according to future estimates and ii) non-cash impacts from payable earnouts
(3) Deferred Income Tax over effects of call and put on LPS Brasil.
(4) Effects related to deferred income tax and intangible assets amortization on non-controlling shareholders.
DescriptionBefore
IFRSIFRS Effects* After IFRS
Net Operating Revenue 111,546 111,546
Costs and Expenses -69,392 0 -69,392
Depreciation and Amortization -4,376 -10,471 -14,847 (1)
Finance Result 4,891 -5,628 -737 (2)
Operational Profit 42,670 -16,099 26,571 (1)+(2)
Income tax and social contribution -10,311 3,385 -6,926 (3)
Net Income 32,359 -12,714 19,645 (1)+(2)+(3)
Non-controlling Shareholders -6,906 3963 -2,943 (4)
Net Income attributable to
controlling shareholders 25,453 -8,751 16,702 (1)+(2)+(3)+(4)
* IFRS 3 non cash effects (business combination)
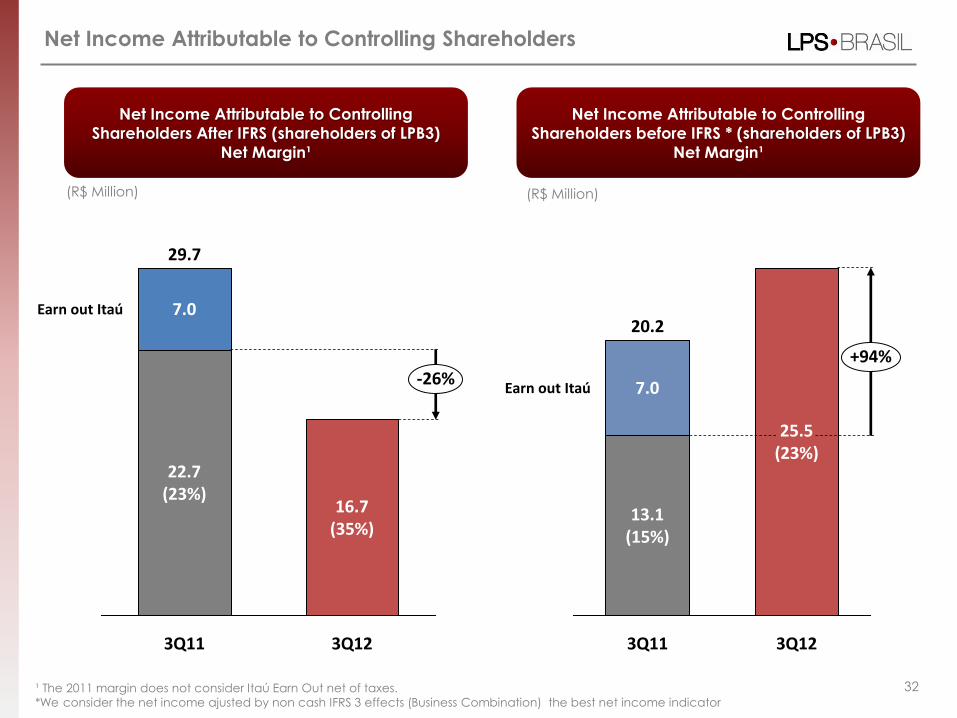
Net Income Attributable to Controlling Shareholders
Net Income Attributable to Controlling
Shareholders After IFRS (shareholders of LPB3)
Net Margin¹
(R$ Million)
32
Net Income Attributable to Controlling
Shareholders before IFRS * (shareholders of LPB3)
Net Margin¹
+94%
Earn out Itaú
3Q12
25.5 (23%)
3Q11
20.2
13.1 (15%)
7.0
(R$ Million)
-26%
Earn out Itaú
3Q12
16.7 (35%)
3Q11
29.7
22.7 (23%)
7.0
¹ The 2011 margin does not consider Itaú Earn Out net of taxes.
*We consider the net income ajusted by non cash IFRS 3 effects (Business Combination) the best net income indicator

3Q12 Earnings Conference Call
Portuguese English
Date: 11/14/2012, Wednesday Date: 11/14/2012, Wednesday
Time: 10h00 a.m. (BR Time) 07h00 a.m. (NY Time)
Time: 12h00 p.m. (BR Time) 09h00 a.m. (NY Time)
Telephone: (11) 2188 0155 Password: Lopes
Telephone Brazil: +55 (11) 2188 0155 Telephone US: (+1) 646 843 6054
Telephone other countries: (+44) 203 051 6929 Password: Lopes
Replay: Replay: http://webcall.riweb.com.br/lpsbrasil/ http://webcall.riweb.com.br/lpsbrasil/english/
CONTACTS
Marcello Leone CFO and IRO
Tel. +55 (11) 3067-0015
IR Tel. +55 (11) 3067-0218
E-mail: [email protected]
www.lopes.com.br/ir
Next Events
33