ana regina silva ppa e a sua fosforilação na sinalização
TRANSCRIPT

Universidade de Aveiro
2012
Secção Autónoma de Ciências da Saúde
Ana Regina Silva Cerqueira
PPA e a sua fosforilação na sinalização STAT3 induzida por Gαo APP and APP phosphorylation in Gαo-induced STAT3 signaling

Universidade de Aveiro
2012
Secção Autónoma de Ciências da Saúde
Ana Regina Silva Cerqueira
PPA e a sua fosforilação na sinalização STAT3 induzida por Gαo APP and APP phosphorylation in Gαo-induced STAT3 signaling
Dissertação apresentada à Universidade de Aveiro para cumprimento dos requisitos necessários à obtenção do grau de Mestre em Biomedicina Molecular, realizada sob a orientação científica da Professora Doutora Sandra Vieira, Professora Auxiliar Convidada da Secção Autónoma de Ciências da Saúde da Universidade de Aveiro.
Este trabalho contou com o apoio do Centro de Biologia Celular (CBC) da Universidade de Aveiro, e é financiado por fundos FEDER através do Programa Operacional Factores de Competitividade – COMPETE e por Fundos nacionais da FCT – Fundação para a Ciência e a Tecnologia no âmbito dos projectos PTDC/QUI-BIQ/101317/2008, PTDC/SAL-NMC/111980/2009 e PEst-OE/SAU/UI0482/2011.

Dedicada ao meu avô, Rui Silva. Dedicada aos meus pais e irmã, a quem devo tudo o que tenho na vida.

o júri
presidente Odete Abreu Beirão da Cruz e Silva Prof. Auxiliar Com Agregação, Secção Autónoma de Ciências da Saúde, Universidade de Aveiro
Sandra Isabel Moreira Pinto Vieira Prof. Auxiliar Convidada, Secção Autónoma de Ciências da Saúde, Universidade de Aveiro
Ana Sofia Duarte Prof. Auxiliar Convidada, Departamento de Ciências da Saúde, Universidade Católica Portuguesa

agradecimentos
À minha orientadora, Sandra Vieira, agradeço a motivação, sabedoria, inspiração e dedicação que contribuíram para uma melhor aprendizagem. À professora Odete da Cruz e Silva por me ter dado a oportunidade de realizar esta etapa no laboratório de neurociências do Centro de Biologia Celular. Aos meus pais e à minha irmã pelo apoio incondicional, confiança, afecto, compreensão, dedicação e incentivo, que tornaram a concretização desta etapa possível. À linda família que tenho a sorte de ter e por, apesar das adversidades face ao trabalho, me proporcionarem o melhor ambiente familiar. Ao Bruno, à Pati, à Lili e à Ana Cristina por me darem o prazer de desfrutar diariamente de uma boa e verdadeira amizade. Ao João, à Carina, Daniela, Juliana, Ana Silva e Catarina por demonstrarem que a distância é um mero pormenor, quando o sentimento é verdadeiro. À Ana, Vanessa, Liliana, ao Tiago e Diogo por serem a prova que o tempo voa, mas que a amizade se pode manter. Ao Ivo, Marcelo e Rafael pela boa disposição e momentos de descontração, que tornam não só os jantares como, principalmente, a companhia insubstituíveis. A todos os meus colegas do CBC, particularmente aos meus colegas do laboratório de Neurociências. Ao Roberto e à Joana Rocha, pelo companheirismo, altruísmo e respeito que foram fundamentais para a realização deste trabalho. À FCT pelo financiamento dos projetos PTDC/QUI-BIQ/101317/2008 e PTDC/SAL-NMC/111980/2009.

palavras-chave
Proteína precursora de amilóide de Alzheimer (PPA); fosforilação da PPA na S655; sinalização da STAT3; proteína Gαo; células SH-SY5Y
resumo
A proteína precursora de amilóide de Alzheimer (PPA) é uma proteína cerebral fundamental, envolvida em mecanismos celulares como a adesão e migração celular e neuritogénese. Como fosfoproteína, a PPA apresenta oito resíduos fosforiláveis no seu domínio citoplasmático. Um desses resíduos, Serina 655 (S655), localiza-se no motivo funcional
653YTSI
656, e a sua fosforilação altera o
tráfego e o processamento da PPA, podendo ainda mediar a ligação desta a outras proteínas através de um hydrophobic pocket localizado imediatamente a jusante ao motivo YTSI (
657His-Lys
676). Nomeadamente, a proteína Gαo, uma
subunidade α de proteínas G heterotrimérica, liga-se à PPA neste local. A Gαo está envolvida em várias cascatas de sinalização e é o membro da família G i/o mais abundante no cérebro. Quando ativada, a Gαo consegue induzir fatores de crescimento relacionados com a via JAK2/STAT3 via Rap, provavelmente através da interação e sequestro de proteínas RapGAP. Adicionalmente, a Gαo foi sugerida como um transdutor da PPA, funcionando esta como um guanidine exchange factor (GEF) para a Gαo. No entanto, ainda não foi atribuído nenhum papel funcional a esta interação. O presente trabalho teve como principal objetivo determinar o papel da PPA na cascata de sinalização da STAT3 induzida por Gαo, pela análise dos efeitos da co-transfecção de PPA-Gαo nos níveis de STAT3 e STAT3 fosforilada através de Western blot. Para isto, células humanas de neuroblastoma SH-SY5Y são co-transfectadas por 6h e 24h com PPA-GFP cDNAs (Wt ou fosfomutantes S655: S655A, SA, e S655E, SE) e Gαo ou GαoCA (um mutante Q205L que mimetiza um estado constitutivamente activo da Gαo). Adicionalmente, foi estudado como é que os metabolismo da PPA e da Gαo afetam-se um ao outro, através da quantificação dos níveis de Gαo, PPA e PPAs secretada por Western blot. Em geral, os resultados obtidos mostram que as co-expressões de PPA-GFPs com Gαo/GαoCA levam a um decréscimo da fosforilação da STAT3 induzida por Gαo. Isto parece ocorrer através da indução de um efeito retro-inibitório nas vias Gαo-STAT3 após a ativação inicial da Gαo e, enquanto este efeito é mais pronunciado para o mutante que reproduz desfosforilação do resíduo S655 da PPA, a fosforilação neste mesmo resíduo parece retardar este efeito. Em concordância, a PPA invariavelmente diminui os níveis de Gαo e a Gαo também diminui os níveis de PPA, potencialmente envolvendo um mecanismo de inibição da ativação da STAT3 induzida pela Gαo através da PPA por degradação lisossomal PPA/Gαo.

keywords
Alzheimer’s Amyloid Precursor Protein (APP); APP phosphorylation at S655; STAT3 signalling; Gαo protein; SH-SY5Y cells
abstract
The transmembranar Alzheimer’s Amyloid Precursor Protein (APP), an important brain protein, is potentially involved in cellular mechanisms such as cell adhesion, migration and neuritogenesis. As a phosphoprotein, APP has eigth phosphorylatable residues in its cytoplasmic domain. One of these residues, S655, lies within the APP
653YTSI
656 sorting motif, and its
phosphorylation alters APP trafficking and processing, and may potentially mediate its binding to other proteins by means of a hydrophobic pocket localized immediately downstream the YTSI motif (
657His-Lys
676). This is the
pocket to which Gαo, an alpha subunit of heterotrimeric G proteins, binds to. Gαo mediates various signaling pathways and is the most brain-enriched member of the Gαi/o family. When activated, Gαo can induce the growth factors-related JAK2/STAT3 pathway via Rap, probably through interaction and sequestration of RapGAP proteins. Gαo has been suggested to be a transducer of APP, with APP acting as a guanidine exchange factor (GEF) for Gαo. Nonetheless, no functional role has been attributed to this interaction. In the work here described, the role of APP in Gαo-induced STAT3 signaling was assayed, by analysing the effects of APP-Gαo co-transfection in STAT3 and phospho-STAT3 levels by Western blot means. For this, human SH-SY5Y neuroblastoma cells were co-transfected for 6h and 24h, with APP-GFP fusion cDNAs (Wt or S655 phosphomutants: dephosphomimicking S655A and phosphomimicking S655E) and Gαo or GαoCA (a Q205L mutant mimicking constitutively active Gαo). Additionally, the effects of APP and Gαo in each other metabolism were also evaluated, by quantifying the levels of Gαo, APP and medium secreted sAPP by Western blot analysis. In general, the results obtained show that APP-GFPs co-expression with Gαo/GαoCA leads to a decrease in Gαo-induced STAT3 phosphorylation. This appears to occur via a retro-inhibition effect on the Gαo-STAT3 pathways following an initial Gαo activation and, while is more pronounced for the S655 dephosphomimicking mutant, phosphorylation at S655 appears to delay this effect. Accordingly, APP invariably decreases Gαo half-life, and Gαo also decreases APP levels, with APP/Gαo lysosomal co-degradation being a potential mechanism by which APP inhibits Gαo-induced STAT3 activation.

1
APP and APP phosphorylation in Gαo-induced STAT3 signaling
Index
Abbreviations ........................................................................................................................ 3
1. Introduction ............................................................................................................... 7
1.1. Alzheimer’s Disease ............................................................................................ 7
1.1.1. Alzheimer’s Disease pathology ................................................................... 7
1.1.2. Hallmarks of AD .......................................................................................... 9
1.1.3. Risk factors ................................................................................................ 11
1.2. The β-Amyloid Precursor Protein (APP) .......................................................... 14
1.2.1. APP gene family, isoforms and domains ................................................... 15
1.2.2. APP metabolism: trafficking and processing ............................................. 18
1.2.3. Phosphorylation of APP ............................................................................. 23
1.3. APP as a potential mediator of G proteins signaling ........................................ 25
1.3.1. G proteins ................................................................................................... 25
1.3.1.1. Gαo Protein: genetics, expression pattern and function ....................... 29
1.3.1.2. Modulation of Gαo activity .................................................................. 30
1.3.1.3. Gαo-mediated signaling transduction ................................................... 31
1.3.1.4. APP-Gαo binding and Alzheimer’s disease ......................................... 32
1.3.2. STAT3 signaling ........................................................................................ 33
1.3.2.1. STAT proteins ...................................................................................... 33
1.3.2.2. STAT3 function ................................................................................... 35
1.3.2.3. APP and Gαo in STAT3 signaling ....................................................... 36
2. Aims of this thesis ................................................................................................... 39
2.1. General Aims..................................................................................................... 39
2.2. Specific Aims .................................................................................................... 39
3. Materials and Methods ............................................................................................ 41
3.1. Culture and maintenance of the SH-SY5Y cell line ......................................... 41
3.2. Wt and S655 Phosphomutants APP-GFP cDNAs ............................................ 41
3.3. Wild-type and constitutively active G-protein alpha o – Gαo and GαoCA
(Q205L) cDNAs ........................................................................................................... 41
3.4. SH-SY5Y cells transfection with APP-GFP and Gαo or GαoCA cDNAs ......... 42
3.4.1. Transfection by the Polyplus method ........................................................ 42
3.4.2. Transfection using the TurboFectTM
reagent ............................................. 43
3.4.3. Transfection using the TurboFectTM
reagent plus CombiMag .................. 43

2
Ana Regina Silva Cerqueira SACS/UA, 2012
3.5. Cell collection and quantification of protein content (BCA) ............................ 44
3.6. Antibodies ......................................................................................................... 45
3.7. Western Blot Assays ......................................................................................... 46
3.8. GFP-trap® pull-down assays ............................................................................. 47
3.9. Ponceau S staining of proteins bands ................................................................ 48
3.10. Fluorescence Microscopy .............................................................................. 49
3.11. Data analysis .................................................................................................. 49
4. Results ..................................................................................................................... 51
4.1. Optimization of APP/Gαo cDNAs transfection ................................................. 51
4.2. Pilot experiment – time periods of Gαo transfection ......................................... 52
4.3. APP effects on Gαo–induced STAT3 signaling ................................................ 54
4.3.1. APP and Gαo effects on STAT3 activation levels ..................................... 54
4.3.2. Effect of APP overexpression in Gαo levels .............................................. 59
4.3.3. Effect of Gαo overexpression in APP levels .............................................. 61
4.4. Visual analysis of cellular APP/Gαo levels ....................................................... 64
4.5. Analysis of APP-Gαo binding ........................................................................... 66
5. Discussion ................................................................................................................ 67
6. Conclusion ............................................................................................................... 72
7. References ............................................................................................................... 75
Appendix ............................................................................................................................. 83

3
APP and APP phosphorylation in Gαo-induced STAT3 signaling
Abbreviations
AD
Alzheimer’s disease
ADP
Adenosine diphosphate
AGS
Activator of protein signaling
AICD
APP intracellular C-terminal domain
AMP
Adenosine monophosphate
APLP
Amyloid precursor-like proteins
APLP
Amyloid precursor-like protein
APOE
Apolipoprotein E gene
ApoE
Apolipoprotein E protein
APP
β-amyloid precursor protein
APPL
Amyloid precursor protein-like
APs
Amyloid plaques
Aβ
Amyloid β-peptide
BACE1
β-site APP-cleaving enzyme
BSA
Bovine serum albumin
Ca2+
Calcium
CaMKII
Calmodulin-dependent protein kinase II
cAMP
Cyclic adenosine monophosphate
CB1
Cannabinoid 1 receptor
Cdc2
Cyclin-dependent protein kinase 2
Cdk5
Cyclin-dependent kinase 5
cDNA
Complementary deoxyribonucleic acid
CNS
Central nervous system
CNTF
Ciliary neurotrophic factor
CTF
Carboxy-terminal fragment
CuBD
Copper-binding domain
DAPI
4',6-diamidino-2-phenylindole
ECL
Enhanced chemiluminescence
ER
Endoplasmic reticulum
FAD
Familial Alzheimer’s disease
G protein
GTP-bindign protein
Gαi
inhibitory G-protein alpha
GAIP
Gα-interating protein
GAP-43
Growth cone-associated protein
GAPs
GTPase-activating proteins
Gβ
G-protein beta-gamma subunits
GDP
Guanosine diphosphate
GEFs
Guanine nucleotide exchanger factors
GFD
Growth factor domain

4
Ana Regina Silva Cerqueira SACS/UA, 2012
GFP
Green fluorescent protein
Gi
inhibitory G-protein
Go
Heterotrimeric 'other' G protein
gp130
Glycoprotein 130
GPCRs
G protein-coupled receptors
GPR
G protein regulatory
Gq
G protein q
GRIN
G protein-regulated inducer of neurite outgrowth
GSK-3β
Glycogen synthase kinase 3β
GTP
Guanosine triphosphate
Gz
G-protein z
Gαo
G-protein alpha-subunit o
GαoCA
constitutively active G-protein alpha o
JAK
Janus Kinase
JNK
c-Jun N-terminal kinase
K+
Potassium
KPI
Kunitz-type protease inhibitor
LD
Linker domain
LIF
Leukemia inhibitory factor
MAPK
Mitogen-activated protein kinase
ND
N-domain
NFTs
Neurofibrillary tangles
NT
non-transfected cells
PARP
poly ADP ribose polymerase
PI3K
Phosphadylinositol-3-kinase
PKC
Protein kinase C
PM
Plasma membrane
PPCs
Proprotein convertases
PS1 and PS2
Presenilin 1 and 2 protein
pSTAT3
STAT3 phosphorylated
PTX
Pertussis toxin
Rac
Rho family of GTPase subfamily
Rap
Ras-related protein or a small GTPase protein
Rap-GAP
Rap GTPase activating protein
Ras
Small G protein superfamily
RGS
Regulators of G protein signaling
S/SerXXX
Serine amino acid residue at position XXX
S655A
APP Serine 655 mutated at alanine
S655E
APP Serine 655 mutated at glutamate
SA APP/SA
Dephosphorylated S655 APP mutant
sAPP
Secreted APP
SDS
Sodium dodecylsulfate

5
APP and APP phosphorylation in Gαo-induced STAT3 signaling
SE APP/SE
Phosphorylated S655 APP mutant
SEM
Standard Error of he mean
SH2
Src homology 2 domain
Src
Non-receptor protein tyrosine kinase
STAT
Signal transducer and activator of transcription
STAT3
Signal transducer and activator of transcription 3
TACE
Tumor necrosis factor-α converting enzyme
TGN
Trans-Golgi network
Thr
Threonine amino acid residue at position XXX
Tip60
Tat interactive protein, 60kDa
TK
Tyrosine-Kinase
Tyr
Tyrosine amino acid residue at position XXX
VPS
Vacuolar protein sorting
WB
Western Blot
Wt APP
Wild-type APP

6
Ana Regina Silva Cerqueira SACS/UA, 2012
7
APP and APP phosphorylation in Gαo-induced STAT3 signaling
1. Introduction
1.1. Alzheimer’s Disease
1.1.1. Alzheimer’s Disease pathology
Alzheimer’s disease (AD), a disorder of unknown etiology, is the most common
form of dementia in the elderly. AD is a chronic disorder, apparently preceded by a
clinically silent period of several years or even decades, which slowly and irreversibly
destroys neurons and causes serious cognitive disability (Arendt, 2001; Bojarski, Herms et
al., 2008).
Since it was presented for the first time in 1906 by Alois Alzheimer, this
neurodegenerative disease is affecting an increasing number of individuals. In 2006,
approximately 26.6 million people worldwide suffered from AD, and because of the
growing life expectancy, the global prevalence of Alzheimer’s can be predicted to be more
than 100 million in 2050 (Selkoe, 2004; Brookmeyer, Johnson et al., 2007).
AD cases have been described according to lesions type, the type of onset, the
cause (genetic or sporadic) and associated lesions (e.g. vascular lesions). Clinically, in the
beginning, AD is characterized by a mild cognitive impairment and deficits in short-term
and spatial memory, which can be confused with the normal changes of aging. The
symptoms become more severe with disease progression and not only destroy a person’s
memory, but the patient also presents disturbances in language use, perception, ability to
learn necessary skills, reason, solve problems, think abstractly, make judgment,
communicate and carry out daily activities. In some patients, AD can even lead to
personality and behavioural changes (Marotta, Majocha et al., 1992; Arakawa, Kita et al.,
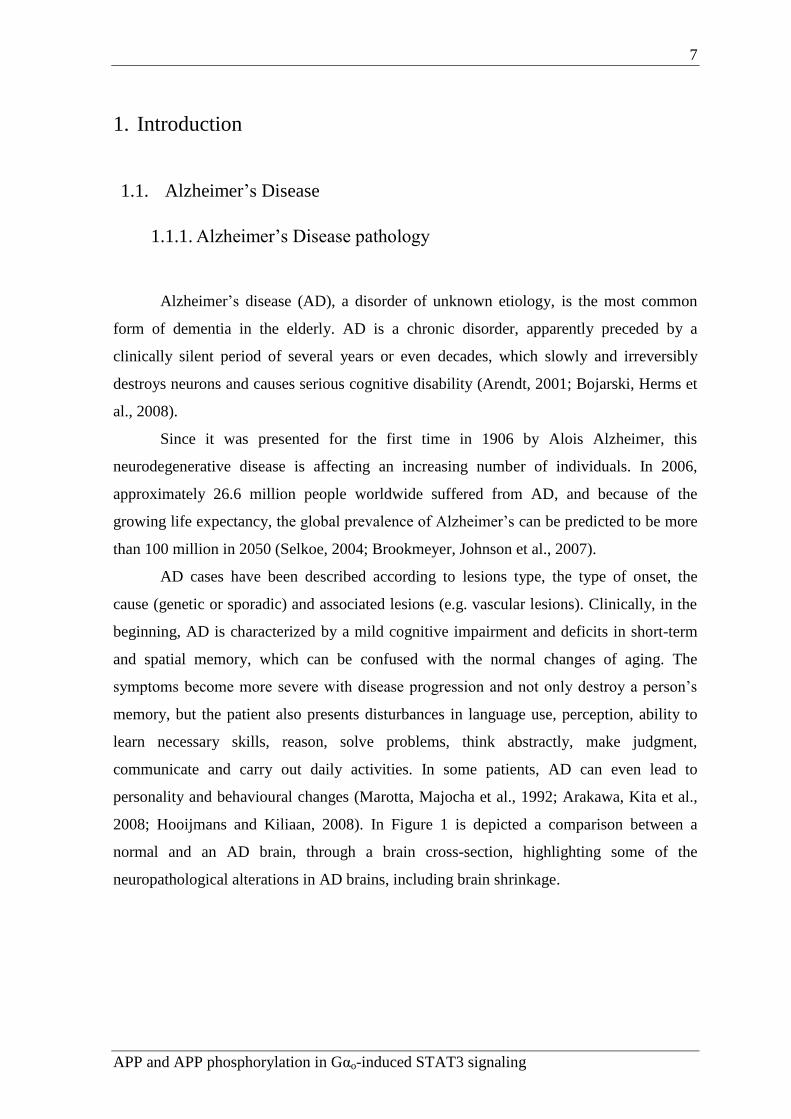
2008; Hooijmans and Kiliaan, 2008). In Figure 1 is depicted a comparison between a
normal and an AD brain, through a brain cross-section, highlighting some of the
neuropathological alterations in AD brains, including brain shrinkage.

8
Ana Regina Silva Cerqueira SACS/UA, 2012
The clinical symptoms of AD result from neuropathological lesions, including
deposition of amyloid plaques (APs) and neurofibrillary tangles (NFTs), in characteristic
brain regions, together with downstream reactive processes such as inflammation and
oxidative stress, leading to loss of effective neural network connectivity, synaptic
degeneration and progressive neuronal cell death (Bojarski, Herms et al., 2008;
Duyckaerts, Delatour et al., 2009; Hampel, Shen et al., 2010; Lin and Luo, 2011). Of note,
some reports indicate that AD could be a disease where not only neurons are affected, but
also peripheral cells such as fibroblasts, lymphocytes and platelets (Bojarski, Herms et al.,
2008).
The neuropathological and biochemical features of AD develop the disorder and
delay the diagnosis, since the symptoms appear later on (Lemere and Masliah, 2010).
Although there are currently accepted clinical guidelines for the probable diagnosis of AD,
the definitive diagnosis of AD happens at autopsy with the postmortem examination of the
brain, which reveals large quantities of NFTs and APs within the parenchyma (Marotta,
Fig. 1: This image represents a cross-section of the brain as seen from the front. On the left the cross-section
represents a normal brain and the one on the right represents a brain with Alzheimer's disease. Reproduced from
American health assistance foundation (January 2012), http://www.ahaf.org/alzheimers/about/understanding/brain-with-
alzheimers.html

9
APP and APP phosphorylation in Gαo-induced STAT3 signaling
Majocha et al., 1992). In Figure 2, we can observe AP and NFT in a microscopic analysis
of the AD brain.
Several symptomatic treatments are in use for AD, but they are incapable of
reversing the pathology of disease, namely, the widely used acetylcholinesterase inhibitors,
which reduce inflammation and alleviate the symptoms. Recently, new therapeutic drugs
are being developed, including vaccines aiming to destroy AP plaques before or after being
aggregated.
1.1.2. Hallmarks of AD
The two major pathological hallmarks of AD that appear to be more correlated with
the clinical symptoms are the extracellular amyloid plaques (also called senile plaques),
and the intracellular neurofibrillary tangles.
The APs are aggregated, insoluble, dense cores of 5-10 nm amyloid fibrils with
surrounding reactive cells, dystrophic neurites, lysosomes, abnormal mitochondria,
astrocytic processes and activated microglia (Fig. 3). The main proteinaceous component
of APs is the neurotoxic β-amyloid (Aβ) peptide, produced by proteolytic cleavages of a
type I transmembranar glycoprotein named β-amyloid precursor protein, APP (Selkoe,
1999; Duyckaerts, Delatour et al., 2009; Hampel, Shen et al., 2010; Lemere and Masliah,
2010). Amyloid-containing senile plaques are a prominent feature of specific AD brain
Fig. 2: Histopathological analysis of an AD brain tissue, post-mortem. In this tissue cut we can observe the
neurofibrillary tangles and amyloid plaques. Reproduced from Experimental genetics group (January 2012),
http://med.kuleuven.be/legtegg/AD.html

10
Ana Regina Silva Cerqueira SACS/UA, 2012
regions, affect limbic and cortical structures, like cerebral cortex, amygdaloid nucleus,
corpus striatum, diencephalon and hippocampus, but they also have been described in the
cerebellum (Marotta, Majocha et al., 1992; Lukiw and Bazan, 2000; Merlo, Spampinato et
al., 2010). The mechanisms responsible for the excessive accumulation of β-amyloid in the
AD brain are unknown, but a few genetic, molecular biology and protein chemistry
hypotheses have been proposed to explain the disease process (Marotta, Majocha et al.,
1992).
The neurofibrillary tangles (Fig. 3) derive from the intracellular accumulation of
paired helical filaments resulted from hyperphosphorylation of a microtubule-associated
protein known as Tau, causing it to aggregate into an insoluble form. In AD, this abnormal
Tau protein induces the microtubule structures to collapse inside neuronal cell bodies,
axons and dendrites (Hooijmans and Kiliaan, 2008; Duyckaerts, Delatour et al., 2009;
Merlo, Spampinato et al., 2010). The progression of Tau pathology is stepwise and
stereotyped from the entorhinal cortex, through the hippocampus, to the neocortex
(Marotta, Majocha et al., 1992).
Fig. 3: Representation of nerve cells within AD brains. The tissue with AD presents a much smaller number of nerve
cells and synapses than a healthy brain; APs are abnormal deposits of protein fragments between nerve cells; the dead
and dying nerve cells contains neurofibrillary tangles. Reproduced from health news (January 2012),
http://www.healthinformer.net/alzheimer-disease-plaques-seen-with-conventional-mri-in-animal-model-for-the-first-
time.html

11
APP and APP phosphorylation in Gαo-induced STAT3 signaling
Although controversies still exist on the real causes of AD and on the precise
relationship between Aβ, Tau and AD pathogenesis, the ability to determine both proteins
levels in living people could markedly improve AD diagnosis and treatment, and these
proteins still considered the most possible targets for new therapies (Merlo, Spampinato et
al., 2010).
The synaptic loss in AD is difficult to evaluate, however it is an early pathological
hallmark of AD that is age dependent and largely independent of Aβ. More than Aβ
deposits, this hallmark could be the neuropathological alteration that is more correlated
with neuronal damage, cognitive decline and memory impairment (Hooijmans and Kiliaan,
2008; Duyckaerts, Delatour et al., 2009). Furthermore, synaptic dysfunction and failure of
brain connectivity appears to predate neuronal loss (Coleman, Federoff et al., 2004;
Hooijmans and Kiliaan, 2008). Studies indicate that the neurodegenerative process initiates
in the temporal lobe structures, like entorhinal cortex, followed by synapse disfunction and
loss in the hippocampus (Coleman, Federoff et al., 2004; Duyckaerts, Delatour et al.,
2009).
The plaques and tangles formation accompany this process, however research
demonstrate that synaptic loss and memory impairment precede APs in the limbic system
(Mucke, Masliah et al., 2000), and AD has been associated with synaptic disruption also in
specific cortical areas (Duyckaerts, Delatour et al., 2009).
These evidences demonstrate that synaptic failures of AD begin prior to neuronal
loss, plaques and tangles development, and also prior to clinical detection of disease. The
explicit recognition that AD starts long before the appearance of the traditional ways of
detecting the illness will highlight the need of the development of early diagnosis
(Coleman, Federoff et al., 2004).
1.1.3. Risk factors
As mentioned above, the cause or causes of AD are not yet identified and there is
no cure, so efforts are needed for preventing the development of the dementia. Many
theories have been proposed, like the “amyloid cascade hypothesis”. The amyloid
deposition is seen as the primary pathway leading to neurodegeneration and AD. Although
this hypothesis is one of the most persistent, there are yet controversy in some results, such
as: the conflicting results about the neurotoxicity of deposited Aβ in vivo (Bishop and

12
Ana Regina Silva Cerqueira SACS/UA, 2012
Robinson, 2002); the fact that Aβ accumulation is not the earliest hallmark and is not
always correlated to neuronal loss (Mucke, Masliah et al., 2000); the fact that many non-
demented persons show large amounts of AD neuropathologicals events (Hooijmans and
Kiliaan, 2008).
So, it becomes necessary to study the AD risk factors and underlying theories to
explain the etiology of this illness. Some researchers suggest various theories and risk
factors that play an important role in AD pathogenesis, like deregulation of calcium
homeostasis (Bojarski, Herms et al., 2008), cardiovascular disorders (Hooijmans and
Kiliaan, 2008), abnormal activation of lipid signaling (Lukiw and Bazan, 2000), induction
of oxidative stress, and others.
AD risk factors can be subdivided in sporadic and familial AD. About 95% of all
AD cases appear to be of random, idiopathic or sporadic origin (Hooijmans and Kiliaan,
2008). These sporadic cases involve the most significant risk factor – age – in concert with
genetic and environmental risk factors. Some researchers suggest that a combination of
lifestyle, genetic, and amyloid related factors, which enhance each other contribution in the
onset and course of AD, will probably be at the etiology of the disease instead of being
only one mechanism (Hooijmans and Kiliaan, 2008). In the group of risk factors for
sporadic AD, the environmental factors are associated with a combination of life events,
such as early-life childhood and adolescent environment, psychosocial and mental
inactivity, loss of motivation and mental stress, a lower level of education and occupation,
improper diet, higher age, exposure to neurotoxic factors, brain injury, and vascular disease
(Arendt, 2001). The best-known genetic risk factor in late-onset sporadic AD is the
apolipoprotein E (APOE) gene. This gene is located on chromosome 19 that encode the
apolipoprotein E (ApoE) protein (Ling, Morgan et al., 2003). ApoE is polymorphic with
three isoforms, ApoE2, ApoE3 and ApoE4, which translate into three alleles of the gene
and differ from each other at two amino acids. ApoE plays an important role in cholesterol
transport in the central nervous system and in AD development, which relates to its ability
to interact with Aβ (Ling, Morgan et al., 2003; Hooijmans and Kiliaan, 2008; O'Brien and
Wong, 2011). The mechanism by which ApoE4 predisposes individuals to AD is not clear.
However, pathologically the evidence is that ApoE4 accelerates brain Aβ deposition, APs
formation and loss of neuronal function by stimulating APP processing and reducing Aβ
clearance (Ling, Morgan et al., 2003; Hooijmans and Kiliaan, 2008).

13
APP and APP phosphorylation in Gαo-induced STAT3 signaling
Familial AD is the second most important risk factor group. About 1% of AD cases
occur due to this group of risk factors (Chiba, Nishimoto et al., 2007). This early onset AD
develops because of missense mutations in the genes coding for the amyloid precursor
protein (APP) on chromosome 21, presenilin 1 (PSEN1) on chromosome 14, and presenilin
2 (PSEN2) on chromosome 1, all causing abnormal processing of APP to Aβ and
production of Aβ-related neurotoxic peptides (Lukiw and Bazan, 2000; Hooijmans and
Kiliaan, 2008).
As mentioned before, APP is the precursor of Aβ and these proteins are implicated
in the pathogenesis of both sporadic and familial AD. The APP gene localizes in the same
chromosome that causes Down’s syndrome (trisomy 21), chromosome 21. The patients
with this syndrome reveal the classical neuropathological features of AD, like APP
overexpression, which results in brain Aβ accumulation, and formation of neurofibrillary
tangles (Hooijmans and Kiliaan, 2008; O'Brien and Wong, 2011). This finding led to a
specific search for families with early-onset AD with genetic linkage to chromosome 21
and resulted in the identification of several missense mutations in APP, associated to
familial AD (Hooijmans and Kiliaan, 2008). In familial AD, mutations of APP gene cause
a change in amino acids adjacent to the BACE1 (enzyme essential for the generation of
Aβ) cleavage site, or occur around the -secretase cleavage site, and result in alteration of
APP proteolytic processing to Aβ, leading to increased production of total Aβ or to
production of a more toxic Aβ peptide (Chiba, Nishimoto et al., 2007; Cole and Vassar,
2007; O'Brien and Wong, 2011).
Presenilins proteins (PS1 and PS2) are integral components of a multiprotein
protease complex, called -secretase, which is responsible for the cleavage of APP and
other important proteins such as Notch, an essential cell development protein, similar to
APP in size and intracellular localization (Ling, Morgan et al., 2003; Bojarski, Herms et
al., 2008). Presenilins are involved in a range of physiological and biological processes
(Ling, Morgan et al., 2003). The familial AD mutations in PSEN1 and PSEN2 show that
the efficiency of presenilin-mediated Notch cleavage is reduced, in contrast to the effects
on APP processing (Ling, Morgan et al., 2003). Indeed, mutations in presenilins genes lead
to an increased production of the more toxic Aβ42, a form of Aβ peptide that is particularly
prone to precipitate and aggregate, relative to Aβ40 (Ling, Morgan et al., 2003; O'Brien
and Wong, 2011).
14
Ana Regina Silva Cerqueira SACS/UA, 2012
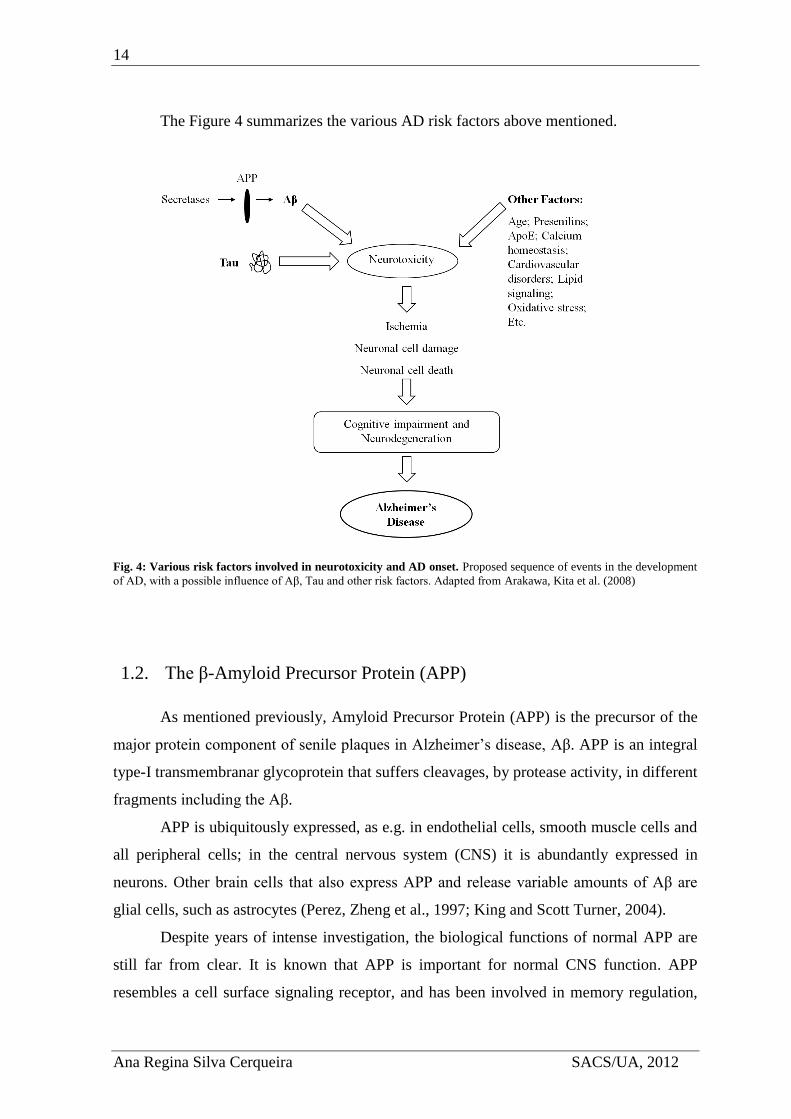
The Figure 4 summarizes the various AD risk factors above mentioned.
1.2. The β-Amyloid Precursor Protein (APP)
As mentioned previously, Amyloid Precursor Protein (APP) is the precursor of the
major protein component of senile plaques in Alzheimer’s disease, Aβ. APP is an integral
type-I transmembranar glycoprotein that suffers cleavages, by protease activity, in different
fragments including the Aβ.
APP is ubiquitously expressed, as e.g. in endothelial cells, smooth muscle cells and
all peripheral cells; in the central nervous system (CNS) it is abundantly expressed in
neurons. Other brain cells that also express APP and release variable amounts of Aβ are
glial cells, such as astrocytes (Perez, Zheng et al., 1997; King and Scott Turner, 2004).
Despite years of intense investigation, the biological functions of normal APP are
still far from clear. It is known that APP is important for normal CNS function. APP
resembles a cell surface signaling receptor, and has been involved in memory regulation,
Fig. 4: Various risk factors involved in neurotoxicity and AD onset. Proposed sequence of events in the development
of AD, with a possible influence of Aβ, Tau and other risk factors. Adapted from Arakawa, Kita et al. (2008)

15
APP and APP phosphorylation in Gαo-induced STAT3 signaling
cell-cell interaction, cell adhesion, cell survival, cell growth, neurite outgrowth, and
protease inhibition (King and Scott Turner, 2004). APP has also been implied in pro- and
anti-apoptotic functions. (De Strooper and Annaert, 2000).
1.2.1. APP gene family, isoforms and domains
In humans, the APP gene is located on the chromosome 21q21, and contains 19
exons, of which exons 7, 8 and 15 can be alternatively spliced (De Strooper and Annaert,
2000; da Cruz e Silva and da Cruz e Silva, 2003; Ling, Morgan et al., 2003). APP belongs
to a family of related proteins that includes the amyloid precursor-like proteins (APLP1
and APLP2) in mammals and amyloid precursor protein-like (APPL) in Drosophila,
Caenorhabditis elegans, and Xenopus (De Strooper and Annaert, 2000; O'Brien and Wong,
2011). All these are homologous type I transmembranar proteins with overlapping
expression in brain, similarly metabolism, and that exhibit some functional redundancy
(King and Scott Turner, 2004). Nonetheless, only APP cleavage gives rise to the Aβ
peptide, which is derived from the domain encoded by parts of exons 16 and 17 (da Cruz e
Silva and da Cruz e Silva, 2003; Ling, Morgan et al., 2003).
Alternative splicing of the APP transcript generates at least 8 isoforms, ranging
from 365 to 770 amino acids (da Cruz e Silva and da Cruz e Silva, 2003; King and Scott
Turner, 2004; O'Brien and Wong, 2011). The three most common isoforms, however,
predominate in a cell-type specific manner, and differ only in the size of their extracellular
sequence: APP695, APP751 and APP770 (Fig. 5). APP695 is expressed predominantly in the
CNS neurons, and the APP751 and APP770 are more expressed in non-neuronal cells, but are
also found in brain glial cells (Selkoe, 2001; King and Scott Turner, 2004; O'Brien and
Wong, 2011). All of these transcripts encode multidomain proteins with a single
membrane-spanning region. The APP751 and APP770 differ from the APP695 in the
expression of exon 7, which encodes a Kunitz serine protease inhibitor (KPI) domain
(Selkoe, 2001).

16
Ana Regina Silva Cerqueira SACS/UA, 2012
Studies revealed that the different APP isoforms respond differently under various
experimental conditions, like Aβ addition. All these three isoforms contain exons 16 and
17, but APP695 responds more readily than the other isoforms to the accumulation of Aβ
(da Cruz e Silva and da Cruz e Silva, 2003).
The complete crystal structure of APP and the ligands or receptors that interact with
the large APP ectodomain are not yet much understood (De Strooper and Annaert, 2000).
However, a number of distinct, large independently-folding structural domains have been
identified in the APP sequence. APP possesses three general domains: a large glycosylated
extracellular component, a single membrane-spanning region and a short intracellular
cytoplasmic domain (Hampel, Shen et al., 2010) (Fig. 6).
Fig. 5: Schematic representation of the three major APP isoforms found in mammalian tissues. The number and
vertical lines delineate the corresponding exons. The most abundant neuronal isoform is APP695 (exons 1-6, 9-18) that
comprises 695 amino acids. As illustrated, APP751 (exons 1-7, 9-18) and APP770 (exons 1-18) are alternatively spliced
isoforms that differ from APP695 in the expression of exons 7 and 8. The sequences encoded by the APP gene exons are
indicated approximately to scale. The Aβ domain it’s represented in this figure as the solid gray region, whose sequence
is divided between exons 16 and 17. Reproduced from da Cruz e Silva and da Cruz e Silva (2003)

17
APP and APP phosphorylation in Gαo-induced STAT3 signaling
The large extracellular region can be subdivided into several functional domains
(Fig. 6). At the N-terminal is a cysteine-rich region consisting in a growth factor domain
(GFD) and a copper-binding domain (CuBD) that interact tightly together. The GFD binds
heparin and can stimulate neurite outgrowth (Kong, Miles et al., 2008). The CuBD of APP
may regulate proteolytic processing or act as a metallotransporter. The copper binding to
this domain affects the dimerization state of APP leading to reduction in Aβ production,
whereas copper binding to the Aβ generates toxic species (Bossy-Wetzel,
Schwarzenbacher et al., 2004; Kong, Miles et al., 2008). Studies revealed that the cysteine-
rich region also contains a zinc-binding domain. This APP metal-binding site was assumed
to play mainly a structural role, modifying its conformation and interfering with APP
binding to constituents of the extracellular matrix (De Strooper and Annaert, 2000).
The copper-binding domain is followed by an acidic domain, which links the
cystein-rich region to a Kunitz-type protease inhibitor (KPI) domain and an OX2 domain.
The KPI and OX2 domains can be spliced out, to produce three main isoforms: APP770,
APP751 and APP695. The longer isoforms APP751 and APP770 contain a 56-amino acid KPI
domain, located in the middle of the APP ectodomain, which inhibits serine proteases. The
OX2 domain is only present in APP770 (King and Scott Turner, 2004). Following these
domains there is a glycosylated domain referred to as E2 (sometimes called the D6a, like in
Figure 6) and an unstructured region, D6b, which precedes the transmembranar domain.
The E2 domain possesses the RERMS motif that appears to have putative growth-
promoting properties and also has a heparin binding site (De Strooper and Annaert, 2000;
Kong, Miles et al., 2008).
Another specific domain that implicates a role for APP as a cell surface receptor is
the C-terminal cytoplasmic tail. This region contains several consensus motifs that regulate
Fig. 6: Schematic representation of functional domains arrangement of APP, highlighting some important regions. The N-terminal growth factor domain (GFD) is followed by copper-binding domain (CuBD), an acidic-rich region,
Kunitz-type protease inhibitor (KPI) and OX2 domains that occur in some APP isoforms, a couple of glycosylated
domains (D6a, sometimes called the E2 domain, followed by an unstructured domain, D6b), a transmembrane region
(TM) and a cytoplasmic tail. The location of the Aβ region, a major component of Alzheimer’s disease plaques, is shown
in red. Reproduced from Kong, Miles et al. (2008)

18
Ana Regina Silva Cerqueira SACS/UA, 2012
its trafficking and suggest a role in signal transduction, through interaction with several
proteins (De Strooper and Annaert, 2000; Evin and Weidemann, 2002). The APP
cytoplasmic domain has been shown to bind to the Fe65 protein and G proteins, for
example. Some APP hereditary mutations that are linked with AD can cause constitutive
activation of Go, a member of the heteromeric G protein family that serve as signal
transducers of various cell surface receptors (Kong, Miles et al., 2008).
1.2.2. APP metabolism: trafficking and processing
As described above, APP is produced in large quantities in neurons and is
metabolized very rapidly. APP traffic (Fig. 7) is tightly regulated and along it APP can be
cleaved by specific proteases. APP follows the constitutive secretory pathway, being N-
glycosylated in the endoplasmic reticulum (ER) (immature APP) and further O-
glycosylated (APP maturation) in the Golgi, where it is highly abundant (Thinakaran and
Koo, 2008; Vieira, Rebelo et al., 2010). After sorting in the ER and Golgi, APP is
delivered to the axon, where it is transported by fast axonal transport to presynaptic
terminals (O'Brien and Wong, 2011). APP can be packaged into secretory vesicles in the
Trans-Golgi network (TGN) and delivered to the plasma membrane (PM). On the cell
surface, APP may be proteolytically processed or suffer internalization, via its YENPTY
motif, being delivered into the endocytic pathway (endosomes). Then, APP is either
transport to lysosomes, where it suffers lysosomal degradation, or recycled by transport
vesicles to the TGN or to the cell surface (Vieira, Rebelo et al., 2010).
Crucial steps in APP metabolism occur at the cell surface and in the TGN. From the
TGN, APP is transported via a clathrin coat complex, which mediate two steps: the
transport directly to an endosomal compartment, and its reinternalization from the cell
surface into the endocytic pathway, connecting the cell surface to the endosome (O'Brien
and Wong, 2011). APP contains the NPXY (asparagiNe-Proline-any-tYrosine) amino acid
motif (YENPTY domain), a conserved sorting signal that regulates the targeting of
proteins for clathrin pit localization and their transport via clathrin-associated vesicles from
the cell surface to the endosome (Evin and Weidemann, 2002; Small and Gandy, 2006;
O'Brien and Wong, 2011).

19
APP and APP phosphorylation in Gαo-induced STAT3 signaling
Another complex that is implicated in APP transport is the retromer complex. The
retromer is a multi-subunit complex that mediates the retrograde transport of several
transmembranar proteins from endosomes to the TGN (Vieira, Rebelo et al., 2010). This
complex consists of two sorting nexin subunits and a cargo-recognition trimer, vacuolar
protein sorting (VPS) 26, VPS29, VPS35 (Small and Gandy, 2006). Several findings
indicate that a dysfunctional retromer complex and/or one of its sorting receptor
components, sorLA (a type-1 transmembrane molecule), can be related to late onset AD
pathology (Vieira, Rebelo et al., 2010). Indeed, the TGN retrieval pathway, involving
sorLA and the retromer, has been inversely correlated with Aβ production. Further studies
revealed that phosphorylation of APP in the Ser655 residue enhances APP binding affinity
for sorting proteins, such as the retromer-related VPS35 protein (at the core of the
retromer) (Vieira, Rebelo et al., 2010). Ser655 phosphorylation was found to enhance both
the protein exit from the Golgi, and its recycling back to the TGN from endosomes,
increasing its cleavage to sAPPα during this trafficking cycle.
Fig. 7: Schematic representation of APP trafficking in neurons. Newly synthesized APP (purple) is transported from
the Golgi down the axon to the cell surface (1) or into a cell body endosomal compartment (2), with clathrin-associated
vesicles (red) mediating both steps. In the cell surface, some APP is cleaved by α-secretase (6), generating the sAPPα
fragment (green), and some is re-internalized into endosomes (3), where Aβ and sAPPβ are generated (blue). Following
proteolysis, the endosome recycles to the cell surface (4), releasing Aβ and sAPPβ. Transport from the endosomes to the
Golgi prior to APP can also occur, mediated by the retromer (5). Reproduced from O'Brien and Wong (2011)

20
Ana Regina Silva Cerqueira SACS/UA, 2012
In what concerns cleavage, there are mainly two pathways for APP proteolytic
processing: the amyloidogenic and non-amyloidogenic, distinguished by the mutually
exclusive action of two different enzymes in the first cleavage event (Fig. 8).
In the non-amyloidogenic pathway, cleavage of APP by α-secretase produces a
large soluble extracellular N-terminal fragment, sAPPα, which has neuroprotective
properties, and a C83 membrane-bound C-terminal fragment. This cleavage divides the Aβ
domain and precludes the formation of intact Aβ. So, stimulating α-cleavage of APP leads
to a significant decrease in Aβ generation (Evin and Weidemann, 2002; Ling, Morgan et
al., 2003). This activation is a relatively major and ubiquitous pathway of APP metabolism
in most cells. Membrane-bound disintegrin and metalloproteinases including ADAM17
(also called TACE), ADAM10, ADAM9 and MDC-9 are proteins that have been identified
as having α-secretase-like activity (Evin and Weidemann, 2002; Ling, Morgan et al.,
2003). The constitutive α-secretase activity occurs primarily at the cell surface, while the
Fig. 8: Schematic diagram of APP proteolytic processing. APP can undergo proteolytic processing via two pathways:
amyloidogenic and non-amyloidogenic. Cleavage of APP by β-secretase occurs at the beginning of the Aβ domain and
generates a shorter soluble N-terminus, APPsβ, as well as an amyloidogenic C-terminal fragment (CTF-β, C99).
Alternatively, α-secretase cleavage, within the Aβ domain, generates the large soluble N-terminal, APPsα, and a non-
amyloidogenic C-terminal fragment (CTF-α, C83). Further proteolysis of these fragments by -secretase results in
generation of either the Aβ (amyloidogenic pathway) or p3-fragment (non-amyloidogenic pathway) and a cytoplasmic
APP intracellular C-terminal domain (AICD). Reproduced from Kumar and Walter (2011)

21
APP and APP phosphorylation in Gαo-induced STAT3 signaling
regulated activity is predominantly located within the Golgi apparatus (Ling, Morgan et al.,
2003; Small and Gandy, 2006). There are several factors that can increase this pathway, by
mechanisms involving the formation and release of secretory vesicles from the TGN, and
thus enhancing APP (and possibly α-secretase) trafficking to the cell surface, as for
example the activation of protein kinase C by phorbol esters (Evin and Weidemann, 2002;
Ling, Morgan et al., 2003; da Cruz e Silva, Rebelo et al., 2009).
The alternative, amyloidogenic pathway is characterized by the cleavage of APP by
β-secretase at its β-cleavage site, producing the large soluble sAPPβ peptide and the
carboxy-terminal fragment (CTF) C99. This pathway constitutes the first step in the
formation of Aβ and is particularly enriched in neurons (Evin and Weidemann, 2002). Two
novel transmembrane aspartyl proteases homologues, β-site APP-cleavage enzymes
BACE1 and BACE2, were identified to cleave APP at the β-secretase sites. The major
neuronal β-secretase that governs the first enzymatic step in this APP processing is
BACE1. This protease appears to be produced as a pro-enzyme predominantly within the
nuclear envelope and the ER (Ling, Morgan et al., 2003). The prodomain in BACE1 does
not support activity but appears to facilitate correct folding of the active protease domain.
This domain is cleaved by proprotein convertases (PPCs) immediately before trafficking
through the Golgi (Ling, Morgan et al., 2003). Although the interaction of APP with
BACE1 can occur in the ER and on the cell surface, evidence suggests that active BACE1
predominantly localizes in the TGN and endosomes, consistent with the amyloidogenic
cleavage of wild-type APP during endocytic/recycling steps (Evin and Weidemann, 2002;
Ling, Morgan et al., 2003; Small and Gandy, 2006). The precise role of BACE2 in APP
processing remains unclear. BACE2 shows similar substrate specificity, cleaving APP at
the β-secretase site, but it also shows a distinct cellular localization pattern and intracellular
protease specificity in the cleavage of APP that differentially affects the generation of Aβ
(Ling, Morgan et al., 2003). Indeed, BACE2 can also have an α-secretase activity, cleaving
APP in the middle of the Aβ domain, between Phe19 and Phe20 (Ling, Morgan et al.,
2003).
The second enzymatic step is determined by cleavage of the membrane-bound C-
terminal APP fragments (CTFs) of each pathway by -secretase. The C83 and C99,
fragments resulting from α-secretase and β-secretase cleavage, respectively, remain
anchored in the membrane and may become degraded or can be further cleaved by -

22
Ana Regina Silva Cerqueira SACS/UA, 2012
secretase, leading to the release and secretion of non-pathogenic p3 peptide and Aβ (Evin
and Weidemann, 2002). In addition, in both pathways, -secretase cleavage generates a
cytoplasmic APP intracellular C-terminal domain (AICD). -secretase is a multimeric
complex composed of four essential transmembrane proteins: presenilin 1 or 2 (PS1 or
PS2, respectively), nicastrin, APH-1 and PEN-2 (Small and Gandy, 2006; Thinakaran and
Koo, 2008; O'Brien and Wong, 2011). This complex is essential for the sequential
intramembranous proteolysis of a variety of transmembrane proteins, like APP, Notch and
Cadherin. APH-1 aids the formation of a precomplex, which interacts with PS1 or PS2
while Pen-2 enters the complex to facilitate the proteolytic cleavage of PS1 or PS2, which
are critical to the γ-secretase complex (O'Brien and Wong, 2011). The ectodomain of
nicastrin recognizes and binds to the previously cleaved transmembrane proteins (O'Brien
and Wong, 2011).
Several data indicates the presence of -secretase complex and its enzymatic
activity in multiple compartments, including the ER, Golgi, TGN, endosomes and plasma
membrane, but studies in cell lines have showed that APP cleavages occur mainly in the
TGN and endosomes (Thinakaran and Koo, 2008). The -secretase complex cleaves at
multiple sites within the APP transmembrane domain. The cleavage of C83, CTF resulting
of α-secretase, leads to AICD and p3 fragments production. The processing of C99,
consequent CTF of the amyloidogenic via, results in different Aβ forms and AICD. The
AICD, free from the membrane, has been suggested to function as a transcription factor,
but genes regulated by AICD have not been unambiguously identified (Hampel, Shen et
al., 2010). The release of the cytoplasmic tail of APP by -cleavage may function in gene
expression, with AICD being targeted to the nucleus, where it forms a multimeric complex
with the nuclear adaptor protein Fe65 and the histone acetyltransferase Tip60, potentially
stimulating the transcription of various genes, including APP itself (Ling, Morgan et al.,
2003).
Noteworthy, APP metabolism may be regulated by direct APP phosphorylation,
and the aberrant production of Aβ associated with AD may result from deregulated,
abnormal APP phosphorylation (da Cruz e Silva and da Cruz e Silva, 2003).

23
APP and APP phosphorylation in Gαo-induced STAT3 signaling
1.2.3. Phosphorylation of APP
The direct phosphorylation of APP might be important in APP-mediated roles such
as neuronal differentiation, possible by altering APP traffic, by regulating APP proteolytic
cleavage to its physiological fragments and/or the binding of APP to specific signal
transducers. APP is a phosphoprotein with several well defined phosphorylated residues at
its extracellular and intracellular portions (Fig. 9).
Only one phosphorylatable domain was identified in the extracellular ectodomain,
and the residues shown to be phosphorylated are Ser198 and Ser206 (da Cruz e Silva,
Fardilha et al., 2004). This phosphorylation appears to occur in two distinct cellular
locations: in a post-Golgi secretory compartment and at the cell surface, by ectoprotein
kinases (da Cruz e Silva, Fardilha et al., 2004). Particularly, phosphorylation of APP
cytoplasmic tail comprises three crucial motifs, 653
YTSI656
, 667
VTPEER672
, and
682YENPTY
687, which have been shown to regulate the interaction of APP with some of its
binding proteins (da Cruz e Silva and da Cruz e Silva, 2003; Lee, Kao et al., 2003; da Cruz
e Silva, Fardilha et al., 2004).
Fig. 9: Schematic representation of the APP phosphorylatable residues. The top diagram represents APP and
indicates the two phosphorylated Serine residues present in its ectodomain. The bottom diagram shows the complete
amino acid sequence of the cytoplasmic tail, and the three phosphorylatable functional domains. Serine, threonine and
tyrosine putative phosphorylation sites are shown enlarged (numbering is relative to APP695). The relative localization of
the Aβ sequence is shown. Reproduced from da Cruz e Silva, Fardilha et al. (2004)

24
Ana Regina Silva Cerqueira SACS/UA, 2012
The 653
YTSI656
(amino acid numbering according human APP695 isoform), is a
typical YXXI sorting signal, responsible for mediating APP basolateral sorting. This motif
contains Thr654 and Ser655, two consensus residues for phosphorylation known to be
phosphorylated in vitro and in vivo. The possible putative kinases involved in their
phosphorylation are protein kinase C (PKC) and calmodulin-dependent protein kinase II
(CaMKII) (Isohara, Horiuchi et al., 1999; da Cruz e Silva and da Cruz e Silva, 2003;
Schettini, Govoni et al., 2010). Ser655 was also reported to be phosphorylated by APP
kinase I (da Cruz e Silva and da Cruz e Silva, 2003). Phosphorylation of Ser655 was
observed to occur predominantly in mature rather than immature APP isoforms (da Cruz e
Silva, Fardilha et al., 2004). As described above, various studies revealed that
phosphorylation within this sorting motif modulates APP trafficking. Mimicking
phosphorylation at the Ser655 residue was reported to enhance APP secretory traffic, e.g.
by increasing APP binding to the retromer complex and the subsequent retromer-mediated
APP retrieval to the TGN (Vieira, Rebelo et al., 2010). S655 phosphorylation, potentially
via PKC, also increases sAPPα production by the alpha-secretase pathway (da Cruz e
Silva, Rebelo et al., 2009; Vieira, Rebelo et al., 2009).
The 667
VTPEER672
motif contains Thr668. This residue can be phosphorylated by
neuronal cyclin-dependent kinase 5 (Cdk5), cyclin-dependent protein kinase 2 (Cdc2),
glycogen synthase kinase 3β (GSK-3β), c-Jun-N-terminal kinase 3 and stress-activated
protein kinase 1b (da Cruz e Silva and da Cruz e Silva, 2003; da Cruz e Silva, Fardilha et
al., 2004; Schettini, Govoni et al., 2010). Phosphorylation at Thr668 might be involved in a
neuron-specific aspect of APP metabolism and/or function, because this phosphorylation in
mature APP occurs only in the brain, being detected in neurites (da Cruz e Silva, Fardilha
et al., 2004). Phosphorylation of this domain appears to be an important factor in the
control of interactions of APP with other proteins. However, there are contradictory results
for the role of APP phosphorylation at Thr668 in Aβ production, in Fe65 binding and in
nuclear translocation of AICD or AICD/Fe65 complex (Schettini, Govoni et al., 2010).
Tyrosine phosphorylation of APP may functionally link APP processing and
neurotrophic signaling to intracellular pathways associated with cellular differentiation and
survival. This phosphorylation occurs in residues of the amino acid sequence
682YENPTY
687, encompassing an NPXY signaling motif, which is a typical internalization
signal for membrane-associated receptor proteins (da Cruz e Silva and da Cruz e Silva,

25
APP and APP phosphorylation in Gαo-induced STAT3 signaling
2003). This motif is present in many Tyrosine-Kinase (TK) receptors and non-receptors
TKs; it is generally phosphorylated and represents the docking site for several interacting
APP-binding proteins, involved in cell signaling and gene transcription (Russo, Venezia et
al., 2005; Schettini, Govoni et al., 2010). The phosphorylation of APP occurs in Tyr682
and Tyr687, although phosphorylation at this last residue is still somehow controverse (da
Cruz e Silva and da Cruz e Silva, 2003; da Cruz e Silva, Fardilha et al., 2004; Rebelo,
Vieira et al., 2007). In cell-culture studies, Tyr682 can be phosphorylated by the
overexpression of the nerve growth factor receptor TrkA, by a constitutively active form of
the tyrosine kinase Abl or by the Src kinase (da Cruz e Silva, Fardilha et al., 2004; Russo,
Venezia et al., 2005; Schettini, Govoni et al., 2010). In some studies using HEK293 cells,
it was reported that the phosphorylation of APP at Tyr687 is important for its processing
by α- and - secretases, increasing CTF-α and AICD generation (Takahashi, Niidome et al.,
2008). Of note, it is possible that APP may only become Tyr682 phosphorylated after full-
length APP cleavage by the -secretase complex (da Cruz e Silva, Fardilha et al., 2004).
1.3. APP as a potential mediator of G proteins signaling
1.3.1. G proteins
G proteins, also called guanine nucleotide-binding proteins, are a family of
heterotrimeric proteins that have a crucial role as molecular switches in signal transduction
pathways mediated by G protein-coupled receptors (GPCRs). They are involved in
transmitting extracellular messages from hormones, neurotransmitters, chemokines and
other signaling factors that interact with GPCRs and G proteins to activate many
intracellular signaling pathways (Hewavitharana and Wedegaertner, 2012).
The heterotrimeric G proteins are signal-transducing protein complexes composed
of α, β and subunits, located on the cytoplasmic side of the plasma membrane (Knust,
2001). The Gα subunit contains the nucleotide binding site and GTPase activity, along with
sites for binding receptors, effectors and Gβ, and a helical domain whose function is not
clear (Neer, 1995). This subunit determines G protein diversity. The β and subunits form
a dimer, a single complex that only dissociates when it is denatured and is, therefore, a
functional monomer (Neer, 1995). Today it is known that both α and β subunits positively

26
Ana Regina Silva Cerqueira SACS/UA, 2012
regulate effectors, acting as signaling molecules by activating other second messengers or
by gating ion channels directly (Neer, 1995).
Different types of G proteins share a common mechanism. They are activated in
response to a conformation change in the GPCR receptor. The GPCRs constitute a large
and the most versatile protein family of transmembrane receptors in the mammalian
genome (Gudermann, Schoneberg et al., 1997; Wettschureck and Offermanns, 2005). The
diversity of this superfamily is a result of the large number of members, their ability to
form different dimer combinations and their ability to respond to several stimuli, as well as
by the large amount of intracellular signaling pathways they activate. Signaling by GPCRs
is not just limited to second messenger molecules but also includes transcription factors
and molecules that affect the cytoskeleton. Despite their structural and functional diversity,
all GPCRs share a similar molecular architecture (Knust, 2001). They consist of an
extracellular N-terminus, an intracellular C-terminus, and seven transmembrane domains
in between, linked by alternating intracellular and extracellular loops (Gudermann,
Schoneberg et al., 1997).
In the inactive state, the Gα subunit has GDP in its binding site. When a chemical
or physical signal stimulates the receptor, the receptor becomes activated and changes its
conformation. The Gα subunit responds with a conformational change that decreases GDP
affinity, so that GDP comes off the binding site (Fig. 10). Once GTP is bound, the Gα
assumes its activated conformation and dissociates both from the receptor and from Gβ
(Knust, 2001). Then, both free Gα-GTP and Gβ can interact with downstream effectors
proteins and diverse downstream signaling cascades, while the receptor is able to interact
with other G proteins and amplify signal transduction (Knust, 2001). In addition to
activation of second messenger molecules, Gα subunits can also modulate the activity of
transcription factors, thereby regulating gene expression (Ram and Iyengar, 2001). The
activated state lasts until the GTP is hydrolyzed to GDP by the inherent GTPase activity of
Gα, allowing re-association with Gβ. G protein becomes inactive and returns to the
receptor, starting a new cycle (Wettschureck and Offermanns, 2005).

27
APP and APP phosphorylation in Gαo-induced STAT3 signaling
The GTPase cycle of G protein activation and deactivation is subject to regulation
by many protein factors that either influences the rate of guanine nucleotide exchange or
the rate of hydrolysis of bound GTP.
The family of regulators of G protein signaling (RGS), for example, has been found
to play a role in desensitization. These proteins are GTPase-activating proteins (GAPs) that
are involved in mechanisms that accelerate the rate of GTP hydrolysis and thereby
negatively regulate G protein signaling (Diverse-Pierluissi, Fischer et al., 1999;
Hewavitharana and Wedegaertner, 2012). RGS proteins block G protein function by
accelerating α subunit GTPase activity, physically blocking the binding to G protein
effectors and/or altering the level of free β subunits available to their downstream
effectors, therefore allowing for rapid modulation of G protein-mediated signaling
(Wettschureck and Offermanns, 2005; Blazer, Roman et al., 2010).
By contrast, guanine nucleotide exchanger factors (GEFs) promote the activation of
G proteins by increasing the rate of GDP dissociation and GTP association (Hewavitharana
and Wedegaertner, 2012). The ligand-bound GPCRs are widely recognized as guanine
exchange factors for heterotrimeric G proteins.
The functional versatility of the G protein mediated signaling pathways is based on
its modular architecture and on the fact that there are numerous subtypes of G proteins. In
Fig. 10: Activation and deactivation of G proteins by guanine nucleotide exchange and GTP hydrolysis. A ligand
binds to the receptor and is activated to become a catalyzer, enhancing the rate of detachment of bound GDP from the α-
subunit of the G protein. The rapidly exchange of GDP to GTP in the α-subunit site is rapidly processed (1) and causes
activation of both α- and β-subunits, enabling them in turn to activate specific effector enzymes. The interaction between
receptor and G protein is transient, allowing the receptor to catalyze guanine nucleotide exchange on a succession of G
protein molecules. The system returns to the resting state following hydrolysis of the bound GTP, and promotes
deactivation of G protein (2). Reproduced from Gomperts, Kramer et al. (2009)

28
Ana Regina Silva Cerqueira SACS/UA, 2012
humans, there are genes encoding 16 Gα, 5 Gβ and 12 G subunits (Hewavitharana and
Wedegaertner, 2012). The α-subunits increase the diversity, define the basic properties of a
heterotrimeric G protein, and can be divided into four families: Gi/o; Gs; Gq and G12/13
(Wettschureck and Offermanns, 2005; Shan, Chen et al., 2006; Hewavitharana and
Wedegaertner, 2012). Each family consists of various members that often show very
specific expression patterns. Members within each family have structural and functional
homologies (Wettschureck and Offermanns, 2005; Hewavitharana and Wedegaertner,
2012).
The G proteins of the Gi/o family are widely expressed. The main members of these
types of G proteins are Gi proteins (Gi1, Gi2 and Gi3) that inhibit various types of adenylyl
cyclases and thus lower the levels of the second messenger cyclic AMP (cAMP). The
function of members of the Gi/o family is affected by pertussis toxin (PTX), which is able
to ADP-ribosylate the Gi/o α-subunit, and, subsequently, uncouples Go and Gi from their
receptors, leading to the disruption of their signaling. A less widely distributed member of
this family is Gz, which is not affected by PTX, is expressed in various tissues (nervous
system and platelets) and was recently shown to interact specifically with various other
proteins including Rap1GAP and certain RGS proteins. Other α-subunits that belong to the
Gi/o family, like gustducin and transducin are involved in specific sensory functions, taste
and visual, respectively. The Go member is particularly abundant in the nervous system
and will be discussed later on, with its action being greatly mediated by its β-complex.
Indeed, activation of Gi/o is believed to be the major coupling mechanism that results in the
activation of β-mediated signaling processes.
The ubiquitously expressed G protein Gs stimulates adenylyl cyclase, resulting in
increases intracellular levels of cAMP (Wettschureck and Offermanns, 2005).
The Gq/G11 family of G proteins binds to and activates members of phospholipase
C β-isoform family (Wettschureck and Offermanns, 2005). Interestingly, there is no
obvious difference between the abilities of both G protein α-subunits to regulate β-
isoforms of phospholipase C. The α-subunits of Gq and G11 are almost ubiquitously
expressed and are involved in various biological signaling pathways (Wettschureck and
Offermanns, 2005).
In the G12/13 family, the two members G12 and G13 appear to be expressed
ubiquitously. Studies have showed that G12/13 can induce a variety of signaling pathways

29
APP and APP phosphorylation in Gαo-induced STAT3 signaling
leading to the activation of various downstream effectors including other G proteins
(Hewavitharana and Wedegaertner, 2012). Of note, the analysis of cellular signaling
processes regulated by these G proteins has been difficult since there are no specific
inhibitors available. The G12 and G13 Gα subunits were described to bind to and regulate
cell adhesion proteins, and interact directly with the cytoplasmic domain of some members
of the Cadherin family of cell surface adhesion molecules (Wettschureck and Offermanns,
2005; Hewavitharana and Wedegaertner, 2012).
The much less understood G protein β and subunits, but with a very important
role in the regulation of various effectors, are tightly associated and can be regarded as one
functional unit. The different subunits could produce several different combinations, but
not all possible pairs are formed (Neer, 1995). The β subunits show very high sequence
identity and exhibit a more or less ubiquitous expression pattern, whereas subunits are
considerably more diverse in sequence and tissue expression (Gudermann, Schoneberg et
al., 1997; Hurowitz, Melnyk et al., 2000). This suggests that through their diversity these
specific subunits couple selectively to effectors, although the molecular determinants of
Gβ-effector coupling are not well known.
1.3.1.1. Gαo Protein: genetics, expression pattern and function
The Gαo protein was accidently discovered during the purification of Gαi from
bovine brain. Gαo was designed as the ‘other’ GTP-binding protein to differentiate from
Gαs, Gαi and transducin. PTX-mediated ADP ribosylation and electrophoresis samples
detected an additional Gα subunit with molecular weight of 39 kDa and revealed a highly
Gαo expression in brain tissue (Jiang and Bajpayee, 2009; Bromberg, Lyengar et al., 2011).
In contrast to the well characterized pathways transduced by other G-proteins, only
recently some mechanism details of Gαo signaling were elucidated. Nonetheless, the
identification of direct effectors of Gαo and the determination of Gαo-induced cellular
responses are still far from known.
The cDNAs encoding Gαo have been cloned and identified in several species, such
as human, rat, mouse, bovine, Drosophila. Gαo has a highly degree of similarity among the
species, suggesting that Gαo-mediated signaling are important to receive, integrate and
execute the transduction of extracellular stimuli (Jiang and Bajpayee, 2009).

30
Ana Regina Silva Cerqueira SACS/UA, 2012
Analysis of genomic cDNA clones encoding Gαo revealed that the human Gαo gene
localizes on chromosome 16q13 and contains 11 exons. Both Gαo isoforms, Gαo1 (GoAα)
and Gαo2 (GoBα), are generated via alternative splicing and are identical in the first two-
thirds of the amino acid sequence. The two forms differ by only 20 amino acids in human
cells. Gαo1 and Gαo2 share the first 6 exons that encode 241 N-terminal amino acids, and
each isoform has unique exons 7, 8 and 9. Different sets of exons suggest that each isoform
may contribute to distinctive biological functions in the body and, especially, in the human
brain (Jiang and Bajpayee, 2009).
The Gαo protein has a less ubiquitous expression pattern than Gαi or Gαs. The
protein is expressed widely in the CNS and was estimated to compose 0.5%-1% of
membrane proteins in brain (Jiang and Bajpayee, 2009; Bromberg, Lyengar et al., 2011).
However, the regional distribution of Gαo protein in all brain is not homogeneous. At the
anatomic level, high concentrations of Gαo have been detected in the frontal cortex,
cerebellum, hypothalamus, hippocampus and substantia nigra, being principally found on
the cytoplasmic face of the plasma membrane coating the cell body and the neurites,
particularly at ‘cell-to-cell’ contacts. It was also determined that Gαo is one of the most
abundant proteins in the neuronal growth cones, structure at the tip of the growing neurite
that is generated during neuronal differentiation. In addition, Gαo expression has also been
observed in heart tissue, pituitary gland and pancreatic islets (Jiang and Bajpayee, 2009).
The Gαo protein has been received considerable attention aiming to determine its
physiological role in the body, mainly due to its high expression in CNS. Gαo has been
associated to cell survival, neuronal development, neuronal adhesion, migration and some
diseases as Alzheimer’s and Parkinson’s. Studies with Gαo knockout mice have reported
several neurological deficiencies, including poor motor coordination, hyperactive and
abnormal behaviour, as well as hyperalgesia, when subjected to the lack of this protein
(Jiang and Bajpayee, 2009). Another study has revealed that Gαo activation can induce
neurite outgrowth in PC12 cells through inhibition of PKC and modulation of intracellular
calcium levels (Strittmatter, Fishman et al., 1994).
1.3.1.2. Modulation of Gαo activity
Many protein factors are involved in signal transduction through G proteins to
regulate the strength, duration, efficiency and specificity of signaling. Gαo is a highly

31
APP and APP phosphorylation in Gαo-induced STAT3 signaling
effective molecular signaling transducer and many GPCRs have been identified to couple
to Gαo protein, such as the cannabinoid 1 (CB1) receptor, muscarinic cholinergic receptors,
α2-adrenergic receptors, and as previously mentioned, these are widely recognized as GEFs
for heterotrimeric G proteins. However, several non-receptor proteins have also shown to
affect the Gαo subunit G protein activity, including the growth cone-associated protein with
molecular weight of 43 kDa (GAP-43), APP, Presenilin 1 and the activator of protein
signaling (AGS) (Jiang and Bajpayee, 2009).
GAP-43, a protein highly expressed in the growth cones of developing and
regenerating neurons, has the ability to enhance Gαo binding to GTP in the distal tips of
growth cones (acting as a GEF), suggesting that Gαo protein can have a neurite outgrowth
role. Interestingly, PTX does not alter the Gαo activation by GAP-43 like in the others
GEFs. AGS is another GEF involved in regulating Gαo-mediated signaling, enhancing
GTPS binding to both Gi and Go proteins. APP and Presenilin 1 have also been
hypothesized to act as a GEF for Gαo protein (Jiang and Bajpayee, 2009).
Other protein factors have also been identified, but these act as decreasers of the
guanine nucleotide exchange rate. A RGS protein identified was the Gα-interacting protein
(GAIP) that is responsible to selectively accelerate the deactivation of Gαo protein. This
RGS protein is not only responsible for deactivation of Gαo protein signaling, but also
regulates the duration and specificity of receptor-stimulated Gαo protein signaling (Jiang
and Bajpayee, 2009). Other studies revealed the existence of G protein regulatory (GPR) or
GoLoco motifs, which bind to Gαo and stabilize it in the GDP-bound conformation while
simultaneously competing with Gβ for Gα binding (Siderovski, Diverse-Pierluissi et al.,
1999; Jiang and Bajpayee, 2009).
1.3.1.3. Gαo-mediated signaling transduction
The signaling transduction mechanism of Gαo protein and its intracellular effectors
has received widely attention, in an attempt to identify the ligands that might stimulate the
signal, the downstream signaling pathways subsequently activated, and the cellular
functional output of the signaling cascades.
Several studies have shown that Gαo is required to activate phospholipase C (PLC)-
β, adenylyl cyclases 2 and 4, and phosphoinositol-3-kinase (PI3K)-β and -; also, Gαo has

32
Ana Regina Silva Cerqueira SACS/UA, 2012
inhibitory effects on adenylyl cyclase 1 and several voltage-gated calcium (Ca2+
) channels.
Besides that, Gαo knockout mice have indicated that Gαo has a critical role in the
muscarinic inhibition of L-type Ca2+
channels in the heart and in the regulation of Ca2+
and
potassium (K+) channels in hippocampal neurons. In addition to the regulation of Ca
2+ and
K+ channels, Gαo proteins may also regulate sodium (Na
+) channels in cells (Jiang and
Bajpayee, 2009; Bromberg, Lyengar et al., 2011).
The role of Gαo in the mediation of the MAPK signaling is still elusive, but in
Chinese hamster ovary cells it was demonstrated that the expression of an active Gαo
mutant is not sufficient to directly induce MAPK activation, but greatly potentiates the
activation of PKC, a PI3K-dependent mechanism, that leads to B-Raf kinase and MAPK
pathway stimulation (Jiang and Bajpayee, 2009; Bromberg, Lyengar et al., 2011).
As previously described, Gαo signaling induces neurite outgrowth, by several
ligands that activate Gi/o coupled receptors, but only recently two pathways have begun to
elucidate some mechanistic details of how Gαo mediates neurite outgrowth. In Neuro2A
cells it was demonstrated that de CB1 receptor stimulates Gαo and activates downstream
signaling converging on signal transducer and activator of transcription 3 (STAT3) that
finally leads to neurite outgrowth (He, Gomes et al., 2005). The interaction of STAT3
signaling and Gαo will be discussed in more detail below. The other signaling involved in
neurite outgrowth, but not as well detailed, is the GRIN pathway. G protein-regulated
inducer of neurite outgrowth 1 and 2 (GRIN1 and GRIN2) bind specifically to Gαo and are
also enriched in neuronal growth cones. Studies demonstrated that co-expression of GRIN
with an activated mutant of Gαo leads to activation of Cdc42 and enhances neurite
outgrowth in Neuro2A cells (Nakata and Kozasa, 2005; Bromberg, Lyengar et al., 2011).
1.3.1.4. APP-Gαo binding and Alzheimer’s disease
A physical interaction between APP and Gαo protein was demonstrated in synthetic
vesicle preparations (Okamoto, Takeda et al., 1995). A completely conserved cytoplasmic
APP695 sequence, 657
His-Lys676
, was reported to form a complex with and to activate the
Gαo protein (Nishimoto, Okamoto et al., 1993). In further studies using phospholipid
vesicles containing APP695 and Gαo, 22C11, a monoclonal antibody against the
extracellular domain of APP, was used to evaluate the interaction between APP and Gαo.
The authors have found that 22C11 acts on APP695 to stimulate Gαo in APP695/Go vesicles,

33
APP and APP phosphorylation in Gαo-induced STAT3 signaling
increasing GDP/GTP exchange rate of Gαo. This effect of 22C11 was specific among
various antibodies and was observed neither in Gαo vesicles alone nor in APP695/Gi2
vesicles. These data demonstrated that APP behaves like a Gαo-linker receptor whereby it
specifically activates Gαo in a ligand-dependent and ligand-specific manner (Okamoto,
Takeda et al., 1995).
Presenilin 1 was also shown to directly interact with Gαo. These in vitro studies
suggest that Gαo may be involved in neuronal loss in AD through apoptotic signaling
mediating by either Aβ, mutant APP or mutant PS1 (Jiang and Bajpayee, 2009). G protein
inhibitors (like PTX) have been demonstrated to block Aβ toxicity (Sola Vigo, Kedikian et
al., 2009). In neuronal cultures, data has shown that interaction of APP with toxic Aβ
species promotes toxicity by a mechanism that involves APP-mediated Gαo protein
activation (Sola Vigo, Kedikian et al., 2009). A mechanism proposed is that under
pathological loads of Aβ, the interaction of APP and Gαo is reduced, liberating Gαo and
subsequently increasing G-protein activity, which may in turn results in downstream
effects including calcium deregulation and subsequent cell death (Shaked, Chauv et al.,
2009). The Gαo protein may be involved in the pathogenesis of AD by other mechanism(s).
In familial Alzheimer’s disease (FAD), three missense mutation into isoleucine,
phenylalanine and glycine at 642 position of valine (V642) have been identified in the
APP695 isoform (Okamoto, Takeda et al., 1995; Giambarella, Yamatsuji et al., 1997).
These mutations co-segregate with the disease phenotype. All three mutants have been
shown to specifically activate the Gαo protein and induce PTX-sensitive apoptosis in COS-
NK1 cells. Studies of Gαo knockout, and expression of V642-APPs mutant lacking the
His657
-Lys676
in COS-NK1 cells, provided strong evidence for a mediating function of Gαo
in APP-induced apoptosis. Data further demonstrated that the Gβ subunit was responsible
for triggering apoptosis in COS-NK1 cells and the expression of mutationally activated
Gαo only induced little apoptosis (Giambarella, Yamatsuji et al., 1997).
1.3.2. STAT3 signaling
1.3.2.1. STAT proteins
Signal transducer and activator of transcription (STAT) transcription factors have
been reported to play a variety of roles in biological processes, such as cellular

34
Ana Regina Silva Cerqueira SACS/UA, 2012
proliferation, differentiation, migration and apoptosis, regulation of target genes
transcription and cell mediation of cytokine receptor signaling (Horvath, 2000; Lee, Park et
al., 2007; Chiba, Yamada et al., 2009; Chiba, Yamada et al., 2009).
Seven mammalian STAT family members have so far been identified: STAT1, 2, 3,
4, 5a, 5b and 6, which are structurally conserved and essential for carrying out multiple
cellular functions in response to cytokine stimulation, hormones and growth factors signals
in a wide range of cell types and tissues (Horvath, 2000; Chiba, Yamada et al., 2009;
Chiba, Yamada et al., 2009). The domain structure of STAT proteins is critical for STAT
functions and several structural and functional regions have been defined, including a N-
domain (ND) responsible for dimer-dimer interactions, a Coiled-Coil domain responsible
for protein interactions, a src homology 2 (SH2) domain for receptor recognition and
dimerization, which is connected to the DNA binding domain via a linker domain (LD)
implicated in transcription. A tyrosine phosphorylation site required for activation and
dimerization, and a serine phosphorylation site in a C-terminal transcriptional activation
domain were also described (Fig. 11) (Horvath, 2000).
Ligand-activated cytokine or growth factor receptors initiate STAT signal
transduction by the activation of cytoplasmatic tyrosine kinases of the Janus Kinase (JAK)
family, or receptors with intrinsic tyrosine kinase activity, which results in the recognition
of specific receptor phosphotyrosine residues by a latent cytoplasmatic STAT protein SH2
domain. Phosphorylation of tyrosine residues of STATs allows STAT dimerization and
nuclear translocation, where they transcriptionally regulate the expression of target genes.
The phosphorylation of STATs serine residues are required to regulate their transcriptional
functions (Horvath, 2000; Lee, Park et al., 2007; Chiba, Yamada et al., 2009). A general
model for receptor-mediated activation of STAT signaling is represented in Fig. 12.
Fig. 11: The structural domains and functional regions of the STAT proteins. ND, N-domain responsible for dimer-
dimer interactions (yellow box); Coiled-Coil, coiled-coil domain responsible for protein interactions (green box); DNA-
binding, a sequence-specific DNA-binding domain (red box); LD, linker-domain implicated in transcription (orange
box); SH2, src homology 2 domain for receptor recognition and dimerization (blue box). All STATs include a tyrosine
(Y) phosphorylation (P, red circles) site required for activation and dimerization. Several of the STATs also have a serine
(S) phosphorylation (P, red circles) site in their C-terminal transcriptional activation domain (TAD, purple box). Adapted
from Horvath (2000)

35
APP and APP phosphorylation in Gαo-induced STAT3 signaling
1.3.2.2. STAT3 function
The STAT proteins are structurally similar, but they diverged functionally and
coevolved with specific enhancers, and cannot substitute for one another in the regulation
of target genes. Several studies on the functional roles of STAT3 revealed that this protein
is essential for growth regulation, organogenesis, early embryonic development, neural
stem cell differentiation, survival and inflammatory response of neurons, being implicated
in the regulation of several genes linked to cell division downstream of growth signals
(Horvath, 2000; Ng, Cheung et al., 2006; Chiba, Yamada et al., 2009). Of note, the STAT3
transcript can be alternatively spliced to generate STAT3b, which lacks the 55-aa C-
terminal domain of STAT3a and, instead, has a 7-aa C-terminal domain (Horvath, 2000).
In diverse cell types, activation of STAT3 has been reported downstream of
receptors for cytokines such as interleukin-6 (IL-6), leukemia inhibitory factor (LIF) and
ciliary neurotrophic factor (CNTF) that utilize a common receptor subunit gp130, as well
as a number of receptors with intrinsic tyrosine kinase activity (Horvath, 2000; Lee, Park et
al., 2007). The recruitment of proteins containing SH2 domains, including STAT3,
subsequently leads to the phosphorylation of STAT3 by receptor-associated Janus kinases
at tyrosine 705 (Tyr705). The activate STATs causes homo- or heterodimerization of
Fig. 12: Classical example of STAT activation mechanism by transmembrane receptors. 1- The binding of the
ligand (yellow triangle) induces receptor oligomerization and activation of JAKs. 2- JAKs phosphorylate (P) each other
and phosphorylate the receptor cytoplasmic domain on tyrosine residues (Y), creating sites for interaction with proteins.
3- SH2 domains of latent cytoplasmic STAT protein recognize specific receptor phosphotyrosine residues, and the
receptor-bound STATs become tyrosine phosphorylated by JAKs. 4- The phosphorylation of STATs allows STAT
dimerization (homodimers are illustrated, but heterodimers can also form), and recruitment of them to the nucleus where
they bind to promoter response elements and activate transcription of their target genes. Receptors with intrinsic tyrosine
kinases and oncogenic tyrosine kinases can apparently activate STATs without the participation of JAK kinases. Adapted
from Horvath (2000)

36
Ana Regina Silva Cerqueira SACS/UA, 2012
STAT1/3 transcription factors and subsequent translocation to the nucleus, activating
multiple target gene transcription via interaction with specific DNA-response elements
(Ng, Cheung et al., 2006).
1.3.2.3. APP and Gαo in STAT3 signaling
The STAT3 signaling pathway has been extensively spotlighted due to its
involvement and regulatory role in various biological processes, such as neuronal
development. Studies demonstrated that CNTF is an instructive signal for astroglial type 2
cell fate, specifically mediated via activation of STAT3 (Aberg, Ryttsen et al., 2001; Xu,
Chen et al., 2009). In AD patients, studies showed controversies regarding the involvement
of STAT3 signaling. Some experiences have detected an elevation of STAT3
phosphorylation at Tyr705 in the postmortem samples of AD brains (Wan, Fu et al., 2010),
while others have concluded that STAT3 inactivation is involved in the pathogenesis of
AD (Chiba, Yamada et al., 2009; Chiba, Yamada et al., 2009). It has also been reported
that APP relies on the activation of the JAK/STAT3 signaling pathway to induce cell
death, increasing the expression of a chemokine with neuroinflammatory properties
(Vrotsos, Kolattukudy et al., 2009). These results indicated that APP expression increased
phosphorylation of STAT3 at Tyr705. Other studies indicate that the STAT3 signaling is
crucial for sAPPα-induced glial differentiation. Results have demonstrated that sAPPα is
able to enhance phosphorylation of STAT3 at Tyr705 in a time-dependent manner, by
directly and indirectly activation of JAK/STAT signaling through gp130 (Kwak, Dantuma
et al., 2010).
The ability of Gα subunits to stimulate STAT3 is especially intriguing because
STAT3 plays an important role in differentiation, proliferation, transformation, apoptosis,
and development of cells. In a previous study, results have showed that overexpression of a
constitutively active Gαo mutant, Gαo Q205L, in NIH-3T3 fibroblast cells leads to the
activation of the STAT3 pathway, resulting in increased proliferation and in the
transformation of the cells (Ram, Horvath et al., 2000). Gαo was shown to increase both
Tyr705 STAT3 phosphorylation and STAT3 transcriptional activity. In Neuro-2A cells,
where endogenous Gαo proteins are expressed, previous data indicated that activation of
cannabinoid receptor 1-coupled Gαi/o (CB1), a GPCR that regulates neurite outgrowth,
leads to the activation of STAT3 and changes in gene expression and, subsequently, in the

37
APP and APP phosphorylation in Gαo-induced STAT3 signaling
normal cell physiology (He, Gomes et al., 2005). STAT3 phosphorylation by Gαo subunits
(Fig. 13) appears to be mediated via Src, a member of a family of cytoplasmic tyrosine
kinases, and to involve activation of a cascade of signaling intermediates, like small
GTPases (Rap1-GAP, Rac 1, Rap 1 and Ral 1) (Ram and Iyengar, 2001; He, Gomes et al.,
2005). This may be an important pathway in neurons, where Gαo activation can lead to
neurite outgrowth and neuronal plasticity. Activation of many GPCRs has also been
reported to phosphorylate and activate STAT3 via others Gα subunits, like Gα16, leading to
changes in gene transcription (Wu, Lo et al., 2003).
The work here described is thus aimed to prove the interaction of APP and Gαo in
STAT3 signaling and the cellular/molecular role of this interaction, elucidating the
sequence of events/signaling pathways after activation.
Fig. 13: Go signaling to the nucleus during the induction of neurite outgrowth. In Neuro2A cells, activation of CB1
cannabinoid receptor mediates neurite outgrowth. Overexpression of Gαo reduces the stability of Rap1GapII, which
results in the activation of Rap1. Activation of Rap1 leads to the activation of Src and STAT3 that mediate gene
expression that promotes neurite outgrowth. The CB1 activation also stimulates the small GTPase Rac1 and subsequently
c-Jun N-terminal kinase (JNK). Both of these proteins are activated downstream Src, and JNK also enhances STAT3
phosphorylation. Reproduced from Bromberg, Lyengar et al. (2011)

38
Ana Regina Silva Cerqueira SACS/UA, 2012

39
APP and APP phosphorylation in Gαo-induced STAT3 signaling
2. Aims of this thesis
In the work here described we mainly intended to test if APP and APP
phosphorylated at S655 could modulate Gαo-induced STAT3 signaling. For this, the SH-
SY5Y neuroblastoma cell line was used, along with specific cDNAs for APP and Gαo and
several molecular and cellular biology procedures.
2.1. General Aims
- To study if APP-Gαo co-transfection modulates Gαo-induced STAT3 signaling by
western blot analysis;
- To study if APP phosphorylation at S655 modulates Gαo-induced STAT3 signaling;
- To evaluate the effect of Gαo activation and APP S655 phosphorylation in APP-Gαo
binding.
2.2. Specific Aims
- To purchase and amplify Gαo and GαoCA (a Q205L mutant mimicking constitutively
active Gαo) cDNAs.
- To optimize SH-SY5Y cells transfection with Gαo and GαoCA cDNAs, and test anti-
Gαo antibodies.
- To optimize time conditions of SH-SY5Y cells transfection with Gαo and GαoCA in
terms of their effects on STAT3 signaling.
- To test if APP overexpression affected Gαo and GαoCA-induced STAT3 signaling.
- To test if APP phosphorylation at S655 influences Gαo- and GαoCA-induced STAT3
signaling, by co-transfecting cells with APP-GFP fusion cDNAs (Wt or S655
phosphomutants: S655A and S655E) and Gαo or GαoCA CDNAs.
- To analyse if Gαo and GαoCA have an effect on APP turnover and/or cleavage.
- To evaluate if APP-GFP proteins differentially interact with Gαo or GαoCA proteins
using the GFP-trap® pull-down technique.

40
Ana Regina Silva Cerqueira SACS/UA, 2012

41
APP and APP phosphorylation in Gαo-induced STAT3 signaling
3. Materials and Methods
3.1. Culture and maintenance of the SH-SY5Y cell line
The human neuroblastoma SH-SY5Y cell line is derived from the original cell line
SK-N-SH, isolated from a bone marrow biopsy of a neuroblastoma patient. The SH-SY5Y
cell line was maintained in a 5% CO2 humidified incubator at 37°C with a recommended
culture medium: 10% fetal bovine serum (FBS) minimal essential medium (MEM):F12
(1:1), with 2mM L-glutamine and 100U/mL penicillin and 100mg/mL streptomycin [10mL
Streptomycin/Penicilin/Amphotericin solution, Gibco]. Cells were split at 70-80%
confluence.
3.2. Wt and S655 Phosphomutants APP-GFP cDNAs
APP-GFP cDNAs were already available at the lab. Namely, APP isoform 695
(APP695) cDNA was used as template to generate S655 cDNA point mutations, namely
Serine 655 to Alanine (S655A) or to Glutamate (S655E), using site directed mutagenesis
(da Cruz e Silva, Iverfeldt et al., 1993; Vieira, Rebelo et al., 2010). These two amino acids,
due to their size and charge, mimic a constitutively dephosphorylated (S655A) and
phosphorylated (S655E) S655 residue, respectively. Further, PCR was performed to
remove the stop codons of Wt and S655 phosphomutants APP695 cDNAs and engineer the
APP695-GFP cDNA constructs (APP-GFP) by subcloning the amplified APP cDNA
fragments into the EGFP-N1 plasmid, encoding for the Green Fluorescent Protein (GFP)
(Vieira, Rebelo et al., 2009).
3.3. Wild-type and constitutively active G-protein alpha o – Gαo and GαoCA
(Q205L) cDNAs
The G-protein alpha o cDNA was obtained at the Missouri S&T cDNA Resource
Center. The human wild type G-protein alpha o subunit has been cloned into pcDNA3.1+
(Invitrogen) at KpnI (5') and Xba I (3'). The open reading frame was amplified by PCR
from human whole brain cDNA (Clontech). The Q205L mutation was introduced into the

42
Ana Regina Silva Cerqueira SACS/UA, 2012
wild-type human G-protein alpha o by Quickchange mutagenesis kit (Stratagene). The
constitutively activated Gαo is characterized by a change in Glutamine 205 to Leucine
(Q205L), resulting in a Gαo subunit mutation that lacks guanosine triphosphatase (GTPase)
activity, remaining in a constitutively active form. Both these clones are distributed in
Invitrogen's pcDNA3.1+ vector, which can be used for mammalian expression and
production of stably transfected cell lines. Upon purchase, these cDNAs, together with the
empty pcDNA3.1 plasmid vector, were transformed in competent E. coli strains, and
plasmid DNA amplified by megaprep technique using the Promega Wizard® Plus
Megapreps DNA Purification System, following the manufacturer instructions.
3.4. SH-SY5Y cells transfection with APP-GFP and Gαo or GαoCA cDNAs
In order to study the effect of APP and APP phosphorylation on Gαo-induced
STAT3 signaling, SH-SY5Y neuroblastoma cells were transiently transfected or co-
transfected with Wt, S655A (SA), or S655E (SE) APP-GFP fusion cDNAs contructs, and
Gαo or GαoCA (a Q205L mutant)cDNAs. To optimize SH-SY5Y cells transfection with
these constructs, three different transfection methods were initially tested, the Polyplus, the
TurboFectTM
lipid-mediated, and TurboFectTM
combined with CombiMag methods. In
these preliminary experiment cells were left to transfect for 24h. In further experiment the
transfection method of choice was the TurboFectTM
and cells were transfected for specific
time periods (2h, 4h, 6h, 8h or 24h). Cells were then harvested in 1% SDS for Western
blotting (WB).
3.4.1. Transfection by the Polyplus method
To proceed the transfection with the polyplus method, cells were seeded per well in
2 mL of cell growth medium 24h prior transfection and, at the time of transfection, cells
were 60-80% confluent. First, the transfection mix was prepared, where 1 μg of DNA was
diluted in 100 μL of jetPRIMETM
buffer (this must be diluted 1:5). After being mix by
vortexing and a briefly spin down, 2 μL of jetPRIMETM
reagent were added to the diluted
DNA (1:2 DNA to jetPRIMETM
reagent ratio). The mixture was vortexed, subjected to spin
down and incubated for 10 min at room temperature. Then, 100 μL of transfection mix was
added, per well, dropwise onto the cells in regular cell growth medium, and distributed

43
APP and APP phosphorylation in Gαo-induced STAT3 signaling
evenly. The six-well plates were gentle agitated and incubated at 37ºC in a humidified
incubator in an atmosphere of 5% CO2. After 4h of incubation, this transfection medium
had to be replaced by 2 ml of growth medium and the plates returned to the incubator, in
order to complete 24h of transfection.
3.4.2. Transfection using the TurboFectTM
reagent
Transfections were carried out according to the manufacter’s instructions
(Fermentas Life Sciences). Before transfection the appropriate medium was replaced.
Briefly, for each monolayer of cells grown in six-well plates, 2 μg of the respective DNA
were diluted in 100 μL of serum-free growth medium. After being quickly vortexed, 4 μL
of TurboFectTM
were added to the diluted DNA. The mixture was vortexed, incubated for
15-20 min at room temperature, and then transferred dropwise to each well, with gentle
agitation of the plate to achieve even distribution. The cells were incubated at 37ºC in a
CO2 incubator. After 6h, cell medium was replaced and transfection was left to occur until
the selected transfection time. In the main experiments the transfection levels were
decreased by down-scaling the protocol to 1 μg of cDNA to 2 μL of TurboFectTM
.
3.4.3. Transfection using the TurboFectTM
reagent plus CombiMag
In this transfection method, TurboFectTM
lipid-mediated transfection is improved,
by incorporating a CombiMag reagent. This last component increases transfection
efficiency, due to the use of magnetism by a magnetic plate (also called ‘magnetofection’).
Cells were seeded in order to accomplish 60-90% confluency at the time of transfection.
Before magnetofection the appropriate medium was replaced, and for each monolayer of
cells to transfect, 1 μL of the CombiMag reagent, previously vortexed, was pipetted into a
microtube. The DNA and TurboFectTM
reagent mixture was prepared in a second
microtube: first, 1 μg of DNA was diluted in 100 μL of serum-free growth medium;
second, TurboFectTM
is vortexed and 1 μL of this was added to the diluted DNA. This
mixture was added to the first microtube with the CombiMag reagent. After being
vortexed, the microtube was incubated for 15-30 min at room temperature. This was added
onto the medium above each cell monolayer, with gentle mixing, and then the six-well
plates were placed over a magnetic plate (OZ Biosciences), during 15 min. Transfected

44
Ana Regina Silva Cerqueira SACS/UA, 2012
cells were incubated at 37ºC in a CO2 incubator, cell medium exchanged after 6h,
according to the TurbofectTM
protocol, and transfection was left to occur for a total of 24h.
3.5. Cell collection and quantification of protein content (BCA)
Cells’ conditioned medium (500 µl) was collected into a microtube containing 55
µl of 10% SDS, the remainder medium was sucked with a Pasteur pipette, and further cells
were collected with 250 µl of 1% boiling SDS. Cellular and medium lysates were boiled
for 10 min, and cell lysates were sonicated for 30 sec.
The total protein quantification method was performed by Pierce’s BCA protein
assay kit in an aliquot of the cell lysates, following the manufacturer’s instructions. This
assay is the result of two reactions. Firstly, there is the reduction of Cu2+
to Cu+ by protein
in an alkaline medium to form a light blue complex. In this biuret reaction peptides
containing three or more amino acid residues form a coloured chelate complex with cupric
ions in an alkaline environment containing sodium potassium tartrate. The amount of Cu2+
reduced is proportional to the amount of protein present in the solution. The bicinchoninic
acid reagent (BCA) addition leads to a sensitive colorimetric detection of the Cu+ cation,
by chelation of two molecules of BCA with each Cu+ ion (a temperature dependent
reaction). This gives rise to a purple-coloured reaction product that strongly absorbs light
at a wavelength of 562 nm. The BCA/copper complex exhibits a high linearity in a
working range of increasing BSA concentration between 20 to 2000 µg/ml. Total protein
concentration of each sample was determined through a standard curve prepared by
plotting BSA absorbance vs. BSA standard concentration. The standards were prepared, as
in Table 1, directly into the wells of a 96-well microplate.
Table 1. Standards used in the BCA protein assay method, with standard protein
concentrations. BSA, Bovine serum albumin solution (2 mg/ml).
Standard BSA (µl) 10% SDS (µl) H2O (µl) Protein mass (µg) W.R. (µl)
P0 - 2,5 22,5 0 200
P1 1 2,5 21,5 2 200
P2 2 2,5 20,5 4 200
P3 5 2,5 17,5 10 200
P4 10 2,5 12,5 20 200
P5 20 2,5 2,5 40 200

45
APP and APP phosphorylation in Gαo-induced STAT3 signaling
The samples were prepared in each well by adding 5 µl of each sample to 20 µl of
the solution in which the sample was collected (in this case 1% SDS). 200 µl/well of
working reagent (W.R), was prepared by the mixture of BCA reagent A with BCA reagent
B in the proportion of 50:1, respectively, and was rapidly added to each well (standards
and samples). The microplate was incubated at 37ºC exactly for 30 min, and then cooled to
RT. The absorbance at 562 nm was immediately measured using a microplate reader
(Infinite M200, Tecan), with gentle oscillation and 25 readings for each well.
3.6. Antibodies
The primary antibodies used in this study were: the monoclonal 22C11 mouse
antibody (Chemicon) directed against APP N-terminus, recognizing full-length APP and
secreted APP (sAPP), and the polyclonal CT695 rabbit antibody (Invitrogen) that
recognizes APP C-terminal (detection of APP full length and APP C-terminal peptides),
for APP and APP-GFP detection; the polyclonal rabbit anti-Gαo (Upstate) and the
monoclonal mouse anti-Gαo (Chemicon) antibody that recognizes the Go α subunit; the
monoclonal rabbit anti-phospho-STAT3 (Tyr705, Millipore) and the monoclonal mouse
anti-STAT3 (Cell Signaling Technology) antibodies, directed against the STAT3 isoforms
alpha (~84kDa) and beta (~76kDa), were used to evaluate the modulation of STAT3
signaling. A polyclonal rabbit anti-PARP cleavage site (214/215) antibody that can be used
as a marker for detecting apoptotic cells by recognizing the 85 kDa fragment of cleaved
PARP was used in the transfection optimization assay. As potential loading control for
Western blot assays, the monoclonal antibody anti-β-Tubulin, that binds the two major and
a minor β-tubulin isotypes, was used. A list of all the antibodies used, together with their
respective dilutions and secondary antibodies is depicted in Table 2.
Table 2. Antibodies used in the Western blots, respective target proteins and specific
dilutions used. All the secondary antibodies are from Amersham Pharmacia.
Target
Protein/Epitope Primary Antibody Secondary Antibody
APP C-terminal CT695 (Invitrogen)
Dilution: 1:500
Horseradish Peroxidase
conjugated α-Rabbit IgG
Dilution: 1:5000
APP N-terminal 22C11 (Chemicon)
Dilution: 1:250
Horseradish Peroxidase
conjugated α-Mouse IgG
Dilution: 1:5000

46
Ana Regina Silva Cerqueira SACS/UA, 2012
Target
Protein/Epitope Primary Antibody Secondary Antibody
Gαo Anti- Gαo (Upstate)
Dilution: 1:5000
Horseradish Peroxidase
conjugated α-Rabbit IgG
Dilution: 1:5000
Gαo
Anti- Gαo (Chemicon)
Dilution: 1:3000, 1:1000
1:500
Horseradish Peroxidase
conjugated α-Mouse IgG
Dilution: 1:5000
PARP cleavage site 214-215 Anti-PARP cleavage site
(214/215) (Chemicon)
Dilution: 1:1000
Horseradish Peroxidase
conjugated α-Rabbit IgG
Dilution: 1:5000
Phospho-STAT3
Anti-phospho-STAT3 (Tyr
705), clone EP2147Y
(Millipore)
Dilution: 1:3000
Horseradish Peroxidase
conjugated α-Rabbit IgG
Dilution: 1:1000
STAT3
Anti-STAT3 (124H6)
(Millipore)
Dilution: 1:1000
Horseradish Peroxidase
conjugated α-Mouse IgG
Dilution: 1:2000
β-Tubulin 2-28-33 (Invitrogen)
Dilution: 1:2000
Horseradish Peroxidase
conjugated α-Mouse IgG
Dilution: 1:5000
3.7. Western Blot Assays
Mass-normalized cell aliquots were subjected to a 7.5% (for the medium samples)
and 5-20% gradient (optimization and experimental assays) sodium dodecylsulfate (SDS)
polyacrylamide gel electrophoresis (PAGE), being subsequently electrotransferred onto
nitrocellulose membranes. After proteins transfer, the membranes were hydrated in 1X
TBS for 10 min. To block possible non-specific binding sites of the primary antibody, a
blocking solution was used of 5% non-fat dry milk in 1X TBS-T solution. The membranes
were immersed in this solution for 1h or 2h. Then, the incubation with primary antibody
was achieved for a period of time according to the manufactures instructions (ranging from
2 h to overnight incubation). After this incubation, membranes were washed three times for
10 min each, with 1X TBS-T. The membrane was further incubated with the specific
secondary antibody conjugated with horseradish peroxidase which binds to the respective
primary antibody, for 2h with agitation. All primary and secondary antibodies used, with
specific dilutions (Table 2), were diluted in 1X TBS-T/3% non-fat dry milk, 1X TBS-T/5%
non-fat dry milk or 1X TBS/1% BSA. Then, the membranes were again subjected to three
washes for 10 min each, with 1X TBS-T. To proceed to the detection of the secondary

47
APP and APP phosphorylation in Gαo-induced STAT3 signaling
antibody and consequently of the proteins, membranes were submitted to the enhanced
chemiluminescence (ECL) detection method. This method is a light emitting non-
radioactive method for detection of immobilised specific antigens, conjugated directly or
indirectly with horseradish peroxidase-labelled antibodies. The washed membranes were
incubated at RT for 1 min with home-made ECL detection solution (detailed composition
in appendix) or for 2-5 min with LuminataTM
Crescendo (Millipore). The excess of
detection reagent was drained off the membrane. In a dark room the blot was then placed
in an x-ray film cassette with a sheet of a Hyperfilm ECL (GE Healthcare) on the top of it.
The cassette was closed and the blot exposed for an appropriate period of time. The film
was then removed and developed with developer solution (Sigma Aldrich), washed in
water, and fixed in a fixing solution (Sigma Aldrich). Then one can estimate if the
membrane needs more or less time inside the x-ray cassette. The blot was further washed
in 1X TBS-T and distilled water before drying, for better conservation.
3.8. GFP-trap® pull-down assays
For biochemical studies, the green fluorescent protein (GFP)-fusion proteins and
their interacting factors can be isolated fast and efficiently via pull down of GFP with
GFP-trap® (Chromotek). Since the interaction is mediate by a small GFP-binding protein
coupled to a monovalent matrix (e.g. agarose beads) the GFP-trap® enables purification of
any protein of interest fused to GFP, eGFP, YFP or Venus.
After transfection (as in section 3.4.2.), SH-SY5Y cells were washed in 1x PBS and
1 ml of cold PBS with 1x PMSF (dilute stock 1:100) was added, keeping the six-well plate
on ice. The cells were collected with a scrapper to a microtube and immediately putted on
ice. The sample was then centrifuged for 5 min at 4ºC at 3000 g, the supernatant was
removed, and 500 μl of lysis buffer was added to the pellet. This was maintained 30 min on
ice and vortexed twice, with 10 min intervals. Meanwhile, the protein sepharose G beads
and the GFP-TRAP beads (Chromotek) were being prepared, by resuspending them in
wash buffer, centrifuging at 13000 g for 1 min and keeping at 4ºC. After the 30 min, the
sample was centrifuged for 5 min at 10000 g at 4ºC, 25 μl of supernatant were transferred
to a new microtube and 12 μl of Loading Buffer/10% SDS were added, always keeping the
sample on ice (‘cells lysates’). The rest of the supernatant was transferred to a new
microtube and, to pre-clear the cell lysate, washed protein sepharose G beads were added

48
Ana Regina Silva Cerqueira SACS/UA, 2012
(25 μl for sample) for 1h at 4ºC with orbital agitation. After BCA protein quantification (as
described before in section 3.5.), mass normalized lysates were centrifuged for 5 min at
13000 g at 4ºC, and the supernatant transferred to GFP-TRAP beads (20 μl for sample) and
incubated overnight with orbital shaking at 4ºC. The mixture was then centrifuged for 5
min at 10000 g at 4ºC, 25 μl of supernatant were collected to a new microtube and 12 μl of
Loading Buffer/10% SDS were added (‘Supernatant’). The pellet was washed with 1 ml of
wash buffer, incubated for 10 min with agitation at 4ºC and centrifuged for 1 min at 10000
g at 4ºC. The supernatant was fully discarded and these operations were repeated for eight
or nine times. 50 μl of Loading Buffer/1% SDS and 2,5 μl of β-mercaptoethanol were
added to the precipitates. Afterwards, all protein samples were sonicated for 30 sec, boiled
for 10 min and frozen. The precipitates, lysates and supernatants were separated by WB.
3.9. Ponceau S staining of proteins bands
Ponceau S staining of proteins bands has been applied as an alternative means to
actin or β-tubulin immunoblotting to assess equal gel loading, or quality control of
membrane transfer in Western blots. This loading control practice has been described as a
fast, inexpensive, and nontoxic method, and binding is fully reversible in a few minutes
(Romero-Calvo, Ocon et al., 2010). The nitrocellulose membranes were incubated in
Ponceau S solution (Sigma Aldrich, 0.1 % [w/v] in 5% acetic acid) for seven minutes,
followed by a brief rinse in distilled water so that the bands were clearly visible. The
membranes were then inserted into transparency sheets and scanned (Fig. 14) in a GS-800
calibrated imaging densitometer (Bio-Rad). After that, membranes were washed in 1x
TBS-T for 2–3 min with gentle agitation and 1x in distilled water until the staining was
completely eliminated. The stain solution can be re-used and the membranes can be
immunologically detected.
Fig. 14: Example of a Ponceau S staining to be used as a loading control in Western blots. Nitrocellulose
membranes were subjected to reversible Ponceau S staining, and lanes of bands scanned in a GS-800 calibrated imaging
densitometer (Bio-Rad).
49
APP and APP phosphorylation in Gαo-induced STAT3 signaling
3.10. Fluorescence Microscopy
Cells grown on coverslips were fixed with a 4% paraformaldehyde PBS solution
for 30 min and permeabilized with a 0,2% TRITON in PBS solution for 10 min; after these
procedures, coverslips were immediately washed three times with PBS solution.
Afterward, the cells were blocked with 50 μL PBS-3% BSA for 30 min. In order to
visualize Gαo and APP, 20 μL of both anti-Gαo and 22C11 antibodies were added in each
coverslip. After two hours of incubation, the primary antibodies were removed by washing
the coverslips three times with PBS, for 10 min each wash. 40 μL of secondary antibodies,
Alexa Fluor 488 and Texas-Red, were diluted in PBS-3%BSA and added to the coverslips
for two hours in the dark, at room temperature. Coverslips were further washed three times
with PBS and one last time with distilled water, and then mounted onto microscope glass
slides with a drop of DAPI-containing antifading Reagent (Bio-Rad) for further
fluorescence microscopy analysis. Fluorescence microphotographs were taken using
confocal microscopy, LSCM. Images were acquired in a LSM 510 META confocal
microscope (Zeiss) using an Argon laser line of 488 nm (green channel), a 561 nm DPSS
laser (red channel), and a Diode 405-430 laser (blue channel).
3.11. Data analysis
Autoradiography films resulting from immunoblots detection were scanned in a
GS-800 calibrated imaging densitometer (Bio-Rad) and protein bands were quantified
using the Quantity One densitometry software (Bio-Rad). Data from Gαo/GαoCA and APP-
GFP cDNAs transfected cells was compared to vector pcDNA3 (V1) and N1-EGFP (V2)
transfected cells, respectively, and expressed as mean ± SEM (standard error of the mean)
of four independent experiments. Statistical significance analysis was conducted by one
way analysis of variance (ANOVA) followed by the Tukey test.

50
Ana Regina Silva Cerqueira SACS/UA, 2012

51
APP and APP phosphorylation in Gαo-induced STAT3 signaling
4. Results
4.1. Optimization of APP/Gαo cDNAs transfection
In order to optimize SH-SY5Y cells transfection, three transfection methods -
Polyplus, TurbofectTM
, and TurbofectTM
plus CombiMag - were tested. For this, SH-SY5Y
neuroblastoma cells were plated at 70-80% confluence, being transfected at the next day
with Gαo and GαoCA cDNAs, using the three different transfection methods as described
in sections 3.4. The levels of Gαo transfection were evaluated by Western blot analysis
using an anti-Gαo antibody (Fig. 15), by comparing with non-transfected cells (NT, Fig.15
at the right).
Fig. 15: Evaluation of Gαo and GαoCA cDNAs transfection in SH-SY5Y cells using different transfection methods. Upper panel: Immunoblot analysis of Gαo and GαoCA cDNAs transfection, cleaved PARP (for apoptosis analysis) and
STAT3 signaling, using anti-Gαo, anti-PARP cleavage site (214/215), anti-STAT3 and anti-phospho-STAT3 (Tyr705)
antibodies, respectively. Lower panel and graphs: Protein expression profiles of Gαo and cleaved PARP with different
transfection methods, allowed evaluate Gαo transfection and apoptosis rate. NT: non-transfected cells; Go PP, Go TF and
Go TF+Combi: cells transfected with Gαo cDNA, using Polyplus, TurbofectTM, and TurbofectTM plus CombiMag
respectively; GoCA PP, GoCA TF and GoCA TF+Combi: GαoCA cDNA transfected cells, using Polyplus, TurbofectTM
lipid-mediated and TurbofectTM plus CombiMag respectively.

52
Ana Regina Silva Cerqueira SACS/UA, 2012
All the transfection methods tested rendered good levels of Gαo transfection, but
both the TurbofectTM
and TurbofectTM
plus CombiMag methods yield higher transfections.
Although the TurbofectTM
plus CombiMag method yielded the best efficient transfection
rate, it was associated with an increase in cell death. PARP cleavage, a classical
characteristic of apoptosis, was used to evaluate the apoptosis rate, by Western blot
analysis using an anti-PARP cleavage site (214/215) antibody (Fig. 15). Therefore, in all
successive experimental assays, the TurbofectTM
reagent method was used. Of note, the
mouse anti-Gαo antibody (Chemicon) was first tested here and rendered no visible signal.
4.2. Pilot experiment – time periods of Gαo transfection
Subsequently, a pilot experiment was delineated in order to optimize the best time
periods of Gαo transfection for the study of Gαo–induced STAT3 signaling. For that, cells
were plated at 70-80% confluence and transfected, after 24h, with pcDNA3 vector alone or
the Gαo and GαoCA cDNAs, for 2h, 4h, 6h, 8h and 24h. After each transfection time
period, cells were collected for Western blot analysis. Both the anti-phospho-STAT3
(pSTAT3, Tyr 705) and anti-STAT3 antibodies were used to analyse STAT3 activation,
and the levels of Gαo were analysed using the anti-Gαo rabbit antibody (Fig. 16). Tubulin
was detected by anti-β-Tubulin antibody. Again, the mouse anti-Gαo antibody was not able
to detect endogenous or transfected Gαo, and hence only the rabbit antibody (Upstate) was
used in further experiments.
Increase in Gαo expression could be observed from 6h of transfection on, and its
expression increased with time of transfection; GαoCA expression could be observed from
4h on, and was slightly higher than for Gαo. Gαo effects on the STAT3 signaling could be
observed from 6h until 24h of transfection, and only Gαo at 6h visibly induced STAT3
phosphorylation. Indeed, for the other periods following the 6h time point, and for all the
GαoCA transfections, the levels of STAT3 phosphorylation were found to decrease below
the vector pcDNA3 ones. Hence, a retro-inhibition mechanism of this pathway appears to
exist upon longer Gαo overexpression times or with Gαo activation, mimicked by the
GαoCA mutant. Further, at 8h and 24h, GαoCA overexpression induces a higher negative
feedback on STAT3 phosphorylation than Gαo.

53
APP and APP phosphorylation in Gαo-induced STAT3 signaling
In synthesis, the 6h transfection period was the only one where STAT3 activation
could be recorded by Western blot means, and at 24h of transfection the pSTAT3/STAT3
ratio were below vector levels for both Gαo and GαoCA. Hence, in all subsequent assays,
6h and 24h were the transfection time periods chosen, as they rendered higher and opposite
effects on STAT3 signaling. Further, in the following main experiments, the transfection
levels were purposely decreased in an attempt to record not only Gαo but also GαoCA-
induced STAT3 phosphorylation at the 6h period.
Fig. 16: Evaluation of Gαo transfection effects on the STAT3 signaling upon different times of transfection (2h, 4h,
6h, 8h and 24h). Upper panel: Immunoblot analysis of SH-SY5Y cells that were transfected with pcDNA3 vector, Gαo
and GαoCA cDNA. Gαo and GαoCA cDNA transfections were confirmed by using the anti-Gαo antibody. STAT3
signaling was analysed by the use of anti-phospho-STAT3 (Tyr705) and total anti-STAT3 antibodies. Tubulin was also
detected by using an anti-β-Tubulin antibody. Graph: The rate of STAT3 activation is presented by the ratio of Phospho-
STAT3 to total STAT3 levels for the samples transfected only with the pcDNA3 vector, or with Gαo and GαoCA cDNAs
at different times of transfection. V1: vector pcDNA3 transfected cells; Go and GoCA: cells transfected with Gαo and
GαoCA cDNA, respectively.

54
Ana Regina Silva Cerqueira SACS/UA, 2012
4.3. APP effects on Gαo–induced STAT3 signaling
4.3.1. APP and Gαo effects on STAT3 activation levels
In order to decipher the influence of APP and Gαo interaction on STAT3 signaling,
and the underlying mechanisms, non differentiated SH-SY5Y neuroblastoma cells were
transfected with pcDNA3 (V1) and EGFP-N1 (V2) empty vectors, APP-GFP (Wt, S655A
and S655E - mimicking APP S655 dephosphorylation and phosphorylation, respectively),
Gαo and GαoCA (a Q205L mutant mimicking constitutively active Gαo) cDNAs, and co-
transfected with APP-GFP fusion cDNAs and Gαo or GαoCA. Transfection was conducted
for 6 and 24 h by the TurbofectTM
method, after which cells and medium were harvested
for Western blot procedure. Transfection of APP-GFP constructs was confirmed for all
conditions by using the 22C11 antibody against APP N-terminus (Fig. 17, bands a, b in
Wt, SA or SE lanes), which also detects endogenous APP proteins (bands c-e). Transfected
Gαo or GαoCA (Fig. 17, lanes Gαo and GαoCA) and endogenous Gαo were detected for all
conditions, using the rabbit anti-Gαo antibody.
Fig. 17: Qualitative assessment of Gαo and APP-GFP levels of transfection upon 6h and 24h of transfection. Immunoblot analysis of SH-SY5Y cells transfected with pcDNA3 (V1) and N1-EGFP (V2) vectors, Gαo and GαoCA (Go
and GoCA, respectively), wild-type and S655 phosphomutant APP-GFP (Wt, SA, SE) cDNAs, or co-transfected with
APP-GFP fusion cDNAs and Gαo or GαoCA: Go + Wt, SA or SE: Gαo and Wt, S655A or S655E co-transfected cells;
GoCA + Wt, SA or SE: cells co-transfected with GαoCA and Wt, S655A or S655E. Upper panel: 6h of cDNAs
transfection; lower panel: 24h of cDNAs transfection. Gαo and APP expressions were detected using the anti-Gαo
antibody and the 22C11 antibody, against APP N-terminus, respectively. a) APP-GFP 695 mature; b) APP-GFP 695
immature forms; c) endogenous APP 751/770 mature; d) endogenous APP 751/770 immature forms; e) endogenous APP
695 immature form.

55
APP and APP phosphorylation in Gαo-induced STAT3 signaling
Tubulin was detected by using an anti-β-Tubulin antibody. Tubulin levels showed a
consistent variation pattern, indicating that it was an experimental variable and therefore
not suited to be used as a loading control (Fig. 18). Thus, Ponceau S staining of total
proteins bands was performed, and samples’ lanes were quantified and used as loading
control for further quantitative determinations.
Following, the activation of STAT3 signaling was analyzed using both an anti-
phosphoSTAT3 (Tyr 705) and anti-STAT3 antibodies, in the 6h and 24h Western blots.
APP effects on Gαo-induced STAT3 signaling (6h of transfection)
The levels of STAT3 and P-STAT3 for each condition were quantified by
densitometry and plotted upon their correction to the loading control (Ponceau S). At 6h of
transfection, no significant variation on total STAT3 levels was observed for all conditions
tested. On the other hand, significant alterations in STAT3 phosphorylation levels (P-
STAT3) could be observed for some conditions. Protein quantification data were used to
determine the P-STAT3/STAT3 ratio for each condition, a measure of STAT3 activation
(Fig. 19).
Fig. 18: Qualitative assessment of tubulin levels upon 6h and 24h of transfection. Immunoblot analysis of SH-SY5Y
cells transfected with pcDNA3 (V1) and N1-EGFP (V2) vectors, Gαo and GαoCA (Go and GoCA, respectively), wild-
type and S655 phosphomutant APP-GFP (Wt, SA, SE) cDNAs, or co-transfected with APP-GFP fusion cDNAs and Gαo
or GαoCA: Go + Wt, SA or SE: Gαo and Wt, S655A or S655E co-transfected cells; GoCA + Wt, SA or SE: cells co-
transfected with GαoCA and Wt, S655A or S655E. Upper panel: 6h of cDNAs transfection; lower panel: 24h of cDNAs
transfection. Tubulin detected by anti-β-Tubulin antibody.
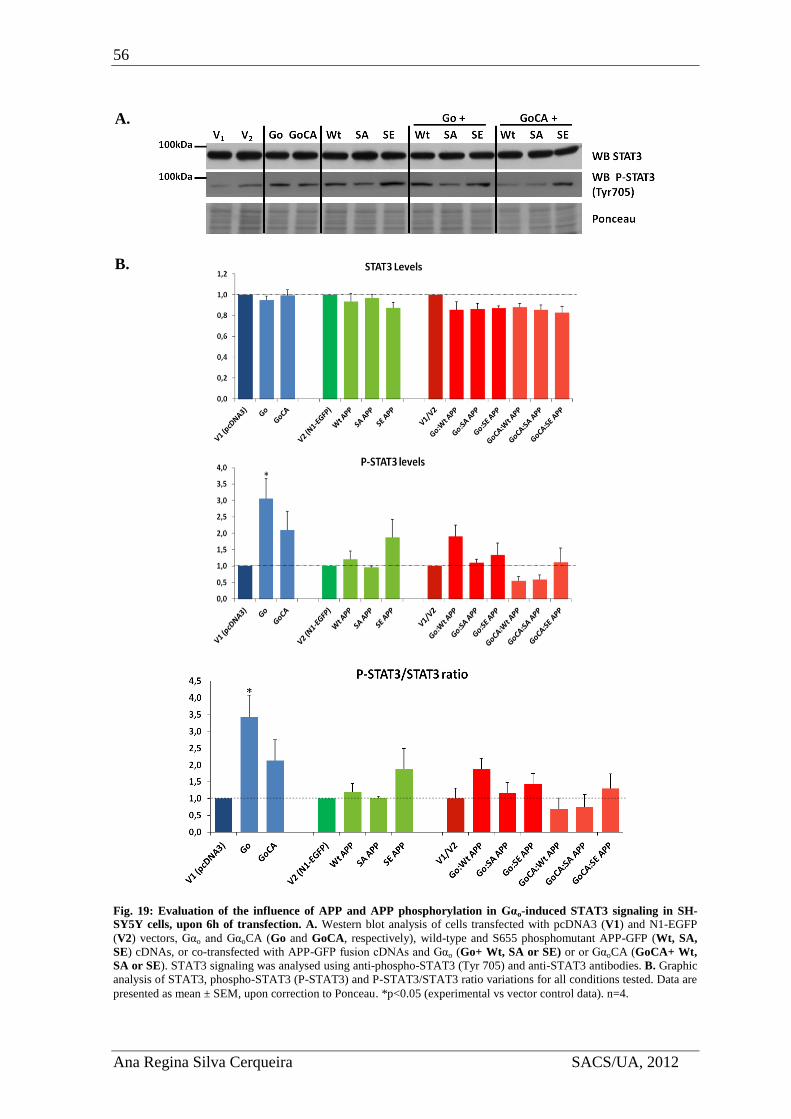
56
Ana Regina Silva Cerqueira SACS/UA, 2012
Fig. 19: Evaluation of the influence of APP and APP phosphorylation in Gαo-induced STAT3 signaling in SH-
SY5Y cells, upon 6h of transfection. A. Western blot analysis of cells transfected with pcDNA3 (V1) and N1-EGFP
(V2) vectors, Gαo and GαoCA (Go and GoCA, respectively), wild-type and S655 phosphomutant APP-GFP (Wt, SA,
SE) cDNAs, or co-transfected with APP-GFP fusion cDNAs and Gαo (Go+ Wt, SA or SE) or or GαoCA (GoCA+ Wt,
SA or SE). STAT3 signaling was analysed using anti-phospho-STAT3 (Tyr 705) and anti-STAT3 antibodies. B. Graphic
analysis of STAT3, phospho-STAT3 (P-STAT3) and P-STAT3/STAT3 ratio variations for all conditions tested. Data are
presented as mean ± SEM, upon correction to Ponceau. *p<0.05 (experimental vs vector control data). n=4.
A.
B.
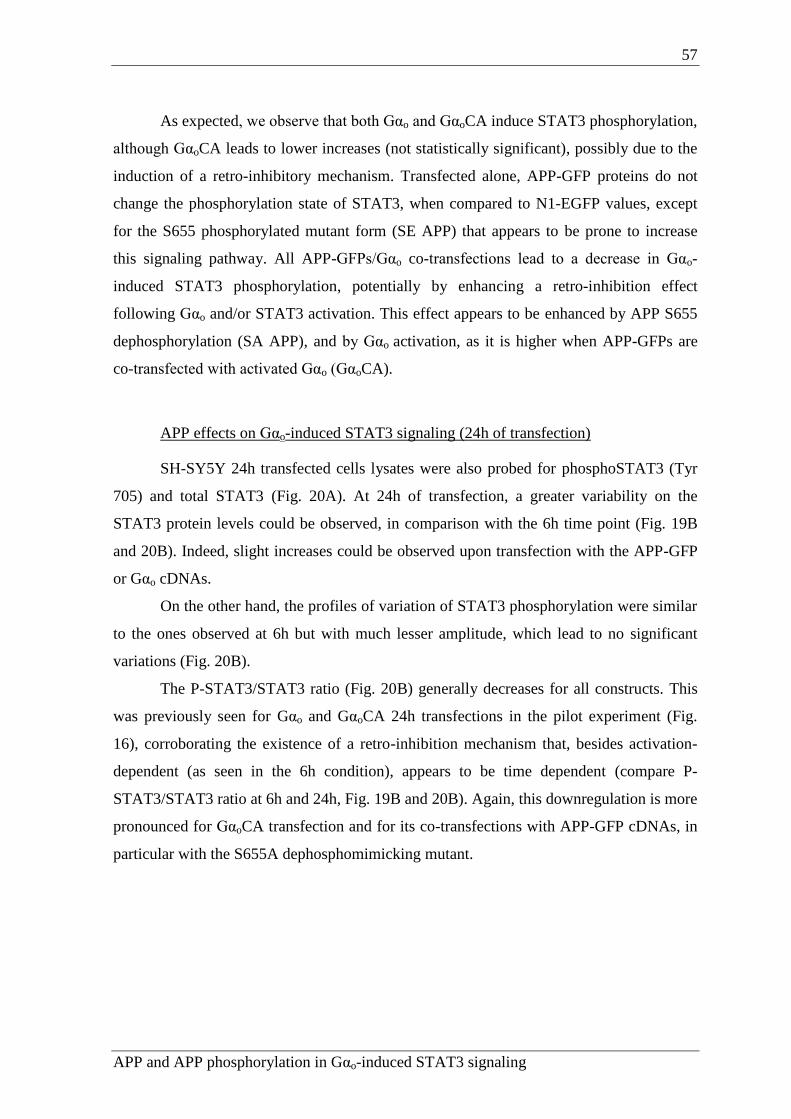
57
APP and APP phosphorylation in Gαo-induced STAT3 signaling
As expected, we observe that both Gαo and GαoCA induce STAT3 phosphorylation,
although GαoCA leads to lower increases (not statistically significant), possibly due to the
induction of a retro-inhibitory mechanism. Transfected alone, APP-GFP proteins do not
change the phosphorylation state of STAT3, when compared to N1-EGFP values, except
for the S655 phosphorylated mutant form (SE APP) that appears to be prone to increase
this signaling pathway. All APP-GFPs/Gαo co-transfections lead to a decrease in Gαo-
induced STAT3 phosphorylation, potentially by enhancing a retro-inhibition effect
following Gαo and/or STAT3 activation. This effect appears to be enhanced by APP S655
dephosphorylation (SA APP), and by Gαo activation, as it is higher when APP-GFPs are
co-transfected with activated Gαo (GαoCA).
APP effects on Gαo-induced STAT3 signaling (24h of transfection)
SH-SY5Y 24h transfected cells lysates were also probed for phosphoSTAT3 (Tyr
705) and total STAT3 (Fig. 20A). At 24h of transfection, a greater variability on the
STAT3 protein levels could be observed, in comparison with the 6h time point (Fig. 19B
and 20B). Indeed, slight increases could be observed upon transfection with the APP-GFP
or Gαo cDNAs.
On the other hand, the profiles of variation of STAT3 phosphorylation were similar
to the ones observed at 6h but with much lesser amplitude, which lead to no significant
variations (Fig. 20B).
The P-STAT3/STAT3 ratio (Fig. 20B) generally decreases for all constructs. This
was previously seen for Gαo and GαoCA 24h transfections in the pilot experiment (Fig.
16), corroborating the existence of a retro-inhibition mechanism that, besides activation-
dependent (as seen in the 6h condition), appears to be time dependent (compare P-
STAT3/STAT3 ratio at 6h and 24h, Fig. 19B and 20B). Again, this downregulation is more
pronounced for GαoCA transfection and for its co-transfections with APP-GFP cDNAs, in
particular with the S655A dephosphomimicking mutant.

58
Ana Regina Silva Cerqueira SACS/UA, 2012
Fig. 20: Evaluation of the influence of APP and APP phosphorylation in Gαo-induced STAT3 signaling in SH-
SY5Y cells, upon 24h of transfection. A. Western blot analysis of cells transfected with pcDNA3 (V1) and N1-EGFP
(V2) vectors, Gαo and GαoCA (Go and GoCA, respectively), wild-type and S655 phosphomutant APP-GFP (Wt, SA,
SE) cDNAs, or co-transfected with APP-GFP fusion cDNAs and Gαo (Go+ Wt, SA or SE) or or GαoCA (GoCA+ Wt,
SA or SE). STAT3 signaling was analysed using anti-phospho-STAT3 (Tyr 705) and anti-STAT3 antibodies. B. Graphic
analysis of STAT3, phospho-STAT3 (P-STAT3) and P-STAT3/STAT3 ratio variations for all conditions tested. Data are
presented as mean ± SEM, upon correction to Ponceau; n=4.
A.
B.

59
APP and APP phosphorylation in Gαo-induced STAT3 signaling
4.3.2. Effect of APP overexpression in Gαo levels
During the previous analysis of the STAT3 signaling activation, we have noticed
that APP overexpression was having an effect on Gαo levels, what could also partially
relate with a STAT3 retro-inhibition mechanism. To analyse this, first the levels of
endogenous and transfect Gαo were quantified in all experimental conditions. The effect of
APP-GFP expression on endogenous Gαo levels was determined by comparing Gαo levels
in transfected APP-GFP samples versus N1-EGFP (V2) samples. Variations in exogenous
Gαo levels were obtained by analysing Gαo levels in APP-GFP/Gαo and APP-GFP/GαoCA
co-transfections, in comparison with Gαo and GαoCA samples, respectively (Fig. 21).
Fig. 21: Analysis of endogenous and exogenous Go levels with APP-GFPs tranfection and co-transfection,
respectively, at 6h and 24h. Immunoblot analysis of SH-SY5Y cells transfected with pcDNA3 (V1) and N1-EGFP (V2)
vectors, Gαo and GαoCA (Go and GoCA, respectively), wild-type and S655 phosphomutant APP-GFP (Wt, SA, SE)
cDNAs, or co-transfected with APP-GFP fusion cDNAs and Gαo or GαoCA: Go + Wt, SA or SE: Gαo and Wt, S655A or
S655E co-transfected cells; GoCA + Wt, SA or SE: cells co-transfected with GαoCA and Wt, S655A or S655E. Gαo
levels were analysed by using a rabbit anti-Gαo antibody at 6h (upper panel) and 24h (lower panel) of transfection.

60
Ana Regina Silva Cerqueira SACS/UA, 2012
At 6h and 24h, endogenous Gαo levels decreased with APP-GFPs transfection in
comparison to the N1-EGFP vector, except for S655E APP that only appears to have this
type of effect at 24h (Fig. 21 and 22). Wt and S655A APP-GFP transfection decrease the
Gαo levels by ~50% and ~40%, respectively, upon 6h of transfection, and S655A even
decreases Gαo levels by ~65% at 24h.
When analysing the exogenous Gαo/GαoCA levels (Fig. 23), much smaller
decreases could be observed, perhaps due to the strong promoter of Gαo plasmids and their
good transfection rates. Indeed, only a small decrease in Gαo levels with APP co-
transfection can be observed at 6h, but this effect increases with time, being more apparent
upon 24h of transfection (Fig. 23). The same occurs with APP/GαoCA co-transfections,
although more pronounced than for APP/Gαo co-transfections, and again slightly
increasing with time, supporting that this negative effect of APP on Gαo levels is time and,
specially, Gαo activation-dependent.
S655 phosphorylated APP (SE APP) decrease exogenous levels of Gαo again only
at 24h. This downregulation effect of S655E APP on exogenous Gαo levels occurs already
at 6h for GαoCA, potentially due to Gαo activation.
Fig. 22: Protein expression profiles of endogenous Gαo levels with APP-GFPs 6h and 24h of tranfection. N1-
EGFP: vector N1-EGFP transfected cells; Wt, SA, SE: cells transfected with Wt, S655A and S655E APP-GFP cDNAs,
respectively. Data are presented as mean±SEM, upon correction to Ponceau. *p<0.05, **p<0.01. n=4.

61
APP and APP phosphorylation in Gαo-induced STAT3 signaling
4.3.3. Effect of Gαo overexpression in APP levels
To evaluate the effect of Gαo overexpression in APP, endogenous APP levels were
quantified in Gαo and GαoCA transfection samples and compared to pcDNA3 (V1)
samples. The analysis of exogenous APP levels was obtained by quantification of the
levels of total APP, or APP-GFP alone, in APP-GFP/Gαo and APP-GFP/GαoCA co-
transfection samples, and their comparison to the corresponding APP-GFP sample (Fig.
24).
Fig. 23: Fold-increase of exogenous Go and GoCA protein expression levels with APP-GFPs co-tranfection at 6h
and 24h. Upper panel: Exogenous Gαo levels at 6h and 24h of transfection. Lower panel: Exogenous GαoCA levels at 6h
and 24h of transfection. Go and GoCA: cells transfected with Gαo and GαoCA cDNA, respectively; Go:Wt, SA or SE:
Gαo and Wt, SA or SE co-transfected cells; GoCA:Wt, SA or SE: cells co-transfected with GαoCA and Wt, SA or SE.
Data are presented as mean±SEM, upon correction to Ponceau *p<0.05, **p<0.01. n=4.
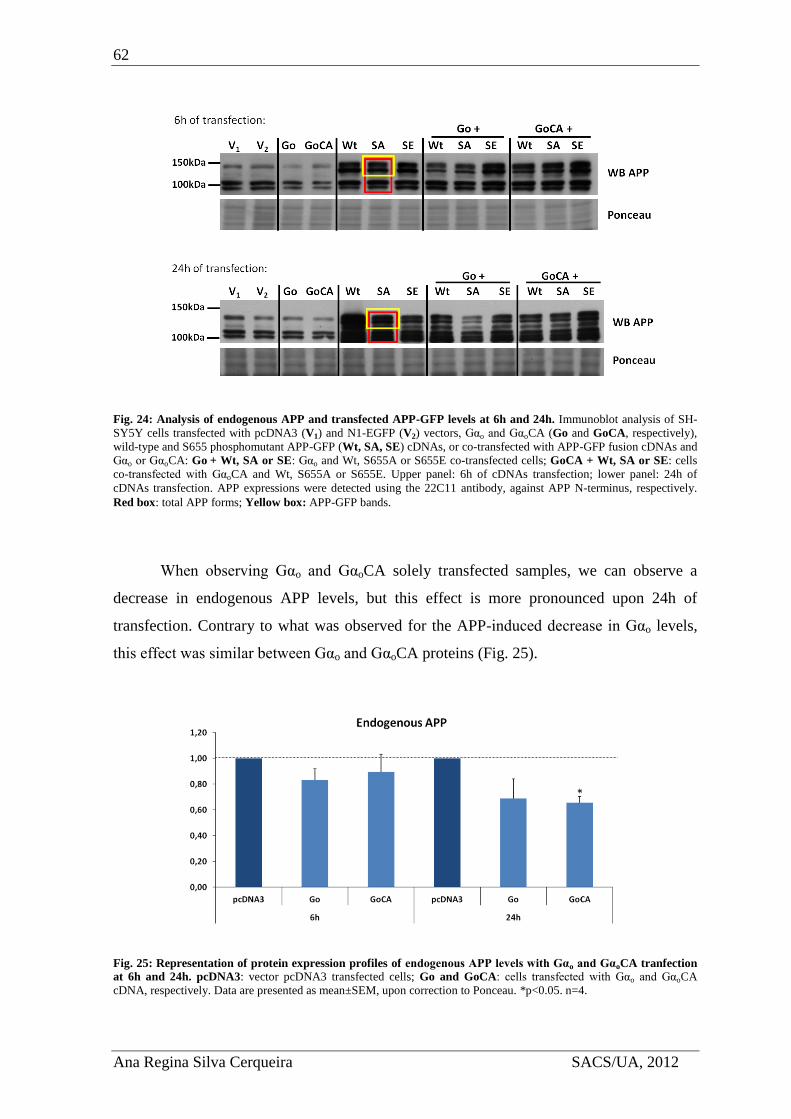
62
Ana Regina Silva Cerqueira SACS/UA, 2012
Fig. 24: Analysis of endogenous APP and transfected APP-GFP levels at 6h and 24h. Immunoblot analysis of SH-
SY5Y cells transfected with pcDNA3 (V1) and N1-EGFP (V2) vectors, Gαo and GαoCA (Go and GoCA, respectively),
wild-type and S655 phosphomutant APP-GFP (Wt, SA, SE) cDNAs, or co-transfected with APP-GFP fusion cDNAs and
Gαo or GαoCA: Go + Wt, SA or SE: Gαo and Wt, S655A or S655E co-transfected cells; GoCA + Wt, SA or SE: cells
co-transfected with GαoCA and Wt, S655A or S655E. Upper panel: 6h of cDNAs transfection; lower panel: 24h of
cDNAs transfection. APP expressions were detected using the 22C11 antibody, against APP N-terminus, respectively.
Red box: total APP forms; Yellow box: APP-GFP bands.
When observing Gαo and GαoCA solely transfected samples, we can observe a
decrease in endogenous APP levels, but this effect is more pronounced upon 24h of
transfection. Contrary to what was observed for the APP-induced decrease in Gαo levels,
this effect was similar between Gαo and GαoCA proteins (Fig. 25).
Fig. 25: Representation of protein expression profiles of endogenous APP levels with Gαo and GαoCA tranfection
at 6h and 24h. pcDNA3: vector pcDNA3 transfected cells; Go and GoCA: cells transfected with Gαo and GαoCA
cDNA, respectively. Data are presented as mean±SEM, upon correction to Ponceau. *p<0.05. n=4.

63
APP and APP phosphorylation in Gαo-induced STAT3 signaling
Relatively to APP-GFP and Gαo and GαoCA co-transfections, these invariably lead
to a decrease in exogenous total APP and APP-GFP levels, which in general follow the
same variation profiles (Fig. 26). At 6h, either Gαo or GαoCA decrease both Wt and SA
APP-GFPs levels, an effect that is more pronounced following 24h of transfection. This
time-dependent effect is also observed for the S655E mutant, but Gαo is less able to
diminish its levels at 6h of transfection (Fig. 26).
Fig. 26: Fold-increase of total APP and APP-GFP protein expression with Gαo and GαoCA co-tranfection at 6h
and 24h. Upper panel: APP-GFP fold-increase with Gαo and GαoCA co-transfection. Lower panel: Total APP fold-
increase with Gαo and GαoCA co-transfection. Go:Wt, SA or SE: Gαo and Wt, SA or SE co-transfected cells;
GoCA:Wt, SA or SE: cells co-transfected with GαoCA and Wt, SA or SE. Data are expressed as mean±SEM, upon
correction to Ponceau. *p<0.05, **p<0.01, ***p<0.001. n=4.

64
Ana Regina Silva Cerqueira SACS/UA, 2012
In synthesis, Gαo decreases APP levels, what may occur by directly or indirectly
intervene in APP cleavage or in APP degradation. To analyse if Gαo decreases APP levels
by increasing its cleavage to sAPP, the conditioned medium collected for each condition
was analysed by Western blotting. The analysis of 6h (data not shown) and 24h medium
Western blots (Fig. 27) revealed that sAPP levels do not increase with Gαo and GαoCA
overexpression. In fact, APP-GFPs/GαoCA co-transfection seems to even decrease sAPP
levels. Therefore, Gαo does not decrease APP levels by increasing APP cleavage but
potentially by increasing APP degradation.
4.4. Visual analysis of cellular APP/Gαo levels
In order to visualize endogenous Gαo and APP levels in SH-SY5Y cells, and
compare their cellular distribution, immunocytochemistry was performed in non-
transfected cells fixed upon 6h and 24h of medium substitution. Fluorescence microscopy
was further carried out using a Confocal microscope, and cells were randomly selected for
analysis (Fig. 28). Very interestingly, both the 6h and 24h images demonstrate that cells
with high APP content (mainly visible at the Golgi) have low Gαo levels and cells with
high Gαo levels show medium APP levels. This result is completely consistent with the
previous Western blot data. Of note, endogenous Gαo and APP appear to colocalize at the
plasma membrane (when Gαo levels are higher) and at cytoplasmic vesicles, when Gαo
levels are lower.
Fig. 27: Qualitative analysis of sAPP levels from the conditioned medium collected at 24h of transfection. Immunoblot analysis of medium from SH-SY5Y cells transfected with pcDNA3 (V1) and N1-EGFP (V2) vectors, Gαo
and GαoCA (Go and GoCA, respectively), wild-type and S655 phosphomutant APP-GFP (Wt, SA, SE) cDNAs, or co-
transfected with APP-GFP fusion cDNAs and Gαo or GαoCA: Go + Wt, SA or SE: Gαo and Wt, S655A or S655E co-
transfected cells; GoCA + Wt, SA or SE: cells co-transfected with GαoCA and Wt, S655A or S655E. Evaluation of
sAPP levels was performed using 22C11 antibody.

65
APP and APP phosphorylation in Gαo-induced STAT3 signaling
Fig. 28: Evaluation of endogenous APP and Gαo levels in SH-SY5Y non-transfected cells at 6h and 24h, by
immunocytochemistry procedures. APP and Gαo cellular distribution was visualized using the 22C11 antibody and
Alexa Fluor 488, and anti-Gαo antibody and Texas-Red, respectively. Coverslips was mounted on microscope glass slides
with DAPI, to delimitate the nucleus of cells. Microphotographs represent non-transfected cells, plated in parallel with
the transfected, and fixed at 6h (A.) and 24h (B.) since medium substitution.
A.
B.

66
Ana Regina Silva Cerqueira SACS/UA, 2012
4.5. Analysis of APP-Gαo binding
The effect of Gαo activation and APP S655 phosphorylation in APP-Gαo binding
was analysed by using GFP-trap® to precipitate GFP fusion proteins. SH-SY5Y cells were
plated at 70-80% confluence and, after 24h, co-transfected with: i) EGFP-N1 vector and
Gαo cDNA (N1:Go; control); ii) wild-type APP-GFP and Gαo cDNAs (Go:Wt), to evaluate
if Gαo binds to APP; iii) wild-type APP-GFP and GαoCA cDNAs (CA:Wt), to test if Gαo
activation alters binding; iv) phosphorylated APP, SE, and Gαo cDNAs (Go:SE), to analyse
if the phosphorylated state of APP alters APP-Gαo binding.
After 6h of transfection, cells were collected to proceed with the pull-down assay.
Afterwards, the precipitates, lysates and supernatants were separated by Western blot, and
blots probed with the APP C-terminal antibody CT695, for APP and APP-GFP detection,
and the polyclonal anti-Gαo antibody (Fig. 29).
APP-GFP (bands a, b) were detected in all Go:Wt and Go:SE lysates and
precipitated samples, being excluded from the N1:Go co-transfection, as expected, and
from supernatants, the later indicating that all APP-GFP were completely pulled-down and
cleared from these samples. Of note, in lysates and supernatants we could detect
endogenous APP in all conditions, but not in pulled-down samples, as expected.
Unfortunately, Gαo expression was only verified in lysates and supernatants, while in the
pulled-down samples no Gαo signal was detected.
Fig. 29: Evaluation of APP-Gαo binding with Gαo activation and APP S655 phosphorylation. Western blot analysis
of SH-SY5Y cells co-transfected and submitted to GFP pull-down assays. Confirmation of APP expression with antibody
CT695 against APP C-terminal, which detected: a) APP-GFP 695 mature; b) APP-GFP 695 immature forms; c)
endogenous APP 751/770 mature; d) and e) endogenous APP 751/770 and 695 immature forms, respectively. Analysis of
Gαo and GαoCA cDNA transfection was performed using an anti-Gαo antibody. N1:Go: vector EGFP-N1 and Go cDNA
co-transfected cells; Go:Wt: cells co-transfected with Gαo and wild-type APP-GFP cDNA; CA:Wt: cells co-transfected
with GαoCA and wild-type APP-GFP cDNA; Go:SE: Go and SE APP-GFP (phosphorylated APP) cDNAs co-transfected
cells.

67
APP and APP phosphorylation in Gαo-induced STAT3 signaling
5. Discussion
Gαo was described to induce neurite outgrowth via activation of two signaling
cascades, the STAT3 and GRIN pathways (He, Gomes et al., 2005; Nakata and Kozasa,
2005). APP binds to Gαo but the role of APP in these pathways was never evaluated (Fig.
30). Nevertheless, APP and sAPP have been shown to modulate neuritogenesis in a
complex and well-ordered manner, with APP phosphorylation at S655 enhancing its
neuritogenic effect (Rocha, 2011). A potential functional co-interaction between APP and
Gαo in neuritogenic signaling is therefore especially appealing and worth investigating.
Therefore, in the present work we addressed the role of APP and APP S655
phosphorylation in Gαo-induced STAT3 signaling, and we have also evaluated the effects
that APP and Gαo promote in each other metabolism.
From our first preliminary experiment we have concluded that the TurbofectTM
reagent method was the more appropriate for Gαo and GαoCA cDNAs transfection in SH-
Fig. 30: Gαo-induced neurite outgrowth through both GRIN1 and STAT3 signaling cascades. Overexpression of
Gαo leads to GRIN1 and Rap1GAP activation, which in turn trigger cascades that promote neuritogenesis. Both of these
proteins activate downstream signaling that activates Cdc42 and leads to STAT3 phosphorylation, respectively. The role
of APP in Gαo-induced neurite outgrowth by these two pathways is not yet known. Adapted from reference (He, Gomes
et al., 2005)

68
Ana Regina Silva Cerqueira SACS/UA, 2012
SY5Y cells, when compared to Polyplus and TurbofectTM
plus CombiMag methods. The
Polyplus rendered less transfection rates and, as expectedly, the combination of a magnetic
particle, CombiMag, with the TurbofectTM
transfection reagent enhanced the deliver
efficiency for all Gαo cDNAs. However, due to the method in itself or to the higher
amounts of Gαo expression, this combined method is associated with an increase in cell
death, proving to be cytotoxic (Fig. 15).
Following, we tested the effect of Gαo and GαoCA overexpression in STAT3
signaling with time (2h, 4h, 6h, 8h and 24h). Gαo and GαoCA transfections could be
observed mainly from 6h on, and alterations in STAT3 phosphorylation state were more
significant at 6h and 24h, the time points chosen for the subsequent experiments (Fig. 16).
At 6h, Gαo was able to induce STAT3 phosphorylation but, upon 24h of transfection, P-
STAT3 levels decreased below pcDNA3 vector ones, evidencing a retro-inhibition
mechanism of this pathway. This negative mechanism appeared to be strongly dependent
on Gαo activation, since P-STAT3 was always found inhibited in GαoCA transfected cells,
at all time points analysed. This is consistent with data on the literature evidencing not only
a transiently STAT activation, but also suggesting the existence of an efficient negative
feedback mechanism. Indeed, in normal cells, and under physiological conditions, STAT3
activation, mediated by phosphorylation at the Tyr705 residue, is a tightly controlled
transient process. While some authors indicate that it lasts from 30 minutes to few hours
(Debnath, Xu et al., 2012), other authors advocate cytokines-mediated STAT3
phosphorylation generally peaks 15 to 30 minutes following stimulation, further declining
to baseline levels over one to two hours (Walker, Chaudhury et al., 2011). Either way, the
residence time of the STAT3 active state is very quick, justifying the declining levels of P-
STAT3 that we observed in our experimental conditions, especially for the activated
GαoCA construct. This retro-inhibitory mechanism is believed to be partially due to a
negative feedback from STAT3-target genes. Actually, in order to tightly control
transcription of key STAT3-target genes, many STAT3 target genes are themselves
negative regulators of STAT activation (Walker, Chaudhury et al., 2011).
Subsequently, we evaluated the effects of APP overexpression in Gαo-induced
STAT3 signaling and the role played by APP S655 phosphorylation in that regulation. For
that, SH-SY5Y cells were transfected with the vectors pcDNA3 and N1-EGFP, Wt, SA
and SE APP-GFPs, Gαo and GαoCA cDNAs, or co-transfected with the APP-GFP and Gαo

69
APP and APP phosphorylation in Gαo-induced STAT3 signaling
cDNAs. As in pilot experiment, at 6h we could observe a stimulation of STAT3
phosphorylation, not only for Gαo but also for GαoCA (Fig. 19), probably resulting from
the lower GαoCA transfection levels (compare Fig. 16 and Fig. 19). Activated Gαo was
reported to enhance STAT3 levels (Ram, Horvath et al., 2000) and the lower increases in
P-STAT3 levels that we observed for GαoCA in our experimental conditions appears to
result from the previously observed retro-inhibition mechanism.
Regarding the APP-GFPs proteins alone, these did not alter the phosphorylation of
STAT3 except for the phosphomimicking S655E mutant, which slightly increases this
signaling pathway relative to N1-EGFP values. This may potentially occur via secreted
sAPP, since S655 phosphorylation increases sAPP production (Vieira, Rebelo et al., 2009)
and sAPP was observed to potentially activate STAT3 (Kwak, Dantuma et al., 2010).
S655E-induction of STAT3 may also occur via Gαo. Indeed, as already mentioned, other
major protein found in axonal growth cones is the Gαo-binding protein GAP-43, whose
expression is up-regulated by APP (Strittmatter, Valenzuela et al., 1990; Mucke, Masliah
et al., 1994). The findings that GAP-43 acts as a GEF for Gαo protein suggests a potentially
role for this protein in mediating phospho S655 APP-induced STAT3 activation.
Unexpectedly, all APP-GFPs/Gαo co-transfections decreased the Gαo-induced
STAT3 phosphorylation, and we were not able to observe an initial positive effect of APP
on Gαo-induced STAT3 activation. These negative effects could result from the
enhancement of the previously observed retro-inhibition effect, which appears occur after
Gαo and/or STAT3 activation, and may also involve Gαo downregulation. Apparently,
this(ese) retro-inhibition effect(s) occurs after Gαo and/or STAT3 activation. Indeed, APP-
GFPs/GαoCA co-transfection led to a higher retro-inhibition effect, together with APP
S655 dephosphorylation (mimicked by the SA APP mutant). Consistent results are shown
at 24h (Fig. 20), where a general decrease in the P-STAT3/STAT3 ratio was detected for
all Gαo/GαoCA and APP-GFP transfections and co-transfections, supporting that this retro-
inhibition mechanism is also time dependent. Again, GαoCA transfection and its co-
transfection with APP-GFP cDNAs, especially with the S655A phosphomutant, resulted in
negative effects on STAT3 phosphorylation levels.
In synthesis, at 6h and 24h, with different transfection conditions, we could observe
a retro-inhibition mechanism in STAT3 signaling, that appears to be strongly Gαo
activation-dependent (as seen in the 6h and 24h conditions), but also time-dependent (as

70
Ana Regina Silva Cerqueira SACS/UA, 2012
seen in the 24h condition, when compared to the 6h). In addition, mimicking S655
dephosphorylation through the use of the S655A mutant increases this effect, suggesting
that APP S655 phosphorylation deviates APP from its negative role on Gαo–induced
STAT3 activation.
Further and somewhat expected, in all these transfection and co-transfection
conditions tested, β-tubulin levels also showed alterations, which discarded its use as a
loading control. The alterations of β-tubulin levels with APP-GFP and Gαo transfections
are a response against the cellular morphological changes that are induced by these
potentially neuritogenic proteins. In fact, our group had already reported differences on β-
tubulin levels with cellular differentiation and Wt APP-GFP transfection, suggesting that
β-tubulin can even be used as a differentiation cytoskeleton-related marker (Rocha, 2011).
Ponceau S staining of proteins bands is widely used (Romero-Calvo, Ocon et al., 2010)
and proved to be a good loading control to use in these transfection and co-transfection
conditions.
We have further observed that increasing APP expression affected the intracellular
levels of Gαo, what could also partially relate APP with its previously observed Gαo-related
STAT3 retro-inhibition mechanism. APP-GFPs overexpression decreased endogenous Gαo
levels to approximately half of their levels relative to control conditions, at 6h and 24h of
transfection (Fig. 22). However, S655E APP-GFP only decreased Gαo levels upon 24h of
transfection. Again, APP-induced Gαo downregulation is a time-, APP S655A
dephosphorylated- and Gαo–activated dependent effect, suggesting a partial correlation
between this effect and the observed APP-induced STAT3 retro-inhibition (Fig. 19 and
20). APP-GFP could also decrease exogenous Gαo and GαoCA levels, upon their co-
transfection (Fig. 23). These decreases were smaller than for the endogenous levels
possibly due to the strong promoter of Gαo plasmids and their good transfection rates.
Again, higher decreases could be observed upon 24h of transfection, when compared to the
6h period, and especially for the Gαo activated mutant, confirming its time- and activation-
dependency. Moreover, this was especially true for the phosphomimicking S655E mutant,
which a much more delayed effect on Gαo downregulation.
In conclusion, both endogenous and exogenous Gαo levels are diminished with APP
overexpression. So, APP appears to participate in a Gαo inactivation mechanism,
potentially by targeting Gαo for degradation. Since both APP-induced negative effects on

71
APP and APP phosphorylation in Gαo-induced STAT3 signaling
P-STAT3 and Gαo levels are time-, APP S655A dephosphorylated- and Gαo–activated
dependent, they are potentially interrelated, with APP decreasing Gαo–induced STAT3
activation through Gαo downregulation.
In other hand, Gαo overexpression also had a similar effect on the APP levels,
suggesting that both proteins are co-degraded to some extent. Gαo and GαoCA transfected
cells were associated with slight decreases in endogenous APP levels, an effect also time-
dependent, being more pronounced upon 24h of transfection (Fig. 25). The same results
were obtained from APP-GFPs/Gαo and GαoCA co-transfection cells, which presented
decreases in exogenous APP-GFP levels. Again, this effect is mainly time-dependent for
the S655E phosphomimicking mutant, with its levels only significantly decreasing at 24h,
for both the Gαo and GαoCA constructs. Nonetheless, Gαo and GαoCA co-transfections
lead to similar decreases in APP-GFP and total APP levels, with APP downregulation
being independent of a previous Gαo activation. This indicates that a previous APP-Gαo
interaction and activation step is upstream APP-induction of a decrease in Gαo levels.
The later results indicate that Gαo decreases the APP half-life, with this decrease
potentially occurring via interference on APP synthesis, cleavage or degradation. Since it
has higher effects on exogenous APP proteins, Gαo appears to directly or indirectly
intervene in APP cleavage or in APP degradation, rather than in its transcription rate. Our
subsequent results strengthen the hypothesis of Gαo-induced APP degradation, since the
medium secreted sAPP data revealed that neither Gαo or GαoCA overexpression increase
APP proteolysis to sAPP (Fig. 27). Moreover, APP-GFPs/GαoCA co-transfection seems to
even decrease sAPP levels, in accordance with an APP/Gαo co-degradation hypothesis.
The fact that Gαo is less able to decrease the levels of S655 phosphorylated APP (S655E)
and vice-versa, together with the knowledge that the dephospho S655A mutant is
preferentially targeted for lysosomal degradation (Vieira, Rebelo et al., 2010) suggests that
the APP downregulation mechanism observed is APP/Gαo lysosomal co-degradation.
Remarkably, visualization of SH-SY5Y non-transfected cells fluorescence
microphotographs (Fig. 28) revealed that cells with high APP levels express low Gαo
levels, while cells with high Gαo levels show invariably medium or low APP levels. These
results are completely consistent with our previous Western blot data and with unpublished
data of our laboratory. Regarding cellular distribution, endogenous Gαo and APP appear to
colocalize at the plasma membrane (when Gαo levels are higher) and at cytoplasmic

72
Ana Regina Silva Cerqueira SACS/UA, 2012
vesicles when Gαo levels are lower. Together with the fact that cells with high levels of
APP have its localization mainly at its ‘cellular reservoir’ - the Golgi, make these locations
a strongly support for APP/Gαo lysosomal co-degradation hypothesis.
Finally, we evaluated if APP-Gαo binding is affected by Gαo activation and APP
S655 phosphorylation, by using GFP-trap® to precipitate the APP-GFP fusion proteins.
Unfortunately, we cannot conclude anything regarding APP-Gαo binding, since no Gαo
could be pulled-down with the APP-GFP proteins, under the conditions tested. These
results raise a question of whether N-terminally fused GFP decreases the APP-Gαo binding
strength, or if this binding is so fast that it is difficult to observe. Future experiments will
involve e.g. immunoprecipitation of non GFP-fused Wt, S655A, and S655E cDNAs.
6. Conclusion
The experiments performed in this work indicate that APP-GFP and Gαo/GαoCA
co-transfected SH-SY5Y cells suffer a decrease in Gαo-induced STAT3 signaling, possibly
via a retro-inhibition effect on the STAT3 pathways, at the Gαo and STAT3 levels. This
negative effect is enhanced by Gαo activation, APP S655 dephosphorylation, and by time
of transfection (in particular for the phosphomimicking S655E mutant). From our data we
proved that a downregulation of Gαo levels indeed occurs downstream APP (potentially
after their interaction and subsequent Gαo activation) and, consistently, SH-SY5Y cells
with high APP levels were observed to possess low Gαo levels. In fact, APP-GFP
overexpression led to a decrease in endogenous and exogenous Gαo levels and, by its turn,
Gαo overexpression decreased APP levels. These effects seem also to be time-dependent
and Gαo-activation dependent. Moreover, sAPP levels did not increase with APP/Gαo co-
transfection, suggesting that Gαo enhances APP degradation, and that APP-Gαo co-
degradation is part of the mechanism by which APP inhibits Gαo-induced STAT3
activation. APP S655 phosphorylation delays this inactivation phase and/or the first
activation phase, and this remains to be analysed. Figure 31 summarizes the pathways and
the hypothesis that we take from these experiments.

73
APP and APP phosphorylation in Gαo-induced STAT3 signaling
Future experiments will comprehend the detection of a first, fast, APP-Gαo-induced
STAT3 activation phase, the characterization of the inhibitory mechanism induced by APP
on this pathway, and the recording and characterization of APP-Gαo binding by alternative
methods.
Fig. 31: Schematic model hypothesizing how APP regulates Gαo/STAT3 signaling pathways. Right to left: JAKs
bind to tyrosine kinase (TK), growth factor or cytokine receptors. The binding of the ligand to the receptor triggers
activation of JAKs, increasing its kinase activity. They phosphorylate the receptor cytoplasmatic domain on
tyrosine residues and create sites for STATs interaction. STAT3 recognize specific receptor phosphotyrosine residues and
become tyrosine phosphorylated by JAKs. The phosphorylation of STAT3 at Tyr705 by receptor-associated Janus
kinases allows homo- or heterodimerization of STAT3 transcription factors and subsequent translocation to the nucleus,
activating transcription of their target genes. In order to tightly control transcription of key STAT3-target genes, many
STAT3 target genes are themselves negative regulators of STAT activation. APP S655 phosphorylation increases Tyr705
phosphorylation of STAT3, potentially by increasing secreted sAPP levels, indirectly activating JAK/STAT signaling. Go-coupled receptor, when stimulated by a ligand, activates Go subunits. The activated α-subunit reduces the stability of
Rap1-GAP, which results in the activation of Rap1 and, subsequently Src and STAT3 activation that mediate gene
expression. The Src activation also stimulates the small GTPase Rac1 and then c-Jun N-terminal kinase (JNK). Gαo
overexpression also leads to GRIN1 activation and, consequently the activation of another small GTPase Cdc42; this,
together with Rac1, regulates actin cytoskeleton remodelling that helps neuritogenesis. The role of APP in Gαo-induced
STAT3 activation is not yet known. GAP-43 has the ability to enhance Gαo activation, acting as a GEF. Indirectly,
phospho S655 APP may potentially increase GAP-43 levels by increasing GAP-43 phosphorylation and thus decreasing
its cleavage by calpain. Directly, APP-Gαo interaction leads first to Gαo activation (and subsequent signaling cascades
activation), and second to APP-Gαo lysosomal co-degradation, in a mechanism that is overall enhanced by APP S655
dephosphorylation.

74
Ana Regina Silva Cerqueira SACS/UA, 2012

75
APP and APP phosphorylation in Gαo-induced STAT3 signaling
7. References
Aberg, M. A., Ryttsen, F., Hellgren, G., Lindell, K., Rosengren, L. E., MacLennan, A. J.,
Carlsson, B., Orwar, O. and Eriksson, P. S. (2001). "Selective introduction of antisense
oligonucleotides into single adult CNS progenitor cells using electroporation demonstrates
the requirement of STAT3 activation for CNTF-induced gliogenesis." Mol Cell Neurosci
17(3): 426-43.
Arakawa, T., Kita, Y. and Niikura, T. (2008). "A rescue factor for Alzheimer's diseases:
discovery, activity, structure, and mechanism." Curr Med Chem 15(21): 2086-98.
Arendt, T. (2001). "Alzheimer's disease as a disorder of mechanisms underlying structural
brain self-organization." Neuroscience 102(4): 723-65.
Bishop, G. M. and Robinson, S. R. (2002). "The amyloid hypothesis: let sleeping dogmas
lie?" Neurobiol Aging 23(6): 1101-5.
Blazer, L. L., Roman, D. L., Chung, A., Larsen, M. J., Greedy, B. M., Husbands, S. M. and
Neubig, R. R. (2010). "Reversible, allosteric small-molecule inhibitors of regulator of G
protein signaling proteins." Mol Pharmacol 78(3): 524-33.
Bojarski, L., Herms, J. and Kuznicki, J. (2008). "Calcium dysregulation in Alzheimer's
disease." Neurochem Int 52(4-5): 621-33.
Bossy-Wetzel, E., Schwarzenbacher, R. and Lipton, S. A. (2004). "Molecular pathways to
neurodegeneration." Nat Med 10 Suppl: S2-9.
Bromberg, K. D., Lyengar, R. and He, J. C. (2011). "Regulation of neurite outgrowth by
Gi/o signaling pathways." Front Biosci 13: 4544-4557.
Brookmeyer, R., Johnson, E., Ziegler-Graham, K. and Arrighi, H. M. (2007). "Forecasting
the global burden of Alzheimer's disease." Alzheimers Dement 3(3): 186-91.
Chiba, T., Nishimoto, I., Aiso, S. and Matsuoka, M. (2007). "Neuroprotection against
neurodegenerative diseases: development of a novel hybrid neuroprotective peptide
Colivelin." Mol Neurobiol 35(1): 55-84.
Chiba, T., Yamada, M. and Aiso, S. (2009). "Targeting the JAK2/STAT3 axis in
Alzheimer's disease." Expert Opin Ther Targets 13(10): 1155-67.
Chiba, T., Yamada, M., Sasabe, J., Terashita, K., Shimoda, M., Matsuoka, M. and Aiso, S.
(2009). "Amyloid-beta causes memory impairment by disturbing the JAK2/STAT3 axis in
hippocampal neurons." Mol Psychiatry 14(2): 206-22.
Cole, S. L. and Vassar, R. (2007). "The Alzheimer's disease beta-secretase enzyme,
BACE1." Mol Neurodegener 2: 22.
Coleman, P., Federoff, H. and Kurlan, R. (2004). "A focus on the synapse for
neuroprotection in Alzheimer disease and other dementias." Neurology 63(7): 1155-62.

76
Ana Regina Silva Cerqueira SACS/UA, 2012
da Cruz e Silva, E. F. and da Cruz e Silva, O. A. (2003). "Protein phosphorylation and APP
metabolism." Neurochem Res 28(10): 1553-61.
da Cruz e Silva, O. A., Fardilha, M., Henriques, A. G., Rebelo, S., Vieira, S. and da Cruz e
Silva, E. F. (2004). "Signal transduction therapeutics: relevance for Alzheimer's disease." J
Mol Neurosci 23(1-2): 123-42.
da Cruz e Silva, O. A., Iverfeldt, K., Oltersdorf, T., Sinha, S., Lieberburg, I.,
Ramabhadran, T. V., Suzuki, T., Sisodia, S. S., Gandy, S. and Greengard, P. (1993).
"Regulated cleavage of Alzheimer beta-amyloid precursor protein in the absence of the
cytoplasmic tail." Neuroscience 57(4): 873-7.
da Cruz e Silva, O. A., Rebelo, S., Vieira, S. I., Gandy, S., da Cruz e Silva, E. F. and
Greengard, P. (2009). "Enhanced generation of Alzheimer's amyloid-beta following
chronic exposure to phorbol ester correlates with differential effects on alpha and epsilon
isozymes of protein kinase C." J Neurochem 108(2): 319-30.
De Strooper, B. and Annaert, W. (2000). "Proteolytic processing and cell biological
functions of the amyloid precursor protein." J Cell Sci 113 ( Pt 11): 1857-70.
Debnath, B., Xu, S. and Neamati, N. (2012). "Small Molecule Inhibitors of Signal
Transducer and Activator of Transcription 3 (Stat3) Protein." J Med Chem.
Diverse-Pierluissi, M. A., Fischer, T., Jordan, J. D., Schiff, M., Ortiz, D. F., Farquhar, M.
G. and De Vries, L. (1999). "Regulators of G protein signaling proteins as determinants of
the rate of desensitization of presynaptic calcium channels." J Biol Chem 274(20): 14490-
4.
Duyckaerts, C., Delatour, B. and Potier, M. C. (2009). "Classification and basic pathology
of Alzheimer disease." Acta Neuropathol 118(1): 5-36.
Evin, G. and Weidemann, A. (2002). "Biogenesis and metabolism of Alzheimer's disease
Abeta amyloid peptides." Peptides 23(7): 1285-97.
American health assistance foundation (January 2012). from
http://www.ahaf.org/alzheimers/about/understanding/brain-with-alzheimers.html.
Giambarella, U., Yamatsuji, T., Okamoto, T., Matsui, T., Ikezu, T., Murayama, Y., Levine,
M. A., Katz, A., Gautam, N. and Nishimoto, I. (1997). "G protein betagamma complex-
mediated apoptosis by familial Alzheimer's disease mutant of APP." EMBO J 16(16):
4897-907.
Gomperts, B. D., Kramer, I. M. and Tatham, P. E. (2009). Signal Transduction.
Experimental genetics group (January 2012). from
http://med.kuleuven.be/legtegg/AD.html.
Gudermann, T., Schoneberg, T. and Schultz, G. (1997). "Functional and structural
complexity of signal transduction via G-protein-coupled receptors." Annu Rev Neurosci
20: 399-427.

77
APP and APP phosphorylation in Gαo-induced STAT3 signaling
Hampel, H., Shen, Y., Walsh, D. M., Aisen, P., Shaw, L. M., Zetterberg, H., Trojanowski,
J. Q. and Blennow, K. (2010). "Biological markers of amyloid beta-related mechanisms in
Alzheimer's disease." Exp Neurol 223(2): 334-46.
He, J. C., Gomes, I., Nguyen, T., Jayaram, G., Ram, P. T., Devi, L. A. and Iyengar, R.
(2005). "The G alpha(o/i)-coupled cannabinoid receptor-mediated neurite outgrowth
involves Rap regulation of Src and Stat3." J Biol Chem 280(39): 33426-34.
Hewavitharana, T. and Wedegaertner, P. B. (2012). "Non-canonical signaling and
localizations of heterotrimeric G proteins." Cell Signal 24(1): 25-34.
Hooijmans, C. R. and Kiliaan, A. J. (2008). "Fatty acids, lipid metabolism and Alzheimer
pathology." Eur J Pharmacol 585(1): 176-96.
Horvath, C. M. (2000). "STAT proteins and transcriptional responses to extracellular
signals." Trends Biochem Sci 25(10): 496-502.
Hurowitz, E. H., Melnyk, J. M., Chen, Y. J., Kouros-Mehr, H., Simon, M. I. and Shizuya,
H. (2000). "Genomic characterization of the human heterotrimeric G protein alpha, beta,
and gamma subunit genes." DNA Res 7(2): 111-20.
Isohara, T., Horiuchi, A., Watanabe, T., Ando, K., Czernik, A. J., Uno, I., Greengard, P.,
Nairn, A. C. and Suzuki, T. (1999). "Phosphorylation of the cytoplasmic domain of
Alzheimer's beta-amyloid precursor protein at Ser655 by a novel protein kinase." Biochem
Biophys Res Commun 258(2): 300-5.
Jiang, M. and Bajpayee, N. S. (2009). "Molecular mechanisms of go signaling."
Neurosignals 17(1): 23-41.
King, G. D. and Scott Turner, R. (2004). "Adaptor protein interactions: modulators of
amyloid precursor protein metabolism and Alzheimer's disease risk?" Exp Neurol 185(2):
208-19.
Knust, E. (2001). "G protein signaling and asymmetric cell division." Cell 107(2): 125-8.
Kong, G. K., Miles, L. A., Crespi, G. A., Morton, C. J., Ng, H. L., Barnham, K. J.,
McKinstry, W. J., Cappai, R. and Parker, M. W. (2008). "Copper binding to the
Alzheimer's disease amyloid precursor protein." Eur Biophys J 37(3): 269-79.
Kumar, S. and Walter, J. (2011). "Phosphorylation of amyloid beta (Abeta) peptides - a
trigger for formation of toxic aggregates in Alzheimer's disease." Aging (Albany NY) 3(8):
803-12.
Kwak, Y. D., Dantuma, E., Merchant, S., Bushnev, S. and Sugaya, K. (2010). "Amyloid-
beta precursor protein induces glial differentiation of neural progenitor cells by activation
of the IL-6/gp130 signaling pathway." Neurotox Res 18(3-4): 328-38.
Lee, K. S., Park, J. H., Lee, S., Lim, H. J., Choi, H. E. and Park, H. Y. (2007). "HB-EGF
induces delayed STAT3 activation via NF-kappaB mediated IL-6 secretion in vascular
smooth muscle cell." Biochim Biophys Acta 1773(11): 1637-44.

78
Ana Regina Silva Cerqueira SACS/UA, 2012
Lee, M. S., Kao, S. C., Lemere, C. A., Xia, W., Tseng, H. C., Zhou, Y., Neve, R.,
Ahlijanian, M. K. and Tsai, L. H. (2003). "APP processing is regulated by cytoplasmic
phosphorylation." J Cell Biol 163(1): 83-95.
Lemere, C. A. and Masliah, E. (2010). "Can Alzheimer disease be prevented by amyloid-
beta immunotherapy?" Nat Rev Neurol 6(2): 108-19.
Lin, L. F. and Luo, H. M. (2011). "Screening of treatment targets for Alzheimer's disease
from the molecular mechanisms of impairment by beta-amyloid aggregation and tau
hyperphosphorylation." Neurosci Bull 27(1): 53-60.
Ling, Y., Morgan, K. and Kalsheker, N. (2003). "Amyloid precursor protein (APP) and the
biology of proteolytic processing: relevance to Alzheimer's disease." Int J Biochem Cell
Biol 35(11): 1505-35.
Lukiw, W. J. and Bazan, N. G. (2000). "Neuroinflammatory signaling upregulation in
Alzheimer's disease." Neurochem Res 25(9-10): 1173-84.
Marotta, C. A., Majocha, R. E. and Tate, B. (1992). "Molecular and cellular biology of
Alzheimer amyloid." J Mol Neurosci 3(3): 111-25.
Merlo, S., Spampinato, S., Canonico, P. L., Copani, A. and Sortino, M. A. (2010).
"Alzheimer's disease: brain expression of a metabolic disorder?" Trends Endocrinol Metab
21(9): 537-44.
Mucke, L., Masliah, E., Johnson, W. B., Ruppe, M. D., Alford, M., Rockenstein, E. M.,
Forss-Petter, S., Pietropaolo, M., Mallory, M. and Abraham, C. R. (1994). "Synaptotrophic
effects of human amyloid beta protein precursors in the cortex of transgenic mice." Brain
Res 666(2): 151-67.
Mucke, L., Masliah, E., Yu, G. Q., Mallory, M., Rockenstein, E. M., Tatsuno, G., Hu, K.,
Kholodenko, D., Johnson-Wood, K. and McConlogue, L. (2000). "High-level neuronal
expression of abeta 1-42 in wild-type human amyloid protein precursor transgenic mice:
synaptotoxicity without plaque formation." J Neurosci 20(11): 4050-8.
Nakata, H. and Kozasa, T. (2005). "Functional characterization of Galphao signaling
through G protein-regulated inducer of neurite outgrowth 1." Mol Pharmacol 67(3): 695-
702.
Neer, E. J. (1995). "Heterotrimeric G proteins: organizers of transmembrane signals." Cell
80(2): 249-57.
Health news (January 2012). from http://www.healthinformer.net/alzheimer-disease-
plaques-seen-with-conventional-mri-in-animal-model-for-the-first-time.html.
Ng, Y. P., Cheung, Z. H. and Ip, N. Y. (2006). "STAT3 as a downstream mediator of Trk
signaling and functions." J Biol Chem 281(23): 15636-44.

79
APP and APP phosphorylation in Gαo-induced STAT3 signaling
Nishimoto, I., Okamoto, T., Matsuura, Y., Takahashi, S., Murayama, Y. and Ogata, E.
(1993). "Alzheimer amyloid protein precursor complexes with brain GTP-binding protein
G(o)." Nature 362(6415): 75-9.
O'Brien, R. J. and Wong, P. C. (2011). "Amyloid precursor protein processing and
Alzheimer's disease." Annu Rev Neurosci 34: 185-204.
Okamoto, T., Takeda, S., Murayama, Y., Ogata, E. and Nishimoto, I. (1995). "Ligand-
dependent G protein coupling function of amyloid transmembrane precursor." J Biol Chem
270(9): 4205-8.
Perez, R. G., Zheng, H., Van der Ploeg, L. H. and Koo, E. H. (1997). "The beta-amyloid
precursor protein of Alzheimer's disease enhances neuron viability and modulates neuronal
polarity." J Neurosci 17(24): 9407-14.
Ram, P. T., Horvath, C. M. and Iyengar, R. (2000). "Stat3-mediated transformation of
NIH-3T3 cells by the constitutively active Q205L Galphao protein." Science 287(5450):
142-4.
Ram, P. T. and Iyengar, R. (2001). "G protein coupled receptor signaling through the Src
and Stat3 pathway: role in proliferation and transformation." Oncogene 20(13): 1601-6.
Rebelo, S., Vieira, S. I., Esselmann, H., Wiltfang, J., da Cruz e Silva, E. F. and da Cruz e
Silva, O. A. (2007). "Tyr687 dependent APP endocytosis and Abeta production." J Mol
Neurosci 32(1): 1-8.
Rocha, J. F. (2011). Understanding APP-dependent neuronal differentiation. Health
Science Department, Universidade de Aveiro. Master Molecular Biomedicine:
http://hdl.handle.net/10773/7389.
Romero-Calvo, I., Ocon, B., Martinez-Moya, P., Suarez, M. D., Zarzuelo, A., Martinez-
Augustin, O. and de Medina, F. S. (2010). "Reversible Ponceau staining as a loading
control alternative to actin in Western blots." Anal Biochem 401(2): 318-20.
Russo, C., Venezia, V., Repetto, E., Nizzari, M., Violani, E., Carlo, P. and Schettini, G.
(2005). "The amyloid precursor protein and its network of interacting proteins:
physiological and pathological implications." Brain Res Brain Res Rev 48(2): 257-64.
Schettini, G., Govoni, S., Racchi, M. and Rodriguez, G. (2010). "Phosphorylation of APP-
CTF-AICD domains and interaction with adaptor proteins: signal transduction and/or
transcriptional role--relevance for Alzheimer pathology." J Neurochem 115(6): 1299-308.
Selkoe, D. J. (1999). "Translating cell biology into therapeutic advances in Alzheimer's
disease." Nature 399(6738 Suppl): A23-31.
Selkoe, D. J. (2001). "Alzheimer's disease: genes, proteins, and therapy." Physiol Rev
81(2): 741-66.
Selkoe, D. J. (2004). "Alzheimer disease: mechanistic understanding predicts novel
therapies." Ann Intern Med 140(8): 627-38.

80
Ana Regina Silva Cerqueira SACS/UA, 2012
Shaked, G. M., Chauv, S., Ubhi, K., Hansen, L. A. and Masliah, E. (2009). "Interactions
between the amyloid precursor protein C-terminal domain and G proteins mediate calcium
dysregulation and amyloid beta toxicity in Alzheimer's disease." FEBS J 276(10): 2736-51.
Shan, D., Chen, L., Wang, D., Tan, Y. C., Gu, J. L. and Huang, X. Y. (2006). "The G
protein G alpha(13) is required for growth factor-induced cell migration." Dev Cell 10(6):
707-18.
Siderovski, D. P., Diverse-Pierluissi, M. and De Vries, L. (1999). "The GoLoco motif: a
Galphai/o binding motif and potential guanine-nucleotide exchange factor." Trends
Biochem Sci 24(9): 340-1.
Small, S. A. and Gandy, S. (2006). "Sorting through the cell biology of Alzheimer's
disease: intracellular pathways to pathogenesis." Neuron 52(1): 15-31.
Sola Vigo, F., Kedikian, G., Heredia, L., Heredia, F., Anel, A. D., Rosa, A. L. and
Lorenzo, A. (2009). "Amyloid-beta precursor protein mediates neuronal toxicity of
amyloid beta through Go protein activation." Neurobiol Aging 30(9): 1379-92.
Strittmatter, S. M., Fishman, M. C. and Zhu, X. P. (1994). "Activated mutants of the alpha
subunit of G(o) promote an increased number of neurites per cell." J Neurosci 14(4): 2327-
38.
Strittmatter, S. M., Valenzuela, D., Kennedy, T. E., Neer, E. J. and Fishman, M. C. (1990).
"G0 is a major growth cone protein subject to regulation by GAP-43." Nature 344(6269):
836-41.
Takahashi, K., Niidome, T., Akaike, A., Kihara, T. and Sugimoto, H. (2008).
"Phosphorylation of amyloid precursor protein (APP) at Tyr687 regulates APP processing
by alpha- and gamma-secretase." Biochem Biophys Res Commun 377(2): 544-9.
Thinakaran, G. and Koo, E. H. (2008). "Amyloid precursor protein trafficking, processing,
and function." J Biol Chem 283(44): 29615-9.
Vieira, S. I., Rebelo, S., Domingues, S. C., da Cruz e Silva, E. F. and da Cruz e Silva, O.
A. (2009). "S655 phosphorylation enhances APP secretory traffic." Mol Cell Biochem
328(1-2): 145-54.
Vieira, S. I., Rebelo, S., Esselmann, H., Wiltfang, J., Lah, J., Lane, R., Small, S. A.,
Gandy, S., da Cruz, E. S. E. F. and da Cruz, E. S. O. A. (2010). "Retrieval of the
Alzheimer's amyloid precursor protein from the endosome to the TGN is S655
phosphorylation state-dependent and retromer-mediated." Mol Neurodegener 5: 40.
Vrotsos, E. G., Kolattukudy, P. E. and Sugaya, K. (2009). "MCP-1 involvement in glial
differentiation of neuroprogenitor cells through APP signaling." Brain Res Bull 79(2): 97-
103.
Walker, S. R., Chaudhury, M. and Frank, D. A. (2011). "STAT3 Inhibition by
Microtubule-Targeted Drugs: Dual Molecular Effects of Chemotherapeutic Agents." Mol
Cell Pharmacol 3(1): 13-19.

81
APP and APP phosphorylation in Gαo-induced STAT3 signaling
Wan, J., Fu, A. K., Ip, F. C., Ng, H. K., Hugon, J., Page, G., Wang, J. H., Lai, K. O., Wu,
Z. and Ip, N. Y. (2010). "Tyk2/STAT3 signaling mediates beta-amyloid-induced neuronal
cell death: implications in Alzheimer's disease." J Neurosci 30(20): 6873-81.
Wettschureck, N. and Offermanns, S. (2005). "Mammalian G proteins and their cell type
specific functions." Physiol Rev 85(4): 1159-204.
Wu, E. H., Lo, R. K. and Wong, Y. H. (2003). "Regulation of STAT3 activity by G16-
coupled receptors." Biochem Biophys Res Commun 303(3): 920-5.
Xu, J. J., Chen, E. Y., Lu, C. L. and He, C. (2009). "Recombinant ciliary neurotrophic
factor promotes nerve regeneration and induces gene expression in silicon tube-bridged
transected sciatic nerves in adult rats." J Clin Neurosci 16(6): 812-7.

82
Ana Regina Silva Cerqueira SACS/UA, 2012

83
APP and APP phosphorylation in Gαo-induced STAT3 signaling
Appendix
Cell culture Solutions and Immunocytochemistry
PBS (1x)
For a final volume of 500 ml, dissolve one pack of BupH Modified Dulbecco’s Phosphate
Buffered Saline Pack (Pierce) in deionised H2O. Final composition:
- 8 mM Sodium Phosphate
- 2 mM Potassium Phosphate
- 140 mM Sodium Chloride
- 10 mM Potassim Chloride
Sterilize by filtering through a 0.2 μm filter and store at 4ºC.
10% FBS MEM:F12 (1:1)
- MEM (Gibco, Invitrogen) 4,805 g
- F12 (Gibco, Invitrogen) 5,315 g
- NaHCO3 (Sigma) 1,5 g
- Sodium pyruvate (Sigma) 0,055 g
- Streptomycin/Penicillin/Amphotericin solution (Gibco, Invitrogen) 10 mL
- 10% FBS (Gibco, Invitrogen) 100 mL
- L-glutamine (200 mM stock solution) 2,5 mL
→ Dissolve in distilled (d) H2O;
→ Adjust the pH to 7.2/ 7.3;
→ Adjust the volume to 1000 mL with dH2O.
4% Paraformaldehyde
For a final volume of 100 mL, add 4g of paraformaldehyde to 25 mL deionised H2O.
Dissolve by heating the mixture at 58ºC while stirring. Add 1-2 drops of 1 M NaOH to
clarify the solution and filter (0.2 μm filter). Add 50 mL of 2X PBS and ajust the volume
to 100 mL with deionised H2O.

84
Ana Regina Silva Cerqueira SACS/UA, 2012
SDS-PAGE and Immunoblotting Solutions
LGB (Lower gel buffer) (4x)
To 900 ml of deionised H2O add:
- Tris 181.65 g
- SDS 4 g
Mix until the solutes have dissolved. Adjust the pH to 8.9 and adjust the volume to 1L with
deionised H2O.
UGB (Upper gel buffer) (5x)
To 900 ml of deionised H2O add:
- Tris 75.69 g
Mix until the solute has dissolved. Adjust the pH to 6.8 and adjust the volume to 1 L with
deionised H2O.
30% Acrylamide/0.8% Bisacrylamide
To 70 ml of deionised H2O add:
- Acrylamide 29.2 g
- Bisacrylamide 0.8 g
Mix until the solute has dissolved. Adjust the volume to 100 ml with deionised water.
Filter through a 0.2 μm filter and store at 4ºC.
10% APS (ammonium persulfate)
In 10 ml of deionised H2O dissolve 1 g of APS. Note: prepare fresh before use.
10% SDS (sodium dodecilsulfate)
In 10 ml of deionised H2O dissolve 1 g of SDS.
Loading Gel Buffer (4x)
- 1 M Tris solution (pH 6.8) 2.5 mL (250 mM)
- SDS 0.8 g (8%)
- Glicerol 4 ml (40%)
- β-Mercaptoetanol 2 ml (2%)
- Bromofenol blue 1 mg (0.01%)

85
APP and APP phosphorylation in Gαo-induced STAT3 signaling
Adjust the volume to 10 ml with deionised H2O. Store in darkness at room temperature.
1 M Tris (pH 6.8) solution
To 150 ml of deionised H2O add:
- Tris base 30.3 g
Adjust the pH to 6.8 and adjust the final volume to 250 ml.
10x Running Buffer
- Tris 30.3 g (250 mM)
- Glycine 144.2 g (2.5 M)
- SDS 10 g (1%)
Dissolve in deionised H2O, adjust the pH to 8.3 and adjust the volume to 1 L.
Resolving (lower) gel solution (60 ml)
7.5% or 10%
- H2O 29,25 ml 25,2 ml
- 30% Acryl/0.8% Bisacryl solution 15 ml 19,8 ml
- LGB (4x) 15 ml 15 ml
- 10% APS 300 μL 300 μL
- TEMED 30 μL 30 μL
Resolving (lower) gel solution for gradient gels (60 ml)
5% and 20%
- H2O 17.4 ml 2.2 ml
- 30% Acryl/0.8% Bisacryl solution 5 ml 20 ml
- LGB (4x) 7.5 ml 7.5 ml
- 10% APS 150 μL 150 μL
- TEMED 15 μL 15 μL
Stacking (upper) gel solution (20 ml)
3.5%
- H2O 13.2 ml
- 30% Acryl/0.8% Bisacryl solution 2.4 ml
- UGB (5x) 4.0 ml
- 10% APS 200 μL
- 10% SDS 200 μL
- TEMED 20 μL

86
Ana Regina Silva Cerqueira SACS/UA, 2012
1x Transfer Buffer
- Tris 3.03 g (25 mM)
- Glycine 14.41 g (192 mM)
Mix until solutes dissolution. Adjust the pH to 8.3 with HCl and adjust the volume to 800
ml with deionised H2O. Just prior to use add 200 ml of methanol (20%).
10x TBS (Tris buffered saline)
- Tris 12.11 g (10 mM)
- NaCl 87.66 g (150 mM)
Adjust the pH to 8.0 with HCl and adjust the volume to 1L with deionised H2O.
10x TBST (TBS+Tween)
- Tris 12.11 g (10 mM)
- NaCl 87.66 g (150 mM)
- Tween 20 5 ml (0.05%)
Adjust the pH to 8.0 with HCl and adjust the volume to 1L with deionised H2O.
Membranes Stripping Solution (500 ml)
- Tris-HCl (pH 6.7) 3.76 g (62.5 mM)
- SDS 10 g (2%)
- β-mercaptoetanol 3.5 ml (100 mM)
Dissolve Tris and SDS in deionised H2O and adjust with HCl to pH 6.7. Add the
mercaptoethanol and adjust volume to 500 ml.
ECL home-made (250 ml)
Solution A - ECL luminol solution (Stock solution):
- 20 mM luminol (in DMSO) * 1.25 ml (100μM)
- 100 mM 4-iodophenol (in DMSO) * 5 ml (2mM)
- 0.1 M Tris (pH 9.35) 125 ml (50 mM)
Adjust volume to 250 ml with deionised H2O.
* Protect from the light; conserve at -20ºC
Solution B – Hydrogen peroxide

87
APP and APP phosphorylation in Gαo-induced STAT3 signaling
Pull-down solutions
Lysis buffer (5 ml)
- 50 mM Tris (pH 8) 250 μl of 1M Tris (pH 8)
- 25% glycerol 1250 μl 100% glycerol
- 0.5% Gepac-ca-630 (NP40) 250 μl 10% NP40
- 200 mM NaCl 200 μl 5M NaCl
- β-mercaptoethanol 0,35 μl β-mercaptoethanol
- 1 mM PMSF 50 μl 100 mM PMSF
- protease inhibitor cocktail 5 μl of protease inhibitor cocktail
Keep all on ice.
Wash buffer (20 ml)
- 10 mM Tris (pH 8) 200 μl of 1M Tris (pH 8)
- 0.1% Gepac-ca-630 (NP40) 200 μl 10% NP40
- 150 mM NaCl 600 μl 5M NaCl
- 0.25 mM EDTA 40 μl 0.25M EDTA
- 1 mM PMSF 200 μl 100 mM PMSF
- protease inhibitor cocktail 20 μl of protease inhibitor cocktail
Keep all on ice.