instituto nacional de pesquisas da amazÔniabdtd.inpa.gov.br/bitstream/tede/1964/5/tese_aline...
TRANSCRIPT
INSTITUTO NACIONAL DE PESQUISAS DA AMAZÔNIA - INPA
PROGRAMA DE PÓS-GRADUAÇÃO EM ECOLOGIA
DISTRIBUIÇÃO, ECOFISIOLOGIA E CAPACIDADE ADAPTATIVA
DO GÊNERO Montrichardia H. CRUEG NA BACIA AMAZÔNICA
ALINE LOPES
Manaus – AM
Setembro, 2014
ALINE LOPES
DISTRIBUIÇÃO, ECOFISIOLOGIA E CAPACIDADE ADAPTATIVA
DO GÊNERO Montrichardia H. CRUEG NA BACIA AMAZÔNICA
ORIENTADORA: Dra. MARIA TERESA FERNANDEZ PIEDADE
Coorientador: Dr. Sidinei Magela Thomaz
Tese apresentada ao Instituto
Nacional de Pesquisas da Amazônia
como parte dos requisitos para
obtenção do título de Doutora em
Biologia (Ecologia).
Manaus – AM
Setembro, 2014
ii
Banca Examinadora do Trabalho Escrito
Nome – Instituição Parecer
Vera Maria F. de Almeida-Val – Instituto Nacional de Pesquisas da Amazônia Aprovada
Doriane Picanço Rodrigues – Universidade Federal do Amazonas Aprovada
Antonio F.M. Camargo – UNESP/Rio Claro Aprovada
Augusto Cesar Franco – Universidade de Brasilia Aprovada com Correções
Christine Lucas - Universidad de la República del Uruguay Aprovada com Correções
Evlyn M.L.M. Novo – Instituto Nacional de Pesquisas Espaciais Aprovada com Correções
Jochen Schöngart - Instituto Nacional de Pesquisas da Amazônia Aprovada com Correções
Banca Avaliadora da Defesa da Tese
Nome – Instituição Parecer
Vera Maria F. de Almeida-Val – Instituto Nacional de Pesquisas da Amazônia Aprovada
Jefferson da Cruz – Universidade Federal do Amazonas Aprovada
Cristiane S. Ferreira – Universidade de Brasília Aprovada
iii
L864 Lopes, Aline
Distribuição, ecofisiologia e capacidade adaptativa do gênero
Montrichardia H. Crueg na Bacia Amazônica / Aline Lopes. --- Manaus:
[s.n.], 2014.
168 f. : il. color.
Tese (Doutorado) --- INPA, Manaus, 2014.
Orientador: Maria Teresa Fernandez Piedade.
Coorientador: Sidinei Magela Thomaz.
Área de concentração: Ecologia.
1. Macrófitas aquáticas. 2. Ecologia de populações.
3. Plasticidade fenotípica. I. Título.
CDD
574.52632
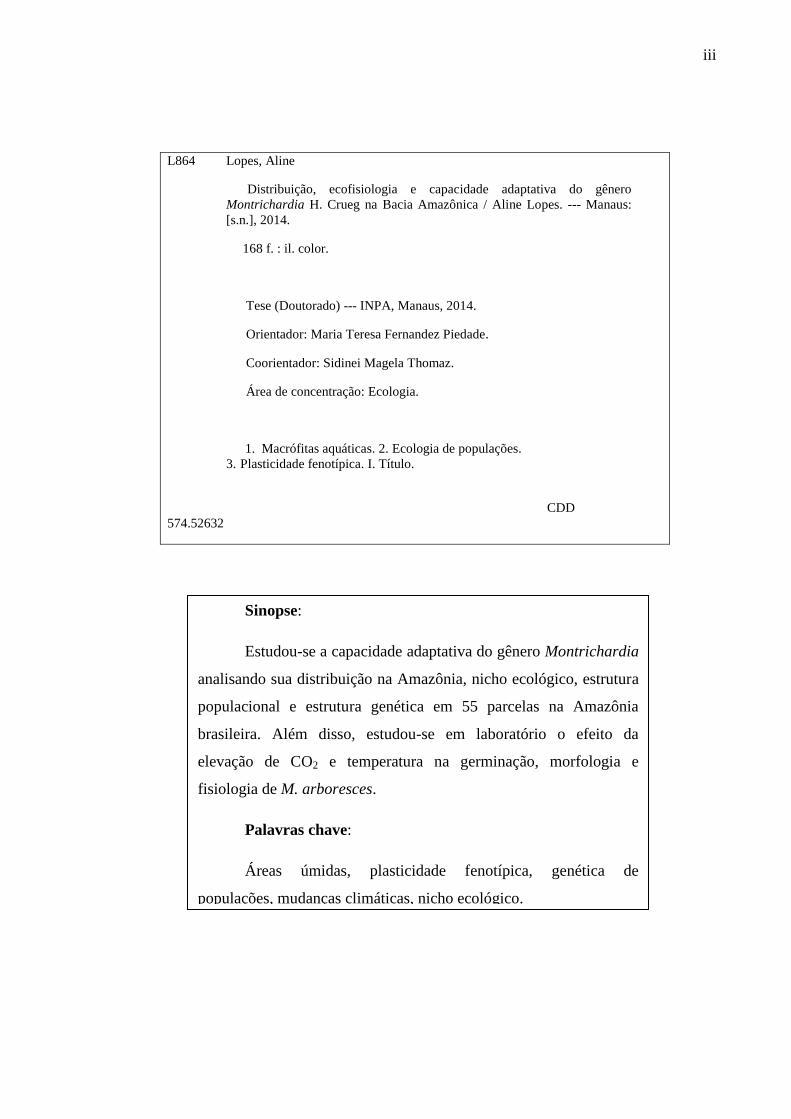
Sinopse:
Estudou-se a capacidade adaptativa do gênero Montrichardia
analisando sua distribuição na Amazônia, nicho ecológico, estrutura
populacional e estrutura genética em 55 parcelas na Amazônia
brasileira. Além disso, estudou-se em laboratório o efeito da
elevação de CO2 e temperatura na germinação, morfologia e
fisiologia de M. arboresces.
Palavras chave:
Áreas úmidas, plasticidade fenotípica, genética de
populações, mudanças climáticas, nicho ecológico.

iv
Às duas mulheres que me ensinaram o mais
importante: ser forte. Minha mãe, Wanda Laura
Lopes por todo incentivo e carinho e a minha
orientadora Maria Teresa Fernandez Piedade por
toda dedicação e ensinamentos no decorrer desses
nove anos.
v
AGRADECIMENTOS
Agradeço ao Instituto Nacional de Pesquisas da Amazônia e aos professores da
instituição por todo aprendizado ao longo de todos esses anos.
Aos meus amigos do Grupo MAUA, Beth, Celso, Lucia, Kelvin, Wallace, Valdeney,
que ao longo desses anos de convivência me ensinaram mais do que eu imaginaria que
poderia aprender quando vim estudar no INPA. Agradeço o auxílio nas coletas, às
explicações, o tempo dedicado e o abraço amigo. Ao Dr. Florian Wittmann e Dr. Jochen
Schöngart por todo incentivo desde a elaboração do projeto, coletas de campo e finalização da
tese. Aos diversos alunos de mestrado, doutorado e iniciação de científica que ajudaram no
campo e nas discussões do projeto e da tese. Em especial a minha aluna de PIBIC Aurélia que
ensinou muito mais a mim do que eu a ela. E me faltam palavras para agradecer a Maitê
Piedade, minha orientadora, a qual participou de todo o processo da minha formação como
pesquisadora.
Às minhas irmãs Karina e Jacqueline por todo incentivo, paciência, carinho, análises
psicológicas, por aguentar todo o meu choro e lamentações, e por me darem sobrinhas
maravilhosas que sempre me alegram, mesmo nos momentos mais difíceis. Às minhas amigas
Joana e Natália por toda paciência nesse período tão difícil de finalização da tese. Mais que
amigas foram minhas irmãs em Manaus.
À minha mãe e meu pai (in memorian) agradeço por confiarem sempre na minha
capacidade e por me mostrarem que sempre é possível superar os obstáculos no caminho. Ao
José Ronaldo, que mesmo sem entender nada do que eu estava fazendo passou horas ao meu
lado no laboratório me fazendo companhia e me dando todo a amor e carinho, quando eu já
não conseguia mais suportar tanta pressão.
A Dra. Marina Anciães pela ajuda na interpretação dos modelos. Ao MSc. Marcelo
“Brasa” pelo tempo dedicado me ensinando a modelar o nicho das espécies. Ao Dr. Sidinei
M. Thomaz pela leitura e comentários aos manuscritos. À Dra. Vera M. F. de Almeida e Val,
Dra. Maristerra R. Lemes e Dra. Doriane Picanço agradeço pelas sugestões nas análises e
interpretação dos dados genéticos. À Dra. Pia Parolin, que foi de extrema importância na
finalização da tese, dando valiosas sugestões aos manuscritos.
vi
Agradeço aos avaliadores anônimos do pré-projeto e aos membros da banca de
qualificação pelas sugestões feitas ao projeto, Dr. Jansen Zuanon (INPA), Dra. Lourdes
(INPA), Dra. Vera de Almeida e Val (INPA), Dr. Bruce Forsberg (INPA), Dr. Charles
Clements (INPA). Aos avaliadores participantes da banca examinadora do trabalho escrito Dr.
Antônio Camargo (UNESP), Dra. Vera de Almeida e Val (INPA), Dra. Christine Luca, Dr.
Augusto Franco (UnB), Dra. Evelyn Novo (INPE), Jochen Schöngart (INPA) e Dra. Doriane
Picanço (UFAM) pelas valorosas sugestões e correções da tese que foram extremamente
importantes na concepção final dos artigos. Agradeço ainda aos avaliadores da defesa da tese
Dra. Vera Maria Fonseca de Almeida-Val, Dr. Jefferson da Cruz e a Dra.Cristiane S. Ferreira.
Ao CNPq agradeço pela bolsa de doutorado. Às agências CNPq e FAPEAM pelo
financiamento do projeto por meio dos editais INCT Adapta, Pronex – “Áreas Alagáveis”,
Editais Universal (2009/2011 e 2011/2013) e PELD “MAUA”.
Agradeço ainda a todos que de forma direta ou indireta me ajudaram nessa jornada e
que não poderei citar aqui tamanha a gama de pessoas envolvidas em todas as fases do
projeto.
Agradeço, sobretudo, a oportunidade de ter conhecido essa imensidão de cores e
sabores da Amazônia que aprendi a admirar cada dia mais. Por todos os Estados percorridos
pude aprender um pouco da cultura e especificidades locais. As diferentes cores de água dos
rios e igarapés, as lindas macrófitas nas águas claras do Tapajós, as Anavilhanas, um labirinto
natural sempre verde, as praias de areia branca do rio Negro, o efeito de maré nos rios do Pará
e Amapá, os lagos azuis de Roraima, a seca no rio Madeira. Enfim em cada ponto de coleta
muito mais que dados ecológicos foram coletados.

vii
"The important thing is not to stop questioning."
"Logics will get you from A to B, imagination will take you everywhere.”
Albert Einstein
viii
RESUMO
Nas áreas alagáveis amazônicas, ainda relativamente integras, a vegetação encontra-se
adaptada ao regime regular de inundação, o qual determina a distribuição de espécies de
plantas. Além do efeito dos níveis da água, as mudanças ambientais, em decorrência do
aumento da temperatura e dos níveis de dióxido de carbono, podem ter efeitos marcantes
sobre a flora e a fauna nestas áreas. A oscilação do nível das águas torna estas áreas frágeis,
por isso, as mudanças ambientais são preocupantes, sendo necessário estimar a capacidade
adaptativa e a resiliência do sistema. Para isso, é fundamental encontrar marcadores
biológicos sensíveis e adequados que permitam desenvolver e propor estratégias de
conservação. O objetivo deste estudo foi fornecer um conjunto de informações sobre as
características adaptativas morfológicas e fisiológicas de macrófitas aquáticas com diferentes
amplitudes de distribuição, visando entender como as modificações ambientais interferem
sobre esse grupo de plantas de fundamental importância para a biota aquática. Foram
coletados dados morfológicos, fisiológicos e moleculares de 55 populações de Montrichardia
spp. distribuídas na Bacia Amazônica; e dados de distribuição provenientes de herbários, com
o intuído de compreender a ecologia das espécies em escala regional (Amazônia) e macro-
escala (Neotropical). Para simular o efeito das mudanças climáticas sobre Montrichardia
arborescens foi realizado um experimento em microcosmo com duração de cinco meses.
Neste experimento foi avaliando a germinação e crescimento inicial das plântulas com a
elevação da temperatura (+1,5 a +4,5ºC que o controle) e CO2 (+200 a +800 ppm que o
controle). Os diversos parâmetros ambientais e caracteres biológicos aferidos demostraram a
clara separação das espécies M. linifera e M. arborescens. Entretanto, a análise genética feita
para as espécies não permitiu determinar a exata relação entre a variedade M. arborescens
var. aculeata e as outras duas espécies. O alto índice de diferenciação genética (RST) entre as
espécies M. linifera e M. arborescens, aliado à interpretação da rede de haplótipos, permitiu
confirmar a separação destas duas espécies, o que se mostrou compatível com a separação
morfológica propiciada pela análise do número de nervuras apicais secundárias. Os fatores
hidroquímicos influenciaram a distribuição das espécies de Montrichardia em escala regional
(Amazônia). Enquanto M. linifera ocorre principalmente em rios de água branca (várzeas), M.
arborescens ocorre em rios de água preta (igapós) e riachos de terra-firme. Em uma macro-
escala (Neotropical), a precipitação e a temperatura foram os fatores que mais influenciaram a
distribuição das espécies. A simulação da elevação de temperatura e CO2 nos microcosmos

ix
permitiu inferir os efeitos das mudanças climáticas sobre M. arborescens. Esta espécie
apresentou uma menor acumulação de biomassa e menor taxa de transporte de elétrons quanto
exposta a níveis extremos de temperatura e CO2. Concluímos que as espécies do gênero
Montrichardia apresentam diferenças adaptativas morfológicas, fisiológicas e genéticas
relacionadas aos parâmetros ambientais intervenientes em cada um dos locais amostrados
(várzea e igapó), e que a elevação de temperatura e CO2 influenciam a morfologia e fisiologia
de M. arborescens.
x
Distribution, ecophysiology and adaptive capacity of genus Montrichardia H. Crueg in
the Amazon Basin
ABSTRACT
In Amazonian floodplains, relatively integral system yet, the vegetation is adapted to
regular flooding regime, which determines the distribution of plant species. Besides the effect
of water levels, environmental changes, due to the increase in temperature and levels of CO2,
may have marked effects on the flora and fauna in these areas. The oscillation of the water
level makes these areas so fragile, and the environmental changes are worrying, being
necessary to estimate the adaptive capacity and resilience of the system. For this it is essential
to find suitable and sensitive biological markers in order to develop and propose conservation
strategies. The aim of this study was to provide a set of information about the morphological
and physiological adaptive traits of aquatic macrophytes with different amplitudes of
distribution, in order to understand how environmental changes affect this group of plants,
with fundamental importance to aquatic biota. Morphological, physiological and molecular
data of 55 populations of Montrichardia spp. distributed in the Amazon Basin were collected.
Data of distribution from herbaria was used to elucidate the ecology of the species at the
regional scale (Amazonia) and macro-scale (Neotropical). To estimate the effect of climate
change on Montrichardia arborescens an experiment was performed in microcosm with the
elevation of temperature and CO2 for five months. The germination and growth of seedling
were evaluated. Various environmental parameters and biological characteristics measured
demonstrated the clear separation of species M. linifera and M. arborescens. However,
genetic analysis did not allow to understand the exact relationship between M. arborescens
var. aculeata and the other two other species. The degree of genetic differentiation (RST)
between the species M. arborescens and M. linifera, together with the interpretation of the
haplotype network, permitted to confirm the separation of these two species, which proved
compatible with the morphological separation provided by the analysis of the number of
secondary apical veins. The hydrochemical factors proved to influence the distribution of
Montrichardia species on a regional scale (Amazonia). While M. linifera occurs mainly in
white water rivers, M. arborescens occurs in black water rivers and upland streams. At a
macro-scale (Neotropical), precipitation and temperature were the most important factors
influencing the species distribution. The simulation of temperature rise and CO2 in

xi
microcosms allowed us to infer the effects of climate change on M. arborescens. This species
showed a lower accumulation of biomass and lower rate of electron transport when exposed
to extremes of temperature and CO2. We conclude that the genus Montrichardia exhibit
morphological, physiological and genetic adaptive differences relating to environmental
parameters in each of the local environment (várzea and igapó), and that the temperature rise
and CO2 influence morphology and physiology of M. arborescens.
xii
SUMÁRIO
LISTA DE TABELAS ........................................................................................................... xiii
LISTA DE FIGURAS .........................................................................................................xv
INTRODUÇÃO ....................................................................................................................1
OBJETIVO GERAL .............................................................................................................10
Objetivos específicos................................................................................................11
Capítulo 1 - (Manuscrito formatado de acordo com as normas da revista Aquatic Botany).......................12
Capítulos 2 - (Manuscrito formatado de acordo com as normas da revista Hydrobiologia)......................38
Capítulo 3 - (Manuscrito formatado de acordo com as normas da revista Acta Amazônica).....................64
Capítulo 4 - (Manuscrito formatado de acordo com as normas da revista Environmetal Science and Pollution
Research)...........................................................................................................105
SÍNTESE.................................................................................................................................129
REFERÊNCIAS BIBLIOFRÁFICAS....................................................................................130
ANEXOS ……………………………………………..……………………………….……140
xiii
LISTA DE TABELAS
Capítulo 1
Table 1 – Number of occurrence of each Montrichardia specie; Water bodies and water types
where samplings were performed in situ. MA = Montrichardia arborescens; MAA =
Montrichardia arborescens var. aculeata; ML = Montrichardia linifera…..........……..…....18
Table 2 – Bioclimatic variables used to development of MAXENT models.…………..........21
Table 3 – Water types and water bodies were collected Montrichardia spp. In Amazon Basin
………………………………………………………………………………………...............23
Table 4. Models for each of the tested species (MA and ML) and their AUC (area under the
curve). *p <0,0001. Where; alt (altitude), rain_tot (rain total), soil (map of soil), veg2002
(Global Vegetation Index, 2002), temp_dry (temperature of the driest month). **see Table 2.
………………………………………………………………………………………...............28
Capítulo 2
Table 1 – Water types and water bodies were collected Montrichardia spp. in the Brazilian
Amazon Basin.………………………………………………………………………………..43
Table 2 - Morphological traits and biomass values of ML = Montrichardia linifera, MA =
Montrichardia arborescens and MAA= Montrichardia arborescens var. aculeata. Different
letters indicate significant differences (p< 0.05) among factors.……………………………..50
Table 3 - Percentage of success of the discriminatory analysis of ML = Montrichardia
linifera, MA = Montrichardia arborescens and MAA= Montrichardia arborescens var.
aculeata.………………………………………………………………………………………51
xiv
Capítulo 3
Tabela 1. Características dos locos microssatélites do genoma do cloroplasto (cpSSR)
utilizados nas análises genéticas das populações de Montrichardia spp. (TA) = Temperatura
de anelamento, NA = número de alelos (Weisigner & Gardner 1999).....................................76
Tabela 2. Diversidade genética em populações de Montrichardia ssp. da Amazônia com base
na análise de nove locos de cpSSR. N- número de indivíduos amostrados; Nh- número de
haplótipos (frequência > 1); H- diversidade genética; A- número de alelos; HE- índices de
diversidade gênica (Nei, 1989). ...............................................................................................80
Tabela 3. Distribuição da variabilidade genética em 18 populações de Montrichardia spp. na
Amazônia brasileira, com base na análise de variância molecular (AMOVA) de nove locos
cpSSR. MA = M. arborescens, ML = M. linifera e MAA = M. arborescens var. aculeata.....81
Capítulo 4
Table 1- Programmed values of CO2 concentration, temperature, and humidity for the
microcosm…………………………………………………………………………………...112
Table 2 – Average values of microcosm climatic conditions per month in the experiment
period………………………………………………………………………………………..115
Table 3 – Index of germination (median) of Montrichardia arborescens: percentage of
germination (G%), initial time of germination (ITG), final time of germination (FTG), median
germination time (t), the velocity of germination index (VGI)..…………………...……….115
Table 4 - Results of the ANCOVA to effect of temperature and CO2 elevation (variable) and
growth time (co-variable) of Montrichardia arborescens seedlings ……………………….116
Table 5 – Means values of Chlorophyll (μmol.mm-2
) at adaxial side of the leaf of
Montrichardia arborescens …………………………………………………………………119
xv
LISTA DE FIGURAS
Capítulo 1
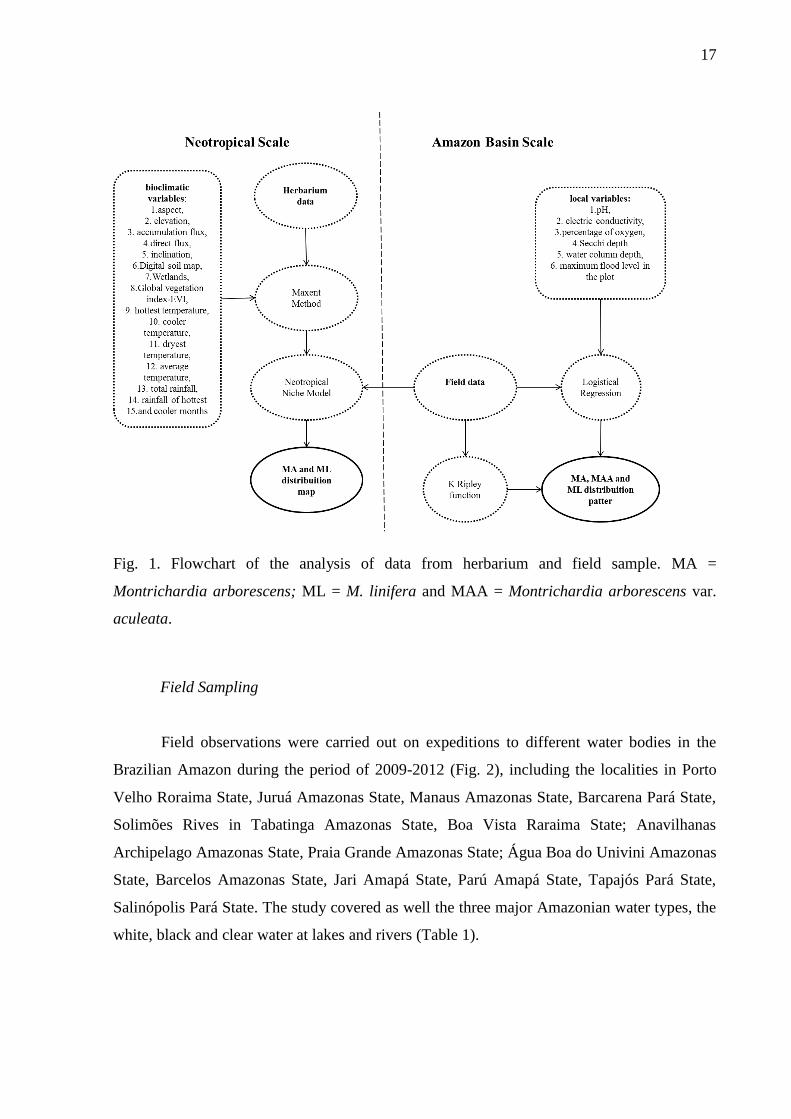
Fig. 1. Flowchart of the analysis of data from herbarium and field sample. MA =
Montrichardia arborescens; ML = M. linifera and MAA = Montrichardia arborescens var.
aculeata. …………………………………...........……………………………………………17
Fig. 2 Sample area of the Montrichardia linifera, Montrichardia arborescens and
Montrichardia arborescens var. aculeata, highlight the Amazon Basin in Brazil's territory..18
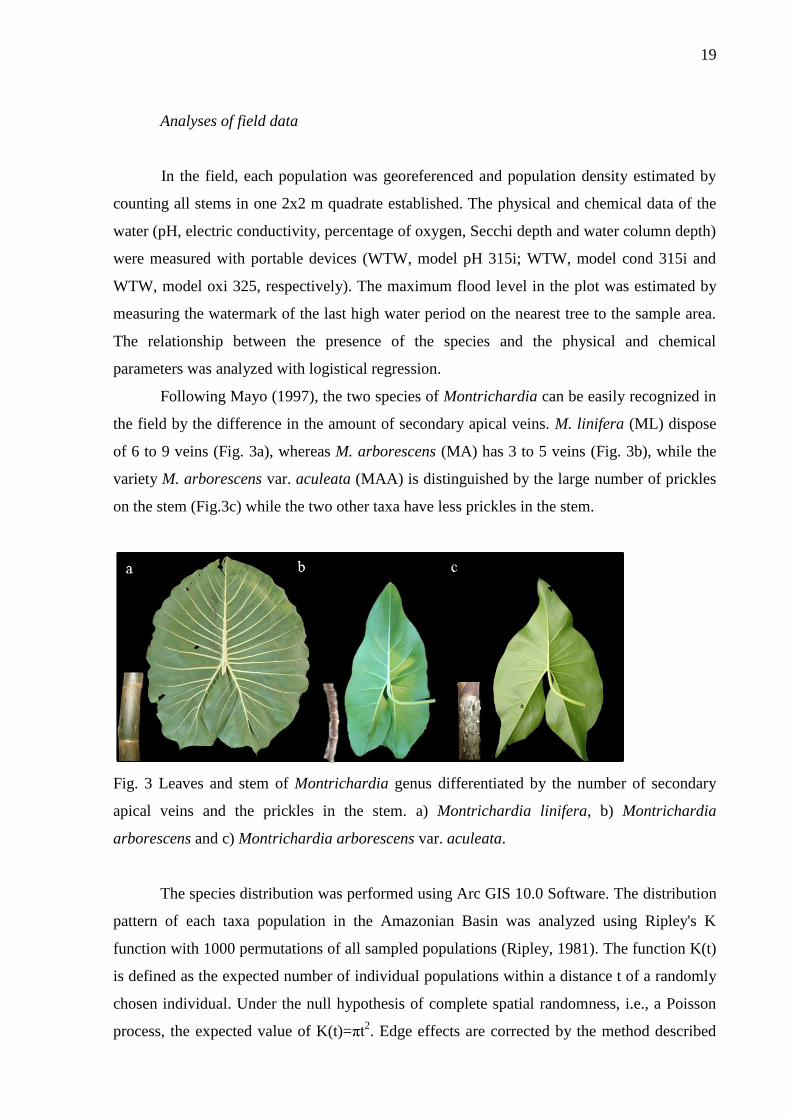
Fig. 3 Leaves and stem of Montrichardia genus differentiated by the number of secondary
apical veins and the prickles in the stem. a) Montrichardia linifera, b) Montrichardia
arborescens and c) Montrichardia arborescens var. aculeata……………………………….19
Fig. 4 Ripley's K function (estimated L) for: a) M. arborescens, b) M. linifera c) M.
arborescens var. aculeata in the Amazon Basin……………….……………….…………….22
Fig. 5 Species distribution of the Montrichardia genus according to the water gradients: a)
electric conductivity, b) pH, c) water transparency (Secchi depth). MA= M. arborescens,
ML= M. linifera, MAA= M. arborescens var. aculeata……………….……………….….....24
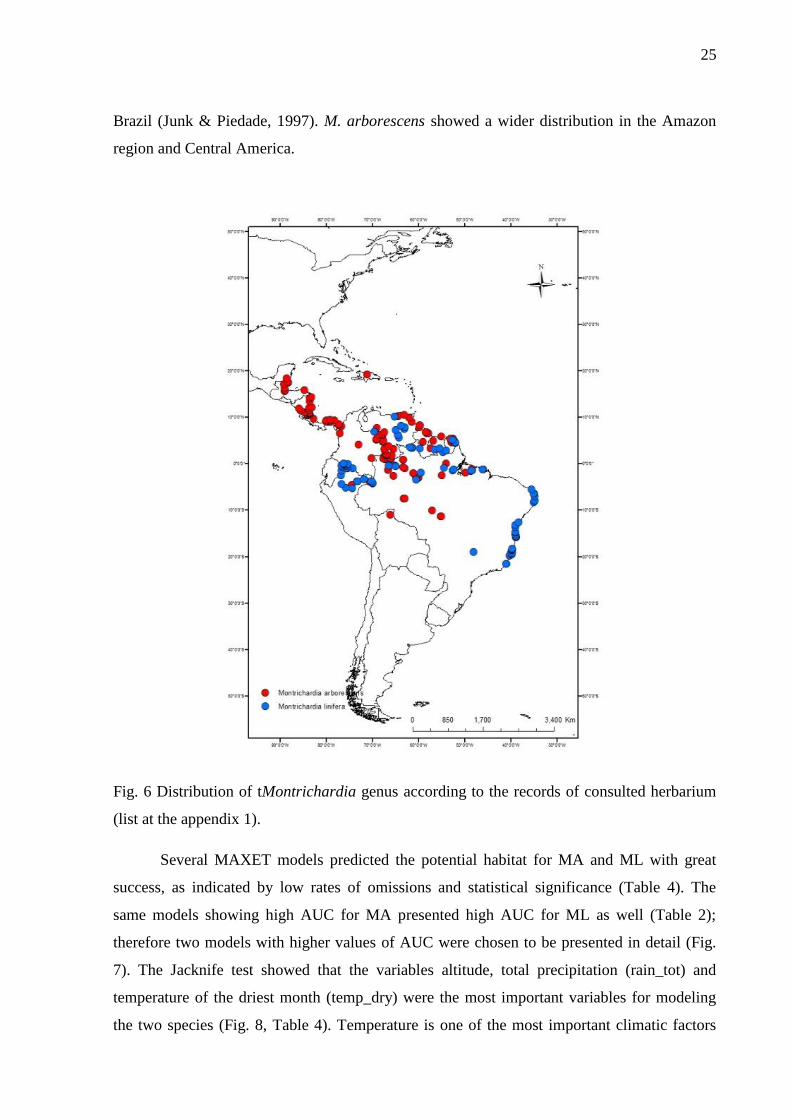
Fig. 6 Distribution of tMontrichardia genus according to the records of consulted herbarium
(list at the appendix 1)……………………………………………………………………...25
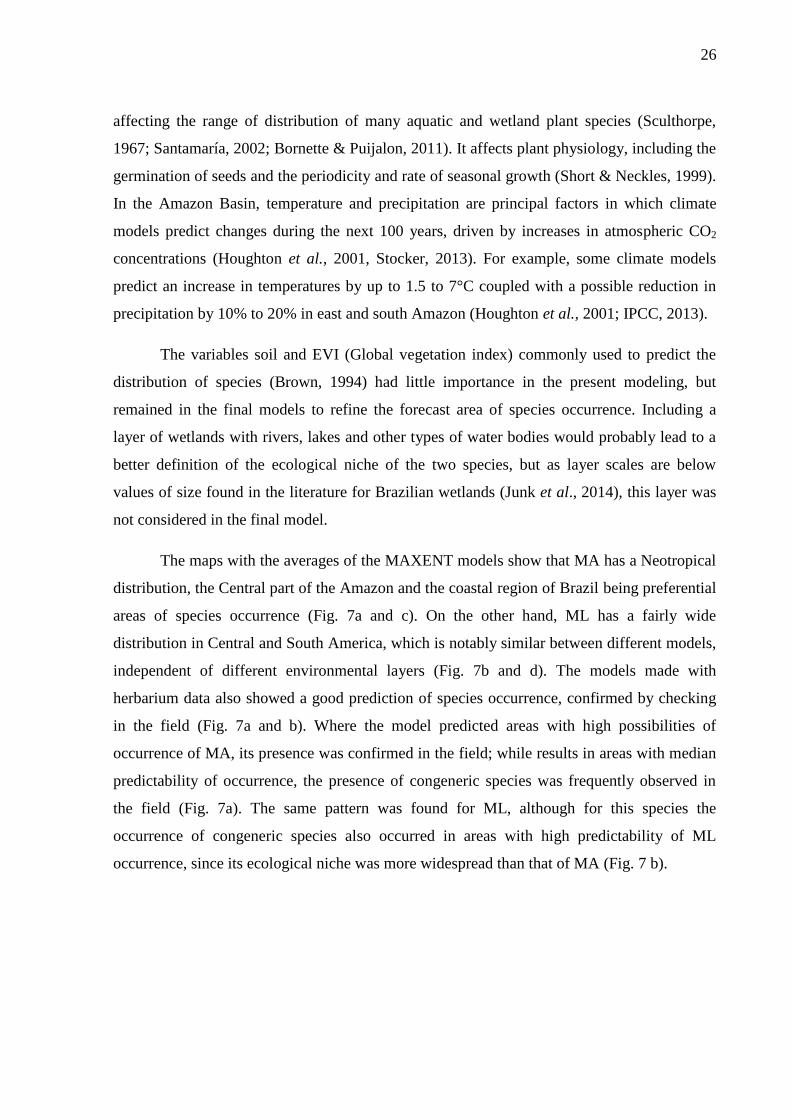
Fig. 7 Ecological niche modeling with field data (not used in the model): a) for Montrichardia
arborescens and b) for Montrichardia linifera; and with data from herbarium specimens (used
for making the models): c) for Montrichardia arborescens and d) for Montrichardia
linifera………………………………………………………………………………………...27
Fig. 8 Results of Jacknife evaluations of the relative importance of predictor variables for: a)
M. arborescens b) M. linifera in the Maxent model. ), alt = altitude, rain_tot = rain total, solo
= map of soil, veg 2002 = Global Vegetation Index, 2002…………………………………..28
xvi
Capítulo 2
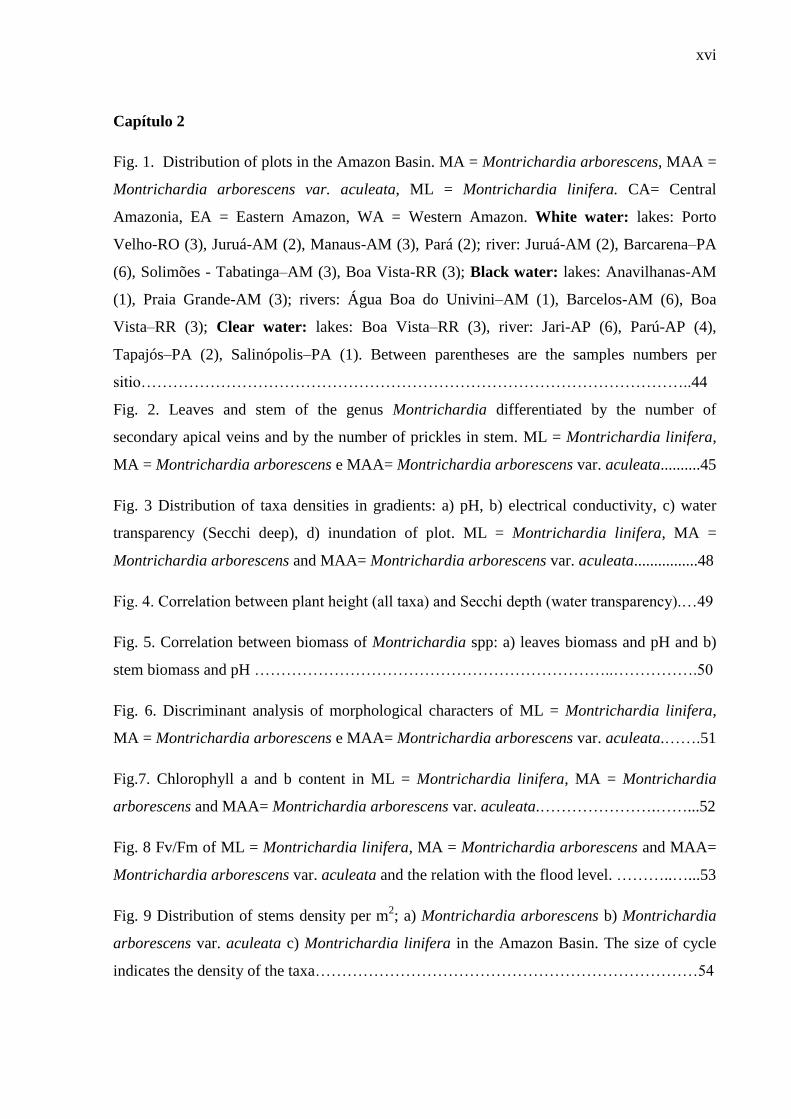
Fig. 1. Distribution of plots in the Amazon Basin. MA = Montrichardia arborescens, MAA =
Montrichardia arborescens var. aculeata, ML = Montrichardia linifera. CA= Central
Amazonia, EA = Eastern Amazon, WA = Western Amazon. White water: lakes: Porto
Velho-RO (3), Juruá-AM (2), Manaus-AM (3), Pará (2); river: Juruá-AM (2), Barcarena–PA
(6), Solimões - Tabatinga–AM (3), Boa Vista-RR (3); Black water: lakes: Anavilhanas-AM
(1), Praia Grande-AM (3); rivers: Água Boa do Univini–AM (1), Barcelos-AM (6), Boa
Vista–RR (3); Clear water: lakes: Boa Vista–RR (3), river: Jari-AP (6), Parú-AP (4),
Tapajós–PA (2), Salinópolis–PA (1). Between parentheses are the samples numbers per
sitio…………………………………………………………………………………………..44
Fig. 2. Leaves and stem of the genus Montrichardia differentiated by the number of
secondary apical veins and by the number of prickles in stem. ML = Montrichardia linifera,
MA = Montrichardia arborescens e MAA= Montrichardia arborescens var. aculeata..........45
Fig. 3 Distribution of taxa densities in gradients: a) pH, b) electrical conductivity, c) water
transparency (Secchi deep), d) inundation of plot. ML = Montrichardia linifera, MA =
Montrichardia arborescens and MAA= Montrichardia arborescens var. aculeata................48
Fig. 4. Correlation between plant height (all taxa) and Secchi depth (water transparency).…49
Fig. 5. Correlation between biomass of Montrichardia spp: a) leaves biomass and pH and b)
stem biomass and pH …………………………………………………………..…………….50
Fig. 6. Discriminant analysis of morphological characters of ML = Montrichardia linifera,
MA = Montrichardia arborescens e MAA= Montrichardia arborescens var. aculeata.…….51
Fig.7. Chlorophyll a and b content in ML = Montrichardia linifera, MA = Montrichardia
arborescens and MAA= Montrichardia arborescens var. aculeata.………………….……...52
Fig. 8 Fv/Fm of ML = Montrichardia linifera, MA = Montrichardia arborescens and MAA=
Montrichardia arborescens var. aculeata and the relation with the flood level. ………..…...53
Fig. 9 Distribution of stems density per m2; a) Montrichardia arborescens b) Montrichardia
arborescens var. aculeata c) Montrichardia linifera in the Amazon Basin. The size of cycle
indicates the density of the taxa………………………………………………………………54
xvii
Fig. 10 Ordenation in two axes yielded by principal components analysis (PCA) of soil
properties in Amzon Basin. The color of the cycles represents the taxa present in the plot.
ML= Montrichardia linifera, MA = Montrichardia arborescens and MAA= Montrichardia
arborescens var. aculeata. Soil properties are given as vectors........................................... 55
Capítulo 3
Fig.1 Localização das áreas de amostragem das populações de Montrichardia spp. Em verde
observa-se a delimitação da Amazônia Legal Brasiliera..........................................................74
Fig. 2 Diferenças morfológicas nas folhas e caule de: a) Montrichardia linifera; b)
Montrichardia arborescens; c) Montrichardia arborescens var. aculeta................................74
Fig. 3 Dendrograma mostrando a relação entre as amostras de Montrichardia na Amazônia
brasileira, gerada por pares de grupos não ponderados por análise de paramento das distâncias
genéticas (Nei, 1972; UPGMA)................................................................................................82
Fig. 4 Correlação entre a distância genética (Nei, 1989) e geográfica (km) das população de
Montrichardia spp.....................................................................................................................83
Fig. 5 Relações entre haplótipos inferida a partir da análise Median-Joining implementada
pelo programa Network, com base na análise de nove locos de cpSSR de Montrichardia spp.
Cada círculo corresponde a um haplótipo e sua área é proporcional à frequência do haplótipo.
Cada traço observado nas linhas que unem os haplótipos representa um evento mutacional. O
ponto mv representa um haplótipo hipotético (median vector). As cores representam as
espécies.....................................................................................................................................84
Fig. 6 Relações entre haplótipos inferida a partir da análise Median-Joining implementada
pelo programa Network, com base na análise de nove locos de cpSSR de Montrichardia spp.
Cada círculo corresponde a um haplótipo e sua área é proporcional à frequência do haplótipo.
Cada traço observado nas linhas que unem os haplótipos representa um evento mutacional. O
ponto mv representa um haplótipo hipotético (median vector). As cores representam as
populações.................................................................................................................................85
xviii
Fig. 7 Distribuição geográfica de haplótipos observados em 18 populações de Montrichardia
spp para nove locos cpSSR. Os tamanhos dos círculos são proporcionais ao tamanho amostral
e as cores representam os haplótipos, conforme legenda à direita da figura............................87
Capítulo 4
Figure 1. Length of roots of M. arborescens in each treatment. Medians with standard
error………………………………………………………………………………………….117
Figure 2. Total biomass (shoot plus root) of M. arborescens in each treatment. Medians with
standard error………………………………………………………………………………..117
Figure 3. Fv/Fm values of Montrichardia arborescens from each CO2/temperature conditions.
Medians with standard error………………………………………………………………...118
Figure 4. Rapid light curves in the leaves of M. arborescens submitted to different
temperatures and CO2 concentrations. PPFD=photosynthetic photon flux density (µmol
photons/m2/second). ………………………………………………………………………...119
1
INTRODUÇÃO
A distribuição geográfica de plantas é frequentemente limitada por fatores climáticos,
pela competição entre as espécies e por barreiras geográficas que impeçam migrações
(Sculthorpe 1967; Woodward & Williams 1987; Woodward 1988; Santamaría 2002). Quando
expostas a fatores ambientais próximos da sua faixa de tolerância às espécies apenas
sobrevivem, tendo suas taxas de reprodução e crescimento diminuídas (Kasuga et al. 1999;
Camargo et al. 2003; Wang et al. 2003). Já as barreiras geográficas impedem tanto o fluxo
gênico, pela impossibilidade de troca de gametas, quanto à dispersão das plantas, e com isso
impossibilitam a interação entre populações e a colonização de novas áreas (Slatkin 1987). No
caso das plantas aquáticas, uma distribuição compatível com essas grandes barreiras terrestres
entre os corpos hídricos seria esperada. Entretanto, cerca de 39% dos gêneros que contem
macrófitas aquáticas são endêmicos de alguma região biogeográfica (Chambers et al. 2008).
Em nível mundial esse padrão de distribuição se deve à facilitação da dispersão propiciada
pelas navegações há mais de cinco séculos (Cook 1985); em níveis regionais e locais, outros
fatores como a conectividade hídrica, ao menos sazonal, podem ser de grande relevância
(Junk & Piedade 1997; Hoorn 2006).
A vegetação aquática na Bacia Amazônica está intimamente relacionada com os
corpos de água que podem ter diferentes propriedades físicas e químicas de acordo com a
geologia da área de drenagem (Piedade et al. 2010). As espécies de macrófitas aquáticas
podem habitar desde as várzeas férteis de água branca, e também os pobres e ácidos igapós de
águas pretas e claras (Sioli 1954). Nesse contexto surge uma importante questão: a
distribuição de macrófitas aquáticas na Amazônia Bacia está relacionada apenas às
propriedades da água dos rios, como acidez e penetração de luz, ou responde ao gradiente
Oeste-Leste do declínio da fertilidade descrito para as florestas de terra firme da Amazônia
(Ter Steege et al. 2006)?
Ao longo do tempo, as mudanças ambientais interferem na distribuição das espécies,
pois a ocorrência de uma espécie não está associada somente às características atuais do
ambiente, mas também aos eventos de mobilidade, exclusão e ingresso de populações que
ocorreram em resposta a mudanças de fatores físicos e edáficos ao longo do tempo
(Sculthorpe 1967; Hoffmann & Sgrò 2011). Fatores estressantes, ou seja, condições
2
desfavoráveis para o crescimento e desenvolvimento das plantas, podem ocorrer sazonalmente
ou permanentemente em um determinado ambiente (Larcher 2000). Os fatores estressantes
induzem o desenvolvimento de respostas adaptativas nas plantas, que variam com a
intensidade do estresse e envolvem mudanças nas rotas do metabolismo primário, (Larcher
2000; Taiz & Zeiger 2004).
Atualmente, com as mudanças ambientais ocorrendo em escala global, notadamente a
elevação da concentração atmosférica de CO2 (IPCC 2013), muitas espécies terão de se
adaptar a essa dinâmica, ou haverá uma probabilidade cada vez maior de extinção (Templeton
et al. 2001; Bellard et al. 2012). Além disso, mudanças no uso do solo na Amazônia como a
construção de barragens e estradas, têm contribuído para a perda de biodiversidade (Feeley et
al. 2012) .
A biodiversidade deve ser considerada nos diversos níveis de organização biológica,
que incluem genes, espécies, comunidades e ecossistemas (Meffe et al. 1997) e as atividades
humanas vêm causado impacto em todos esses níveis da biodiversidade. Em geral o impacto é
mais visível ao nível de espécie, enquanto que o impacto sobre a diversidade genética de uma
espécie, por ser menos aparente, é muitas vezes ignorado (Templeton et al. 2001; Crispo et al.
2011; Pauls et al. 2013). Além disso, a diversidade genética, por ser o nível mais baixo nesta
hierarquia da diversidade, tem um impacto direto sobre os níveis mais elevados por meio do
processo evolutivo.
As populações são conjuntos de indivíduos da mesma espécie que vivem em uma
mesma área, porém, isso não significa que populações de uma mesma espécie sejam
geneticamente ou espacialmente homogêneas (Silvertown & Doust, 1993). Elas apresentam
variadas diferenças estruturais. A estrutura genética depende da frequência gênica e
genotípica; a estrutura espacial está relacionada à variação de densidade; já a estrutura etária
depende do número relativo de indivíduos jovens e adultos, enquanto que a estrutura de
tamanho depende do número relativo de indivíduos grandes e pequenos (Silvertown & Doust
1993). Estudos sobre a distribuição espacial da variação genética dentro e entre as populações,
ou da estrutura genética de uma mesma população têm facilitado muito a compreensão da
especiação, adaptação e dinâmica populacional (Zhang et al. 2005), aspectos de vital
importância para a conservação.
A estrutura genética da população depende principalmente do fluxo gênico e da deriva
genética (Hamrick 1982). O fluxo gênico depende das migrações entre populações locais,
3
havendo aumento da diferenciação genética dentro de uma população, mas causando uma
diminuição da variação genética entre populações (Wright 1932). Já a deriva genética afeta a
frequência de um alelo na população devido à amostragem aleatória de gametas, promovendo
com isso a diminuição da variação genética dentro de uma população local, mas aumentando
a diferenciação genética entre populações pequenas (Wright 1969). As atividades humanas
frequentemente resultam na diminuição da deriva genética e no aumento do fluxo gênico de
muitas espécies, o que reduz a variação genética nas populações locais e evita a propagação
de complexos adaptativos para fora da sua população de origem (Crispo et al. 2011). Desta
forma, os processos adaptativos são perturbados local e globalmente dentro de uma espécie
(Silvertown & Doust 1993).
A deriva genética raramente ocorre independentemente da seleção natural (Silvertown
& Doust, 1993), a qual seleciona os organismos com as melhores adaptações ao ambiente. A
seleção natural é o único processo que pode resultar em mudanças adaptativas (Silvertown &
Doust 1993). Segundo Darwin (1859), três condições são necessárias para que ocorra a
seleção natural: (1) variação entre indivíduos; (2) herança da variação; (3) diferenças de
aptidão entre os variantes. Uma vez que essas condições estejam presentes, genótipos com
fenótipos de maior aptidão irão se multiplicar mais rapidamente na população que outros com
menor aptidão, havendo um potencial para mudanças adaptativas. Desta forma, os processos
ecológicos influenciam a estrutura genética das populações, por meio da seleção natural,
promovendo o aumento da variação genética (Silvertown & Doust 1993).
O conhecimento da estrutura genética de populações vegetais pode também ajudar a
explicar a evolução da alta diversidade vegetal encontrada nos trópicos (Eguiarte et al. 1992;
Hewitt, 2000; Hoorn et al., 2010). Segundo a Teoria de Equilíbrio Instável de Wright (1932) a
subdivisão de uma população em demes1 pequenos, havendo baixo fluxo gênico entre os
mesmos, poderia resultar em uma rápida diferenciação genética devida à deriva, levando a
uma eventual especiação simpátrica. Fedorov (1966) também defende que a alta diversidade
de espécies tropicais seria o produto de especiação não adaptativa, resultante do acasalamento
de indivíduos que são relacionados por ascendência (endogamia) e deriva genética,
provocadas por baixas densidades de indivíduos coespecíficos e autofecundação
predominante. Uma hipótese alternativa, a de Equilíbrio em Micro nichos, estabelece que a
diversidade em florestas tropicais resulte da adaptação das populações a nichos bastante
1 Populações locais pequenas que se intercruzam e partilham um conjunto de genes distintos.
4
específicos, definidos por fatores bióticos e abióticos (Dobzhansky 1950; Bawa 1990). Neste
caso haveria uma baixa endogamia e grandes tamanhos efetivos de população, com o modo de
especiação sendo similar ao de uma diferenciação alopátrica de espécies com fecundação
cruzada (alógamas) predominante (Eguiarte et al. 1992).
A alta capacidade reprodutiva de muitas plantas aquáticas na Amazônia pode estar
relacionada com as grandes flutuações do nível da água, ocasionada pelo pulso de inundação a
que elas estão sujeitas (Junk et al. 1989). A alta mortalidade de plantas durante a seca
favoreceu a seleção genética para altas taxas de reprodução que foram conseguidas
principalmente por reprodução vegetativa (Junk & Mello 1990; Piedade et al. 2010). Diante
disto, a variedade dentro e até mesmo entre as populações é pequena. Por outro lado,
observações de campo mostram que após uma grande seca há emergência de plântulas
provenientes do banco de sementes (D’Angelo 2009), o que favoreceria a variabilidade
genética dentro e entre as populações.
As populações respondem a cada ambiente diferentemente, visando garantir maior
eficiência na aquisição de carbono e sucesso reprodutivo (Kozlowski 1997; Dias-Filho 2005),
resultando em indivíduos com diferentes fenótipos (Silvertown & Doust 1993). A plasticidade
fenotípica retrata a habilidade de um organismo alterar sua fisiologia e/ou morfologia em
decorrência de sua interação com o ambiente (Bradshaw 1965; Schlichting 1986; Schlichting
& Pigliucci 1993; Stearns 1989; Scheiner 1993; Sultan 2000; Matesanz et al. 2012). Por
muito tempo acreditou-se que a plasticidade fenotípica limitaria o potencial para mudanças
evolutivas, por reduzir o impacto da seleção natural na estrutura genética de populações
(Wright 1932). Entretanto, atualmente estão sendo desenvolvidos novos métodos de estudos e
modelos matemáticos de genética quantitativa que descreveram a relação entre a plasticidade
fenotípica e importantes processos biológicos, revisando esse paradigma (Reed et al. 2011;
Thibert‐Plante & Hendry 2011).
A plasticidade fenotípica pode ser considerada um mecanismo gerador de
variabilidade fenotípica, uma vez que a seleção natural age sobre fenótipos criando
oportunidades para que mudanças genéticas ocorram. Além disto, se as divergências
fenotípicas geradas dentro de uma população forem mantidas por seleção disruptiva, haverá
favorecimento para o surgimento de subespécies, raças ou populações geneticamente únicas,
adaptadas ao seu ambiente local (ecótipos) (Via & Lande 1985; Thompson 1991). A
caracterização de ecótipos ou verificação de potencialidades para sua formação gera
5
importantes subsídios para maximizar a preservação da variabilidade genética, quando da
delimitação de áreas de conservação, ou quando projetos de manejo sustentado da flora
silvestre estiverem sendo efetuados (Nanson 1993; Lortie & Aarssen 1996). Espécies com
grande potencial para plasticidade em caracteres ligados à sobrevivência apresentam
vantagens adaptativas em ambientes instáveis, heterogêneos ou de transição, visto que as
mudanças produzidas podem facilitar a exploração de novos nichos, resultando no aumento da
tolerância às condições físico-químicas ambientais (Via 1993; Via et al. 1995). Desta forma,
espera-se que uma população que ocupe um ambiente heterogêneo ou de transição, como é o
caso das áreas alagáveis (zona de transição aquático-terrestre), apresente grande potencial
plástico em suas características fisiológicas e/ou morfológicas (Junk et al. 1989; Fuzeto &
Lomônaco 2000).
As planícies alagáveis são áreas úmidas que alternam as fases aquática e terrestre ao
longo do ano (Junk et al. 1989). Por apresentarem esta alternância de fases e porque seu uso e
funções ecológicas eram pouco conhecidos, por muito tempo as áreas inundáveis foram
consideradas prejudiciais para a população humana e sofreram inúmeras intervenções visando
sua modificação em todo o mundo (Junk 1997). Entretanto, nos dias de hoje as múltiplas
funções desses ambientes são amplamente reconhecidas e grandes esforços vêm sendo
aglutinados visando seu uso sustentável e conservação (Junk et al. 2014).
Nas áreas alagáveis amazônicas há uma grande diversidade vegetal, composta de
árvores, palmeiras, arbustos, herbáceas semi-aquáticas e aquáticas (Junk & Piedade 1997). O
pulso de inundação é o principal fator responsável pela estruturação das comunidades vegetais
nestas áreas (Junk et al. 1989). A adaptação das plantas ao regime de inundação ocorre em
resposta à interação entre frequência, magnitude e previsibilidade dos eventos que causam
mortalidade (Lytle & Poff 2004). As macrófitas aquáticas enraizadas, por exemplo, estão
sujeitas a estresses típicos do ambiente aquático, como a formação de ondas, escassez de
oxigênio, instabilidade do substrato, mas também a variação periódica do nível da água, que
causa mudanças drásticas no ambiente (Junk & Piedade 1997; Piedade et al. 2013).
Para sobreviver nas áreas alagáveis as plantas precisam superar as restrições
decorrentes da redução periódica do oxigênio disponível e da intensidade de luz (Junk &
Piedade 1997). Dentre as espécies que ocorrem nesses ambientes, as macrófitas aquáticas são
as mais bem adaptadas à inundação, ocupando áreas onde a cota do nível do rio pode atingir
até 10 m de amplitude e a inundação pode ter uma duração de mais de 230 dias por ano (Junk
6
1989). As macrófitas aquáticas são capazes de colonizar ambientes com as mais diversas
características físicas e químicas devido à grande plasticidade fisiológica que possuem.
Segundo Sculthorpe (1967) durante a evolução as plantas aquáticas retornaram do ambiente
terrestre para o ambiente aquático, desenvolvendo assim progressivas adaptações para a vida
aquática, que podem ser visualizadas pelos diferentes hábitos de vida, tais como: submersas,
flutuantes, enraizadas com folhas flutuantes e emergentes. Cada um desses tipos biológicos
reage diferentemente às oscilações do nível da água (Humphries 1996; Thomaz & Bini 2003).
Os modelos clássicos de distribuição e desenvolvimento da vegetação aquática
geralmente são baseados nas relações fisiológicas entre as plantas e as condições ambientais,
na sua tolerância e na sua habilidade para crescer nestas diferentes condições (Cancian et al.
2009). Os padrões de crescimento desses vegetais estão relacionados principalmente com
luminosidade, temperatura, disponibilidade de nutrientes, pH, alcalinidade, salinidade,
velocidade da corrente, variação no nível de água e processos ecológicos, sendo que as
variáveis abióticas e bióticas atuam em conjunto sobre uma população ou sobre um indivíduo
(Madsen et al. 1998; Riis et al. 2000; Murphy 2002; Barendregt & Bio 2003; Neiff & Neiff
2003; Henry-Silva & Camargo 2005).
As adaptações morfológicas, anatômicas, fisiológicas e fenológicas de plantas
aquáticas são tidas como respostas às mudanças físico-químicas resultantes das oscilações
entre fases terrestres e aquáticas (Nogueira & Couto, 2004). As adaptações morfológicas
incluem redução do tamanho corpóreo, mudança na alocação de biomassa e mudanças
fisiológicas e no ciclo de vida (crescimento e reprodução), que é sincronizado ao pulso de
inundação (Junk et al. 1989; Lytle & Poff 2004). Quando comparados indivíduos da mesma
espécie, emergentes e terrestres, nota-se alterações anatômicas como redução do parênquima
paliçádico e sua substituição por espaços celulares ocupados por ar, redução da quantidade e
da posição dos estômatos, redução do xilema e da lignificação das fibras do floema
(Sculthorpe 1967; Simpson, 1988; Boeger & Poulson, 2003).
A natureza das adaptações fisiológicas pode variar bastante entre espécies, tanto de
acordo com as características genéticas, quanto em função da disponibilidade dos recursos
ambientais. As adaptações podem influenciar diretamente parâmetros responsáveis pela
aquisição diária de carbono como a capacidade fotossintética e a eficiência quântica e a
absorção e uso de nutrientes do solo, que influenciam o metabolismo primário (Pimenta et al.
1998; Parolin 2001; De Simone et al. 2002). Assim, o estudo do comportamento
7
ecofisiológico de espécies vegetais que colonizam diferentes ecossistemas inundáveis é uma
importante ferramenta para compreender os potenciais efeitos de alterações ambientais.
Além das adaptações à inundação, as espécies de áreas alagáveis precisam de
adaptações para sobreviver na época de seca (Lytle & Poff 2004). O ciclo de vida de diversas
espécies foi sincronizado, ao longo do tempo geológico, com o regime de inundação. Isto só é
possível se o regime de secas e cheias for previsível ao longo dos anos. A macrofita aquática
emergente Echinochloa polystachya, por exemplo, floresce todos os anos na época de cheia e
se reproduz por rebrotamento na época de seca (Piedade et al. 1991). Espécies, com ciclo de
vida adaptado ao regime de inundação, em caso de alterações deste regime (como da
construção de barragens), que resultem em inundações em diferentes períodos do ano, seriam
extremamente afetadas, podendo ocasionar a diminuição das taxas de reprodução e
sobrevivência (Junk & Mello 1990; Thomaz & Bini 2003; Lytle & Poff 2004). Já no caso das
plantas flutuantes, a frequência de ocorrência das espécies praticamente não se altera em
resposta à oscilação brusca do nível de água, embora possa haver um aumento de biomassa de
algumas espécies quando o nível retorna ao normal, possivelmente devido às alterações na
química da água (Thomaz & Bini 2003). Desta forma, dentre as macrófitas aquáticas, as fixas
ao substrato seriam as melhores indicadoras de mudanças provocadas na amplitude na
inundação.
As macrófitas aquáticas são as principais produtoras nas áreas alagáveis, favorecendo
o processo de ciclagem de nutrientes, atuando, ainda, como armazenadoras de nutrientes em
sua biomassa (Thomaz & Esteves 1986; Melack & Fosberg 2001; Piedade et al. 2001). Além
disso, essas plantas afetam a química da água por meio da fotossíntese e promovem substrato
para consumidores e decompositores, sendo responsáveis pela oxigenação e depuração da
água, proteção das margens da ação erosiva da água; servem inclusive como refúgio para
diversas espécies de vertebrados e invertebrados aquáticos (Esteves 1998). Sua distribuição na
planície de inundação depende da duração da fase aquática e terrestre, da estabilidade física
do habitat, que é influenciada pelos processos de sedimentação e erosão, dos processos
sucessionais relacionados com o período de vida e idade das plantas, e de impactos humanos
(Junk & Piedade 1997). Por terem um ciclo de vida curto e altas taxas reprodutivas, as
macrófitas aquáticas são representativas das condições ambientais atuais, diferentemente das
árvores que respondem às mudanças ambientais mais lentamente (Junk & Piedade 1997; Junk
et al. 2011).
8
O reconhecimento da variabilidade estrutural e funcional no tempo e no espaço é de
grande importância para o estabelecimento de políticas de conservação ambiental (Frankham
et al. 2002; Allendorf & Luikart 2007). Pesquisas sobre variabilidade genética com o uso de
marcadores moleculares têm sido amplamente utilizadas em plantas aquáticas consideradas
daninhas como Eichhornia crassipes (Cardoso et al. 2003), Egeria densa, Egeria najas
(Martins et al. 2003; Rodella et al. 2006) e Pistia stratiotes (Cardoso et al. 2005; Cícero et al.
2007). Essa metodologia pode fornecer subsídios para avaliação da origem e dispersão de
espécies nativas ou exóticas, bem como servir como ponto de partida para estudos de manejo
(Martins et al. 2003). Além disso, a ocorrência de variedades ou ecótipos de macrófitas
aquáticas em função de mudanças ambientais nas planícies inundáveis brasileiras poderia
constituir um indicativo dos efeitos de alterações antrópicas nestas áreas, possibilitando
propor estratégias de conservação e manejo adequado das espécies e ambientes.
A análise de marcadores moleculares pode contribuir também para a delimitação de
espécies (Guichoux et al. 2011; Wang et al. 2011). O gênero Montrichardia Crueg. inclui
plantas que podem ser encontradas nas áreas úmidas da América Latina (Mayo et al. 1997;
Croat et al. 2005). Atualmente duas espécies são reconhecidas no gênero, Montrichardia
arborescens (L.) Schott e Montrichardia linifera (Arruda) Schott (Croat et al. 2005), havendo
ainda a descrição da variedade M. arborescens aculeata (G. Mey.) Engl. (Lins 1994) e a
espécie extinta Montrichardia aquatica (Herrera 2008). Alguns estudos utilizando caracteres
morfológicos de folhas apontam para a definição de apenas uma espécie, M. linifera (Silva et
al. 2012), enquanto outros estudos apontam para a separação das duas espécies (Mirouze et al.
2012).
A espécie M. linifera ocorre em altas densidades na várzea amazônica, colonizando as
margens de rios e lagos, enquanto M. arborescens tem uma distribuição mais esparsa ao longo
dos rios amazônicos, ocupando o sub-bosque de florestas alagáveis (Lopes & Piedade 2012;
CRIA 2014). Montrichardia arborescens var. aculeata (G.Mey.) Engl. difere de M.
arborescens pelo grande número de acúleos e é encontrada principalmente em ambientes de
água salobra, perto da costa brasileira (Lins 1994). Apesar do maior número de registros em
herbários para M. arborescens (CRIA 2014), M. linifera ocupa uma vasta área ao longo do
Rio Amazonas (CRIA 2014).
Apesar da alta diversidade de espécies, das variadas formas de vidas e de sua ampla
distribuição geográfica, a origem e evolução da família Araceae ainda é pobremente
conhecida. Seu registro fóssil é escasso e controverso (Herendeen & Crane 1995). O
9
desenvolvimento de modelos de nicho ecológico pode ser importante para investigar padrões
e processos biogeográficos, possibilitando a previsão da distribuição geográfica de espécies a
partir de dados esparsos de ocorrência (Guisan & Thuiller 2005). Além disso, a modelagem
do nicho ecológico das espécies e dados históricos da biodiversidade tem sido utilizada para
prever a distribuição das espécies frente às mudanças climáticas (Siqueira & Peterson 2003).
Os organismos desenvolveram adaptações ao longo do processo evolutivo para
enfrentar as modificações ambientais naturais, e esta especificidade de respostas pode também
contribuir negativamente para a sobrevivência das espécies em face de desafios agudos, como
os de origem antrópica (Brauner et al. 1999; Val & Almeida-Val 2004; Lopes et al. 2009).
Nesse sentido, do gênero Montrichardia foi escolhido para gerar um conjunto de informações
sobre as características adaptativas e fisiológicas das espécies componentes, de forma a
entender como as modificações ambientais interferem sobre esse grupo de plantas de
fundamental importância para a biota aquática, contribuindo ainda para a delimitação
taxonômica das espécies.

10
OBJETIVO GERAL
Determinar como macrófitas aquáticas amazônicas congenéricas respondem à
diferentes desafios ambientais de origem natural e antrópica.
11
Objetivos Específicos
I. Modelar a distribuição potencial do gênero Montrichardia. nos Neotrópicos e analisar a
distribuição dos táxons na Bacia Amazônica;
II. Caracterizar a variação morfológica e fisiológica entre populações de M. arborescens, M.
arborescens var. aculeata e M. linifera submetidas a ambientes com diferentes condições
nutricionais na Bacia Amazônica;
III. Caracterizar geneticamente as populações de M. arborescens, M. linifera e M.
arborescens var. aculeata na Bacia Amazônica e identificar o grau de diferenciação
genética existente entre as espécies do gênero Montrichardia;
IV. Determinar o efeito da elevação de CO2 e temperatura na germinação, crescimento e
fisiologia de M. arborescens.

12
Capítulo 1
______________________________________________________________________
Lopes et al. (submetido) Modeling distribution
and ecological niches of Montrichardia Crueg.
(Araceae) in the Neotropics, Aquatic Botany.
13
Modeling distribution and ecological niches of Montrichardia Crueg. (Araceae) in
the Neotropics
Aline Lopes1, Florian Wittmann
2, & Maria Teresa Fernandez Piedade
3
1Graduate Program in Ecology, Instituto Nacional de Pesquisas da Amazônia - INPA Grupo de Ecologia,
Monitoramento e Uso Sustentável de Áreas Úmidas – MAUA. CP 47869011-970 Manaus, Amazonas, Brazil
2 Max Planck Institute for Chemistry, Biogeochemistry Dep. Mainz, Germany [email protected]
3 Instituto Nacional de Pesquisas da Amazônia, CDAM/ Grupo MAUA “Ecologia, Monitoramento e Uso
Sustentável de Áreas Úmidas Amazônicas”[email protected]
Highlights:
1. Climatic factors influence the distribution of species at a Neotropical scale.
2. Hydrochemical factors influence the distribution of axa at an Amazonian scale.
3. The models were able to predict the presence of congeneric species.
Abstract: Congeneric aquatic plant species may colonize different aquatic ecosystems
in the Amazon through adaptations in growth and reproduction to cope with diverse
environmental challenges. Montrichardia is a Neotropical genus comprised of two species:
M. linifera and M. arborescens, the latter with the variety aculeata. Ecological niche
modeling is an important tool to understand factors controlling specie distribution. The study
of the geographical distribution of the species was based on herbarium data as well as species
sampling in 55 sites across the Amazon Basin in different water bodies, covering an estimated
area of 3.8 million km2. The modeling algorithm for maximum entropy distribution –
MAXENT - was used to analyze the distribution patterns in relation to climatic and
environmental factors on a large scale (Neotropics). With comparatively few data and
environmental layers, the model was able to predict whit high accuracy the occurrence of
these congeneric species. At the large scale M. arborescens showed a wide distribution
occurring in Central America and the Amazon Basin while M. linifera seems to be restricted
14
to the Guyana Shield and Andean regions. At the regional scale (Amazon basin),
hydrochemical factors such as the type of water (black or white) appear to influence the
distribution of both species. The ecological niche of the species showed that M. linifera has a
potential for wider distribution than M. arborescens, especially within the Amazonian Basin.
Key-words: Wetlands, Araceae, aquatic macrophytes, Maxent.
Introduction
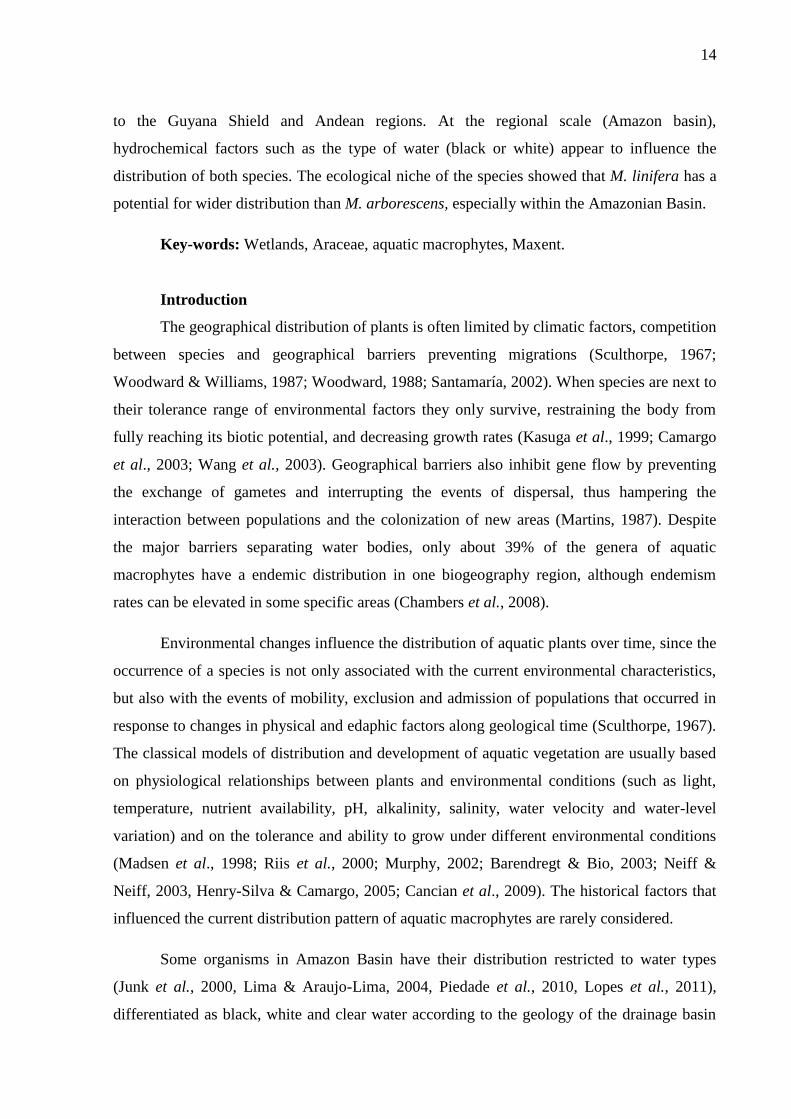
The geographical distribution of plants is often limited by climatic factors, competition
between species and geographical barriers preventing migrations (Sculthorpe, 1967;
Woodward & Williams, 1987; Woodward, 1988; Santamaría, 2002). When species are next to
their tolerance range of environmental factors they only survive, restraining the body from
fully reaching its biotic potential, and decreasing growth rates (Kasuga et al., 1999; Camargo
et al., 2003; Wang et al., 2003). Geographical barriers also inhibit gene flow by preventing
the exchange of gametes and interrupting the events of dispersal, thus hampering the
interaction between populations and the colonization of new areas (Martins, 1987). Despite
the major barriers separating water bodies, only about 39% of the genera of aquatic
macrophytes have a endemic distribution in one biogeography region, although endemism
rates can be elevated in some specific areas (Chambers et al., 2008).
Environmental changes influence the distribution of aquatic plants over time, since the
occurrence of a species is not only associated with the current environmental characteristics,
but also with the events of mobility, exclusion and admission of populations that occurred in
response to changes in physical and edaphic factors along geological time (Sculthorpe, 1967).
The classical models of distribution and development of aquatic vegetation are usually based
on physiological relationships between plants and environmental conditions (such as light,
temperature, nutrient availability, pH, alkalinity, salinity, water velocity and water-level
variation) and on the tolerance and ability to grow under different environmental conditions
(Madsen et al., 1998; Riis et al., 2000; Murphy, 2002; Barendregt & Bio, 2003; Neiff &
Neiff, 2003, Henry-Silva & Camargo, 2005; Cancian et al., 2009). The historical factors that
influenced the current distribution pattern of aquatic macrophytes are rarely considered.
Some organisms in Amazon Basin have their distribution restricted to water types
(Junk et al., 2000, Lima & Araujo-Lima, 2004, Piedade et al., 2010, Lopes et al., 2011),
differentiated as black, white and clear water according to the geology of the drainage basin

15
(Sioli, 1968). This classification is a simple categorization of water types, because the water
color can be easily related to its physicochemical characteristics (Sioli, 1968; Furch, 2000;
Junk et al., 2011). White-water rivers drain Andean and pre-Andean terrains originating from
lake and estuary sediments of the Tertiary and Pleistocene periods and thus they are rich in
dissolved minerals (Furch & Junk, 1997). Intense erosion and depositional processes result in
high loads of suspended matter being transported, resulting in a floodplain with a muddy
colored water (várzea). The floodplain with no suspended material of clear and black water
rivers (igapós) drain the Precambrian and Paleozoic formations of the Brazilian and Guiana
shields (Furch & Junk, 1997). The black water rivers are originated from lowland regions
with bleached sandy soil, the end product of weathering (Mounier et al., 1998) and are
characterized by high level of dissolved humic substances, low pH (acidic waters) and low
suspended particulate matter concentration. The clear water rivers are characterized by a high
phytoplankton production, comparable to that in the várzea lakes (Richey et al., 1990; Junk,
1997). Both white and clear waters have more aquatic plants and floating meadows than black
waters (Piedade et al., 2010). There are few species of aquatic macrophytes occurring in igapó
floodplains, the Cyperaceae, Poacea, Maranthaceae and Araceae are the families more
common in igapó of Negro River (Piedade et al., 2010, Lopes et al., 2014).
The origin and evolution of the Araceae family is still poorly known (Nauheimer et
al., 2012), despite its high diversity of species (about 3.790 species), varied forms of life
(lianas, epiphytes and herbaceous) and widespread geographic distribution, occurring in sub-
tropical, tropical and temperate climates (Watson & Dallwitz, 1992, Boyce & Croat, 2011).
Their fossil records are sparse and controversial (Herendeen et al., 1992). Montrichardia is
exclusively Neotropical (Mayo, 1997) and contains only two species of aquatic macrophytes,
M. linifera and M. arborescens, both known popularly as Aroid Marsh and in Brazil as
“Aninga”. Populations of both species occur in the Amazon Basin, often forming
monospecific stands. M. linifera occurs with high densities in the Amazonian várzea,
colonizing the edges of rivers and lakes, while M. arborescens occurs mainly in igapó,
fringing the understory of floodplain forests (Lopes & Piedade., 2012; CRIA, 2014).
Montrichardia arborescens var. aculeata (G.Mey.) Engl. differs from M. arborescens by the
large number of prickles and is mostly found in brackish environments (Lins, 1994).
The causes of the niche separation of these three taxa have not yet been explained.
However, since as a general pattern the effect of climatic and physical factors (as temperature,
rainfall, elevation, geology, vegetation, inferring geographical regions), at certain scales affect
the distributions of species (Soberón & Peterson, 2005). The development of ecological niche
16
modeling is an important tool to investigate biogeographic patterns, allowing the prediction of
geographic distribution of species from sparse occurrence data (Guisan & Thuiller, 2005).
Moreover, modeling the ecological niche of species and biodiversity historical data has been
used to predict the distribution of species in face of future climate change (Siqueira &
Peterson, 2003; Pearson & Dawson, 2003; Thomas et al., 2004).
In this study we infer about the patterns of geographic distribution of the three
Montrichardia taxa and estimate the ecological niche of two species, aiming of test if the
species’ distribution responds either to Neotropical climatic factors or to local environmental
factors. Montrichardia was chosen to test the accuracy of modeling techniques in order to
elucidate how its two congeneric species with differential distribution over the Amazon basin
respond to the same environmental variables. Moreover, this analyses permit to test if the
number of records is a good indicator of the niche size. Our hypothesis is that despite the
larger number of records of M. arborescens, M. linifera has a fundamentally wider ecological
niche than M. arborescens, because the former species has been detected in a much smaller
geographical range (CRIA, 2014).
Material and methods
Two data sets were analyzed (Fig. 1): A) To analyze the influence of local
environmental in three taxa distribution we performed field sampling in a total of 55 different
sites distributed over an area of 3.8 million km2 within the Amazon Basin (Fig. 2). B) To
make the Maxent model we used georeferenced data gathered from herbarium material of
registered sites in the CRIA (2014, appendix 1) and MOBOT (2014), in a total of 170 records
for Montrichardia arborescens (MA) and 93 records for M. linifera (ML). As Montrichardia
arborescens var. aculeata (MAA) variety is not recognized by the herbarium, it was not
considered for analysis of distribution patterns using data from herbarium.
17
Fig. 1. Flowchart of the analysis of data from herbarium and field sample. MA =
Montrichardia arborescens; ML = M. linifera and MAA = Montrichardia arborescens var.
aculeata.
Field Sampling
Field observations were carried out on expeditions to different water bodies in the
Brazilian Amazon during the period of 2009-2012 (Fig. 2), including the localities in Porto
Velho Roraima State, Juruá Amazonas State, Manaus Amazonas State, Barcarena Pará State,
Solimões Rives in Tabatinga Amazonas State, Boa Vista Raraima State; Anavilhanas
Archipelago Amazonas State, Praia Grande Amazonas State; Água Boa do Univini Amazonas
State, Barcelos Amazonas State, Jari Amapá State, Parú Amapá State, Tapajós Pará State,
Salinópolis Pará State. The study covered as well the three major Amazonian water types, the
white, black and clear water at lakes and rivers (Table 1).
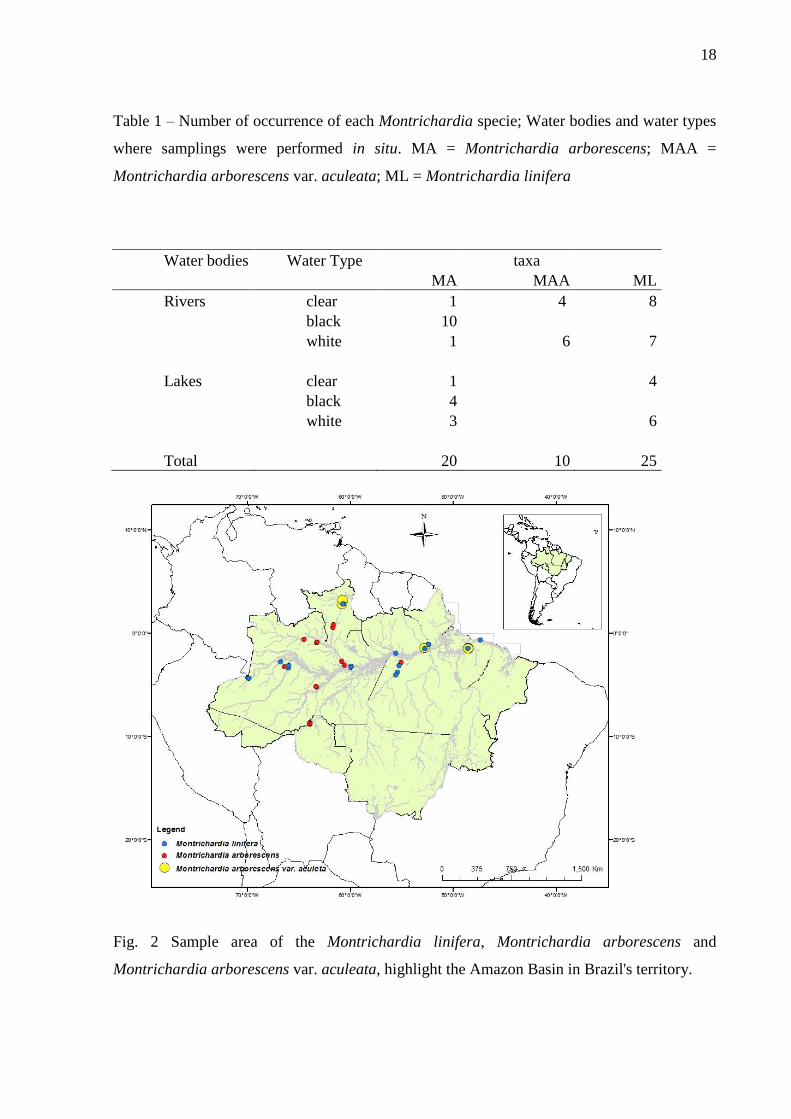
18
Table 1 – Number of occurrence of each Montrichardia specie; Water bodies and water types
where samplings were performed in situ. MA = Montrichardia arborescens; MAA =
Montrichardia arborescens var. aculeata; ML = Montrichardia linifera
Water bodies Water Type taxa
MA MAA ML
Rivers clear 1 4 8
black 10
white 1 6 7
Lakes clear 1 4
black 4
white 3 6
Total 20 10 25
Fig. 2 Sample area of the Montrichardia linifera, Montrichardia arborescens and
Montrichardia arborescens var. aculeata, highlight the Amazon Basin in Brazil's territory.
19
Analyses of field data
In the field, each population was georeferenced and population density estimated by
counting all stems in one 2x2 m quadrate established. The physical and chemical data of the
water (pH, electric conductivity, percentage of oxygen, Secchi depth and water column depth)
were measured with portable devices (WTW, model pH 315i; WTW, model cond 315i and
WTW, model oxi 325, respectively). The maximum flood level in the plot was estimated by
measuring the watermark of the last high water period on the nearest tree to the sample area.
The relationship between the presence of the species and the physical and chemical
parameters was analyzed with logistical regression.
Following Mayo (1997), the two species of Montrichardia can be easily recognized in
the field by the difference in the amount of secondary apical veins. M. linifera (ML) dispose
of 6 to 9 veins (Fig. 3a), whereas M. arborescens (MA) has 3 to 5 veins (Fig. 3b), while the
variety M. arborescens var. aculeata (MAA) is distinguished by the large number of prickles
on the stem (Fig.3c) while the two other taxa have less prickles in the stem.
Fig. 3 Leaves and stem of Montrichardia genus differentiated by the number of secondary
apical veins and the prickles in the stem. a) Montrichardia linifera, b) Montrichardia
arborescens and c) Montrichardia arborescens var. aculeata.
The species distribution was performed using Arc GIS 10.0 Software. The distribution
pattern of each taxa population in the Amazonian Basin was analyzed using Ripley's K
function with 1000 permutations of all sampled populations (Ripley, 1981). The function K(t)
is defined as the expected number of individual populations within a distance t of a randomly
chosen individual. Under the null hypothesis of complete spatial randomness, i.e., a Poisson
process, the expected value of K(t)=πt2. Edge effects are corrected by the method described
20
by Diggle (1983) and ter Braak (1980). The resulting estimates of K(t) were transformed to
K*(t) = √[K(t)/π]-t. This transformation stabilizes the sampling variances of the estimates [see
Besag in the discussion of Ripley (1977)] and gives a function whose expectation under the
null hypothesis is zero for all distances t. Negative values of K*(t) indicate a regular pattern
and positive values an aggregated pattern. A plot of K*(t) against t therefore reveals spatial
pattern at various scales. Statistical analyzes were performed using the R 3.0.1 Software.
Direct ordination of presence/ausence of taxa to environmental gradients was also made in
Comunidata 1.6 Software.
Analyses of herbarium data
To model the potential distribution and niche of Montrichardia species in the
Neotropics we used the Maximum Entropy Method (MAXENT) general purpose machine
learning method, which has been adapted and developed as a software (MaxEnt) for species
distribution modeling (Phillips et al., 2006) and identified as one of the most accurate
methods for species niche modeling (Elith et al., 2006). From small numbers of occurrence
records MAXENT was better than others algorithms like GARP (Genetic Algorithm for Rule
Set Production) when sample sizes were experimentally reduced to less than 10 presence-
records (Pearson et al., 2007). MaxEnt version 3.3.3k was used to perform the analysis
(http://www.cs.princeton.edu/~schapire/MaxEnt/). The method combines biological data of
species occurrence (presence-only data) with environmental characteristics (e.g., GIS layers
with a grid of values for the geographic area considered; table 02) to estimate the probability
of distribution of maximum entropy (i.e., closest to uniform), subject to the set of constraints
provided (i.e., environmental characteristics where the species occurs) (Phillips et al., 2006).
For each species, 30% of samples were used for the validation of the model. All other settings
were set as default as they perform well and are robust for a large range dataset.
Fifteen environmental variables were used with a resolution of 1 km, extracted of
public data bases (Table 02). Variables were used individually and in several combinations in
the search for the best MAXENT model with the lowest number of variables for the species to
be tested. All models were made using 1000 permutations.
The performance of models was assessed using three methods: (i) the area under curve
(AUC) of the receiver-operating characteristic (ROC) (ii) the jackknife validation method (iii)
and by plotting our collected occurrence data in the model. In addition, results were
interpreted in accordance with ecological knowledge of the studied species (see chapters 2, 3
and 4).
21
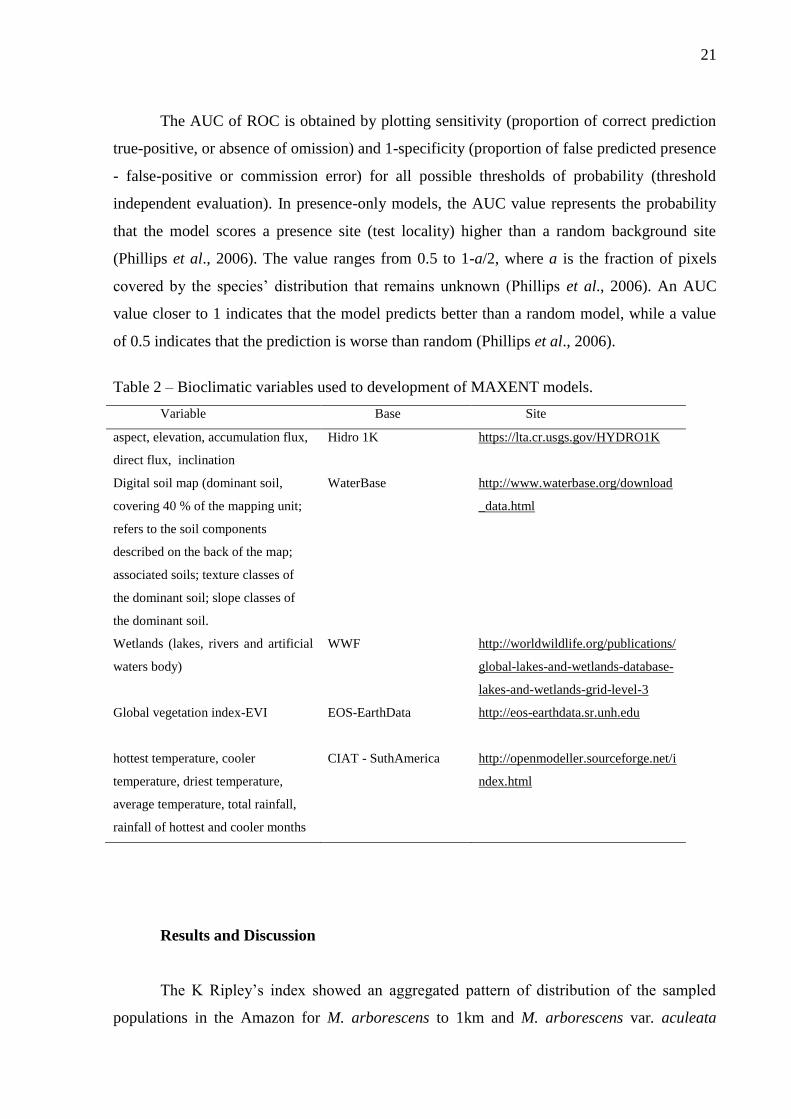
The AUC of ROC is obtained by plotting sensitivity (proportion of correct prediction
true-positive, or absence of omission) and 1-specificity (proportion of false predicted presence
- false-positive or commission error) for all possible thresholds of probability (threshold
independent evaluation). In presence-only models, the AUC value represents the probability
that the model scores a presence site (test locality) higher than a random background site
(Phillips et al., 2006). The value ranges from 0.5 to 1-a/2, where a is the fraction of pixels
covered by the species’ distribution that remains unknown (Phillips et al., 2006). An AUC
value closer to 1 indicates that the model predicts better than a random model, while a value
of 0.5 indicates that the prediction is worse than random (Phillips et al., 2006).
Table 2 – Bioclimatic variables used to development of MAXENT models.
Variable Base Site
aspect, elevation, accumulation flux,
direct flux, inclination
Hidro 1K https://lta.cr.usgs.gov/HYDRO1K
Digital soil map (dominant soil,
covering 40 % of the mapping unit;
refers to the soil components
described on the back of the map;
associated soils; texture classes of
the dominant soil; slope classes of
the dominant soil.
WaterBase http://www.waterbase.org/download
_data.html
Wetlands (lakes, rivers and artificial
waters body)
WWF http://worldwildlife.org/publications/
global-lakes-and-wetlands-database-
lakes-and-wetlands-grid-level-3
Global vegetation index-EVI EOS-EarthData
http://eos-earthdata.sr.unh.edu
hottest temperature, cooler
temperature, driest temperature,
average temperature, total rainfall,
rainfall of hottest and cooler months
CIAT - SuthAmerica http://openmodeller.sourceforge.net/i
ndex.html
Results and Discussion
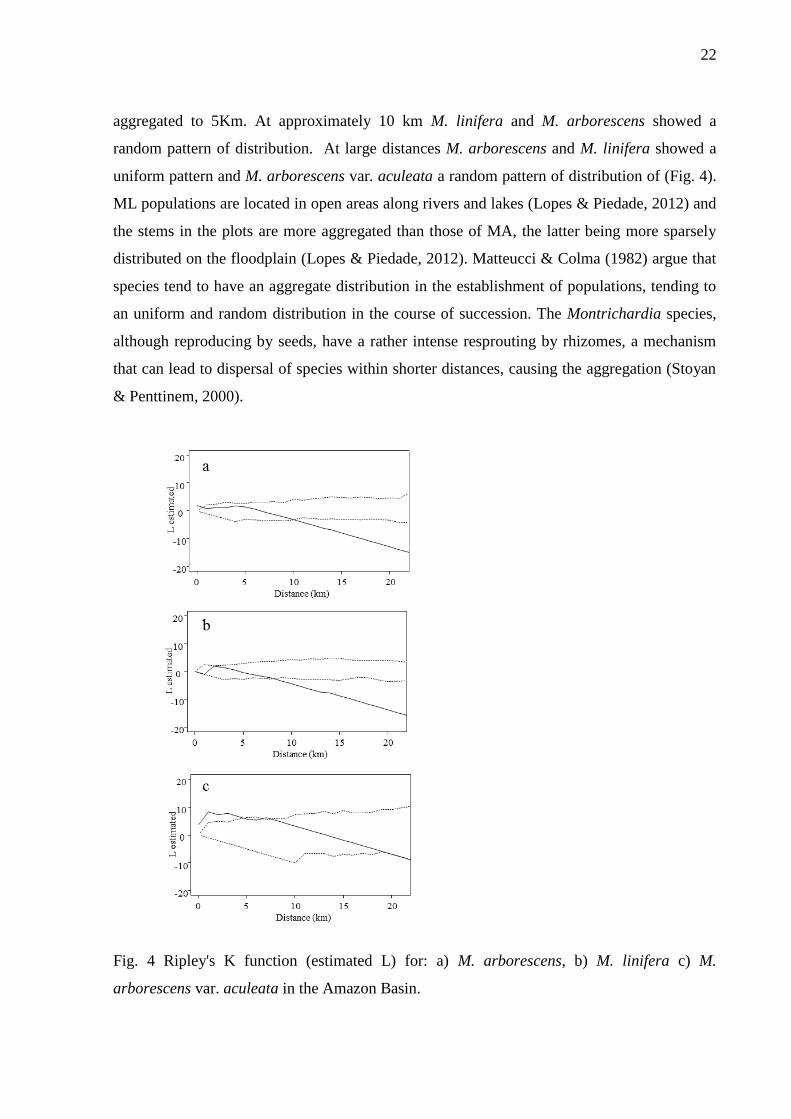
The K Ripley’s index showed an aggregated pattern of distribution of the sampled
populations in the Amazon for M. arborescens to 1km and M. arborescens var. aculeata
22
aggregated to 5Km. At approximately 10 km M. linifera and M. arborescens showed a
random pattern of distribution. At large distances M. arborescens and M. linifera showed a
uniform pattern and M. arborescens var. aculeata a random pattern of distribution of (Fig. 4).
ML populations are located in open areas along rivers and lakes (Lopes & Piedade, 2012) and
the stems in the plots are more aggregated than those of MA, the latter being more sparsely
distributed on the floodplain (Lopes & Piedade, 2012). Matteucci & Colma (1982) argue that
species tend to have an aggregate distribution in the establishment of populations, tending to
an uniform and random distribution in the course of succession. The Montrichardia species,
although reproducing by seeds, have a rather intense resprouting by rhizomes, a mechanism
that can lead to dispersal of species within shorter distances, causing the aggregation (Stoyan
& Penttinem, 2000).
Fig. 4 Ripley's K function (estimated L) for: a) M. arborescens, b) M. linifera c) M.
arborescens var. aculeata in the Amazon Basin.
23
Montrchandia linifera does not occur along the black rivers (Table 1; Fig. 5) and is
likely to be limited to environments with high nutrient availability, were it forms large
monospecific stands in rivers and lakes (Table 3). The analysis of M. arborescens field data
showed that the species occurs preferentially along the margin of black rivers and lakes, and
is also found in lower densities in várzea floodplains (Table 1 and 3). The occurrence of M.
arborescens in the Brazilian part of the Amazon seems to be related to black and clear-water
lowland rivers and upland streams, although some records for the Amazon River are available
in herbaria (Fig. 1). This species demonstrates ability to colonize environments with distinct
abiotic characteristics and low amount of nutrients (Lopes & Piedade, 2012), which explains
its distribution along clear and black waters. The MAA variety was found only in Roraima
(Cauamé River), Amapá (Paru River) and Pará (Piramonha River), occurring only in white
and clear-water rivers (Fig. 2; Table 3). We argue that this variety might be a hybrid of MA
and ML. Genetic test needs to be performed to confirm this hypothesis (see Chapeter 3).
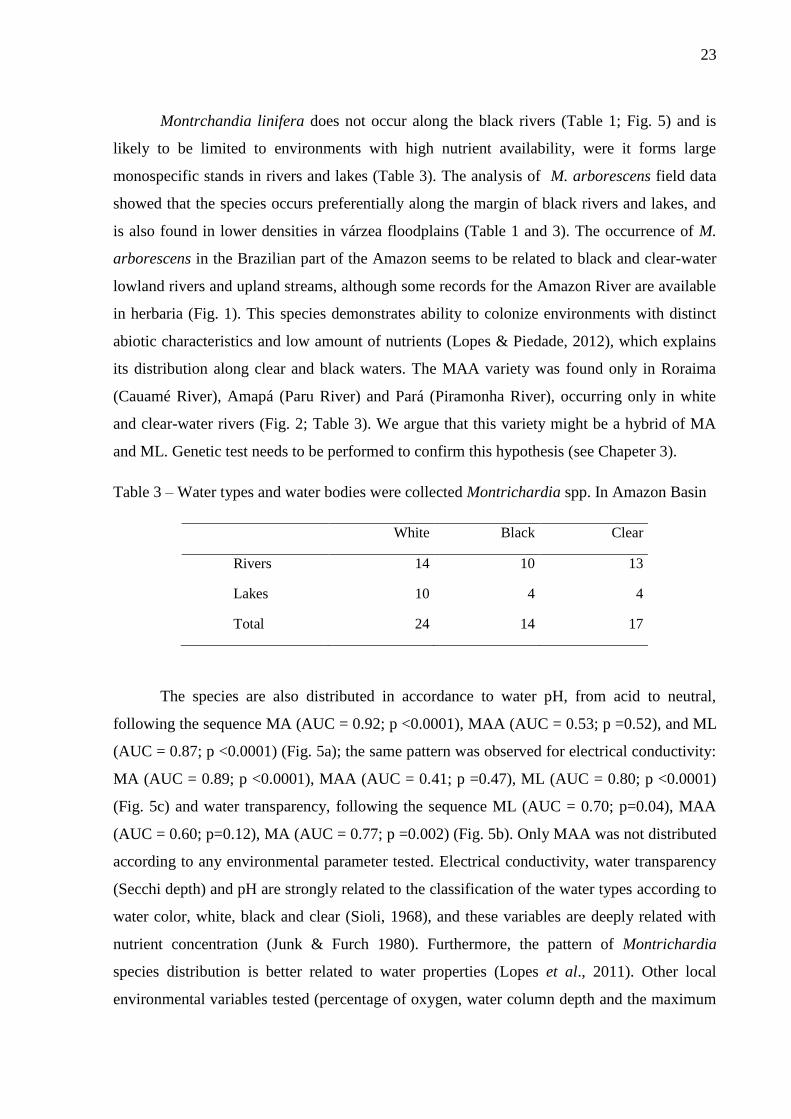
Table 3 – Water types and water bodies were collected Montrichardia spp. In Amazon Basin
White Black Clear
Rivers 14 10 13
Lakes 10 4 4
Total 24 14 17
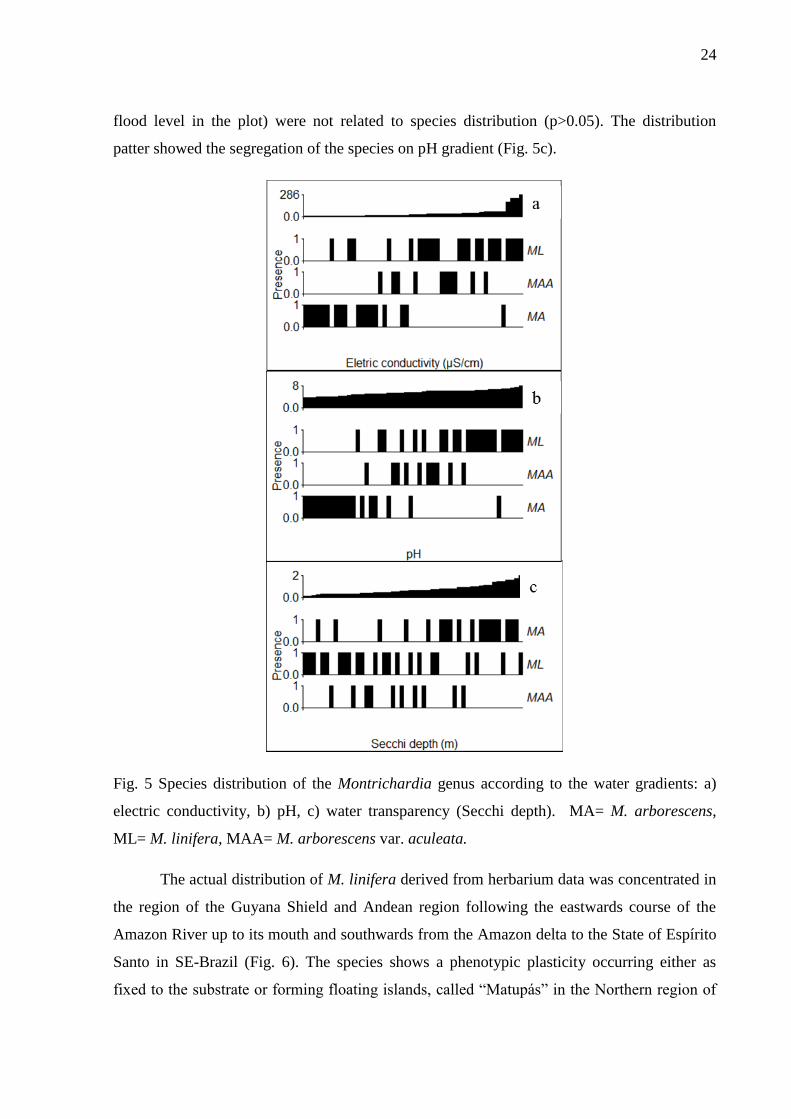
The species are also distributed in accordance to water pH, from acid to neutral,
following the sequence MA (AUC = 0.92; p <0.0001), MAA (AUC = 0.53; p =0.52), and ML
(AUC = 0.87; p <0.0001) (Fig. 5a); the same pattern was observed for electrical conductivity:
MA (AUC = 0.89; p <0.0001), MAA (AUC = 0.41; p =0.47), ML (AUC = 0.80; p <0.0001)
(Fig. 5c) and water transparency, following the sequence ML (AUC = 0.70; p=0.04), MAA
(AUC = 0.60; p=0.12), MA (AUC = 0.77; p =0.002) (Fig. 5b). Only MAA was not distributed
according to any environmental parameter tested. Electrical conductivity, water transparency
(Secchi depth) and pH are strongly related to the classification of the water types according to
water color, white, black and clear (Sioli, 1968), and these variables are deeply related with
nutrient concentration (Junk & Furch 1980). Furthermore, the pattern of Montrichardia
species distribution is better related to water properties (Lopes et al., 2011). Other local
environmental variables tested (percentage of oxygen, water column depth and the maximum
24
flood level in the plot) were not related to species distribution (p>0.05). The distribution
patter showed the segregation of the species on pH gradient (Fig. 5c).
Fig. 5 Species distribution of the Montrichardia genus according to the water gradients: a)
electric conductivity, b) pH, c) water transparency (Secchi depth). MA= M. arborescens,
ML= M. linifera, MAA= M. arborescens var. aculeata.
The actual distribution of M. linifera derived from herbarium data was concentrated in
the region of the Guyana Shield and Andean region following the eastwards course of the
Amazon River up to its mouth and southwards from the Amazon delta to the State of Espírito
Santo in SE-Brazil (Fig. 6). The species shows a phenotypic plasticity occurring either as
fixed to the substrate or forming floating islands, called “Matupás” in the Northern region of
25
Brazil (Junk & Piedade, 1997). M. arborescens showed a wider distribution in the Amazon
region and Central America.
Fig. 6 Distribution of tMontrichardia genus according to the records of consulted herbarium
(list at the appendix 1).
Several MAXET models predicted the potential habitat for MA and ML with great
success, as indicated by low rates of omissions and statistical significance (Table 4). The
same models showing high AUC for MA presented high AUC for ML as well (Table 2);
therefore two models with higher values of AUC were chosen to be presented in detail (Fig.
7). The Jacknife test showed that the variables altitude, total precipitation (rain_tot) and
temperature of the driest month (temp_dry) were the most important variables for modeling
the two species (Fig. 8, Table 4). Temperature is one of the most important climatic factors
26
affecting the range of distribution of many aquatic and wetland plant species (Sculthorpe,
1967; Santamaría, 2002; Bornette & Puijalon, 2011). It affects plant physiology, including the
germination of seeds and the periodicity and rate of seasonal growth (Short & Neckles, 1999).
In the Amazon Basin, temperature and precipitation are principal factors in which climate
models predict changes during the next 100 years, driven by increases in atmospheric CO2
concentrations (Houghton et al., 2001, Stocker, 2013). For example, some climate models
predict an increase in temperatures by up to 1.5 to 7°C coupled with a possible reduction in
precipitation by 10% to 20% in east and south Amazon (Houghton et al., 2001; IPCC, 2013).
The variables soil and EVI (Global vegetation index) commonly used to predict the
distribution of species (Brown, 1994) had little importance in the present modeling, but
remained in the final models to refine the forecast area of species occurrence. Including a
layer of wetlands with rivers, lakes and other types of water bodies would probably lead to a
better definition of the ecological niche of the two species, but as layer scales are below
values of size found in the literature for Brazilian wetlands (Junk et al., 2014), this layer was
not considered in the final model.
The maps with the averages of the MAXENT models show that MA has a Neotropical
distribution, the Central part of the Amazon and the coastal region of Brazil being preferential
areas of species occurrence (Fig. 7a and c). On the other hand, ML has a fairly wide
distribution in Central and South America, which is notably similar between different models,
independent of different environmental layers (Fig. 7b and d). The models made with
herbarium data also showed a good prediction of species occurrence, confirmed by checking
in the field (Fig. 7a and b). Where the model predicted areas with high possibilities of
occurrence of MA, its presence was confirmed in the field; while results in areas with median
predictability of occurrence, the presence of congeneric species was frequently observed in
the field (Fig. 7a). The same pattern was found for ML, although for this species the
occurrence of congeneric species also occurred in areas with high predictability of ML
occurrence, since its ecological niche was more widespread than that of MA (Fig. 7 b).
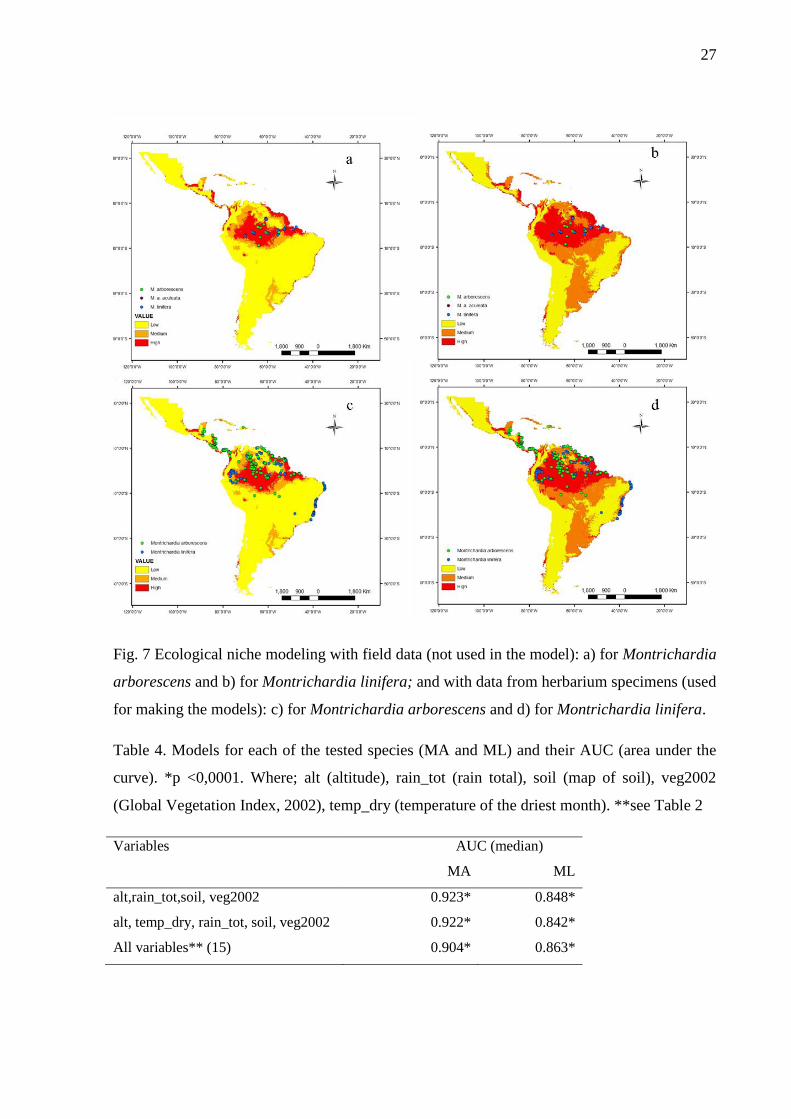
27
Fig. 7 Ecological niche modeling with field data (not used in the model): a) for Montrichardia
arborescens and b) for Montrichardia linifera; and with data from herbarium specimens (used
for making the models): c) for Montrichardia arborescens and d) for Montrichardia linifera.
Table 4. Models for each of the tested species (MA and ML) and their AUC (area under the
curve). *p <0,0001. Where; alt (altitude), rain_tot (rain total), soil (map of soil), veg2002
(Global Vegetation Index, 2002), temp_dry (temperature of the driest month). **see Table 2
Variables AUC (median)
MA ML
alt,rain_tot,soil, veg2002 0.923* 0.848*
alt, temp_dry, rain_tot, soil, veg2002 0.922* 0.842*
All variables** (15) 0.904* 0.863*
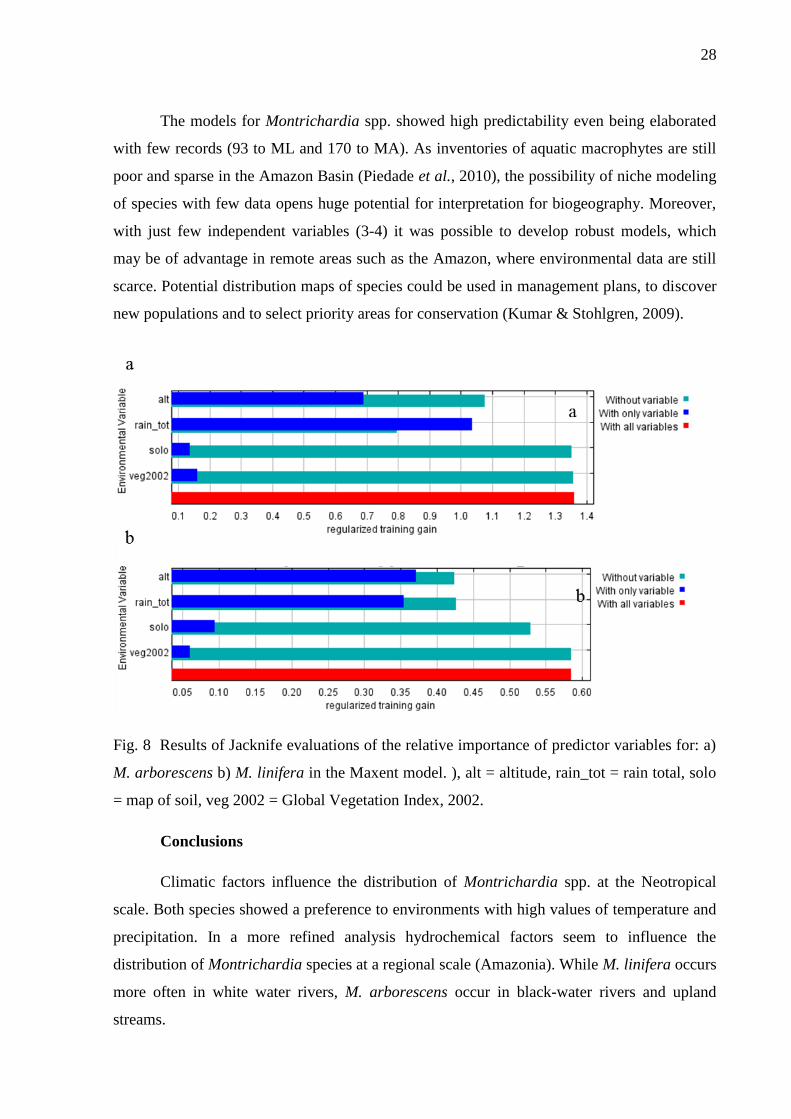
28
The models for Montrichardia spp. showed high predictability even being elaborated
with few records (93 to ML and 170 to MA). As inventories of aquatic macrophytes are still
poor and sparse in the Amazon Basin (Piedade et al., 2010), the possibility of niche modeling
of species with few data opens huge potential for interpretation for biogeography. Moreover,
with just few independent variables (3-4) it was possible to develop robust models, which
may be of advantage in remote areas such as the Amazon, where environmental data are still
scarce. Potential distribution maps of species could be used in management plans, to discover
new populations and to select priority areas for conservation (Kumar & Stohlgren, 2009).
Fig. 8 Results of Jacknife evaluations of the relative importance of predictor variables for: a)
M. arborescens b) M. linifera in the Maxent model. ), alt = altitude, rain_tot = rain total, solo
= map of soil, veg 2002 = Global Vegetation Index, 2002.
Conclusions
Climatic factors influence the distribution of Montrichardia spp. at the Neotropical
scale. Both species showed a preference to environments with high values of temperature and
precipitation. In a more refined analysis hydrochemical factors seem to influence the
distribution of Montrichardia species at a regional scale (Amazonia). While M. linifera occurs
more often in white water rivers, M. arborescens occur in black-water rivers and upland
streams.
29
Montrichardia linifera showed a greater potential ecological niche than M.
arborescens in accordance with our hypothesis. The models calibrated with few data and
environmental layers were able to predict well the presence of species and the occurrence of
congeneric species.
Acknowledgments
This work is support by INCT ADAPTA - Brazilian Ministry of Science, Technology
and Innovation (CNPq/FAPEAM), and the Universal CNPq (14/2009; 14/2011), PRONEX
“Áreas alagáveis” (CNPq/FAPEAM), PELD MAUA (CNPq/FAPEAM). For Marcelo Santos
Junior and Marina Ansiães for help with Maxent Softwear, Conceição Lucia Costa, Celso R.
Costa and Valdeney de A. Azevedo we thank the assistance in the collection of data. The
authors thank the Conselho Nacional de Desenvolvimento Científico e Tecnológico (CNPq)
for Aline Lopes Doctor’s Grant; MAUA Research Group for logistical and technical support.
30
References
Barendregt, A., Bio, A.M.F., 2003. Relevant variables to predict macrophytes communities in
running waters. Ecol. Model. 160, 205-217.
Bornette, G., Puijalon, S. 2011. Response of aquatic plants to abiotic factors: a review.
Aquatic Sciences. 73(1), 1-14.
Boyce, P.C., Croat, T.B., 2011. The Überlist of Araceae, Totals for Published and Estimated
Number of Species in Aroid Genera. http://www.aroid.org/genera/140313uberlist.pdf
[accessed 10 January 2014].
Brown, D.G., 1994. Predicting vegetation types at treeline using topography and biophysical
disturbance variables. J Veg Sci. 5, 641–656.
Camargo, A.F.M., Pezzato, M. M., Henry-Silva, G. G., 2003. Fatores limitantes à produção
primária de macrófitas aquáticas. In: Thomaz, S.M., Bini, L.M. Ecologia e manejo de
macrófitas. Maringá: UEM, p. 59-83.
Cancian, L.F., Camargo, A.F.M., Silva, G.G., 2009. Crescimento de Pistia stratiotes em
diferentes condições de temperatura e fotoperíodo. Acta Bot. Bras. 23, 552-557.
Chambers, P. A., Lacoul, P., Murphy, K. J., Thomaz S. M. 2008. Global diversity of aquatic
macrophytes in freshwater. Hydrobiologia 595, 9-26.
CRIA - Centro de Referencia em Informação Ambiental, 2014. Species links. Disponível em:
http://splink.cria.org.br/centralized_search?criaLANG=pt [accessed 10 January 2014].
Diggle, P.J., 1983. Statistical analysis of spatial point patterns. p.4-5
http://www.cabnr.unr.edu/weisberg/NRES675/Diggle2003.pdf [accessed 10 January 2014].
Elith, J., Graham, C. H., Anderson, R. P., Dudi´K, M., Ferrier, S., Guisan, A., Hijmans, R. J.,
Huettmann, F., Leathwick, J. R., Lehmann, A., Li, J., Lohmann, L. G., Loiselle, B. A.,
Manion, G., Moritz, C., Nakamura, M., Nakazawa, Y., Overton, J. Mcc., Peterson, A. T.,
Phillips, S. J., Richardson, K. S., Scachetti-Pereira, R., Schapire, R. E., Sobero´N, J.,
Williams, S., Wisz, M. S., Zimmermann, N. E. 2006. Novel methods improve prediction of
species’ distributions from occurrence data. Ecography, 29, 129-151.
31
Furch, K., 2000. Chemistry and bioelement inventory of contrasting Amazonian forest soils.
In: Junk, W.J., Ohly, J.J., Piedade, M.T.F., Soares, M.G.M. (Eds.),The Central Amazon
Floodplain: Actual Use and Options for a Sustainable Management. Backhuys Publishers,
Leiden, The Netherlands, pp. 109-128.
Furch, K., Junk, W.J., 1997. Physicochemical conditions in the floodplains. Ecological
Studies, 126, 69−108.
Guisan, A., Thuiller, W., 2005. Predicting species distribution: offering more than simple
habitat models. Ecol. lett.. 8, 993-1009.
Henry-Silva, G.G., Camargo, A.F.M., 2005. Interações ecologias entre as macrófitas
aquáticas flutuantes Eichhornia crassipes e Pistia stratiotes. Hoehnea, 32(3), 445-452.
Herendeen, P., Crepet, W., Dilcher, D., 1992. The fossil history of the Leguminosae:
Phylogenetic and biogeographic implications. In: Herendeen P, Dilcher, D. (Eds.), Advances
in Legume Systematics, Part 4. The Fossil Record, Kew Publishing, Surrey, UK, pp. 303–
316.
Houghton, R.A., Lawrence, K.T., Hackler, J.L., Brown, S., 2001. The spatial distribution of
forest biomass in the Brazilian Amazon: A comparison of estimates. Global Change
Biol. 7, 731–746.
IPCC, 2013: Climate Change 2013: The Physical Science Basis. Contribution of Working
Group I to the Fifth Assessment Report of the Intergovernmental Panel on Climate Change
[Stocker, T. F., D. Qin, G.-K. Plattner, M. Tignor, S. K. Allen, J. Boschung, A. Nauels, Y.
Xia, V. Bex and P. M. Midgley (eds.)]. Cambridge University Press, Cambridge, United
Kingdom and New York, NY, USA.
http://www.climatechange2013.org/images/report/WG1AR5_TS_FINAL.pdf
Junk W.J., 1997. The Central Amazon Floodplain: Ecology of a Pulsing System. Ecological
Studies 126. Springer-Verlag: Berlin; 525.
Junk, W.J., Piedade, M.T.F., Lourival, R., Wittmann, F., Kandus, P., Lacerda, L.D., Bozelli,
R.L., Esteves, F.A. , Nunes Da Cunha, C., Maltchik, L. , Schöngart, J., Schaeffer-Novelli, Y. ,
Agostinho, A.A., 2014. Brazilian wetlands: their definition, delineation, and classification for
research, sustainable management, and protection. Aquat. Conserv. 24, 5-22.
32
Junk, W.J. , Piedade, M TF, Schöngart, J, Cohn-Haft, M, Adeney, J. M , Wittmann, F. 2011 A
Classification of Major Naturally-Occurring Amazonian Lowland Wetlands. Wetlands
31,623-640.
Junk, W.J., Ohly, J.J., Piedade, M.T.F., Soares, M.G.M., 2000. The Central Amazon
Floodplain: Actual Use and Options for a Sustainable Management.- Backhuys Publishers
b.V., Leiden, Klinge, H., Junk, W. J., Revilla, C.J. p. 584.
Junk, W.J., Piedade, M.T., 1997. Plant life in the floodplain with special reference to
herbaceous plants. In: Junk, W.J. (Eds.), The Central Amazon Floodplain. Springer-Verlag,
New York 126, pp. 147– 181.
Junk, W.J., Furch, K. 1980. Water Chemistry and aquatic macrophytes of rivers and streams
in Amazon river Basin and adjacent areas. Part I: Cuiabá – Porto Velho - Manaus Path. Acta
Amaz. 10 (3), 611-633.
Kasuga, M., Liu, Q., Miura, S., Yamaguchi-Shinozaki, K., & Shinozaki, K. (1999).
Improving plant drought, salt, and freezing tolerance by gene transfer of a single stress-
inducible transcription factor. Nature Biotechnol. 17(3), 287-291.
Kumar, S., Stohlgren, T.J., 2009. Maxent modeling for predicting suitable habitat for
threatened and endangered tree Canacomyrica monticola in New Caledonia. J. Ecol. Nat.
Environ. 1(4), 094-098.
Lima, Á.C., Araujo‐Lima, C.A. 2004. The distributions of larval and juvenile fishes in
Amazonian rivers of different nutrient status. Freshwater Biol. 49(6), 787-800.
Lins, A.L. 1994. Aspectos morfológicos e anatômicos de raízes do gênero Montrichardia
Crueg (Araceae). M.Sc. dissertation, Universidade Federal do Rio Grande do Sul. 93 pp.
Porto Alegre.
Lopes A., Piedade M.T.F., 2012. Distribuição, biomassa e variação morfológica entre
populações do gênero Montrichardia Crueg (Araceae) na Bacia Amazônica. In: I Congresso
Brasileiro de Áreas Úmidas, Cuiabá: Anais do I Congresso Brasileiro de Áreas Úmidas.
Lopes, A. Wittmann, F. Schöngart, J., Piedade, M.T.F. 2014. Herbáceas aquáticas em seis
igapós na amazônia central: composição e diversidade de gêneros. Revista Geográfica
Academica (in press)
33
Lopes, A., Paula, J.D.A., Mardegan, S.F., Hamada, N., Piedade, M.T.F., 2011. Influência do
hábitat na estrutura da comunidade de macroinvertebrados aquáticos associados às raízes de
Eichhornia crassipes na região do Lago Catalão, Amazonas, Brasil. Acta Amaz. 41, 493-502.
Madsen, T.V., Hahn, P. , Johansen, J., 1998. Effect of inorganic carbon supply on the nitrogen
requirement of two submerged macrophytes, Elodea Canadensis and Callitriche cophocarpa.
Aquatic Bot. 62, 95-106.
Martins, P.S,. 1987. Estrutura populacional, fluxo gênico e conservação in situ. IPEF. 35,71-
78.
Matteucci, S., Colma, A., 1982. Metodología para el estudio de la vegetación. Secretaría
general de la Organización de los Estados Americanos. Washington, DC.
Mayo, S.J., Bogner J., Boyce P.C., 1997. The Genera of Araceae. RBGKew Press, London.
MOBOT. Missouri Botanical Garden - Disponível em:
http://www.mobot.org/MOBOT/research/APweb/welcome.html. [accessed 10 January 2014].
Mounier S., Braucher R., Benaim J.Y., 1998. Differentiation of organic matter’s properties of
the Rio Negro basin by cross flow ultra-filtration and UV-spectrofluorescence. Water Res.
33(10): 2363–2373.
Murphy, K.J., 2002. Plant communities and plant diversity in softwater lakes if northern
Europe. Aquatic Bot. 73, 287-324.
Nauheimer L., Boyce P.C., Renner S.S., 2012. Giant taro and its relatives: a phylogeny of the
large genus Alocasia (Araceae) sheds light on Miocene floristic exchange in the Malesian
region. Mol. Phylogenet. Evol. 63, 43–51.
Neiff, J.J., Poi de Neiff, A.S.G., 2003. Connectivity processes as a basis for the management
of aquatic plants. In: Thomaz, S., Bini, L.M. (Eds.), Ecologia e Manejo de Macrófitas
Aquáticas.. Nupélia - Maringá . Eduem, Maringá, p. 39-58.
Pearson, R. G., Dawson, T. P. 2003. Predicting the impacts of climate change on the
distribution of species: are bioclimate envelope models useful?. Global Ecol. Biogeogr. 12(5),
361-371.
34
Pearson, R.G., Raxworthy, C. J., Nakamura, M., Peterson. A.T., 2007. Predicting species’
distributions from small numbers of occurrence records: A test case using cryptic geckos in
Madagascar. J. Biogeog. 34,102–117.
Phillips, S.J., Anderson, R.P., Schapire, R.E., 2006. Maximum entropy modeling of species
geographic distributions. Ecol. Modell. 190, 231-259.
Piedade, M.T.F., Junk, W., D'Ângelo, S.A., Wittmann, F., Schöngart, J., Barbosa, K.M.D.N.,
Lopes, A., 2010. Aquatic herbaceous plants of the Amazon floodplains: state of the art and
research needed. Acta Limnol. Bras. 22(2), 165-178.
Richey J.R., Hedges J.I., Devol A.H., Quay P.D., Victoria R., Martinelli L.A., Forsberg B.R.,
1990. Biogeochemistry of carbon in the Amazon River. Limnol. Oceanogr. 35,352–371.
Riis, T., Sand-Jensen, K., Vestergaard, O., 2000. Plant communities in lowland Danish
streams: species composition and environmental factors. Aquatic Bot. 66, 255-172.
Ripley, B. D., 1977. Modelling spatial patterns (with Discussion). J. R. Statist. Soc. B, 39,
172-212
Ripley, B.D., 1981. Spatial statistics. Wiley Series in Probability and Mathematical Statistics.
John Wiley & Sons, New York.
Santamaría, L. 2002. Why are most aquatic plants widely distributed? Dispersal, clonal
growth and small-scale heterogeneity in a stressful environment. Acta Oecol. 23(3), 137-154.
Santamaría, L., 2002. Why are most aquatic plants widely distributed? Dispersal, clonal
growth and small-scale heterogeneity in a stressful environment. Acta Oecol.23, 137–154.
Sculthorpe, C.D., 1967. The Biology of Aquatic Vascular Plants. Edward Arnold, London, p.
610.
Short, F.T., Neckles, H.A., 1999. The effects of global climate change on seagrasses. Aquat.
Bot. 63(3), 169-196.
Sioli, H., 1968. Hydrochemistry and geology in the Brazilian Amazon region. Amazoniana
3,267-277.
Siqueira, M.F.D., Peterson, A.T., 2003. Consequences of global climate change for
geographic distributions of cerrado tree species. Biota Neotrop. 3, 1-14.
35
Soberón, J., Peterson, A. T. Interpretation of models of fundamental ecological niches and
species' distributional areas. Biodiversity Informatics. 2(1),10- 20.
Stocker, T. F., Qin, D., Plattner, G. K., Tignor, M., Allen, S. K., Boschung, J., ... & Midgley,
P. M. 2013. IPCC, 2013: Climate Change 2013: The Physical Science Basis. Contribution of
Working Group I to the Fifth Assessment Report of the Intergovernmental Panel on Climate
Change.
Stoyan D., Penttinen A., 2000. Recent application of point process methods in forestry
statistics. Stat. Sci., 15(1): 61-78.
ter Braak, C. J. F. 1980. Binary mosaics and point quadrat sampling in ecology. IWIS-TNO
A80 ST 9637, IWIS- TNO, P.O. Box 100, Wageningen.Watson, L., Dallwitz, M.J., 1992
onwards. The families of flowering plants: descriptions, illustrations, identification, and
information retrieval. [accessed 10 January 2014]. http://delta-intkey.com.
Thomas, C. D., Cameron, A., Green, R. E., Bakkenes, M., Beaumont, L. J., Collingham, Y.
C., ... & Williams, S. E. (2004). Extinction risk from climate change. Nature, 427(6970), 145-
148.
Wang, W., Vinocur, B., Altman, A. 2003. Plant responses to drought, salinity and extreme
temperatures: towards genetic engineering for stress tolerance. Planta, 218(1), 1-14.
Watson, L., Dallwitz, M.J. 1992 onwards. The grass genera of the world: descriptions,
illustrations, identification, and information retrieval; including synonyms, morphology,
anatomy, physiology, phytochemistry, cytology, classification, pathogens, world and local
distribution, and references. [accessed 10 January 2014]. (http://delta-intkey.com).
Woodward, F.I., 1988. Temperature and the distribution of plant species. In: Long, S.P.,
Woodward, F.I. (Eds.), Plants and Temperature. The Company of Biologists Limited.
University of Cambridge, Cambridge, p. 59–75.
Woodward, F.I., Williams, B.G., 1987. Climate and plant distribution at global and local
scales. Vegetatio. 69,189-197.
36
Appendix 1
List of Herbarium consulted to determine the distribution of species (CRIA, 2014).
1. ASE - Herbário da Universidade Federal de Sergipe
2. BOTU - Herbário "Irina Delanova Gemtchújnicov"
3. CPMA - Coleção de plantas medicinais e aromáticas
4. EAC - Herbário Prisco Bezerra
5. EAN - Herbário Jaime Coelho de Moraes
6. ESA - Herbário da Escola Superior de Agricultura Luiz de Queiroz
7. FUEL - Herbário da Universidade Estadual de Londrina
8. FURB - Herbário Dr. Roberto Miguel Klein
9. HISA - Herbário de Ilha Solteira
10. HRCB - Herbário Rioclarense
11. HSJRP - Herbário de São José do Rio Preto
12. HST - Herbário Sérgio Tavares
13. HTSA - Herbário do Trópico Semi-Árido
14. HUEM - Herbário UEM
15. HUMC - Herbário Mogiense
16. HUPG - Herbário da Universidade Estadual de Ponta Grossa
17. IAC - Herbário do Instituto Agronômico de Campinas
18. INPA-Herbario - Herbário
19. IPA - Herbário - IPA Dárdano de Andrade Lima
20. JBRJ_RB - Herbário Dimitri Sucre Benjamin
21. JPB - Herbário Lauro Pires Xavier
37
22. MAC - Herbário do Instituto do Meio Ambiente do Estado de Alagoas
23. MBM - Herbário do Museu Botânico Municipal
24. MBML-Herbario - Herbário
25. MOBOT_BR - Missouri Botanical Garden - Brazilian records
26. MOSS - Herbário Dárdano de Andrade Lima
27. NYBG_BR - The New York Botanical Garden - Brazilian records
28. PEUFR - Herbário Professor Vasconcelos Sobrinho
29. SPF - Herbário do Departamento de Botânica, SPF-IB/USP
30. SPSF - Herbário Dom Bento Pickel
31. TEPB - Herbário Graziela Barroso
32. UEC - Herbário da Universidade Estadual de Campinas
33. UFP - Herbário UFP - Geraldo Mariz
34. UFRN - Herbário UFRN
35. UPCB - Herbário do Departamento de Botânica
36. URM - Herbário Pe. Camille Torrand
37. VIES - Herbário Central da Universidade Federal do Espírito Santo VIES

Capítulo 2
______________________________________________________________________
Lopes et al., (submetido) The genus
Montrichardia Crueg (Araceae) in the Amazon
Basin: overseeing morphological and
physiological traits along a longitudinal gradient,
Hydrobiologia.
39
The genus Montrichardia Crueg (Araceae) in the Amazon Basin:
overseeing morphological and physiological traits along a longitudinal
gradient
Aline Lopes1, Pia Parolin
2, Maria Teresa Fernandez Piedade
3
1 Graduate Program in Ecology. Instituto Nacional de Pesquisas da Amazônia/ Grupo
MAUA “Ecologia, Monitoramento e Uso Sustentável de Áreas Úmidas Amazônicas”, Av.
André Araújo, 2.936 - Petrópolis Cx. Postal 2223 - CEP 69080-971 Manaus, Amazonas,
Brasil. Telephone /fax+55 92 36421503 [email protected]
2 Dept of Plant Diversity, Univ. of Hamburg, Germany, [email protected]
3Instituto Nacional de Pesquisas da Amazônia, CDAM/ Grupo MAUA “Ecologia,
Monitoramento e Uso Sustentável de Áreas Úmidas Amazônicas” Av. André Araújo, 2.936 -
Petrópolis Cx. Postal 2223 - CEP 69080-971 Manaus, Amazonas, Brasil.
Abstract
Montrichardia is an exclusively Neotropical genus which is widely distributed and
well adapted to Amazonian floodplains. Two species [M. linifera (ML) and M. arborescens
(MA)] and one variety [M. arborescens var. aculeata (MAA)] are described, although some
authors support that they belong to a single species characterized by high plasticity. This
study aimed to determine if analyses of densities (stem/m2), morphology, physiology and
biomass of 55 populations of Montrichardia growing in rivers with different water properties
in the Amazon Basin can help in discriminating the taxa. Our sampling was made along a
gradient of declining soil fertility from Western to Eastern Amazonia spanning more than
2,500 km along the Amazon River. Our results show that local phenotypic variations such as
plant height, number of veins, and other morphological and physiological traits allowed the
separation of the two species and one variety of Montrichardia. The discriminant analysis
[DAB (diameter at the base), height, length-internodes] allowed separation of the species ML
and MA, with MAA as a subset of MA. The density distribution of Montrichardia taxa
proved to be more influenced by the type of water of the floodplains than the soil fertility
gradient.
Key-words: Aquatic macrophytes; biomass; phenotypic plasticity; Amazon floodplains.
40
Introduction
The classic models of distribution and development of aquatic vegetation are usually
based on physiological relationships between plants and environmental conditions and the
tolerance and ability of the species to grow in different conditions (Barendregt & Bio, 2003).
The growth patterns of these plants are mainly related to abiotic parameters such as light,
temperature, nutrient availability, pH, alkalinity, salinity, stream velocity, water level
variation and ecological processes, together with biotic variables acting on individuals (Riis et
al., 2000; Murphy, 2002; Henry-Silva & Camargo, 2005; Madsen et al., 1998; Barendregt &
Bio, 2003; Neiff & Neiff, 2003). Morphological adaptations include changes in body size,
biomass allocation and physiology (Lytle & Poff, 2004). The nature of physiological
adaptations can vary greatly among species, according to the genetic load and the availability
of environmental resources. The direct influence of the parameters responsible for the daily
carbon uptake, as the photosynthetic capacity and quantum efficiency, absorption and use of
nutrients from the soil, ultimately influence the primary metabolism of plants (Pimenta, et al.,
1998; Parolin, 2001; De Simone et al., 2002).
All species growing in the Amazon floodplains are subjected to the natural and
predictable hydrological changes (Junk et al., 1989), and are highly adapted to them through
physiological, morphological and phenological adaptations (Parolin et al., 2004; Parolin,
2009). Nevertheless, even highly adapted species in these environments may reduce growth
rates for some weeks per year owing to abnormal dry periods or extended flooding (Pezeshki,
2001; Parolin et al., 2010), or when growing in limiting conditions i.e. low mineral contents.
Thus, the study of the morphological and ecophysiological behavior of plant species
colonizing different floodplain ecosystems is an important tool for understanding the potential
effects of environmental changes in these extreme ecosystems which alternate drought and
flood phases.
Studies of geographical variability in floristic composition, species diversity and
abundance of trees within the Amazon are quite plentiful and based on correlation between
floristic parameters at different sites and on environmental variables, such as precipitation and
soil fertility (Whitmore, 1975; Gentry, 1988; Leigh, 1999; Ter Steege et al., 2000; Ter Steege
et al., 2003, Ter Steege et al., 2013, Pitman et al., 2002, Wittmann et al., 2006). Historical and
evolutionary interpretations are used to explain the division of Amazonia into
phytogeographical provinces or regions (Mori, 1991; Prance, 1994; de Oliveira & Daly, 1999;
Wittmann et al., 2006). On the other hand, studies of patterns of abundance and diversity of
41
aquatic macrophytes in the Amazon Basin are punctual, in rivers or lakes, and so far there is
no distribution pattern for the aquatic macrophytes community (Piedade et al., 2010), or even
for some of their species in the Amazon Basin. However, it is known that under favorable
conditions of nutrients, aquatic herbaceous plants may have high growth rates and
productivity (Piedade et al., 1991; Junk & Piedade, 1997). Furthermore, other factors may
influence growth patterns, such as light, temperature, pH, alkalinity, salinity, competition and
flow velocity (Lacoul & Freedman, 2006, Junk & Piedade, 1997). The differences in the
characteristics of floodplains, such as nutrient concentration and pH can affect the occurrence
and growth of the aquatic herbaceous plants (Piedade et al., 2010).
The aquatic vegetation is intimately related to the water bodies that may differ in water
properties according to the geology of the catchment area along the Amazon Basin. Since
species of aquatic macrophytes may inhabit fertile white water river floodplains (várzea), and
also unfertile and acidic black and clear water river floodplains (igapó) (Sioli, 1954), a
question arises: does the distribution of aquatic macrophytes in the Amazon Basin relate to
the properties of the river water such as acidity and light penetration, or does it follow the
West-East gradient of declining fertility described also for the upland forests of Amazonia
(Ter Steege et al., 2006)?
To answer this question we selected the exclusively Neotropical genus Montrichardia,
widely distributed in the Amazonian floodplains of different water properties. Some authors
claim that the genus is composed by a single species with high plasticity (Silva et al., 2012)
and others that there are two species [M. linifera (ML) and M. arborescens (MA)] and one
variety [M. arborescens var. aculeata (MAA)] (Lins, 1994). We analyzed the distribution,
densities (stem/m2), biomass, morphological and physiological traits and their plasticity in
populations distributed in a variety of water bodies along the Amazon Basin. Based on our
analyses of several morphological and ecophysiological variables of the genus Montrichardia
we hypothesize that Montrichardia species are distributed according to physical and chemical
variables, and that analysis of densities, morphology, physiology and biomass of individuals
can help in discriminating the species. Moreover, it is expected that the densities of all the
taxa decreases eastwards, from Tabatinga (Western Amazon), to the mouth of the Amazon
River (Eastern Amazon) according to the longitudinal gradient of soil fertility described by
Quesada et al. (2010).
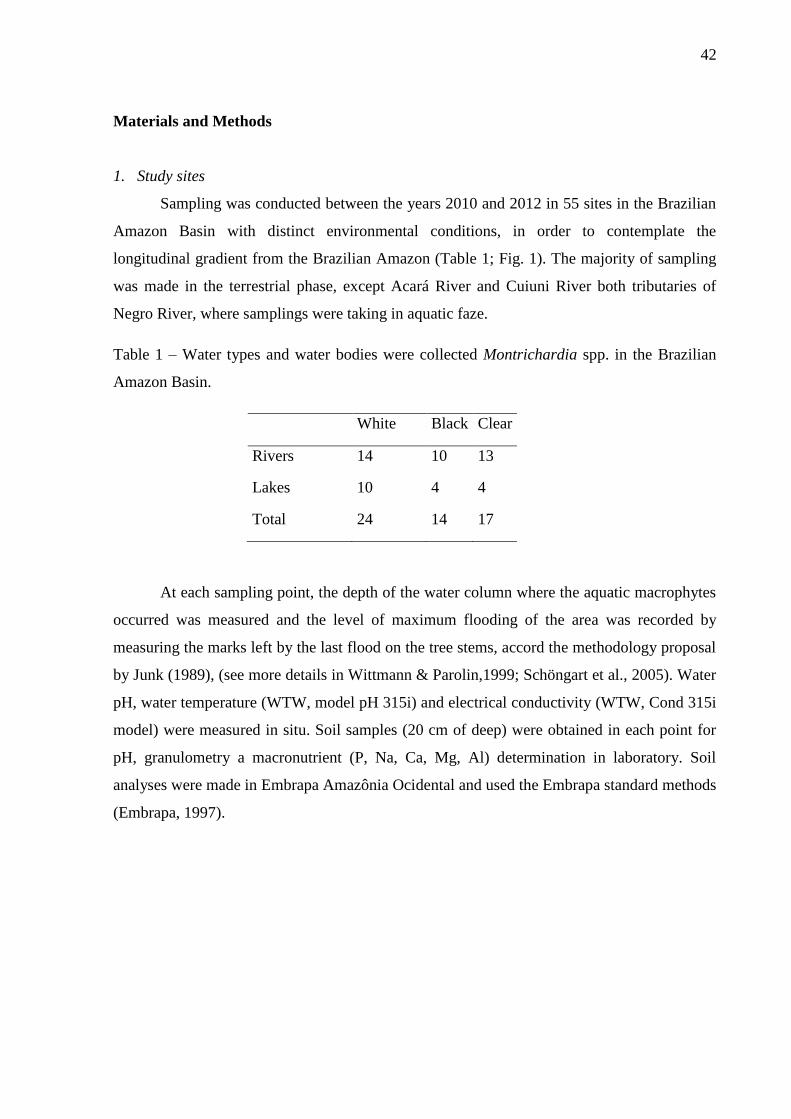
42
Materials and Methods
1. Study sites
Sampling was conducted between the years 2010 and 2012 in 55 sites in the Brazilian
Amazon Basin with distinct environmental conditions, in order to contemplate the
longitudinal gradient from the Brazilian Amazon (Table 1; Fig. 1). The majority of sampling
was made in the terrestrial phase, except Acará River and Cuiuni River both tributaries of
Negro River, where samplings were taking in aquatic faze.
Table 1 – Water types and water bodies were collected Montrichardia spp. in the Brazilian
Amazon Basin.
White Black Clear
Rivers 14 10 13
Lakes 10 4 4
Total 24 14 17
At each sampling point, the depth of the water column where the aquatic macrophytes
occurred was measured and the level of maximum flooding of the area was recorded by
measuring the marks left by the last flood on the tree stems, accord the methodology proposal
by Junk (1989), (see more details in Wittmann & Parolin,1999; Schöngart et al., 2005). Water
pH, water temperature (WTW, model pH 315i) and electrical conductivity (WTW, Cond 315i
model) were measured in situ. Soil samples (20 cm of deep) were obtained in each point for
pH, granulometry a macronutrient (P, Na, Ca, Mg, Al) determination in laboratory. Soil
analyses were made in Embrapa Amazônia Ocidental and used the Embrapa standard methods
(Embrapa, 1997).
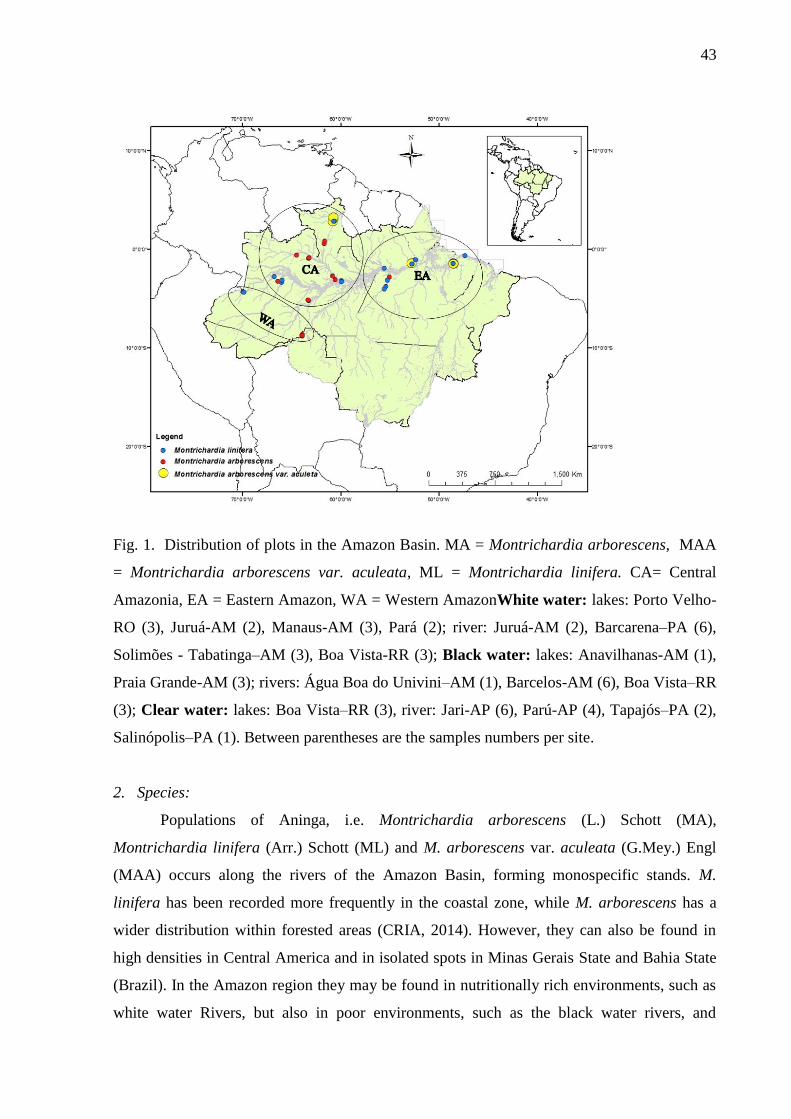
43
Fig. 1. Distribution of plots in the Amazon Basin. MA = Montrichardia arborescens, MAA
= Montrichardia arborescens var. aculeata, ML = Montrichardia linifera. CA= Central
Amazonia, EA = Eastern Amazon, WA = Western AmazonWhite water: lakes: Porto Velho-
RO (3), Juruá-AM (2), Manaus-AM (3), Pará (2); river: Juruá-AM (2), Barcarena–PA (6),
Solimões - Tabatinga–AM (3), Boa Vista-RR (3); Black water: lakes: Anavilhanas-AM (1),
Praia Grande-AM (3); rivers: Água Boa do Univini–AM (1), Barcelos-AM (6), Boa Vista–RR
(3); Clear water: lakes: Boa Vista–RR (3), river: Jari-AP (6), Parú-AP (4), Tapajós–PA (2),
Salinópolis–PA (1). Between parentheses are the samples numbers per site.
2. Species:
Populations of Aninga, i.e. Montrichardia arborescens (L.) Schott (MA),
Montrichardia linifera (Arr.) Schott (ML) and M. arborescens var. aculeata (G.Mey.) Engl
(MAA) occurs along the rivers of the Amazon Basin, forming monospecific stands. M.
linifera has been recorded more frequently in the coastal zone, while M. arborescens has a
wider distribution within forested areas (CRIA, 2014). However, they can also be found in
high densities in Central America and in isolated spots in Minas Gerais State and Bahia State
(Brazil). In the Amazon region they may be found in nutritionally rich environments, such as
white water Rivers, but also in poor environments, such as the black water rivers, and
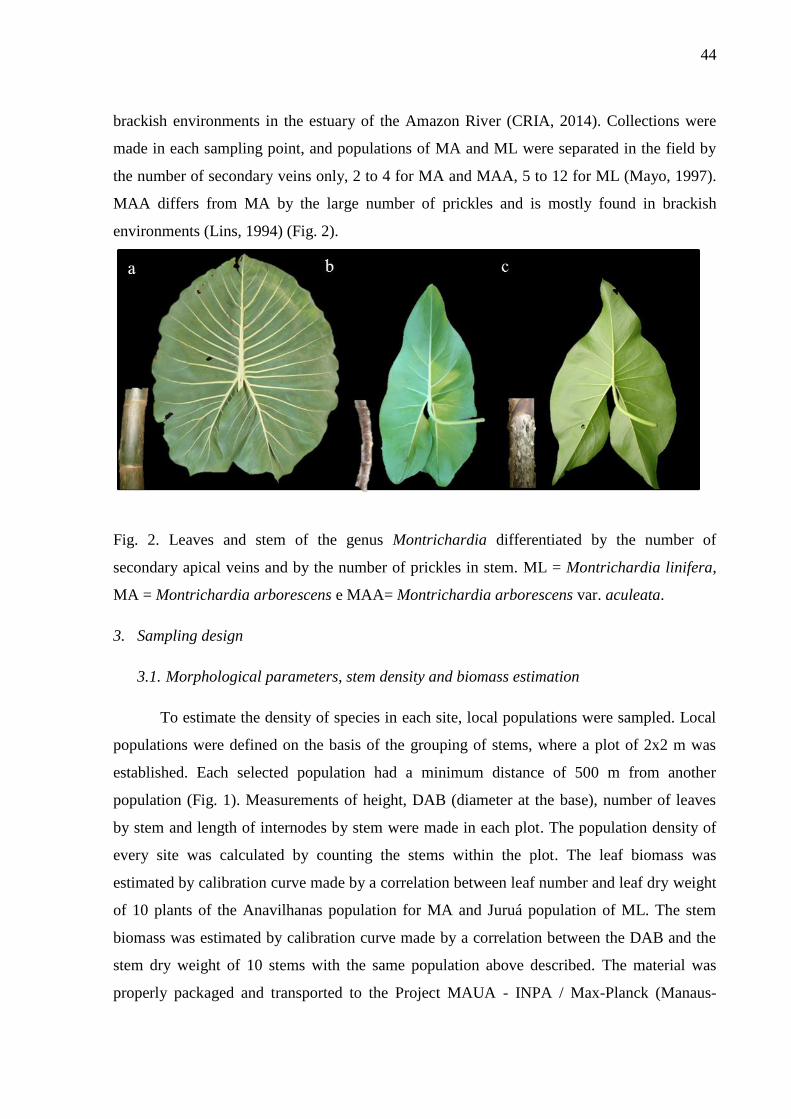
44
brackish environments in the estuary of the Amazon River (CRIA, 2014). Collections were
made in each sampling point, and populations of MA and ML were separated in the field by
the number of secondary veins only, 2 to 4 for MA and MAA, 5 to 12 for ML (Mayo, 1997).
MAA differs from MA by the large number of prickles and is mostly found in brackish
environments (Lins, 1994) (Fig. 2).
Fig. 2. Leaves and stem of the genus Montrichardia differentiated by the number of
secondary apical veins and by the number of prickles in stem. ML = Montrichardia linifera,
MA = Montrichardia arborescens e MAA= Montrichardia arborescens var. aculeata.
3. Sampling design
3.1. Morphological parameters, stem density and biomass estimation
To estimate the density of species in each site, local populations were sampled. Local
populations were defined on the basis of the grouping of stems, where a plot of 2x2 m was
established. Each selected population had a minimum distance of 500 m from another
population (Fig. 1). Measurements of height, DAB (diameter at the base), number of leaves
by stem and length of internodes by stem were made in each plot. The population density of
every site was calculated by counting the stems within the plot. The leaf biomass was
estimated by calibration curve made by a correlation between leaf number and leaf dry weight
of 10 plants of the Anavilhanas population for MA and Juruá population of ML. The stem
biomass was estimated by calibration curve made by a correlation between the DAB and the
stem dry weight of 10 stems with the same population above described. The material was
properly packaged and transported to the Project MAUA - INPA / Max-Planck (Manaus-
45
AM), where it was dried in oven (Heraeus & Memmert) with forced ventilation at 75 º C until
constant weight. The collected plants were deposited at the Herbarium of INPA.
For stomata counting, the modeling technique with quick drying glue was used in the
middle third of the abaxial and adaxial side of the leaves. Stomata density was determined by
counting the stomata located in an area of 0.864 mm2 with an optical microscope with 20x of
magnification. For each species at each site, mature leaves of ten plants were collected for
measurement of specific leaf area (SLA). An area of 1.4 cm x 1.0 cm was cut from each sheet
and packed in field into paper bag with silica gel. In the laboratory sheets were dried in oven
with forced ventilation (Heraeus e Memmert) at 75°C until constant weight, and subsequently
weighted. SLA was calculated as follows; SLA = leaf area/dry mass (cm2.g
-1).
3.2. Physiological parameters
In each local population, ten individuals were sampled for physiological
measurements. We determined the quantum efficiency of PSII and the concentration of
chloroplastid pigments. Data were collected between 9:00 am and 11:00 am in fully expanded
leaves which seemed visually healthy. The ‘current photochemical capacity’ of PSII (Bolhár-
Nordenkampf & Öquist, 1993) or ‘intrinsic efficiency’ (Maxwell and Johnson, 2000) was
assessed with a Mini-PAM (Walz, Effeltrich, Germany). The maximal photochemical yield
(Y=Fv/Fm) was measured in dark-adapted leaves (10 minutes), when a saturation pulse
induces maximal fluorescence yield (Fm) and maximal variable fluorescence (Fv), which are
considered as reliable measures of the potential quantum yield of Photosystem II. In dark-
adapted leaves (all reaction centers of the electron transport chain oxidized) Fv/Fm is a
parameter for measuring the maximum relative electron transport rate of PSII (Krause &
Weis, 1991). Healthy leaves usually show Fv/Fm values between 0.66 and 0.80, lower values
indicating intracellular or physiological changes (calculated according to Bolhár-
Nordenkampf & Götzl, 1992, for several common floodplain species in Waldhoff et al.,
2000). The concentration of chloroplastid pigments, chlorophyll a (Chl a), chlorophyll b (Chl
b) and total chlorophyll were established with a portable meter (ClorofiLOG 1030, CFL). The
ClorofiLOG analyzes three bands of light and allows obtaining indexes of dimensionless
chlorophyll content, which should be related to the actual concentration of chlorophyll
extracted from the leaves. To verify these relationship 22 leaf discs of 9 mm diameter of each
species were collected. The discs were placed in graduated centrifuge tubes containing 10 ml
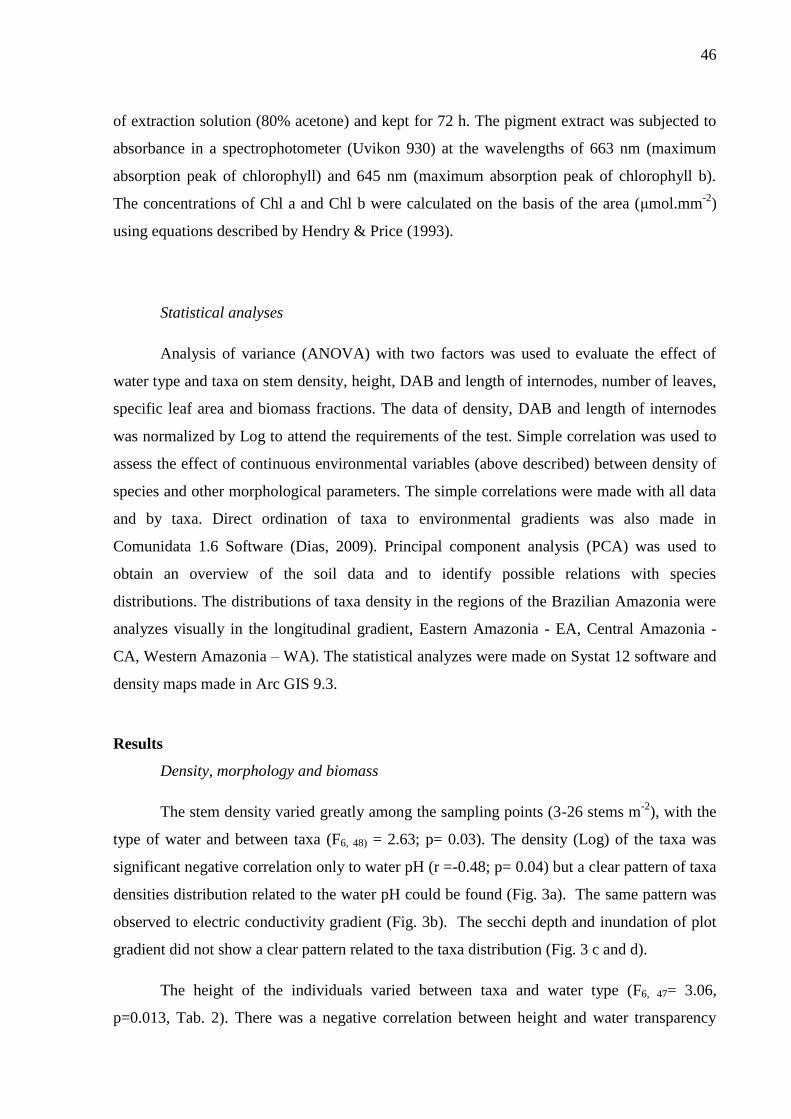
46
of extraction solution (80% acetone) and kept for 72 h. The pigment extract was subjected to
absorbance in a spectrophotometer (Uvikon 930) at the wavelengths of 663 nm (maximum
absorption peak of chlorophyll) and 645 nm (maximum absorption peak of chlorophyll b).
The concentrations of Chl a and Chl b were calculated on the basis of the area (μmol.mm-2
)
using equations described by Hendry & Price (1993).
Statistical analyses
Analysis of variance (ANOVA) with two factors was used to evaluate the effect of
water type and taxa on stem density, height, DAB and length of internodes, number of leaves,
specific leaf area and biomass fractions. The data of density, DAB and length of internodes
was normalized by Log to attend the requirements of the test. Simple correlation was used to
assess the effect of continuous environmental variables (above described) between density of
species and other morphological parameters. The simple correlations were made with all data
and by taxa. Direct ordination of taxa to environmental gradients was also made in
Comunidata 1.6 Software (Dias, 2009). Principal component analysis (PCA) was used to
obtain an overview of the soil data and to identify possible relations with species
distributions. The distributions of taxa density in the regions of the Brazilian Amazonia were
analyzes visually in the longitudinal gradient, Eastern Amazonia - EA, Central Amazonia -
CA, Western Amazonia – WA). The statistical analyzes were made on Systat 12 software and
density maps made in Arc GIS 9.3.
Results
Density, morphology and biomass
The stem density varied greatly among the sampling points (3-26 stems m-2
), with the
type of water and between taxa (F6, 48) = 2.63; p= 0.03). The density (Log) of the taxa was
significant negative correlation only to water pH (r =-0.48; p= 0.04) but a clear pattern of taxa
densities distribution related to the water pH could be found (Fig. 3a). The same pattern was
observed to electric conductivity gradient (Fig. 3b). The secchi depth and inundation of plot
gradient did not show a clear pattern related to the taxa distribution (Fig. 3 c and d).
The height of the individuals varied between taxa and water type (F6, 47= 3.06,
p=0.013, Tab. 2). There was a negative correlation between height and water transparency
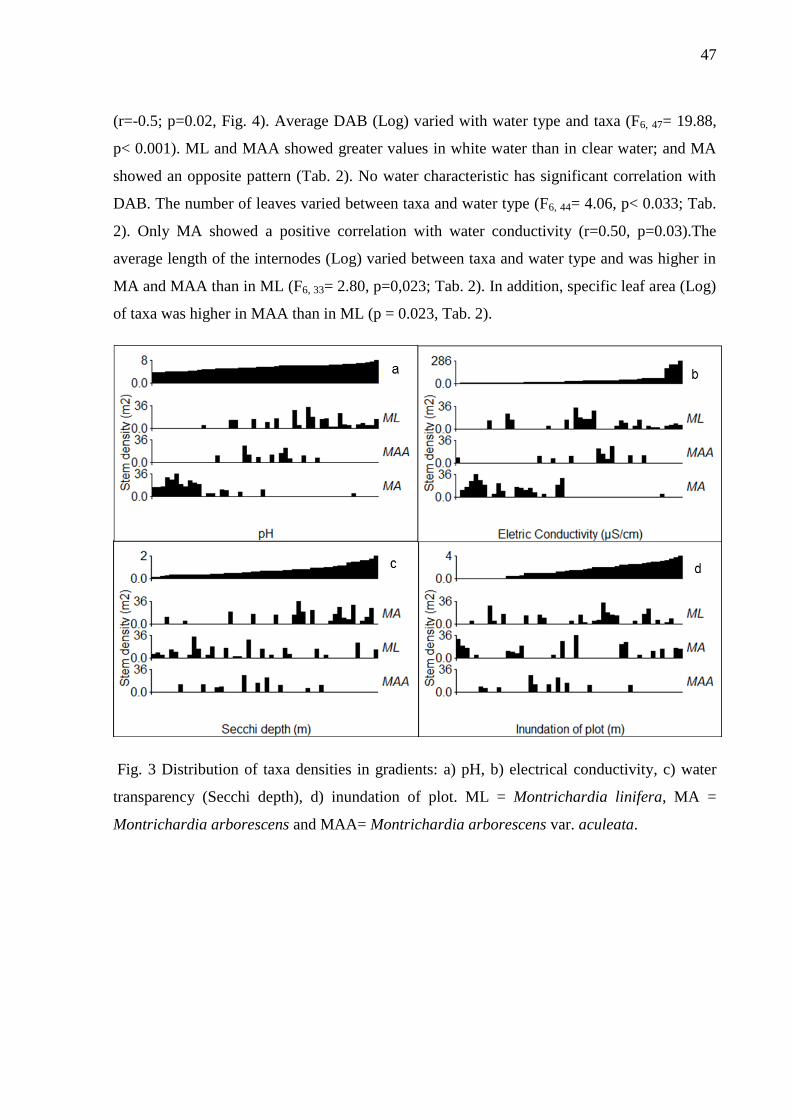
47
(r=-0.5; p=0.02, Fig. 4). Average DAB (Log) varied with water type and taxa (F6, 47= 19.88,
p< 0.001). ML and MAA showed greater values in white water than in clear water; and MA
showed an opposite pattern (Tab. 2). No water characteristic has significant correlation with
DAB. The number of leaves varied between taxa and water type (F6, 44= 4.06, p< 0.033; Tab.
2). Only MA showed a positive correlation with water conductivity (r=0.50, p=0.03).The
average length of the internodes (Log) varied between taxa and water type and was higher in
MA and MAA than in ML (F6, 33= 2.80, p=0,023; Tab. 2). In addition, specific leaf area (Log)
of taxa was higher in MAA than in ML (p = 0.023, Tab. 2).
Fig. 3 Distribution of taxa densities in gradients: a) pH, b) electrical conductivity, c) water
transparency (Secchi depth), d) inundation of plot. ML = Montrichardia linifera, MA =
Montrichardia arborescens and MAA= Montrichardia arborescens var. aculeata.

48
Fig. 4. Correlation between plant height (all taxa) and Secchi depth (water transparency).
The biomass equations were established based on the number of leaves and DAB. For
ML: Leaves biomass = 15.097 * No of leaves – 24.364 (R ² = 0.90); Biomass of Stem =
399.29 * DAB - 485.91 (R ² = 0.82). For MA and MAA: Leaves biomass = 2.0816 * No of
leaves - 2.8489 (R ² = 0.84); Biomass of Stem= 197.81 * DAB - 479.61 (R ² = 0.89). The
leaves biomass (Log) showed significant difference between taxa and water type (F6, 44=
32.14, p< 0.0001), with the biomass of ML being greater than that of MA and MAA (Tab. 2).
Furthermore, leaf biomass was higher in white water than in the clear and black water (p =
0.003), showing a positive correlation between leaves biomass and pH (r = 0.62, p = 0.002,
Fig. 5a), and electric conductivity (r = 0.5, p = 0.035).
The biomass of the stems (Log) varied between taxa and types of water (F6, 47=29.91;
p <0.001, Tab. 2). The stem biomass values for black water were lower than that of white and
clear water (Tab. 2). Among the water bodies with white water ML presented higher biomass
of stem, and the same pattern was found for clear water (Tab. 2). The average stem biomass
values were correlated with the water pH (r = 0:54, p = 0.01, Fig 5b). The total biomass
followed the same pattern of stem biomass (F6, 47=40.06; p <0.0001; Tab. 2).
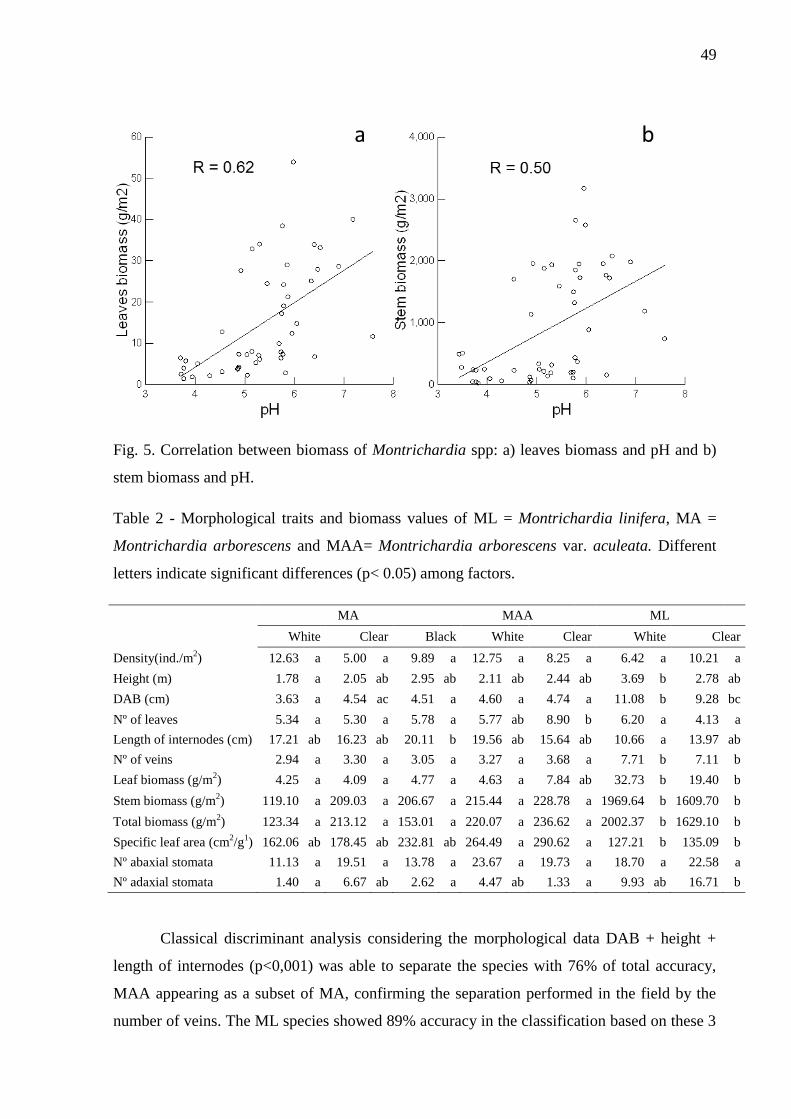
49
Fig. 5. Correlation between biomass of Montrichardia spp: a) leaves biomass and pH and b)
stem biomass and pH.
Table 2 - Morphological traits and biomass values of ML = Montrichardia linifera, MA =
Montrichardia arborescens and MAA= Montrichardia arborescens var. aculeata. Different
letters indicate significant differences (p< 0.05) among factors.
MA MAA ML
White Clear Black White Clear White Clear
Density(ind./m2) 12.63 a 5.00 a 9.89 a 12.75 a 8.25 a 6.42 a 10.21 a
Height (m) 1.78 a 2.05 ab 2.95 ab 2.11 ab 2.44 ab 3.69 b 2.78 ab
DAB (cm) 3.63 a 4.54 ac 4.51 a 4.60 a 4.74 a 11.08 b 9.28 bc
Nº of leaves 5.34 a 5.30 a 5.78 a 5.77 ab 8.90 b 6.20 a 4.13 a
Length of internodes (cm) 17.21 ab 16.23 ab 20.11 b 19.56 ab 15.64 ab 10.66 a 13.97 ab
Nº of veins 2.94 a 3.30 a 3.05 a 3.27 a 3.68 a 7.71 b 7.11 b
Leaf biomass (g/m2) 4.25 a 4.09 a 4.77 a 4.63 a 7.84 ab 32.73 b 19.40 b
Stem biomass (g/m2) 119.10 a 209.03 a 206.67 a 215.44 a 228.78 a 1969.64 b 1609.70 b
Total biomass (g/m2) 123.34 a 213.12 a 153.01 a 220.07 a 236.62 a 2002.37 b 1629.10 b
Specific leaf area (cm2/g
1) 162.06 ab 178.45 ab 232.81 ab 264.49 a 290.62 a 127.21 b 135.09 b
Nº abaxial stomata 11.13 a 19.51 a 13.78 a 23.67 a 19.73 a 18.70 a 22.58 a
Nº adaxial stomata 1.40 a 6.67 ab 2.62 a 4.47 ab 1.33 a 9.93 ab 16.71 b
Classical discriminant analysis considering the morphological data DAB + height +
length of internodes (p<0,001) was able to separate the species with 76% of total accuracy,
MAA appearing as a subset of MA, confirming the separation performed in the field by the
number of veins. The ML species showed 89% accuracy in the classification based on these 3
50
parameters with no overlapping with MAA or MA, while MA and MAA showed 69% and
64% accuracy respectively, as these two species were overlapping (Tab. 3). Canonical Scores Plot
ML
MAAMA
-6 -4 -2 0 2 4
FACTOR(1)
-6
-4
-2
0
2
4
FA
CT
OR
(2)
Fig. 6. Discriminant analysis of morphological characters of ML = Montrichardia linifera,
MA = Montrichardia arborescens e MAA= Montrichardia arborescens var. aculeata.
Table 3 - Percentage of success of the discriminatory analysis of ML = Montrichardia
linifera, MA = Montrichardia arborescens and MAA= Montrichardia arborescens var.
aculeata.
MA MAA ML % success
MA (21) 11 5 0 69
MAA (9) 4 7 0 64
ML (19) 0 2 17 89
Total 15 14 17 76
The number of stomata was higher on the adaxial side than on the abaxial side of
leaves, varying significantly between species only in the adaxial side of the leaf, where ML
showed a greater average (12.9) than MA and MAA (3.3 and 3.5 respectively; Tab. 2). The
number of stomata was not associated with any of the measured environmental variables.
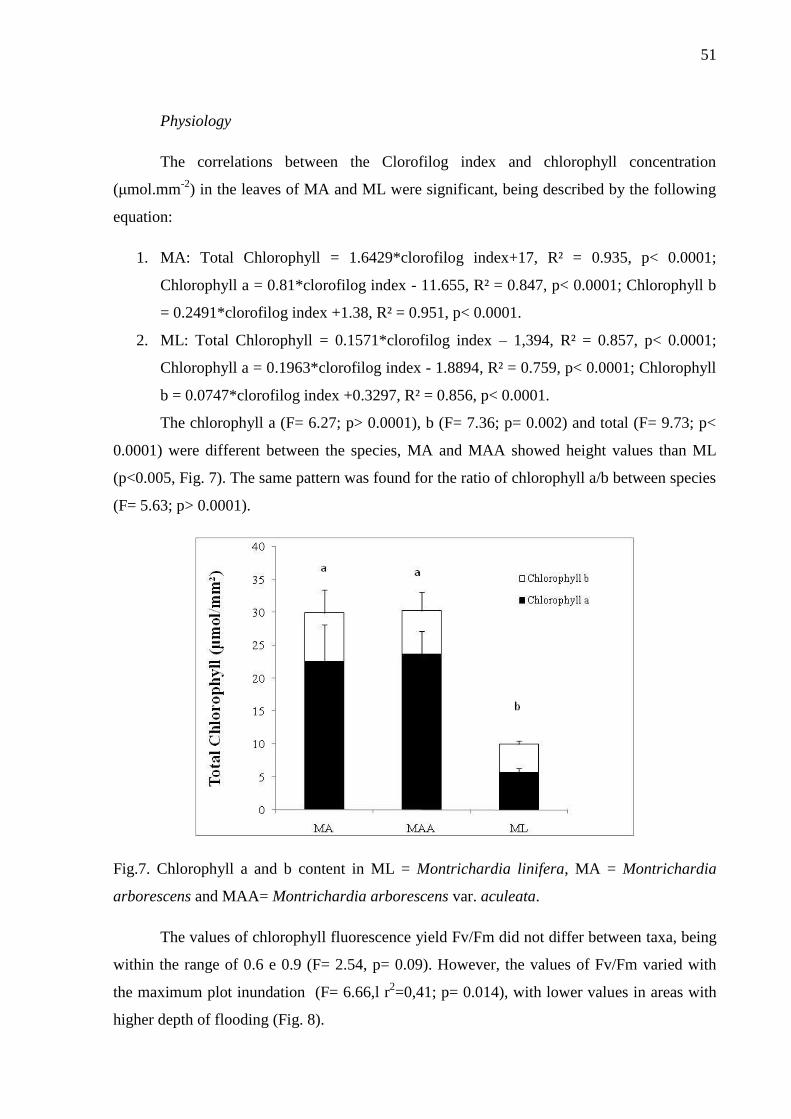
51
Physiology
The correlations between the Clorofilog index and chlorophyll concentration
(μmol.mm-2
) in the leaves of MA and ML were significant, being described by the following
equation:
1. MA: Total Chlorophyll = 1.6429*clorofilog index+17, R² = 0.935, p< 0.0001;
Chlorophyll a = 0.81*clorofilog index - 11.655, R² = 0.847, p< 0.0001; Chlorophyll b
= 0.2491*clorofilog index +1.38, R² = 0.951, p< 0.0001.
2. ML: Total Chlorophyll = 0.1571*clorofilog index – 1,394, R² = 0.857, p< 0.0001;
Chlorophyll a = 0.1963*clorofilog index - 1.8894, R² = 0.759, p< 0.0001; Chlorophyll
b = 0.0747*clorofilog index +0.3297, R² = 0.856, p< 0.0001.
The chlorophyll a (F= 6.27; p> 0.0001), b (F= 7.36; p= 0.002) and total (F= 9.73; p<
0.0001) were different between the species, MA and MAA showed height values than ML
(p<0.005, Fig. 7). The same pattern was found for the ratio of chlorophyll a/b between species
(F= 5.63; p> 0.0001).
Fig.7. Chlorophyll a and b content in ML = Montrichardia linifera, MA = Montrichardia
arborescens and MAA= Montrichardia arborescens var. aculeata.
The values of chlorophyll fluorescence yield Fv/Fm did not differ between taxa, being
within the range of 0.6 e 0.9 (F= 2.54, p= 0.09). However, the values of Fv/Fm varied with
the maximum plot inundation (F= 6.66,l r2=0,41; p= 0.014), with lower values in areas with
higher depth of flooding (Fig. 8).
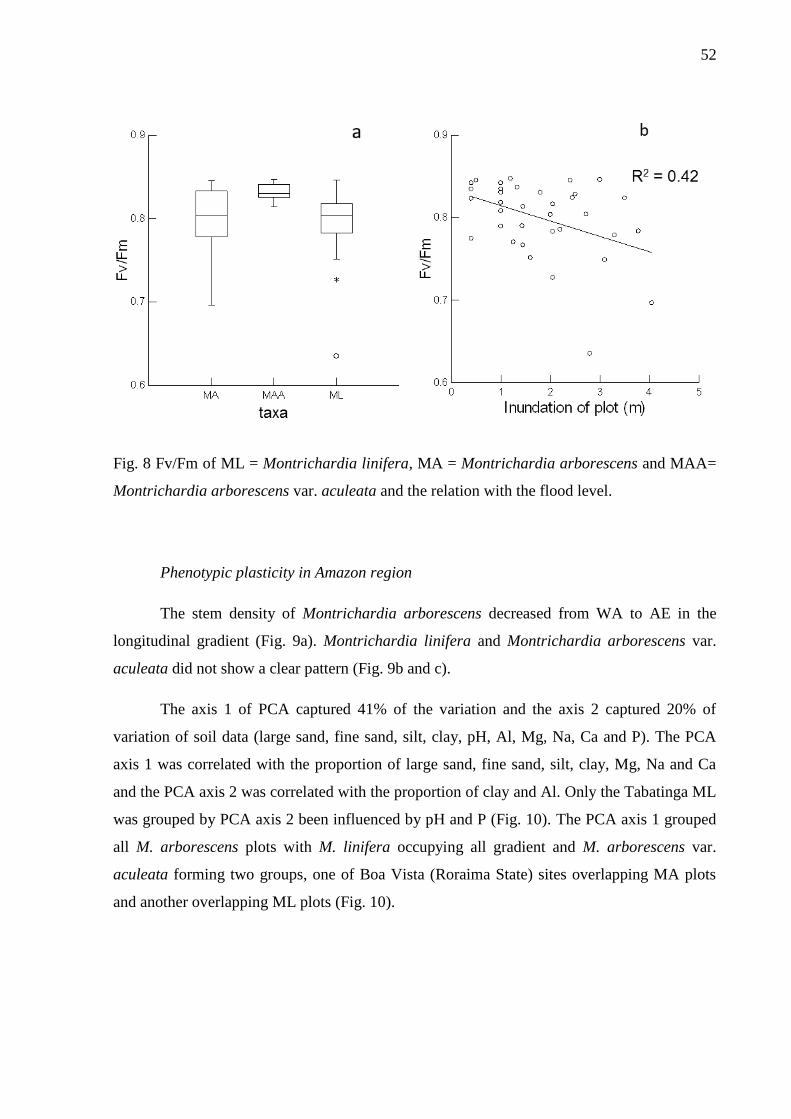
52
Fig. 8 Fv/Fm of ML = Montrichardia linifera, MA = Montrichardia arborescens and MAA=
Montrichardia arborescens var. aculeata and the relation with the flood level.
Phenotypic plasticity in Amazon region
The stem density of Montrichardia arborescens decreased from WA to AE in the
longitudinal gradient (Fig. 9a). Montrichardia linifera and Montrichardia arborescens var.
aculeata did not show a clear pattern (Fig. 9b and c).
The axis 1 of PCA captured 41% of the variation and the axis 2 captured 20% of
variation of soil data (large sand, fine sand, silt, clay, pH, Al, Mg, Na, Ca and P). The PCA
axis 1 was correlated with the proportion of large sand, fine sand, silt, clay, Mg, Na and Ca
and the PCA axis 2 was correlated with the proportion of clay and Al. Only the Tabatinga ML
was grouped by PCA axis 2 been influenced by pH and P (Fig. 10). The PCA axis 1 grouped
all M. arborescens plots with M. linifera occupying all gradient and M. arborescens var.
aculeata forming two groups, one of Boa Vista (Roraima State) sites overlapping MA plots
and another overlapping ML plots (Fig. 10).
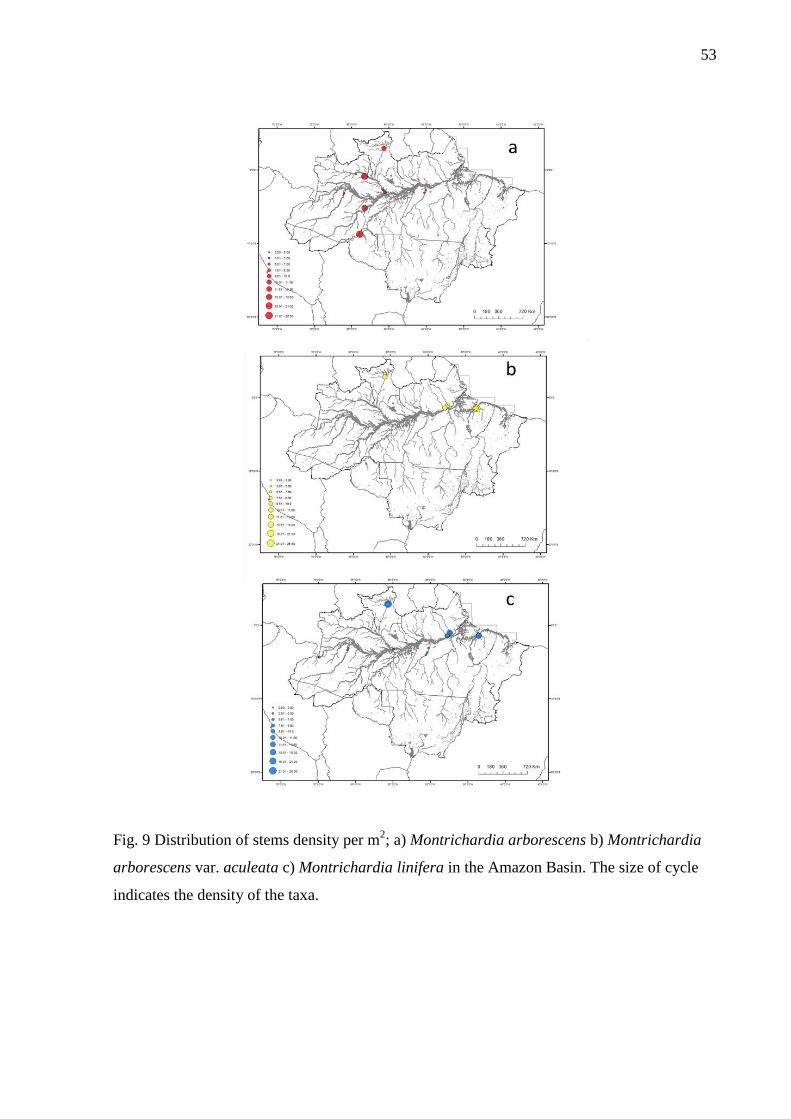
53
Fig. 9 Distribution of stems density per m2; a) Montrichardia arborescens b) Montrichardia
arborescens var. aculeata c) Montrichardia linifera in the Amazon Basin. The size of cycle
indicates the density of the taxa.
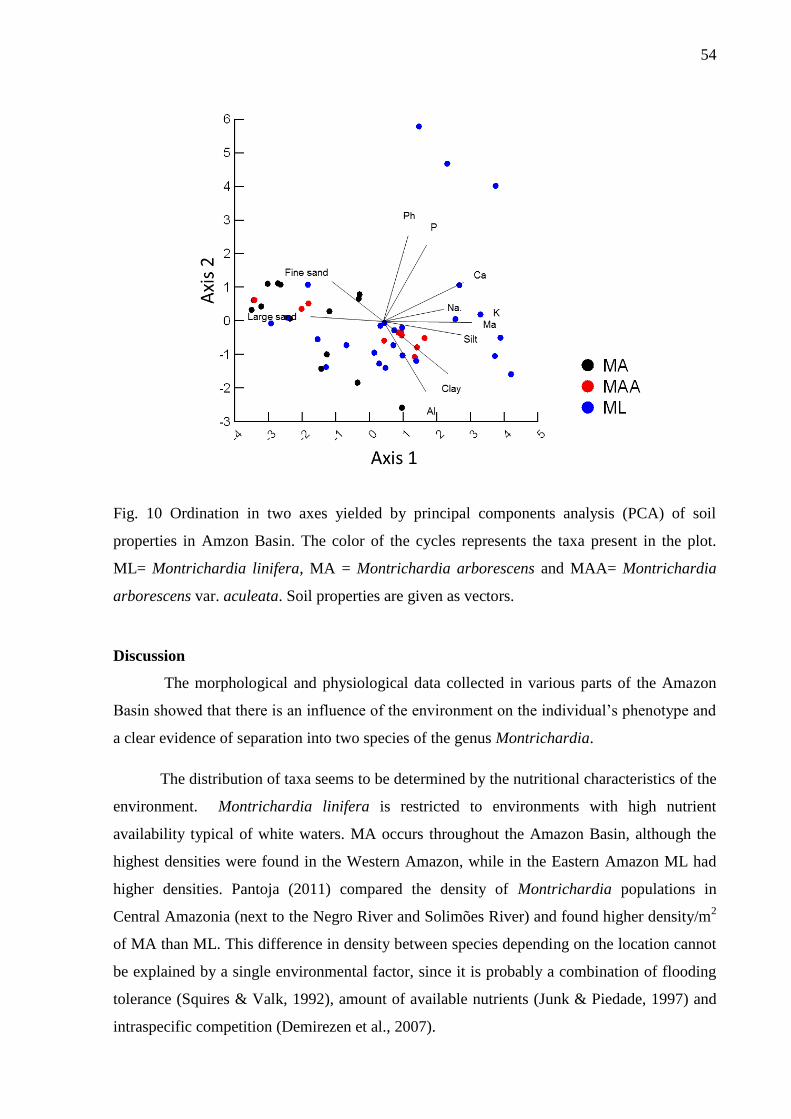
54
Fig. 10 Ordination in two axes yielded by principal components analysis (PCA) of soil
properties in Amzon Basin. The color of the cycles represents the taxa present in the plot.
ML= Montrichardia linifera, MA = Montrichardia arborescens and MAA= Montrichardia
arborescens var. aculeata. Soil properties are given as vectors.
Discussion
The morphological and physiological data collected in various parts of the Amazon
Basin showed that there is an influence of the environment on the individual’s phenotype and
a clear evidence of separation into two species of the genus Montrichardia.
The distribution of taxa seems to be determined by the nutritional characteristics of the
environment. Montrichardia linifera is restricted to environments with high nutrient
availability typical of white waters. MA occurs throughout the Amazon Basin, although the
highest densities were found in the Western Amazon, while in the Eastern Amazon ML had
higher densities. Pantoja (2011) compared the density of Montrichardia populations in
Central Amazonia (next to the Negro River and Solimões River) and found higher density/m2
of MA than ML. This difference in density between species depending on the location cannot
be explained by a single environmental factor, since it is probably a combination of flooding
tolerance (Squires & Valk, 1992), amount of available nutrients (Junk & Piedade, 1997) and
intraspecific competition (Demirezen et al., 2007).
55
The growth in height and diameter plays an important role at the population level,
since the size of the individual may influence the onset of the reproductive period (Lacey,
1986), also influencing the competitive ability for nutrients and space between the plants
(Hutchings & Budd, 1981). The height of the taxa was negatively correlated with water
transparency. Taller plants were found in less transparent water, a strategy of height increment
probably related to the possibility to maintain some level of light uptake during the period of
flooding. The occurrence of plants in environments subjected to flooding is related to the
development of complex morphological and physiological adaptations selected throughout
evolution (Crawford & Braendle, 1996) allowing these taxa to adapt and tolerate such
conditions (Harborne, 1989). Moreover DAB appears to be related to the taxa and nutritional
characteristics of the environment. Sites of the relatively nutritionally rich white waters
showed higher values for DAB of ML, while MA showed higher values in the nutritionally
poor black water. However, the height of plot inundation appears not to influence the DAB of
Montrichardia, since DABs of the taxa did not change when analyzed in association to this
factor, an opposite result in comparison to what was found for Ischnosiphon polyphyllus in
the Rio Negro where smaller DABs were found in areas with higher floods (Nakazono &
Piedade, 2004). In addition, M. arborescens showed higher DAB in environments with higher
levels of flooding which may be related to the capacity of the taxa in endure the pressure of
the water current and sediments (Junk & Piedade, 1997).
The high values of ML biomass found in the present study can be considered as high
when compared to other aquatic macrophytes of Amazonian floodplains such as Paspalum
repens (Ell.) Kunth. (2210 g/m2), Oryza perennis L. (1720 g/m
2) and Hymenachne
amplexicaulis (2270 g/m2) (Piedade et al. 1991, Junk & Howard–Williams 1984).
The concentration of chlorophyll in the leaves of M. arborescens was higher than that
in M. linifera. The chlorophyll concentration may decrease due to nutritional deficiencies
(Lichtenthaler et al., 2007), and higher levels of light incidence in leaves (Villadares &
Niinemets, 2008). Since M. linifera occurs mainly in várzea floodplains with relatively high
concentrations of nutrients such as nitrogen and magnesium (Furch & Junk, 1997), we may
conclude that the lowest concentration of chlorophyll in this species may be related to
differences in light intensity reaching the leaves, similar to the others species expost to same
condition (Lee et al., 2000). In this case the concentration of chlorophyll should relate to the
habitat, since M. linifera inhabits open areas that receive high light intensity, while M.
arborescens is an understory plant being shaded by trees (Lins, 1994).
56
The stomata usually are more abundant in the abaxial side of the leaf (Driscoll et al.,
2006), but not in Montrichardia spp. Densities and size of stomata are a variable
characteristic among the plants and depend on the environment (Castro et al., 2005, Melo et
al., 2007). M. linifera showed higher density of stomata compared to M. arborescens and its
variety aculeata. Reducing the amount of stomata in areas with higher flooding could be
related to the lower water absorption (Kozlowski, 1984), but may also lead to plant water
stress (Jackson & Colmer, 2005; Melo et al., 2007; Parent et al., 2008). Almost all measured
leaves presented values of Fv/Fm between 0.635 and 0.847, which are within the range of
values indicated for healthy aquatic macrophytes (Koch et al., 2007). However, lower values
were found in plants subjected to greater flood levels, indicating that to prolonged flooding
may promote damage in the photosynthetic apparatus even in well adapted species like these
of Montrichardia spp.
The density of Montrichardia in Amazonia ranged from 3 to 26 stems/m2. While M.
linifera occupy an ample part of the gradient without any clear pattern related to differences in
soil fertilityM. arborescens showed a similar density distribution as tree taxa in the West-East
gradient of soil fertility proposed to the Amazon region (Quesada et al., 2010).
Elevated values were found in the western Amazon where the soil fertility is higher
(Ter Steege et al., 2003). However the other two taxa did not show a clear pattern. Therefore
we suggest that similarly to the várzea forests (see Wittmann et al., 2006), the correlations
between environmental variables, density and diversity patterns of aquatic macrophytes in
Amazonian wetlands are difficult to explain because the amount of precipitation in most parts
of the Amazon Basin is not directly related with the height and duration of the local annual
inundations (Junk et al., 1989).
Conclusions
The morphological (height, DAB and length of internodes) and physiological (leaf
chlorophyll concentration) data allowed a clear separation taxonomic and ecological of
Montrichardia linifera and Montrichardia arborescens.
57
While M. linifera occupied an ample part of the gradient without any clear pattern
related to differences in soil fertility, M. arborescens proved to be influenced in terms of stem
density by this gradient, in a similar pattern as described for trees in the Amazon Basin.
The delimitation of our study taxa can well play a role in the context of discussions
about the high species diversity of wetlands. If one species turns out to be two species or
more, as we could demonstrate in our study for Montrichardia in Amazonian floodplains, the
calculations of species numbers, diversity indices, and related plans for management and
conservation must be corrected and generally regarded in a more critical way.
Acknowledgements
This work is support by INCT ADAPTA - Brazilian Ministry of Science, Technology
and Innovation (CNPq/FAPEAM), the Universal CNPq (14/2009; 14/2011), Pronex
(CNPq/FAPEAM) and PELD MAUA (CNPq/FAPEAM). For Naara Ferreira da Silva
(INPA), Raissa Lagreca (UFRO), Pauline Pantoja (INPA), Conceição Lucia Costa, Celso R.
Costa and Valdeney de A. Azevedo we thank the assistance in the collection of data. The
authors thank the Conselho Nacional de Desenvolvimento Científico e Tecnológico (CNPq)
for Aline Lopes Doctor’s Grant; MAUA Research Group, Laboratório de Ecofisiologia e
Evolução (LEEM) for logistical and technical support.
References
Barendregt, A. & A. M. F., Bio, 2003. Relevant variables to predict macrophytes
communities in running waters. Ecological Modelling, 160: 205-217.
Bolhár-Nordenkampf, H. R. & G. Öquist, 1993. Chlorophyll fluorescence as a tool in
photosynthesis research. In: Hall, D.O., J. M. O. Scurlock, H. R. Bolhàr-Nordenkampf, R.C.
Leegood, R.C. & S. P. Long, (eds.), Photosynthesis and Production in a Changing
Environment. Chapman and Hall: 93–206.
Bolhár-Nordenkampf, H. R. & M. Götzl, 1992. Chlorophyllfluoreszenz als Indikator der mit
Seehöhe zunehmenden Streßbelastung von Fichtennadeln, FBVA Berichte. Schriftenreihe d.
Forstl. Bundesveranst. 67, 119–131.
58
Castro, E. M., J. E. B. P. Pinto, H.C. Melo, A. M. Soares, A. A. Alvarenga, & E. C. Lima
Júnior, 2005. Aspectos anatômicos e fisiológicos de plantas de guaco submetidas a diferentes
fotoperíodos. Horticultura Brasileira 23: 846-850.
Crawford, R. M. M., & R. Braendle, 1996. Oxygen deprivation stress in a changing
environment. Journal of Experimental Botany, 47(2), 145-159.
De Oliveira, A.A. & D. Daly, 1999. Geographic distribution of tree species in the region of
Manaus, Brazil: implications for regional diversity and conservation. Biodiversity and Con-
servation, 8, 1245–1259.
De Simone, O., E. Müller, W. J. Junk, & W. Schmidt, 2002. Adaptations of Central Amazon
tree species to prolonged flooding: Root morphology and leaf longevity. Functional Plant
Biology, 29: 1025-1035.
Demirezen, D., A. Aksoy, & K. Uruc-, 2007. Effect of population density on growth, biomass
and nickel accumulation capacity of Lemna gibba (Lemnaceae). Chemosphere 66, 553–557
Dias-Filho, M.B. 2005. Opções forrageiras para áreas sujeitas a inundação ou alagamento
temporário. In: Pedreira, C.G.S., J. C. de Moura, S.C. da Silva & V. P. de Faria (eds.). 22º
Simpósio sobre manejo de pastagem. Teoria e prática da produção animal em pastagens.
Piracicaba: FEALQ, p.71-93.
Driscoll, S. P., A. Prins, E. Olmos, K. J. Kunert & C. H. Foyer, 2006. Specification of adaxial
and abaxial stomata, epidermal structure and photosynthesis to CO2 enrichment in maize
leaves. Journal of Experimental Botany, 57(2), 381-390.
Gentry, A. H., 1988. Changes in plant community diversity and floristic composition on
environmental and geograph ical gradients. Annals of the Missouri Botanical Garden 75: 1–
34.
Harborne, J. B., 1989. Methods in plant biochemistry. Volume 1. Plant phenolics. Academic
Press Ltd..
Hendry, G.A.F. & A.H. Price, 1993. Stress indications: chlorophylls and carotenoids. p. 148-
152. In: Hendry, G.A.F. & J.P. Prime, (eds). Methods in comparative plant ecology. A
laboratory manual, Chapman & Hall, London.
59
Henry-Silva, G. G. & A. F. M. Camargo, 2005. Interações ecologias entre as macrófitas
aquáticas flutuantes Eichhornia crassipes e Pistia stratiotes. Hoehnea, 32(3), 445-452.
Hutchings, M. J., & C. S. Budd, C. S. 1981. Plant competition and its course through time.
Bioscience, 31(9), 640-645.
Jackson, M. B., & T. D. Colmer, 2005. Response and adaptation by plants to flooding
stress. Annals of Botany, 96(4), 501-505.
Junk, W. J & C. Howard-Willians, 1984. Ecology of aquatic macrophytes in Amazonia. In
The Amazon- Limminology and landscape ecology of a mighty tropical river and its basin.
Monographie biologicae (H. Sioli, ed). Dordrecht, p 270-293
Junk, W. J. & M. T. F. Piedade, 1997. Plant life in the floodplain with special reference to
herbaceous plants. In: Junk, W. J., (ed.) The Central Amazon floodplain: Ecological Studies
Berlin: Springer, 126:147‐185.
Junk, W.J., 1989. Flood tolerance and tree distribution in central Amazonian floodplains. In:
Holm-Nielsen L.B., I.C. Nielsen & H. Balslev (eds) Tropical Forests: botanical dynamics,
speciation and diversity. Academic Press, London, 47-64.
Junk, W.J., P. B. Bayley & R. E. Sparks, 1989. The flood pulse concept in river-floodplain
systems. In: DOGE, D.P.(ed.). Proc. Int. Large River Symp (LARS) – Can. Spec. Publ. Fish.
Aquat. Sci., 106:110-127.
Koch M. S., S. A. Schopmeyer, C. Kyhn-Hansen, C. J. Madden & J. S. Peters, 2007. Tropical
seagrass species tolerance to hypersalinity stress Aquatic Botany 86:14–24.
Kozlowski, T. T., 1984. Plant responses to flooding of soil. BioScience 34: 162–166.Lacey,
E. 1986. Onset of reproduction in plants: Size-versus age-dependency. Trends in Ecology and
Evolution, 1:72-75.
Krause, G.H.,Weis, E., 1991. Chlorophyll fluorescence and photosynthesis: The Basics. Ann.
Rev. Plant Physiol. 42, 313–349.
Lacey, E. 1986. Onset of reproduction in plants: Size-versus age-dependency. Trends in
Ecology and Evolution, 1:72-75.
60
Lacoul, P., & B. Freedman, 2006. Environmental influences on aquatic plants in freshwater
ecosystems. Environmental Reviews, 14(2), 89-136.
Lee, D.W., F.Oberbauer, P.Johnson, K. Baskaran, M. Mansor, H. Mohamad & S. K. Yap,
2000. Effects of irradiance and spectral quality on leaf structure and function in seedlings of
two southeast asian Hopea (Dipterocarpaceae) species. American Journal of Botany, 87 (4),
447-455.
Leigh, E.G., 1999. Tropical forest ecology: a view from the Barro Colorado Island. Oxford
University Press, Oxford.
Lichtenthaler, H. K., 2007. Biosynthesis, accumulation and emission of carotenoids, α-
tocopherol, plastoquinone, and isoprene in leaves under high photosynthetic
irradiance. Photosynthesis research, 92(2), 163-179.
Lins, A.L. 1994. Aspectos morfológicos e anatômicos de raízes do gênero Montrichardia
Crueg (Araceae). M.Sc. dissertation, Universidade Federal do Rio Grande do Sul. 93 pp.
Porto Alegre.
Lytle, D. A. & N. L. Poff, 2004. Adaptation to natural flow regimes. Trends in Ecology and
evolution, 16(2): 94-100.
Madsen, T. V., P. Hahn & J. Johansen, 1998. Effect of inorganic carbon supply on the
nitrogen requirement of two submerged macrophytes, Elodea Canadensis and Callitriche
cophocarpa. Aquatic Botany, 62: 95-106.
Maxwell, K., & Johnson, G. N. (2000). Chlorophyll fluorescence--a practical guide. Journal
of Experimental Botany, 51(345), 659–68.
Mayo, S. J., J. Bogner & P.C. Boyce, 1987. The Genera of Araceae. RBGKew Press,
Londres.
Melo, H. D., E. D. Castro, A. M. Soares, L. D. Melo & J. D. Alves, 2007. Alterações
anatômicas e fisiológicas em Setaria anceps Stapf ex Massey e Paspalum paniculatum L. sob
condições de déficit hídrico. Hoehnea, 34(2), 145-153.
Mori S. A., 1991. The Guyana lowland Xoristic province. Comp Rendu Séan Soc Biogéogr.
67:67–75.
61
Murphy, K. J., 2002. Plant communities and plant diversity in softwater lakes if northern
Europe. Aquatic Botany, 73:287-324.
Nakazono, E. M., & M. T. F. Piedade, 2004. Biologia e ecologia do arumã, Ischnosiphon
polyphyllus (Marantaceae), no arquipélago de Anavilhanas, Rio Negro, Amazônia
Central. Revista Brasil. Bot, 27(3), 421-428.
Neiff, J.J. & A. S. G. P. Neiff, 2003. Connectivity processes as a basis for the management of
aquatic plants. In: Ecologia e Manejo de Macrófitas Aquáticas. Eds. Thomaz, S. & Bini, L.M.
Nupélia - Maringá (SC). Eduem, Maringá, 39-58.
Pantoja, P.O., 2011. Comparação ecofisiológica e de atributos de crescimento das herbáceas
aquáticas Montrichardia linifera (Arruda.) Schott e M. arborescens (L.) Schott em tipologias
alagáveis contrastantes na Amazônia Central. Master thesis., INPA, Manaus, 63 p.
Parent, C., N. Capelli & J. Dat, 2008. Reactive oxygen species, stress and cell death in plants.
Comptes Rendus – Biologies 331, 255–261.
Parolin P., 2009. Submerged in darkness: adaptations to prolonged submergence by woody
species of the Amazonian Floodplains. Annals of Botany. 103:359–376.
Parolin P., C. Lucas, M. T. F. Piedade & F. Wittmann. 2010. Drought responses of flood-
tolerant trees in Amazonian floodplains. Annals of Botany. 105:129–139.
Parolin, P., O. De Simone, K. Haase, D. Waldhoff, R. S. Ottenberger, U. Kuhn, J.
Kesselmeier, W. Schmidt, M. T. F. Piedade & W. J. Junk, 2004. Central Amazon floodplain
forests: tree survival in a pulsing system.- The Botanical Review 70(3):357-380.
Parolin, P., 2001. Morphological and physiological adjustments to water logging and drought
in seedlings of Amazonian floodplain trees. Oecologia, 128: 326-335.
Pezeshki, S. R., 2001. Wetland plant responses to soil flooding.Environmental and
Experimental Botany, 46(3), 299-312.
Piedade M. T. F., W. J. Junk, S. A. D'Ângelo, F. Wittmann, J. Schöngart, K. M. D. N.
Barbosa, & A. Lopes, 2010. Aquatic herbaceous plants of the Amazon floodplains: state of
the art and research needed. Acta Limnologica Brasiliensia 22(2):165-178.
62
Piedade, M. T.F., W. J. Junk, & S. P. Long. 1991. The productivity of the C4 grass
Echinochloa polystachya on the Amazon floodplain. Ecology ,72:1456–1463.
Pimenta, J.A., E. Bianchini & M. F. Medri. 1998. Adaptations to flooding by tropical trees:
morphological and anatomical modifications. In: F.R. Scarano & A.C. Franco (eds.).
Ecophysiological strategies of xerophytic and amphibious plants in the Neotropics. Série
Oecologia Brasiliensis, 4:154-176.
Pitman, N.C.A., J. Terborgh, M. R. Silman, P. V. Nunêz, D.A. Neill, C. E. Ceron, W. A.
Palacios & M. Aulestia, 2002. A comparison of tree species diversity in two upper
Amazonian forests. Ecology, 83, 3210–3224.
Prance, G.T., 1994. The use of phytogeographic data for conservation planning. Systematics
and conservation eval- uation. Systematic Association Special, Vol. 50 (ed. by P.L. Forey,
C.J. Humphries & R.I. Vane-Wright), pp. 145–163. Clarendon Press, Oxford
Quesada, C. A. Lloyd, J. Schwarz, M. Patino, S. Baker, T.R. Czimczik, C.I. Fyllas,
N.M. Martinelli, L. Nardoto, G.B. Schmerler, J. Santos, A.J.B. Hodnett, M.G. Herrera,
R. Luizao, F.J. Arneth, A. Lloyd, G. Dezzeo, N. Hilke, I. Kuhlmann, I. Raessler, M. Brand,
W.A. Geilmann, H. Moraes Filho, J.O. Carvalho, F.P. Araujo Filho, R.N. , et al. ; Variations
in chemical and physical properties of Amazon forest soils in relation to their genesis.
Biogeosciences, v. 7, p. 1515-1541, 2010.
Riis, T., K. Sand-Jensen. & O. Vestergaard, 2000. Plant communities in lowland Danish
streams: species composition and environmental factors. Aquatic Botany. 66: 255-172.
Schöngart, J., M. T. F. Piedade, F. Wittmann, W. J. Junk, & M. Worbes, 2005. Wood growth
patterns of Macrolobium acaciifolium (Benth.) Benth.(Fabaceae) in Amazonian black-water
and white-water floodplain forests.Oecologia, 145(3), 454-461.
Sculthorpe, C.D., 1967. The Biology of Aquatic Vascular Plants. Edward Arnold, London, p.
610.
Silva, M. F. S., I. M. De Andrade, S. J. Mayo, 2012. Geometric morphometrics of leaf blade
shape in Montrichardia linifera (Araceae) populations from the Rio Parnaíba Delta, north‐east
Brazil. Botanical Journal of the Linnean Society, 170(4), 554-572.
63
Sioli, H. 1954., Betrachtungen über den Begriff der “Fruchtbarkeit” eines Gebietes anhand
der Verhältnisse in Böden und Gewässern Amazoniens. Forsch. Fortscin. Berlin 28(3):65–72.
Squires, L. & A. V. D. Valk, 1992. Water-depth tolerances of the dominant emergent
macrophytes of the Delta Marsh, Manitoba. Canadian Journal of Botany, 70(9), 1860-1867.
Ter Steege, H., D. Sabatier, H. Castellanos, T. Van Andel, J. Duivenvoorden, A. A. de
Oliveira, R. de Ek, R. Lilwah, P. Maas & S. Mori, 2000. An analysis of the floristic
composition and diversity of Amazonian forests including those of the Guiana shield. Journal
of Tropical Ecology, 16, 801–828.
Ter Steege, H., N. C. Pitman, D. Sabatier, C. Baraloto, R. P. Salomão, J. E. Guevara & P. V.
Fine, 2013. Hyperdominance in the Amazonian tree flora. Science, 342(6156), 1243092.
Ter Steege, H., N. C. Pitman, O. L. Phillips, J. Chave, D. Sabatier, A. Duque, & R. Vásquez,
2006. Continental-scale patterns of canopy tree composition and function across
Amazonia. Nature, 443(7110), 444-447.
Ter Steege, H., N. Pitman, D. Sabatier, H. Castellanos, P. Van der Hout, D.C. Daly, M.
Silveira, O. L. Phillips, R. Vasquez, T. Van Andel, J. Duivenvoorden, A. A. De Oliveira, R.
Ek, R. Lilwah, R. Thomas, J. Van Essen, C. Baider, P. Maas, S. Mori, J. Terborgh, P. V.
Nunez, H. Mogollo´n & W. Morawetz, 2003. A spatial model of tree a- diversity and b-
density for the Amazon Region. Biodiversity and Conservation, 12, 2255–2277.
Valladares, F. & U. L. Niinemets, 2008. Shade Tolerance, a Key Plant Feature of Complex
Nature and Consequences. Annu. Rev. Ecol. Evol. Syst, 39: 237–57.
Waldhoff, D., W. J. Junk & B. Furch, 2000. Comparative measurements of chlorophyll a
parameters of Nectandra ama zonum under different environmental conditions in climate
controlled chambers. Verh. Internat. Verein. Limnol. 27: 2052–2056.
Whitmore, T. C., 1975. Tropical rain forests of the Far East. Clarendon, Oxford.
Wittmann, F. & P. Parolin, 1999. Phenology of six tree species from Central Amazonian
varzea. Ecotropica 5, 51–57
Wittmann, F., J. Schöngart, J. C. Montero, T. Motzer, W. J. Junk, M. T. F. Piedade, & M.
Worbes, 2006. Tree species composition and diversity gradients in white‐water forests across
the Amazon Basin. Journal of Biogeography, 33(8), 1334-1347.

Capítulo 3
______________________________________________________________________
Lopes et al., (a ser submetido) Diversidade
genética e estrutura filogeográfica de
Montrichardia spp. (Araceae) na Bacia
Amazônica, Acta Amazônia.
65
Diversidade genética e estrutura filogeográfica de Montrichardia
spp. (Araceae) na Bacia Amazônica
Aline Lopes1, Maristerra R. Lemes
2, Rogério Gribel
2 & Maria Teresa Fernandez
Piedade3
1 Pós-graduação em Ecologia. Instituto Nacional de Pesquisas da Amazônia/ Grupo
MAUA “Ecologia, Monitoramento e Uso Sustentável de Áreas Úmidas Amazônicas”
2 Instituto Nacional de Pesquisas da Amazônia, Laboratório de Genética e Biologia
Reprodutiva de Plantas (LabGen)
3 Instituto Nacional de Pesquisas da Amazônia, CDAM/ Grupo MAUA “Ecologia,
Monitoramento e Uso Sustentável de Áreas Úmidas Amazônicas”
Resumo
O gênero neotropical Montrichardia possui um complexo de três táxons cuja
interpretação sistemática é feita com base em caracteres morfológicos. Buscando delimitar
taxonomicamente as espécies, procedeu-se à caracterização dos padrões de distribuição da
variabilidade genética em populações de Montrichardia spp. na Bacia Amazônica brasileira,
com base na análise de nove locos microssatélites do genoma do cloroplasto, por meio de uma
abordagem filogeográfica. Amostraram-se 288 indivíduos de 18 populações de Montrichardia
spp. (M. arborescens (MA) = 7, M. linifera (ML) = 7 e M. arborescens var. aculeata (MAA)
= 4). Foram observados entre 3 a 15 alelos por loco cpSSR e 36 haplótipos. O índice médio de
diversidade genética (HE) foi alto: MA= 0,68, MAA= 0,56 e ML= 0,62. A distribuição da
variabilidade genética dentro e entre as populações (AMOVA) mostrou que 55,4% da
variação genética encontram-se entre as populações (7,5% se deve à variação entre as
espécies) e 37,1% dentro das populações, evidenciando alta estruturação genética entre as
66
populações (RST = 0.63) e baixa diferenciação entre os táxons. A análise de relacionamento
dos haplótipos indicou a existência de eventos múltiplos de colonização por diferentes
linhagens maternas na maioria das populações de Montrichardia estudadas. Os resultados
também indicam a existência de fluxo gênico histórico entre as duas espécies (M. arborescens
e M. linifera) e a variedade M. arborescens var. aculeata, sugerindo a ocorrência de
introgressão. Sugerimos investigações futuras que incluam marcadores do genoma nuclear,
para melhor compreender a influência da introgressão nos diferentes padrões morfológicos de
Montrichardia observados na natureza.
Palavras chave: Macrófitas aquáticas, estrutura genética, diversidade haplotípica, SSR,
genoma do cloroplasto.
Genetic diversity and phylogeographic structure of Montrichardia spp. (Araceae)
populations in the Amazon Basin
Abstract The Neotropical genus Montrichardia has a complex of three taxa whose
systematic interpretation varies according to the morphological characters considered. To
delimit the species taxonomy the characterization of the distribution patterns of genetic
variability was performed in populations of Montrichardia spp. in the Brazilian Amazon
Basin with phylogeographic approach. We sampled 288 individuals from 18 populations of
M. arborescens (MA; 7), M. linifera (ML; 7) and M. arborescens var. aculeata (MAA; 4).
three to 15 alleles per locus cpSSR were observed. The average of genetic diversity index
(HE) was high: MA= 0.68, MAA= 0.56 and ML= 0.62. The distribution of genetic variation
within and between populations (AMOVA) showed that 55,4 % of genetic variation is
contained among populations (approximately 7,5 % due to the variation between species) and
37,1 % within populations, indicating high genetic structure among populations (RST = 0.63).
The analysis of haplotypes relationship indicated the existence of multiple events of
67
colonization by different maternal lineages in most populations of Montrichardia studied. The
results also indicate the existence of gene flow between the two species (M. arborescens and
M. linifera) and the variety M. arborescens var. aculeata, suggesting the occurrence of
introgression. We suggest that future research include the nuclear genome markers to better
understand the influence of introgression in different morphological patterns of
Montrichardia observed in nature.
Key-words: Aquatic macrophytes, genetic diversity, haplotype diversity, SSR, chloroplast
genome
Introdução
A distribuição geográfica de plantas é frequentemente limitada por fatores climáticos,
pela competição entre as espécies e por barreiras geográficas que impedem migrações
(Sculthorpe 1967; Woodward & Williams 1987; Woodward 1988; Santamaría 2002). As
barreiras geográficas impedem tanto o fluxo gênico pela impossibilidade de troca de gametas,
quanto os eventos de dispersão das plantas, e com isso impossibilitam a interação entre
populações e a colonização de novas áreas (Martins 1987). No caso das plantas aquáticas,
uma distribuição compatível com as grandes barreiras terrestres que separam os corpos de
água seria esperada. Entretanto somente cerca de 39% dos gêneros que contêm macrófitas
aquáticas são endêmicos de alguma região biogeográfica (Chambers et al. 2008). Em nível
mundial esse padrão de distribuição se deve à facilitação da dispersão propiciada pelas
navegações há mais de cinco séculos (Cook, 1985); em níveis regionais e locais, outros
fatores como a conectividade hídrica, ao menos sazonal, podem ser de grande relevância
(Junk & Piedade 1997; Hoorn 2006).
68
As populações, embora sejam compostas por indivíduos da mesma espécie que vivem
em uma mesma área, não são geneticamente homogêneas (Silvertown & Doust 1993). Elas
apresentam variadas diferenças genéticas estruturais, as quais dependem da frequência gênica
e genotípica (Hamrick 1982). O fluxo gênico depende das migrações entre populações,
havendo aumento da diversidade genética dentro de uma população e diminuição da variação
genética entre populações (Wright 1932). Já a deriva genética afeta a frequência de um alelo
na população devido à amostragem aleatória de gametas, promovendo, com isso, a diminuição
da variação genética dentro de uma população, mas aumentando a diferenciação genética
entre populações pequenas (Wright 1969). As atividades humanas frequentemente resultam na
diminuição da deriva genética e no aumento do fluxo gênico de muitas espécies, o que reduz a
variação genética nas populações locais e evita a propagação de complexos adaptativos para
fora da sua população de origem. Desta forma, os processos adaptativos são perturbados local
e globalmente dentro de uma espécie (Silvertown & Doust 1993). Estudos sobre a distribuição
espacial da variação genética dentro e entre as populações, ou da estrutura genética da
população, têm facilitado muito a compreensão da especiação, adaptação e dinâmica
populacional (Zhang et al. 2005), de vital importância para a conservação.
Pesquisas sobre variabilidade genética com o uso de marcadores moleculares SSR
(simple sequence repeat) nucleares e de cloroplasto têm sido amplamente realizadas com
plantas aquáticas como as espécies da família Araceae (Lemna spp.) (Xue et al. 2012),
Spartina maritima (de Carvalho et al. 2013) e Elodea canadensis (Huotari & Korpelainen
2012; Huotari & Korpelainen 2013). Essa metodologia pode fornecer subsídios para a
avaliação da origem e dispersão de espécies nativas ou exóticas, bem como servir como ponto
de partida para estudos de manejo (Meekins et al. 2001; Tang et al. 2009). A utilização de
marcadores microssatélites de cloroplasto para análises interespecíficas também é possível já
que homoplasias têm sido observadas apenas em categorias taxonômicas acima de gênero
69
(Doyle et al. 1998; Hale et al. 2004) e, ainda assim, muitos pesquisadores têm considerado os
níveis de homoplasia baixos o suficiente para permitir análises genéticas populacionais
(Cuenca et al. 2003; Navascués & Emerson 2005). Em um estudo comparando simulações
computacionais e dados empíricos de uma espécie de Pinus, Navascués & Emerson (2005)
avaliaram os efeitos da homoplasia nas medidas de diversidade genética baseadas em cpSSR e
concluíram que o índice de diversidade genética de Nei (HE) é pouco influenciado por
homoplasias, e que o uso de um grande número de locos contribui para diminuir os efeitos
negativos das homoplasias nas estimativas de diversidade genética.
O gênero Montrichardia Crueg inclui plantas que podem ser encontradas nas áreas
úmidas da América latina (Mayo et al. 1997; Croat et al. 2005), e seus representantes são
polinizados por besouros e por entomofilia (Gibernau et al. 2003). Atualmente duas espécies
são reconhecidas no gênero, Montrichardia arborescens (L.) Schott e Montrichardia linifera
(Arruda) Schott (Croat et al. 2005), havendo ainda a descrição da variedade M. arborescens
aculeata (G. Mey.) Engl. (Lins 1994) e a espécie extinta Montrichardia aquatica (Herrera
2008). Enquanto alguns estudos utilizando caracteres morfológicos de folhas apontam para a
definição de apenas uma espécie, M. linifera (Silva et al. 2012), outros apontam para a
separação das duas espécies (Mirouze et al. 2012, capitulo 2). Diante desta situação, a análise
de marcadores moleculares pode contribuir para a delimitação das espécies do gênero
Montrichardia.
Neste estudo foi analisada a estrutura filogeográfica de Montrichardia spp. utilizando
um grande número (18) de populações distribuídas na Amazônia Legal Brasileira, analisadas
por meio de marcadores do genoma do cloroplasto, nove locos de microssatélites. Os estudos
de filogeografia em plantas baseiam-se principalmente na variabilidade do genoma de
cloroplasto (cpDNA). O genoma do cloroplasto caracteriza-se por não ser recombinante,
apresentar baixos níveis de mutação e herança haplóide (uniparental), geralmente materna, na
70
maioria das angiospermas (Avise 1994), e por ser transmitido unicamente via sementes (Birky
1995; McCauley 1994), o que possibilita identificar padrões de distribuição da variabilidade
genética mais estruturados geograficamente, comparados àqueles observados no genoma
nuclear (Ennos et al. 1999; Cavers et al. 2003; Petit et al. 2005). A estrutura genética deste
genoma é influenciada pelo parentesco histórico e fluxo gênico ancestral entre populações,
bem como por eventos históricos como glaciações e mudanças climáticas ao longo do tempo
geológico (Avise 1994).
Este trabalho foi concebido tendo como objetivo identificar o grau de diferenciação
genética existente entre as espécies e populações e caracterizar geneticamente, com
marcadores moleculares, a distribuição de populações de Montrichardia spp. na Bacia
Amazônica brasileira. Nossa hipótese é que a separação das espécies descritas com base em
caracteres morfológicos reflete a separação genética entre as espécies Montrichardia linifera e
Montrichardia arborescens (incluindo a variedade aculeata). A delimitação dos táxons pode
desempenhar um importante papel no contexto das discussões sobre a grande diversidade
vegetal nas zonas úmidas. Se uma espécie pode ser duas espécies ou mais, os cálculos de
número de espécies, índices de diversidade e planos relacionados para gestão e conservação
deve ser corrigido e considerados de uma forma mais maneira crítica.
Materiais e Métodos
1. Área de estudo, material biológico e delineamento experimental
Para a caracterização genética das populações de Montrichardia spp. foram coletadas
amostras de folhas de 288 indivíduos pertencentes a 18 populações localizadas em áreas
alagáveis na Amazônia brasileira (Tabela1; Figura 1). Foram amostrados 16 indivíduos por
população.
71
As amostras coletadas compreenderam as populações de duas espécies e uma
variedade de Montrichardia, M. arborescens (L.) Schott (Araceae), M. linifera (Arr.) Schott
(Araceae) e M. arborescens var. aculeata, as quais apresentam diferenças morfológicas
descritas no capitulo 2. As espécies, conhecidas como aninga ocorrem ao longo da calha de
rios da Bacia Amazônica formando agrupamentos monoespecíficos. M. linifera possui mais
registros de ocorrência na zona costeira, enquanto que M. arborescens possui uma
distribuição maior no interior das áreas florestadas (ver Capitulo 1). Já M. arborescens var.
aculeata tem sua distribuição relacionada com ambientes salobros na foz no rio Amazonas
(Lins 1994). Entretanto, as espécies podem também ser encontradas em altas densidades na
América Central e em pontos isolados em Minas Gerais e Bahia (BR) (ver Capitulo 1). Na
Amazônia podem ser encontradas em ambientes ricos nutricionalmente, como os rios de água
branca, mas também em ambientes pobres, como os rios de água preta e clara, e em ambientes
salobros na foz no rio Amazonas (CRIA 2014; ver Capitulo 1). As espécies foram
identificadas pela morfologia, com base na diferença no número de nervuras secundárias
apicais; M. linifera possui entre 6 e 9 nervuras, enquanto M. arborescens e M. arborescens
var. aculeata possuem entre 3 a 5 nervuras, porém esta última variedade possui um grande
número de acúleos no caule enquanto que em MA e ML esse número é reduzido (Figura 2).
As amostras de folhas coletadas foram acondicionadas em sacos plásticos contendo
sílica gel e posteriormente armazenadas a - 20ºC até a extração do DNA. As análises
genéticas foram realizadas no Laboratório de Genética e Biologia Reprodutiva de Plantas
(LABGEN) do INPA.
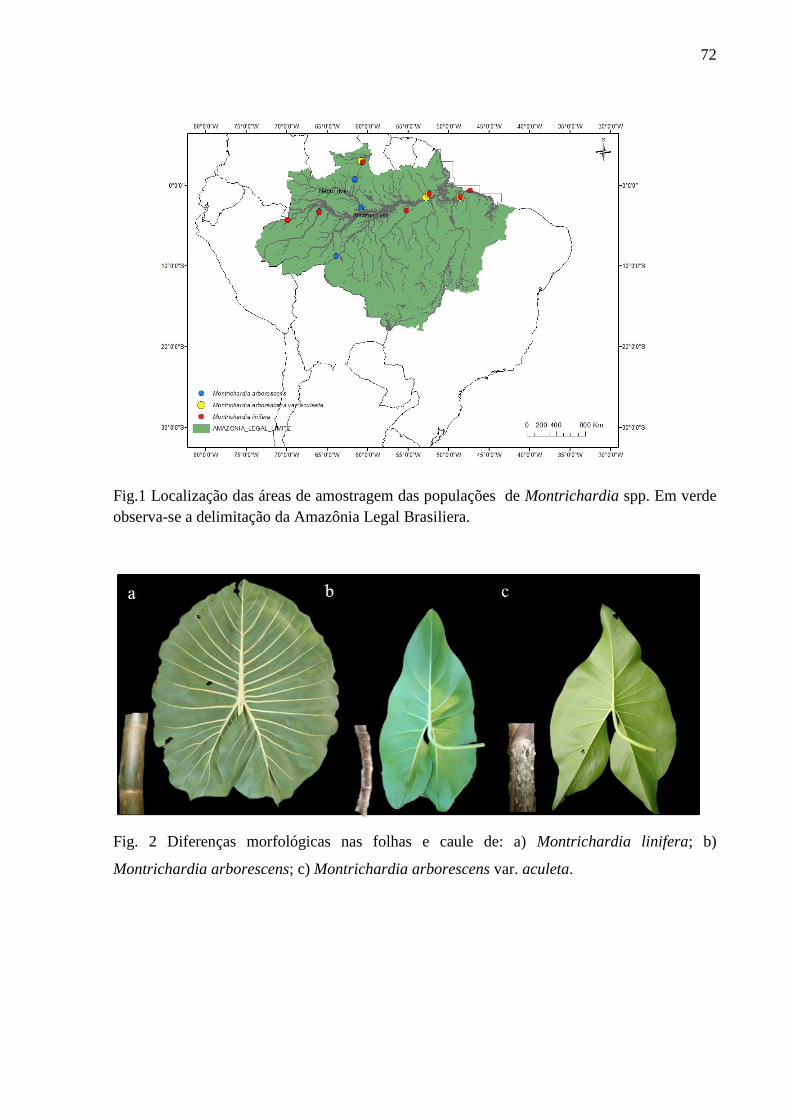
72
Fig.1 Localização das áreas de amostragem das populações de Montrichardia spp. Em verde
observa-se a delimitação da Amazônia Legal Brasiliera.
Fig. 2 Diferenças morfológicas nas folhas e caule de: a) Montrichardia linifera; b)
Montrichardia arborescens; c) Montrichardia arborescens var. aculeta.
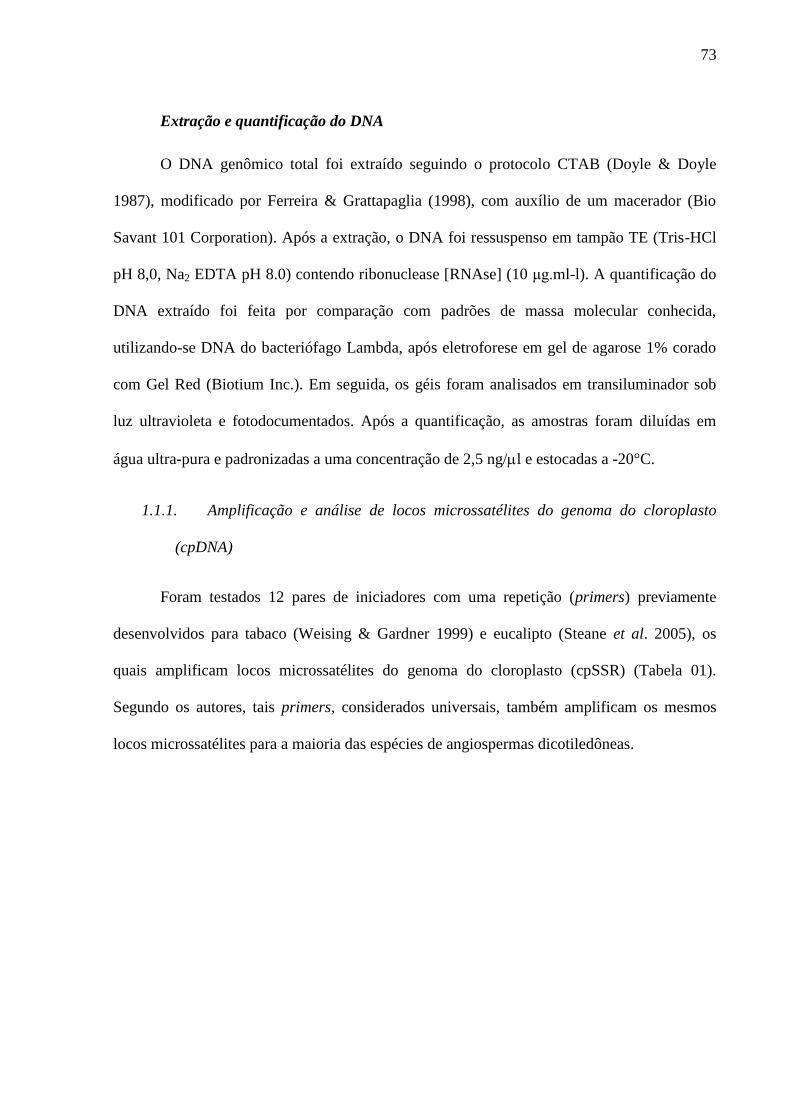
73
Extração e quantificação do DNA
O DNA genômico total foi extraído seguindo o protocolo CTAB (Doyle & Doyle
1987), modificado por Ferreira & Grattapaglia (1998), com auxílio de um macerador (Bio
Savant 101 Corporation). Após a extração, o DNA foi ressuspenso em tampão TE (Tris-HCl
pH 8,0, Na2 EDTA pH 8.0) contendo ribonuclease [RNAse] (10 μg.ml-l). A quantificação do
DNA extraído foi feita por comparação com padrões de massa molecular conhecida,
utilizando-se DNA do bacteriófago Lambda, após eletroforese em gel de agarose 1% corado
com Gel Red (Biotium Inc.). Em seguida, os géis foram analisados em transiluminador sob
luz ultravioleta e fotodocumentados. Após a quantificação, as amostras foram diluídas em
água ultra-pura e padronizadas a uma concentração de 2,5 ng/l e estocadas a -20°C.
1.1.1. Amplificação e análise de locos microssatélites do genoma do cloroplasto
(cpDNA)
Foram testados 12 pares de iniciadores com uma repetição (primers) previamente
desenvolvidos para tabaco (Weising & Gardner 1999) e eucalipto (Steane et al. 2005), os
quais amplificam locos microssatélites do genoma do cloroplasto (cpSSR) (Tabela 01).
Segundo os autores, tais primers, considerados universais, também amplificam os mesmos
locos microssatélites para a maioria das espécies de angiospermas dicotiledôneas.
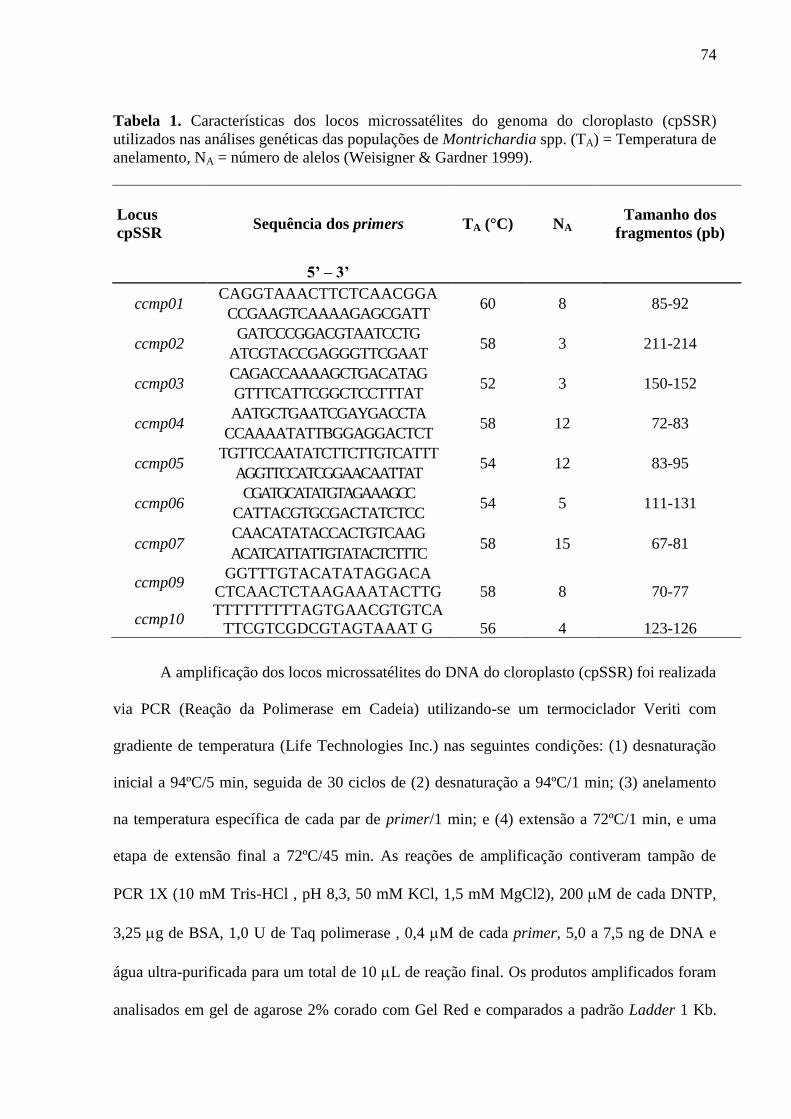
74
Tabela 1. Características dos locos microssatélites do genoma do cloroplasto (cpSSR)
utilizados nas análises genéticas das populações de Montrichardia spp. (TA) = Temperatura de
anelamento, NA = número de alelos (Weisigner & Gardner 1999).
Locus
cpSSR Sequência dos primers TA (°C) NA
Tamanho dos
fragmentos (pb)
5’ – 3’
ccmp01 CAGGTAAACTTCTCAACGGA
60 8 85-92 CCGAAGTCAAAAGAGCGATT
ccmp02 GATCCCGGACGTAATCCTG
58 3 211-214 ATCGTACCGAGGGTTCGAAT
ccmp03 CAGACCAAAAGCTGACATAG
52 3 150-152 GTTTCATTCGGCTCCTTTAT
ccmp04 AATGCTGAATCGAYGACCTA
58 12 72-83 CCAAAATATTBGGAGGACTCT
ccmp05 TGTTCCAATATCTTCTTGTCATTT
54 12 83-95 AGGTTCCATCGGAACAATTAT
ccmp06 CGATGCATATGTAGAAAGCC
54 5 111-131 CATTACGTGCGACTATCTCC
ccmp07 CAACATATACCACTGTCAAG
58 15 67-81 ACATCATTATTGTATACTCTTTC
ccmp09 GGTTTGTACATATAGGACA
CTCAACTCTAAGAAATACTTG 58 8 70-77
ccmp10 TTTTTTTTTAGTGAACGTGTCA
TTCGTCGDCGTAGTAAAT G 56 4 123-126
A amplificação dos locos microssatélites do DNA do cloroplasto (cpSSR) foi realizada
via PCR (Reação da Polimerase em Cadeia) utilizando-se um termociclador Veriti com
gradiente de temperatura (Life Technologies Inc.) nas seguintes condições: (1) desnaturação
inicial a 94ºC/5 min, seguida de 30 ciclos de (2) desnaturação a 94ºC/1 min; (3) anelamento
na temperatura específica de cada par de primer/1 min; e (4) extensão a 72ºC/1 min, e uma
etapa de extensão final a 72ºC/45 min. As reações de amplificação contiveram tampão de
PCR 1X (10 mM Tris-HCl , pH 8,3, 50 mM KCl, 1,5 mM MgCl2), 200 M de cada DNTP,
3,25 g de BSA, 1,0 U de Taq polimerase , 0,4 M de cada primer, 5,0 a 7,5 ng de DNA e
água ultra-purificada para um total de 10 L de reação final. Os produtos amplificados foram
analisados em gel de agarose 2% corado com Gel Red e comparados a padrão Ladder 1 Kb.
75
Após a otimização das condições de amplificação dos locos cpSSR, os produtos amplificados
foram analisados por eletroforese capilar, em um sequenciador ABI 3130 XL (Life
Technologies, Inc.), seguindo as instruções do fabricante. Para estimar os tamanhos dos
fragmentos amplificados foi utilizado o padrão interno GeneScan 500 ROX (Life
Technologies, Inc.) e, para tal, um dos primers de cada par utilizado na amplificação de cada
loco cpSSR foi marcado com um fluoróforo específico (TET, HEX ou FAM). Os alelos
detectados foram analisados usando o software GeneMapper 4.1 (Life Technologies, Inc.).
Análise dos dados
As populações de cada espécie foram consideradas independes e serviram como
réplicas para comparação entre as espécies. Os parâmetros de diversidade genética estimados
para cada população foram: número de alelos (A), número de haplótipos (Nh) e índice de
diversidade genética de Nei (HE) (Nei 1987) inferidos por meio do programa Arlequin 3.5
(Excoffier et al. 2005).
Para determinar os padrões de distribuição da variabilidade genética e diferenciação
genética entre as populações de Montrichardia spp. foi realizada uma análise de variância
molecular (AMOVA) implementada pelo programa Arlequin 3.5 (Excoffier et al. 2005). O
índice de diferenciação genética (RST) entre as populações foi estimado por meio da AMOVA,
cuja significância foi testada por meio de 1023 permutações (Slatkin 1995).
A hipótese de isolamento por distância foi testada utilizando o teste de Mantel (Mantel
1967), por meio do programa Arlequin 3.5 (Excoffier et al. 2005). Essa análise correlaciona
medidas de distância genética e distância geográfica (Km), entre os pares das populações
analisadas.
As relações entre os haplótipos foram estimadas por meio de uma análise de rede
(“network”) pelo método “Median-Joining” (Bandelt et al. 1999) implementada pelo
76
programa Network 4.6.1.2 (Fluxus Technology Ltd. www.Fluxus-engineering.com; Forster et
al. 2001). Para a construção da rede foi necessária à redução do número de haplótipos
utilizando o método de contração e, em seguida, buscando diminuir o efeito de homoplasia
comum nos locos cpSSR, foi executada a rotina de redução da média referente aos haplótipos
com frequência maior que um. Aos alelos com maior número de mutações foram atribuídos
pesos inversos de 9 a 2 para diminuir ainda mais a possibilidade de homoplasias na rede,
conforme sugerido por Bandelt et al. (1999).
Com base em uma matriz de distâncias genéticas de Nei (1972) foi construído um
dendrograma utilizando o método de agrupamento de distância média (UPGMA), o qual
infere sobre o relacionamento entre os pares de populações (Swofford & Olsen 1990). Esta
análise foi realizada utilizando-se o programa “Tools for Population Genetic Analyses –
TFPGA” (Miller 1997). A significância estatística observada nos nós do dendrograma foi
estimada por meio de análise bootstraping com base em 1000 permutações, também
implementada no programa TFPGA.
Resultados
Diversidade genética
Dos 12 pares de primers universais de cpSSR testados (Weising & Gardner 1999;
Steane et al., 2005), nove tiveram suas condições de amplificação otimizadas (anexo I),
confirmando assim a transferibilidade desses marcadores para Montrichardia spp.. Todos os
locos de cpSSR (ccmp1, ccmp2, ccmp3, ccmp4, ccmp5, ccmp6, ccmp7, ccmp9 e ccmp10)
utilizados mostraram-se polimórficos e foram analisados para caracterizar a variabilidade
genética dos 288 indivíduos coletados nas 18 populações de Montrichardia spp. amostradas
(Tabela 2).
77
No total foram identificados 70 alelos para os nove locos cpSSR considerando todas as
populações amostradas para os três táxons de Montrichardia, sendo que o número de alelos
observados por loco variou de 3 a 15. O número total de alelos observado para cada espécie
foi de 65 para MA, 54 para ML e 43 para MAA. O índice médio de diversidade genética (HE)
observado para o conjunto das populações foi 0,400, variando de 0,319 a 0,586 (Tabela 2). As
populações que apresentaram a maior diversidade genética, considerando-se os índices de
diversidade de Nei (HE) e o número de alelos analisados em conjunto foram as populações
MA Igarapé do Rosário, PA e MAA Rio Piramanha, PA, ambas situadas na região do baixo
Amazonas (Tabela 2).
A partir da análise conjunta dos alelos detectados nos nove locos cpSSR foram
definidos 262 haplótipos (Apêndice 1), cujas frequências variaram de 0,38 a 1,53%. Após a
contração dos haplótipos, por meio de rotina implementada pelo programa Network, foram
obtidos 234 haplótipos, e após a redução pela média dos haplótipos com frequência acima de
um foram determinados 36 haplótipos os quais foram utilizados para estimar a diversidade e
relações entre os haplótipos (Apêndice 2). A diversidade haplotípica (Nh) média foi de 4,9
variando de 2 a 9 haplótipos observados por população, considerando apenas os haplótipos
com frequência de ocorrência superior a 1.
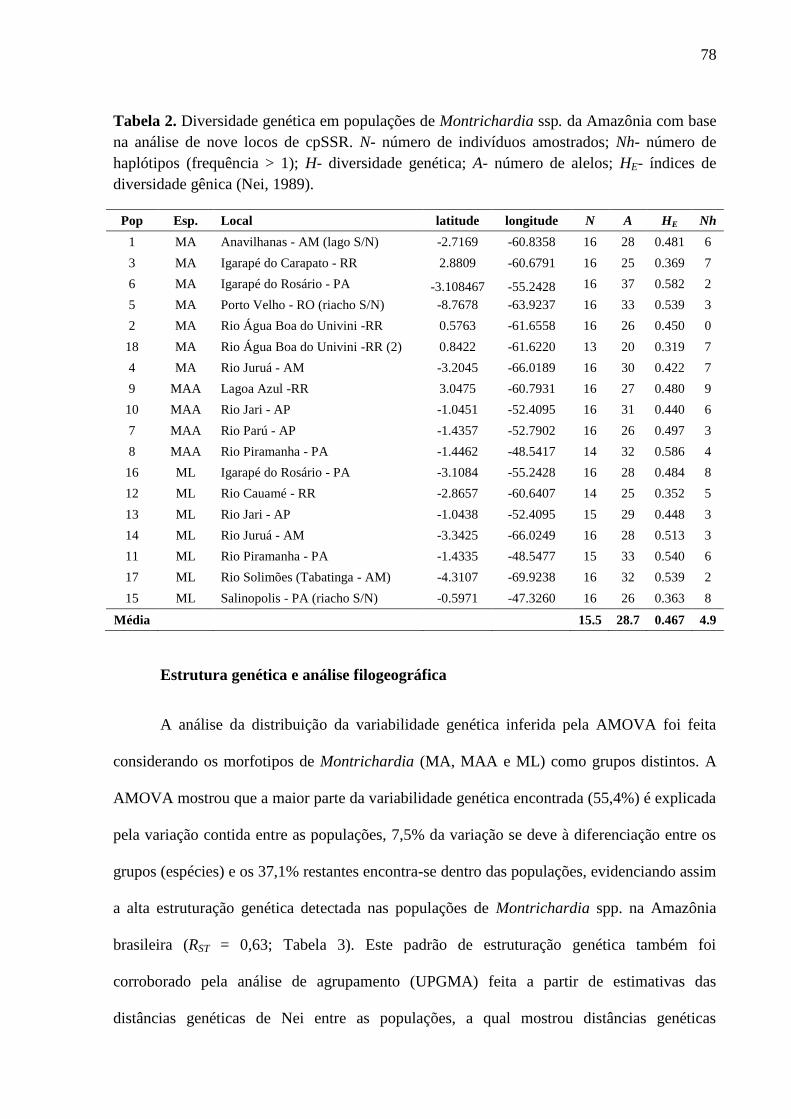
78
Tabela 2. Diversidade genética em populações de Montrichardia ssp. da Amazônia com base
na análise de nove locos de cpSSR. N- número de indivíduos amostrados; Nh- número de
haplótipos (frequência > 1); H- diversidade genética; A- número de alelos; HE- índices de
diversidade gênica (Nei, 1989).
Pop Esp. Local latitude longitude N A HE Nh
1 MA Anavilhanas - AM (lago S/N) -2.7169 -60.8358 16 28 0.481 6
3 MA Igarapé do Carapato - RR 2.8809 -60.6791 16 25 0.369 7
6 MA Igarapé do Rosário - PA -3.108467 -55.2428 16 37 0.582 2
5 MA Porto Velho - RO (riacho S/N) -8.7678 -63.9237 16 33 0.539 3
2 MA Rio Água Boa do Univini -RR 0.5763 -61.6558 16 26 0.450 0
18 MA Rio Água Boa do Univini -RR (2) 0.8422 -61.6220 13 20 0.319 7
4 MA Rio Juruá - AM -3.2045 -66.0189 16 30 0.422 7
9 MAA Lagoa Azul -RR 3.0475 -60.7931 16 27 0.480 9
10 MAA Rio Jari - AP -1.0451 -52.4095 16 31 0.440 6
7 MAA Rio Parú - AP -1.4357 -52.7902 16 26 0.497 3
8 MAA Rio Piramanha - PA -1.4462 -48.5417 14 32 0.586 4
16 ML Igarapé do Rosário - PA -3.1084 -55.2428 16 28 0.484 8
12 ML Rio Cauamé - RR -2.8657 -60.6407 14 25 0.352 5
13 ML Rio Jari - AP -1.0438 -52.4095 15 29 0.448 3
14 ML Rio Juruá - AM -3.3425 -66.0249 16 28 0.513 3
11 ML Rio Piramanha - PA -1.4335 -48.5477 15 33 0.540 6
17 ML Rio Solimões (Tabatinga - AM) -4.3107 -69.9238 16 32 0.539 2
15 ML Salinopolis - PA (riacho S/N) -0.5971 -47.3260 16 26 0.363 8
Média 15.5 28.7 0.467 4.9
Estrutura genética e análise filogeográfica
A análise da distribuição da variabilidade genética inferida pela AMOVA foi feita
considerando os morfotipos de Montrichardia (MA, MAA e ML) como grupos distintos. A
AMOVA mostrou que a maior parte da variabilidade genética encontrada (55,4%) é explicada
pela variação contida entre as populações, 7,5% da variação se deve à diferenciação entre os
grupos (espécies) e os 37,1% restantes encontra-se dentro das populações, evidenciando assim
a alta estruturação genética detectada nas populações de Montrichardia spp. na Amazônia
brasileira (RST = 0,63; Tabela 3). Este padrão de estruturação genética também foi
corroborado pela análise de agrupamento (UPGMA) feita a partir de estimativas das
distâncias genéticas de Nei entre as populações, a qual mostrou distâncias genéticas
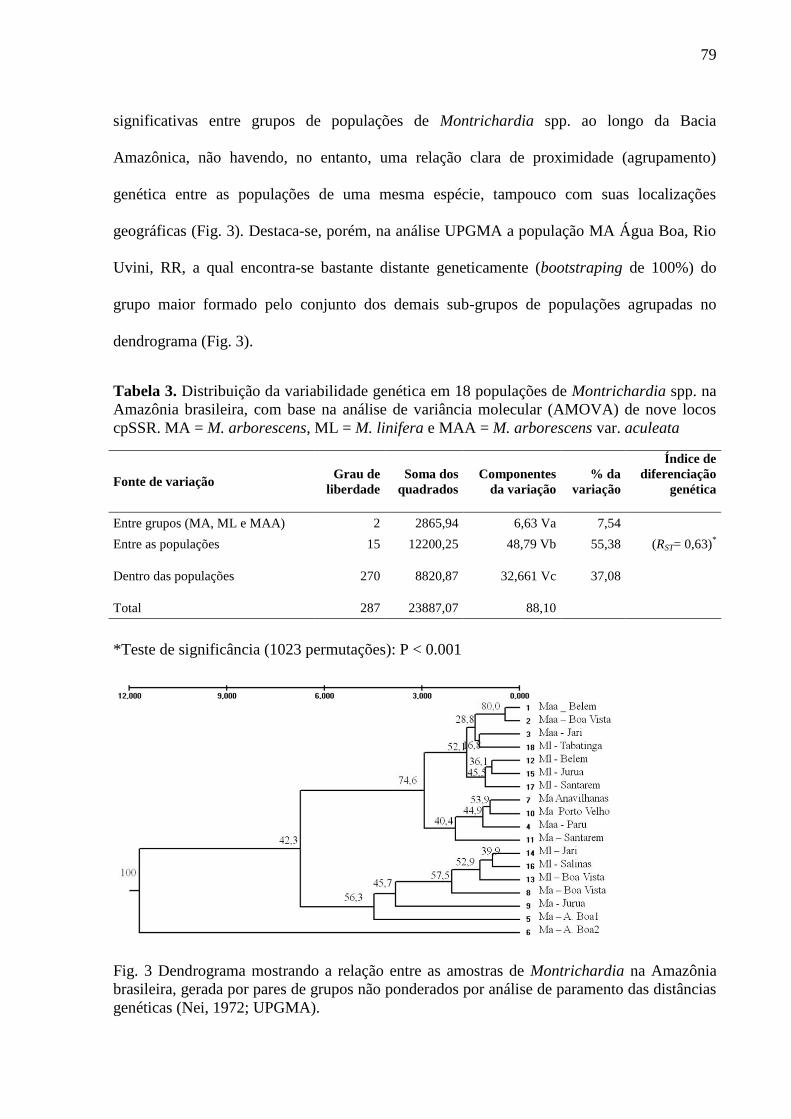
79
significativas entre grupos de populações de Montrichardia spp. ao longo da Bacia
Amazônica, não havendo, no entanto, uma relação clara de proximidade (agrupamento)
genética entre as populações de uma mesma espécie, tampouco com suas localizações
geográficas (Fig. 3). Destaca-se, porém, na análise UPGMA a população MA Água Boa, Rio
Uvini, RR, a qual encontra-se bastante distante geneticamente (bootstraping de 100%) do
grupo maior formado pelo conjunto dos demais sub-grupos de populações agrupadas no
dendrograma (Fig. 3).
Tabela 3. Distribuição da variabilidade genética em 18 populações de Montrichardia spp. na
Amazônia brasileira, com base na análise de variância molecular (AMOVA) de nove locos
cpSSR. MA = M. arborescens, ML = M. linifera e MAA = M. arborescens var. aculeata
Fonte de variação Grau de
liberdade
Soma dos
quadrados
Componentes
da variação
% da
variação
Índice de
diferenciação
genética
Entre grupos (MA, ML e MAA) 2 2865,94 6,63 Va 7,54
Entre as populações 15 12200,25 48,79 Vb 55,38 (RST= 0,63)*
Dentro das populações 270 8820,87 32,661 Vc 37,08
Total 287 23887,07 88,10
*Teste de significância (1023 permutações): P < 0.001
Fig. 3 Dendrograma mostrando a relação entre as amostras de Montrichardia na Amazônia
brasileira, gerada por pares de grupos não ponderados por análise de paramento das distâncias
genéticas (Nei, 1972; UPGMA).
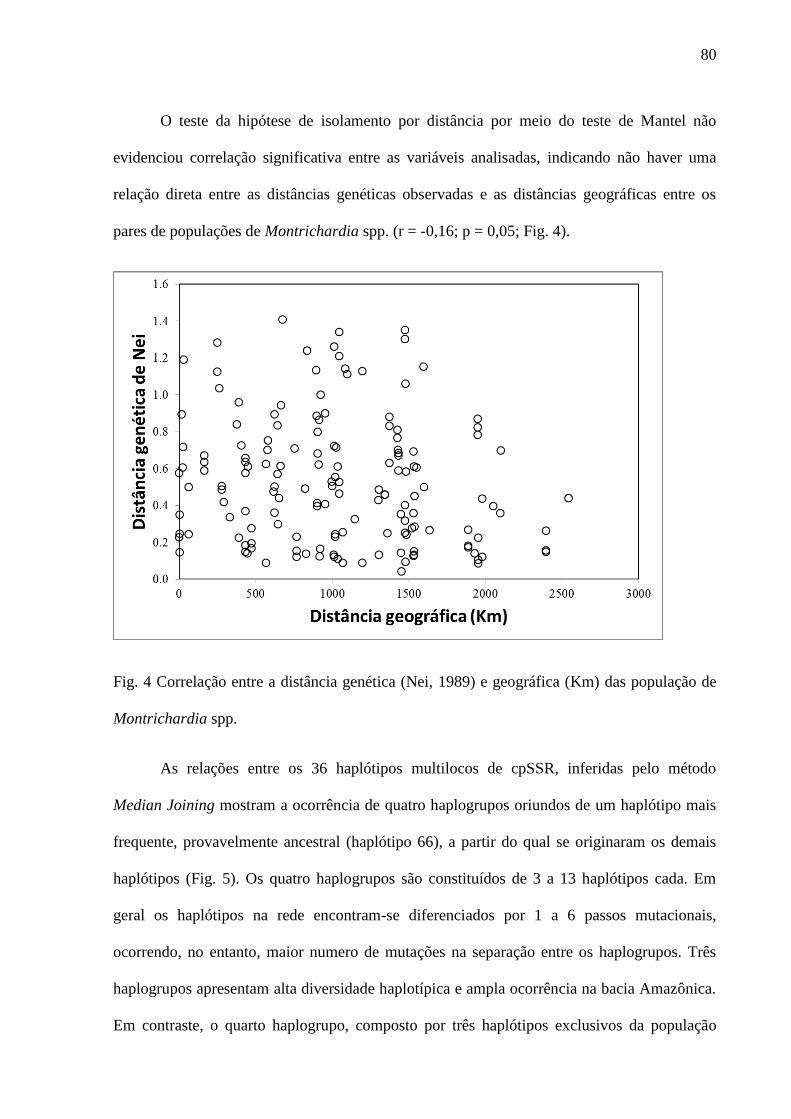
80
O teste da hipótese de isolamento por distância por meio do teste de Mantel não
evidenciou correlação significativa entre as variáveis analisadas, indicando não haver uma
relação direta entre as distâncias genéticas observadas e as distâncias geográficas entre os
pares de populações de Montrichardia spp. (r = -0,16; p = 0,05; Fig. 4).
Fig. 4 Correlação entre a distância genética (Nei, 1989) e geográfica (Km) das população de
Montrichardia spp.
As relações entre os 36 haplótipos multilocos de cpSSR, inferidas pelo método
Median Joining mostram a ocorrência de quatro haplogrupos oriundos de um haplótipo mais
frequente, provavelmente ancestral (haplótipo 66), a partir do qual se originaram os demais
haplótipos (Fig. 5). Os quatro haplogrupos são constituídos de 3 a 13 haplótipos cada. Em
geral os haplótipos na rede encontram-se diferenciados por 1 a 6 passos mutacionais,
ocorrendo, no entanto, maior numero de mutações na separação entre os haplogrupos. Três
haplogrupos apresentam alta diversidade haplotípica e ampla ocorrência na bacia Amazônica.
Em contraste, o quarto haplogrupo, composto por três haplótipos exclusivos da população
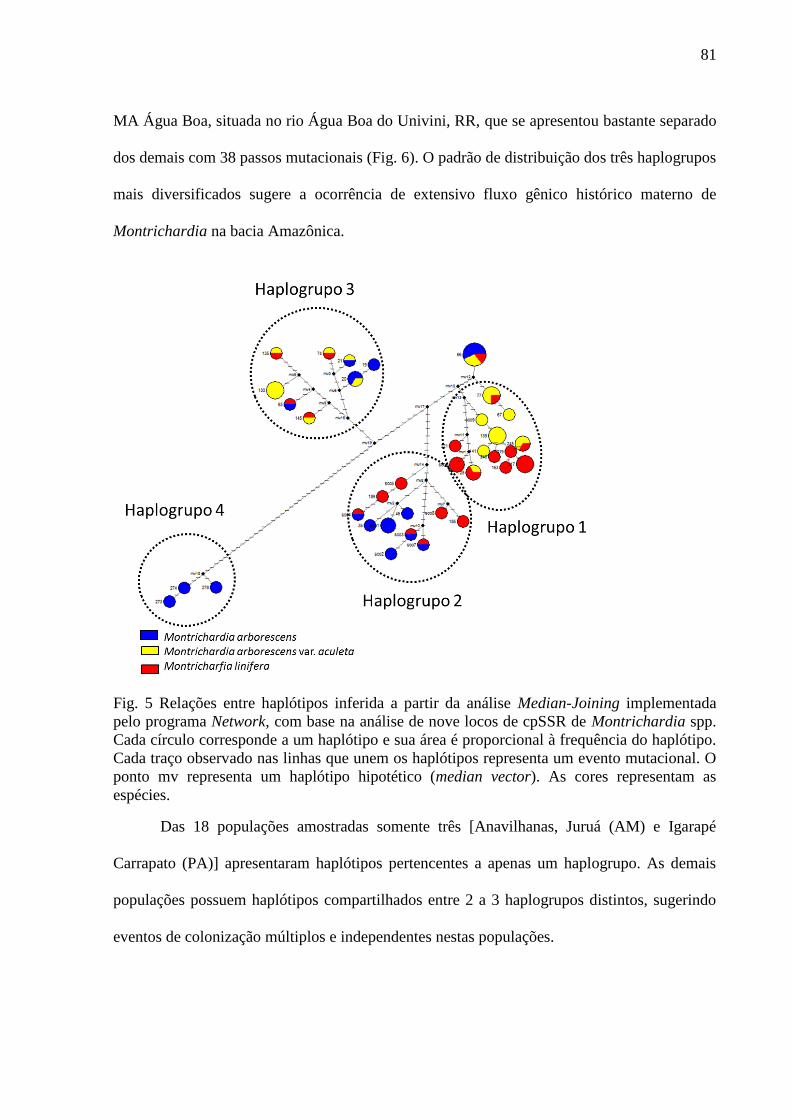
81
MA Água Boa, situada no rio Água Boa do Univini, RR, que se apresentou bastante separado
dos demais com 38 passos mutacionais (Fig. 6). O padrão de distribuição dos três haplogrupos
mais diversificados sugere a ocorrência de extensivo fluxo gênico histórico materno de
Montrichardia na bacia Amazônica.
Fig. 5 Relações entre haplótipos inferida a partir da análise Median-Joining implementada
pelo programa Network, com base na análise de nove locos de cpSSR de Montrichardia spp.
Cada círculo corresponde a um haplótipo e sua área é proporcional à frequência do haplótipo.
Cada traço observado nas linhas que unem os haplótipos representa um evento mutacional. O
ponto mv representa um haplótipo hipotético (median vector). As cores representam as
espécies.
Das 18 populações amostradas somente três [Anavilhanas, Juruá (AM) e Igarapé
Carrapato (PA)] apresentaram haplótipos pertencentes a apenas um haplogrupo. As demais
populações possuem haplótipos compartilhados entre 2 a 3 haplogrupos distintos, sugerindo
eventos de colonização múltiplos e independentes nestas populações.
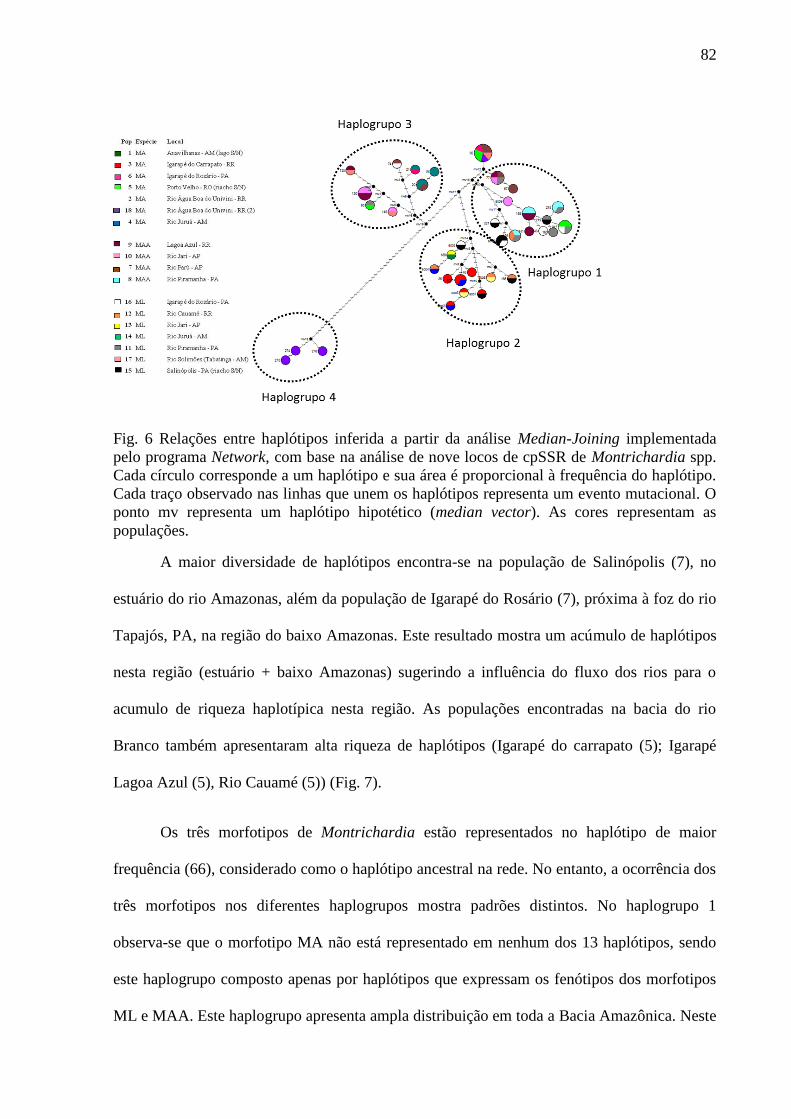
82
Fig. 6 Relações entre haplótipos inferida a partir da análise Median-Joining implementada
pelo programa Network, com base na análise de nove locos de cpSSR de Montrichardia spp.
Cada círculo corresponde a um haplótipo e sua área é proporcional à frequência do haplótipo.
Cada traço observado nas linhas que unem os haplótipos representa um evento mutacional. O
ponto mv representa um haplótipo hipotético (median vector). As cores representam as
populações.
A maior diversidade de haplótipos encontra-se na população de Salinópolis (7), no
estuário do rio Amazonas, além da população de Igarapé do Rosário (7), próxima à foz do rio
Tapajós, PA, na região do baixo Amazonas. Este resultado mostra um acúmulo de haplótipos
nesta região (estuário + baixo Amazonas) sugerindo a influência do fluxo dos rios para o
acumulo de riqueza haplotípica nesta região. As populações encontradas na bacia do rio
Branco também apresentaram alta riqueza de haplótipos (Igarapé do carrapato (5); Igarapé
Lagoa Azul (5), Rio Cauamé (5)) (Fig. 7).
Os três morfotipos de Montrichardia estão representados no haplótipo de maior
frequência (66), considerado como o haplótipo ancestral na rede. No entanto, a ocorrência dos
três morfotipos nos diferentes haplogrupos mostra padrões distintos. No haplogrupo 1
observa-se que o morfotipo MA não está representado em nenhum dos 13 haplótipos, sendo
este haplogrupo composto apenas por haplótipos que expressam os fenótipos dos morfotipos
ML e MAA. Este haplogrupo apresenta ampla distribuição em toda a Bacia Amazônica. Neste
83
haplogrupo encontra-se a maioria das populações amostradas na região próxima ao estuário e
no baixo Amazonas. Além disso, todos os indivíduos da população MAA do rio Piramanha,
PA, estão concentrados neste haplogrupo. O mesmo ocorre para os indivíduos de ML na
mesma população, com exceção de um indivíduo encontrado no haplogrupo 3. No haplogrupo
2 o fenótipo correspondente ao morfotipo MAA não foi registrado, observando-se apenas os
morfotipos MA e ML. Neste haplogrupo encontram-se representados todos os indivíduos da
população MA do igarapé do Carrapato, PA, bem como todos os indivíduos da população ML
do rio Jarí, PA. O haplogrupo 3 apresenta haplótipos compartilhados entre os três morfotipos
(MA, MAA e ML) e também é amplamente distribuído na Bacia, no entanto, com menor
número de populações representadas que os dois haplogrupos anteriores. Ressalta-se que
todos os indivíduos de Montrichardia amostrados em Anavilhanas, AM, fazem parte de dois
haplótipos exclusivos deste haplogrupo. Já o haplogrupo 4, isolado na rede, é formado por
três haplótipos exclusivos do morfotipo MA ocorrendo em uma única população no rio
Univini - RR.
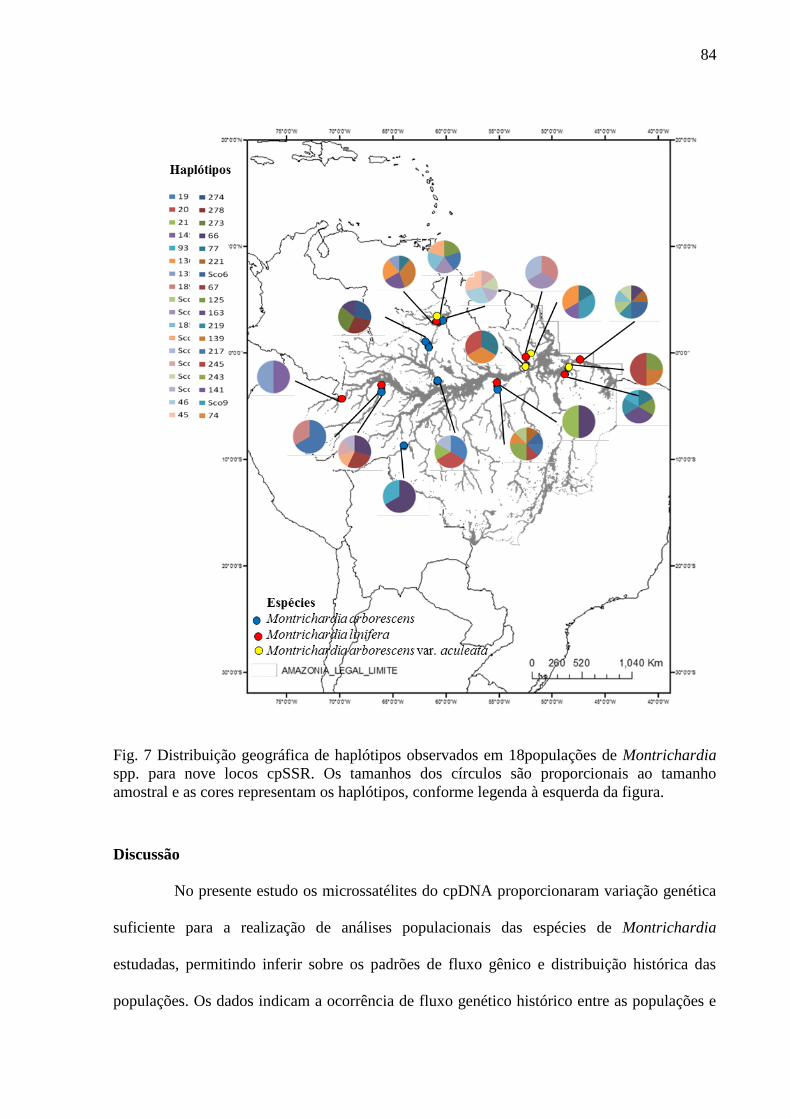
84
Fig. 7 Distribuição geográfica de haplótipos observados em 18populações de Montrichardia
spp. para nove locos cpSSR. Os tamanhos dos círculos são proporcionais ao tamanho
amostral e as cores representam os haplótipos, conforme legenda à esquerda da figura.
Discussão
No presente estudo os microssatélites do cpDNA proporcionaram variação genética
suficiente para a realização de análises populacionais das espécies de Montrichardia
estudadas, permitindo inferir sobre os padrões de fluxo gênico e distribuição histórica das
populações. Os dados indicam a ocorrência de fluxo genético histórico entre as populações e
85
entre as espécies, evidenciada pelo alto número de haplótipos de cpDNA compartilhados, o
que sugere pouco isolamento geográfico das populações no tempo evolutivo.
Como a herança uniparental de gametas faz com que a variação no cloroplasto seja
mais sensível à deriva genética, o fluxo gênico aqui medido reflete apenas a dispersão de
sementes ou de propágulos vegetativos de Montrichardia, excluindo o fluxo gênico
promovido pela polinização (Birky 1995). A presença de apenas duas espécies descritas no
gênero Montrichardia é, provavelmente, resultado da baixa velocidade de especiação do
gênero resultante da falta de barreiras entre as populações que possuem dispersão hidrocórica,
diminuindo assim as chances de isolamento reprodutivo (Herrera et al. 2008). Há relatos
ainda de que o gênero Montrichardia é consumido por peixes, tartarugas, búfalos e pelo
peixe-boi (Portal et al. 2002; Amarante et al. 2010), podendo portando apresentar, além da
hidrocoria, dispersão por ictiocoria e zoocoria (Lucas 2008; Parolin 2013). Esse tipo de
dispersão permite também o fluxo gênico contra as correntes dos rios (em direção às
nascentes), aumentando assim a possibilidade de fluxo gênico entre as populações.
O isolamento por distância não parece ser uma força motriz relevante para a
estruturação genética das populações de Montrichardia na Bacia Amazônica. Não foi
encontrado padrão filogeográfico claro na distribuição dos haplótipos, sugerindo fluxos
gênicos históricos de longa distância e eventos múltiplos de colonização por diferentes
linhagens maternas em ampla escala geográfica. Este padrão é consistente com as
reconstruções paleoambientais, com base em dados de paleomorfologias, paleontologia e
paleopalinologia, que indicam a existência na bacia amazônica, ao final do Mioceno, de
extensivas regiões recobertas por variedades de ambientes lacustres, ripários e aquáticos, com
pântanos, lagos rasos e deltas interiores (Latrubesse et al. 2010; Hoorn 1994a; 1994b).
A população de Água Boa do Univini (RR) parece, no entanto, ser uma exceção a este
padrão de grande mistura de linhagens. A ocorrência de muitos passos mutacionais entre os
86
haplótipos desta população e o restante da network haplotípica sugerem um evento único de
colonização e o isolamento em relação ao fluxo gênico na Bacia Amazônica. Esta população
pode ter ficado isolada durante os longos períodos de introgressão marinha com a formação
do lago amazônico no Pleistoceno (Klammer 1984). Além disso, o Rio Água Boa do Univini
provavelmente tem sua origem relacionada com eventos tectônicos que modificaram a
estrutura dessa região, que se assemelha mais com a formação vulcânica que aflora em
Apoteri (Guiana) e no Rio Branco (Boa Vista) (RadamBrasil 1975; Santos-Costa 2005).
As demais populações encontradas na bacia do rio Branco apresentaram alta riqueza
de haplótipos (Igarapé do carrapato (5); Igarapé Lagoa Azul (5), Rio Cauamé (5)). Essa Bacia
constitui um sistema hídrico com águas ricas em sedimentos em suspensão, que se interliga ao
sistema Rio Solimões/Amazonas pelo rio Negro, cujas águas são pobres em sedimentos em
suspensão (Irion et al. 1997). Acredita-se que bacia do rio Branco passou por processo eólicos
no período quaternário, provavelmente durante a ultima glaciação máxima, que resultaram na
formação de dunas nas proximidades dos rios Cauamé e Branco (Latrubesse & Nelson 2001).
Essas dunas cobertas por vegetação poderiam contribuir para o fluxo gênico entre as
populações. Além disso, a população de MA Boa Vista parece estar mais relacionada com
ML já que 4 de 6 haplótipos dessa população foram compartilhadas com populações de ML.
Boa Vista (RR) foi uma das poucas localidades onde foram encontrados os três morfotipos.
Embora esses morfotipos tenham sido coletados em corpos hídricos distintos, a proximidade
entre eles e a conectividade hídrica podem contribuir para o fluxo gênico interespecífico. A
polinização de M. arborescens é feita por besouros (Gibernau et al., 2003) que poderiam
transportar pólen entre populações de espécies diferentes, resultando na hibridização das
espécies, no entanto como no presente estudo analisamos apenas o genoma do cloroplasto não
podemos inferir sobre a contribuição de fluxo gênico via pólen, o qual sugerimos como objeto
de investigações futuras. Cabe ressaltar, no entanto, que a ocorrência de hibridização natural
87
é relatada para outros gêneros da família Araceae como Arisaema (Maki & Murata 2001;
Hayakawa et al. 2011), Dieffenbachia (Schatz 1990) e Symplocarpus, (Wen et al. 1996) e
artificial em Philodendron (McColley & Miller 1965), gênero filogeneticamente próximo de
Montrichardia (Henriquez et al. 2014).
O processo de especiação se dá pela divisão, dentro de populações, em unidades
evolutivas independentes, envolvendo a separação genética e diferenciação fenotípica (Coyne
& Orr 2004; Savolainen et al. 2006). O alto índice RST entre as populações, aliado às relações
entre os haplótipos permitem inferir que as espécies de Montrichardia, apesar de
apresentarem fenótipos diferentes, apresentam fluxo gênico entre si. A ocorrência de dois
morfotipos em 12 dos 36 haplótipos, além da presença dos três morfotipos no haplótipo
ancestral são fortes evidências da troca gênica entre morfotipos via introgressão. O processo
de especiação pode ser desencadeado por alterações geográficas, ecológicas, morfológicas ou
comportamentais, tendo os mecanismos de seleção natural e deriva gênica forte atuação (Petit
& Excoffier 2009; Stearns & Hoekstra 2000). A separação de MA de ML se mostra
compatível com a separação morfológica possível com base no número de nervuras apicais
secundárias. Entretanto a posição de MAA no dendrograma (UPGMA), assim como pela
distribuição dos haplótipos relacionados aos três morfotipos demonstra que esta variedade
esta mais relacionada com ML, contrariando a classificação feita com base no número de
nervuras. A presença de fluxo gênico interespecífico indica que as barreiras do isolamento
reprodutivo são incompletas para as espécies estudadas (Mayr 1942).
Conclusão
O estudo mostrou que os marcadores genéticos de herança materna utilizados são úteis
para reconstruir os padrões de fluxo gênico e colonização observados em populações de
Montrichardia spp. na bacia Amazônica. Os dados genéticos com base na análise do genoma
88
do cloroplasto mostraram que as populações dos três morfotipos analisados na realidade
constituem um sistema aberto no qual provavelmente estão ocorrendo trocas gênicas, e não
mostram correspondência direta com a delimitação taxonômica das espécies feitas com base
apenas em caracteres morfológicos. Não foi encontrado padrão filogeográfico claro na
distribuição dos haplótipos, sugerindo fluxos gênicos históricos de longa distância e eventos
múltiplos de colonização, indicadores de metapopulação, por diferentes linhagens maternas
em ampla escala geográfica. Este padrão é consistente com reconstruções paleoambientais as
quais indicam a ocorrência de extensos ambientes aquáticos durante o final do Mioceno na
bacia Amazônica (Hoorn 2006). Recomenda-se no futuro análises que incluam marcadores do
genoma nuclear para melhor compreender a influência da introgressão nos diferentes padrões
morfológicos de observados na natureza, bem como a viabilidade de polinização entre os três
táxons.
Agradecimentos
Este trabalho foi financiado pelo INCT ADAPTA – MCTI (CNPq/FAPEAM), e pelos
projetos Universal CNPq (14/2009; 14/2011); PELD MAUA (CNPq/FAPEAM); Pronex
“áreas alagáveis” (CNPq/FAPEAM) e SEEDSOURCE (União Européia/INPA). Gostaríamos
de agradecer à Doriane Picanço (UFAM), Paulo E. Kamisnk (INPA), Carla Sardelli (Unesp)
pela ajuda com os protocolos laboratoriais e na analise dos dados e à Pia Parolin (University
of Hamburg) pelos comentários no manuscrito. Agradecemos ainda ao Conselho Nacional de
Desenvolvimento Científico e Tecnológico (CNPq) pela bolsa de doutorado de Aline Lopes;
ao Grupo de Pesquisa MAUA e ao Laboratório de Genética de Plantas (LABGEN/INPA) pelo
apoio técnico e logístico.
89
Referências
Amarante, C. B.; Müller, R.C.S.; Dantas, K.G.F.; Alves, C.N.; Müller, A.H.; Palheta, D.C.
2010. Composição química e valor nutricional para grandes herbívoros das folhas e frutos de
aninga (Montrichardia linifera, Araceae). Acta Amazonica, 40: 729 – 736.
Avise, J. C. 1994. Molecular markers, natural history and evolution. New York, Chapman and
Hall.
Bandelt, H. J.; Forster, P., Roehl. A. 1999. Median-joining networks for inferring intraspecific
phylogenies. Molecular Biology and Evolution, 16:37–48.
Birky, C. W. 1995. Uniparental inheritance of mitochondrial and chloroplast genes:
mechanisms and evolution. Proceedings of the National Academy of Science 92:11331-11338.
Cavers, S.; Navarro, C.; Lowe, A.J. 2003. Chloroplast DNA phylogeography reveals
colonization history of a neotropical tree, Cedrela odorata L., Mesoamerica Molecular
Ecology, 12: 1451-1460.
Chambers, P. A.; Lacoul, P.; Murphy, K. J.; Thomaz S. M. 2008. Global diversity of aquatic
macrophytes in freshwater. Hydrobiologia, 595: 9-26.
Cook, C.D.K. 1985. Range extensions of aquatic vascular plant species. Journal of Aquatic
Plant Management, 23:1-6.
Coyne, J. A.; Orr. H.A. 2004. Speciation. Sinauer Associates, Sunderland, MA.
CRIA- Centro de Referencia em Informação Ambiental. Species links. Disponível em:
http://splink.cria.org.br/centralized_search?criaLANG=pt Acesso em: 14 jan. 2014.
Croat, T.B.; Fernández-Concha, G.C.; González, L.I. 2005. Montrichardia arborescens (L.)
Schott (Araceae) newly reported for Mexico. Aroideana, 28: 86–87.
90
Cuenca, A.; Escalante, A.E.; Piñero, D. 2003. Long-distance colonization, isolation by
distance, and historical demography in a relictual Mexican pinyon pine (Pinus nelsonii Shaw)
as revealed by paternally inherited genetic markers (cpSSRs). Molecular Ecology, 12: 2087-
2097.
de Carvalho, J. F.; Chelaifa, H.; Boutte, J.; Poulain, J.; Couloux, A.; Wincker, P., et al. 2013.
Exploring the genome of the salt-marsh Spartina maritima (Poaceae, Chloridoideae) through
BAC end sequence analysis. Plant Molecular Biology, 83(6):591-606.
Doyle, J.J; Doyle, J. L. 1987. Isolation of plant DNA from fresh tissue. Focus, 12: 13-15.
Doyle, J.J.; Morgante, M.; Tingey, S.V.; Powel, W. 1998. Size homoplazy in chloroplast
microsatellites of wild perennial relatives of soybean (Glycine subgenus Glycine). Molecular
Biology and Evolution, 15: 215-218.
Ennos, R.A.; Sinclair, W.T.; Hu, X.-S.; Langdon, A. 1999 Using organelle markers to
elucidate the history, ecology and evolution of plant populations. In: Hollingsworth, P.M.;
Bateman, R.M.; Gornall, R. J. (Eds). Molecular Systematics and Plant Evolution. The
Systematics Association Special Volume Series. p.1-19.
Excoffier, L.; Estoup, A.; Cornuet, J-M. 2005. Bayesian Analysis of an Admixture Model
With Mutations and Arbitrarily Linked Markers. Genetics, 169:1727-1738.
Ferreira, M. E.; Grattapaglia, D. 1998. Introdução ao uso de marcadores moleculares em
análise genética. 3ª edição. Brasília (EMBRAPA-CENARGEN). 222p.
Forster, P.; Bandelt, H. J.;Rohl, A. 2000. NETWORK 3.1.1.0. Software free available at:
www.fluxus-engineering.com. Fluxus Technology Ltd., Cambridge.
91
Gibernau M.;Barabe´ D.; Labat D.; Cerdan P.; Dejean A. 2003. Reproductive biology of
Montrichardia arborescens (Araceae) in French Guiana. Journal of Tropical Ecology, 19:
103–107.
Hale, M.L.; Borland, A.M.; Gustafsson, M.H.; Wolff, K. 2004. Causes of size homoplasy
among chloroplast microsatellites in closely related Clusia species. Journal of Molecular
Evolution, 58: 182-190.
Hamrick, J. L. 1982. Plant population genetics and evolution. American Journal of Botany,
1685-1693.
Hayakawa, H.; Hamachi, H.; Matsuyama, K.; Muramatsu, Y.; Minamiya, Y.; Ito, K.; et al.
2011. Introgressive Hybrids of Arisaema sikokianum and A. tosaense (Araceae) Confirmed
through Nuclear and Chloroplast DNA Comparisons. American Journal of Plant Sciences, 2:
303-307
Herrera, F. A.; Jaramillo, C. A.; Dilcher D. L.; Wing, S. L.; Gomez-N. C. 2008. Fossil
Araceae from a Paleocene neotropical rainforest in Colombia. American Journal of Botany,
95:1569–1583.
Hoorn, C. 1994a. An environmental reconstruction of the paleo-Amazon River system
(Middle-late Miocene, NW Amazonia), Palaeogeography Palaeoclimatology Palaeoecology,
112:187–238.
Hoorn, C. 2006. The birth of the mighty Amazon. Scientific American, 294(5), 52-59.
Hoorn, C., 1994b. Fluvial palaeoenvironments in the Amazonas Basin (Early Miocene-early
Middle Miocene, Colombia). Palaeogeography Palaeoclimatology Palaeoecology, 109: 1-54.
92
Huotari, T.; Korpelainen, H. 2012. Complete chloroplast genome sequence of Elodea
canadensis and comparative analyses with other monocot plastid genomes. Gene, 508(1): 96-
105.
Huotari, T.: Korpelainen, H. 2013. Comparative Analyses of Plastid Sequences between
Native and Introduced Populations of Aquatic Weeds Elodea canadensis and E. nuttallii. PloS
one, 8(4): e58073.
Irion, G.; Junk, W.J.; Mello, J.A.S.N. 1997. The large central Amazonian river floodplains
near Manaus: geological, climatological, hydro- logical and geomorphological aspects. In:
Junk WJ, ed. The Central Amazon floodplain: ecology of a pulsing system. Ecological Studies
126. Heidelberg: Springer, 23–46.
Junk, W. J.; Piedade, M. T. F. 1997. Plant life in the floodplain with special reference to
herbaceous plants. In: Junk, W. J., (ed.) The Central Amazon floodplain: Ecological Studies
Berlin: Springer, 126:147‐185.
Klammer, G. 1984. The relief of the extra-Andean Amazon basin. In: Sioli, H. (Ed). The
Amazon: Limnology and landscape ecology of a mighty tropical river and its basin. Dr. W.
Junk Publishers, Dordrecht.
Latrubesse, E. M.; Cozzuol, M.; da Silva-Caminha, S. A.; Rigsby, C. A.; Absy, M. L.;
Jaramillo, C. 2010. The Late Miocene paleogeography of the Amazon Basin and the evolution
of the Amazon River system. Earth-Science Reviews, 99(3), 99-124.
Latrubesse, E.M. Nelson, B.W. 2001. Evidence for Late Quaternary aeolian activity in the
Roraima–Guyana region. Catena 43, 63–80.
93
Lins, A.L.F.A. 1994. Aspectos morfológicos e anatômicos de raízes do gênero Montrichardia
Crueg. (Araceae). Dissertação de mestrado, Universidade Federal do Rio Grande do Sul,
Porto Alegre.
Lucas, C. 2008. Within flood season variation in fruit consumption and seed dispersal by two
characin fishes of the Amazon. Biotropica, 40: 581–589.
Maki, M.;Murata, J. 2001. Allozyme analysis of the hybrid origin of Arisaema ehimense
(Araceae). Heredity, 86: 87-93.
Mantel, N. 1967. The detection of disease clustering and a generalized regression approach.
Cancer Researcher, 27:209-220.
Martins, D.; Cardoso, L.R.; Mori, E.S.; Tanaka, R.H.. 2003. Caracterização genética de
acessos de egéria (Egeria spp.) coletados no Estado de São Paulo. Planta Daninha, 21: 1-6.
Martins, P.S. 1987. Estrutura populacional, fluxo gênico e conservação in situ. IPEF, 35:71-
78.
Mayo, S. J.; Bogner, J.; Boyce. P.C. 1997 . The genera of Araceae. Royal Botanic Gardens,
Kew, UK.
Mayr, E. 1942. Systematics and the origin of species. Columbia Univ. Press, New York,
USA.
McCauley, D.E. 1994. Contrasting the distribution of chloroplast DNA and allozyme
polymorphism among local populations of Silene alba: implications for studies of gene flow
in plants. Proceedings of the National Academy of Sciences of the United States of America,
91: 8127-8131.
94
Meekins, J. F.; Ballard Jr, H. E.;McCarthy, B. C. 2001. Genetic variation and molecular
biogeography of a North American invasive plant species (Alliaria petiolata, Brassicaceae).
International Journal of Plant Sciences, 162(1), 161-169.
Miller, M. P. 1997. Tools for population genetic analyses (TFPGA) 1.3: A Windows program
for the analysis of allozyme and molecular population genetic data. Computer software
distributed by author, 4, 157.
Mirouze, E.; Staquet A.; Vezy R. 2012. Morphometric and morphological analyses of leaves
in two species of Araceae: Montrichardia linifera and Montrichardia arborescens among
different French Guiana populations. Journal of Ecofog, 3: 1-15.
Navascués, M.; Emerson, B.C. 2005. Chloroplast microsatellites: measures of genetic
diversity and the effect of homoplasy. Molecular Ecology, 14: 1333-1341.
Nei, M. 1972. Genetic distance between populations. American Naturalist, 106: 283-292.
Nei, M., 1987 Molecular Evolutionary Genetics. Columbia University Press, New York, NY,
USA.
Parolin, P. 2013. Take me to the river–seed dispersal in Amazonian floodplain. New Frontiers
in Tropical Biology: The Next 50 Years (A Joint Meeting of ATBC and OTS). Atbc.
Petit, R. J.; Excoffier, L. 2009. Gene flow and species delimitation. Trends in Ecology and
Evolution, 24 (7): 386-393.
Petit, R.J.; Duminil, J.; Fineschi, S.; Hampe, A.; Salvini, D.; Vendramin, G.G. 2005.
Comparative organization of chloroplast, mitochondrial and nuclear diversity in plant
populations. Molecular Ecology, 14: 689-701.
95
Portal, R. R.; Lima, M.A.S.. Luz, V.L.F.; Bataus, Y.S.L.; Reis, J dos. 2002. Espécies vegetais
utilizadas na alimentação de Podocnemis unifilis, Troschel 1948 (Reptila, Testudinae,
Pelomedusidae) na região do Pracauba - Amapá – Brasil. Ciência Animal Brasileira, 3(1); 11-
19.
RadamBrasil, Departamento Nacional da Produção Mineral. Projeto RADAMBRASIL. 1975.
Folha NA.21 Tumucumaque e parte da folha NB.21: geologia, geomorfologia, solos,
vegetação e uso potencial da terra. Ministério de Minas e Energia. DNPM/Projeto
RADAMBRASIL. Rio de Janeiro. Vol. 9. 370p. 6 mapas
Santamaría, L., 2002. Why are most aquatic plants widely distributed? Dispersal, clonal
growth and small-scale heterogeneity in a stressful environment. Acta Oecologica, 23: 137–
154.
Santos-Costa, S. (2005). Delimitação do arcabouço tectonico do Cinturão Guiana Central,
Estado de Roraima, com base na analise integrada dos dados geofisicos, geologicos,
isotopicos e imagens de satelite. Tese (doutorado) Universidade Estadual de Campinas,
Instituto de Geociências.
Savolainen, V.; Anstett, M. C.; Lexer, C.; Hutton, I.; Clarkson, J.; Norup, M.; Powell, M.P.;
Spriggate, D.; Salamin, N.; Baker, W.J. 2006. Sympatric speciation in palms on an oceanic
island. Nature, 441: 210-213.
Schatz, G. E. 1990. Some aspects of pollination biology in Central American forests.
Reproductive Ecology of Tropical Forest Plants, 7:69-84.
Sculthorpe, C. D. 1967. The biology of aquatic vascular plants. London: Belhaven Press.
Silva M.F.S.; De Andrade I.M.; Mayo S.J. 2012. Geometric morphometrics of leaf blade
shape in Montrichardia linifera (Araceae) populations from the Rio Parnaíba Delta, north-east
96
Brazil. Botanical Journal of the Linnean Society, 170: 554 – 572.
Silvertown J. W. J.; Doust, L. 1993 Introduction to plant population biology. Blackwell
Scientific, Oxford, UK
Slatkin, M. 1995 A measure of population subdivision based on microsatellite allele
frequencies. Genetics 139: 457-462.
Steane, D.A.; Jones, R.C.; Vaillancourt, R.E. 2005. A set of chloroplast microsatellite primers
for Eucalyptus (Myrtaceae). Molecular Ecology Notes, 5: 538-541.
Stearns, S. C.: Hoekstra, R. F. 2000. Evolution: an introduction. Oxford University Press
Inc.., New Work, 381p.
Swofford, D. L.; Olsen, G. J.; Waddell, P. J.: Hillis, D. M. 1990. Phylogeny
reconstruction. Molecular systematics, 3: 407-514.
Tang, S. Q.; Wei, F.; Zeng, L. Y.; Li, X. K.; Tang, S. C.; Zhong, Y.; GENG, Y. P. 2009.
Multiple introductions are responsible for the disjunction distributions of invasive Parthenium
hysterophorus in China: evidence from nuclear and chloroplast DNA. Weed research, 49(4):
373-380.
Weisinger, K.; Gardner, R. C. 1999. A set of conserved PCR primers for the analysis of
simple sequence repeat polymorphisms in chloroplast genomes of dicotyledonous
angiosperms. Genome, 42: 9 – 19.
Wen, J.; Jansen, R. K.; Kilgore, K. 1996. Evolution of the Eastern Asian and Eastern North
American disjunction genus Symplocarpus (Araceae): insights from chloroplast DNA
restriction site data. Biochemical systematics and ecology, 24(7):735-747.
97
Woodward, F.I. 1988. Temperature and the distribution of plant species. In: Long, S.P.,
Woodward, F.I. (Eds.) Plants and Temperature. The Company of Biologists Ltd. University
of Cambridge, Cambridge, 59–75.
Woodward, F.I.; Williams, B.G. 1987. Climate and plant distribution at global and local
scales. Vegetatio, 69:189-197.
Wright, S. 1932. The roles of mutation, inbreeding, cross-breeding, and selection in evolution.
Proceedings of the 6th
International Congress of Genetics, 1:356-366.
Wright, S. 1969. Evolution and the genetics of populations. v.2. The theory of gene
frequencies. The University of Chicago Press, Chicago.
Xue, H., Xiao, Y., Jin, Y., Li, X., Fang, Y., Zhao, H., et al. 2012. Genetic diversity and
geographic differentiation analysis of duckweed using inter-simple sequence repeat markers.
Molecular Biology Reports, 39(1):547-554.
Zhang, J.; Nielsen, R.; Yang, Z. 2005. Evaluation of an improved branch-site likelihood
method for detecting positive selection at the molecular level. Molecular Biology and
Evolution, 22:2472–2479.
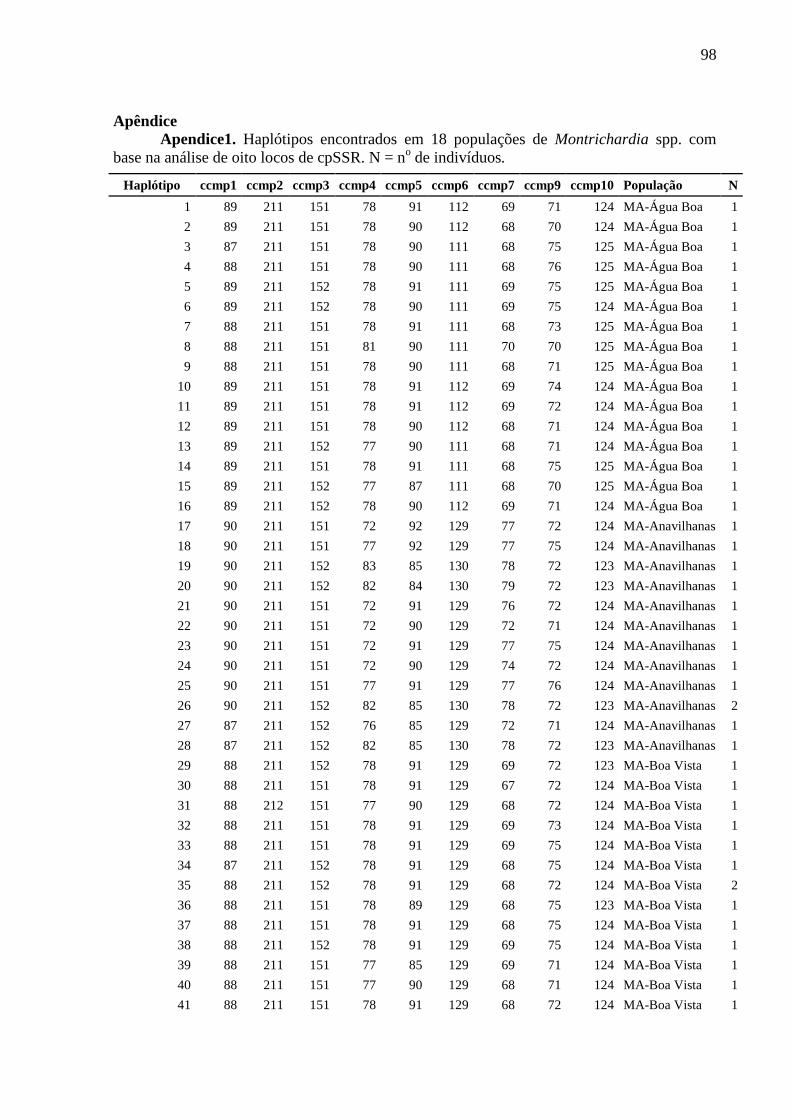
98
Apêndice
Apendice1. Haplótipos encontrados em 18 populações de Montrichardia spp. com
base na análise de oito locos de cpSSR. N = no de indivíduos.
Haplótipo ccmp1 ccmp2 ccmp3 ccmp4 ccmp5 ccmp6 ccmp7 ccmp9 ccmp10 População N
1 89 211 151 78 91 112 69 71 124 MA-Água Boa 1
2 89 211 151 78 90 112 68 70 124 MA-Água Boa 1
3 87 211 151 78 90 111 68 75 125 MA-Água Boa 1
4 88 211 151 78 90 111 68 76 125 MA-Água Boa 1
5 89 211 152 78 91 111 69 75 125 MA-Água Boa 1
6 89 211 152 78 90 111 69 75 124 MA-Água Boa 1
7 88 211 151 78 91 111 68 73 125 MA-Água Boa 1
8 88 211 151 81 90 111 70 70 125 MA-Água Boa 1
9 88 211 151 78 90 111 68 71 125 MA-Água Boa 1
10 89 211 151 78 91 112 69 74 124 MA-Água Boa 1
11 89 211 151 78 91 112 69 72 124 MA-Água Boa 1
12 89 211 151 78 90 112 68 71 124 MA-Água Boa 1
13 89 211 152 77 90 111 68 71 124 MA-Água Boa 1
14 89 211 151 78 91 111 68 75 125 MA-Água Boa 1
15 89 211 152 77 87 111 68 70 125 MA-Água Boa 1
16 89 211 152 78 90 112 69 71 124 MA-Água Boa 1
17 90 211 151 72 92 129 77 72 124 MA-Anavilhanas 1
18 90 211 151 77 92 129 77 75 124 MA-Anavilhanas 1
19 90 211 152 83 85 130 78 72 123 MA-Anavilhanas 1
20 90 211 152 82 84 130 79 72 123 MA-Anavilhanas 1
21 90 211 151 72 91 129 76 72 124 MA-Anavilhanas 1
22 90 211 151 72 90 129 72 71 124 MA-Anavilhanas 1
23 90 211 151 72 91 129 77 75 124 MA-Anavilhanas 1
24 90 211 151 72 90 129 74 72 124 MA-Anavilhanas 1
25 90 211 151 77 91 129 77 76 124 MA-Anavilhanas 1
26 90 211 152 82 85 130 78 72 123 MA-Anavilhanas 2
27 87 211 152 76 85 129 72 71 124 MA-Anavilhanas 1
28 87 211 152 82 85 130 78 72 123 MA-Anavilhanas 1
29 88 211 152 78 91 129 69 72 123 MA-Boa Vista 1
30 88 211 151 78 91 129 67 72 124 MA-Boa Vista 1
31 88 212 151 77 90 129 68 72 124 MA-Boa Vista 1
32 88 211 151 78 91 129 69 73 124 MA-Boa Vista 1
33 88 211 151 78 91 129 69 75 124 MA-Boa Vista 1
34 87 211 152 78 91 129 68 75 124 MA-Boa Vista 1
35 88 211 152 78 91 129 68 72 124 MA-Boa Vista 2
36 88 211 151 78 89 129 68 75 123 MA-Boa Vista 1
37 88 211 151 78 91 129 68 75 124 MA-Boa Vista 1
38 88 211 152 78 91 129 69 75 124 MA-Boa Vista 1
39 88 211 151 77 85 129 69 71 124 MA-Boa Vista 1
40 88 211 151 77 90 129 68 71 124 MA-Boa Vista 1
41 88 211 151 78 91 129 68 72 124 MA-Boa Vista 1
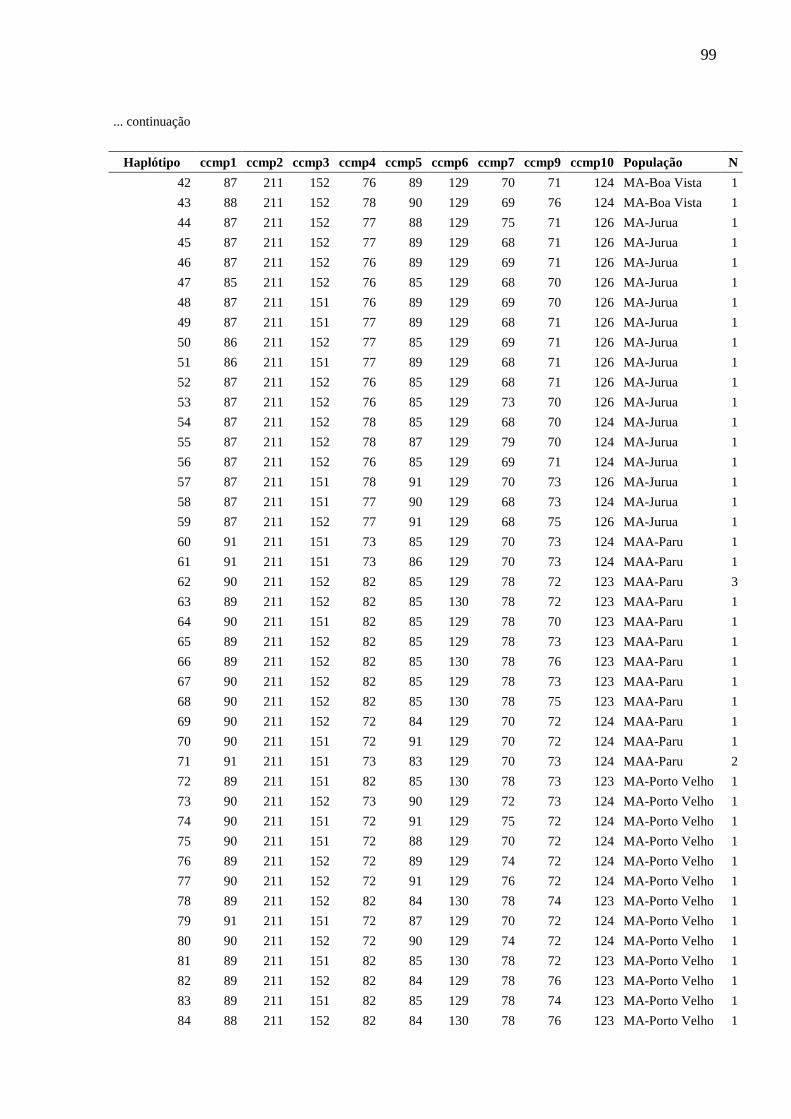
99
... continuação
Haplótipo ccmp1 ccmp2 ccmp3 ccmp4 ccmp5 ccmp6 ccmp7 ccmp9 ccmp10 População N
42 87 211 152 76 89 129 70 71 124 MA-Boa Vista 1
43 88 211 152 78 90 129 69 76 124 MA-Boa Vista 1
44 87 211 152 77 88 129 75 71 126 MA-Jurua 1
45 87 211 152 77 89 129 68 71 126 MA-Jurua 1
46 87 211 152 76 89 129 69 71 126 MA-Jurua 1
47 85 211 152 76 85 129 68 70 126 MA-Jurua 1
48 87 211 151 76 89 129 69 70 126 MA-Jurua 1
49 87 211 151 77 89 129 68 71 126 MA-Jurua 1
50 86 211 152 77 85 129 69 71 126 MA-Jurua 1
51 86 211 151 77 89 129 68 71 126 MA-Jurua 1
52 87 211 152 76 85 129 68 71 126 MA-Jurua 1
53 87 211 152 76 85 129 73 70 126 MA-Jurua 1
54 87 211 152 78 85 129 68 70 124 MA-Jurua 1
55 87 211 152 78 87 129 79 70 124 MA-Jurua 1
56 87 211 152 76 85 129 69 71 124 MA-Jurua 1
57 87 211 151 78 91 129 70 73 126 MA-Jurua 1
58 87 211 151 77 90 129 68 73 124 MA-Jurua 1
59 87 211 152 77 91 129 68 75 126 MA-Jurua 1
60 91 211 151 73 85 129 70 73 124 MAA-Paru 1
61 91 211 151 73 86 129 70 73 124 MAA-Paru 1
62 90 211 152 82 85 129 78 72 123 MAA-Paru 3
63 89 211 152 82 85 130 78 72 123 MAA-Paru 1
64 90 211 151 82 85 129 78 70 123 MAA-Paru 1
65 89 211 152 82 85 129 78 73 123 MAA-Paru 1
66 89 211 152 82 85 130 78 76 123 MAA-Paru 1
67 90 211 152 82 85 129 78 73 123 MAA-Paru 1
68 90 211 152 82 85 130 78 75 123 MAA-Paru 1
69 90 211 152 72 84 129 70 72 124 MAA-Paru 1
70 90 211 151 72 91 129 70 72 124 MAA-Paru 1
71 91 211 151 73 83 129 70 73 124 MAA-Paru 2
72 89 211 151 82 85 130 78 73 123 MA-Porto Velho 1
73 90 211 152 73 90 129 72 73 124 MA-Porto Velho 1
74 90 211 151 72 91 129 75 72 124 MA-Porto Velho 1
75 90 211 151 72 88 129 70 72 124 MA-Porto Velho 1
76 89 211 152 72 89 129 74 72 124 MA-Porto Velho 1
77 90 211 152 72 91 129 76 72 124 MA-Porto Velho 1
78 89 211 152 82 84 130 78 74 123 MA-Porto Velho 1
79 91 211 151 72 87 129 70 72 124 MA-Porto Velho 1
80 90 211 152 72 90 129 74 72 124 MA-Porto Velho 1
81 89 211 151 82 85 130 78 72 123 MA-Porto Velho 1
82 89 211 152 82 84 129 78 76 123 MA-Porto Velho 1
83 89 211 151 82 85 129 78 74 123 MA-Porto Velho 1
84 88 211 152 82 84 130 78 76 123 MA-Porto Velho 1
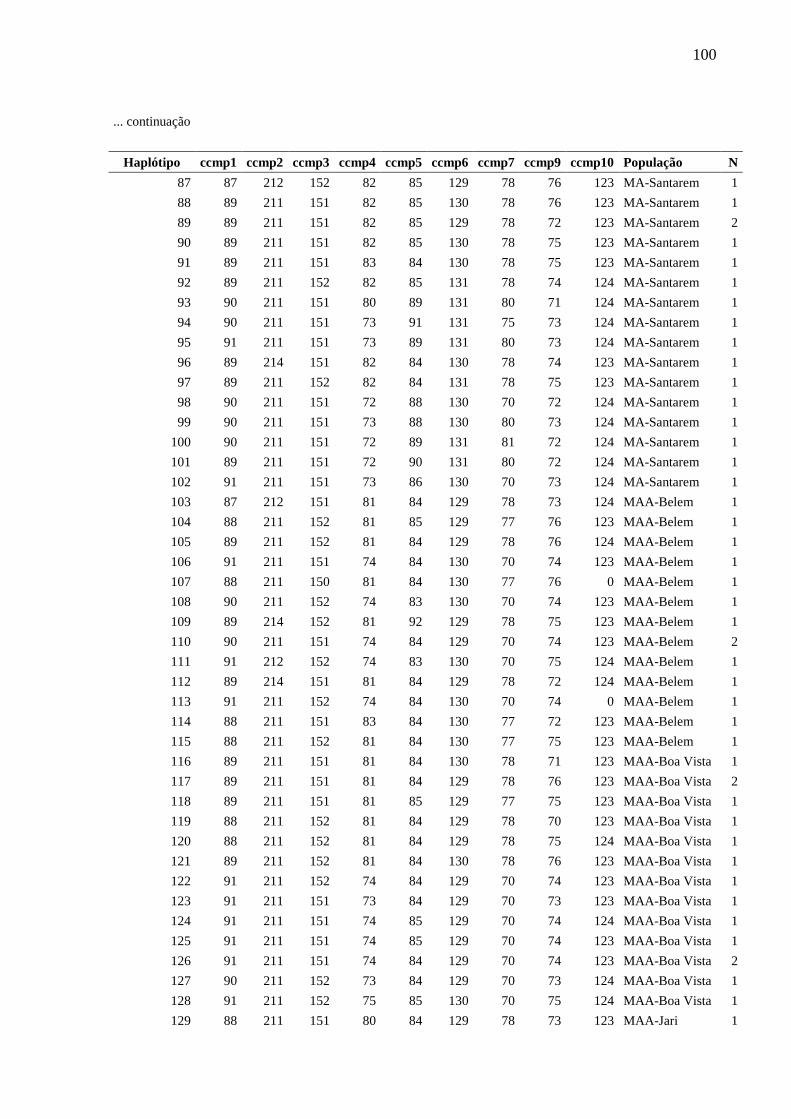
100
... continuação
Haplótipo ccmp1 ccmp2 ccmp3 ccmp4 ccmp5 ccmp6 ccmp7 ccmp9 ccmp10 População N
87 87 212 152 82 85 129 78 76 123 MA-Santarem 1
88 89 211 151 82 85 130 78 76 123 MA-Santarem 1
89 89 211 151 82 85 129 78 72 123 MA-Santarem 2
90 89 211 151 82 85 130 78 75 123 MA-Santarem 1
91 89 211 151 83 84 130 78 75 123 MA-Santarem 1
92 89 211 152 82 85 131 78 74 124 MA-Santarem 1
93 90 211 151 80 89 131 80 71 124 MA-Santarem 1
94 90 211 151 73 91 131 75 73 124 MA-Santarem 1
95 91 211 151 73 89 131 80 73 124 MA-Santarem 1
96 89 214 151 82 84 130 78 74 123 MA-Santarem 1
97 89 211 152 82 84 131 78 75 123 MA-Santarem 1
98 90 211 151 72 88 130 70 72 124 MA-Santarem 1
99 90 211 151 73 88 130 80 73 124 MA-Santarem 1
100 90 211 151 72 89 131 81 72 124 MA-Santarem 1
101 89 211 151 72 90 131 80 72 124 MA-Santarem 1
102 91 211 151 73 86 130 70 73 124 MA-Santarem 1
103 87 212 151 81 84 129 78 73 124 MAA-Belem 1
104 88 211 152 81 85 129 77 76 123 MAA-Belem 1
105 89 211 152 81 84 129 78 76 124 MAA-Belem 1
106 91 211 151 74 84 130 70 74 123 MAA-Belem 1
107 88 211 150 81 84 130 77 76 0 MAA-Belem 1
108 90 211 152 74 83 130 70 74 123 MAA-Belem 1
109 89 214 152 81 92 129 78 75 123 MAA-Belem 1
110 90 211 151 74 84 129 70 74 123 MAA-Belem 2
111 91 212 152 74 83 130 70 75 124 MAA-Belem 1
112 89 214 151 81 84 129 78 72 124 MAA-Belem 1
113 91 211 152 74 84 130 70 74 0 MAA-Belem 1
114 88 211 151 83 84 130 77 72 123 MAA-Belem 1
115 88 211 152 81 84 130 77 75 123 MAA-Belem 1
116 89 211 151 81 84 130 78 71 123 MAA-Boa Vista 1
117 89 211 151 81 84 129 78 76 123 MAA-Boa Vista 2
118 89 211 151 81 85 129 77 75 123 MAA-Boa Vista 1
119 88 211 152 81 84 129 78 70 123 MAA-Boa Vista 1
120 88 211 152 81 84 129 78 75 124 MAA-Boa Vista 1
121 89 211 152 81 84 130 78 76 123 MAA-Boa Vista 1
122 91 211 152 74 84 129 70 74 123 MAA-Boa Vista 1
123 91 211 151 73 84 129 70 73 123 MAA-Boa Vista 1
124 91 211 151 74 85 129 70 74 124 MAA-Boa Vista 1
125 91 211 151 74 85 129 70 74 123 MAA-Boa Vista 1
126 91 211 151 74 84 129 70 74 123 MAA-Boa Vista 2
127 90 211 152 73 84 129 70 73 124 MAA-Boa Vista 1
128 91 211 152 75 85 130 70 75 124 MAA-Boa Vista 1
129 88 211 151 80 84 129 78 73 123 MAA-Jari 1
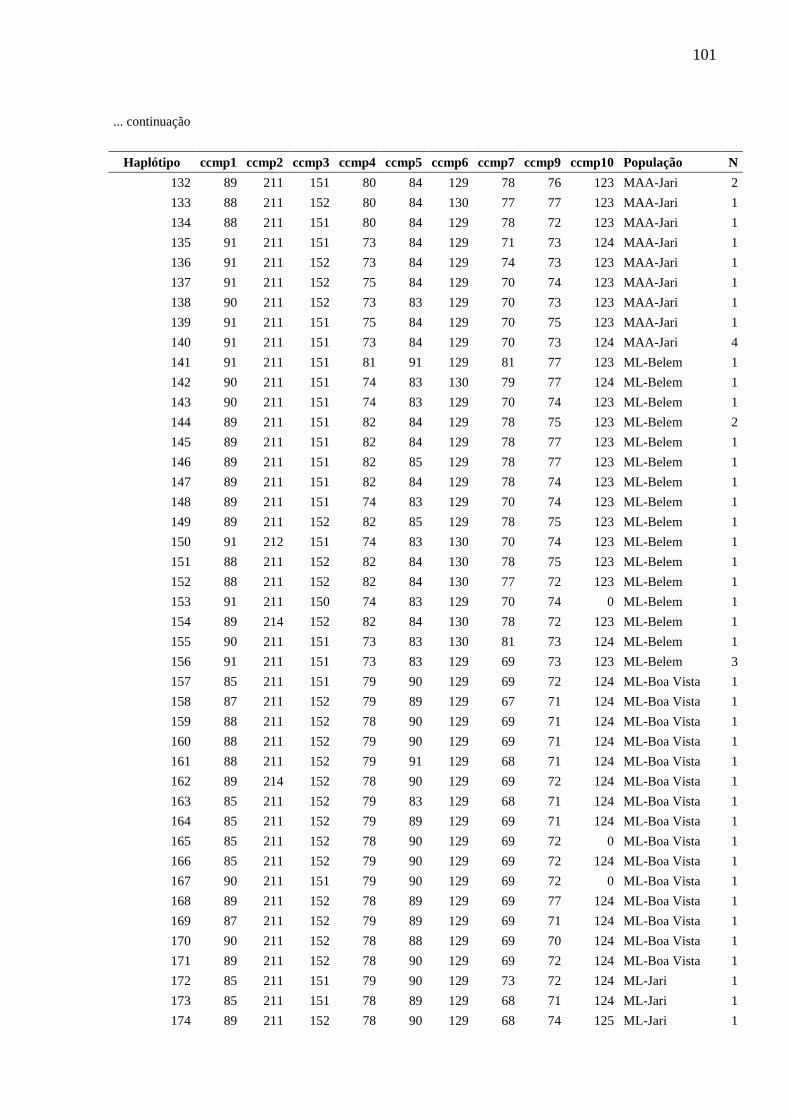
101
... continuação
Haplótipo ccmp1 ccmp2 ccmp3 ccmp4 ccmp5 ccmp6 ccmp7 ccmp9 ccmp10 População N
132 89 211 151 80 84 129 78 76 123 MAA-Jari 2
133 88 211 152 80 84 130 77 77 123 MAA-Jari 1
134 88 211 151 80 84 129 78 72 123 MAA-Jari 1
135 91 211 151 73 84 129 71 73 124 MAA-Jari 1
136 91 211 152 73 84 129 74 73 123 MAA-Jari 1
137 91 211 152 75 84 129 70 74 123 MAA-Jari 1
138 90 211 152 73 83 129 70 73 123 MAA-Jari 1
139 91 211 151 75 84 129 70 75 123 MAA-Jari 1
140 91 211 151 73 84 129 70 73 124 MAA-Jari 4
141 91 211 151 81 91 129 81 77 123 ML-Belem 1
142 90 211 151 74 83 130 79 77 124 ML-Belem 1
143 90 211 151 74 83 129 70 74 123 ML-Belem 1
144 89 211 151 82 84 129 78 75 123 ML-Belem 2
145 89 211 151 82 84 129 78 77 123 ML-Belem 1
146 89 211 151 82 85 129 78 77 123 ML-Belem 1
147 89 211 151 82 84 129 78 74 123 ML-Belem 1
148 89 211 151 74 83 129 70 74 123 ML-Belem 1
149 89 211 152 82 85 129 78 75 123 ML-Belem 1
150 91 212 151 74 83 130 70 74 123 ML-Belem 1
151 88 211 152 82 84 130 78 75 123 ML-Belem 1
152 88 211 152 82 84 130 77 72 123 ML-Belem 1
153 91 211 150 74 83 129 70 74 0 ML-Belem 1
154 89 214 152 82 84 130 78 72 123 ML-Belem 1
155 90 211 151 73 83 130 81 73 124 ML-Belem 1
156 91 211 151 73 83 129 69 73 123 ML-Belem 3
157 85 211 151 79 90 129 69 72 124 ML-Boa Vista 1
158 87 211 152 79 89 129 67 71 124 ML-Boa Vista 1
159 88 211 152 78 90 129 69 71 124 ML-Boa Vista 1
160 88 211 152 79 90 129 69 71 124 ML-Boa Vista 1
161 88 211 152 79 91 129 68 71 124 ML-Boa Vista 1
162 89 214 152 78 90 129 69 72 124 ML-Boa Vista 1
163 85 211 152 79 83 129 68 71 124 ML-Boa Vista 1
164 85 211 152 79 89 129 69 71 124 ML-Boa Vista 1
165 85 211 152 78 90 129 69 72 0 ML-Boa Vista 1
166 85 211 152 79 90 129 69 72 124 ML-Boa Vista 1
167 90 211 151 79 90 129 69 72 0 ML-Boa Vista 1
168 89 211 152 78 89 129 69 77 124 ML-Boa Vista 1
169 87 211 152 79 89 129 69 71 124 ML-Boa Vista 1
170 90 211 152 78 88 129 69 70 124 ML-Boa Vista 1
171 89 211 152 78 90 129 69 72 124 ML-Boa Vista 1
172 85 211 151 79 90 129 73 72 124 ML-Jari 1
173 85 211 151 78 89 129 68 71 124 ML-Jari 1
174 89 211 152 78 90 129 68 74 125 ML-Jari 1
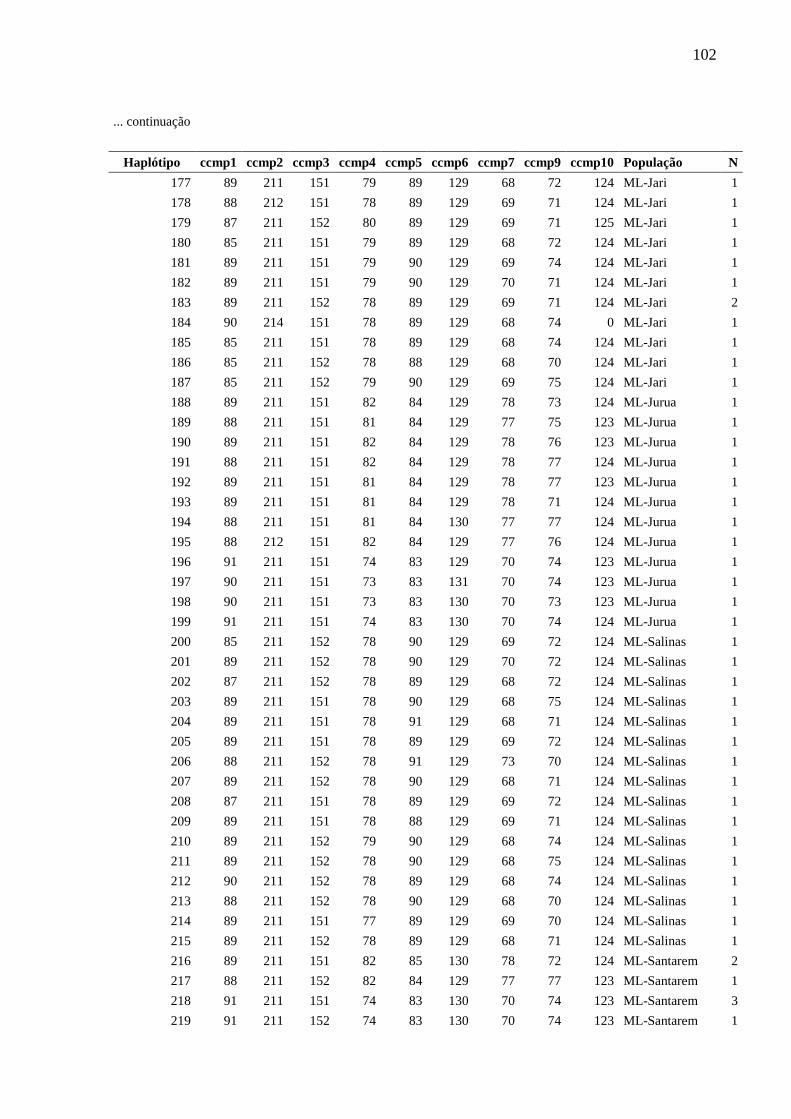
102
... continuação
Haplótipo ccmp1 ccmp2 ccmp3 ccmp4 ccmp5 ccmp6 ccmp7 ccmp9 ccmp10 População N
177 89 211 151 79 89 129 68 72 124 ML-Jari 1
178 88 212 151 78 89 129 69 71 124 ML-Jari 1
179 87 211 152 80 89 129 69 71 125 ML-Jari 1
180 85 211 151 79 89 129 68 72 124 ML-Jari 1
181 89 211 151 79 90 129 69 74 124 ML-Jari 1
182 89 211 151 79 90 129 70 71 124 ML-Jari 1
183 89 211 152 78 89 129 69 71 124 ML-Jari 2
184 90 214 151 78 89 129 68 74 0 ML-Jari 1
185 85 211 151 78 89 129 68 74 124 ML-Jari 1
186 85 211 152 78 88 129 68 70 124 ML-Jari 1
187 85 211 152 79 90 129 69 75 124 ML-Jari 1
188 89 211 151 82 84 129 78 73 124 ML-Jurua 1
189 88 211 151 81 84 129 77 75 123 ML-Jurua 1
190 89 211 151 82 84 129 78 76 123 ML-Jurua 1
191 88 211 151 82 84 129 78 77 124 ML-Jurua 1
192 89 211 151 81 84 129 78 77 123 ML-Jurua 1
193 89 211 151 81 84 129 78 71 124 ML-Jurua 1
194 88 211 151 81 84 130 77 77 124 ML-Jurua 1
195 88 212 151 82 84 129 77 76 124 ML-Jurua 1
196 91 211 151 74 83 129 70 74 123 ML-Jurua 1
197 90 211 151 73 83 131 70 74 123 ML-Jurua 1
198 90 211 151 73 83 130 70 73 123 ML-Jurua 1
199 91 211 151 74 83 130 70 74 124 ML-Jurua 1
200 85 211 152 78 90 129 69 72 124 ML-Salinas 1
201 89 211 152 78 90 129 70 72 124 ML-Salinas 1
202 87 211 152 78 89 129 68 72 124 ML-Salinas 1
203 89 211 151 78 90 129 68 75 124 ML-Salinas 1
204 89 211 151 78 91 129 68 71 124 ML-Salinas 1
205 89 211 151 78 89 129 69 72 124 ML-Salinas 1
206 88 211 152 78 91 129 73 70 124 ML-Salinas 1
207 89 211 152 78 90 129 68 71 124 ML-Salinas 1
208 87 211 151 78 89 129 69 72 124 ML-Salinas 1
209 89 211 151 78 88 129 69 71 124 ML-Salinas 1
210 89 211 152 79 90 129 68 74 124 ML-Salinas 1
211 89 211 152 78 90 129 68 75 124 ML-Salinas 1
212 90 211 152 78 89 129 68 74 124 ML-Salinas 1
213 88 211 152 78 90 129 68 70 124 ML-Salinas 1
214 89 211 151 77 89 129 69 70 124 ML-Salinas 1
215 89 211 152 78 89 129 68 71 124 ML-Salinas 1
216 89 211 151 82 85 130 78 72 124 ML-Santarem 2
217 88 211 152 82 84 129 77 77 123 ML-Santarem 1
218 91 211 151 74 83 130 70 74 123 ML-Santarem 3
219 91 211 152 74 83 130 70 74 123 ML-Santarem 1
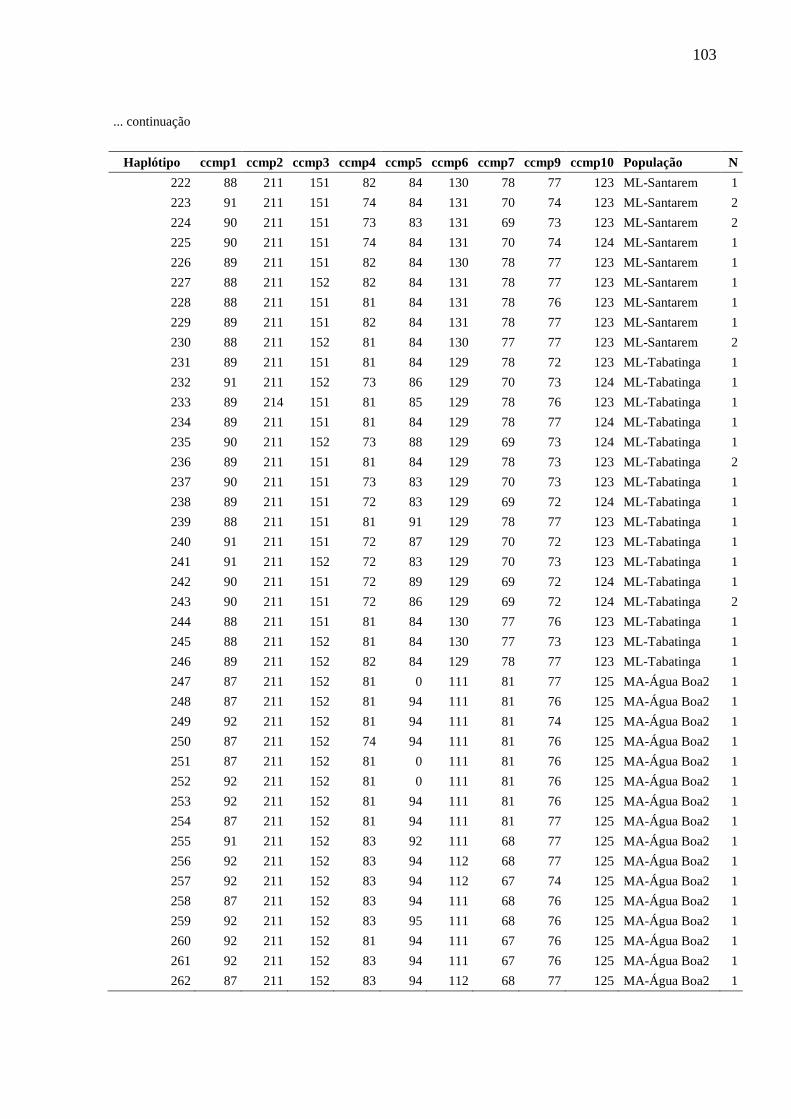
103
... continuação
Haplótipo ccmp1 ccmp2 ccmp3 ccmp4 ccmp5 ccmp6 ccmp7 ccmp9 ccmp10 População N
222 88 211 151 82 84 130 78 77 123 ML-Santarem 1
223 91 211 151 74 84 131 70 74 123 ML-Santarem 2
224 90 211 151 73 83 131 69 73 123 ML-Santarem 2
225 90 211 151 74 84 131 70 74 124 ML-Santarem 1
226 89 211 151 82 84 130 78 77 123 ML-Santarem 1
227 88 211 152 82 84 131 78 77 123 ML-Santarem 1
228 88 211 151 81 84 131 78 76 123 ML-Santarem 1
229 89 211 151 82 84 131 78 77 123 ML-Santarem 1
230 88 211 152 81 84 130 77 77 123 ML-Santarem 2
231 89 211 151 81 84 129 78 72 123 ML-Tabatinga 1
232 91 211 152 73 86 129 70 73 124 ML-Tabatinga 1
233 89 214 151 81 85 129 78 76 123 ML-Tabatinga 1
234 89 211 151 81 84 129 78 77 124 ML-Tabatinga 1
235 90 211 152 73 88 129 69 73 124 ML-Tabatinga 1
236 89 211 151 81 84 129 78 73 123 ML-Tabatinga 2
237 90 211 151 73 83 129 70 73 123 ML-Tabatinga 1
238 89 211 151 72 83 129 69 72 124 ML-Tabatinga 1
239 88 211 151 81 91 129 78 77 123 ML-Tabatinga 1
240 91 211 151 72 87 129 70 72 123 ML-Tabatinga 1
241 91 211 152 72 83 129 70 73 123 ML-Tabatinga 1
242 90 211 151 72 89 129 69 72 124 ML-Tabatinga 1
243 90 211 151 72 86 129 69 72 124 ML-Tabatinga 2
244 88 211 151 81 84 130 77 76 123 ML-Tabatinga 1
245 88 211 152 81 84 130 77 73 123 ML-Tabatinga 1
246 89 211 152 82 84 129 78 77 123 ML-Tabatinga 1
247 87 211 152 81 0 111 81 77 125 MA-Água Boa2 1
248 87 211 152 81 94 111 81 76 125 MA-Água Boa2 1
249 92 211 152 81 94 111 81 74 125 MA-Água Boa2 1
250 87 211 152 74 94 111 81 76 125 MA-Água Boa2 1
251 87 211 152 81 0 111 81 76 125 MA-Água Boa2 1
252 92 211 152 81 0 111 81 76 125 MA-Água Boa2 1
253 92 211 152 81 94 111 81 76 125 MA-Água Boa2 1
254 87 211 152 81 94 111 81 77 125 MA-Água Boa2 1
255 91 211 152 83 92 111 68 77 125 MA-Água Boa2 1
256 92 211 152 83 94 112 68 77 125 MA-Água Boa2 1
257 92 211 152 83 94 112 67 74 125 MA-Água Boa2 1
258 87 211 152 83 94 111 68 76 125 MA-Água Boa2 1
259 92 211 152 83 95 111 68 76 125 MA-Água Boa2 1
260 92 211 152 81 94 111 67 76 125 MA-Água Boa2 1
261 92 211 152 83 94 111 67 76 125 MA-Água Boa2 1
262 87 211 152 83 94 112 68 77 125 MA-Água Boa2 1
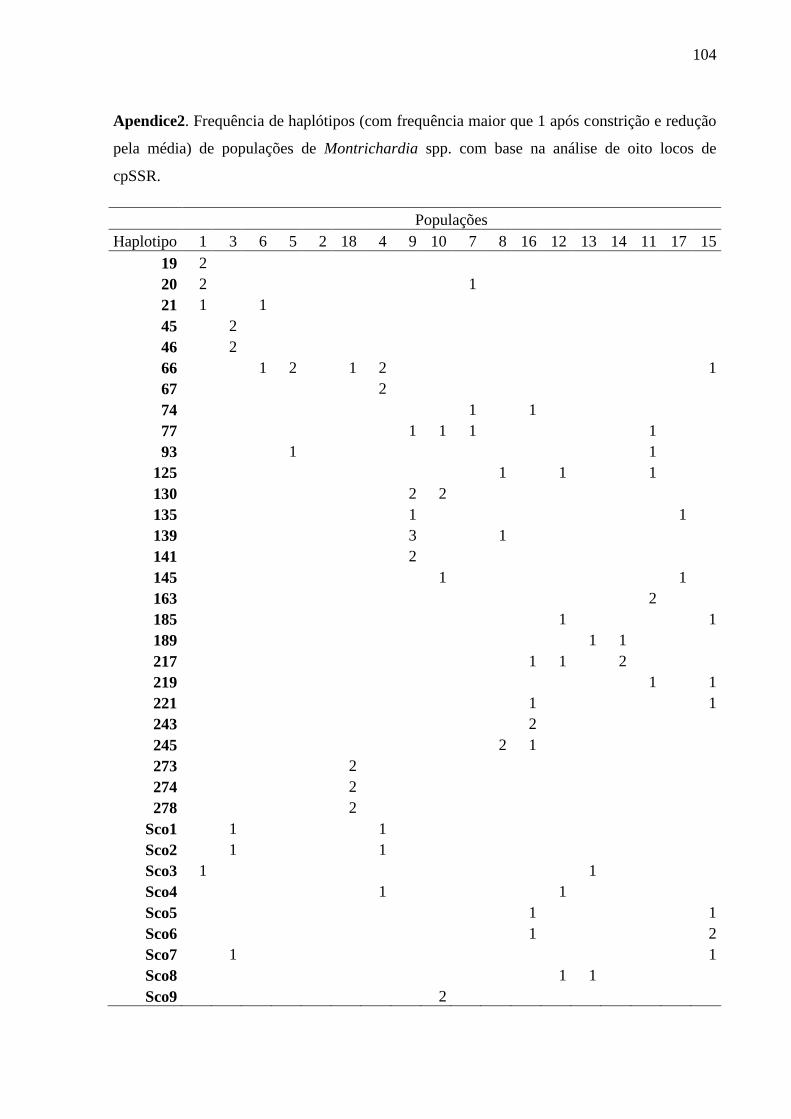
104
Apendice2. Frequência de haplótipos (com frequência maior que 1 após constrição e redução
pela média) de populações de Montrichardia spp. com base na análise de oito locos de
cpSSR.
Populações
Haplotipo 1 3 6 5 2 18 4 9 10 7 8 16 12 13 14 11 17 15
19 2
20 2 1
21 1 1
45 2
46 2
66 1 2 1 2 1
67 2
74 1 1
77 1 1 1 1
93 1 1
125 1 1 1
130 2 2
135 1 1
139 3 1
141 2
145 1 1
163 2
185 1 1
189 1 1
217 1 1 2
219 1 1
221 1 1
243 2
245 2 1
273 2
274 2
278 2
Sco1 1 1
Sco2 1 1
Sco3 1 1
Sco4 1 1
Sco5 1 1
Sco6 1 2
Sco7 1 1
Sco8 1 1
Sco9 2

Capítulo 4
______________________________________________________________________
Lopes et al., (submetido) Effect of elevated CO2
and temperature on germination and initial
growth of Montrichardia arborescens (L.) Schott
(Araceae): a microcosm experiment,
Environmental Science and Pollution Research.
106
Effect of elevated CO2 and temperature on germination and initial growth of
Montrichardia arborescens (L.) Schott (Araceae): a microcosm experiment
Aline Lopes1, Aurélia Bentes Ferreira
2, Pauline Pantoja de Oliveira
3, Pia
Parolin4, Maria Teresa Fernandez Piedade
2
1 Graduate Program in Ecology. Instituto Nacional de Pesquisas da Amazônia/ Grupo
MAUA “Ecologia, Monitoramento e Uso Sustentável de Áreas Úmidas Amazônicas”, Av.
André Araújo, 2.936 - Petrópolis Cx. Postal 2223 - CEP 69080-971 Manaus, Amazonas,
Brasil. Telephone /fax+55 92 36421503 [email protected]
2Instituto Nacional de Pesquisas da Amazônia, CDAM/ Grupo MAUA “Ecologia,
Monitoramento e Uso Sustentável de Áreas Úmidas Amazônicas” Av. André Araújo, 2.936 -
Petrópolis Cx. Postal 2223 - CEP 69080-971 Manaus, Amazonas, Brasil.
[email protected], [email protected]
3Biological & Environmental Science, University of Stirling, Stirling, UK, FK9 4LA ,
4 Dept of Plant Diversity, Univ. of Hamburg, Germany, [email protected]
Abstract
IPCC predictions for the Amazon Basin indicate an increase in temperatures by ca.
1.5-7°C coupled with a reduction in precipitation by ca. 10-20% in some regions over the
twenty-first century. Estimated increases in mean temperature are expected to disrupt present
patterns of the distribution of organisms, including wetland species. The aim of this work was
to determine the effects of changes in temperature and atmospheric [CO2] on the germination
and initial growth of the common Amazonian aquatic macrophyte Montrichardia arborescens
as a model organism in order to understand how climatic changes can affect Amazonian
wetland plants. Infructescences were collected from individuals of the Negro River and
germination was followed. The produced seedlings were then monitored over a period of 5
months. The treatments consisted of four microcosms: Control: current ambient temperature
and CO2; Mild: Control + 1.5 ° C and + 200 ppm of CO2; Intermediate: Control + 2.5 ° C and
+ 400 ppm of CO2; Extreme: Control + 4.5 ° C and + 850 ppm of CO2. The treatments did not
cause effects on germination parameters and leaf chlorophyll concentrations. Rapid light
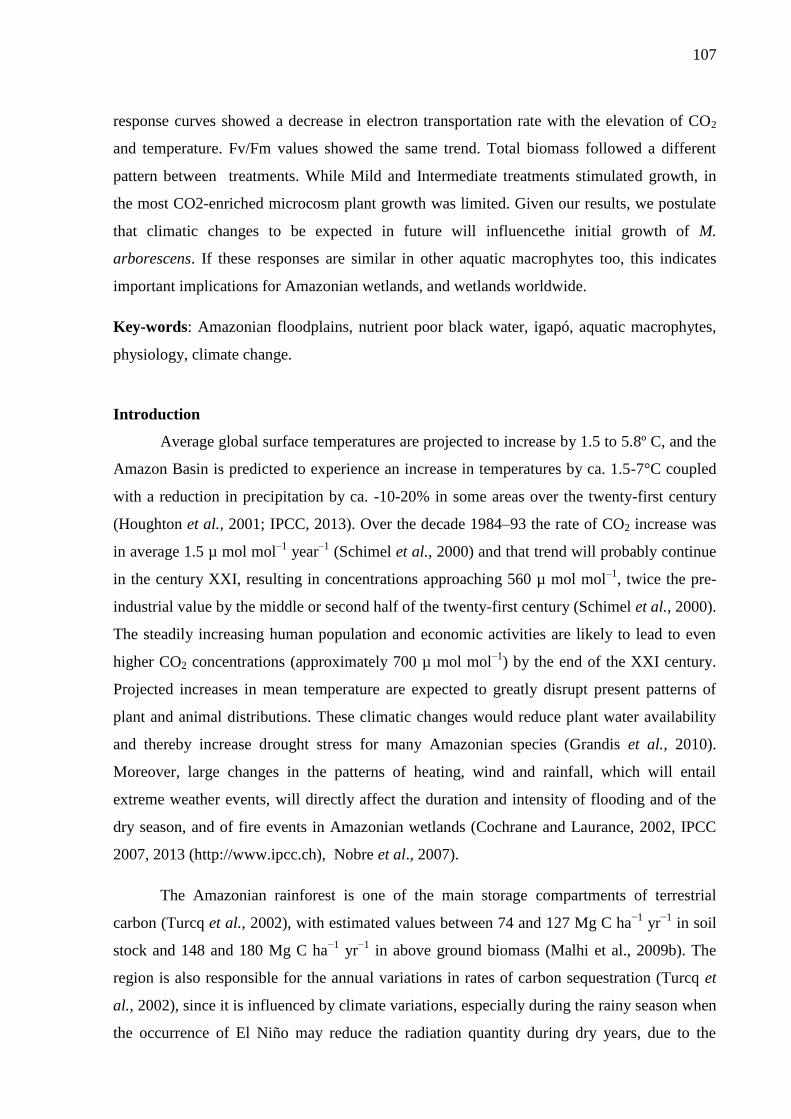
107
response curves showed a decrease in electron transportation rate with the elevation of CO2
and temperature. Fv/Fm values showed the same trend. Total biomass followed a different
pattern between treatments. While Mild and Intermediate treatments stimulated growth, in
the most CO2-enriched microcosm plant growth was limited. Given our results, we postulate
that climatic changes to be expected in future will influencethe initial growth of M.
arborescens. If these responses are similar in other aquatic macrophytes too, this indicates
important implications for Amazonian wetlands, and wetlands worldwide.
Key-words: Amazonian floodplains, nutrient poor black water, igapó, aquatic macrophytes,
physiology, climate change.
Introduction
Average global surface temperatures are projected to increase by 1.5 to 5.8º C, and the
Amazon Basin is predicted to experience an increase in temperatures by ca. 1.5-7°C coupled
with a reduction in precipitation by ca. -10-20% in some areas over the twenty-first century
(Houghton et al., 2001; IPCC, 2013). Over the decade 1984–93 the rate of CO2 increase was
in average 1.5 µ mol mol–1
year–1
(Schimel et al., 2000) and that trend will probably continue
in the century XXI, resulting in concentrations approaching 560 µ mol mol–1
, twice the pre-
industrial value by the middle or second half of the twenty-first century (Schimel et al., 2000).
The steadily increasing human population and economic activities are likely to lead to even
higher CO2 concentrations (approximately 700 µ mol mol–1
) by the end of the XXI century.
Projected increases in mean temperature are expected to greatly disrupt present patterns of
plant and animal distributions. These climatic changes would reduce plant water availability
and thereby increase drought stress for many Amazonian species (Grandis et al., 2010).
Moreover, large changes in the patterns of heating, wind and rainfall, which will entail
extreme weather events, will directly affect the duration and intensity of flooding and of the
dry season, and of fire events in Amazonian wetlands (Cochrane and Laurance, 2002, IPCC
2007, 2013 (http://www.ipcc.ch), Nobre et al., 2007).
The Amazonian rainforest is one of the main storage compartments of terrestrial
carbon (Turcq et al., 2002), with estimated values between 74 and 127 Mg C ha−1
yr−1
in soil
stock and 148 and 180 Mg C ha−1
yr−1
in above ground biomass (Malhi et al., 2009b). The
region is also responsible for the annual variations in rates of carbon sequestration (Turcq et
al., 2002), since it is influenced by climate variations, especially during the rainy season when
the occurrence of El Niño may reduce the radiation quantity during dry years, due to the
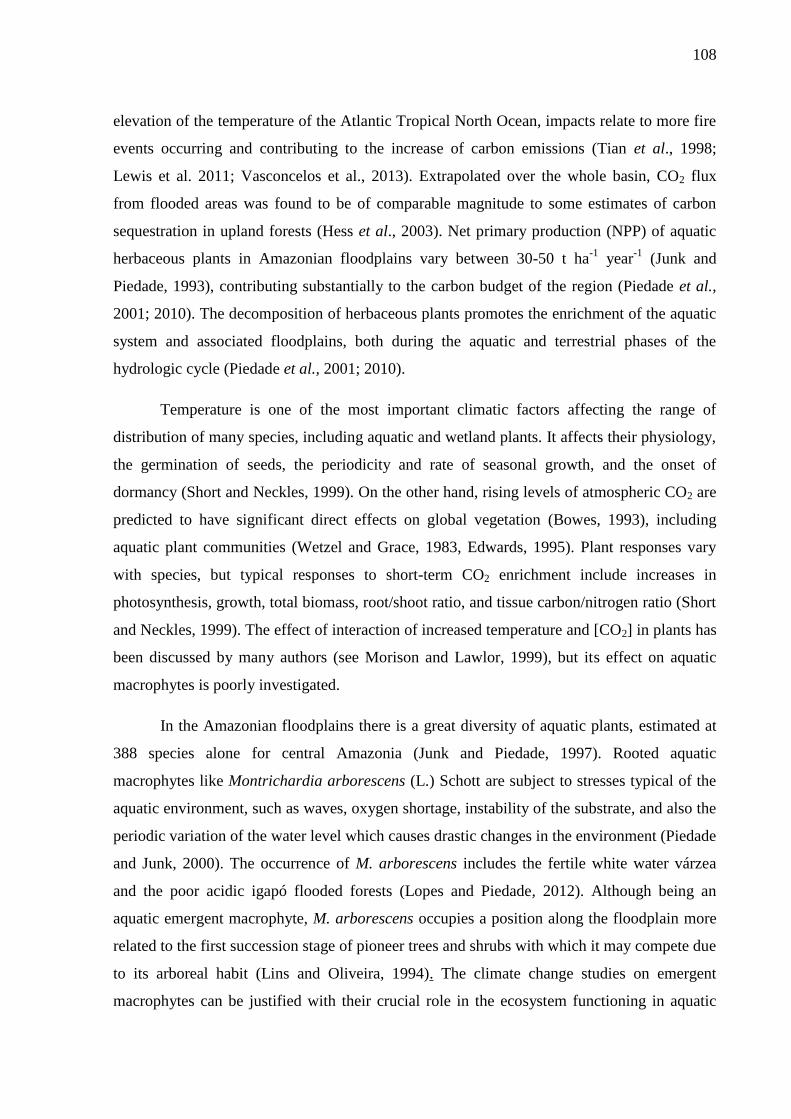
108
elevation of the temperature of the Atlantic Tropical North Ocean, impacts relate to more fire
events occurring and contributing to the increase of carbon emissions (Tian et al., 1998;
Lewis et al. 2011; Vasconcelos et al., 2013). Extrapolated over the whole basin, CO2 flux
from flooded areas was found to be of comparable magnitude to some estimates of carbon
sequestration in upland forests (Hess et al., 2003). Net primary production (NPP) of aquatic
herbaceous plants in Amazonian floodplains vary between 30-50 t ha-1
year-1
(Junk and
Piedade, 1993), contributing substantially to the carbon budget of the region (Piedade et al.,
2001; 2010). The decomposition of herbaceous plants promotes the enrichment of the aquatic
system and associated floodplains, both during the aquatic and terrestrial phases of the
hydrologic cycle (Piedade et al., 2001; 2010).
Temperature is one of the most important climatic factors affecting the range of
distribution of many species, including aquatic and wetland plants. It affects their physiology,
the germination of seeds, the periodicity and rate of seasonal growth, and the onset of
dormancy (Short and Neckles, 1999). On the other hand, rising levels of atmospheric CO2 are
predicted to have significant direct effects on global vegetation (Bowes, 1993), including
aquatic plant communities (Wetzel and Grace, 1983, Edwards, 1995). Plant responses vary
with species, but typical responses to short-term CO2 enrichment include increases in
photosynthesis, growth, total biomass, root/shoot ratio, and tissue carbon/nitrogen ratio (Short
and Neckles, 1999). The effect of interaction of increased temperature and [CO2] in plants has
been discussed by many authors (see Morison and Lawlor, 1999), but its effect on aquatic
macrophytes is poorly investigated.
In the Amazonian floodplains there is a great diversity of aquatic plants, estimated at
388 species alone for central Amazonia (Junk and Piedade, 1997). Rooted aquatic
macrophytes like Montrichardia arborescens (L.) Schott are subject to stresses typical of the
aquatic environment, such as waves, oxygen shortage, instability of the substrate, and also the
periodic variation of the water level which causes drastic changes in the environment (Piedade
and Junk, 2000). The occurrence of M. arborescens includes the fertile white water várzea
and the poor acidic igapó flooded forests (Lopes and Piedade, 2012). Although being an
aquatic emergent macrophyte, M. arborescens occupies a position along the floodplain more
related to the first succession stage of pioneer trees and shrubs with which it may compete due
to its arboreal habit (Lins and Oliveira, 1994). The climate change studies on emergent
macrophytes can be justified with their crucial role in the ecosystem functioning in aquatic
109
habitats (Ojala et al., 2002). Furthermore, this species was chosen to understand the effects of
stressors in nutritionally poor areas such as igapó.
The nature of the physiological adaptations may vary greatly among species according
to the genetic load as a function of the availability of environmental resources (Pepper et al.,
1998). This will influence parameters directly responsible for obtaining daily carbon as the
photosynthetic capacity and quantum efficiency and the uptake and use of nutrients in soil,
which influences the primary metabolism (Parolin, 2001, De Simone et al., 2002). Thus, the
studies of the ecophysiological behavior of plant species that colonize floodplain ecosystems
are important tools for understanding the potential effects of environmental changes.
Analyzing the combined effects of CO2 and temperature on plants is important because
changes in CO2 concentrations are global, and different ecosystems in very different
temperature regimes will be affected, irrespective of any past or future changes in temperature
(Morison and Lawlor, 1999). The aim of this paper was to determine the responses of an
Amazonian aquatic macrophyte in scenarios with significant changes in temperature and
atmospheric CO2 concentrations according to the predictions of the IPCC (2007). In order to
characterize the potential effect of CO2 enriched atmosphere over seedling establishment, our
experiment was designed to evaluate the responses of seedlings to four scenarios of CO2
concentrations and temperatures. We aimed at understanding whether climatic changes would
interfere with the responses of growth parameters and photosynthesis. Our hypothesis is that
moderate elevation of temperature and CO2 stimulates seed germination and seedling growth,
while high concentrations can inhibit the germination and growth of seedlings.
Methods
Species investigated
Montrichardia arborescens, known as Aninga, has a broad distribution along the river
shores in the Amazon Basin, forming monospecific stands in the edges of the floodplain
forests. The species can also be found in high densities in Central America and in isolated
spots in the states of Minas Gerais and Bahia (Brazil). In the Amazon Basin, M. arborescens
may be found in nutritionally rich environments, such as the white water rivers (várzeas), but
especially in poor environments, such as black water rivers (igapós) and in the brackish
estuarine areas of the Amazon River (http://splink.cria.org.br).
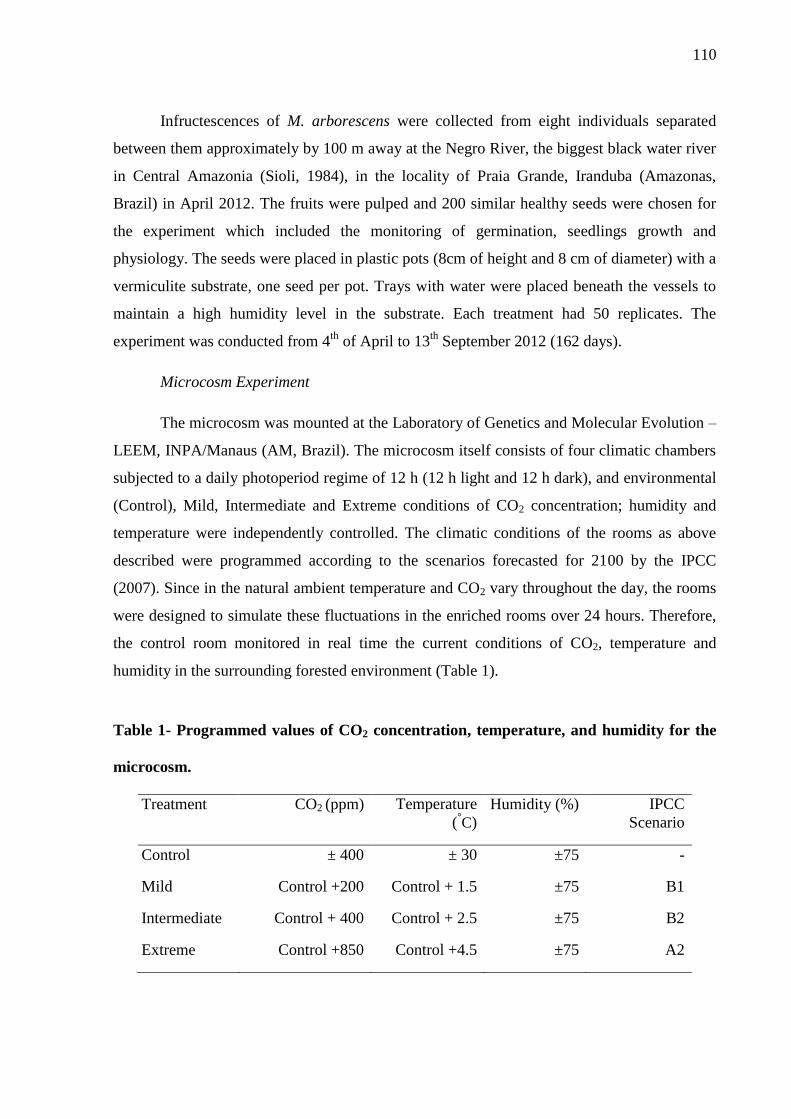
110
Infructescences of M. arborescens were collected from eight individuals separated
between them approximately by 100 m away at the Negro River, the biggest black water river
in Central Amazonia (Sioli, 1984), in the locality of Praia Grande, Iranduba (Amazonas,
Brazil) in April 2012. The fruits were pulped and 200 similar healthy seeds were chosen for
the experiment which included the monitoring of germination, seedlings growth and
physiology. The seeds were placed in plastic pots (8cm of height and 8 cm of diameter) with a
vermiculite substrate, one seed per pot. Trays with water were placed beneath the vessels to
maintain a high humidity level in the substrate. Each treatment had 50 replicates. The
experiment was conducted from 4th
of April to 13th
September 2012 (162 days).
Microcosm Experiment
The microcosm was mounted at the Laboratory of Genetics and Molecular Evolution –
LEEM, INPA/Manaus (AM, Brazil). The microcosm itself consists of four climatic chambers
subjected to a daily photoperiod regime of 12 h (12 h light and 12 h dark), and environmental
(Control), Mild, Intermediate and Extreme conditions of CO2 concentration; humidity and
temperature were independently controlled. The climatic conditions of the rooms as above
described were programmed according to the scenarios forecasted for 2100 by the IPCC
(2007). Since in the natural ambient temperature and CO2 vary throughout the day, the rooms
were designed to simulate these fluctuations in the enriched rooms over 24 hours. Therefore,
the control room monitored in real time the current conditions of CO2, temperature and
humidity in the surrounding forested environment (Table 1).
Table 1- Programmed values of CO2 concentration, temperature, and humidity for the
microcosm.
Treatment CO2 (ppm) Temperature
(°C)
Humidity (%) IPCC
Scenario
Control ± 400 ± 30 ±75 -
Mild Control +200 Control + 1.5 ±75 B1
Intermediate Control + 400 Control + 2.5 ±75 B2
Extreme Control +850 Control +4.5 ±75 A2
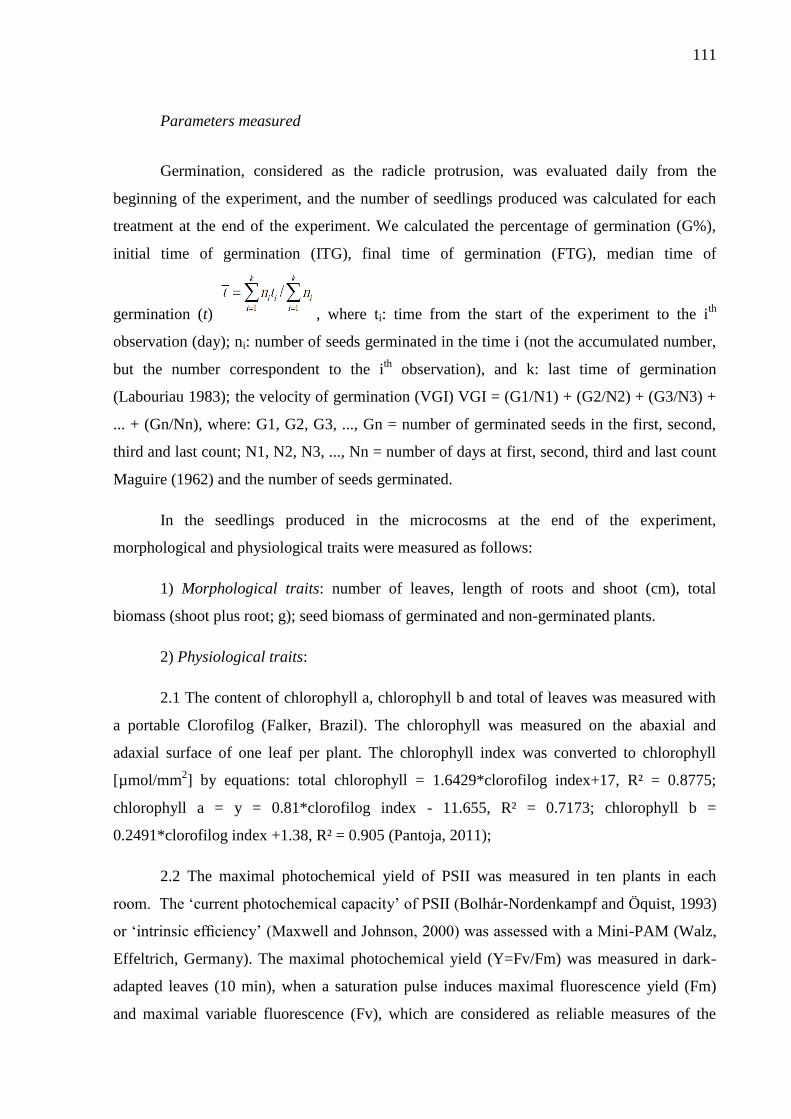
111
Parameters measured
Germination, considered as the radicle protrusion, was evaluated daily from the
beginning of the experiment, and the number of seedlings produced was calculated for each
treatment at the end of the experiment. We calculated the percentage of germination (G%),
initial time of germination (ITG), final time of germination (FTG), median time of
germination (t) , where ti: time from the start of the experiment to the ith
observation (day); ni: number of seeds germinated in the time i (not the accumulated number,
but the number correspondent to the ith
observation), and k: last time of germination
(Labouriau 1983); the velocity of germination (VGI) VGI = (G1/N1) + (G2/N2) + (G3/N3) +
... + (Gn/Nn), where: G1, G2, G3, ..., Gn = number of germinated seeds in the first, second,
third and last count; N1, N2, N3, ..., Nn = number of days at first, second, third and last count
Maguire (1962) and the number of seeds germinated.
In the seedlings produced in the microcosms at the end of the experiment,
morphological and physiological traits were measured as follows:
1) Morphological traits: number of leaves, length of roots and shoot (cm), total
biomass (shoot plus root; g); seed biomass of germinated and non-germinated plants.
2) Physiological traits:
2.1 The content of chlorophyll a, chlorophyll b and total of leaves was measured with
a portable Clorofilog (Falker, Brazil). The chlorophyll was measured on the abaxial and
adaxial surface of one leaf per plant. The chlorophyll index was converted to chlorophyll
[µmol/mm2] by equations: total chlorophyll = 1.6429*clorofilog index+17, R² = 0.8775;
chlorophyll a = y = 0.81*clorofilog index - 11.655, R² = 0.7173; chlorophyll b =
0.2491*clorofilog index +1.38, R² = 0.905 (Pantoja, 2011);
2.2 The maximal photochemical yield of PSII was measured in ten plants in each
room. The ‘current photochemical capacity’ of PSII (Bolhár-Nordenkampf and Öquist, 1993)
or ‘intrinsic efficiency’ (Maxwell and Johnson, 2000) was assessed with a Mini-PAM (Walz,
Effeltrich, Germany). The maximal photochemical yield (Y=Fv/Fm) was measured in dark-
adapted leaves (10 min), when a saturation pulse induces maximal fluorescence yield (Fm)
and maximal variable fluorescence (Fv), which are considered as reliable measures of the
112
potential quantum yield of Photosystem II. In dark-adapted leaves (all reaction centers of the
electron transport chain oxidized) Fv/Fm is a parameter for measuring the maximum relative
electron transport rate of PSII (Krause and Weis, 1991). Healthy leaves usually show Fv/Fm
values between 0.66 and 0.80, lower values indicate intracellular or physiological changes
(calculated according to Bolhár-Nordenkampf and Götzl, 1992, for several common
floodplain species in Waldhoff et al., 2000).
2.3 Rapid light curves (RLC) in three plants in each treatment were additionally
carried. This measure shows the photosynthetic electron transport rate (ETR). Responses to
short-term irradiances were measured using increasing irradiation in nine steps within 3
minutes, each irradiation period lasting 10 s.
Statistical analyses
ANCOVA was user to analyze the effect of the treatments on morphological traits,
with the time available for plant’s growth as co-variable. ANOVA was used to analyze the
effect of the treatments on physiological traits and germination parameters. The differences
between the factors were estimated by Tukey test a posteriori. The non-parametric Kruskal-
Wallis-Test was applied when the assumption of ANOVA was not met, followed by of
Dunnett test. The statistical analyses were performed with Systat 12 (SYSTAT, 2007).
Results
During the experimental period, the climatic conditions in the microcosms varied in
response to outside-room ambient changes. The [CO2] varied between 350 and 500 ppm in
treatment Control, 550 to 680 in treatment Mild, 770 to 890 in treatment Intermediate and
1200 to 1330 in treatment Extreme (Table 1). The temperature varied between 26 and 28ºC in
the Control treatment, 28 to 30ºC in treatment Mild, 29 to 31ºC in treatment Intermediate and
31 to 33ºC in treatment Extreme (Table 2). The humidity varied between 69 and 77% in all
treatments during the experiment period (Table 2).
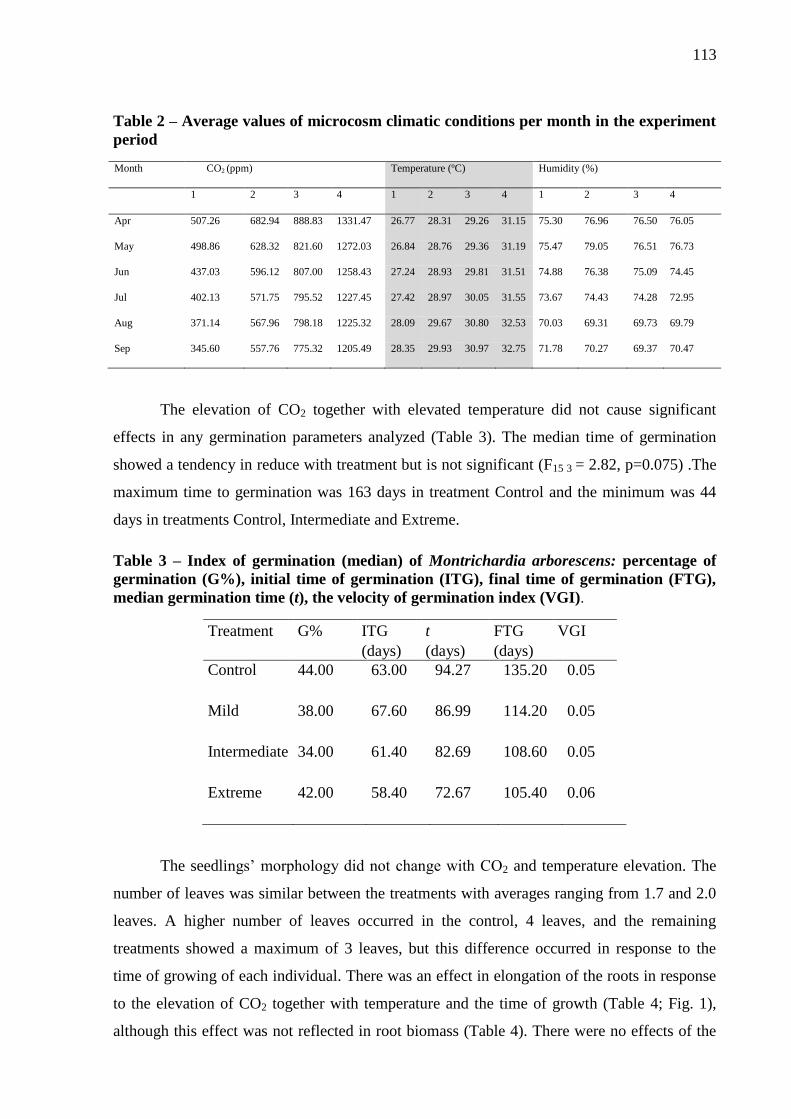
113
Table 2 – Average values of microcosm climatic conditions per month in the experiment
period
Month CO2 (ppm) Temperature (ºC) Humidity (%)
1 2 3 4 1 2 3 4 1 2 3 4
Apr 507.26 682.94 888.83 1331.47 26.77 28.31 29.26 31.15 75.30 76.96 76.50 76.05
May 498.86 628.32 821.60 1272.03 26.84 28.76 29.36 31.19 75.47 79.05 76.51 76.73
Jun 437.03 596.12 807.00 1258.43 27.24 28.93 29.81 31.51 74.88 76.38 75.09 74.45
Jul 402.13 571.75 795.52 1227.45 27.42 28.97 30.05 31.55 73.67 74.43 74.28 72.95
Aug 371.14 567.96 798.18 1225.32 28.09 29.67 30.80 32.53 70.03 69.31 69.73 69.79
Sep 345.60 557.76 775.32 1205.49 28.35 29.93 30.97 32.75 71.78 70.27 69.37 70.47
The elevation of CO2 together with elevated temperature did not cause significant
effects in any germination parameters analyzed (Table 3). The median time of germination
showed a tendency in reduce with treatment but is not significant (F15 3 = 2.82, p=0.075) .The
maximum time to germination was 163 days in treatment Control and the minimum was 44
days in treatments Control, Intermediate and Extreme.
Table 3 – Index of germination (median) of Montrichardia arborescens: percentage of
germination (G%), initial time of germination (ITG), final time of germination (FTG),
median germination time (t), the velocity of germination index (VGI).
Treatment G% ITG t FTG VGI
(days) (days) (days)
Control 44.00 63.00 94.27 135.20 0.05
Mild 38.00 67.60 86.99 114.20 0.05
Intermediate 34.00 61.40 82.69 108.60 0.05
Extreme 42.00 58.40 72.67 105.40 0.06
The seedlings’ morphology did not change with CO2 and temperature elevation. The
number of leaves was similar between the treatments with averages ranging from 1.7 and 2.0
leaves. A higher number of leaves occurred in the control, 4 leaves, and the remaining
treatments showed a maximum of 3 leaves, but this difference occurred in response to the
time of growing of each individual. There was an effect in elongation of the roots in response
to the elevation of CO2 together with temperature and the time of growth (Table 4; Fig. 1),
although this effect was not reflected in root biomass (Table 4). There were no effects of the
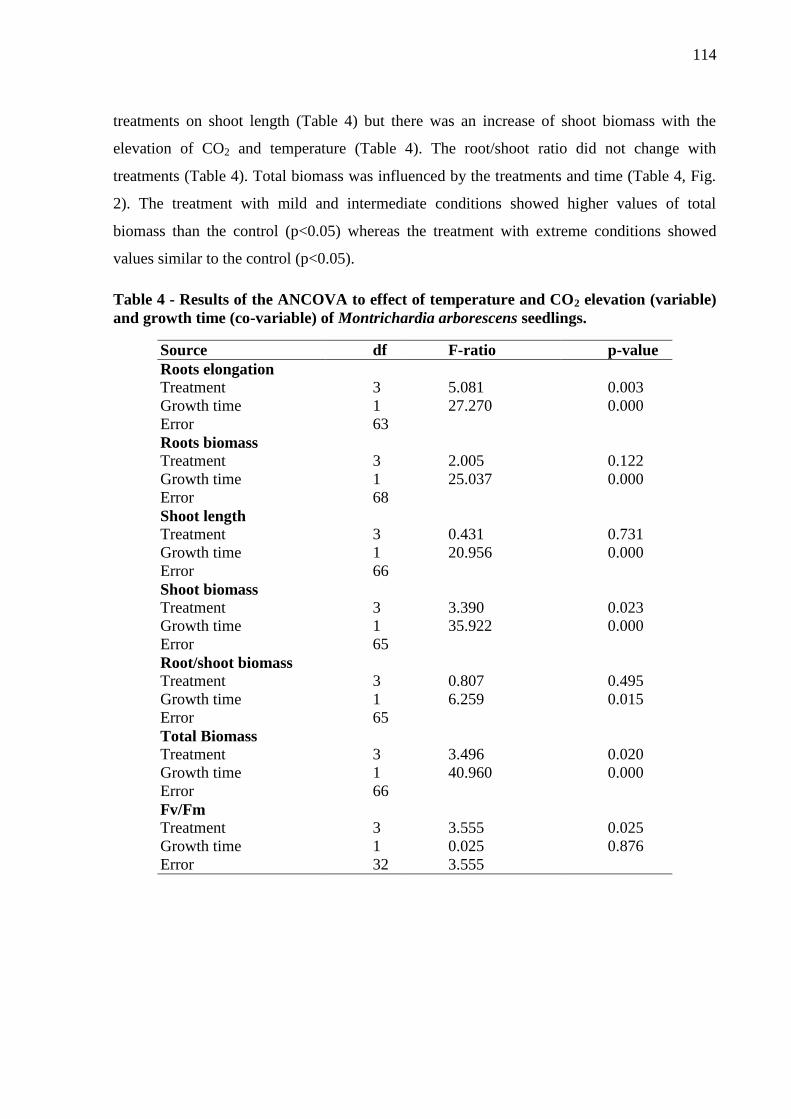
114
treatments on shoot length (Table 4) but there was an increase of shoot biomass with the
elevation of CO2 and temperature (Table 4). The root/shoot ratio did not change with
treatments (Table 4). Total biomass was influenced by the treatments and time (Table 4, Fig.
2). The treatment with mild and intermediate conditions showed higher values of total
biomass than the control (p<0.05) whereas the treatment with extreme conditions showed
values similar to the control (p<0.05).
Table 4 - Results of the ANCOVA to effect of temperature and CO2 elevation (variable)
and growth time (co-variable) of Montrichardia arborescens seedlings.
Source df F-ratio p-value
Roots elongation
Treatment 3 5.081 0.003
Growth time 1 27.270 0.000
Error 63
Roots biomass
Treatment 3 2.005 0.122
Growth time 1 25.037 0.000
Error 68
Shoot length
Treatment 3 0.431 0.731
Growth time 1 20.956 0.000
Error 66
Shoot biomass
Treatment 3 3.390 0.023
Growth time 1 35.922 0.000
Error 65
Root/shoot biomass
Treatment 3 0.807 0.495
Growth time 1 6.259 0.015
Error 65
Total Biomass
Treatment 3 3.496 0.020
Growth time 1 40.960 0.000
Error 66
Fv/Fm
Treatment 3 3.555 0.025
Growth time 1 0.025 0.876
Error 32 3.555
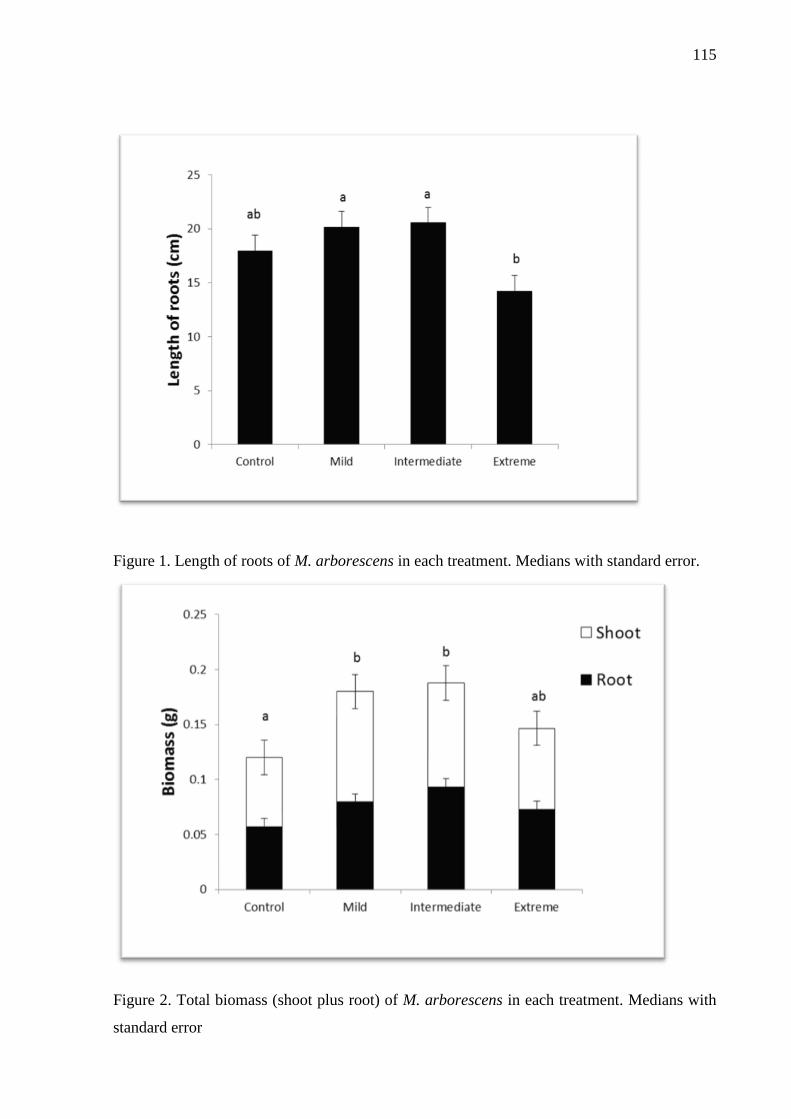
115
Figure 1. Length of roots of M. arborescens in each treatment. Medians with standard error.
Figure 2. Total biomass (shoot plus root) of M. arborescens in each treatment. Medians with
standard error
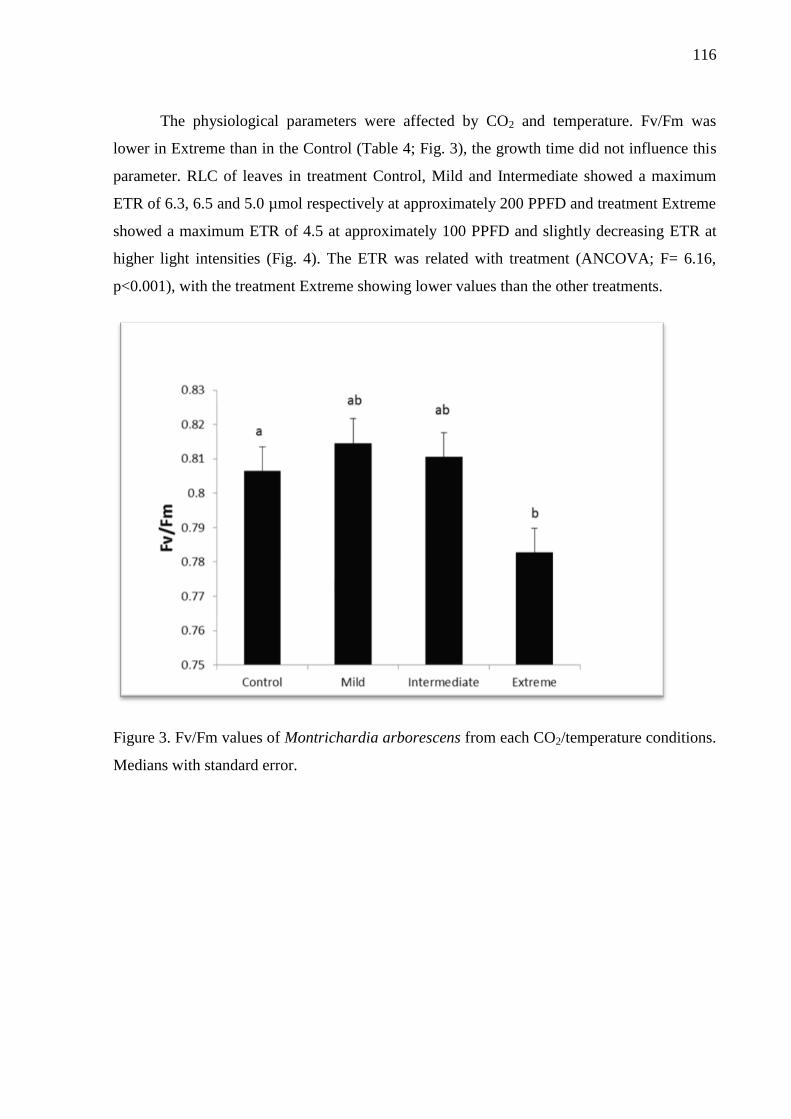
116
The physiological parameters were affected by CO2 and temperature. Fv/Fm was
lower in Extreme than in the Control (Table 4; Fig. 3), the growth time did not influence this
parameter. RLC of leaves in treatment Control, Mild and Intermediate showed a maximum
ETR of 6.3, 6.5 and 5.0 µmol respectively at approximately 200 PPFD and treatment Extreme
showed a maximum ETR of 4.5 at approximately 100 PPFD and slightly decreasing ETR at
higher light intensities (Fig. 4). The ETR was related with treatment (ANCOVA; F= 6.16,
p<0.001), with the treatment Extreme showing lower values than the other treatments.
Figure 3. Fv/Fm values of Montrichardia arborescens from each CO2/temperature conditions.
Medians with standard error.
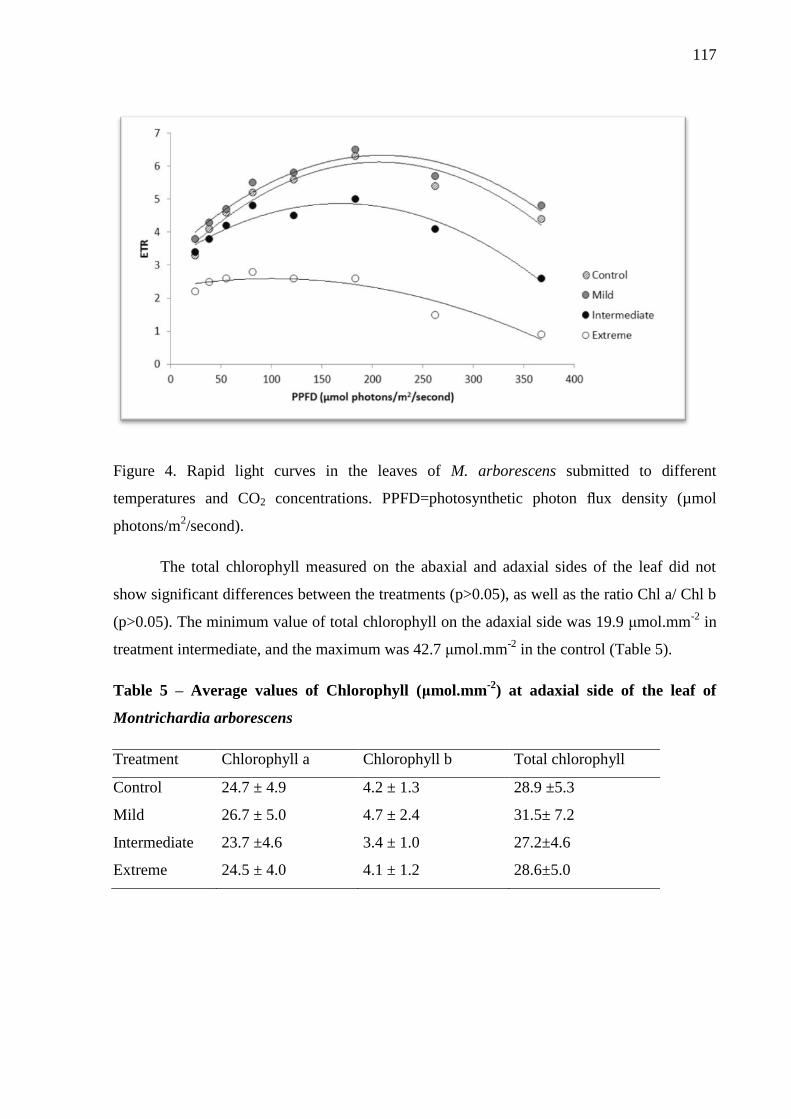
117
Figure 4. Rapid light curves in the leaves of M. arborescens submitted to different
temperatures and CO2 concentrations. PPFD=photosynthetic photon flux density (µmol
photons/m2/second).
The total chlorophyll measured on the abaxial and adaxial sides of the leaf did not
show significant differences between the treatments (p>0.05), as well as the ratio Chl a/ Chl b
(p>0.05). The minimum value of total chlorophyll on the adaxial side was 19.9 μmol.mm-2
in
treatment intermediate, and the maximum was 42.7 μmol.mm-2
in the control (Table 5).
Table 5 – Average values of Chlorophyll (μmol.mm-2
) at adaxial side of the leaf of
Montrichardia arborescens
Treatment Chlorophyll a Chlorophyll b Total chlorophyll
Control 24.7 ± 4.9 4.2 ± 1.3 28.9 ±5.3
Mild 26.7 ± 5.0 4.7 ± 2.4 31.5± 7.2
Intermediate 23.7 ±4.6 3.4 ± 1.0 27.2±4.6
Extreme 24.5 ± 4.0 4.1 ± 1.2 28.6±5.0
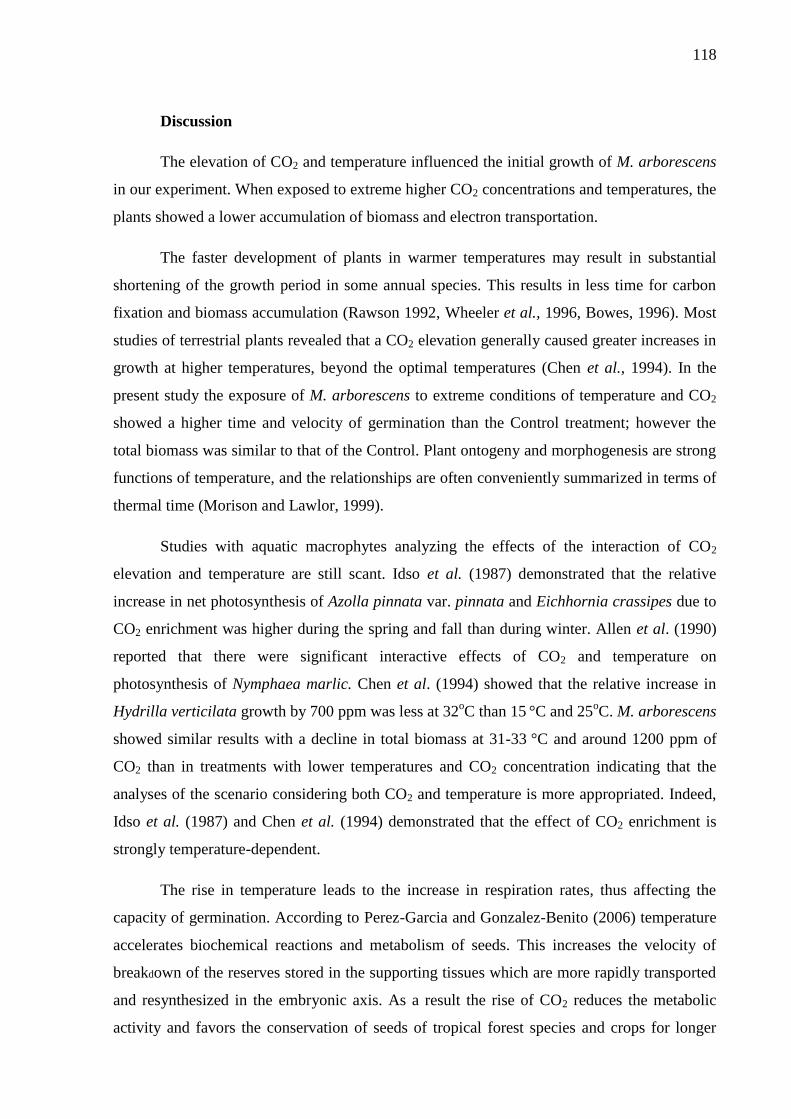
118
Discussion
The elevation of CO2 and temperature influenced the initial growth of M. arborescens
in our experiment. When exposed to extreme higher CO2 concentrations and temperatures, the
plants showed a lower accumulation of biomass and electron transportation.
The faster development of plants in warmer temperatures may result in substantial
shortening of the growth period in some annual species. This results in less time for carbon
fixation and biomass accumulation (Rawson 1992, Wheeler et al., 1996, Bowes, 1996). Most
studies of terrestrial plants revealed that a CO2 elevation generally caused greater increases in
growth at higher temperatures, beyond the optimal temperatures (Chen et al., 1994). In the
present study the exposure of M. arborescens to extreme conditions of temperature and CO2
showed a higher time and velocity of germination than the Control treatment; however the
total biomass was similar to that of the Control. Plant ontogeny and morphogenesis are strong
functions of temperature, and the relationships are often conveniently summarized in terms of
thermal time (Morison and Lawlor, 1999).
Studies with aquatic macrophytes analyzing the effects of the interaction of CO2
elevation and temperature are still scant. Idso et al. (1987) demonstrated that the relative
increase in net photosynthesis of Azolla pinnata var. pinnata and Eichhornia crassipes due to
CO2 enrichment was higher during the spring and fall than during winter. Allen et al. (1990)
reported that there were significant interactive effects of CO2 and temperature on
photosynthesis of Nymphaea marlic. Chen et al. (1994) showed that the relative increase in
Hydrilla verticilata growth by 700 ppm was less at 32oC than 15
°C and 25
oC. M. arborescens
showed similar results with a decline in total biomass at 31-33 °C and around 1200 ppm of
CO2 than in treatments with lower temperatures and CO2 concentration indicating that the
analyses of the scenario considering both CO2 and temperature is more appropriated. Indeed,
Idso et al. (1987) and Chen et al. (1994) demonstrated that the effect of CO2 enrichment is
strongly temperature-dependent.
The rise in temperature leads to the increase in respiration rates, thus affecting the
capacity of germination. According to Perez-Garcia and Gonzalez-Benito (2006) temperature
accelerates biochemical reactions and metabolism of seeds. This increases the velocity of
breakdown of the reserves stored in the supporting tissues which are more rapidly transported
and resynthesized in the embryonic axis. As a result the rise of CO2 reduces the metabolic
activity and favors the conservation of seeds of tropical forest species and crops for longer
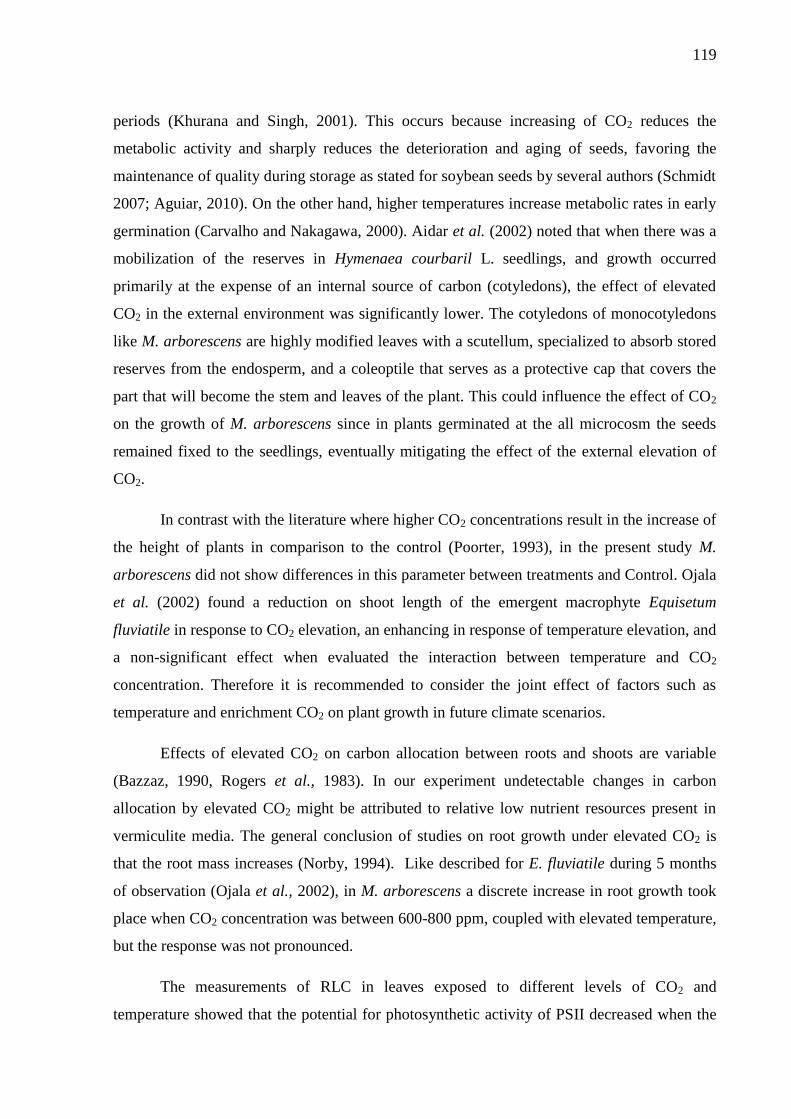
119
periods (Khurana and Singh, 2001). This occurs because increasing of CO2 reduces the
metabolic activity and sharply reduces the deterioration and aging of seeds, favoring the
maintenance of quality during storage as stated for soybean seeds by several authors (Schmidt
2007; Aguiar, 2010). On the other hand, higher temperatures increase metabolic rates in early
germination (Carvalho and Nakagawa, 2000). Aidar et al. (2002) noted that when there was a
mobilization of the reserves in Hymenaea courbaril L. seedlings, and growth occurred
primarily at the expense of an internal source of carbon (cotyledons), the effect of elevated
CO2 in the external environment was significantly lower. The cotyledons of monocotyledons
like M. arborescens are highly modified leaves with a scutellum, specialized to absorb stored
reserves from the endosperm, and a coleoptile that serves as a protective cap that covers the
part that will become the stem and leaves of the plant. This could influence the effect of CO2
on the growth of M. arborescens since in plants germinated at the all microcosm the seeds
remained fixed to the seedlings, eventually mitigating the effect of the external elevation of
CO2.
In contrast with the literature where higher CO2 concentrations result in the increase of
the height of plants in comparison to the control (Poorter, 1993), in the present study M.
arborescens did not show differences in this parameter between treatments and Control. Ojala
et al. (2002) found a reduction on shoot length of the emergent macrophyte Equisetum
fluviatile in response to CO2 elevation, an enhancing in response of temperature elevation, and
a non-significant effect when evaluated the interaction between temperature and CO2
concentration. Therefore it is recommended to consider the joint effect of factors such as
temperature and enrichment CO2 on plant growth in future climate scenarios.
Effects of elevated CO2 on carbon allocation between roots and shoots are variable
(Bazzaz, 1990, Rogers et al., 1983). In our experiment undetectable changes in carbon
allocation by elevated CO2 might be attributed to relative low nutrient resources present in
vermiculite media. The general conclusion of studies on root growth under elevated CO2 is
that the root mass increases (Norby, 1994). Like described for E. fluviatile during 5 months
of observation (Ojala et al., 2002), in M. arborescens a discrete increase in root growth took
place when CO2 concentration was between 600-800 ppm, coupled with elevated temperature,
but the response was not pronounced.
The measurements of RLC in leaves exposed to different levels of CO2 and
temperature showed that the potential for photosynthetic activity of PSII decreased when the
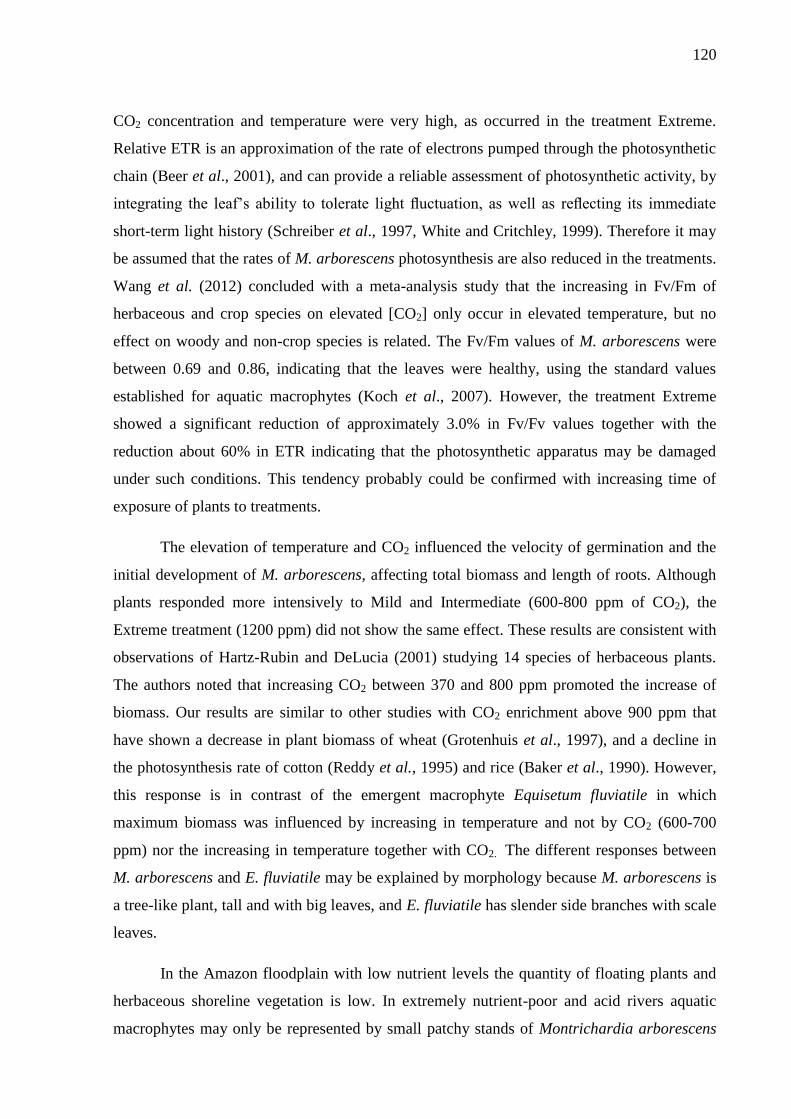
120
CO2 concentration and temperature were very high, as occurred in the treatment Extreme.
Relative ETR is an approximation of the rate of electrons pumped through the photosynthetic
chain (Beer et al., 2001), and can provide a reliable assessment of photosynthetic activity, by
integrating the leaf’s ability to tolerate light fluctuation, as well as reflecting its immediate
short-term light history (Schreiber et al., 1997, White and Critchley, 1999). Therefore it may
be assumed that the rates of M. arborescens photosynthesis are also reduced in the treatments.
Wang et al. (2012) concluded with a meta-analysis study that the increasing in Fv/Fm of
herbaceous and crop species on elevated [CO2] only occur in elevated temperature, but no
effect on woody and non-crop species is related. The Fv/Fm values of M. arborescens were
between 0.69 and 0.86, indicating that the leaves were healthy, using the standard values
established for aquatic macrophytes (Koch et al., 2007). However, the treatment Extreme
showed a significant reduction of approximately 3.0% in Fv/Fv values together with the
reduction about 60% in ETR indicating that the photosynthetic apparatus may be damaged
under such conditions. This tendency probably could be confirmed with increasing time of
exposure of plants to treatments.
The elevation of temperature and CO2 influenced the velocity of germination and the
initial development of M. arborescens, affecting total biomass and length of roots. Although
plants responded more intensively to Mild and Intermediate (600-800 ppm of CO2), the
Extreme treatment (1200 ppm) did not show the same effect. These results are consistent with
observations of Hartz-Rubin and DeLucia (2001) studying 14 species of herbaceous plants.
The authors noted that increasing CO2 between 370 and 800 ppm promoted the increase of
biomass. Our results are similar to other studies with CO2 enrichment above 900 ppm that
have shown a decrease in plant biomass of wheat (Grotenhuis et al., 1997), and a decline in
the photosynthesis rate of cotton (Reddy et al., 1995) and rice (Baker et al., 1990). However,
this response is in contrast of the emergent macrophyte Equisetum fluviatile in which
maximum biomass was influenced by increasing in temperature and not by CO2 (600-700
ppm) nor the increasing in temperature together with CO2. The different responses between
M. arborescens and E. fluviatile may be explained by morphology because M. arborescens is
a tree-like plant, tall and with big leaves, and E. fluviatile has slender side branches with scale
leaves.
In the Amazon floodplain with low nutrient levels the quantity of floating plants and
herbaceous shoreline vegetation is low. In extremely nutrient-poor and acid rivers aquatic
macrophytes may only be represented by small patchy stands of Montrichardia arborescens
121
along the margins of the floodplain forest (Junk and Howard-Williams, 1984). Climate
models predict that from the middle of this century on, the Amazon rainforest may give place
to a cerrado-type vegetation (Oyama and Nobre, 199; Jenkins et al., 2005) or semi-deciduous
forest (Malhi et al., 2009a). Under such conditions the Amazonian wetlands may become a
refuge for species of humid forest lowering the effects of decreased precipitation (Piedade et
al., 2013). However, our results with M. arborescens indicate that the elevation of CO2 to
1200 ppm and temperature may result in extreme reductions of aquatic macrophytes in these
areas, since this is the most abundant species in the igapó system (Lopes et al., 2014). This
could result in a drastic change in the whole floristic composition of these areas.
Conclusions
The elevation of CO2 and temperature influenced the initial growth of M. arborescens,
resulting in a lower accumulation of biomass and electron transport. If this result was a
standard for other aquatic macrophytes, this would indicate important implications for
Amazonian wetlands, and also for wetlands worldwide. Aquatic macrophytes are the main
primary producers in this environment, and they are pioneers in the constant successional
processes in wetlands. In extremely nutrient-poor and acid water like igapó, the aquatic
macrophyte vegetation may be reduced to few species. An elevation of CO2 concentrations to
1,200 ppm and higher temperatures may result in a drastic reduction of these plants. This
implies that a reduction of carbon sequestration by the herbaceous vegetation may be
expected, leading to an alteration in the local and regional carbon cycles.
The aquatic herbaceous plants are very important in the carbon and nutrient budgets of
wetlands. The igapó ecosystem is an important area for the regional economy owing to
activities in fisheries, forestry, and tourism. The reduction of the biomass of aquatic
macrophytes could certainly have a negative impact on the biota and the whole ecosystem,
since these plants are very productive and provide shelter and food for many animals.
Therefore, long-term investigations of interactions of CO2 and temperature effects, like the
proposed IPCC scenarios, are needed to clarify the effects on Amazonian aquatic macrophytes
and the whole ecosystem.

122
Acknowledgments
This work is support by INCT ADAPTA - Brazilian Ministry of Science, Technology
and Innovation (CNPq/FAPEAM), and the Universal CNPq (14/2009; 14/2011). The authors
thanks the Conselho Nacional de Desenvolvimento Científico e Tecnológico (CNPq) for
Aline Lopes Doctor’s Grant; MAUA Research Group, Laboratório de Ecofisiologia e
Evolução (LEEM) for logistical and technical support.
References
Aguiar RW, Faroni LRA, Guedes RN, Sousa AH, Rozado AF. 2010. Toxicidade da
combinação de dióxido de carbono e fosfina sob diferentes temperaturas para Tribolium
castaneum. Revista Brasileira de Engenharia Agrícola e Ambiental 14:881-886.
Aidar MPM, Martinez CA,; Costa AC, Costa PMF, Dietrich SMC, Buckeridge MS. 2002.
Effect of Atmospheric CO2 Enrichment on The Establishment of Seedlings of Jatobá,
Hymenaea courbaril L. Biota Neotropica 2(1):1-10.
Allen SG, Idso SB, Kimball B A. 1990. Interactive effects of CO2 and environment on net
photosynthesis of Water-Lily. Agriculture, Ecosystems & Environment 30:81–88.
Baker JT, Allen LH Jr, Boote KJ. 1990. Growth and yield responses of rice to carbon dioxide
concentration. Journal of Agricultural Science 115:313–320.
Bazzaz, FA. 1990. The response of natural ecosystems to the rising global CO2 levels.
Annual Review of Ecology and Systematics 21:67-96.
Beer S, Björk M, Gademann R, Ralph PJ. 2001. Measurement of photosynthesis in
seagrasses. In: Short, FT, Coles, R. eds., Global Seagrass Research Methods. Elsevier
Publishers: The Netherlands, pp.183– 198.
Bolhár-Nordenkampf HR, Götzl M. 1992. Chlorophyllfluoreszenz als Indikator der mit
Seehöhe zunehmenden Streßbelastung von Fichtennadeln. FBVA Berichte Schriftenreihe der
Forstlichen Bundesveranstaltungen. 67:119–131.
Bolhár-Nordenkampf HR, Öquist G. 1993. Chlorophyll fluorescence as a tool in
photosynthesis research. In: Hall DO, Scurlock JMO, Bolhàr-Nordenkampf HR, Leegood
123
RC, Long SP eds. Photosynthesis and Production in a Changing Environment. Chapman and
Hall, pp.193–206.
Bowes G. 1993. Facing the Inevitable: Plants and Increasing Atmospheric CO2 Annual
Review of Plant Physiology and Plant Molecular Biology 44:309-332.
Bowes G. 1996. Photosynthetic responses to changing atmospheric carbon dioxide
concentration. In: Baker NR ed. Photosynthesis and the environment. Kluwer Academic
Publisher. Dordrecht. pp.387-407.
Carvalho NM, Nakagawa J. 2000. Sementes: ciência, tecnologia e produção. Jaboticabal:
FUNEP. 588.
Chen DX, Coughenour MB, Eberts D, Thullen JS. 1994. Interactive effects of CO2
enrichment and temperature on the growth of dioecious Hydrilla verticillata. Environmental
and Experimental Botany 34:345–353.
Cochrane MA, Laurance WF. 2002. Fire as a large-scale edge effect in Amazonian forests.
Journal of Tropical Ecology 18(3):311-325.
De Simone O, Müller E, Junk WJ, Schmidt W. 2002. Adaptations of Central Amazon tree
species to prolonged flooding: root morphology and leaf longevity. Plant Biology 4:515–522.
Edwards AJ. 1995. Impact of climatic change on coral reefs, mangroves, and tropical
seagrass ecosystems. In: Eisma, D. ed. Climate Change: Impact on Coastal Habitation. CRC
Press, Boca Raton. 209-234.
Grandis A, Godoi S, Buckeridge S. 2010. Respostas fisiológicas de plantas amazônicas de
regiões alagadas às mudanças climáticas globais. Revista Brasileira de Botânica 33:1–12.
Grotenhuis TP, Bugbee B. 1997. Super-optimal CO2 reduces seed yield but not vegetative
growth in wheat. Crop Science 37:1215–1222.
Hartz-Rubin JS, DeLucia EH. 2001. Canopy development of a model herbaceous
community exposed to elevated atmospheric CO2 and soil nutrients. Physiologia
Plantarum 113: 258-266.
124
Hess LL, Melack JM, Novo E M, Barbosa CC, Gastil M. 2003. Dual-season mapping of
wetland inundation and vegetation for the central Amazon basin. Remote Sensing of
Environment 87(4):404-428.
Houghton JT, Ding Y, Griggs DJ, Noguer M, van der Linden PJ, Xiaosu D, eds. 2001.
Climate Change 2001. The Scientific basis. Cambridge, UK: Cambridge University Press.
Idso SB, Kimball BA, Anderson MG, Mauney J R. 1987. Effects of Atmospheric CO2
enrichment on plant growth: the interactive role of air temperature. Agriculture, ecosystems
& environment 20:1-10.
IPCC. 2007. Summary for Policymakers of the Synthesis Report of the IPCC Fourth
Assessment Report DRAFT COPY 16 NOVEMBER 2007 23:04 – Subject to final copyedit
Jenkins G. Betts R, Collins M, Griggs D, Lowe J, Wood R. 2005. Stabilizing climate to
avoid dangerous climate change – a summary of relevant research at the Hadley Centre.
Exeter, UK: Departament for Environment Food a Rural Affairs, Met Office Hadley Centre,
16.
Junk W J, Howard-Williams C. 1984. Ecology of aquatic macrophytes in Amazonia. In: Sioli
H. ed. The Amazon: limnology and landscape ecology of a mighty tropical river and its
basin. Dordrecht: Dr. W. Junk Publishers 10:269-293.
Junk WJ, Piedade MT. 1997. Plant life in the floodplain with special reference to herbaceous
plants. In: Junk WJ, ed. The Central Amazon Floodplain. Berlin:Springer-Verlag. pp.147–81.
Junk WJ, Piedade MTF. 1993. Biomass and primary production of herbaceous plants
communities in the Amazon floodplain. Hydrobiologia 263:155-162.
Khurana E, Singh JS. 2001. Ecology of seed and seedling growth for conservation and
restauration of tropical dry forest: a review. Conservation Biology 28 (1): 39-52.
Koch MS, Schopmeyer SA, Kyhn-Hansen C, Madden CJ, Peters JS. 2007. Tropical seagrass
species tolerance to hypersalinity stress Aquatic Botany 86:14–24
Krause GH,Weis E. 1991. Chlorophyll fluorescence and photosynthesis: The Basics. Annual
review of plant biology 42:313–349.
125
Labouriau, L.G. 1983. A germinação das sementes. Organização dos Estados Americanos.
Programa Regional de Desenvolvimento Científico e Tecnológico. Série de Biologia.
Monografia 24.
Lewis, S. L., Brando, P. M., Phillips, O. L., van der Heijden, G. M., & Nepstad, D. (2011).
The 2010 amazon drought. Science, 331(6017), 554-554.
Lins ALFA, Oliveira PL. 1994. Origem, aspectos morfológicos e anatômicos das raízes
embrionárias de Montrichardia linifera (arruda) Schott (Araceae). B. Museu Paraense Emílio
Goeldi, Série Bot. 10(2):221-236.
Lopes A. Piedade MTF. 2012. Distribuição, biomassa e variação morfológica entre
populações do gênero Montrichardia Crueg (Araceae) na Bacia Amazônica. In: I Congresso
Brasileiro de Áreas Úmidas, Cuiabá: Anais do I Congresso Brasileiro de Áreas Úmidas.
Lopes, A. Wittmann, F. Schöngart, J., Piedade, M.T.F. 2014. Herbáceas aquáticas em seis
igapós na amazônia central: composição e diversidade de gêneros. Revista Geográfica
Acadêmica (in press).
Maguire, J. D. Speed of germination-aid in selection and evaluation of seedling emergence
and vigour. Crop Science, Madison, v. 2, n. 1, p. 176-177, 1962.
Malhi Y, Aragão L E, Galbraith D, Huntingford C, Fisher R, Zelazowski P, ... & Meir P.
2009a. Exploring the likelihood and mechanism of a climate-change-induced dieback of the
Amazon rainforest. Proceedings of the National Academy of Sciences 106(49):20610-20615.
Malhi, Y., Aragão, L. E. O., Metcalfe, D. B., Paiva, R., Quesada, C. A., Almeida, S., ... &
Teixeira, L. M. 2009b. Comprehensive assessment of carbon productivity, allocation and
storage in three Amazonian forests. Global Change Biology, 15(5), 1255-1274.
Maxwell, K., & Johnson, G. N. (2000). Chlorophyll fluorescence--a practical guide. Journal
of Experimental Botany, 51(345), 659–68.
Morison J, Lawlor D. 1999. Interactions between increasing CO2 concentration and
temperature on plant growth. Plant, Cell and Environment 44:659–682.
126
Nobre CA, Sampaio G, Salazar L. 2007. Mudanças climáticas e Amazônia. Ciência e Cultura
59:22-27.
Norby RJ. 1994. Issues and perspectives for investigating root responses to elevated
atmospheric carbon dioxide. Plant and Soil 165:9–20.
Ojala A, Kankaala P, Tulonen T. 2002. Growth response of Equisetum fluviatile to elevated
CO2 and temperature. Environmental and Experimental Botany 47:157–171
Oyama M D, Nobre CA. 1999. A new climate-vegetation equilibrium state for tropical
South America. Geophysical Research Letters 30(23):2199-2203.
Pantoja PO. 2011. Comparação ecofisiológica e de atributos de crescimento das herbáceas
aquáticas Montrichardia linifera (Arruda.) Schott e M. Arborescens (l.) Schott em tipologias
alagáveis contrastantes na Amazônia central. (Master thesis in Ecology) INPA: Manaus 70p.
Parolin, P. 2001. Morphological and physiological adjustments to waterlogging and drought
in seedlings of Amazonian floodplain trees. Oecologia, 128: 326-335.
Pepper WJ, Barbour W, Sankovski A, Braaz B. 1998. No-policy greenhouse gas emission
scenarios: revisiting IPCC 1992. Environmental Science & Policy 1(4):289-311.
Perez-Garcia F, Gonzalez-Benito M E. 2006. Seed germination of five Helianthemum
species: Effect of temperature and presowing treatments, Journal of Arid Environments
65(01):688-693.
Piedade MTF, Junk W, D'Ângelo SA, Wittmann F, Schöngart J., Barbosa, KMDN, Lopes A.
2010. Aquatic herbaceous plants of the Amazon floodplains: state of the art and research
needed. Acta Limnologica Brasiliensia 22(2):165-178.
Piedade MTF, Junk WJ. 2000. Natural herbaceous plant communities in the Amazon
floodplains and their use. In Junk WJ, Ohly J, Piedade MTF, Soares MGM. eds. The Central
Amazon Floodplain: actual use and options for a sustainable management. [S.l.]: Backhuys
Publishers b. pp.269-290.
Piedade MTF, Schöngart J, Wittmann F, Parolin, P., Junk, W. 2013. Impactos da inundação e
seca na vegetação de áreas alagáveis amazônicas. In: Borma LS, Nobre C. org. Secas na
Amazônia: causas e consequências. São Paulo: Oficina de Textos pp.268-305.
127
Piedade MTF, Worbes M, Junk WJ. 2001. Geo-ecological controls on elemental fluxes in
communities of higher plants in Amazonian floodplains. In: McClain ME, Victoria RL,
Richey J. org. The Biogeochemistry of the Amazon Basin. Oxford: Oxford University Press.
pp.209-233.
Poorter H, 1993. Interspecific variation in the growth reduction to long-term elevated CO2 in
winter wheat. Vegetatio 104/105:77–97.
Rawson HM. 1992. Plant responses to temperature under conditions of elevated CO2.
Australian Journal of Botany 40(5):473–490.
Reddy VR, Reddy KR, Hodges HF. 1995. Carbon-dioxide enrichment and temperature
effects on cotton canopy photosynthesis, transpiration, and water-use efficiency. Field Crops
Research 41: 13–23.
Rogers HH, Heck WW, Heagle AS. 1983. A field technique for the study of plant responses
to elevated carbon dioxide concentrations. Journal of the Air Pollution Control Association
33:42–44.
Schimel D, Enting IG, Heimann M, Wigley TML, Raynaud D, Alves D, Siegenthaler U.
2000. CO2 and the Carbon Cycle (Extracted from the Intergovernmental Panel on Climate
Change (IPCC) Report, “Climate Change, 1994”. In: Wigley TML, Schimel DS, eds. The
Carbon Cycle. Cambridge: Cambridge University Press, pp.1–37.
Schmidt, L. 2007. Tropical forest seed. Dinamarca: DFSC, pp.421.
Schreiber U, Gademann R, Ralph PJ, Larkum AWD. 1997. Assessment of photosynthetic
performance of Prochloron in Lissoclinum patella by in situ and in hospite chlorophyll
fluorescence measurements. Plant Cell Physiol 38:945–951.
Short F, Neckles H. 1999. The effects of global climate change on seagrasses. Aquatic
Botany 63:169–196.
Sioli H. 1984. The Amazon and its main affluents: hydrography, morphology of the river
courses, and river types. In: The Amazon.Netherlands:Springer pp.127-165.
Systat Inc. 2007. SYSTAT 12 SYSTAT Software Inc.
128
Tian H, Mellilo JM, Kicklighter DW, McGuire AD, Helfrich III JVK, Moore III B,
Vörösmarty CJ. 1998. Effect of interannual climate variability on carbon storage in
Amazonian ecosystems. Nature 396:664–667.
Turcq B, Cordeiro RC, Sifeddine A, Simoes Filho FF, Abrao JJ, Oliveira FBO, Silva AO,
Capitaneo JL, Lima FAK. 2002. Carbon storage in Amazonia during the LGM: data and
uncertainties. Chemosphere 49:821–835
Vasconcelos, S. S. D., Fearnside, P. M., Graça, P. M. L. D. A., Nogueira, E. M., Oliveira, L.
C. D., & Figueiredo, E. O. (2013). Forest fires in southwestern Brazilian Amazonia:
Estimates of area and potential carbon emissions. Forest Ecology and Management, 291,
199-208
Wahid A, Gelani S, Ashraf M, Foolad MR. 2007. Heat tolerance in plants: an
overview. Environmental and Experimental Botany 61:199–223.
Waldhoff D, Junk W, Furch B. 2000. Fluorescence Measurements as Indicator of Adaptation
Strategies in an Abundant Tree Species from Central Amazonian Floodplain Forests. In:
Lieberei R, Bianchi H, Boehm V, Reisdorff C. eds. Neotropical Ecosystems: Proceedings of
the German-Brazilian Workshop, Hamburg Geesthacht: GKSS-Forschungszentrum pp.573-
577
Wang D, Heckathorn SA, Wang X, Philpott SM. 2012. A meta-analysis of plant
physiological and growth responses to temperature and elevated CO2. Oecologia169:1–13.
Wetzel RG,Grace JB, 1983. Aquatic plant communities. In: Lemon ER ed. CO2 and Plants:
The Response of Plants to Rising Levels of Atmospheric Carbon Dioxide. AAAS Selected
Symposium 83, Boulder, Colorado pp. 223–280.
Wheeler TR, Batts G, Ellis R, Hadley P, Morison J, 1996. Growth and yield of winter wheat
(Triticum aestivum) crops in response to CO2 and temperature The Journal of Agricultural
Science 127(01):37-48.
White AJ, Critchley C, 1999. Rapid light curves: a new fluorescence method to assess the
state of the photosynthetic apparatus. Photosynthesis Research 59(1):63-72.
129
SÍNTESE
Os diversos parâmetros ambientais e caracteres biológicos aferidos demostraram a
clara separação das espécies M. linifera e M. arborescens, contradizendo recentes estudos
morfológicos pontuais (Lins, 1994; Lins & Oliveira, 1995; Silva et al. 2012) e corroborando
Mirouze et al. (2012). Entretanto, não foi possível determinar a exata relação entre a
variedade M. arborescens var. aculeata e as outras duas espécies. O alto índice de
diferenciação genética (RST) entre as espécies M. linifera e M. arborescens aliado à
interpretação da rede de haplótipos, permitiu confirmar a separação destas duas espécies, o
que se mostrou compatível com a separação morfológica propiciada pela análise do número
de nervuras apicais secundárias (Mayo, 1987).
Os fatores hidroquímicos parecem influenciar a distribuição das espécies de
Montrichardia em escala regional (Amazônia). Enquanto M. linifera ocorre principalmente
em rios de agua branca (várzeas), M. arborescens ocorre em rios de água preta (igapós) e
riachos de terra-firme. As variações nas características morfológicas intraespecíficas em
resposta à transparência da água e ao pH, juntamente com os valores de Fv/Fm e o nível de
inundação das parcelas, sugerem a ocorrência de plasticidade fenotípica ao nível morfológico
e fisiológico, que permite que as espécies ocupem corpos hídricos com diferentes
características físico-químicas. Além disso, o gradiente longitudinal de fertilidade do solo da
Amazônia Ocidental para a Amazônia Oriental influenciou a densidade de M. arborescens, de
forma similar as padrão descrito para espécies de árvores na Floresta Amazônica (Ter Steege
et al., 2006).
Em uma macro-escala (Neotropical), a precipitação e temperatura foram os fatores que
mais influenciaram a distribuição das espécies. Na Bacia Amazônica estes dois parâmetros
são apontados com os principais fatores que serão alterados devido às mudanças climáticas
decorrentes da elevação da concentração de CO2 na atmosfera (Houghton et al., 2001). A
simulação da elevação de temperatura e CO2 nos microcosmos permitiram inferir os efeitos
das mudanças climáticas sobre M. arborescens. Esta espécie apresentou uma menor
acumulação de biomassa e menor taxa de transporte de elétrons quanto exposta a níveis
extremos de temperatura e CO2. Caso esse resultado seja um padrão para outras macrófitas
aquáticas, ele indica importantes implicações para as áreas alagáveis, não somente
Amazônicas, já que as macrófitas aquáticas possuem uma ampla distribuição em todos os
continentes.
130
REFERËNCIAS BIBLIOGRÁFICAS
Allendorf, F. W.; Luikart, G. 2007. Conservation and the genetics of populations Malden:
Blackwell Publishing.
Barendregt, A.; Bio, A.M.F. 2003. Relevant variables to predict macrophytes communities in
running waters. Ecological Modelling, 160: 205-217.
Bawa, K. 1990. Plant-pollinator interactions in tropical rain forests. Annual Review of
Ecology, Evolution, and Systematics, 21: 399-422.
Bellard, C.; Bertelsmeier, C.; Leadley, P.; Thuiller, W.; Courchamp, F. 2012. Impacts of
climate change on the future of biodiversity. Ecology letters, 15(4), 365-377.
Boeger, M.R.T.; Poulson, M.E. 2003. Morphological adaptations and photosynthetic rates of
amphibious Veronica anagallisaquatica L.(Scrophulariaceae) under different flow
regimes. Aquatic Botany, 75(2): 123-135.
Bradshaw, A. D. 1965. Evolutionary significance of phenotypic plasticity in plants. Advances
in Genetics, 13, 115-155.
Brauner, C. J.; Ballantyne, C. L.; Vijayan, M. M; Val, A. L. 1999. Crude oil affects air‐
breathing frequency, blood phosphate levels and ion regulation in an air‐breathing teleost fish,
Hoplosternum littorale. Comparative Biochemistry and Physiology, 123C, 127‐ 134.
Camargo, A.F.M.; Pezzato, M.M.; Henry-Silva, G.G. 2003. Fatores limitantes à produção
primária. In: Thomaz SM, Bini LM. eds. Ecologia e manejo de macrófitas aquáticas.
Maringá: Eduem pp.59-83.
Cancian, L. F.; Camargo, A. F. M.; Silva, G. G. 2009. Crescimento de Pistia stratiotes em
diferentes condições de temperatura e fotoperíodo. Acta Botanica Brasilica, 23(2):552-557.
Cardoso, L. R.; Martins, D.; Mori, E.S.; Terra, M.A. 2005. Variabilidade genética entre
populações de Pistia stratiotes. Planta Daninha, 23(2):181-185.
Cardoso, L. R.; Martins, D.; Terra, M. A. 2003. Sensibilidade a herbicidas de acessos de
aguapé coletados em reservatórios do Estado de São Paulo. Planta Daninha, 21:61-67.
131
Chambers, P. A.; Lacoul, P.; Murphy, K. J.; Thomaz S. M. 2008. Global diversity of aquatic
macrophytes in freshwater. Hydrobiologia, 595: 9-26.
Cícero, E.A.S.; Pitelli, R.A.; Sena, J.A.D.; Ferraudo, A.S. 2007. Variabilidade genética e
sensibilidade de acessos de Pistia stratiotes ao herbicida glyphosate. Planta daninha, 25(3):
579-587.
Cook, C.D.K. 1985. Range extensions of aquatic vascular plant species. Journal of Aquatic
Plant Management, 23:1-6.
CRIA- Centro de Referencia em Informação Ambiental. Species links. Disponível em:
http://splink.cria.org.br/centralized_search?criaLANG=pt Acesso em: 14 jan. 2014.
Crispo, E.; Moore, J. S.; Lee‐Yaw, J. A.; Gray, S. M.; Haller, B. C. 2011. Broken barriers:
Human‐induced changes to gene flow and introgression in animals. BioEssays, 33(7):508-
518.
Croat, T.B.; Fernández-Concha, G.C.; González, L.I. 2005. Montrichardia arborescens (L.)
Schott (Araceae) newly reported for Mexico. Aroideana, 28: 86–87.
D’Angelo, S. A. 2009. Colonização Vegetal Em Áreas De Sedimentação Recente Na Várzea
Da Amazônia Central. Dissertação de Mestrado, Instituto Nacional de Pesquisas da
Amazônia/ Fundação Universidade do Amazonas, Manaus, Amazonas.
Darwin, C. 1859. The Origin of Species by Means of Natural Selection, 1st edn. John Murray,
London.
De Simone, O.; Müller, E.; Junk, W.J.; Schmidt, W. 2002. Adaptations of Central Amazon
tree species to prolonged flooding: Root morphology and leaf longevity. Functional Plant
Biology, 29: 1025-1035.
Dias-Filho, M.B. 2005. Opções forrageiras para áreas sujeitas a inundação ou alagamento
temporário. In: Pedreira, C.G.S.; Moura, J.C. de; da Silva, S.C.; Faria, V.P. de (Ed..). 22º
Simpósio sobre manejo de pastagem. Teoria e prática da produção animal em pastagens.
Piracicaba: FEALQ, p.71-93.
Dobzhansky, T. 1950. Evolution in the tropics. American Scientist, 38(2):209-221.
132
Eguiarte, L.E., Perez-Nasser, L.; Piñero, D. 1992. Genetic structure, outcrossing rate and
heterosis in Astrocaryum mexicanum (tropical palm): implications for evolution and
conservation. Heredity, 69:217-228.
Esteves, F.A. 1998. Fundamentos de limnologia. Interciência. 2ª ed., Rio de Janeiro, 602p.
Fedorov, A.A. 1966. The structure of the tropical rain forest and speciation in the humid
tropics. Journal of Ecolology. 54:1-11.
Feeley, K. J.; Malhi, Y.; Zelazowski, P.; Silman, M. R. 2012. The relative importance of
deforestation, precipitation change, and temperature sensitivity in determining the future
distributions and diversity of Amazonian plant species. Global Change Biology, 18(8): 2636-
2647.
Frankham, R., Ballou, J. D.; Briscoe, D. A. 2002. Introduction to Conservation Genetics.
Cambridge: Cambridge University Press.
Fuzeto, A.P.; Lomônaco, C. 2000. Potencial plástico de Cabralea canjerana subsp. polytricha
(Adr. Juss.) Penn. (Meliaceae) e seu papel na formação de ecótipos em área de cerrado e
vereda, Uberlândia, MG. Revista Brasileira de Botânica, 23:169-176.
Guichoux, E.; Lagache, L.; Wagner, S.; Léger, P.; Petit, R. J. 2011. Two highly validated
multiplexes (12‐plex and 8‐plex) for species delimitation and parentage analysis in oaks
(Quercus spp.). Molecular Ecology Resources,11(3):578-585.
Guisan, A.; Thuiller, W.; 2005. Predicting species distribution: offering more than simple
habitat models. Ecological letters 8: 993-1009.
Hamrick, J. L. 1982. Plant population genetics and evolution. American Journal of Botany,
1685-1693.
Henry-Silva, G. G.; Camargo, A. F. M. 2005. Interações ecologias entre as macrófitas
aquáticas flutuantes Eichhornia crassipes e Pistia stratiotes. Hoehnea, 32(3), 445-452.
Herendeen, P.; Crepet, W.; Dilcher, D., 1992. The fossil history of the Leguminosae:
Phylogenetic and biogeographic implications. In: Herendeen P, Dilcher, D. (Eds.), Advances
in Legume Systematics, Part 4. The Fossil Record, Kew Publishing, Surrey, UK, pp. 303–
316.
133
Herrera, F. A.; Jaramillo, C. A.; Dilcher, D. L.; Wing, S. L.; Gomez-N. C. 2008. Fossil
Araceae from a Paleocene neotropical rainforest in Colombia. American Journal of Botany,
95:1569–1583.
Hewitt, G. 2000. The genetic legacy of the Quaternary ice ages. Nature, 405(6789), 907-913.
Hoffmann, A. A.; Sgrò, C. M. 2011. Climate change and evolutionary
adaptation. Nature, 470(7335), 479-485.
Hoorn, C. 2006. The birth of the mighty Amazon. Scientific American, 294(5), 52-59.
Hoorn, C.; Wesselingh, F. P.; Ter Steege, H.; Bermudez, M. A.; Mora, A.; Sevink, J. et al.
2010. Amazonia through time: Andean uplift, climate change, landscape evolution, and
biodiversity. Science, 330(6006), 927-931.
Houghton, J.T.; Ding, Y,; Griggs, D.J; Noguer, M.; van der Linden, P.J.; Xiaosu, D. 2001.
Climate Change 2001. The Scientific basis. Cambridge, UK: Cambridge University Press.
Humphries, P. 1996. Aquatic macrophytes, macroinvertebrate associations and water levels in
a lowland Tasmanian river. Hydrobiologia, 321(3), 219-233.
IPCC, 2013: Climate Change 2013: The Physical Science Basis. Contribution of Working
Group I to the Fifth Assessment Report of the Intergovernmental Panel on Climate Change
[Stocker, T. F., D. Qin, G.-K. Plattner, M. Tignor, S. K. Allen, J. Boschung, A. Nauels, Y.
Xia, V. Bex and P. M. Midgley (eds.)]. Cambridge University Press, Cambridge, United
Kingdom and New York, NY, USA.
http://www.climatechange2013.org/images/report/WG1AR5_TS_FINAL.pdf
Junk, W. J. ; Piedade, M. T. F. ; Lourival, R. ; Wittmann, F. ; Kandus, P. ; Lacerda, L. D. et
al. 2014. Brazilian wetlands: their definition, delineation, and classification for research,
sustainable management, and protection. Aquatic Conservation (Print), 24:5-22.
Junk, W. J.; Piedade, M. T. F. 1997. Plant life in the floodplain with special reference to
herbaceous plants. In: Junk, W. J., (Ed.) The Central Amazon floodplain: Ecological Studies
Berlin: Springer, 126:147‐185.
Junk, W. J.; Mello, J. A. S. N. 1990. Impactos ecológicos das represas hidrelétricas na bacia
amazônica brasileira. Estudos avançados, 4(8); 126-143 .
134
Junk, W.J. 1989. Flood tolerance and tree distribution in central Amazonian floodplains. In:
Holm-Nielsen LB, Nielsen IC, Balslev H (Ed.) Tropical Forests: botanical dynamics,
speciation and diversity. Academic Press, London, 47-64.
Junk, W.J. 1997. Structure and function of the large Central Amazonian river-floodplains:
Sythesis and discussion. In: Junk, W. J., (Ed.) The central Amazon Floodplain: Ecology of a
pulsing System. Berlin: Springer, 126:455-472.
Junk, W.J.; Bayley, P.B.; Sparks, R.E. 1989. The flood pulse concept in river-floodplain
systems. In: DOGE, D.P.(Ed.). Proc. Int. Large River Symp (LARS) – Can. Spec. Publ. Fish.
Aquat. Sci., 106:110-127.
Junk, W.J.; Piedade, M. T.F.; Schöngart, J; Cohn-Haft, M.; Adeney, J. M.; Wittmann, F. 2011
A Classification of Major Naturally-Occurring Amazonian Lowland Wetlands. Wetlands,
31:623-640
Kasuga, M.; Liu, Q.; Miura, S.; Yamaguchi-Shinozaki, K.; Shinozaki, K. 1999. Improving
plant drought, salt, and freezing tolerance by gene transfer of a single stress-inducible
transcription factor. Nature biotechnology, 17(3), 287-291.
Kozlowski, T.T. 1997. Responses of woody plants to flooding and salinity. Tree Physiology
Monograph, 1: 1-29.
Larcher, W. 2000. Ecofisiologia Vegetal, São Carlos: Rima, 531pp.
Lins, A.L. 1994. Aspectos morfológicos e anatômicos de raízes do gênero Montrichardia
Crueg (Araceae). M.Sc. dissertation, Universidade Federal do Rio Grande do Sul. 93 pp.
Porto Alegre.
Lins, A.L.F.A.; Oliveira, P.L. 1994. Origem, aspectos morfologicos e anatomicos das raizes
embrionarias de Mon- trichardia linifera (Arruda) Schott (Araceae). Boletim do Museu
Paraense Emílio Goeldi, Série Botânica; 10: 221–236.
Lopes, A.; Piedade, M.T.F. 2012. Distribuição, biomassa e variação morfológica entre
populações do gênero Montrichardia Crueg (Araceae) na Bacia Amazônica. In: I Congresso
Brasileiro de Áreas Úmidas, Cuiabá: Anais do I Congresso Brasileiro de Áreas Úmidas.
135
Lopes, A.; Rosa-Osman, SM.; Piedade, MTF. 2009. Effects of crude oil on survival,
morphology, and anatomy of two aquatic macrophytes from the Amazon floodplains.
Hydrobiologia, 639(1); 295-305.
Lortie, C.J.; Aarssen, L.W. 1996. The specialization hypothesis for phenotypic plasticity in
plants. International Journal of Plant Science, 157:484-487.
Lytle, D. A.; Poff, N. L. 2004. Adaptation to natural flow regimes. Trends in Ecology and
evolution, 16(2): 94-100.
Madsen, T.V.; Hahn, P.; Johansen, J. 1998. Effect of inorganic carbon supply on the nitrogen
requirement of two submerged macrophytes, Elodea Canadensis and Callitriche cophocarpa.
Aquatic Botany, 62: 95-106.
Martins, D.; Cardoso, L.R.; Mori, E.S.; Tanaka, R.H.. 2003. Caracterização genética de
acessos de egéria (Egeria spp.) coletados no Estado de São Paulo. Planta Daninha, 21: 1-6.
Matesanz, S.; Horgan-Kobelski, T.; Sultan, S. E. 2012. Phenotypic plasticity and population
differentiation in an ongoing species invasion. PloS one, 7(9), e44955.
Mayo, S.J.; J. Bogner, Boyce, P.C. 1997 . The genera of Araceae. Royal Botanic Gardens,
Kew, UK.
Meffe, G. K.; Carroll, C. R. 1997. Principles of Conservation Biology. Sunderland: Sinauer.
Melack, J.; Forsberg, G. B. R. 2001. Biogeochemistry of Amazon floodplain lakes, p 235-
276. In: Mcclain, .M. E.; Victoria, R.; Richey, J. E. (eds.). The Biogeochemistry of the
Amazon Basin and its Role in a Changing World. Oxford University Press, New York.
Mirouze, E.; Staquet, A.; Vezy, R. 2012. Morphometric and morphological analyses of leaves
in two species of Araceae : Montrichardia linifera and Montrichardia arborescens among
different French Guiana populations, Journal of Ecofog, 3:1–15.
Murphy, K.J. 2002. Plant communities and plant diversity in softwater lakes if northern
Europe. Aquatic Botany, 73:287-324.
Nanson, A. 1993. Gestion des ressources génétiques forestières. Annales de Gembloux, 99:13-
36.
136
Neiff, J.J.; Poi de Neiff, A.S.G. 2003. Connectivity processes as a basis for the management
of aquatic plants. In: Thomaz, S.; Bini, L.M. Ecologia e Manejo de Macrófitas Aquáticas..
Nupélia - Maringá (SC). Eduem, Maringá, 39-58.
Nogueira, F.; Couto, E.G. 2004. Amostragem em planícies de inundação. In: C.E. de M.
Bicudo & D. de C. Bicudo (Ed..). Amostragem em Limnologia. São Carlos, RIMA, 281-293.
Parolin, P. 2001. Morphological and physiological adjustments to waterlogging and drought
in seedlings of Amazonian floodplain trees. Oecologia, 128: 326-335.
Pauls, S. U.; Nowak, C.; Bálint, M.; Pfenninger, M. 2013. The impact of global climate
change on genetic diversity within populations and species.Molecular Ecology, 22(4), 925-
946.
Piedade, M.F.F.; Junk, W. J.; Long, S.P. 1991. The productivity of the C4 grass Echinochloa
polystachya on the Amazon floodplain. Ecology, 72:1456–1463.
Piedade, M.T.F.; Junk, W.; D'Ângelo, S.A.; Wittmann, F.; Schöngart, J.;Barbosa, K.M.D.N.;
Lopes, A. 2010. Aquatic herbaceous plants of the Amazon floodplains: state of the art and
research needed. Acta Limnologica Brasiliensia, 22(2), 165-178.
Piedade, M.T.F.; Schöngart, J.; Wittmann, F.; Parolin, P.; Junk, W. 2013. Impactos da
inundação e seca na vegetação de áreas alagáveis amazônicas. In: Borma, L.S.; Nobre, C..
(Org.). Secas na Amazônia: causas e consequências. 1ed.São Paulo: Oficina de Textos, p.
268-305
Piedade, M.T.F.; Worbes, M.; Junk, W.J. 2001. Geo-ecological controls on elemental fluxes
in communities of higher plants in Amazonian floodplains. In: McClain, M.E., Victoria, R.L.,
and Richey, J.E. (Ed.) The Biogeochemistry of the Amazon Basin. Oxford University Press. p.
209-234.
Pimenta, J.A.; Bianchini, E.; Medri, M.F. 1998. Adaptações to flooding by tropical trees:
morphological and anatomical modifications. In: F.R. Scarano & A.C. Franco (Ed..).
Ecophysiological strategies of xerophytic and amphibious plants in the Neotropics. Série
Oecologia Brasiliensis, 4:154-176.
137
Reed, T. E.; Schindler, D. E.; Waples, R. S. 2011. Interacting effects of phenotypic plasticity
and evolution on population persistence in a changing climate. Conservation Biology, 25(1),
56-63.
Riis, T; Sand-Jensen, K.; Vestergaard, O. 2000. Plant communities in lowland Danish
streams: species composition and environmental factors. Aquatic Botany. 66: 255-172.
Rodella, R.A.; Costa, N.V.; Costa, L.D.N.C.; Martins, D.. 2006. Diferenciação entre Egeria
densa e Egeria najas pelos caracteres anatômicos foliares. Planta daninha 24(2): 211-220 .
Santamaría, L., 2002. Why are most aquatic plants widely distributed? Dispersal, clonal
growth and small-scale heterogeneity in a stressful environment. Acta Oecologica, 23: 137–
154.
Scheiner, S. M. 1993. Genetics and evolution of phenotypic plasticity. Annual Review of
Ecology and Systematics, 24: 35–68.
Scheiner, S.M.; Callahan, H.S. 1999. Measuring natural selection on phenotypic plasticity.
Evolution,53:1704-1713.
Schlichting, C. D. 1986. The Evolution of Phenotypic Plasticity in Plants. Annual Review of
Ecology and Systematics, 17: 667-693.
Schlichting, C.D.; Pigliucci, M. 1993. Control of phenotypic plasticity via regulatory genes.
The American Naturalist, 142:367-371.
Sculthorpe, C. D. 1967. The biology of aquatic vascular plants. London: Belhaven Press.
Silva M.F.S.; De Andrade I.M.; Mayo S.J. 2012. Geometric morphometrics of leaf blade
shape in Montrichardia linifera (Araceae) populations from the Rio Parnaíba Delta, north-east
Brazil. Botanical Journal of the Linnean Society, 170: 554 – 572.
Silvertown, J.W.J.; Doust, L. 1993 Introduction to plant population biology. Blackwell
Scientific, Oxford, UK.
Simpson, D. A. 1988. Phenotypic plasticity of Elodea nuttallii (Planch.) H. St John and
Elodea canadensis Michx in the British Isles. Watsonia, 17(2), 121-132.
Sioli, H. 1954. Betrachtungen über den Begriff der “Fruchtbarkeit” eines Gebietes anhand der
Verhältnisse in Böden und Gewässern Amazoniens. Forsch. Fortscin. Berlin 28(3):65–72.
138
Slatkin, M. 1987. Gene flow and the geographic structure of natural
populations. Science, 236(4803), 787-792.
Stearns, A.D. 1989. The evolutionary significance of phenotypic plasticity. Bioscence,
39:436-445.
Sultan, S. E. 2000. Phenotypic plasticity for plant development, function and life
history. Trends in plant science, 5(12), 537-542.
Taiz, L; Zeiger, E. 2004. Fisiologia Vegetal, 3ª ed. Artmed. Porto Alegre. 719p.
Templeton, A. R.; Robertson, R. J.; Brisson, J.; Strasburg, J. 2001. Disrupting evolutionary
processes: the effect of habitat fragmentation on collared lizards in the Missouri Ozarks.
Proceedings of the National Academy of Sciences, 98:5426‐5432.
Thibert‐Plante, X.; Hendry, A. P. 2011. The consequences of phenotypic plasticity for
ecological speciation. Journal of Evolutionary Biology, 24(2), 326-342.
Thomaz, S. M.; Bini, L. M.; Pagioro, T. A. 2003. Macrófitas Aquáticas Em Itaipu: Ecologia E
Perspectivas Para O Manejo. In: Thomaz, S.M.; Bini, L.M. (Org.). Ecologia E Manejo De
Macrófitas Aquáticas. EDUEM Maringá, 319-341.
Thomaz, S. M.; Esteves, F. A. 1986. Valores energéticos da biomassa de algumas espécies de
macrófitas aquáticas tropicais. Ciência e Cultura, 38(10): 1691 - 1695
Thomaz, S.M.; Bini, L.M. 2003. Ecologia e Manejo de Macrófitas Aquáticas. Eduem,
Maringá.
Thompson, J.D. 1991. Phenotypic plasticity as a component of evolutionary change. Trends
in Ecology and Evolution, 6:246-249.
Val, A. L.; Almeida‐Val, V. M. F. 2004. Crude oil, copper and fish of the Amazon. In:
Sloman, K. A., Wood, C. M. & Mac Kinlay, D., (Ed.) Behavior, Physiology and Toxicology
Interactions in Fish. VI International Congress on the Biology of Fish. Manaus, AM:
American Fisheries Society, 1‐6.
Via, S. 1993. Adaptive phenotypic plasticity: target or byproduct of selection in a variable
environment. The American Naturalist, 142:352-365.
139
Via, S.; Gomulkiewicz, R.; Dejong, G.; Scheiner, S.M.; Schlichting, C.D.; Van Tienderen,
P.H. 1995. Adaptive phenotypic plasticity: consensus and controversy. Trends in Ecology and
Evolution, 19:212-217.
Via, S.; Lande, R. 1985. Genotype-environment interaction and the evolution of phenotypic
plasticity. Evolution, 39: 505–523.
Wang, Q.; YU, Q.‐S.,; LIU, J.‐Q. 2011. Are nuclear loci ideal for barcoding plants? A case
study of genetic delimitation of two sister species using multiple loci and multiple
intraspecific individuals. Journal of Systematics and Evolution, 49.3: 182-188.
Wang, W.; Vinocur, B.; Altman, A. 2003. Plant responses to drought, salinity and extreme
temperatures: towards genetic engineering for stress tolerance. Planta, 218(1), 1-14.
Woodward, F.I. 1988. Temperature and the distribution of plant species. In: Long, S.P.,
Woodward, F.I. (Ed.) Plants and Temperature. The Company of Biologists Ltd. University of
Cambridge, Cambridge, 59–75.
Woodward, F.I.; Williams, B.G. 1987. Climate and plant distribution at global and local
scales. Vegetatio, 69:189-197.
Wright, S. 1932. The roles of mutation, inbreeding, cross-breeding, and selection in evolution.
Proceedings of the 6th
International Congress of Genetics, 1:356-366.
Wright, S. 1969. Evolution and the genetics of populations. v.2. The theory of gene
frequencies. The University of ChicagoPress, Chicago.
Zhang, J.; Nielsen, R.; Yang, Z. 2005. Evaluation of an improved branch-site likelihood
method for detecting positive selection at the molecular level. Molecular Biology and
Evolution, 22:2472–2479.

140
ANEXOS
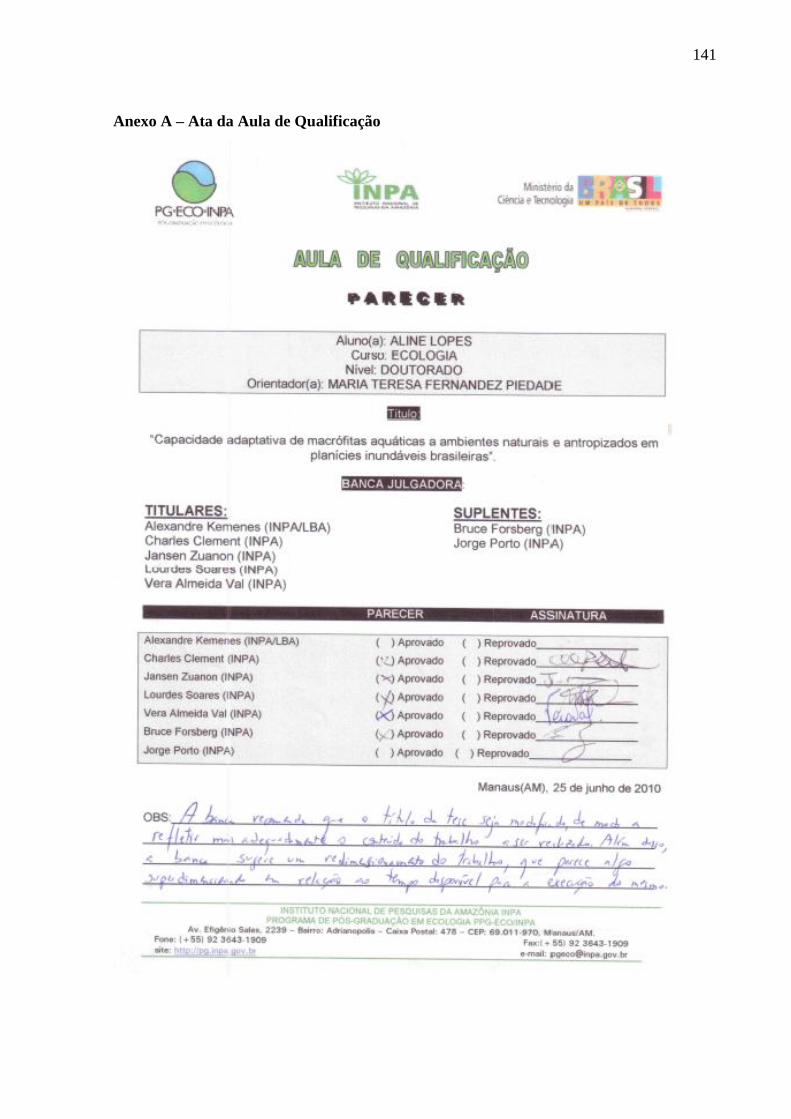
141
Anexo A – Ata da Aula de Qualificação
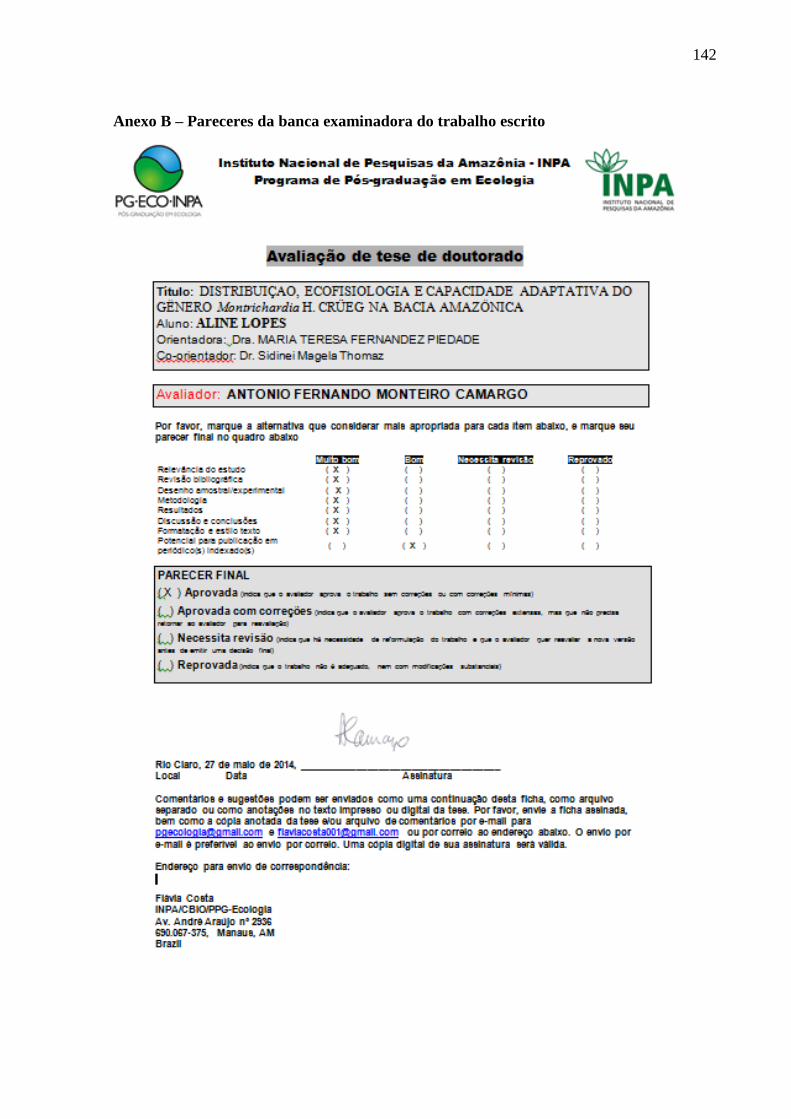
142
Anexo B – Pareceres da banca examinadora do trabalho escrito
143
144
145
146
147
148
149
Anexo C – Ata da defesa pública da tese