impacto do dimensionamento de sistemas de...
TRANSCRIPT

UNIVERSIDADE ESTADUAL DE CAMPINAS
Faculdade de Engenharia Civil, Arquitetura e Urbanismo
TALITA ANDRIOLI MEDINILHA DE CARVALHO
IMPACTO DO DIMENSIONAMENTO DE SISTEMAS DE ABERTURAS NO
DESEMPENHO TÉRMICO DE EDIFICIOS NATURALMENTE VENTILADOS
PELA AÇÃO DOS VENTOS
THE IMPACT OF WINDOW SYSTEMS DIMENSIONING ON THERMAL
PERFORMANCE OF A WIND DRIVEN VENTILATED BUILDING
CAMPINAS
2017

TALITA ANDRIOLI MEDINILHA DE CARVALHO
IMPACTO DO DIMENSIONAMENTO DE SISTEMAS DE ABERTURAS NO
DESEMPENHO TÉRMICO DE EDIFICIOS NATURALMENTE VENTILADOS PELA
AÇÃO DOS VENTOS
THE IMPACT OF WINDOW SYSTEMS DIMENSIONING ON THERMAL
PERFORMANCE OF A WIND DRIVEN VENTILATED BUILDING
Dissertação de Mestrado apresentada a Faculdade de Engenharia
Civil, Arquitetura e Urbanismo da Unicamp, para obtenção do título
de Mestra em Arquitetura, Tecnologia e Cidade, na área de
concentração de Arquitetura, Tecnologia e Cidade.
Dissertation presented to the Faculty of Civil Engineering,
Architecture, and Urbanism of the University of Campinas in partial
fulfilment of the requirements for the degree of Master in
Architecture, Technology, and Cities, in the area of Architecture,
Technology, and Cities.
Orientadora: Profa. Dra. Lucila Chebel Labaki
ESTE EXEMPLAR CORRESPONDE À VERSÃO FINAL DA DISSERTAÇÃO DEFENDIDA PELA
ALUNA TALITA ANDRIOLI MEDINILHA DE CARVALHO E ORIENTADA PELA PROFA. DRA.
LUCILA CHEBEL LABAKI.
ASSINATURA DA ORIENTADORA
______________________________________
CAMPINAS
2017


UNIVERSIDADE ESTADUAL DE CAMPINAS
FACULDADE DE ENGENHARIA CIVIL, ARQUITETURA E URBANISMO
IMPACTO DO DIMENSIONAMENTO DE SISTEMAS DE ABERTURAS NO DESEMPENHO
TÉRMICO DE EDIFICIOS NATURALMENTE VENTILADOS PELA AÇÃO DOS VENTOS
Talita Andrioli Medinilha de Carvalho
Dissertação de Mestrado aprovada pela Banca Examinadora, constituída por:
Profa. Dra. Lucila Chebel Labaki
Presidente e Orientadora/FEC‐Unicamp
Prof. Dr. Alexandre Márcio Toledo
UFAL
Prof. Dr. Leonardo Marques Monteiro
USP
A Ata da defesa com as respectivas assinaturas dos membros encontra‐se
no processo de vida acadêmica do aluno.
Campinas, 07 de fevereiro de 2017

Dedico este trabalho aos meus pais, Dimas e Edite, que foram
um exemplo de respeito e amor pela natureza, economizando e
reaproveitando recursos sempre que podiam.
AGRADECIMENTOS
Agradeço a minha orientadora, Profa. Dra. Lucila Chebel Labaki, pela sua calma inspiradora
e por acreditar no meu potencial. Por ter sido um exemplo de que é possível conciliar uma vida
acadêmica com a dedicação à família.
Aos meus colegas do laboratório Lacaf por sua ajuda quando o desenvolvimento deste
trabalho parecia impossível e pelas risadas que tornaram estes momentos mais leves. Ao Prof. Dr. Paulo
Vatavuk que colaborou para o meu aprendizado do programa Ansys CFX. A Profa. Dra. Leticia de Oliveira
Neves por seus conselhos que mudaram o curso do trabalho ganhando em qualidade.
Agradeço aos meus pais, Dimas Luccas Medinilha e Edite Andrioli Medinilha, e ao meu
esposo, Álvaro de Carvalho Neto, que sempre acreditaram em mim, quando nem mesmo eu acreditava.
Aos meus primos Raoni Medinilha e Giuliano Alves da Cruz pelas correções dos meus textos em inglês.
E a toda minha família e amigos pelo suporte mesmo com a minha ausência.
Agradeço à CAPES pela bolsa de mestrado, que permitiu a minha dedicação exclusiva a esta
pesquisa.

RESUMO
A ventilação natural é uma estratégia passiva de resfriamento que pode contribuir para a redução do consumo energético em edifícios, mas sua aplicação requer conhecimento especializado e simulações demoradas. Para viabilizar o uso da ventilação natural aos projetistas são necessárias diretrizes simplificadas e confiáveis. Entretanto, as normas atuais sobre ventilação natural precisam de maior aprofundamento, pois elas apenas regulam o número de trocas de ar ou porcentagens de área de janelas, sem considerar outros parâmetros importantes. Neste sentido, o objetivo desta pesquisa foi investigar o impacto do dimensionamento de sistemas de aberturas no desempenho térmico de ambientes residenciais e ventilados pela ação dos ventos. O estudo se dividiu em três fases. Primeiro foi verificada a influência de diversos parâmetros geométricos de dimensionamento de sistemas de abertura na ventilação de um cômodo. O estudo foi realizado por simulação CFD (Dinâmica de Fluidos Computacional) através do software CFX ANSYS 16.2, que permitiu avaliar a velocidade e fluxo do ar. Na segunda fase foi investigado o efeito da obstrução do entorno e diferentes ângulos de incidência do vento no fluxo de ar. O objeto deste estudo foi um prédio residencial no formato de duplo “H” localizado em Piracicaba, SP. Também foi adotada a simulação em CFX ANSYS 16.2 para obtenção dos dados, simulando diferentes obstruções do entorno e variando os ângulos de incidência do vento. Então, dando continuidade a este experimento (fase três), foi verificada a influência de diversas configurações de sistemas de abertura no desempenho térmico do mesmo edifício. Desta vez foram simuladas várias configurações utilizando os softwares CFX ANSYS 16.2 e Energy Plus. O índice graus dia de conforto adaptativo foi adotado como indicador de desempenho térmico nesta fase. Os resultados da primeira fase indicam que a área de abertura não é o único parâmetro relevante para o dimensionamento de sistemas de ventilação pela ação dos ventos. Já na segunda fase ficou claro que o nível do pavimento onde a janela se encontra influencia a velocidade de entrada do ar. Também se observou que as obstruções do entorno têm maior influência no fluxo de ar do pavimento térreo. Por fim, o formato em “duplo H”, não provê boa ventilação em todos os apartamentos. Então, na terceira fase, foi identificado que em prédios baixos é importante considerar a posição da janela em planta, a altura acima do solo, a obstrução do entorno e a orientação da abertura. Pesquisas futuras poderiam seguir o mesmo procedimento para estender os resultados para outras regiões bioclimáticas e formatos de prédios. Por fim, o trabalho estimula a qualidade do ambiente construído por aprofundar os conhecimentos sobre o dimensionamento de aberturas visando boa ventilação natural, e assim contribui com a diminuição dos gastos energéticos para condicionamento artificial dos ambientes.
Palavras‐chave: Janela, Ventilação natural, Conforto térmico, Fluidodinâmica computacional (CFD), Simulação computacional.

ABSTRACT
Wind driven ventilation is a passive cooling strategy that can be a powerful ally to reduce energy consumption in buildings, but it requires specialized knowledge and time investment. In order to make it more available to designers reliable and simplified guidelines are necessary. However, current ventilation standards require further developments since they only regulate minimal air change rate or percentages of window area, without considering other important parameters. In this regard, the purpose of this research is to investigate the impact of window systems dimensioning on thermal performance of a wind driven ventilated buildings. The study was divided into three steps. First, we investigated the influence of various geometric parameters of window systems dimensioning at the ventilation of a room. The simulations for the study occurred in CFD (Computational Fluid Dynamics), with the CFX ANSYS 16.2 software, and allowed to evaluate the airflow and wind speed. The second step intended to evaluate the effect of surroundings obstruction at different wind attack angle on the airflow. The object of this study is a residential building configured as a "double H" located in Piracicaba, São Paulo State (Brazil). The adopted method was using simulations in ANSYS CFX. Then, continuing this experiment (step three), it was verified the influence of different configurations of window systems on the thermal performance of the same building. In this experiment, several configurations were simulated with the software Energy Plus coupled with CFD (ANSYS CFX). The index Adaptive Comfort Degree‐Days was adopted as a thermal performance indicator for this step. The results of the first step indicate that the opening area is not the only parameter to be considered to achieve proper natural ventilation; others criteria such as placement of the window on the façade, its proportion and orientation were also influential. The second step shows that the floor level influences the air velocity. It was also observed that the surroundings obstructions have greater influence on airflow at the ground floor. The shape of the studied building does not provide good ventilation in all apartments. Finally, at the third step, It was verified the best windows sizes for each situation. It was shown that proper window dimensions depend on the window location, building orientation and the presence of obstruction. The work provides simplified guidance to the windows design, thus, it stimulates the quality of the built environment and contributes to decreasing energy expenses with artificial conditioning.
Keywords: Window, Natural ventilation, Thermal comfort, Computational fluid dynamics (CFD), Computer simulation.
SUMÁRIO
1 INTRODUÇÃO .............................................................................................................................................. 11
2 ESTADO DA ARTE ........................................................................................................................................ 14
2.1 O PAPEL DA VENTILAÇÃO PELA AÇÃO DOS VENTOS ....................................................................... 14
2.2 DIRETRIZES PARA A VENTILAÇÃO PELA AÇÃO DOS VENTOS NO AMBIENTE EDIFICADO ................ 17
2.2.1 Métodos para o dimensionamento de aberturas para ambientes ventilados pela
ação dos ventos ..................................................................................................................... 17
2.2.2 Normas NBR 15575 e NBR 15220‐3. ..................................................................................... 25
2.2.3 Programas de etiquetagem, Procel e Casa Azul .................................................................... 26
2.3 MÉTODOS PARA QUANTIFICAÇÃO DA VENTILAÇÃO PELA AÇÃO DOS VENTOS .............................. 29
2.4 INDICADORES DE CONFORTO TÉRMICO .......................................................................................... 32
2.4.1 Voto Médio Estimado (VME) ................................................................................................. 32
2.4.2 Método Adaptativo ................................................................................................................ 33
2.4.3 Graus dia de conforto adaptativo .......................................................................................... 34
2.4.4 Movimento mínimo do ar ...................................................................................................... 35
3 METODOLOGIA GERAL DA PESQUISA ......................................................................................................... 36
3.1 Etapas da pesquisa ........................................................................................................................... 36
3.2 Clima de Piracicaba ........................................................................................................................... 38
4 RESULTADOS ............................................................................................................................................... 42
4.1 THE INFLUENCE OF SEVERAL GEOMETRIC PARAMETERS OF WINDOW SYSTEMS DESIGN
IN THE NATURAL VENTILATION OF A SMALL ROOM ....................................................................... 43
4.1.1 Method ................................................................................................................................... 45
4.1.2 Results and discussion ........................................................................................................... 49
4.1.3 Conclusion .............................................................................................................................. 58
4.2 THE INFLUENCE OF SURROUNDINGS OBSTRUCTION ON THE AIRFLOW OF A RESIDENTIAL
BUILDING .......................................................................................................................................... 60
4.2.1 Method ................................................................................................................................... 61
4.2.2 Results and discussion ........................................................................................................... 64
4.2.3 Conclusion .............................................................................................................................. 73
4.3 BEST WINDOWS SIZES FOR DIFFERENT SURROUNDING OBSTRUCTION AND ORIENTATION
IN A WIND DRIVEN VENTILATED BUILDING BASED ON THERMAL PERFORMANCE ........................ 74
4.3.1 Method ................................................................................................................................... 75

4.3.2 Results and discussion ........................................................................................................... 82
4.3.3 Conclusion .............................................................................................................................. 90
5 CONCLUSÃO FINAL ...................................................................................................................................... 92
REFERÊNCIAS ......................................................................................................................................................... 94
APÊNDICE I. CFX ANSYS 16.2–PHYSICS ....................................................................................................... 103
APÊNDICE II. CFX ANSYS 16.2– BOUDARY LIMIT LAYER, CCL EXPRESION. .................................................. 104
APÊNDICE III. OPERATIVE TEMPERATURE OF EXPERIMENT 4.3 .................................................................. 106

11
1 INTRODUÇÃO
No contexto mundial, especialmente em países desenvolvidos, a demanda
energética tem crescido devido ao estilo de vida atual e a maior intolerância ao desconforto
térmico (LAMBERTS et al., 2008). No período de 1970 a 2013 o Brasil registrou um aumento
de 56,68% no consumo de energia (BEN, 2016). Em 2015, 48,53% da energia produzida no
Brasil foi gasta nos espaços construídos, o que demonstra que o potencial de economia do
setor é alto (BEN, 2016). Neste sentido, Lamberts et al (2008) explicam que o projeto e
método construtivo das edificações podem afetar diretamente o consumo de energia e
recursos naturais, bem como o conforto térmico, portanto é necessário maior atenção a
estes pontos. Dessa maneira, fica clara a necessidade de considerar em projeto estratégias
passivas que levem em conta o clima onde a construção será implantada.
A Carta Bioclimática (GIVONI, 1992), um conhecido instrumento de conforto
térmico que traça alguma destas estratégias, foi utilizado na elaboração do zoneamento
bioclimático brasileiro ‐ divisão do Brasil em 8 zonas climáticas, reunindo cidades com
aspectos climáticos semelhantes (ABNT, 2005). Este aponta para a ventilação natural como
principal estratégia para o conforto térmico no país e é também muito utilizada para o
resfriamento térmico em outros climas tropicais (AFLAKI et al., 2015).
A ventilação natural pode contribuir para a redução dos gastos com energia em
climas quentes (PEREIRA et al., 2013), mas para garantir a eficiência da estratégia é
importante considerar métodos para minimizar o ganho de calor já na fase de projeto
(AFLAKI et al., 2015). Alguns exemplos citados pelos autores são: o sombreamento das
aberturas, a correta orientação e forma do edifício, o tamanho das aberturas e o uso da
vegetação.
A ventilação contribui para a renovação do ar com propósitos higiênicos, o
conforto térmico e a diminuição da temperatura das superfícies das paredes e objetos
(RIVERO, 1986). Além disso, pode induzir a uma sensação agradável (OHBA; TSUKAMOTO;
LUN, 2013) que aumenta a tolerância ao desconforto térmico por calor (DEAR; BRAGER,
2002).

12
No entanto, apesar dos requisitos mínimos para o conforto térmico no Brasil
terem sido revistos com a norma NBR 15575 (ABNT, 2013a, b, c), as normas de ventilação
natural no mundo não avançaram. Elas ainda abordam apenas o aspecto higiênico,
propondo um valor mínimo de troca de ar (ASHRAE, 2004; CÂNDIDO; DEAR; LAMBERTS,
2011), ou uma área mínima de aberturas (ABNT, 2013b).
Ambos os critérios atendem as necessidades de renovação do ar, mas pesquisas
indicam que para satisfazer às necessidades de conforto térmico outros fatores devem ser
considerados, como a topografia do entorno, direção e intensidade dos ventos, carga
térmica, proporção e forma do edifícios, orientação, disposição e forma das aberturas
(CÓSTOLA, 2006; LAMBERTS; DUTRA; PEREIRA, 2014; TOLEDO, 2006).
Sendo assim, faltam diretrizes simplificadas para aplicar a ventilação natural
como estratégia passiva de resfriamento. Como consequência, a maioria dos arquitetos não
tem condições de desenvolver um projeto eficiente no ponto de vista do conforto térmico.
Para dimensionar as aberturas corretamente se faz necessário consultar especialistas, o que
acarretaria em impacto de tempo e custo (CÓSTOLA, 2006), recursos muitas vezes
indisponíveis aos construtores no Brasil.
Esta falta de informação pode representar um alto custo ambiental
considerando o clima brasileiro e o número de casas que vem sendo construídas a cada ano.
No ano de 2010 o censo (IBGE, 2011) divulgou que o número de domicílios no brasil cresceu
22%, atingindo o número de 57 314 048. Assim é necessário investir em tecnologias passivas
de baixo custo para tornar este crescimento sustentável à economia e ao ambiente.
Nesta perspectiva, o objetivo geral desta pesquisa é investigar o impacto do
dimensionamento de sistemas de aberturas no desempenho térmico de ambientes
residenciais e ventilados pela ação dos ventos. Os objetivos específicos são:
Verificar a influência de diversos parâmetros geométricos de
dimensionamento de sistemas de abertura na ventilação de um cômodo.
Avaliar o efeito da obstrução do entorno na ventilação pela ação dos
ventos em um prédio de quatro pavimentos.
Verificar a influência de diversas configurações de sistemas de abertura
no desempenho térmico deste edifício.

13
Não é objeto desta pesquisa avaliar a influência do efeito chaminé ou da
ventilação mecânica nos estudos de caso. Também não são considerados diferentes valores
de coeficientes de descarga das aberturas por falta de base de dados sobre o assunto. Além
disso, não foi abordado o uso de dispositivos de sombreamentos de aberturas. Estes são
aspectos de grande importância para o assunto e devem ser estudados em pesquisas
futuras.
O trabalho está estruturado em cinco capítulos: o primeiro referente à presente
introdução; a seguir, no capítulo dois, são apresentados os principais trabalhos e normas
sobre ventilação natural em edifícios no Brasil, assim como as variáveis pertinentes ao tema;
ainda neste capítulo são expostos métodos para quantificação da ventilação pela ação dos
ventos, e os indicadores de conforto térmico mais relevantes.
No capítulo três são descritos os métodos adotados na pesquisa; o capítulo
quatro apresenta os resultados da pesquisa na forma de artigo em língua inglesa. Por fim, o
capítulo cinco expõe a conclusão do trabalho.

14
2 ESTADO DA ARTE
Este capítulo trata da função da ventilação em edifícios, assim como as principais
pesquisas que abordaram o dimensionamento de aberturas com enfoque no conforto
térmico. Também são apresentados os principais selos de eficiência energética e normas
brasileiras e que fornecem diretrizes para o projeto de sistemas de ventilação. Por fim, são
abordados os diversos métodos para a quantificação da ventilação pela ação dos ventos
usando simulação computacional e os principais indicadores de conforto térmico.
2.1 O PAPEL DA VENTILAÇÃO PELA AÇÃO DOS VENTOS
A ventilação se dá por ação de vários fatores climáticos, como “a distribuição
global sazonal da pressão do ar, a rotação da terra, a variação diária no aquecimento e
resfriamento do solo, mar e da topografia”(GIVONI, 1992).
Este fenômeno tem grande importância para os ambientes internos, tendo três
funções: a renovação do ar por motivos higiênicos, o conforto térmico e a diminuição da
temperatura superficial das paredes e objetos (RIVERO, 1986). Apesar disso, os códigos de
obras e normas de construção apenas contemplam a função higiênica, deixando de lado a
contribuição da ventilação para o conforto térmico(CÓSTOLA, 2006).
Pesquisas nacionais e internacionais tem demonstrado que habitações de
interesse social tem deficiências em vários aspectos, sendo um deles o conforto térmico
(LABAKI; KOWALTOWSKI, 1998; SANTAMOURIS et al., 2007). No Brasil, Labaki e Kowaltowski
(1998) conduziram estudos em assentamentos de casas e concluíram que a arquitetura
vernacular de Campinas não é adequada ao clima, mas pequenas modificações de projeto
poderiam contribuir para uma melhora nas condições de conforto térmico das mesmas.
Dando continuidade a esses estudos, Oliveira (2009) realizou pesquisa na mesma cidade
investigando os efeitos de reformas de casas autoconstruídas para a ventilação de um
quarteirão; para isso usou como ferramenta a simulação computacional em CFD
(Computational Fluid Dynamics, software Phoenics) e deste modo pôde identificar que, na
maior parte dos casos, as consequências destas reformas foram negativas, mostrando que

15
o aumento da área construída sem critérios causa alteração na direção dos ventos e redução
de até 2,5m/s na sua velocidade.
Na sequência, Labaki et al. (2011) avaliaram os impactos de reformas em
habitações autoconstruídas para a ventilação natural do seu interior, efetuando simulações
em túnel de vento com quatro modelos selecionados a partir dos dados de Oliveira (2009).
Com isso, foi observado que adendos à construção que resultam em alto percentual de
ocupação do lote não promovem ventilação adequada para fins de conforto e qualidade do
ar.
Ainda investigando ambientes residenciais de interesse social, Morais e Labaki
(2013b) estudaram a ventilação natural em três tipologias de edifícios multifamiliares do
programa governamental Minha Casa Minha Vida localizados em Campinas, e constataram
que, embora muitos não alcancem a ventilação natural desejada, poucas modificações
bastariam para melhorar este quadro, como por exemplo: orientação correta da
implantação, posicionamento das aberturas, o aumento das reentrâncias na fachada e a
assimetria na forma.
As experiências citadas acima demonstraram que um maior preparo técnico e
critérios mais apurados para o dimensionamento de sistemas de aberturas poderiam levar
a uma arquitetura de melhor desempenho térmico, menor impacto de vizinhança e sem
aumentos significativos de custos. Para tanto, é necessário levar em conta os fatores que
influenciam a ventilação no interior dos edifícios, como: a topografia do entorno, direção e
intensidade dos ventos, a carga térmica, a proporção e forma do edifício e das aberturas, a
orientação, disposição, tipo e área das aberturas (CÓSTOLA, 2006; LAMBERTS; DUTRA;
PEREIRA, 2014; TOLEDO, 2006).
Terrenos na cidade e em descampados tem diferentes rugosidades devido às
diferenças de densidade das construções e, portanto, diferentes intensidades de ventilação.
Devido ao crescimento acelerado das cidades, o impacto da topografia do entorno na
ventilação tem sido alvo de atenção nos últimos anos. Vem se investigando o impacto da
alta densidade das edificações no meio urbano (BUCCOLIERI, 2011; NG et al., 2011; YUAN;
NG, 2012), assim como procedimentos para avaliar ou assessorar o desempenho dos ventos

16
neste cenário (ALLARD; GHIAUS, 2005; KUANG; CHEN; SUN, 2015; MIRZAEI; HAGHIGHAT,
2012).
Como citado anteriormente na pesquisa de Oliveira (2009), a densidade das
construções do entorno pode mudar a direção e intensidade dos ventos, afetando
diretamente a vazão da ventilação no interior dos edifícios. Uma mudança de 5º na
incidência do vento pode alterar a vazão de 5% a 40% (CÓSTOLA, 2006). Outro fator que
modifica a ventilação são as estações do ano, ocorrência tão relevante que pode servir para
prever a direção predominante do movimento do ar em certas regiões, como é o caso de
Maceió (TOLEDO, 2006); contudo a sazonalidade dos ventos não deve ser encarada como
regra, pois em outros locais, como São Paulo, o ângulo de incidência é mais disperso
(CÓSTOLA, 2006).
Além disso, as características das aberturas têm um papel importante no
desempenho da ventilação no interior dos edifícios. A exemplo do coeficiente de descarga
do caixilho, que tem sido objeto de pesquisa (IQBAL et al., 2015; PERÉN et al., 2015; WANG,
H; KARAVA; CHEN, 2015; WANG, QN; GUAN; LIAO, 2014) e pode proporcionar um aumento
de até quatro vezes na ventilação, ou seja, escolher o tipo certo de caixilho pode levar a uma
economia na quantidade de janelas necessárias e por consequência a uma redução do custo
da construção. Outra característica determinante é a orientação das aberturas, que pode
representar até 20% de aumento na ventilação de um edifício (CÓSTOLA, 2006); a
orientação também influencia na eficiência e função de sheds (LUKIANTCHUKI; CARAM,
2012).

17
2.2 DIRETRIZES PARA A VENTILAÇÃO PELA AÇÃO DOS VENTOS NO AMBIENTE
EDIFICADO
O Arquiteto João Filgueiras Lima, Lelé, ficou conhecido pela aplicação da
ventilação como estratégia de conforto. No início da sua carreira, como projetava de
maneira intuitiva, seus projetos apresentavam baixa eficiência quanto à ventilação. Com o
tempo ele foi aprimorando suas técnicas e contratou pessoal especializado no tema e com
isso teve grande progresso (LUKIANTCHUKI; CARAM, 2012).
Este é um exemplo de como o conhecimento técnico predomina sobre a
intuição, indicando a necessidade de critérios para o correto dimensionamento da
ventilação. Como será apresentado na sequência, embora muitas políticas de incentivo
(ASHRAE 55‐ Estados Unidos, Normativa Europeia (JANDA; BUSCH, 1994), Australian
Building Greenhouse Raiting Scheme‐ Austrália, Building Energy Standards BEST‐ Cingapura,
NBR 15575, NBR 15220‐3, Procel‐ Brasil) apresentem normas ou recomendações a fim de
garantir o conforto térmico nas construções, nenhuma delas tem um conceito avançado
para as recomendações de ventilação natural. As normas geralmente adotam um número
mínimo de trocas de ar por hora, ou uma porcentagem da área do piso como sugestão para
dimensionar janelas.
Este conceito de ventilação atende apenas fins higiênicos e funciona bem para
países frios, mas em países quentes como o Brasil, a ventilação natural também é uma boa
estratégia para o conforto térmico (GIVONI, 1992; LAMBERTS; DUTRA; PEREIRA, 2014;
RIVERO, 1986). Portanto, é importante considerá‐la criteriosamente dando enfoque ao
comportamento do escoamento do ar ao formular recomendações para nosso país
(TOLEDO, 2001).
2.2.1 Métodos para o dimensionamento de aberturas para ambientes ventilados pela
ação dos ventos
A contextualização do tema “dimensionamento de aberturas em ambientes
naturalmente ventilados” foi feita por meio da revisão bibliográfica sistemática, ou
mapeamento sistemático; método que consiste na busca sistemática da literatura de um

18
tópico específico e visa identificar as publicações relevantes ao tema de maneira organizada
(RUIZ‐RUBE et al., 2014) e analisá‐los quantitativa e qualitativamente (ARANTES; LABAKI,
2016).
O mapeamento sistemático seguiu uma sequência de passos já utilizada por
outras pesquisas da área (ARANTES; LABAKI, 2016; LOPES; CÓSTOLA; LABAKI, 2015). Para a
busca foram adotadas seis (6) palavras‐chaves ligadas através dos operadores booleanos:
“OR” (função de “ou”, retorna resultados que contenham um termo ou o outro) e “AND”
(função de “e”, retorna resultados que contenham ambos os termos). Na sequência estão
listados os termos pesquisados:
“Fenestration sizing” “Window design” OR OR
“Window sizing” “WWR” AND “Ventilation” OR OR
“Fenestration design” “Window to Wall Ratio” AND “Ventilation”
OR
Estes termos foram pesquisados nas principais bases de dados conveniadas à Unicamp ou
de livre acesso (Revista Ambiente Construído, Scopus, Science Direct e Web of Science). A
busca foi restrita a artigos de revistas ou congressos e os termos foram buscados no título,
resumo e palavras‐chave dos artigos. Dessa maneira foram encontrados 366 artigos.
Os resultados passaram por duas (2) etapas de seleção: foram descartadas as duplicidades,
foi verificado se os artigos abrangiam o tema da pesquisa (conforto térmico e ventilação
pela ação dos ventos). Assim restaram apenas 24 artigos aderentes ao tema.
Concluída esta etapa iniciou‐se a fase da análise dos artigos. Observando as
datas das publicações (figura 1) é possível perceber que existe uma oscilação quanto à linha
de crescimento de pesquisas no tema de busca. Nota‐se que os anos de 2006, 2007 e 2015
foram os que tiveram o maior número de publicações, demonstrando que o interesse pelo
tópico tem aumentado em pesquisas recentes.

19
Figura 1. Número de artigos aderentes por ano de publicação.
O tema e método adotado pelos artigos aderentes é apresentado na figura 2.
Observa‐se que as variáveis mais pesquisadas são o coeficiente “Window to Wall Ratio” e o
material de execução das janelas; em seguida, a dimensão, orientação, sombreamento e
dimensionamento das janelas, que mostraram um interesse intermediário como tema de
pesquisa. Por fim, a posição das janelas foi o assunto menos investigado. Quando se trata
de índices de desempenho avaliados, os mais comuns foram o desempenho térmico e o
consumo energético; sendo os menos usados dentre as pesquisas o conforto térmico e o
desempenho da iluminação diurna.
Figura 2. Publicações aderentes por variáveis pesquisadas e índices adotados pelos autores.
2
1 1 1
2
1
4
3
1 1 1 1
3
2
1981 1986 1991 1996 2001 2006 2011 2016
N°artigos
Ano
WWR
DIMENÇÃO DAS JANELAS
MATERIAL DA JANELA
ORIENTAÇÃO DA JANELA
POSIÇÃO DA JANELA
SOMBREAMENTO
METODO DIMENSIONAMENTO …
CONSUMO ENERGÉTICO
DESEMPENHO TÉRMICO
CONFORTO TÉRMICO
DESEMPENHO ILUM NATURAL
‐ 2 4 6 8 10 12
Número de artigos
objeto de pesquisa índices de desempenho adotados

20
2.2.1.1 Aspectos gerais que influenciam a ventilação
Aflaki et al. (2015) realizaram revisão bibliográfica sobre a ventilação cruzada em
climas tropicais. Segundo eles, a ventilação natural é recomendada para climas tropicais,
principalmente quando o atraso térmico é pequeno, mas para maximizar a eficiência da
estratégia também é preciso evitar o aquecimento do edifício. Algumas opções para
prevenir isso são: o sombreamento, orientação solar e forma do edifício, tamanho das
aberturas, vegetação do entorno, e materiais do envelope. Além disso, eles também
apontam variáveis relevantes para uma boa ventilação natural, como o layout, orientação
do prédio, o tamanho e localização das janelas.
A importância do sombreamento das aberturas foi confirmada por diversas
pesquisas, como Xie et al.(2009) que realizaram estudo de campo em prédios tradicionais
chineses e identificaram a relevância do sombreamento. As pesquisas de Wang, L; Hien
(2006) e Wang, L; Wong Nyuk; Li (2007) investigaram os tamanhos ótimos de dispositivos
horizontais para o sombreamento das janelas através de simulação, considerando o PMV
(Predicted Mean Vote) como indicador de desempenho: assim apontaram que estes
dispositivos são necessários em todas as orientações.
Outro fator relevante para se projetar um sistema de ventilação natural é a
orientação das janelas com relação aos ventos predominantes; neste sentido, (ALI; MILAD;
ALI, 2007) avaliaram a influência da posição vertical da janela e da direção do ataque do
vento na temperatura do teto usando a simulação CFD; O modelo avaliado na pesquisa
(figura 3) possui aberturas retangulares em paredes paredes opostas e a altura do peitoril
destas janelas (y) variou, enquanto o pé direito do modelo (H) ficou fixo. Assim a proporção
y/H variou de 0.27, 0.36, 0.45, 0.54, até 0.63. Por fim foi possível concluir que a melhor
situação para abaixar a temperatura do teto é a janela com peitoril alto; também
argumentam que a ventilação tem melhor efeito quando a janela está posicionada de
acordo com a direção de ataque do vento.

21
Figura 3. Modelo adotado para as simulações CFD. Fonte: (ALI; MILAD; ALI, 2007)
2.2.1.2 Relação entre o coeficiente Window to Wall Ratio e a ventilação
O coeficiente Window to Wall Ratio foi largamente discutido, abordando
principalmente o ganho de calor devido à área envidraçada, mas a questão de como o
tamanho das aberturas melhora a ventilação pela ação dos ventos foi pouco explorada. Na
sequência serão apresentadas algumas pesquisas que abordam este aspecto.
Um estudo de caso em hospitais (STEPHEN NIMLYAT; ZIN KANDAR; SEDIADI,
2015) avaliou a performance de dois edifícios (figura 4) usando um índice chamado indoor
environmental quality (IEQ), que é uma avaliação conjunta de vários parâmetros: conforto
térmico, acústico, visual e qualidade do ar. Concluiu‐se que plantas abertas propiciam
melhor performance (ventilação e iluminação) que ambientes com muitas divisões e
corredores.

22
Figura 4. Plateau Specialist Hospital e Jos University Teaching Hospital,da esquerda para direita. Fonte: (STEPHEN NIMLYAT; ZIN KANDAR; SEDIADI, 2015)
Zmeureanu (1988) relacionou parâmetros como o WWR e a ventilação natural
ao isolamento térmico em casas localizadas em Montreal, avaliando o custo benefício para
propor o isolamento térmico mais vantajoso para o clima frio. Foi apontado que o
isolamento térmico com melhor custo‐benefício é inferior aos recomendados para região.
2.2.1.3 Métodos de dimensionamento de sistemas de ventilação
As pesquisas descritas a seguir buscaram fornecer subsidio para o
dimensionamento de sistemas de ventilação de forma direta ‐ propondo um método de
dimensionamento ‐ ou indireta – apresentando recomendações de dimensões.
TABESH e SERTYESILISIK (2016) analisaram o WWR ideal para átrios e pátios internos considerando diferentes climas da Turquia (frio –Erzurum‐, ameno e úmido‐ Istanbul‐ e quente e seco ‐Diyarbakir) e tipos de vidros (simples, duplo e triplo). Os modelos foram simulados através do programa de
simulação energética DesignBuilder; a
figura 5 apresenta um esquema da variação paramétrica dos modelos. Assim,
apontaram que a melhor configuração foi o WWR de 40% para qualquer tipo de vidro e que,
analisando apenas a energia para o resfriamento, o melhor WWR foi de 80% para todos os
climas analisados.

23
Pátio Variações do WWR interior:
40, 60 e 80%
Tipos de vidro: simples, duplo e triplo
Átrio Coberto com vidro simples
Coberto com vidro duplo
WWR exterior: 30%
Tipos de vidro: simples, duplo e triplo
Coberto com vidro triplo
Figura 5. Variação dos modelos simulados. Fonte: TABESH e SERTYESILISIK (2016)
A área e a posição da janela também foram investigadas na China (HUO; HU; LI,
2013) através de simulação CFD (Computational Fluid Dynamics). O estudo, apesar de
simplificado, confirmou que janelas grandes aumentam a ventilação de um cômodo e que a
orientação das aberturas influencia na ventilação. Outro estudo chinês (JIAN, 2007) também
recomenda janelas grandes, mas apenas na face sul, além disso, o autor argumenta que os
valores ótimos são alcançados com o sombreamento da janela e utilizando a ventilação
noturna.
Pesquisa realizada na Califórnia fez recomendações simplificadas sobre o
tamanho das aberturas baseado em um cálculo prescritivo de ganho de calor (AL‐SALLAL,
1998). Suga; Kato; Hiyama (2010) e Khemlani (1995) propuseram um método de
dimensionamento de aberturas para uma das faces de um cômodo, sendo que o primeiro
leva em conta o consumo energético, custo, iluminação e ventilação para identificar o WWR
ideal. Já o segundo também se baseia na iluminação e no desempenho térmico, mas não
considera o aquecimento solar, além de não poder ser aplicado a climas quentes.
Na Turquia (INANICI; DEMIRBILEK, 2000) também foi avaliado o tamanho de
janelas em apenas uma face do edifício (sul) considerando o WWR de 25 a 90% e a
proporção do edifício, realizando simulação energética através do programa SUNCODC‐PC.
Foi adotado como estudo de caso um edifício residencial de três pavimentos (figura 6) onde
foi avaliado apenas o pavimento intermediário, de forma que a influência do solo e da
cobertura não foi analisada. A ventilação do edifício é hibrida e foi aplicado um controle de

24
abertura das janelas, onde elas são abertas quando a temperatura está entre 24° e 26°C.
Por fim, recomendou‐se janelas pequenas (25%) para climas quentes (Erzurum e Ankara), já
para climas frios, janelas grandes (Diyarbakir, Izmir e Antalya). Isso ocorreu porque nos
climas quentes a janela maior provoca aumento do ganho de calor por áreas envidraçadas.
Pavimento térreo Primeiro Pavimento Último Pavimento
Figura 6. Plantas do modelo com proporção 1:1. Fonte: (INANICI; DEMIRBILEK, 2000)
Pesquisa similar foi realizada no Brasil (RUPP; GHISI, 2012), na qual o método de
dimensionamento de aberturas visou atender a ventilação híbrida e iluminação em prédios
de escritórios (baseado no consumo de energia elétrica); o sistema propõe um intervalo de
tamanhos de janelas ideal para várias situações considerando a proporção do prédio e a
orientação. A Tabela 1 apresenta um intervalo de áreas ideais das janelas baseado no
consumo energético.
Como se observa, dentre estes artigos aderentes poucos propõem métodos de
dimensionamento de sistemas de ventilação levando em conta a ventilação pela ação dos
ventos e ainda faltam métodos de dimensionamento que considerem os outros fatores
relevantes para ventilação apropriada, especialmente no ambiente residencial.

25
Tabela 1. Intervalo de área das janelas para cada estudo de caso, orientação, geometria e proporção. Fonte: (RUPP; GHISI, 2012)
Amplitude da área das janelas (%)
Caso Orientação Geometría 2:1 Geometría 1:1 Geometría 1:2
K=0.8 K=2.0 K=5.0 K=0.8 K=2.0 K=5.0 K=0.8 K=2.0 K=5.0
1 Norte
Sul
Leste
Oeste
2 Norte
Sul
Leste
Oeste
3 Norte
Sul
Leste
Oeste
4 Norte
Sul
Leste
Oeste
Onde K é um índice (não‐dimensional); W é a largura total do ambiente (m), D é a profundidade total do ambiente (m) e h é a altura entre a superfície de trabalho e o
teto (m).
2.2.2 Normas NBR 15575 e NBR 15220‐3.
A norma NBR 15220 (ABNT, 2003) propõe a divisão do Brasil em 8 zonas
climáticas (Zoneamento Bioclimático), e traça diretrizes construtivas para cada uma destas
zonas com base nas recomendações de Givoni (1992). Para tanto, são propostos limites de:
transmitância térmica, atraso térmico, fator de calor solar e tamanho das aberturas; o último
critério descreve a área ideal de abertura para cada zona, e a tabela que segue delimita
valores para tamanhos de janelas pequenas, médias e grandes.

26
Tabela 2‐Aberturas para ventilação de acordo com a área do piso.
Aberturas para ventilação A (em % da área de piso)
Pequenas 10%< A <15%
Médias 15%< A <25%
Grandes A >40%
Fonte: NBR 15220‐3, p17
Recentemente foi proposta a norma NBR 15575 (ABNT, 2008, 2013b, c) que
trata do: desempenho estrutural, segurança contra incêndio e no uso e operação,
funcionalidade e acessibilidade, conforto tátil e antropodinâmico, desempenho térmico,
acústico e lumínico, estanqueidade à água, durabilidade e manutenção predial. Aqui serão
comentados apenas os sistemas de avaliação de conforto térmico simplificado.
A norma leva em consideração o envelope do prédio; para tanto são traçados
limites de capacidade e transmitância térmica para os sistemas de vedação e coberturas.
Além disto, também são colocados limites para a dimensão das aberturas para cidades onde
estes não forem especificados pelo código de obras, pedindo tamanho médio para as zonas
de 1 a 7 (maior ou igual a 7% da área do piso) e grande para a zona 8 (se localizada na Região
Norte do Brasil, maior ou igual a 12% da área do piso, quando na Região Nordeste e Sudeste
do Brasil, maior ou igual a 8% da área do piso). Esses valores são menores que o proposto
pela NBR 15220. Nota‐se que apesar das recomendações para o conforto terem sido revistas
na NBR 15575 (ABNT, 2008, 2013b, c) o método simplificado para o dimensionamento de
aberturas não evoluiu.
2.2.3 Programas de etiquetagem, Procel e Casa Azul
O Programa Brasileiro de Etiquetagem Procel Edifica (PBE) propõe dois métodos
diferentes, o RTQ‐C (INMETRO, 2013a) para edifícios comerciais e o RTQ‐R (INMETRO,
2013b), para residenciais. De acordo com os objetivos desta pesquisa aqui será exposto
apenas o último método.
De acordo com este modelo, são atribuídas etiquetas de “A” a “E”, para a
classificação e são avaliados três pontos (envoltória para resfriamento, aquecimento e

27
refrigeração) para os quais são atribuídos equivalentes numéricos que mais tarde serão
pesados para determinar a pontuação final do prédio.
O método adota como requisitos mínimos os parâmetros termofísicos de acordo
com as normas brasileiras de desempenho térmico. Para a área mínima das aberturas segue
a norma NBR 15575. Com relação à circulação de ar de banheiros aceitam‐se aberturas
voltadas para poço de ventilação ou até forros ventilados, mas para se obter nível “A” é
necessário que pelo menos 50% deles sejam naturalmente ventilados. Ainda neste tópico,
coloca‐se como essencial a possibilidade de fechamento das aberturas em locais onde as
médias mensais das temperaturas mínimas sejam menores que 20°C ou que sejam
localizados nas zonas bioclimáticas 1 a 7. Para as zonas 2 a 8 também é exigida a ventilação
cruzada, de forma que quanto mais bem distribuídas forem as aberturas, melhor (ver tabela
3). No caso da iluminação natural impõe que, para ambientes de permanência prolongada,
seja disponibilizada uma iluminação natural correspondente a 12,5% da área útil do mesmo,
independente da zona bioclimática.
Tabela 3‐ fórmula para ventilação cruzada, RTQ‐R (INMETRO, 2013b).
A2/A1 ≥ 0,25
A1: somatório área de ventilação nas fachadas da orientação com maior área de abertura.
A2: somatório área de ventilação nas fachadas das demais orientações.
Já o Selo Casa Azul (CAIXA ECONÔMICA FEDERAL, 2010) é aplicável a projetos
habitacionais em que as unidades sejam avaliadas em até R$ 130.000,00 e financiadas pela
CAIXA. No sistema é possível se alcançar três níveis de sustentabilidade, BRONZE (atendendo
aos critérios obrigatórios), PRATA (atendendo a 6 critérios além dos obrigatórios), OURO
(atendendo a 12 critérios além dos obrigatórios). Para tanto são propostos 53 critérios de
avaliação (18 obrigatórios) que abrangem: “Qualidade Urbana”, “Conservação de Recursos
Materiais”, “Gestão da Água”, “Práticas Sociais”, “Eficiência Energética” e “Projeto e
Conforto”.
O programa também incentiva a preocupação com a ventilação, como por
exemplo: para o requisito Relação com a vizinhança, espera‐se que na implantação do

28
prédio seja levado em consideração o impacto ambiental da ventilação nos terrenos
confrontantes, porém, não é instituído um método de análise quantitativo. Para avaliar o
desempenho térmico – orientação ao sol e ventos, o selo se apoia nas diretrizes construtivas
do zoneamento bioclimático apresentado na NBR15220. Além disso, é exigida a existência
de aberturas voltadas para o exterior atendendo a área mínima de ventilação.
Portanto, no que tange a ventilação movida pelos ventos o Selo Azul da Caixa,
apenas exige a adoção das normativas vigentes, sem propor grandes alterações.

29
2.3 MÉTODOS PARA QUANTIFICAÇÃO DA VENTILAÇÃO PELA AÇÃO DOS
VENTOS
A predição da vazão no interior de um edifício devido a ação dos ventos pode
ser calculada através de diversos modelos, manuais ou da simulação. Como nesta pesquisa
optou‐se pelo uso da simulação, serão apresentados os métodos mais usados, o nível de
incertezas relacionados a cada um, e também as principais variáveis a serem consideradas.
Os principais métodos que utilizam a simulação para prever a vazão do ar são o
Airflow Network (AFN) e o Computational Fluid Dynamics (CFD), sendo o último mais preciso.
Segundo TRINDADE; PEDRINI e DUARTE (2010) o método CFD foi inicialmente
utilizado na indústria aeroespacial, mas atualmente tem sido muito usado em muitos
campos como a arquitetura e engenharia. Alguns exemplos de softwares CFD são o CFX
ANSYS, Fluent ANSYS, Phoenics CHAM, e FloVENT ELiNTER.
ASFOUR e GADI (2007) explicam que “O modelo CFD se baseia no conceito de
dividir a solução do domínio em subzonas. Então, para cada zona, as equações de
conservação de massa, momento, e energia são resolvidas se utilizando de computadores
potentes”. A seguir os passos do workflow em modelos CFD:
Modelagem do objeto de estudo e do domínio
Geração da malha
Definição do código de solução (tipo de simulação, modelo de turbulência e
transferência de calor, e critérios de convergência)
Simulação do modelo
Já o modelo Ariflow network (AFN) “é representado por um grupo de nós,
simulando as aberturas do edifício, e um grupo de linhas, simulando o percurso do
fluido”(ASFOUR; GADI, 2007). Os softwares ESP‐r e Energy Plus são exemplos de AFN. O
workflow para modelagem da Ariflow network segue os seguintes passos:
Modelagem do edifício
Especificação do coeficiente de pressão e de descarga
Configuração do edifício
Simulação do modelo
Quando se trata simulação da ventilação pela ação dos ventos, o AFN apresenta
a vantagem de considerar diversas incidências e velocidades do vento, simular grandes
períodos (exemplo: um ano), além de também simular o problema em um tempo

30
consideravelmente menor. Já o CFD apenas considera uma direção e intensidade do vento
por vez, e soluciona o problema para apenas um instante. Apesar destas diferenças, é
importante reforçar que a fidelidade dos resultados do CFD é maior que em AFN e que os
dois modelos podem ser usados em conjunto produzindo melhores resultados.
Na sequência serão apresentados alguns conceitos importantes para estas
simulações: o perfil de camada limite, o coeficiente de pressão e o coeficiente de descarga.
O vento na superfície terrestre sofre alterações no escoamento devido a
aspectos geomorfológicos, sendo que quanto mais distante da superfície maior a velocidade
do vento. A velocidade do vento vai aumentando até uma altura onde esta é menor ou igual
a 99% da velocidade no escoamento não perturbado: esta altura representa a espessura da
camada limite (MORAIS; LABAKI, 2013b).
Existem três tipos de perfil de camada limite (convectiva, estável e neutra), que
são determinados pela natureza e quantidade da turbulência no momento. O perfil de
camada limite convectiva ocorre em dias quentes e é caracterizado por ser turbulento. A
altura da camada limite nestes dias pode alcançar até 1000m. Já o perfil de camada limite
estável ocorre à noite e é pouco turbulento. Por fim, o perfil de camada limite neutra ocorre
em dias nublados e costuma ser adotado em simulações (CÓSTOLA, 2006).
Como o CFD pode ser aplicado para diversos fluidos e em diferentes condições,
é necessário inserir um perfil logaritmo para representar a camada limite. Já para o AFN isso
não é necessário, pois como estes programas são geralmente específicos para edifícios, o
perfil da camada limite já está inserido no seu algoritmo (ENERGY, 2015).
Para a simulação AFN também é necessário inserir valores de coeficiente de
pressão para cada abertura que irá compor o sistema de ventilação pela ação dos ventos.
“Define‐se Coeficiente de Pressão (Cp), o quociente adimensional da pressão dinâmica
medida em um ponto x na parede do modelo (Px) pela pressão dinâmica do fluxo de ar
(vento) não perturbado (Pd)”(CÓSTOLA, 2006).
O uso de valores corretos de coeficientes de pressão é essencial para a
fidelidade dos resultados (BAHARVAND, 2010; KARAVA; STATHOPOULOS; ATHIENITIS, 2006;
LUKIANTCHUKI et al., 2016; TOLEDO, 2006). A obtenção destes valores pode se dar através
de cálculos manuais, busca nas bases de dados, e simulação em CFD ou em túnel de vento.

31
Apesar da rapidez e praticidades dos dois primeiros métodos, a simulação por CFD ou túnel
de vento é recomendada pois garante maior confiabilidade nos resultados (CÓSTOLA;
ALUCCI, 2007).
As configurações das aberturas também devem ser inseridas na AFN, sendo o
coeficiente de descarga tão relevante quanto a área das aberturas. Este coeficiente está
relacionado com o modelo de esquadria e tipo de abertura da janelas e representa a perda
de carga no escoamento (TOLEDO, 2006).
Apesar de muito importante, ainda se sabe muito pouco sobre este coeficiente
(ENERGYPLUS, 2015; LUKIANTCHUKI et al., 2016). As bases de dados sobre o assunto são
incompletas e consideram um valor fixo para cada tipo de abertura. Estudo recente
demonstrou que fatores como a incidência do vento e a porosidade do edifício, bem como
a configuração da janela podem afetar o coeficiente, de forma que um mesmo tipo de
abertura pode apresentar vários coeficientes de descarga (P. KARAVA; T. STATHOPOULOS;
ATHIENITIS, 2011).
Por fim, para se produzir resultados confiáveis utilizando CFD ou AFN, o modelo
deve ser configurado criteriosamente. O trabalho de (CÓSTOLA, 2006) buscou definir um
método para a quantificação da ventilação pela ação dos ventos na escala do edifício através
do CFD e AFN, e serviu como referência para as configurações adotadas na atual pesquisa.

32
2.4 INDICADORES DE CONFORTO TÉRMICO
O ser humano tem a capacidade de manter sua temperatura estável através das
trocas de calor com o meio por condução, radiação, convecção, perspiração, transpiração e
trocas na respiração (FANGER, 1970). Estas trocas envolvem na maior parte (exceto a
condução e radiação) a presença de ar, demonstrando que o elemento é essencial à
manutenção da vida, não somente devido à produção de energia pela respiração, mas
também para a homeotermia (FANGER, 1970; RIVERO, 1986).
Embora o bem estar térmico dependa de fatores físicos, ele também é
influenciado por variáveis psicológicas como: a experiência térmica, a expectativa e
alliesthesia1 térmica (DACANAL, 2011; DEAR; BRAGER, 2002; RUAS, 2002). Assim, o conforto
térmico pode ser definido como “o estado da mente que expressa satisfação com o
ambiente térmico” (ASHRAE, 2013).
Devido à complexidade ao se considerar fatores psicológicos em modelos
matemáticos para avaliar a satisfação térmica, têm sido desenvolvidos indicadores de
conforto que levam em conta apenas variáveis físicas, desta forma viabilizando avaliar o
conforto em situações climáticas variadas e para então melhor adequá‐las (RUAS, 2002).
Deste modo, foram desenvolvidos vários indicadores de conforto térmico, dentre os quais
se destacam; o Voto Médio Estimado (VME), o modelo adaptativo, graus dia de conforto
adaptativo e o movimento mínimo do ar.
2.4.1 Voto Médio Estimado (VME)
Para obter uma relação entre dados climáticos e a sensação de conforto térmico,
Fanger (1970, p. 112) realizou experimentos com 256 pessoas treinadas sob condições
climáticas controladas e somou estes resultados a pesquisas análogas (MCNALL JR, P. E.,
JAAX, J., ROHLES, F. H., NEVINS, R. G., & SPRINGER, 1967; NEVINS et al., 1966) formando
uma base de dados de questionários com 1396 pessoas. A partir destes foi elaborada a
Equação do Conforto, para a qual também foram desenvolvidas várias tabelas para facilitar
1 Alliesthesia é uma palavra inglesa. Quando aplicada ao conforto térmico se refere à porção afetiva do bem estar térmico, sugerindo que o conforto térmico de um indivíduo é determinado tanto pelo estado térmico geral como pelo próprio ambiente (PARKINSON; DE DEAR; CANDIDO, 2015).
33
sua aplicação. O método pede como dados de entrada parâmetros individuais (atividade
realizada pelo usuário, resistência térmica do vestuário) e climáticos (temperatura do ar,
umidade do ar, velocidade do ar e temperatura média radiante) e fornece como resultado
uma escala de sensação térmica, de sete pontos, chamada de Voto Médio Estimado (VME),
que varia de ‐3 (muito frio) a 3 (muito calor), sendo 0 a neutralidade térmica. Além disso,
também se observa que sempre haverá uma porcentagem de insatisfeitos, mesmo para uma
situação de neutralidade térmica, relacionando‐se a Equação de Conforto com a
Porcentagem Estimada de Insatisfeitos (PEI). Este método é adequado a ambientes internos
e artificialmente condicionados
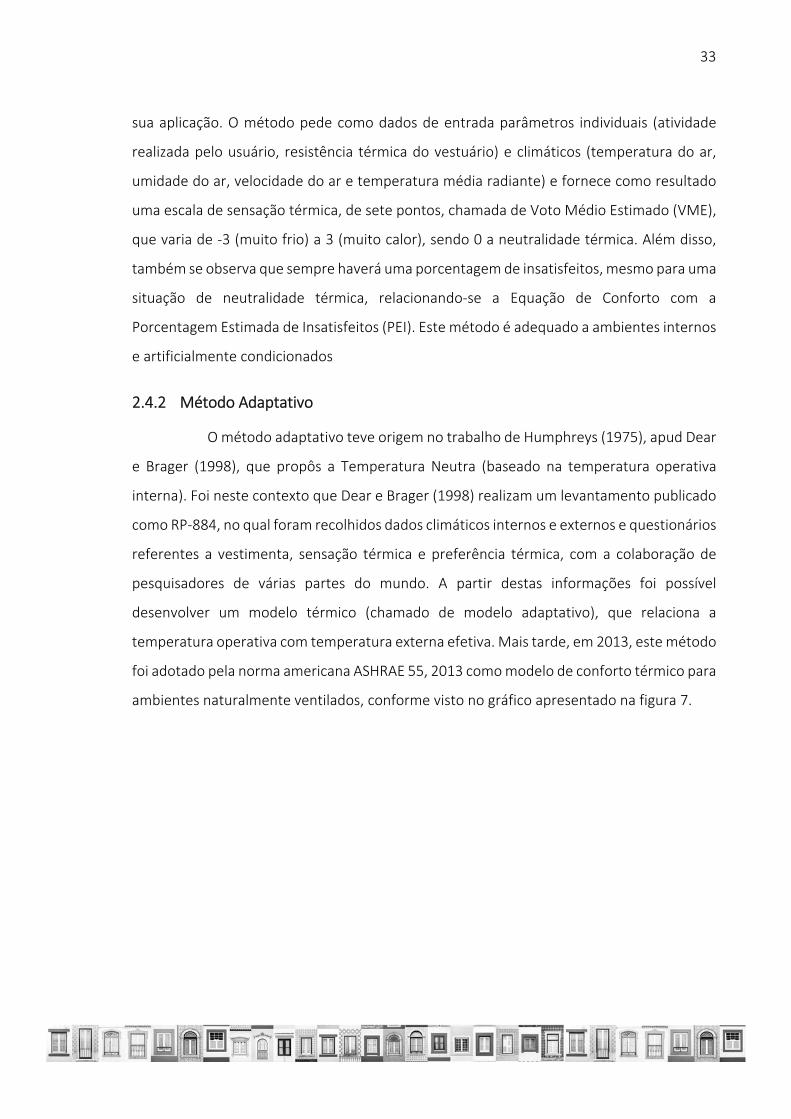
2.4.2 Método Adaptativo
O método adaptativo teve origem no trabalho de Humphreys (1975), apud Dear
e Brager (1998), que propôs a Temperatura Neutra (baseado na temperatura operativa
interna). Foi neste contexto que Dear e Brager (1998) realizam um levantamento publicado
como RP‐884, no qual foram recolhidos dados climáticos internos e externos e questionários
referentes a vestimenta, sensação térmica e preferência térmica, com a colaboração de
pesquisadores de várias partes do mundo. A partir destas informações foi possível
desenvolver um modelo térmico (chamado de modelo adaptativo), que relaciona a
temperatura operativa com temperatura externa efetiva. Mais tarde, em 2013, este método
foi adotado pela norma americana ASHRAE 55, 2013 como modelo de conforto térmico para
ambientes naturalmente ventilados, conforme visto no gráfico apresentado na figura 7.

34
Figura 7. Limites aceitáveis para a temperatura operativa segundo o modelo adaptativo em ambientes naturalmente ventilados, com velocidade até 0,3m/s. Fonte: (ASHRAE, 2013).
Além disto, o trabalho consegue demonstrar que para o usuário se apresenta
uma maior amplitude na temperatura aceitável quando possui controle sobre a abertura
das janelas em ambientes naturalmente ventilados, do que quando submetidos a ambientes
condicionados com uma temperatura fixa. Na tabela 4 é proposto o aumento dos limites de
conforto térmico conforme a ventilação aumenta.
Tabela 4. Aumento dos limites de temperatura operativa para o modelo adaptativo de acordo com a velocidade do ar.
Velocidade média do ar 0,6m/s
Velocidade média do ar 0,9m/s
Velocidade média do ar 1,2m/s
1,2°C 1,8°C 2,2°C
Fonte: (ASHRAE, 2013)
2.4.3 Graus dia de conforto adaptativo
O índice foi proposto por Mcgilligan; Natarajan; Nikolopoulou (2011) e se baseia
no índice análogo graus dia de aquecimento ou resfriamento. O índice proposto quantifica
quantos graus a temperatura de um ambiente esteve fora da faixa de conforto térmico
baseada no modelo adaptativo e pode ser calculado para o aquecimento ou resfriamento,
conforme segue:

35
Graus Dia de Conforto Adaptativo (aquecimento)= Ti ‐ Ls
Graus Dia de Conforto Adaptativo (resfriamento)= Li ‐ Ti
Ti= temperatura interna
Ls=limite superior de conforto adaptativo
Li= limite inferior de conforto adaptativo
Enquanto o conforto adaptativo permite apenas identificar se no momento a
sensação térmica do usuário está dentro ou fora da faixa de conforto, o índice Graus Dia de
Conforto Adaptativo permite uma análise de intensidade do desconforto experimentado.
2.4.4 Movimento mínimo do ar
Com intuito de investigar a sensação térmica e a ventilação desejável, CÂNDIDO
et al. (2011) realizaram dois experimentos em Maceió (Brasil) questionando os participantes
sobre a preferência quanto ao movimento do ar (maior ou menor velocidade do ar). Então,
através de análise estatística, propuseram limites para a ventilação adequada em ambientes
internos. Foram estabelecidos valores mínimos de velocidade do ar para determinadas
faixas de temperatura, como visto na tabela 5.
Tabela 5. Movimento mínimo do ar.
TEMPERATURA OPERATIVA INTERNA (°C)
VELOCIDADE DO AR MIN (m/s)
24‐27 0.4< 27‐29 0.41–0.8 29‐31 >0.81
Fonte: adaptado de CÂNDIDO et al. (2011)
A partir desses estudos o movimento mínimo do ar passou a ser considerado um
indicador de conforto em clima tropical, e tem sido aplicado em pesquisas sobre ventilação
pela ação dos ventos (LUKIANTCHUKI et al., 2016; MORAIS; LABAKI, 2013a).

36
3 METODOLOGIA GERAL DA PESQUISA
3.1 ETAPAS DA PESQUISA
A pesquisa foi realizada em duas etapas. Na primeira foi investigado um cômodo
hipotético de 16m2, e a segunda e terceira tiveram como objeto um edifício residencial de
4 pavimentos localizado em Piracicaba, SP (zona bioclimática 2).
Em cada etapa do estudo foram derivadas outras situações a partir do modelo
de referência, possibilitando estudar os parâmetros definidos em cada fase. A descrição de
cada modelo e do método detalhado serão abordados no capítulo quatro (Resultados) no
subitem referente ao método de cada experimento. A seguir estão brevemente descritos os
passos da pesquisa:
Etapa 1‐ Verificar a influência de diversos parâmetros geométricos de
dimensionamento de sistemas de abertura na ventilação de um cômodo.
Definir modelo para a etapa.
Estabelecer os parâmetros a serem testados.
Simular variações no modelo através do software de CFD (CFX Ansys 16.2).
Identificar os parâmetros que representam maior impacto para a ventilação
interna do cômodo (passo que definirá aqueles que serão utilizados na
terceira etapa).
Etapa 2‐ Avaliar o efeito da obstrução do entorno na ventilação pela ação dos ventos
em um prédio de quatro pavimentos.
Definir o edifício de referência para a etapa.
Levantar os dados do edifício.
Simular variações no modelo através do software de CFD (CFX Ansys 16.2).
Avaliar a qualidade da ventilação natural do edifício
Etapa 3‐ Verificar a influência de diversas configurações de sistemas de abertura no
desempenho térmico do edifício da etapa 2.
Obter os coeficientes de pressão através de CFD (CFX Ansys 16.2).

37
Simular variações nas configurações do modelo através do software Energy
Plus.
Identificar as configurações de aberturas que promovem melhores condições
de conforto térmico.

38
3.2 CLIMA DE PIRACICABA
O município de Piracicaba está situado a sudoeste do estado de São Paulo,
Região Metropolitana de Campinas (figura 8). Situa‐se nas coordenadas geográficas: latitude
22 42´30´´ sul e longitude 47 38'00'' oeste, e a uma altitude de 546 metros (RORIZ, 2012b).
De acordo com o Censo (IBGE, 2011), a população do município era de 364.571 habitantes
em 2010, e a área total compreende a 1.378,069 km²(IBGE, 2011).
Figura 8. Localização de Piracicaba no estado de São Paulo.
Segundo a classificação de Koppen, o clima da cidade é úmido e subtropical/Cwa
(CEPAGRI, 2016) com inverno ameno e verão quente e úmido, como se vê na tabela 6 e
figura 9 (RORIZ, 2012a). Nota‐se que, comparando‐se as duas estações, há pouca diferença
entre as máximas (apenas 2°C) apresentando maiores diferenças nas temperaturas mínimas
(6,5°C) Este fato indica uma característica importante da região, apontando para
necessidade de resfriamento mesmo no inverno (para alguns períodos do dia), de forma que
a ventilação natural deve ser considerada como estratégia de resfriamento do ar durante o
ano todo, diferente de países frios onde, no inverno, é usada apenas para renovação do ar.
N

39
Verão (°C) Inverno (°C)
Temperatura média máxima 28.50 26.19
Temperatura média mínima 18.96 12.48
Temperatura média 23.02 18.87
Umidade relativa média 78.74 68.30 Tabela 6. Temperatura de bulbo seco e umidade
relativa, médias anuais‐ Piracicaba; Baseado em
(RORIZ, 2012a))
Figura 9. Caracterização do clima de Piracicaba: a‐ médias da temperatura de bulbo seco e umidade relativa;
Baseado em RORIZ (2012a)
Nas figuras 10 e 11 é possível ver o comportamento da temperatura e umidade
relativa no solstício de verão e inverno. Observa‐se que o verão é mais úmido que o inverno
e que os valores mais baixos de umidade ocorrem entre as 9:00h e as 15:00h, em ambas as
estações, coincidindo com as maiores temperaturas. Além disso, nota‐se que a máxima
temperatura ocorre em torno das 13:00h e a mínima às 6:00h nos dois dias.
Figura 10. Variação diária da temperatura de
bulbo seco e umidade relativa, solstício de verão‐Piracicaba; Baseado em (RORIZ, 2012a)
Figura 11.Variação diária da temperatura de bulbo seco e umidade relativa, solstício de
inverno‐Piracicaba; Baseado em (RORIZ, 2012a)
0
10
20
30
40
50
60
70
80
90
100
10
12
14
16
18
20
22
24
26
28
30
summer winter
Avrege relative humidity (%)
Outdoor drybulb tem
perature (C
°)
Avg Max T Avg Min T Avg T RH Avg
40
50
60
70
80
90
100
14
16
18
20
22
24
26
28
1:00
3:00
5:00
7:00
9:00
11:00
13:00
15:00
17:00
19:00
21:00
23:00
Umidade relativa
Temp. bulbo seco
Hora
Verão
TBS UR
40
50
60
70
80
90
100
14
16
18
20
22
24
26
28
1:00
3:00
5:00
7:00
9:00
11:00
13:00
15:00
17:00
19:00
21:00
23:00
Umidade relativa
Temp. bulbo seco
Hora
Inverno
TBS UR
40
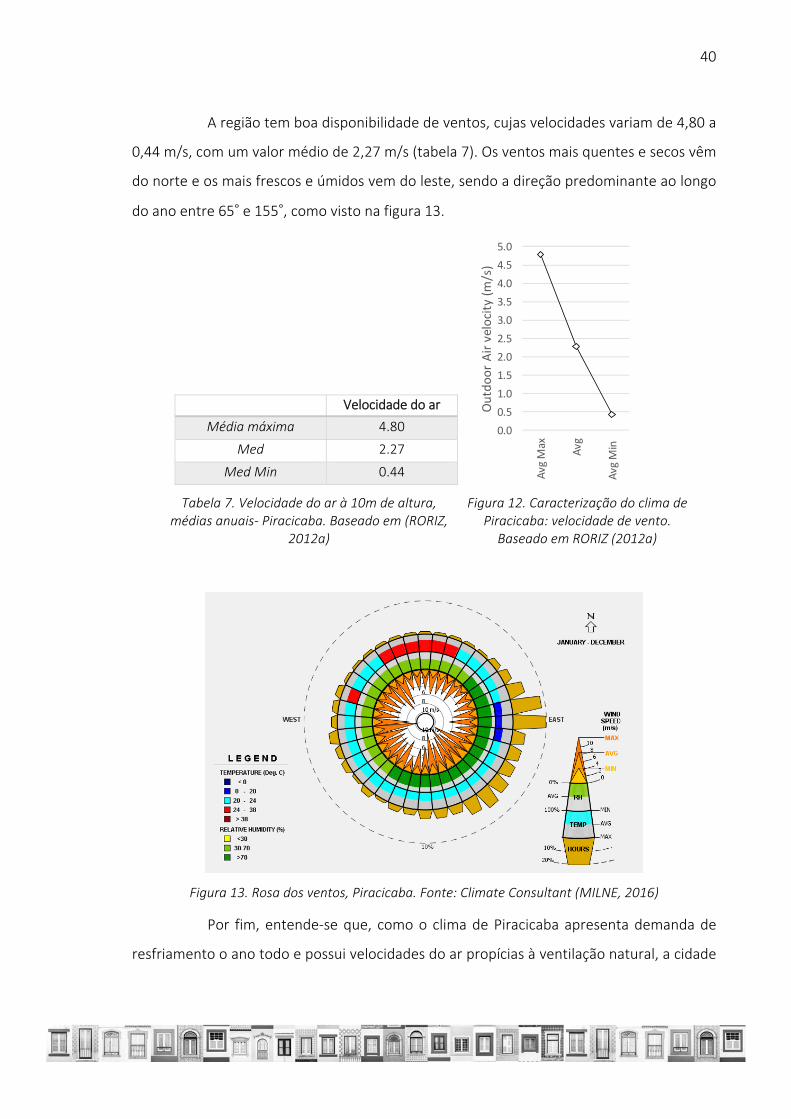
A região tem boa disponibilidade de ventos, cujas velocidades variam de 4,80 a
0,44 m/s, com um valor médio de 2,27 m/s (tabela 7). Os ventos mais quentes e secos vêm
do norte e os mais frescos e úmidos vem do leste, sendo a direção predominante ao longo
do ano entre 65° e 155°, como visto na figura 13.
Velocidade do ar
Média máxima 4.80
Med 2.27
Med Min 0.44
Tabela 7. Velocidade do ar à 10m de altura, médias anuais‐ Piracicaba. Baseado em (RORIZ,
2012a)
Figura 12. Caracterização do clima de Piracicaba: velocidade de vento. Baseado em RORIZ (2012a)
Figura 13. Rosa dos ventos, Piracicaba. Fonte: Climate Consultant (MILNE, 2016)
Por fim, entende‐se que, como o clima de Piracicaba apresenta demanda de
resfriamento o ano todo e possui velocidades do ar propícias à ventilação natural, a cidade
0.0
0.5
1.0
1.5
2.0
2.5
3.0
3.5
4.0
4.5
5.0
Avg M
ax
Avg
Avg M
in
Outdoor Air velocity (m/s)

41
tem potencial para aplicação da ventilação natural como estratégia passiva para o
resfriamento.

42
4 RESULTADOS
Na sequência são apresentados os resultados do estudo que foram divididos em
três subitens. Para tal, adotou‐se a estrutura de artigo e por este motivo o capítulo foi escrito
em inglês. O conteúdo do item 4.1 foi publicado com pequenas modificações (MEDINILHA;
LABAKI, 2016). Neste foram abordados parâmetros geométricos importantes para o
dimensionamento de aberturas. Na sequência (4.2) avaliou‐se a ventilação em um prédio de
apartamentos levando em conta a predominância dos ventos e obstrução do entorno. Então
no item 4.3 foi avaliado o melhor tamanho de aberturas de acordo com o comportamento
térmico.

43
4.1 THE INFLUENCE OF SEVERAL GEOMETRIC PARAMETERS OF WINDOW
SYSTEMS DESIGN IN THE NATURAL VENTILATION OF A SMALL ROOM
Around the world, energy consumption has been growing progressively and has
already surpassed the population growth (PÉREZ‐LOMBARD; ORTIZ; POUT, 2008), due to
lifestyle and lower thermal discomfort tolerance (LAMBERTS et al., 2008). Studies show that
energy use will grow at higher rates in emerging economies (3.2%) than in developed
countries (1.1%), and that by 2020 the former will overcome the latter in this aspect (PÉREZ‐
LOMBARD; ORTIZ; POUT, 2008).
In this regard, a big portion of energy use takes place at the built environment,
for example in Brazil it represents 48,53% of the consumption in the country (BEN, 2016),
indicating great energy savings potential. Given that building designs and constructive
methods can interfere directly with natural resources consumption (LAMBERTS et al., 2008),
in order to avoid high energy costs it is mandatory that architects should consider passive
strategies in the design process.
A valuable strategy for this purpose is natural ventilation, which contributes to
air renovation for sanitary purposes, thermal comfort and decrease of the surface
temperature of walls and objects (RIVERO, 1986). The natural cross ventilation also can
induce a pleasant sensation while having a positive effect on thermic alliesthesia (OHBA;
TSUKAMOTO; LUN, 2013), which causes a higher tolerance to hot thermal sensation (DEAR;
BRAGER, 2002). For these reasons, it can contribute to the reduction of energy costs,
especially in hot climates (PEREIRA et al., 2013).
Nevertheless, most of ventilation standards approach only the sanitary aspect,
by proposing minimal air change rate (ASHRAE, 2004; JANDA; BUSCH, 1994) or window area
(ABNT, 2013b). Otherwise maximum wind speed limits (CÂNDIDO; DEAR; LAMBERTS, 2011)
are suggested.
Recent research has been discussing the applicability of the minimal acceptable
air movement, instead of maximum, for hot climates (CÂNDIDO; DEAR; LAMBERTS, 2011;
MANU et al., 2014). Table 1 shows the suggested velocity limits as a function of the
temperature:

44
Table 1. Minimal acceptable air movement. Based on CÂNDIDO et al. (2011)
Indoor operative temperature (°C)
Min wind speed (m/s)
24‐27 0.4
27‐29 0.41–0.8
29‐31 0.81
Other authors argue that ventilation regulations still require reviews and should
consider thermal comfort, proposing different parameters for natural ventilation, such as:
wind direction and speed towards the inlet window;
opening position at the wall;
discharge coefficient of the window;
the proportion of the opening;
anthermal load (CÓSTOLA, 2006).
Many of these aspects have been topics of research, such as: size (ALDAWOUD,
2016; PERSSON; ROOS; WALL, 2006); discharge coefficient (IQBAL et al., 2015; P. KARAVA;
T. STATHOPOULOS; ATHIENITIS, 2011; WANG, QN; GUAN; LIAO, 2014); and orientation
towards prevailing wind (CÓSTOLA, 2006; LUKIANTCHUKI; CARAM, 2012; MORAIS; LABAKI,
2013a).
However, further investigation is still required in order to comprehend all
parameters listed above. This research intended to evaluate the influence of various window
geometry parameters (area, position, proportion and window orientation) on the natural
ventilation behavior of a room. CFD (Computational Fluid Dynamics) simulation was adopted
as the method to identify the most influential parameters. The performance indicators used
were: the acceptability of air movement (CÂNDIDO; DEAR; LAMBERTS, 2011) and the
reduction of air velocities from one case to another.
Therefore, the work provides a better understanding of these aspects and their
influence on wind‐driven ventilation. This knowledge can be a helpful tool to the process of
windows design, contributing to the improvement of the quality of ventilation in the built
environment.

45
4.1.1 Method
A square room (16m²) with two opposite windows (1x1m) located at Piracicaba‐ Brazil was
adopted as the base model. This model was modified by varying the size and position of the
openings generating 16 new case studies. Then through CFD simulation air velocity values
and velocity contours were obtained inside the room at a height of 1.20m, which is the
height of the central point of the window and also represents the height of a seated person.
The mean air velocity (2.46 m/s) used as input data for the CFD simulation was
extracted from the Piracicaba climate archive (RORIZ, 2012a) and it was obtained at 10m
from the ground. To represent the boundary layer effect a CCL expression was inserted into
the model according to (CÓSTOLA; ALUCCI, 2007) –see “Apêndice II”, so the reference speed
obtained at user height was 0.92m/s.
To define the minimum air movement as proposed by CÂNDIDO et al. (2011) –
see chapter 2.4‐ the room was considered shaded so that the air temperature could be
adopted as the base. Since in Piracicaba, the summer air temperature is within the range of
27 to 29°C, it was adopted the speed of 0,6m/s; on the other hand in winter, with a
temperature range from 24 to 27°C, the adopted speed was 0,4m/s.
4.1.1.1 Case study
The hypothetical model was defined to minimize its influence on the results.
Thus, it was chosen a room with four square meters (4m2), two openings with one square
meter (1m2), and a wind direction of 90º to the inlet window and with no obstructions, as
seen in figure 1.
46
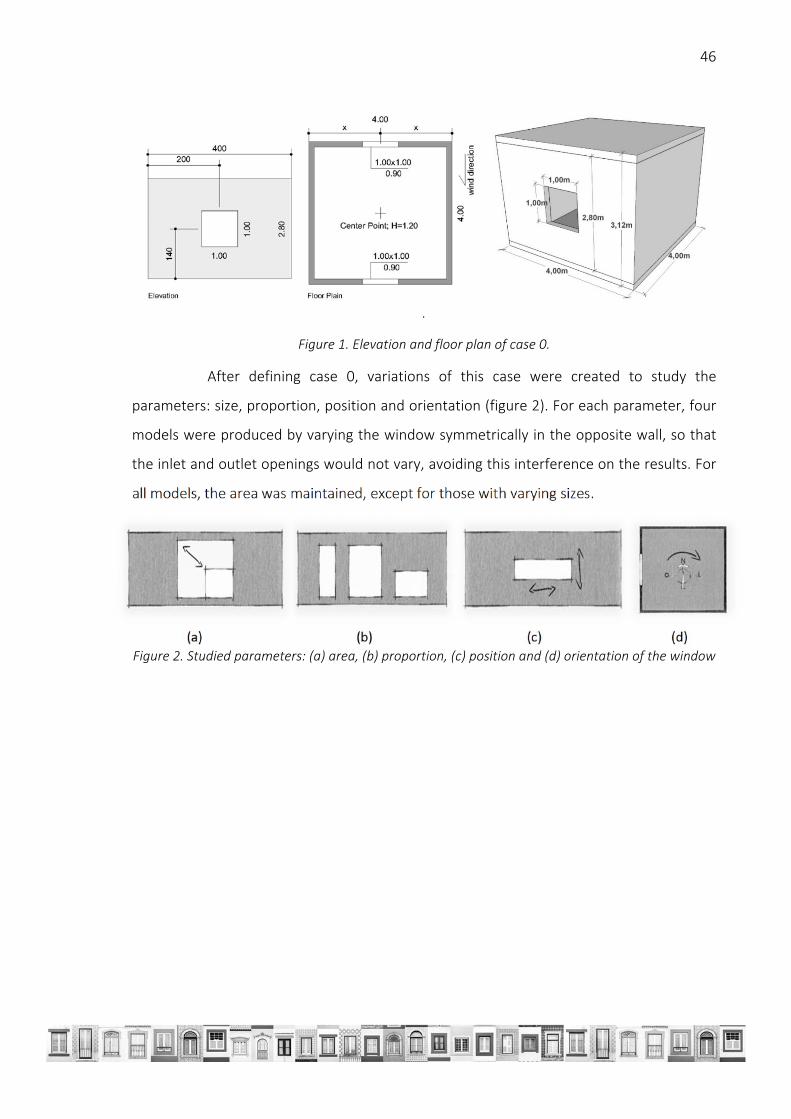
.
Figure 1. Elevation and floor plan of case 0.
After defining case 0, variations of this case were created to study the
parameters: size, proportion, position and orientation (figure 2). For each parameter, four
models were produced by varying the window symmetrically in the opposite wall, so that
the inlet and outlet openings would not vary, avoiding this interference on the results. For
all models, the area was maintained, except for those with varying sizes.
(a) (b) (c) (d)
Figure 2. Studied parameters: (a) area, (b) proportion, (c) position and (d) orientation of the window

47
Figure 3. Elevation for the different size models.
Figure 4. Elevation for the different position
models.
Figure 5. Elevation for the different proportion
models.
Figure 6. Wind Rose for different orientations
The size models maintained a center position on the wall increasing only the size
of the windows by 0.25m for each model, as seen in figure 3. For the proportion variations,
the first two models represented a horizontal shape, while the other two, the vertical form
(figure 4). As for the position models, the geometry of the opening itself did not change,
modifying only its location on the facade, first moving it up and down and then to the side,
as seen in figure 5. Afterward, the orientation of the wind attack angle was modified by an

48
increase of 22.5° for each model, varying from 112.5° (case orient 1) to 180° (case orient 4)
(figure 6).
4.1.1.2 CFD
The simulations were performed with CFX Ansys 16.2 (CFD software) since it has
been applied successfully in several researches on building ventilations (ALDAWOUD, 2016;
CÓSTOLA; ALUCCI, 2007; LUKIANTCHUKI et al., 2016; MORAIS; LABAKI, 2013a; SOKHI et al.,
2000).
An octagonal domain (figure 7) was adopted rather than the usual rectangular
one because it facilitates the simulation of diverse wind direction without sacrificing the
ideal obstruction (CÓSTOLA; ALUCCI, 2007). For this domain, it is recommended a spacing
of 10 to 15 times the object height, in every direction and 5 times the value for the domain
height with the top blockage of 3% (COST, 2004). Following these recommendations, this
research domain had 40m radius and 24m height, which resulted in an obstruction of
0.004% meeting the criteria.
Figure 7. Octagonal domain, base model.
Mesh independence tests were performed to ensure the accuracy of the model
and to define the mesh, meaning that the mesh was refined until it did not present
significant changes in results. Thus, the mesh was set as tetrahedral and the global
parameters were: maximum size, 1,2; face size, 0,6; and numbers of cells across the gap, 3.
It was applied a program controlled inflation with a growth rate of 1.2, at the whole model;
and a face sizing on the room boundaries, defining the element size as 0.10m and the same

49
growth rate of 1,2. The case 0 led to the total amount of 278312 nodes and 1469385
elements.
The domain configuration was established based on recent research (CÓSTOLA,
2006; MORAIS; LABAKI, 2013b): analysis type, stationary; heat transfer, isothermal at 20°C;
turbulence model, k epsilon. Then, the boundary conditions were defined as: domain side
walls, subsonic opening; domain top, free slip wall; domain ground and room walls– no slip
wall.
The wind direction was fixed as 90° towards the inlet opening for all simulation,
except at the simulations of the parameter orientation.
As recommended by several authors, the limit convergence criteria was set as
maximum residual of 10‐4 (CÓSTOLA; ALUCCI, 2007; LUKIANTCHUKI et al., 2016; MORAIS;
LABAKI; ROSA, 2012; PERÉN et al., 2015), and the minimum and maximum iterations were
fixed as 100 and 600 respectively. These configurations resulted in an average run time of 4
hours for each simulation and a total of 68 hours.
4.1.2 Results and discussion
Initially, it is presented an overview of the ventilation behavior by comparing the
average wind speed for all models. Then, an individual performance evaluation is conducted
by analyzing the increment on wind speed (adopting the base model as reference) and
velocity contour. The last one was also used to identify the minimal acceptable air
movement for summer and winter.

50
Figure 8. Average wind speed for all models.
By analyzing figure 8 it can be noted that the air movement was above the base
model speed only for size models and that the orientation models show the biggest
decrease. Therefore, it is possible to conclude that increasing the inlet and outlet area
demonstrated to be the best strategy to improve the air speed average. As for the other
cases, the average ventilation remained similar to case 0.
Figure 9. Increase in wind speed relative to the case 0, for size parameter models.
0.00
0.10
0.20
0.30
0.40
0.50
0.60
0.70
1 2 3 4
Avg wind speed (m/s)
case 0 area proportionposition orientation
‐100%
‐80%
‐60%
‐40%
‐20%
0%
20%
40%
60%
80%
100%
case area 1 case area 2 case area 3 case area 4
wind speed increase %
Center ponit Average
smaller
window
bigest
window
112,5° 180°
51
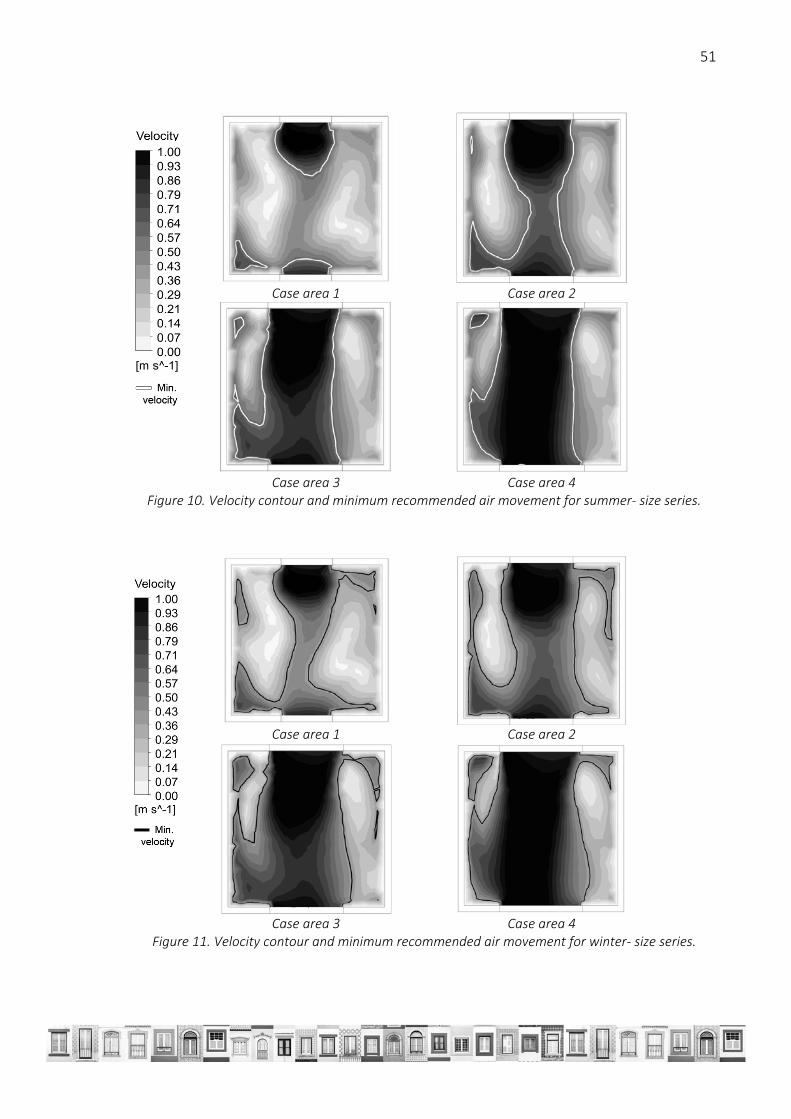
Case area 1 Case area 2
Case area 3 Case area 4
Figure 10. Velocity contour and minimum recommended air movement for summer‐ size series.
Case area 1 Case area 2
Case area 3 Case area 4
Figure 11. Velocity contour and minimum recommended air movement for winter‐ size series.

52
The analysis of the size parameter shows that as the window area increases the
average wind speed also increases, as expected (figure 9). However, while the area increased
by 4 times, average speed was only enhanced by 1.66 times. It is also noted that after the
center point reached the inlet speed (0,92 m/s), the ventilation could not be improved even
with bigger opening areas.
Figure 10 and figure 11 show the qualitative aspect of the size models. It is noted
that this opening geometry provides a good homogeneity which improves, as the windows
grow bigger. Summer minimal air movement is not fully achieved at any of the size models;
the first model only reaches proper ventilation on the windows proximities, and even for the
larger window it is not achieved at the sides of the room (figure 10). The inlet area
enhancement also provides acceptable wind speed in winter (figure 11).
Figure 12. Increase in wind speed relative to the base model, for proportion parameter series.
‐100%
‐80%
‐60%
‐40%
‐20%
0%
20%
40%
60%
80%
100%
case prop 1 case prop 2 case prop 3 case prop 4
wind speed increase %
Center ponit Average
Horizomntal
Vertical

53
Case prop 1 Case prop 2
Case prop 3 Case prop 4
Figure 13. Velocity contour and minimum recommended air movement for summer ‐ proportion series.
Case prop 1 Case prop 2
Case prop 3 Case prop 4
Figure 14. Velocity contour and minimum recommended air movement for winter ‐ proportion series

54
Figure 12 stands for the proportion models. It shows an evident decrease on
center point velocities for cases Prop 01 and 02 (‐60 and ‐72% respectively), but there is no
considerable change in the average speed, thus indicating that the horizontal shapes
produce less homogeneous ventilation. In these windows, the acceptable speeds for
summer are close to the inlet openings (figure 13) and for winter there is a small area near
the outlet window as well (figure 14).
Vertical geometries revealed a decrease in the velocity at the center point, and
an irrelevant variation in the average (figure 12), thus indicating that wider geometry
performs better than slim ones.
Velocity contours, presented in figure 13 and figure 14 demonstrated that
vertical openings have a narrow and centered flux displaying higher values by the windows.
So the recommended air speed for summer is located only near the inlet, like for the
horizontal window, but appropriate velocities are also achieved in winter through the center
of the room.
Figure 15. Increase in wind speed relative to the base model, for position parameter series
‐100%
‐80%
‐60%
‐40%
‐20%
0%
20%
40%
60%
80%
100%
case posi 1 case posi 2 case posi 3 case posi 4
wind speed increase %
Center ponit Average
windowup
window
down
windowto
the side

55
Case posi 1 Case posi 2
Case posi 3 Case posi 4
Figure 16. Velocity contour and minimum recommended air movement for summer ‐ position series.
Case posi 1 Case posi 2
Case posi 3 Case posi 4
Figure 17. Velocity contour and minimum recommended air movement for winter ‐ position series.

56
The first case of parameter position (window up) displayed similar ventilation
behavior as compared to case 0 (figure 15). It only reaches the suggested speed in the
room`s center for both seasons (figure 16 e figure 17). The cases Posi 02 (window down), 3
and 4 (moved to the side) center point speed shows a reduction (figure 15). When the
window was located down there was low ventilation performance (30% decrease on the
average), and the air movement was below the minimum throughout the room. While for
models where the window was moved to the side, in spite of a low center velocity, the
average did not show representative changes, thus demonstrating that the flux, as the
proper air velocity, was also moved to the same side.
Figure 18. Increase in wind speed relative to the base model, for orientation parameter series.
‐100%
‐80%
‐60%
‐40%
‐20%
0%
20%
40%
60%
80%
100%
case 112,5° case 135° case 157,5° case 180°
wind speed increase %
Center ponit Average
112,5°
180°
135°
157,5°

57
Case orient 1 Case orient 2
Case orient 3 Case orient 4
Figure 19. Velocity contour and minimum recommended air movement for summer ‐ orientation series.
Case orient 1 Case orient 2
Case orient 3 Case orient 4
Figure 20. Velocity contour and minimum recommended air movement for winter ‐ orientation series.

58
As verified by several researches (AFLAKI et al., 2015; ALI; MILAD; ALI, 2007;
CÓSTOLA, 2006; LAMBERTS; DUTRA; PEREIRA, 2014; LUKIANTCHUKI; CARAM, 2012;
TOLEDO, 2006), when the wind angle towards the inlet becomes closer to 180º the average
ventilation speed drops (figure 18). Nevertheless, for the speed at the center point, even a
slight inclination means a significant decrease (90%). Results indicate that only angles from
90º to 135º promote proper ventilation in the room`s corner in any season (figure 19 and
figure 20), and show little change in the average speed. Wider angles represent significant
speed reduction in general and do not achieve the recommended ventilation in most of the
room.
4.1.3 Conclusion
This work intended to evaluate the influence of window geometry parameters
on natural ventilation of the studied room and to identify the most relevant ones.
In this regard, it was possible to conclude that the most significant parameters
were the size and orientation, showing great influence on average wind speed.
Nevertheless, while proportion and position prove to have little impact on the
amount of incoming air, they influence the distribution of ventilation in the room and
minimal wind speed was only partially achieved.
The results show that square windows provide a homogeneous ventilation. Also,
as the window becomes more horizontal the highest velocities tend to be closer to the inlet
area, while when it becomes more vertical, the flux tends to cross the room. Thus, the inlet
position on the façade influences the flow position, especially because the outlet was at the
same location on the opposite wall. So the lower window provided little air movement at
measured high (1,20m), and for the higher window irrelevant changes in the flow were
observed; when the openings were moved to the side the airflow was moved to the same
side. A possibility to reduce the influence of the position on ventilation could be the placing
of the outlet opening at an opposite position in relation to the inlet.

59
For this reason, it is important to define the position in the room where the
activities will take place before making a decision regarding the window design under
discussion.
In addition, windows should be positioned preferably between 45º and 135º
towards the prevailing wind. If it is not possible to adopt the suggested orientation,
additional active or passive measures should be predicted to ensure proper air speed, such
as air pumps or solar chimneys.
Thus, natural ventilation standards should also consider the studied parameters,
as their influence on wind distribution and minimal air movement availability is clear. In this
matter, it is likewise important to verify that there is a limit to enhance the wind speed,
because, even though the velocity of a point can be enhanced by the Venturi effect, after
the average interior speed achieves the exterior reference speed the window geometry is
not able to improve speed in it anymore.
Another significant fact is that the inlet area of 1m2 was not enough to provide
recommended wind speed (for the studied climate) to the entire room in any geometry or
attack angle.
In conclusion, we understand that there is no ideal window geometry, but it is
important to consider that different inlet shapes affect the interior airflow, and that
understanding how it works is important to the design of openings.
Finally, it is important to point out that further research could explore other
configurations, such as nonsymmetrical inlet and outlet, a bigger number of openings, and
nonparallel position for inlet and outlet.

60
4.2 THE INFLUENCE OF SURROUNDINGS OBSTRUCTION ON THE AIRFLOW OF A
RESIDENTIAL BUILDING
Wind driven ventilation is the most used passive strategy to remove the excess
of heat load of building in tropical climates (AFLAKI et al., 2015). It is a valuable approach to
achieve thermal comfort at low cost (MORAIS; LABAKI, 2013a) and therefore can contribute
to energy savings (PEREIRA et al., 2013).
Nevertheless, wind driven ventilation is a complex phenomenon and airflow
inside buildings can be influenced by many factors, such as the surroundings obstruction.
The accelerated growth of urban areas in the recent years drew attention to the influence
of urban density on airflow (BUCCOLIERI, 2011; NG et al., 2011; YUAN; NG, 2012), and
recommendations have been outlined to access designers to improve wind performance in
buildings (ALLARD; GHIAUS, 2005; KUANG; CHEN; SUN, 2015; MIRZAEI; HAGHIGHAT, 2012).
Researches demonstrate that the surroundings obstruction can change the
direction and intensity of the winds, directly affecting the ventilation flow inside the
buildings (OLIVEIRA, 2009). For example, a change of 5º in the incidence of wind can change
the flow of 5% to 40% (CÓSTOLA, 2006).
Another key feature is the wind attack angle towards the building windows (ALI;
MILAD; ALI, 2007; LUKIANTCHUKI; CARAM, 2012) which can represent up to 20% increase
in ventilation inside building (CÓSTOLA, 2006). A research on social housing investigated
three common architectural typologies in Brazil and showed that most of these building,
including the H‐shaped one, present ineffective wind ventilation systems. The authors
indicated that few low‐cost modifications would suffice to improve this situation, for
example: the correct orientation in relation to wind prevailing winds, the positioning of the
windows, and also the adoption of asymmetric building form (MORAIS; LABAKI, 2013a).
Although there are investigations about the influence of the surrounding
obstruction to airflow, some common architectural typologies have not yet been
investigated, such as the "double H" (two buildings shaped like an "H" positioned together).
In this regard, this paper aims to evaluate the effect of surroundings obstruction, floor level,
and wind attack angle on the airflow of a residential building configured as a "double H".

61
4.2.1 Method
The reference for this work is a residential building located in Piracicaba, São
Paulo State (Brazil). This study considered two surrounding obstruction situations
(obstructed and unobstructed) and 3 wind attack angles (0°, 45°, and 90°) resulting in 6
models. The data for this research were obtained through simulations in CFD
(Computational Fluid Dynamics), by using the software CFX Ansys 16.2.
4.2.1.1 Model
For the selection of the reference building, the following conditions were considered:
to be part of a social housing program, to have an usual floor plan for the considered city,
and to display uniform floor plan. Therefore Parque Piazza Navona residential complex was
chosen because it not only meets these criteria but was the most populated. It is composed
of 23 apartment blocks (as seen in figure 21‐a). The location of the building at the residential
complex (highlighted in figure 21‐a) was selected for being the most obstructed one. It was
adopted as a reference for the simulation of the obstructed surroundings, while for the
unobstructed models it was used the same building but without the surrounding.
The reference building is a four‐story building configured as a "double H" (two
buildings shaped like an "H" positioned together) and it forms a central courtyard limited by
the stairs towers. It also presents two side recesses figure 21‐b). The apartments are
composed of two bedrooms (nocturnal area), a kitchen integrated to living room (diurnal
area), and a bathroom (figure 22).
All windows of the building were considered of the same size (J1), except the
bathroom window that is smaller (J2), as described in Table 2. The bedrooms and bathrooms
have only one window, the integrated living room has two windows, as well as the corridor,
see Figure 22.
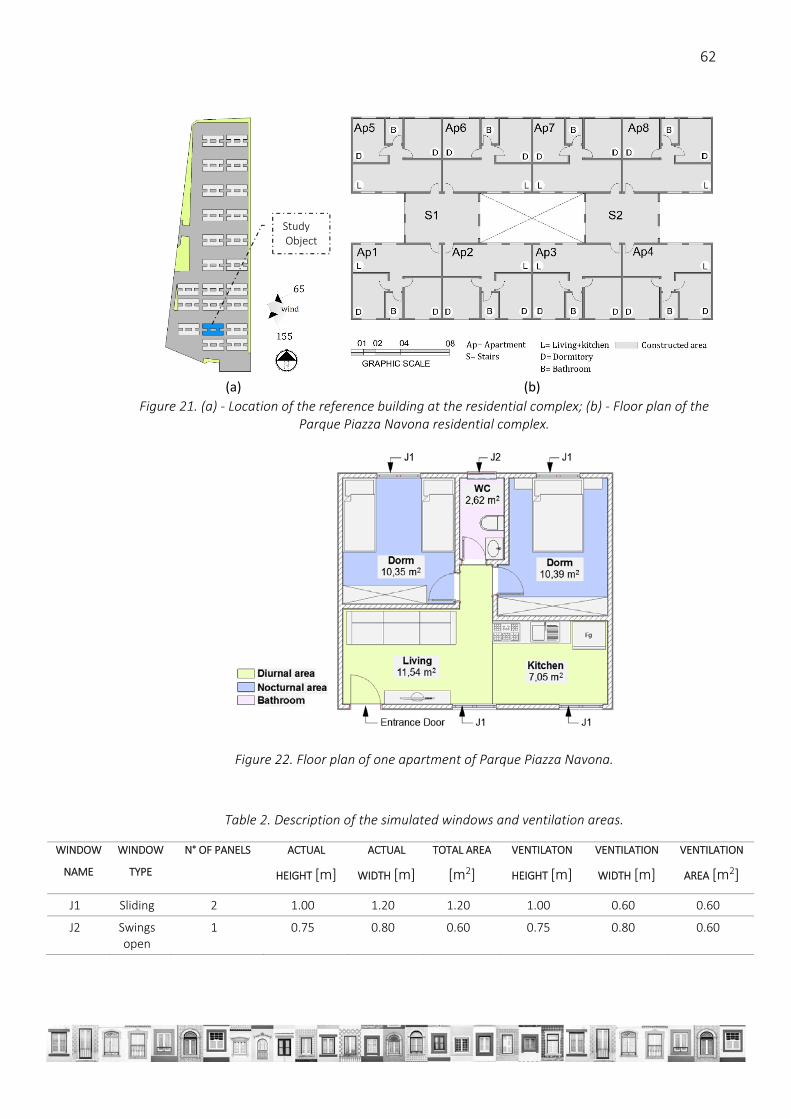
62
(a)
(b)
Figure 21. (a) ‐ Location of the reference building at the residential complex; (b) ‐ Floor plan of the Parque Piazza Navona residential complex.
Figure 22. Floor plan of one apartment of Parque Piazza Navona.
Table 2. Description of the simulated windows and ventilation areas.
WINDOW
NAME
WINDOW
TYPE
N° OF PANELS ACTUAL
HEIGHT [m]
ACTUAL
WIDTH [m]
TOTAL AREA
[m2]
VENTILATON
HEIGHT [m]
VENTILATION
WIDTH [m]
VENTILATION
AREA [m2]
J1 Sliding 2 1.00 1.20 1.20 1.00 0.60 0.60
J2 Swings open
1 0.75 0.80 0.60 0.75 0.80 0.60
Study Object

63
4.2.1.2 Computer simulation
The study was carried out in the CFD program CFX Ansys 16.2 , which was chosen
because it has been successfully applied in similar researches (CÓSTOLA; ALUCCI, 2007;
LUKIANTCHUKI; CARAM, 2012; MORAIS; LABAKI, 2013a). Two sets of models (obstructed
and unobstructed) were simulated for three wind incidences (0°, 45°, and 90°).
To enable the simulation of various wind attack angles it was adopted an
octagonal domain with a 674,43m diameter (50 times the object height) and 77,40m height
(5 times the object height), according to recommendations (CÓSTOLA; ALUCCI, 2007). This
configuration resulted in a blockage of 0.009%.
In order to represent the obstructed surroundings all buildings of the residential
complex were modelled (figure 23‐a), but for the unobstructed surroundings only the
analysed building was modelled (figure 23‐b). In addition, all internal partitions of the first
and last floor were modelled for the evaluated building.
(a)
(b)
Figure 23. Model of the buildings in CFX Ansys 16.2 with obstructed and (b) unobstructed surrounding.
The average wind speed of Piracicaba at 10 m height is 2,46m/s (RORIZ, 2012b),
this value was used as the reference wind speed entry for the simulations. In order to
consider the boundary layer effect a CCL (Common Command Language) expression was
Study Object

64
inserted on CFX, the profile was considered neutral, according to (CÓSTOLA; ALUCCI, 2007).
After applying this correction, the resulted average inlet speed was 1,06m/s and 2,27m/s,
for the first and fourth‐floor window level respectively.
Mesh independence tests were performed to ensure the accuracy of the model
and to define the mesh. Several simulations were carried out by refining the mesh each time.
This process continued until a finer mesh did not present significant changes in results,
according to other researches in the field (CÓSTOLA; ALUCCI, 2007; LUKIANTCHUKI; CARAM,
2012; MORAIS; LABAKI, 2013a). Thus, the mesh and the model’s domain were configured as
shown in table 3:
Table 3. Adopted configuration for CFX ANSYS 16.2 simulation.
GLOBAL PARAMETERS DOMAIN INPUT
SIZING DOMAIN CONFIGURATION
numbers of cells across gap= 3 analysis type= stationary
face size= 2 heat transfer= isothermal at 20ºC
maximum size= 4 turbulence model= k epsilon
growth rate= 1,2 BOUNDARY CONDITIONS
domain side walls= subsonic opening
domain top= free slip wall
domain ground and room walls= no slip wall
MESH CONTROL ROUGHNESS = smooth wall
Face sizing CONVERGENCE CRITERIA
Local = building maximum residual = 10‐4
element size= 0.8m minimum iterations = 1
growth rate= 1,2 maximum iterations = 600
4.2.2 Results and discussion
In this section, the airflow inside the first and fourth‐floor apartments of the
models at three wind attack angle (0°, 45°, and 90°) is presented. Initially the models are
analyzed with the obstructed surrounding and then with the unobstructed one. The images
of the airflow (figures from 24 to 35) show a close‐up view of the studied building allowing

65
the analysis of its interior. In some images the wind attack angle is not clear in the close‐up
image due to turbulence, therefore it is indicated in the legend.
4.2.2.1 Unobstructed surrounding
By analysing the unobstructed model with wind attack of 0° (figure 24), it is clear
that in the first‐floor level the ventilation around the building is turbulent. In addition, the
windward apartments (Ap 01‐04) are well ventilated when only air velocity is considered but
the air quality could be harmed: in this apartments, the living room income air flows through
the bathroom, which can cause bad odours and increased humidity. For the apartments 06
and 07 (located in the courtyard) the airflow crosses the apartments 02 and 03 before it
flows through them, which can also cause bad odours. This is not a constant situation
because the ventilation of the leeward apartments only happens if all windows of the
windward apartments are open, otherwise the airflow rate in apartments 06 and 07 can be
reduced. In this model, all leeward apartments (Ap 05‐08) have low wind speed, and
ventilation occurs mostly due to turbulence. The ventilation on the fourth‐floor level (figure
25) presents similar behaviour inside the building, but on the outside, it is less turbulent and
has higher velocities.
Figure 26 shows that the apartments 02, 03, 04 and 05 are well ventilated, but
in the first three rooms the airflow in the living room comes from the bathroom, which
presents the same problems discussed previously. Then in the apartments 06 and 07 the
income air flows across the apartments 02, 03 and the stairs towers. On the fourth‐floor
level (figure 27) the income velocity is higher due to the boundary limit profile and
ventilation is less turbulent as compared to the first‐floor. In this floor, the apartments 01 –
04 behave in a similar manner to those with wind attack angle of 0°, except for the
apartment 05 that shows higher velocities and presents acceptable performance.
By observing the wind attack angle of 90° (figure 28 and figure 29), we can see
at the first‐floor the exterior ventilation is turbulent; then, at the fourth‐floor, it is more
stable and with higher velocities. In both floor levels only apartments 01 and 05 show good
ventilation.

66
Wind
direction
Figure 24. Airflow of the first‐floor apartments at wind attack angle of 0°, unobstructed
surrounding.
Wind
direction
Figure 25. Airflow of the fourth‐floor apartments at wind attack angle of 0°, unobstructed surrounding.

67
Wind
direction
Figure 26. Airflow of the first‐floor apartments at wind attack angle of 45°, unobstructed
surrounding.
Wind
direction
Figure 27. Airflow of the fourth‐floor apartments at wind attack angle of 45°, unobstructed surrounding.

68
Wind
direction
Figure 28. Airflow of the first‐floor apartments at wind attack angle of 90°, unobstructed
surrounding.
Wind
direction
Figure 29. Airflow of the first‐floor apartments at wind attack angle of 90°, unobstructed
surrounding.

69
4.2.2.2 Obstructed surrounding
Figure 30 shows the first‐floor of the obstructed model with wind attack of 0°.
In this situation, the wind around the building changes direction due to the obstructions.
The wind is tangent to the apartments 01 to 04 and for this reason the ventilation is due to
suction with adequate speed, but turbulent. Moreover, the air quality is compromised
because it flows through the bathroom before arriving at the living room. Apartments 05 to
08 have similar behaviour to the unobstructed ones at the same wind attack angle,
presenting low air speed. At the fourth‐floor (figure 31), the wind surrounding the building
has higher speed, but the airflow behaviour in the apartments is very similar to the ones on
the first‐floor.
The model with wind attack angle of 45° (figure 32 and figure 33) show a small
difference between the first and the fourth‐floor. The ventilation is not turbulent and the
wind direction does not change considerably. The apartments have low air speed, the first‐
floor presenting the higher values.
Figure 34 presents the results of first‐floor level at a wind angle of 90°: the wind
direction undergoes the influence of the obstruction and the flow is similar to that with 45°
wind incidence, but with lower velocities. Then at the fourth‐floor level (figure 35), the wind
direction is not influenced by the obstructions and speed is higher. However, the apartment
on both levels shows the same airflow behaviour. Since the first‐floor level has low‐income
airspeed and at the fourth‐floor the flow is tangent to the windows, all rooms present poor
ventilation.
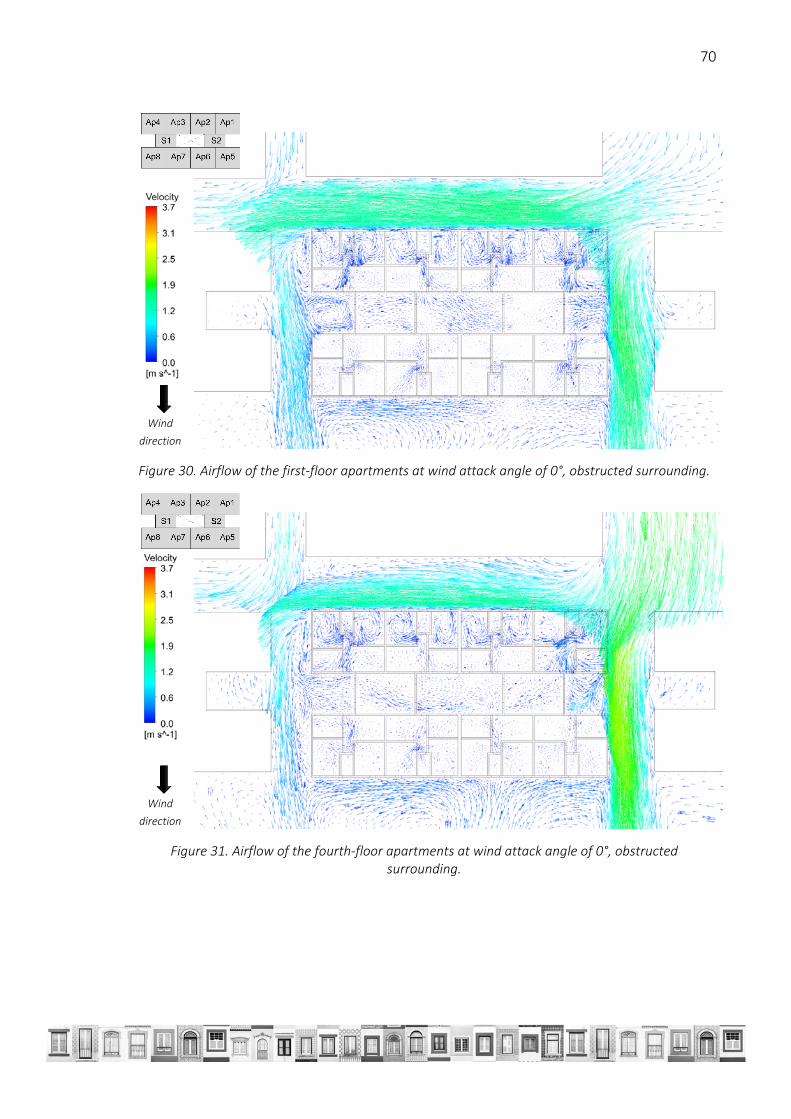
70
Wind
direction
Figure 30. Airflow of the first‐floor apartments at wind attack angle of 0°, obstructed surrounding.
Wind
direction
Figure 31. Airflow of the fourth‐floor apartments at wind attack angle of 0°, obstructed surrounding.
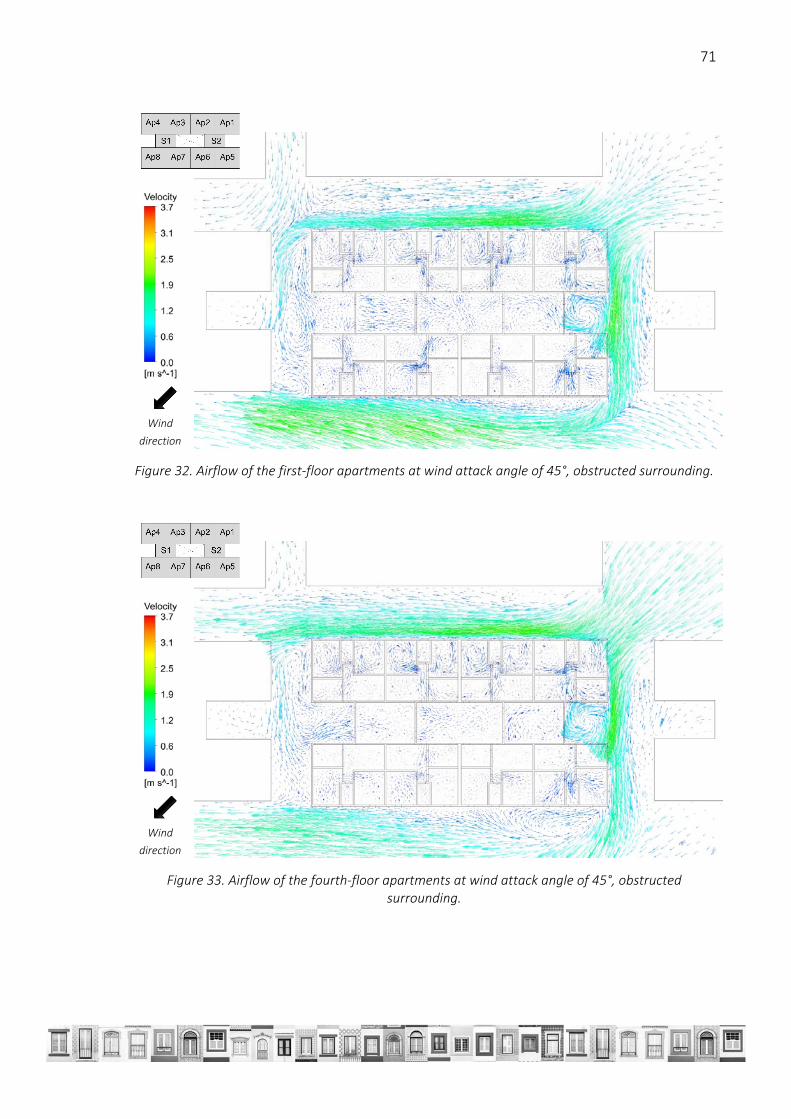
71
Wind
direction
Figure 32. Airflow of the first‐floor apartments at wind attack angle of 45°, obstructed surrounding.
Wind
direction
Figure 33. Airflow of the fourth‐floor apartments at wind attack angle of 45°, obstructed surrounding.

72
Wind
direction
Figure 34. Airflow of the first‐floor apartments at wind attack angle of 90°, obstructed surrounding.
Wind
direction
Figure 35. Airflow of the first‐floor apartments at wind attack angle of 90°, obstructed surrounding.

73
4.2.3 Conclusion
This study addressed the issue of airflow quality on a residential building
configured as a "double H", focusing on the effect of surroundings obstruction, wind attack
angle and floor level.
The analysis of the airflow around the buildings with unobstructed surroundings
indicates that the wind attack angle does not influence the velocity of the income air, but
influences the airflow and the turbulence levels. In addition, the floor level has a strong
influence on the income velocity due to the boundary limit profile.
In relation to the income airflow, it is noted that when the airflow is tangent to
the windows the ventilation inside the rooms is insufficient. Apartments with windows at
leeward also do not achieve good ventilation.
For these reasons, the "double H” shape building are not well ventilated in all
apartments, independent of wind attack angle, surroundings obstruction or floor level. This
leads to conclude that different options of building shapes should be considered, such as
leaving a space between the two “H”. This strategy prevents the airflow from crossing the
neighbour’s apartments before arriving at the apartment located leeward on the courtyard;
also it would provide better air circulation.
Another issue identified is that in some cases the income air in the living room
and kitchen comes from the bathroom, bringing undesired odours. A solution in these cases
could be to mirror the apartments position by always placing the living room and the kitchen
windows at the windward position.
The findings of this work can contribute to the quality of the built environment
in the country, since it evaluates a recurrent format in residential buildings in Brazil,
indicating solutions to the identified problems. In this way, it gives subsidy for the design of
new buildings with proper ventilation.

74
4.3 BEST WINDOWS SIZES FOR DIFFERENT SURROUNDING OBSTRUCTION AND
ORIENTATION IN A WIND DRIVEN VENTILATED BUILDING BASED ON
THERMAL PERFORMANCE
Design taking advantage of the wind driven ventilation is a recommended
strategy to reduce energy consumption in buildings (GIVONI, 1992; LAMBERTS et al., 2008;
RIVERO, 1986) . Nevertheless, to make proper use of this resource it is required an advanced
knowledge in the field and time‐consuming simulations. Thus, to allow greater applicability
of this resource guidelines that simplify the process of dimensioning wind driven ventilation
systems, as well as to approach the most relevant factors for natural ventilation are
necessary. Such factors are the topography, the wind direction and velocity, the heat load,
the proportion and shape of the building and window, the orientation, position in floor plan,
type and area of the windows (CÓSTOLA; ALUCCI, 2007; LAMBERTS; DUTRA; PEREIRA, 2014;
TOLEDO, 2006).
The current standards adopt a simplified approach to the topic, imposing a
minimum number of air exchanges per hour, minimum ventilation area, or maximum air
speed (AFLAKI et al., 2015; CANDIDO et al., 2010). These standards does not cover all the
important aspects mentioned before and requires further study.
In addition to the standards, some researchers also address this issue by
proposing methods for ventilation systems dimensioning for one face of a room (KHEMLANI,
1995; SUGA; KATO; HIYAMA, 2010), or hybrid ventilation and lighting systems in office
buildings (RUPP; GHISI, 2012), and different buildings proportion (INANICI; DEMIRBILEK,
2000).
Other authors focus on the investigation of important parameters that indirectly
lead to windows systems dimensioning guidance. The most investigated parameter in this
regard is the WWR (window to wall ratio), which is mostly appropriated to evaluate its
impact on the overheating, so that just a few researches explore the relation between the
WWR and wind driven ventilation.
Zmeureanu (1988) relates WWR to the cost benefit of various types of thermal
insulation and considers natural ventilation in the Montreal climate. Another case study

75
evaluated air quality, thermal, acoustic, and visual comfort, in Nigerian hospitals(STEPHEN
NIMLYAT; ZIN KANDAR; SEDIADI, 2015). Also, in Turkey, the ideal WWR for atrium and
courtyards was analyzed (TABESH; SERTYESILISIK, 2016).
Although there is a discussion about some aspects of the windows design, it is
noted that there are still some important factors related to natural ventilation that are not
addressed, indicating the need for researches especially in the residential field.
In this regard, we investigated the ideal windows sizes for a low‐rise building
with wind driven ventilation considering different building surroundings obstruction and
orientations. The evaluated parameters are based on the previous research presented in
item 4.1, and are consistent with the scale of the models. A list of all parameters evaluated
is presented: window area, the position of the windows on the floor plan, distance from the
ground, building surroundings obstruction and orientation. The building thermal
performance was adopted to evaluate the best windows systems, as recommended on
Brazilian standard NBR 15220 (ABNT, 2005) instead of the wind speed.
Therefore, this study aims to contribute to reducing the deficit of information
about sizing windows for the residential environment.
4.3.1 Method
The reference for this work is a residential building located in Piracicaba, São
Paulo State (Brazil). It was therefore modified by varying the area of the windows, building
surroundings obstruction and orientation. The data for this research were obtained through
simulations, which occurred in two steps: the first one in CFD to obtain the pressure
coefficients of the windows and then this information was fed to Energy Plus to perform the
thermal simulation.
The use of Energy Plus coupled with CFD improves the results accuracy because
it allows considering different wind directions and intensity, building’s heat load,
surrounding obstruction and orientation. This work did not consider proportions and
different shapes of the building and windows, neither windows discharge coefficient or
terrain topography.

76
The city climate is described as humid subtropical ‐ Köppen classification system
(CEPAGRI, 2016). The average humidity is higher than 70% through all year; the maximum
average temperature in summer is 28,50°C and in winter 26,19°C, the average minimum in
summer is 18,96°C and in winter 12,48°C (RORIZ, 2012a), which shows that even in winter
high temperatures are observed, therefore ventilation is needed throughout the year.
Figure 36. Rose of winds for Piracicaba. Source: Climate Consultant (MILNE, 2016)
The wind speed varies from 4,80 to 0,44 m/s with an average of 2,46m/s (value
used as the reference wind speed entry for the simulations). These data were extracted
from Piracicaba climate archive (RORIZ, 2012b) which were obtained at 10m above
ground. In order to consider the boundary layer effect a CCL (Common Command
Language) expression (CÓSTOLA; ALUCCI, 2007) was inserted on CFX, the profile was
considered neutral. After applying this correction, the resulted average inlet speed value
were 1,06m/s and 2,27m/s, for the first and fourth‐floor window level respectively. In
addition, for Piracicaba, the wind prevailing direction is from 65° to 155°, as seen in figure
36.
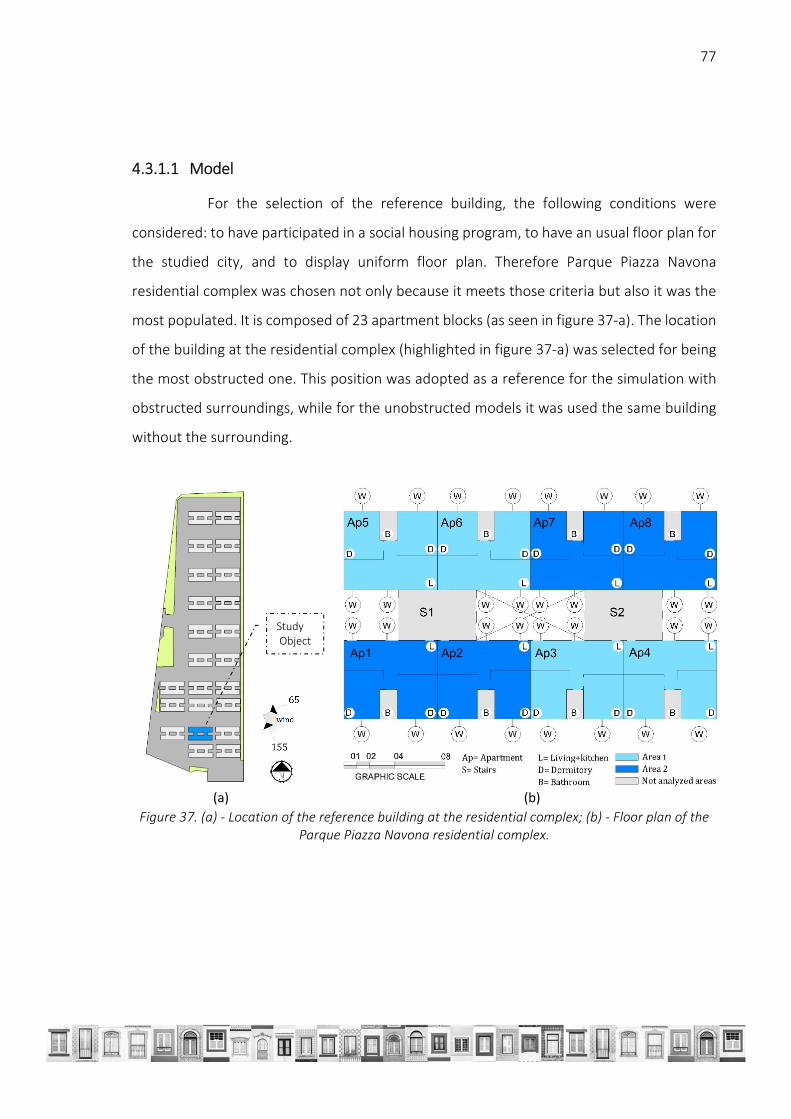
77
4.3.1.1 Model
For the selection of the reference building, the following conditions were
considered: to have participated in a social housing program, to have an usual floor plan for
the studied city, and to display uniform floor plan. Therefore Parque Piazza Navona
residential complex was chosen not only because it meets those criteria but also it was the
most populated. It is composed of 23 apartment blocks (as seen in figure 37‐a). The location
of the building at the residential complex (highlighted in figure 37‐a) was selected for being
the most obstructed one. This position was adopted as a reference for the simulation with
obstructed surroundings, while for the unobstructed models it was used the same building
without the surrounding.
(a)
(b)
Figure 37. (a) ‐ Location of the reference building at the residential complex; (b) ‐ Floor plan of the Parque Piazza Navona residential complex.
Study Object

78
(a)
(b)
Figure 38. (a) ‐ Floor plan of one apartment; (b) ‐ external view of Parque Piazza Navona residential complex.
The reference case is a four‐story building with typical materials and painted in
light colors (figure 38‐b). As seen in the floor plan, shown in figure 37‐b, the building is
configured as a "double H" (two buildings shaped like an "H" positioned together) so that it
forms a central courtyard and two side recesses. The apartments are composed of two
bedrooms, a bathroom and a kitchen integrated to the living room (figure 38‐a).
The presentation of the results is organized in two sections (4.3.2.1‐
Surroundings obstruction and 4.3.2.2‐Orientation). In the first session it was analyzed area
1 and in the second section areas 1 and 2 (see figure 37‐b and table 4). All rooms of the
apartments were simulated except for the bathroom since it is of low relevance for thermal
comfort.
Table 4. Description of the analyzed areas
Section Analyzed area
4.3.2.1‐Surroundings obstruction Area 1°
4.3.2.2‐Orientation Area 1 and 2°
4.3.1.2 Parametric variation
To determine the windows sizes to be tested, a calculation of window minimum
(30% of the floor area) and maximum (60% of the floor area) area was performed by applying
the currents Brazilian standards (ABNT, 2005, 2013b) to the apartments. These values were
based on existing Commercial Brazilian windows, therefore it was adopted the range from
0.6 to 4.0 m2. The selected sizes are shown in table 6 and figure 39. Windows J60, J120 and

79
J160 are the most common and inexpensive ones. In addition, the cases suffered variation
on the parameters: surroundings obstruction, orientation and window area as described in
table 5, generating 30 case studies.
Table 5. Description of the simulated models
SURROUNDINGS OBSTRUCTION
ORIENTATIONS WINDOW TESTED NUMBER OF SIMULATIONS
obstructed 0°, 45°, 90°, and 135° J60, J120, J160, J260, J330, and J400 24
unobstructed 0° J60, J120, J160, J260, J330, and J400 6
Table 6. Description of the simulated windows and ventilation areas.
NAME N° OF SLIDING
PANELS
ACTUAL HEIGHT
[m]
ACTUAL
WIDTH [m]
TOTAL AREA
[m2]
VENTILATON
HEIGHT [m]
VENTILATION
WIDTH [m]
VENTILATION
AREA [m2]
J60 2 1.00 1.20 1.20 1.00 0.60 0.60
J120 2 1.20 2.00 2.40 1.20 1.00 1.20
J160 3 1.20 2.00 2.40 1.20 1.33 1.60
J260 3 1.50 2.60 3.90 1.50 1.73 2.60
J330 3 1.65 3.00 4.95 1.65 2.00 3.30
J400 3 2.00 3.00 6.00 2.00 2.00 4.00
Figure 39. Geometric scheme of the simulated windows and ventilation areas.

80
4.3.1.3 Computer simulation
For computer simulations, two software were used: CFX Ansys 16.2 (CFD
simulation) and the Energy Plus 8.4 (energy simulation). The settings are described as
follows:
CFX
Two sets of models (obstructed and unobstructed) were simulated for different
wind incidences. Thus, eight simulations were carried out for each set (unobstructed and
obstructed) by rotating the wind attack angle every 45°, starting from 0 up to 315°.
In order to obtain the pressure coefficients, 16 simulations were performed with
the software CFX Ansys 16.2 for different wind incidences and obstructions (further input to
the software Energy Plus). The simulations were carried out by rotating the wind attack angle
every 45°, starting from 0° up to 315°. To represent the obstructed surroundings all buildings
of the residential complex were modeled and for the unobstructed surroundings only the
analyzed building. All internal partitions for the first and last floor (evaluated floors in the
study) were modeled. Therefore, 64 pressure coefficients were extracted from each model,
considering the central point of each window present in the studied rooms (identified with
a “W” in figure 37‐b).
To enable the simulation of various wind attack angles it was adopted an
octagonal domain with a 674,43m diameter (50 times the object height) and 77,40m height
(5 times the object height), according to the recommendations of (CÓSTOLA; ALUCCI, 2007).
This configuration resulted in a blockage of 0.009%.
Mesh independence tests were performed to ensure the accuracy of the model
and to define the mesh. Several simulations were carried out by refining the mesh each time,
This process continued until a finer mesh did not present significant changes in results, as
proceeded in other rehearses in the field (CÓSTOLA; ALUCCI, 2007; LUKIANTCHUKI; CARAM,
2012; MORAIS; LABAKI, 2013a). Thus, the mesh and the model’s domain were configured as
shown in table 7:

81
Table 7. Adopted configuration for CFX ANSYS 16.2 simulation.
GLOBAL PARAMETERS DOMAIN INPUT
SIZING DOMAIN CONFIGURATION
numbers of cells across gap= 3 analysis type= stationary
face size= 2 heat transfer= isothermal at 20ºC
maximum size= 4 turbulence model= k epsilon
growth rate= 1,2 BOUNDARY CONDITIONS
domain side walls= subsonic opening
domain top= free slip wall
domain ground and room walls= no slip wall
MESH CONTROL ROUGHNESS = smooth wall
Face sizing CONVERGENCE CRITERIA
Local = building maximum residual = 10‐4
element size= 0.8m minimum iterations = 1
growth rate= 1,2 maximum iterations = 600
Energy Plus
The models were constructed in SketchUp with the aid of OpenStudio plugin.
The construction materials of the models were based on the actual case (listed in table 8),
and the internal loads were established following recommendations (PEREIRA et al., 2013),
see table 9.
Table 8. Materials used to compose the Energy Plus model.
LAYER 1 THICKNESS [M]
LAYER 2 THICKNESS [M] LAYER 3
THICKNESS [M]
TOTAL TRANSMITTANCE [W/M2K]
ABSORPTANCE
Exterior Wall
Mortar 0,025 Concrete block
0,09x0,19x0,39 2,78 0,6
Interior Wall
Mortar 0,025 Ceramic block
0,09x0,14x0,24 Mortar 0,025 2,46 0,6
Slab Concrete 0,14 x x x x 2,7 0,3
Table 9. Internal loads used to configure the Energy Plus model.
TYPE OF LOAD AMOUNT UNIT
People 4
Lighting 10.6 W/m²
Electric equipment 3.9 W/m²

82
Due to symmetry, it was possible to reduce the numbers of simulations by
varying the orientation only at one‐quarter of the circle (0°, 45°, 90°, and 135°). “Shading”
objects were used to represent the surrounding’s obstruction. The wind obstruction was
already considered at CFD.
Natural ventilation was simulated in all studied apartments (see figure 37) using
the object Airflow Network, with simulation control "Multizone Without Distribution", and
pressure coefficients extracted from the CFD model. The maximum number of iterations
was equal to 500 according to recommendations (PEREIRA et al., 2013). The windows were
considered always open in order to understand the full potential to mitigate thermal
discomfort through natural ventilation in different models.
4.3.2 Results and discussion
This study adopted as performance indicator the Adaptive Comfort Degree‐Days
(for overheating) (MCGILLIGAN; NATARAJAN; NIKOLOPOULOU, 2011), which is calculated as
the difference between the operative temperature and the adaptive comfort model of
temperature for hot thermal sensation. This method allows to evaluate the intensity of
discomfort throughout the day (NICO‐RODRIGUES et al., 2015); and is a well‐known method
for naturally ventilated environments.
The results are organized in two sections, the first one analyzing the building
surroundings obstruction and then evaluating the building orientations as follows:
4.3.2.1 Surroundings obstruction
In this section, it was analyzed the obstructed and unobstructed models at
orientation 0°, and in order to simplify data manipulation, we considered only apartments
01, 02, 07, 08 at both first and fourth‐floor (see figure 37‐b).
Figure 40 presents the average operative temperatures of the apartments with
different window sizes and surrounding obstructions. The apartments with unobstructed
surrounding (figure 40‐a) have a wider range of temperatures than those with obstructed

83
surrounding figure 40‐b). In addition, it can be observed that the temperature of apartments
with window J400 are higher than the others. This happens because on the obstructed
surrounding models the studied building is shaded by the neighboring ones and the interior
air speed is reduced due to the obstructions (as discussed in item 4.2).
(a)
(b)
Figure 40. Daily variation of the operative temperature in apartments with different window sizes, on the summer solstice. (a) unobstructed and (b) obstructed surrounding.
The analysis shown in table 11 and table 12 presents the best and the second
best window sizes, which means the models with the lowest values of Degree Days of
Thermal Discomfort by Heat. Also, these results are classified by size, as follows: 0,60 to 1,20
m2‐ small; 2,60 to 1,60 m2 ‐ medium; 3,30 to 4,00 m2‐ big. To enable the study applicability
to other hot climates the results are also sorted by temperature ranges.
17
19
21
23
25
27
29
0:00
2:00
4:00
6:00
8:00
10:00
12:00
14:00
16:00
18:00
20:00
22:00
Operative temp. C
°
Time
External Air Temp Ap. with J60 window
Ap. with J120 window Ap. with J160 window
Ap. with J260 window Ap. with J330 window
Ap. with J400 window
17
19
21
23
25
27
29
0:00
2:00
4:00
6:00
8:00
10:00
12:00
14:00
16:00
18:00
20:00
22:00
Operative temp. C
°
Time
External Air Temp Ap. with J60 window
Ap. with J120 window Ap. with J160 window
Ap. with J260 window Ap. with J330 window
Ap. with J400 window

84
Table 10. Best window sizes based on Degree Days of Thermal Discomfort, unobstructed models.
SET
TEMPERATURE RANGE
BEST WINDOW SIZE 1st 2nd 1st 2nd 1st 2nd 1st 2nd1st Floor_AP 01_dorm* J60 J120 J260 J330 J60 J120 J60 J120 small1st Floor _AP 02_dorm* J60 J120 J260 J330 J60 J120 J60 J120 small1st Floor _AP 07_dorm* J60 J120 J160 J330 J60 J120 J60 J120 small1st Floor _AP 08_dorm* J60 J120 J330 J120 J60 J120 J60 J120 small1st Floor _AP 01_sala J60 J120 J330 J260 J60 J120 J60 J120 small1st Floor _AP 02_sala J60 J120 J260 J330 J60 J120 J60 J120 small1st Floor _AP 07_sala J60 J120 J330 J260 J60 J120 J60 J120 small1st Floor _AP 08_sala J60 J120 J260 J160 J60 J120 J60 J120 small4th Floor_AP 01_dorm* J160 J120 J330 J160 J120 J160 J160 J120 medium 4th Floor_AP 02_dorm* J120 J160 J330 J160 J160 J120 J120 J160 medium 4th Floor_AP 07_dorm* J120 J60 J330 J160 J120 J60 J120 J160 small4th Floor_AP 08_dorm* J120 J60 J330 J160 J60 J120 J120 J160 small4th Floor_AP 01_sala J60 J120 J160 J330 J60 J120 J120 J60 small4th Floor_AP 02_sala J60 J120 J330 J160 J160 J120 J120 J160 small4th Floor_AP 07_sala J120 J60 J120 J330 J120 J60 J160 J120 small4th Floor_AP 08_sala J60 J120 J160 J120 J120 J160 J120 J160 small
UNOBSTRUCTED SET
Most frequent window size
all simulated 24-27°C 27,1-29°C 29,1-31°C
Table 11. Best window sizes based on Degree Days of Thermal Discomfort, obstructed models.
SET
TEMPERATURE RANGE
BEST WINDOW SIZE 1st 2nd 1st 2nd 1st 2nd 1st 2nd1st Floor_AP 01_dorm* J60 J120 J400 J330 J60 J120 J60 J120 small1st Floor _AP 02_dorm* J60 J120 J400 J330 J60 J120 J60 J120 small1st Floor _AP 07_dorm* J60 J120 J400 J330 J60 J120 J60 J120 small1st Floor _AP 08_dorm* J60 J120 J330 J400 J60 J120 J60 J120 small1st Floor _AP 01_sala J60 J120 J400 J330 J60 J120 J60 J120 small1st Floor _AP 02_sala J60 J120 J120 J260 J60 J120 J60 J120 small1st Floor _AP 07_sala J60 J120 J260 J160 J60 J120 J60 J60 small1st Floor _AP 08_sala J60 J120 J260 J330 J60 J120 J60 J120 small4th Floor_AP 01_dorm* J160 J260 J120 J400 J260 J160 J260 J160 medium 4th Floor_AP 02_dorm* J260 J160 J60 J400 J330 J260 J260 J330 medium 4th Floor_AP 07_dorm* J260 J160 J400 J260 J160 J400 J260 J330 medium 4th Floor_AP 08_dorm* J260 J160 J330 J400 J260 J330 J260 J330 medium 4th Floor_AP 01_sala J160 J120 J260 J330 J160 J120 J260 J160 medium 4th Floor_AP 02_sala J160 J260 J260 J400 J160 J260 J260 J160 medium 4th Floor_AP 07_sala J260 J330 J330 J400 J330 J400 J260 J330 big4th Floor_AP 08_sala J260 J330 J260 J330 J330 J260 J400 J260 medium
OBSTRUCTED SET
Most frequent window size
24-27°Call simulated 27-29°C 29-31°C
*Average of the two
bedrooms
Subtitle:
small
medium
large
*Average of the two
bedrooms
Subtitle:
small
medium
large

85
(a)
(b)
(c)
Figure 41. (a) Ideal windows average area of the dorms and living rooms on the first and fourth‐floor; (b) Ideal windows average area of the rooms on the first and fourth‐floor; (c) Ideal windows
average area of the obstructed and unobstructed sets.
In unobstructed models (table 12), the first‐floor apartments present better
performance with smaller windows, except for the temperature range 24‐27 ° C. At this
temperature the best windows for the bedrooms are medium and large (1,60 to 3,30 m2) as
for the living rooms large windows are better (2.60 to 400 m2). For the rooms on the fourth‐
floor apartments, the ideal window sizes were higher than in the first one. For the whole
simulation, the best windows are also small. By considering the higher temperatures (27‐
31°C) the best performance varies from 1.60 to 2.60m2 (medium). For the lowest
temperature range the best windows are from medium to large (2,60 to 3,30m2). In the
living rooms in this floor the ideal size of the windows is similar to the bedrooms, being
smaller at 27‐29°C temperature range for the whole simulation.
By analyzing the models of obstructed surroundings (table 5), we noted that at
the first‐floor apartment the small windows are ideal in all temperatures ranges except at
24‐27°C, showing that in this model large windows are better. In the fourth‐floor, the
windows with better performance are the medium and large; however, for the living room
in the temperatures range of 24‐27°C small windows also show good performance.
Figure 43‐a allows evaluating the position of the opening regarding the building
floor plan. On the first‐floor, the room’s exposition to the sun was not influential. In the
fourth‐floor at the shaded rooms (living rooms), the ideal window size is small for all
0 1 2 3 4
all simulated
24‐27°C
27‐29°C
29‐31°C
Avg Window Area (m²)
4tht Floor _sala 4th Floor_dorm
1st Floor _sala 1st Floor _dorm
0 1 2 3 4
all simulated
24‐27°C
27‐29°C
29‐31°C
Avg Window Area (m²)
4th Floor 1st Floor
0 1 2 3 4
all simulated
24‐27°C
27‐29°C
29‐31°C
Avg Window Area (m²)
Obstructed Unobstructed

86
temperatures except for high ones. Still, regarding the floor plan, the living rooms facing the
courtyard show the same performance than those located on the outer edge of the building.
It is important to note that, even if the courtyard did not influence the thermal behavior, it
can affect the air quality and does not provide a constant ventilation (as discussed in item
4.2). On the other hand, the influence of the room’s exposition to the sun has proved to be
relevant.
In the next step, it was evaluated the window height regarding the ground
(figure 43‐b). It was observed that at the top floor the ideal windows are bigger than at the
first‐floor, the exception being the low‐temperature range when floor height has little
influence on the average.
Therefore, concerning the obstruction of the surrounding (figure 43‐c), it is clear
that for the obstructed models the best windows sizes are bigger than for the unobstructed
ones. This is due to the reduction of the air speed by the obstructions as well as to the
shading caused by the surrounding.

87
4.3.2.2 Orientation
To evaluate the building orientation, all apartments of the obstructed models
were analysed at four orientations (0°, 45°, 90°, and 135°).
Figure 42 presents the average operative temperatures of the apartments by
considering different window sizes. It is clear that in all cases the temperature curves are
similar, but it can be noted that the apartments with the smaller window (J60) shows the
highest temperatures while the lowest temperatures occur at apartments with J300.
Figure 42. Daily variation of the operative temperature in apartments with different window sizes, for the summer solstice.
Table 12 presents the best and the second best window sizes, which means the
models with the lowest values of Adaptive Comfort Degree‐Days. The ideal window size for
the fourth‐floor was also represented by color in the floorplan; the first‐floor is not
approached because is presented uniform results, as seen in table 12. These results were
classified by window size, as follows: 0,60 to 1,20m2 ‐ small; 2,60 to 1,60m2 ‐ medium; 3,30
to 4,00m2 ‐ big.
By analyzing table 12, we note that for all orientations apartments on the first‐
floor require small windows (from 0,60 to 1,20 m²). It is also clear for apartments on the
fourth‐floor that the ideal windows for orientation 0° and 135° were the same, and for the
17
19
21
23
25
27
29
0:00
1:00
2:00
3:00
4:00
5:00
6:00
7:00
8:00
9:00
10:00
11:00
12:00
13:00
14:00
15:00
16:00
17:00
18:00
19:00
20:00
21:00
22:00
23:00
Operative temp. C
°
Time
External Air Temp Ap with J60 windows Ap with J120 windows
Ap with J160 windows Ap with J260 windows Ap with J330 windows
Ap with J400 windows

88
orientation 45° and 90°, the windows were similar. The dormitory of the fourth‐floor
presented similar needs for every orientation, and the most frequent window size was
medium. Only at the orientations 45° and 90°, the dormitory of apartment one required
small windows as the second best (1,20m²). The best window sizes for the living room and
kitchen are different for each model. At 0° and 135°, the ideal windows are from 0,60 to
3,30m². The wide range of sizes presented in these orientations can be explained by the
prevailing winds, as it becomes more clear in figure 43‐c.
By observing the floor plan shown in table 12, it is clear that the courtyard does
not show the thermal behavior as occurs in apartments with obstructed surrounding, since
all the windows with view to the interior (the ones on the recess and those on the courtyard)
show similar behavior. Nevertheless, it is relevant to note that this situation provides
unreliable and poor quality ventilation, as brought to light on item 4.2.
Figure 43‐a shows that window sizes for the first‐floor are smaller than for the
fourth‐floor since apartments on the first‐floor need less ventilation to reach the ideal
temperature due to contact with the ground. In addition, windows on the first‐floor do not
show any influence of the building orientation, which was not the model for the fourth‐floor.
In the first‐floor, the influence of the wind attack angle is reduced because at this height the
wind speed is low for all directions.
In respect to the results concerning orientation, figure 43‐b shows that for
building orientations 0° and 135° the windows should be bigger. This phenomenon is better
explained through figure 43‐c, where it is clear that apartments oriented to northeast, east
and southeast require smaller windows. These orientations coincide with the prevailing wind
and also receive less solar radiation. It is worth of noting that the behavior of the living room
and the bedroom are very similar.
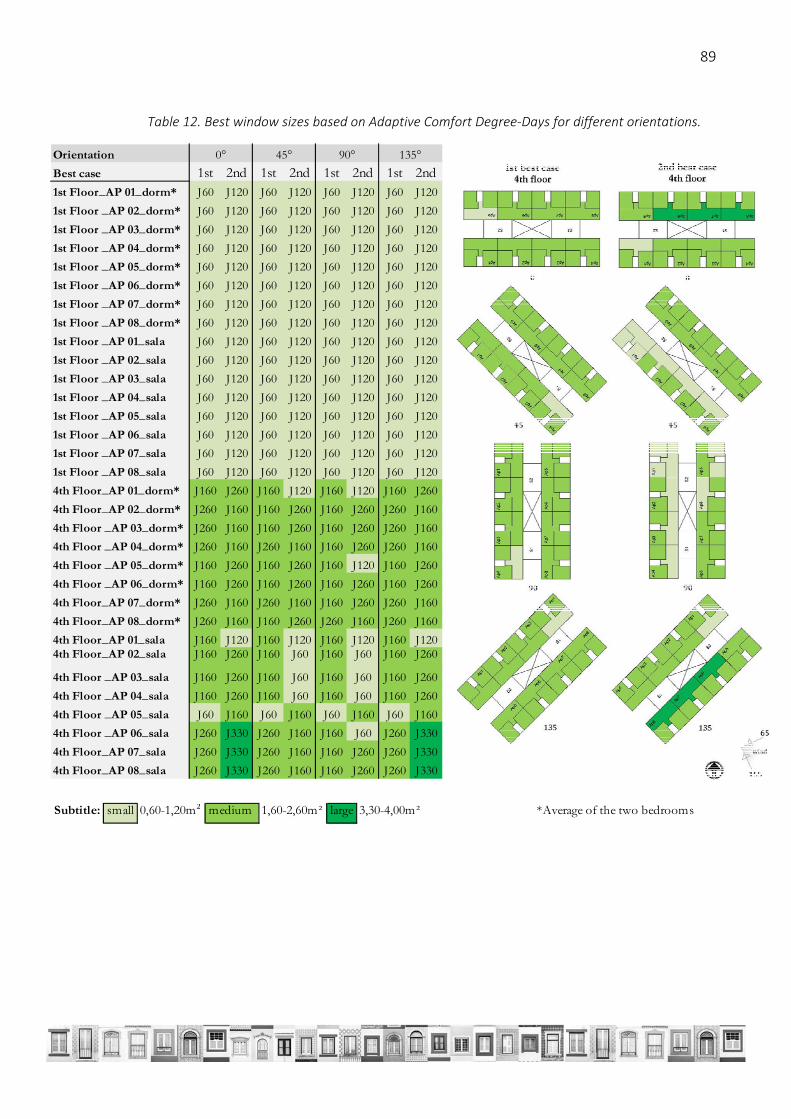
89
Table 12. Best window sizes based on Adaptive Comfort Degree‐Days for different orientations.
Orientation
Best case 1st 2nd 1st 2nd 1st 2nd 1st 2nd1st Floor_AP 01_dorm* J60 J120 J60 J120 J60 J120 J60 J120
1st Floor _AP 02_dorm* J60 J120 J60 J120 J60 J120 J60 J120
1st Floor _AP 03_dorm* J60 J120 J60 J120 J60 J120 J60 J120
1st Floor _AP 04_dorm* J60 J120 J60 J120 J60 J120 J60 J120
1st Floor _AP 05_dorm* J60 J120 J60 J120 J60 J120 J60 J120
1st Floor _AP 06_dorm* J60 J120 J60 J120 J60 J120 J60 J120
1st Floor _AP 07_dorm* J60 J120 J60 J120 J60 J120 J60 J120
1st Floor _AP 08_dorm* J60 J120 J60 J120 J60 J120 J60 J120
1st Floor _AP 01_sala J60 J120 J60 J120 J60 J120 J60 J120
1st Floor _AP 02_sala J60 J120 J60 J120 J60 J120 J60 J120
1st Floor _AP 03_sala J60 J120 J60 J120 J60 J120 J60 J120
1st Floor _AP 04_sala J60 J120 J60 J120 J60 J120 J60 J120
1st Floor _AP 05_sala J60 J120 J60 J120 J60 J120 J60 J120
1st Floor _AP 06_sala J60 J120 J60 J120 J60 J120 J60 J120
1st Floor _AP 07_sala J60 J120 J60 J120 J60 J120 J60 J120
1st Floor _AP 08_sala J60 J120 J60 J120 J60 J120 J60 J120
4th Floor_AP 01_dorm* J160 J260 J160 J120 J160 J120 J160 J260
4th Floor_AP 02_dorm* J260 J160 J160 J260 J160 J260 J260 J160
4th Floor _AP 03_dorm* J260 J160 J160 J260 J160 J260 J260 J160
4th Floor _AP 04_dorm* J260 J160 J260 J160 J160 J260 J260 J160
4th Floor _AP 05_dorm* J160 J260 J160 J260 J160 J120 J160 J260
4th Floor _AP 06_dorm* J160 J260 J160 J260 J160 J260 J160 J260
4th Floor_AP 07_dorm* J260 J160 J260 J160 J160 J260 J260 J160
4th Floor_AP 08_dorm* J260 J160 J160 J260 J260 J160 J260 J160
4th Floor_AP 01_sala J160 J120 J160 J120 J160 J120 J160 J1204th Floor_AP 02_sala J160 J260 J160 J60 J160 J60 J160 J260
4th Floor _AP 03_sala J160 J260 J160 J60 J160 J60 J160 J260
4th Floor _AP 04_sala J160 J260 J160 J60 J160 J60 J160 J260
4th Floor _AP 05_sala J60 J160 J60 J160 J60 J160 J60 J160
4th Floor _AP 06_sala J260 J330 J260 J160 J160 J60 J260 J330
4th Floor_AP 07_sala J260 J330 J260 J160 J160 J260 J260 J330
4th Floor_AP 08_sala J260 J330 J260 J160 J160 J260 J260 J330
0° 45° 90° 135°
Subtitle: small 0,60-1,20m² medium 1,60-2,60m² large 3,30-4,00m² *Average of the two bedrooms

90
(a)
(b)
(c)
Figure 43. (a) – average ideal windows area of the rooms on the first and fourth‐floor [m²]; (b) ‐average ideal windows area for different buildings orientations [m²]; (c) – average ideal windows
area for different window orientations [m²].
4.3.3 Conclusion
Thus, it was possible to evaluate the sizing of openings from the viewpoint of
thermal comfort in naturally ventilated buildings, indicating those models with the best
thermal performance, therefore contributing to improve the knowledge of the openings
design and consequently to reduce energy costs.
Analyzing the window size with respect to the floor height, it is noted that at the
first‐floor the optimal windows were smaller than for the fourth‐floor. This happens because
at the first‐floor temperatures are milder due to contact to the ground and its lower
exposure to the sun; on the other hand at the top floor the heat gain through the roof causes
increased temperatures, thus requiring higher wind speed.
For the Piracicaba climate, the wind does not blow predominantly from a single
direction but from a range of angles, thus we considered the range of wind predominance
to evaluate its influence on different window dimensions. Therefore, at the process of
designing windows in different climates, it is recommended to observe if this is a similar
model or not. Even when the occurrence of prevailing winds is low, this direction influences
the ideal window size, which means that windows oriented to the prevailing wind can be
smaller than the leeward ones.
0.0
0.5
1.0
1.5
2.0
2.50°
45°
90°
135°
1st Floor 4th Floor
0.0
0.5
1.0
1.5
2.0
2.50°
45°
90°
135°
window size
0.0
0.5
1.0
1.5
2.0
2.5N
NE
E
SE
S
SW
W
NW
dorm liv total
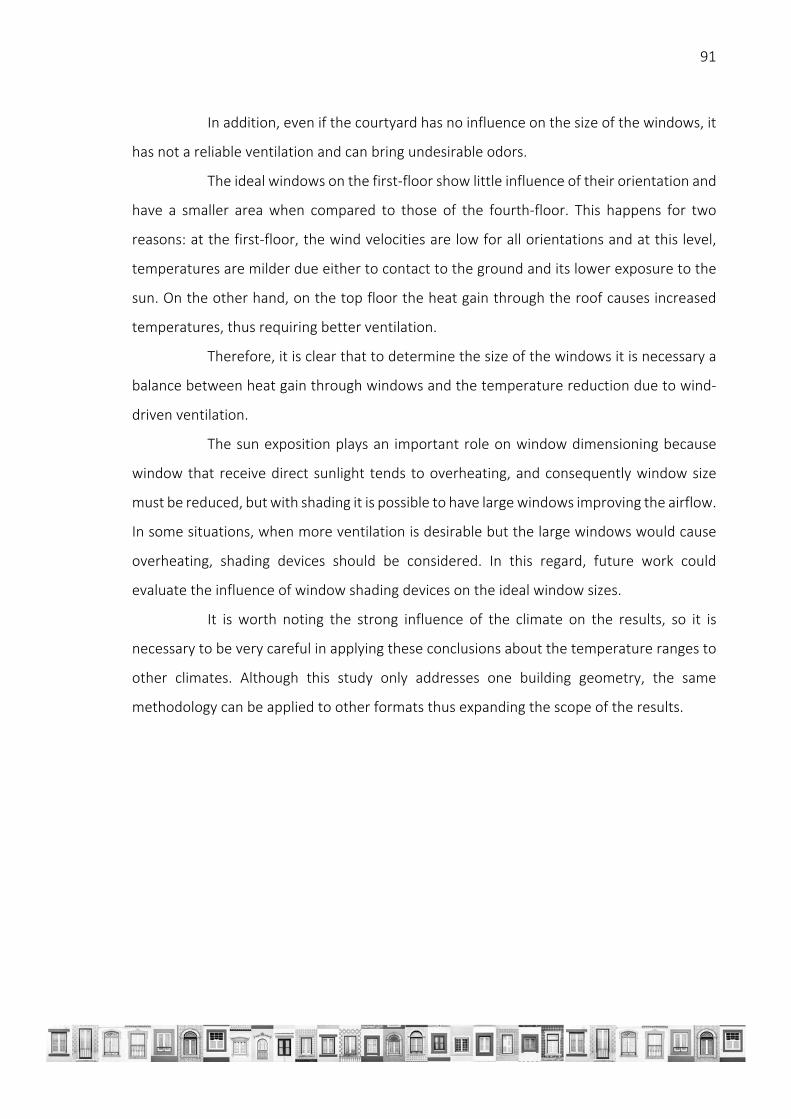
91
In addition, even if the courtyard has no influence on the size of the windows, it
has not a reliable ventilation and can bring undesirable odors.
The ideal windows on the first‐floor show little influence of their orientation and
have a smaller area when compared to those of the fourth‐floor. This happens for two
reasons: at the first‐floor, the wind velocities are low for all orientations and at this level,
temperatures are milder due either to contact to the ground and its lower exposure to the
sun. On the other hand, on the top floor the heat gain through the roof causes increased
temperatures, thus requiring better ventilation.
Therefore, it is clear that to determine the size of the windows it is necessary a
balance between heat gain through windows and the temperature reduction due to wind‐
driven ventilation.
The sun exposition plays an important role on window dimensioning because
window that receive direct sunlight tends to overheating, and consequently window size
must be reduced, but with shading it is possible to have large windows improving the airflow.
In some situations, when more ventilation is desirable but the large windows would cause
overheating, shading devices should be considered. In this regard, future work could
evaluate the influence of window shading devices on the ideal window sizes.
It is worth noting the strong influence of the climate on the results, so it is
necessary to be very careful in applying these conclusions about the temperature ranges to
other climates. Although this study only addresses one building geometry, the same
methodology can be applied to other formats thus expanding the scope of the results.

92
5 CONCLUSÃO FINAL
Este trabalho teve como objetivo investigar o dimensionamento de sistemas de
ventilação em prédios residenciais ventilados pela ação dos ventos e o seu impacto no
desempenho térmico. A pesquisa se dividiu em três etapas: na primeira foram investigados
parâmetros geométricos de dimensionamento de sistemas de abertura em um cômodo. Na
segunda, foi avaliado o comportamento do fluxo de ar em um prédio residencial. Na última
etapa, foram avaliadas as configurações de abertura que resultam em situações de conforto
térmico em edifícios residenciais.
Na primeira etapa pode‐se verificar que os principais fatores para o
dimensionamento das aberturas em um cômodo são a área e orientação das aberturas, pois
apresentaram significativa influência na média da velocidade do ar no interior do cômodo
estudado.
A proporção e posição das aberturas podem ser considerados parâmetros
secundários, pois influenciaram o fluxo e a uniformidade do movimento do ar, apesar de
não terem mostrado grande influência na média das velocidades. Também foi observado
que a melhor orientação para as janelas é entre 45º e 135º em relação aos ventos
predominantes.
Antes de dimensionar as janelas de um edifício é necessário definir o tipo e
localização das atividades previstas para os ambientes em questão para então verificar o
movimento do ar desejável para o espaço. Por exemplo, em locais onde se realizam
atividades como escrita e leitura, altas velocidades do ar causam incômodo e, portanto, seria
melhor que o fluxo de ar fosse direcionado para outro ponto do cômodo; por outro lado,
onde são previstas atividades como descanso, o vento é bem‐vindo, podendo‐se então
prever o ar fluindo por ali.
As normas de ventilação natural brasileiras não consideram todos os parâmetros
estudados. Como ao longo do estudo ficou clara a influência da área, orientação, posição e
proporção das aberturas, recomenda‐se sua inclusão nas normas.
Na etapa dois foi identificado que o formato em “duplo H”, apesar de
largamente aplicado no estado de São Paulo, não provê boa ventilação em todos os
apartamentos; assim recomenda‐se a adoção do formato de “H” comum que possibilita
93
maior fluxo e qualidade do ar. Além disso, deve haver uma preocupação com a posição do
banheiro, evitando‐se que a sua janela sirva de entrada de ar para outros ambientes.
Finalmente, na terceira etapa foi possível identificar que não há um único
tamanho ideal de janela para todo um edifício. Cada janela deve ser pensada levando‐se em
conta sua posição em planta (exposição ao sol e aos ventos), altura com relação ao solo,
obstrução do entorno e orientação com relação ao sol e aos ventos predominantes.
É importante ressaltar que os fatores a serem considerados para um projeto de
sistema de ventilação pela ação dos ventos dependem da escala e objetivos do projeto.
Quando se projeta ambientes com um uso definido, é possível pensar nos caminhos do
vento, induzindo o fluxo para onde são desejáveis maiores velocidades do ar; assim,
recomenda‐se considerar a área, proporção, posição e orientação da janela. Porém, quando
se projeta ambientes genéricos, este tipo de detalhamento não é possível; nestes casos leva‐
se em conta a área e orientação das janelas. Já os parâmetros posição em planta, altura em
relação ao solo, obstrução do entorno e orientação sempre devem ser considerados.
Em uma aplicação prática destes conceitos nem sempre é possível projetar
janelas de diferentes tamanhos em um mesmo prédio, neste caso sugere‐se a adoção do
maior tamanho de janela, pois em caso de desconforto é possível fechar a janela.
Em linhas gerais, observou‐se que, independentemente da posição em planta
ou da orientação, as janelas do primeiro andar sempre devem ser menores que as do último.
No primeiro pavimento, as janelas também apresentaram pouca influência da orientação e
posição em planta, já que nesta altura a velocidade próxima das aberturas sofre pouca
influência destes fatores.
Por fim, este trabalho buscou incentivar o uso da ventilação natural como
estratégia de conforto, colaborando para reduzir os gastos com condicionamento artificial
dos ambientes. Espera‐se que, para futuros trabalhos, seja possível aplicar o mesmo método
em outras zonas bioclimáticas e outras plantas de apartamentos. Outro tema relevante que
poderia ser abordado é a influência de protetores solares para o dimensionamento de
aberturas.
94
REFERÊNCIAS
ABNT. NBR 15220: Desempenho Térmico de Edificações ‐Parte 1 : Definições ,
símbolos e unidades. 2005, Rio de Janeiro, Brasil: ABNT, 2005.
ABNT. NBR 15575‐1: Edificações Habitacionais‐ Desempenho ‐ Parte 1:
Requisitos gerais Prefácio. 2013a, Rio de Janeiro, Brasil: ABNT, 2013. p.60.
ABNT. NBR 15575‐4: Edificações habitacionais ‐ Desempenho ‐ Parte 4: Sistemas
de vedações verticais externas e internas. 2013b, Rio de Janeiro, Brasil: ABNT, 2013. p.51.
9788507007036. .
ABNT. NBR 15575‐5: Edificações habitacionais‐ Desempenho ‐ Parte 5:
Requisitos para sistemas de coberturas. 2013c, Rio de Janeiro, Brasil: ABNT, 2013. p.63.
AFLAKI, Ardalan et al. A review on natural ventilation applications through
building facade components and ventilation openings in tropical climates. ENERGY AND
BUILDINGS v. 101, p. 153–162 , 2015.
AL‐SALLAL, K.A. Sizing windows to achieve passive cooling, passive heating, and
daylighting in hot arid regions. Renewable Energy v. 14, n. 4, p. 365–371 , 1998.
ALDAWOUD, A. Windows design for maximum cross‐ventilation in buildings.
Advances in Building Energy Research , 2016.
ALI, Abdel Aziz Ali; MILAD, Guirguis Nabil; ALI, Hassan Mahmoud. Effect of
natural ventilation and wind direction on the thermal performance of a building ceiling.
2007, Beijing: [s.n.], 2007. p.410–414. 9781622765447. .
ALLARD, F; GHIAUS, C. Natural ventilation in the urban environment: assessment
and design. [S.l.]: Earthscan James and James Publications, 2005. 266 p. .978‐1844071296.
ARANTES, Beatriz; LABAKI, Lucila Chebel. Fachadas sazonalmente adaptáveis:
mapeamento sistemático da literatura. 2016, São Paulo, Brasil: ENTAC, 2016. p.10.
ASFOUR, Omar S.; GADI, Mohamed B. A comparison between CFD and Network
models for predicting wind‐driven ventilation in buildings. Building and Environment v. 42,
n. 12, p. 4079–4085 , 2007.
ASHRAE. ASHRAE 55: Thermal Environmental Conditions for Human Occupancy.
2013, EStados Unidos: ASHRAE, 2013. 9781936504268. .
ASHRAE. ASHRAE 62 : Ventilation for Acceptable Indoor Air Quality. 2004, USA:

95
ASHRAE, 2004.
BAHARVAND, Ehsan. How to model a wall solar chimney? Complexity and
Predictability. Technische Universiteit, Eindhoven, 2010.
BEN. Balanço Energético Nacional. 2015 ‐ Ano Base 2015. Rio de Janeiro: [s.n.],
2016.
BUCCOLIERI, R. An application of ventilation efficiency concepts to the analysis
of building density effects on urban flow and pollutant concentration. International Journal
of Environment and Pollution , 2011.
CAIXA ECONÔMICA FEDERAL. Selo Casa Azul: Boas práticas para habitação mais
sustentável. . São Paulo: Páginas e Letras. Disponível em:
<http://www.caixa.gov.br/sustentabilidade/produtos‐servicos/selo‐casa‐
azul/Paginas/default.aspx>. Acesso em: 19 maio 2015. , 2010
CANDIDO, Christhina et al. Air movement acceptability limits and thermal
comfort in Brazil’s hot humid climate zone. Building and Environment v. 45, n. 1, p. 222–229
, 2010.03601323 (ISSN).
CÂNDIDO, Christhina; DEAR, Richard De; LAMBERTS, Roberto. Combined
thermal acceptability and air movement assessments in a hot humid climate. Building and
Environment v. 46, p. 7 , 2011.
CEPAGRI. Clima dos Municípios Paulistas. Disponível em:
<http://www.cpa.unicamp.br/outras‐informacoes/clima_muni_436.html>. Acesso em: 1
maio 2016.
COST. Cost Action 14: recommendations on the use of CFD in predicting
pedestrian wind environment. Brussels: COST, 2004.
CÓSTOLA, Daniel. Ventilação por ação do vento no edifício: procedimentos para
quantificação Dissertação (mestrado). Universidade de São Paulo, São Paulo, 2006.
CÓSTOLA, Daniel; ALUCCI, Marcia. Pressure coefficient simulated by CFD for
wind‐driven ventilation analysis. Proceedings: Building Simlation 2007 n. 2003, p. 999–1006
, 2007.
DACANAL, Cristiane. Fragmentos florestais urbanos e interações climáticas em
diferentes escalas: estudos em Campinas, SP Tese (doutorado). Unicamp, 2011.

96
DEAR, Richard De; BRAGER, Gail S. Thermal comfort in naturally ventilated
buildings: Revisions to ASHRAE Standard 55. Energy and Buildings v. 34, n. 6, p. 549–561 ,
2002.0378‐7788.
DEAR, Richard De; BRAGER, Gs. Developing an adaptive model of thermal
comfort and preference. ASHRAE Transactions v. 104, p. 1–18 , 1998.
ENERGY, Us Department Of. EnergyPlus Engineering Reference: The Reference
to EnergyPlus Calculations. US Department of Energy p. 1051 , 2015. Disponível em:
<http://scholar.google.com/scholar?hl=en&btnG=Search&q=intitle:EnergyPlus+Engineerin
g+Reference,+The+Reference+to+EnergyPlus+Calculations#1>.
ENERGYPLUS. Input/output reference: The encyclopedic reference to EnergyPlus
input and output . [S.l: s.n.]. Disponível em:
<http://apps1.eere.energy.gov/buildings/energyplus/pdfs/inputoutputreference.pdf>. ,
2015
FANGER, P. O. Thermal comfort: Analysis and Application in Environmental
Engineering. Copenhagem: Danish Technical, 1970. 244 p. .
GIVONI, B. Comfort, climate analysis and building design guidelines. Energy and
buildings , 1992. Disponível em:
<http://www.sciencedirect.com/science/article/pii/037877889290047K>. Acesso em: 18
maio 2015.
HUMPHREYS, Michael A. Fields study of thermal comfort compared and applied
.Building Research Establishment (BRE). Garston: [s.n.]. , 1975
HUO, Xiao Ping; HU, Jia Yu; LI, Dan. The Research on Influence of Different Forms
of Window on Indoor Natural Ventilation in Residential Building. Applied Mechanics and
Materials Applied Mechanics and Materials. v. 353–356, p. 3109–3113 , 2013.978‐3‐03785‐
775‐5.
IBGE. Sinopse censo 2010. Rio de Janeiro: [s.n.], 2011. Disponível em:
<http://biblioteca.ibge.gov.br/visualizacao/livros/liv64529_ref_glossario_equipetec.pdf>.
INANICI, Mehlika N; DEMIRBILEK, F.Nur. Thermal performance optimization of
building aspect ratio and south window size in five cities having different climatic
characteristics of Turkey. Building and Environment v. 35, n. 1, p. 41–52 , 2000.

97
INMETRO, INSTITUTO NACIONAL DE METROLOGIA E QUALIDADE INDUSTRIAL.
RTQ‐C ‐ Requisitos Técnicos da Qualidade para o Nível de Eficiência Energética de Edifícios
Comerciais, de Serviços e Públicos . Rio de Janeiro: INMETRO. , 2013a
INMETRO, INSTITUTO NACIONAL DE METROLOGIA E QUALIDADE INDUSTRIAL.
RTQ‐R ‐ Regulamento Técnico da Qualidade para o Nível de Eficiência Energética de
Edificações Residenciais . Rio de Janeiro: INMETRO. , 2013b
IQBAL, A et al. Discharge coefficient of centre‐pivot roof windows. Building and
Environment , 2015.
JANDA, Kathryn B.; BUSCH, John F. Worldwide status of energy standards for
buildings .Energy. [S.l: s.n.]. , 1994
JIAN, Y. Study on effects of building form on solar thermal application.
Taiyangneng Xuebao/Acta Energiae Solaris Sinica v. 28, n. 1, p. 108–112 , 2007.
KARAVA, P; STATHOPOULOS, T; ATHIENITIS, A K. Impact of internal pressure
coefficients on wind‐driven ventilation analysis. International Journal of Ventilation v. 5, n. 1,
p. 53–66 , 2006. Disponível em: <https://www.scopus.com/inward/record.uri?eid=2‐s2.0‐
33748854617&partnerID=40&md5=717a8ae670e276dfa7ad55d072ef394d>.
KHEMLANI, Lachmi. GENWIN: A generative computer tool for window design in
energy‐conscious architecture. Building and Environment v. 30, n. 1, p. 73–81 , 1995.
KUANG, X; CHEN, J; SUN, C. Evaluation of Ventilation Effectiveness of Microscale
and Middle‐Scale Urban Green Belt Based on Computer Simulation. Low‐carbon City and
New‐type Urbanization , 2015.
LABAKI, Lucila C. et al. Ventilation in Self‐Built Houses ‐ A Study Through Wind
Tunnel Measurements in Campinas, Brazil. International Journal of Ventilation v. 10, n. 2 , 1
set. 2011.
LABAKI, Lucila C.; KOWALTOWSKI, Doris C.C.K. Bioclimatic and vernacular design
in urban settlements of Brazil. Building and Environment v. 33, n. 1, p. 63–77 , jan. 1998.
LAMBERTS, Roberto et al. Sustentabilidade nas edificações: contexto
internacional e algumas referências brasileiras na área. Universidade Federal de Santa
Catarina , 2008. Disponível em:
<http://labeee.ufsc.br/sites/default/files/documents/sustentabilidade_nas_edificacoes_co

98
ntexto_internacional_e_algumas_referencias_brasileiras_na_areasustentabilidade_nas_ed
ificacoes_contexto_internacional_e_algumas_referencias_brasileiras_na_area.pdf>.
Acesso em: 18 maio 2015.
LAMBERTS, Roberto; DUTRA, Luciano; PEREIRA, Fernando O. R. Eficiência
Energética na Arquitetura. p. 382 , 2014.
LOPES, Felipe da Silva Duarte; CÓSTOLA, Daniel; LABAKI, Lucila Chebel.
Panorama de consumo energético para estudos de eficiência em edifícios de escritório em
regiões de clima tropical. 2015, São Paulo, Brasil: [s.n.], 2015. p.9.
LUKIANTCHUKI, Marieli Azoia et al. Sheds extratores e captadores de ar:
influência da geometria e da dimensão das aberturas no desempenho da ventilação natural
nas edificações. Ambiente Construído v. 16, n. 1, p. 83–104 , jan. 2016.
LUKIANTCHUKI, Marieli Azoia; CARAM, Rosana Maria. The use of sheds to
promote the natural ventilation: the work of Brazilian architect João Filgueiras Lima, Lelé.
2012, Londres, Inglaterra: [s.n.], 2012. p.17.
MANU, Sanyogita et al. Assessment of Air Velocity Preferences and Satisfaction
for Naturally Ventilated Office Buildings in India. 2014, Ahmedabad: [s.n.], 2014. p.1–8.
MCGILLIGAN, Charles; NATARAJAN, Sukumar; NIKOLOPOULOU, Marialena.
Adaptive comfort degree‐days: A metric to compare adaptive comfort standards and
estimate changes in energy consumption for future UK climates. Energy and Buildings v. 43,
n. 10, p. 2767–2778 , 2011.03787788.
MCNALL JR, P. E., JAAX, J., ROHLES, F. H., NEVINS, R. G., & SPRINGER, W. Thermal
comfort (thermally neutral) conditions for three levels of activity . [S.l: s.n.]. , 1967
MEDINILHA, Talita Andrioli; LABAKI, Lucila Chebel. Let’s open these windows!
The influence of opening design parameters on natural ventilation. 2016, Los Angeles: PLEA,
2016. Disponível em:
<http://plea2016.uscarch.com/index.php/pleapapers/fullpapers/paper/view/1288>.
MILNE, Murray. Climate consultant . Los Angeles: Department of Architecture
and Urban Design. Disponível em: <http://www.energy‐design‐tools.aud.ucla.edu/climate‐
consultant/>. , 2016
MIRZAEI, PA; HAGHIGHAT, F. A procedure to quantify the impact of mitigation
99
techniques on the urban ventilation. Building and environment n. 47, p. 410–420 , 2012.
MORAIS, Juliana M S C; LABAKI, Lucila C; ROSA, Leonardo M. A influência da
tipologia arquitetonica na ventilação natural interna de edificios do “Minha casa minha vida
”. Tese (Doutorado). 2012, Juiz de Fora: ENTAC‐ Encontro Nacional de Tecnologia do
Ambiente Construído, 2012. p.3237–3243.
MORAIS, Juliana M S C; LABAKI, Lucila Chebel. Evaluating natural ventilation in
multi‐storey social housing. 2013a, [S.l: s.n.], 2013. Disponível em:
<http://mediatum.ub.tum.de/node?id=1169290>. Acesso em: 1 maio 2016.
MORAIS, Juliana M S C; LABAKI, Lucila Chebel. Ventilação natural em edificios
multifamiliares do “Programa Minha Casa Minha Vida”. Biblioteca Digital da Unicamp,
Campinas, 2013b.
NEVINS, R. G. et al. A temperature‐humidity chart for thermal comfort of seated
persons. . [S.l: s.n.]. , 1966
NG, E et al. Improving the wind environment in high‐density cities by
understanding urban morphology and surface roughness: a study in Hong Kong. Landscape
and Urban Planning n. 101, p. 59–74 , 2011.
NICO‐RODRIGUES, Edna Aparecida et al. Quando a janela define a condição de
desempenho térmico em ambientes ventilados naturalmente: caso específico das
edificações multifamiliares em Vitória, ES. Ambiente Construído v. 15, n. 2, p. 7–23 , jun.
2015.1500020001.
OHBA, Masaaki; TSUKAMOTO, Kenji; LUN, Isaac. State and Prospects of Natural
/ Cross Ventilation Research in TPU . Tokyo: Tokyo Polytechnic University. Disponível em:
<http://www.wind.arch.t‐
kougei.ac.jp/system/file/activity_reports/GCOE_P2_REPORT.pdf>. , 2013
OLIVEIRA, Mariela Cristina Ayres De. Computer simulation for evaluation of the
effects of modifications in self‐built houses in ventilation Tese (Doutorado). Biblioteca Digital
da Unicamp, Campinas, 2009.
P. KARAVA; T. STATHOPOULOS; ATHIENITIS, A.K. Wind Driven Flow Through
Openings – A Review of Discharge Coefficients. International Journal of Ventilation v. 3, n. 3,
p. 255–266 , 2011.1473‐3315.

100
PARKINSON, Thomas; DE DEAR, Richard; CANDIDO, Christhina. Thermal pleasure
in built environments: alliesthesia in different thermoregulatory zones. Building Research &
Information p. 1–14 , 10 jul. 2015. Disponível em:
<http://www.tandfonline.com/doi/abs/10.1080/09613218.2015.1059653>. Acesso em: 16
jul. 2015.
PEREIRA. Helena A. da C. et al. Manual de simulação computacional de edifícios
naturalmente ventilados no programa Energy Plus – versão 8.0. Florianópolis – SC: [s.n.],
2013.
PERÉN, JI et al. CFD analysis of cross‐ventilation of a generic isolated building
with asymmetric opening positions: impact of roof angle and opening location. Building and
Environment , 2015.
PÉREZ‐LOMBARD, Luis; ORTIZ, José; POUT, Christine. A review on buildings
energy consumption information. Energy and Buildings v. 40, n. 3, p. 394–398 , jan. 2008.
Disponível em: <http://www.sciencedirect.com/science/article/pii/S0378778807001016>.
Acesso em: 9 jul. 2014.
PERSSON, ML; ROOS, A; WALL, M. Influence of window size on the energy
balance of low energy houses. Energy and Buildings , 2006.
RIVERO, Roberto. Arquitetura e clima. [S.l.]: D. C. Luzzatto, 1986.
.9788585038441.
RORIZ, Maurício. Base de dados climáticos de 411 municípios brasileiros.
Disponível em: <http://www.roriz.eng.br/epw_9.html>. Acesso em: 7 out. 2015a.
RORIZ. Maurício. Correções nas Irradiâncias e Iluminâncias dos arquivos EPW da
Base ANTAC. Associação Nacional de Tecnologia do Ambiente Construído São Carlos: [s.n.],
2012b. Disponível em: <http://roriz.dominiotemporario.com/doc/Correcoes nos arquivos
EPW ‐ ANTAC.pdf>. Acesso em: 5 abr. 2016.
RUAS, Álvaro César. Sistematização da avaliação de conforto térmico em
ambientes edificados e sua aplicação num software. Biblioteca Digital da Unicamp, 2002.
Disponível em:
<http://www.bibliotecadigital.unicamp.br/document/?code=vtls000283945&fd=y>. Acesso
em: 11 maio 2015.

101
RUIZ‐RUBE, Ivan et al. Uses and applications of Software & Systems Process
Engineering Meta‐Model process models. A systematic mapping study. Journal of Software:
Evolution and Process v. 26, n. 12, p. 1172–1192 , 2014.
RUPP, R.F.; GHISI, E. Sizing window areas for daylighting and hybrid ventilation
in commercial buildings. 2012, Lima: [s.n.], 2012. p.6.
SANTAMOURIS, M. et al. Recent progress on passive cooling techniques.
Advanced technological developments to improve survivability levels in low‐income
households. Energy and Buildings v. 39, n. 7, p. 859–866 , 2007.
SOKHI, Ranjeet S. et al. (Orgs.). Urban Air Quality: Measurement, Modelling and
Management. Dordrecht: Springer Netherlands, 2000. Disponível em:
<http://www.springerlink.com/index/10.1007/978‐94‐010‐0932‐4>. Acesso em: 22 fev.
2016. .978‐94‐010‐3796‐9.
STEPHEN NIMLYAT, P; ZIN KANDAR, M; SEDIADI, E. Empirical investigation of
indoor environmental quality (IEQ) performance in hospital buildings in Nigeria. Jurnal
Teknologi v. 77, n. 14, p. 41–50 , 2015.
SUGA, Kentaro; KATO, Shinsuke; HIYAMA, Kyosuke. Structural analysis of Pareto‐
optimal solution sets for multi‐objective optimization: An application to outer window
design problems using Multiple Objective Genetic Algorithms. Building and Environment v.
45, n. 5, p. 1144–1152 , 2010.
TABESH, Tofigh; SERTYESILISIK, Begum. An Investigation into Energy
Performance with the Integrated Usage of a Courtyard and Atrium. BUILDINGS v. 6, n. 2 ,
jun. 2016.
TOLEDO, Alexandre Márcio. Avaliação do desempenho da ventilação natural pela
ação do vento em apartamentos : uma aplicação em Maceió/AL. UFSC, Florianópolis, 2006.
253 p.
TOLEDO, Alexandre Márcio. Critérios para o dimensionamento de aberturas de
ventilação natural dos edifícios. 2001, São Pedro, Brasil: ANTAC, 2001.
TRINDADE, Sileno Cirne; PEDRINI, Aldomar; DUARTE, Raimundo Nonato
Calazans. Métodos de aplicação da simulação computacional em edifícios naturalmente
ventilados no clima quente e úmido. Ambiente Construído v. 10, n. 4, p. 37–58 , 2010.

102
WANG, H; KARAVA, P; CHEN, Q. Development of simple semiempirical models
for calculating airflow through hopper, awning, and casement windows for single‐sided
natural ventilation. Energy and Buildings , 2015.
WANG, L; HIEN, W N. The impact of façade designs: Orientations, window to wall
ratios and shading devices on indoor environment for naturally ventilated residential
buildings in Singapore. 2006, Geneva: [s.n.], 2006. p.I293–I297.
WANG, L; WONG NYUK, H; LI, S. Facade design optimization for naturally
ventilated residential buildings in Singapore. Energy and Buildings v. 39, n. 8, p. 954–961 ,
2007.
WANG, QN; GUAN, YL; LIAO, QH. Experimental Study on Discharge Coefficients
of Windward Window in Buildings with Wind‐driven Cross Ventilation. Advanced Materials
Research , 2014.
XIE, M.‐J. et al. Filed study of the thermal environment of the traditional
residential building in the north of hunan province in summer. Journal of Hunan University
Natural Sciences v. 36, n. 3, p. 16–21 , 2009.
YUAN, C; NG, E. Building porosity for better urban ventilation in high‐density
cities–A computational parametric study. Building and Environment , 2012.
ZMEUREANU, R. Optimization of the Insulation Level of Energy Efficient Houses
in Montreal. Journal of Building Physics v. 12, n. 2, p. 124–135 , 1 out. 1988.

103
APÊNDICE I. CFX ANSYS 16.2–PHYSICS
Tabela 8. Domain Physics configurations used for CFX ANSYS 16.2 simulations
Domain
Type Fluid
Materials
Air Ideal Gas
Fluid Definition Material Library
Morphology Continuous Fluid
Settings
Buoyancy Model Non Buoyant
Domain Motion Stationary
Reference Pressure 1.0000e+00 [atm]
Heat Transfer Model Isothermal
Fluid Temperature 2.0000e+01 [C]
Turbulence Model k epsilon
Turbulent Wall Functions Scalable
The settings used for the simulations were widely applied and accepted
(CÓSTOLA; ALUCCI, 2007; LUKIANTCHUKI; CARAM, 2012; MORAIS; LABAKI, 2013a) so the
proportions of the results are reliable. It is worth to mention that since the results were not
validated by experimentation, possibly there are some discrepancies with the real case.
Due to the computer configurations and the complexity of the models, the
simulation time for the second experiment took about 12 to 16 hours. For this reason, it was
decided to set the number of gaps across cells as three and not higher. Future work could
consider improving this number for better correspondence to reality.
104
APÊNDICE II. CFX ANSYS 16.2– BOUDARY LIMIT LAYER, CCL EXPRESION.
CCL expression used to enter boundary layer calculation in CFD simulation,
based on (CÓSTOLA, 2006):
“LIBRARY:
CEL:
&replace EXPRESSIONS:
ak = 0.41 [ ]
cmu = 0.09 [ ]
cmuhalf = cmu^0.5
denref = prefnew/(rgas*tamb)
dir = 0
dira = (180 + dir)*pi180
ed1 = (ustarnew^3)/(ak*(zmod‐zref))
epsinner = 0.4*unitlen
epsouter = 1.5*unitlen
gradh = 500*unitlen
pamb = prefnew*(exp(‐g*z/(rgas*tamb))‐1.0)
pi180 = pi/180
prefnew = 101325. [ Pa ]
rgas = 287.09601 [ J kg^‐1 K^‐1 ]
speed = ustarnew*loge((zmod‐zref)/z0)/ak
tamb = 288.15 [ K ]
te1 = (ustarnew^2)/cmuhalf
thetaa = dira
u1 = speed*sin(thetaa)
unitlen = 1. [ m ]
unittime = 1. [ s ]
unitvel = 1. [ m^1s^‐1 ]
uref = 2.27*unitvel

105
ustarnew = ak*uref/loge((zuref‐zref)/z0)
v1 = speed*cos(thetaa)
z0 = 0.3*unitlen
zmod = abs(z + 0.005*unitlen)
zref = 0*unitlen
zuref = 10*unitlen
END
END
END”

106
APÊNDICE III. OPERATIVE TEMPERATURE OF EXPERIMENT 4.3
(a)
(b)
(c)
(d)
Figure 44. Daily variation of the operative temperature on apartments with unobstructed surrounding, on the summer solstice. (a) Bedrooms on the first floor and (b) fourth floor, (c) living
rooms on the first floor and (d) fourth floor.
17
19
21
23
25
27
29
0:00
2:00
4:00
6:00
8:00
10:00
12:00
14:00
16:00
18:00
20:00
22:00
Operative temp. C
°
Time
External Air Temp 1st_ dorm_J60
1st_dorm_J120 1st_dorm_J160
1st_dorm_J260 1st_dorm_J330
1st_dorm_J400
17
19
21
23
25
27
29
0:00
2:00
4:00
6:00
8:00
10:00
12:00
14:00
16:00
18:00
20:00
22:00
Operative temp. C°
Time
External Air Temp 4th_ dorm_J60
4th_dorm_J120 4th_dorm_J160
4th_dorm_J260 4th_dorm_J330
4th_dorm_J400
17
19
21
23
25
27
29
0:00
2:00
4:00
6:00
8:00
10:00
12:00
14:00
16:00
18:00
20:00
22:00
Operative temp. C°
Time
External Air Temp 1st_ sala_J60
1st_sala_J120 1st_sala_J160
1st_sala_J260 1st_sala_J330
1st_sala_J400
17
19
21
23
25
27
29
0:00
2:00
4:00
6:00
8:00
10:00
12:00
14:00
16:00
18:00
20:00
22:00
Operative temp. C°
Time
External Air Temp 1st_ sala_J60
1st_sala_J120 1st_sala_J160
1st_sala_J260 1st_sala_J330
1st_sala_J400

107
(a)
(b)
(c)
(d)
Figure 45. Daily variation of the operative temperature on apartments with obstructed surrounding, on the summer solstice. (a) Bedrooms on the first floor and (b) fourth floor, (c) living rooms on the
first floor and (d) fourth floor.
17
19
21
23
25
27
29
0:00
2:00
4:00
6:00
8:00
10:00
12:00
14:00
16:00
18:00
20:00
22:00
Operative temp. C°
Time
External Air Temp 1st_ dorm_J60
1st_dorm_J120 1st_dorm_J160
1st_dorm_J260 1st_dorm_J330
1st_dorm_J400
17
19
21
23
25
27
29
0:00
2:00
4:00
6:00
8:00
10:00
12:00
14:00
16:00
18:00
20:00
22:00Operative temp. C°
Time
External Air Temp 4th_ dorm_J60
4th_dorm_J120 4th_dorm_J160
4th_dorm_J260 4th_dorm_J330
4th_dorm_J400
17
19
21
23
25
27
29
0:00
2:00
4:00
6:00
8:00
10:00
12:00
14:00
16:00
18:00
20:00
22:00Operative temp. C°
Time
External Air Temp 1st_ sala_J60
1st_sala_J120 1st_sala_J160
1st_sala_J260 1st_sala_J330
1st_sala_J400
17
19
21
23
25
27
29
0:00
2:00
4:00
6:00
8:00
10:00
12:00
14:00
16:00
18:00
20:00
22:00Operative temp. C°
Time
External Air Temp 1st_ sala_J60
1st_sala_J120 1st_sala_J160
1st_sala_J260 1st_sala_J330
1st_sala_J400

108
(a)
(b)
(c)
(d)
Figure 46. Daily variation of the operative temperature on apartments with different building
orientation. (a) 0°, (b) 45°, (c) 90°and, (d) 135°.
17
19
21
23
25
27
29
Operative temp. C
°
TimeExternal Air Temp Ap with J60 windows
Ap with J120 windows Ap with J160 windows
Ap with J260 windows Ap with J330 windows
Ap with J400 windows
17
19
21
23
25
27
29
Operative temp. C
°
TimeExternal Air Temp Ap with J60 windows
Ap with J120 windows Ap with J160 windows
Ap with J260 windows Ap with J330 windows
Ap with J400 windows
17
19
21
23
25
27
29
Operative temp. C
°
TimeExternal Air Temp Ap with J60 windows
Ap with J120 windows Ap with J160 windows
Ap with J260 windows Ap with J330 windows
Ap with J400 windows
17
19
21
23
25
27
29
Operative temp. C
°
TimeExternal Air Temp Ap with J60 windows
Ap with J120 windows Ap with J160 windows
Ap with J260 windows Ap with J330 windows
Ap with J400 windows