fgv - rae revista de administração de empresas, 2016. volume 56, número 6
TRANSCRIPT

FÓRUM | FORUM
Varejo: Competitividade e inovaçãoDelane Botelho e Leandro Guissoni
Franchisor-franchisee relationship quality: Time of relationship and performanceLuís Fernando Varotto e Juracy Gomes Parente
Antecedentes da intenção de compra de marcas próprias: Um estudo no mercado emergenteLúcia Aparecida da Silva Borges, Dirceu Tornavoi de Carvalho e Cláudio de Souza Miranda
Os efeitos negativos da experiência e do controle no desempenho do vendedor Juliano Domingues da Silva, Valter da Silva Faia e Valter Afonso Vieira
ARTIGOS | ARTICLES
Does the institutional environment affect CSR disclosure? The role of governanceMaría del Mar Miras Rodríguez e Bernabé Escobar Pérez
The mediated effect of formal and informal control on governance formsNuria Rodríguez-López e M. Eva Diz-Comesaña
Creative marketing strategy and effective execution on performance in Pakistan Muhammad Ishtiaq Ishaq e Nazia Munazer Hussain
RESENHA | BOOK REVIEW
Behavioral Finance: Fatores psicológicos e decisões de investimentoThiago de Sousa Barros
INDICAÇÕES BIBLIOGRÁFICAS | BOOK RECOMMENDATIONS
Você é transdisciplinar?Míriam Ribeiro de Barros Shaw
Instituições e seu impacto no desempenho das empresasDavid Kallás
R$ 5
0,00
PESQUISA ECONHECIMENTOV. 56, N. 6,Novembro–Dezembro 2016
www.fgv.br/rae
ISSN 0034-7590www.fgv.br/rae
REDAÇÃOAnalista de Produção Editorial: Denise Francisco Cândido Assistente Administrativa: Eduarda Pereira Anastacio Copidesque (Português e Inglês): Paula Thompson |Márcia Nunes | Editage Tradução e revisão (Espanhol e Inglês): RAG Traduções | Fernando Effori
ADMINISTRAÇÃOResponsável: Ilda Fontes Assistente Administrativa: Eldi Francisca Soares Assistente de Marketing: Andréa Cerqueira Souza Jovem Aprendiz: Nathanael Robson Gouveia
DISTRIBUIÇÃOComunidade acadêmico-científica: 500 exemplaresNúmero de visitas ao site no período setembro-outubro: 44.221 visitantesEXEMPLAR AVULSO: R$ 50,00PONTOS DE VENDA: Livrarias da FGV e Livraria CulturaARTE/EDITORAÇÃO ELETRÔNICATypecomm | Comunicação + Design
PRODUÇÃO INDUSTRIALImpressão e Acabamento: Prol Editora GráficaData de Impressão: 11.11.2016Tiragem: 500 exemplares
PERIODICIDADE: Bimestral
INDEXADORESDOAJ - Directory of Open Access Journalswww.doaj.orgEbsco Publishing: Business Source Complete, Economia y Negocios, Fonte Acadêmicawww.ebscohost.comGale Cengage Learningwww.gale.cengage.comGoogle Scholarscholar.google.com.brOASISBR http://oasisbr.ibict.brPortal de Periódicos CAPESwww.periodicos.capes.gov.brProQuest Information and Learningwww.proquest.com.brREDIB - Red Iberoamericana de Innovación y Conocimiento Científicowww.redib.org/RePEcwww.repec.orgSistema de Información Científica Redalyc - Red de Revistas Científicas de América Latina y el Caribe, España y Portugalredalyc.uaemex.mxSciELO - Scientific Electronic Library Onlinewww.scielo.orgScopus | Elsevierwww.info.sciverse.com/scopusSHERPA/RoMEOwww.sherpa.ac.uk/romeoSPELL – Scientific Periodicals Electronic Librarywww.spell.org.brSumários Brasileiros de Revistas Científicaswww.sumarios.funpeerp.com.brThomson ReutersSSCI, JCRwww.thomsonreuters.comDIRETÓRIOSAcademicKeyswww.academickeys.comCabell’swww.cabells.comCLASE – Citas Latinoamericans en Sciencias Sociales y Humanidadeswww.dgbiblio.unam.mx/index.php/catalogosDiadorimdiadorim.ibict.brIBSS - International Bibliography of the Social Sciencewww.lse.ac.ukHAPI-Hispanic American Periodicals Índexhapi.ucla.eduLatindex - Sistema Regional de Información en Líneapara Revistas Científicas de América Latina, el Caribe,España y Portugalwww.latindex.orgROAD - The Directory of Open Access Scholarly Resourceshttp://road.issn.org/Ulrichs Periodical Directorywww.ulrichsweb.comWorldWideScience.Orghttp://worldwidescience.org/index.html
ATENDIMENTO AO ASSINANTE São Paulo e Grande São Paulo:+ 55 (11) 3799-7999 Fax: + 55 (11) 3799-7871 Av. 9 de Julho, 2029 - 01313 902São Paulo - SP - Brasil
e-mail: [email protected] | site: www.fgv.br/rae
RAE é membro e subscreve os princípios do Committee on Publication Ethics (COPE). http://publicationethics.org/
CORPO EDITORIAL CIENTÍFICOAlexandre de Pádua Carrieri (UFMG - Belo Horizonte - MG, Brasil), Allan Claudius Queiroz Barbosa (UFMG - Belo Horizonte - MG, Brasil), Ana Paula Paes de Paula (UFMG - Belo Horizonte - MG, Brasil), Anatalia Saraiva Martins Ramos (UFRN - Natal - RN, Brasil), André Lucirton Costa (USP/FEA-RP - Ribeirão Preto - SP, Brasil), Andre Luis de Castro Moura Duarte (INSPER - São Paulo - SP, Brasil), Andre Ofenhejm Mascarenhas (Zetesis - Sao Paulo - SP, Brasil), Andrea Lago da Silva (UFSCAR – São Carlos – SP, Brasil), Anielson Barbosa da Silva (UFPB - João Pessoa - PB, Brasil), Antonio Domingos Padula (UFRGS - Porto Alegre - RS, Brasil), Antonio Lopo Martinez (FUCAPE - Vitoria - ES, Brasil), Antonio Moreira de Carvalho (PUC Minas - Belo Horizonte - MG, Brasil), Antonio Navarro-García (Universidad de Sevilla - Sevilha, Espanha), Bento Alves da Costa Filho (Ibmec-DF - Brasília - DF, Brasil), Bill Cooke (University of York - Heslington, Reino Unido), Carlos Jesús Fernández Rodríguez (Universidad Autónoma de Madrid - Madrid, Espanha), Carlos L. Rodriguez (UNCW - Wilimigton - NC, Estados Unidos), Cesar Alexandre de Souza (USP-FEA - São Paulo SP, Brasil), Claudio R. Lucinda (USP/FEA-RP - Ribeirão Preto - SP, Brasil), Dario de Oliveira Lima Filho (UFMS - Campo Grande - MS, Brasil), Delane Botelho (FGV-EAESP - São Paulo - SP, Brasil), Denise Del Prá Netto Machado (FURB - Blumenau - SC, Brasil), Diego Rene Gonzales Miranda (Universidad EAFIT - Medellín, Colômbia), Diogo Henrique Helal (UFPB - Joao Pessoa - PB, Brasil), Domingo Garcia-Perez-de-Lema (UPCT - Cartagena, Espanha), Edgard Barki (FGV-EAESP - São Paulo - SP, Brasil), Edmilson de Oliveira Lima (UNINOVE - São Paulo - SP, Brasil), Eduardo Andre Teixeira Ayrosa (FGV-EBAPE - Rio de Janeiro - RJ, Brasil), Ely Laureano de Paiva (FGV-EAESP - São Paulo - SP, Brasil), Eric David Cohen (Ibmec-Rio - Rio de Janeiro - RJ, Brasil), Eric van Heck (Erasmus University - Rotterdam, Holanda), Fábio Frezatti (USP-FEA - São Paulo - SP, Brasil), Fernanda Finotti Perobelli (UFJF - Juiz de Fora - MG, Brasil), Francisco Javier Rondán Cataluña (Universidad de Sevilla - Sevilla, Espanha), Gláucia Maria Vasconcellos Vale (PUC-Minas - Belo Horizonte - MG, Brasil), Glicia Vieira (UFES - Vitoria - ES, Brasil), Graziela Comini (USP-FEA - São Paulo - SP, Brasil), Graziela Dias Alperstedt (UDESC - Florianópolis - SC, Brasil), Heitor Almeida (College of Business at Illinois - Champaign, Estados Unidos), Henrique Luiz Côrrea (CRUMMER - Flórida - FL, Estados Unidos), Janete Lara de Oliveira (UFMG - Belo Horizonte - MG, Brasil), João Luiz Becker (UFRGS - Porto Alegre - RS, Brasil), Jorge Verschoore (São Leopoldo – RS, Brasil), José Antônio Gomes Pinho (UFBA - Salvador - BA, Brasil), José Henrique de Faria (UFPR - Curitiba - PR, Brasil), José Mauro C. Hernandez (USP-EACH - São Paulo - SP, Brasil), Luciano Barin Cruz (HEC-Montréal - Québec, Canada), Luiz Artur Ledur Brito (FGV-EAESP - São Paulo - SP, Brasil), Maria Alexandra Cunha (FGV-EAESP - São Paulo - SP, Brasil), Maria Ceci Araújo Misoczky (UFRGS - Porto Alegre - RS, Brasil), Mário Aquino Alves (FGV-EAESP - São Paulo - SP, Brasil), Mario Sacomano Neto (UNIMEP - São Paulo - SP, Brasil), Marlei Pozzebon (HEC-Montréal - Québec, Canada e FGV-EAESP - São Paulo - SP, Brasil), Mateus Canniatti Ponchio (ESPM - São Paulo - SP, Brasil), Mauricio Reinert (UEM - Maringá - PR, Brasil), Patricia Mendonça (USP-EACH - São Paulo - SP, Brasil), Paulo Bastos Tigre (UFRJ - Rio de Janeiro - RJ, Brasil), Paulo Roberto Barbosa Lustosa (UnB - Brasília - DF, Brasil), Rafael Alcadipani (FGV-EAESP - São Paulo - SP, Brasil), Rafael Goldszmidt (FGV-EBAPE - Rio de Janeiro - RJ, Brasil), Ramón Valle Cabrera (Universidad Pablo de Olavide - Sevilha, Espanha), Rebecca Arkader (UFRJ - Rio de Janeiro - RJ, Brasil), Ricardo Ratner Rochman (FGV/EESP - São Paulo - SP, Brasil), Roberto Patrus Mundim Pena (PUC-Minas - Belo Horizonte - MG, Brasil), Rodrigo Bandeira-de-Mello (FGV-EAESP - São Paulo - SP, Brasil), Rodrigo Ladeira (UNIFACS - Salvador - BA, Brasil), Salomão Alencar de Farias (UFPE - Recife - PE, Brasil), Sérgio Bulgacov (FGV-EAESP - São Paulo - SP, Brasil), Sérgio Giovanetti Lazzarini (INSPER - São Paulo - SP, Brasil), Silvana Anita Walter (FURB - Blumenau - SC, Brasil), Sônia Maria Fleury (FGV-EBAPE - Rio de Janeiro - RJ, Brasil), Tales Andreassi (FGV-EAESP - São Paulo - SP, Brasil), Teresia D. L. van Ad. de Macedo-Soares (PUC-Rio - Rio de Janeiro - RJ, Brasil), Thomas Brashear Alejandro (University of Massachusetts Amherst - Amherst - MA, Estados Unidos), Vinicius Brei (UFRGS - Porto Alegre - RS, Brasil), Wilson Toshiro Nakamura (MACKENZIE – São Paulo – SP, Brasil).
COMITÊ DE POLÍTICA EDITORIALCarlos Osmar Bertero, Eduardo Diniz, Flávio Carvalho de Vasconcelos, Francisco Aranha, Luiz Artur Ledur Brito, Maria José Tonelli, Maria Tereza Leme Fleury, Tales Andreassi, Thomaz Wood Jr.
EDITORA-CHEFEMaria José Tonelli
EDITOR-ADJUNTOFelipe Zambaldi
EDITORA DE LIVROSRoseli Morena Porto
A RAE - Revista de Administração de Empresas foi impressa com papel proveniente de madeira certificada FSC e de outras fontes controladas. A certificação FSC e uma garantia ao meio ambiente e aos trabalhadores florestais.

Publicação bimestral da Fundação Getulio VargasEscola de Administração de Empresas de São Paulo
Apoio:
PESQUISA E CONHECIMENTO | V. 56, N. 6, NOVEMBRO-DEZEMBRO 2016

RAE – Revista de Administração de Empresas / Fundação Getulio Vargas.Vol. 1, n. 1 (maio/ago. 1961) - . - Rio de Janeiro: Fundação Getulio Vargas, 1961 - v.; 27,5cm.
Quadrimestral: 1961–1962. Trimestral: 1963–1973. Bimestral: 1974–1977.Trimestral: 1978–1992. Bimestral: 1992–1995. Trimestral: 1996–2010.Bimestral: 2011–.
Publicada: São Paulo: FGV-EAESP, 1988–
ISSN 0034-7590
1. Administração de empresas – Periódicos. I. Fundação Getulio Vargas. II. Escola de Administração de Empresas de São Paulo.
A RAE – Revista de Administração de Empresas adota a Licença de Atribuição (CC-BY) do Creative Commons (https://creativecommons.org/licenses/by/4.0/br) em todos os trabalhos publicados, exceto, quando houver indicação específica de detentores de direitos autorais.
CDD 658CDU 658
Novembro/Dezembro 2016
SUMÁRIO
EDITORIAL
594 SOBRE PUBLICAR Maria José Tonelli
FÓRUM
596 VAREJO: COMPETITIVIDADE E INOVAÇÃO Introdução ao Fórum de Varejo, com uma reflexão sobre os desafios envolvendo competitividade e
inovação no campo, seguida da apresentação dos artigos componentes do fórum, provenientes do 8º Congresso Latino-Americano de Varejo (CLAV).
Delane Botelho e Leandro Guissoni
600 QUALIDADE DO RELACIONAMENTO FRANQUEADOR-FRANQUEADO: TEMPO DE RELACIONAMENTO E DESEMPENHO
Estudo sobre a influência do tempo de relacionamento entre franqueador e franqueado na qualidade desse relacionamento e em seu desempenho financeiro.
Luís Fernando Varotto e Juracy Gomes Parente
611 ANTECEDENTES DA INTENÇÃO DE COMPRA DE MARCAS PRÓPRIAS: UM ESTUDO NO MERCADO EMERGENTE Investigação sobre preditores da intenção de compra de marcas próprias e suas inter-relações no Brasil. Lúcia Aparecida da Silva Borges, Dirceu Tornavoi de Carvalho e Cláudio de Souza Miranda
626 OS EFEITOS NEGATIVOS DA EXPERIÊNCIA E DO CONTROLE NO DESEMPENHO DO VENDEDOR Verificação da relação entre sistemas de controle por comportamento e desempenho do vendedor
e da interação dessa relação com a experiência do vendedor. Juliano Domingues da Silva, Valter da Silva Faia e Valter Afonso Vieira
ARTIGOS
641 HÁ INFLUÊNCIA DO AMBIENTE INSTITUCIONAL NAS PRÁTICAS DE DIVULGAÇÃO DE RSC? O PAPEL DA GOVERNANÇA
Análise do efeito do ambiente institucional sobre a Responsabilidade Social Corporativa e a influência dos mecanismos de Governança Corporativa nesse efeito.
María del Mar Miras Rodríguez e Bernabé Escobar Pérez
655 EFEITO MEDIADOR DO CONTROLE FORMAL E INFORMAL NA FORMA DE GOVERNO Pesquisa sobre os impactos do controle formal e informal na forma de governança e suas interações. Nuria Rodríguez-López e M. Eva Diz-Comesaña
668 ESTRATÉGIA DE MARKETING CRIATIVO E EXECUÇÃO EFETIVA SOBRE O SEU DESEMPENHO NO PAQUISTÃO Determinação da influência de estratégias de marketing criativo e execução efetiva sobre o desempenho
de unidades de negócio com a moderação da orientação estratégica e da incerteza ambiental. Muhammad Ishtiaq Ishaq e Nazia Munazer Hussain
RESENHA
680 BEHAVIORAL FINANCE: FATORES PSICOLÓGICOS E DECISÕES DE INVESTIMENTO Thiago de Sousa Barros
INDICAÇÕES BIBLIOGRÁFICAS
682 VOCÊ É TRANSDISCIPLINAR? Míriam Ribeiro de Barros Shaw
683 INSTITUIÇÕES E SEU IMPACTO NO DESEMPENHO DAS EMPRESAS David Kallás
© RAE | São Paulo | V. 56 | n. 6 | nov-dez 2016

ISSN 0034-7590© RAE | São Paulo | V. 56 | n. 6 | nov-dez 2016
November/December 2016
CONTENTSEDITORIAL
594 ABOUT PUBLISHING Maria José Tonelli
FORUM
596 RETAIL: COMPETITIVENESS AND INNOVATION An introduction to the Fórum de Varejo (Retail Forum) including a reflection about the challenges
involving competitiveness and innovation in the field, followed by the articles comprised in the forum, which were presented in the 8º Congresso Latino-Americano de Varejo (8th Latin American Retail Congress [CLAV]).
Delane Botelho and Leandro Guissoni
600 FRANCHISOR-FRANCHISEE RELATIONSHIP QUALITY: TIME OF RELATIONSHIP AND PERFORMANCE A study about the influence of relationship duration on relationship quality and financial performance
in the franchisee-franchisor relationship. Luís Fernando Varotto and Juracy Gomes Parente
611 PREDICTORS OF STORE BRAND PURCHASE INTENTION: A STUDY IN THE EMERGING MARKET An investigation about predictors of store brand purchase intention and the interrelations between them. Lúcia Aparecida da Silva Borges, Dirceu Tornavoi de Carvalho and Cláudio de Souza Miranda
626 THE NEGATIVE EFFECTS OF EXPERIENCE AND CONTROL ON SALESPERSON’S PERFORMANCE The article examines the relationship between salesperson behavior-based control systems and
salesperson performance, as well as the interaction between that interaction and salesperson experience. Juliano Domingues da Silva, Valter da Silva Faia and Valter Afonso Vieira
ARTICLES
641 DOES THE INSTITUTIONAL ENVIRONMENT AFFECT CSR DISCLOSURE? THE ROLE OF GOVERNANCE An analysis of the effect of institutional environment on corporate social responsibility, as well as
the influence of corporate governance on that effect. María del Mar Miras Rodríguez and Bernabé Escobar Pérez
655 THE MEDIATED EFFECT OF FORMAL AND INFORMAL CONTROL ON GOVERNANCE FORMS A study about the impacts of formal and informal control on governance form and its interactions. Nuria Rodríguez-López and M. Eva Diz-Comesaña
668 CREATIVE MARKETING STRATEGY AND EFFECTIVE EXECUTION ON PERFORMANCE IN PAKISTAN Determining the influence of creative marketing and effective implementation strategies on business
units’ performance, as well as the moderating effects of strategic orientation and environment uncertainty. Muhammad Ishtiaq Ishaq and Nazia Munazer Hussain
BOOK REVIEW
680 BEHAVIORAL FINANCE: PSYCHOLOGICAL FACTORS AND INVESTMENT DECISIONS Thiago de Sousa Barros
BOOK RECOMMENDATIONS
682 ARE YOU MULTIDISCIPLINARY? Míriam Ribeiro de Barros Shaw
683 INSTITUTIONS AND THEIR IMPACT ON THE PERFORMANCE OF COMPANIES David Kallás

ISSN 0034-7590 © RAE | São Paulo | V. 56 | n. 6 | nov-dez 2016
SUMARIO
Noviembre/Diciembre 2016
EDITORIAL
594 SOBRE PUBLICAR Maria José Tonelli
FORO
596 COMERCIO MINORISTA: COMPETITIVIDAD E INNOVACIÓN Introducción al Foro de Comercio Minorista, con una reflexión sobre los desafíos relacionados a la
competitividad e innovación en el campo, seguida de presentación de los artículos que componen el foro, provenientes del 8º Congresso Latino-Americano de Varejo (8º Congreso Latinoamericano de Comercio Minorista [CLAV]).
Delane Botelho y Leandro Guissoni
600 CALIDAD DE LAS RELACIONES FRANQUICIADOR-FRANQUICIADO: TIEMPO DE RELACIONES Y DESEMPEÑO Estudio sobre la influencia del tiempo de relación entre franquiciador y franquiciado en la calidad
de esa relación y en su desempeño financiero. Luís Fernando Varotto y Juracy Gomes Parente
611 ANTECEDENTES DE LA INTENCIÓN DE COMPRA DE MARCAS PROPIAS: UN ESTUDIO EN EL MERCADO EMERGENTE
Investigación sobre predictores de la intención de compra de marcas propias y sus interrelaciones en Brasil. Lúcia Aparecida da Silva Borges, Dirceu Tornavoi de Carvalho y Cláudio de Souza Miranda
626 LOS EFECTOS NEGATIVOS DE LA EXPERIENCIA Y DEL CONTROL EN EL DESEMPEÑO DEL VENDEDOR Verificación de la relación entre sistemas de control por comportamiento y desempeño del vendedor
y de la interacción de esa relación con la experiencia del vendedor. Juliano Domingues da Silva, Valter da Silva Faia y Valter Afonso Vieira
ARTÍCULOS
641 ¿EL ENTORNO INSTITUCIONAL INFLUYE EN LAS PRÁCTICAS DE REVELACIÓN DE INFORMACIÓN DE LA RSC? EL PAPEL DEL GOBIERNO CORPORATIVO
Análisis del efecto del ambiente institucional sobre la Responsabilidad Social Corporativa y la influencia de los mecanismos de Gobernanza Corporativa en ese efecto.
María del Mar Miras Rodríguez y Bernabé Escobar Pérez
655 EFECTO MEDIADOR DEL CONTROL FORMAL E INFORMAL EN LA FORMA DE GOBIERNO Investigación sobre los impactos del control formal e informal en la forma de gobernanza y sus interacciones. Nuria Rodríguez-López y M. Eva Diz-Comesaña
668 ESTRATEGIA DE MARKETING CREATIVO Y EJECUCIÓN EFECTIVA SOBRE SU DESEMPEÑO EN PAQUISTÁN Determinación de la influencia de estrategias de marketing creativo y ejecución efectiva sobre
el desempeño de unidades de negocio con la moderación de la orientación estratégica y de la incertidumbre ambiental.
Muhammad Ishtiaq Ishaq y Nazia Munazer Hussain
RESEÑA
680 BEHAVIORAL FINANCE: FACTORES PSICOLÓGICOS Y DECISIONES DE INVERSIÓN Thiago de Sousa Barros
RECOMENDACIONES BIBLIOGRÁFICAS
682 ¿USTED ES TRANSDISCIPLINARIO? Míriam Ribeiro de Barros Shaw
683 INSTITUCIONES Y SU IMPACTO EN EL DESEMPEÑO DE LAS EMPRESAS David Kallás

594
ISSN 0034-7590© RAE | São Paulo | V. 56 | n. 6 | nov-dez 2016
RAE | Revista de Administração de Empresas | FGV/EAESP
EDITORIALDOI: http://dx.doi.org/10.1590/S0034-759020160601
SOBRE PUBLICAR
O RAEpub, novo manual de publicação da RAE-Revista de Administração de Empresas, traz diretrizes para publi-cação e indica aos autores as principais dimensões que
compõem a avaliação dos artigos submetidos à Revista. Vale retomar sinteticamente o processo: o primeiro passo é dado na triagem inicial realizada pelo editor-chefe, que avalia o poten-cial de publicação do texto e o encaminha, se for o caso, para avaliação dos editores científicos, especialistas na área temáti-ca. Como o campo das Ciências Sociais cresceu enormemente nessas últimas décadas, nós nos tornamos, como diz Boaventu-ra de Souza Santos, “ignorantes especializados”. Por esse mo-tivo, o corpo editorial científico abrange especialistas para essa multiplicidade temática. O segundo passo é dado pelo editor científico, que pode recomendar a rejeição do artigo ou enca-minhá-lo para o processo de blind-review. Essa etapa inclui a avaliação por pareceristas, que sugerem aperfeiçoamento para o artigo, e pode envolver várias rodadas até que ele seja aceito para publicação. O papel dos avaliadores, nesse caso, é suge-rir mudanças que visam, com base na sua experiência e em seu conhecimento, ao aperfeiçoamento do artigo (Rai, 2016), entre-tanto eles não decidem sobre sua aprovação ou rejeição. O edi-tor científico recomenda (ou não) a publicação, e a decisão fi-nal é do editor-chefe. Se aceito, a terceira fase inclui a revisão gramatical.
Esse é o processo, mas qual a importância da avaliação? Afinal, por que é essencial realizá-la? Ao longo dos anos, a co-munidade científica aprimorou a avaliação dos artigos e, conse-quentemente, dos periódicos: bons artigos reforçam a qualida-de dos periódicos, que atraem a submissão de bons artigos. No Brasil, na área de Administração, Turismo e Contabilidade, esse processo se consolidou a partir de 2002, com as diretrizes para avaliação de periódicos da Coordenação de Aperfeiçoamen-to de Pessoal de Nível Superior (Capes) e a participação ativa de diversos professores pesquisadores de todo o país. Ainda que muitos questionem esse processo, em essência, a avalia-ção dos periódicos reforça a busca pela qualidade da produção científica dos programas de pós-graduação (Trzesniak, 2016).
Embora possamos ser repetitivos, quais as qualidades que são valorizadas em artigos científicos? Basicamente, contri-buições para o campo de pesquisa que preencham lacunas teó-ricas após exaustivas e atualizadas revisões da literatura. São considerados os artigos que apresentem um quadro teórico bem
articulado, procedimentos metodológicos claramente descritos, com conclusões relevantes para teoria e prática. Similaridades, evidentemente, devem ser evitadas. Muitos autores reproduzem conteúdo sem a devida citação, em geral dos próprios artigos, o que leva à sua rejeição. Quando se trata de similaridade com dis-sertações, teses ou artigos em congressos, entretanto, o artigo não é rejeitado. Descrito dessa forma, tais critérios parecem sim-ples e objetivos, mas os esforços para obter tais resultados não são fáceis. No primeiro semestre de 2016, foram submetidos 500 artigos à Revista, porém apenas 20 foram aceitos para publica-ção. Isso não deve servir para desestimular, mas sim reafirmar a importância da qualidade da pesquisa. Nunca é demais refor-çar a necessidade de rigor nos procedimentos metodológicos e de revisões teóricas substantivas, que dão sustentação para pes-quisas de qualidade. O rigor, entretanto, não deve matar a cria-tividade, que contribui para o desenvolvimento do conhecimen-to, para a revisão de conceitos cristalizados em verdades e/ou para a solução dos complexos problemas que vivemos (Eisenhar-dt, Graebner, & Sonenshein, 2016).
O último número da RAE apresenta três artigos aprova-dos no Fórum de Varejo, em parceria com o 8º Congresso Lati-no Americano de Varejo (CLAV), selecionados por Delane Bote-lho e Leandro Guissoni. A edição traz outros três artigos, além da resenha sobre o livro “Finanças comportamentais: Quando a economia encontra a psicologia”, de Júlio Lobão, e as indi-cações bibliográficas sobre “transdisciplinaridade” e “institui-ções e desempenho de empresas”.
Boa leitura!
Maria José Tonelli | Editora-chefe
Professora da Fundação Getulio Vargas, Escola de Administração de Empresas de São Paulo – São Paulo – SP, Brasil
REFERÊNCIAS
Eisenhardt, K. M., Graebner, M. E., & Sonenshein, S. (2016). Grand challenges and inductive methods: Rigor without rigor mortis. Academy of Management Journal, 59(4), 1113-1123. doi:10.5465/amj.2016.4004
Rai, A. (2016). Writing a virtuous review. MIS Quarterly, 40(3), 3-10.
Trzesniak, P. (2016). Um Qualis em quatro tempos: Histórico e sugestões para Administração, Ciências Contábeis e Turismo. RC&F-Revista Contabilidade & Finanças, 27(72), 279-290.

ISSN 0034-7590
RAE | Revista de Administração de Empresas | FGV/EAESP 595
© RAE | São Paulo | V. 56 | n. 6 | nov-dez 2016
EDITORIALDOI: http://dx.doi.org/10.1590/S0034-759020160601
ABOUT PUBLISHING
R AEpub, the new publication manual of the RAE-Revista de Administração de Empresas of FGV/EAESP, brings publishing guidelines and shows authors the
main dimensions that form the evaluation process of articles submitted to the Journal. It is worth briefly recalling the process: the first step is the initial selection by the editor-in-chief, who evaluate the text’s publication potential and forwards it, if suitable, for review by the scientific editors, specialists in the thematic area. Because the field of Social Sciences has grown massively in the last few decades, we have become, as Boaventura de Souza Santos says, “specialized ignorants”. Therefore, the editorial body includes specialists for this thematic multiplicity. The second step is taken by the scientific editor, who may recommend rejecting the article or forwarding it to the blind-review process. This phase includes an evaluation by reviewers, who suggest certain improvements to the article, and may even involve various rounds until it is accepted for publication. The role of reviewers, in this case, is to suggest changes that, based on their experience and knowledge, are aimed at improving the article (Rai, 2016); however, they do not decide on its approval or rejection. The scientific editor recommends (or not) its publication, and the editor-in-chief has the final decision. If the article is accepted, the third phase includes a grammar review.
This is the process, but what is the importance of the review? After all, why is it essential to conduct it? Over the years, the scientific community has enhanced the review of articles and, thereby, of journals: good articles reinforce the quality of journals, which attract the submission of good articles. In Brazil, in the area of Administration, Tourism and Accounting, this process has become consolidated since 2002, with the guidelines for periodicals issued by the Coordenação de Aperfeiçoamento de Pessoal de Nível Superior (Capes) and the active participation of various professors engaged in research across the country. Even though many people question this process, in essence, the assessment conducted by periodicals reinforces the pursuit of quality of graduate programs’ scientific production (Trzesniak, 2016).
Although we may sound repetitive, what qualities are appreciated in scientific articles? Basically, contributions to the field of research which can fill theoretical gaps after exhaustive, up-to-date literature reviews. Articles considered for publication
are the ones that present a well articulate theoretical framework, clearly described methodological procedures, and conclusions that are relevant both for theory and practice. Similarities should be avoided. Many authors reproduce contents without proper citation, usually of their own articles, which causes their rejection. When similarities concern dissertations, theses or articles presented at congresses, however, the article is not rejected. Described in this way, these criteria seem simple and straightforward, but the efforts to achieve such results are not easy. In the first semester of 2016, 500 articles were submitted to the Journal, but only 20 were accepted for publication. This should not serve to discourage, but rather reaffirm the importance of research quality. One can never overstress the need of rigor in methodological procedures and substantive theoretical reviews, which underpin quality research. Rigor, however, must not kill creativity, which contributes to developing knowledge, reviewing concepts that have crystalized into truths, and/or solving the complex problems we experience (Eisenhardt, Graebner, & Sonenshein, 2016).
RAE’s latest issue presents three articles approved at the Fórum de Varejo (Retail Forum) in partnership with the 8º Congresso Latino-Americano de Varejo (8th Latin American Retail Congress [CLAV]), selected by Delane Botelho and Leandro Guissoni. The issue brings three other articles, in addition to a review of Júlio Lobão’s book Finanças Comportamentais: Quando a economia encontra a psicologia, and book recommendations on “transdisciplinarity” and “institutions and the performance of companies”.
Enjoy your reading!
Maria José Tonelli | Editor-in-chief
Professor at Fundação Getulio Vargas, Escola de Administração de Empresas de São Paulo – São Paulo – SP, Brazil
REFERENCES
Eisenhardt, K. M., Graebner, M. E., & Sonenshein, S. (2016). Grand challenges and inductive methods: Rigor without rigor mortis. Academy of Management Journal, 59(4), 1113-1123. doi:10.5465/amj.2016.4004
Rai, A. (2016). Writing a virtuous review. MIS Quarterly, 40(3), 3-10.
Trzesniak, P. (2016). Um Qualis em quatro tempos: Histórico e sugestões para Administração, Ciências Contábeis e Turismo. RC&F-Revista Contabilidade & Finanças, 27(72), 279-290.

596
ISSN 0034-7590© RAE | São Paulo | V. 56 | n. 6 | nov-dez 2016 | 596-599
DELANE [email protected] da Fundação Getulio Vargas, Escola de Administração de Empresas de São Paulo – São Paulo – SP, Brasil
LEANDRO [email protected] da Fundação Getulio Vargas, Escola de Administração de Empresas de São Paulo – São Paulo – SP, Brasil
FÓRUMArtigo convidado
VAREJO: COMPETITIVIDADE E INOVAÇÃO8º CONGRESSO LATINO-AMERICANO DE VAREJO (CLAV 2015)“Competitividade e Inovação” foi o tema do 8º Congresso Latino-Americano de Varejo (CLAV) realizado na FGV/EAESP em 29 e 30 de outubro de 2015. Desde 2008, ano do primeiro CLAV, as características principais do congresso têm-se fortalecido: i) discussão científica de temas de varejo com implicações para o mercado; ii) reflexão sobre temas de vanguarda para o vare-jo; iii) interação entre profissionais de mercado e acadêmicos, seja pelo formato de painéis de executivos, como maneira de se colocar em discussão as demandas de conhecimento do mer-cado, seja pela submissão de artigos executivos e casos de ensino; iv) relevância não apenas aos pesquisadores e palestrantes experientes da academia, mas também àqueles que estão iniciando, com o tradicional consórcio doutoral e a banca de iniciação científica para alunos de graduação; v) internacionalização: ao longo destes anos, o CLAV tem priorizado a vinda de pesquisadores reconhecidos na academia internacional, como editores de periódicos de alto impacto no varejo, e a atração de artigos estrangeiros, com sessões de apresentação exclusi-vamente em inglês. Ao longo de sua história, o CLAV tem recebido apoio das três principais agências de fomento brasileiras: Capes, CNPq e FAPESP. A realização do CLAV é do GVcev (Cen-tro de Excelência em Varejo da FGV/EAESP), o qual reúne professores, alunos dos cursos da gra-duação e pós-graduação da FGV/EAESP e de outras instituições de ensino/pesquisa.
Nos últimos anos, o varejo vem sofrendo mudanças expressivas no cenário internacio-nal, o que reflete nas discussões dos profissionais e dos pesquisadores de administração. No contexto de país emergente, deve-se esperar interesse renovado ao varejo, já que esse setor é um catalizador de desenvolvimento não apenas de negócios, mas também dos aspectos so-ciais. Por esse motivo, o CLAV reflete o ambiente acadêmico e de negócios do Brasil e da Amé-rica Latina, proporcionando aos participantes do evento melhor entendimento do varejo, com enfoque nas transições pelo qual o varejo global e nacional vem passando.
COMPETITIVIDADE E INOVAÇÃO NO VAREJOO crescimento nos mercados emergentes tem atraído atenção de consumidores, fabricantes de bens de consumo e varejistas (Kumar, Sunder, & Sharma, 2015). Entretanto, o ambiente de negó-cios no varejo em alguns desses mercados, como o Brasil, tem apresentado momentos de fragilida-de em virtude de problemas econômicos e políticos principalmente a partir de 2014. Gupta, Malho-tra, Czinkota, e Foroudi (2016) sugerem a importância da conexão entre inovação e competitividade, identificando que a competitividade de uma empresa permite que seus gestores inovem nas prá-ticas mercadológicas. Estudos e práticas para essa busca nos mercados consumidores podem im-pactar o resultado de empresas no varejo e potencialmente influenciar o desenvolvimento econômi-co no país, motivando, portanto, a escolha do tema do CLAV-2015 de “Competitividade e Inovação”.
Embora exista consenso de que a inovação envolve aplicação de novas ideias que estimu-lam o desempenho financeiro, o termo apresenta interpretações que dependem do contexto em que ela ocorre. Os conceitos iniciais derivam da teoria econômica ou teoria das organizações e são fundamentados na lógica centrada em manufatura. Inovação na indústria de serviços, incluin-
RAE-Revista de Administração de Empresas | FGV/EAESP
DOI: http://dx.doi.org/10.1590/S0034-759020160602

597
ISSN 0034-7590
AUTORES | Delane Botelho | Leandro Guissoni
© RAE | São Paulo | V. 56 | n. 6 | nov-dez 2016 | 596-599
do o varejo, tem recebido pouca atenção na literatura (Hristov & Reynolds, 2015). Empresas alcançam a vantagem competitiva por meio de iniciativas de inovação, que são manifestadas em novos produtos, serviços, processos ou novas abordagens com base em estratégias e atividades de marketing (Porter, 1990). Defini-ções tradicionais descrevem o varejo como “negócio que vende produtos e serviços para consumidores finais” (Rosenberg, 1993; Levy & Weitz, 1996, p. 419), então o varejo e o escopo de suas ati-vidades parecem simples e muitas vezes tornam a área carente de contribuições sobre como suas organizações podem ser mais competitivas e inovar (Peterson & Balasubramanian, 2002). Al-guns autores (como Pantano, 2014; Hristov & Reynolds, 2015) descrevem os varejistas como adotantes de tecnologias e inova-ção, e não desenvolvedores de novas tecnologias como ocorre em outras indústrias. E a adoção se dá muitas vezes como meio de aumentar sua capacidade de compreensão de mercados e tendências futuras, em vez de prover uma experiência mais va-liosa para o cliente. Ao introduzir uma nova tecnologia, o varejis-ta sempre questiona até que ponto ela seria usada pelo consumi-dor ou o gestor obteria dados para prever tendências ou facilitar sua tomada de decisão. Mas, apesar disso, pesquisas com con-sumidores indicam a sua crescente procura de inovação no pon-to de venda (Cox et al., 2016).
Apesar disso, como qualquer atividade de negócios, o varejo evolui e inova com o tempo. Avanços tecnológicos e mu-danças no comportamento do consumidor, impulsionados pe-los novos dispositivos e pela mídia, continuam a transformá-lo. As mudanças têm sido mais intensas com a disseminação da in-ternet, mídias sociais e aparelhos móveis, provendo aos consu-midores acesso mais fácil a informações e fontes de compras. Clientes mais jovens terão maiores expectativas de usar canais de compras on-line influenciados pelas mídias sociais (Cox et al., 2016). Varejistas têm desenvolvido aplicativos para melho-rar e estender a experiência de compra desses usuários para além da loja física (Grewal, Roggeveen, Runyan, Nordfält, & Lira, in press). Muitos consumidores têm acesso a uma variedade de ferramentas de mídia via smartphones e tablets, que lhes dão acesso instantâneo a blogs e conteúdos e informação, e podem usar aplicativos para encontrar os preços mais baixos ou des-cobrir o que os amigos estão comprando, tornando mais fácil a busca de opções alternativas e tornando-os mais sensíveis aos preços. Uma abordagem da gestão da inovação para o varejo, principalmente para tais clientes, consiste em envolvê-los no novo processo de desenvolvimento de produtos/serviços para melhorar o resultado final e o nível de qualidade. Por isso, mui-tos estudos (Greer & Lei, 2012; Kohler et al., 2011) centram-se em estratégias na participação dos consumidores no processo de cocriação para que seu conhecimento seja aproveitado em
novos produtos (Pantano, 2014), explorando novas tecnologias, principalmente por meio da internet.
Por outro lado, o crescente envelhecimento da popula-ção levará à demanda por mais conveniência e disponibilidade local dos produtos, o que implica que a demanda por loja física de varejo continua (Cox et al., 2016). Mas tal demanda pode ter características experienciais, num novo modelo, em que o pon-to de venda aumenta o envolvimento do cliente, permitindo-lhe interagir com produtos e obter informação sobre a melhor ma-neira de usá-los. Por exemplo, numa loja de móveis, o cliente pode ser capaz de “entrar” nas dimensões de sua sala de estar e ver como o mobiliário novo fica mais bem adequado, podendo mudar virtualmente design, cores e padrões. Essa experiência na loja física, portanto, requer tecnologia e inovação.
Essa combinação de experiências on-line e na loja física remete ao termo multicanalidade. O tema de diversificação de canais em marketing não é novo, mas a evolução no número de canais que devem ser considerados numa estratégia varejista pa-rece ser uma mudança disruptiva (Grewal et al., in press), ainda mais se eles forem usados pelo consumidor de maneira indis-tinta, originando o termo omnichannel. Com a entrada de canais mobile, smartphones e mídias sociais, e com a integração deles e de outros meios ao canal off-line, passa-se da forma multicanal para o modelo de varejo omnichannel. Diferentemente da multi-canalidade, que considera apenas os canais de venda do vare-jo, no ambiente omnichannel, há ênfase na interação entre ca-nais e marcas, ou seja, há interações entre comprador, marca e varejista. Esse novo modelo de negócios, portanto, tem um foco menor no canal utilizado e maior na interação entre o compra-dor e a marca (Verhoef, Kannan, & Inmane, 2015). Adicionalmen-te, tais mudanças são impulsionadas por novos softwares a elas relacionados: aplicativos, pagamentos móveis, cupons digitais, serviços baseados em geolocalização etc. Mas, quando o varejis-ta adiciona novos canais para o cliente, ele também precisa revi-sar ou adicionar novos sistemas de logística para garantir que o produto seja entregue. Inovações como o uso de carros autodiri-gíveis e robotização, por exemplo, já estão sendo usadas para re-duzir custos de entregas e custos operacionais, quando se traba-lha com o conceito de multicanalidade (Cox et al., 2016).
Em termos de multicanalidade, há uma grande oportuni-dade para o varejo brasileiro, e o volume de dados já transacio-nados pelo e-commerce atesta isso. O Brasil é o único país da América Latina que figura entre os dez maiores mercados mun-diais do e-commerce. Se, por um lado, fica claro que o shopper brasileiro está se tornando multicanal, por outro é possível dizer que hoje ele ainda não tem uma experiência completa de compra omnichannel, visto que, de modo geral, os varejistas brasileiros ainda não se adequaram a esse ambiente. Pequenos varejistas,

598
ISSN 0034-7590
FÓRUM | Varejo: Competitividade e inovação
© RAE | São Paulo | V. 56 | n. 6 | nov-dez 2016 | 596-599
por exemplo, geralmente não apresentam presença digital forte, portanto devem se desenvolver no ambiente on-line, enquanto empresas maiores têm de garantir que os consumidores recebam suas ofertas de forma padrão em todos os canais. É em época de crise que as tais oportunidades são vislumbradas em busca de garantir a competitividade atual e futura. O varejo formal brasilei-ro representa apenas 15,5% do produto interno bruto (PIB), sen-do que, em países como Estados Unidos, representa 28%. Isso significa que a maior formalização do varejo deve contribuir para o aumento da participação no PIB, com implicações para a com-petitividade das empresas que atuam no setor.
Sempre haverá os efeitos colaterais da inovação. Mídias so-ciais on-line e móveis, por exemplo, oferecem oportunidades para os varejistas se comunicarem de forma personalizada, principal-mente com os jovens, mas também acarretam desafios associa-dos a potenciais ameaças à privacidade do consumidor (Aguirre, Mahr, Grewal, Ruyter, & Wetzels, 2015). Portanto, tais inovações re-querem transparência sobre quando e como os dados do consu-midor são coletados. A disseminação das práticas de personali-zação da comunicação faz com que os consumidores sejam mais conscientes de que as empresas coletam suas informações on-line e off-line. Isso provavelmente provoca maior ceticismo em relação ao varejista, o que pode ser problemático numa época em que há também uma crise de confiança entre consumidores e empresas.
Em se tratando de inovação no varejo, o setor também tem papel importante nas questões de sustentabilidade, em razão de seu poder econômico global e sua posição privilegiada entre ofer-ta e demanda. Os varejistas podem influenciar tanto a produção quanto os padrões de consumo (Delai & Takahashi, 2013). Tam-bém podem influenciar em suas cadeias de abastecimento como resultado de suas estratégias de sustentabilidade, moldando de-cisões e atividades, como o desenvolvimento de novos produtos, estratégias de recursos humanos, aspectos de distribuição e pa-drões de embalagem. No lado da demanda, os varejistas podem influenciar os consumidores no modo como eles compram, usam e descartam os produtos. Nessa perspectiva, a pesquisa em vare-jo tem evoluído e também buscado oferecer contribuições para a competitividade das organizações envolvidas, com potencial im-pacto no desenvolvimento econômico no país, principalmente com a preocupação atual sobre os problemas econômicos e políti-cos citados aqui. Portanto, o propósito do CLAV 2015 foi criar con-dições para discutir contribuições para a literatura sobre compe-tividade e inovação no varejo, assim como para as organizações de varejo e seus consumidores, com artigos apresentados em di-versas trilhas acadêmicas: estratégias varejistas, eficiência e tec-nologia, fator humano nas organizações varejistas, relacionamen-to, parcerias e suplly chain, responsabilidade e sustentabilidade e comportamento do consumidor.
FÓRUM RAE DE VAREJO – ARTIGOS
Como já é de costume, os melhores artigos do CLAV-2015 em avaliação double blind review são considerados para publica-ção no Fórum RAE de Varejo. Este fórum discute assuntos re-lacionados ao tema “Competitividade e Inovação” e apresenta estudos que contribuem tanto para a literatura quanto para as práticas varejistas.
A relação entre competitividade e inovação contribui para que as organizações varejistas aperfeiçoem os modelos de ne-gócio ou levam a propor novos modelos que as tornem mais lu-crativas, prósperas e gerem valor aos stakeholders mesmo em momento adverso, como mencionado em relação ao Brasil. Em relatório sobre o varejo no Brasil, a Euromonitor (2016) indica um modelo de negócios no varejo que tem crescido mesmo em am-biente turbulento: o de franquias, que apresentou em 2015 au-mento de 8% de faturamento e 10% no número de lojas franquea-das em relação ao ano de 2014, incluindo 131 novas marcas que adotaram o modelo em 2015. O artigo “Franchisor-franchisee re-lationship quality: Time of relationship and performance”, de Va-rotto e Parente (2016), analisa, com base em 342 franqueados, como o relacionamento entre franqueadores e franqueados se desenvolve ao longo do tempo e de que maneira esse processo influencia a qualidade de relação e o desempenho financeiro na questão franqueador-franqueado. Os resultados indicam que o tempo tem efeito moderador positivo nesse aspecto e apresen-tam implicações para a prática na gestão de franquias, pois os franqueadores devem buscar desenvolver iniciativas que permi-tam sustentar a relação depois do seu estágio inicial, chamado de honeymoon, após o primeiro ano de relacionamento, e o cui-dado com o estágio crossroads, após oito anos.
A necessidade de que as organizações varejistas sejam inovadoras, produtivas e alcancem níveis satisfatórios de com-petitividade é mais evidente em períodos de adversidades no ambiente econômico. Conforme relatório apresentado pela Mckinsey (Donatelli, Hoefel, Resstom, & Stul, 2016) e que foi desenvolvido com a proposta de investigar o comportamento do consumidor em época de desaceleração da economia, os consumidores no Brasil têm buscado economizar em suas com-pras no varejo e passam a prestar mais atenção em preços e promoções de produtos. Quando objetivam manter o consumo de suas marcas preferidas, buscam varejistas que as ofereçam com preço menor, porém, mais da metade dos consumidores que já optaram por marcas de menores preços alega que não tem intenção de voltar a consumir as marcas mais caras. Se-gundo a mesma pesquisa, apenas 18% dos clientes que opta-ram por marcas mais baratas compraram marcas próprias dos varejistas, enquanto na América Latina, em geral, o resultado

599
ISSN 0034-7590
AUTORES | Delane Botelho | Leandro Guissoni
© RAE | São Paulo | V. 56 | n. 6 | nov-dez 2016 | 596-599
foi de 26% e em países classificados como maduros chega a 60%. Isso é explicado pela baixa representatividade das mar-cas próprias no Brasil. Contudo, é esperado aumento de inova-ções de marca própria e do seu papel no varejo brasileiro. O ar-tigo “Antecedentes da intenção de compra de marcas próprias: Um estudo no mercado emergente”, de Borges, Carvalho, e Mi-randa (2016), explora preditores da intenção de compra de mar-cas próprias com base na imagem da loja, no risco percebido e na atitude em relação a elas. Os resultados mostram que o ris-co percebido e a imagem da loja são fortes preditores da ima-gem da marca própria. O primeiro construto (risco percebido) inclui variáveis de risco de desempenho e financeiro. O segun-do construto (imagem da loja) compreende variáveis como qua-lidade do produto, sortimento e atmosfera de loja. Como im-plicação para varejistas que gerenciam suas marcas próprias, o estudo identifica que, melhorando esses fatores menciona-dos, a atitude e a intenção de compra desses produtos podem ser influenciadas positivamente, o que contribui para sua com-petitividade.
Uma das atividades que muitas vezes executivos que atuam no varejo consideram a mais relevante para a competiti-vidade das organizações envolve a gestão de pessoas, incluin-do equipes e pessoal para dar suporte a vendas e ao atendi-mento ao consumidor final. Especificamente, os sistemas de incentivo e controle dos vendedores podem influenciar a satis-fação dos consumidores e o desempenho de vendas da organi-zação (Kraus, Haumann, Ahearne, & Wieseke, 2015). No artigo “Os efeitos negativos da experiência e do controle no desem-penho do vendedor”, Silva, Faia, e Vieira (2016) identificam a relação entre o perfil de locomoção do vendedor, isto é, da proatividade do vendedor, e o desempenho de vendas a par-tir da proposta de investigação sobre os efeitos do sistema de controle por comportamento, incluindo como as organizações monitoram, controlem, avaliam e compensam os vendedores. Como resultado da pesquisa empírica com base nos dados de 138 vendedores no varejo, os autores mostram que o alto nível do sistema de controle por comportamento reduz o efeito en-tre a orientação para locomoção do vendedor e seu desempe-nho. Como implicação para o varejo, os autores sugerem que os gestores de vendedor no varejo proporcionem oportunidades para que eles expressem suas opiniões e participem de estra-tégias e ações de vendas. Ainda, identificam que, com o passar do tempo e de acordo com a experiência do vendedor, os ges-tores devem flexibilizar as normas rígidas de controle por com-portamento e inserir mecanismos de controle diversos, como o sistema de controle por resultados.
Esperamos que este Fórum RAE estimule pesquisas adi-cionais no varejo sobre os vários tópicos aqui identificados.
REFERÊNCIASAguirre, E., Mahr, D., Grewal, D., de Ruyter, K., & Wetzels, M. (2015). Unrav-
eling the personalization paradox: The effect of information collection and trust-building strategies on online advertisement effectiveness. Journal of Retailing, 91(1), 34-49. doi:10.1016/j.jretai.2014.09.005
Borges, L. A. da S., Carvalho, D. T., & Miranda, C. de S. (2016). Anteceden-tes da intenção de compra de marcas próprias: Um estudo no mercado emergente. RAE-Revista de Administração de Empresas, 56(6), 611-625. doi:10.1590/S0034-759020160604
Cox, A., Hay, G., Econometrics, C., Hogarth, T., Brown, G., Writing, G. B., & Limmer, H. (2016). Productivity in the retail sector: Challenges and op-portunities. Recuperado de http://www.employment-studies.co.uk/system/files/resources/files/ukces0816d.pdf
Delai, I., & Takahashi, S. (2013). Corporate sustainability in emerging mar-kets: Insights from the practices reported by the Brazilian retailers. Jour-nal of Cleaner Production, 47, 211-221. doi:10.1016/j.jclepro.2012.12.029
Donatelli, M., Hoefel, F., Resstom, S., & Stul, F. (2006, jun.). Meet the new Brazilian consumer. Mckinsey Consumer Packaged Goods and Retail. Recuperado de www.mckinsey.com/industries/consumer-pack-aged-goods/our-insights/meet-the-new-brazilian-consumer
Euromonitor International Report. (2016, abr.). Retailing in Brazil. Recupe-rado de http://www.euromonitor.com/retailing-in-brazil/report
Grewal, D., Roggeveen, A. L., Runyan, R. C., Nordfält, J., & Lira, M. E. V. (in press). Retailing in today’s world: Multiple channels and oth-er strategic decisions affecting firm performance. Journal of Retail-ing and Consumer Services. Recuperado de http://ac.els-cdn.com/S0969698916000023/1-s2.0-S0969698916000023-main.pdf?_tid=6bd10618-a4e5-11e6-a258-00000aab0f27&acdnat=1478521774_f85f5389cfaf648d960b2d87e0fed58c
Grewal, D., & Levy, M. (2009). Emerging issues in retailing research. Journal of Retailing, 85(4), 522-526. doi:10.1016/j.jretai.2009.09.007
Gupta, S., Malhotra, N. K., Czinkota, M., & Foroudi, P. (2006). Marketing innovation: A consequence of competitiveness. Journal of Business Re-search, 69(12), 5671-5681. doi:10.1016/j.jbusres.2016.02.042
Hristov, L., & Reynolds, J. (2015). Perceptions and practices of innovation in retailing: Challenges of definition and measurement. International Jour-nal of Retail & Distribution Management, 43(2), 126-147. doi:10.1108/ijrdm-09-2012-0079
Kraus, F., Haumann, T., Ahearne, M., & Wieseke, J. (2015). When sales man-agers and salespeople disagree in the appreciation for their firm: The phenomenon of organizational identification tension. Journal of Retail-ing, 91(3), 486-515. doi:10.1016/j.jretai.2015.03.001
Kumar, V., Sunder, S., & Sharma, A. (2015). Leveraging distribution to max-imize firm performance in emerging markets. Journal of Retailing, 91(4), 627-643. doi:10.1016/j.jretai.2014.08.005
Levy, M., & Weitz, B. (1996). Essentials of retailing. Boston, EUA: Irwin Mc-Graw-Hill.
Pantano, E. (2014). Innovation drivers in retail industry. International Jour-nal of Information Management, 34(3), 344-350. doi:10.1016/j.ijinfo-mgt.2014.03.002
Peterson, R. A., & Balasubramanian, S. (2002). Retailing in the 21st cen tury: Reflections and prologue to research. Journal of Retailing, 78(1), 9-16. doi:10.1016/S0022-4359(01)00062-8
Porter, M. E. (1990). The Competitive Advantage of Nations. Harvard Busi-ness Review. Recuperado de https://hbr.org/
Rosenberg, J. M. (1993). Dictionary of business and management. New York, EUA: John Wiley & Sons.
Silva, J. D., Faia, V. da S., Vieira, V. A. (2016). Os efeitos negativos da ex-periência e do controle no desempenho do vendedor. RAE-Revista de Administração de Empresas, 56(6), 626-640. doi:10.1590/S0034-759020160605
Varotto, L. F., & Parente, J. G. (2016). Franchisor-franchisee relationship quality: Time of relationship and performance. RAE-Revista de Adminis-tração de Empresas, 56(6), 600-610. doi:10.1590/S0034-759020160603
Verhoef, P. C., Kannan, P. K., & Inman, J. J. (2015). From multi-channel re-tailing to omni-channel retailing: Introduction to the special issue on multi-channel retailing. Journal of Retailing, 91(2), 174-181. doi:10.1016/j.jretai.2015.02.005
600
ISSN 0034-7590© RAE | São Paulo | V. 56 | n. 6 | nov-dez 2016 | 600-610
LUÍS FERNANDO [email protected] at Universidade Nove de Julho, Diretoria de Ciências Gerenciais – São Paulo – SP, Brazil
JURACY GOMES PARENTE [email protected] at Fundação Getulio Vargas, Escola de Administração de Empresas de São Paulo – São Paulo – SP, Brazil
FORUMSubmitted 03.02.2016. Approved 08.11.2016Evaluated by double blind review process. Scientific Editors: Delane Botelho and Leandro Guissoni
FRANCHISOR-FRANCHISEE RELATIONSHIP QUALITY: TIME OF RELATIONSHIP AND PERFORMANCEQualidade do relacionamento franqueador-franqueado: Tempo de relacionamento e desempenhoCalidad de las relaciones franquiciador-franquiciado: Tiempo de relaciones y desempeño
ABSTRACTFranchise literature disputes how the relationship between franchisors and franchisees develops over time. Traditional lifecycle theory views relationships following an ascendant curve, in which relationship quality and performance strengthen over time. Another perspective better reflects the peculiarities of the franchisor-franchisee relationship, indicating that relationship quality in franchise systems follows a U-shaped curve. There is also limited research on the moderating effect of time on the relationship between relational variables and outcomes. This study sheds light on the influence of relationship duration on relationship quality and financial performance in the franchisee-franchi-sor relationship. Using a self-report survey from a sample of 342 franchisees, mean and regression analyses are conducted to test relationships. Results confirm the time effect on franchisor-franchisee relationship quality and performance, but the hypothesized shape of relationship phases is only par-tially confirmed. Moreover, time has a positive moderating effect on the impact of relationship quality on financial performance. KEYWORDS | Franchise, relationship quality, financial performance, U–curve theory, time of relationship.
RESUMOA literatura sobre franquia diverge acerca de como o relacionamento entre franqueadores e franqueados se desenvolve ao longo do tempo. A teoria tradicional do ciclo de vida considera que os relacionamentos seguem uma curva ascendente, na qual a qualidade do relacionamento e o desempenho fortalecem-se com o tempo. Outra perspectiva reflete melhor as peculiaridades do relacionamento entre franquea-dor e franqueado, indicando que a qualidade do relacionamento em um sistema de franquia segue uma curva em forma de U. Ademais, há um número limitado de pesquisas sobre o efeito moderador do tempo sobre o relacionamento entre variáveis relacionais e resultados. Este estudo lança luzes sobre a influência da duração do relacionamento sobre a qualidade do relacionamento e sobre o desempenho financeiro, no relacionamento entre franqueador e franqueado. Utilizando uma pesquisa de auto relato com uma amostra de 432 franqueados, foram realizadas análises de regressão e de média para testar os relacionamentos. Os resultados confirmam o efeito do tempo sobre o desempenho e a qualidade do relacionamento entre franqueador e franqueado, mas o formato hipotético das fases do relacionamento foi apenas parcialmente confirmado. Além disso, o tempo tem um efeito moderador positivo sobre o impacto da qualidade do relacionamento no desempenho financeiro.PALAVRAS-CHAVE | Franquia, qualidade de relacionamento, desempenho financeiro, teoria da curva em U, tempo de relacionamento.
RESUMENLa literatura sobre franquicias disputa cómo se desarrollan las relaciones entre los franquiciadores y franquiciados con el transcurso del tiempo. La teoría del ciclo de vida tradicional ve las relaciones siguiendo una curva ascendente en la que la calidad y el desempeño se fortalecen con el pasar del tiempo. Otra perspectiva refleja mejor las peculiaridades de las relaciones franquiciador-franquiciado, indicando que la calidad de las relaciones en los sistemas de franquicias sigue una curva en U. También hay investigaciones limitadas sobre el efecto moderador del tiempo en las relaciones entre variables relacionales y resultados. Este estudio arroja una luz sobre la influencia de la duración de las relaciones sobre la calidad y el desempeño financiero en las relaciones de franquiciados-franquiciadores. Utili-zando una encuesta de autoinforme de una muestra de 342 franquiciados, se conducen análisis de medias y de regresión para probar las relaciones. Los resultados confirman el efecto del tiempo en la calidad y desempeño de las relaciones franquiciadores-franquiciados, pero la forma hipotética de las fases de las relaciones está confirmada sólo parcialmente. Además, el tiempo tiene un efecto moderador positivo en el impacto de la calidad de las relaciones sobre el desempeño financiero.PALABRAS CLAVE | Franquicia, calidad de relaciones, desempeño financiero, teoría de la curva U, tiempo de relaciones.
RAE-Revista de Administração de Empresas | FGV/EAESP
DOI: http://dx.doi.org/10.1590/S0034-759020160603
601
ISSN 0034-7590
AUTHORS | Luís Fernando Varotto | Juracy Gomes Parente
© RAE | São Paulo | V. 56 | n. 6 | nov-dez 2016 | 600-610
INTRODUCTION
Franchising is one of the fastest developing forms of business in the world, and a rich field for studies in marketing and other relevant areas, such as economics, law, management, finance, and entrepreneurship (Grewal, Iyer, Javalgi, & Radulovich, 2011), due to its varied possibilities on governance formats and inter-organizational behaviors (Dant, Grünhagen, & Windsperger, 2011). The success of the franchise system depends on the performance of inter-organizational behaviors in the franchisor-franchisee dyad over time (Grayson, 2007; Heide & Wathne, 2006). Indeed, satisfactory relationships between franchisor and franchisees have long been recognized as critical to the success of the franchise system (Watson & Johnson, 2010).
The measure of franchise performance includes both non-financial (e.g., relationship quality) and financial indicators of performance (e.g., sales growth and profitability) (Venkatraman & Ramanujam, 1986, 1987). Although the relevance of the franchisor-franchisee relationship is evident, there are few studies concerning how this relationship develops over time (Dant, Li, & Wortzel, 1995; Dant, 2008). Indeed, relationship marketing shifted its focus from discrete transactions to long-term relationships (Jap & Ganesan, 2000), raising the need to distinguish between short-term transactions and long-term relational exchanges (Dwyer, Schurr, & Oh, 1987). Therefore, the influence of time, as well as its role on relational and outcome variables, are relevant issues.
In numerous studies, the concept of time is considered as the relationship duration (Athanasopoulou, 2009), and most theories focus on the relationship between organizational buyers and sellers (Dwyer et al., 1987) or on the behavior of the individual representing each organization (Ring & Ven, 1994). Literature in relationship marketing, under the traditional lifecycle theory (Blut et al., 2011; Dant & Nasr, 1998; Dwyer et al., 1987), sees relationships in franchises following an ascendant curve, in which relationship quality and performance strengthen over time and relationship variables are potentially affected by relationship duration (Jap & Anderson, 2007). In fact, buyer-seller relationships are the base for the traditional relationship lifecycle theory, whose study first originated in the U.S. during the early 1980s, initially focusing on the distribution channels approach and, later, on the buyer-supplier relationship. Focusing on business relationships, economic exchanges, and efficiency, research on buyer-seller relationships seeks to explain governance structures and the nature of dyadic behavior in the market-channel context (Möller & Halinen, 2000).
However, buyer-seller relationships may not adequately represent the relationship pattern for franchisor-franchisee relationships, since franchise relationships do not resemble a traditional business-to-business (B2B) exchange relationship
(Grace & Weaven, 2011). Indeed, franchisee-franchisor relationships should be analyzed in the context of inter-organizational exchange, as well as within the context of inter-personal interactions, given their social and subjective nature (Dant, Weaven, & Baker, 2013), whose relationship building parallels marriage analogies (Doherty & Alexander, 2004). Most studies in the marriage context suggest a U-shaped pattern, with high marital happiness in the early years of marriage, a decline in marital happiness during the middle years, and a rise in marital happiness in the later years (VanLaningham, Johnson, & Amato, 2001). Blut et al. (2011) propose that relationships in franchise systems follow a similar logic to the U-shaped curve of marriage contexts. This alternative pattern would explain the evolution of relational variables in franchising better than the traditional lifecycle theory. Given this controversy, this study sheds light on the influence of relationship duration on relationship quality and financial performance in the franchisee-franchisor relationship.
The success of the franchise system depends not only on the relationship quality performance for franchisors and franchisees, but also on the financial performance achieved by these two major players (Brown & Dev, 1997). Considering a broader conceptualization of performance in franchising, this study also investigates the influence of time of relationship upon financial indicators of performance (Venkatraman & Ramanujam, 1986), such as sales growth and profitability (Venkatraman & Ramanujam, 1987). Although financial performance has been acknowledged as a consequence of relationship quality (Athanasopoulou, 2009), there have been few studies that analyze the relationship between nonfinancial measures—such as relationship quality—and financial performance (Banker, Potter, & Srinivasan, 2005). Huntley (2006) finds evidence of the link between relationship quality and profitable outcomes in B2B relationships; however, this issue is still relatively unexplored in the franchise context. Consequently, the present work also seeks to elucidate and address this important issue.
LITERATURE REVIEW AND PROPOSED HYPOTHESESFranchising and relationship constructs
Franchising can be defined as contractual arrangements that represent a form of relational exchange (Grünhagen & Dorsch, 2003), characterized by a long-term continuous perspective, involved in complex relationships, where the survival of the relationship takes precedence over any single exchange (Strutton, Pelton, & Lumpkin, 1995). The satisfactory relationship between franchisor and franchisees has long been recognized as critical to

602
ISSN 0034-7590
FORUM | Franchisor-franchisee relationship quality: Time of relationship and performance
© RAE | São Paulo | V. 56 | n. 6 | nov-dez 2016 | 600-610
the success of a franchise system, where satisfactory relationships specifically mean that franchising provides benefits for the entire network (Watson & Johnson, 2010). Initial research into franchises focuses on the choice of franchising as an organizational form, grounding its assumptions predominantly on either resource scarcity or agency theory. However, over time, the focus of research has moved toward understanding the relationship between franchisors and franchisees (Watson & Johnson, 2010).
Franchisors are expected to provide services for their franchisees, such as training, research and development, advertising and marketing support, management assistance, and supply provision (Watson & Johnson, 2010), which are relevant for system promotion and uniformity (Monroy & Alzola, 2005). Positive or negative franchisee evaluation of these services over time affects both their satisfaction and dissatisfaction, leading to greater trust or ensuing conflict in the relationship, with affects the perception of the franchisee’s relationship quality (Chiou, Hsieh, & Yang, 2004).
Relationship quality is a crucial concept in the development of long-term and mutually beneficial relationships (Athanasopoulou, 2009), and, for some authors, represents the strength and magnitude of a relationship (Dant et al., 2013; Monroy & Alzola, 2005). Analyzing the franchise context, Monroy & Alzola (2005) introduce the concepts of transactional and relationship quality as different but interdependent constructs. Transactional quality is related to short-term business performance, considering two dimensions for franchisees (i.e., contents and assistance), which include attributes such as training, support, information, supply, financial facilities, management assistance, and accessibility, and also two dimensions for franchisors (i.e., formality and identity), which include business development, training attendance, payment accomplishment, uniformity, and transparency. Relationship quality, on the other hand, is related to the long-term performance of franchise partners. It includes variables such as trust, commitment, and relationship, and requires time to be developed and consolidated. Therefore, transactional quality “guarantees a satisfactory business start-up, constituting the first step in the development of a long-term relationship” (Monroy & Alzola, 2005, p. 598)
Relationship quality, according to mainstream academic research, is considered an overall assessment of relationship strength, and treated as a global or higher-order construct that reflects a combination of multiple first-order factors (Palmatier, 2008), which capture different but related facets of a relationship (Palmatier, Dant, Grewal, & Evans, 2006). Relationship quality’s most cited dimensions in academic research are trust, commitment, and satisfaction (Athanasopoulou, 2009; Palmatier et al., 2006).
Trust is one of the most relevant constructs in relationship marketing (Anderson & Narus, 1990; Doney & Cannon, 1997; Ganesan, 1994; Mohr & Spekman, 1994; Morgan & Hunt, 1994), and
is tied to the belief in partner integrity and predictability (Morgan & Hunt, 1994). Under this view, a company acts in order to generate positive results and does not take unexpected actions which may harm their partners (Anderson & Narus, 1990). This is an important factor in building long-term relationships (Ganesan, 1994), since in the presence of trusted long-term idiosyncratic investments can be made with limited risk (Doney & Cannon, 1997).
Commitment is related to the intention and desire of the parties to maintain a given relationship in the future (Wilson, 1995). In marketing literature, commitment is associated to survival, performance (Anderson & Weitz, 1992; Geyskens, Steenkamp, Scheer, & Kumar, 1996; Morgan & Hunt, 1994) and successful long-term relationships (Walter, Mueller, & Helfert, 2000). Therefore, commitment is associated to the partners’ intention to continue the relationship, and their willingness to accept short-term sacrifices in order to achieve long-term benefits (Morgan & Hunt, 1994) by means of relationship survival and stability (Anderson & Weitz, 1992; Dwyer et al., 1987).
Satisfaction is the most popular construct in empirical studies of channel relationship models (Geyskens, Steenkamp, & Kumar, 1999), and is typically positively linked to the continuity of long-term relationships, and negatively linked to conflicts in the relationship (Anderson & Narus, 1990). Satisfaction is related to the perceived discrepancy between prior expectations and actual profits (economic perspective) or to an emotional response to the overall working relationship with the channel partner (non-economic perspective) (Crosby, Evans, & Cowles, 1990; Geyskens et al., 1999). Within the franchise context, satisfaction has been tied to the franchisee’s commitment and intention to remain in the relationship (Chiou et al., 2004).
Successful inter-organizational relationships are a critical issue in terms of financial performance (Palmatier, Dant, & Grewal, 2007), since firms with higher levels of cooperation and reduced conflict are more willing to improve innovations, expand markets, and reduce costs (Cannon & Homburg, 2001). In fact, good relationships, trust in partners, and commitment should improve organizational performance, given that, in an environment of this nature, exchanges produce greater satisfaction and efficiency (Wang & Yang, 2013). There are many key drivers of inter-organizational relationship performance. Palmatier et al.(2007) claim that at least four main theories dominate attempts to understand these drivers—commitment-trust theory (Morgan & Hunt, 1994), the perception of dependence (Bucklin & Sengupta, 1993), transaction cost economics (Williamson, 1979), and the perspective of relational norms (Kaufmann & Dant, 1992).
Therefore, although performance has been measured from various viewpoints, depending on the research questions, disciplinary focus, and data availability, the main focus has been

603
ISSN 0034-7590
AUTHORS | Luís Fernando Varotto | Juracy Gomes Parente
© RAE | São Paulo | V. 56 | n. 6 | nov-dez 2016 | 600-610
towards business economic performance, which is reflected by dimensions such as sales growth, net income growth, return on investment, profitability, relative market position, and market share (Venkatraman & Ramanujam, 1987). In franchise literature, financial performance has been measured mainly by franchise profitability, annual sales, and sales growth (Soontiens & Lacroix, 2009).
Following the work of Blut et al (2011), this study operation-alizes the measure of financial performance using the informant’s perceived performance rather than objective measures of perfor-mance. Accordingly, it also focuses on the franchisee’s perception of sales growth and profitability in order to measure perceived financial performance.
Time, as a variable, is included in numerous studies as relationship duration, and the role of time in relationships can be analyzed from more than one vantage point (Athanasopoulou, 2009). Indeed, the concept of relationship dynamics is explained by a multitude of theories adapted from sociology, as to explain relationship development in inter-organizational contexts (Ring & Ven, 1994). One of these points of view is the episodic perspective, under which relationships follow a cycle, replete with a construction, development, and a likely end (Athanasopoulou, 2009). Time is seen as a series of phases or periods in which relationship variables change according to time phases (Dwyer et al., 1987; Morgan & Hunt, 1994; Wilson, 1995). Traditional lifecycle theory sees relationships proceeding through a sequence of phases (Dwyer et al., 1987), typically differentiated as (1) formation, (2) exploration, (3) maturity, and (4) termination.
Following traditional lifecycle theory, after the first experiences between the parties in the initial relationship phase, relational variables, such as cooperation and dependence, are assessed more favorably over time. As the relationship matures, the ties between partners strengthen, thus increasing their interdependence (Blut et al., 2011). Life-cycle theory has produced empirical results that suggest that numerous relational variables follow an inverted U-shaped curve (Jap & Anderson, 2007). However, Blut et al. (2011) find that this life-cycle configuration may not extend to other inter-organizational arrangements that differ from those based on traditional buyer-seller relationships, such as franchisor-franchisee relationships. These researchers, in contrast to the life cycle theory, suggest that relational constructs in the franchise context may follow a U-shaped curve over time, with a “honeymoon” initial phase, following stages of “routine,”
“crossroads,” and “stabilization.” Blut et al. (2011) find evidence of a U-shaped curve in variables such as satisfaction, trust, commitment, and performance.
Therefore, following the perspective of Blut et al. (2011), this study examines if relationship quality and financial performance do follow a U-shaped curve, leading to the following hypotheses:
H1a: The relationship between relationship quality and time follows a U-shaped curve, which is high in the first and fourth phase, and low in the second and third phase.
H1b: The relationship between financial performance and time follows a U-shaped curve, which is high in the first and fourth phase, and low in the second and third phase.
The moderating role of time on the effects of relational variables, such as trust and commitment, on relational outcomes has been examined in business-to-consumer contexts, but it has been somewhat neglected in B2B settings (Victoria Bordonaba-Juste & Polo-Redondo, 2008). In fact, only the moderating role of relationship time in the effects of trust and commitment on satisfaction and the intention to continue a relationship were tested by Victoria Bordonaba-Juste and Polo-Redondo (2008), but the moderating role of time on the effect of relational variables, such as relationship quality, on financial performance is still unexplored.
In longer relationships, parties benefit from mutual expe-rience and variables, such as trust, commitment, communication, and cooperation. Over time, bonds become stronger and the rela-tionship closer (Athanasopoulou, 2009). There are also evidences that, in general, long-term relationships are more profitable than short-term ones (Reichheld & Teal, 2001).
Therefore, during the lifetime of a relationship, relational variables, such as relationship quality, should receive better assessments, as well as financial performance evaluations, by partners in long-term relationships than in short-term ones. From this point of view, the following hypothesis is also tested:
H2: The effect of relationship quality on financial performance is stronger in long-term relationships than in short-term ones.
METHODOLOGY
Sampling procedures
The sample for this investigation was drawn from the list of franchisees of three Brazilian franchisors within the educational and fast food segments. These franchisors provided the researcher with a list of franchisee stores and their e-mail addresses. The questionnaire was tested and revised prior to general administration. In total, 1237 franchisees were invited to participate in an on line survey. To encourage participation, we emphasized the premise of confidentiality, as franchisors would only have access to aggregate data. A total of 348 usable surveys were obtained, representing a response rate of 28.1%. To reinforce confidentiality, responses were obtained in an anonymous fashion. Examination of sample characteristics

604
ISSN 0034-7590
FORUM | Franchisor-franchisee relationship quality: Time of relationship and performance
© RAE | São Paulo | V. 56 | n. 6 | nov-dez 2016 | 600-610
indicates that females represent 54.4% of respondents and 70.0% of the franchisees operate only one unit. There is no significant difference among the franchisees’ profile of the three franchise networks. A Mahalanobis distribution analysis to identify outliers was performed, and six elements that presented difference in behavior were eliminated, leaving 342 questionnaires.
Measures employed and psychometric assessment
Relationship quality was measured by the same scale used by Dant et al. (2013), in a study which measures the perceived relationship quality between franchisors and franchisees. Three scales measure satisfaction, trust, and commitment, and all three scales are seven-point Likert-type scales, from 1 (strongly disagree) to 7 (strongly agree).
Perceived financial performance is measured by means of a Likert-type scale derived from Venkatraman & Ramanujam (1987) and Griffith et al. (2006), which measures the constructs
of franchisee sales growth and profitability. These scales were originally developed and applied in English. For this reason, they were translated into Portuguese and subsequently validated. Both are five-point Likert-type scale, from 1 (much worse) to 5 (much better), with a defined neutral point anchored with a response of 3 (equal). In these questionnaires, franchisees provide answers regarding their sales growth and profitability in comparison with similar stores in the region.
Time of relationship is measured as the number of months of the relationship between the franchisees and their respective franchisors. For testing, the sample is distributed in four groups (phases), following the parameters adopted by Blut et al. (2011):
1. Honeymoon—ends after one year2. Routine—ends after four years3. Crossroads—ends after eight years4. Stabilization—begins after eight years
Table 1 shows reliability analysis for the scales above.
Table 1. Reliability analysis
Construct Item Factor loading
Composite reliability
Cronbach’s Alpha
Commitment
We are very committed to the relationship with our franchisor 0.887 0.96 0.96I enjoy working with this franchisor 0.823I feel as though the franchisor and I are “in it together” 0.894It feels like the franchisor and I are constantly doing something for each other 0.810I feel that the values of this franchise system match my own 0.874We try our best to maintain our relationship with our franchisor 0.807We feel proud to belong to this franchise system 0.862We intend to continue functioning as a franchisee of our franchisor 0.667We have a mutually beneficial relationship 0.834The franchisor and I get along well together 0.855The franchisor and I tend to share similar values 0.843
Satisfaction
Overall we consider our relationship with the franchisor to be: Satisfying 0.847 0.96 0.94Overall we consider our relationship with the franchisor to be: Friendly 0.806Overall we consider or relationship with the franchisor to be: Considerate 0.860Overall we consider our relationship with the franchisor to be: Cordial 0.874Overall we consider our relationship with the franchisor to be: Supportive 0.873Overall we consider our relationship with the franchisor to be: Fair 0.906Overall we consider our relationship with the franchisor to be: Healthy 0.893
Trust
I can rely on my franchisor to keep the promises they make to me 0.894 0.96 0.96I can count on my franchisor to be honest in its dealings with me 0.928My franchisor can be counted on to do what is right 0.899My franchisor is sincere in its dealings with me 0.918My franchisor is a company that I have great confidence in 0.865My franchisor is a company that stands by its word 0.917
Sales growth Compared to other stores in this region, its sales growth is (if you have more than one unit measure the average): 0.934 0.91 0.80
Profitability Compared to other stores in this region, its profitability is (if you have more than one unit measure the average) 0.892

605
ISSN 0034-7590
AUTHORS | Luís Fernando Varotto | Juracy Gomes Parente
© RAE | São Paulo | V. 56 | n. 6 | nov-dez 2016 | 600-610
RESULTS AND DISCUSSION
The mean analysis statistical technique is applied to investigate the differences in the means of relationship quality and financial performance variables along the proposed relationship phases (hypotheses H1a and H1b). This technique is used to determine if the means of the variables associated with relationship quality and financial performance are significantly different within the four tested phases of the relationship. Regression analysis is used to test the influence of the time of relationship in the link between relationship quality and performance (hypothesis H2).
In order to test H1a and H1b the sample is distributed as in Table 2.
Table 2. Groups for phases
Relationship phases
Value label Number
1 Honeymoon 40
2 Routine 87
3 Crossroads 59
4 Stabilization 156
Source: Software SPSS 18.0
Table 3 shows the average and standard deviations of relationship quality and performance constructs in the four defined stages of the relationship.
Table 3. Relationship phases: Descriptive statistics
Relationship
phasesMean
Standard deviation
Number
Relationship quality
Honeymoon 5.96 0.82 40
Routine 5.76 1.23 87
Crossroads 5.9 0.97 59
Stabilization 6.12 1.04 156
Total 5.97 1.07 342
Performance
Honeymoon 3.25 0.52 40
Routine 3.10 0.72 87
Crossroads 3.32 0.78 59
Stabilization 3.35 0.82 156
Total 3.27 0.76 342
Table 3 indicates that the averages of relationship quality and performance seem to follow the stages of a U-shaped behavior, with higher averages in the extremes of the honeymoon and stabilization, and lower averages in the routine and crossroads stages, as portrayed in Graph 1 below.
Graph 1. Relationship quality by relationship phase
Honeymoon Routine Crossroads Stabilization
Relationship quality
6.206.106.005.905.805.705.605.50
A similar pattern is found for the financial performance variable, but with a greater increase in the crossroads stage as compared to the honeymoon stage, and continuing to rise as relationship time increases, as portrayed in Graph 2 below:
Graph 2. Financial performance by relationship phase
Financial performance
Honeymoon Routine Crossroads Stabilization
3.403.353.303.253.203.153.103.053.002.95
In all factors that measure relationship quality and performance variables, the significance levels are below 5% (p < 0.05), which indicates non-normality of the data. Based on this data profile, the Kruskal-Wallis non-parametric test is applied to investigate the null hypothesis, in which the population averages in these two variables are the same for the four stages of the relationship. Table 4 indicates the average ranks for the relationship phases.

606
ISSN 0034-7590
FORUM | Franchisor-franchisee relationship quality: Time of relationship and performance
© RAE | São Paulo | V. 56 | n. 6 | nov-dez 2016 | 600-610
Table 4. Relationship quality and financial performance mean ranks for relationship phases
Phases Number Mean rank
Relationship quality
Honeymoon 40 155
Routine 87 153.57
Crossroads 59 160.03
Stabilization 156 190.07
Total 342
Financial performance
Honeymoon 40 166.99
Routine 87 151.94
Crossroads 59 177.65
Stabilization 156 181.24
Total 342
Table 5. Kruskal-Wallis test for relationship quality and financial performance
Relationship
qualityPerformance
Chi-square 10.308 5.505
Sig. 0.016 0.138
According to the results from the Kruskal-Wallis test (Table 5), there is in fact a significant difference between averages in the stages of relationship for the relationship quality variable. Regarding the financial performance variable, no significant difference can be observed between the averages in the relationship stages.
Subsequently, a post hoc test is conducted on the relationship quality variable to verify whether the averages among the four stages of the relationship are different. The results are shown in Table 6.
As per Table 6, a significant difference (10% significance level) is observed between the averages of the routine and stabilization stages, which, at least in part, confirms the curve pattern of the relationship quality variable.
Regarding the performance variable, bearing in mind that the differences in the averages of the constructs show no difference, the analysis of sales growth and profitability variables are performed separately, by means of the Kruskal-Wallis test, to verify if differences could be observed in the averages of these variables within the relationship stages.
Table 6. Post hoc tests: Multiple comparisons on relationship quality
Phases (1) Phases (2)Mean
difference (1-2)
Standard error
Significance
Honeymoon
Routine 0.2 0.2 0.76
Crossroads 0.05 0.22 1
Stabilization -0.16 0.19 0.82
Routine
Honeymoon -0.2 0.2 0.76
Crossroads -0.15 0.18 0.85
Stabilization -0.36 0.14 0.05
Crossroads
Honeymoon -0.05 0.22 1
Routine 0.15 0.18 0.85
Stabilization -0.22 0.16 0.54
Stabilization
Honeymoon 0.16 0.19 0.82
Routine 0.36 0.14 0.05
Crossroads 0.22 0.16 0.54
Table 7. Sales growth and profitability mean ranks for relationship phases
Phases Number Mean rank
Sales growth
Honeymoon 40 188.90
Routine 87 159.15
Crossroads 59 171.92
Stabilization 156 173.77
Total 342
Profitability
Honeymoon 40 147.06
Routine 87 147.98
Crossroads 59 180.68
Stabilization 156 187.41
Total 342
Table 8. Kruskal-Wallis test for sales growth and profitability
Sales growth Profitability
Chi-square 3.090 13.553
Significance 0.378 0.004
According to the Kruskal-Wallis test, only the profitability variable presents significant differences among the relationship stages. Considering this result, the post hoc test was conducted on the profitability variable to verify between which stages of the relationship the averages are different.
Table 9 indicates the results.

607
ISSN 0034-7590
AUTHORS | Luís Fernando Varotto | Juracy Gomes Parente
© RAE | São Paulo | V. 56 | n. 6 | nov-dez 2016 | 600-610
Table 9. Post hoc tests: multiple comparisons on profitability
Phases (1) Phases (2)Mean
difference (1-2)
Standard error
Significance
Honeymoon
Routine 0.02 0.162 0.999
Crossroads -0.28 0.174 0.374
Stabilization -0.34 0.150 0.109
Routine
Honeymoon -0.02 0.162 0.999
Crossroads -0.31 0.143 0.146
Stabilization -0.37* 0.114 0.008
Crossroads
Honeymoon 0.28 0.174 0.374
Routine 0.31 0.143 0.146
Stabilization -0.06 0.130 0.967
Stabilization
Honeymoon 0.34 0.150 0.109
Routine 0.37* 0.114 0.008
Crossroads 0.06 0.130 0.967
As observed in the relationship quality variable, a significant difference (10% significance level) could also be observed between the routine and stabilization stages for the profitability variable, which, at least in part, confirms this study’s hypothesis.
Table 10 shows a comparison of the findings from Blut et al. (2011) and those from the present study.
Table 10. Comparison: Blut et al. (2011) and present research
Relational variables Honeymoon Routine Crossroads Stabilization
Blut et al.
(2011)
Relationship Quality* (7 point Likert-
scale)
4.95 4.19 4.15 4.69
This study
Relationship Quality (7
point Likert-scale)
5.96 5.76 5.90 6.12
Blut et al.
(2011)
Performance (7 point
Likert-scale)5.00 4.23 4.34 4.93
This study
Performance (5 point
Likert-scale)3.25 3.10 3.32 3.35
Note: * Mean of the constructs satisfaction, trust, and commitment.
Table 10 results indicate that, although significant differences between the routine and stabilization stages were identified, the format of the curves throughout the stages is quite similar to that found by Blut et al. (2011), reinforcing the hypothesis that the relationship in franchises follows a different pattern from the traditional lifecycle theory.
The H2 hypothesis tests the influence of the time of relationship in the link between relationship quality and performance. To test this relationship, a regression analysis is applied utilizing model 1 (simple moderation) of PROCESS macro in SPSS (Hayes, 2013), with financial performance as the dependent variable, relationship time as moderator variable, and relationship quality as independent variable.
In the moderation analysis, relationship time was utilized in its continuous measurement (derived from all 342 responses, and not just by the averages of the four stages of the U-shaped curve). Considering the vast literature indicating that moderation analysis through qualitative dichotomization of the scale does not accentuate type II error (Cadario & Parguel, 2014; Iacobucci, Posavac, Kardes, Schneider, & Popovich, 2015; McClelland, Lynch, Irwin, Spiller, & Fitzsimons, 2015, among others), the decision for maintaining the continuous variable was justified by the high variability of the obtained measure (minimum time = two months, maximum time = 528 months, M = 120.72 months, sd = 116.12 months) (Rucker, McShane, & Preacher, 2015).
Figure 1 shows the relation between relationship quality and performance moderated by time.
Figure 1. Relation between relationship quality and performance over time
Time
Relationshipquality
Performance
Regression analysis identifies the direct effect of relationship quality on financial performance (b = 0.231, CI 95% [0.126, 0.335, p < 0.001], R2 = 0.194), but does not identify a direct effect of time of relationship on financial performance ( =
- 0.002, CI 95% [- 0.007, 0.003, p > 0.417 = n.s.]). As predicted by H2, a positive influence of time of the relationship is identified on the relationship between relationship quality and financial performance (b = 0.109, CI 95% [0.004, 0.017, p < 0.05]).

608
ISSN 0034-7590
FORUM | Franchisor-franchisee relationship quality: Time of relationship and performance
© RAE | São Paulo | V. 56 | n. 6 | nov-dez 2016 | 600-610
A spotlight analysis (Hayes, 2013) presented in Graph 3 indicates a positive moderation of relationship time.
Graph 3. Time moderation spotlight
Time
Moderation effect
Perfo
rman
ce
Mean[4.5]
0.2330.286
0.340
[120.7] [236.8](SD) SD
0.50.45
0.40.35
0.30.25
0.20.15
0.10.05
0
According to the results presented, in the more mature stages of the relationship, it is evident that an increase in connection strength between relationship quality and performance occurs during the relationship duration.
CONCLUSIONS
This study showed that the relationship in franchise systems seems to follow a different pattern than that of the traditional lifecycle theory (Dwyer et al., 1987), but similar to the U-shaped curve model proposed by Blut et al.(2011). According to the results of the present study, the relationship in franchise systems is developed following the stages of a U-shaped curve over time. It was confirmed that time of relationship influences the intensity of the connection between relationship quality and financial performance.
The intensity of the connection between relationship quality and financial performance, as well as its explanatory power, proved to be lower for the franchisees with a shorter relationship than for those franchisees with a longer relationship. This finding reinforces the importance of strong relationships for growth and profitability, and that deepening this relationship over time is responsible for the long-term success of franchise networks.
Although the averages of the variables of relationship quality and performance confirmed the hypothesis that the relationship in franchises follows a U-shaped curve, passing through four different stages, it was impossible to prove that the measurements are significantly different in all stages. It can be perceived that there is a variation between the averages of relationship quality and performance throughout the four stages. Nonetheless, it is clear that there is an important difference
when one compares the initial stages of the relationship (honeymoon, routine, and crossroads) and the more advanced stage (stabilization). The averages for the variables of relationship in the study conducted by Blut et al. (2011) present no greater differences in magnitude in the same stages of relationship than those identified in the present study. However, in the findings of Blut et al. (2011) the differences between averages were considered significant. It is likely that the difference in sample size (2668 versus 342) may well explain the fact that this study was unable to identify significant differences of the averages analyzed in the four stages of the proposed relationship.
Nevertheless, the graph configuration of the averages of these variables over time seems to confirm the theoretical proposal of Blut et al. (2011) in that the relationship in franchises does not follow the traditional cycle of the inverted “U” found in B2B relationships. Conversely, it appears to follow a U-shaped curve, in which the relationships worsen after the initial stages of positive expectation, and begins to improve and stabilize throughout the relationship.
Theoretically, this study shed light upon the role of the time of relationship between franchisors and franchisees, and reinforces the perception that relationships in franchises does not follow the traditional lifecycle theory (Dwyer et al., 1987).
We also suggested that the effect of relationship quality on financial performance is stronger in long-term relationships than in short-term ones. These results suggest that better assessments of relationship quality are associated to higher financial performance assessments, reinforcing previous theoretical findings in marketing literature (Athanasopoulou, 2009; Reichheld & Teal, 2001). The positive moderating effect of time on the relation between relationship quality and performance, although empirically observed, has not been tested in literature. Therefore, this study contributes to existing knowledge in the area by analyzing the moderating effect of time on the impact of relationship quality on performance in the franchisor-franchisee relationship.
This works also provides useful managerial implications due to the relation between financial performance and the quality of the relationship. Franchisors should be especially careful to avoid the declining tendency—in both relationship quality and financial performance—after the initial honeymoon stages. The understanding that franchise relationships follow a cycle whose stages are associated with different franchisees’ expectations and needs can help franchisors develop strategies that are properly adjusted to the specific demands of the franchisees. Perhaps the training and support efforts provided by the franchisors to the new franchisees need to be carried out for a longer period to avoid the drop in financial performance and relationship quality.
609
ISSN 0034-7590
AUTHORS | Luís Fernando Varotto | Juracy Gomes Parente
© RAE | São Paulo | V. 56 | n. 6 | nov-dez 2016 | 600-610
This special attention from the franchisors during the franchisee’s crossroads stage could be reflected in strengthened relationship quality and overall network performance, and might deter any relationship discontinuity likely to take place in this phase.
This work adopted a transversal approach regarding the temporal dimension. Although this design is well established (Jap & Anderson, 2007; Jap & Ganesan, 2000), the conducting of longitudinal studies, with larger samples, in addition to the incorporation of other variables might provide new insights about how relationship quality and financial performance evolve during franchise relationships.
REFERENCES
Anderson, E., & Weitz, B. (1992). The use of pledges to build and sustain commitment in distribution channels. Journal of Marketing Research, 29(1), 18-34.doi:10.2307/3172490
Anderson, J. C., & Narus, J. A. (1990). A model of distributor firm and manufacturer firm working partnerships. The Journal of Marketing, 54, 42-58.doi:10.1108/03090560910946945
Athanasopoulou, P. (2009). Relationship quality: A critical literature re-view and research agenda. European Journal of Marketing, 43(5/6), 583-610.doi:10.1108/03090560910946945
Banker, R. D., Potter, G., & Srinivasan, D. (2005). Association of non-financial performance measures with the financial performance of a lodging chain. Cornell Hotel and Restaurant Administration Quarterly, 46(4), 394-412. doi:10.1177/0010880405275597
Blut, M., Backhaus, C., Heussler, T., Woisetschläger, D. M., Evanschitzky, H., & Ahlert, D. (2011). What to expect after the honeymoon: Testing a lifecycle theory of franchise relationships. Journal of Retailing, 87(3), 306-319. doi:10.1016/j.jretai.2010.06.003
Brown, J. R., & Dev, C. S. (1997). The franchisor-franchisee relation-ship: A key to franchise performance. The Cornell Hotel and Restau-rant Administration Quarterly, 38(6), 4-38. doi:10.1016/S0010-8804(97)85367-0
Bucklin, L. P., & Sengupta, S. (1993). Organizing successful co-marketing alliances. The Journal of Marketing, 57(2), 32-46.doi:10.2307/1252025
Cadario, R., & Parguel, B. (2014). Reconsidering the practice of discret-izing quantitative variables: Towards a new analysis of moderation in experimental research. Recherche Et Applications En Marketing (En-glish Edition), 29(4).doi:10.1177/2051570714552360
Cannon, J. P., & Homburg, C. (2001). Buyer-supplier relationships and customer firm costs. Journal of Marketing, 65(1), 29-43.doi:10.1509/jmkg.65.1.29.18136
Chiou, J. -S., Hsieh, C. -H., & Yang, C. -H. (2004). The effect of franchisors’ communication, service assistance, and competitive advantage on franchisees’ intentions to remain in the franchise system. Journal of Small Business Management, 42(1), 19-36.doi:10.1111/j.1540-627X.2004.00095.x
Crosby, L. A., Evans, K. R., & Cowles, D. (1990). Relationship quality in services selling: An interpersonal influence perspective. The Journal of Marketing, 54(3), 68-81.doi:10.2307/1251817
Dant, R. P. (2008). A futuristic research agenda for the field of franchis-ing. Journal of Small Business Management, 46(1), 91-98.doi:10.1111/j.1540-627X.2007.00233.x
Dant, R. P., Grünhagen, M., & Windsperger, J. (2011). Franchising re-search frontiers for the twenty-first century. Journal of Retailing, 87(3), 253-268.doi:10.1016/j.jretai.2011.08.002
Dant, R. P., Li, Z. G., & Wortzel, L. H. (1995). Linking relationship qual-ity and service quality in franchise systems: Model and measure-ment. Journal of Marketing Channels, 4(1-2), 103-124. doi:10.1300/J049v04n01_07
Dant, R. P., & Nasr, N. I. (1998). Control techniques and upward flow of information in franchising in distant markets: Conceptualization and preliminary evidence. Journal of Business Venturing, 13(1), 3-28.doi:10.1300/J049v04n01_07
Dant, R. P., Weaven, S. K., & Baker, B. L. (2013). Influence of personal-ity traits on perceived relationship quality within a franchisee-fran-chisor context. European Journal of Marketing, 47(1/2), 279-302.doi:10.1108/03090561311285556
Doherty, A. M., & Alexander, N. (2004). Relationship development in international retail franchising: Case study evidence from the UK fashion sector. European Journal of Marketing, 38(9/10), 1215-1235.doi:10.1108/03090560410548942
Doney, P. M., & Cannon, J. P. (1997). An examination of the nature of trust in buyer-seller relationships. The Journal of Marketing, 61, 35-51.doi:10.1108/03090560410548942
Dwyer, F. R., Schurr, P. H., & Oh, S. (1987). Developing buyer-seller re-lationships. The Journal of Marketing, 51, 11-27.doi:10.2307/1251126
Ganesan, S. (1994). Determinants of long-term orientation in buyer-seller relationships. The Journal of Marketing, 58, 1-19.doi:10.2307/1252265
Geyskens, I., Steenkamp, J. -B. E., & Kumar, N. (1999). A meta-analysis of satisfaction in marketing channel relationships. Journal of Market-ing Research, 36(2), 223-238.
Geyskens, I., Steenkamp, J. -B. E., Scheer, L. K., & Kumar, N. (1996). The effects of trust and interdependence on relationship commitment: A trans-Atlantic study. International Journal of Research in Marketing, 13(4), 303-317.doi:10.2307/3152095
Grace, D., & Weaven, S. (2011). An empirical analysis of franchisee val-ue-in-use, investment risk and relational satisfaction. Journal of Re-tailing, 87(3), 366-380.doi:10.2307/3152095
Grayson, K. (2007). Friendship versus business in marketing relation-ships. Journal of Marketing, 71(4), 121-139.doi:10.1509/jmkg.71.4.121
Grewal, D., Iyer, G. R., Javalgi, R. R. G., & Radulovich, L. (2011). Franchise partnership and international expansion: A conceptual framework and research propositions. Entrepreneurship Theory and Practice, 35(3), 533-557.doi:10.1111/j.1540-6520.2011.00444.x
Griffith, D. A., Noble, S. M., & Chen, Q. (2006). The performance implica-tions of entrepreneurial proclivity: A dynamic capabilities approach. Journal of Retailing, 82(1), 51-62.
Grünhagen, M., & Dorsch, M. J. (2003). Does the franchisor provide val-ue to franchisees? Past, current, and future value assessments of two franchisee types. Journal of Small Business Management, 41(4), 366-384.doi:10.1016/j.jretai.2005.11.007
Hayes, A. F. (2013). Introduction to mediation, moderation, and con-ditional process analysis: A regression-based approach. New York, USA: Guilford Press.
610
ISSN 0034-7590
FORUM | Franchisor-franchisee relationship quality: Time of relationship and performance
© RAE | São Paulo | V. 56 | n. 6 | nov-dez 2016 | 600-610
Heide, J. B., & Wathne, K. H. (2006). Friends, businesspeople, and rela-tionship roles: A conceptual framework and a research agenda. Jour-nal of Marketing, 70(3), 90-103.
Huntley, J. K. (2006). Conceptualization and measurement of relation-ship quality: Linking relationship quality to actual sales and recom-mendation intention. Industrial Marketing Management, 35(6), 703-714.doi:10.1016/j.indmarman.2005.05.011
Iacobucci, D., Posavac, S. S., Kardes, F. R., Schneider, M., & Popovich, D. L. (2015). Toward a more nuanced understanding of the statistical properties of a median split. Journal of Consumer Psychology, 25(4), 652-665.doi:10.1016/j.jcps.2014.12.002
Jap, S. D., & Anderson, E. (2007). Testing a life-cycle theory of coopera-tive interorganizational relationships: Movement across stages and performance. Management Science, 53(2), 260-275.doi:10.1287/mnsc.l060.0610
Jap, S. D., & Ganesan, S. (2000). Control mechanisms and the relationship life cycle: Implications for safeguarding specific investments and devel-oping commitment. Journal of Marketing Research, 37(2), 227-245.
Kaufmann, P. J., & Dant, R. P. (1992). The dimensions of commercial ex-change. Marketing Letters, 3(2), 171-185.
McClelland, G., Lynch, J. G., Irwin, J. R., Spiller, S. A., & Fitzsimons, G. J. (2015). Median splits, type II errors, and false positive consumer psychology: Don’t fight the power. Journal of Consumer Psychology, 25(4), 679-689.doi:10.1016/j.jcps.2015.05.006
Mohr, J., & Spekman, R. (1994). Characteristics of partnership success: Partnership attributes, communication behavior, and conflict resolu-tion techniques. Strategic Management Journal, 15(2), 135-152.
Möller, K., & Halinen, A. (2000). Relationship marketing theory: Its roots and direction. Journal of Marketing Management, 16(1-3), 29-54.doi:10.1002/smj.4250150205
Monroy, M. F., & Alzola, L. M. (2005). An analysis of quality manage-ment in franchise systems.European Journal of Marketing, 39(5/6), 585-605.doi:10.1108/03090560510590728
Morgan, R. M., & Hunt, S. D. (1994). The commitment-trust theo-ry of relationship marketing. The Journal of Marketing, 58, 20-38.doi:10.2307/1252308
Palmatier, R. W. (2008). Interfirm relational drivers of customer value. Journal of Marketing, 72(4), 76-89.doi:10.1509/jmkg.72.4.76
Palmatier, R. W., Dant, R. P., & Grewal, D. (2007). A comparative lon-gitudinal analysis of theoretical perspectives of interorganization-al relationship performance. Journal of Marketing, 71(4), 172-194.doi:10.1509/jmkg.71.4.172
Palmatier, R. W., Dant, R. P., Grewal, D., & Evans, K. R. (2006). Factors influencing the effectiveness of relationship marketing: A meta-anal-ysis. Journal of Marketing, 70(4), 136-153.doi:10.1509/jmkg.70.4.136
Reichheld, F. F., & Teal, T. (2001). The loyalty effect: The hidden force behind growth, profits, and lasting value. Boston: USA: Harvard Busi-ness Press.
Ring, P. S., & Van de Ven, A. H. (1994). Developmental processes of cooperative interorganizational relationships. Academy of Manage-ment Review, 19(1), 90-118.
Rucker, D. D., McShane, B. B., & Preacher, K. J. (2015). A researcher’s guide to regression, discretization, and median splits of contin-uous variables. Journal of Consumer Psychology, 25(4), 666-678.doi:10.1016/j.jcps.2015.04.004
Soontiens, W., & Lacroix, A. (2009). Personality traits of franchisees—McDonald’s restaurants in Australia. Problems and Perspectives in Management, 7(1), 238-244.
Strutton, D., Pelton, L. E., & Lumpkin, J. R. (1995). Psychological climate in franchising system channels and franchisor-franchisee solidar-ity. Journal of Business Research, 34(2), 81-91.doi:10.1016/0148-2963(94)00053-H
VanLaningham, J., Johnson, D. R., & Amato, P. (2001). Marital happiness, marital duration, and the U-shaped curve: Evidence from a five-wave panel study. Social Forces, 79(4), 1313-1341.
Venkatraman, N., & Ramanujam, V. (1986). Measurement of busi-ness performance in strategy research: A comparison of ap-proaches. Academy of Management Review, 11(4), 801-814.doi:10.1177/014920638701300109
Venkatraman, N. U., & Ramanujam, V. (1987). Measurement of business economic performance: An examination of meth-od convergence. Journal of Management, 13(1), 109-122.doi:10.1177/014920638701300109
Victoria Bordonaba-Juste, M., & Polo-Redondo, Y. (2008). Differences between short and long-term relationships: An empirical analysis in franchise systems. Journal of Strategic Marketing, 16(4), 327-354.doi:10.1080/09652540802264033
Walter, A., Mueller, T. A., & Helfert, G. (2000). The impact of satisfaction, trust, and relationship value on commitment: Theoretical consider-ations and empirical results. In IMP Conference Proceedings.
Wang, X., & Yang, Z. (2013). Inter-firm opportunism: A meta-analytic review and assessment of its antecedents and effect on perfor-mance. Journal of Business & Industrial Marketing, 28(2), 137-146.doi:10.1108/08858621311295272
Watson, A., & Johnson, R. (2010). Managing the franchisor--franchisee relationship: A relationship marketing perspective. Journal of Mar-keting Channels, 17(1), 51-68.doi:10.1080/10466690903436305
Williamson, O. E. (1979). Transaction-cost economics: The gover-nance of contractual relations. The Journal of Law & Economics, 22(2), 233-261.

611
ISSN 0034-7590 © RAE | São Paulo | V. 56 | n. 6 | nov-dez 2016 | 611-625
LÚCIA APARECIDA DA SILVA [email protected] do Instituto Federal de Educação, Ciência e Tecnologia de São Paulo – Sertãozinho – SP, Brasil
DIRCEU TORNAVOI DE [email protected] da Universidade de São Paulo, Faculdade de Economia, Administração e Contabilidade de Ribeirão Preto – Ribeirão Preto – SP, Brasil
CLÁUDIO DE SOUZA [email protected] da Universidade de São Paulo, Faculdade de Economia, Administração e Contabilidade de Ribeirão Preto – Ribeirão Preto – SP, Brasil
FÓRUMSubmetido 14.03.2016. Aprovado 13.10.2016Avaliado pelo processo de double blind review. Editores Científicos: Delane Botelho e Leandro Guissoni
ANTECEDENTES DA INTENÇÃO DE COMPRA DE MARCAS PRÓPRIAS: UM ESTUDO NO MERCADO EMERGENTEPredictors of store brand purchase intention: A study in the emerging market
Antecedentes de la intención de compra de marcas propias: Un estudio en el mercado emergente
RESUMOEste estudo investiga preditores da intenção de compra de marcas próprias e suas inter-relações. Apro-funda-se a linha de pesquisa sobre formação da intenção de compra pela modelagem de construtos ainda não avaliados simultaneamente em estudos anteriores, a saber: imagem da loja, risco percebido, imagem da marca própria e atitude em relação à marca própria. Para testar as hipóteses oriundas da literatura sobre o tema, dados foram coletados por meio de uma survey com 1.938 clientes de super-mercados no Brasil. Os resultados, obtidos por meio de modelagem de equações estruturais utilizando PLS, demonstram que há relacionamentos significativos entre (1) risco percebido e imagem da marca própria; (2) imagem da loja e imagem da marca própria; (3) imagem da marca própria e atitude; e (4) entre atitude e intenção de compra. Conclui-se que o risco percebido e a imagem da loja são fortes preditores da imagem da marca própria e da atitude, compondo um modelo robusto de predição da intenção de compra de marca própria e perfazendo contribuição a literatura.PALAVRAS-CHAVE | Marca própria, risco percebido, imagem da loja, imagem de marca própria, inten-ção de compra.
ABSTRACTThe present study investigates predictors of store brand purchase intention and the interrelations between them. It deepens the research about purchase intention formation using a modelling of constructs that have not been simultaneously examined in previous studies: store image, perceived risk, store brand image, and attitude towards the store brand. To test the hypotheses from the literature on the subject, we collected data through a survey with 1,938 supermarket customers in Brazil. Our results, found by means of structural equation modeling using PLS, demonstrate the existence of significant relationships between: (1) perceived risk and store brand image; (2) store image and store brand image; (3) store brand image and attitude; and (4) between attitude and purchase intention. We conclude that perceived risk and store image are strong predictors of store brand image and attitude, thereby forming a robust model of prediction of store brand purchase intention and providing a contribution to the literature.KEYWORDS | Store brand, perceived risk, store image, store brand image, purchase intention.
RESUMENEste estudio investiga predictores de la intención de compra de marcas propias y sus interrelaciones. La línea de investigación profundiza sobre la formación de la intención de compra por el modelado de cons-tructos aún no evaluados simultáneamente en estudios anteriores, como: imagen de la tienda, riesgo percibido, imagen de la marca propia y actitud en relación a la marca propia. Para verificar las hipóte-sis oriundas de la literatura sobre el tema, se recolectaron datos por medio de una encuesta con 1.938 clientes de supermercados en Brasil. Los resultados, obtenidos por medio de modelado de ecuaciones estructurales utilizando PLS, demuestran que hay relaciones significativas entre (1) riesgo percibido e imagen de la marca propia; (2) imagen de la tienda e imagen de la marca propia; (3) imagen de la marca propia y actitud; y (4) entre actitud e intención de compra. Se concluye que el riesgo percibido y la imagen de la tienda son fuertes predictores de la imagen de la marca propia y de la actitud, lo que compone un modelo robusto de predicción de la intención de compra de marca propia y contribuye a la a literatura.PALABRAS CLAVE | Marca propia, riesgo percibido, imagen de la tienda, imagen de marca propia, actitud, intención de compra.
RAE-Revista de Administração de Empresas | FGV/EAESP
DOI: http://dx.doi.org/10.1590/S0034-759020160604

612
ISSN 0034-7590
FÓRUM | Antecedentes da intenção de compra de marcas próprias: Um estudo no mercado emergente
© RAE | São Paulo | V. 56 | n. 6 | nov-dez 2016 | 611-625
INTRODUÇÃO
O número de varejistas que adotam produtos de marcas próprias em seu mix, como estratégia para construir uma vantagem competitiva, está aumentando. As publicações e os projetos de pesquisas acadêmicas sobre o tema na perspectiva de marketing acompanham o crescimento da adoção de marcas próprias no varejo como uma tendência mundial (Hyman, Kopf, & Lee, 2010).
Segundo a Nielsen (2016), na América Latina, o país líder em vendas de marcas próprias é a Colômbia, com 15% de market share, seguido por Chile (10%), Argentina (9%) e México (8%). De agosto de 2014 a agosto de 2015, o segmento de marcas próprias nos supermercados brasileiros movimentou mais de R$ 3,6 bilhões, alcançando 5,1% de participação no mercado total, que é uma participação muito pequena quando comparada, especialmente, com alguns países da Europa, que atingem 45% de participação de mercado com suas marcas próprias.
Ao serem lançadas no Brasil, na década de 1970, como produtos de preço baixo, as marcas próprias adquiriram uma imagem de baixa qualidade, influenciando de maneira desfavo-rável a atitude dos consumidores. Desde então, os profissionais de marketing de varejo tem enfrentado o desafio de posicionar melhor suas marcas próprias e aumentar suas vendas.
De maneira geral, os elementos que influenciam a atitude dos consumidores e a propensão para consumirem marcas próprias relacionam-se a: renda e tamanho da família, familiaridade com a marca própria, preço, embalagem, qualidade dos produtos, risco percebido e imagem da loja (Chaniotakis, Lymperopoulos, & Soureli, 2010; Harcar, Kara, & Kucukemiroglu, 2006; Hidalgo, Manssur, Olavarrieta, & Farías, 2007; Huang & Huddleston, 2009; Kremer & Viot, 2012; Porral & Lang, 2015; Porral & Levy-Mangin, 2016; Sarkar, Sharma, & Kalro, 2016).
Neste trabalho, objetiva-se investigar os antecedentes da intenção do consumidor em comprar marcas próprias em supermercados. Especificamente, procura-se compreender as relações entre imagem da loja e risco percebido com a imagem da marca própria, bem como as relações desses construtos com a atitude geral e a intenção de compra.
Apesar de a literatura sobre o tema ser vasta, sua distribuição pelo mundo é irregular. “Parece haver uma escassez de conhecimento, particularmente em mercados emergentes como a África do Sul, quanto à maneira pela qual os consumidores avaliam cognitivamente marcas próprias” (Beneke & Carter, 2015, p. 22). Diallo (2012) ressalta que os fatores relacionados à imagem e ao risco percebido são fortes preditores na intenção de compras de marcas próprias no contexto de mercados emergentes, que são pouco investigados e requerem estudos envolvendo tais temas. Nesse sentido, o estudo desses temas no contexto
brasileiro justifica-se pela baixa participação de mercado das marcas próprias em supermercados.
Além disso, há pouco consenso quanto aos fenômenos, conceituados operacionalmente sob forma de medidas psicométricas, relevantes para se entender essa avaliação cognitiva, que, por sua vez, resulta em comportamento intencional de comprar ou não marcas próprias. A literatura mostra que há considerável esforço de pesquisa em encontrar modelos explicativos da intenção de compra de marcas próprias ajustados a realidades regionais. O desenvolvimento científico de modelos pressupõe reducionismo, mas seus limites ampliam-se com técnicas de coleta e análise de dados.
O trabalho de Beneke e Carter (2015) apresenta o que consideram novos antecedentes para o processo de atribuição de valor percebido, um precedente direto de intenção de compra de marcas próprias.
Em linha com esse esforço de modelagem e refinamento de construtos, as principais contribuições deste estudo são (1) a análise simultânea dos construtos risco percebido, imagem da loja, atitude e imagem da marca própria como preditores de intenção de compra de marca própria, combinação ainda não estudada; (2) análise das interações entre esses preditores e (3) identificação das variáveis-chave para o aprimoramento da explicação da intenção de compra de produtos de marcas próprias.
Na sequência, o trabalho apresenta e discute o referencial teórico e desenvolvimento das hipóteses. Em seguida, são apresentados o método de pesquisa adotado, os resultados e análises e, por fim, as considerações finais.
MARCAS PRÓPRIAS: UM PANORAMA
As marcas desempenham importante papel na composição do mix de produtos do varejista, pois contribuem para o posicionamento do varejo e auxiliam os clientes em suas escolhas. Marcas próprias são marcas desenvolvidas e vendidas exclusivamente por varejistas ou atacadistas, e podem levar o nome da empresa ou outro (Parente & Barki, 2014).
Um dos objetivos dos varejistas com a inserção das marcas próprias é aumentar a lealdade do consumidor às lojas da rede. Entretanto, Dawes e Nenycz-Thiel (2013) destacam que, para isso, deverão investir na qualidade desses produtos, que é importante para a atratividade da loja e para evitar contaminação negativa da imagem do varejista devido à má imagem da marca própria (Olbrich & Jansen, 2014). As marcas próprias estão se consolidando no setor de alimentos, por ofertarem qualidade similar às marcas nacionais, a preços competitivos (Rubio, Oubiña, & Villaseñor, 2014).

613
ISSN 0034-7590
AUTORES | Lúcia Aparecida da Silva Borges | Dirceu Tornavoi de Carvalho | Cláudio de Souza Miranda
© RAE | São Paulo | V. 56 | n. 6 | nov-dez 2016 | 611-625
No mercado brasileiro, os varejistas estão desenvolvendo diferentes programas de marcas próprias (Diallo, 2012). Há varejistas que trabalham suas estratégias com foco em preço baixo, mas há grandes redes de varejo que adotam estratégia de diferenciação para suas marcas próprias (Associação Brasileira de Supermercados [Abras], 2014). É crescente a aceitação de produtos de marcas próprias por um amplo segmento sociodemográfico de consumidores (Shuklay, Banerjee, & Adidam, 2013). No Brasil, as marcas próprias são consumidas principalmente pelas classes A/B (Nielsen, 2015).
RISCO PERCEBIDO NA COMPRA DE PRODUTOS DE MARCA PRÓPRIAQuando se trata de produtos de marcas próprias, o risco percebido é relevante, especialmente ao comparar as alternativas de marcas próprias com as de marcas nacionais (Dick, Jain, & Richardson, 1995). Para Rubio et al. (2014), os consumidores percebem as marcas nacionais como mais seguras e com menor variação na qualidade do que as marcas próprias. Pereira (2001) ressalta que, de maneira geral, as marcas próprias são comercializadas com preços mais baixos em relação às marcas nacionais, o que pode comprometer a imagem da marca própria. Isso ocorre porque o risco percebido tende a ser mais baixo quando os preços são mais altos, uma vez que os consumidores assumem uma relação linear entre preço e qualidade (Olbrich & Jansen, 2014). Assim, a inferioridade percebida nas marcas próprias é uma fonte de incerteza acerca do nível de satisfação para os consumidores desse tipo de marca, aumentando o risco associado à sua compra (Mieres, Martín, & Gutiérrez, 2006).
Seis diferentes tipos de riscos percebidos são encontrados na literatura: risco financeiro, social, físico, psicológico, de tempo e de desempenho (Laforet, 2007; Mitra, Reiss, & Capella, 1999; Solomon, 2011; Stone & Gronhaug, 1993).
O risco financeiro pode ser definido como a possibilidade de perda monetária causada pela má escolha no processo de compra (Zielke & Dobbelstein, 2007). O risco social relaciona-se à força da crença do cliente de que ele possa ser avaliado negativamente por terceiros devido à marca escolhida (Liljander, Polsa, & Riel, 2009). O risco físico é o medo causado pela possibilidade de um produto prejudicar a saúde ou ferir fisicamente uma pessoa (Mieres et al., 2006). O risco psicológico pode ser descrito como a antecipação de possível decepção por parte do consumidor em selecionar um produto de má qualidade, afetando seu bem-estar mental (Ueltschy, Krampf, & Yannopoulos, 2004). O risco do tempo relaciona-se à possível perda de tempo associada à compra de um produto insatisfatório (Mitra et al., 1999). O risco
de desempenho representa o medo que o consumidor tem de o produto não oferecer o desempenho prometido (Agarwal & Teas, 2001).
Stone e Gronhaug (1993) ressaltam que o risco percebido na compra varia entre pessoas e produtos. Wu, Yeh, e Hsiao (2011) utilizaram três dimensões da escala de risco percebido (risco financeiro, risco de desempenho e risco psicológico), desenvolvida por Stone e Gronhaug (1993). Já Diallo (2012) usou apenas as dimensões risco de desempenho e risco financeiro em seu estudo. O autor ressalta que Liljander et al. (2009) demonstraram que essas são as dimensões mais associadas ao comportamento de compra de marcas próprias, porém, não há um consenso sobre os tipos de riscos mais relevantes no contexto de marcas próprias (Sheau-Fen, Sun-May, & Yu-Ghee, 2012).
Para o desenvolvimento deste estudo, foram consideradas as dimensões risco de desempenho e risco financeiro, como ado-tado por Diallo (2012) e Liljander et al. (2009). Acrescentou-se, ainda, a dimensão risco físico, pelo fato de que, em supermer-cados, os produtos de marcas próprias mais adquiridos são alimentos e produtos de limpeza doméstica, percebidos como potencialmente arriscados à saúde (Derbaix, 1983; Hornibrook, McCarthy, & Fearne, 2005; Wang, 2015). Para Golan, Roberts, e Ollinger (2004), a segurança dos produtos alimentares é difícil de ser avaliada pelos consumidores, antes ou até mesmo depois de serem consumidos, representando um obstáculo para o compor-tamento de compra do consumidor (Yeung, Yee, & Morris, 2010), que tem se preocupado com resíduos de aditivos nos alimen-tos, hormônios nas carnes, pesticidas, conservantes etc. (Wang, 2015), os quais são prejudiciais à saúde.
Liljander et al. (2009) e Mieres et al. (2006) afirmam que o risco financeiro tem efeito negativo na intenção de compra de marcas próprias. Produtos mais complexos de serem produzidos são mais relacionados ao risco funcional, pois apresentam mais desafios para o fabricante em produzi-los (Semeijn, Riel, & Ambrosini, 2004).
Kakkos, Trivellas, e Sdrolias (2015), Liljander et al. (2009), Mieres et al. (2006) e Sheau-Fen et al. (2012) afirmam que o risco percebido influencia o comportamento e a intenção de compra de marcas próprias. Rzem e Debabi (2012) identificaram o risco e o valor percebidos como variáveis principais que explicam a atitude em relação à marca. Baseado nas afirmações e discussões acima, têm-se as seguintes hipóteses (H):
H1: Risco percebido tem influência negativa sobre a ima-gem da marca própria.
H2: Risco percebido tem influência negativa sobre a inten-ção de compra do consumidor em relação a marcas próprias.
614
ISSN 0034-7590
FÓRUM | Antecedentes da intenção de compra de marcas próprias: Um estudo no mercado emergente
© RAE | São Paulo | V. 56 | n. 6 | nov-dez 2016 | 611-625
IMAGEM DA LOJA E MARCA PRÓPRIA
A partir dos anos 1990, a imagem da loja tornou-se uma das principais dimensões estratégicas na competição entre varejistas (Reardon, Miler, & Coe, 1995). A imagem da loja é definida na mente do comprador em parte pelas qualidades funcionais e em parte pela atmosfera de atributos psicológicos (Martineau, 1958). Para Bloemer e Ruyter (1998), a imagem da loja é a soma de todos os atributos percebidos pelos clientes a partir de suas experiências com a loja.
De maneira geral, a imagem da loja envolve várias dimensões, como: atmosfera, serviços da loja, qualidade de produtos, localização, sortimento, conveniência e preço/valor. O investimento nessas dimensões é importante na medida em que uma melhor imagem de loja pode ajudar a marca do varejista e suas marcas próprias, criando grande diferenciação no mercado (Bao, Bao, & Sheng, 2011), pois os consumidores usam essas dimensões como elemento influenciador de seu comportamento de compra (Diallo, 2012).
Forte relacionamento entre imagem da loja e imagem da marca própria é requisito fundamental para uma diferenciação bem-sucedida no varejo (Collins-Dodd & Lindley, 2003). A literatura reporta um relacionamento direto entre imagem da marca e imagem da loja (Porter & Claycomb, 1997), e que associações e avaliações positivas da loja levarão a uma imagem de marca mais favorável (Wu et al., 2011). A imagem da loja e sua reputação melhoram a imagem da marca própria e sua qualidade percebida (Porral & Lang, 2015). Silva, Merlo, e Nagano (2012) sugerem que a imagem da loja, sua limpeza e organização, maior conhecimento e familiaridade com a loja são fatores que influenciam a disposição dos consumidores para confiar na e comprar a marca própria da loja. Assim, tem-se a seguinte hipótese (H):
H3: Imagem da loja tem influência positiva sobre a imagem da marca própria.
Os varejistas precisam conscientizar-se das conexões cognitivas entre imagem da loja e marca própria, especialmente quando disponibilizam maior variedade de marcas próprias em um mesmo ambiente (Beneke & Zimmerman, 2014). No contexto de supermercados, se o consumidor tem uma imagem positiva da loja, poderá desenvolver atitude positiva para com a marca própria daquele supermercado (Collins-Dodd & Lindley, 2003). Para Richardson, Dick, e Jain (1996), a imagem da loja tem efeito positivo na atitude em relação aos produtos de marcas próprias, funcionando como um combustível para a atitude do consumidor em relação à marca própria do varejista, e é um importante preditor da atitude em relação a essas marcas (Semeijn et al., 2004).
Vahie e Paswan (2006) afirmam que, para influenciar positivamente a atitude dos consumidores, o varejista deve estar atento não apenas ao merchandising, mas a toda atmosfera da loja (Parente & Barki, 2014). Martínez-Ruiz, Ruiz-Palomino, Martinez-Canas, e Blázquez-Resino (2014) identificaram que os atributos da loja que proporcionam conveniência na compra e uma atmosfera especial da loja são importantes para melhorar a lealdade atitudinal dos consumidores propensos a comprar marcas próprias. A partir das discussões dos autores, têm-se a seguinte hipótese (H):
H4: Imagem da loja tem influência positiva sobre a atitude do consumidor frente às marcas próprias.
A imagem da loja tem efeito positivo e direto na avaliação do consumidor em relação às marcas próprias (Liljander et al., 2009; Semeijn et al., 2004). Estudos sugerem que a imagem favorável da loja pode melhorar a imagem e a qualidade percebida da marca própria do varejista (Semeijn et al., 2004), reduzindo, assim, os riscos associados à sua compra pelos consumidores (Diallo, 2012; Liljander et al., 2009). Esses autores identificaram que a imagem da loja tem influência direta e negativa no risco percebido em relação à marca própria, ou seja, a imagem da loja tem efeito redutor do risco percebido.
A imagem da loja é composta por fatores extrínsecos que, segundo Ailawadi e Keller (2004), amenizam o risco percebido, pela melhoria do posicionamento das marcas próprias (Delgado-Ballester, Hernandez-Espallardo, & Rodriguez-Orejuela, 2014). Mitchell (1998) complementa que a percepção da qualidade da loja leva à redução do risco percebido. Nesse sentido, Delgado-Ballester et al. (2014) sugerem ao varejista o investimento na criação e na manutenção de uma imagem positiva da loja. Além disso, a imagem da loja tem efeito positivo sobre a intenção de compra de marca própria, sendo considerada um antecedente da intenção (Beneke, Brito, & Garvey, 2015; Liljander et al., 2009; Porral & Levy-Mangin, 2016; Wu et al., 2011). Com base nas discussões dos autores, tem-se a seguinte hipótese (H):
H5: Imagem da loja tem influência negativa sobre o risco percebido em relação às marcas próprias.
IMAGEM DA MARCA PRÓPRIA
A imagem de uma marca é a soma total das associações realizadas na memória do consumidor decorrentes de suas percepções sobre a marca (Keller, 1993) e serve como garantia do produto (Dodds, Monroe, & Grewal, 1991). A imagem da marca própria é formada pelas dimensões afetiva e de qualidade da marca (Vahie & Paswan, 2006). Esses autores identificaram que os

615
ISSN 0034-7590
AUTORES | Lúcia Aparecida da Silva Borges | Dirceu Tornavoi de Carvalho | Cláudio de Souza Miranda
© RAE | São Paulo | V. 56 | n. 6 | nov-dez 2016 | 611-625
impactos da imagem da loja sobre a dimensão afetiva da marca própria incluem a conveniência, a qualidade e a percepção de preço versus valor. Essas dimensões influenciam positivamente a atitude do consumidor em torno das marcas próprias.
Há certo consenso na literatura de que uma imagem de marca favorável tem impacto positivo sobre o comportamento do consumidor para com a marca, proporcionando ao varejista aumento do número de compradores leais à loja, maior possibilidade de praticar preços superiores e um boca a boca mais positivo (Martenson, 2007). Para Laroche, Kim, e Zhou (1996), os consumidores têm uma atitude positiva e maior intenção de compras para com as marcas que têm melhor imagem. Os consumidores comprarão marcas próprias se as perceberem como produtos de qualidade e se tiverem imagem positiva da marca (Sethuraman & Gielens, 2014). Hidalgo et al. (2007) sugerem que um plano de comunicação integrada eficaz fortalece a imagem da marca própria e melhora a atitude do consumidor diante desses produtos.
Os consumidores utilizam os atributos extrínsecos para avaliar a qualidade e reduzir o risco percebido nas marcas próprias (Wu et al., 2011). Ailawadi e Keller (2004) afirmam que os varejistas podem criar sua imagem de marca por meio de associações únicas para a qualidade de seus serviços. Para Hoch e Banerj (1993) e Richardson, Dick, e Jain (1994), se o padrão de qualidade das marcas próprias é similar ao das marcas nacionais, cria-se uma imagem favorável das marcas próprias, e, consequentemente, melhor qualidade percebida influencia positivamente a atitude do consumidor diante dessas marcas (Harcar et al., 2006). Baseado nas discussões dos autores, têm-se as seguintes hipóteses:
H6: Imagem da marca própria tem efeito positivo sobre a atitude do consumidor em relação às marcas próprias.
H7: Imagem da marca própria tem efeito positivo sobre a intenção de compra de marcas próprias.
ATITUDE EM RELAÇÃO À MARCA PRÓPRIA
Keller (1993) define atitude como uma avaliação geral da marca por parte dos consumidores, e essa atitude forma a base para as decisões e comportamentos em torno da marca (Grace & O’Cass, 2004). Quanto ao processo de formação da atitude, Fishbein e Ajzen (1975) destacam o conceito de crença que, de maneira geral, perfaz o elo entre os atributos dos objetos e a própria atitude. Os indivíduos apresentam uma série de crenças em relação a um determinado objeto, que, em suma, são os determinantes da atitude dos indivíduos e, normalmente, antecedem a intenção
comportamental, e, por conseguinte, o próprio comportamento desses indivíduos em relação a um determinado produto (Hoppe, Barcellos, Vieira, & Matos, 2012).
Semeijn et al. (2004) destacam a composição do mix de produtos, suas exposições e o nível de serviço como elementos utilizados na construção de crenças sobre o varejista e que, consequentemente, determinam a atitude do consumidor em relação às suas marcas. Chaniotakis et al. (2010) identificam a relação entre atitude e intenção de compra, que, segundo Wu et al. (2011), representa a possibilidade de que os consumidores estarão dispostos a comprar determinado produto no futuro.
Para Chaniotakis et al. (2010), a intenção de compra é diretamente afetada pela atitude dos consumidores em relação à marca própria; quanto mais favorável, mais forte deverá ser a intenção individual de cumpri-la (Armitage & Conner, 2001). Com base nas discussões acima, propõe-se a seguinte hipótese:
H8: Atitude tem influência positiva sobre a intenção de compra de marcas próprias.
Modelo conceitual
A Figura 1 apresenta uma visão sumária das relações entre os construtos estabelecidas como hipóteses neste estudo.
Figura 1. Modelo de relações dos construtos e hipóteses
Imagem daloja
Imagem damarca
própria
Riscopercebido
Atitudes emrelação a
marcaprópria
Intenção decompra de
marcaprópria
H3 H4
H6 H8
H7
H2
H1
H5

616
ISSN 0034-7590
FÓRUM | Antecedentes da intenção de compra de marcas próprias: Um estudo no mercado emergente
© RAE | São Paulo | V. 56 | n. 6 | nov-dez 2016 | 611-625
O modelo proposto para o desenvolvimento do estudo considera a imagem da loja e o risco percebido construtos que exercem relação direta com a imagem da marca própria, que, por sua vez, tem efeito direto na atitude e influencia a intenção de compra de marca própria. O modelo também preconiza que a imagem da marca própria tem ligação com a intenção de compra e que a imagem da loja pode reduzir o risco percebido. Além disso, pressupõe que a imagem da loja tem efeito direto na atitude e que o risco percebido tem efeito direto na intenção de compra de marca própria.
METODOLOGIAA pesquisa de campo foi realizada por meio de formulários estruturados, enviados por correio eletrônico para um banco de e-mails selecionado de consumidores brasileiros de supermercados.
A técnica amostral adotada para o desenvolvimento da survey foi não probabilística por conveniência, uma vez que o propósito da pesquisa foi testar hipóteses do modelo, e não fazer inferências para uma população de interesse. O pré-teste foi desenvolvido com 50 consumidores para detectar deficiências em termos utilizados no enunciado das questões e dificuldades no preenchimento das respostas que pudessem ocasionar falhas no processo de coleta. Além disso, o pré-teste foi utilizado para validar a tradução das escalas tanto de forma qualitativa quanto quantitativa, por testes preliminares de confiabilidade (alfa de Cronbach).
O formulário de coleta de dados foi desenvolvido no software Lime Survey, um programa livre utilizado e hospedado na universidade que possibilita coletar dados por autopreenchimento dos respondentes. O convite com o link para o formulário foi enviado para 62.340 e-mails válidos e teve taxa de retorno de 3,25%, ou seja, retornaram 2.045 questionários respondidos. Foram excluídos 107 questionários preenchidos de maneira inadequada, ficando uma amostra de 1.938 consumidores.
Para compreensão clara acerca do significado de marcas próprias e para que fosse obtida maior eficiência nas respostas, foram apresentadas ilustrações gerais de produtos e uma breve explicação sobre o conceito de marcas próprias. A coleta de dados ocorreu entre 1o de junho e 1o de julho de 2014.
Medidas
No início do questionário, perguntou-se o nome da marca própria mais adquirida pelo respondente. O objetivo foi direcionar as
questões do modelo aos objetos focais específicos de avaliação: a marca própria e o supermercado (loja). A frequência com que marcas e lojas foram citadas é irrelevante para os objetivos deste estudo.
Para avaliação dos construtos componentes do modelo, utilizou-se uma escala de concordância de 7 pontos, onde 7 significava “concordo totalmente” e 1, “discordo totalmente”. Todas as escalas utilizadas já haviam sido validadas na literatura, e as dimensões com suas variáveis aplicadas no questionário estão apresentadas no Quadro 1.
Para o tratamento de dados, foi utilizado, inicialmente, o software SPSS (Statistical Package for Social Sciences), base 17.0. Foram utilizadas técnicas estatísticas descritivas para descrever o perfil da amostra e, em seguida, desenvolveu-se a análise de confiabilidade das escalas utilizadas. Por fim, aplicou-se a análise fatorial exploratória a fim de verificar a independência (ortogonalidade) entre os construtos estudados.
Uma vez considerados aceitáveis, os dados foram transferidos para o SmartPLS, versão profissional 3.0, que foi usado para estimação do modelo de mensuração e das relações entre os construtos.
Segundo Bido, Silva, Souza, e Godoy (2010), a modela-gem em equações estruturais (MEE), ferramenta que permite a avaliação de relações entre construtos não mensuráveis diretamente (variáveis latentes), “abrange basicamente dois tipos de métodos de estimação: o primeiro é conhecido como modelagem de equações estruturais baseado em covariân-cias (MEEBC) ou, simplesmente, modelos LISREL; o segundo é conhecido como Mínimos Quadrados Parciais (Partial Least Squares) (MEEPLS), que realiza a avaliação do MEE por partes. Mais recentemente, esse último método tem sido denomi-nado PLS-PM (Partial Least Squares – Path Modeling)” (p. 246).
Os autores justificam o uso do método com o mesmo argumento que se aplica ao presente trabalho: “Um dos motivos para se usar PLS-PM em detrimento de outros métodos é a possibilidade de se modelarem variáveis latentes com indicadores formativos, pois tradicionalmente se usavam, prioritariamente, indicadores reflexivos, como definido pela psicometria. Esclarecendo mais, os indicadores são formativos quando explicam o constructo, e não é esperado que haja correlação entre eles, enquanto os reflexivos são os indicadores explicados pelos constructos (indicadores-efeito), tal como nas escalas de atitude” (Bido et al., 2010, p. 248).

617
ISSN 0034-7590
AUTORES | Lúcia Aparecida da Silva Borges | Dirceu Tornavoi de Carvalho | Cláudio de Souza Miranda
© RAE | São Paulo | V. 56 | n. 6 | nov-dez 2016 | 611-625
Quadro 1. Composição dos construtos utilizados na modelagem comportamental
Construto/autores
Dimensões e variáveis
Imagem da loja Chowdhury, Reardon, & Srivastava (1998) e Semeijn et al. (2004)
Serviço dos funcionáriosB1 Os funcionários desta loja são muito acolhedores, hospitaleiros.B4 Os funcionários desta loja são bem capacitados.B7 Os funcionários desta loja são corteses, gentis.B16 Os serviços dos funcionários desta loja são excelentes. B18 Não tenho problemas com a devolução de produtos nesta loja. B20 Os funcionários desta loja são bem dispostos a resolverem problemas dos clientes.B22 Estou satisfeito(a) com o atendimento que recebo dos funcionários desta loja.Qualidade dos produtosB5 Eu gosto das marcas dos produtos que são vendidos nesta loja.B9 Esta loja vende somente produtos de alta qualidade.B15 Esta loja oferece produtos de alta qualidade.B30 Eu posso contar com a qualidade dos produtos que eu compro nesta loja por serem excelentes.Seleção dos produtos B2 Encontro tudo que eu preciso nesta loja.B12 Esta loja tem uma grande variedade de produtos.B25 Os produtos estão disponíveis quando eu preciso.AtmosferaB3 O layout da loja é claro (distribuição e localização dos departamentos). B6 Esta loja está sempre suja.B19 Esta loja é antiquada.B21 É fácil encontrar artigos em promoção nesta loja.B29 A aparência desta loja é atraente.Conveniência B8 Esta loja é conveniente (útil, prática). B13 É fácil entrar nesta loja.B23 O acesso a esta loja é fácil (distância percorrida, trânsito fácil, proximidade).B26 Esta loja tem horário de funcionamento conveniente.Preço/valor B11 Eu consigo comprar produtos mais baratos nesta loja.B14 Os preços nesta loja são justos.B24 Eu obtenho uma boa relação entre custo e benefício comprando nesta loja.
Risco percebidoStone & Gronhaug (1993)
Risco financeiro C1 Se eu comprar produtos de marca própria, vou gastar mal o meu dinheiro.C6 Se eu comprasse marca própria para o meu uso pessoal, eu ficaria preocupado(a) pelo produto não valer o que gastei. C9 Se eu comprar produtos de marca própria, ficarei pensando se o investimento financeiro foi bem feito. Risco funcional ou de desempenho C3 Ao considerar a compra de marca própria para o uso, preocupa-me se o produto realmente vai funcionar tão bem quanto eu espero.C8 A ideia de comprar produtos de marca própria causa-me preocupação pelo quanto este produto pode ser seguro e confiável. C10 Se eu fosse comprar produtos de marca própria para o uso, eu ficaria preocupado(a) quanto ao produto não oferecer o nível de benefícios que eu espero.Risco físicoC2 Devido à possível falta de segurança de alguns produtos de marca própria, ao considerar este tipo de produto para uso doméstico, preocupo-me com os riscos físicos potenciais associados a ele.C4 A compra de marca própria para uso doméstico preocupa-me no que diz respeito a o produto causar efeitos colaterais físicos desconfortáveis.C11 Uma preocupação que tenho a respeito da compra de marca própria para o uso doméstico é que provavelmente fará mal, devido ao uso excessivo do produto.
Imagem da marca própriaVahie & Paswan (2006)
AfetivaD2 Estou satisfeito(a) com a maioria dos produtos de marca própria que eu compro nesta loja.D4 Eu gosto muito da marca própria desta loja.QualidadeD1 Muitos produtos de marca própria que eu compro nesta loja estão com algum tipo de defeito.D3 Esta loja não se importa muito com a qualidade de seus produtos de marca própria.D5 Muitos produtos de marca própria que eu compro nesta loja se desgastam com mais rapidez.
AtitudeBurton, Lichtenstein, Netemeyer, & Garretson (1998)
E1 Quando eu compro marcas próprias, eu sempre sinto que estou fazendo um bom negócio. E2 Eu gosto muito quando marcas próprias estão disponíveis nas categorias de produtos que compro.E3 Em geral, as marcas próprias são produtos de baixa qualidade. E4 Para a maioria das categorias de produtos, a melhor opção de compra é geralmente a marca própria.E5 Considerando a relação entre custo e benefício, eu prefiro marcas próprias às demais marcas (marcas do fabricante).E6 Comprar marca própria me faz sentir bem.
Intenção de compraDiallo (2012) e Knight & Kim (2007)
F1 Tenho a intenção de comprar produtos de marca própria desta loja com frequência.F2 Eu consideraria a compra de uma marca própria.F3 Existe uma forte possibilidade de eu comprar produtos de marca própria.F4 Eu compraria produtos de marca própria na próxima vez que eu for ao supermercado.F5 A probabilidade de considerar a compra de produtos de marca própria é alta.F6 Eu pretendo comprar produtos de marca própria desta loja com mais frequência.

618
ISSN 0034-7590
FÓRUM | Antecedentes da intenção de compra de marcas próprias: Um estudo no mercado emergente
© RAE | São Paulo | V. 56 | n. 6 | nov-dez 2016 | 611-625
RESULTADOS E ANÁLISES
A seguir, apresentam-se os resultados e análises da pesquisa de campo em relação a cada um dos elementos pesquisados.
Caracterização da amostra
A população amostrada são pessoas que têm relação com a universidade, como ex-alunos, professores, consultores etc. O convite foi para toda a base de contatos existente, e a amostra foi de 1.938, descrita a seguir.
Do total de respondentes, 925 pertenciam ao sexo feminino (47,7%) e 1.013, ao sexo masculino (52,1%), permitindo uma coleta equilibrada de opiniões entre os sexos. Em relação à faixa etária, a maior parte da amostra encontrava-se entre 31 e 40 anos (35%), seguida das faixas entre 41 e 50 anos (22,9%) e entre 21 e 30 anos (20,4%). Os 21,7% restantes da amostra estão distribuídos nas demais faixas etárias, sendo 15,9% entre 51 e 60 anos, 5,3% acima de 60 anos e apenas 0,5% na faixa etária de até 20 anos.
Com respeito ao nível de escolaridade, a amostra foi composta por 75,7% de pós-graduados, seguida de 20,3% de pessoas com nível superior completo, 3% com superior incompleto e apenas 1% com ensino médio incompleto ou completo. Em relação à renda, a maior parte da amostra era de pessoas com renda superior a R$ 7.001,00 (55,8%), entre R$ 3.501,00 e R$ 7.000,00 (29,2%), entre R$ 1.501,00 e R$ 3.500,00 (12,2%), e apenas 2,8% da amostra com renda até R$ 1.500,00. Observa-se que grande parte da amostra consumidora de produtos de marcas próprias está classificada como pessoas mais maduras, acima de 30 anos, pertencentes a classes socioeconômicas mais altas, o que está de acordo com o apontado pela Nielsen (2015).
A amostra teve origem nos 26 estados do Brasil e no Distrito Federal, residindo a maioria no estado de São Paulo (60,6%), seguido de Rio de Janeiro (7%), Minas Gerais (4,6%), Paraná e Rio Grande do Sul, com 3,8% e 3,6%, respectivamente, Bahia (2,4%), e dos demais estados (18% da amostra).
Confiabilidade e ortogonalidade dos construtos
A Tabela 1 apresenta as cargas fatoriais de cada variável dos construtos. Observa-se que as cargas fatoriais das variáveis dos construtos estão dentro do valor recomendado na literatura; segundo Afthanorhan (2013), cargas maiores que 0,5 devem ser mantidas no modelo e menores devem ser retiradas, pois comprometem a confiabilidade dos construtos.
Tabela 1. Outer loadings (cargas fatoriais das variáveis dos construtos)
Variáveis AtitudeImagem da loja
Imagem da marca própria
Intenção de compra
Risco percebido
Atmosfera 0,809
Conveniência 0,772
Preco_vr 0,512
Qual_Prod 0,893
Serv_Func 0,764
Sort_Prod 0,848
D2_IMP_A_1 0,828
D3_IMP_Q_2 0,604
D4_IMP_A_2 0,854
D5_IMP_Q_3 0,613
E1_ATT_1 0,834
E2_ATT_2 0,836
E4_ATT_4 0,697
E5_ATT_5 0,775
E6_ATT_6 0,805
F1_INTC_1 0,856
F2_INTC_2 0,812
F3_INTC_3 0,937
F4_INTC_4 0,931
F5_INTC_5 0,933
F6_INTC_6 0,880
Ris_Des 0,933
Ris_Fin 0,929
Ris_Fisico 0,878
Para assegurar a consistência interna de cada construto, foi analisado o alfa de Cronbach, que, conforme apresentado na Tabela 2, excedeu o valor crítico de 0,7, o que assegura que os construtos foram medidos de modo consistente (Fornell & Larcker, 1981; Henseler, Ringle, & Sinkovics, 2009).

619
ISSN 0034-7590
AUTORES | Lúcia Aparecida da Silva Borges | Dirceu Tornavoi de Carvalho | Cláudio de Souza Miranda
© RAE | São Paulo | V. 56 | n. 6 | nov-dez 2016 | 611-625
Tabela 2. Tabela 2. Valor do alfa de Cronbach de cada construto do modelo de pesquisa
Variáveis Alfa de Cronbach
Atitude 0,852
Imagem da loja 0,861
Imagem da marca própria 0,719
Intenção de compra 0,949
Risco percebido 0,900
Teste do modelo
A modelagem de equações estruturais, usando a análise PLS, foi conduzida para testar o modelo conceitual. A seguir, as medidas do modelo são avaliadas.
Validade convergente e validade discriminante
Observa-se, na Tabela 3, que todos os critérios sugeridos para essa análise atendem os valores recomendados por Fornell e Larcker (1981) e por Henseler et al. (2009). O alfa de Cronbach, apresentado anteriormente, é superior a 0,7; a Average Variance Extracted (AVE) é superior a 0,5 em todos os construtos e a confiabilidade composta também é superior a 0,7 em todos os construtos que compõem o modelo, concluindo que os itens que deveriam estar relacionados, teoricamente, estão, de fato, inter-relacionados.
Tabela 3. Indicadores da validade convergente do modelo
Variáveis AVEComposite reliability
Atitude 0.626 0.893
Imagem da loja 0.602 0.899
Imagem da marca própria 0.539 0.820
Intenção de compra 0.797 0.959
Risco percebido 0.834 0.938
O valor da validade discriminante é obtido a partir da raiz quadrada do valor da AVE. Assim, os valores na diagonal (em negrito) são a raiz quadrada da AVE, enquanto os outros valores representam a correlação entre os respectivos construtos. Os valores da validade discriminantes estão apresentados na Tabela 4.
Tabela 4. Validade discriminante
Variáveis AtitudeImagem da loja
Imagem da marca própria
Intenção de compra
Risco percebido
Atitude 0,791 Imagem da loja
0,386 0,776
Imagem da marca própria
0,537 0,537 0,734
Intenção de compra
0,722 0,424 0,619 0,893
Risco percebido
-0,325 -0,229 -0,478 -0,428 0,913
Observa-se que a validade discriminante, nesse caso, é admitida pelo fato de os números da diagonal (em negrito) serem mais altos do que os valores em suas linhas e colunas.
Modelo estrutural – Validade nomológica e coeficientes β (path coefficients)
A validade nomológica refere-se ao grau com que um construto se comporta como preditor dentro de um sistema de construtos relacionados. Para essa análise, observa-se se todas as relações previstas no modelo são significativas, utilizando o bootstrapping para verificar se o t de Student é superior a 1,96 (valor crítico para nível de significância de 0,05). O uso da reamostragem (bootstrapping) é o procedimento utilizado para capturar a significância de cada relação.
A Tabela 5 apresenta o t value referente a todos os relacionamentos entre os construtos. Observa-se que todos os valores são superiores a 1,96, portanto todas as cargas são significantes, representando que há correlações entre as variáveis originais e as variáveis latentes.
Tabela 5. T value dos construtos do modelo do estudo
Variáveis AtitudeImagem da loja
Imagem da marca própria
Intenção de compra
Risco percebido
Atitude 28,926
Imagem da loja
5,236 24,020 9,883
Imagem da marca própria
18,585 12,410
Intenção de compra
Risco percebido
19,253 6,659
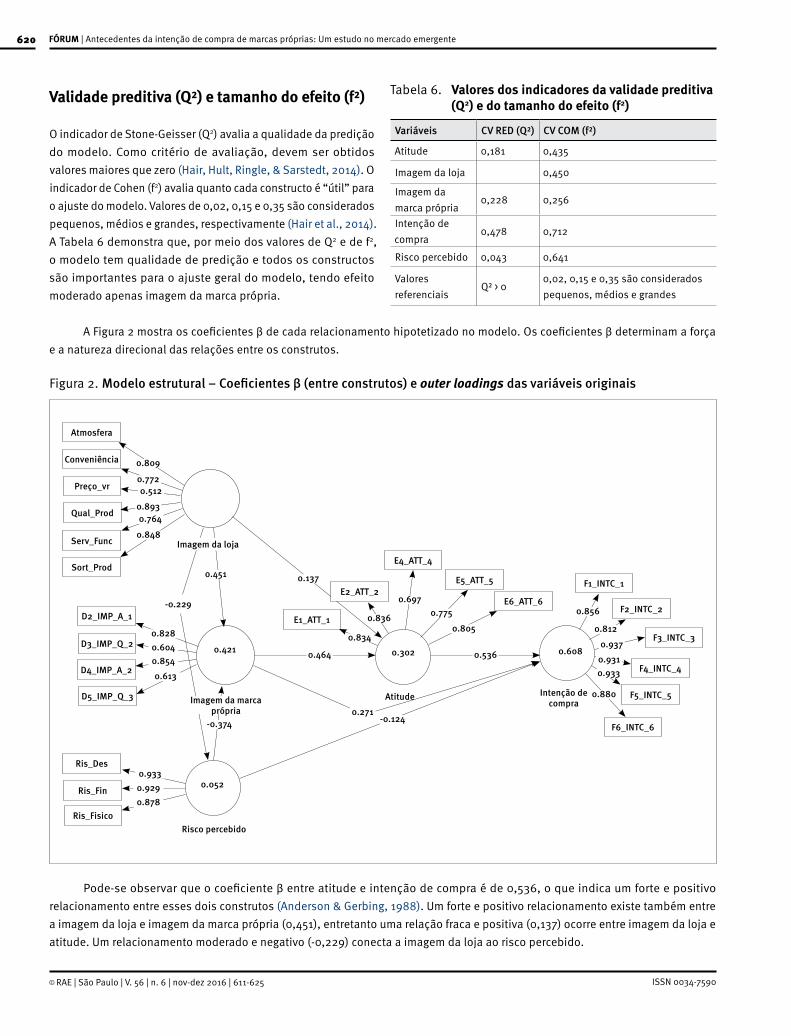
620
ISSN 0034-7590
FÓRUM | Antecedentes da intenção de compra de marcas próprias: Um estudo no mercado emergente
© RAE | São Paulo | V. 56 | n. 6 | nov-dez 2016 | 611-625
Validade preditiva (Q²) e tamanho do efeito (f²)
O indicador de Stone-Geisser (Q2) avalia a qualidade da predição do modelo. Como critério de avaliação, devem ser obtidos valores maiores que zero (Hair, Hult, Ringle, & Sarstedt, 2014). O indicador de Cohen (f2) avalia quanto cada constructo é “útil” para o ajuste do modelo. Valores de 0,02, 0,15 e 0,35 são considerados pequenos, médios e grandes, respectivamente (Hair et al., 2014). A Tabela 6 demonstra que, por meio dos valores de Q2 e de f2, o modelo tem qualidade de predição e todos os constructos são importantes para o ajuste geral do modelo, tendo efeito moderado apenas imagem da marca própria.
Tabela 6. Valores dos indicadores da validade preditiva (Q2) e do tamanho do efeito (f2)
Variáveis CV RED (Q²) CV COM (f²)
Atitude 0,181 0,435
Imagem da loja 0,450
Imagem da marca própria
0,228 0,256
Intenção de compra
0,478 0,712
Risco percebido 0,043 0,641
Valores referenciais
Q² > 00,02, 0,15 e 0,35 são considerados pequenos, médios e grandes
A Figura 2 mostra os coeficientes β de cada relacionamento hipotetizado no modelo. Os coeficientes β determinam a força e a natureza direcional das relações entre os construtos.
Figura 2. Modelo estrutural – Coeficientes β (entre construtos) e outer loadings das variáveis originais
0.697
0.137
E4_ATT_4
E1_ATT_1
E5_ATT_5
E6_ATT_6
F1_INTC_1
F2_INTC_2
F3_INTC_3
F4_INTC_4
F5_INTC_5
F6_INTC_6
Atmosfera
Conveniência
Preço_vr
Qual_Prod
Serv_Func
Sort_Prod
D2_IMP_A_1
D3_IMP_Q_2
D4_IMP_A_2
D5_IMP_Q_3
Ris_Des
Ris_Fin
Ris_Fisico
0.836
0.421 0.302
Atitude
0.608
Intenção decompra
0.052
Risco percebido
0.775
0.805
0.536
0.834
0.464
-0.229
0.451
0.6130.8540.6040.828
E2_ATT_2
0.856
0.812
0.9370.9310.933
0.880
0.271-0.124
0.9330.9290.878
-0.374
Imagem da marcaprópria
0.809
0.7720.512
0.8930.764
0.848Imagem da loja
Pode-se observar que o coeficiente β entre atitude e intenção de compra é de 0,536, o que indica um forte e positivo relacionamento entre esses dois construtos (Anderson & Gerbing, 1988). Um forte e positivo relacionamento existe também entre a imagem da loja e imagem da marca própria (0,451), entretanto uma relação fraca e positiva (0,137) ocorre entre imagem da loja e atitude. Um relacionamento moderado e negativo (-0,229) conecta a imagem da loja ao risco percebido.

621
ISSN 0034-7590
AUTORES | Lúcia Aparecida da Silva Borges | Dirceu Tornavoi de Carvalho | Cláudio de Souza Miranda
© RAE | São Paulo | V. 56 | n. 6 | nov-dez 2016 | 611-625
Há uma relação forte e positiva (0,464) entre a imagem da marca própria e a atitude; e, entre os construtos imagem da marca própria e intenção de compra, o relacionamento é positivo (0,271), porém moderado. A conexão entre risco percebido e imagem da marca própria é forte e negativa (-0,374); já a relação entre o risco percebido e a intenção de compra é fraca e negativa (-0,124).
O valor de R2 de 0,608 para intenção de compra indica que aproximadamente 61% da variância do construto é explicada pelos construtos antecedentes identificados no modelo, enquanto o R2 de 0,302 na atitude indica que 30% da atitude é explicada pela imagem da loja, imagem da marca própria e risco percebido. Já em relação à imagem da marca própria, o valor de R2 de 0,421 indica que 42% da variância da imagem da marca própria é explicada pela imagem da loja e pelo risco percebido. Não há um valor considerado mínimo para o R2, apenas deve ser fruto de uma regressão significativa a p < 5%. Cohen (1988) argumenta que, para a área de ciências sociais, R² = 0,02 são fracos, R² = 0,13 possuem efeito médio e R² superiores a 0,26 podem ser considerados expressivos.
Avaliação das hipóteses e discussão dos resultados
Observa-se, pela Figura 2, que todas as hipóteses propostas no modelo estrutural foram aceitas com significância p < 0,05.
Este estudo identificou um relacionamento forte, significativo e negativo entre risco percebido e imagem da marca própria. Dessa forma, melhorar a qualidade dos produtos de marcas próprias, diminuir a variação da qualidade dentro das categorias e criar uma boa relação entre custo e benefício, conforme sugerido por Semeijn et al. (2004) e Zielke e Dobbelstein (2007), são ações que reduzem o risco percebido. Entre as dimensões do risco, destacam-se a dimensão risco de desempenho e risco financeiro como as que apresentaram maior efeito no construto risco percebido.
Há relacionamento negativo e significante entre risco percebido e a intenção de compra, o que corrobora os resultados encontrados por Liljander et al. (2009) e Mieres et al. (2006), que, em seus estudos, descobriram que o risco percebido influencia a intenção de compra de marcas próprias. Conclui-se, então, que o risco percebido influencia negativamente a intenção de compra de produtos de marcas próprias.
Identificou-se, também, que há relacionamento positivo, significante e forte entre imagem da loja e imagem da marca própria. Esse resultado corrobora os estudos de Collins-Dodd e Lindley (2003), que encontraram forte relacionamento entre a imagem da loja e a imagem da marca própria, e um relacionamento direto entre esses dois construtos, conforme identificado por
Porter e Claycomb (1997). Conclui-se, então, que a imagem da loja tem influência positiva na imagem da marca própria, o que significa que, ao modificar, de maneira satisfatória, os elementos ou dimensões que compõem a imagem da loja, poderá ocorrer melhoria da imagem da marca própria.
Relacionamento positivo e significante foi identificado entre os construtos imagem da loja e atitude, conforme descoberto por Dolbec e Chebat (2013), Richardson et al. (1996), Semeijn et al. (2004) e Vahie e Paswan (2006). Entretanto, neste estudo, apesar de esse relacionamento ter sido positivo e significante, foi fraco, exercendo pouca influência na formação da atitude.
Entre os construtos imagem da loja e risco percebido, foi identificado relacionamento moderado, negativo e significante, o que demonstra que a imagem da loja pode reduzir o risco percebido nas marcas próprias, conforme identificado por Liljander et al. (2009). No modelo testado, as dimensões qualidade do produto, sortimento de produtos e atmosfera foram as que obtiveram maiores cargas, ou seja, são as que mais influenciam a imagem da loja. Essas descobertas remetem ao fato de que, se essas dimensões forem modificadas de maneira positiva, poderão contribuir para a redução do risco percebido nas marcas próprias.
Um relacionamento positivo, forte e significante foi encontrado entre os construtos imagem da marca própria e atitude. Esse resultado está de acordo com as descobertas de Laroche et al. (1996), concluindo, então, que a imagem da marca própria exerce influência positiva na atitude do consumidor ante essas marcas. Das dimensões que compõem o construto imagem da marca própria, a dimensão afetiva exerce maior influência nesse construto, o que corrobora os resultados identificados por Vahie e Paswan (2006).
Relacionamento moderado, positivo e significante foi encontrado entre os construtos imagem da marca própria e intenção de compra, o que está de acordo com Wu et al. (2011), que identificaram que a imagem da marca própria também influencia de maneira positiva a intenção de compra, concluindo que marcas com melhor imagem desenvolverão maior intenção de compra.
Entre os construtos atitude e intenção de compra, os resultados obtidos demonstram que há relacionamento forte, positivo e significante entre esses construtos, o que corrobora os estudos de Armitage e Conner (2001) e Chaniotakis et al. (2010), podendo inferir que quanto mais favorável for a atitude do consumidor ante a marca própria, melhor será sua intenção de compra.
CONSIDERAÇÕES FINAIS
Os construtos imagem da loja, imagem da marca própria, risco percebido e atitude, analisados simultaneamente, considerados

622
ISSN 0034-7590
FÓRUM | Antecedentes da intenção de compra de marcas próprias: Um estudo no mercado emergente
© RAE | São Paulo | V. 56 | n. 6 | nov-dez 2016 | 611-625
no modelo como antecedentes da intenção de compra, explicaram aproximadamente 61% da intenção de compra de marcas próprias. Os relacionamentos encontrados no modelo, com coeficientes β variando entre -0,124 e 0,536, demonstram a robustez da modelagem comportamental proposta para explicar a intenção de compra de marcas próprias, ampliando a compreensão científica do fenômeno.
• De modo a finalizar a contribuição teórica do estudo, faz-se necessário um olhar sobre as dimensões que compõem cada construto, de maneira a identificar as variáveis-chave para o aprimoramento do entendimento de como a intenção de compra de produtos de marca própria é formada na mente dos consumidores.
• No construto imagem da loja, a qualidade do produto, o sortimento e a atmosfera são as variáveis que exercem maior peso na sua formação. Dessa forma, conclui-se que a melhoria da qualidade das marcas próprias, do planejamento do sortimento e da variedade de produtos a ser ofertado e dos aspectos da atmosfera (iluminação, layout, cores, comunicação visual, músicas) gera reflexo positivo na imagem da loja.
• No construto risco percebido, o risco de desempenho e o risco financeiro são os que exercem maior peso nesse construto. Nesse sentido, conclui-se que experiências agradáveis com marcas próprias, investimentos nos atributos intrínsecos e extrínsecos que cumpram o desempenho prometido, e uma relação mais justa entre preço e qualidade contribuem para a redução do risco percebido.
• No construto intenção de compra, as variáveis que exercem maior efeito são aquelas que denotam a intenção de compra de produtos de marca própria, mas não expressam a intenção de compra de marcas próprias com frequência. Conclui-se que há tendência à intenção de compra de marcas próprias, mas não a intenção de comprar esses produtos com frequência.
Os resultados deste estudo podem oferecer contribuições importantes para o marketing de empresas de varejo que adotam ou pretendem adotar as marcas próprias em seu mix de produtos. O forte efeito do risco percebido sobre a imagem da marca própria sugere a adoção da estratégia de qualidade garantida nos produtos de marca própria. Ao melhorar aspectos referentes à imagem da loja e ao risco percebido, consequentemente, os gerentes obterão melhoria na imagem da marca própria, na
atitude e na intenção de compra desses produtos. Os gerentes podem melhorar a imagem da marca própria por meio de aspectos que influenciam o risco percebido e, ao mesmo tempo, melhorar a imagem da loja para que obtenham melhoria na imagem de suas marcas próprias.
As principais limitações deste estudo relacionam-se com a generalização das descobertas proporcionadas por ele, já que a amostra não foi probabilística. Tal limitação não compromete a contribuição da pesquisa, já que o objetivo foi testar relações entre construtos. O estudo é robusto para população de alta renda, a que mais compra marca própria no Brasil, mas não pode ser generalizado para as classes com menor poder aquisitivo. Sugere-se o desenvolvimento do mesmo estudo aplicando os relacionamentos hipotetizados em uma amostra de consumidores de baixa renda; ou a aplicação em outros setores de mercado que também trabalham com marcas próprias, para testar se os efeitos entre os construtos diferem dos resultados obtidos no contexto de supermercados.
REFERÊNCIAS
Afthanorhan, W. M. A. B. W. (2013). A comparison of partial least square structural equation modeling (PLS-SEM) and covariance based struc-tural equation modeling (CB-SEM) for confirmatory factor analysis. International Journal of Engineering Science and Innovative Technol-ogy, 2(5), 198-205.
Agarwal, S., & Teas, R. K. (2001). Perceived value: Mediating role of per-ceived risk. Journal of Marketing Theory & Practice, 9(4), 1-14. doi:10.1080/10696679.2001.11501899
Ailawadi, K. L., & Keller, K. L. (2004). Understanding retail branding: Conceptual insights and research priorities. Journal of Retailing, 80(4), 331-342. doi:10.1016/j.jretai.2004.10.008
Anderson, J. C., & Gerbing, D. W. (1988). Structural equation modeling in practice: A review and recommended two-step approach. Psycho-logical Bulletin, 103(3), 411-423. doi:10.1037/0033-2909.103.3.411
Armitage, C. J., & Conner, M. (2001). Efficacy of the theory of planned be-haviour: A meta-analytic review. British Journal of Social Psychology, 40(4), 471-499. doi:10.1348/014466601164939
Associação Brasileira de Supermercados. (2014). Pesquisas sazonais marcas próprias: 19º estudo da Nielsen aponta oportunidades. Re-cuperado de http://www.abrasnet.com.br/economia-e-pesquisa/pesquisas-sazonais/marcas-proprias/
Bao, Y., Bao, Y., & Sheng, S. (2011). Motivating purchase of private brands: Effects of store image, product signatureness, and quality variation. Journal of Business Research, 64, 220-226. doi:10.1016/j.jbusres.2010.02.007
Beneke, J., Brito, A., & Garvey, K. A. (2015). Propensity to buy private label merchandise: The contributory effects of store image, price, risk, quality and value in the cognitive stream. International Jour-nal of Retail & Distribution Management, 43(1), 43-62. doi:10.1108/ijrdm-09-2013-0175

623
ISSN 0034-7590
AUTORES | Lúcia Aparecida da Silva Borges | Dirceu Tornavoi de Carvalho | Cláudio de Souza Miranda
© RAE | São Paulo | V. 56 | n. 6 | nov-dez 2016 | 611-625
Beneke, J., & Carter, S. (2015). The development of a consumer value proposition of private label brands and the application thereof in a South African retail context. Journal of Retailing and Consumer Ser-vices, 25, 22-35. doi:10.1108/ijrdm-09-2013-0175
Beneke, J., & Zimmerman, N. (2014). Beyond private label panache: The effect of store image and perceived price on brand prestige. Journal of Consumer Marketing, 31(4), 301-311. doi:10.1108/jcm-12-2013-0801
Bido, D. S., Silva, D., Souza, C. A., & Godoy, A. S. (2010). Mensuração com indicadores formativos nas pesquisas em administração de em-presas: Como lidar com a multicolinearidade entre eles? RAEP-Ad-ministração: Ensino e Pesquisa, 11(2), 245-269. doi:10.13058/raep.2010.v11n2.145
Bloemer, J., & Ruyter, K. (1998). On the relationship between store im-age, store satisfaction and store loyalty. European Journal of Market-ing, 32(5/6), 499. doi:10.1108/03090569810216118
Burton, S., Lichtenstein, D. R., Netemeyer, R. G., & Garretson, J. A. (1998). A scale for measuring attitude toward private label prod-ucts and an examination of its psychological and behavioral cor-relates. Journal of the Academy of Marketing Science, 26(4), 293-306. doi:10.1177/0092070398264003
Chaniotakis, I. E., Lymperopoulos, C., & Soureli, M. (2010). Con-sumer’s intention of buying own-label premiun food prod-ucts. Journal of Product & Brand Management, 19(5), 327-334. doi:10.1108/10610421011068568
Chowdhury, J., Reardon, J., & Srivastava, R. (1998). Alternative modes of measuring store image: An empirical assessment of structured ver-sus unstructured measures. Journal of Marketing Theory and Practice, 6(2), 72-86.
Cohen, J. (1988). Statistical power analysis for the behavioral sciences (2nd ed.). New York, EUA: Psychology Press.
Collins-Dodd, C., & Lindley, T. (2003). Store brands and retail differenti-ation: The influence of store image and store brand attitude on store own brand perceptions. Journal of Retailing and Consumer Services, 10(6), 345-352. doi:10.1108/10610421011068568
Dawes, J., & Nenycz-Thiel, M. (2013). Analyzing the intensity of private label competition across retailers. Journal of Business Research, 66(1), 60-66. doi:10.1016/j.jbusres.2011.07.023
Delgado-Ballester, E., Hernandez-Espallardo, M., & Rodriguez-Orejuela, A. (2014). Store image influences in consumers’ perceptions of store brands: The moderating role of value consciousness. European Jour-nal of Marketing, 48(9/10), 1850-1869. doi:10.1108/ejm-02-2012-0087
Derbaix, C. (1983). Perceived risk and risk believers: An empiri-cal investigation. Journal of Economic Psychology, 3(1), 19-38. doi:10.1016/0167-4870(83)90056-9
Diallo, M. F. (2012). Effects of store image and store brand price-im-age ons tore brand purchase intention: Application to an emerging market. Journal of Retailing and Consumer Services, 19(3), 360-367. doi:10.1016/j.jretconser.2012.03.010
Dick, A., Jain, A., & Richardson, P. (1995). Correlates of store brand proneness: Some empirical observations. Journal of Product & Brand Management, 4(4), 15-22. doi:10.1108/10610429510097663
Dodds, W. B., Monroe, K. B., & Grewal, D. (1991). Effects of price, brand and store information on buyers’ production evaluation. Journal of Marketing Research, 28(3), 307-319. doi:10.2307/3172866
Dolbec, P. Y., & Chebat, J. C. (2013). The impact of a flagships vs. a brand store on brand attitude, brand attachment and brand equity. Journal of Retailing, 89(4), 460-466. doi:10.1016/j.jretai.2013.06.003
Fishbein, M., & Ajzen, I. (1975). Belief, attitude, intention, and behavior: An introduction to theory and research. Reading MA: Addison-Wesley.
Fornell, C., & Larcker, D. F. (1981). Evaluating structural equation models with unobservable variables and measurement error. Journal of Mar-keting Research, 18(1), 39-50. doi:10.2307/3151312
Golan, E., Roberts, T., & Ollinger, M. (2004). Savvy buyers spur food safety innovations in meat processing. Amber Waves, 2(2), 22-29.
Grace, D., & O’Cass, A. (2004). Examining service experiences and post-consumption evaluations. Journal of Services Marketing, 18(6), 450-461. doi:10.1108/08876040410557230
Hair, J., Hult, G. T. M., Ringle, C., & Sarstedt, M. (2014). A primer on par-tial least squares structural equation modeling (PLS-SEM). Los Ange-les, EUA: SAGE Publications.
Harcar, T., Kara, A., & Kucukemiroglu, O. (2006). Consumer’s perceived value and buying behavior of store brands: An empirical investiga-tion. The Business Review, 5(2), 55-62.
Henseler, J., Ringle, C., & Sinkovics, R. (2009). The use of partial least squares path modelling in international marketing. In R. R. Sinkov-ics & P. N. Ghauri (Eds.), New Challenges to International Marketing (pp.277 - 319). Bingley, Reino Unido: Emerald Group Publishing Lim-ited.
Hidalgo, P., Manssur, E., Olavarrieta, S., & Farías, P. (2007). Determi-nantes de la compra de marcas privadas. Revista de Ciências Socia-les, 13(2), 205-218.
Hoch, S. J., & Banerji, S. (1993). When do private labels succeed? Sloan Management Review, 34(4). Recuperado de http://sloanreview.mit.edu/
Hoppe, A., Barcellos, M. D., Vieira, L. M., & Matos, C. A. (2012). Compor-tamento do consumidor de produtos orgânicos: Uma aplicação da teoria do comportamento planejado. BASE-Revista de Administração e Contabilidade da Unisinos, 9(2), 174-188.
Hornibrook, S. A., McCarthy, M., & Fearne, A. (2005). Consumers’ per-ception of risk: The case of beef purchases in Irish supermarkets. In-ternational Journal of Retail & Distribution Management, 33(10), 701-715. doi:10.1108/09590550510622263
Huang, Y., & Huddleston, P. (2009). Retailer premium own-brands: Cre-ating customer loyalty through own-brand products advantage. In-ternational Journal of Retail & Distribution Management, 37(11), 975-992. doi:10.1108/09590550910999389
Hyman, M. R., Kopf, D. A., & Lee, D. (2010). Review of literature – Future research suggestions: Private label brands: Benefits, success factors and future research. Journal of Brand Management, 17(5), 368-389. doi:10.1057/bm.2009.33
Kakkos, N., Trivellas, P., & Sdrolias, L. (2015). Identifying drivers of pur-chase intention for private label brands: Preliminary evidence from Greek consumers. Procedia – Social and Behavioral Sciences, 175(12), 522-528. doi:10.1016/j.sbspro.2015.01.1232
Keller, K. L. (1993). Conceptualizing, measuring, and managing customer-based brand equity. Journal of Marketing, 57(1), 1-22. doi:10.2307/1252054
Knight, D. K., & Kim, E. Y. (2007). Japanese consumer’s need for uniqueness: Effects on brand perceptions and purchase intention. Journal of Fashion Marketing and Management, 11(2), 270-280. doi:10.1108/13612020710751428
Kremer, F., & Viot, C. (2012). How store brands build retailer brand im-age. International Journal of Retail & Distribution Management, 40(7), 528-543. doi:10.1108/09590551211239846

624
ISSN 0034-7590
FÓRUM | Antecedentes da intenção de compra de marcas próprias: Um estudo no mercado emergente
© RAE | São Paulo | V. 56 | n. 6 | nov-dez 2016 | 611-625
Laforet, S. (2007). British grocers’ brand extension in financial ser-vices. Journal of Product & Brand Management, 16(2), 82-97. doi:10.1108/10610420710739964
Laroche, M., Kim, C., & Zhou, L. (1996). Brand familiarity and confi-dence as determinants of purchase intention: An empirical test in a multiple brand context. Journal of Business Research, 27(2), 115-120. doi:10.1016/0148-2963(96)00056-2
Liljander, V., Polsa, P., & Riel, A. Van. (2009). Modelling consumer re-sponses to an apparel store brand: Store image as a risk reducer. Journal of Retailing and Consumer Services, 16(4), 281-290. 10.1016/j.jretconser.2009.02.005
Martenson, R. (2007). Corporate brand image, satisfaction and store loyalty: A study of the store as a brand, store brands and manufactur-er brands. International Journal of Retail & Distribution Management, 35(7), 544-555. doi:10.1108/09590550710755921
Martineau, P. (1958). The personality of the retail store. Harvard Busi-ness Review, 36. Recuperado de https://hbr.org/
Martínez-Ruiz, M. P., Ruiz-Palomino, P., Martinez-Canas, R., & Blázquez-Resino, J. J. (2014). Consumer satisfaction and loyalty in private-label food stores. British Food Journal, 116(5), 849-871. doi:10.1108/bfj-09-2012-0216
Mieres, C. G., Martín, A. M. D., & Gutiérrez, J. A. (2006). Anteced-ents of the difference in perceived risk between store brands and national brands. European Journal of Marketing, 40(1/2), 61-82. doi:10.1108/03090560610637310
Mitchell, V. W. (1998). A role for consumer risk perceptions in grocery retailing. British Food Journal, 100(4), 171-183. doi:10.1108/00070709810207856
Mitra, K., Reiss, M., & Capella, L. (1999). An examination of perceived: Risk, information search and behavioral intentions in search, experi-ence and credence services. The Journal of Services Marketing, 13(3), 208-228. doi:10.1108/08876049910273763
Nielsen. (2015). Imprensa. Recuperado de http://www.nielsen.com/br/pt/press-room/2015/Em-um-cenario-economico-nao-tao-otimis-ta-marca-propria-se-destaca-por-promocao-aponta-Nielsen.html
Nielsen. (2016). Insights. Recuperado de http://www.nielsen.com/br/pt/insights/news/2016/Marcas-proprias-e-alimentos-saudav-eis-sao-duas-das-seis-principais-tendencias-do-varejo-na-Ameri-ca-Latina.html
Olbrich, R., & Jansen, H. C. (2014). Price-quality relationship in pricing strategies for private labels. Journal of Product & Brand Management, 23(6), 429-438. doi:10.1108/jpbm-06-2014-0627
Parente, J., & Barki, E. (2014). Varejo no Brasil: Gestão e estratégia (2a ed.). São Paulo, SP: Atlas.
Pereira, I. (2001). Marcas de supermercado. RAE-Revista de Ad-ministração de Empresas, 41(1), 16-27. doi:10.1590/s0034-75902001000100003
Porral, C. C., & Lang, M. F. (2015). Private labels: The role of manufac-turer identification, brand loyalty and image on purchase intention. British Food Journal, 117(2), 506-522. doi:10.1108/BFJ-06-2014-0216
Porral, C. C., & Levy-Mangin, J. P. (2016). Food private label brands: The role of consumer trust on loyalty and purchase intention. British Food Journal, 118(3), 679-696. doi:10.1108/bfj-08-2015-0299
Porter, S. S., & Claycomb, C. (1997). The influence of brand recognition on retail store image. Journal of Product & Brand Management, 6(6), 373-387. doi:10.1108/10610429710190414
Reardon, J., Miller, C. E., & Coe, B. (1995). Applied scale development: Measurement of store image. Journal of Applied Business Research, 11(4), 85-93. doi:10.19030/jabr.v11i4.5851
Richardson, A., Dick, S., & Jain, K. (1994). Extrinsic and intrinsic cue ef-fects on perceptions of store brand quality. The Journal of Marketing, 58(4), 28-36. doi:10.2307/1251914
Richardson, P., Jain, A., & Dick, A. (1996). Household store brand prone-ness: A framework. Journal of Retailing, 72(2), 159-185. doi:10.1016/S0022-4359(96)90012-3
Rubio, N., Oubiña, J., & Villaseñor, N. (2014). Brand awareness-brand quality inference and consumer’s risk perception in store brands of food products. Food Quality and Preference, 32, 289-298. doi:10.1016/j.foodqual.2013.09.006
Rzem, H., & Debabi, M. (2012). Store image as a moderator of store brand attitude. Journal of Business Studies Quarterly, 4(1), 130-148.
Sarkar, S., Sharma, D., & Kalro, A. D. (2016). Private label brands in an emerging economy: An exploratory study in India. Internation-al Journal of Retail & Distribution Management, 44(2), 203-222. doi:10.1108/ijrdm-07-2015-0102
Semeijn, J., Riel, A. Van, & Ambrosini, A. (2004). Consumer evaluations of store brands: Effects of store image and product attributes. Jour-nal of Retailing & Consumer Services, 11(4), 247-258. doi:10.1016/S0969-6989(03)00051-1
Sethuraman, R., & Gielens, K. (2014). Determinants of store brand share. Journal of Retailing, 90(2), 141-153. doi:10.1016/j.jretai.2014.04.002
Sheau-Fen, Y., Sun-May, L., & Yu-Ghee, W. (2012). Store brand prone-ness: Effects of perceived risk, quality and familiarity. Australasian Marketing Journal, 20(1), 48-58. doi:10.1016/j.ausmj.2011.10.014
Shuklay, P., Banerjee, M., & Adidam, P. T. (2013). The moderating influ-ence of socio-demographic factors on the relationship between con-sumer psychographics and the attitude towards private label brands. Journal of Consumer Behaviour, 12(6), 423-435. doi:10.1002/cb.1441
Silva, L. A., Merlo, E. M., & Nagano, M. S. (2012). Uma análise dos principais elementos influenciadores da tomada de decisão de compra de produtos de marca própria de supermercados. REAd-Re-vista Eletrônica de Administração, 71(1), 97-129. doi:10.1590/S1413-23112012000100004
Solomon, M. (2011). O comportamento do consumidor: Comprando, possuindo e sendo (9a ed.). Porto Alegre, RS: Bookman.
Stone, R. N., & Gronhaug, K. (1993). Perceived risk: Further consider-ations for marketing discipline. European Journal of Marketing, 27(3), 39-50. doi:10.1108/03090569310026637
Ueltschy, L. C., Krampf, R. F., & Yannopoulos, P. (2004). A cross na-tional study of perceived consumer risk toward online (inter-net) purchasing. Multinational Business Review, 12(2), 59-82. doi:10.1108/1525383X200400010
Vahie, A., & Paswan, A. (2006). Private label brand image: Its re-lationship with store image and national brand. Internation-al Journal of Retail & Distribution Management, 34(1), 67-84. doi:10.1108/09590550610642828
Wang, E. S. T. (2015). Effect of food service-brand equity on consum-er-perceived food value, physical risk, and brand preference. British Food Journal, 117(2), 553-564. doi:10.1108/bfj-09-2013-0260
Wu, P. C. S., Yeh, G. Y. Y., & Hsiao, C. R. (2011). The effect of store im-age and service quality on brand image and purchase intention for private label brands. Australasian Marketing Journal, 19(1), 30-39. doi:10.1016/j.ausmj.2010.11.001

625
ISSN 0034-7590
AUTORES | Lúcia Aparecida da Silva Borges | Dirceu Tornavoi de Carvalho | Cláudio de Souza Miranda
© RAE | São Paulo | V. 56 | n. 6 | nov-dez 2016 | 611-625
Yeung, R., Yee, W., & Morris, J. (2010). The effects of risk-reducing strategies on consumer perceived risk and on purchase likeli-hood: A modelling approach. British Food Journal, 112(3), 306-322. doi:10.1108/00070701011029174
Zielke, S., & Dobbelstein, T. (2007). Customers’ willingness to purchase new store brands. Journal of Product & Brand Management, 16(2), 112-121. doi:10.1108/10610420710739982

626
ISSN 0034-7590© RAE | São Paulo | V. 56 | n. 6 | nov-dez 2016 | 626-640
JULIANO DOMINGUES DA [email protected] em Administração pela Universidade Estadual de Maringá, Programa de Pós-Graduação em Administração – Maringá – PR, Brasil
VALTER DA SILVA FAIA [email protected] em Administração pela Universidade Estadual de Maringá, Programa de Pós-Graduação em Administração – Maringá – PR, Brasil
VALTER AFONSO VIEIRA [email protected] da Universidade Estadual de Maringá, Programa de Pós-Graduação em Administração – Maringá – PR, Brasil
FÓRUMSubmetido 16.03.2016. Aprovado 11.08.2016Avaliado pelo processo de double blind review. Editores Científicos: Delane Botelho e Leandro Guissoni
OS EFEITOS NEGATIVOS DA EXPERIÊNCIA E DO CONTROLE NO DESEMPENHO DO VENDEDORThe negative effects of experience and control on salesperson’s performance
Los efectos negativos de la experiencia y del control en el desempeño del vendedor
RESUMONa literatura, há evidência de que quanto maior o perfil de locomoção do vendedor, maior o desem-penho com vendas. Neste artigo, propomos que o sistema de controle por comportamento, quando elevado, prejudica essa associação positiva devido à grande quantidade de acompanhamento das ações dos vendedores, inibindo-os. Além do mais, propomos que essa relação moderada pelo sistema de controle se torna negativa (piorando) quando há alta experiência do vendedor. Essa moderação tripla pode ser explicada pelo conflito da organização com a forma de controlar os vende-dores mais experientes, congruente com a literatura sobre socialização organizacional. Uma survey com vendedores de lojas de varejo foi realizada. Os resultados demonstraram que a orientação para locomoção do vendedor é um preditor do desempenho, mas que o alto nível do sistema de controle por comportamento reduz esse efeito. Além do mais, quando existe maior experiência, essa relação piora, diminuindo o desempenho.PALAVRAS-CHAVE | Sistema de controle, comportamento, experiência, locomoção, desempenho.
ABSTRACTThere is evidence that the greater the seller’s level of locomotion, the greater the sales performance. In this paper, we proposed that the high level of behavior-based control system undermines this positive relationship, due to the large amount of follow-ups of sellers’ actions, inhibiting them. Furthermore, we proposed that this moderated relationship becomes negative (worse) when there is high level of experience. This three-way moderation effect is explained by the organizational conflict from the control to the salespeople, which is consistent with literature on organizational socialization. We did a survey with salespeople working on retail stores. The results demonstrated that the seller’s level of locomotion is a predictor of sales performance, but that the high level of behavior-based control system reduces it. In addition, when there is a high experience, this relationship worsens, reducing the performance.KEYWORDS | Control system, behavior, experience, locomotion, performance.
RESUMENEn la literatura, hay evidencias de que cuanto mayor el perfil de locomoción del vendedor, mayor es el desempeño en las ventas. En este artículo, proponemos que el sistema de control por comportamiento, cuando es elevado, perjudica esa asociación positiva debido al gran seguimiento de las acciones de los vendedores, que termina inhibiéndolos. Además, proponemos que esa relación moderada por el sistema de control resulta negativa (empeorando) cuando se trata de vendedores de gran experiencia. Esa moderación triple se puede explicar por el conflicto de la organización con la forma de contro-lar a los vendedores más experimentados, lo que es congruente con la literatura sobre socialización organizacional. Los resultados de la encuesta realizada con vendedores de tiendas minoristas demos-traron que la orientación a locomoción del vendedor es un predictor del desempeño, pero que el alto nivel del sistema de control por comportamiento reduce ese efecto. Asimismo, cuando existe mayor experiencia, esa relación empeora, disminuyendo el desempeño.PALABRAS CLAVE | Sistema de control, comportamiento, experiencia, locomoción, desempeño.
RAE-Revista de Administração de Empresas | FGV/EAESP
DOI: http://dx.doi.org/10.1590/S0034-759020160605

627
ISSN 0034-7590
AUTORES | Juliano Domingues da Silva | Valter da Silva Faia | Valter Afonso Vieira
© RAE | São Paulo | V. 56 | n. 6 | nov-dez 2016 | 626-640
INTRODUÇÃO
Na literatura de vendas, há um extenso conjunto de fatores que podem aumentar o desempenho do vendedor, entre eles a experiência (Verbeke, Dietz, & Verwall, 2011), a orientação para locomoção do indivíduo (Jasmand, Blazevic, & Ruyter, 2012) e o sistema de controle da força de vendas (Anderson & Oliver, 1987; Miao & Evans, 2013).
A experiência do vendedor é compreendida como eventos que são experimentados ao longo do tempo e que se relacionam com a realização de algum trabalho específico (Quiñones, Ford, & Teachout, 1995). A locomoção refere-se à proatividade do vendedor, a uma forte orientação (Sok, Sok, & Luca, 2015) e à motivação intrínseca para ação (Pierro, Kruglanski, & Higgins, 2006), demonstrando um desejo de eliminar rapidamente qualquer barreira que o impeça de executar algo e um maior engajamento no trabalho (Kruglanski et al., 2000). Segundo Anderson e Oliver (1987), sistema de controle é um conjunto de “procedimentos organizacionais para monitorar, direcionar, avaliar e compensar os empregados” (p. 76).
Pesquisas comprovam que tanto a locomoção do vendedor (Benjamin & Flynn, 2006; Jasmand et al., 2012; Kruglanski et al., 2000; Vieira, Pires, & Galeano, 2013) como o sistema de controle por comportamento (Crosno & Brown, 2014; Samaraweera & Gelb, 2014) têm relação direta com desempenho do vendedor. Contudo, parece haver necessidade de as organizações monitorarem e controlarem seus vendedores quanto às atividades de vendas, e, nesse contexto, pouco se sabe sobre como o sistema de controle pode moderar os efeitos da locomoção. É fato que o sistema de controle possui um papel moderador no esforço (Ahearne, Rapp, Hughes, & Jindal, 2010; Vieira, Silva, Berbert, & Faia, 2015), na motivação (Miao & Evans, 2013, 2014) e na comissão de vendas (Mallin & Pullins, 2009), mas há necessidade de se compreender como essa moderação ocorre na locomoção, especialmente para indivíduos com diferentes níveis de experiência. Logo, algumas questões surgem. Por exemplo, um alto controle por comportamento do vendedor pode reduzir o seu desempenho? Os efeitos de um alto controle por comportamento no desempenho são os mesmos para vendedores com níveis maiores ou menores de experiência?
Com base nessas lacunas, nós propomos um modelo teórico em que a relação positiva entre locomoção e desempenho do vendedor é, de fato, prejudicada pelo sistema de controle por comportamento e agravada ainda mais pela experiência do indivíduo na mesma organização. Esse agravamento na locomoção ocorre porque o controle tende a inibir as ações e as condutas proativas em vendas pelo mecanismo de acompanhamento constante e rotineiro das atividades (Oliver & Anderson, 1994). O efeito negativo da experiência pode ser explicado pela literatura
de socialização organizacional. Sturman (2003) argumenta que os benefícios advindos da experiência gerados pela socialização organizacional decrescem ao longo do tempo, pois um indivíduo será mais ativo para aprender normas e valores quando ingressa na organização, mas tende a aprender menos nos anos posteriores.
Com base em dados de 138 vendedores no varejo, o trabalho propõe dois elementos de moderação que podem piorar o desempenho do vendedor. Portanto, três contribuições para o campo de vendas são descortinadas. Primeiro, os dados da pesquisa mostram um efeito positivo da locomoção no desempenho do vendedor. Esse achado amplia o poder preditivo da teoria do modo regulatório não mais aplicada à psicologia (Kruglanski et al., 2000; Kruglanski, Pierro, & Higgins, 2015), mas ao marketing. Ademais, esse achado é coerente com os achados de Jasmand et al. (2012), os quais não formularam hipótese para a associação.
Segundo, os resultados desta pesquisa mostraram que a combinação entre o sistema de controle por comportamento e a locomoção em vendas gerou menor resultado no desempenho, demonstrando um lado negativo do controle, quando comparado ao lado positivo defendido por Miao e Evans (2013). O lado negativo do sistema de controle já foi observado em outros trabalhos com relação aos construtos trabalho duro e inteligente (Silva, Vieira, & Faia, 2015), conhecimento do vendedor (Miao & Evans, 2012), desempenho (Miao, Evans, & Zou, 2007) e esforço (Vieira et al., 2015). Nesse sentido, ampliamos a discussão do lado negativo do controle para o perfil de locomoção.
Terceiro, partindo da literatura sobre socialização organizacional (Sturman, 2003), os resultados mostram que quanto maior é a experiência do vendedor na organização, pior é a relação entre locomoção e desempenho quando há um alto nível de sistema de controle por comportamento. Esse achado é congruente com o raciocínio de Sturman (2003) e Ng e Feldman (2010), que apontam que os benefícios no desempenho do trabalho gerados pela experiência na empresa são susceptíveis de enfraquecer ao longo do tempo. Vendedores mais experientes são menos dispostos e motivados que vendedores em início de carreira quanto aos ganhos advindos da socialização organizacional (i.e., aprendizado de valores, habilidades, comportamentos esperados e conhecimento social) em decorrência da percepção menos favorável do ambiente de trabalho (Helmreich, Sawin, & Carsrud, 1986; Huang, Shi, Zhang, & Cheung, 2006) e da percepção de estagnação na organização (Ng & Feldman, 2010; Peter & Hull, 1969).
Após essa introdução, o segundo tópico evidencia o referencial teórico para o desenvolvimento do estudo. A terceira parte apresenta o modelo teórico e as hipóteses. A etapa seguinte descreve os procedimentos metodológicos, o tipo da pesquisa e a definição dos principais construtos. Por fim, os resultados e as conclusões são apresentadas.

628
ISSN 0034-7590
FÓRUM | Os efeitos negativos da experiência e do controle no desempenho do vendedor
© RAE | São Paulo | V. 56 | n. 6 | nov-dez 2016 | 626-640
REFERENCIAL TEÓRICO
Neste tópico, discutimos o conceito de locomoção de acordo com a teoria do modo regulatório (Kruglanski et al., 2000) e o sistema de controle por comportamento conforme a abordagem de Anderson e Oliver (1987). Por fim, a experiência do vendedor é tratada.
Orientação para locomoção
De acordo com Higgins (2000), os indivíduos são motivados para tomarem “boas decisões que apresentam resultados positivos” (p. 1218), as quais possuem maior proporção de resultados benéficos quando comparados aos maléficos. No contexto de vendas, normalmente as alternativas de decisão são associadas aos valores numéricos (exs.: bônus, comissões, viagens, ganhos extras etc.), sendo uma boa decisão aquela que apresentar maior valor de resultado (Avnet & Higgins, 2003). Contudo, os indivíduos apresentam características distintas do modo regulatório, as quais influenciam a forma de tomar decisões e de agir na busca por resultados (Pierro et al., 2006). Logo, a avaliação positiva de uma decisão não deve ser feita apenas em função dos resultados, mas também em função dos meios usados para alcançá-los (Avnet & Higgins, 2003), gerando um ajuste. Para Pierro et al. (2013), “quando o indivíduo experimenta esse ajuste de propósitos, ele se sente melhor e se torna mais engajado na tarefa” (p. 918), elevando o seu senso de importância naquilo que está fazendo.
Uma das orientações encontradas na teoria do modo regulatório é aquela para locomoção (Giacomantonio, Mannetti, & Pierro, 2013; Sok et al., 2015). Para Kruglanski et al. (2000), a orientação para locomoção “é um aspecto da autorregulação preocupado com o movimento de um estado para o outro e com o comprometimento de recursos psicológicos que vai iniciar e manter o movimento na direção dos objetivos de uma maneira direta, longe de distrações e atrasos” (p. 794). Assim, de acordo com Sok et al. (2015) “as pessoas com essa orientação devem se sentir recompensadas por constantemente se mover de uma atividade para a próxima atividade” (p. 144). Portanto, esses indivíduos são vistos como orientados à ação e que vão em frente (Pierro et al., 2006). Em resumo, Pierro et al. (2013) destacam que pessoas orientadas à locomoção “se preocupam com o desejo de tomar uma ação, começar e simplesmente fazer, mesmo se isso significar não considerar os significados e as opções de modo amplo” (p. 918). Nesse sentido, o nível de engajamento nas tarefas é menos influenciado por recompensas externas (Giacomantoni et al., 2013), e mais por uma motivação interna (Pierro et al., 2006).
Sistema de controle por comportamento
Anderson e Oliver (1987) definiram o sistema de controle como “um conjunto de procedimentos para monitorar, direcionar, avaliar e compensar os empregados” (p. 76). Há diversos tipos de sistemas de controle discutidos na literatura, tais como por comportamento, por resultado, por atividade e por capacidade (Anderson & Oliver, 1987; Crosno & Brown, 2014; Miao & Evans, 2013; Samaraweera & Gelb, 2014). Neste trabalho, utilizamos o sistema de controle por comportamento como um processo organizacional que tende a controlar as atividades rotineiras e as ações cotidianas dos vendedores (Oliver & Anderson, 1994). Nesse tipo de sistema de controle, os gestores se esforçam para controlar as tarefas dos vendedores que deverão ser executadas rotineiramente, nas quais eles podem intervir e dar suporte quando necessário, o que torna o controle mais intenso e frequente (Anderson & Oliver, 1987).
O sistema de controle por comportamento é indicado para alcançar objetivos de longo prazo e avaliar medidas rotineiras de desempenho (Kim & Takashima, 2014), pois tem como foco intensificar a qualidade do relacionamento entre o vendedor e cliente (Crosno & Brown, 2014), aumentar a capacidade do vendedor para se adaptar às situações de vendas (Guenzi, Baldauf, & Panagopoulos, 2014) e incentivar a orientação para aprendizagem do vendedor (Rodrigues, Coelho, & Sousa, 2015).
No sistema de controle por comportamento, o plano de compensação fixa tende a ser elevado (Oliver & Anderson, 1994), reduzindo o risco aos vendedores (Anderson & Oliver, 1987) em troca de comprometimento e cooperação nas atividades e ganhos de controle (Crosno & Brown, 2014). Portanto, o foco do sistema é controlar o processo e o comportamento, analisando a atividade para que, assim, se alcance o desempenho esperado. A ponderação do controle por comportamento tende a defender a dedicação para com atividades prioritárias da organização, objetivando os resultados no longo prazo (Piercy, Cravens, Lane, & Vorhies, 2006). Em suma, o sistema de controle por comportamento sinaliza aos vendedores como aplicarem seus esforços nas atividades.
Experiência do vendedor
A experiência se desenvolve com o passar do tempo, a partir do crescimento individual do vendedor e da experiência adquirida por ele na sua função ou na organização em que trabalha (Onyemah & Anderson, 2009; Quiñones et al., 1995). Na medida em que os vendedores adquirem experiência, passam a desenvolver maior maturidade profissional, que é importante para as vendas e as tarefas (Stan, Evans, Arnold, & McAmis, 2012). A maturidade

629
ISSN 0034-7590
AUTORES | Juliano Domingues da Silva | Valter da Silva Faia | Valter Afonso Vieira
© RAE | São Paulo | V. 56 | n. 6 | nov-dez 2016 | 626-640
profissional pode tornar o funcionário mais focado e preparado para enfrentar as adversidades e encontrar soluções para clientes de modo mais rápido do que vendedores menos experientes, pois possui um conhecimento maior sobre potenciais recursos (Onyemah & Anderson, 2009).
No início de suas carreiras profissionais, os vendedores podem apresentar um conhecimento ainda insuficiente sobre as competências e as habilidades necessárias para o desempenho eficaz na atividade. No entanto, com o passar do tempo, tendem a ganhar conhecimento, fazendo com que suas habilidades de vendas dos diversos produtos aumentem, pois a experiência adquirida tende a gerar maior maturidade (Stan et al., 2012) e adaptação à necessidade do cliente (Cron & Slocum, 1986; Rapp, Ahearne, Mathieum, & Schillewaert, 2006). A experiência propicia aos vendedores uma bagagem mais adequada para práticas de vendas, como o desenvolvimento de adaptabilidade na abordagem de vendas (Verbeke et al., 2011) e a orientação para o cliente (Franke & Park, 2006).
É importante distinguir a experiência em vendas geral da experiência em vendas na empresa. A experiência geral é o conhecimento acumulado pelo vendedor ao longo de sua carreira, em diversas organizações (Sturman, 2003), podendo ter realizado a venda de diferentes produtos para distintos segmentos. Já a experiência na empresa (organizational tenure) é o tempo de vendas em uma mesma organização, a qual permite ao vendedor se tornar mais bem-informado a respeito da empresa (Ng & Feldman, 2010). Neste trabalho, utilizamos a experiência na empresa para entender como o sistema de controle organizacional interfere no desempenho em vendas.
MODELO TEÓRICO
O modelo teórico apresentado nesta seção leva em consideração hipóteses que objetivam explicar as relações. Primeiro, sugerimos que a orientação para locomoção do vendedor possui um efeito direto e positivo no seu desempenho. Segundo, sugerimos que essa relação é moderada pelo sistema de controle por comportamento. Terceiro, propomos uma moderação tripla entre locomoção, sistema de controle por comportamento e experiência do vendedor.
Efeito da locomoção
Uma pessoa com alta orientação para locomoção tem como principal preocupação mover-se e realizar várias tarefas, empregando grande esforço para realizá-las (Pierro et al., 2006). Acredita-se que a locomoção do vendedor impacte o desempenho, porque, ao se mover de um estado para o outro, o indivíduo
busca atingir a meta e concretizar a venda, dado que está comprometido com o estado psicológico da ação (Kruglanski et al., 2000). Ademais, em face do senso de progresso que move o vendedor na ação, a persistência na tarefa de fechar a venda tende a ajudar a elevar o desempenho (Kruglanski et al., 2015).
Empiricamente, há evidências na literatura de que a locomoção tem efeito positivo na realização de tarefas (Johnson, Shull, & Wallace, 2011), na venda cruzada (Jasmand et al., 2012), na orientação ao cliente (Lee & Ji, 2013), na busca por novos clientes (DeCarlo & Lam, 2015) e no desempenho do vendedor (Silva et al., 2015; Vieira et al., 2013). Assim, tem-se que:
H1: Orientação para locomoção tem relação positiva com o desempenho do vendedor.
Efeito moderador do sistema de controle
Alta orientação para locomoção desperta uma forte intenção para ação (Kruglanski et al., 2015). Vendedores com esse perfil procuram eliminar o mais rápido possível qualquer barreira para a ação, focando nos fins (Pierro et al., 2006). Desse modo, o sistema de controle por comportamento pode ser visto pelo vendedor orientado à locomoção como uma barreira para a ação, por controlar sistematicamente suas atividades. Pela ótica do sistema de controle por comportamento, os vendedores tendem a ser mais fortemente direcionados sobre quais atividades desempenhar rotineiramente (Oliver & Anderson, 1994), podendo gerar um possível bloqueio de sua autonomia da ação.
A conduta proativa do vendedor pode passar a ser engessada pelo controle do comportamento (Crosno & Brown, 2014; Samaraweera & Gelb, 2014), e, em decorrência da perda de autonomia e normatização, o efeito da locomoção sobre o desempenho do vendedor pode ser reduzido. Portanto, acredita-se que vendedores com alta orientação para locomoção, que possuem iniciativa e predisposição para se envolver nas tarefas de maneira contínua (Pierro et al., 2006), e com elevado controle por comportamento, tenham prejuízo, devido ao controle estrito das ações e ao cerceamento da liberdade/autonomia sobre qual estratégia adotar (Miao & Evans, 2013).
Além do mais, o sistema de controle por comportamento pode exigir dos vendedores que realizem, além das tarefas de vendas, as tarefas burocráticas do dia a dia (Anderson & Oliver, 1987), como o preenchimento de fichas, cadastros e relatórios. Por realizarem tarefas distintas do foco de vendas, demandando mais recursos, tempo e esforço, pode haver maior distanciamento para a ação de prospecção e de vendas, podendo desmotivar o vendedor (Miao & Evans, 2013) e reduzir o desempenho (Onyemah & Anderson, 2009). Logo:

630
ISSN 0034-7590
FÓRUM | Os efeitos negativos da experiência e do controle no desempenho do vendedor
© RAE | São Paulo | V. 56 | n. 6 | nov-dez 2016 | 626-640
H2: Sistema de controle por comportamento tem um efeito moderador negativo na relação entre locomoção e desem-penho do vendedor. Isto é, sob condições de alto (vs. bai-xo) nível de controle por comportamento, a locomoção terá um efeito negativo (vs. positivo) no desempenho.
Efeito moderador da experiência em vendas
Espera-se que o efeito moderador do sistema de controle por comportamento na relação entre a locomoção e o desempenho varie em função da experiência do vendedor na organização. Sustentamos esse efeito moderador com base na literatura sobre socialização organizacional (Sturman, 2003).
Chatman (1991) define a socialização organizacional “como um processo pelo qual um indivíduo compreende os valores, habilidades, comportamentos esperados e conhecimento social que são essenciais para assumir um papel organizacional” (p. 462), acumulando experiência na organização. Quando um indivíduo ingressa em uma organização, ele é exposto a “um conjunto de normas culturais, expectativas comportamentais e informações operacionais da organização”, se socializando (Sturman, 2003, p. 612). O sistema de controle por comportamento pode reforçar o processo de socialização, dada a preocupação constante em estabelecer valores, habilidades e comportamentos esperados para os vendedores seguirem ao longo do tempo (Anderson & Oliver, 1987; Miao & Evans, 2013), moldando o comportamento dos indivíduos (Chatman, 1991).
Esse processo de socialização organizacional pode gerar benefícios para indivíduos em início de carreira, pois eles tendem a ser mais ativos e motivados para aprender durante o processo de socialização (Super, 1980), e o sistema de controle por comportamento é mais adequado para implementar a socialização dos valores (Sturman, 2003). Contudo, esses benefícios gerados pela socialização e pelo sistema de controle por comportamento decrescem para indivíduos mais experientes, pois, com o passar do tempo na mesma organização, os indivíduos tendem a diminuir o aprendizado (Sturman, 2003). Ng e Feldman (2010) postulam que, “após os indivíduos aprenderem praticamente todos os
aspectos de seus postos de trabalho, o aumento do tempo na organização pode não mais produzir quaisquer aumentos marginais no desempenho do trabalho” (p. 1228). À medida que um indivíduo aumenta seu tempo na mesma organização, ele passa a ter uma percepção menos favorável do ambiente de trabalho, por ser menos receptivo para se comportar de modo participativo diante das diretrizes da gestão, uma vez que encontra menos motivação do que o indivíduo em início de carreira (Helmreich et al., 1986; Huang et al., 2006).
Outro fator é a percepção de estagnação na organização, quando um indivíduo fica desmotivado em aprender novos aspectos de seu trabalho, por alcançar uma posição na hierarquia organizacional para a qual ele não possui habilidade suficiente ou em que não pode mais ser promovido (Ng & Feldman, 2010; Peter & Hull, 1969). Assim, quando um sistema de controle por comportamento passa a reforçar o processo de socialização organizacional de maneira constante e contínua para vendedores orientados à locomoção e com experiência elevada na empresa, os efeitos benéficos da locomoção são prejudicados, levando ao enfraquecimento do desempenho do vendedor. Nesse sentido, acreditamos que o desempenho do vendedor possa variar de acordo com o nível de sistema de controle por comportamento e com a experiência do vendedor na empresa. Logo:
H3: A combinação entre a experiência na empresa e o siste-ma de controle por comportamento modera negativamente a relação entre orientação para locomoção e desempenho do vendedor. Isto é: sob condições de experiência eleva-da na empresa, a locomoção terá um efeito positivo menor quando há um elevado controle por comportamento.
A partir das hipóteses sugeridas, propomos o modelo teórico apresentado na Figura 1. O modelo apresenta uma relação direta positiva entre a locomoção e o desempenho do vendedor (H1), moderada pelo sistema de controle por comportamento (H2). Por fim, há o efeito da experiência (H3), gerando o efeito negativo.
Figura 1. Modelo teórico da pesquisa
Desempenho comvendas
Locomoção dovendedor (H1)
Moderação duplaControle por
comportamento (H2)Moderação tripla
Experiência dovendedor (H3)
Covariáveis:GêneroIdade
EscolaridadeTamanho da empresa
Nota: Seta pontilhada representa Moderação; Seta contínua, Efeito direto.

631
ISSN 0034-7590
AUTORES | Juliano Domingues da Silva | Valter da Silva Faia | Valter Afonso Vieira
© RAE | São Paulo | V. 56 | n. 6 | nov-dez 2016 | 626-640
METODOLOGIA
Para testar as hipóteses, uma pesquisa quantitativa do tipo descritiva, com corte transversal, foi realizada. O método de pesquisa escolhido foi o levantamento (survey), empregado por meio de um questionário estruturado. A amostra escolhida é de vendedores que trabalham no comércio de vestuário, de calçados e de móveis. Portanto, os vendedores atuam no varejo, com contato direto com consumidores das classes A, B e C. Os vendedores foram abordados dentro das lojas e, após receberem a explicação dos objetivos da pesquisa, foram convidados a participar dela. Portanto, a pesquisa foi realizada na forma de coleta pessoal. A amostra utilizada foi não probabilística por conveniência. Dada a quantidade de variáveis independentes, o Teorema do Limite Central e a fórmula de 15 sujeitos para cada uma das três variáveis independentes (Field, 2013), haveria necessidade mínima de 3x15 = 75 respondentes. O tamanho final da nossa amostra foi de 138 vendedores.
Mensuração das escalas
As escalas são do tipo Likert de 10 pontos, ancoradas de 1 = discordo totalmente até 10 = concordo totalmente. Em termos de medição, locomoção é mensurada com sete questões extraídas do estudo de Kruglanski et al. (2000), sendo: Eu não me importo de fazer as coisas mesmo que envolva um esforço extra; Me sinto animado(a) quando estou prestes a atingir uma meta; Eu gosto de participar das coisas ativamente, mais do que apenas assistir e observar; Quando decido fazer uma coisa, eu não posso esperar para começar; No momento em que completo uma tarefa, eu já tenho uma próxima em mente; Em grande parte do tempo, meus pensamentos estão ocupados com a tarefa que eu desejo completar; e Quando eu começo a fazer alguma coisa, eu costumo perseverar até terminá-la.
Sistema de controle por comportamento é operacionalizado por meio de uma escala com cinco questões adaptadas de Ahearne et al. (2010), sendo: A empresa faz controle rígido de minhas atividades e comportamentos; A empresa monitora minhas ações diária e regularmente; O volume de comissão que a empresa me remunera em relação ao salário fixo é baixo; A empresa acompanha as ações dos vendedores dia a dia; e A empresa deixa os vendedores livres para trabalhar (reversa).
Desempenho do vendedor é operacionalizado por uma escala com quatro questões adaptadas dos estudos de Baldauf e Cravens (2000), a saber: Produzo uma elevada participação de mercado para minha empresa em relação aos outros vendedores de minha empresa; Realizo um elevado número de vendas para minha empresa; Faço vendas dos produtos com margens de lucro
mais altas em relação aos outros vendedores de minha empresa; e Ultrapasso as metas de vendas. Destaca-se que o desempenho do vendedor é mensurado de maneira subjetiva, em virtude da dificuldade em obter tais medidas diretamente das empresas (conforme sugestão de Rich, Bommer, Mackenzie, Podsakoff, & Johnson, 1999).
Experiência em vendas na empresa é mensurada de maneira objetiva a partir do tempo em anos há que o vendedor trabalha na empresa (Sturman, 2003). As variáveis de controle foram definidas como o gênero do respondente, a idade (anos), o grau de escolaridade e o tamanho da empresa em que o vendedor trabalha (em número de empregados).
Checagem dos dados
Após a coleta dos dados, a normalidade, os missing-values e a multicolineridade foram examinados. Em seguida, a análise fatorial exploratória das escalas foi verificada para fins de dimensionalidade. Posteriormente, a análise fatorial confirmatória também foi empregada para validade do modelo de medidas (Byrne, 2013). Todos os indicadores obtiveram cargas fatoriais elevadas, exceto um item da escala de locomoção e um da escala de controle. Esses dois indicadores foram retirados nas análises finais.
Modelos de regressão
Para os testes de moderação, adotou-se a sistemática proposta por Aiken e West (1991) com uso das escalas contínuas. As escalas foram padronizadas via escore z (Field, 2013) antes da criação das moderações para reduzir os efeitos da multicolinearidade. As moderações foram analisadas graficamente, estimando os valores para a variável dependente a partir da combinação entre altos e baixos valores das variáveis independente e moderadoras (Aiken & West, 1991), ou seja, 1 desvio padrão acima da média (alto valor) e 1 desvio padrão abaixo da média (baixo valor). Adicionalmente, para análise da moderação tripla, também foram estimados os coeficientes de regressão da interação entre locomoção e sistema de controle ao longo do nível de experiência via técnica de Johnson-Neyman (Hayes, 2013).
RESULTADOS
Os dados dos vendedores estão na Tabela 1. A amostra é formada por 138 vendedores de 38 lojas varejistas de vestuário, calçados e móveis. Não foram encontradas diferenças na média do desempenho do vendedor (F(2, 135) = 0,99; p > 0,37), na locomoção (F(2, 135) = 0,05; p > 0,99) e no sistema de controle por

632
ISSN 0034-7590
FÓRUM | Os efeitos negativos da experiência e do controle no desempenho do vendedor
© RAE | São Paulo | V. 56 | n. 6 | nov-dez 2016 | 626-640
comportamento (F(2, 135) = 0,65; p > 0,52) a partir das diferentes lojas do comércio. A maioria dos respondentes é do sexo feminino (56,52%), mais de 60% desses possuem curso superior, e 29,71% possuem curso de especialização. A média de idade é de 31 anos, com média de experiência na empresa varejista de 4,57 anos.
Tabela 1. Descrição da amostra
Características Vendedores (n = 138)
Gênero
Masculino 43,48%
Feminino 56,52%
Educação
Ensino fundamental 6,52%
Ensino médio 27,54%
Ensino superior 36,23%
Pós-graduação (Especialização) 29,71%
Tamanho da empresa (número empregados)
4,56 (3,62) a
Idade (anos) 31,8 (8,9) a
Experiência (anos) 4,57 (3,6) a
Nota: aMédia (Desvio padrão)
A Tabela 2 apresenta os coeficientes de correlação entre os construtos, bem como as medidas descritivas de média e desvio padrão e os índices de validade e confiabilidade das escalas. A validade convergente e discriminante das escalas foi aferida por meio do índice de variância extraída média. Ao analisar os índices de ajustamento do modelo de medidas, os resultados foram satisfatórios, sendo χ²/gl = 1,96, RMSEA = 0,084, GFI= 0,83 e CFI
= 0,81 (Byrne, 2013). Após a análise fatorial confirmatória usada para checar a validade discriminante, utilizamos a regressão múltipla com bootstraping para teste das hipóteses, seguindo proposta de Hayes (2013).
Para examinar as hipóteses, três modelos de regressão foram criados. O modelo 1 mostra os efeitos diretos. No modelo 2, além dos efeitos diretos, as relações moderadas são apresentadas. Por fim, o modelo 3 apresenta o efeito moderador triplo. Os resultados estão descritos na Tabela 3.
Efeitos controlados
As covariáveis foram inseridas com o objetivo de controlar os efeitos estranhos no desempenho do vendedor, similar ao feito
por DeCarlo e Lam (2015) e Rapp et al. (2006). No modelo 1 de regressão, constatou-se uma relação entre o grau de escolaridade e o desempenho do vendedor (β = 0,18; p < 0,05). Pelo fato de a escolaridade ser uma variável categórica, um teste adicional de análise de variância foi realizado. O resultado confirmou a existência de diferença significativa entre as médias (F(3,134) = 3,256, p < 0,05) do grupo de vendedores com especialização e do ensino médio (M
= 7,44 vs. M = 6,73, respectivamente). Esse efeito foi controlado quando observado o coeficiente de determinação (R²).
Efeitos diretos
Na relação direta (modelo 1), verifica-se que a orientação para locomoção (β = 0,20; p < 0,05) impacta o desempenho do vendedor, demonstrando que quanto maior for a orientação para a locomoção do vendedor, maior é o seu desempenho. Diante do apresentado, a hipótese H1 foi confirmada. Nesse sentido, os achados ampliam as descobertas de Pierro et al. (2006) e Kruglanski et al. (2000) da psicologia para o campo das vendas e estendem os achados de Jasmandet al. (2012) e Lee e Ji (2013).
Tabela 2. Medidas descritivas e coeficientes de correlação
Construtos 1 2 3 4 5 6
1. Idade 1
2. Tamanho da empresa
-0,07 1
3. Experiência 0,19* 0,12 1
4. Locomoção -0,04 -0,02 0,05 1
5. Sistema de controle por comportamento
0,14 0,09 0,04 -0,41** 1
6. Desempenho -0,01 0,02 -0,06 0,23** -0,12 1
Média 31,76 13,91 4,57 7,84 7,66 7,11
Desvio padrão 8,88 13,65 3,63 1,35 1,42 1,04
Variância extraída média (AVE)
0,45 0,45 0,53
Alfa de Cronbach
0,83 0,78 0,79
Raiz AVE 0,67 0,67 0,73
Confiabilidade composta (CR)
0,85 0,80 0,81
Nota: **p < 0,01; *p < 0,05

633
ISSN 0034-7590
AUTORES | Juliano Domingues da Silva | Valter da Silva Faia | Valter Afonso Vieira
© RAE | São Paulo | V. 56 | n. 6 | nov-dez 2016 | 626-640
Tabela 3. Coeficientes de regressão sobre o desempenho
Construtos Modelo 1 Modelo 2 Modelo 3
Variáveis de controle Beta (β) t Valor Beta (β) t Valor Beta (β) t Valor
Gênero -0,057 -0,671 -0,045 -0,524 -0,032 -0,387
Idade 0,034 0,399 0,052 0,600 0,037 0,431
Escolaridade 0,184 2,183* 0,207 2,425* 0,194 2,323*
Tamanho da empresa 0,047 0,560 0,022 0,254 -0,001 -0,013
Efeitos de primeira ordem Beta (β) t Valor Beta (β) t Valor Beta (β) t Valor
Locomoção (H1) 0,202 2,212* 0,240 2,528* 0,281 2,969**
Sistema controle comportamento -0,043 -0,465 0,022 0,220 0,050 0,502
Experiência -0,082 -0,959 -0,087 -1,004 -0,206 -2,098*
Moderação dupla Beta (β) t Valor Beta (β) t Valor Beta (β) t Valor
Locomoção × Sistema de controle por comportamento (H2)
-0,180 -1,907* -0,179 -1,933*
Locomoção × Experiência 0,030 0,308 0,135 1,294
Sistema de controle por comportamento × Experiência
-0,060 -0,645 0,077 0,723
Moderação tripla Beta (β) t Valor Beta (β) t Valor Beta (β) t Valor
Locomoção × Sistema de controle por comportamento × Experiência (H3)
-0,263 -2,447*
R² Ajustado 0,098 0,060 0,095
VIFa (maior) 1,259 1,478 1,755
F (Modelo) 2,015 1,870 2,311
Nota: **p < 0,01; *p < 0,05. aFator de inflação e variação. Beta (β) = Coeficientes padronizados de regressão
Efeitos moderados
A hipótese H2 propõe que o sistema de controle por comportamento enfraquece a relação positiva entre orientação para locomoção e desempenho do vendedor. No modelo 2, nota-se uma relação direta e positiva entre locomoção e desempenho (β = 0,24; p < 0,05), mas, quando essa associação é moderada pelo sistema de controle por comportamento, ela passa a ser negativa, reduzindo o desempenho do vendedor (β = -0,18; p < 0,05). Esse resultado é esperado e confirma a hipótese H2.
Acreditamos que esse resultado da moderação seja decorrente de dois mecanismos. Primeiro, o sistema de controle por comportamento tende a ser prejudicial devido ao controle
estrito das ações e ao cerceamento da liberdade rotineira do vendedor sobre qual estratégia usar (Miao & Evans, 2013). Segundo, distintas tarefas burocráticas sugeridas pelo controle de comportamento podem causar desmotivação (Miao & Evans, 2013) e reduzir de desempenho (Onyemah & Anderson, 2009).
O Gráfico 1 representa a moderação da hipótese H2. Utilizando a classificação de Sharma, Durand e Gur-Arie (1981), a moderação neste artigo é do tipo homologizer, pois a moderação
“influencia a força da relação, mas não interage com a preditora e nem com a variável critério” (p. 292). Percebe-se que a relação entre locomoção e desempenho do vendedor é positiva quando o nível de sistema de controle por comportamento é baixo e, contrariamente, quase nula quando ele é alto.
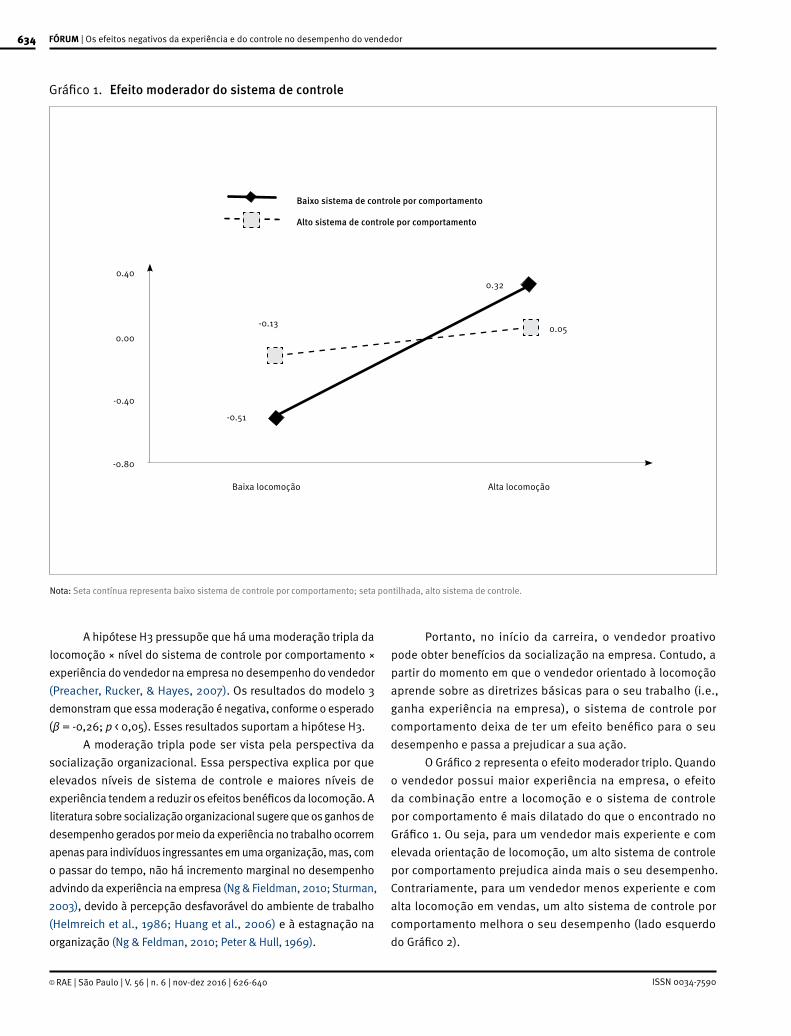
634
ISSN 0034-7590
FÓRUM | Os efeitos negativos da experiência e do controle no desempenho do vendedor
© RAE | São Paulo | V. 56 | n. 6 | nov-dez 2016 | 626-640
Gráfico 1. Efeito moderador do sistema de controle
Baixo sistema de controle por comportamento
Alto sistema de controle por comportamento
Baixa locomoção
0.40
-0.13
-0.51
0.32
0.050.00
-0.40
-0.80
Alta locomoção
Nota: Seta contínua representa baixo sistema de controle por comportamento; seta pontilhada, alto sistema de controle.
A hipótese H3 pressupõe que há uma moderação tripla da locomoção × nível do sistema de controle por comportamento × experiência do vendedor na empresa no desempenho do vendedor (Preacher, Rucker, & Hayes, 2007). Os resultados do modelo 3 demonstram que essa moderação é negativa, conforme o esperado (β = -0,26; p < 0,05). Esses resultados suportam a hipótese H3.
A moderação tripla pode ser vista pela perspectiva da socialização organizacional. Essa perspectiva explica por que elevados níveis de sistema de controle e maiores níveis de experiência tendem a reduzir os efeitos benéficos da locomoção. A literatura sobre socialização organizacional sugere que os ganhos de desempenho gerados por meio da experiência no trabalho ocorrem apenas para indivíduos ingressantes em uma organização, mas, com o passar do tempo, não há incremento marginal no desempenho advindo da experiência na empresa (Ng & Fieldman, 2010; Sturman, 2003), devido à percepção desfavorável do ambiente de trabalho (Helmreich et al., 1986; Huang et al., 2006) e à estagnação na organização (Ng & Feldman, 2010; Peter & Hull, 1969).
Portanto, no início da carreira, o vendedor proativo pode obter benefícios da socialização na empresa. Contudo, a partir do momento em que o vendedor orientado à locomoção aprende sobre as diretrizes básicas para o seu trabalho (i.e., ganha experiência na empresa), o sistema de controle por comportamento deixa de ter um efeito benéfico para o seu desempenho e passa a prejudicar a sua ação.
O Gráfico 2 representa o efeito moderador triplo. Quando o vendedor possui maior experiência na empresa, o efeito da combinação entre a locomoção e o sistema de controle por comportamento é mais dilatado do que o encontrado no Gráfico 1. Ou seja, para um vendedor mais experiente e com elevada orientação de locomoção, um alto sistema de controle por comportamento prejudica ainda mais o seu desempenho. Contrariamente, para um vendedor menos experiente e com alta locomoção em vendas, um alto sistema de controle por comportamento melhora o seu desempenho (lado esquerdo do Gráfico 2).

635
ISSN 0034-7590
AUTORES | Juliano Domingues da Silva | Valter da Silva Faia | Valter Afonso Vieira
© RAE | São Paulo | V. 56 | n. 6 | nov-dez 2016 | 626-640
Gráfico 2. Efeito da combinação entre experiência e sistema de controle
Alto sistema de controle por comportamentoBaixo sistema de controle por comportamento
Baixa locomoção Alta locomoção
Baixa experiência
0.22
0.41 0.45
0.11
-0.21
-0.11
-1.27
-0.18
0.80
0.40
0.00
-0.40
-0.80
-1.20
-1.60
Alta experiência
Baixa locomoção Alta locomoção
Nota: Seta contínua representa baixo sistema de controle por comportamento; seta pontilhada, alto sistema de controle.
De acordo com a estimativa de coeficiente de Johnson-Neyman (Gráfico 3), o efeito positivo da moderação locomoção × sistema de controle por comportamento é positivo até 2,30 anos de experiência dentro da organização (β = 0,01; p > 0,85). A partir desse nível de experiência, o coeficiente da regressão fica cada vez mais negativo, especialmente após o quinto ano (β = -0,10; p < 0,05), quando se torna mais acentuado e significativo, atingindo o máximo com 17 anos de tempo em vendas na empresa (β =
-0,62; p < 0,001).
Gráfico 3. Efeito negativo da experiência em vendas
Experiência
LLCI(b) LLCI(b)Locomocão x Sistema de controle por comportamento
0,400
0,200
0,000
-0,200
-0,400
-0,600
-0,800
-1,000
-1,200
0,5
p > 0.05 p < 0 .05
1,4 2,3 3,1 4,0 4,9 5,0 5,8 6,6 7,5 8,4 9,3 10,1 11,0 11,9 12,8 13,6 14,5 15,4 16,3 17,1
Dese
mpe
nho
Nota: Seta contínua efeito do coeficiente da moderação; setas pontilhadas são limites de confiança superior e inferior.

636
ISSN 0034-7590
FÓRUM | Os efeitos negativos da experiência e do controle no desempenho do vendedor
© RAE | São Paulo | V. 56 | n. 6 | nov-dez 2016 | 626-640
A moderação tripla encontrada entre locomoção do vendedor, sistema de controle e experiência na empresa foi a partir de um modelo de regressão linear múltipla. Uma análise adicional foi realizada para testar uma moderação tripla quadrática no formato de um “U” invertido, conforme modelo sugerido por Dawson (2014). Os resultados quadráticos tendem a ajudar a explicar as relações lineares e são empregados nos estudos de marketing para explicar a lealdade (Agustin & Singh, 2005) e a orientação para o mercado (Cadogan, Kuivalainen, & Sundqvist, 2009).
Os achados apresentados na Tabela 4 destacam que o quadrado da experiência na organização apresentou coeficiente de regressão negativo e significativo (β = -0,39; p < 0,01). O sinal negativo representa uma relação curvilinear no formato de um “U” invertido, portanto a experiência apresenta um impacto positivo até um determinado valor em que a relação se torna negativa. A moderação tripla locomoção ×sistema de controle ×experiência não apresentou coeficiente significativo de regressão (β = -0,10; p = NS).
Tabela 4. Coeficientes de regressão sobre o desempenho no modelo de moderação tripla quadrática
ConstrutosDesempenho
B SE Beta (β) t Valor
Efeitos de primeira ordem
Locomoção 0,313 0,112 0,313 2,790**
Sistema controle comportamento -0,020 0,125 -0,020 -0,157
Experiência 0,059 0,133 0,059 0,445
Experiência² -0,202 0,070 -0,391 -2,886**
Moderações duplas
Locomoção x Sistema de controle por comportamento -0,132 0,115 -0,122 -1,150
Locomoção × Experiência 0,166 0,141 0,162 1,177
Sistema de controle por comportamento x Experiência -0,011 0,149 -0,011 -0,077
Locomoção × Experiência² -0,003 0,086 -0,006 -0,033
Sistema de controle por comportamento x Experiência² 0,085 0,090 0,173 0,944
Moderações triplas
Locomoção × Sistema de controle por comportamento x Experiência
-0,275 0,158 -0,272 -1,742†
Locomoção × Sistema de controle por comportamento x Experiência²
-0,046 0,083 -0,101 -0,557
R² Ajustado 0,127
VIF (maior) 5,289
Fa (Modelo) 2,815**
Nota: **p < 0,01; *p < 0,05; †p < 0,10. a Fator de inflação e variação. B = Coeficientes não padronizados de regressão; SE = Erro padrão; Beta (β) = Coeficientes padronizados de regressão.
A representação da moderação no Gráfico 4 apresenta achados coerentes com os encontrados na regressão linear. As parábolas de cor preta indicam uma situação de alta orientação para locomoção. Percebe-se que a curvatura da parábola em que o sistema de controle é baixo é mais forte e ascendente, quando comparada com a parábola quando o sistema de controle é alto, descendente. As parábolas de cor cinza referem-se a uma baixa orientação para locomoção, onde a curvatura é mais ascendente quando o sistema de controle é alto e mais descendente quando o sistema de controle é baixo.

637
ISSN 0034-7590
AUTORES | Juliano Domingues da Silva | Valter da Silva Faia | Valter Afonso Vieira
© RAE | São Paulo | V. 56 | n. 6 | nov-dez 2016 | 626-640
Gráfico 4. Efeito curvilinear da experiência sobre o desempenho com vendas
Alta locomoção, Alto controleBaixa locomoção, Alto controle
Alta locomoção, Baixo controleBaixa locomoção, Baixo controle
Baixa experiência
Dese
mpe
nho
-2
-1.5
-1
-0.5
0
0.5
1
Alta experiência
CONCLUSÕESAs conclusões foram subdivididas em quatro tópicos. São apresentadas as discussões teóricas, discussões gerenciais, limitações da pesquisa e sugestões de pesquisas futuras.
Discussões teóricas
Em primeiro lugar, tomando por base a teoria do modo regulatório (Kruglanski et al., 2000), demonstramos que orientação para locomoção é uma característica importante para o vendedor em termos de elevar o seu desempenho. Pesquisas anteriores mostraram que essa relação se aplica aos sujeitos na execução de tarefas (Chernikova et al., 2016) e aos estudantes em provas (Destro, Chernikova, Pierro, Kruglanski, & Higgins, 2015). Neste trabalho, encontramos que a orientação para locomoção remete a um perfil de iniciativa diante de situações de vendas, aumentando o desempenho do vendedor. Apresentando uma hipótese e os argumentos da psicologia (Pierro et al., 2006, 2013) para essa associação, ampliamos os achados de Jasmand et al. (2012) de venda cruzada para desempenho do vendedor.
Em segundo lugar, utilizando o sistema de controle em vendas (Anderson & Oliver, 1987; Oliver & Anderson, 1994), ampliamos a literatura que mostra efeitos positivos do controle de modo direto (Ahearne et al. 2010; Crosno & Brown, 2014; Miao & Evans, 2013; Samaraweera & Gelb, 2014), indicando que o sistema de controle por comportamento, ao moderar a locomoção, gera um efeito negativo no desempenho do vendedor.
Esse resultado é contraintuitivo e demonstra que o vendedor com perfil de locomoção, por ser orientado à ação, pode ter dificuldade para agir se for submetido a um controle normativo de suas atividades.
Em terceiro lugar, tomando por base a literatura sobre socialização organizacional (Sturman, 2003), inserimos a experiência na discussão do desempenho do vendedor orientado à locomoção e do uso do sistema de controle por comportamento. No processo de socialização, vendedores proativos, mas com pouca experiência na organização, podem necessitar do sistema de controle por comportamento para compreender claramente as diretrizes, as atividades e os caminhos específicos para realizar suas atividades (Anderson & Oliver, 1987; Miao & Evans, 2013), aumentando o desempenho. No entanto, com o processo de socialização consolidado, o vendedor pode não encontrar necessidade nos padrões normativos do sistema de controle por comportamento, pois esse elemento tende a restringir sua ação. Desse modo, o desempenho do vendedor orientado à locomoção tende a ser mais alto quando for submetido a um alto nível de sistema de controle por comportamento e for inexperiente.
Discussões gerenciais
Algumas implicações gerenciais para gestão de vendas são sugeridas. Gerentes podem aprimorar os processos de recrutamento e seleção ao procurar perfil de candidatos orientados à ação, para proatividade e para a prospecção de

638
ISSN 0034-7590
FÓRUM | Os efeitos negativos da experiência e do controle no desempenho do vendedor
© RAE | São Paulo | V. 56 | n. 6 | nov-dez 2016 | 626-640
clientes. Em dinâmicas e entrevistas, os gerentes podem utilizar como critério de seleção a orientação para locomoção, pois tal perfil tende a gerar maiores níveis de desempenho do vendedor (Silva et al., 2015) e de vendas cruzadas (Vieira et al., 2013).
Outro ponto relevante é que mecanismos de controle de comportamento rígidos podem inibir a locomoção da equipe de vendas. Desse modo, gestores devem encontrar formas mais flexíveis de controlar seus subordinados. Por exemplo, proporcionar oportunidades para que os vendedores expressem suas opiniões, refaçam trabalhos/vendas e participem da criação de estratégias para as ações de vendas podem ser formas mais flexíveis. Miao e Evans (2013) sustentam essa tese e demonstram que vendedores estão mais dispostos a planejar suas tarefas e a aplicar mais esforço em suas ações quando os gestores propiciam mais liberdade para eles. Com o passar do tempo, os gestores devem flexibilizar as normas, inserindo outros mecanismos de controle, como sistema de controle por resultados (Onyemah & Anderson, 2009) para alcançar resultados e metas estratégicas. O sistema de controle por resultado cria um ambiente no qual os vendedores passam a se sentir mais livres para exercerem suas tarefas, menos inibidos e monitorados e, como já internalizaram as políticas, valores e regras da empresa, precisam se preocupar menos com alinhamento de objetivos organizacionais. Esse sistema de controle por resultado pode, então, tender a elevar as vendas.
Vale destacar que as políticas de controle por compor-tamento dos vendedores não devem ser realizadas de maneira contínua para toda a equipe de vendas. Gestores podem imple-mentar mecanismos de controles normativos e rígidos apenas para vendedores em início da carreira, quando ainda não pos-suem tempo de casa, conhecimento das políticas ou dos valores organizacionais.
Limitações da pesquisa
Como toda pesquisa científica, há limitações aqui que merecem cautela. Por exemplo, o desempenho subjetivo em vendas pode contribuir para vieses nos resultados auferidos. A opção por explorar essa métrica de maneira subjetiva dá-se pela dificuldade de obter dados objetivos das organizações. Portanto, pode haver uma limitação do vendedor no que tange a ele se auto avaliar. Em outro ponto, a amostra da pesquisa limitou-se ao comércio varejista de vestuário, calçados e móveis. Nesse sentido, deve-se ter parcimônia quanto à generalização dos resultados para os segmentos de serviços e indústria. Por exemplo, um representante comercial não é necessariamente controlado por um sistema de controle, uma vez que tem a própria empresa e segue suas metas e objetivos. Por fim, a pesquisa focou apenas os
efeitos da dimensão de sistema de controle por comportamento. A literatura apresenta o sistema de controle constituído também por outras dimensões, como controle por atividade, capacidade e resultado (Anderson & Oliver, 1987; Miao & Evans, 2013).
Sugestões para estudos futuros
Futuras pesquisas podem ampliar a análise do modelo proposto nesta pesquisa de diversos modos. Inicialmente, Miao e Evans (2013) definem que sistema de controle é composto por controle por atividade e por capacidade, os quais podem apresentar efeitos distintos no comportamento do vendedor. Desse modo, os efeitos negativos do sistema de controle por comportamento podem ser mais detalhados em estudos futuros, comparando com as dimensões de controle por atividade e por capacidade.
Ademais, o controle por resultado, por pautar-se em medidas objetivas e de mais simples avaliação do desempenho (Anderson & Oliver, 1987), pode gerar um efeito oposto ao controle por comportamento no que tange unicamente a locomoção. Especificamente, pesquisas futuras podem explorar os efeitos positivos do sistema de controle por resultado na relação entre locomoção e desempenho do vendedor.
Estudos futuros podem examinar a experiência com vendas no geral, pois o conhecimento e aprendizado acumulados ao longo da vida são um fator fundamental para o desempenho do vendedor (Quiñones et al., 1995). Nesse sentido, investigações podem examinar como os efeitos curvilineares do tempo podem moderar o sistema de controle. O ponto de partida seria o trabalho de Steffens, Shemla, Wegge, e Diestel (2014), mas com a sofisticação da moderação.
NOTA DE AGRADECIMENTOOs autores são gratos à observação dos revisores para um possível efeito em “U” invertido.
REFERÊNCIAS
Agustin, C., & Singh, J. (2005). Curvilinear effects of consumer loyalty determinants in relational exchanges. Journal of Marketing Research, 42(1), 96-108. doi:10.1509/jmkr.42.1.96.56961
Ahearne, M., Rapp, A., Hughes, D. E., & Jindal, R. (2010). Managing sales force product perceptions and control systems in the success of new product introductions. Journal of Marketing Research, 47(4), 764-776. doi: 10.1509/jmkr.47.4.764
Aiken, L. S., & West, S. G. (1991). Multiple regression: Testing and inter-preting interactions. New York, EUA: Sage.

639
ISSN 0034-7590
AUTORES | Juliano Domingues da Silva | Valter da Silva Faia | Valter Afonso Vieira
© RAE | São Paulo | V. 56 | n. 6 | nov-dez 2016 | 626-640
Anderson, E., & Oliver, R. L (1987). Perspectives on behavior-based ver-sus outcome-based salesforce control systems. Journal of Marketing, 51(10), 76-88. doi:10.2307/1251249
Avnet, T., & Higgins, E. T. (2003). Locomotion, assessment, and reg-ulatory fit: Value transfer from “how” to “what”. Journal of Exper-imental Social Psychology, 39(5), 525-530. doi:10.1016/S0022-1031(03)00027-1
Baldauf, A., & Cravens, D. W. (2000). The effect of moderators on the salesperson behavior performance and salesperson out-come performance and sales organization effectiveness relation-ships. European Journal of Marketing, 36(11/12), 1367-1388. doi: 10.1108/03090560210445227
Benjamin, L., & Flynn, F. J. (2006). Leadership style and regulatory mode: Value from fit? Organizational Behavior and Human Decision Processes, 100(2), 216-230. doi:10.1016/j.obhdp.2006.01.008
Byrne, B. M. (2013). Structural equation modeling with AMOS: Basic concepts, applications, and programming (2nd ed.). New York, EUA: Routledge.
Cadogan, J. W., Kuivalainen, O., & Sundqvist, S. (2009). Export mar-ket-oriented behavior and export performance: Quadratic and mod-erating effects under differing degrees of market dynamism and inter-nationalization. Journal of International Marketing, 17(4), 71-89.
Chatman, J. A. (1991). Matching people and organizations: Selection and socialization in public accounting firms. Administrative Science Quarterly, 36(3), 459-484. doi:10.2307/2393204
Chernikova, M., Destro, C. L., Mauro, R., Pierro, A., Kruglanski, A. W., & Higgins, E. T. (2016). Different strokes for different folks: Effects of reg-ulatory mode complementarity and task complexity on performance. Personality and Individual Differences, 89, 134-142. doi:10.1016/j.paid.2015.10.011
Cron, W. L., & Slocum, J. W., Jr. (1986). The influence of career stages on salespeople’s job attitudes, work perceptions, and performance. Journal of Marketing Research, 23(2), 119-129. doi:10.2307/3151659
Crosno, J. L., & Brown, J. R. (2014). A meta-analytic review of the effects of organizational control in marketing exchange relationships. Jour-nal of the Academy of Marketing Science, 43(3), 297-314. doi:10.1007/s11747-014-0386-5
Dawson, J. F. (2014). Moderation in management research: What, why, when, and how. Journal of Business and Psychology, 29(1), 1-19. doi:10.1007/s10869-013-9308-7
DeCarlo, T. E., & Lam, S. K. (2015). Identifying effective hunters and farm-ers in the salesforce: A dispositional–situational framework. Journal of the Academy of Marketing Science, 44(4), 415-439. doi:10.1007/s11747-015-0425-x
Destro, C. L., Chernikova, M., Pierro, A., Kruglanski, A. W., & Higgins, E. T. (2015). Practice benefits locomotors: Regulatory mode complemen-tarity and task performance. Social Psychological and Personality Science, 7(4), 358-365. doi:10.1177/1948550615616171.
Field, A. (2013). Discovering statistics using SPSS. New York, EUA: Sage.
Franke, G. R., & Park, J. E. (2006). Salesperson adaptive selling behavior and customer orientation: A meta-analysis. Journal of Marketing Re-search, 43(4), 693-702. doi:10.1509/jmkr.43.4.693
Giacomantonio, M., Mannetti, L., & Pierro, A. (2013). Locomoting toward well-being or getting entangled in a material world: Regulatory modes and affective well-being. Journal of Economic Psychology,38(2013), 80-89. doi:10.1016/j.joep.2012.07.003
Guenzi, P., Baldauf, A., & Panagopoulos, N. G. (2014). The influence of formal and informal sales controls on customer-directed selling be-haviors and sales unit effectiveness. Industrial Marketing Manage-ment, 43(5), 786-800. doi:10.1016/j.indmarman.2014.04.014
Hayes, A. F. (2013). Introduction to mediation, moderation, and con-ditional process analysis: A regression-based approach. New York, EUA: Guilford Press.
Helmreich, R. L., Sawin, L. L., & Carsrud, A. L. (1986). The honeymoon effect in job performance: Temporal increases in the predictive power of achievement motivation. Journal of Applied Psychology, 71(2), 185-188. doi:10.1037/0021-9010.71.2.185
Higgins, E. T. (2000). Making a good decision: Value from fit. American Psychologist, 55(11), 1217-1230. doi:10.1037/0003-066X.55.11.1217
Huang, X., Shi, K., Zhang, Z., & Cheung, Y. L. (2006). The impact of par-ticipative leadership behavior on psychological empowerment and organizational commitment in Chinese state-owned enterprises: The moderating role of organizational tenure. Asia Pacific Journal of Man-agement, 23(3), 345-367. doi:10.1007/s10490-006-9006-3
Jasmand, C., Blazevic, V., & Ruyter, K. de. (2012). Generating sales while providing service: A study of customer service representatives’ am-bidextrous behavior. Journal of Marketing, 76(1), 20-37. doi:10.1509/jm.10.0448
Johnson, P. D., Shull, A., & Wallace, J. C. (2011). Regulatory focus as a mediator in goal orientation and performance relationships. Journal of Organizational Behavior, 32(5), 751-766. doi:10.1002/job.701
Kim, C., & Takashima, K. (2014). The impact of outcome-based control for retail buyers on organizational performance. Australasian Market-ing Journal, 22(2), 76-83. doi: 10.1016/j.ausmj.2014.04.002
Kruglanski, A. W., Pierro, A., & Higgins, E. T. (2015). Experience of time by people on the go: A theory of the locomotion-temporality inter-face. Personality and Social Psychology Review, 20(2), 100-117. doi:1088868315581120.
Kruglanski, A. W., Thompson, E. P., Higgins, E. T., Atash, M., Pierro, A., Shah, J. Y., & Spiegel, S. (2000). To “do the right thing” or to “just do it”: Locomotion and assessment as distinct self-regulatory imper-atives. Journal of Personality and Social Psychology, 79(5), 793-815. doi:10.1037/0022-3514.79.5.793
Lee, I. G., & Ji, S. G. (2013). A study on the role of locomotion orientation as an antecedent of salespeople’ selling behavior. Asia Marketing Journal, 15(2), 175-194.
Mallin, M. L., & Pullins, E. B. (2009). The moderating effect of control systems on the relationship between commission and salesperson intrinsic motivation in a customer oriented environment. Industri-al Marketing Management, 38(7), 769-777. doi:10.1016/j.indmar-man.2008.03.004
Miao, C. F., & Evans, K. R. (2012). Effects of formal sales control systems: A combinatory perspective. International Journal of Research in Mar-keting, 29(2), 181-191. doi:10.1016/j.ijresmar.2011.09.002
Miao, C. F., & Evans, K. R. (2013). The interactive effects of sales con-trol systems on salesperson performance: A job demands-resources perspective. Journal of the Academy Marketing Science, 41(1), 73-90. doi: 10.1080/02642069.2014.942653
Miao, C. F., & Evans, K. R. (2014). Motivating industrial salesforce with sales control systems: An interactive perspective. Journal of Business Research, 67(6), 1233-1242. doi:10.1016/j.jbusres.2013.04.007
Miao, C. F., Evans, K. R., & Zou S. (2007). The role of salesperson moti-vation in sales control systems: Intrinsic and extrinsic motivation re-visited. Journal of Business Research, 60(5), 417-425. doi: 10.1016/j.jbusres.2006.12.005

640
ISSN 0034-7590
FÓRUM | Os efeitos negativos da experiência e do controle no desempenho do vendedor
© RAE | São Paulo | V. 56 | n. 6 | nov-dez 2016 | 626-640
Ng, T. W., & Feldman, D. C. (2010). Organizational tenure and job performance. Journal of Management, 36(5), 1220-1250. doi:10.1177/0149206309359809
Oliver, R. L., & Anderson E. (1994). An empirical test of the consequenc-es of behavior – and outcome – based sales control systems. Journal of Marketing, 58(4), 53-67. doi:10.2307/1251916
Onyemah, V., & Anderson, E. (2009). Inconsistencies among the consti-tutive elements of a sales force control system: Test of a configuration theory-based performance prediction. Journal of Personal Selling & Sales Management, 29(1), 9-24. doi:10.2753/PSS0885-3134290101
Peter, L. J., & Hull, R. (1969). The Peter principle. London, UK: Souvenir Press.
Piercy, N. F., Cravens, D. W., Lane, N., & Vorhies, D. W. (2006). Driving or-ganizational citizenship behaviors and salesperson in-role behavior performance: The role of management control and perceived organi-zational support. Journal of the Academy of Marketing Science, 34(2), 244-262. doi:10.1177/0092070305280532
Pierro, A., Giacomantonio, M., Pica, G., Giannini, A. M., Kruglanski, A. W., & Higgins, E. T. (2013). Persuading drivers to refrain from speed-ing: Effects of message sidedness and regulatory fit. Accident Analy-sis & Prevention, 50(2013), 917-925. doi:10.1016/j.aap.2012.07.014
Pierro, A., Kruglanski, A. W., & Higgins, E. T. (2006). Regulatory mode and the joys of doing: Effects of ‘locomotion’ and ‘assessment’ on in-trinsic and extrinsic task‐motivation. European Journal of Personality, 20(5), 355-375. doi:10.1002/per.600
Preacher, K. J., Rucker, D. D., & Hayes, A. F. (2007). Addressing moderated mediation hypotheses: Theory, methods and pre-scriptions. Multivariate Behavioral Research. 42(1), 185-227. doi:10.1080/00273170701341316
Quiñones, M. A., Ford, J. K., & Teachout, M. S. (1995). The relation-ship between work experience and job performance: A conceptual and meta‐analytic review. Personnel Psychology, 48(4), 887-910. doi:10.1111/j.1744-6570.1995.tb01785.x
Rapp, A., Ahearne, M., Mathieum, J., & Schillewaert, N. (2006). The impact of knowledge and empowerment on working smart and working hard: The moderating role of experience. International Jour-nal of Research in Marketing, 23(3), 279-293. doi:10.1016/j.ijres-mar.2006.02.003
Rich, G. A., Bommer, W. H., Mackenzie, S. B., Podsakoff, P. M., & Johnson, J. L. (1999). Apples and apples or apples and oranges? A meta-analy-sis of objective and subjective measures of salesperson performance. Journal of Personal Selling & Sales Management, 19(4), 41-52.
Rodrigues, L. C. A., Coelho, F., & Sousa, C. M. (2015). Control mecha-nisms and goal orientations: Evidence from frontline service employ-ees. European Journal of Marketing, 49(3/4), 350-371. doi:10.1108/EJM-01-2014-0008
Samaraweera, M., & Gelb, B. D. (2014). Formal salesforce controls and revenue production: A meta-analysis. Journal of Personal Sell-ing & Sales Management, 35(1), 23-32. doi:10.1080/08853134.2014.977796
Sharma, S., Durand, R. M., & Gur-Arie, O. (1981). Identification and anal-ysis of moderator variables. Journal of Marketing Research, 18(3), 291-300. doi:10.2307/3150970
Silva, J. D., Vieira, V. A., & Faia, V. S. (2015). Quando o sistema de con-trole enfraquece o desempenho com vendas. REMARK-Revista Bra-sileira de Marketing, 14(1), 1-17. doi:10.5585/remark.v14i1.2816
Sok, K. M., Sok, P., & Luca, L. M. De. (2015). The effect of ‘can do’ and ‘reason to’ motivations on service-sales ambidexterity. Industrial Marketing Management, 55(2016), 144-155. doi:10.1016/j.indmar-man.2015.09.001
Stan, S., Evans, K. R., Arnold, T. J., & McAmis, G. T. (2012). The mod-erating influence of organizational support on the development of salesperson job performance: Can an organization provide too much support? Journal of Personal Selling & Sales Management, 32(4), 405-419. doi:10.2307/23483291
Steffens, N. K., Shemla, M., Wegge, J., & Diestel, S. (2014). Or-ganizational tenure and employee performance: A multilevel analysis. Group & Organization Management, 39(6), 664-690. doi:10.1177/1059601114553512
Sturman, M. C. (2003). Searching for the inverted U-shaped relationship between time and performance: Meta-analyses of the experience/performance, tenure/performance, and age/performance relation-ships. Journal of Management, 29(5), 609-640. doi:10.1016/S0149-2063_03_00028-X
Super, D. E. (1980). A life-span, life-space approach to career de-velopment. Journal of Vocational Behavior, 16(3), 282-298. doi:10.1016/0001-8791(80)90056-1
Verbeke, W., Dietz, B. & Verwaal, E. (2011). Drivers of sales performance: A contemporary meta-analysis. Have salespeople become knowl-edge brokers? Journal of the Academy of Marketing Science, 39(3), 407-428. doi:10.1007/s11747-010-0211-8
Vieira, V. A., Pires, D., & Galeano, R. (2013). Determinantes do desem-penho empresarial e das vendas cruzadas no varejo. RAE-Revista de Administração de Empresas, 53(6), 565-579. doi:10.1590/S0034-759020130605
Vieira, V. A., Silva, J. D., Berbert, S. C., & Faia, V. S. (2015). Impacto do sistema de controle sobre a venda de novos produtos. RAC-Revista de Administração Contemporânea, 19(Edição especial), 221-244. doi: 10.1590/1982-7849rac20151840

641
ISSN 0034-7590 © RAE | São Paulo | V. 56 | n. 6 | nov-dez 2016 | 641-654
MARÍA DEL MAR MIRAS RODRÍ[email protected] at Universidad de Sevilla, Facultad de Ciencias Económicas y Empresariales – Sevilla, Spain
BERNABÉ ESCOBAR PÉREZ [email protected] at Universidad de Sevilla, Facultad de Ciencias Económicas y Empresariales – Sevilla, Spain
ARTICLESSubmitted 04.21.2015. Approved 02.17.2016Evaluated by double blind review process. Scientific Editor: Graziella Maria Comini
DOES THE INSTITUTIONAL ENVIRONMENT AFFECT CSR DISCLOSURE? THE ROLE OF GOVERNANCEHá Influência do ambiente institucional nas práticas de divulgação de RSC? O papel da governança
¿El entorno institucional influye en las prácticas de revelación de información de la RSC? El papel del Gobierno Corporativo
ABSTRACTThe aim of this article is to analyze whether the institutional environment has a direct effect on Corpo-rate Social Responsibility (CSR) reporting practices or if this effect is explained by the influence of the institutional environment on Corporate Governance (CG) mechanisms. To conduct our study, we focused on two countries that reflect different types of institutional environment: relation-based (Brazil) and rule-based (Spain). Based on our results, we can affirm that the institutional environment influences CG mechanisms (Board Size and Reference Shareholder) as well as companies’ CSR disclosure. Additio-nally, the CG mechanisms affected by the institutional environment also help to explain differences in CSR reporting practices. As relation-based societies evolve into rules-based environments, the informa-tion disclosed about CSR becomes more complex due to a strengthening of CG mechanisms.KEYWORDS | Corporate governance, disclosure, corporate social responsibility, institutional environ-ment, ownership structure.
RESUMOO objetivo desta investigação é examinar se o efeito do ambiente institucional sobre as práticas de divulgação de informações de Responsabilidade Social Corporativa (RSC) é direto ou se é devido à influência desse ambiente sobre as características de Governança Corporativa (GC). Neste sentido, são comparados dois ambientes institucionais: o Brasil, porque é centrado nas relações, e a Espa-nha, porque é centrada em normas. A partir dos resultados obtidos, pode-se deduzir que o ambiente institucional influencia características da GC (Tamanho do Conselho de Administração e Acionista de Referência), bem como a divulgação sobre a RSC. Além disso, essas características da GC são influen-ciadas pelo ambiente institucional e, por sua vez, explicam as diferenças encontradas nas práticas de divulgação de informações de RSC. Assim, à medida que as sociedades centradas nas relações evoluem para outras centradas em normas, as informações divulgadas sobre RSC tornam-se mais complexas, devido ao fortalecimento das características da GC.PALAVRAS-CHAVE | Governança corporativa, divulgação de informações, responsabilidade social cor-porativa, cultura nacional, estrutura acionista.
RESUMENEl objetivo es examinar si el efecto que el entorno institucional ejerce sobre la información divulgada sobre la Responsabilidad Social Corporativa (RSC) es directo o si se explica por la influencia que este entorno tiene sobre las características del Gobierno Corporativo. Para ello, se comparan dos entornos institucionales dis-tintos: Brasil (Centrado en las Relaciones) y España (Centrado en las Normas). Considerando los resultados concluimos que el entorno ejerce una influencia sobre los mecanismos del Gobierno Corporativo (Tamaño del Consejo y Accionista de Referencia), y la divulgación de la Responsabilidad Social Corporativa. Además, estas características del Gobierno Corporativo, afectadas por el entorno, son las que a su vez explican estas diferencias encontradas en las prácticas de divulgación de información sobre la Responsabilidad Social Corporativa. En la medida en la que las sociedades Centradas en las Relaciones evolucionen hacia otras Centradas en las Normas, la información divulgada sobre la Responsabilidad Social Corporativa será más compleja debido al fortalecimiento de los mecanismos del Gobierno Corporativo.PALABRAS CLAVE | Gobierno corporativo, divulgación de información, responsabilidad social corpo-rativa, entorno institucional, estructura de propiedad.
RAE-Revista de Administração de Empresas | FGV/EAESP
DOI: http://dx.doi.org/10.1590/S0034-759020160606
642
ISSN 0034-7590
ARTICLES | Does the institutional environment affect CSR disclosure? The role of governance
© RAE | São Paulo | V. 56 | n. 6 | nov-dez 2016 | 641-654
INTRODUCTION
Today, the importance of Corporate Social Responsibility (CSR) in business is undeniable (Lee, 2008) as well as the relevance of CSR communication strategy. Despite the diversity of options available to disclose about CSR (Ihlen, Bartlett, & May, 2011), most companies have chosen to do it by means of a CSR/sustainability report.
The publication of sustainability reports has increased significantly in recent years (KPMG, 2011) even though CSR disclosure is not mandatory in most countries. Studies have pointed a few reasons behind this growth in CSR disclosure, particularly the responsibility of companies towards their stakeholders in the pursuit of legitimacy (Crowther, 2000), the rewards companies expect for their socially/ environmentally friendly behaviors and for decreasing information asymmetries (Bushman, Piotroski, & Smith, 2004), and the various pressures from their environment (Young & Marais, 2012).
According to previous empirical evidence, the majority of these external pressures come from the industry (Sweeney & Coughlan, 2008) and the institutional environment in which they operate (Adams, 2002; Chen & Bouvain, 2009; Golob & Bartlett, 2007; Kolk & Perego, 2010; Michelon, Pilonato, & Ricceri, 2015; Prado, Gallego, & García, 2009), which clearly determines the degree of engagement in CSR disclosure practices.
It is theoretically consistent with Institutional Theory to affirm that organizations adapt their structures and policies to institutional norms (Dimaggio & Powell, 1983) in order to survive in the market. However, research on the effects of the institutional environment can be complex due to the significant difficulty to isolate variables and distinguish those effects from the impact the institutional environment has on other internal-context variables (Adams, 2002).
In this perspective, we should consider that this institutionalization process also affects Corporate Governance (CG) mechanisms (Charkham, 1994; Doidge, Karolyi, & Stulz, 2007; Klapper & Love, 2004; Porta, Lopez-De-Silanes, & Shleifer, 1999). These mechanisms are not limited to the Board of Directors (BD), comprehending also other features of the ownership structure of companies.
The considerations above and the evidence that sustainability disclosure policies emerge from BD (as supported by Agency and Stakeholder Theories – Freeman, 1984; Jensen & Meckling, 1976) motivate us to inquire whether the institutional environment has a direct effect on CSR reporting practices or if this effect is partially explained by the influence that the institutional environment has on companies’ CG characteristics.
Consequently, the aim of this article is to analyze whether the institutional environment has a direct effect on CSR reporting
practices of if this effect is explained by the influence of the institutional environment on CG mechanisms.
According to suggestions by several researchers (Adams, 2002; Young & Marais, 2012) and considering the aim of our study, we focused on a comparison between two countries: Brazil and Spain. This is because these country’s institutional environments are clearly different (Li & Filer, 2007) and because both countries have been considered pioneers or top-ranked in the reporting of CSR information (Gallego, Formigoni, & Antunes, 2014; Grecco, Filho, Segura, García, & Rodríguez, 2013; KPMG, 2013; Sierra, Zorio, & García, 2013). Additionally, according to previous empirical evidence, there are differences concerning CG mechanisms: Brazilian companies’ BDs are weaker and less effective than Spanish ones (Andrés, Azofra, & Lopez, 2005; Black, Carvalho, & Gorga, 2010).
Thus, our sample consists of 125 listed companies from Brazil and Spain with CG and financial data available at the ASSET4 Database (an international database with information about listed companies’ CG and CSR).
In our study, we used measures that reflect the complexity of companies’ CSR reporting. We used an index intended to reflect CSR reporting practices; we considered also the actions taken to increase the credibility and quality of such disclosures (Amran, Lee, & Devi, 2014; Boiral, 2013); the extent to which the disclosed information followed the Global Reporting Initiatives (GRI) guidelines; whether such adequacy was subject to external checking; and, finally, whether the information had been assured. With regard to CG mechanisms, we focused on the ones indicated by the literature as having an influence on CSR reporting practices: Board Size, Board Independence, Board Activity, CSR Committee, and Reference Shareholder.
Considering our results, we can affirm that the institutional environment has a strong influence on the complexity of the CSR reporting practices as well as on two of the CG mechanisms analyzed: Board size and the presence of a Reference Shareholder. Moreover, these two CG characteristics are the ones that significantly affect CSR disclosure. When CG variables are introduced in the analysis, the institutional environment alone no longer has any significant effect on CSR reporting. Therefore, we can conclude that the effect of the institutional environment on CSR reporting practices is mediated by CG mechanisms, particularly Board Size and the existence of a Reference Shareholder.
With regard to the composition of our sample, it is worth highlighting that, in rule-based societies, the information disclosed about CSR presents a higher level of complexity than in relation-based societies.
The present article is organized as follows. In the next two sections, we focus on the theoretical framework adopted, a review of the literature, and the development of our hypotheses. In the following section, we look more closely into the sample and the

643
ISSN 0034-7590
AUTHORS | María del Mar Miras Rodríguez | Bernabé Escobar Pérez
© RAE | São Paulo | V. 56 | n. 6 | nov-dez 2016 | 641-654
variables chosen, as well as the methodologies employed. After that, we present the results of our study and a discussion about our subject. Finally, in the last section, we present our conclusions, the limitations of the study, and mention some of the lines of investigation that remain open.
CSR DISCLOSURE
Communicating CSR has become a priority for companies in order to ensure the satisfaction of stakeholders’ demands. Although there is a wide range of alternatives for how to report about CSR (Ihlen et al., 2011), most companies choose to include CSR-related information in their official written documents since markets, investors and stakeholders usually recognize this way better than other options (Gray, Kouhy, & Lavers, 1995).
Once a company has decided to report about CSR in its documents, the next step is to choose whether it is going to do that in its annual reports or through a more specific document, i.e., the sustainability or CSR report. This document aims to inform stakeholders about the social, environmental and economic impact (Triple Bottom Line approach – Elkington, 1998) of companies’ activities during a given financial year (Rodríguez, Frías, & García, 2014).
In recent years, there has been an increase in the information disclosed about CSR (KPMG, 2013). However, the credibility and quality of CSR reports have been challenged (Boiral, 2013; Amran et al., 2014). Consequently, companies have started to implement some more complex CSR disclosure practices in order to make their reports more credible.
Thus, companies can decide to report according to international standards (GRI guidelines) in order to enable the comparison and harmonization of CSR information between companies (Adams, 2002; Boiral, 2013). Later, these reports can get a specific “application level”, which reflects to what extent each company’s report follows the GRI guidelines. Kolk and Perego (2010), García, Sierra, and Zorio (2013), and Castelo, Delgado, Ferreira, and Pereira (2014), among other scholars, argue that the adoption of the GRI guidelines is an important driver for enhancing the quality of CSR/sustainability reports. Moreover, this application level can be self-reported or externally checked (by a third-party or GRI). In this respect, the external checking of a CSR report’s adequacy to GRI gives more credibility to the report (Fernández, Romero, & Ruiz, 2012; Prado et al., 2009).
Finally, the maximum level of information complexity is provided by the assurance of the CSR report. This is generally perceived as a mechanism to secure CSR reports’ credibility (Fernández, Romero, & Ruiz, 2014; Simnett, Vanstraelen, & Chua, 2009) and quality (García et al., 2013; Perego & Kolk, 2012).
CSR REPORTING, CORPORATE GOVERNANCE MECHANISMS AND INSTITUTIONAL ENVIRONMENTSeveral researchers have inquired about what factors could explain the differences found in CSR disclosure practices. Empirical evidence suggests that, in addition to industry pressures and the institutional environment, other factors that can significantly affect CSR reporting practices are company size, profitability and CG mechanisms.
Firstly, differences in the level of adoption of CSR disclosure practices have been detected between companies depending on their size (Clarkson, Overell, & Chapple, 2011; Fernández et al., 2012). Normally, company size is significantly and positively associated with the level of voluntary disclosure (Belkaoui & Karpik, 1989; Hackston & Milne, 1996). More recently, several researchers have confirmed that a firm’s size can play a relevant role in its CSR disclosure (Michelon & Parbonetti, 2012; Michelon et al., 2015; Rodríguez et al., 2014).
In contrast, the relationship between profitability and voluntary disclosure is not completely clear. However, main disclosure theories, such as Agency and Political Cost theories, argue for a positive correlation (Reverte, 2009). Nevertheless, most of the empirical evidence has not found any significant results on CSR disclosure (Michelon & Parbonetti, 2012; Rodríguez et al., 2014; Said, Zainuddin, & Haron, 2009).
On the other hand, the responsibility for CSR disclosure decisions lies with the BD (Michelon & Parbonetti, 2012; Rodríguez et al., 2014). This is theoretically supported by Agency (Jensen & Meckling, 1976) and Stakeholder (Freeman, 1984) theories. According to these theories, the BD seeks to safeguard the interests of all stakeholders by disclosing information that increases transparency, thus reducing information asymmetry and avoiding opportunistic behaviors.
Based on these arguments, several researches (Amran et al., 2014; Haniffa & Cooke, 2005; Michelon & Parbonetti, 2012; Rodríguez et al., 2014; Said et al., 2009) have tried to identify the CG mechanisms that have an effect on CSR disclosure practices. There are several BD characteristics (BD size, level of activity of the BD, presence of independent directors in the BD), as well as other CG mechanisms (the existence of a CSR Committee in the company and the presence of a Reference Shareholder), that seem to show an effect on sustainability disclosure practices (Amran et al., 2014; Said et al., 2009).
Empirical evidence about the connection between board size and disclosure is not completely clear, although this connection seems to be related with board effectiveness. While several studies argue that smaller boards are more

644
ISSN 0034-7590
ARTICLES | Does the institutional environment affect CSR disclosure? The role of governance
© RAE | São Paulo | V. 56 | n. 6 | nov-dez 2016 | 641-654
effective because having fewer members contributes to decrease communication and coordination problems (Andrés et al., 2005; Jensen, 1993; Lipton & Lorsch, 1992; Yermack, 1996), others advocate the convenience of larger boards as these could manage more effectively the complexity of today’s business environments (Frías, Rodríguez, & García, 2013; Gandía, 2008; Kent & Stewart, 2008; Willekens, Bauwhede, Gaeremynck, & Gucht, 2005). This debate about effectiveness is also extended to the level of activity of BDs. In this respect, some researchers argue that more active boards would be more effective (Lipton & Lorsch, 1992), while others have suggested that an excessive number of meetings implies less effectiveness (Vafeas, 1999).
In both cases (Board size and level of activity), BD effectiveness is closely linked to the information disclosed by companies (García, Rodríguez, & Gallego, 2011). In other words, evidence suggests that more effective boards would disclose more information, which includes more information about CSR.
Another aspect of this governance mechanism that is commonly examined is board independence. The literature has shown board independence to be positively associated with disclosure practices since independent directors are less aligned with the management, and encourage firms to disclose more and increase information quality as an attempt to protect the interests of all stakeholders (Forker, 1992; Michelon & Parbonetti, 2012; among others). Nevertheless, some contributions show a negative relationship (Haniffa & Cooke, 2005; Prado & García, 2010), while others identify a non-significant relationship (Frías et al., 2013; García et al., 2011).
According to Ullman (1985), the establishment of a CSR Committee is an obvious indication of the company’s CSR engagement level. Since one of the functions of this committee is to ensure the quality of the company’s sustainability disclosure, the existence of a CSR Committee can be viewed as a sign of the company’s commitment to stakeholders, in line with the evidence found by Michelon and Parbonetti (2012) and Amran et al. (2014).
The last CG mechanism that the literature points as capable of affecting CSR disclosure is the existence of a Reference Shareholder (someone who has the majority of voting rights, veto power or golden share in a company). Ownership structure is identified as one of the key elements that explain international variations in the CG structure (Hoshi, Kashyap, & Scharfstein, 1990; Porta et al., 1999). The presence of a Reference Shareholder is one of the most relevant characteristics of ownership which will certainly affect the company’s strategic decisions as he/she has enough power to appoint directors to the board (Boyd, 1994). Considering that several characteristics of the BD can affect CSR reporting practices, as discussed earlier, one can see the potential
influence that the existence of a Reference Shareholder would have on CSR disclosure practices.
Additionally, Agency Theory (Ross, 1973) also contribute in this line of thought as some authors argue that shareholders are more in favor of CSR than managers (Miras, Escobar, & Carrasco, 2014) since the former are concerned about long-term repercussions and aware of the negative consequences of not being socially responsible (Graves & Waddock, 1994; Margolis & Walsh, 2003). Therefore, the first hypothesis is as follows:
H1: CG mechanisms have an influence on CSR reporting practices.
Furthermore, many researchers have stated the relevant role that industry plays on CSR disclosure (Fifka, 2013; Kolk & Perego, 2010; Simnett et al., 2009; Sweeney & Coughlan, 2008). In this respect, the main arguments affirm that the nature of activities determines the industry’s attitude to social responsibility along with the need for legitimization in the markets or the need for improving firms’ reputation due to the negative impact of their activities (greenwashing).
Finally, companies are also under another kind of pressure to disclose about CSR, i.e., pressure from their institutional environment (Adams, 2002; Kolk & Perego, 2010; Lattemann, Fetscherin, Alon, Li, & Schneider, 2009). This is theoretically supported by Institutional Theory, which states that organizations are continuously adapting their structures and policies to the institutional norms and cultural context in which they operate (Dimaggio & Powell, 1983; Scott & Meyer, 1994) as an attempt to survive in the markets. Apart from the influence of regulation in each institutional environment, companies will imitate the successful behavior or practices carried out by their peer organizations (Dimaggio & Powell, 1983). This is the argument followed by North (1991) and Williamson (2000) when they try to explain the concept of institutional environment.
The most relevant evidence in the literature that enhances the existence of this relationship was highlighted by Adams (2002): (1) the strong dependence between the issues that are worthy reporting and the institutional environment; (2) the divergences found in companies’ main CSR concerns also depend on the institutional environment; and (3) stakeholders’ demands for firms to be socially responsible vary according to differences in the institutional environment. Considering all these arguments, our second hypothesis affirms that:
H2: CSR disclosure is different depending on the institutional environment in which the company operates.
Nevertheless, Adams (2002) pointed out the complexity of analyzing the institutional environment’s influence since it is

645
ISSN 0034-7590
AUTHORS | María del Mar Miras Rodríguez | Bernabé Escobar Pérez
© RAE | São Paulo | V. 56 | n. 6 | nov-dez 2016 | 641-654
very difficult to isolate the contextual variables and to differ its influence from the indirect effects derived from the influence that the institutional environment has on the other internal context variables.
This brings us to consider whether the effects of the institutional environment on CSR reporting is not direct but could be explained instead by the mediation of CG mechanisms, a mediation that is strongly influenced by the institutional environment (Doidge et al., 2007; Klapper & Love, 2004; Li & Harrison, 2008a, 2008b) and, at the same time, significantly relevant to CSR disclosure practices (Haniffa & Cooke, 2005; Michelon & Parbonetti, 2012).
On the one hand, Charkham (1994) and Porta et al. (1999) remarked that one of the significant effects of the institutional environment on the internal variables of companies is the variation in corporate ownership structures. In this perspective, Klapper and Love (2004) and Doidge et al. (2007) highlighted two country-related characteristics that are determinant in the impact of institutional environment: investor protection and the costs of accessing capital markets. The empirical evidence in this respect (Li & Harrison, 2008a, 2008b) confirms that CG structures are
strongly affected by the institutional environment, particularly Board Size and Board’s Independence. Consequently, our third hypothesis is as follows:
H3: Corporate Governance mechanisms are influenced by the institutional environment in which the company operates.
Considering Adams’s (2002) argument regarding the difficulty to determine whether the effect of the institutional environment on CSR reporting practices is direct or if it is explained by the influence that this environment has on other internal variables – in this case the CG mechanisms – we state our fourth hypothesis:
H4: The influence that the institutional environment has on CSR disclosure is explained by the mediating role of CG mechanisms.
Figure 1 shows the relationships between the three main variables discussed in this theoretical section as well as the theoretical framework which supports them.
Figure 1. Map of the relationships between the three main variables
Nationalculture Institutional
theory
Stakeholders andAgency
TheoriesInstitutional
Theory
CG mechanisms
CSR reportingpractices
METHODOLOGY
This study is predominantly explanatory and uses a quantitative approach. In this section, the study’s sample selection, variables and statistical method are explained.
Country selection and sample
Previous research about CSR disclosure has taken the institutional environment of the company into consideration in different ways. On the one hand, there are some studies that assume this influence by focusing only on one institutional environment (Gallego et al., 2014; Kuo, Yeh, & Yu, 2012; Michelon et al.,
2015; Paul et al., 2006, Prado et al., 2009) or by controlling its effect in multinational samples (Alon, Lattemann, Fetscherin, Li, & Schneider, 2010; Chen & Bouvain, 2009; Fortanier, Kolk, & Pinkse, 2011).
On the other hand, other studies try to determine the impact that different institutional environments have on CSR reporting practices (Adams, 2002; Golob & Bartlett, 2007; Grecco et al., 2013; Tschopp, 2005; Young & Marais, 2012). One of the characteristics of this kind of research is that it is mainly focused on developed countries, although their institutional environments vary according to two classifications: Variety of Capitalism (VOC) (Hall & Solskic, 2001) and the Governance Index Environment (GEI ) (Li & Filer, 2007).

646
ISSN 0034-7590
ARTICLES | Does the institutional environment affect CSR disclosure? The role of governance
© RAE | São Paulo | V. 56 | n. 6 | nov-dez 2016 | 641-654
The latter has allowed expanding the scope of research since it classifies each society either as a Rule-Based or a Relation-Based environment (Li, Park, & Li, 2004). To that end, GEI considers five relevant aspects of each environment: political rights, rule of law, free press, the quality of accounting standards, and general trust levels. In Rule-Based environments, regulation is transparent and efficient, and, consequently, the information reported by companies is credible. However, the control exercised by the government in Relation-Based environments can trigger a general mistrust in the information provided, and companies feel less pressure to disclose about their practices (Lattemann et al., 2009).
Consequently, we are going to test our hypothesis focusing on the comparison between Rule-Based and Relation-Based environments, which are measured by the GEI Index (a positive score means a Rule-Based environment, while a negative one means a Relation-Based society). In order to choose the concrete institutional environments for our investigation, the CSR reporting practices were relevant, as well as the CG mechanisms. Therefore,
we decided to focus on two countries with a high level of CSR reporting and a Code of Good Governance.
This is why our sample consists of Spanish and Brazilian listed companies (according with the GEI index, Brazil is identified as a Relation-Based environment, while Spain belongs to the Rule-Based group).
Both countries have been identified as pioneers in the CSR reporting field in their respective geographic regions. While Brazil has proved a leading country in Latin America in the publication of CSR reports (Gallego et al., 2014), Spain is widely recognized for its companies’ CSR reporting practices (Sierra et al., 2013). Nevertheless, differences are reported in the percentage of CSR report-publishing companies and the level of GRI adoption; the assurance of CSR reports is recognized by KPMG (2013) and Grecco et al. (2013).
Additionally, the Codes of Good Governance in effect are from 2009, in the case of Brazil, and 2006, in Spain. Their main recommendations are summarized in Exhibit 1.
Exhibit 1. Key characteristics of the Codes of Good Governance of Brazil and Spain
Corporate governance characteristics Brazil Spain
board size Between 5 and 11 Between 5 and 15
Independent directors Most should be independent At least more than 33%
Board activityIt is suggested that the frequency of meetings should not exceed one per month
No recommendation
CSR Committee Suggested, although not further elaborated No recommendation
Source: Codes of Good Governance of Spain and Brazil.
Previous research about CG in Brazil (Black et al., 2010) pointed out the need to strengthen the BDs of Brazilian companies since they have boards too small to be effective, and a significant percentage of Brazilian boards has no independent directors at all. This problem is common to most BRICS countries (Estrin & Prevezer, 2011). On the other hand, Andrés et al. (2005) analyzed the characteristics of BDs in OECD countries to get insights about their effectiveness. Spanish BDs are medium-sized, mostly formed by independent directors (75%) and quite active (8.57 meetings per year).
Initially, 128 companies from Brazil and Spain were selected because of two reasons: (1) the information about their CSR disclosure practices was available at Corporate Registers, the GRI website, or, in a few cases, directly at the company’s website (even when there was no formal CSR report); and (2) their CG data were available at the ASSET4 Database. This database is frequently used by academics (Ioannou & Serafeim, 2012)
and investors to build their sustainability reports. It provides a collection of indicators (valued from 0 to 100) organized in four pillars: Social Scores, Environmental Scores, Corporate Governance Scores, and Economic Scores. The financial data were provided by the DataStream database. Because some pieces of information were not available for three companies, we have to remove those companies from our sample.
Once we had our final sample composition (125 companies), we proceeded to analyze their CSR disclosure practices based on their CSR reports, annual reports or integrated reporting. This information about CSR reporting practices refers to the financial year 2012 because it was the last available year for the complete sample (the lag between the year covered and the date of publication is from 1 to 2 years – Boiral, 2013). For the cases in which there was no coincidence between the natural year and the financial year, we used the most recent report available (from 2011-2012 or 2012-2013).
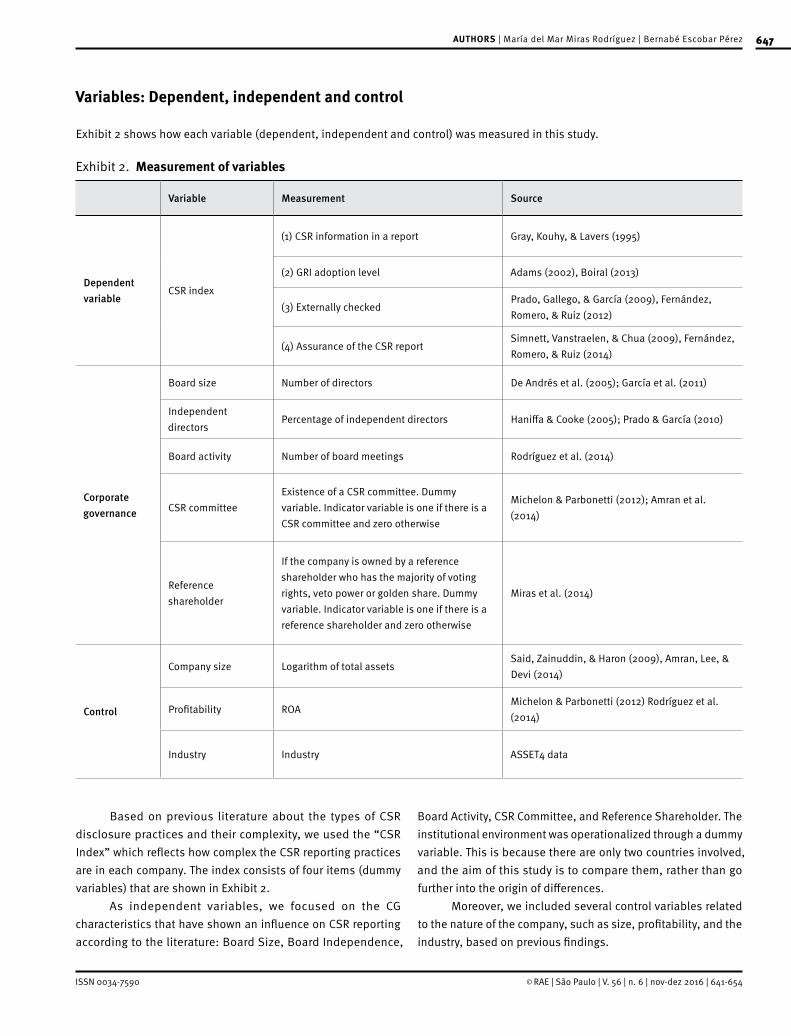
647
ISSN 0034-7590
AUTHORS | María del Mar Miras Rodríguez | Bernabé Escobar Pérez
© RAE | São Paulo | V. 56 | n. 6 | nov-dez 2016 | 641-654
Variables: Dependent, independent and control
Exhibit 2 shows how each variable (dependent, independent and control) was measured in this study.
Exhibit 2. Measurement of variables
Variable Measurement Source
Dependent variable
CSR index
(1) CSR information in a report Gray, Kouhy, & Lavers (1995)
(2) GRI adoption level Adams (2002), Boiral (2013)
(3) Externally checkedPrado, Gallego, & García (2009), Fernández, Romero, & Ruiz (2012)
(4) Assurance of the CSR reportSimnett, Vanstraelen, & Chua (2009), Fernández, Romero, & Ruiz (2014)
Corporate governance
Board size Number of directors De Andrés et al. (2005); García et al. (2011)
Independent directors
Percentage of independent directors Haniffa & Cooke (2005); Prado & García (2010)
Board activity Number of board meetings Rodríguez et al. (2014)
CSR committeeExistence of a CSR committee. Dummy variable. Indicator variable is one if there is a CSR committee and zero otherwise
Michelon & Parbonetti (2012); Amran et al. (2014)
Reference shareholder
If the company is owned by a reference shareholder who has the majority of voting rights, veto power or golden share. Dummy variable. Indicator variable is one if there is a reference shareholder and zero otherwise
Miras et al. (2014)
Control
Company size Logarithm of total assetsSaid, Zainuddin, & Haron (2009), Amran, Lee, & Devi (2014)
Profitability ROAMichelon & Parbonetti (2012) Rodríguez et al. (2014)
Industry Industry ASSET4 data
Based on previous literature about the types of CSR disclosure practices and their complexity, we used the “CSR Index” which reflects how complex the CSR reporting practices are in each company. The index consists of four items (dummy variables) that are shown in Exhibit 2.
As independent variables, we focused on the CG characteristics that have shown an influence on CSR reporting according to the literature: Board Size, Board Independence,
Board Activity, CSR Committee, and Reference Shareholder. The institutional environment was operationalized through a dummy variable. This is because there are only two countries involved, and the aim of this study is to compare them, rather than go further into the origin of differences.
Moreover, we included several control variables related to the nature of the company, such as size, profitability, and the industry, based on previous findings.

648
ISSN 0034-7590
ARTICLES | Does the institutional environment affect CSR disclosure? The role of governance
© RAE | São Paulo | V. 56 | n. 6 | nov-dez 2016 | 641-654
Regressions and models
Considering the characteristics of our dependent variables (categorical, although the differences between them are not quantified), we had to use ordinal regression to get consistent results. Although other, more complex methodologies could be used (such as Structural Equation Models –SEM), we have decided to use the ordinal regression technique since (1) there were not many hypotheses and variables included, and (2) the variables were observable and not composed of several items.
Ordinal regression minimizes the differences of the sum of the squares between the dependent variable and a weighted combination of the independent variables. The estimated coefficients reflect how changes in the factors affect the level of complexity of the CSR reporting practices analyzed.
Therefore, we estimate our models:
1. CSR reporting practices = ß1+ ß2Institutional Environment + ß3 Company Size + ß4 ROA + Industry effect+ ε
2. CSR reporting practices = ß1+ ß2 Board Size + ß3 Board Independence + ß4 Board Activity + ß5 CSR Committee+ ß6 Reference Shareholder +ß7 Company Size + ß8 ROA + Industry effect+ ε
3. CSR reporting practices = ß1+ ß2 Board Size + ß3 Board Independence + ß4 Board Activity + ß5 CSR Committee+ ß6 Reference Shareholder +ß7Institutional Environment+ ß8 Company Size +ß9 ROA + Industry effect+ ε
Goodness of fit was determined by the -2 log of likelihood (measured through a χ² distribution) which controls the representativeness of each of the equations. If the probability value associated was below 0.05, we should reject the null hypothesis, accepting that the final ordinal model is relevant from the econometric point of view (Hair, Black, Babin, & Anderson, 1998).
RESULTS AND DISCUSSION
Descriptive statistics
We present the sample’s distribution of industries by country (Table 1), the sample’s descriptive statistics for each country (Table 2), and the bivariate correlations between all the variables included in the study (Table 4).
Table 1. Distribution of industries by country
Industries Brazil Spain
Aerospace and defense 1.2
Alternative energy 1.2 4.9
Banks 6.0 14.6
Chemicals 1.2
Construction and materials 2.4 7.3
Electricity 14.3 9.8
Electronic and electrical equipment 1.2
Financial services 6.0 4.9
Fixed line telecommunications 2.4 2.4
Food and drug retailers 2.4 2.4
Food producers 7.1 4.9
Forestry and paper 2.4
Gas, water and multi-utilities 3.6 4.9
General industrials 1.2
General retailers 7.1 2.4
Health care equipment and services 2.4
Household goods and home construction 2.4
Industrial engineering 1.2 2.4
Industrial metals and mining 6.0 2.4
Industrial transportation 4.8 2.4
Media 1.2 7.3
Mining 1.2
Mobile telecommunications 1.2
Nonlife insurance 3.6 2.4
Oil and gas producers 3.6 2.4
Oil equipment and services 2.4
Personal goods 2.4
Pharmaceuticals and biotechnology 7.3
Real estate investment and services 7.1 2.4
Software and computer services 1.2 2.4
Support services 4.9
Tobacco 1.2
Travel and leisure 1.2 2.4
Total 100.0 100.0
Source: Based on ASSET4.

649
ISSN 0034-7590
AUTHORS | María del Mar Miras Rodríguez | Bernabé Escobar Pérez
© RAE | São Paulo | V. 56 | n. 6 | nov-dez 2016 | 641-654
As shown in Table 1, the two main industries in both countries are energy (22.7% for Brazil, 22% for Spain) and financial services (13.2% for Brazil, 19.5% for Spain). With regard to the representation of other sectors, Brazilian companies are more dedicated to industries and real estate investments, while the percentage of Spanish companies is higher for construction, media, and pharmacy and biotechnology. Other industries have little presence in both samples.
Table 2. Descriptive statistics for Spain and Brazil
Spain Brazil
N MeanStandard deviation
N MeanStandard deviation
CSR index 41 2.78 1.60 84 2.06 1.65
CSR information disclosure 41 0.82 0.38 84 0.70 0.46
GRI level 41 0.71 0.46 84 0.58 0.49
Externally checked 41 0.63 0.49 84 0.42 0.49
Assurance 41 0.61 0.49 84 0.36 0.48
Board size 41 14.05 3.47 84 9.38 2.53
Independent members (%) 40 30.30 23.09 67 25.66 21.96
BD activity 38 10.79 3.67 39 15.21 13.59
CSR committee 41 0.78 0.42 84 0.69 0.47
Reference shareholder 41 0.27 0.44 84 0.48 0.50
ROA 41 4.72 9.68 84 6.38 7.91
Company size 41 80008608.05 218109043.63 84 71921260.05 199570754.21
Source: Based on ASSET4.
Based on the descriptive statistics shown in Table 2, we can see that Spanish companies have higher scores for all CSR disclosure practices than Brazilian companies. Nevertheless, these data have to be carefully considered and complemented with others analyses (Graph 1), since the distribution could not be uniform.
Graph 1. Accumulated percentage of CSR disclosure practices in Brazil and Spain
0.8
BrazilSpain
0.6
0.4
0.2
00 1 2 3 4
1
Graph 1 presents the differences found between Brazil and Spain concerning CSR disclosure practices. Mean results in Table 1 are distorted since there is a large group of Spanish companies with the maximum score: 52.28% in the case of the CSR Index. Nevertheless, intermediate scores for Spanish companies are almost non-existent. Furthermore, 18.18% of Spanish companies do not carry out any CSR disclosure practice, nor do 29.59% follow the GRI guidelines. With regard to the assurance of CSR reports, results show that this particular CSR disclosure practice is more common in Spanish companies than in Brazilian ones, in line with the results of the survey conducted by KPMG (2013). For Brazilian companies, these percentages are higher (30.12 %). However, the CSR Index for Brazilian companies is better distributed, and not so concentrated on the maximum level.
Based on the comparison of results in Table 2 regarding financial measures, we can affirm that the Financial Performance of Brazilian companies is higher. Additionally, if we consider total assets, Spanish companies are larger than Brazilian ones.
The mean values for both countries’ CG characteristics are also shown in Table 2. Indeed, one must consider that

650
ISSN 0034-7590
ARTICLES | Does the institutional environment affect CSR disclosure? The role of governance
© RAE | São Paulo | V. 56 | n. 6 | nov-dez 2016 | 641-654
each country’s Code of Good Governance gathers several recommendations about CG mechanisms (see Exhibit 1). Although the recommendations in Brazilian Code seem to go further than those in the Spanish Code, this is not reflected in our descriptive statistics. Spanish boards are larger, with a higher percentage of independents directors, and less active than the boards of Brazilian companies. With regard to the existence of a CSR Committee, more Spanish companies have one. As for the presence of a Reference Shareholder, there are more Brazilian than Spanish companies with a Reference Shareholder (48% vs 27%).
Additionally, we conducted a test of mean differences to find out which CG variables were most affected by the institutional environment (Table 3). In this case, Board Size and the existence of a Reference Shareholder are the ones showing significant statistical differences. Taking these results into account, we could accept our third hypothesis. However, it is necessary to note that not all CG mechanisms show significant statistical differences (only Board Size and Reference Shareholder).
Table 3. Test of mean differences for CG characteristics
Corporate Governance characteristics Test of mean differences
Board size 55.38 **
Independent directors 52.99
Board activity 19.33
CSR committee 1.60
Reference shareholder 6.16 *
Significance test **< 0.005, *<0.05Source: Based on ASSET4
As shown in Table 4, there is a significant, positive correlation between CSR reporting practices and three of the independent variables (Board Size, CSR Committee and Reference Shareholder). These results support that CSR disclosure decisions lie with BDs (Adams, 2002; Haniffa & Cooke, 2005; Michelon & Parbonetti, 2012).
Table 4. Bivariate correlations
(1) (2) (3) (4) (5) (6) (7) (8) (9)
(1) CSR index 1
(2) Board size 0.36** 1
(3) Independent members -0.05 -0.05 1
(4) BD activity 0.21 -0.12 -0.03 1
(5) CSR committee 0.55** 0.27** -0.04 0.16 1
(6) Reference shareholder 0.27** 0.00 -0.27** 0.013 0.07 1
(7) Institutional environment 0.19* 0.63** 0.12 -0.23* 0.11 -0.22* 1
(8) Company size 0.30** 0.09 0.02 0.35** 0.18* 0.12 0.01 1
(9) ROA 0.05 -0.16 0.05 -0.09 -0.04 0.15 -0.09 -0.14 1
Significance test ** < 0.01 * < 0.05Source: Based on ASSET4
With regard to CG variables, we could only find two significant correlations: Board size – CSR Committee (positive); and Independent Members – Reference Shareholder (negative). This evidence is logical and consistent with Boyd’s (1994) argument that when there is a Reference Shareholder, several directors will be appointed by him/her.
Multivariate tests
All models in the study are statistically relevant according to their statistics (-2-log-likelihood), and their results are summarized in Tables 7 and 8. Firstly, it is worth highlighting that the institutional environment has a strongly significant influence on the complexity

651
ISSN 0034-7590
AUTHORS | María del Mar Miras Rodríguez | Bernabé Escobar Pérez
© RAE | São Paulo | V. 56 | n. 6 | nov-dez 2016 | 641-654
of CSR disclosure practices when they are studied separately (see Table 5). This was expected, according with theoretical the framework and previous empirical evidence (Adams, 2002; Grecco et al., 2013; Kolk & Perego, 2010; Young & Marais, 2012). Therefore, Hypothesis 2 is accepted.
Table 5. Comparison of results of the ordinal regression
Brazil Spain
Coefficient estimation
Standard deviation
WaldCoefficient estimation
Standard deviation
Wald
Company size 2.07 0.46 19.95** -0.90 0.73 1.53
ROA 0.96 0.05 4.62* 0.47 0.24 3.87*
Industry controlled controlled
−2 log likelihood 157.71 42.51
χ² 97.51** 54.39**
Pseudo R² Cox & Snell 0.69 0.74
Significance test ** < 0.005, *<0.05Source: Based on ASSET4
Once these first analyses were finished, we focused on the ordinal regressions of the models proposed (Table 6). Firstly, we found that including CG variables has a positive impact on the explanation of CSR report complexity (R2 increases). Therefore, we conclude that CG characteristics affect CSR disclosure (i.e., Hypothesis 1 is accepted). These results are in line with previous evidence in this respect.
Table 6. Results of the ordinal regressions
CSR Index
Model 1 Model 2 Model 3
Coefficient estimation
Standard deviation
WaldCoefficient estimation
Standard deviation
WaldCoefficient estimation
Standard deviation
Wald
Board size 0.33 0.16 4.42† 0.11 0.22 0.25
Independent directors
0.02 0.02 1.18 0.01 0.02 0.52
Board activity -0.16 0.11 2.02 -0.17 0.12 2.26
CSR committee 1.52 1.10 1.94 1.79 1.16 2.41
Reference shareholder
1.98 1.06 3.50* 2.52 1.17 4.62*
Institutional environment
-1.86 0.53 12.11** -2.07 1.49 1.91
Company size 1.21 0.23 26.96** 2.03 0.58 12.33** 2.19 0.65 11.35**
ROA 0.09 0.03 6.21* 0.30 0.13 5.62* 0.29 0.13 5.30*
Industry controlled controlled controlled
−2 log likelihood 261.38 91.95 89.85
χ² 103.52** 83.74** 85.84**
Pseudo R² Cox & Snell
0.56 0.70 0.71
Significance test ** < 0.005, *<0.05, †<0.1Source: Based on ASSET4

652
ISSN 0034-7590
ARTICLES | Does the institutional environment affect CSR disclosure? The role of governance
© RAE | São Paulo | V. 56 | n. 6 | nov-dez 2016 | 641-654
However, not all CG mechanisms have a statistical significant effect on the dependent variable. Board Size and the existence of a Reference Shareholder are the CG mechanisms that positively affect CSR disclosure. These results are in line with the scarce literature on this subject matter (Young & Marais, 2012). Previous research has pointed out that the presence of independent directors in boards has a positive effect on the level of CSR disclosure (Lattemann et al., 2009), although we did not confirm this in our findings. This disagreement could be explained by the low percentage of external directors in the companies included in the sample.
The empirical evidence suggests that the CG mechanisms with a strong influence on CSR reporting practices (Board Size and Reference Shareholder) are the ones that show significant differences according to the institutional environment (see Table 3).
When the impacts of CG mechanisms and institutional environment on CSR reporting practices were considered simultaneously, we found that the institutional environment was no longer significant. The goodness of fit of this model is quite close to that of the model which did not consider the institutional environment (only a 1% increase). Only one of the CG variables (the existence of a Reference Shareholder) continued showing a significant influence on CSR disclosure.
At this point, we were able to conclude that the influence of the institutional environment on CSR disclosure is mediated by both CG mechanisms (Board Size and Reference Shareholder). Therefore, Hypothesis 4 is accepted.
With regard to the control variables (size and ROA), our results confirmed that company size and profitability have a positive impact on the complexity of CSR disclosure practices, although in some cases, the significance of that impact decreased when CG variables were included in the models. All regressions were also controlled by industry.
CONCLUSIONS
Considering that the aim of this paper is to analyze whether the effect of the institutional environment on CSR reporting practices is direct or if this effect can be explained by the influence that the institutional environment has on CG mechanisms, we can conclude that CG mechanisms mediate the influence that the institutional environment has on CSR reporting practices. Not all CG characteristics were found to be determinant, i.e., only Board Size and the existence of a Reference Shareholder were found to have a significant impact on the complexity of those reporting practices.
This research reveals that it is strongly relevant to know and study the regulation and recommendations concerning CG-related issues for each country (which are reflected on each country’s Code of Good Governance) as well as their actual implementation in companies since CG features could be decisive for several strategic decisions, particularly policies of voluntary disclosure.
Specifically, our study focused on comparing two institutional environments (Rule-Based and Relation-based). Our results support that CSR disclosure complexity is higher in Rule-Based institutional environments.
The main contribution of this study is our finding that the higher complexity of the CSR information disclosed in Rule-Based societies comes from the effect of these societies’ institutional environment on CG mechanisms. Therefore, as Relation-Based societies evolve into Rules-Based environments, the information disclosed about Corporate Social Responsibility becomes more complex due to a strengthening of Corporate Governance mechanisms.
Our results suggest that further investigations should be conducted including more countries in the sample. Moreover, future research on this topic might consider using other statistical techniques such as SEM.
REFERENCES
Adams, C. A. (2002). Internal organizational factors influencing corpo-rate social and ethical reporting. Accounting, Auditing & Accountabil-ity Journal, 15(2), 223-250. doi:10.1108/09513570210418905
Alon, I., Lattemann, C., Fetscherin, M., Li, S., & Schneider, A. M. (2010). Usage of public corporate communications of social responsibility in Brazil, Russia, India and China (BRIC). International Journal of Emerg-ing Markets, 5(1), 6-22. doi:10.1108/17468801011018248
Amran, A., Lee, S. P., & Devi, S. S. (2014). The influence of governance structure and strategic corporate social responsibility toward sus-tainability reporting quality. Business Strategy and the Environment, 23(4), 217-235. doi:10.1002/bse.1767
Andrés, P. De, Azofra, V., & Lopez, F. (2005). Corporate boards in OECD countries: Size, composition, functioning and effectiveness. Corpo-rate Governance: An International Review, 13(2), 197-210. doi:10.1111/j.1467-8683.2005.00418.x
Belkaoui, A., & Karpik, P. G. (1989). Determinants of the corporate deci-sion to disclose social information. Accounting, Auditing & Account-ability Journal, 2(1), 36-51. doi:10.1108/09513578910132240
Black, B. S., Carvalho, A. G. De, & Gorga, E. (2010). Corporate gover-nance in Brazil. Emerging Markets Review, 11(1), 21-38. doi:10.1016/j.ememar.2009.09.004
Boiral, O. (2013). Sustainability reports as simulacra? A counter-account of A and A+ GRI reports. Accounting, Auditing & Accountability Jour-nal, 26(7), 1036-1071. doi:10.1108/AAAJ-04-2012-00998
Boyd, B. K. (1994). Board control and CEO compensation. Strategic Management Journal, 15, 335-344.

653
ISSN 0034-7590
AUTHORS | María del Mar Miras Rodríguez | Bernabé Escobar Pérez
© RAE | São Paulo | V. 56 | n. 6 | nov-dez 2016 | 641-654
Bushman, R., Piotroski, J. D., & Smith, A. J. (2004). What determines cor-porate transparency? Journal of Accounting Research, 42(2), 207-252. doi:10.1111/j.1475-679x.2004.00136.x
Castelo, M., Delgado, C., Ferreira, S., & Pereira, T. (2014). Factors influ-encing the assurance of sustainability reports in the context of the economic crisis in Portugal. Managerial Auditing Journal, 29(3), 237-252. doi:10.1108/MAJ-07-2013-0905
Charkham, J. (1994). Keeping good company: A study of corporate gov-ernance in five countries. Oxford, United Kingdom: Clarendon Press.
Chen, S., & Bouvain, P. (2009). Is corporate responsibility converging? A comparison of corporate responsibility reporting in the USA, UK, Australia, and Germany. Journal of Business Ethics, 87(1), 299-317. doi:10.1007/s10551-008-9794-0
Clarkson, P. M., Overell, M. B., & Chapple, L. (2011). Environmental reporting and its relation to corporate environmental performance. Abacus, 47(1), 27-60. doi:10.1111/j.1467-6281.2011.00330.x
Crowther, D. (2000). Corporate reporting, stakeholders and the internet: Mapping the new corporate landscape. Urban Study, 37(10), 1837-1848. doi:10.1080/00420980020080451
Dimaggio, P. J., & Powell, W. W. (1983). The iron cage revisited: Institu-tional isomorphism and collective rationality in organizational fields. American Sociological Review, 48(2), 147-160.
Doidge, C., Karolyi, A., & Stulz, R. M. (2007). Why do countries matter so much for corporate governance? Journal of Financial Economics, 86(1), 1-39. doi:10.1016/j.jfineco.2006.09.002
Elkington, J. (1998). Partnerships from cannibals with forks: The triple bottom line of 21st century business. Environmental Quality Manage-ment, 8(1), 37-51. doi:10.1002/tqem.3310080106
Estrin, S., & Prevezer, M. (2011). The role of informal institutions in cor-porate governance: Brazil, Russia, India, and China compared. Asia Pacific Journal of Management, 28(1), 41-67. doi:10.1007/s10490-010-9229-1
Fernández, B., Romero, S., & Ruiz, S. (2012). Measuring quality of sus-tainability reports and assurance statements: Characteristics of the high quality reporting companies. International Journal of Society Systems Science, 4(1), 5-27. doi:10.1504/ijsss.2012.045371
Fernández, B., Romero, S., & Ruiz, S. (2014). Effect of stakeholders’ pressure on transparency of sustainability reports within the GRI framework. Journal of Business Ethics, 122(1), 53-63. doi:10.1007/s10551-013-1748-5
Fifka, M. S. (2013). Corporate responsibility reporting and its determi-nants in comparative perspective–a review of the empirical literature and a meta‐analysis. Business Strategy and the Environment, 22(1), 1-35. doi:10.1002/bse.729
Forker, J. J. (1992). Corporate governance and disclosure quality. Ac-counting and Business Research, 22, 111-124. doi:10.1080/00014788.1992.9729426
Fortanier, F., Kolk, A., & Pinkse, J. (2011). Harmonization in CSR report-ing. Management International Review, 51(5), 665-696. doi:10.1007/s11575-011-0089-9
Freeman, R. E. (1984). Strategic management: A stakeholder approach. Boston, USA: Pitman.
Frías, J. V., Rodríguez, L., & García, I. M. (2013). The role of the board in the dissemination of integrated corporate social reporting. Corporate Social Responsibility and Environmental Management, 20, 219-233. doi:10.1002/csr.1294
Gallego, I., Formigoni, H., & Antunes, M. T. P. (2014). Corporate social responsibility practices at Brazilian firms. RAE-Revista de Adminis-tração de Empresas, 54(1), 12-27. doi:10.1590/s0034-759020140103
Gandía, J. L. (2008). Determinants of interest-based corporate gover-nance disclosure by Spanish listed companies. Online Information Review, 32(6), 791-817. doi:10.1108/14684520810923944
García, I. M., Rodríguez, L., & Gallego, I. (2011). Corporate governance and strategic information on the internet. Accounting, Auditing & Ac-countability Journal, 24(4), 471-501. doi:10.1108/09513571111133063
García, M. A., Sierra, L., & Zorio, A. (2013). Financial crisis impact on sustainability reporting, Management Decision, 51(7), 1528-1542. doi:10.1108/md-03-2013-0102
Golob, U., & Bartlett, J. L. (2007). Communicating about corporate so-cial responsibility: A comparative study of CSR reporting in Austra-lia and Slovenia. Public Relations Review, 33(1), 1-9. doi:10.1016/j.pubrev.2006.11.001
Graves, S. B., & Waddock, S. A. (1994). Institutional owners and cor-porate social performance. Academy of Management Journal, 37(4), 1034-1046. doi:10.2307/256611
Gray, R. H., Kouhy, R., & Lavers, S. (1995). Constructing a research database of social and environmental reporting by UK compa-nies. Accounting, Auditing & Accountability Journal, 8(2), 78-101. doi:10.1108/09513579510086812
Grecco, M. C. P., Filho, M. A. F. M., Segura, L. C., García, I. M., & Ro-dríguez, L. (2013). The voluntary disclosure of sustainable informa-tion: A comparative analysis of Spanish and Brazilian companies. Revista de Contabilidade e Organizações, 7(17), 45-55. 10.11606/rco.v7i17.56690
Hackston, D., & Milne, M. J. (1996). Some determinants of so-cial and environmental disclosures in New Zealand compa-nies. Accounting, Auditing & Accountability Journal, 9(1), 77-108. doi:10.1108/09513579610109987
Hair, J. F., Black, W. C., Babin, B. J., & Anderson, R. E. (1998). Multivariate data analysis. New Jersey, USA: Prentice-Hall.
Hall, P., & Solskice, D. (2001). Varieties of capitalism: The institutional foundations of comparative advantage. Oxford, USA: Oxford Univer-sity Press.
Haniffa, R. M., & Cooke, T. E. (2005). The impact of culture and gover-nance on corporate social reporting. Journal of Accounting and Public Policy, 24(5), 391-430. doi:10.1016/j.jaccpubpol.2005.06.001
Hoshi, T., Kashyap, A., & Scharfstein, D. (1990). The role of banks in reducing the costs of financial distress in Japan. Journal of Financial Economics, 27(1), 67-88. doi:10.1016/0304-405X(90)90021-Q
Ihlen, Ø., Bartlett, J., & May, S. (2011). The handbook of communication and corporate social responsibility. USA: John Wiley & Sons.
Ioannou, I, & Serafeim, G. (2012). What drives corporate social perfor-mance? The role of nation-level institutions. Journal of International Business Studies, 43(9), 834-864. doi:10.1057/jibs.2012.26
Jensen, M. C. (1993). The modern industrial revolution, exit, and the failure of internal control systems. The Journal of Finance, 48(3), 831-880. doi:10.1111/j.1540-6261.1993.tb04022.x
Jensen, M. C., & Meckling, H. W. (1976). Theory of the firm: Managerial behavior, agency costs, and ownership structure. Journal of Financial Economics, 3(4), 305-360. doi:10.1016/0304-405x(76)90026-x
Kent, P., & Stewart, J. (2008). Corporate governance and disclosures on the transition to international financial reporting standards. Accounting and Finance, 48(4), 649-671. doi:10.1111/j.1467-629x.2007.00257.x
Klapper, L. F., & Love, I. (2004). Corporate governance, investor protec-tion, and performance in emerging markets. Journal of Corporate Fi-nance, 10(5), 703-728. doi:10.1016/S0929-1199(03)00046-4

654
ISSN 0034-7590
ARTICLES | Does the institutional environment affect CSR disclosure? The role of governance
© RAE | São Paulo | V. 56 | n. 6 | nov-dez 2016 | 641-654
Kolk, A., & Perego, P. (2010). Determinants of the adoption of sustain-ability assurance statements: An international investigation. Business Strategy and the Environment, 19(3), 182-198. doi:10.1002/bse.643
KPMG. (2011). KPMG international survey of corporate responsibility re-porting 2011. Amsterdam, Netherlands: KPMG International Global Sustainability Services.
KPMG. (2013). KPMG international survey of corporate responsibility re-porting 2013. Amsterdam, Netherlands: KPMG International Global Sustainability Services.
Kuo, L., Yeh, C. C., & Yu, H. C. (2012). Disclosure of corporate social re-sponsibility and environmental management: Evidence from China. Corporate Social Responsibility and Environmental Management, 19(5), 273-287. doi:10.1002/csr.274
Lattemann, C., Fetscherin, M., Alon, I., Li, S., & Schneider, A. M. (2009). CSR communication intensity in Chinese and Indian multinational companies. Corporate Governance: An International Review, 17(4), 426-442. doi:10.1111/j.1467-8683.2009.00758.x
Lee, M. D. P. (2008). A review of the theories of corporate social re-sponsibility: Its evolutionary path and the road ahead. International Journal of Management Reviews, 10(1), 53-73. doi:10.1111/j.1468-2370.2007.00226.x
Li, S., & Filer, L. (2007). The effects of the governance environment on the choice of investment mode and the strategic implications. Jour-nal of World Business, 42(1), 80-98. doi:10.1016/j.jwb.2006.11.006
Li, J., & Harrison, J. R. (2008a). National culture and the composition and leadership structure of boards of directors. Corporate Gover-nance: An International Review, 16(5), 375-385. doi:10.1111/j.1467-8683.2008.00697.x
Li, J., & Harrison, J. R. (2008b). Corporate governance and national cul-ture: A multi-country study. Corporate Governance, 8(5), 607-621. doi:10.1108/14720700810913278
Li, S., Park, S. H., & Li, S. (2004). The great leap forward: The transition from relation-based governance to rule-based governance. Organi-zational Dynamics, 33(1), 63-78. doi:10.1016/j.orgdyn.2003.11.005
Lipton, M., & Lorsch, J. W. (1992). A modest proposal for improved cor-porate governance. Business Lawyer, 48(1), 59-77.
Margolis, J. D., & Walsh, J. P. (2003). Misery loves companies: Rethink-ing social initiatives by business. Administrative Science Quarterly, 48(2), 268-305. doi:10.2307/3556659
Michelon, G., & Parbonetti, A. (2012). The effect of corporate governance on sustainability disclosure. Journal of Management and Governance, 16(3), 477-509. doi:10.1007/s10997-010-9160-3
Michelon, G., Pilonato, S., & Ricceri, F. (2015). CSR reporting practices and the quality of disclosure: An empirical analysis. Critical Perspec-tives on Accounting, 33, 59-78. doi:10.1016/j.cpa.2014.10.003
Miras, M. M., Escobar, B., & Carrasco, A. (2014). Are Spanish listed firms betting on CSR during the crisis? Evidence from the agency problem. Business and Management Research, 3(1), 85-95. doi:10.5430/bmr.v3n1p85
North, D. (1991). Institutions. Journal of Economic Perspectives, 5(1), 97-112.
Paul, K., Cobas, E., Ceron, R., Frithiof, M., Maass, A., Navarro, I., … Deaton, L. Z. (2006). Corporate social reporting in Mexico. Journal of Corporate Citizenship, 22, 67-80. doi:10.9774/gleaf.4700.2006.su.00007
Perego, P., & Kolk, A. (2012). Multinationals’ accountability on sus-tainability: The evolution of third-party assurance of sustainability reports. Journal of Business Ethics, 110(2), 173-190. doi:10.1007/s10551-012-1420-5
Porta, R. La, Lopez-De-Silanes, F., & Shleifer, A. (1999). Corporate ownership around the world. Journal of Finance, 54(2), 471-517. doi:10.1111/0022-1082.00115
Prado, J. M., Gallego, I., & García, I. M. (2009). Stakeholder engagement and corporate social responsibility reporting: The ownership struc-ture effect. Corporate Social Responsibility and Environmental Man-agement, 16(2), 94-107. doi:10.1002/csr.189
Prado, J. M., & García, I. M. (2010). The role of the board of directors in disseminating relevant information on greenhouse gases. Journal of Business Ethics, 97(3), 391-424. doi:10.1007/s10551-010-0515-0
Reverte, C. (2009). Determinants of corporate social responsibility dis-closure ratings by Spanish listed firms. Journal of Business Ethics, 88(2), 351-366.
Rodríguez, L., Frías, J. V., & García, R. (2014). El consejo de administración y las memorias de sostenibilidad. Revista de Contabilidad- Spanish Accounting Review, 17(1), 5-16. doi:10.1016/j.rcsar.2013.02.002
Ross, S. A. (1973). The economic theory of agency: The principal’s prob-lem. The American Economic Review, 63(2), 134-139.
Said, R., Zainuddin, Y. H., & Haron, H. (2009). The relationship between corporate social responsibility disclosure and corporate governance characteristics in Malaysian public listed companies. Social Respon-sibility Journal, 5(2), 212-226. doi:10.1108/17471110910964496
Scott, W. R., & Meyer, J. W. (1994). Institutional environments and orga-nizations: Structural complexity and individualism. Thousand Oaks, CA: Sage.
Sierra, L., Zorio, A., & García, M. A. (2013). Sustainable development and assurance of corporate social responsibility reports published by Ibex‐35 companies. Corporate Social Responsibility and Environ-mental Management, 20(6), 359-370. doi:10.1002/csr.1303
Simnett, R., Vanstraelen, A., & Chua, W. F. (2009). Assurance on sustain-ability reports: An international comparison. The Accounting Review, 84(3), 937-967. doi:10.2308/accr.2009.84.3.937
Sweeney, L., & Coughlan, J. (2008). Do different industries report cor-porate social responsibility differently? An investigation through the lens of stakeholder theory. Journal of Marketing Communications, 14(2), 113-124. doi:10.1080/13527260701856657
Tschopp, D. J. (2005). Corporate social responsibility: A comparison between the United States and the European Union. Corporate So-cial Responsibility and Environmental Management, 12(1), 55-59. doi:10.1002/csr.69
Ullmann, A. A. (1985). Data in search of a theory: A critical examination of the relationships among social performance, social disclosure, and economic performance of US firms. Academy of Management Re-view, 10(3), 540-557. doi:10.5465/amr.1985.4278989
Vafeas, N. (1999). Board meeting frequency and firm performance. Journal of Financial Economics, 53(3), 113-142. doi:10.1016/s0304-405x(99)00018-5
Willekens, M., Bauwhede, H. V., Gaeremynck, A., & Gucht, L. Van de. (2005). Internal and external governance and the voluntary disclo-sure of financial and non-financial performance. XV National BAA Auditing SIG Conference, Aston, United Kingdom.
Williamson, O. E. (2000). The new institutional economics: Taking stock, looking ahead. Journal of Economic Literature, 38(3), 595-613.
Yermack, D. (1996). Higher market valuation of companies with a small board of directors. Journal of Financial Economics, 40(2), 185-211. doi:10.1016/0304-405X(95)00844-5
Young, S., & Marais, M. (2012). A multi-level perspective of CSR report-ing: The implications of national institutions and industry risk char-acteristics. Corporate Governance: An International Review, 20(5), 432-450. doi:10.1111/j.1467-8683.2012.00926.x

655
ISSN 0034-7590 © RAE | São Paulo | V. 56 | n. 6 | nov-dez 2016 | 655-667
NURIA RODRÍGUEZ-LÓPEZ [email protected] at Universidad de Vigo, Facultad de Ciencias Empresariales y Turismo – Ourense, Spain
M. EVA DIZ-COMESAÑA [email protected] at Universidad de Vigo, Facultad de Ciencias Económicas y Empresariales – Vigo, Spain
ARTICLESSubmitted 07.02.2015. Approved 09.07.2016Evaluated by double blind review process. Scientific Editor: Mario Sacomano Neto
THE MEDIATED EFFECT OF FORMAL AND INFORMAL CONTROL ON GOVERNANCE FORMSEfeito mediador do controle formal e informal na forma de governo
Efecto mediador del control formal e informal en la forma de gobierno
ABSTRACTThe present paper employs the perspective of Transaction Cost Economics (TCE) to analyze the relevance of formal and informal controls in selecting the governance form. The evidence supports the influence of frequency, information sharing and relation-specific investments as a cause of control mechanisms, and the effect of these factors on the choice of the governance form, but there is no evidence about the combined interaction between these variables. The present work proposes that there is a mediation effect of formal and informal norms on the relationship between the TCE variables (frequency, infor-mation asymmetry and relation-specific investments) and the governance form. We applied Structural Equation Modelling to companies in the telecommunications sector in Spain. Our results confirm the opposite effect of formal and informal controls on the selection of governance forms and the mediation effect of these mechanisms of control on the selection of the governance form.KEYWORDS | Governance forms, integration, formal control, informal control, transaction characteristics.
RESUMOO presente trabalho emprega o ponto de vista da Economia dos Custos de Transação (ECT) para ana-lisar a relevância dos controles formais e informais na seleção da forma de governança. A evidência apoia a influência da frequência, compartilhamento de informações e investimentos específicos como causa dos mecanismos de controle, e o efeito desses fatores sobre a escolha da forma de governança. Entretanto não há nenhuma evidência sobre as interações entre essas variáveis. Este trabalho propõe que existe um efeito de mediação das normas informais e formais sobre a relação entre as variáveis da ECT (frequência, informações assimétricas e investimentos específicos) e a forma de governança. A Modelagem de Equações Estruturais é aplicada a empresas do setor de telecomunicações da Espanha. Os resultados obtidos confirmam o efeito oposto de controles formais e informais e o efeito de media-ção dos mecanismos de controle sobre a seleção da forma de governança.PALAVRAS-CHAVE | Formas de governança, integração, controle formal, controle informal, caracterís-ticas da transação.
RESUMENEl presente trabajo emplea la perspectiva de la Economía de los Costes de Transacción (ECT) para ana-lizar la relevancia del control formal e informal en la selección de la forma de gobierno. Los estudios existentes ponen de relieve la influencia de la frecuencia, la información compartida y las inversiones específicas como causa de los mecanismos de control, y el efecto de estos factores sobre la elección de la forma de gobierno, pero no hay evidencia sobre la interacción conjunta de estas variables. Este tra-bajo propone que hay un efecto de mediación de las normas formales e informales en la relación entre las variables de la ECT (frecuencia, asimetría de la información e inversiones específicas) y la forma de gobierno. Tras aplicar un Modelo de Ecuaciones Estructurales en el sector de las telecomunicaciones en España, los resultados confirman que los controles formales e informales actúan como media-dores en la relación existente entre las características de las transacciones y la forma de gobierno, ejerciendo además una influencia de sentido opuesto sobre la selección de dicha forma de gobierno.PALABRAS CLAVE | Forma de gobierno, integración, control formal, control informal, características de las transacciones.
RAE-Revista de Administração de Empresas | FGV/EAESP
DOI: http://dx.doi.org/10.1590/S0034-759020160607

656
ISSN 0034-7590
ARTICLES | The mediated effect of formal and informal control on governance forms
© RAE | São Paulo | V. 56 | n. 6 | nov-dez 2016 | 655-667
INTRODUCTION
Strategic decision-making regarding the degree of integration of an activity has been analyzed from a transactional perspective through the link between integration and governance forms. Transaction Cost Economics (TCE), developed by Oliver Williamson (Williamson, 1989, 1991a), focuses on predicting the form of governance structure or the degree of integration by examining transaction characteristics (Dekker, 2004). The main transaction characteristics are the frequency of transactions, the uncertainty derived from asymmetric information, and the relation-specific investments that bind the parties and generate hold-up problems (Dekker, 2004; Eriksson & Laan, 2007; Howell, Meade, & O’Connor, 2010; Langfield-Smith & Smith, 2003). These three variables have positive effects on the degree of integration. However, incorporating social aspects can mitigate or even change this effect. In fact, frequency (Langfield-Smith & Smith, 2003), relation-specific investments (Faems, Janssens, Madhok, & Van Looy, 2008; Goo & Huang, 2008; Langfield-Smith & Smith, 2003), and information sharing (Faems et al., 2008; Goo & Huang, 2008; Langfield-Smith & Smith, 2003) favor trust and informal controls, and these reduce the need for integrated forms.
Although these developments are described as a whole, TCE considers the transaction characteristics and the mechanism of control as different steps in the selection of the governance form (Dekker, 2004; Langfield-Smith & Smith, 2003; Williamson, 1989). Reuver and Bouwman (2012) also highlighted the need to differentiate the economic institution of transaction (market, hierarchy, and hybrid form) and the method of organizing the action (formal and informal controls).
From these developments it can be theorized that frequency, information sharing, and relation-specific investments determine the form of governing an activity. But they do so through the mechanism that organizes the action
– that is, through the combination of formal control (degree of hierarchy) and informal control (degree of formalization), because it is the combination of these features that determines the advisable degree of integration.
The importance of the simultaneous presence of formal and informal control is highlighted in the literature, which states that it can be achieved with the same degree of control through different forms of governance that arise from different combinations of formal and informal mechanisms. See, for example, the formal and informal hierarchy of Diefenbach and Sillince (2011), the shared-governance networks of Cristofoli, Markovic, and Meneguzzo (2014), the vertical network organization of Baudry and Chassagnon (2012), and the contributions of Christiansen and Neuhold (2012), and Calabrò and Mussolino (2013).
However, the majority of the academic literature focuses on justifying only partial relationships between these groups of variables. Thus, a number of studies was conducted on the selection of the governance form by examining transaction characteristics (Crandall, Eisenach, & Litan, 2010; Howell et al., 2010; Neumann, 2010; Waterman & Choi, 2011), the definition of the control structure based on the transaction characteristics (Ding, Dekker, & Groot, 2013; Johansson & Siverbo, 2011; Meer-Kooistra & Vosselman, 2000) and the influence of action-organizing mechanisms on relationship outcomes (Reuver, 2011; Reuver & Bouwman, 2012; Eriksson & Laan, 2007; Langfield-Smith, 2008; Langfield-Smith & Smith, 2003; Şengün & Wasti, 2011).
There are few studies on the interactions between transaction characteristics, action-organizing mechanism and governance forms. These interactions were only partially approached from a relational perspective by Goo and Huang (2008) and through case study by Dekker (2004). Williamson (1991b) argues for the need to study strategizing, considering power arguments and the institutional environment in make-or-buy decisions. Also, Ménard (2004) highlights the influence of the institutional environment on the choice of a specific mode of hybrid form and proposes a typology of hybrid forms and the possible coexistence of different levels of integration; tighter coordination and trust are crucial to deal with the specificities and uncertainty involved in hybrid forms. And Christiansen and Neuhold (2012, p. 12) highlight that the real issue “concerns the identification of the conditions under which informal governance is helpful or even essential to the achievement of better outcomes”
Thus, this paper aims to analyze whether the set of mechanisms used to organize the action have any effects on the influence that the transaction characteristics have over selection of the governance form, or whether there is no such an effect and the degree of integration of the governance form is directly determined by the frequency, information sharing, and relation-specific investment factors (as has been proposed in TCE).
To achieve this purpose, the next sections address the theoretical background of hierarchical integration and governance forms and explain the research design. The following sections present the main results and the discussion of results. Finally, the last one presents conclusions, gaps, and indications for future research.
THEORETICAL BACKGROUND AND HYPOTHESESFrom a transactional perspective, different forms of governance have distinct attributes that cannot be replicated in other structures and make each of them the most efficient form for a

657
ISSN 0034-7590
AUTHORS | Nuria Rodríguez-López | M. Eva Diz-Comesaña
© RAE | São Paulo | V. 56 | n. 6 | nov-dez 2016 | 655-667
specific situation (Williamson, 1996). This perspective argues that the main differences between modes of governance refer to the ability to manage specific aspects. Thus, hierarchies have better attributes of information and adaptation than hybrid forms and markets (Crocker, 1983; Williamson, 1991a).
Information advantages are enhanced by audit superiority (Crocker, 1983) and by greater simplicity when there are codification systems that can increase communicative efficiency and give stability to operations (Rosen, 1996). Adaptive superiority is enhanced by the subordination of individual interests to the maximization of a common interest (Imai & Itami, 1984) while promoting both workforce motivation (Simon, 1991) and the specialization of resources (Demsetz, 1988, 1995; Williamson, 1989, 1993); a firm can develop relation-specific investments without an increase in hold-up problems by fostering its own specific internal morality and originating relationships of institutional and personal trust (Masten, 1984; Ouchi, 1980; Ouchi & Price, 1993).
It has been said that the control derived from hierarchical relationships is the main generator of differences between the forms of governance because it facilitates a more efficient conflict management (Palay, 1984) and increased coordination. Thus, integrated forms are associated with control over decisions (Baker, Gibbons, & Murphy, 2002; Mahoney, 1992; Rosen, 1996). Where describing every right and obligation in detail for every conceivable future situation is too costly, the authority relation arises to avoid conflicts over the use of assets (Foss & Foss, 2002).
While authority is associated with hierarchies, it is not enough to define a hierarchical governance form. The hierarchical principle of authority can also be present in cooperative governance forms near hierarchies such us joint ventures (Rialp & Salas, 2002). Also, contracts can simulate hierarchical relations (Stinchcombe, 1985) and legally bind, enforce, and allow the control of activities (Reuver, 2011).
On the other hand, some authors argue that ownership is an essential variable as a source of rights associated with vertical integration (Hart, 1996). Legal ownership over assets transfers specific and residual rights to the owner. Residual rights are those rights that are not specified in contracts and allow a more efficient management of future situations (Foss & Foss, 2002; Hart, 1996; Rialp & Salas, 2002). Ownership can help a firm to adopt the governance form with the lowest cost (Howell et al., 2010). However, the owner can transfer or delegate the use of assets (Foss & Foss, 2002); thus, while ownership favors control over decisions, ownership and control over decisions can be simultaneously present (hierarchy) or not (cooperation and market).
Therefore, property favors hierarchy but it does not determine hierarchy; also, property rights (understood as the hierarchical
control over decisions and authority) are related with hierarchies but they are not sufficient to define a hierarchical governance form. Property and control can combine in different ways to shape different governance forms (Piesse, Strange, & Toonsi, 2012). The simultaneous presence of property rights and single proprietorship are necessary to achieve the maximum degree of integration associated with a hierarchical governance form.
Hierarchy implies authority and a reallocation of property rights (Rialp & Salas, 2002), i.e., the simultaneous presence of control over decisions and ownership (Coase, 1996; Lyons, 1994; Masten, Meehan, & Snyder, 1989; Perry, 1989); this idea is associated with formal control (Fryxell, Dooley, & Vryza, 2002; Miller, 2011). The degree of hierarchical governance decreases alongside the reduction of property rights and ownership; the intermediate points are hybrid forms, and the market is present when there is an absence of property rights and ownership.
Therefore, Hypotheses 1 and 2 are formulated as follows:
H1: Formal control has a positive relation with the adoption of hierarchical governance forms.
H2: Ownership has a positive influence on property rights.
Although TCE points out the existence of hybrid forms, the informal or social control involved in these forms is not well recognized by TCE theory (Srivastava & Teo, 2012). The dichotomy market-hierarchy based on ownership and property rights is only associated with formal controls (Fryxell et al., 2002; Miller, 2011). However, the informal control based on common values and norms that often exists intangibly (Fryxell et al., 2002; Şengün & Wasti, 2009) is essential in hybrid forms because informal control generates trust and commitment and reduces the need for formalization (Calabrò & Mussolino, 2013; Eriksson & Laan, 2007).
Informal control replaces explicit rules and regulations and promotes trust; trust and informal control are always co-present (Khodyakov, 2007; Şengün & Wasti, 2009). The overuse of formal controls decreases trust (Smets, Oorschot, & Langerak, 2013), and trust reduces the need to use formal control mechanisms (Dekker, 2004; Meer-Kooistra & Vosselman, 2000). The benefits of this negative relationship between trust and formal control have been highlighted by numerous organizational scholars (Şengün & Wasti, 2011).
Reuver (2011) and Reuver and Bouwman (2012) highlighted the relevance of informal control and trust as mechanisms of governance that generate a third and different way of governance at the same level of market and hierarchy. At the same time, they argue that these mechanisms of governance can be used in combination by organizations; they may partially overlap to configure particular ways of governance forms. Langfield-Smith

658
ISSN 0034-7590
ARTICLES | The mediated effect of formal and informal control on governance forms
© RAE | São Paulo | V. 56 | n. 6 | nov-dez 2016 | 655-667
and Smith (2003) affirmed that informal control is present in every organization simultaneously with formal, explicit controls, whether as outcome controls (market) or behavior controls (hierarchy); and Tessier and Otley (2012) propose that social and technical controls are part of all the various control systems of an organization. Also, Inauen, Osterloh, Frey, and Homberg, (2014) state that management control systems can be seen as packages, i.e., they relate to contingency variables depending on the balance between different types of control systems. Formal and informal control are complementary mechanisms (Calabrò & Mussolino, 2013) and firms adapt their control structure to deal with contingency characteristics (Jokipii, 2010).
Moreover, a positive relationship can be established between ownership and informal control and between property rights and informal control. The ownership of specific physical assets can indicate the existence of credible commitment and trust on the part of the owner (Dyer, 1997); a lower use of formal norms in favor of informal ones is then expected. With regard to property rights, a few studies suggest that hierarchical relationships weaken trust, so relationships with a high degree of authority and control originate lack of trust as formal control indicates, in this case, that the party is reluctant to take risks in the relationship (Mayer, Davis, & Schoorman, 1995), and this should reflect in a lower tendency to secure the relationship’s future continuity and in less informal control.
Taking into account the relationship between property rights, ownership, and trust, we propose Hypotheses 3, 4, and 5.
H3: Informal control has a negative influence on the adoption of hierarchical governance forms.
H4: Ownership has a positive influence on informal control.
H5: Property rights have a negative influence on informal control.
With regard to transaction characteristics, TCE highlights the frequency of transactions, the uncertainty derived from asymmetric information, and the relation-specific investments that bind the parties and lead to hold-up problems as the main factors to consider in integrating an activity (Dekker, 2004; Eriksson & Laan, 2007; Howell et al., 2010; Langfield-Smith & Smith, 2003).
Relational contracting takes into account the historical context in which the relationship occurs to explain the use of informal agreements and norms in the relationship (Miller, 2011). Thus, the frequency of relationships reduces the risk of opportunistic behavior (Hill, 1990). After repeated interaction and feedback, good results from previous trustful actions will improve the perceptions of trust and favor successive transactions without excessive formalization (Dyer, 1997; Langfield-Smith & Smith, 2003; Mayer et al., 1995). Prior ties between partners enable the
use of less formal governance arrangements (Dekker, 2008) and, in the long run, these will be more economical (Fryxell et al., 2002).
In turn, Arruñada, Garicano, and Vázquez (2001) connected frequency to asymmetrical contractual clauses that reduce the risk of nonfulfillment. From this transactional perspective, Subramani and Venkatraman (2003) and Baudry and Chassagnon (2012) argued that transaction frequency can generate specificities which would increase the likelihood of integration of the activity. Williamson (1989) held that frequency is important for the recovery of costs with specialized governance structures. If frequency influences the adoption of hierarchical governance forms, then a positive relationship could be expected between frequency and property rights, and between frequency and ownership. Therefore, Hypotheses 6a, 6b and 6c are formulated as follows:
H6a: The frequency of the relationship has a positive influence on informal control.
H6b: The frequency of the relationship has a positive influence on property rights.
H6c: The frequency of the relationship has a positive influence on ownership.
A second factor that reinforces informal control (Goo & Huang, 2008; Langfield-Smith & Smith, 2003) and reduces transaction costs is the exchange of information between contracting parties (Roy & Dugal, 1998; Selnes, 1998). Clauß (2012) referred to this transfer of information as “openness”, which reflects the willingness to share sensitive information. Information transfers, frequent meetings, and communications between contracting partners reduce information asymmetry, the probability of opportunistic behavior, and transaction costs. They indicate goodwill and reduce the need for formal control (Das & Teng, 2001; Dyer, 1997).
On the other hand, from the transactional viewpoint, the longer the wait in information transfers, the better the integration to improve coordination (Caves & Bradburd, 1988). The sharing of information can be best conducted by means a hierarchical governance form due to its better coordinating qualities. Thus, we propose that information sharing will favor ownership and property rights over the activity. Therefore, Hypotheses 7a, 7b, and 7c are formulated as follows:
H7a: Information sharing has a positive influence on informal control.
H7b: Information sharing has a positive influence on property rights.
H7c: Information sharing has a positive influence on ownership.
659
ISSN 0034-7590
AUTHORS | Nuria Rodríguez-López | M. Eva Diz-Comesaña
© RAE | São Paulo | V. 56 | n. 6 | nov-dez 2016 | 655-667
A third significant factor that works as an originator of informal control (Goo & Huang, 2008; Langfield-Smith & Smith, 2003) and as a reducer of transaction costs is relation-specific investment. A legal contract can minimize costs in short-term transactions, but self-obliging safeguards like relation-specific investments are more efficient if the exchange is expected to have a long duration (Dyer, 1997). Although they are assumed to have high initial costs (Sako, 1992), once created, their maintenance costs are relatively low. Successful mutual adaptation creates trust and credible commitments that reduce transaction costs, the need for authority, and the need for more integrated forms of governance (Baudry & Chassagnon, 2012; Dyer, 1997). In relationships based on relation-specific investments, individuals show an increased tendency to adopt initiatives that may not have been explicitly agreed on but increase the value of the transaction. Once a high level of trust has been established, successive specialized investments will reinforce the trust and credibility of the commitment.
From the transactional perspective, traditional TCE connects protection from opportunistic behavior to the adoption of mechanisms of governance. The greater the assets’ specificity, the closer the form of governance should be to integration. These more integrated structures protect the parties from transaction costs and the risks of opportunism (Lyons, 1994; Williamson, 1989, 1991a). Thus, relation-specific investments should lead to more property rights and ownership. Hypotheses 8a, 8b, and 8c are formulated as follows:
H8a: Relation-specific investments have a positive influence on informal control.
H8b: Relation-specific investments have a positive influence on property rights.
H8c: Relation-specific investments have a positive influence on ownership.
Frequency, information sharing, and relation-specific investments influence formal control (property rights and ownership) and informal control (lack of formalization), but their influence on the selection of the governance form are in opposition. Therefore, the total influence on the governance form can vary depending on the combination of property rights, ownership, and informal norms. We propose that these three variables act as mediating variables in the effect that frequency, information sharing, and relation-specific investments have on the selection of the form of governance; informal control has the opposite effect, acting as a substitute for hierarchical governance.
RESEARCH DESIGN AND DEVELOPMENT
Our field study analyzed telephone operators in the telecommuni-cations industry in Spain (Europe). We chose this industry to test our hypotheses for three reasons. It is the service sector activity that has contributed most to investment and GDP in recent years (Spanish National Statistics Institute, www.ine.es), thus becoming the main driver of economic development in the country. More-over, companies in this industry contribute significantly to the welfare of society and the quality of life of citizens, making this a strategic sector in Spain.
Secondly, there are no studies analyzing the determinants of vertical integration in this sector. The majority of the academic literature focuses on legal aspects of the regulations that should be designed to control the behavior of vertically integrated operators (Cave, 2006; Crandall et al., 2010; Howell et al., 2010; Waterman & Choi, 2011). A few authors approach this topic from an economic perspective in analogous activities, like cable television (Waterman & Choi, 2011; Yoo, 2002) or the electric power industry (Howell et al., 2010), and from the perspective of governance forms in the mobile service (Reuver & Bouwman, 2012) and IT outsourcing industries (Goo & Huang, 2008). There is some discussion concerning network neutrality, but a few aspects, like ISP integration into other activities, have received little academic attention (Waterman & Choi, 2011).
Thirdly, because vertical integration is “the more natural and resilient industry structure” (Howell et al., 2010, p. 393), organizations tend to integrate vertically in order to solve failings in contracts derived from higher risk, asymmetric information, market power, and large investments. In Spain, more than 10 years after liberalization, the market is still strongly concentrated. Telefónica owns more than 50% of domestic market share, and the 4 main operators account for 90%; these 4 operators come from initial European monopolists. Internet service providers (ISPs) are potential retail bottlenecks; if the market shares of the largest ISP providers become large enough, they could control consumers’ access to other Internet services (Waterman & Choi, 2011) and discriminate against upstream or downstream competitors (Crandall et al., 2010).
This suggests that high-sunk costs (investments in infrastructure inherent in the sector) (Crandall et al., 2010) continue to influence business dynamics, limiting the access of new entrants and therefore competition. Certain stages of the value chain can only be carried out by dominant operators, and this determines the power structures and levels of integration. Consequently, strategic decisions about the form of governance of each activity are limited, overriding informal control in interfirm relationships.

660
ISSN 0034-7590
ARTICLES | The mediated effect of formal and informal control on governance forms
© RAE | São Paulo | V. 56 | n. 6 | nov-dez 2016 | 655-667
This paper proposes that informal control is at the same level as the traditionally studied characteristics related with integration decisions (property rights and ownership), being an essential element in governance form decisions even in sectors with structural constraints.
Since this industry is highly concentrated according to the available data, we focused our study on Internet access providers with a market share higher than 1%; these firms comprise 93% of users, 80% of total incomes (Comisión del Mercado de las Telecomunicaciones [CMT], 2011), and 90% of market share (Asociación para la Investigación de Medios de Comunicación [AIMC], 2012). To select the target population, we used data from the Spanish National Commission for Telecommunications (CMT, 2011) and the Media Research Association (AIMC, 2012). The information was collected by means of a questionnaire. Our data collection used the “key informant” methodology, which relies on a selected set of members to provide information about organizational characteristics (Goo & Huang, 2008). Respondents must have positions like President, CIO/Vice President, Director/Assistant Vice President, Operations Manager, or Contract Officer.
Most governance studies focus on dyadic buyer-supplier relationships. Reuver and Bouwman (2012), in their analysis of value network, expanded the analysis to consider relationships with organizations that, according to the respondent’s perception, are part of his organization’s value network. However, that procedure seems inadequate to study the degree of integration of governance forms within an industry because a global assessment of the governance forms of the primary activities in that industry’s value chain is then advised.
Cassiman and Sieber (2007), and Valor and Hess (2002) identified the following primary activities in the ISP industry’s
value chain: (1) user interface (user devices, applications and software, access technology, and services rights); (2) retail Internet access (retail-enabling technology, retail transit service, and enabling technology to connect with ISPs); (3) services (enabling technology to supply Internet services, services rights, and basic online services (mail, ftp, news, etc.)), advanced online services (hosting, gaming platforms, e-commerce platforms, etc.), and contents developing; (4) a core network (enabling technology to connect to the backbone, backbone transit service, and enabling technology to interchange); and (5) costumer care, infrastructure works, and hardware manufacturing.
Measuring all relationships separately using a complex instrument of measurement has been considered infeasible given respondents’ workload (Varamaki & Vesalainen, 2003) and the likelihood of nonresponse (Reuver & Bouwman, 2012). Therefore, respondents were asked to answer all the questions for every primary activity in the industry value chain, but the measures were adapted to select observable variables.
Following TCE, the degree of integration of each activity was measured through the existing form of governance to manage that activity. Companies were asked to indicate the method of governance chosen for each activity, from five options: no relationship, buyer relationship, cooperation, group company, and in-house activity.
In the same way, following the transactional background, we selected observable measures according to the descriptions of the characteristics of transactions (Clauß, 2012; Dekker, 2004; Eriksson & Laan, 2007; Howell et al., 2010; Langfield-Smith & Smith, 2003) and according to the meanings of the mechanisms that organize action (Reuver & Bouwman, 2012). The variables were codified through a 1-5 Likert scale (Exhibit 1).
Exhibit 1. Variables
Variable Name Description
Frequency frequency How often interactions take place
Information sharing opennessTo what degree a partner acquaints the other with its real being. How openly information are shared
Relation-specific investments
specificity Rate of specific assets involved in the activity which were created during the relationship
Informal control InformalHow many aspects are specified in writing. What is the reason for, and the content of, the relationship
Property rights prop._rights Level of control that the company has over performing of each activity
Ownership ownership Proportion of ownership the company has on the assets required for each activity

661
ISSN 0034-7590
AUTHORS | Nuria Rodríguez-López | M. Eva Diz-Comesaña
© RAE | São Paulo | V. 56 | n. 6 | nov-dez 2016 | 655-667
The target population consists of 512 cases, which were obtained by multiplying the number of companies obtained from the above mentioned respondents (32 companies) by the number of primary activities in the industry’s value chain (16 tasks). The size of the sample was 325 cases, obtaining a sample error of 3.29% at a level of confidence of 95%. The firms in the sample comprise 72% of users, 55% of total incomes, and 62% of market share (AIMC, 2012)
The hypotheses were contrasted using Structural Equation Modelling (SEM). The SEM approach is recommended by several authors to evaluate effects of mediation (Cheung & Lau, 2007; Iacobucci, Saldanha, & Deng, 2007). We employed path analysis as the variables should not be grouped due to the need for overidentification; Sharma (2002) accepted this approach because it is a less demanding method for known parameters.
To examine the mediated effect of informal norms, property rights, and ownership, we followed the strategy suggested by Holmbeck (1997). Assuming that frequency, information sharing, and relation-specific investments are the predictor variables (A), informal norms, property rights, and ownership are the mediator variables (B), and the governance form is the outcome variable (C),
[…] one would assess the fit of the direct effect (A C) model [and] assess the fit of the A B C model under two conditions: (a) when the A C path is constrained to zero, and (b) when the A C path is not constrained. One then examines whether the second model provides a significant improvement in fit over the first model. […]. If there is a mediational effect, the addition of the A C path to the constrained model should not improve the fit. (Holmbeck, 1997, p. 602)
The maximum verisimilitude estimation method was used because it is coherent, not skewed, efficient, does not vary with scale type, and is appropriate for large sample sizes (Mangin & Mallou, 2003). A bootstrapping technique was used because data did not show a multivariate normal distribution (Hair, Anderson, Tatham, R.L., & Black., 1999). To re-specify the model and obtain a parsimonious model, our criterion was to suppress causal relationships with a critical ratio smaller than 1.96 (p > 0.05).
RESULTS
The following re-specified model was obtained (Figure 1, Table 1):
Figure 1. Re-specified model of telephone operators
0.03
0.01
0.18
-0.19
-0.14
-0.66
0.66
-0.080.27
0.15
0.28
0.44
0.53
0.46
0.16
0.40
0.40
0.12
0.11
prop._rights
informalopenness
specificity
frequency
ownership
governance
form
z1
z2
z3
z4

662
ISSN 0034-7590
ARTICLES | The mediated effect of formal and informal control on governance forms
© RAE | São Paulo | V. 56 | n. 6 | nov-dez 2016 | 655-667
Table 1. Constrained model regression weights and squared multiple correlations
Regression weights
Estimate C.R. Standardized
ownership <- openness 0.490 7.069 0.404
prop._rights <- ownership 0.250 6.881 0.398
prop._rights <- openness 0.095 2.145 0.125
prop._rights <- frequency 0.298 2.817 0.150
prop._rights <- specificity 0.130 3.435 0.182
informal <- prop._rights -0.774 -14.082 -0.657
informal <- openness 0.240 5.895 0.267
informal <- frequency -0.338 -3.284 -0.144
informal <- specificity -0.158 -4.287 -0.188
governance form <- ownership 0.353 11.079 0.460
governance form <- informal -0.085 -1.714 -0.082
governance form <- prop._rights 0.536 8.315 0.439
Explicated variables Squared Multiple Correlations
Explicated variables Squared Multiple Correlations
prop._rights 0.283ownership 0.163
informal 0.526governance form 0.657
Positive variances, high multiple correlations (Table 1), and indexes within advisable ranges (Table 1) confirm the goodness of fit for the re-specified model. Residuals and modification indices do not suggest additional paths between the endogenous variables in the model. The difference between the two model chi-squares confirms the lack of significance of the direct path and, therefore, the mediational effect (Table 2).
Table 2. Models fit summary and difference between the two models’ chi-squares
Recommended values*Models fit summary
Direct effect model Unconstrained model Constrained model
Absolute measuresX2 (p ≥ 0.05) 3.610 (0.307) 1.756 (0.625) 6.473 (0.372)RMSEA £ 0.08 0.028 0.000 0.018Incremental measuresNFI ≥ 0,9 0.894 0.997 0.989RFI ≈ 1 0.789 0.980 0.963IFI ≈ 1 0.980 1.002 0.999TLI ≥ 0,9 0.957 1.015 0.997CFI ≥ 0,95 0.978 1.000 0.999Measure of parsimonyX²/DF < 5 1.203 0.585 1.079Assuming unconstrained model to be correct:
DF CMIN PConstrained model** 3 4.717 0.194
* (Cai, Goh, Souza, & Li, 2013; Hair et al., 1999; Mangin & Mallou, 2003; Xie & Peng, 2011)** p > 0.05 →the constrained model is accepted
The acceptance and rejection of the hypotheses are shown in Exhibit 2.

663
ISSN 0034-7590
AUTHORS | Nuria Rodríguez-López | M. Eva Diz-Comesaña
© RAE | São Paulo | V. 56 | n. 6 | nov-dez 2016 | 655-667
Exhibit 2. Acceptance and rejection of hypotheses
Hypotheses Result
Hypothesis 1: Formal control has a positive relation with the adoption of hierarchical governance forms Accepted
Hypothesis 2: Ownership has a positive influence on property rights Accepted
Hypothesis 3: Informal control has a negative influence on the adoption of hierarchical governance forms Accepted
Hypothesis 4: Ownership has a positive influence on informal control Nonsignificant
Hypothesis 5: Property rights have a negative influence on informal control Accepted
Hypothesis 6a: The frequency of the relationship has a positive influence on informal controlHypothesis 6b: The frequency of the relationship has a positive influence on property rightsHypothesis 6c: The frequency of the relationship has a positive influence on ownership
RejectedAcceptedNonsignificant
Hypothesis 7a: Information sharing has a positive influence on informal controlHypothesis 7b: Information sharing has a positive influence on property rightsHypothesis 7c: Information sharing has a positive influence on ownership
AcceptedAcceptedAccepted
Hypothesis 8a: Relation-specific investments have a positive influence on informal controlHypothesis 8b: Relation-specific investments have a positive influence on property rightsHypothesis 8c: Relation-specific investments have a positive influence on ownership
RejectedAcceptedNonsignificant
DISCUSSIONWith regard to the effects of the action-organizing mechanisms on the degree of hierarchical governance, Hypotheses 1, 2, 3, and 5 are accepted. Therefore, results confirm that each governance form has distinctive properties and that its adoption depends on the combination of formal (ownership and property rights) and informal norms.
So the positive relationship between ownership and the degree of hierarchical governance is accepted (Jeuland & Shugan, 1983). Therefore, ownership appears to impact the adoption of integrated forms of governance, with advantages due to its residual rights of control. Property rights are also considered to be determinants of vertical integration (Baker et al., 2002; Mahoney, 1992; Rosen, 1996); authority-based control over tasks fosters coordination, adaptation, and communication between individuals (Subramani & Venkatraman, 2003) (Hypothesis 1).
Hypothesis 3 is also significant for the analyzed telephone operators. Thus, the evidence seems to accept the negative influence of informal controls on vertical integration (Miller, 2011; Reuver, 2011; Reuver & Bouwman, 2012). These results suggest that this kind of control can reduce the need for integration. Informal norms by themselves seem to deliver some advantages of information and coordination originally attributed to hierarchical forms. The degree of integration is mediated by informal norms that exert an attenuating effect on integration, thus counteracting the effect of the other variables. Therefore, we confirm the relevance of informal mechanisms on the selection of the governance form at the same level as market and hierarchy but
with the opposite effect (Reuver, 2011; Reuver & Bouwman, 2012), and the presence of informal and formal controls simultaneously (Langfield-Smith & Smith, 2003).
With regard to the interrelations between the action-organizing mechanisms (both formal and informal) all hypotheses are accepted (i.e., Hypotheses 2 and 5) except for the relation between ownership and the lack of formalization (Hypothesis 4). The acceptance of Hypothesis 2 lends support to the property literature advocating the allocation of residual rights as a result of asset ownership (Howell et al., 2010). Hypothesis 5 was accepted as well. Thus, the use of hierarchical rules appears to have a negative influence on informal control, as measured through the contractual structure (Mayer, et al., 1995; Meer-Kooistra & Vosselman, 2000; Şengün & Wasti, 2011).
However, Hypothesis 4 is nonsignificant, so the proposition about the positive relationship between ownership and informal norms (Dyer, 1997) cannot be accepted. The telephone operators showed a nonsignificant sign, which agrees with the existence of specific physical assets and their protection through ownership, according to the TCE. This result may be due to operators’ large investment needs and their significant effort to define tasks, procedures, and relationships in a new technological context. Considering the influence of frequency, information sharing, and relation-specific investments, our exogenous variables will allow us to go deeper in this explanation.
With regard to the influence of frequency, information sharing, and relation-specific investments, the majority of the relationships were confirmed, indicating that transaction

664
ISSN 0034-7590
ARTICLES | The mediated effect of formal and informal control on governance forms
© RAE | São Paulo | V. 56 | n. 6 | nov-dez 2016 | 655-667
characteristics affect the choice of governance form through its main action-organizing mechanisms. Results seem to confirm the mediated effect of formal and informal norms on the degree of hierarchical governance. A relationship cannot be established between frequency, information sharing, and relation-specific investments in terms of integration without evaluating the effects of these variables on property rights, ownership, and informal norms because the total effect may vary based on the partial effects from each of these variables.
Concerning the transmission of information, all hypotheses are accepted, so the results suggest that it indirectly influences the degree of hierarchical governance. Thus, the positive influence of information sharing on informal norms (Goo & Huang, 2008; Langfield-Smith & Smith, 2003) is corroborated (Hypothesis 7a); this relationship enhances the negative effect of informal norms on hierarchical governance. However, the acceptance of the positive influence of information sharing on property rights (Hypothesis 7b) and ownership (Hypothesis 7c) based on TCE (Dekker, 2004; Eriksson & Laan, 2007; Howell et al., 2010) enhances the increase in the degree of hierarchical governance. Formal and informal mechanisms of organization then become parallel and opposite.
With regard to the frequency and relation-specific investments, only Hypotheses 6b and 8b were accepted (positive relationship with authority). As we expected, the evidence seems to accept a positive influence on property rights, according to TCE (Dekker, 2004; Eriksson & Laan, 2007; Howell et al., 2010). However, the relationships between these variables and ownership are nonsignificant (Hypotheses 6c and 8c), while with informal norms they are rejected, showing negative signs (Hypotheses 6a and 8a).
Positive influences on property rights combined with the lack of significance of ownership indicate that companies perceive control over all their tasks to be indispensable, but ownership is determined by other factors. This result demonstrates that in the telecommunications industry, which contains high sunk costs (Crandall et al., 2010), the investment of specific assets is not a subject that firms can decide on without constraints. The experimental empirical evidence, i.e., that the sunk cost bias influences the choice of governance structure (Miller, 2011), was supported. So despite the liberalizing regulations in recent years, infrastructure barriers to entry continue to force new entrants towards costly investments.
With regard to informal control, we found negative signs between frequency and informal norms (Hypothesis 6a) and between relation-specific investments and informal norms (Hypothesis 8a), unlike the positive one proposed in the academic literature (Goo & Huang, 2008; Langfield-Smith & Smith, 2003). There is no support for a reduction in the need to protect specific
investments in favor of the use of formal norms (Lyons, 1994; Subramani & Venkatraman, 2003).
These negative relationships with informal norms could be explained by a greater difficulty to decide on the correct moves in the telecommunications industry, which is characterized by new, complex technology, complexity of activities, and specific human resources (Crandall et al., 2010). In this case, it is necessary to use formal action-organizing mechanisms to prevent performance failure. Thus, companies will create technical specifications and procedures to ensure the acquisition and possession of skills related to each activity. In the short term, this reduces trust and formalization, but in the long term, formal governance structures could develop trusting relationships because the creation of mutual transparency creates a less informal governance structure (Dekker, 2004).
The total effect of frequency and relation-specific investments on the degree of hierarchical governance is positive. Reduction of transaction costs by long-established ties because of these two factors (Dyer, 1997) is difficult to support in this sector.
These results confirm the arguments presented earlier on the importance of property rights and hierarchical governance. In an industry like telecommunications, with its structural particularities, an authority-like mechanism to organize actions and its influence on the adoption of hierarchic governance forms are important. Moreover, the ownership of infrastructures in this sector limits free competition and confirms that integrated governance forms are the natural industry structure.
Finally, the result indicates the need to consider simultaneously formal and informal controls to select the governance form. On the one hand, frequency and relation-specific investments highlight the presence of formalization instead of informal norms, reinforcing the idea of preference for hierarchical governance. On the other hand, the importance of informal norms to manage interfirm relationships and balance the effects of formal control on the degree of hierarchy is expressed in the transmission of information. Transparency between agents favors symmetry and reduces complexity, allowing a less formalized relationship and, therefore, a less hierarchical governance form.
CONCLUSIONS, LIMITATIONS, AND INDICATIONS FOR FUTURE RESEARCHThe present analysis supports the proposition that action-organizing mechanisms (i.e., formal and informal controls) mediate the effect of the transaction characteristics (frequency, information sharing, relation-specific investments) on the degree of hierarchical governance. According to TCE, transaction

665
ISSN 0034-7590
AUTHORS | Nuria Rodríguez-López | M. Eva Diz-Comesaña
© RAE | São Paulo | V. 56 | n. 6 | nov-dez 2016 | 655-667
characteristics and action-organizing mechanisms are different steps in the selection of the governance form (Dekker, 2004; Langfield-Smith & Smith, 2003; Williamson, 1989) and the interaction between these sets of variables is what determines the governance form.
Formal and informal mechanisms are simultaneously present. Thus, to select the degree of hierarchical governance, firms use property rights in combination with ownership, but they consider the existence of informal norms with opposite effects to those of property rights and ownership on hierarchical governance. Informal norms can act as a substitute for hierarchy in defining the governance form.
With regard to formal mechanisms, in the telecommunica-tions industry, both the authority-like mechanism that organizes action and the influence of that mechanism on the adoption of hierarchic governance forms are important. Moreover, the costly infrastructures that characterize this industry limits free competition and makes government regulations insufficient; telephone operators are forced to integrate the entire value chain. This fact and the complexity of activities lead these oper-ators to increase contractual formalization instead of attaching greater importance to the generation of trust and the strength-ening of relationships.
As for informal mechanisms, the variable information shows a positive relationship with informal norms and, consequently, a reduction in the degree of hierarchical governance. Therefore, informal control is a factor that has to be taken into account in managing the forms of governance, even in sectors with structural constraints like the telecommunications industry.
Although all results seem significant, the present study shows a first test of these relationships, so further research is required to corroborate our findings. In this respect, one limitation arises from the fact that each variable in the model was measured through observable variables, implying the risk of representation of some of the concepts.
Future research should study these relationships from a dynamic perspective to confirm the findings of this study regarding the effect of past experience in defining the governance form, and to evaluate the period of time necessary to acquire or change past experiences. A formal governance structure can guarantee the stability and continuity of a relationship in the future, i.e., formal control mechanisms can act as generators of trust (Das & Teng, 2001; Dekker, 2004; Vázquez, Iglesias, & Alvarez-González, 2005). Therefore, certain forms of governance can change past experiences and drive the selection of a new combination of action-organizing mechanisms and the evolution of the governance form.
REFERENCES
Arruñada, B., Garicano, L., & Vázquez, L. (2001). Contractual allocation of decision rights and incentives: The case of automobile distribu-tion. Journal of Law, Economics, and Organization, 17(1), 257-284. doi:10.1093/jleo/17.1.257
Asociación para la Investigación de Medios de Comunicación. (2012). Navegantes en la red: 14a encuesta AIMC a usuarios de internet 2011. Madrid, España: Asociación para la Investigación de Medios de Co-municación.
Baker, G., Gibbons, R., & Murphy, K. J. (2002). Relational contracts and the theory of the firm. Quarterly Journal of Economics, 117(1), 39-84. doi:10.1162/003355302753399445
Baudry, B., & Chassagnon, V. (2012). The vertical network organization as a specific governance structure: What are the challenges for in-complete contracts theories and what are the theoretical implica-tions for the boundaries of the (hub-) firm? Journal of Management & Governance, 16(2), 285-303. doi:10.1007/s10997-010-9148-z
Cai, S., Goh, M., Souza, R. de, & Li, G. (2013). Knowledge sharing in col-laborative supply chains: Twin effects of trust and power. Internation-al Journal of Production Research, 51(7), 2060-2076. doi:10.1080/00207543.2012.701780
Calabrò, A., & Mussolino, D. (2013). How do boards of directors con-tribute to family SME export intensity? The role of formal and infor-mal governance mechanisms. Journal of Management & Governance, 17(2), 363-403. doi:10.1007/s10997-011-9180-7
Cassiman, B., & Sieber, S. (2007). The impact of the internet on market structure. In A. J. Salazar & S. Sawyer (Eds.). Handbook of information technology in organizations and electronic markets (pp. 299-322). Singapore: World Scientific Publishing Co. Pte. Ltd.
Cave, M. (2006). Six degrees of separation: Operational separation as a remedy in European telecommunications regulation. Communica-tions & Strategies, 64(4), 84-104.
Caves, R. E., & Bradburd, R. M. (1988). The empirical determinants of vertical integration. Journal of Economic Behavior & Organization, 9(3), 265-279. doi:10.1016/0167-2681(88)90037-6
Cheung, G. W., & Lau, R. S. (2007). Testing mediation and suppres-sion effects of latent variables: Bootstrapping with structural equation models. Organizational Research Methods, 11(2), 296-325. doi: 10.1177/1094428107300343
Christiansen, T., & Neuhold, C. (2012). International handbook on infor-mal governance. [s.l.] Edward Elgar Publishing.
Clauß, T. (2012). The influence of the type of relationship on the gen-eration of innovations in buyer-supplier collaborations. Creativity and Innovation Management, 21(4), 388-411. doi:10.1111/j.1467-8691.2012.00651.x
Coase, R. H. (1996). La naturaleza de la empresa. In O. E. Williamson & S. G. Winter (Eds.). La naturaleza económica de la empresa (pp. 29-103). México D. F., Mexico: Fondo de Cultura Económica.
Comisión del Mercado de las Telecomunicaciones. (2011). Informe eco-nómico sectorial: Informe anual 2011. Madrid, España: Comisión del Mercado de las Telecomunicaciones.
Crandall, R. W., Eisenach, J. A., & Litan, R. E. (2010). Vertical separation of telecommunciations networks: Evidence from five countries. Federal Communications Law Journal, 62(3), 493-540.

666
ISSN 0034-7590
ARTICLES | The mediated effect of formal and informal control on governance forms
© RAE | São Paulo | V. 56 | n. 6 | nov-dez 2016 | 655-667
Cristofoli, D., Markovic, J., & Meneguzzo, M. (2014). Governance, man-agement and performance in public networks: How to be successful in shared-governance networks. Journal of Management & Gover-nance, 18(1), 77-93. doi:10.1007/s10997-012-9237-2
Crocker, K. J. (1983). Vertical integration and the strategic use of pri-vate information. The Bell Journal of Economics, 14(1), 236-248. doi:10.2307/3003550
Das, T. K., & Teng, B.-S. (2001). Trust, control, and risk in strategic al-liances: An integrated framework. Organization Studies, 22(2), 251-283. doi:10.1177/0170840601222004
Dekker, H. C. (2004). Control of inter-organizational relationships: Evi-dence on appropriation concerns and coordination requirements. Ac-counting, Organizations & Society, 29(1), 27-49. doi:10.1016/S0361-3682(02)00056-9
Dekker, H. C. (2008). Partner selection and governance design in inter-firm relationships. Accounting, Organizations and Society, 33(7-8), 915-941. doi:10.1016/j.aos.2007.02.002
Demsetz, H. (1988). Ownership, control and the firm: The organization of economic activity. Oxford, United Kingdom: Basil Blackwell.
Demsetz, H. (1995). The economics of the business firm: Seven critical commentaries. Cambridge, United Kingdom: Cambridge University Press.
Diefenbach, T., & Sillince, J. A. A. (2011). Formal and informal hierarchy in different types of organization. Organization Studies, 32(11), 1515-1537. doi:10.1177/0170840611421254
Ding, R., Dekker, H. C., & Groot, T. (2013, June). Risk, partner selection and contractual control in interfirm relationships. Management Ac-counting Research, 24(2), 140-155. doi:10.1016/j.mar.2013.04.007
Dyer, J. (1997). Effective interfirm collaboration: How firms minimize transaction costs and maximize transaction value. Strategic Management Journal, 18(7), 535-556.
Eriksson, P. E., & Laan, A. (2007). Procurement effects on trust and control in client-contractor relationships. Engineering Construction & Architectural Management, 14(4), 387-399. doi:10.1108/09699980710760694
Faems, D., Janssens, M., Madhok, A., & Van Looy, B. (2008). Toward an integrative perspective on alliance governance: Connecting contract design, trust dynamics, and contract application. Academy of Man-agement Journal, 51(6), 1053-1078.
Foss, K., & Foss, N. J. (2002). The knowledge-based approach and orga-nizational economics: How much do they really differ? And how does it matter? In N. J. Foss & V. Mahnke (Eds.). Competence, governance, and entrepreneurship: Advances in economic strategy research (pp. 55-79). [s.l.] Oxford University Press.
Fryxell, G. E., Dooley, R. S., & Vryza, M. (2002). After the ink dries: The in-teraction of trust and control in US-based international joint ventures. Journal of Management Studies, 39(6), 865-886. doi:10.1111/1467-6486.00315
Goo, J., & Huang, C. D. (2008). Facilitating relational governance through service level agreements in IT outsourcing: An application of the commitment–trust theory. Decision Support Systems, 46(1), 216-232. doi:10.1016/j.dss.2008.06.005
Hair, J. F., Anderson, R. E., Tatham, R. L., Black, W. C. (1999). Análisis de datos multivariante. Upper Saddle River, USA: Prentice Hall.
Hart, O. D. (1996). Los contratos incompletos y la teoría de la empresa. In O. E. Williamson & S. G. Winter (Eds.). La naturaleza de la empresa: Orígenes, evolución y desarrollo (pp. 192-219). México D.F., Mexico: Fondo de Cultura Económica.
Hill, C. W. (1990). Cooperation, opportunism, and the invisible hand: Implications for transaction cost theory. Academy of Management Review, 15(3), 500-513. doi:10.5465/amr.1990.4309111
Holmbeck, G. N. (1997). Toward terminological, conceptual, and statisti-cal clarity in the study of mediators and moderators: Examples from the child-clinical and pediatric psychology literatures. Journal of Con-sulting and Clinical Psychology, 65(4), 599-610.
Howell, B., Meade, R., & O’Connor, S. (2010). Structural separation versus vertical integration: Lessons for telecommunications from electricity reforms. Telecommunications Policy, 34(7), 392-403. doi:10.1016/j.telpol.2010.05.003
Iacobucci, D., Saldanha, N., & Deng, X. (2007). A meditation on me-diation: Evidence that structural equations models perform better than regressions. Journal of Consumer Psychology, 17(2), 139-153. doi:10.1016/S1057-7408(07)70020-7
Imai, K., & Itami, H. (1984). Interpenetration of organization and mar-ket: Japan’s firm and market in comparison with the US. International Journal of Industrial Organization, 2(4), 285-310. doi:10.1016/0167-7187(84)90001-8
Inauen, E, Osterloh, M., Frey, B. S., & Homberg, F. (2014). How a mul-tiple orientation of control reduces governance failures: A focus on monastic auditing. Journal of Management & Governance, 19(4), 763-796. doi:10.1007/s10997-014-9292-y
Jeuland, A. P., & Shugan, S. M. (1983). Managing channel profits. Mar-keting Science, 2(3), 239-272. doi:10.1287/mksc.1070.0332
Johansson, T., & Siverbo, S. (2011). Governing cooperation hazards of outsourced municipal low contractibility transactions: An explorato-ry configuration approach. Management Accounting Research, 22(4), 292-312. doi:10.1016/j.mar.2011.01.001
Jokipii, A. (2010). Determinants and consequences of internal control in firms: A contingency theory based analysis. Journal of Management & Governance, 14(2), 115-144. doi:10.1007/s10997-009-9085-x
Khodyakov, D. M. (2007). The complexity of trust-control relationships in creative organizations: Insights from a qualitative analysis of a conductorless orchestra. Social Forces, 86(1), 1-22. doi:10.1353/sof.2007.0100
Langfield-Smith, K. (2008). The relations between transactional charac-teristics, trust and risk in the start-up phase of a collaborative alli-ance. Management Accounting Research, Management Control Sys-tems as a Package, 19(4), 344-364. doi:10.1016/j.mar.2008.09.001
Langfield-Smith, K., & Smith, D. (2003). Management control systems and trust in outsourcing relationships. Management Accounting Re-search, 14(3), 281-307. doi:10.1016/S1044-5005(03)00046-5
Lyons, B. R. (1994). Contracts and specific investment: An empirical test of transaction cost theory. Journal of Economics & Management Strat-egy, 3(2), 257-278. doi:10.1111/j.1430-9134.1994.00257.x
Mahoney, J. T. (1992). The choice of organizational form: Vertical finan-cial ownership versus other methods of vertical integration. Strategic Management Journal, 13(8), 559-584. doi:10.1002/smj.4250130802
Mangin, J. P. L., & Mallou, J. V. (2003). Análisis multivariable para las ciencias sociales. Madrid, España: Prentice Hall.
Masten, S. E. (1984). The organization of production: Evidence from the aerospace industry. Journal of Law and Economics, 27(2), 403-417.
Masten, S. E., Meehan, J. W., Jr., & Snyder, E. A. (1989). Vertical integra-tion in the US auto industry: A note on the influence of transaction specific assets. Journal of Economic Behavior & Organization, 12(2), 265-273. doi:10.1016/0167-2681(89)90059-0

667
ISSN 0034-7590
AUTHORS | Nuria Rodríguez-López | M. Eva Diz-Comesaña
© RAE | São Paulo | V. 56 | n. 6 | nov-dez 2016 | 655-667
Mayer, R. C., Davis, J. H., & Schoorman, F. D. (1995). An integrative mod-el of organizational trust. Academy of Management Review, 20(3), 709-734.
Meer-Kooistra, J. Van Der, & Vosselman, E. G. (2000). Management con-trol of interfirm transactional relationships: The case of industrial renovation and maintenance. Accounting, Organizations and Society, 25(1), 51-77. doi:10.1016/S0361-3682(99)00021-5
Ménard, C. (2004). The economics of hybrid organizations. Jour-nal of Institutional and Theoretical Economics, 160(3), 345-376. doi:10.1628/0932456041960605
Miller, F. (2011). Using formal and informal controls to limit opportun-ism: Review and classification of remedies to hold-ups. Journal of Accounting Literature, 30, 1-39.
Neumann, K. (2010). Ex ante governance decisions in inter-organization-al relationships: A case study in the airline industry. Management Accounting Research, 21(4), 220-237. doi:10.1016/j.mar.2010.05.002
Ouchi, W. G. (1980). Markets, bureaucracies, and clans. Administrative Science Quarterly, 25(1), 129-141. doi:10.2307/2392231
Ouchi, W. G., & Price, R. L. (1993). Hierarchies, clans, and Theory Z: A new perspective on organization development. Organizational Dy-namics, 21(4), 62-70. doi:10.1016/0090-2616(93)90034-X
Palay, T. M. (1984). Comparative institutional economics: The gover-nance of rail freight contracting. The Journal of Legal Studies, 13(2), 265-287.
Perry, M. K. (1989). Vertical integration: Determinants and effects. In R. Schmalensee & R. Willig (Eds.). Handbook of industrial organization (Vol. 1, pp. 183-255). Amsterdam, Neederlands: Elsevier Science.
Piesse, J., Strange, R., & Toonsi, F. (2012). Is there a distinctive MENA model of corporate governance? Journal of Management & Gover-nance, 16(4), 645-681. doi:10.1007/s10997-011-9182-5
Reuver, M. De. (2011). Governance of mobile service innovation after the walled gardens. Info, 13(1), 43-60. doi:10.1108/14636691111101874
Reuver, M. De, & Bouwman, H. (2012). Governance mechanisms for mobile service innovation in value networks. Journal of Business Re-search, 65(3), 347-354. doi:10.1016/j.jbusres.2011.04.016
Rialp, J., & Salas, V. (2002). La colaboración empresarial desde la teoría de los derechos de propiedad. Investigaciones Económicas, 26(1), 113-144.
Rosen, S. (1996). Costos de transacción y mercados de trabajo internos. In O. E. Williamson & S. G. Winter (Eds.). La naturaleza de la empresa: Orígenes, evolución y desarrollo (pp. 104-125). México D.F., Mexico: Fondo de Cultura Económica.
Roy, M. H., & Dugal, S. S. (1998). Developing trust: The importance of cognitive flexibility and co-operative contexts. Management Deci-sion, 36(9), 561-567. doi:10.1108/00251749810239441
Sako, M. (1992). Price, quality and trust: Inter-firm relations in Britain and Japan. Cambridge, United Kingdom: Cambridge University Press.
Selnes, F. (1998). Antecedents and consequences of trust and satis-faction in buyer-seller relationships. European Journal of Marketing, 32(3-4), 305-322. doi:10.1108/03090569810204580
Şengün, A. E., & Wasti, S. N. (2009). Revisiting trust and con-trol. International Small Business Journal, 27(1), 39-69. doi:10.1177/0266242608098346
Şengün, A. E., & Wasti, S. N. (2011). Trust types, distrust, and perfor-mance outcomes in small business relationships: The pharma-cy-drug warehouse case. Service Industries Journal, 31(2), 287-309. doi:10.1080/02642060902759137
Sharma, D. S. (2002). The differential effect of environmental dimen-sionality, size, and structure on budget system characteristics in ho-tels. Management Accounting Research, 13(1), 101-130. doi:10.1006/mare.2002.0183
Simon, H. A. (1991). Organizations and markets. The Journal of Economic Perspectives, 5(2), 25-44.
Smets, L. P. M., Oorschot, K. E., & Langerak, F. (2013). Don’t trust trust: A dynamic approach to controlling supplier involvement in new prod-uct development. Journal of Product Innovation Management, 30(6), 1145-1158. doi:10.1111/jpim.12051
Srivastava, S. C., & Teo, T. S. H. (2012). Contract performance in offshore systems development: Role of control mechanisms. Journal of Man-agement Information Systems, 29(1), 115-158.
Stinchcombe, A. L. (1985). Contracts as hierarchical documents. In A. L. Stinchcombe & C. Heimer (Eds.). Organization theory and manage-ment (pp. 121-171). Oslo, Norway: Norwegian University Press.
Subramani, M. R., & Venkatraman, N. (2003). Safeguarding investments in asymmetric interorganizational relationships: Theory and evi-dence. Academy of Management Journal, 46(1), 46-62.
Tessier, S., & Otley, D. (2012). A conceptual development of Simons’ Le-vers of Control framework. Management Accounting Research, 23(3), 171-185. doi:10.1016/j.mar.2012.04.003
Valor, J., & Hess, M. (2002). Estrategias y sostenibilidad de portales, proveedores de acceso a internet y empresas de contenidos: Un análisis mediante la cadena de valor. Economía Industrial, 340, 31-41.
Varamaki, E., & Vesalainen, J. (2003). Modelling different types of mul-tilateral co-operation between SMEs. Entrepreneurship & Regional Development, 15(1), 27.
Vázquez, R., Iglesias, V., & Alvarez-González, L. I. (2005). Distribution channel relationships: The conditions and strategic outcomes of co-operation between manufacturer and distributor. The International Review of Retail, Distribution and Consumer Research, 15(2), 125-150. doi:10.1080/09593960500049241
Waterman, D., & Choi, S. (2011). Non-discrimination rules for ISPs and vertical integration: Lessons from cable television. Telecommunica-tions Policy, 35(11), 970-983. doi:10.1016/j.telpol.2011.09.001
Williamson, O. E. (1989). Las instituciones económicas del capitalismo. Mexico D.F., Mexico: Fondo de Cultura Económica.
Williamson, O. E. (1991a). Mercados y jerarquías: Su análisis y sus impli-caciones antitrust. México D.F., México: Fondo de Cultura Económica.
Williamson, O. E. (1991b). Strategizing, economizing, and econom-ic organization. Strategic Management Journal, 12(S2), 75-94. doi:10.1002/smj.4250121007
Williamson, O. E. (1993). Calculativeness, trust, and economic organiza-tion. Journal of Law and Economics, 36(1), 453-486.
Williamson, O. E. (1996). Transaction cost economics and the Carnegie connection. Journal of Economic Behavior & Organization, 31(2), 149-155. doi:10.1016/S0167-2681(96)00898-0
Xie, Y., & Peng, S. (2011). How do corporate associations influence cus-tomer relationship strength? The effects of different types of trust. Journal of Strategic Marketing, 19(5), 443-454. doi:10.1080/0965254x.2011.565882
Yoo, C. S. (2002). Vertical integration and media regulation in the new economy. Yale Journal on Regulation, 19, 171-300.
668
ISSN 0034-7590© RAE | São Paulo | V. 56 | n. 6 | nov-dez 2016 | 668-679
MUHAMMAD ISHTIAQ [email protected] in Management from the Università degli Studi di Padova – Padova, Italy
NAZIA MUNAZER HUSSAIN [email protected]. Phil at Global Institute – Lahore, Pakistan
ARTICLESSubmitted 02.04.2014. Approved 09.08.2016Evaluated by double blind review process. Scientific Editor: Felipe Zambaldi
CREATIVE MARKETING STRATEGY AND EFFECTIVE EXECUTION ON PERFORMANCE IN PAKISTANEstratégia de marketing criativo e execução efetiva sobre o seu desempenho no Paquistão
Estrategia de marketing creativo y ejecución efectiva sobre su desempeño en Paquistán
ABSTRACTThe purpose of the current research is to determine the influence of creative marketing strategies and effective execution on business unit performance. Moreover, strategic orientation and environ-mental uncertainty are used as moderating variables. Data are collected from 368 key informants working in Fast-Moving Consumer Goods (FMCG), banking, pharmaceutical, chemical, insurance, and engineering industries using a multi-stage random sampling technique. Factor analysis and multiple hierarchal regressions are used to test the study hypotheses. The results indicate that creative marke-ting strategy and effective execution are positively associated with business performance. Moreover, environmental uncertainty and strategic orientation play a moderating role in the above relationships.KEYWORDS | Marketing strategy, creativity, strategic orientation, firm performance, Pakistan.
RESUMOO objetivo da pesquisa é determinar a influência de estratégias de marketing criativo e execução efetiva no desempenho da unidade de negócios. Além disso, a orientação estratégica e incerteza ambiental são utilizadas como variáveis moderadoras. Os dados foram coletados de 368 informan-tes-chave que trabalham em indústrias Fast-Moving Consumer Goods (FMCG), no setor bancário, farmacêutico, químico, de seguros e engenharia com a ajuda da técnica de amostragem aleatória multi-etápica. Análise fatorial e regressão múltipla hierárquica foram empregadas para testar as hipóteses do estudo. Os resultados indicaram que a estratégia de marketing criativo e sua execu-ção efetiva se associam positivamente ao desempenho dos negócios. Adicionalmente, a incerteza ambiental e a orientação estratégica desempenharam papel moderador nas relações analisadas.PALAVRAS-CHAVE | Estratégia de marketing, criatividade, orientação estratégica, desempenho empresarial, Paquistão.
RESUMENEl presente estudio tiene como objetivo determinar la influencia de las estrategias de marketing creativo y ejecución efectiva sobre el desempeño de unidades de negocio. Además, la orientación estratégica y la incertidumbre ambiental se utilizan como variables moderadoras. Los datos son reco-lectados de 368 informantes claves que trabajan en industrias Fast-Moving Consumer Goods (FMCG), banca, farmacéutica, química, seguros e ingeniería utilizando una técnica de muestreo aleatorio polietápico. Para probar la hipótesis del estudio, se utilizan análisis factorial y regresiones jerárqui-cas múltiples. Los resultados indican que la estrategia de marketing creativo y la ejecución efectiva están asociadas positivamente al desempeño de negocios. Además, la incertidumbre ambiental y la orientación estratégica desempeñan un papel moderador en las relaciones antes mencionadas.PALABRAS CLAVE | Estrategia de marketing, creatividad, orientación estratégica, desempeño de firmas, Paquistán.
RAE-Revista de Administração de Empresas | FGV/EAESP
DOI: http://dx.doi.org/10.1590/S0034-759020160608

669
ISSN 0034-7590
AUTHORS | Muhammad Ishtiaq Ishaq | Nazia Munazer Hussain
© RAE | São Paulo | V. 56 | n. 6 | nov-dez 2016 | 668-679
INTRODUCTION
In order to compete in fast changing business environments, a set of skills is necessary to adopt, integrate, and exploit given resources effectively (Barney, 1991; Teece, Pisano, & Shuen, 1997). Markides (1999) introduced “breakthrough strategies” that primarily focus on revitalizing business and markets in a competitive environment, also taking other strategic alliances into consideration. The combination of creative marketing strategies and effective implementation seems a logical approach for organizations to gain a competitive advantage. O’Reilly and Tushman (2004) claimed that very few firms, referred as “ambidextrous organizations,” are flexible and risk taking, and believe in the exploration of innovation and experimentation in doing business, whereas some companies focus on execution, implementation, selective, efficient, and refined practices. These concepts are explained as exploration and exploitation, as introduced by Marsh (1991). In 2007, Business Week released an article by Hindo on ambidextrous organizations, where the author discussed several business management issues, taking 3M as an example. The link between creative marketing strategies and business performance is intuitive and convincing, but research focused on western countries has delivered mixed results, whereas no significant research has focused on the Asian context yet.
The first research conducted on the topic examined the antecedents of creative marketing and found a significant impact on business performance (Andrews & Smith, 1996). These findings are further confirmed by another early study, Menon, Bharadwaj, Adidam, and Edison (1999). On the other hand, Im and Workman (2004) were unable to find any significant relationship between innovative marketing programs and business performance. Noble and Mokwa (1999) focused on the impact of effective strategy execution on performance. Vorhies and Morgan (2005) showed that firms with average performance cannot implement marketing strategies effectively when compared to high performing firms in competitive markets. Neilson, Martin, and Powers (2008) further argued that the implementation phase of any business strategy is not an easy task for senior marketing personnel. Hence, effective implementation is considered a major concern for practitioners (Bower & Gilbert, 2007) and academicians (Chebat, 1999). The issue has been consistently labeled as implementation gap, black box strategy, and depicted as an elusive phenomenon (Bourgeois & Brown, 1984; Miller, Wilson, & Hick, 2004; Piercy, 2009).
A business strategy is the set of decisions that enables an organization to generate superior performance. Porter (1980) and Miles and Snow (1978) provided the most relevant theoretical framework to understand the nature of strategic decisions. Four archetypes of organizational approach are identified, depending on how a company defines its product-market realm
(entrepreneurial problem), processes, and constructs structures (the technical and administrative problems) to achieve business realization. Organizations with Prospector orientation are readily involved in identifying a new market and product opportunities, whereas Defenders tend to create longstanding relationships with customers and products in the global market. On the other hand, Analyzers take a transitional approach, standing between Defenders and Prospectors, but actively tracking Prospectors for developing stable customer relationships and product range. Reactors, the last type, do not show a consistent reply to an entrepreneurial problem (Slater, Halt, & Olson, 2010).
The entrepreneurial problem relates to how a product defines the market coverage scope (i.e., market or focused wide) and how an organization crafts customer values (i.e., low cost or differentiation strategy), as discussed in Porter, 1980.
In order to generate higher profits, organizations should define creative marketing strategies and have the ability to implement them effectively. Due to resource competition, uncertain environment, and cultural tensions, it is often hard to accomplish both objectives at the same time (Slater et al., 2010; Ishaq, 2013). For instance, The current economic and social situation in Pakistan has created an ambiguous and uncertain business environment that heavily damaged all business sectors, badly affecting marketing activities, and individual and organizational performance. Creative marketing strategies and effective implementation are well-documented constructs in academic literature due to their significance for the strategy development process. However, the academic literature is still vague on issues linked with creativity and creative strategies implementation. Therefore, this research provides a significant contribution to the literature by examining the simultaneous impact of creative marketing strategy and effective implementation on business unit performance. Moreover, environmental uncertainty and strategic orientations are tested as moderating variables.
LITERATURE REVIEW
In a competitive and fierce competition environment, organizations are actively developing overarching skills to build long-term strategies and plan their perfect execution (Noble & Mokwa, 1999; Walker & Ruekert, 1987). To achieve this goal, top marketing executives should focus on their businesses field to increase organizational performance (Slater & Olson, 2000). While conducting research on business strategies and innovation, the first question a researcher faces is why organizations experience difficulties in adopting creativity and effective implementation simultaneously. March (1991) provided an explanation of this dilemma in terms of “exploration

670
ISSN 0034-7590
ARTICLES | Creative marketing strategy and effective execution on performance in Pakistan
© RAE | São Paulo | V. 56 | n. 6 | nov-dez 2016 | 668-679
vs. exploitation conundrum.” Exploration includes procedures like creativity, innovation, experimentation, and risk taking, whereas exploitation covers execution, efficiency, and implementation (Slater et al., 2010; Ishaq, 2013). In the next sections, we discuss the potential of creative marketing strategies and effective execution for increased business unit performance in uncertain environments and across strategic orientations.
Marketing strategy creativity
A creative marketing strategy is defined as a set of activities developed to promote products/services for selective or full target markets to achieve business objectives. For newcomers, the only way to stay in competition is to adopt an innovative strategy (Hamel, 1988). Marketing creativity is described as the steps into the conception of distinctive practices in the marketing department. An organization that has unique, creative, or innovative strategy can hold a strategic position in the industry and it is less likely to be imitated by competitors (Barney, 1991, Ishaq, 2013). Researchers (Bourgeois & Eisenhardt, 1988; Menon et al., 1999) argued that firms only achieve positive goals if they believe in rigorous decision-making process, innovative solutions, and creative strategies. For instance, Cirque du Soleil is the best example of very creative or
“Blue Ocean” strategy (Kim & Mauborgne, 2004).Innovative and creative businesses create new strategies,
think innovatively, and strengthen their competitive space in the industry by satisfying their customers’ demand (Slater et. al., 2010). Innovative strategies can comprise a new pricing model, value propositions, market expansion, customer driven policies, efficient supply chain, and other means for “reaching out to customers” (Ishaq, 2013). This marketing mix is the main reason for buyers to purchase a certain product/service, due to a differentiation in customer value that will lead to increased organizational performance. Therefore, we introduce the following hypothesis.
H1: Creative marketing strategy exerts a positive impact on business performance.
Strategy implementation effectiveness
Bonoma (1984) asserts that, while creative and innovative strategies might be easier to conceive, their implementation with respect to customer constraints, competitors, and current organizational circumstances is often complicated. Noble and Mokwa (1999) define strategy implementation as the enactment of a given script and guidelines. Cespedes and Piercy (1996) consider effective execution as the accomplishment of organizational goals through appropriate actions. Many researchers focused on behavioral and interpersonal
characteristics of strategy implementation (e.g., Noble & Mokwa, 1999), where the academic literature suggests a few definitions. Wind and Robertson (1983) suggest a simple definition of marketing strategy implementation as “the operationalization of a clearly articulated strategic marketing plan.”
Some researchers (Guth & MacMillan, 1986; Floyd & Wooldridge, 2000) argued that the effective implementation of a business strategy is a sole responsibility of mid-level managers, due to their precarious role and current market situation. Despite their crucial role, only a few studies addressed the drivers of a successful implementation of creative strategies by mid-level managers working in marketing departments (Bower & Gilbert, 2007). Konovsky (2000) and Noble and Mokwa (1999) argued that organizational justice procedures are decisive factors, driving the efforts of the employees towards effective strategy implementation, as they are associated with clear communication strategy at the top management’s end and organizational buy-in.
Nohria, Joyce, and Roberson (2003) conducted a research on 160 organizations observed over five years and concluded that organizations that implement their strategies flawlessly have a high likelihood to achieve market success. To realize an effective execution of marketing strategies, top management is responsible to provide human resources, financial resources, direction, and a competitive environment (Varadarajan, Jayachandran, & White, 2001; Naeem, Nawaz, Rana, & Ishaq, 2011; Ishaq, 2013). Hrebiniak (2005) identified the implementation concept as a key success factor for an organization due to its strategic implications, such as invisibility, competitive advantage, and difficulty in imitating faced by competitors. Numerous researchers devoted huge efforts to understand different strategic behaviors for effective execution, such as market orientation, innovation orientation, organization’s structure, marketing program contents, and product market strategy for achieving higher market share and performance (Ishaq, 2013; Matsuno & Mentzer, 2000; Slater & Olson, 2000, 2001; Vorhies & Morgan, 2003). Most researchers argued that true success in implementation is only achieved when an organization finds the right fit in organizational characteristics and strategy, which leads to superior performance. Hence, we introduce the following hypothesis.
H2: Effective implementation of marketing strategy leads to superior business performance of an organization.
Tension between creativity & implementation in uncertainty
Researchers have tried to describe why organizations face harsh difficulties to achieve success on creativity and its imple-mentation phase simultaneously. In his pioneer researcher,

671
ISSN 0034-7590
AUTHORS | Muhammad Ishtiaq Ishaq | Nazia Munazer Hussain
© RAE | São Paulo | V. 56 | n. 6 | nov-dez 2016 | 668-679
Abernathy (1978) discussed when and how an organization can generate innovative ideas and simultaneously increase its productivity. The tension between creativity and implementa-tion is further addressed in a seminal work by March (1991), where the author analyses the exploitation vs. exploration conundrum describing exploration as the process of inno-vation, experimentation, risk taking, and creativity, whereas exploitation encompasses execution, implementation, and efficiency. Deshpande and Webster (1989) argued that culture is a deep-seated set of beliefs and values that translates into specific norms to transform an individual behavior in orga-nizations. Quinn and Rohrbaugh (1983) offered a model for organization culture named “competing values,” which con-sists of three dimensions: means-end, control-flexibility, and internal-external. The representation of culture along these dimensions produce four major types: (1) adhocracy, which is an external orientation consisting of flexibility, creative behavior, and entrepreneurial nature; (2) hierarchy, which is an internal orientation based on stability in business opera-tions and produces predictability in businesses; (3) market, which represents stability, but in an external orientation situ-ation with focus on competitive behavior, and (4) clan, which is an internal point of reference for an organization, and is explained in terms of flexibility and relationship building ori-entation (Slater et al., 2010).
Based on the above explanation, organizations characterized by adhocracy culture are expected to introduce creative strategies, whereas organizations characterized by hierarchy cultural orientation are expected to be oriented towards effective implementation. However, research provided conflicting evidence regarding the beliefs and values associated with hierarchy and adhocracy culture (Deshpande, Farley & Webster, 1993). There seem to be a significant challenge to intermingle the values and beliefs of these two competing cultures into one another for establishing ambidextrous organizations. It seems that creativity and effective execution can simultaneously achieve satisfactory results only when addressing mediocrity rather than excellence (Slater et al., 2010). It is possible that organizations focusing on both strategies at the same time may lack internal fit or may be out of focus. Therefore, these organizations should be given an implicit and explicit choice to focus either on innovation or on implementation. Hence, we introduce the following hypotheses.
H3: Creative marketing strategy plays a vital role in boosting business performance in an unpredictable environment.
H4: Effective strategy implementation strongly influences business performance in predictable environments.
Strategic orientation as moderating role
Strategic action can play a role in both internal and external environments, in which a business firm is operating (Slater et al., 2010). Several empirical studies investigated the environment’s impact (Jaworski & Kohli, 1993; Slater & Narver, 1994) on different product-market strategies (Ishaq, 2013; Matsuno & Mentzer, 2000; Naeem et al., 2011; Naeem, Nawaz, & Ishaq, 2012; Vorhies & Morgan, 2003). To understand a strategic decision, Porter (1980) and Miles and Snow (1978) introduced a set of dominant typologies. In 1978, Miles and Snow recognized four prototypes of organizations, depending on how they describe their product-market realm and their approaches to it (entrepreneurial issues), and construct structures and processes (the technical and administrative issues) in a competitive market. This entrepreneurial behavior is further analyzed in Walker and Ruekert (1987), in which the authors categorized Defenders as Low Cost and Differentiated Defenders. To build a strong position in competitive economies, the highly creatively oriented Prospectors deal with innovative ideas; Analyzers focus on Prospector strategies and improve their status relatively (Dickson, 1992), while Differentiated and Low-Cost Defenders are late followers and risk averse and should grasp the advantages of consumers’ preferences for superior and low cost services (Dickson, Farris, & Verbeke, 2001).
Prospector
Prospectors, the first archetype proposed by Miles and Snow, are exploiting the situation, and locate market opportunities and new product development strategies on a regular basis. Prospectors express the highest entrepreneurial strategic orientation, characterized by high risk taking propensity and ability to fulfill the emerging markets demand. Aggressive marketing strategies are consistent with the market demand of the early adopter segment, as well as with the characteristic of innovative providers of unique services/products. These organizations have the ability to handle risk due to uncertainty and turbulent markets. They use marketing research extensively, which allows them to examine multiple aspects of market conditions. Miles and Snow (1978) argued that Prospectors rely on a “capacity to monitor a wide range of environmental conditions, trends, and events.”
Organizations with an entrepreneurial mindset or Prospector orientation are recognized as dominant strategy makers, rather than implementers. Miller (1983) describes Prospectors as proactive innovators, first to come up with

672
ISSN 0034-7590
ARTICLES | Creative marketing strategy and effective execution on performance in Pakistan
© RAE | São Paulo | V. 56 | n. 6 | nov-dez 2016 | 668-679
unique ideas, take risky steps for creating ventures and also engage in product-market innovation. They have the proper vision to achieve supporting goals, which represents a marketing strategy that not only inspires individuals, but also provides key directions to entrepreneurial organizations (Slater et al., 2010). Prospectors operate in the most competitive environment and satisfy latent customer needs on an immediate basis by offering new products and services (Slater et al., 2010). They have a proactive orientation towards the market (Narver, Slater, & MacLachlan, 2004), especially towards the early adopter segment and innovators (Slater, Hult, & Olson, 2007), which leads them to devote significant resources to drafting creative strategies, marketing research, and other related issues (Walker et al., 2003). Buyers in these special segments opt for a unique pricing model to reduce risk. As aggressive marketers (Slater & Olson, 2001), Prospectors should develop multiple distributions to get a sustainable advantage in competing market (Moore, 1991). Hence, we introduce the following hypothesis.
H5: For Prospectors, creative marketing strategies influence business performance more than an effective strategy implementation.
Analyzers
Analyzers stand in between the extreme positions of Prospectors and Defenders, and combine the strength of both strategies to maintain a stable customer base (Slater et al., 2010). The culture of Analyzers is a mixture of hierarchal and market culture. Market culture translates in competitor driven strategies, encourages consumer creativity, competitive values, and is outward looking. These facets are vital factors that allow these organizations to improve their product and service and compete with Prospectors. In these organizations, hierarchal culture is endorsed on execution, stability, and control on what an organization is currently working on or planning to achieve in the future. Organizations characterized by Analyzer orientation mainly focus on mass marketing strategies addressing the early majority and early adopter consumers by offering superior products, as compared to Prospectors. Slater et al. (2010) claimed that Analyzers quickly follow the Prospectors’ strategies to attract new customers through the introduction of improved services and products with low cost. Analyzers can rapidly compete with Prospectors in terms of price, features, and quality, or a combination of these factors, to gain a larger market share. Therefore, Analyzers must prepare themselves to change their strategies quickly to reap more benefits in the market (Slater et al. 2010).
Miles and Snow (1978) claimed that Analyzers can achieve substantial growth with a combination of market and product development. Moore (1991) argued that buyers in this segment put a large emphasis on getting a complete and accurate solution to problems that may occur. Slater et al. (2010) argued that, if an organization is unable to implement its business plan effectively, the whole efforts of marketing activities lead to no result. Analyzers, based on their cultural orientation, are only able to achieve a “cross the chasm” status if they focus on innovative strategies and effective execution simultaneously (Moore, 1991). Slater and Olson (2001) argued that Analyzers have the ability to develop a strong and broad relationship with all strategic partners (distributors, retailers, wholesalers, raw material providers). Moreover, Analyzers usually take a balanced approach in competitive environments (Miles & Snow, 1978). Therefore, we introduce the following hypothesis.
H6: For Analyzers, creative marketing strategies and effective strategy implementation equally contribute to increasing business performance.
Low-cost Defenders
Successful organizations with Low-Cost Defenders strategic orientation are characterized by a hierarchal culture, which pushes them to offer operational excellence and reasonable cost (Ishaq, 2013). This type of defenders minimizes the costs of their marketing strategy to achieve superior performance over competitors. Organizations competing with Low-Cost Defenders differentiate themselves through lowest price strategies with adequate product/service benefits. VIZIO is the best example of Low-Cost Defender: it was a consulting firm in 2004 and became a market share leader (LCD TVs domain) in the second quarter of 2007. VIZIO achieved this success through a low cost manufacturing process, intensive distribution strategy, low advertising, reasonably good quality, and low consumer price (Ogg & Kanellos, 2007). Low-Cost Defenders engage in low-cost marketing activities, and focus on implementing their marketing strategy rather than designing innovative strategies. Therefore, we introduce the following hypothesis.
H7: For Low Cost Defenders, effective strategy implementa-tion is more strongly associated with business performance than creative marketing strategy.
Differentiated Defenders
Differentiated Defenders are players who focus on late and early majority customers introducing quality services/products in the

673
ISSN 0034-7590
AUTHORS | Muhammad Ishtiaq Ishaq | Nazia Munazer Hussain
© RAE | São Paulo | V. 56 | n. 6 | nov-dez 2016 | 668-679
market. The only way for Differentiated Defenders to generate the maximum profit from the business is to differentiate themselves heavily, providing superior services/products and other advantages. Some Differentiated Defenders are working in product or service oriented industries, using pre-sale and post-sale strategies to differentiate from competitors. These organizations must establish a unique market proposition and an exclusive customer base to be able to charge higher prices (Ishaq, 2013; Slater & Olson, 2001). Zeithaml et al. (1988) argued that providing better service quality includes control processes implementation and internal communication to manage employees in services organization. Successful Differentiated Defenders engage in relative formal policies and put constant emphasis on execution to ensure consistent service and product delivery (Olson, Slater, & Hult, 2005a). Therefore, we introduce the following hypothesis.
H8: For Differentiated Defenders, creative marketing strategies and effective strategy implementation equally contribute to business performance boost.
RESEARCH METHODThe sample for this study is drawn from two stock exchanges, Lahore Stock Exchange and Karachi Stock Exchange. In an initial step, eight sets of industries are formed, from both stock exchanges, for random sampling purpose. After stratification, 700 companies are randomly selected and a questionnaire based survey is conducted, sending the survey along with a cover letter to key informants, such as Business Unit Heads, Marketing Heads, Sales Head, National Sales Managers, and Brand Managers, across industries in Pakistan. In the first phase of data collection (eight weeks), 290 questionnaires have been received. Subsequent reminders yielded another one 105 questionnaires in four weeks. A total of 27 questionnaires are excluded from the study because of errors and missing values, and 368 questionnaires are completed, with a response rate of 52%. To deal with non-response bias, an exploration technique is employed, as prescribed by Armstrong and Overton (1977). In this technique, the means of all study variables of the first and last third of respondents are compared; the results indicated no statistical differences in the mean scores. As the results show no statistical difference between late and early responses, we can conclude that the non-response biases are not a concern (Armstrong & Overton, 1977). The list of all industries is available in Table 1.
Table 1. Companies that participated in the study
IndustriesNumber of companies /
Business units
Insurance industry 35
Banking industry 43
Chemical industry 44
FMCG industry 60
Pharmaceutical industry 19
Engineering industry 31
Textile industry 126
Telecommunication 10
Marketing strategy creativity is measured on a 10 item scale developed by Andrews and Smith (1996), while strategy implementation effectiveness is measured on a 5 item scale, as suggested by Noble and Mokowa (1999). Relative quality and relative cost are assessed on 3 items developed by Slater et al., (2010). Market turbulence and technology turbulence are assessed on 5 items, while competitive intensity is measured on a 6 item scale, as in Jaworski and Kohli (1993). Slater and Olson (2000) suggested one item scale for each strategic orientation (Prospectors, Analyzers, Differentiated Defenders, Low-Cost Defenders, and Rectors). Business performance is assessed according to the scale introduced by Olson et al. (2005a). First order reflective scales are used to measure all constructs, while the same constructs in uncertain environment are measured using a second order reflective scale. Environmental uncertainty is defined as the unpredictability of consumer behavior and technological innovation (Miller, Droge, & Toulouse, 1988). Hence, environmental uncertainty refers to first order competitive intensity, market turbulence, and technology turbulence. All items are measured on a 5 point Likert scale, where 1 = Strongly Disagree, 2 = Disagree, 3 = Neutral, 4 = Agree, and 5 = Strongly Agree, except strategic orientation.
RESULTS
Table 2 reports the descriptive statistics, reliability coefficients, and exploratory factor analyses of each construct. The Cronbach’s alpha coefficients of the study constructs range from 0.65 to 0.87, whereas the threshold of the alpha coefficients is 0.60 (James, Demaree, & Wolf, 1984). This criterion is met by all variables. All constructs show an adequate level of internal consistency, and

674
ISSN 0034-7590
ARTICLES | Creative marketing strategy and effective execution on performance in Pakistan
© RAE | São Paulo | V. 56 | n. 6 | nov-dez 2016 | 668-679
factor analysis is applied on each construct. The interpretability criterion of factor analysis is that at least 3 items of each construct show significant loadings (>0.30) (Cattell, 1966). Since the loading range of each construct is above 0.30, all items are introduced in the analyses. Kaiser-Meyer-Olkin (KMO) and Bartlett’s Tests are performed to examine the construct validities. The value of KMO, between 0.5 and 1.0, shows the appropriateness of the factor analysis, indicating that this type of data may be used for exploratory factor analysis. Furthermore, the Bartlett’s Test also confirmed the statistical significance (p < 0.000) of each construct.
Table 2. Descriptive statistics SV QI FL KMO Mean Standard deviation α
Creative marketing strategy
CMS1 0.799
0.829
Bartlett’s test of sphericity: p = 0.001
3.89 0.470.89
CMS 2 0.809CMS 3 0.788CMS 4 0.797CMS 5 0.645CMS 6 0.758CMS7 0.841CMS8 0.803CMS9 0.745
CMS10 0.789
Strategy implementation effectiveness
SEI1 0.7220.816
Bartlett’s test of sphericity: p = 0.001
3.80 0.420.65
SEI2 0.812SEI3 0.740SEI4 0.785
SEI5 0.801
Relative cost
RC1 0.773 0.743Bartlett’s test of sphericity: p = 0.001
4.10 0.51 0.85RC2 0.811
RC3 0.858
Relative quality
RQ1 0.790 0.796Bartlett’s test of sphericity: p = 0.001
3.58 0.46 0.68RQ2 0.743
RQ3 0.729
Market turbulence
MT1 0.7590.905
Bartlett’s test of sphericity: p = 0.001
3.73 0.46 0.75
MT2 0.844MT3 0.840MT4 0.670
MT5 0.784
Technology turbulence
TT1 0.7250.845
Bartlett’s test of Sphericity: p = 0.001
3.69 0.58 0.74
TT2 0.822TT3 0.845TT4 0.840
TT5 0.801
Competitive intensity
CI1 0.7110.871
Bartlett’s test of sphericity: p = 0.001
3.45 0.42 0.74
CI2 0.786CI3 0.842CI4 0.864CI5 0.849
CI6 0.711
Business performance
BP1 0.7310.799
Bartlett’s test of sphericity: p = 0.001
3.70 0.53 0.87
BP2 0.794BP3 0.692BP4 0.815
BP5 0.839

675
ISSN 0034-7590
AUTHORS | Muhammad Ishtiaq Ishaq | Nazia Munazer Hussain
© RAE | São Paulo | V. 56 | n. 6 | nov-dez 2016 | 668-679
Table 3 reports the correlation and multicollinearity statistics of all study variables. Correlation values range between a minimum 0.28 to maximum 0.45, indicating the absence of multicollineraity (Neter et al., 1983). Furthermore, variance inflation factors and tolerance statistics are also taken into consideration to address potential multicollinearity and we found values well below the threshold, confirming the absence of multicollinearity. Table 4 shows the stepwise regression analyses to test the hypothesis 1-4 of this research. In the first step of the hierarchal regression, a set of control variables is introduced in the model. The model explained 15% of the total variance and only environmental uncertainty (which is the product of three variables: technology turbulence, market turbulence,
and completive intensity) showed positive and significant relationship with business unit performance. In the second step, two independent variables, creative marketing strategy (CMS) and strategy effective implementation (SEI), are introduced in the model and the model reflected 33% of the variance of the dependent variable. With respect to the predictive strength of the model, the ANOVA results confirmed that the model (F = 98.677, p = 0.01) is adequate to explain the variability of business performance. The beta coefficients showed a positive impact of creative marketing strategy (β = 0.349, t = 2.96, p = 0.01) and strategy effective implementation (β = 0.42, t = 4.85, p = 0.01) on business unit performance. Hence, the first two hypotheses of the study are confirmed.
Table 3. Correlation statisticsCMS SEI RQ RC MT CI TT PER Tolerance VIF
CMS 1 0.39** 0.27** 0.33** 0.18** 0.25** 0.15* 0.17** 044 2.52SEI - 1 0.28** 0.29** 0.21** 0.19** 0.14* 0.20** 0.39 2.48RQ - - 1 0.21** 0.29** 0.25** 0.11 0.26** 0.31 3.55RC - - - 1 0.11 0.26** 0.09 0.10 0.28 2.89MT - - - - 1 0.18** 0.21** 0.25** 0.20 2.62CI - - - - - 1 0.28** 0.30** 0.49 2.40TT - - - - - - 1 0.21** 0.41 3.01PER - - - - - - - 1 0.37 3.28
Note: Creative Marketing Strategy (CMS), Strategy Effective Implementation (SEI), Relative Cost (RC), Relative Quality (RQ), Technology Turbulence (TT), Market Turbulence (MT), Competitive Intensity (CI), Performance (PER). *Significant at the 0.05 level (1-tailed); **Significant at the 0.01 level (1-tailed).
The moderating role of environmental uncertainty is also measured within the CMS/performance and SEI/performance relationships. The interaction term of CMS with environmental uncertainty and SEI with environmental uncertainty are entered in the model, which explained 30% of the variance of the dependent variable (F = 63.55, p = 0.01). The results confirm that environmental uncertainty plays a moderating role in
the CMS/performance (β = 0.40, t = 4.49, p = 0.01) and SEI/performance relationships (β = 0.37, t = 3.12, p = 0.01). The results partially confirm our study hypotheses that creative marketing strategy plays a more important role in increasing business performance in uncertain environment conditions, whereas strategy implementation effectiveness has a stronger influence on business performance in a certain environment.
Table 4. Regression analysis resultsPredictors Un-standardized Beta Coefficient t-value Step 1 - Control variablesRelative costRelative qualityEnvironmental uncertainty
0.110.010.19
1.240.1012.54**
R Square 0.15*Step 2 - Independent variableCMSSEI
0.340.42
2.96*4.58*
R Square 0.33*F-Statistics 98.68*Moderation regression: Environmental uncertainty CMS*EU 0.40 4.49*SEI*EU 0.37 3.12*R Square 0.30*F-Statistics 63.55*
Note: Dependent Variable = Business Unit Performance, EU = Environmental Uncertainty (competitive intensity, technology and market turbulence).* Significant at 0.01 levels: One-tailed, ** Significant at 0.05 levels: One-tailed.
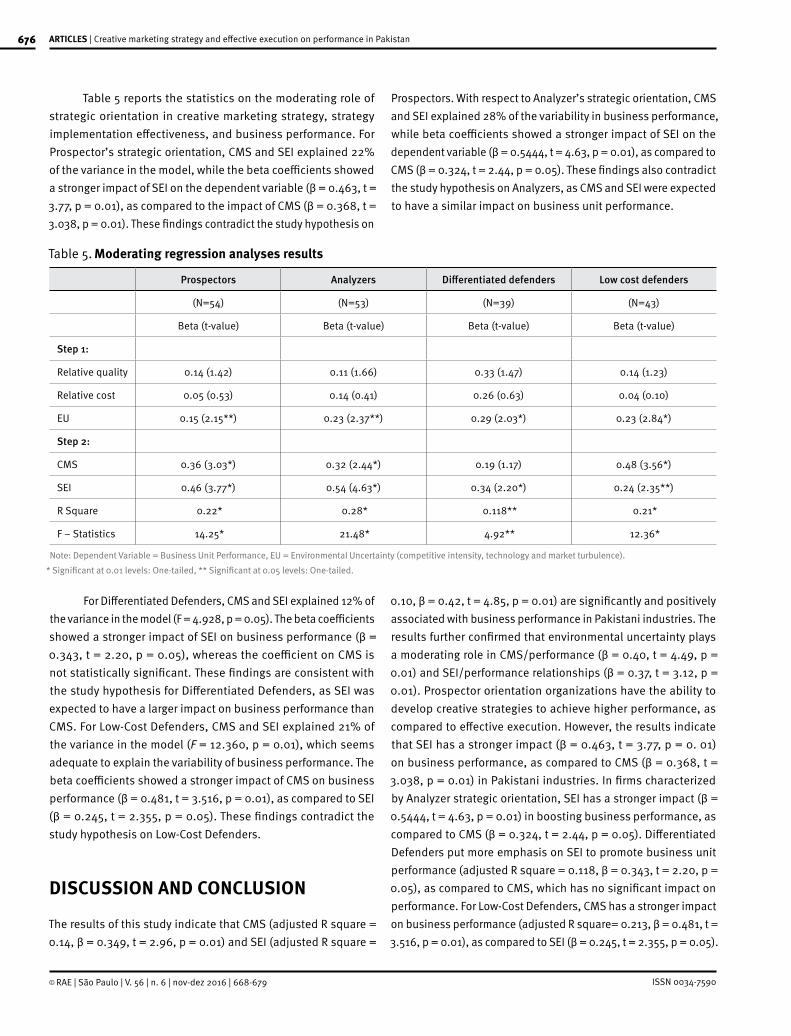
676
ISSN 0034-7590
ARTICLES | Creative marketing strategy and effective execution on performance in Pakistan
© RAE | São Paulo | V. 56 | n. 6 | nov-dez 2016 | 668-679
Table 5 reports the statistics on the moderating role of strategic orientation in creative marketing strategy, strategy implementation effectiveness, and business performance. For Prospector’s strategic orientation, CMS and SEI explained 22% of the variance in the model, while the beta coefficients showed a stronger impact of SEI on the dependent variable (β = 0.463, t = 3.77, p = 0.01), as compared to the impact of CMS (β = 0.368, t = 3.038, p = 0.01). These findings contradict the study hypothesis on
Prospectors. With respect to Analyzer’s strategic orientation, CMS and SEI explained 28% of the variability in business performance, while beta coefficients showed a stronger impact of SEI on the dependent variable (β = 0.5444, t = 4.63, p = 0.01), as compared to CMS (β = 0.324, t = 2.44, p = 0.05). These findings also contradict the study hypothesis on Analyzers, as CMS and SEI were expected to have a similar impact on business unit performance.
Table 5. Moderating regression analyses results
Prospectors Analyzers Differentiated defenders Low cost defenders
(N=54) (N=53) (N=39) (N=43)
Beta (t-value) Beta (t-value) Beta (t-value) Beta (t-value)
Step 1:
Relative quality 0.14 (1.42) 0.11 (1.66) 0.33 (1.47) 0.14 (1.23)
Relative cost 0.05 (0.53) 0.14 (0.41) 0.26 (0.63) 0.04 (0.10)
EU 0.15 (2.15**) 0.23 (2.37**) 0.29 (2.03*) 0.23 (2.84*)
Step 2:
CMS 0.36 (3.03*) 0.32 (2.44*) 0.19 (1.17) 0.48 (3.56*)
SEI 0.46 (3.77*) 0.54 (4.63*) 0.34 (2.20*) 0.24 (2.35**)
R Square 0.22* 0.28* 0.118** 0.21*
F – Statistics 14.25* 21.48* 4.92** 12.36*
Note: Dependent Variable = Business Unit Performance, EU = Environmental Uncertainty (competitive intensity, technology and market turbulence).* Significant at 0.01 levels: One-tailed, ** Significant at 0.05 levels: One-tailed.
For Differentiated Defenders, CMS and SEI explained 12% of the variance in the model (F = 4.928, p = 0.05). The beta coefficients showed a stronger impact of SEI on business performance (β = 0.343, t = 2.20, p = 0.05), whereas the coefficient on CMS is not statistically significant. These findings are consistent with the study hypothesis for Differentiated Defenders, as SEI was expected to have a larger impact on business performance than CMS. For Low-Cost Defenders, CMS and SEI explained 21% of the variance in the model (F = 12.360, p = 0.01), which seems adequate to explain the variability of business performance. The beta coefficients showed a stronger impact of CMS on business performance (β = 0.481, t = 3.516, p = 0.01), as compared to SEI (β = 0.245, t = 2.355, p = 0.05). These findings contradict the study hypothesis on Low-Cost Defenders.
DISCUSSION AND CONCLUSION
The results of this study indicate that CMS (adjusted R square = 0.14, β = 0.349, t = 2.96, p = 0.01) and SEI (adjusted R square =
0.10, β = 0.42, t = 4.85, p = 0.01) are significantly and positively associated with business performance in Pakistani industries. The results further confirmed that environmental uncertainty plays a moderating role in CMS/performance (β = 0.40, t = 4.49, p = 0.01) and SEI/performance relationships (β = 0.37, t = 3.12, p = 0.01). Prospector orientation organizations have the ability to develop creative strategies to achieve higher performance, as compared to effective execution. However, the results indicate that SEI has a stronger impact (β = 0.463, t = 3.77, p = 0. 01) on business performance, as compared to CMS (β = 0.368, t = 3.038, p = 0.01) in Pakistani industries. In firms characterized by Analyzer strategic orientation, SEI has a stronger impact (β = 0.5444, t = 4.63, p = 0.01) in boosting business performance, as compared to CMS (β = 0.324, t = 2.44, p = 0.05). Differentiated Defenders put more emphasis on SEI to promote business unit performance (adjusted R square = 0.118, β = 0.343, t = 2.20, p = 0.05), as compared to CMS, which has no significant impact on performance. For Low-Cost Defenders, CMS has a stronger impact on business performance (adjusted R square= 0.213, β = 0.481, t = 3.516, p = 0.01), as compared to SEI (β = 0.245, t = 2.355, p = 0.05).

677
ISSN 0034-7590
AUTHORS | Muhammad Ishtiaq Ishaq | Nazia Munazer Hussain
© RAE | São Paulo | V. 56 | n. 6 | nov-dez 2016 | 668-679
This study produced some unique, unexpected, and interesting findings with respect to Pakistani industries. The results showed that creative marketing strategies and effective execution have a positive impact on performance across diversified industries operating in Pakistan. This work complemented previous research findings, where different researchers identified the importance of creativity and implementation for performance enhancement (Ishaq, 2013; Slater et al., 2010; Walker & Ruekert, 1987). To the best of our knowledge, this is the first study of its kind that focuses on Asia, especially on the Pakistani context, and (1) utilizes the Walker and Ruekert’s (1987) model for differentiating between Differentiated Defenders and Low-Cost Defenders; (2) addresses the impact of environmental uncertainty in highly unpredictable business markets, such as Pakistan.
In the highly competitive environment in which current businesses operate, it is hard to recognize the factors through which an organization creates innovative marketing strategies and plan their effective execution. Innovation in marketing strategies can only evolve with the help unique organizational characteristics and effective planning, and need to be further implemented to achieve good results. Research findings (for reference see Andrews & Smith, 1996; Ishaq, 2013; Salter et al. 2010) showed that creative marketing programs have the ability to influence individual factors, but also situational forces, such as low time pressure, formal planning process, organizational processes, formal business education, macro-environment, and manager’s knowledge of different business operations. In another study, Menon et al. (1999) reported that communication quality and integration among cross function teams are positively influenced by creative marketing programs. Kirca et al. (2006) conducted a meta-analysis on market orientation’s antecedents and consequences and claimed that market orientation is strongly linked with innovativeness. This result suggests that market-oriented organizations with creative strategies are well focused on consumers’ latent needs. Noble and Mokwa (1999) are considered the first authors to analyze the antecedents of effective implementation and concluded that the relationship between marketing strategy and a strategy effective implementation and the vision of the organization is mediated by the managers’ commitment.
On the other hand, different researches assessed the interaction between marketing organizational structures and product-market strategies (Olson, Slater, & Hult, 2005b), and performance and market orientations (Ishaq, 2013; Matsuno & Mentzer, 2000; Slater et al., 2010; Vorhies & Morgan, 2003). However, no study has ever taken into consideration organizational characteristics across different geographies. This research produced some important facts and figures relative to the Asian
market. Although it surely has multiple strategic implications, this research also has some limitations. The study is based on the survey method and cross-sectional research design. Hence, researchers should take the study design into consideration while interpreting the study results. Future research should undertake longitudinal research to investigate the causal inference among the study variables. In addition, a single respondent from each business unit/organization has been addressed, which is an important limitation. Future research should use multiple raters from the same organizations, which will enhance the reliability of the results as “less knowledgeable informants can actually decrease the accuracy of responses” (Huber & Power, 1985).
REFERENCES
Abernathy, W. J. (1978). The productivity dilemma: Roadblock to inno-vation in the automobile industry (Vol. 35): Johns Hopkins University Press Baltimore, MD.
Andrews, J., & Smith, D. C. (1996). In search of the marketing imagi-nation: Factors affecting the creativity of marketing programs for mature products. Journal of Marketing Research, 33(2), 174-187. doi:10.2307/3152145
Armstrong, J., & Overton, T. (1977). Estimating nonresponse bias in mail surveys. Journal of Marketing Research, 14(3), 396-402. doi:10.2307/3150783
Barney, J. (1991). Firm resources and sustained competi-tive advantage. Journal of Management, 17(1), 99-120. doi:10.1177/014920639101700108
Bonoma, T. V. (1984). Making your marketing strategy work. Harvard Business Review, 62(2). Retrieved from https://hbr.org/
Bourgeois, L. J., & Brodwin, D. R. (1984). Strategic implementation: Five approaches to an elusive phenomenon. Strategic Management Jour-nal, 5(3), 241-264. doi:10.1002/smj.4250050305
Bower, J. L., & Gilbert, C. G. (2007). How managers’ everyday decisions create-or destroy-your company’s strategy. Harvard Business Review, 85(2). Retrieved from https://hbr.org/
Cattell, R. B. (1966). The scree test for the number of factors. Multivar-iate Behavioral Research, 1(2), 245-276. doi:10.1207/s15327906m-br0102_10
Cespedes, F. V., & Piercy, N. F. (1996). Implementing marketing strategy. Journal of Marketing Management, 12(1-3), 135-160. doi:10.1080/0267257X.1996.9964405
Chebat, J.-C. (1999). Special issue on strategy implementation and as-sessment research: Research on implementation deserves as much attention as strategy formulation. Journal of Business Research, 45(2), 107-109. doi:10.1016/S0148-2963(97)00229-4
Deshpande, R., & Webster Jr, F. E. (1989). Organizational culture and marketing: Defining the research agenda. Journal of Marketing, 53(1), 3-15. doi:10.2307/1251521
Dickson, P. R. (1992). Toward a general theory of competitive rationality. Journal of Marketing, 56(1), 69-83. doi:10.2307/1252133
678
ISSN 0034-7590
ARTICLES | Creative marketing strategy and effective execution on performance in Pakistan
© RAE | São Paulo | V. 56 | n. 6 | nov-dez 2016 | 668-679
Dickson, P. R., Farris, P. W., & Verbeke, W. J. (2001). Dynamic strategic thinking. Journal of the Academy of Marketing Science, 29(3), 216-237. doi:10.1177/03079459994605
Guth, W. D., & MacMillan, I. C. (1986). Strategy implementation versus middle management self interest. Strategic Management Journal, 7(4), 313-327. doi:10.1002/smj.4250070403
Hamel, G. (1998). Opinion: Strategy innovation and the quest for value. MIT Sloan Management Review, 39(2). Retrieved from http://sloan-review.mit.edu/
Hindo, B. (2007). At 3M, a struggle between efficiency and creativity. Business Week, 11. Retrieved from http://www.bloomberg.com/busi-nessweek
Hrebiniak, L. G. (2005). Making strategy work: Leading effective execu-tion and change. New Jersey, USA: Pearson Education.
Im, S., & Workman Jr, J. P. (2004). Market orientation, creativity, and new product performance in high-technology firms. Journal of Marketing, 68(2), 114-132. doi:10.1509/jmkg.68.2.114.27788
Ishaq, M. I. (2013). Marketing Strategy and business unit performance: Empirical evidence from Pakistani industries. Saarbrücken, Germany: LAP Lambert Academic Publishing.
James, L. R., Demaree, R. G., & Wolf, G. (1984). Estimating within-group interrater reliability with and without response bias. Journal of Ap-plied Psychology, 69(1), 85-98. doi:10.1037/0021-9010.69.1.85
Jaworski, B. J., & Kohli, A. K. (1993). Market orientation: Anteced-ents and consequences. Journal of Marketing, 57(3), 53-70. doi:10.2307/1251854
Kim, W. C., & Mauborgne, R. (2004). Blue ocean strategy. Harvard Busi-ness Review, 10. Retrieved from https://hbr.org/
Konovsky, M. A. (2000). Understanding procedural justice and its im-pact on business organizations. Journal of management, 26(3), 489-511. doi: 10.1177/014920630002600306
March, J. G. (1991). Exploration and exploitation in organizational learn-ing. Organization Science, 2(1), 71-87. doi:10.1287/orsc.2.1.71
Markides, C. (1999). Six principles of breakthrough strategy. Business Strategy Review, 10(2), 1-10. doi:10.1111/1467-8616.00096
Matsuno, K., & Mentzer, J. T. (2000). The effects of strategy type on the market orientation-performance relationship. Journal of Marketing, 64(4), 1-16.
Menon, A., Bharadwaj, S. G., Adidam, P. T., & Edison, S. W. (1999). An-tecedents and consequences of marketing strategy making: A model and a test. Journal of Marketing, 63((2), 18-40. doi:10.2307/1251943
Miles, R. E., & Snow, C. C., (1978). Organizational strategy, structure, and process. New York: McGraw-Hill.
Miller, D., Dröge, C., & Toulouse, J.-M. (1988). Strategic process and content as mediators between organizational context and structure. Academy of Management Journal, 31(3), 544-569.
Miller, S., Wilson, D., & Hickson, D. (2004). Beyond planning: Strategies for successfully implementing strategic decisions. Long Range Plan-ning, 37(3), 201-218. doi:10.1016/j.lrp.2004.03.003
Moore, G. (1991). Crossing the chasm: Marketing and selling technology products to mainstream customers. New York, USA: HarperBusiness.
Moorman, C., & Miner, A. S. (1998). The convergence of planning and execution: Improvisation in new product development. Journal of Marketing, 62(3), 1-20. doi:10.2307/1251740
Naeem, B., Nawaz, M. M., & Ishaq, M. I. (2012). Implications of market-ing strategy for prospectors, analyzers and defenders. African Journal of Business Management, 6(4), 1527-1531. doi:10.5897/ajbm11.2294
Naeem, B., Nawaz, M. M., Rana, A. A., & Ishaq, M. I. (2011). Do crea-tive marketing strategy and its effective execution promote business performance? An empirical assessment. African Journal of Business Management, 5(30), 12108-12113. doi:10.5897/ajbm11.1154
Narver, J. C., Slater, S. F., & MacLachlan, D. L. (2004). Responsive and proactive market orientation and new product success. Journal of Product Innovation Management, 21(5), 334-347. doi:10.1111/j.0737-6782.2004.00086.x
Neilson, G. L., Martin, K. L., & Powers, E. (2008). The secrets to success-ful strategy execution. Harvard Business Review, 86(6). Retrieved from http://hbrbr.com.br/
Noble, C. H., & Mokwa, M. P. (1999). Implementing marketing strategies: Developing and testing a managerial theory. Journal of Marketing, 63(4), 57-73. doi:10.2307/1251974
Nohria, N., Joyce, W., & Roberson, B. (2003). What really works: Au-dio-Tech Business Book Summaries.
O Reilly, C. A., & Tushman, M. L. (2004). The ambidextrous organization. Harvard Business Review, 82(4). Retrieved from http://hbrbr.com.br/
Olson, E. M., Slater, S. F., & Hult, G. T. M. (2005a). The importance of structure and process to strategy implementation. Business Horizons, 48(1), 47-54. doi:10.1016/j.bushor.2004.10.002
Olson, E. M., Slater, S. F., & Hult, G. T. M. (2005b). The performance implications of fit among business strategy, marketing organization structure, and strategic behavior. Journal of marketing, 69(3), 49-65.
Piercy, N. (2009). Market-led strategic change: A guide to transforming the process of going to market. New York, USA: Routledge.
Porter, M. E. (1980). Competitive strategies: Techniques for analyzing industries and competitors. New York, USA: The Free Press..
Quinn, R. E., & Rohrbaugh, J. (1983). A spatial model of effectiveness cri-teria: Towards a competing values approach to organizational anal-ysis. Management Science, 29(3), 363-377. 10.1287/mnsc.29.3.363
Slater, S. F., & Narver, J. C. (1994). Does competitive environment mod-erate the market orientation-performance relationship? Journal of Marketing, 58(1), 46-55. doi:10.2307/1252250
Slater, S. F., & Olson, E. M. (2000). Strategy type and performance: The influence of sales force management. Strategic Management Journal, 21(8), 813-829. doi:10.1002/1097-0266(200008)21:8<813::aid-sm-j122>3.0.co;2-g
Slater, S. F., & Olson, E. M. (2001). Marketing’s contribution to the im-plementation of business strategy: An empirical analysis. Strategic Management Journal, 22(11), 1055-1067. doi:10.1002/smj.198
Slater, S. F., Hult, G. T. M., & Olson, E. M. (2007). On the importance of matching strategic behavior and target market selection to business strategy in high-tech markets. Journal of the Academy of Marketing Science, 35(1), 5-17. doi:10.1007/s11747-006-0002-4
Slater, S. F., Hult, G. T. M., & Olson, E. M. (2010). Factors influencing the relative importance of marketing strategy creativity and marketing strategy implementation effectiveness. Industrial Marketing Man-agement, 39(4), 551-559. doi:10.1016/j.indmarman.2008.03.007
Teece, D. J., Pisano, G., & Shuen, A. (1997). Dynamic capabilities and strategic management. Strategic Management Journal, 18(7), 509-533.

679
ISSN 0034-7590
AUTHORS | Muhammad Ishtiaq Ishaq | Nazia Munazer Hussain
© RAE | São Paulo | V. 56 | n. 6 | nov-dez 2016 | 668-679
Varadarajan, P. R., & Clark, T. (1994). Delineating the scope of corpo-rate, business, and marketing strategy. Journal of Business Research, 31(2-3), 93-105. doi:10.1016/0148-2963(94)90074-4
Varadarajan, P. R., Jayachandran, S., & White, J. C. (2001). Strategic interdependence in organizations: Deconglomeration and mar-keting strategy. Journal of Marketing, 65(1), 15-28. doi:10.1509/jmkg.65.1.15.18129
Vorhies, D. W., & Morgan, N. A. (2005). Benchmarking marketing capa-bilities for sustainable competitive advantage. Journal of Marketing, 69(1), 80-94. doi:10.1509/jmkg.69.1.80.55505
Walker Jr, O. C., & Ruekert, R. W. (1987). Marketing’s role in the imple-mentation of business strategies: A critical review and conceptual framework. Journal of Marketing, 51(3), 15-33. doi:10.2307/1251645
Wind, Y., & Robertson, T. S. (1983). Marketing strategy: New direc-tions for theory and research. Journal of Marketing, 47(2), 12-25. doi:10.2307/1251490
Workman Jr, J. P., Homburg, C., & Gruner, K. (1998). Marketing organ-ization: An integrative framework of dimensions and determinants. Journal of Marketing, 62(3), 21-41.

680
ISSN 0034-7590© RAE | São Paulo | V. 56 | n. 6 | nov-dez 2016 | 680-681
RAE-Revista de Administração de Empresas | FGV/EAESP
RESENHA
PorTHIAGO DE SOUSA BARROS
[email protected] em Administração pela Fundação Getulio Vargas, Escola de
Administração de Empresas de São Paulo – São Paulo – SP, Brasil
BEHAVIORAL FINANCE: FATORES PSICOLÓGICOS E DECISÕES DE INVESTIMENTO
FINANÇAS COMPORTAMENTAIS: QUANDO A ECONOMIA ENCONTRA A PSICOLOGIAJúlio Lobão. Coimbra, Portugal: Conjuntura Actual Editora, 2012, 295 p.
São parcos os livros brasileiros que abordam a temática das finanças comportamen-tais, havendo predominância de publicações de artigos em revistas científicas, mas não uma obra completa que envolva as diversas teorias por trás do amplo guarda-chu-va da chamada behavioral finance. Tal lacuna pode ser preenchida com a publicação do livro “Finanças comportamentais: Quando a economia encontra a psicologia”, da-tado de 2012 e com versão em português de Portugal, pela editora Actual, onde Júlio Lobão, doutor em economia e professor de finanças da Universidade do Porto, elucida pontos cruciais para o pleno entendimento dessa matéria, com linguagem acessível e fundamentações consistentes.
No primeiro capítulo, o autor discorre a respeito dos aspectos fundamentais eri-gidos pelas finanças tradicionais, em especial o homem econômico – e sua racio-nalidade perfeita, autointeresse perfeito e detentor de uma informação perfeita –, a eficiência de mercado e as decisões financeiras individuais, para contrapor tais argu-mentações às recentes descobertas das finanças comportamentais. Desse modo, Lo-bão parte dos precedentes históricos dessa disciplina assaz importante e chega ao contexto contemporâneo, enfatizando as principais críticas e debates existentes entre essas duas vertentes do vasto campo das finanças.
Avançando nessa seara, o segundo capítulo aprofunda o nível de discussão e aponta as insuficiências do paradigma racional, embasando suas teses em pesqui-sadores do quilate de Stiglitz, Sharpe e Roll. Mostra os problemas graves oriundos da aplicabilidade empírica de modelos como o CAPM, pois o beta dos ativos não é ca-paz de prever as rentabilidades com precisão (dado que modelos multifatoriais apre-sentam melhores resultados) e uma parcela significativa da rentabilidade das ações não consegue ser justificada pelo risco sistemático (há, inclusive, um conjunto de fa-tos não explicados listados na literatura, designados por anomalias), além de que os modelos de equilíbrio racionais alternativos têm problemas de consistência interna.
O capítulo 3 é um compêndio das diversas facetas teóricas que tangenciam a de-cisão dos investidores; nele, o livro ganha fôlego e atinge seu píncaro analítico, dis-
DOI: http://dx.doi.org/10.1590/S0034-759020160609
681
ISSN 0034-7590 © RAE | São Paulo | V. 56 | n. 6 | nov-dez 2016 | 680-681
correndo acerca das questões de racionalidade (maximização da utilidade esperada quanto a preferências e a regra de Bayes para opiniões), observando fatos e exemplos flagrantes de ra-cionalidade limitada, com especial destaque às violações da re-gra de utilidade esperada pelo enfoque dos paradoxos de Allais e Ellsberg, perpassando pela Teoria Perspectiva de Kahneman e Tversky, pelos enviesamentos cognitivos e emocionais dos in-vestidores (onde são citados elementos como aversão ao arre-pendimento, efeitos de ancoragem, excesso de confiança ou otimismo, além da chamada contabilidade mental e uma gama de outros atributos que afetam a tomada de decisão), e culmi-nando nos fatores de efeito coletivo. Um vasto arcabouço teóri-co é revisitado, e a própria frase cunhada pelo filósofo holandês Spinoza (1632-1677), que é utilizada para abrir o capítulo, pode ser utilizada para exprimir, sucintamente, as diversas nuances por trás dos investidores que afetam, significativamente, suas tomadas de decisões, afinal, “os homens acreditam ser livres apenas porque têm consciência das suas ações, mas não das causas que as determinam” (p. 79), negligenciado e relegando a um segundo plano a importância dessas características emo-cionais nos atos de investimento.
Sob esse enfoque, como bem aduziu Krugman (How did economists get it so wrong? New York Times, 2009, 2 Setem-bro), os economistas (e aqui incluo administradores, engenhei-ros e tomadores de decisões financeiras como um todo) terão que reconhecer a relevância da irracionalidade e da frequen-te imprevisibilidade dos comportamentos, além de enfrentar as imperfeições próprias dos mercados e aceitar que se está mui-to longe de se ter uma teoria elegante que explique todos os fe-nômenos financeiros.
Por isso, o quarto capítulo verte sobre os limites da arbitra-gem, trazendo reflexões relevantes a respeito dos riscos rela-
cionados à informação e modelos, bem como os enviesamen-tos cognitivos e emocionais dos arbitradores, chegando aos custos inerentes desse processo de implementação (custos de transação, inerentes ao risco de sincronização e decorrentes da contração de empréstimos). Tais características informacionais levam a obra a desembocar em seu último capítulo: “(Des)Equi-líbrios de mercado”.
Nessa reta final, Lobão adota uma estratégia cativante e prende o leitor às páginas que estão por vir. Em suma, ele faz um diálogo entre as finanças racionais e as finanças compor-tamentais, fomentando um debate profundo, com sólida fun-damentação teórica, capaz de delinear uma tela geral dos de-sequilíbrios de mercado, combinando cenários distintos de aversão ao risco e fricções de mercado (com o primeiro e sem o segundo, com o segundo e sem o primeiro, ou com as duas pos-sibilidades). Assim, o autor conclui seu livro com os principais modelos de finanças comportamentais e as evidências empíri-cas que suportam tais proposições de modelagem.
Em síntese, o livro de Lobão conseguiu amalgamar a essên-cia das finanças tradicionais e comportamentais, preocupando--se com a apresentação de fatos empíricos e mantendo acesa uma chama de constante contraposição entre essas duas cor-rentes das finanças, sendo esse jogo entre o que cada esfera teórica dispõe uma maneira interessante de construir o raciocí-nio existente por trás da narrativa. A pergunta fundamental que norteia o texto do economista português é: Podem os investido-res aprender a ser totalmente racionais? Conforme o desenrolar das análises contidas nas 295 páginas, percebemos que não, uma vez que a origem das limitações à racionalidade é cogni-tiva e emocional, não se tratando de causas incidentais e con-tingenciais, mas, sim, de fatores profundamente enraizados na forma como interpretamos a informação e tomamos decisões.

682 RAE-Revista de Administração de Empresas | FGV/EAESP
ISSN 0034-7590© RAE | São Paulo | V. 56 | n. 6 | nov-dez 2016 | 682
INDICAÇÕES BIBLIOGRÁFICASVocê é transdisciplinar? Míriam Ribeiro de Barros Shaw | [email protected]
Transdisciplinaridade é uma conduta, opção de pensamento, forma de ação. Para Edgar Morin, somos 100% natureza e 100% cultura. Essa proposição quer dizer que somos fortes e frágeis ao mesmo tempo, temos um potencial quase inexplicável de criar, transformar, de nos religarmos a nós mesmos e às condições que nos rodeiam. Transformação dos limites emocionais, físicos, sociais, religação de saberes. Os autores lembrados nestas indicações de leitura desafiam os limites acadêmicos, empresariais e institucionais. Questionam suas próprias posturas pessoais quanto à ética, afetividade e imaginação na produção de ciência, de políticas públicas, da educação. Propõem inovações, religam conhecimentos e reinventam-se a si mesmos. São transdisciplinares. Míriam Ribeiro de Barros Shaw é socióloga, membro do Núcleo de Estudos da Complexidade (PUC-SP).
EDUCAÇÃO DOS SENTIDOS e mais... Rubem Alves. 8a ed. Campinas, SP: Verus, 2012. 126 p.
Neste ensaio sobre os cinco sentidos, educar, para Rubem Alves, é experimentar, vivenciar, integrar as sensibilidades. Os sentidos fazem a mediação entre o vivido e o desejado. Destaque para a linguagem poética, a delicadeza de figuras de lin-guagem, a proposição de integração e a religação dos indivíduos com eles mes-mos, por meio da melhor percepção de seus próprios sentidos e da consequente ampliação do seu olhar para o mundo.
A VIA PARA O FUTURO DA HUMANIDADE. Edgar Morin. Rio de Janeiro, RJ: Bertrand Brasil, 2013. 392 p.
Texto propositivo de uma política da humanidade. Para tanto, apresenta uma ar-quitetura de reformas interdependentes, regenerativas das relações sociais; do pensamento e educação, conhecimento e comunicação; da saúde, cidade, agri-cultura, alimentação, consumo, trabalho; da moral, família, condição feminina, adolescência, envelhecimento e morte. Edgar Morin convida o leitor a assumir uma atitude de esperança e coragem com as injustiças, desigualdades e intole-râncias, apostando nas mudanças e metamorfoses do mundo contemporâneo.
CULTURA E PENSAMENTO COMPLEXO. Maria da Conceição de Almeida & Edgard de Assis Carvalho. Porto Alegre, RS: Sulina, 2012. 159 p.
Edgard Carvalho e Conceição de Almeida, neste conjunto de sete ensaios curtos e claros, fazem conexões entre cultura e educação. Relembram que os sistemas de explicação do mundo são biodegradáveis, renovam-se, não se subordinam a pa-radigmas dominantes, lançam interrogações para o entendimento humano. Con-firmam o fato de que a educação é uma via de transformação da humanidade e de que a escola brasileira ocupa papel de destaque no cenário mundial de com-plexidade.
ILYA PRIGOGINE: Ciência, razão e paixão. Edgard de Assis Carvalho & Maria da Conceição de Almeida (Orgs.). Coleção Contextos da Ciência. São Paulo, SP: Livraria da Física, 2009. 112 p.
Conjunto de entrevistas, ensaios e resenhas. A ciência está sob o olhar de Ilya Prigogine, que atribui a ela a marca da complexidade, uma vez que os cientis-tas e suas pesquisas consideram suas proposições incertas, variantes, delicadas, transformáveis e transformantes, instáveis, criativas e abundantemente huma-nas. Nesse sentido, a criatividade, a sensibilidade, a fluidez, a regeneração e a degeneração guiam o compromisso de todos na invenção, construção e recons-trução do mundo.
ENSINAR A VIVER: Manifesto para mudar a educação.Edgar Morin. Porto Alegre, RS: Sulina, 2015. 183 p.
Ensaio sobre conhecimento, ciência e educação. Manifesto objetivo e provocador para mudar a educação. Edgar Morin estimula o leitor a compreender o valor do erro, a importância da incerteza. Sugere a religação dos saberes, a superação da simplificação, da redução da ciência. A educação revitaliza-se na missão de ensinar, atualiza-se na tarefa de ensinar a viver bem e criar perspectivas para a ciência, a arte, a religião, o futuro.

683Indicações Bibliográficas
ISSN 0034-7590 © RAE | São Paulo | V. 56 | n. 6 | nov-dez 2016 | 683
Instituições e seu impacto no desempenho das empresasDavid Kallás | [email protected]
Instituições interagem com as organizações de maneira dinâmica, influenciando as decisões estratégicas e, consequentemente, o desempenho. A integração entre o que acontece no nível país se relaciona com o que se passa no nível firma de modo recíproco e tem sido um campo fértil de pesquisas que ajudam a entender, entre outras, as diferenças observadas nos comportamentos de empresas e governos em países desenvolvidos e emergentes. Esse tema é tão instigante que pelo menos oito dos mais recentes ganhadores do prêmio Nobel de Economia se debruçaram sobre esse tema, entre eles Douglass North e Oliver E. Williamson. A lista a seguir, elaborada por David Kallás, professor de Estratégia no Insper, contempla as obras clássicas desses autores e apresenta algumas referências adicionais relevantes para pesquisadores e interessados no tema.
INSTITUTIONS, INSTITUTIONAL CHANGE AND ECONOMIC PERFORMANCE. Douglass C. North. New York, USA: Cambridge University Press, 1990. 159 p.
Obra clássica em que aparecem as definições fundamentais do tema, entre elas a de que as instituições são a regra do jogo em uma sociedade que rege as inte-rações humanas. O ganhador do prêmio Nobel explica as diferenças de desem-penho das economias em longos períodos. Com a questão “Qual combinação de instituições melhor permite a captura dos ganhos das transações?”, ele oferece uma perspectiva de como instituições persistem e mudam com o passar do tempo.
THE NEW INSTITUTIONALISM IN ORGANIZATIONAL ANALYSIS. Walter W. Powell & Paul J. DiMaggio (Eds.). London, UK: University of Chicago Press, 1991. 486 p.
A visão sociológica representada por esta obra indispensável de Powell & DiMa-ggio sugere que as preferências individuais e categorias básicas de pensamento, tais como o indivíduo, a ação social, o Estado e a cidadania, são moldadas pelas forças institucionais. A teoria organizacional e sociológica rejeita a hipótese do modelo de ator racional, o interesse nas instituições como variáveis independen-tes, explicações cognitivas e culturais e a agregação de atributos individuais como explicação para o grupo.
THE ECONOMIC INSTITUTIONS OF CAPITALISM. Oliver E. Williamson. New York, USA: Free Press, 1985. 468 p.
O autor, também ganhador do Nobel, criou, na década de 1980, a nova teoria ins-titucional, rompendo com as existentes até então. O tema central passa a ser a economia dos custos de transação e a questão dos investimentos idiossincráti-cos. Essa teoria permite analisar os impactos das relações contratuais nas deci-sões de integração vertical e de governança, ou seja, economizar na produção de um bem ou serviço ou nos custos de transação (a tradicional escolha make or buy).
VARIETIES OF CAPITALISM: The institutional foundations of comparative advantage. Peter A. Hall & David Soskice (Eds.). Oxford: Oxford University Press, 2001. 560 p.
Esta obra propõe um framework para o entendimento das similaridades e diferen-ças institucionais entre economias desenvolvidas. A visão das variedades do ca-pitalismo é baseada nos conceitos de ciência política e aponta não haver um con-junto único e ótimo de instituições. As nações, entretanto, podem gerar vantagens competitivas por meio de sua infraestrutura institucional. Baseados nas propostas seminais deste livro, diversos pesquisadores expandiram o conceito para enten-der o funcionamento de outras economias, como as emergentes.
REINVENTANDO O CAPITALISMO DE ESTADO: O Leviatã nos negócios: Brasil e outros países. Aldo Musacchio & Sergio G. Lazzarini. São Paulo, SP: Portfolio-Penguin, 2015. 408 p.
Aborda a ascensão de uma nova espécie de capitalismo de Estado nos países emergentes, em que o governo (o Leviatã) interage com os investidores privados, atuando como acionista minoritário de companhias abertas ou como apoiador financeiro de empresas privadas (as “campeãs nacionais”). Os autores examinam o impacto do novo capitalismo de Estado nos investimentos e desempenho das empresas, mostrando como o debate sobre propriedade privada ou estatal tornou-se irrelevante.

684
ISSN 0034-7590
RAE-Revista de Administração de Empresas | FGV/EAESP
© RAE | São Paulo | V. 56 | n. 6 | nov-dez 2016
GOVERNANÇA
Entidade de caráter técnico-científico e filantrópico, instituída em 20 de dezembro de 1944 como pessoa jurídica de direito privado, visando ao estudo dos problemas da organização racional do trabalho, especialmente nos seus aspectos administrativos e social, e à conformidade de seus métodos às condições do meio brasileiro.
Primeiro Presidente e Fundador: Luiz Simões Lopes
Presidente: Carlos Ivan Simonsen Leal
Vice-presidentes: Francisco Oswaldo Neves Dornelles, Marcos Cintra Cavalcanti de Albuquerque,Sergio Franklin Quintella.
CONSELHO DIRETORPresidente: Carlos Ivan Simonsen Leal
Vice-presidentes: Francisco Oswaldo Neves Dornelles, Marcos Cintra Cavalcanti de Albuquerque,Sergio Franklin Quintella.
Vogais: Armando Klabin, Carlos Alberto Pires de Carvalho e Albuquerque, Cristiano Buarque Franco Neto, Ernane Galvêas, José Luiz Miranda, Lindolpho de Carvalho Dias, Marcílio Marques Moreira, Roberto Paulo Cezar de Andrade.
Suplentes: Aldo Floris, Antonio Monteiro de Castro Filho, Ary Oswaldo Mattos Filho, Eduardo Baptista Vianna, Gilberto Duarte Prado, Jacob Palis Júnior, José Ermírio de Moraes Neto, Marcelo José Basílio de Souza Marinho, Mauricio Matos Peixoto.
CONSELHO CURADORPresidente: Carlos Alberto Lenz César Protásio
Vice-presidente: José Alfredo Dias Lins (Klabin Irmãos & Cia.)
Vogais: Alexandre Koch Torres de Assis, Antonio Alberto Gouvêa Vieira, Andrea Martini (Souza Cruz S/A, Eduardo M. Krieger, Estado do Rio Grande do Sul, Estado da Bahia, Luiz Chor, Marcelo Serfaty, Marcio João de Andrade Fortes, Murilo Portugal Filho (Federação Brasileira de Bancos), Pedro Henrique Mariani Bittencourt (Banco BBM S.A), Orlando dos Santos Marques (Publicis Brasil Comunicação Ltda), Raul Calfat (Votorantim Participações S.A), José Carlos Cardoso (IRB-Brasil Resseguros S.A), Ronaldo Vilela (Sindicato das Empresas de Seguros Privados, de Previdência Complementar e de Capitalização nos Estados do Rio de Janeiro e do Espírito Santo), Sandoval Carneiro Junior, Willy Otto Jordan Neto.Suplentes: José Carlos Schmidt Murta Ribeiro, Luiz Ildefonso Simões Lopes (Brookfield Brasil Ltda), Luiz Roberto Nascimento Silva, Manoel Fernando Thompson Motta Filho, Nilson Teixeira (Banco de Investimentos Crédit Suisse S.A), Olavo Monteiro de Carvalho (Monteiro Aranha Participações S.A), Patrick de Larragoiti Lucas (Sul América Companhia Nacional de Seguros), Clóvis Torres (VALE S.A.), Rui Barreto, Sergio Lins Andrade, Victório Carlos De Marchi.
UNIDADES DA FGV-SPEscola de Administração de Empresas de São PauloDiretor: Luiz Artur Ledur Brito
Escola de Economia de São PauloDiretor: Yoshiaki Nakano
Escola de Direito de São PauloDiretor: Oscar Vilhena Vieira
FGV ProjetosDiretor: Cesar Cunha Campos
Diretor Técnico: Ricardo Simonsen
Diretor de Controle: Antônio Carlos Kfouri Aidar
Diretor de Qualidade: Francisco Eduardo Torres de Sá
Diretor de Mercado: Sidnei Gonzalez
Diretores-Adjuntos de Mercado: Carlos Augusto Lopes da Costa e José Bento Carlos Amaral Júnior
Diretoria da FGV para assuntos da FGV-SP
Diretor: Maria Tereza Leme Fleury
Diretoria de Operações da FGV-SP: Mario Rocha Souza
DIRETORIADiretor: Luiz Artur Ledur Brito
Vice-Diretor: Tales Andreassi
CONGREGAÇÃOPresidente: Luiz Artur Ledur Brito
CONSELHO DE GESTÃO ACADÊMICAPresidente: Luiz Artur Ledur Brito
DEPARTAMENTOS DE ENSINO E PESQUISAAdministração da Produção e de Operações:Susana Carla Farias Pereira
Administração Geral e Recursos Humanos:Maria Ester de Freitas
Contabilidade, Finanças e Controle: Jean Jacques Salim
Fundamentos Sociais e Jurídicos da Administração: Ligia Maura Costa
Informática e Métodos Quantitativos Aplicados à Administração: André Luiz Silva Samartini
Mercadologia: Delane Botelho
Planejamento e Análise Econômica Aplicados à Administração: Arthur Barrionuevo Filho
Gestão Pública: Peter Kevin Spink
CURSOS, PROGRAMAS E SERVIÇOSCurso de Especialização em Administração para Graduados (CEAG): Luis Henrique Pereira
Curso de Especialização em Administração Hospitalar e de Sistemas de Saúde (CEAHS): Walter Cintra Ferreira Júnior
Master in Business and Management (MBM)Luís Henrique Rigato Vasconcellos
Mestrado e Doutorado em Administração de Empresas: Ely Laureano Paiva
Mestrado e Doutorado em Administração Pública e Governo: Mario Aquino Alves
Mestrado Profissional em Administração de Empresas (MPA): Marcelo Oliveira Coutinho de Lima
Mestrado Profissional em Gestão e Políticas Públicas: Regina Silvia Viotto Monteiro Pacheco
Mestrado Profissional em Gestão Internacional: Edgard Elie Roger Barki
Mestrado Profissional em Gestão para a Competitividade: Gilberto Sarfati
OneMBA: Marina de Camargo Heck
Coordenação Acadêmica para Educação Executiva da EAESP com o IDE: João Carlos Douat
Núcleo de Pesquisas/ GVpesquisa: Thomaz Wood Júnior
RAE-publicações: Maria José Tonelli
CENTROS DE ESTUDOSCentro de Empreendedorismoe Novos Negócios: Tales Andreassi
Centro de Estudos de AdministraçãoPública e Governo: Fernando Burgos Pimentel dos Santos
Centro de Estudos de Política e Economiado Setor Público: George Avelino Filho
Centro de Estudos em Planejamentoe Gestão de Saúde: Ana Maria Malik
Centro de Estudosem Sustentabilidade: Mário Prestes Monzoni Neto
Centro de Excelência em Logísticae Supply Chain: Priscila Laczynski de Souza Miguel
Centro de Excelência em Varejo: Maurício Gerbaudo Morgado
Centro de Tecnologiade Informação Aplicada: Alberto Luiz Albertin
Instituto de Finanças: João Carlos Douat
Centro de Estudos de Microfinanças e Inclusão Financeira: Lauro Emilio Gonzalez Farias
Centro de Estudos em Finanças: William Eid Jr.
Centro de Estudos em Private Equity: Newton Monteiro de Campos Neto
Centro de Estudos em Competitividade Internacional: Maria Tereza Leme Fleury
Fórum de Inovação: Marcos Augusto de Vasconcellos
Núcleo de Comunicação, Marketinge Redes Sociais Digitais: Eliane Pereira Zamith Brito
Núcleo de Estudos em Organizaçõese Pessoas: Maria José Tonelli
APOIOCentro de Desenvolvimento do Ensino e da Aprendizagem: Francisco Aranha
Coordenadoria de Avaliação Institucional: Heloisa Mônaco dos Santos
Centro de Carreiras: Renato Guimarães Ferreira
Coordenadoria deCultura e Diversidade: Inês Pereira e Samy Dana
Coordenadoria de Relações Internacionais: Julia Alice Sophia von Maltzan Pacheco
Serviço de Apoio e Atendimento Psicológico e Psiquiátrico - Pró-Saúde GV: Tiago Luis Corbisier Matheus
Alumni GV: Francisco Ilson Saraiva Junior
ASSOCIAÇÃO DOS FUNCIONÁRIOS DA FGV-EAESPPresidente: Vagner Neres da Silva
DIRETÓRIO ACADÊMICO GETULIO VARGASPresidente: Luis Gustavo Perez Fakhouri
DIRETORES DA RAEMaio/1961 a jun/65: Raimar Richers; jul/65 a dez/66: Yolanda F. Balcão; jan/67 a jun/68: Carlos Osmar Bertero; jul/68 a jun/69: Ary Bouzan; jul/69 a jun/71: Orlando Figueiredo;jul/71 a dez/72: Manoel Tosta Berlinck; jan/73 a jun/75: Robert N.V.C. Nicol; jul/75 a mar/80: Luiz Antonio de Oliveira Lima, abr/80 a mar/82: Sérgio Micelli Pessoa de Barros;abr/82 a dez/83: Yoshiaki Nakano; jan/84 a set/85: Sérgio Micelli Pessoa de Barros; out/85 a set/89: Maria Cecília Spina Forjaz; out/89 a dez/89: Maria Rita Garcia L. Durand;jan/90 a set/91: Gisela Taschner Goldenstein; out/91 a nov/95: Marilson Alves Gonçalves; dez/95 a dez/00: Roberto Venosa; jan/01 a dez/04: Thomaz Wood Jr.;jan/05 a ago/07: Carlos Osmar Bertero; ago/07 a ago/08: Francisco Aranha; set/08 a jan/09: Flávio Carvalho de Vasconcelos; fev/09 a dez/2015: Eduardo Diniz; jan/2016: Maria José Tonelli

LINHA EDITORIAL
MISSÃO
A RAE-Revista de Administração de Empresas tem como missão fomentar e disseminar a produção de conheci-mento, promovendo a integração da comunidade cien-tífica brasileira às comunidades científicas mundiais no campo da Administração.
FOCO
A RAE tem interesse na publicação de artigos de desen-volvimento teórico, trabalhos empíricos e ensaios nos diversos campos da Administração de Empresas, tais como: Administração da Informação, Estudos Organiza-cionais, Ensino e Pesquisa em Administração, Estraté-gia em Organizações, Finanças, Gestão de Ciência, Tec-nologia e Inovação, Gestão de Operações e Logística, Gestão de Pessoas e Relações de Trabalho e Marketing.
Como revista generalista na área, a RAE cobre um amplo espectro de subdomínios de conhecimento, perspectivas e questões, buscando levar ao seu público-alvo (professo-res, pesquisadores e estudantes) artigos inovadores e de excelente qualidade na área de Administração de Empre-sas. Aceitam-se colaborações do Brasil e de outros países e incentiva-se a pluralidade de abordagens e perspectivas.
O público primário da RAE é composto por acadêmicos - professores, pesquisadores e estudantes.
SUBMISSÃO
Os trabalhos devem ser encaminhados à Redação pela in-ternet, por meio do ScholarOne, sistema de submissão e gerenciamento de artigos, disponibilizado em parceria com SciELO: http://mc04.manuscriptcentral.com/rae-scielo.
Os artigos podem ser submetidos em português, in glês ou espanhol, observando o formato e as normas de pa-dronização específica da seção na qual o trabalho se insere, conforme descrito em nosso RAEpub Manual de Publi cação, disponível em http://rae.fgv.br/manu-al-rae/, na seção Formato. Os autores devem consultar ainda as Orientações aos Au tores, que fornecem instru-ções sobre posicionamento, estilo e estrutura que de-vem ser observadas antes do envio do trabalho para apreciação na RAE.
Os autores poderão submeter somente um artigo por vez (esta regra aplica-se também às chamadas de trabalhos), ou seja, enquanto existir um artigo em processo de avalia-ção, o autor não poderá submeter um segundo, seja como autor principal ou em co-autoria. Caso o trabalho seja re-jeitado em uma das etapas do processo, o autor poderá submeter o mesmo artigo, desde que tenha sido devolvido na situação “Reject & Resubmit”, ou um novo artigo.
INEDITISMO E EXCLUSIVIDADE
Artigos submetidos à avaliação na RAE devem ser inédi-tos (em qualquer idioma) e não devem estar sendo con-siderados por outro periódico. Ressalta-se que os tra-balhos apresentados em Congressos Científicos não perdem o ineditismo.
AVALIAÇÃO
O processo de avaliação de artigos submetidos à RAE, após triagem preliminar por formato (adequação do ar-tigo às regras de normalização e formatação exigidas) e uso de sistema de detecção de similaridades, consiste em três etapas:
1ª) Triagem realizada pelo Editor-chefe, que examina a adequação do trabalho à linha editorial da revista e seu potencial para publicação;
2ª) Avaliação preliminar por um membro do Corpo Edi-torial Científico, que visa identificar a contribuição do artigo para a sua área de especialidade; e
3ª) Sistema double blind review: coordenado por um membro do Corpo Editorial Científico da área de espe-cialidade do artigo, consiste na interação entre os auto-res e dois pareceristas especialistas que, ao avaliarem o trabalho, fazem comentários e sugestões de aperfeiçoa-mento. Essa etapa envolve reavaliações contínuas, reu-nindo esforços para aprimoramento dos artigos.
Habitualmente, os editores científicos e Editor-chefe acrescentam às sugestões dos avaliadores um aconse-lhamento editorial, cujo objetivo é o aprimoramento do artigo, visando à publicação.
PREPARAÇÃO PARA PUBLICAÇÃO
Depois de aprovado, o artigo é submetido à edição e à revisão ortográfica e gramatical. A Redação envia a ver-são final para aprovação dos autores e eventuais atuali-zações, tais como afiliação institucional.
OUTRAS FORMAS DE CONTRIBUIÇÃO
A RAE está aberta a outros tipos de contribuição que compõem o conteúdo da revista:
As seções Resenha e Indicações Bibliográficas têm como objetivo apresentar aos leitores obras do campo da Administração de Empresas e áreas correlatas. Os li-vros escolhidos devem ser recentes e apresentar contri-buições para a teoria e prática.
Propostas de Fóruns temáticos, Entrevistas, Debates podem ser apresentadas e serão avaliadas pelo Editor-chefe com base no escopo editorial da RAE.
DIREITOS AUTORAIS
A FGV/EAESP/RAE adota a Licença Creative Commons de Atribuição (BY) (https://creativecommons.org/licenses/by/4.0/) em todos os trabalhos publicados, exceto quando houver indicação específica de detentores de direitos autorais.
Em caso de dúvidas, deve-se consultar a Redação:[email protected].

Mais informações: (11) [email protected] | www.fgv.br/gvcasos
CHAMADA DE TRABALHOSGVcasos convida à submissão de trabalhos visando à publicação nas próximas edições.São publicadas duas edições da GVcasos por ano, procurando privilegiar trabalhos que enfoquem problemas organizacionais inseridos na realidade brasileira e latino-americana.A revista tem interesse em receber casos de ensino nas diversas áreas da Administração. Os casos submetidos precisam ser inéditos e não devem estar sendo considerados para publicação por outro periódico.
1. A submissão deve ser feita por meio do site da GVcasos: www.fgv.br/gvcasos (na página inicial, clicar em “submissões on-line”)
2. Quanto ao conteúdo e à estrutura, o caso de ensino deve compor duas partes, a saber:
(a) Corpo do texto:Deve conter uma exposição, com texto claro e fluente, que descreva um contexto de tomada de decisão e um problema decisório real. O caso deve ser documentado com dados e datas reais.
(b) Notas de ensinoAs notas de ensino deverão conter exposição teórica do assunto relativo ao caso de ensino, entendendo-se por exposição teórica a exploração do arcabouço conceitual necessário à exploração ou discussão do caso. Devem também contemplar aspectos pedagógicos; análise das possíveis alternativas de decisões/soluções da situação organizacional focada no texto, além de referências bibliográficas pertinentes aos conceitos abordados.
3. Quanto à sua formatação, ambas as partes que compõem o caso submetido – corpo do texto e notas de ensino – devem estar em um único documento, com as seguintes características:
• Papel: A4 (29,7 x 21 cm)
• Margens: superior 3cm, inferior 2cm, direita 2cm, esquerda 3cm
• Editor de texto: Word do Office 2003 ou posterior
• Fonte: Times New Roman, tamanho 12
• Extensão do texto: Máximo de 10.000 palavras, incluindo eventuais tabelas e/ou figuras, anexos/apêndices e as notas de ensino
• Espaçamento: 1,5, parágrafo justificado
• Notas de rodapé ou de final de texto devem ser evitadas
4. O processo de avaliação de casos de ensino submetidos consiste de duas etapas: uma avaliação preliminar pelos editores, que examinam a adequação do trabalho à linha editorial da revista e o seu potencial para publicação, e avaliação duplo-cega.
Para mais informações sobre a política editorial da revista e orientações sobre o processo de submissão e avaliação de trabalhos, visite o site www.fgv.br/gvcasos.
Orientações para envio de trabalhos