anu a rio anfavea 2012
TRANSCRIPT
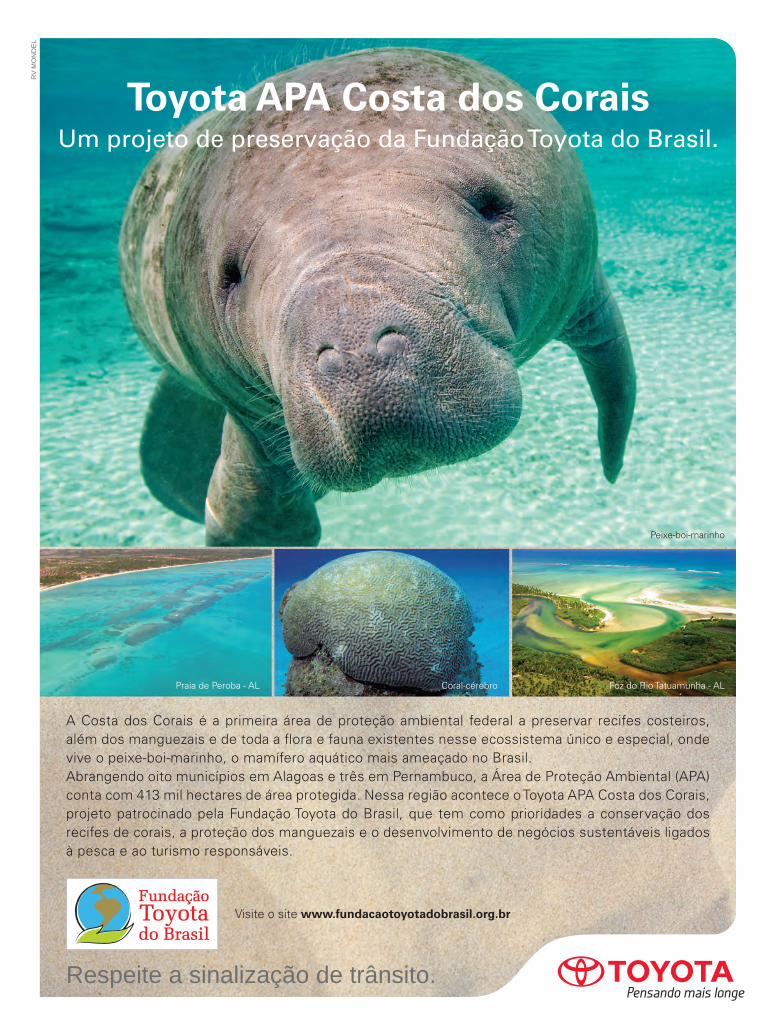
A Costa dos Corais é a primeira área de proteção ambiental federal a preservar recifes costeiros, além dos manguezais e de toda a flora e fauna existentes nesse ecossistema único e especial, onde vive o peixe-boi-marinho, o mamífero aquático mais ameaçado no Brasil. Abrangendo oito municípios em Alagoas e três em Pernambuco, a Área de Proteção Ambiental (APA) conta com 413 mil hectares de área protegida. Nessa região acontece o Toyota APA Costa dos Corais, projeto patrocinado pela Fundação Toyota do Brasil, que tem como prioridades a conservação dos recifes de corais, a proteção dos manguezais e o desenvolvimento de negócios sustentáveis ligados à pesca e ao turismo responsáveis.
Toyota APA Costa dos CoraisUm projeto de preservação da Fundação Toyota do Brasil.
Visite o site www.fundacaotoyotadobrasil.org.br
Praia de Peroba - AL
Peixe-boi-marinho
Coral-cérebro Foz do Rio Tatuamunha - AL
RV
MO
ND
EL
Respeite a sinalização de trânsito.
TO-0045-11_anun_meio_amb_costacorais_L3_20,5x27,5.indd 1 13/12/2011 18:37:24

Associação Nacional dos Fabricantes de Veículos Automotores
Anuário da Indústria Automobilística Brasileira
Brazilian automotive industry yearbook
2012
Anuário da Indústria Automobilística Brasileira • 2012Brazilian Automotive Industry Yearbook • 2012
é uma publicação da / published by
Associação Nacional dos Fabricantes de Veículos Automotores ANFAVEABrazilian Automotive Industry Association
Avenida Indianópolis, 496 • São Paulo • SP • Brasil • 04062-900Telefone 55 11 2193-7800 • Fax 55 11 2193-7825 • www.anfavea.com.br • [email protected]
Escritório em Brasília - Distrito Federal DF / Brasilia OfficeSHIS QI 15 • Conjunto 14 • Casa 5 • Lago Sul • Brasília • DF • Brasil • 71635-340Telefone 55 61 2191-1400 • Fax 55 61 2191-1412 / 2191-1414
Centro de Documentação da Indústria Automobilística CEDOCAvenida Indianópolis, 496 • São Paulo • SP • Brasil • 04062-900Telefone 55 11 2193-7800 • Fax 55 11 2193-7852 • [email protected]
© Todos os direitos reservados. Permitida a livre reprodução desde que citada a fonte. All rights reserved. This publication may be reproduced. Kindly mention the source.
São Paulo, 2012
• Equipe editorial / Editorial team Eduardo Lopez Pablo Teruel Thiago Lima
• Estatístico responsável / Statistics advisor Sérgio Yukio Sawada - CONRE 3ª Região nº 5.612-A - Brasil
• Projeto gráfico e editoração Graphic design and desktop publishing Ponto & Letra (www.ponto-e-letra.com.br | [email protected]) • Capa e ilustrações / Cover and illustrations Cesar Hamanaka | Ponto & Letra (www.ponto-e-letra.com.br) • Tradução (inglês) / English version
Eduardo Alberto Chau Ribeiro ([email protected]) • Pré-impressão, impressão e acabamento / Pre-production, printing and finishes Ipsis Gráfica e Editora (www.ipsis.com.br)
• Direção comercial / Selling service of the advertising space in this edition Mecânica de Comunicação (www.meccanica.com.br | [email protected])
Cin
to d
e se
gura
nça
salva
vid
as
É por isso que o Brasil vai com a VolvoTransporTar confiança
o Brasil produz cada vez mais. E a Volvo transporta a economia do país pelos caminhos da prosperidade.
www.volvo.com.br
AF Anúncio Progresso Anuário Anfavea 205x275mm.indd 1 4/10/12 11:12 AM
Anuário da Indústria Automobilística BrasileiraBrazilian Automotive Industry Yearbook
4
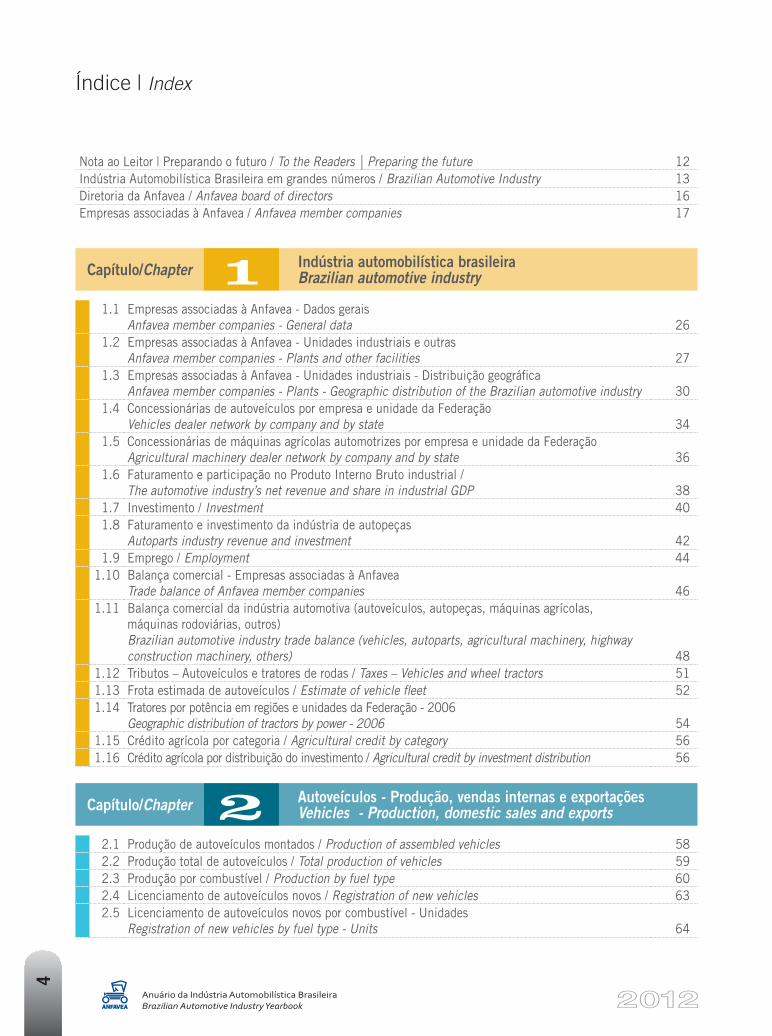
Nota ao Leitor | Preparando o futuro / To the Readers | Preparing the future 12Indústria Automobilística Brasileira em grandes números / Brazilian Automotive Industry 13Diretoria da Anfavea / Anfavea board of directors 16Empresas associadas à Anfavea / Anfavea member companies 17
Capítulo/Chapter 1 Indústria automobilística brasileira Brazilian automotive industry
1.1 Empresas associadas à Anfavea - Dados gerais Anfavea member companies - General data 26
1.2 Empresas associadas à Anfavea - Unidades industriais e outras Anfavea member companies - Plants and other facilities 27
1.3 Empresas associadas à Anfavea - Unidades industriais - Distribuição geográfica Anfavea member companies - Plants - Geographic distribution of the Brazilian automotive industry 30
1.4 Concessionárias de autoveículos por empresa e unidade da Federação Vehicles dealer network by company and by state 34
1.5 Concessionárias de máquinas agrícolas automotrizes por empresa e unidade da Federação Agricultural machinery dealer network by company and by state 36
1.6 Faturamento e participação no Produto Interno Bruto industrial / The automotive industry’s net revenue and share in industrial GDP 38
1.7 Investimento / Investment 401.8 Faturamento e investimento da indústria de autopeças
Autoparts industry revenue and investment 421.9 Emprego / Employment 44
1.10 Balança comercial - Empresas associadas à Anfavea Trade balance of Anfavea member companies 46
1.11 Balança comercial da indústria automotiva (autoveículos, autopeças, máquinas agrícolas, máquinas rodoviárias, outros) Brazilian automotive industry trade balance (vehicles, autoparts, agricultural machinery, highway construction machinery, others) 48
1.12 Tributos – Autoveículos e tratores de rodas / Taxes – Vehicles and wheel tractors 511.13 Frota estimada de autoveículos / Estimate of vehicle fleet 521.14 Tratores por potência em regiões e unidades da Federação - 2006
Geographic distribution of tractors by power - 2006 541.15 Crédito agrícola por categoria / Agricultural credit by category 561.16 Crédito agrícola por distribuição do investimento / Agricultural credit by investment distribution 56
Capítulo/Chapter 2 Autoveículos - Produção, vendas internas e exportações Vehicles - Production, domestic sales and exports
2.1 Produção de autoveículos montados / Production of assembled vehicles 582.2 Produção total de autoveículos / Total production of vehicles 592.3 Produção por combustível / Production by fuel type 602.4 Licenciamento de autoveículos novos / Registration of new vehicles 632.5 Licenciamento de autoveículos novos por combustível - Unidades
Registration of new vehicles by fuel type - Units 64
Índice | Index
Anuário da Indústria Automobilística BrasileiraBrazilian Automotive Industry Yearbook
5
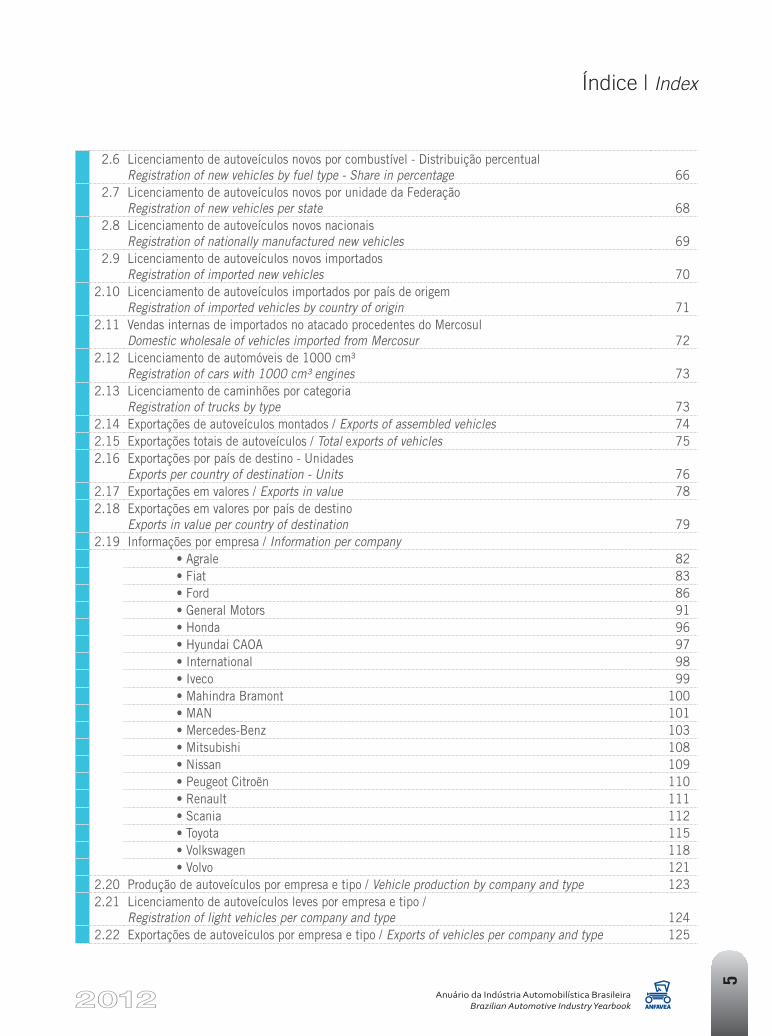
2.6 Licenciamento de autoveículos novos por combustível - Distribuição percentualRegistration of new vehicles by fuel type - Share in percentage 66
2.7 Licenciamento de autoveículos novos por unidade da Federação Registration of new vehicles per state 68
2.8 Licenciamento de autoveículos novos nacionais Registration of nationally manufactured new vehicles 69
2.9 Licenciamento de autoveículos novos importados Registration of imported new vehicles 70
2.10 Licenciamento de autoveículos importados por país de origemRegistration of imported vehicles by country of origin 71
2.11 Vendas internas de importados no atacado procedentes do MercosulDomestic wholesale of vehicles imported from Mercosur 72
2.12 Licenciamento de automóveis de 1000 cm³ Registration of cars with 1000 cm³ engines 73
2.13 Licenciamento de caminhões por categoria Registration of trucks by type 73
2.14 Exportações de autoveículos montados / Exports of assembled vehicles 742.15 Exportações totais de autoveículos / Total exports of vehicles 752.16 Exportações por país de destino - Unidades
Exports per country of destination - Units 762.17 Exportações em valores / Exports in value 782.18 Exportações em valores por país de destino
Exports in value per country of destination 792.19 Informações por empresa / Information per company
• Agrale 82• Fiat 83• Ford 86• General Motors 91• Honda 96• Hyundai CAOA 97• International 98• Iveco 99• Mahindra Bramont 100• MAN 101• Mercedes-Benz 103• Mitsubishi 108• Nissan 109• Peugeot Citroën 110• Renault 111• Scania 112• Toyota 115• Volkswagen 118• Volvo 121
2.20 Produção de autoveículos por empresa e tipo / Vehicle production by company and type 1232.21 Licenciamento de autoveículos leves por empresa e tipo /
Registration of light vehicles per company and type 1242.22 Exportações de autoveículos por empresa e tipo / Exports of vehicles per company and type 125
Índice | Index

Anuário da Indústria Automobilística BrasileiraBrazilian Automotive Industry Yearbook
8
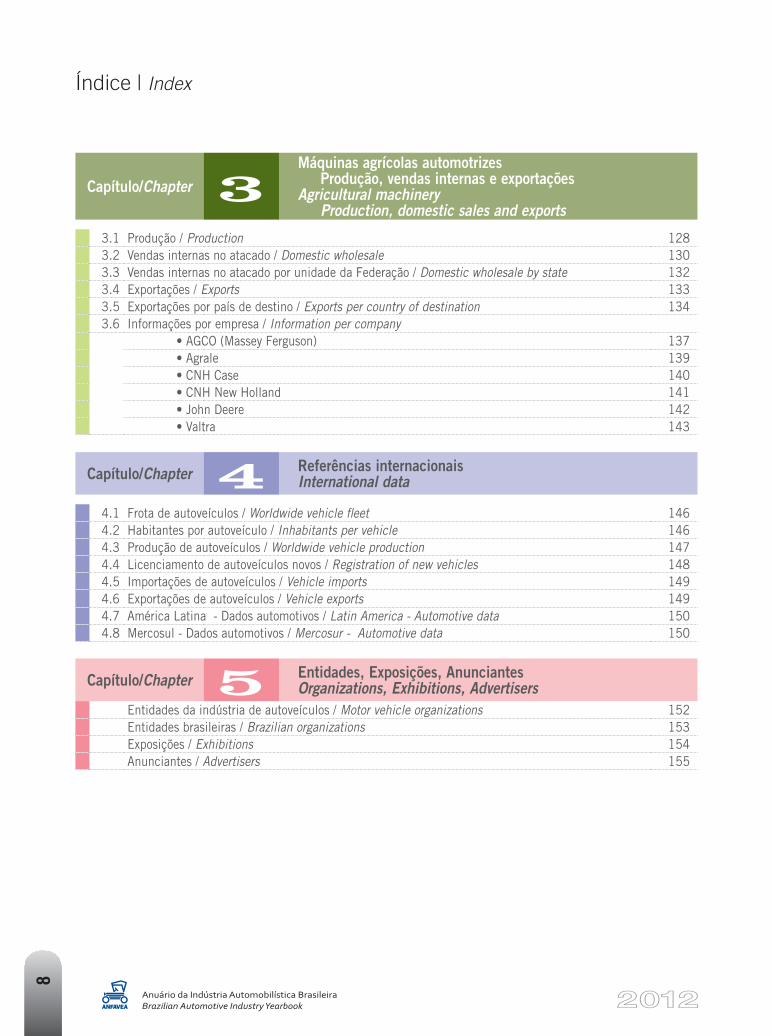
Capítulo/Chapter 3Máquinas agrícolas automotrizes
Produção, vendas internas e exportaçõesAgricultural machinery
Production, domestic sales and exports
3.1 Produção / Production 1283.2 Vendas internas no atacado / Domestic wholesale 1303.3 Vendas internas no atacado por unidade da Federação / Domestic wholesale by state 1323.4 Exportações / Exports 1333.5 Exportações por país de destino / Exports per country of destination 1343.6 Informações por empresa / Information per company
• AGCO (Massey Ferguson) 137• Agrale 139• CNH Case 140• CNH New Holland 141• John Deere 142• Valtra 143
Capítulo/Chapter 4 Referências internacionais International data
4.1 Frota de autoveículos / Worldwide vehicle fleet 1464.2 Habitantes por autoveículo / Inhabitants per vehicle 1464.3 Produção de autoveículos / Worldwide vehicle production 1474.4 Licenciamento de autoveículos novos / Registration of new vehicles 1484.5 Importações de autoveículos / Vehicle imports 1494.6 Exportações de autoveículos / Vehicle exports 1494.7 América Latina - Dados automotivos / Latin America - Automotive data 1504.8 Mercosul - Dados automotivos / Mercosur - Automotive data 150
Capítulo/Chapter 5 Entidades, Exposições, Anunciantes Organizations, Exhibitions, Advertisers
Entidades da indústria de autoveículos / Motor vehicle organizations 152Entidades brasileiras / Brazilian organizations 153Exposições / Exhibitions 154Anunciantes / Advertisers 155
Índice | Index
Anuário da Indústria Automobilística BrasileiraBrazilian Automotive Industry Yearbook
9
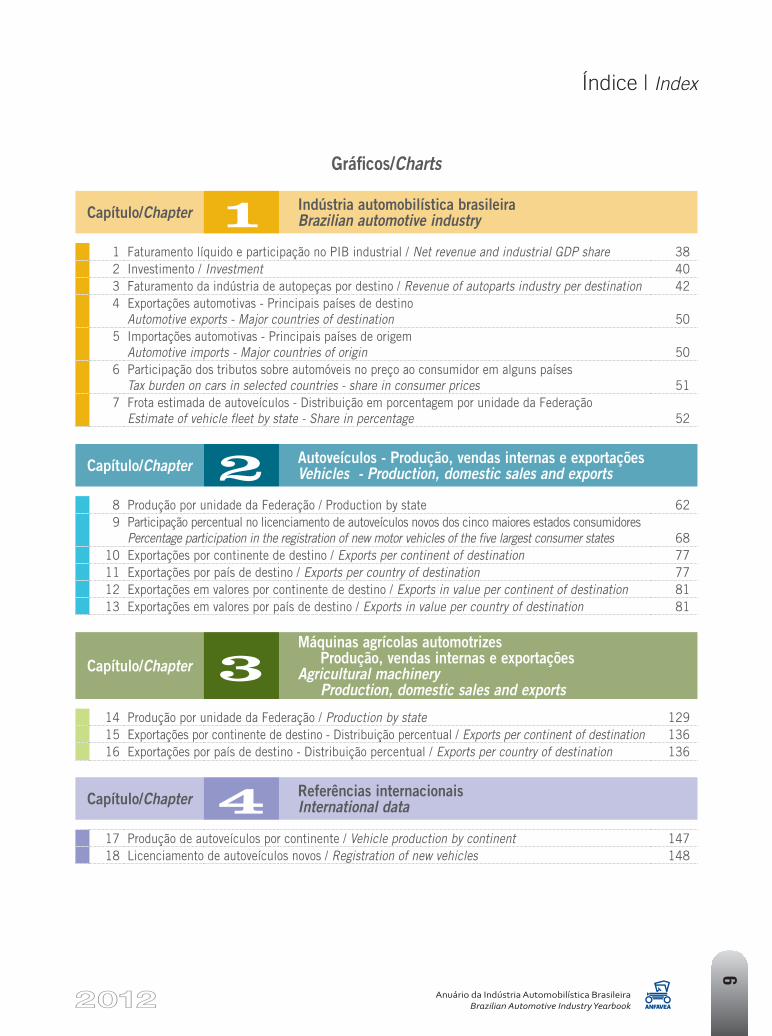
Gráficos/Charts
Capítulo/Chapter 1 Indústria automobilística brasileira Brazilian automotive industry
1 Faturamento líquido e participação no PIB industrial / Net revenue and industrial GDP share 382 Investimento / Investment 403 Faturamento da indústria de autopeças por destino / Revenue of autoparts industry per destination 424 Exportações automotivas - Principais países de destino
Automotive exports - Major countries of destination 505 Importações automotivas - Principais países de origem
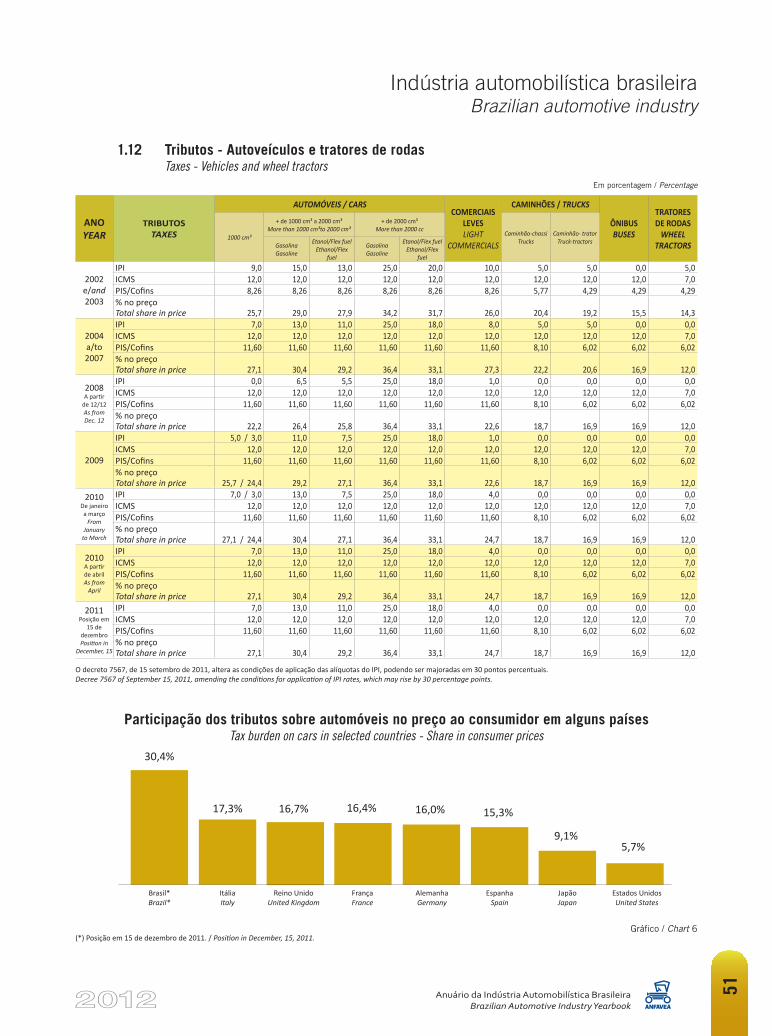
Automotive imports - Major countries of origin 506 Participação dos tributos sobre automóveis no preço ao consumidor em alguns países
Tax burden on cars in selected countries - share in consumer prices 517 Frota estimada de autoveículos - Distribuição em porcentagem por unidade da Federação
Estimate of vehicle fleet by state - Share in percentage 52
Capítulo/Chapter 2 Autoveículos - Produção, vendas internas e exportações Vehicles - Production, domestic sales and exports
8 Produção por unidade da Federação / Production by state 629 Participação percentual no licenciamento de autoveículos novos dos cinco maiores estados consumidores
Percentage participation in the registration of new motor vehicles of the five largest consumer states 6810 Exportações por continente de destino / Exports per continent of destination 7711 Exportações por país de destino / Exports per country of destination 7712 Exportações em valores por continente de destino / Exports in value per continent of destination 8113 Exportações em valores por país de destino / Exports in value per country of destination 81
Capítulo/Chapter 3Máquinas agrícolas automotrizes
Produção, vendas internas e exportaçõesAgricultural machinery
Production, domestic sales and exports
14 Produção por unidade da Federação / Production by state 12915 Exportações por continente de destino - Distribuição percentual / Exports per continent of destination 13616 Exportações por país de destino - Distribuição percentual / Exports per country of destination 136
Capítulo/Chapter 4 Referências internacionais International data
17 Produção de autoveículos por continente / Vehicle production by continent 14718 Licenciamento de autoveículos novos / Registration of new vehicles 148
Índice | Index

Job: 302078 -- Empresa: Burti -- Arquivo: 302078-02345-DUPLA AMAROK XADREZ 410x275 80602512_pag001.pdfRegistro: 77460 -- Data: 17:54:55 09/05/2012
Job: 302078 -- Empresa: Burti -- Arquivo: 302078-02345-DUPLA AMAROK XADREZ 410x275 80602512_pag001.pdfRegistro: 77460 -- Data: 17:54:55 09/05/2012
Anuário da Indústria Automobilística BrasileiraBrazilian Automotive Industry Yearbook
12
Nota ao LeitorTo the Readers
Preparando o futuro
Os resultados de mercado e de produção automoti-va em 2011, expressados nos gráficos e tabelas deste Anuário, confirmam mais um ano de marcha positiva ininterrupta da indústria automobilística nos últimos anos. De fato, pois entre 2002 e 2011 o mercado automotivo cresceu 145%, com média anual supe-rior a 10%, enquanto a produção, embora em ritmo menor que o das vendas internas, expandiu-se 109% no período, média de 8,6% ao ano.
As perspectivas, no que se refere ao comportamen-to do mercado, são animadoras e revelam potencial de crescimento também nos próximos anos, com o Brasil podendo vir a consumir 6 milhões de veículos/ano em futuro de médio e longo prazos, desde que mantidas as perspectivas de estabilidade e de expansão da economia brasileira, além de adequadas condições de crédito e de acesso do consumidor ao mercado.
A indústria automobilística prepara-se para esse futuro, com novos e importantes investimentos em novas fábricas, em aumento da capacidade de pro-dução, em processos e produtos e em tecnologia e inovação.
Se há projeções de mercado e ações concretas da indústria com programas de investimentos, existem também sérios desafios à frente. Inicia-se um novo ciclo para a indústria automobilística no País, com o regime automotivo para o período 2013-2017 exigin-do renovado compromisso de toda a cadeia automoti-va quanto ao atendimento de metas de nacionalização e de investimentos em engenharia e inovação. É um passo certo para valorizar a produção nacional que, contudo, precisará ser complementado com políticas setoriais específicas e com políticas estruturais de competitividade para o País objetivando fortalecer a capacidade competitiva da indústria nacional e da própria economia brasileira nos próximos anos. Com-petitividade é passaporte necessário para o futuro!
Os Editores
Preparing the future
The results from the market and in automo-tive production in 2011, shown in the graphs and tables in this Yearbook, confirm another year of positive, uninterrupted growth that has been seen in the automotive industry in recent years. In fact, between 2002 and 2011, the automotive market grew by 145%, at an annual average of more than 10%, while production, although at a slower pace than that for domestic sales, grew by 109% in the period, averaging 8.6 % per year.
The outlook for the market is encouraging and there is potential for growth in the coming years, with Brazil perhaps reaching 6 million vehicle sales a year in the medium and long term, as long as the country’s economic stability and expansion are maintained, along with appropriate credit terms and access by consumers to the market continues to be facilitated.
The automotive industry is preparing for the future with significant investment in new factories, increased production capacity, processes and prod-ucts, technology and innovation.
In addition to market forecasts and concrete actions by the industry via investment programs, there are also serious challenges ahead. It starts with a new cycle for the automotive industry in the Brazil, with the automotive plans for the pe-riod 2013-2017 requiring renewed commitment by the entire automotive supply chain regarding requirements for Brazilian-made parts and invest-ment in engineering and innovation. It is the right step in order to enhance domestic production which, however, needs to be complemented with specific industrial policies and structural policies to strengthen the competitiveness of the Brazilian industry and the country’s economy in the coming years. Competitiveness is the passport to the future.
The Editors
Anuário da Indústria Automobilística BrasileiraBrazilian Automotive Industry Yearbook
13
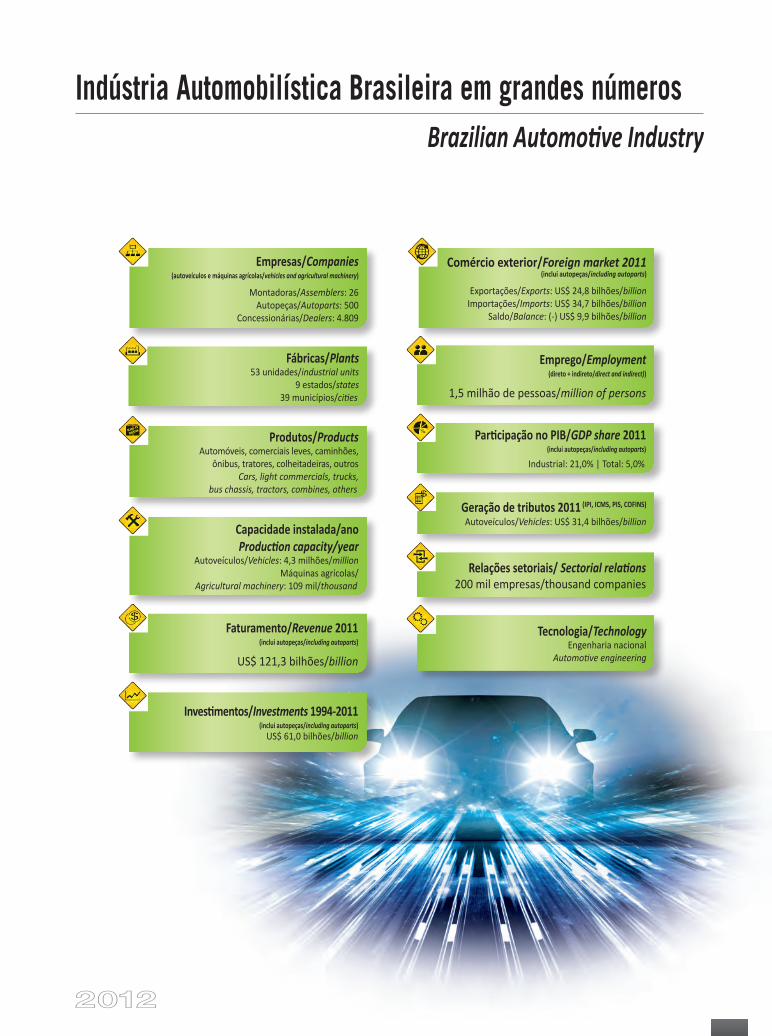
Indústria Automobilística Brasileira em grandes númerosBrazilian Automotive Industry
Comércio exterior/Foreign market 2011(inclui autopeças/including autoparts)
Exportações/Exports: US$ 24,8 bilhões/billionImportações/Imports: US$ 34,7 bilhões/billion
Saldo/Balance: (-) US$ 9,9 bilhões/billion
Emprego/Employment(direto + indireto/direct and indirect))
1,5 milhão de pessoas/million of persons
Participação no PIB/GDP share 2011(inclui autopeças/including autoparts)
Industrial: 21,0% | Total: 5,0%
Relações setoriais/ Sectorial relations200 mil empresas/thousand companies
Geração de tributos 2011 (IPI, ICMS, PIS, COFINS)
Autoveículos/Vehicles: US$ 31,4 bilhões/billion
Tecnologia/TechnologyEngenharia nacional
Automotive engineering
Faturamento/Revenue 2011(inclui autopeças/including autoparts)
US$ 121,3 bilhões/billion
Produtos/ProductsAutomóveis, comerciais leves, caminhões,
ônibus, tratores, colheitadeiras, outros Cars, light commercials, trucks,
bus chassis, tractors, combines, others
Capacidade instalada/anoProduction capacity/year
Autoveículos/Vehicles: 4,3 milhões/millionMáquinas agrícolas/
Agricultural machinery: 109 mil/thousand
Empresas/Companies(autoveículos e máquinas agrícolas/vehicles and agricultural machinery)
Montadoras/Assemblers: 26Autopeças/Autoparts: 500
Concessionárias/Dealers: 4.809
Fábricas/Plants53 unidades/industrial units
9 estados/states39 municípios/cities
Investimentos/Investments 1994-2011(inclui autopeças/including autoparts)
US$ 61,0 bilhões/billion
Job: Fiat-Grand-Siena -- Empresa: Leo Burnett -- Arquivo: 23230-022-Fiat-An Grand Siena Traseira-41x27.5_pag001.pdfRegistro: 71656 -- Data: 16:40:51 21/03/2012
Job: Fiat-Grand-Siena -- Empresa: Leo Burnett -- Arquivo: 23230-022-Fiat-An Grand Siena Traseira-41x27.5_pag001.pdfRegistro: 71656 -- Data: 16:40:51 21/03/2012
Anuário da Indústria Automobilística BrasileiraBrazilian Automotive Industry Yearbook
16
Diretoria da ANFAVEAAnfavea Board of Directors
2010 / 2013
PresidentePresident Cledorvino Belini
1º Vice-presidente1st Vice-president Luiz Moan Yabiku Júnior
Vice-presidentes / Vice-presidents Alexandre Bernardes
Alfredo Miguel Neto
Andrea Zámolyi Park
Antonio Candido Prataviera Calcagnotto
Antonio Carlos Ramos
Antonio Megale
Antonio Sérgio Martins Mello
Carlos Eduardo Cruz de Souza Lemos
Carlos Morassutti
Fernanda Villas-Bôas
Hugo Zattera
João Alecrim
Josef-Fidelis Senn
Luiz Carlos Gomes de Moraes
Marco Saltini
Mário Fioretti
Mauro Marcondes Machado
Paulo Takeuchi
Ricardo Bastos
Rogelio Golfarb
Rogério Rezende
Silvia Regina Bonotto Pietta
Suely Agostinho
Valentino Rizzioli
Diretor executivoExecutive director Paulo Sotero Pires Costa
Diretor de relações institucionaisInstitutional relations director Ademar Cantero
Diretor técnicoTechnical director Aurélio Santana
Anuário da Indústria Automobilística BrasileiraBrazilian Automotive Industry Yearbook
17
Empresas associadas à ANFAVEAANFAVEA member companies
A ANFAVEA - Associação Nacional dos Fabricantes de Veículos Automotores, fundada em 1956, é a entidade que congrega os fabricantes de autoveículos (automóveis, comerciais leves, caminhões e chassis para ônibus) e máquinas agrícolas automotrizes (tratores, colheitadeiras, outros produtos) com instalações industriais no Brasil.
ANFAVEA - Associação Nacional dos Fabricantes de Veículos Automotores, founded in 1956, is an organization that embraces the vehicle manufacturers (cars, light commercials, trucks and bus chassis) and agricultural machinery (tractors, combines, others products with industrial unit in Brazil.
• AGCO do Brasil Comércio e Indústria Ltda. (Massey Ferguson)• Agrale S.A.• Caterpillar Brasil Ltda.• CNH Latin America Ltda. (Case e/and New Holland)• Fiat Automóveis S.A.• Ford Motor Company Brasil Ltda.• General Motors do Brasil Ltda.• Honda Automóveis do Brasil Ltda.• Hyundai - CAOA Montadora de Veículos S.A.• International Indústria Automotiva da América do Sul Ltda.• Iveco Latin America Ltda.• John Deere Brasil Ltda.• KG Estamparia, Ferramentaria, Usinagem e Montagem Ltda.
(Grupo Brasil)• Komatsu do Brasil Ltda.• Mahindra - Bramont Montadora Industrial e Comercial de Veículos S.A.• MAN Latin America Indústria e Comércio de Veículos Ltda.
(Volkswagen Caminhões e Ônibus)• Mercedes-Benz do Brasil Ltda.• Mitsubishi - MMC Automotores do Brasil Ltda.• Nissan do Brasil Automóveis Ltda.• Peugeot Citroën do Brasil Automóveis Ltda.• Renault do Brasil S.A.• Scania Latin America Ltda.• Toyota do Brasil Ltda.• Valtra do Brasil Ltda.• Volkswagen do Brasil Indústria de Veículos Automotores Ltda.• Volvo do Brasil Veículos Ltda.
Anuário da Indústria Automobilística BrasileiraBrazilian Automotive Industry Yearbook
18
AGCO do Brasil Comércio e Indústria Ltda.Avenida Guilherme Schell, 10.260 92420-910 - Canoas - RS - BrasilTel. 55 51 3462-8000 www.agco.com.brwww.massey.com.br
Agrale S.A.Rodovia BR 116, Km 145, nº 15.104 - São Ciro95059-520 - Caxias do Sul - RS - BrasilTel. 55 54 3238-8000 | Fax 55 54 3238-8052www.agrale.com.br
Caterpillar Brasil Ltda.Rodovia Luiz de Queiroz, Km 157, s/nº13420-900 - Piracicaba - SP - BrasilTel. 55 19 2106-2100 | Fax 55 19 2106-2430www.caterpillar.com.br
CNH Latin America Ltda.Avenida General David Sarnoff, 2.237 - Cidade Industrial - Inconfidentes32210-900 - Contagem - MG - BrasilTel. 55 31 2104-3111www.cnh.com
Fiat Automóveis S.A.Rodovia Fernão Dias, Km 42932530-000 - Betim - MG - BrasilTel. 55 31 2123-2111 / 0800 707 1000www.fiat.com.br
Ford Motor Company Brasil Ltda.Avenida do Taboão, 899 - Rudge Ramos09655-900 - São Bernardo do Campo - SP - BrasilTel. 55 11 4174-8571www.ford.com.br
General Motors do Brasil Ltda.Avenida Goiás, 1.80509550-900 - São Caetano do Sul - SP - BrasilTel. 55 11 4234-7700www.chevrolet.com.br
Honda Automóveis do Brasil Ltda.Rua Dr. José Áureo Bustamante, 377 - 1º andar - Santo Amaro04710-090 - São Paulo - SP - BrasilTel. 55 11 5576-5122www.honda.com.br
Empresas associadas à ANFAVEAANFAVEA member companies
Anuário da Indústria Automobilística BrasileiraBrazilian Automotive Industry Yearbook
20
Hyundai - CAOA Montadora de Veículos S.A.Av. Ibirapuera, 2.822 - Moema04028-002 - São Paulo - SP - BrasilTel. 55 11 5538-1000www.hyundai-motor.com.br
International Indústria Automotiva da América do Sul Ltda.Avenida das Nações Unidas, 22.00204795-915 - São Paulo - SP - BrasilTel. 55 11 3882-3200www.internationalcaminhoes.com.br
Iveco Latin America Ltda.Av. Senador Milton Campos, 175 - Vila da Serra34000-000 - Nova Lima - MG - BrasilTel. 55 31 2123-4000www.iveco.com.br
John Deere Brasil Ltda.Avenida Soledade, 550 - 15º andar90470-340 - Porto Alegre - RS - BrasilTel. 55 51 2103-5700 | Fax 55 51 2103-5714www.johndeere.com.br
KG Estamparia, Ferramentaria, Usinagem e Montagem Ltda. Avenida Álvaro Guimarães, 2.48709810-901 - São Bernardo do Campo - SP - BrasilTel. 55 11 4344-5800 | Fax 55 11 4344-5811 www.grupobrasil.com
Komatsu do Brasil Ltda.Rodovia Índio Tibiriçá, 2.00008655-000 - Suzano - SP - BrasilTel. 55 11 4745-7000 | Fax 55 11 4745-7027www.komatsu.com.br
by Bramont
Mahindra - Bramont Montadora Industrial e Comercial de Veículos S.A.Av. dos Oitis, 6.360 – Distrito Industrial II 69085-842 - Manaus - AM - BrasilTel. 55 92 2123-8090 | Fax 55 92 2123-8099www.bramont.com.br | www.mahindra.com.brShowroom: Av. Rebouças, 2.797 - 05401-350 - São Paulo - SP - BrasilSAC 0800 707 8092
MAN Latin America Indústria e Comércio de Veículos Ltda.Rua Volkswagen, 291 - 7º, 8º e 9º andares - Jabaquara04344-020 - São Paulo - SP - BrasilTel. 55 11 5582-5122www.man-la.com
Mercedes-Benz do Brasil Ltda.Avenida Alfred Jurzykowski, 562 - Vila Paulicéia - Caixa Postal 20209680-900 - São Bernardo do Campo - SP - BrasilTel. 55 11 4173-6611 www.mercedes-benz.com.br
Empresas associadas à ANFAVEAANFAVEA member companies
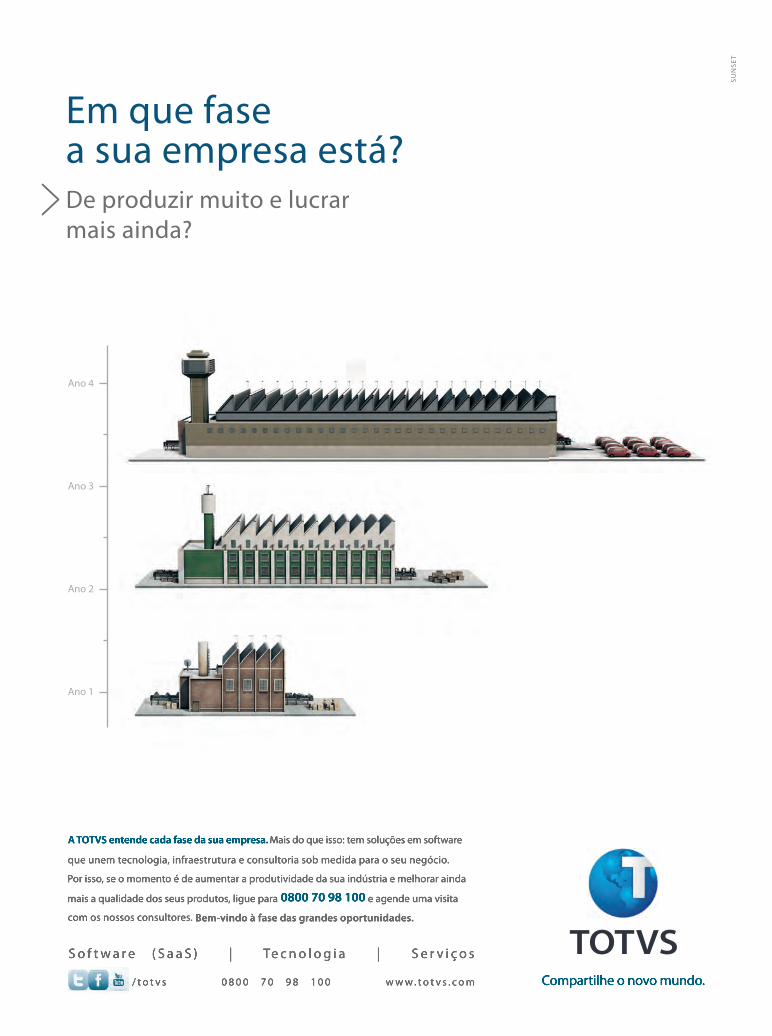
Ano 1
Ano 2
Ano 3
Ano 4
De produzir muito e lucrar mais ainda?
Em que fase a sua empresa está?
Compartilhe o novo mundo.
A TOTVS entende cada fase da sua empresa. Mais do que isso: tem soluções em software
que unem tecnologia, infraestrutura e consultoria sob medida para o seu negócio.
Por isso, se o momento é de aumentar a produtividade da sua indústria e melhorar ainda
mais a qualidade dos seus produtos, ligue para 0800 70 98 100 e agende uma visita
com os nossos consultores. Bem-vindo à fase das grandes oportunidades.
/ t o t v s 0 8 0 0 7 0 9 8 1 0 0 w w w . t o t v s . c o m
S o f t w a r e ( S a a S ) | Te c n o l o g i a | S e r v i ç o s
3126_AnuSegmento_RevistaAnfavea_20.5x27.5.indd 1 4/19/12 5:16 PM
Anuário da Indústria Automobilística BrasileiraBrazilian Automotive Industry Yearbook
22
Mitsubishi - MMC Automotores do Brasil Ltda.Av. Nações Unidas, 19.84704795-100 - São Paulo - SP - BrasilTelefone 55 11 5694-2700 | Fax 55 11 5694-2789www.mitsubishimotors.com.br
Nissan do Brasil Automóveis Ltda.Avenida Renault, 1.300 - Borda do Campo83070-900 - São José dos Pinhais - PR - BrasilTel. 55 41 3380-2000www.nissan.com.br
Peugeot Citroën do Brasil Automóveis Ltda.Praia de Botafogo, 501 - 7º andar - conjs 703/704 - Botafogo - Centro Empresarial Mourisco22250-040 - Rio de Janeiro - RJ - BrasilTel. 55 21 3506-4900www.psa-peugeot-citroen.com.br
Renault do Brasil S.A.Avenida Renault, 1.300 - Borda do Campo83070-900 - São José dos Pinhais - PR - BrasilTel. 55 41 3380-2000 www.renault.com.br
Scania Latin America Ltda.Avenida José Odorizzi, 151 - Vila Euro09810-902 - São Bernardo do Campo - SP - BrasilTel. 55 11 4344-9333 | Fax 55 11 4344-2659www.scania.com.br
Toyota do Brasil Ltda.Av. Nações Unidas, 12.901 - Torre Oeste - 15º andar - Brooklin04578-910 - São Paulo - SP - BrasilTel. 55 11 5502-9100 | Fax 55 11 5507-2285www.toyota.com.br
Valtra do Brasil Ltda.Rua Capitão Francisco de Almeida, 695 - Brás Cubas08740-300 - Mogi das Cruzes - SP - BrasilTel. 55 11 4795-2000 | Fax 55 11 4795-2119www.valtra.com.br
Volkswagen do Brasil Indústria de Veículos Automotores Ltda.Via Anchieta, Km 23,509823-901 - São Bernardo do Campo - SP - BrasilTel. 55 11 4347-2355www.volkswagen.com.br
Volvo do Brasil Veículos Ltda.Avenida Juscelino Kubitschek de Oliveira, 2.600 CIC (Cidade Industrial de Curitiba) - Caixa Postal 66081260-900 - Curitiba - PR - BrasilTel. 55 41 3317-8111 | Fax 55 41 3317-8601www.volvo.com.br
Empresas associadas à ANFAVEAANFAVEA member companies
A VALTRA TRAZ A EVOLUÇÃO PARA O CAMPO.
@valtrabrasil
valtrabrasil
valtravideos
A Valtra entende as necessidades da agricultura e do agricultor brasileiro, por isso não para de evoluir. A diversi� cada linha de colheitadeiras, tratores, pulverizadores e implementos Valtra é apoiada por sistemas avançados de agricultura de precisão. Mais tecnologia, qualidade e desempenho para você produzir sempre mais. E sempre com o atendimento personalizado de uma extensa rede de concessionárias. Valtra. O nosso jeito é fazer do seu jeito.
va_0011_12O_Anun_Institucional_20.5x27.5cm_v7_AF.indd 1 4/4/12 4:42 PM


Indústria automobilística brasileiraBrazilian automotive industry
1
26
Indústria automobilística brasileiraBrazilian automotive industry
Anuário da Indústria Automobilística BrasileiraBrazilian Automotive Industry Yearbook
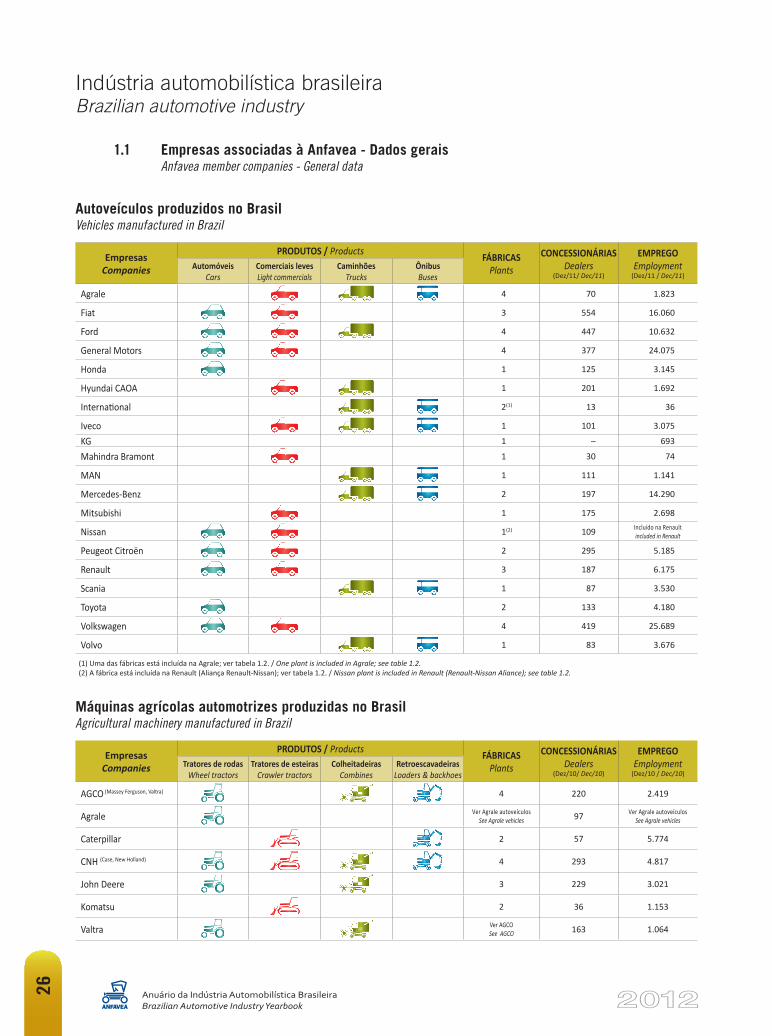
1.1 Empresas associadas à Anfavea - Dados gerais Anfavea member companies - General data
Autoveículos produzidos no BrasilVehicles manufactured in Brazil
Empresas Companies
PRODUTOS / Products FÁBRICASPlants
CONCESSIONÁRIASDealers
(Dez/11/ Dec/11)
EMPREGOEmployment
(Dez/11 / Dec/11)Automóveis
CarsComerciais leves Light commercials
Caminhões Trucks
Ônibus Buses
Agrale 4 70 1.823
Fiat 3 554 16.060
Ford 4 447 10.632
General Motors 4 377 24.075
Honda 1 125 3.145
Hyundai CAOA 1 201 1.692
International 2(1) 13 36
Iveco 1 101 3.075
KG 1 – 693
Mahindra Bramont 1 30 74
MAN 1 111 1.141
Mercedes-Benz 2 197 14.290
Mitsubishi 1 175 2.698
Nissan 1(2) 109 Incluído na Renaultincluded in Renault
Peugeot Citroën 2 295 5.185
Renault 3 187 6.175
Scania 1 87 3.530
Toyota 2 133 4.180
Volkswagen 4 419 25.689
Volvo 1 83 3.676
Máquinas agrícolas automotrizes produzidas no BrasilAgricultural machinery manufactured in Brazil
Empresas Companies
PRODUTOS / Products FÁBRICASPlants
CONCESSIONÁRIASDealers
(Dez/10/ Dec/10)
EMPREGOEmployment
(Dez/10 / Dec/10)Tratores de rodas
Wheel tractorsTratores de esteiras
Crawler tractorsColheitadeiras
CombinesRetroescavadeiras
Loaders & backhoes
AGCO (Massey Ferguson, Valtra) 4 220 2.419
Agrale Ver Agrale autoveículos See Agrale vehicles 97 Ver Agrale autoveículos
See Agrale vehicles
Caterpillar 2 57 5.774
CNH (Case, New Holland) 4 293 4.817
John Deere 3 229 3.021
Komatsu 2 36 1.153
Valtra Ver AGCOSee AGCO 163 1.064
(1) Uma das fábricas está incluída na Agrale; ver tabela 1.2. / One plant is included in Agrale; see table 1.2.(2) A fábrica está incluída na Renault (Aliança Renault-Nissan); ver tabela 1.2. / Nissan plant is included in Renault (Renault-Nissan Aliance); see table 1.2.
27
Indústria automobilística brasileiraBrazilian automotive industry
Anuário da Indústria Automobilística BrasileiraBrazilian Automotive Industry Yearbook
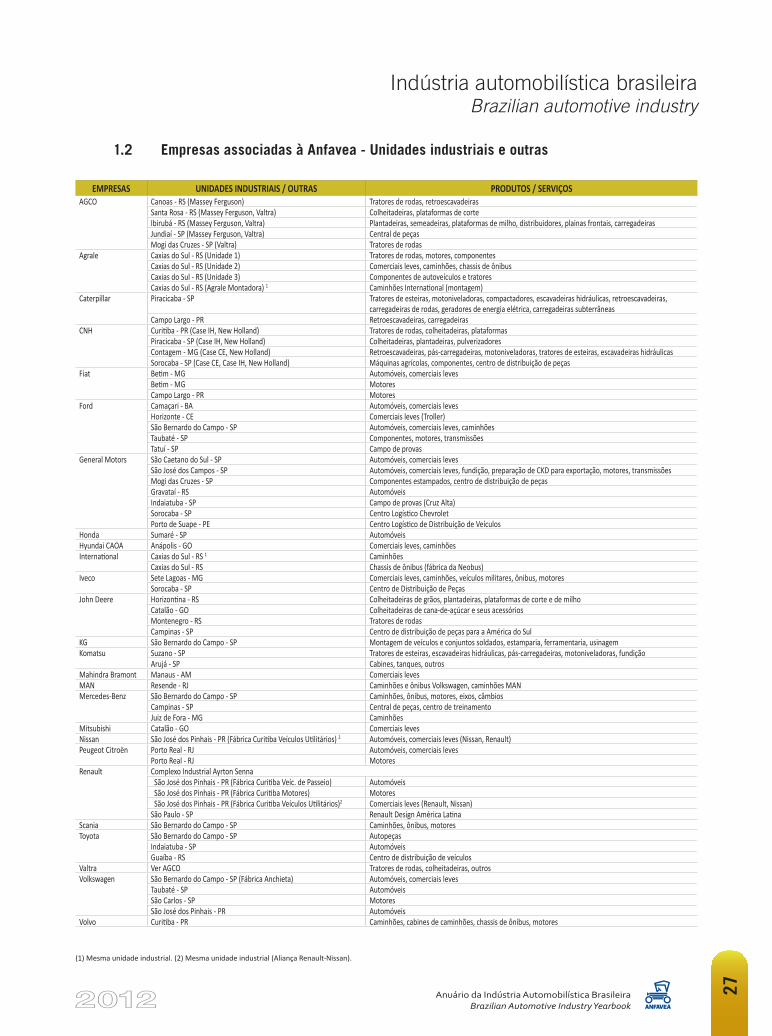
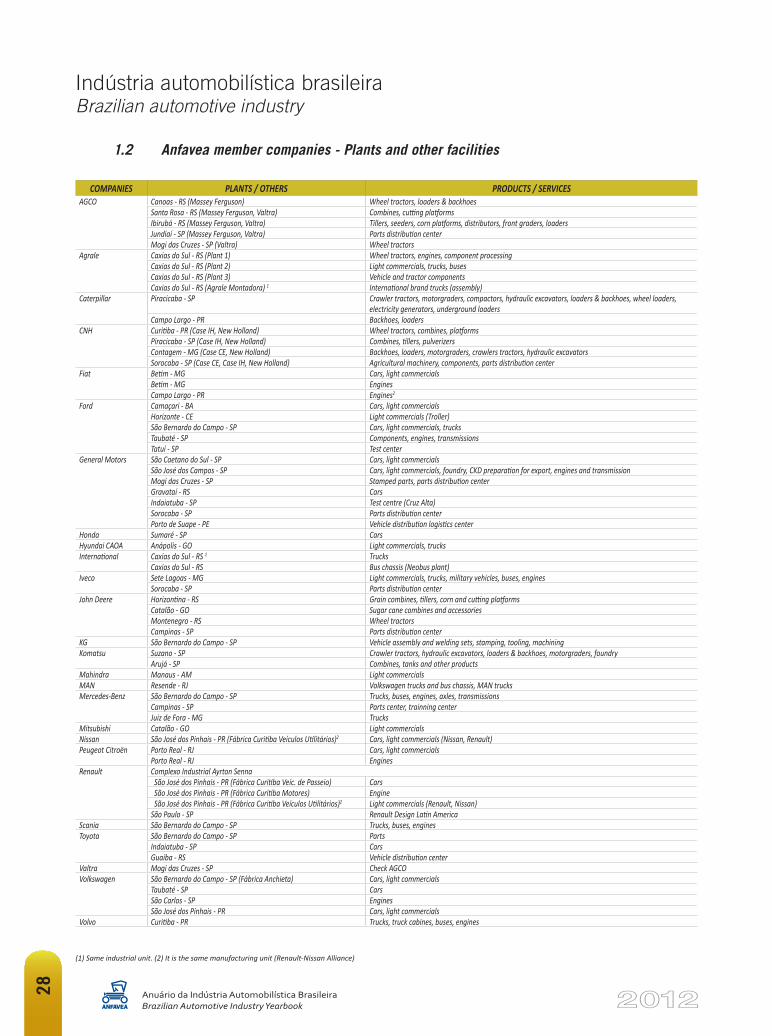
(1) Mesma unidade industrial. (2) Mesma unidade industrial (Aliança Renault-Nissan).
EMPRESAS UNIDADES INDUSTRIAIS / OUTRAS PRODUTOS / SERVIÇOSAGCO Canoas - RS (Massey Ferguson) Tratores de rodas, retroescavadeiras
Santa Rosa - RS (Massey Ferguson, Valtra) Colheitadeiras, plataformas de corteIbirubá - RS (Massey Ferguson, Valtra) Plantadeiras, semeadeiras, plataformas de milho, distribuidores, plainas frontais, carregadeirasJundiaí - SP (Massey Ferguson, Valtra) Central de peçasMogi das Cruzes - SP (Valtra) Tratores de rodas
Agrale Caxias do Sul - RS (Unidade 1) Tratores de rodas, motores, componentesCaxias do Sul - RS (Unidade 2) Comerciais leves, caminhões, chassis de ônibusCaxias do Sul - RS (Unidade 3) Componentes de autoveículos e tratoresCaxias do Sul - RS (Agrale Montadora) 1 Caminhões International (montagem)
Caterpillar Piracicaba - SP Tratores de esteiras, motoniveladoras, compactadores, escavadeiras hidráulicas, retroescavadeiras, carregadeiras de rodas, geradores de energia elétrica, carregadeiras subterrâneas
Campo Largo - PR Retroescavadeiras, carregadeirasCNH Curitiba - PR (Case IH, New Holland) Tratores de rodas, colheitadeiras, plataformas
Piracicaba - SP (Case IH, New Holland) Colheitadeiras, plantadeiras, pulverizadoresContagem - MG (Case CE, New Holland) Retroescavadeiras, pás-carregadeiras, motoniveladoras, tratores de esteiras, escavadeiras hidráulicasSorocaba - SP (Case CE, Case IH, New Holland) Máquinas agrícolas, componentes, centro de distribuição de peças
Fiat Betim - MG Automóveis, comerciais levesBetim - MG MotoresCampo Largo - PR Motores
Ford Camaçari - BA Automóveis, comerciais levesHorizonte - CE Comerciais leves (Troller)São Bernardo do Campo - SP Automóveis, comerciais leves, caminhõesTaubaté - SP Componentes, motores, transmissõesTatuí - SP Campo de provas
General Motors São Caetano do Sul - SP Automóveis, comerciais levesSão José dos Campos - SP Automóveis, comerciais leves, fundição, preparação de CKD para exportação, motores, transmissõesMogi das Cruzes - SP Componentes estampados, centro de distribuição de peçasGravataí - RS AutomóveisIndaiatuba - SP Campo de provas (Cruz Alta)Sorocaba - SP Centro Logístico ChevroletPorto de Suape - PE Centro Logístico de Distribuição de Veículos
Honda Sumaré - SP AutomóveisHyundai CAOA Anápolis - GO Comerciais leves, caminhõesInternational Caxias do Sul - RS 1 Caminhões
Caxias do Sul - RS Chassis de ônibus (fábrica da Neobus)Iveco Sete Lagoas - MG Comerciais leves, caminhões, veículos militares, ônibus, motores
Sorocaba - SP Centro de Distribuição de PeçasJohn Deere Horizontina - RS Colheitadeiras de grãos, plantadeiras, plataformas de corte e de milho
Catalão - GO Colheitadeiras de cana-de-açúcar e seus acessóriosMontenegro - RS Tratores de rodasCampinas - SP Centro de distribuição de peças para a América do Sul
KG São Bernardo do Campo - SP Montagem de veículos e conjuntos soldados, estamparia, ferramentaria, usinagemKomatsu Suzano - SP Tratores de esteiras, escavadeiras hidráulicas, pás-carregadeiras, motoniveladoras, fundição
Arujá - SP Cabines, tanques, outrosMahindra Bramont Manaus - AM Comerciais levesMAN Resende - RJ Caminhões e ônibus Volkswagen, caminhões MANMercedes-Benz São Bernardo do Campo - SP Caminhões, ônibus, motores, eixos, câmbios
Campinas - SP Central de peças, centro de treinamentoJuiz de Fora - MG Caminhões
Mitsubishi Catalão - GO Comerciais levesNissan São José dos Pinhais - PR (Fábrica Curitiba Veículos Utilitários) 2 Automóveis, comerciais leves (Nissan, Renault)Peugeot Citroën Porto Real - RJ Automóveis, comerciais leves
Porto Real - RJ MotoresRenault Complexo Industrial Ayrton Senna
São José dos Pinhais - PR (Fábrica Curitiba Veíc. de Passeio) Automóveis São José dos Pinhais - PR (Fábrica Curitiba Motores) Motores São José dos Pinhais - PR (Fábrica Curitiba Veículos Utilitários)2 Comerciais leves (Renault, Nissan)São Paulo - SP Renault Design América Latina
Scania São Bernardo do Campo - SP Caminhões, ônibus, motoresToyota São Bernardo do Campo - SP Autopeças
Indaiatuba - SP AutomóveisGuaíba - RS Centro de distribuição de veículos
Valtra Ver AGCO Tratores de rodas, colheitadeiras, outrosVolkswagen São Bernardo do Campo - SP (Fábrica Anchieta) Automóveis, comerciais leves
Taubaté - SP AutomóveisSão Carlos - SP MotoresSão José dos Pinhais - PR Automóveis
Volvo Curitiba - PR Caminhões, cabines de caminhões, chassis de ônibus, motores
1.2 Empresas associadas à Anfavea - Unidades industriais e outras
28
Indústria automobilística brasileiraBrazilian automotive industry
Anuário da Indústria Automobilística BrasileiraBrazilian Automotive Industry Yearbook
1.2 Anfavea member companies - Plants and other facilities
(1) Same industrial unit. (2) It is the same manufacturing unit (Renault-Nissan Alliance)
COMPANIES PLANTS / OTHERS PRODUCTS / SERVICESAGCO Canoas - RS (Massey Ferguson) Wheel tractors, loaders & backhoes
Santa Rosa - RS (Massey Ferguson, Valtra) Combines, cutting platformsIbirubá - RS (Massey Ferguson, Valtra) Tillers, seeders, corn platforms, distributors, front graders, loadersJundiaí - SP (Massey Ferguson, Valtra) Parts distribution centerMogi das Cruzes - SP (Valtra) Wheel tractors
Agrale Caxias do Sul - RS (Plant 1) Wheel tractors, engines, component processingCaxias do Sul - RS (Plant 2) Light commercials, trucks, busesCaxias do Sul - RS (Plant 3) Vehicle and tractor componentsCaxias do Sul - RS (Agrale Montadora) 1 International brand trucks (assembly)
Caterpillar Piracicaba - SP Crawler tractors, motorgraders, compactors, hydraulic excavators, loaders & backhoes, wheel loaders, electricity generators, underground loaders
Campo Largo - PR Backhoes, loadersCNH Curitiba - PR (Case IH, New Holland) Wheel tractors, combines, platforms
Piracicaba - SP (Case IH, New Holland) Combines, tillers, pulverizersContagem - MG (Case CE, New Holland) Backhoes, loaders, motorgraders, crawlers tractors, hydraulic excavatorsSorocaba - SP (Case CE, Case IH, New Holland) Agricultural machinery, components, parts distribution center
Fiat Betim - MG Cars, light commercialsBetim - MG EnginesCampo Largo - PR Engines2
Ford Camaçari - BA Cars, light commercialsHorizonte - CE Light commercials (Troller)São Bernardo do Campo - SP Cars, light commercials, trucksTaubaté - SP Components, engines, transmissionsTatuí - SP Test center
General Motors São Caetano do Sul - SP Cars, light commercialsSão José dos Campos - SP Cars, light commercials, foundry, CKD preparation for export, engines and transmissionMogi das Cruzes - SP Stamped parts, parts distribution centerGravataí - RS CarsIndaiatuba - SP Test centre (Cruz Alta)Sorocaba - SP Parts distribution centerPorto de Suape - PE Vehicle distribution logistics center
Honda Sumaré - SP CarsHyundai CAOA Anápolis - GO Light commercials, trucksInternational Caxias do Sul - RS 1 Trucks
Caxias do Sul - RS Bus chassis (Neobus plant)Iveco Sete Lagoas - MG Light commercials, trucks, military vehicles, buses, engines
Sorocaba - SP Parts distribution centerJohn Deere Horizontina - RS Grain combines, tillers, corn and cutting platforms
Catalão - GO Sugar cane combines and accessoriesMontenegro - RS Wheel tractorsCampinas - SP Parts distribution center
KG São Bernardo do Campo - SP Vehicle assembly and welding sets, stamping, tooling, machiningKomatsu Suzano - SP Crawler tractors, hydraulic excavators, loaders & backhoes, motorgraders, foundry
Arujá - SP Combines, tanks and other productsMahindra Manaus - AM Light commercialsMAN Resende - RJ Volkswagen trucks and bus chassis, MAN trucksMercedes-Benz São Bernardo do Campo - SP Trucks, buses, engines, axles, transmissions
Campinas - SP Parts center, trainning centerJuiz de Fora - MG Trucks
Mitsubishi Catalão - GO Light commercialsNissan São José dos Pinhais - PR (Fábrica Curitiba Veículos Utilitários)2 Cars, light commercials (Nissan, Renault)Peugeot Citroën Porto Real - RJ Cars, light commercials
Porto Real - RJ EnginesRenault Complexo Industrial Ayrton Senna
São José dos Pinhais - PR (Fábrica Curitiba Veíc. de Passeio) Cars São José dos Pinhais - PR (Fábrica Curitiba Motores) Engine São José dos Pinhais - PR (Fábrica Curitiba Veículos Utilitários)2 Light commercials (Renault, Nissan)São Paulo - SP Renault Design Latin America
Scania São Bernardo do Campo - SP Trucks, buses, enginesToyota São Bernardo do Campo - SP Parts
Indaiatuba - SP CarsGuaíba - RS Vehicle distribution center
Valtra Mogi das Cruzes - SP Check AGCOVolkswagen São Bernardo do Campo - SP (Fábrica Anchieta) Cars, light commercials
Taubaté - SP CarsSão Carlos - SP EnginesSão José dos Pinhais - PR Cars, light commercials
Volvo Curitiba - PR Trucks, truck cabines, buses, engines
Job: Iveco -- Empresa: Leo Burnett -- Arquivo: 23794-007-IVECO-AN-Ecoline-20.5x27.5_pag001.pdfRegistro: 72613 -- Data: 15:49:34 30/03/2012
30
Indústria automobilística brasileiraBrazilian automotive industry
Anuário da Indústria Automobilística BrasileiraBrazilian Automotive Industry Yearbook
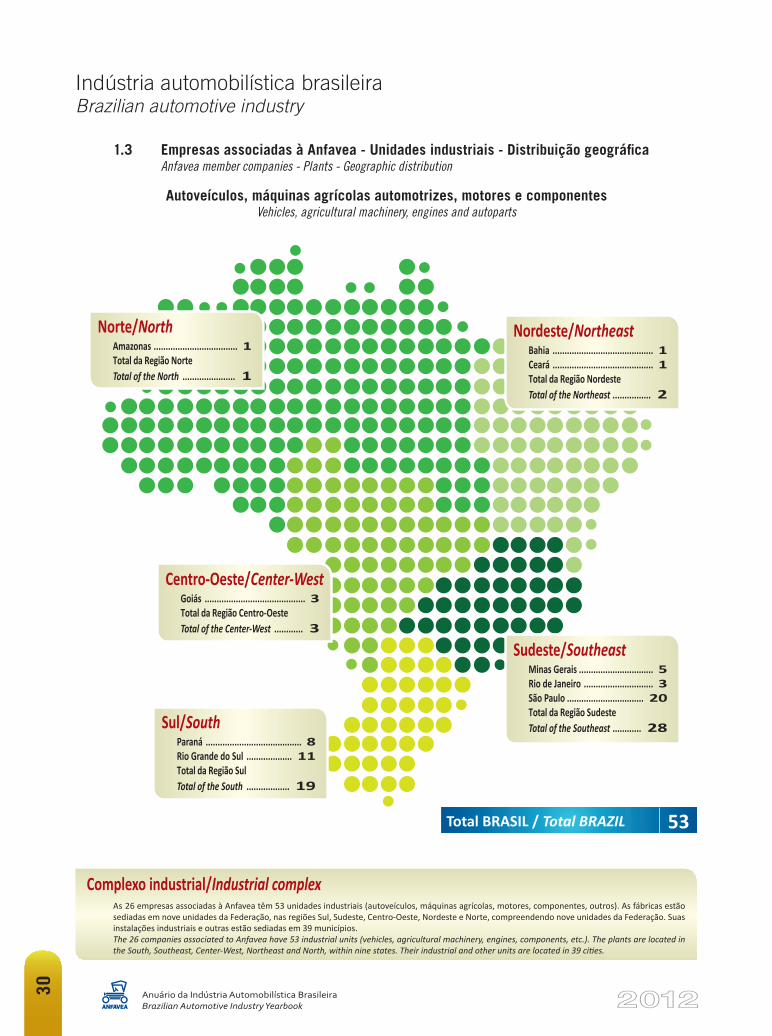
Autoveículos, máquinas agrícolas automotrizes, motores e componentesVehicles, agricultural machinery, engines and autoparts
Complexo industrial/Industrial complexAs 26 empresas associadas à Anfavea têm 53 unidades industriais (autoveículos, máquinas agrícolas, motores, componentes, outros). As fábricas estão sediadas em nove unidades da Federação, nas regiões Sul, Sudeste, Centro-Oeste, Nordeste e Norte, compreendendo nove unidades da Federação. Suas instalações industriais e outras estão sediadas em 39 municípios.The 26 companies associated to Anfavea have 53 industrial units (vehicles, agricultural machinery, engines, components, etc.). The plants are located in the South, Southeast, Center-West, Northeast and North, within nine states. Their industrial and other units are located in 39 cities.
1.3 Empresas associadas à Anfavea - Unidades industriais - Distribuição geográfica Anfavea member companies - Plants - Geographic distribution
Total BRASIL / Total BRAZIL 53
Sudeste/SoutheastMinas Gerais ............................... 5Rio de Janeiro ............................. 3São Paulo ................................ 20Total da Região Sudeste Total of the Southeast ............ 28
Nordeste/NortheastBahia .......................................... 1Ceará .......................................... 1Total da Região Nordeste Total of the Northeast ................ 2
Centro-Oeste/Center-WestGoiás .......................................... 3Total da Região Centro-Oeste Total of the Center-West ............ 3
Sul/SouthParaná ........................................ 8Rio Grande do Sul ................... 11Total da Região Sul Total of the South .................. 19
Norte/NorthAmazonas ................................... 1Total da Região Norte Total of the North ...................... 1

CONSTRUINDO E ALIMENTANDO O MUNDO.BUILDING AND FEEDING THE WORLD.
A CNH está presente em todo o país, produzindo e comercializando máquinas agrícolas e de construção. Nos cinco continentes, ela tem 40 fábricas e uma rede com mais de 11.300 concessionários em 170 países. Essa é a força da CNH, uma das maiores fabricantes mundiais de máquinas e líder nos segmentos onde atua. Uma empresa pioneira que desenvolve tecnologias para transformar o mundo.
CNH is present throughout Brazil, building machines that help to develop and feed our country. The company has a total of 40 manufacturing facilities and a network of more than 11,300 dealers in 170 different countries over the five continents. This is the strength of CNH, a world leader in the agricultural and construction equipment businesses. An industry-leading investing every day in new technologies to shape the world.
32
Indústria automobilística brasileiraBrazilian automotive industry
Anuário da Indústria Automobilística BrasileiraBrazilian Automotive Industry Yearbook
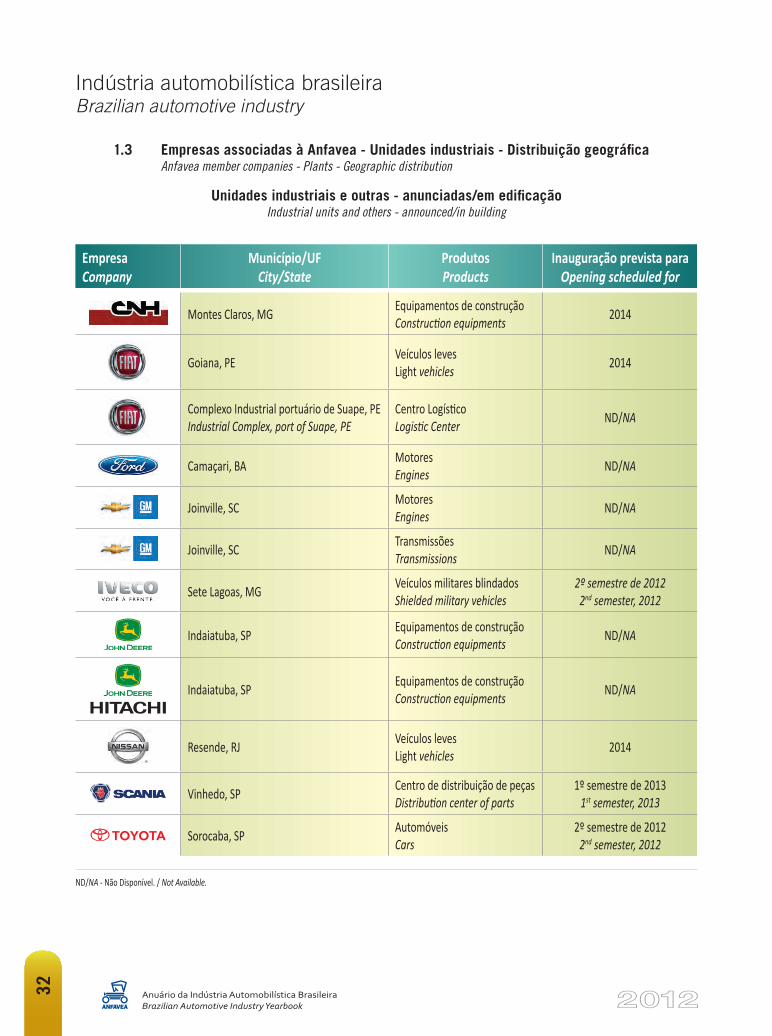
Unidades industriais e outras - anunciadas/em edificaçãoIndustrial units and others - announced/in building
1.3 Empresas associadas à Anfavea - Unidades industriais - Distribuição geográfica Anfavea member companies - Plants - Geographic distribution
Empresa Company
Município/UF City/State
ProdutosProducts
Inauguração prevista paraOpening scheduled for
Montes Claros, MG Equipamentos de construçãoConstruction equipments 2014
Goiana, PE Veículos levesLight vehicles 2014
Complexo Industrial portuário de Suape, PE Industrial Complex, port of Suape, PE
Centro LogísticoLogistic Center ND/NA
Camaçari, BA Motores Engines ND/NA
Joinville, SC MotoresEngines ND/NA
Joinville, SC Transmissões Transmissions ND/NA
Sete Lagoas, MG Veículos militares blindados Shielded military vehicles
2º semestre de 20122nd semester, 2012
Indaiatuba, SP Equipamentos de construçãoConstruction equipments ND/NA
Indaiatuba, SP Equipamentos de construçãoConstruction equipments ND/NA
Resende, RJ Veículos leves Light vehicles 2014
Vinhedo, SP Centro de distribuição de peçasDistribution center of parts
1º semestre de 20131st semester, 2013
Sorocaba, SP Automóveis Cars
2º semestre de 20122nd semester, 2012
ND/NA - Não Disponível. / Not Available.

a tecnologia da Massey Ferguson.
Quando o assunto é produtividade, os produtores
de todo o mundo usam a mesma linguagem:
França
Brasil
T R A B A L H A N D O C O M V O C Ê .
www.massey.com.br @MF_Brasilmasseyfergusonbrasilmasseybrasil
PRECISÃOALTA RENTABILIDADE
POTÊNCIA: 320CV e 370CV
TRANSMISSÃO - CVT(RESISTÊNCIA/DURABILIDADE)
VERSÁTEIS EM DIFERENTES CULTURAS
NOVOS TRATORES SÉRIE MF8600
MX-0025-12W-An-205x275-ANFAVEA.indd 1 5/10/12 10:52 AM
34
Indústria automobilística brasileiraBrazilian automotive industry
Anuário da Indústria Automobilística BrasileiraBrazilian Automotive Industry Yearbook
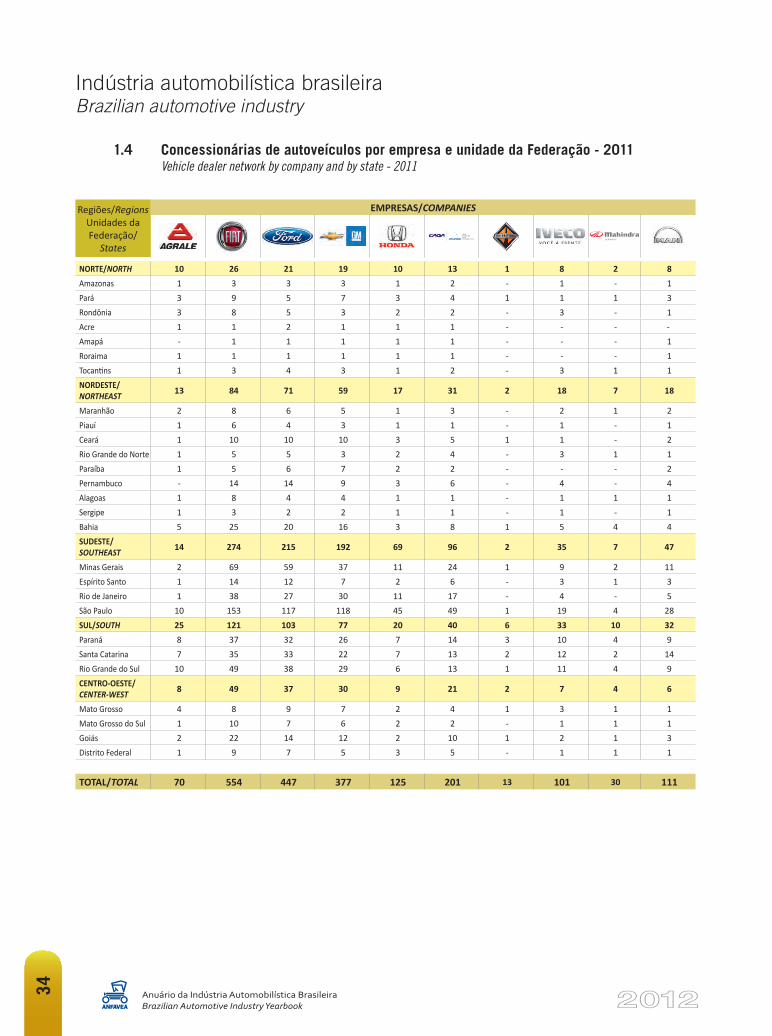
1.4 Concessionárias de autoveículos por empresa e unidade da Federação - 2011 Vehicle dealer network by company and by state - 2011
Regiões/Regions Unidades da Federação/
States
EMPRESAS/COMPANIES
by Bramont
NORTE/NORTH 10 26 21 19 10 13 1 8 2 8 Amazonas 1 3 3 3 1 2 - 1 - 1 Pará 3 9 5 7 3 4 1 1 1 3 Rondônia 3 8 5 3 2 2 - 3 - 1 Acre 1 1 2 1 1 1 - - - -Amapá - 1 1 1 1 1 - - - 1 Roraima 1 1 1 1 1 1 - - - 1 Tocantins 1 3 4 3 1 2 - 3 1 1 NORDESTE/NORTHEAST 13 84 71 59 17 31 2 18 7 18
Maranhão 2 8 6 5 1 3 - 2 1 2 Piauí 1 6 4 3 1 1 - 1 - 1 Ceará 1 10 10 10 3 5 1 1 - 2 Rio Grande do Norte 1 5 5 3 2 4 - 3 1 1 Paraíba 1 5 6 7 2 2 - - - 2 Pernambuco - 14 14 9 3 6 - 4 - 4 Alagoas 1 8 4 4 1 1 - 1 1 1 Sergipe 1 3 2 2 1 1 - 1 - 1 Bahia 5 25 20 16 3 8 1 5 4 4 SUDESTE/ SOUTHEAST 14 274 215 192 69 96 2 35 7 47
Minas Gerais 2 69 59 37 11 24 1 9 2 11 Espírito Santo 1 14 12 7 2 6 - 3 1 3 Rio de Janeiro 1 38 27 30 11 17 - 4 - 5 São Paulo 10 153 117 118 45 49 1 19 4 28 SUL/SOUTH 25 121 103 77 20 40 6 33 10 32 Paraná 8 37 32 26 7 14 3 10 4 9 Santa Catarina 7 35 33 22 7 13 2 12 2 14 Rio Grande do Sul 10 49 38 29 6 13 1 11 4 9 CENTRO-OESTE/CENTER-WEST 8 49 37 30 9 21 2 7 4 6
Mato Grosso 4 8 9 7 2 4 1 3 1 1 Mato Grosso do Sul 1 10 7 6 2 2 - 1 1 1 Goiás 2 22 14 12 2 10 1 2 1 3 Distrito Federal 1 9 7 5 3 5 - 1 1 1
TOTAL/TOTAL 70 554 447 377 125 201 13 101 30 111
35
Indústria automobilística brasileiraBrazilian automotive industry
Anuário da Indústria Automobilística BrasileiraBrazilian Automotive Industry Yearbook
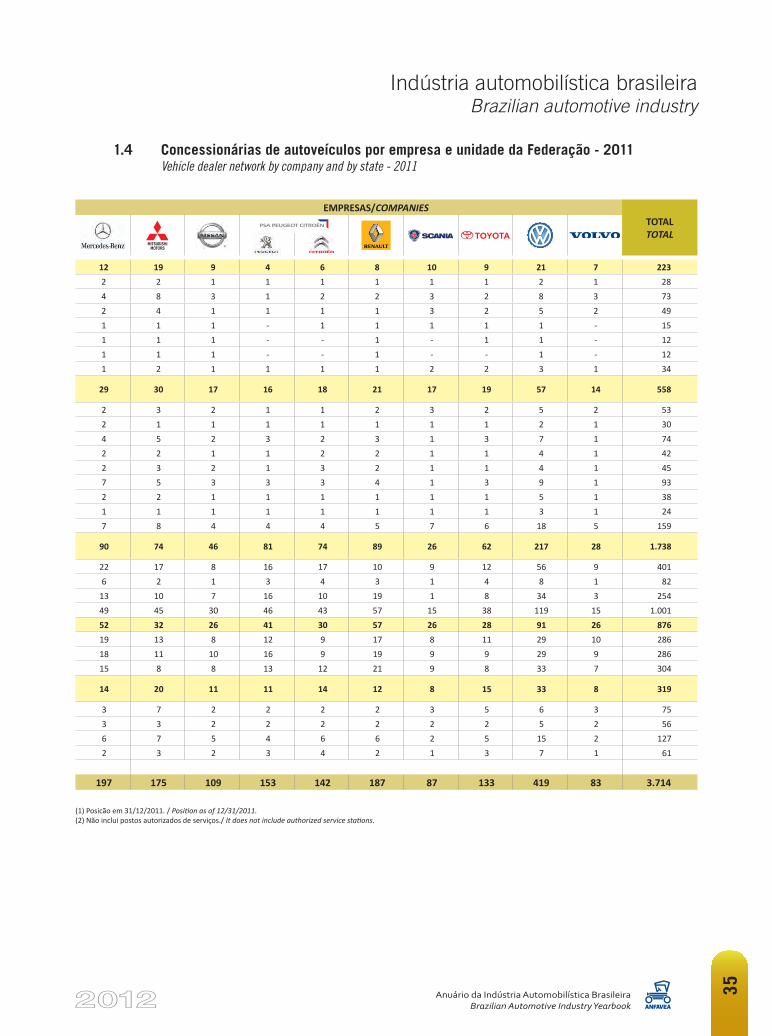
1.4 Concessionárias de autoveículos por empresa e unidade da Federação - 2011 Vehicle dealer network by company and by state - 2011
EMPRESAS/COMPANIESTOTAL TOTAL
12 19 9 4 6 8 10 9 21 7 223 2 2 1 1 1 1 1 1 2 1 28 4 8 3 1 2 2 3 2 8 3 73 2 4 1 1 1 1 3 2 5 2 49 1 1 1 - 1 1 1 1 1 - 15 1 1 1 - - 1 - 1 1 - 12 1 1 1 - - 1 - - 1 - 12 1 2 1 1 1 1 2 2 3 1 34
29 30 17 16 18 21 17 19 57 14 558
2 3 2 1 1 2 3 2 5 2 53 2 1 1 1 1 1 1 1 2 1 30 4 5 2 3 2 3 1 3 7 1 74 2 2 1 1 2 2 1 1 4 1 42 2 3 2 1 3 2 1 1 4 1 45 7 5 3 3 3 4 1 3 9 1 93 2 2 1 1 1 1 1 1 5 1 38 1 1 1 1 1 1 1 1 3 1 24 7 8 4 4 4 5 7 6 18 5 159
90 74 46 81 74 89 26 62 217 28 1.738
22 17 8 16 17 10 9 12 56 9 401 6 2 1 3 4 3 1 4 8 1 82
13 10 7 16 10 19 1 8 34 3 254 49 45 30 46 43 57 15 38 119 15 1.001 52 32 26 41 30 57 26 28 91 26 876 19 13 8 12 9 17 8 11 29 10 286 18 11 10 16 9 19 9 9 29 9 286 15 8 8 13 12 21 9 8 33 7 304
14 20 11 11 14 12 8 15 33 8 319
3 7 2 2 2 2 3 5 6 3 75 3 3 2 2 2 2 2 2 5 2 56 6 7 5 4 6 6 2 5 15 2 127 2 3 2 3 4 2 1 3 7 1 61
197 175 109 153 142 187 87 133 419 83 3.714
(1) Posicão em 31/12/2011. / Position as of 12/31/2011.(2) Não inclui postos autorizados de serviços./ It does not include authorized service stations.
36
Indústria automobilística brasileiraBrazilian automotive industry
Anuário da Indústria Automobilística BrasileiraBrazilian Automotive Industry Yearbook
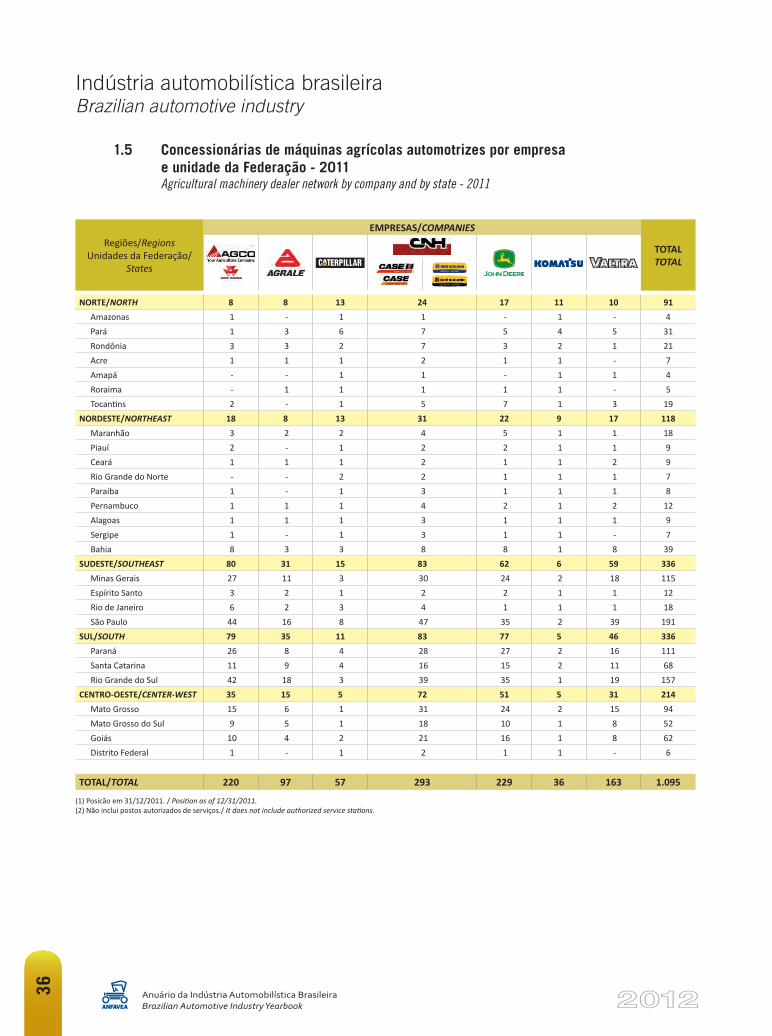
1.5 Concessionárias de máquinas agrícolas automotrizes por empresa e unidade da Federação - 2011 Agricultural machinery dealer network by company and by state - 2011
Regiões/Regions Unidades da Federação/
States
EMPRESAS/COMPANIES
TOTAL TOTAL
NORTE/NORTH 8 8 13 24 17 11 10 91Amazonas 1 - 1 1 - 1 - 4Pará 1 3 6 7 5 4 5 31Rondônia 3 3 2 7 3 2 1 21Acre 1 1 1 2 1 1 - 7Amapá - - 1 1 - 1 1 4Roraima - 1 1 1 1 1 - 5Tocantins 2 - 1 5 7 1 3 19
NORDESTE/NORTHEAST 18 8 13 31 22 9 17 118Maranhão 3 2 2 4 5 1 1 18Piauí 2 - 1 2 2 1 1 9Ceará 1 1 1 2 1 1 2 9Rio Grande do Norte - - 2 2 1 1 1 7Paraíba 1 - 1 3 1 1 1 8Pernambuco 1 1 1 4 2 1 2 12Alagoas 1 1 1 3 1 1 1 9Sergipe 1 - 1 3 1 1 - 7Bahia 8 3 3 8 8 1 8 39
SUDESTE/SOUTHEAST 80 31 15 83 62 6 59 336Minas Gerais 27 11 3 30 24 2 18 115Espírito Santo 3 2 1 2 2 1 1 12Rio de Janeiro 6 2 3 4 1 1 1 18São Paulo 44 16 8 47 35 2 39 191
SUL/SOUTH 79 35 11 83 77 5 46 336Paraná 26 8 4 28 27 2 16 111Santa Catarina 11 9 4 16 15 2 11 68Rio Grande do Sul 42 18 3 39 35 1 19 157
CENTRO-OESTE/CENTER-WEST 35 15 5 72 51 5 31 214Mato Grosso 15 6 1 31 24 2 15 94Mato Grosso do Sul 9 5 1 18 10 1 8 52Goiás 10 4 2 21 16 1 8 62Distrito Federal 1 - 1 2 1 1 - 6
TOTAL/TOTAL 220 97 57 293 229 36 163 1.095
(1) Posicão em 31/12/2011. / Position as of 12/31/2011.(2) Não inclui postos autorizados de serviços./ It does not include authorized service stations.
REN-0041-11_AN_AF.indd 1 12/23/11 11:51 AM
38
Indústria automobilística brasileiraBrazilian automotive industry
Anuário da Indústria Automobilística BrasileiraBrazilian Automotive Industry Yearbook
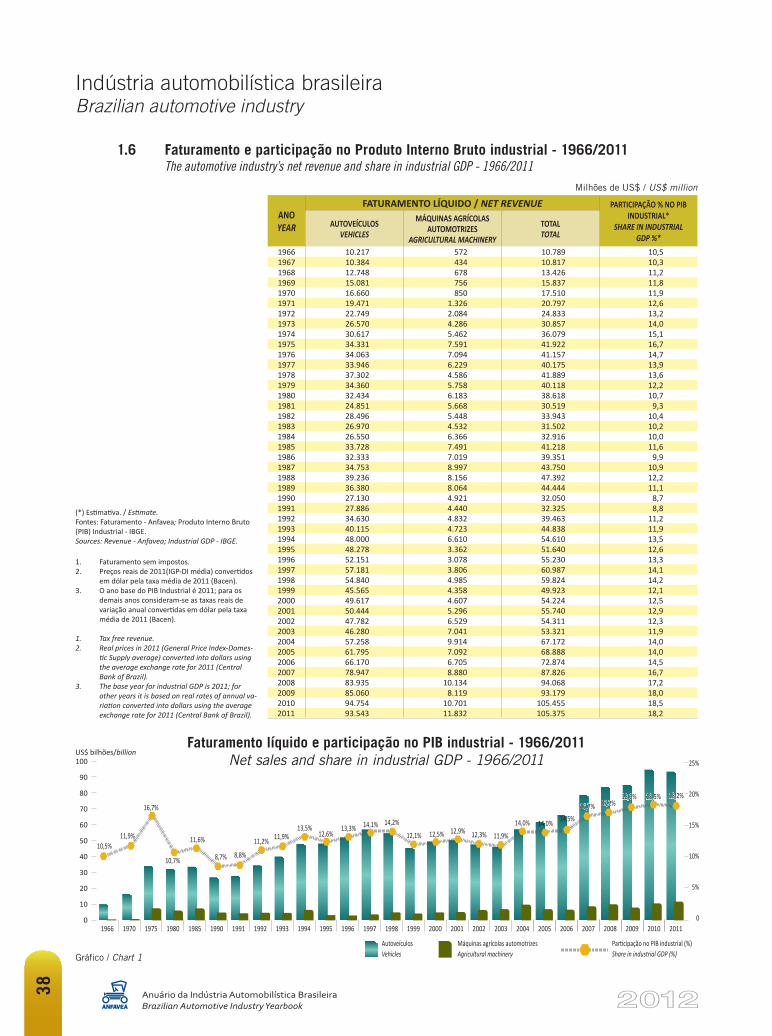
1.6 Faturamento e participação no Produto Interno Bruto industrial - 1966/2011 The automotive industry’s net revenue and share in industrial GDP - 1966/2011
Faturamento líquido e participação no PIB industrial - 1966/2011Net sales and share in industrial GDP - 1966/2011
Gráfico / Chart 1
(*) Estimativa. / Estimate.Fontes: Faturamento - Anfavea; Produto Interno Bruto (PIB) Industrial - IBGE.Sources: Revenue - Anfavea; Industrial GDP - IBGE.
1. Faturamento sem impostos. 2. Preços reais de 2011(IGP-DI média) convertidos
em dólar pela taxa média de 2011 (Bacen). 3. O ano base do PIB Industrial é 2011; para os
demais anos consideram-se as taxas reais de variação anual convertidas em dólar pela taxa média de 2011 (Bacen).
1. Tax free revenue. 2. Real prices in 2011 (General Price Index-Domes-
tic Supply average) converted into dollars using the average exchange rate for 2011 (Central Bank of Brazil).
3. The base year for industrial GDP is 2011; for other years it is based on real rates of annual va-riation converted into dollars using the average exchange rate for 2011 (Central Bank of Brazil).
Milhões de US$ / US$ million
US$ bilhões/billion
ANOYEAR
FATURAMENTO LÍQUIDO / NET REVENUE PARTICIPAÇÃO % NO PIB INDUSTRIAL*
SHARE IN INDUSTRIAL GDP %*
AUTOVEÍCULOS VEHICLES
MÁQUINAS AGRÍCOLAS AUTOMOTRIZES
AGRICULTURAL MACHINERY
TOTAL TOTAL
1966 10.217 572 10.789 10,5 1967 10.384 434 10.817 10,3 1968 12.748 678 13.426 11,2 1969 15.081 756 15.837 11,8 1970 16.660 850 17.510 11,9 1971 19.471 1.326 20.797 12,6 1972 22.749 2.084 24.833 13,2 1973 26.570 4.286 30.857 14,0 1974 30.617 5.462 36.079 15,1 1975 34.331 7.591 41.922 16,7 1976 34.063 7.094 41.157 14,7 1977 33.946 6.229 40.175 13,9 1978 37.302 4.586 41.889 13,6 1979 34.360 5.758 40.118 12,2 1980 32.434 6.183 38.618 10,7 1981 24.851 5.668 30.519 9,3 1982 28.496 5.448 33.943 10,4 1983 26.970 4.532 31.502 10,2 1984 26.550 6.366 32.916 10,0 1985 33.728 7.491 41.218 11,6 1986 32.333 7.019 39.351 9,9 1987 34.753 8.997 43.750 10,9 1988 39.236 8.156 47.392 12,2 1989 36.380 8.064 44.444 11,1 1990 27.130 4.921 32.050 8,7 1991 27.886 4.440 32.325 8,8 1992 34.630 4.832 39.463 11,2 1993 40.115 4.723 44.838 11,9 1994 48.000 6.610 54.610 13,5 1995 48.278 3.362 51.640 12,6 1996 52.151 3.078 55.230 13,3 1997 57.181 3.806 60.987 14,1 1998 54.840 4.985 59.824 14,2 1999 45.565 4.358 49.923 12,1 2000 49.617 4.607 54.224 12,5 2001 50.444 5.296 55.740 12,9 2002 47.782 6.529 54.311 12,3 2003 46.280 7.041 53.321 11,9 2004 57.258 9.914 67.172 14,0 2005 61.795 7.092 68.888 14,0 2006 66.170 6.705 72.874 14,5 2007 78.947 8.880 87.826 16,7 2008 83.935 10.134 94.068 17,2 2009 85.060 8.119 93.179 18,0 2010 94.754 10.701 105.455 18,5 2011 93.543 11.832 105.375 18,2
AutoveículosVehicles
Máquinas agrícolas automotrizesAgricultural machinery
Participação no PIB industrial (%)Share in industrial GDP (%)
100
90
80
70
60
50
40
30
20
10
0
25%
20%
15%
10%
5%
01966 1970 1975 1980 1985 1990 1991 1992 1993 1994 1995 1996 1997 1998 1999 2000 2001 2002 2003 2004 2005 2006 2007 2008 2009 2010 2011
10,5%11,9%
16,7%
10,7%
11,6%
8,7% 8,8%
11,2% 11,9%13,5%
12,6%13,3% 14,1% 14,2%
12,1% 12,5% 12,9% 12,3% 11,9%
14,0% 14,0% 14,5%16,7% 17,2%
18,0% 18,5% 18,2%
40
Indústria automobilística brasileiraBrazilian automotive industry
Anuário da Indústria Automobilística BrasileiraBrazilian Automotive Industry Yearbook
ANO YEAR
AUTOVEÍCULOS VEHICLES
MÁQUINAS AGRÍCOLAS AUTOMOTRIZES AGRICULTURAL MACHINERY
TOTAL TOTAL
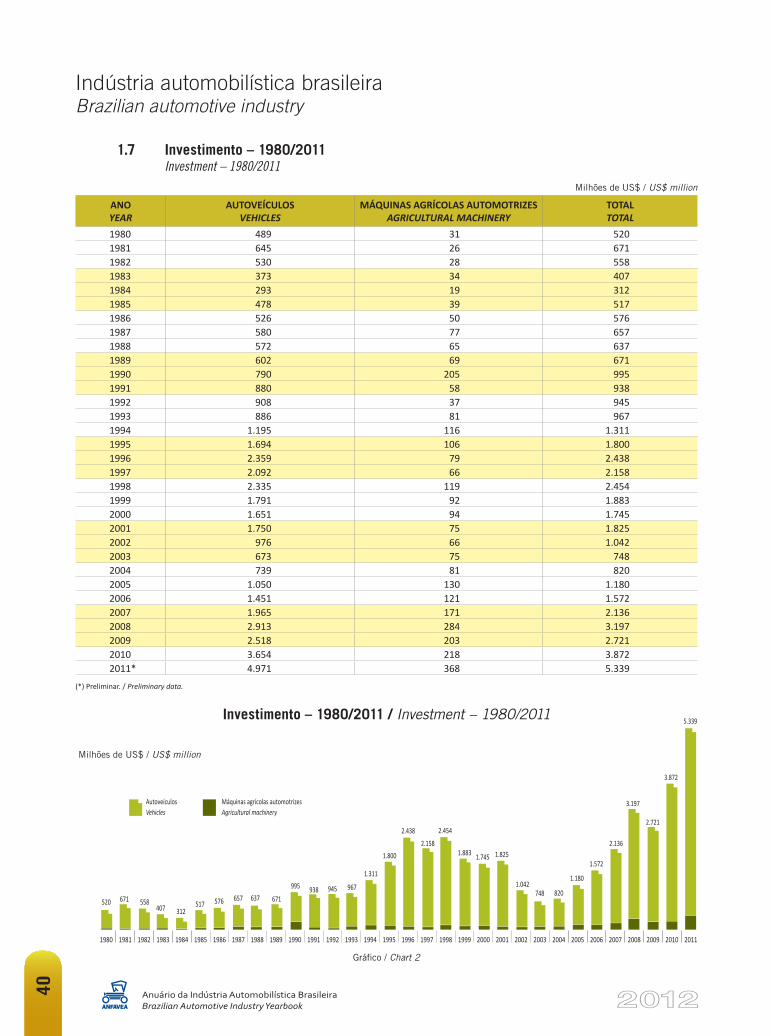
1980 489 31 5201981 645 26 6711982 530 28 5581983 373 34 4071984 293 19 3121985 478 39 5171986 526 50 5761987 580 77 6571988 572 65 6371989 602 69 6711990 790 205 9951991 880 58 9381992 908 37 9451993 886 81 9671994 1.195 116 1.3111995 1.694 106 1.8001996 2.359 79 2.4381997 2.092 66 2.1581998 2.335 119 2.4541999 1.791 92 1.8832000 1.651 94 1.7452001 1.750 75 1.8252002 976 66 1.0422003 673 75 7482004 739 81 8202005 1.050 130 1.1802006 1.451 121 1.5722007 1.965 171 2.1362008 2.913 284 3.1972009 2.518 203 2.7212010 3.654 218 3.8722011* 4.971 368 5.339
(*) Preliminar. / Preliminary data.
Gráfico / Chart 2
Investimento – 1980/2011 / Investment – 1980/2011
Milhões de US$ / US$ million
1.7 Investimento – 1980/2011 Investment – 1980/2011
Milhões de US$ / US$ million
1980 1981 1982 1983 1984 1985 1986 1987 1988 1989 1990 1991 1992 1993 1994 1995 1996 1997 1998 1999 2000 2001 2002 2003 2004 2005 2006 2007 2008 2009 2010 2011
520 671 558407 312
517 576 657 637 671
995 938 945 967
1.311
1.800
2.4382.158
2.454
1.883 1.745 1.825
1.042748 820
1.180
1.572
2.136
3.197
2.721
3.872
5.339
AutoveículosVehicles
Máquinas agrícolas automotrizesAgricultural machinery
42
Indústria automobilística brasileiraBrazilian automotive industry
Anuário da Indústria Automobilística BrasileiraBrazilian Automotive Industry Yearbook
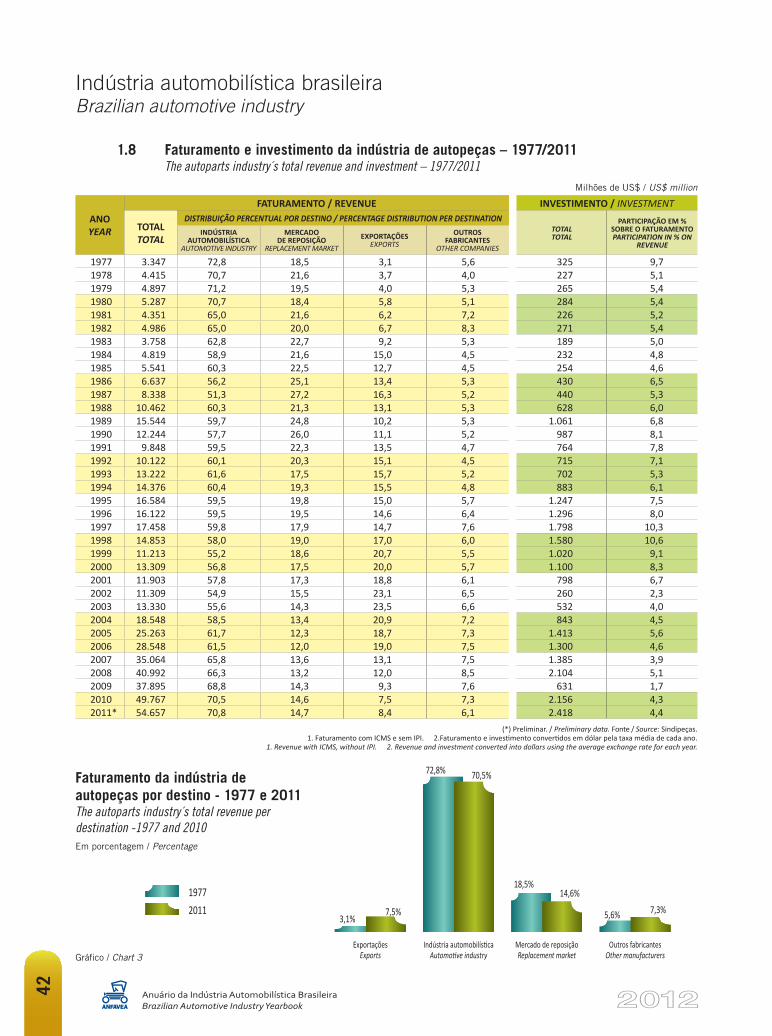
Em porcentagem / Percentage
Faturamento da indústria de autopeças por destino - 1977 e 2011The autoparts industry´s total revenue per destination -1977 and 2010
Gráfico / Chart 3
(*) Preliminar. / Preliminary data. Fonte / Source: Sindipeças.1. Faturamento com ICMS e sem IPI. 2.Faturamento e investimento convertidos em dólar pela taxa média de cada ano.
1. Revenue with ICMS, without IPI. 2. Revenue and investment converted into dollars using the average exchange rate for each year.
1.8 Faturamento e investimento da indústria de autopeças – 1977/2011 The autoparts industry´s total revenue and investment – 1977/2011
Milhões de US$ / US$ million
ANO YEAR
FATURAMENTO / REVENUE INVESTIMENTO / INVESTMENT
TOTAL TOTAL
DISTRIBUIÇÃO PERCENTUAL POR DESTINO / PERCENTAGE DISTRIBUTION PER DESTINATIONTOTALTOTAL
PARTICIPAÇÃO EM % SOBRE O FATURAMENTOPARTICIPATION IN % ON
REVENUE
INDÚSTRIA AUTOMOBILÍSTICA
AUTOMOTIVE INDUSTRY
MERCADO DE REPOSIÇÃO
REPLACEMENT MARKETEXPORTAÇÕES
EXPORTSOUTROS
FABRICANTES OTHER COMPANIES
1977 3.347 72,8 18,5 3,1 5,6 325 9,71978 4.415 70,7 21,6 3,7 4,0 227 5,11979 4.897 71,2 19,5 4,0 5,3 265 5,41980 5.287 70,7 18,4 5,8 5,1 284 5,41981 4.351 65,0 21,6 6,2 7,2 226 5,21982 4.986 65,0 20,0 6,7 8,3 271 5,41983 3.758 62,8 22,7 9,2 5,3 189 5,01984 4.819 58,9 21,6 15,0 4,5 232 4,81985 5.541 60,3 22,5 12,7 4,5 254 4,61986 6.637 56,2 25,1 13,4 5,3 430 6,51987 8.338 51,3 27,2 16,3 5,2 440 5,31988 10.462 60,3 21,3 13,1 5,3 628 6,01989 15.544 59,7 24,8 10,2 5,3 1.061 6,81990 12.244 57,7 26,0 11,1 5,2 987 8,11991 9.848 59,5 22,3 13,5 4,7 764 7,81992 10.122 60,1 20,3 15,1 4,5 715 7,11993 13.222 61,6 17,5 15,7 5,2 702 5,31994 14.376 60,4 19,3 15,5 4,8 883 6,11995 16.584 59,5 19,8 15,0 5,7 1.247 7,51996 16.122 59,5 19,5 14,6 6,4 1.296 8,01997 17.458 59,8 17,9 14,7 7,6 1.798 10,31998 14.853 58,0 19,0 17,0 6,0 1.580 10,61999 11.213 55,2 18,6 20,7 5,5 1.020 9,12000 13.309 56,8 17,5 20,0 5,7 1.100 8,32001 11.903 57,8 17,3 18,8 6,1 798 6,72002 11.309 54,9 15,5 23,1 6,5 260 2,32003 13.330 55,6 14,3 23,5 6,6 532 4,02004 18.548 58,5 13,4 20,9 7,2 843 4,52005 25.263 61,7 12,3 18,7 7,3 1.413 5,62006 28.548 61,5 12,0 19,0 7,5 1.300 4,62007 35.064 65,8 13,6 13,1 7,5 1.385 3,92008 40.992 66,3 13,2 12,0 8,5 2.104 5,12009 37.895 68,8 14,3 9,3 7,6 631 1,72010 49.767 70,5 14,6 7,5 7,3 2.156 4,32011* 54.657 70,8 14,7 8,4 6,1 2.418 4,4
3,1%7,5%
18,5%14,6%
5,6% 7,3%
72,8% 70,5%
ExportaçõesExports
Indústria automobilísticaAutomotive industry
Mercado de reposiçãoReplacement market
Outros fabricantesOther manufacturers
19772011
Eventos do setor automotivo:
A Reed Exhibitions Alcantara Machado, líder Mundial na Organização de Eventos, realiza 8 feiras da cadeia automotiva/logística, atendendo 46 setores destes segmentos.
+ de 1.100.000 de visitantes presentes nos eventos; + de 2.886 expositores representantes de toda a cadeia automotiva/logística; 94% de expositores satisfeitos e 82% tem intenção de retornar na próxima edição do evento; 94% de visitantes satisfeitos e 95% tem intenção de retornar na próxima edição do evento.
São Paulo - R. Bela Cintra, 1200 - 7º andar CEP 01415-001 | São Paulo, SP | BrasilT. +55 11 3060 5000 | F. +55 11 3060 5001
Visite www.reedalcantara.com.br
16 a 18 de agosto de 2012Expo Center Norte - Pav. Azul | São Paulo, SP
www.congresso-fenabrave.com.br
24 a 25 de outubro de 2012FECOMÉRCIO | São Paulo, SP
www.ecotranslog.com.br
24 de outubro a 4 de novembro de 2012
Anhembi | São Paulo, SPwww.salaodoautomovel.com.br
S A L Ã O I N T E R N A C I O N A L D E
VEÍCULOS ANTIGOS
22 a 25 de novembro de 2012Anhembi | São Paulo, SP
www.salaodeantigos.com.br
8 a 13 de outubro de 2013Anhembi | São Paulo, SP
www.salaoduasrodas.com.br
28 de outubro a 1 de novembro de 2013
Anhembi | São Paulo, SPwww.fenatran.com.br
16 a 20 de abril de 2013Anhembi | São Paulo, SP
www.automecfeira.com.br
01 a 05 de maio de 2014 Anhembi | São Paulo, SP
www.automecpesados.com.br
C
M
Y
CM
MY
CY
CMY
K
205x275_ANFAVEA.pdf 04/05/2012 10:27:06
44
Indústria automobilística brasileiraBrazilian automotive industry
Anuário da Indústria Automobilística BrasileiraBrazilian Automotive Industry Yearbook
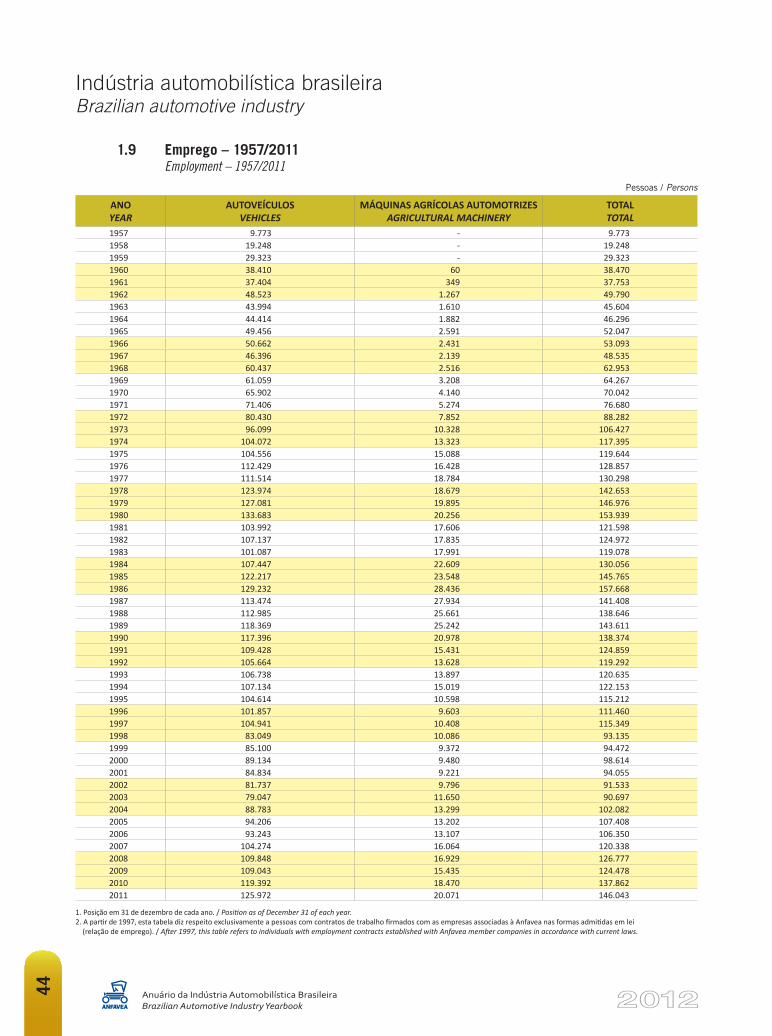
Pessoas / Persons
ANO YEAR
AUTOVEÍCULOS VEHICLES
MÁQUINAS AGRÍCOLAS AUTOMOTRIZES AGRICULTURAL MACHINERY
TOTAL TOTAL
1957 9.773 - 9.7731958 19.248 - 19.2481959 29.323 - 29.3231960 38.410 60 38.4701961 37.404 349 37.7531962 48.523 1.267 49.7901963 43.994 1.610 45.6041964 44.414 1.882 46.2961965 49.456 2.591 52.0471966 50.662 2.431 53.0931967 46.396 2.139 48.5351968 60.437 2.516 62.9531969 61.059 3.208 64.2671970 65.902 4.140 70.0421971 71.406 5.274 76.6801972 80.430 7.852 88.2821973 96.099 10.328 106.4271974 104.072 13.323 117.3951975 104.556 15.088 119.6441976 112.429 16.428 128.8571977 111.514 18.784 130.2981978 123.974 18.679 142.6531979 127.081 19.895 146.9761980 133.683 20.256 153.9391981 103.992 17.606 121.5981982 107.137 17.835 124.9721983 101.087 17.991 119.0781984 107.447 22.609 130.0561985 122.217 23.548 145.7651986 129.232 28.436 157.6681987 113.474 27.934 141.4081988 112.985 25.661 138.6461989 118.369 25.242 143.6111990 117.396 20.978 138.3741991 109.428 15.431 124.8591992 105.664 13.628 119.2921993 106.738 13.897 120.6351994 107.134 15.019 122.1531995 104.614 10.598 115.2121996 101.857 9.603 111.4601997 104.941 10.408 115.3491998 83.049 10.086 93.1351999 85.100 9.372 94.4722000 89.134 9.480 98.6142001 84.834 9.221 94.0552002 81.737 9.796 91.5332003 79.047 11.650 90.6972004 88.783 13.299 102.0822005 94.206 13.202 107.4082006 93.243 13.107 106.3502007 104.274 16.064 120.3382008 109.848 16.929 126.7772009 109.043 15.435 124.4782010 119.392 18.470 137.8622011 125.972 20.071 146.043
1. Posição em 31 de dezembro de cada ano. / Position as of December 31 of each year.2. A partir de 1997, esta tabela diz respeito exclusivamente a pessoas com contratos de trabalho firmados com as empresas associadas à Anfavea nas formas admitidas em lei (relação de emprego). / After 1997, this table refers to individuals with employment contracts established with Anfavea member companies in accordance with current laws.
1.9 Emprego – 1957/2011 Employment – 1957/2011

46
Indústria automobilística brasileiraBrazilian automotive industry
Anuário da Indústria Automobilística BrasileiraBrazilian Automotive Industry Yearbook
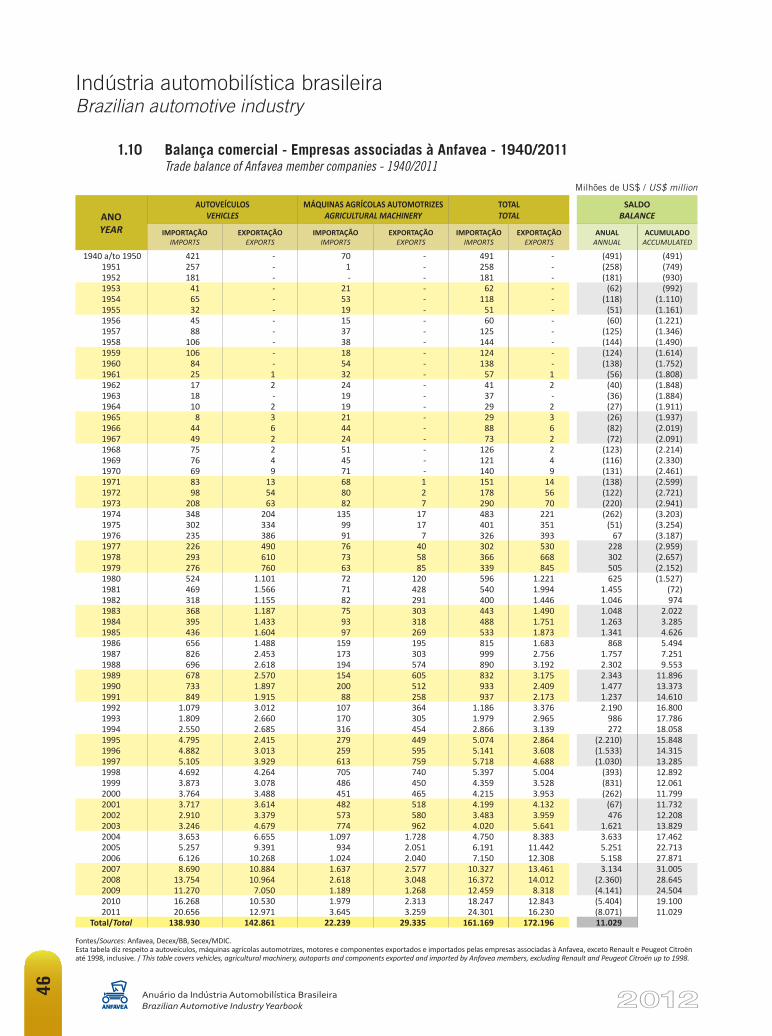
Fontes/Sources: Anfavea, Decex/BB, Secex/MDIC.Esta tabela diz respeito a autoveículos, máquinas agrícolas automotrizes, motores e componentes exportados e importados pelas empresas associadas à Anfavea, exceto Renault e Peugeot Citroën até 1998, inclusive. / This table covers vehicles, agricultural machinery, autoparts and components exported and imported by Anfavea members, excluding Renault and Peugeot Citroën up to 1998.
Milhões de US$ / US$ million
ANO YEAR
AUTOVEÍCULOS VEHICLES
MÁQUINAS AGRÍCOLAS AUTOMOTRIZES AGRICULTURAL MACHINERY
TOTAL TOTAL
SALDO BALANCE
IMPORTAÇÃOIMPORTS
EXPORTAÇÃOEXPORTS
IMPORTAÇÃOIMPORTS
EXPORTAÇÃOEXPORTS
IMPORTAÇÃOIMPORTS
EXPORTAÇÃOEXPORTS
ANUALANNUAL
ACUMULADOACCUMULATED
1940 a/to 1950 421 - 70 - 491 - (491) (491)1951 257 - 1 - 258 - (258) (749)1952 181 - - - 181 - (181) (930)1953 41 - 21 - 62 - (62) (992)1954 65 - 53 - 118 - (118) (1.110)1955 32 - 19 - 51 - (51) (1.161)1956 45 - 15 - 60 - (60) (1.221)1957 88 - 37 - 125 - (125) (1.346)1958 106 - 38 - 144 - (144) (1.490)1959 106 - 18 - 124 - (124) (1.614)1960 84 - 54 - 138 - (138) (1.752)1961 25 1 32 - 57 1 (56) (1.808)1962 17 2 24 - 41 2 (40) (1.848)1963 18 - 19 - 37 - (36) (1.884)1964 10 2 19 - 29 2 (27) (1.911)1965 8 3 21 - 29 3 (26) (1.937)1966 44 6 44 - 88 6 (82) (2.019)1967 49 2 24 - 73 2 (72) (2.091)1968 75 2 51 - 126 2 (123) (2.214)1969 76 4 45 - 121 4 (116) (2.330)1970 69 9 71 - 140 9 (131) (2.461)1971 83 13 68 1 151 14 (138) (2.599)1972 98 54 80 2 178 56 (122) (2.721)1973 208 63 82 7 290 70 (220) (2.941)1974 348 204 135 17 483 221 (262) (3.203)1975 302 334 99 17 401 351 (51) (3.254)1976 235 386 91 7 326 393 67 (3.187)1977 226 490 76 40 302 530 228 (2.959)1978 293 610 73 58 366 668 302 (2.657)1979 276 760 63 85 339 845 505 (2.152)1980 524 1.101 72 120 596 1.221 625 (1.527)1981 469 1.566 71 428 540 1.994 1.455 (72)1982 318 1.155 82 291 400 1.446 1.046 974 1983 368 1.187 75 303 443 1.490 1.048 2.022 1984 395 1.433 93 318 488 1.751 1.263 3.285 1985 436 1.604 97 269 533 1.873 1.341 4.626 1986 656 1.488 159 195 815 1.683 868 5.494 1987 826 2.453 173 303 999 2.756 1.757 7.251 1988 696 2.618 194 574 890 3.192 2.302 9.553 1989 678 2.570 154 605 832 3.175 2.343 11.896 1990 733 1.897 200 512 933 2.409 1.477 13.373 1991 849 1.915 88 258 937 2.173 1.237 14.610 1992 1.079 3.012 107 364 1.186 3.376 2.190 16.800 1993 1.809 2.660 170 305 1.979 2.965 986 17.786 1994 2.550 2.685 316 454 2.866 3.139 272 18.058 1995 4.795 2.415 279 449 5.074 2.864 (2.210) 15.848 1996 4.882 3.013 259 595 5.141 3.608 (1.533) 14.315 1997 5.105 3.929 613 759 5.718 4.688 (1.030) 13.285 1998 4.692 4.264 705 740 5.397 5.004 (393) 12.892 1999 3.873 3.078 486 450 4.359 3.528 (831) 12.061 2000 3.764 3.488 451 465 4.215 3.953 (262) 11.799 2001 3.717 3.614 482 518 4.199 4.132 (67) 11.732 2002 2.910 3.379 573 580 3.483 3.959 476 12.208 2003 3.246 4.679 774 962 4.020 5.641 1.621 13.829 2004 3.653 6.655 1.097 1.728 4.750 8.383 3.633 17.462 2005 5.257 9.391 934 2.051 6.191 11.442 5.251 22.713 2006 6.126 10.268 1.024 2.040 7.150 12.308 5.158 27.871 2007 8.690 10.884 1.637 2.577 10.327 13.461 3.134 31.005 2008 13.754 10.964 2.618 3.048 16.372 14.012 (2.360) 28.645 2009 11.270 7.050 1.189 1.268 12.459 8.318 (4.141) 24.504 2010 16.268 10.530 1.979 2.313 18.247 12.843 (5.404) 19.100 2011 20.656 12.971 3.645 3.259 24.301 16.230 (8.071) 11.029
Total/Total 138.930 142.861 22.239 29.335 161.169 172.196 11.029
1.10 Balança comercial - Empresas associadas à Anfavea - 1940/2011 Trade balance of Anfavea member companies - 1940/2011
RIN
O C
OM
Faça revisões em seuveículo regularmente.
O mundo inteiro busca soluções parao controle de poluentes. A Scania traz.Scania SCR. O sucesso que roda no mundo inteiro já está pronto para rodar no Brasil.Mais informações: www.proconvep7.scania.com.br.
SCAN0611-0722_An_conama_cavalos 205x275.indd 1 3/13/12 11:58 AM
48
Indústria automobilística brasileiraBrazilian automotive industry
Anuário da Indústria Automobilística BrasileiraBrazilian Automotive Industry Yearbook
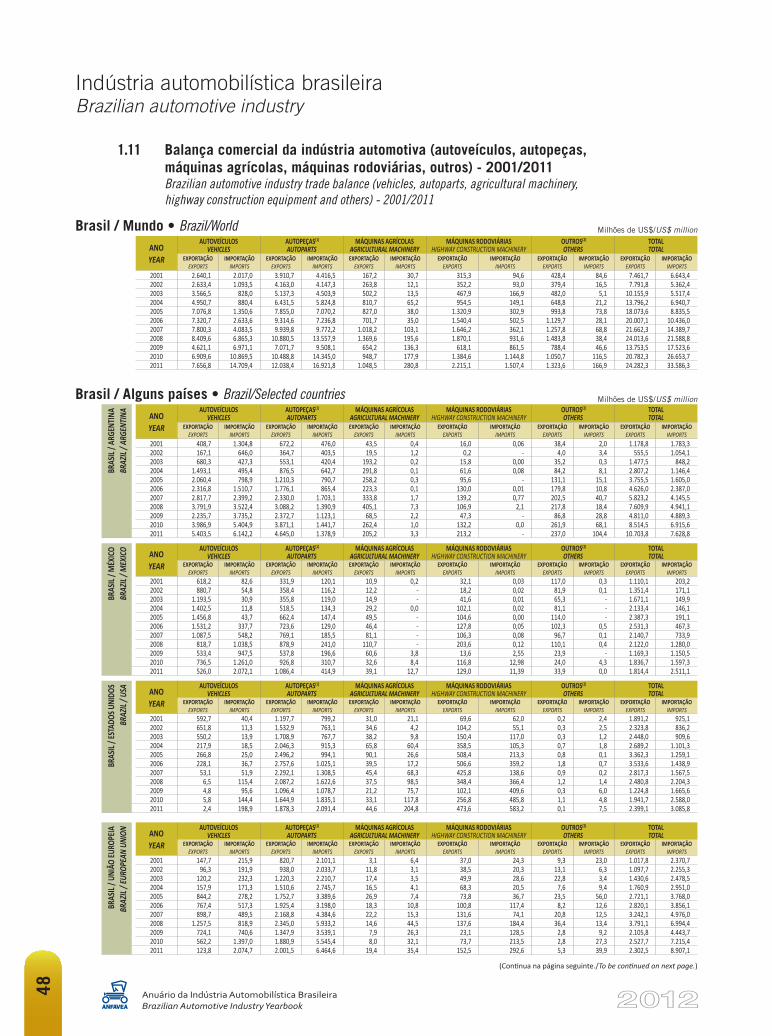
1.11 Balança comercial da indústria automotiva (autoveículos, autopeças, máquinas agrícolas, máquinas rodoviárias, outros) - 2001/2011 Brazilian automotive industry trade balance (vehicles, autoparts, agricultural machinery, highway construction equipment and others) - 2001/2011
Brasil / Mundo • Brazil/WorldANO YEAR
AUTOVEÍCULOS VEHICLES
AUTOPEÇAS(1) AUTOPARTS
MÁQUINAS AGRÍCOLAS AGRICULTURAL MACHINERY
MÁQUINAS RODOVIÁRIAS HIGHWAY CONSTRUCTION MACHINERY
OUTROS(2) OTHERS
TOTAL TOTAL
EXPORTAÇÃO EXPORTS
IMPORTAÇÃO IMPORTS
EXPORTAÇÃO EXPORTS
IMPORTAÇÃO IMPORTS
EXPORTAÇÃO EXPORTS
IMPORTAÇÃO IMPORTS
EXPORTAÇÃO EXPORTS
IMPORTAÇÃO IMPORTS
EXPORTAÇÃO EXPORTS
IMPORTAÇÃO IMPORTS
EXPORTAÇÃO EXPORTS
IMPORTAÇÃO IMPORTS
2001 2.640,1 2.017,0 3.910,7 4.416,5 167,2 30,7 315,3 94,6 428,4 84,6 7.461,7 6.643,4 2002 2.633,4 1.093,5 4.163,0 4.147,3 263,8 12,1 352,2 93,0 379,4 16,5 7.791,8 5.362,4 2003 3.566,5 828,0 5.137,3 4.503,9 502,2 13,5 467,9 166,9 482,0 5,1 10.155,9 5.517,4 2004 4.950,7 880,4 6.431,5 5.824,8 810,7 65,2 954,5 149,1 648,8 21,2 13.796,2 6.940,7 2005 7.076,8 1.350,6 7.855,0 7.070,2 827,0 38,0 1.320,9 302,9 993,8 73,8 18.073,6 8.835,5 2006 7.320,7 2.633,6 9.314,6 7.236,8 701,7 35,0 1.540,4 502,5 1.129,7 28,1 20.007,1 10.436,0 2007 7.800,3 4.083,5 9.939,8 9.772,2 1.018,2 103,1 1.646,2 362,1 1.257,8 68,8 21.662,3 14.389,7 2008 8.409,6 6.865,3 10.880,5 13.557,9 1.369,6 195,6 1.870,1 931,6 1.483,8 38,4 24.013,6 21.588,8 2009 4.621,1 6.971,1 7.071,7 9.508,1 654,2 136,3 618,1 861,5 788,4 46,6 13.753,5 17.523,6 2010 6.909,6 10.869,5 10.488,8 14.345,0 948,7 177,9 1.384,6 1.144,8 1.050,7 116,5 20.782,3 26.653,7 2011 7.656,8 14.709,4 12.038,4 16.921,8 1.048,5 280,8 2.215,1 1.507,4 1.323,6 166,9 24.282,3 33.586,3
Brasil / Alguns países • Brazil/Selected countries
BRAS
IL / A
RGEN
TINA
BRAZ
IL / A
RGEN
TINA
ANO YEAR
AUTOVEÍCULOS VEHICLES
AUTOPEÇAS(1) AUTOPARTS
MÁQUINAS AGRÍCOLAS AGRICULTURAL MACHINERY
MÁQUINAS RODOVIÁRIAS HIGHWAY CONSTRUCTION MACHINERY
OUTROS(2) OTHERS
TOTAL TOTAL
EXPORTAÇÃO EXPORTS
IMPORTAÇÃO IMPORTS
EXPORTAÇÃO EXPORTS
IMPORTAÇÃO IMPORTS
EXPORTAÇÃO EXPORTS
IMPORTAÇÃO IMPORTS
EXPORTAÇÃO EXPORTS
IMPORTAÇÃO IMPORTS
EXPORTAÇÃO EXPORTS
IMPORTAÇÃO IMPORTS
EXPORTAÇÃO EXPORTS
IMPORTAÇÃO IMPORTS
2001 408,7 1.304,8 672,2 476,0 43,5 0,4 16,0 0,06 38,4 2,0 1.178,8 1.783,3 2002 167,1 646,0 364,7 403,5 19,5 1,2 0,2 - 4,0 3,4 555,5 1.054,1 2003 680,3 427,3 553,1 420,4 193,2 0,2 15,8 0,00 35,2 0,3 1.477,5 848,2 2004 1.493,1 495,4 876,5 642,7 291,8 0,1 61,6 0,08 84,2 8,1 2.807,2 1.146,4 2005 2.060,4 798,9 1.210,3 790,7 258,2 0,3 95,6 - 131,1 15,1 3.755,5 1.605,0 2006 2.316,8 1.510,7 1.776,1 865,4 223,3 0,1 130,0 0,01 179,8 10,8 4.626,0 2.387,0 2007 2.817,7 2.399,2 2.330,0 1.703,1 333,8 1,7 139,2 0,77 202,5 40,7 5.823,2 4.145,5 2008 3.791,9 3.522,4 3.088,2 1.390,9 405,1 7,3 106,9 2,1 217,8 18,4 7.609,9 4.941,1 2009 2.235,7 3.735,2 2.372,7 1.123,1 68,5 2,2 47,3 - 86,8 28,8 4.811,0 4.889,3 2010 3.986,9 5.404,9 3.871,1 1.441,7 262,4 1,0 132,2 0,0 261,9 68,1 8.514,5 6.915,6 2011 5.403,5 6.142,2 4.645,0 1.378,9 205,2 3,3 213,2 - 237,0 104,4 10.703,8 7.628,8
BRAS
IL / M
ÉXICO
BR
AZIL
/ MEX
ICO ANO YEAR
AUTOVEÍCULOS VEHICLES
AUTOPEÇAS(1) AUTOPARTS
MÁQUINAS AGRÍCOLAS AGRICULTURAL MACHINERY
MÁQUINAS RODOVIÁRIAS HIGHWAY CONSTRUCTION MACHINERY
OUTROS(2) OTHERS
TOTAL TOTAL
EXPORTAÇÃO EXPORTS
IMPORTAÇÃO IMPORTS
EXPORTAÇÃO EXPORTS
IMPORTAÇÃO IMPORTS
EXPORTAÇÃO EXPORTS
IMPORTAÇÃO IMPORTS
EXPORTAÇÃO EXPORTS
IMPORTAÇÃO IMPORTS
EXPORTAÇÃO EXPORTS
IMPORTAÇÃO IMPORTS
EXPORTAÇÃO EXPORTS
IMPORTAÇÃO IMPORTS
2001 618,2 82,6 331,9 120,1 10,9 0,2 32,1 0,03 117,0 0,3 1.110,1 203,2 2002 880,7 54,8 358,4 116,2 12,2 - 18,2 0,02 81,9 0,1 1.351,4 171,1 2003 1.193,5 30,9 355,8 119,0 14,9 - 41,6 0,01 65,3 - 1.671,1 149,9 2004 1.402,5 11,8 518,5 134,3 29,2 0,0 102,1 0,02 81,1 - 2.133,4 146,1 2005 1.456,8 43,7 662,4 147,4 49,5 - 104,6 0,00 114,0 - 2.387,3 191,1 2006 1.531,2 337,7 723,6 129,0 46,4 - 127,8 0,05 102,3 0,5 2.531,3 467,3 2007 1.087,5 548,2 769,1 185,5 81,1 - 106,3 0,08 96,7 0,1 2.140,7 733,9 2008 818,7 1.038,5 878,9 241,0 110,7 - 203,6 0,12 110,1 0,4 2.122,0 1.280,0 2009 533,4 947,5 537,8 196,6 60,6 3,8 13,6 2,55 23,9 - 1.169,3 1.150,5 2010 736,5 1.261,0 926,8 310,7 32,6 8,4 116,8 12,98 24,0 4,3 1.836,7 1.597,3 2011 526,0 2.072,1 1.086,4 414,9 39,1 12,7 129,0 11,39 33,9 0,0 1.814,4 2.511,1
BRAS
IL / E
STAD
OS U
NIDO
SBR
AZIL
/ USA ANO
YEAR
AUTOVEÍCULOS VEHICLES
AUTOPEÇAS(1) AUTOPARTS
MÁQUINAS AGRÍCOLAS AGRICULTURAL MACHINERY
MÁQUINAS RODOVIÁRIAS HIGHWAY CONSTRUCTION MACHINERY
OUTROS(2) OTHERS
TOTAL TOTAL
EXPORTAÇÃO EXPORTS
IMPORTAÇÃO IMPORTS
EXPORTAÇÃO EXPORTS
IMPORTAÇÃO IMPORTS
EXPORTAÇÃO EXPORTS
IMPORTAÇÃO IMPORTS
EXPORTAÇÃO EXPORTS
IMPORTAÇÃO IMPORTS
EXPORTAÇÃO EXPORTS
IMPORTAÇÃO IMPORTS
EXPORTAÇÃO EXPORTS
IMPORTAÇÃO IMPORTS
2001 592,7 40,4 1.197,7 799,2 31,0 21,1 69,6 62,0 0,2 2,4 1.891,2 925,1 2002 651,8 11,3 1.532,9 763,1 34,6 4,2 104,2 55,1 0,3 2,5 2.323,8 836,2 2003 550,2 13,9 1.708,9 767,7 38,2 9,8 150,4 117,0 0,3 1,2 2.448,0 909,6 2004 217,9 18,5 2.046,3 915,3 65,8 60,4 358,5 105,3 0,7 1,8 2.689,2 1.101,3 2005 266,8 25,0 2.496,2 994,1 90,1 26,6 508,4 213,3 0,8 0,1 3.362,3 1.259,1 2006 228,1 36,7 2.757,6 1.025,1 39,5 17,2 506,6 359,2 1,8 0,7 3.533,6 1.438,9 2007 53,1 51,9 2.292,1 1.308,5 45,4 68,3 425,8 138,6 0,9 0,2 2.817,3 1.567,5 2008 6,5 115,4 2.087,2 1.622,6 37,5 98,5 348,4 366,4 1,2 1,4 2.480,8 2.204,3 2009 4,8 95,6 1.096,4 1.078,7 21,2 75,7 102,1 409,6 0,3 6,0 1.224,8 1.665,6 2010 5,8 144,4 1.644,9 1.835,1 33,1 117,8 256,8 485,8 1,1 4,8 1.941,7 2.588,0 2011 2,4 198,9 1.878,3 2.091,4 44,6 204,8 473,6 583,2 0,1 7,5 2.399,1 3.085,8
BRAS
IL / U
NIÃO
EURO
PEIA
BR
AZIL
/ EUR
OPEA
N UN
ION ANO
YEAR
AUTOVEÍCULOS VEHICLES
AUTOPEÇAS(1) AUTOPARTS
MÁQUINAS AGRÍCOLAS AGRICULTURAL MACHINERY
MÁQUINAS RODOVIÁRIAS HIGHWAY CONSTRUCTION MACHINERY
OUTROS(2) OTHERS
TOTAL TOTAL
EXPORTAÇÃO EXPORTS
IMPORTAÇÃO IMPORTS
EXPORTAÇÃO EXPORTS
IMPORTAÇÃO IMPORTS
EXPORTAÇÃO EXPORTS
IMPORTAÇÃO IMPORTS
EXPORTAÇÃO EXPORTS
IMPORTAÇÃO IMPORTS
EXPORTAÇÃO EXPORTS
IMPORTAÇÃO IMPORTS
EXPORTAÇÃO EXPORTS
IMPORTAÇÃO IMPORTS
2001 147,7 215,9 820,7 2.101,1 3,1 6,4 37,0 24,3 9,3 23,0 1.017,8 2.370,7 2002 96,3 191,9 938,0 2.033,7 11,8 3,1 38,5 20,3 13,1 6,3 1.097,7 2.255,3 2003 120,2 232,3 1.220,3 2.210,7 17,4 3,5 49,9 28,6 22,8 3,4 1.430,6 2.478,5 2004 157,9 171,3 1.510,6 2.745,7 16,5 4,1 68,3 20,5 7,6 9,4 1.760,9 2.951,0 2005 844,2 278,2 1.752,7 3.389,6 26,9 7,4 73,8 36,7 23,5 56,0 2.721,1 3.768,0 2006 767,4 517,3 1.925,4 3.198,0 18,3 10,8 100,8 117,4 8,2 12,6 2.820,1 3.856,1 2007 898,7 489,5 2.168,8 4.384,6 22,2 15,3 131,6 74,1 20,8 12,5 3.242,1 4.976,0 2008 1.257,5 818,9 2.345,0 5.933,2 14,6 44,5 137,6 184,4 36,4 13,4 3.791,1 6.994,4 2009 724,1 740,6 1.347,9 3.539,1 7,9 26,3 23,1 128,5 2,8 9,2 2.105,8 4.443,7 2010 562,2 1.397,0 1.880,9 5.545,4 8,0 32,1 73,7 213,5 2,8 27,3 2.527,7 7.215,4 2011 123,8 2.074,7 2.001,5 6.464,6 19,4 35,4 152,5 292,6 5,3 39,9 2.302,5 8.907,1
(Continua na página seguinte./To be continued on next page.)
Milhões de US$/US$ million
Milhões de US$/US$ million
COM UM INTERNATIONAL, VOCÊ NÃO PEGA A ESTRADA. CONQUISTA.
Faça
revi
sões
em
seu
veí
culo
regu
larm
ente
.
www.internationalcaminhoes.com.br SAC: 0800 979 0144
50
Indústria automobilística brasileiraBrazilian automotive industry
Anuário da Indústria Automobilística BrasileiraBrazilian Automotive Industry Yearbook
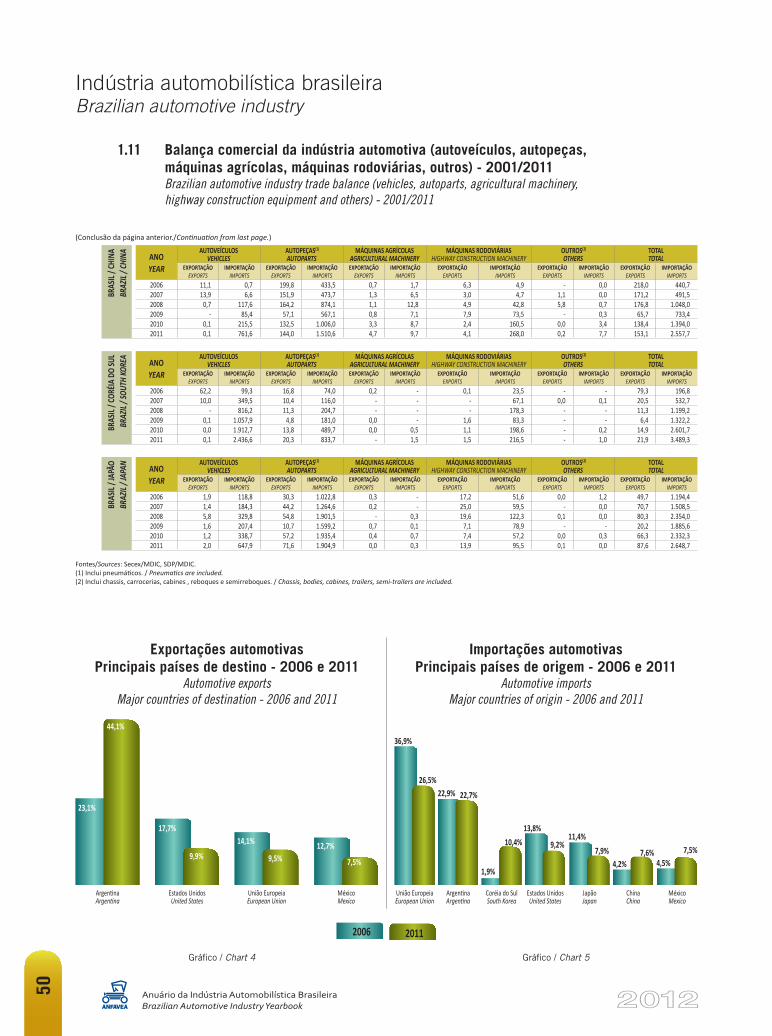
1.11 Balança comercial da indústria automotiva (autoveículos, autopeças, máquinas agrícolas, máquinas rodoviárias, outros) - 2001/2011 Brazilian automotive industry trade balance (vehicles, autoparts, agricultural machinery, highway construction equipment and others) - 2001/2011
(Conclusão da página anterior./Continuation from last page.)
BRAS
IL / C
HINA
BRAZ
IL / C
HINA ANO
YEAR
AUTOVEÍCULOS VEHICLES
AUTOPEÇAS(1) AUTOPARTS
MÁQUINAS AGRÍCOLAS AGRICULTURAL MACHINERY
MÁQUINAS RODOVIÁRIAS HIGHWAY CONSTRUCTION MACHINERY
OUTROS(2) OTHERS
TOTAL TOTAL
EXPORTAÇÃO EXPORTS
IMPORTAÇÃO IMPORTS
EXPORTAÇÃO EXPORTS
IMPORTAÇÃO IMPORTS
EXPORTAÇÃO EXPORTS
IMPORTAÇÃO IMPORTS
EXPORTAÇÃO EXPORTS
IMPORTAÇÃO IMPORTS
EXPORTAÇÃO EXPORTS
IMPORTAÇÃO IMPORTS
EXPORTAÇÃO EXPORTS
IMPORTAÇÃO IMPORTS
2006 11,1 0,7 199,8 433,5 0,7 1,7 6,3 4,9 - 0,0 218,0 440,7 2007 13,9 6,6 151,9 473,7 1,3 6,5 3,0 4,7 1,1 0,0 171,2 491,5 2008 0,7 117,6 164,2 874,1 1,1 12,8 4,9 42,8 5,8 0,7 176,8 1.048,0 2009 - 85,4 57,1 567,1 0,8 7,1 7,9 73,5 - 0,3 65,7 733,4 2010 0,1 215,5 132,5 1.006,0 3,3 8,7 2,4 160,5 0,0 3,4 138,4 1.394,0 2011 0,1 761,6 144,0 1.510,6 4,7 9,7 4,1 268,0 0,2 7,7 153,1 2.557,7
BRAS
IL / C
ORÉIA
DO
SUL
BRAZ
IL / S
OUTH
KORE
A
ANO YEAR
AUTOVEÍCULOS VEHICLES
AUTOPEÇAS(1) AUTOPARTS
MÁQUINAS AGRÍCOLAS AGRICULTURAL MACHINERY
MÁQUINAS RODOVIÁRIAS HIGHWAY CONSTRUCTION MACHINERY
OUTROS(2) OTHERS
TOTAL TOTAL
EXPORTAÇÃO EXPORTS
IMPORTAÇÃO IMPORTS
EXPORTAÇÃO EXPORTS
IMPORTAÇÃO IMPORTS
EXPORTAÇÃO EXPORTS
IMPORTAÇÃO IMPORTS
EXPORTAÇÃO EXPORTS
IMPORTAÇÃO IMPORTS
EXPORTAÇÃO EXPORTS
IMPORTAÇÃO IMPORTS
EXPORTAÇÃO EXPORTS
IMPORTAÇÃO IMPORTS
2006 62,2 99,3 16,8 74,0 0,2 - 0,1 23,5 - - 79,3 196,8 2007 10,0 349,5 10,4 116,0 - - - 67,1 0,0 0,1 20,5 532,7 2008 - 816,2 11,3 204,7 - - - 178,3 - - 11,3 1.199,2 2009 0,1 1.057,9 4,8 181,0 0,0 - 1,6 83,3 - - 6,4 1.322,2 2010 0,0 1.912,7 13,8 489,7 0,0 0,5 1,1 198,6 - 0,2 14,9 2.601,7 2011 0,1 2.436,6 20,3 833,7 - 1,5 1,5 216,5 - 1,0 21,9 3.489,3
BRAS
IL / J
APÃO
BRAZ
IL / J
APAN ANO
YEAR
AUTOVEÍCULOS VEHICLES
AUTOPEÇAS(1) AUTOPARTS
MÁQUINAS AGRÍCOLAS AGRICULTURAL MACHINERY
MÁQUINAS RODOVIÁRIAS HIGHWAY CONSTRUCTION MACHINERY
OUTROS(2) OTHERS
TOTAL TOTAL
EXPORTAÇÃO EXPORTS
IMPORTAÇÃO IMPORTS
EXPORTAÇÃO EXPORTS
IMPORTAÇÃO IMPORTS
EXPORTAÇÃO EXPORTS
IMPORTAÇÃO IMPORTS
EXPORTAÇÃO EXPORTS
IMPORTAÇÃO IMPORTS
EXPORTAÇÃO EXPORTS
IMPORTAÇÃO IMPORTS
EXPORTAÇÃO EXPORTS
IMPORTAÇÃO IMPORTS
2006 1,9 118,8 30,3 1.022,8 0,3 - 17,2 51,6 0,0 1,2 49,7 1.194,4 2007 1,4 184,3 44,2 1.264,6 0,2 - 25,0 59,5 - 0,0 70,7 1.508,5 2008 5,8 329,8 54,8 1.901,5 - 0,3 19,6 122,3 0,1 0,0 80,3 2.354,0 2009 1,6 207,4 10,7 1.599,2 0,7 0,1 7,1 78,9 - - 20,2 1.885,6 2010 1,2 338,7 57,2 1.935,4 0,4 0,7 7,4 57,2 0,0 0,3 66,3 2.332,3 2011 2,0 647,9 71,6 1.904,9 0,0 0,3 13,9 95,5 0,1 0,0 87,6 2.648,7
Fontes/Sources: Secex/MDIC, SDP/MDIC.(1) Inclui pneumáticos. / Pneumatics are included. (2) Inclui chassis, carrocerias, cabines , reboques e semirreboques. / Chassis, bodies, cabines, trailers, semi-trailers are included.
Exportações automotivasPrincipais países de destino - 2006 e 2011
Automotive exportsMajor countries of destination - 2006 and 2011
Importações automotivasPrincipais países de origem - 2006 e 2011
Automotive importsMajor countries of origin - 2006 and 2011
Gráfico / Chart 4 Gráfico / Chart 5
23,1%
44,1%
14,1%
9,5%12,7%
7,5%
17,7%
9,9%
36,9%
26,5%
1,9%
11,4%10,4%7,9%
13,8%
4,2% 4,5%
9,2%7,6% 7,5%
22,9% 22,7%
ArgentinaArgentina
União EuropeiaEuropean Union
Estados UnidosUnited States
ArgentinaArgentina
União EuropeiaEuropean Union
Coréia do SulSouth Korea
JapãoJapan
MéxicoMexico
Estados UnidosUnited States
ChinaChina
MéxicoMexico
2006 2011
51
Indústria automobilística brasileiraBrazilian automotive industry
Anuário da Indústria Automobilística BrasileiraBrazilian Automotive Industry Yearbook
Em porcentagem / Percentage
ANO YEAR
TRIBUTOS TAXES
AUTOMÓVEIS / CARSCOMERCIAIS
LEVES LIGHT
COMMERCIALS
CAMINHÕES / TRUCKS
ÔNIBUS BUSES
TRATORES DE RODAS
WHEEL TRACTORS
1000 cm³
+ de 1000 cm³ a 2000 cm³ More than 1000 cm³to 2000 cm³
+ de 2000 cm³ More than 2000 cc
Caminhão-chassi Trucks
Caminhão- trator Truck-tractorsGasolina
Gasoline
Etanol/Flex fuel Ethanol/Flex
fuel
Gasolina Gasoline
Etanol/Flex fuel Ethanol/Flex
fuel
2002 e/and 2003
IPI 9,0 15,0 13,0 25,0 20,0 10,0 5,0 5,0 0,0 5,0 ICMS 12,0 12,0 12,0 12,0 12,0 12,0 12,0 12,0 12,0 7,0 PIS/Cofins 8,26 8,26 8,26 8,26 8,26 8,26 5,77 4,29 4,29 4,29% no preço Total share in price 25,7 29,0 27,9 34,2 31,7 26,0 20,4 19,2 15,5 14,3
2004 a/to2007
IPI 7,0 13,0 11,0 25,0 18,0 8,0 5,0 5,0 0,0 0,0 ICMS 12,0 12,0 12,0 12,0 12,0 12,0 12,0 12,0 12,0 7,0 PIS/Cofins 11,60 11,60 11,60 11,60 11,60 11,60 8,10 6,02 6,02 6,02% no preço Total share in price 27,1 30,4 29,2 36,4 33,1 27,3 22,2 20,6 16,9 12,0
2008A partir
de 12/12As from Dec. 12
IPI 0,0 6,5 5,5 25,0 18,0 1,0 0,0 0,0 0,0 0,0 ICMS 12,0 12,0 12,0 12,0 12,0 12,0 12,0 12,0 12,0 7,0 PIS/Cofins 11,60 11,60 11,60 11,60 11,60 11,60 8,10 6,02 6,02 6,02% no preço Total share in price 22,2 26,4 25,8 36,4 33,1 22,6 18,7 16,9 16,9 12,0
2009
IPI 5,0 / 3,0 11,0 7,5 25,0 18,0 1,0 0,0 0,0 0,0 0,0 ICMS 12,0 12,0 12,0 12,0 12,0 12,0 12,0 12,0 12,0 7,0 PIS/Cofins 11,60 11,60 11,60 11,60 11,60 11,60 8,10 6,02 6,02 6,02% no preço Total share in price 25,7 / 24,4 29,2 27,1 36,4 33,1 22,6 18,7 16,9 16,9 12,0
2010 De janeiro
a marçoFrom
January to March
IPI 7,0 / 3,0 13,0 7,5 25,0 18,0 4,0 0,0 0,0 0,0 0,0 ICMS 12,0 12,0 12,0 12,0 12,0 12,0 12,0 12,0 12,0 7,0 PIS/Cofins 11,60 11,60 11,60 11,60 11,60 11,60 8,10 6,02 6,02 6,02% no preço Total share in price 27,1 / 24,4 30,4 27,1 36,4 33,1 24,7 18,7 16,9 16,9 12,0
2010 A partir de abrilAs from
April
IPI 7,0 13,0 11,0 25,0 18,0 4,0 0,0 0,0 0,0 0,0 ICMS 12,0 12,0 12,0 12,0 12,0 12,0 12,0 12,0 12,0 7,0 PIS/Cofins 11,60 11,60 11,60 11,60 11,60 11,60 8,10 6,02 6,02 6,02% no preço Total share in price 27,1 30,4 29,2 36,4 33,1 24,7 18,7 16,9 16,9 12,0
2011 Posição em
15 de dezembroPosition in
December, 15
IPI 7,0 13,0 11,0 25,0 18,0 4,0 0,0 0,0 0,0 0,0 ICMS 12,0 12,0 12,0 12,0 12,0 12,0 12,0 12,0 12,0 7,0 PIS/Cofins 11,60 11,60 11,60 11,60 11,60 11,60 8,10 6,02 6,02 6,02% no preço Total share in price 27,1 30,4 29,2 36,4 33,1 24,7 18,7 16,9 16,9 12,0
O decreto 7567, de 15 setembro de 2011, altera as condições de aplicação das alíquotas do IPI, podendo ser majoradas em 30 pontos percentuais. Decree 7567 of September 15, 2011, amending the conditions for application of IPI rates, which may rise by 30 percentage points.
1.12 Tributos - Autoveículos e tratores de rodas Taxes - Vehicles and wheel tractors
(*) Posição em 15 de dezembro de 2011. / Position in December, 15, 2011.Gráfico / Chart 6
Brasil*Brazil*
EspanhaSpain
FrançaFrance
JapãoJapan
ItáliaItaly
Reino UnidoUnited Kingdom
AlemanhaGermany
Estados UnidosUnited States
30,4%
17,3% 16,7% 16,4% 16,0% 15,3%
9,1%5,7%
Participação dos tributos sobre automóveis no preço ao consumidor em alguns paísesTax burden on cars in selected countries - Share in consumer prices
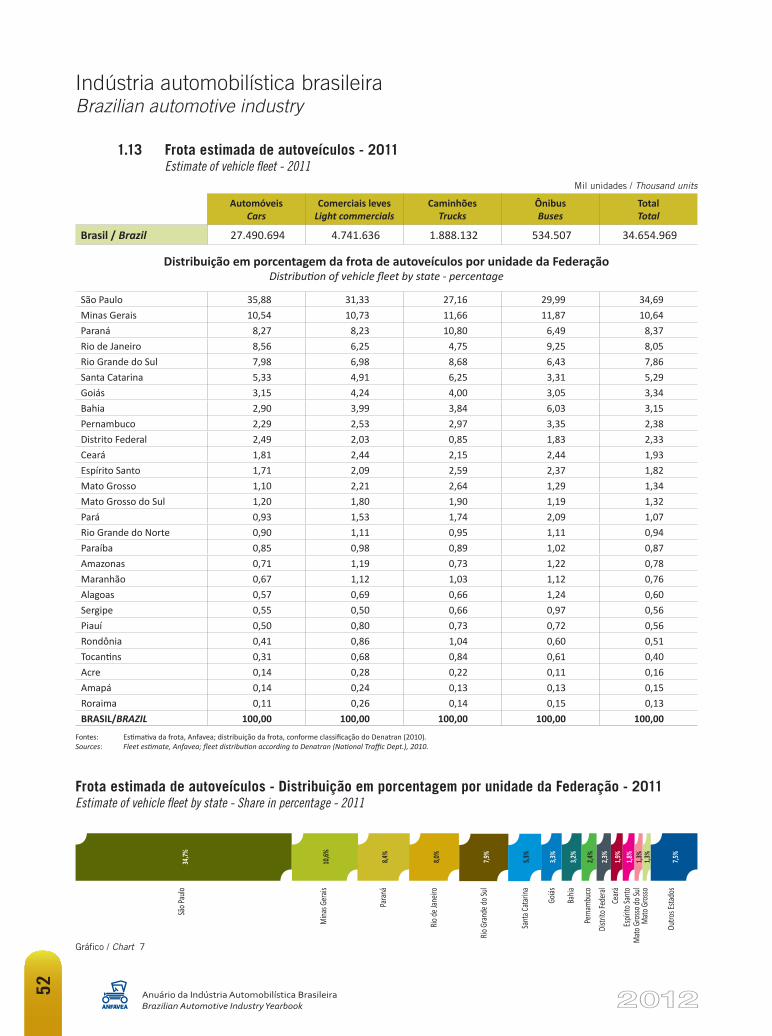
52
Indústria automobilística brasileiraBrazilian automotive industry
Anuário da Indústria Automobilística BrasileiraBrazilian Automotive Industry Yearbook
Gráfico / Chart 7
Frota estimada de autoveículos - Distribuição em porcentagem por unidade da Federação - 2011Estimate of vehicle fleet by state - Share in percentage - 2011
Fontes: Estimativa da frota, Anfavea; distribuição da frota, conforme classificação do Denatran (2010).Sources: Fleet estimate, Anfavea; fleet distribution according to Denatran (National Traffic Dept.), 2010.
Mil unidades / Thousand units
1.13 Frota estimada de autoveículos - 2011 Estimate of vehicle fleet - 2011
Automóveis Cars
Comerciais leves Light commercials
Caminhões Trucks
Ônibus Buses
Total Total
Brasil / Brazil 27.490.694 4.741.636 1.888.132 534.507 34.654.969
Distribuição em porcentagem da frota de autoveículos por unidade da FederaçãoDistribution of vehicle fleet by state - percentage
São Paulo 35,88 31,33 27,16 29,99 34,69 Minas Gerais 10,54 10,73 11,66 11,87 10,64 Paraná 8,27 8,23 10,80 6,49 8,37 Rio de Janeiro 8,56 6,25 4,75 9,25 8,05 Rio Grande do Sul 7,98 6,98 8,68 6,43 7,86 Santa Catarina 5,33 4,91 6,25 3,31 5,29 Goiás 3,15 4,24 4,00 3,05 3,34 Bahia 2,90 3,99 3,84 6,03 3,15 Pernambuco 2,29 2,53 2,97 3,35 2,38 Distrito Federal 2,49 2,03 0,85 1,83 2,33 Ceará 1,81 2,44 2,15 2,44 1,93 Espírito Santo 1,71 2,09 2,59 2,37 1,82 Mato Grosso 1,10 2,21 2,64 1,29 1,34 Mato Grosso do Sul 1,20 1,80 1,90 1,19 1,32 Pará 0,93 1,53 1,74 2,09 1,07 Rio Grande do Norte 0,90 1,11 0,95 1,11 0,94 Paraíba 0,85 0,98 0,89 1,02 0,87 Amazonas 0,71 1,19 0,73 1,22 0,78 Maranhão 0,67 1,12 1,03 1,12 0,76 Alagoas 0,57 0,69 0,66 1,24 0,60 Sergipe 0,55 0,50 0,66 0,97 0,56 Piauí 0,50 0,80 0,73 0,72 0,56 Rondônia 0,41 0,86 1,04 0,60 0,51 Tocantins 0,31 0,68 0,84 0,61 0,40 Acre 0,14 0,28 0,22 0,11 0,16 Amapá 0,14 0,24 0,13 0,13 0,15 Roraima 0,11 0,26 0,14 0,15 0,13 BRASIL/BRAZIL 100,00 100,00 100,00 100,00 100,00
34,7%
10,6% 8,4
%
8,0%
7,9%
5,3%
3,3%
3,2%
2,4%
2,3%
1,9%
1,8%
1,3%
1,3%
7,5%
São P
aulo
Mina
s Gera
is
Paran
á
Rio de
Jane
iro
Rio G
rande
do Su
l
Santa
Catar
ina
Goiás
Bahia
Pern
ambu
coDi
strito
Fede
ralCe
aráEs
pírito
Santo
Mato
Gro
sso do
Sul
Mato
Gro
sso
Outro
s Esta
dos
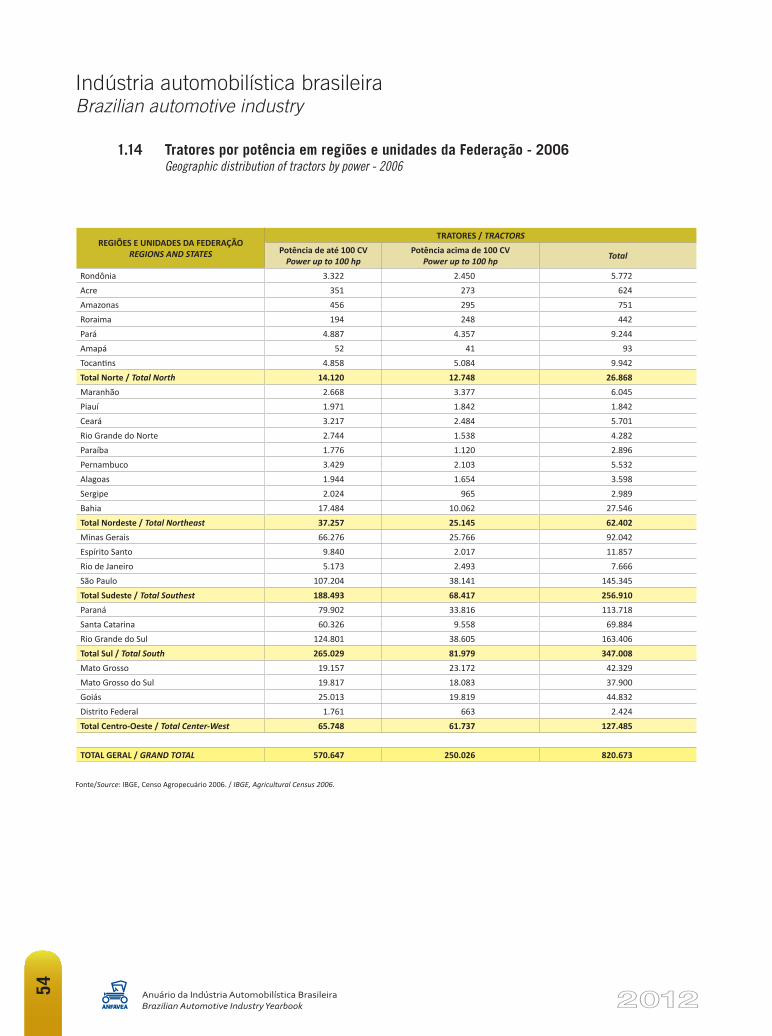
54
Indústria automobilística brasileiraBrazilian automotive industry
Anuário da Indústria Automobilística BrasileiraBrazilian Automotive Industry Yearbook
1.14 Tratores por potência em regiões e unidades da Federação - 2006 Geographic distribution of tractors by power - 2006
Fonte/Source: IBGE, Censo Agropecuário 2006. / IBGE, Agricultural Census 2006.
REGIÕES E UNIDADES DA FEDERAÇÃO REGIONS AND STATES
TRATORES / TRACTORSPotência de até 100 CV
Power up to 100 hpPotência acima de 100 CV
Power up to 100 hp Total
Rondônia 3.322 2.450 5.772Acre 351 273 624Amazonas 456 295 751Roraima 194 248 442Pará 4.887 4.357 9.244Amapá 52 41 93Tocantins 4.858 5.084 9.942Total Norte / Total North 14.120 12.748 26.868Maranhão 2.668 3.377 6.045Piauí 1.971 1.842 1.842Ceará 3.217 2.484 5.701Rio Grande do Norte 2.744 1.538 4.282Paraíba 1.776 1.120 2.896Pernambuco 3.429 2.103 5.532Alagoas 1.944 1.654 3.598Sergipe 2.024 965 2.989Bahia 17.484 10.062 27.546Total Nordeste / Total Northeast 37.257 25.145 62.402Minas Gerais 66.276 25.766 92.042Espírito Santo 9.840 2.017 11.857Rio de Janeiro 5.173 2.493 7.666São Paulo 107.204 38.141 145.345Total Sudeste / Total Southest 188.493 68.417 256.910Paraná 79.902 33.816 113.718Santa Catarina 60.326 9.558 69.884Rio Grande do Sul 124.801 38.605 163.406Total Sul / Total South 265.029 81.979 347.008Mato Grosso 19.157 23.172 42.329Mato Grosso do Sul 19.817 18.083 37.900Goiás 25.013 19.819 44.832Distrito Federal 1.761 663 2.424Total Centro-Oeste / Total Center-West 65.748 61.737 127.485
TOTAL GERAL / GRAND TOTAL 570.647 250.026 820.673
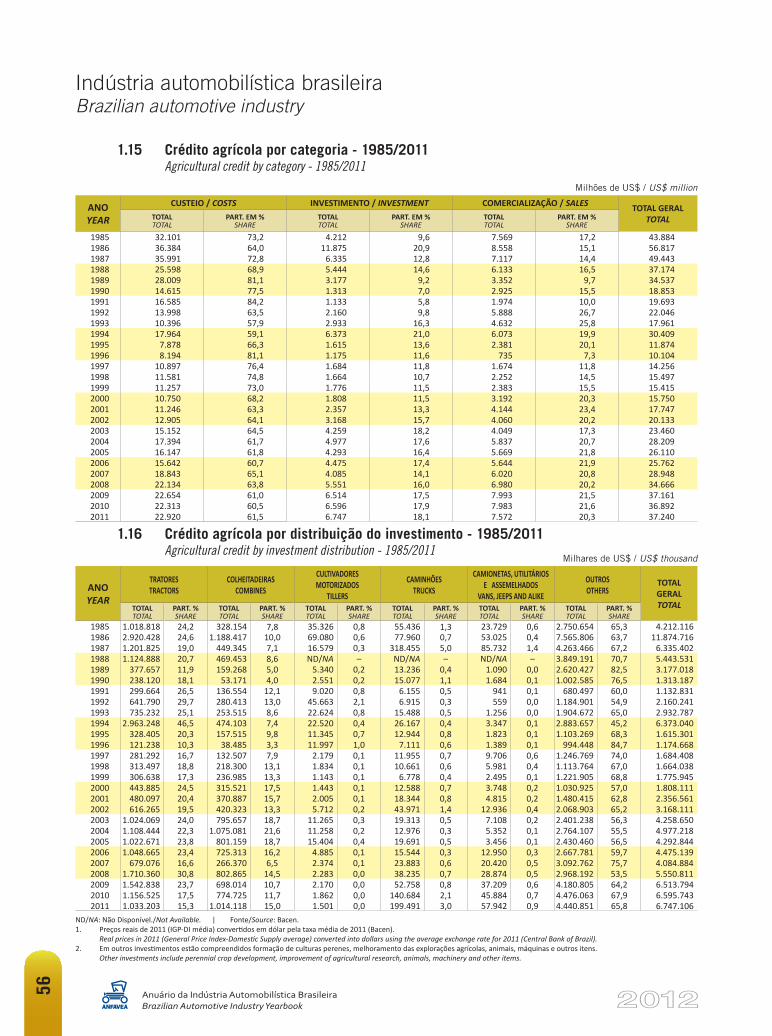
56
Indústria automobilística brasileiraBrazilian automotive industry
Anuário da Indústria Automobilística BrasileiraBrazilian Automotive Industry Yearbook
Milhões de US$ / US$ million
ND/NA: Não Disponível./Not Available. | Fonte/Source: Bacen.1. Preços reais de 2011 (IGP-DI média) convertidos em dólar pela taxa média de 2011 (Bacen).
Real prices in 2011 (General Price Index-Domestic Supply average) converted into dollars using the average exchange rate for 2011 (Central Bank of Brazil).2. Em outros investimentos estão compreendidos formação de culturas perenes, melhoramento das explorações agrícolas, animais, máquinas e outros itens.
Other investments include perennial crop development, improvement of agricultural research, animals, machinery and other items.
1.15 Crédito agrícola por categoria - 1985/2011 Agricultural credit by category - 1985/2011
ANO YEAR
TRATORES TRACTORS
COLHEITADEIRAS COMBINES
CULTIVADORES MOTORIZADOS
TILLERS
CAMINHÕES TRUCKS
CAMIONETAS, UTILITÁRIOS E ASSEMELHADOS
VANS, JEEPS AND ALIKE
OUTROS OTHERS
TOTAL GERAL TOTALTOTAL
TOTALPART. %SHARE
TOTALTOTAL
PART. %SHARE
TOTALTOTAL
PART. %SHARE
TOTALTOTAL
PART. %SHARE
TOTALTOTAL
PART. %SHARE
TOTALTOTAL
PART. %SHARE
1985 1.018.818 24,2 328.154 7,8 35.326 0,8 55.436 1,3 23.729 0,6 2.750.654 65,3 4.212.1161986 2.920.428 24,6 1.188.417 10,0 69.080 0,6 77.960 0,7 53.025 0,4 7.565.806 63,7 11.874.7161987 1.201.825 19,0 449.345 7,1 16.579 0,3 318.455 5,0 85.732 1,4 4.263.466 67,2 6.335.4021988 1.124.888 20,7 469.453 8,6 ND/NA – ND/NA – ND/NA – 3.849.191 70,7 5.443.5311989 377.657 11,9 159.268 5,0 5.340 0,2 13.236 0,4 1.090 0,0 2.620.427 82,5 3.177.0181990 238.120 18,1 53.171 4,0 2.551 0,2 15.077 1,1 1.684 0,1 1.002.585 76,5 1.313.1871991 299.664 26,5 136.554 12,1 9.020 0,8 6.155 0,5 941 0,1 680.497 60,0 1.132.8311992 641.790 29,7 280.413 13,0 45.663 2,1 6.915 0,3 559 0,0 1.184.901 54,9 2.160.2411993 735.232 25,1 253.515 8,6 22.624 0,8 15.488 0,5 1.256 0,0 1.904.672 65,0 2.932.7871994 2.963.248 46,5 474.103 7,4 22.520 0,4 26.167 0,4 3.347 0,1 2.883.657 45,2 6.373.0401995 328.405 20,3 157.515 9,8 11.345 0,7 12.944 0,8 1.823 0,1 1.103.269 68,3 1.615.3011996 121.238 10,3 38.485 3,3 11.997 1,0 7.111 0,6 1.389 0,1 994.448 84,7 1.174.6681997 281.292 16,7 132.507 7,9 2.179 0,1 11.955 0,7 9.706 0,6 1.246.769 74,0 1.684.4081998 313.497 18,8 218.300 13,1 1.834 0,1 10.661 0,6 5.981 0,4 1.113.764 67,0 1.664.0381999 306.638 17,3 236.985 13,3 1.143 0,1 6.778 0,4 2.495 0,1 1.221.905 68,8 1.775.9452000 443.885 24,5 315.521 17,5 1.443 0,1 12.588 0,7 3.748 0,2 1.030.925 57,0 1.808.1112001 480.097 20,4 370.887 15,7 2.005 0,1 18.344 0,8 4.815 0,2 1.480.415 62,8 2.356.5612002 616.265 19,5 420.323 13,3 5.712 0,2 43.971 1,4 12.936 0,4 2.068.903 65,2 3.168.1112003 1.024.069 24,0 795.657 18,7 11.265 0,3 19.313 0,5 7.108 0,2 2.401.238 56,3 4.258.6502004 1.108.444 22,3 1.075.081 21,6 11.258 0,2 12.976 0,3 5.352 0,1 2.764.107 55,5 4.977.2182005 1.022.671 23,8 801.159 18,7 15.404 0,4 19.691 0,5 3.456 0,1 2.430.460 56,5 4.292.8442006 1.048.665 23,4 725.313 16,2 4.885 0,1 15.544 0,3 12.950 0,3 2.667.781 59,7 4.475.1392007 679.076 16,6 266.370 6,5 2.374 0,1 23.883 0,6 20.420 0,5 3.092.762 75,7 4.084.8842008 1.710.360 30,8 802.865 14,5 2.283 0,0 38.235 0,7 28.874 0,5 2.968.192 53,5 5.550.8112009 1.542.838 23,7 698.014 10,7 2.170 0,0 52.758 0,8 37.209 0,6 4.180.805 64,2 6.513.7942010 1.156.525 17,5 774.725 11,7 1.862 0,0 140.684 2,1 45.884 0,7 4.476.063 67,9 6.595.7432011 1.033.203 15,3 1.014.118 15,0 1.501 0,0 199.491 3,0 57.942 0,9 4.440.851 65,8 6.747.106
Milhares de US$ / US$ thousand
1.16 Crédito agrícola por distribuição do investimento - 1985/2011 Agricultural credit by investment distribution - 1985/2011
ANO YEAR
CUSTEIO / COSTS INVESTIMENTO / INVESTMENT COMERCIALIZAÇÃO / SALES TOTAL GERAL TOTALTOTAL
TOTALPART. EM %
SHARETOTALTOTAL
PART. EM %SHARE
TOTALTOTAL
PART. EM %SHARE
1985 32.101 73,2 4.212 9,6 7.569 17,2 43.8841986 36.384 64,0 11.875 20,9 8.558 15,1 56.8171987 35.991 72,8 6.335 12,8 7.117 14,4 49.4431988 25.598 68,9 5.444 14,6 6.133 16,5 37.1741989 28.009 81,1 3.177 9,2 3.352 9,7 34.5371990 14.615 77,5 1.313 7,0 2.925 15,5 18.8531991 16.585 84,2 1.133 5,8 1.974 10,0 19.6931992 13.998 63,5 2.160 9,8 5.888 26,7 22.0461993 10.396 57,9 2.933 16,3 4.632 25,8 17.9611994 17.964 59,1 6.373 21,0 6.073 19,9 30.4091995 7.878 66,3 1.615 13,6 2.381 20,1 11.8741996 8.194 81,1 1.175 11,6 735 7,3 10.1041997 10.897 76,4 1.684 11,8 1.674 11,8 14.2561998 11.581 74,8 1.664 10,7 2.252 14,5 15.4971999 11.257 73,0 1.776 11,5 2.383 15,5 15.4152000 10.750 68,2 1.808 11,5 3.192 20,3 15.7502001 11.246 63,3 2.357 13,3 4.144 23,4 17.7472002 12.905 64,1 3.168 15,7 4.060 20,2 20.1332003 15.152 64,5 4.259 18,2 4.049 17,3 23.4602004 17.394 61,7 4.977 17,6 5.837 20,7 28.2092005 16.147 61,8 4.293 16,4 5.669 21,8 26.1102006 15.642 60,7 4.475 17,4 5.644 21,9 25.7622007 18.843 65,1 4.085 14,1 6.020 20,8 28.9482008 22.134 63,8 5.551 16,0 6.980 20,2 34.6662009 22.654 61,0 6.514 17,5 7.993 21,5 37.1612010 22.313 60,5 6.596 17,9 7.983 21,6 36.8922011 22.920 61,5 6.747 18,1 7.572 20,3 37.240
Autoveículos - Produção, vendas internas e exportações
Vehicles - Production, domestic sales and exports
2
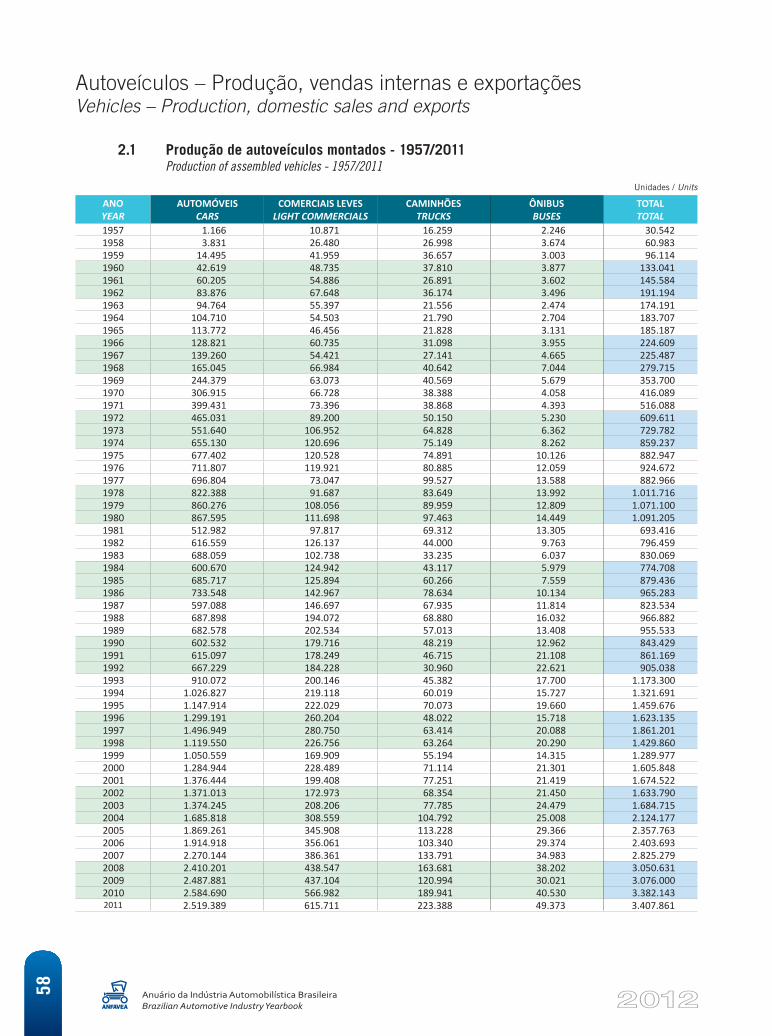
Autoveículos – Produção, vendas internas e exportaçõesVehicles – Production, domestic sales and exports
Anuário da Indústria Automobilística BrasileiraBrazilian Automotive Industry Yearbook
58
ANO YEAR
AUTOMÓVEIS CARS
COMERCIAIS LEVES LIGHT COMMERCIALS
CAMINHÕES TRUCKS
ÔNIBUS BUSES
TOTAL TOTAL
1957 1.166 10.871 16.259 2.246 30.542 1958 3.831 26.480 26.998 3.674 60.983 1959 14.495 41.959 36.657 3.003 96.114 1960 42.619 48.735 37.810 3.877 133.041 1961 60.205 54.886 26.891 3.602 145.584 1962 83.876 67.648 36.174 3.496 191.194 1963 94.764 55.397 21.556 2.474 174.191 1964 104.710 54.503 21.790 2.704 183.707 1965 113.772 46.456 21.828 3.131 185.187 1966 128.821 60.735 31.098 3.955 224.609 1967 139.260 54.421 27.141 4.665 225.487 1968 165.045 66.984 40.642 7.044 279.715 1969 244.379 63.073 40.569 5.679 353.700 1970 306.915 66.728 38.388 4.058 416.089 1971 399.431 73.396 38.868 4.393 516.088 1972 465.031 89.200 50.150 5.230 609.611 1973 551.640 106.952 64.828 6.362 729.782 1974 655.130 120.696 75.149 8.262 859.237 1975 677.402 120.528 74.891 10.126 882.947 1976 711.807 119.921 80.885 12.059 924.672 1977 696.804 73.047 99.527 13.588 882.966 1978 822.388 91.687 83.649 13.992 1.011.716 1979 860.276 108.056 89.959 12.809 1.071.100 1980 867.595 111.698 97.463 14.449 1.091.205 1981 512.982 97.817 69.312 13.305 693.416 1982 616.559 126.137 44.000 9.763 796.459 1983 688.059 102.738 33.235 6.037 830.069 1984 600.670 124.942 43.117 5.979 774.708 1985 685.717 125.894 60.266 7.559 879.436 1986 733.548 142.967 78.634 10.134 965.283 1987 597.088 146.697 67.935 11.814 823.534 1988 687.898 194.072 68.880 16.032 966.882 1989 682.578 202.534 57.013 13.408 955.533 1990 602.532 179.716 48.219 12.962 843.429 1991 615.097 178.249 46.715 21.108 861.169 1992 667.229 184.228 30.960 22.621 905.038 1993 910.072 200.146 45.382 17.700 1.173.300 1994 1.026.827 219.118 60.019 15.727 1.321.691 1995 1.147.914 222.029 70.073 19.660 1.459.676 1996 1.299.191 260.204 48.022 15.718 1.623.135 1997 1.496.949 280.750 63.414 20.088 1.861.201 1998 1.119.550 226.756 63.264 20.290 1.429.860 1999 1.050.559 169.909 55.194 14.315 1.289.977 2000 1.284.944 228.489 71.114 21.301 1.605.848 2001 1.376.444 199.408 77.251 21.419 1.674.522 2002 1.371.013 172.973 68.354 21.450 1.633.790 2003 1.374.245 208.206 77.785 24.479 1.684.715 2004 1.685.818 308.559 104.792 25.008 2.124.177 2005 1.869.261 345.908 113.228 29.366 2.357.763 2006 1.914.918 356.061 103.340 29.374 2.403.693 2007 2.270.144 386.361 133.791 34.983 2.825.279 2008 2.410.201 438.547 163.681 38.202 3.050.631 2009 2.487.881 437.104 120.994 30.021 3.076.000 2010 2.584.690 566.982 189.941 40.530 3.382.143 2011 2.519.389 615.711 223.388 49.373 3.407.861
2.1 Produção de autoveículos montados - 1957/2011 Production of assembled vehicles - 1957/2011
Unidades / Units

Autoveículos – Produção, vendas internas e exportaçõesVehicles – Production, domestic sales and exports
Anuário da Indústria Automobilística BrasileiraBrazilian Automotive Industry Yearbook
59
ANO YEAR
AUTOMÓVEIS CARS
COMERCIAIS LEVES LIGHT COMMERCIALS
CAMINHÕES TRUCKS
ÔNIBUS BUSES
TOTAL TOTAL
1957 1.166 10.871 16.259 2.246 30.542 1958 3.831 26.480 26.998 3.674 60.983 1959 14.495 41.959 36.657 3.003 96.114 1960 42.619 48.735 37.810 3.877 133.041 1961 60.205 54.886 26.891 3.602 145.584 1962 83.876 67.648 36.174 3.496 191.194 1963 94.764 55.397 21.556 2.474 174.191 1964 104.710 54.503 21.790 2.704 183.707 1965 113.772 46.456 21.828 3.131 185.187 1966 128.821 60.735 31.098 3.955 224.609 1967 139.260 54.421 27.141 4.665 225.487 1968 165.045 66.984 40.642 7.044 279.715 1969 244.379 63.073 40.569 5.679 353.700 1970 306.915 66.728 38.388 4.058 416.089 1971 399.863 73.840 38.868 4.393 516.964 1972 471.055 92.329 53.557 5.230 622.171 1973 564.002 110.810 69.202 6.362 750.376 1974 691.310 126.935 79.413 8.262 905.920 1975 712.526 128.895 78.688 10.126 930.235 1976 765.291 125.370 83.891 12.059 986.611 1977 732.360 73.637 101.368 13.828 921.193 1978 871.170 92.235 86.269 14.340 1.064.014 1979 912.018 110.065 93.051 12.832 1.127.966 1980 933.152 115.540 102.017 14.465 1.165.174 1981 585.834 105.306 76.350 13.393 780.883 1982 672.589 130.197 46.698 9.820 859.304 1983 748.371 106.398 35.487 6.206 896.462 1984 679.386 129.430 48.497 7.340 864.653 1985 759.141 134.413 64.769 8.385 966.708 1986 815.152 145.418 84.544 11.218 1.056.332 1987 683.380 148.847 74.205 13.639 920.071 1988 782.411 196.108 71.810 18.427 1.068.756 1989 730.992 205.008 62.699 14.553 1.013.252 1990 663.084 184.754 51.597 15.031 914.466 1991 705.303 182.609 49.295 23.012 960.219 1992 815.959 201.591 32.025 24.286 1.073.861 1993 1.100.278 224.387 47.876 18.894 1.391.435 1994 1.248.773 251.044 64.137 17.435 1.581.389 1995 1.297.467 239.399 70.495 21.647 1.629.008 1996 1.458.576 279.697 48.712 17.343 1.804.328 1997 1.677.858 306.545 63.744 21.556 2.069.703 1998 1.254.016 247.044 63.773 21.458 1.586.291 1999 1.109.509 176.994 55.277 14.934 1.356.714 2000 1.361.721 235.161 71.686 22.672 1.691.240 2001 1.501.586 214.936 77.431 23.163 1.817.116 2002 1.520.285 179.861 68.558 22.826 1.791.530 2003 1.505.139 216.702 78.960 26.990 1.827.791 2004 1.862.780 318.351 107.338 28.758 2.317.227 2005 2.011.817 365.636 118.000 35.387 2.530.840 2006 2.092.003 379.208 106.644 34.474 2.612.329 2007 2.391.354 412.545 137.281 38.986 2.980.166 2008 2.545.729 459.211 167.330 44.111 3.216.381 2009 2.575.418 449.896 123.633 34.535 3.183.482 2010 2.825.974 583.074 191.621 45.879 3.646.548 2011 2.519.389 632.363 225.751 55.113 3.432.616
* Montados e desmontados (CKD). / Assembled and CKD.
2.2 Produção total* de autoveículos - 1957/2011 Total production* of vehicles - 1957/2011
Unidades / Units
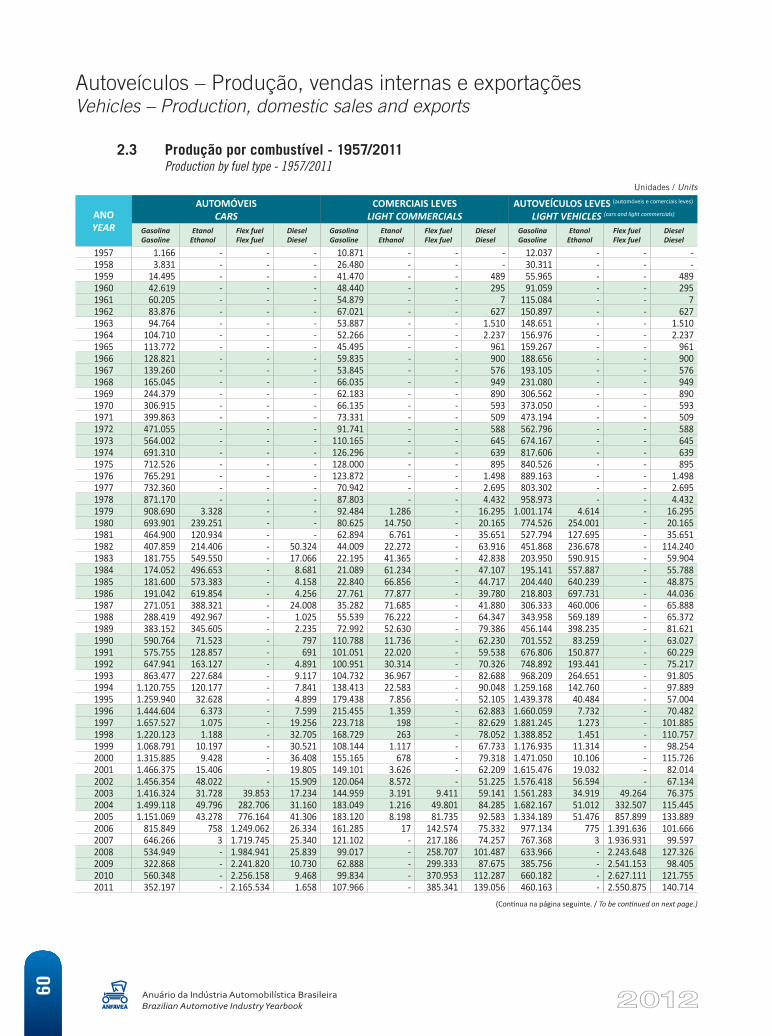
Autoveículos – Produção, vendas internas e exportaçõesVehicles – Production, domestic sales and exports
Anuário da Indústria Automobilística BrasileiraBrazilian Automotive Industry Yearbook
60
ANO YEAR
AUTOMÓVEIS CARS
COMERCIAIS LEVES LIGHT COMMERCIALS
AUTOVEÍCULOS LEVES (automóveis e comerciais leves) LIGHT VEHICLES (cars and light commercials)
GasolinaGasoline
EtanolEthanol
Flex fuel Flex fuel
DieselDiesel
GasolinaGasoline
EtanolEthanol
Flex fuel Flex fuel
DieselDiesel
GasolinaGasoline
EtanolEthanol
Flex fuel Flex fuel
DieselDiesel
1957 1.166 - - - 10.871 - - - 12.037 - - - 1958 3.831 - - - 26.480 - - - 30.311 - - - 1959 14.495 - - - 41.470 - - 489 55.965 - - 489 1960 42.619 - - - 48.440 - - 295 91.059 - - 295 1961 60.205 - - - 54.879 - - 7 115.084 - - 7 1962 83.876 - - - 67.021 - - 627 150.897 - - 627 1963 94.764 - - - 53.887 - - 1.510 148.651 - - 1.510 1964 104.710 - - - 52.266 - - 2.237 156.976 - - 2.237 1965 113.772 - - - 45.495 - - 961 159.267 - - 961 1966 128.821 - - - 59.835 - - 900 188.656 - - 900 1967 139.260 - - - 53.845 - - 576 193.105 - - 576 1968 165.045 - - - 66.035 - - 949 231.080 - - 949 1969 244.379 - - - 62.183 - - 890 306.562 - - 890 1970 306.915 - - - 66.135 - - 593 373.050 - - 593 1971 399.863 - - - 73.331 - - 509 473.194 - - 509 1972 471.055 - - - 91.741 - - 588 562.796 - - 588 1973 564.002 - - - 110.165 - - 645 674.167 - - 645 1974 691.310 - - - 126.296 - - 639 817.606 - - 639 1975 712.526 - - - 128.000 - - 895 840.526 - - 895 1976 765.291 - - - 123.872 - - 1.498 889.163 - - 1.498 1977 732.360 - - - 70.942 - - 2.695 803.302 - - 2.695 1978 871.170 - - - 87.803 - - 4.432 958.973 - - 4.432 1979 908.690 3.328 - - 92.484 1.286 - 16.295 1.001.174 4.614 - 16.295 1980 693.901 239.251 - - 80.625 14.750 - 20.165 774.526 254.001 - 20.165 1981 464.900 120.934 - - 62.894 6.761 - 35.651 527.794 127.695 - 35.651 1982 407.859 214.406 - 50.324 44.009 22.272 - 63.916 451.868 236.678 - 114.240 1983 181.755 549.550 - 17.066 22.195 41.365 - 42.838 203.950 590.915 - 59.904 1984 174.052 496.653 - 8.681 21.089 61.234 - 47.107 195.141 557.887 - 55.788 1985 181.600 573.383 - 4.158 22.840 66.856 - 44.717 204.440 640.239 - 48.875 1986 191.042 619.854 - 4.256 27.761 77.877 - 39.780 218.803 697.731 - 44.036 1987 271.051 388.321 - 24.008 35.282 71.685 - 41.880 306.333 460.006 - 65.888 1988 288.419 492.967 - 1.025 55.539 76.222 - 64.347 343.958 569.189 - 65.372 1989 383.152 345.605 - 2.235 72.992 52.630 - 79.386 456.144 398.235 - 81.621 1990 590.764 71.523 - 797 110.788 11.736 - 62.230 701.552 83.259 - 63.027 1991 575.755 128.857 - 691 101.051 22.020 - 59.538 676.806 150.877 - 60.229 1992 647.941 163.127 - 4.891 100.951 30.314 - 70.326 748.892 193.441 - 75.217 1993 863.477 227.684 - 9.117 104.732 36.967 - 82.688 968.209 264.651 - 91.805 1994 1.120.755 120.177 - 7.841 138.413 22.583 - 90.048 1.259.168 142.760 - 97.889 1995 1.259.940 32.628 - 4.899 179.438 7.856 - 52.105 1.439.378 40.484 - 57.004 1996 1.444.604 6.373 - 7.599 215.455 1.359 - 62.883 1.660.059 7.732 - 70.482 1997 1.657.527 1.075 - 19.256 223.718 198 - 82.629 1.881.245 1.273 - 101.885 1998 1.220.123 1.188 - 32.705 168.729 263 - 78.052 1.388.852 1.451 - 110.757 1999 1.068.791 10.197 - 30.521 108.144 1.117 - 67.733 1.176.935 11.314 - 98.254 2000 1.315.885 9.428 - 36.408 155.165 678 - 79.318 1.471.050 10.106 - 115.726 2001 1.466.375 15.406 - 19.805 149.101 3.626 - 62.209 1.615.476 19.032 - 82.014 2002 1.456.354 48.022 - 15.909 120.064 8.572 - 51.225 1.576.418 56.594 - 67.134 2003 1.416.324 31.728 39.853 17.234 144.959 3.191 9.411 59.141 1.561.283 34.919 49.264 76.375 2004 1.499.118 49.796 282.706 31.160 183.049 1.216 49.801 84.285 1.682.167 51.012 332.507 115.445 2005 1.151.069 43.278 776.164 41.306 183.120 8.198 81.735 92.583 1.334.189 51.476 857.899 133.889 2006 815.849 758 1.249.062 26.334 161.285 17 142.574 75.332 977.134 775 1.391.636 101.666 2007 646.266 3 1.719.745 25.340 121.102 - 217.186 74.257 767.368 3 1.936.931 99.597 2008 534.949 - 1.984.941 25.839 99.017 - 258.707 101.487 633.966 - 2.243.648 127.326 2009 322.868 - 2.241.820 10.730 62.888 - 299.333 87.675 385.756 - 2.541.153 98.405 2010 560.348 - 2.256.158 9.468 99.834 - 370.953 112.287 660.182 - 2.627.111 121.755 2011 352.197 - 2.165.534 1.658 107.966 - 385.341 139.056 460.163 - 2.550.875 140.714
(Continua na página seguinte. / To be continued on next page.)
2.3 Produção por combustível - 1957/2011 Production by fuel type - 1957/2011
Unidades / Units
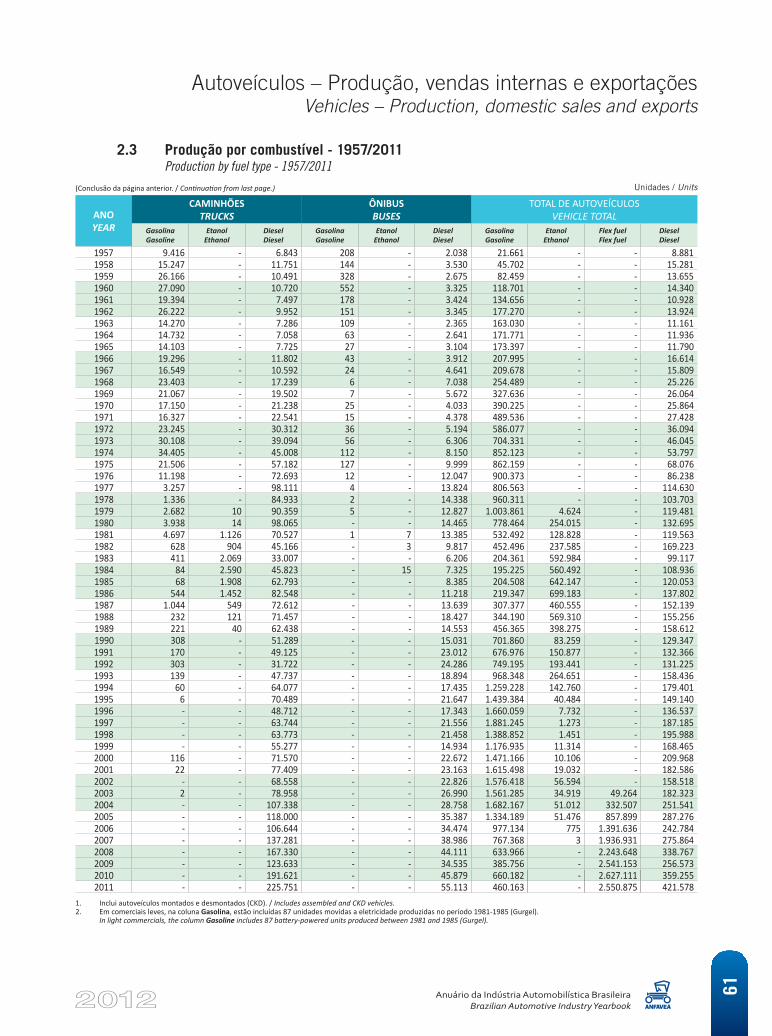
Autoveículos – Produção, vendas internas e exportaçõesVehicles – Production, domestic sales and exports
Anuário da Indústria Automobilística BrasileiraBrazilian Automotive Industry Yearbook
61
ANO YEAR
CAMINHÕES TRUCKS
ÔNIBUS BUSES
TOTAL DE AUTOVEÍCULOS VEHICLE TOTAL
GasolinaGasoline
EtanolEthanol
DieselDiesel
GasolinaGasoline
EtanolEthanol
DieselDiesel
GasolinaGasoline
EtanolEthanol
Flex fuel Flex fuel
DieselDiesel
1957 9.416 - 6.843 208 - 2.038 21.661 - - 8.881 1958 15.247 - 11.751 144 - 3.530 45.702 - - 15.281 1959 26.166 - 10.491 328 - 2.675 82.459 - - 13.655 1960 27.090 - 10.720 552 - 3.325 118.701 - - 14.340 1961 19.394 - 7.497 178 - 3.424 134.656 - - 10.928 1962 26.222 - 9.952 151 - 3.345 177.270 - - 13.924 1963 14.270 - 7.286 109 - 2.365 163.030 - - 11.161 1964 14.732 - 7.058 63 - 2.641 171.771 - - 11.936 1965 14.103 - 7.725 27 - 3.104 173.397 - - 11.790 1966 19.296 - 11.802 43 - 3.912 207.995 - - 16.614 1967 16.549 - 10.592 24 - 4.641 209.678 - - 15.809 1968 23.403 - 17.239 6 - 7.038 254.489 - - 25.226 1969 21.067 - 19.502 7 - 5.672 327.636 - - 26.064 1970 17.150 - 21.238 25 - 4.033 390.225 - - 25.864 1971 16.327 - 22.541 15 - 4.378 489.536 - - 27.428 1972 23.245 - 30.312 36 - 5.194 586.077 - - 36.094 1973 30.108 - 39.094 56 - 6.306 704.331 - - 46.045 1974 34.405 - 45.008 112 - 8.150 852.123 - - 53.797 1975 21.506 - 57.182 127 - 9.999 862.159 - - 68.076 1976 11.198 - 72.693 12 - 12.047 900.373 - - 86.238 1977 3.257 - 98.111 4 - 13.824 806.563 - - 114.630 1978 1.336 - 84.933 2 - 14.338 960.311 - - 103.703 1979 2.682 10 90.359 5 - 12.827 1.003.861 4.624 - 119.481 1980 3.938 14 98.065 - - 14.465 778.464 254.015 - 132.695 1981 4.697 1.126 70.527 1 7 13.385 532.492 128.828 - 119.563 1982 628 904 45.166 - 3 9.817 452.496 237.585 - 169.223 1983 411 2.069 33.007 - - 6.206 204.361 592.984 - 99.117 1984 84 2.590 45.823 - 15 7.325 195.225 560.492 - 108.936 1985 68 1.908 62.793 - - 8.385 204.508 642.147 - 120.053 1986 544 1.452 82.548 - - 11.218 219.347 699.183 - 137.802 1987 1.044 549 72.612 - - 13.639 307.377 460.555 - 152.139 1988 232 121 71.457 - - 18.427 344.190 569.310 - 155.256 1989 221 40 62.438 - - 14.553 456.365 398.275 - 158.612 1990 308 - 51.289 - - 15.031 701.860 83.259 - 129.347 1991 170 - 49.125 - - 23.012 676.976 150.877 - 132.366 1992 303 - 31.722 - - 24.286 749.195 193.441 - 131.225 1993 139 - 47.737 - - 18.894 968.348 264.651 - 158.436 1994 60 - 64.077 - - 17.435 1.259.228 142.760 - 179.401 1995 6 - 70.489 - - 21.647 1.439.384 40.484 - 149.140 1996 - - 48.712 - - 17.343 1.660.059 7.732 - 136.537 1997 - - 63.744 - - 21.556 1.881.245 1.273 - 187.185 1998 - - 63.773 - - 21.458 1.388.852 1.451 - 195.988 1999 - - 55.277 - - 14.934 1.176.935 11.314 - 168.465 2000 116 - 71.570 - - 22.672 1.471.166 10.106 - 209.968 2001 22 - 77.409 - - 23.163 1.615.498 19.032 - 182.586 2002 - - 68.558 - - 22.826 1.576.418 56.594 - 158.518 2003 2 - 78.958 - - 26.990 1.561.285 34.919 49.264 182.323 2004 - - 107.338 - - 28.758 1.682.167 51.012 332.507 251.541 2005 - - 118.000 - - 35.387 1.334.189 51.476 857.899 287.276 2006 - - 106.644 - - 34.474 977.134 775 1.391.636 242.784 2007 - - 137.281 - - 38.986 767.368 3 1.936.931 275.864 2008 - - 167.330 - - 44.111 633.966 - 2.243.648 338.767 2009 - - 123.633 - - 34.535 385.756 - 2.541.153 256.573 2010 - - 191.621 - - 45.879 660.182 - 2.627.111 359.255 2011 - - 225.751 - - 55.113 460.163 - 2.550.875 421.578
1. Inclui autoveículos montados e desmontados (CKD). / Includes assembled and CKD vehicles.2. Em comerciais leves, na coluna Gasolina, estão incluídas 87 unidades movidas a eletricidade produzidas no período 1981-1985 (Gurgel).
In light commercials, the column Gasoline includes 87 battery-powered units produced between 1981 and 1985 (Gurgel).
2.3 Produção por combustível - 1957/2011 Production by fuel type - 1957/2011
Unidades / Units(Conclusão da página anterior. / Continuation from last page.)
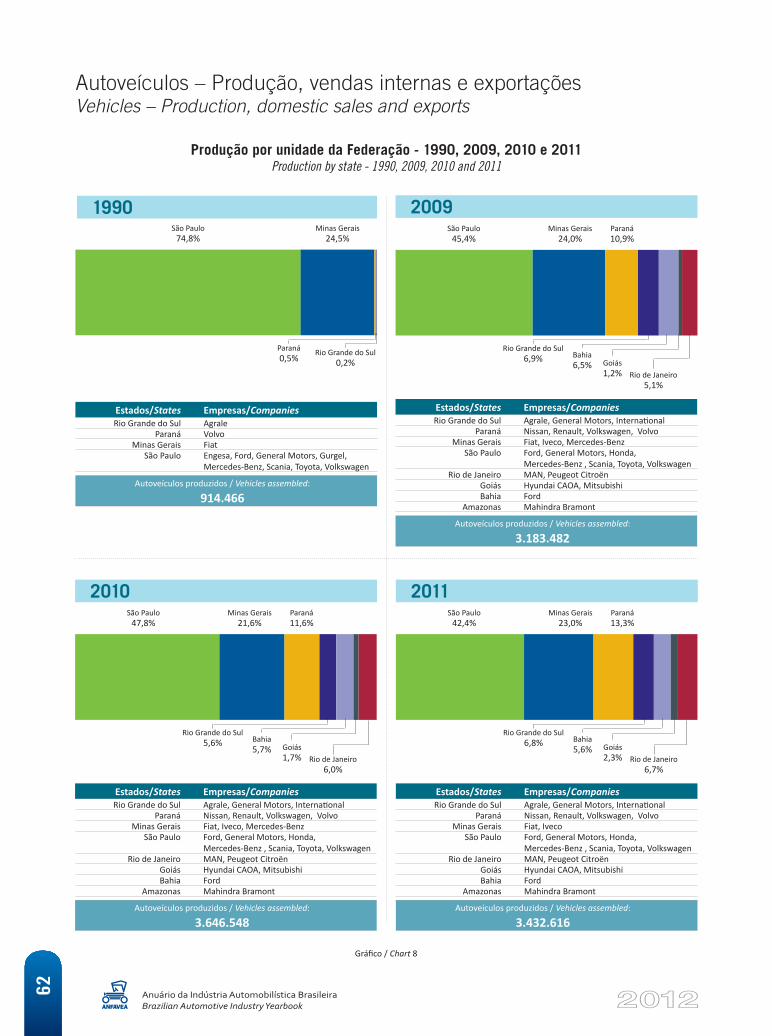
Autoveículos – Produção, vendas internas e exportaçõesVehicles – Production, domestic sales and exports
Anuário da Indústria Automobilística BrasileiraBrazilian Automotive Industry Yearbook
62
Gráfico / Chart 8
São Paulo74,8%
Minas Gerais24,5%
Paraná0,5%
Rio Grande do Sul0,2%
1990
Produção por unidade da Federação - 1990, 2009, 2010 e 2011Production by state - 1990, 2009, 2010 and 2011
São Paulo45,4%
Minas Gerais24,0%
Paraná10,9%
Rio Grande do Sul6,9% Bahia
6,5% Goiás1,2% Rio de Janeiro
5,1%
2009
Estados/States Empresas/CompaniesRio Grande do Sul Agrale, General Motors, International
Paraná Nissan, Renault, Volkswagen, VolvoMinas Gerais Fiat, Iveco, Mercedes-Benz
São Paulo Ford, General Motors, Honda, Mercedes-Benz , Scania, Toyota, Volkswagen
Rio de Janeiro MAN, Peugeot CitroënGoiás Hyundai CAOA, MitsubishiBahia Ford
Amazonas Mahindra Bramont
Autoveículos produzidos / Vehicles assembled:
3.183.482
São Paulo42,4%
Minas Gerais23,0%
Paraná13,3%
Rio Grande do Sul6,8% Bahia
5,6% Goiás2,3% Rio de Janeiro
6,7%
2011
Estados/States Empresas/CompaniesRio Grande do Sul Agrale, General Motors, International
Paraná Nissan, Renault, Volkswagen, VolvoMinas Gerais Fiat, Iveco
São Paulo Ford, General Motors, Honda, Mercedes-Benz , Scania, Toyota, Volkswagen
Rio de Janeiro MAN, Peugeot CitroënGoiás Hyundai CAOA, MitsubishiBahia Ford
Amazonas Mahindra Bramont
Autoveículos produzidos / Vehicles assembled:
3.432.616
São Paulo47,8%
Minas Gerais21,6%
Paraná11,6%
Rio Grande do Sul5,6% Bahia
5,7% Goiás1,7% Rio de Janeiro
6,0%
2010
Estados/States Empresas/CompaniesRio Grande do Sul Agrale, General Motors, International
Paraná Nissan, Renault, Volkswagen, VolvoMinas Gerais Fiat, Iveco, Mercedes-Benz
São Paulo Ford, General Motors, Honda, Mercedes-Benz , Scania, Toyota, Volkswagen
Rio de Janeiro MAN, Peugeot CitroënGoiás Hyundai CAOA, MitsubishiBahia Ford
Amazonas Mahindra Bramont
Autoveículos produzidos / Vehicles assembled:
3.646.548
Estados/States Empresas/CompaniesRio Grande do Sul Agrale
Paraná VolvoMinas Gerais Fiat
São Paulo Engesa, Ford, General Motors, Gurgel, Mercedes-Benz, Scania, Toyota, Volkswagen
Autoveículos produzidos / Vehicles assembled:
914.466
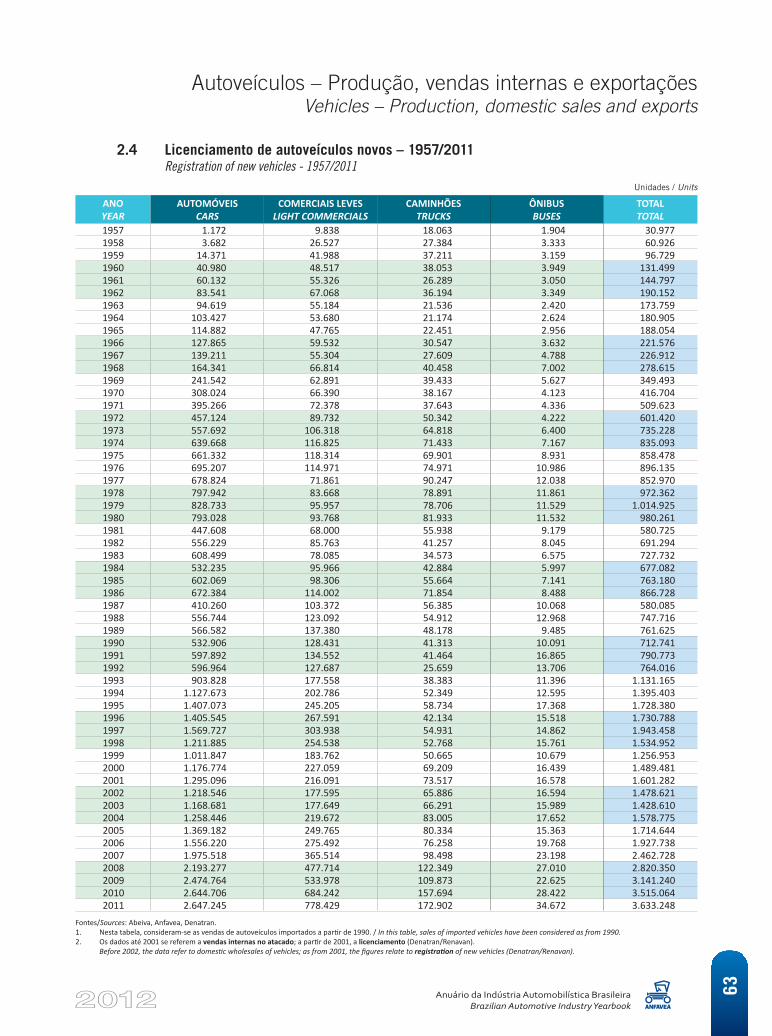
Autoveículos – Produção, vendas internas e exportaçõesVehicles – Production, domestic sales and exports
Anuário da Indústria Automobilística BrasileiraBrazilian Automotive Industry Yearbook
63
2.4 Licenciamento de autoveículos novos – 1957/2011 Registration of new vehicles - 1957/2011
ANO YEAR
AUTOMÓVEIS CARS
COMERCIAIS LEVES LIGHT COMMERCIALS
CAMINHÕES TRUCKS
ÔNIBUS BUSES
TOTAL TOTAL
1957 1.172 9.838 18.063 1.904 30.977 1958 3.682 26.527 27.384 3.333 60.926 1959 14.371 41.988 37.211 3.159 96.729 1960 40.980 48.517 38.053 3.949 131.499 1961 60.132 55.326 26.289 3.050 144.797 1962 83.541 67.068 36.194 3.349 190.152 1963 94.619 55.184 21.536 2.420 173.759 1964 103.427 53.680 21.174 2.624 180.905 1965 114.882 47.765 22.451 2.956 188.054 1966 127.865 59.532 30.547 3.632 221.576 1967 139.211 55.304 27.609 4.788 226.912 1968 164.341 66.814 40.458 7.002 278.615 1969 241.542 62.891 39.433 5.627 349.493 1970 308.024 66.390 38.167 4.123 416.704 1971 395.266 72.378 37.643 4.336 509.623 1972 457.124 89.732 50.342 4.222 601.420 1973 557.692 106.318 64.818 6.400 735.228 1974 639.668 116.825 71.433 7.167 835.093 1975 661.332 118.314 69.901 8.931 858.478 1976 695.207 114.971 74.971 10.986 896.135 1977 678.824 71.861 90.247 12.038 852.970 1978 797.942 83.668 78.891 11.861 972.362 1979 828.733 95.957 78.706 11.529 1.014.925 1980 793.028 93.768 81.933 11.532 980.261 1981 447.608 68.000 55.938 9.179 580.725 1982 556.229 85.763 41.257 8.045 691.294 1983 608.499 78.085 34.573 6.575 727.732 1984 532.235 95.966 42.884 5.997 677.082 1985 602.069 98.306 55.664 7.141 763.180 1986 672.384 114.002 71.854 8.488 866.728 1987 410.260 103.372 56.385 10.068 580.085 1988 556.744 123.092 54.912 12.968 747.716 1989 566.582 137.380 48.178 9.485 761.625 1990 532.906 128.431 41.313 10.091 712.741 1991 597.892 134.552 41.464 16.865 790.773 1992 596.964 127.687 25.659 13.706 764.016 1993 903.828 177.558 38.383 11.396 1.131.165 1994 1.127.673 202.786 52.349 12.595 1.395.403 1995 1.407.073 245.205 58.734 17.368 1.728.380 1996 1.405.545 267.591 42.134 15.518 1.730.788 1997 1.569.727 303.938 54.931 14.862 1.943.458 1998 1.211.885 254.538 52.768 15.761 1.534.952 1999 1.011.847 183.762 50.665 10.679 1.256.953 2000 1.176.774 227.059 69.209 16.439 1.489.481 2001 1.295.096 216.091 73.517 16.578 1.601.282 2002 1.218.546 177.595 65.886 16.594 1.478.621 2003 1.168.681 177.649 66.291 15.989 1.428.610 2004 1.258.446 219.672 83.005 17.652 1.578.775 2005 1.369.182 249.765 80.334 15.363 1.714.644 2006 1.556.220 275.492 76.258 19.768 1.927.738 2007 1.975.518 365.514 98.498 23.198 2.462.728 2008 2.193.277 477.714 122.349 27.010 2.820.350 2009 2.474.764 533.978 109.873 22.625 3.141.240 2010 2.644.706 684.242 157.694 28.422 3.515.064 2011 2.647.245 778.429 172.902 34.672 3.633.248
Fontes/Sources: Abeiva, Anfavea, Denatran.1. Nesta tabela, consideram-se as vendas de autoveículos importados a partir de 1990. / In this table, sales of imported vehicles have been considered as from 1990. 2. Os dados até 2001 se referem a vendas internas no atacado; a partir de 2001, a licenciamento (Denatran/Renavan).
Before 2002, the data refer to domestic wholesales of vehicles; as from 2001, the figures relate to registration of new vehicles (Denatran/Renavan).
Unidades / Units
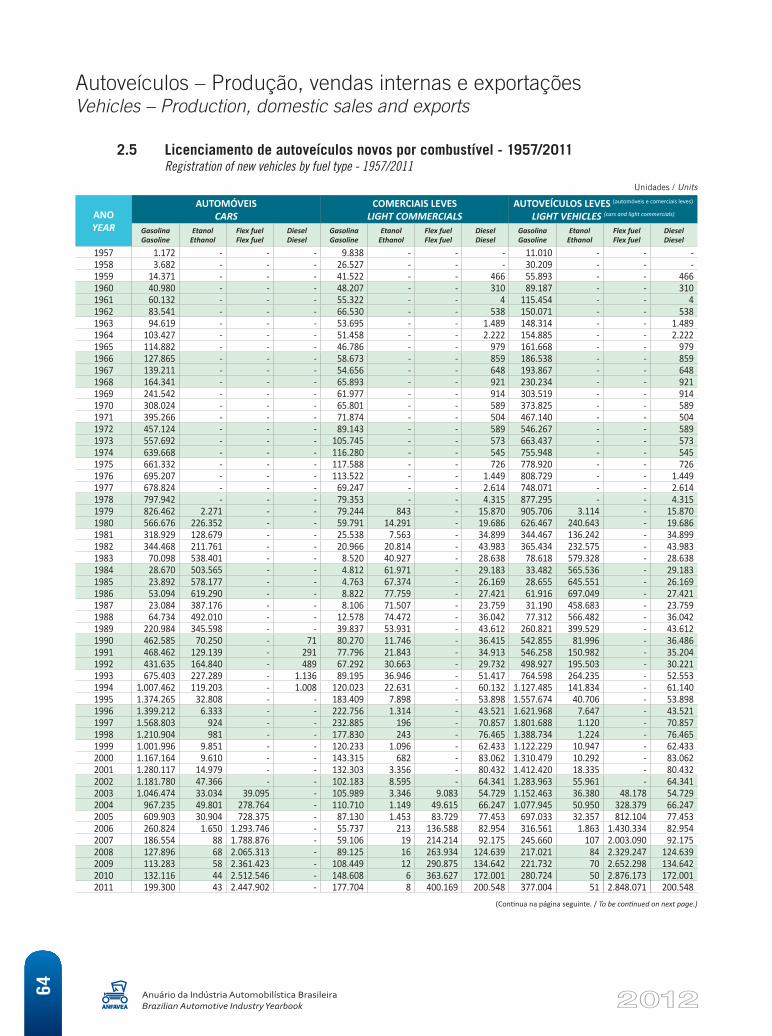
Autoveículos – Produção, vendas internas e exportaçõesVehicles – Production, domestic sales and exports
Anuário da Indústria Automobilística BrasileiraBrazilian Automotive Industry Yearbook
64
ANO YEAR
AUTOMÓVEIS CARS
COMERCIAIS LEVES LIGHT COMMERCIALS
AUTOVEÍCULOS LEVES (automóveis e comerciais leves) LIGHT VEHICLES (cars and light commercials)
GasolinaGasoline
EtanolEthanol
Flex fuel Flex fuel
DieselDiesel
GasolinaGasoline
EtanolEthanol
Flex fuel Flex fuel
DieselDiesel
GasolinaGasoline
EtanolEthanol
Flex fuel Flex fuel
DieselDiesel
1957 1.172 - - - 9.838 - - - 11.010 - - - 1958 3.682 - - - 26.527 - - - 30.209 - - - 1959 14.371 - - - 41.522 - - 466 55.893 - - 466 1960 40.980 - - - 48.207 - - 310 89.187 - - 310 1961 60.132 - - - 55.322 - - 4 115.454 - - 4 1962 83.541 - - - 66.530 - - 538 150.071 - - 538 1963 94.619 - - - 53.695 - - 1.489 148.314 - - 1.489 1964 103.427 - - - 51.458 - - 2.222 154.885 - - 2.222 1965 114.882 - - - 46.786 - - 979 161.668 - - 979 1966 127.865 - - - 58.673 - - 859 186.538 - - 859 1967 139.211 - - - 54.656 - - 648 193.867 - - 648 1968 164.341 - - - 65.893 - - 921 230.234 - - 921 1969 241.542 - - - 61.977 - - 914 303.519 - - 914 1970 308.024 - - - 65.801 - - 589 373.825 - - 589 1971 395.266 - - - 71.874 - - 504 467.140 - - 504 1972 457.124 - - - 89.143 - - 589 546.267 - - 589 1973 557.692 - - - 105.745 - - 573 663.437 - - 573 1974 639.668 - - - 116.280 - - 545 755.948 - - 545 1975 661.332 - - - 117.588 - - 726 778.920 - - 726 1976 695.207 - - - 113.522 - - 1.449 808.729 - - 1.449 1977 678.824 - - - 69.247 - - 2.614 748.071 - - 2.614 1978 797.942 - - - 79.353 - - 4.315 877.295 - - 4.315 1979 826.462 2.271 - - 79.244 843 - 15.870 905.706 3.114 - 15.870 1980 566.676 226.352 - - 59.791 14.291 - 19.686 626.467 240.643 - 19.686 1981 318.929 128.679 - - 25.538 7.563 - 34.899 344.467 136.242 - 34.899 1982 344.468 211.761 - - 20.966 20.814 - 43.983 365.434 232.575 - 43.983 1983 70.098 538.401 - - 8.520 40.927 - 28.638 78.618 579.328 - 28.638 1984 28.670 503.565 - - 4.812 61.971 - 29.183 33.482 565.536 - 29.183 1985 23.892 578.177 - - 4.763 67.374 - 26.169 28.655 645.551 - 26.169 1986 53.094 619.290 - - 8.822 77.759 - 27.421 61.916 697.049 - 27.421 1987 23.084 387.176 - - 8.106 71.507 - 23.759 31.190 458.683 - 23.759 1988 64.734 492.010 - - 12.578 74.472 - 36.042 77.312 566.482 - 36.042 1989 220.984 345.598 - - 39.837 53.931 - 43.612 260.821 399.529 - 43.612 1990 462.585 70.250 - 71 80.270 11.746 - 36.415 542.855 81.996 - 36.486 1991 468.462 129.139 - 291 77.796 21.843 - 34.913 546.258 150.982 - 35.204 1992 431.635 164.840 - 489 67.292 30.663 - 29.732 498.927 195.503 - 30.221 1993 675.403 227.289 - 1.136 89.195 36.946 - 51.417 764.598 264.235 - 52.553 1994 1.007.462 119.203 - 1.008 120.023 22.631 - 60.132 1.127.485 141.834 - 61.140 1995 1.374.265 32.808 - - 183.409 7.898 - 53.898 1.557.674 40.706 - 53.898 1996 1.399.212 6.333 - - 222.756 1.314 - 43.521 1.621.968 7.647 - 43.521 1997 1.568.803 924 - - 232.885 196 - 70.857 1.801.688 1.120 - 70.857 1998 1.210.904 981 - - 177.830 243 - 76.465 1.388.734 1.224 - 76.465 1999 1.001.996 9.851 - - 120.233 1.096 - 62.433 1.122.229 10.947 - 62.433 2000 1.167.164 9.610 - - 143.315 682 - 83.062 1.310.479 10.292 - 83.062 2001 1.280.117 14.979 - - 132.303 3.356 - 80.432 1.412.420 18.335 - 80.432 2002 1.181.780 47.366 - - 102.183 8.595 - 64.341 1.283.963 55.961 - 64.341 2003 1.046.474 33.034 39.095 - 105.989 3.346 9.083 54.729 1.152.463 36.380 48.178 54.729 2004 967.235 49.801 278.764 - 110.710 1.149 49.615 66.247 1.077.945 50.950 328.379 66.247 2005 609.903 30.904 728.375 - 87.130 1.453 83.729 77.453 697.033 32.357 812.104 77.453 2006 260.824 1.650 1.293.746 - 55.737 213 136.588 82.954 316.561 1.863 1.430.334 82.954 2007 186.554 88 1.788.876 - 59.106 19 214.214 92.175 245.660 107 2.003.090 92.175 2008 127.896 68 2.065.313 - 89.125 16 263.934 124.639 217.021 84 2.329.247 124.639 2009 113.283 58 2.361.423 - 108.449 12 290.875 134.642 221.732 70 2.652.298 134.642 2010 132.116 44 2.512.546 - 148.608 6 363.627 172.001 280.724 50 2.876.173 172.001 2011 199.300 43 2.447.902 - 177.704 8 400.169 200.548 377.004 51 2.848.071 200.548
(Continua na página seguinte. / To be continued on next page.)
2.5 Licenciamento de autoveículos novos por combustível - 1957/2011 Registration of new vehicles by fuel type - 1957/2011
Unidades / Units
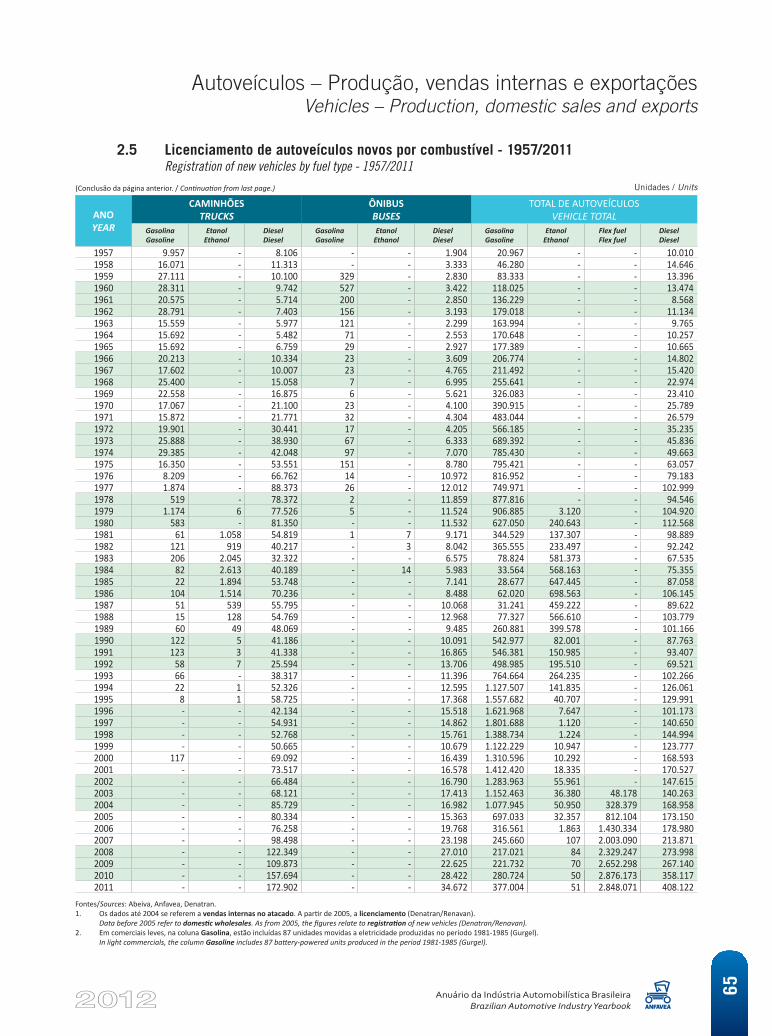
Autoveículos – Produção, vendas internas e exportaçõesVehicles – Production, domestic sales and exports
Anuário da Indústria Automobilística BrasileiraBrazilian Automotive Industry Yearbook
65
ANO YEAR
CAMINHÕES TRUCKS
ÔNIBUS BUSES
TOTAL DE AUTOVEÍCULOS VEHICLE TOTAL
GasolinaGasoline
EtanolEthanol
DieselDiesel
GasolinaGasoline
EtanolEthanol
DieselDiesel
GasolinaGasoline
EtanolEthanol
Flex fuel Flex fuel
DieselDiesel
1957 9.957 - 8.106 - - 1.904 20.967 - - 10.010 1958 16.071 - 11.313 - - 3.333 46.280 - - 14.646 1959 27.111 - 10.100 329 - 2.830 83.333 - - 13.396 1960 28.311 - 9.742 527 - 3.422 118.025 - - 13.474 1961 20.575 - 5.714 200 - 2.850 136.229 - - 8.568 1962 28.791 - 7.403 156 - 3.193 179.018 - - 11.134 1963 15.559 - 5.977 121 - 2.299 163.994 - - 9.765 1964 15.692 - 5.482 71 - 2.553 170.648 - - 10.257 1965 15.692 - 6.759 29 - 2.927 177.389 - - 10.665 1966 20.213 - 10.334 23 - 3.609 206.774 - - 14.802 1967 17.602 - 10.007 23 - 4.765 211.492 - - 15.420 1968 25.400 - 15.058 7 - 6.995 255.641 - - 22.974 1969 22.558 - 16.875 6 - 5.621 326.083 - - 23.410 1970 17.067 - 21.100 23 - 4.100 390.915 - - 25.789 1971 15.872 - 21.771 32 - 4.304 483.044 - - 26.579 1972 19.901 - 30.441 17 - 4.205 566.185 - - 35.235 1973 25.888 - 38.930 67 - 6.333 689.392 - - 45.836 1974 29.385 - 42.048 97 - 7.070 785.430 - - 49.663 1975 16.350 - 53.551 151 - 8.780 795.421 - - 63.057 1976 8.209 - 66.762 14 - 10.972 816.952 - - 79.183 1977 1.874 - 88.373 26 - 12.012 749.971 - - 102.999 1978 519 - 78.372 2 - 11.859 877.816 - - 94.546 1979 1.174 6 77.526 5 - 11.524 906.885 3.120 - 104.920 1980 583 - 81.350 - - 11.532 627.050 240.643 - 112.568 1981 61 1.058 54.819 1 7 9.171 344.529 137.307 - 98.889 1982 121 919 40.217 - 3 8.042 365.555 233.497 - 92.242 1983 206 2.045 32.322 - - 6.575 78.824 581.373 - 67.535 1984 82 2.613 40.189 - 14 5.983 33.564 568.163 - 75.355 1985 22 1.894 53.748 - - 7.141 28.677 647.445 - 87.058 1986 104 1.514 70.236 - - 8.488 62.020 698.563 - 106.145 1987 51 539 55.795 - - 10.068 31.241 459.222 - 89.622 1988 15 128 54.769 - - 12.968 77.327 566.610 - 103.779 1989 60 49 48.069 - - 9.485 260.881 399.578 - 101.166 1990 122 5 41.186 - - 10.091 542.977 82.001 - 87.763 1991 123 3 41.338 - - 16.865 546.381 150.985 - 93.407 1992 58 7 25.594 - - 13.706 498.985 195.510 - 69.521 1993 66 - 38.317 - - 11.396 764.664 264.235 - 102.266 1994 22 1 52.326 - - 12.595 1.127.507 141.835 - 126.061 1995 8 1 58.725 - - 17.368 1.557.682 40.707 - 129.991 1996 - - 42.134 - - 15.518 1.621.968 7.647 - 101.173 1997 - - 54.931 - - 14.862 1.801.688 1.120 - 140.650 1998 - - 52.768 - - 15.761 1.388.734 1.224 - 144.994 1999 - - 50.665 - - 10.679 1.122.229 10.947 - 123.777 2000 117 - 69.092 - - 16.439 1.310.596 10.292 - 168.593 2001 - - 73.517 - - 16.578 1.412.420 18.335 - 170.527 2002 - - 66.484 - - 16.790 1.283.963 55.961 - 147.615 2003 - - 68.121 - - 17.413 1.152.463 36.380 48.178 140.263 2004 - - 85.729 - - 16.982 1.077.945 50.950 328.379 168.958 2005 - - 80.334 - - 15.363 697.033 32.357 812.104 173.150 2006 - - 76.258 - - 19.768 316.561 1.863 1.430.334 178.980 2007 - - 98.498 - - 23.198 245.660 107 2.003.090 213.871 2008 - - 122.349 - - 27.010 217.021 84 2.329.247 273.998 2009 - - 109.873 - - 22.625 221.732 70 2.652.298 267.140 2010 - - 157.694 - - 28.422 280.724 50 2.876.173 358.117 2011 - - 172.902 - - 34.672 377.004 51 2.848.071 408.122
Fontes/Sources: Abeiva, Anfavea, Denatran.1. Os dados até 2004 se referem a vendas internas no atacado. A partir de 2005, a licenciamento (Denatran/Renavan).
Data before 2005 refer to domestic wholesales. As from 2005, the figures relate to registration of new vehicles (Denatran/Renavan).2. Em comerciais leves, na coluna Gasolina, estão incluídas 87 unidades movidas a eletricidade produzidas no período 1981-1985 (Gurgel).
In light commercials, the column Gasoline includes 87 battery-powered units produced in the period 1981-1985 (Gurgel).
2.5 Licenciamento de autoveículos novos por combustível - 1957/2011 Registration of new vehicles by fuel type - 1957/2011
Unidades / Units(Conclusão da página anterior. / Continuation from last page.)
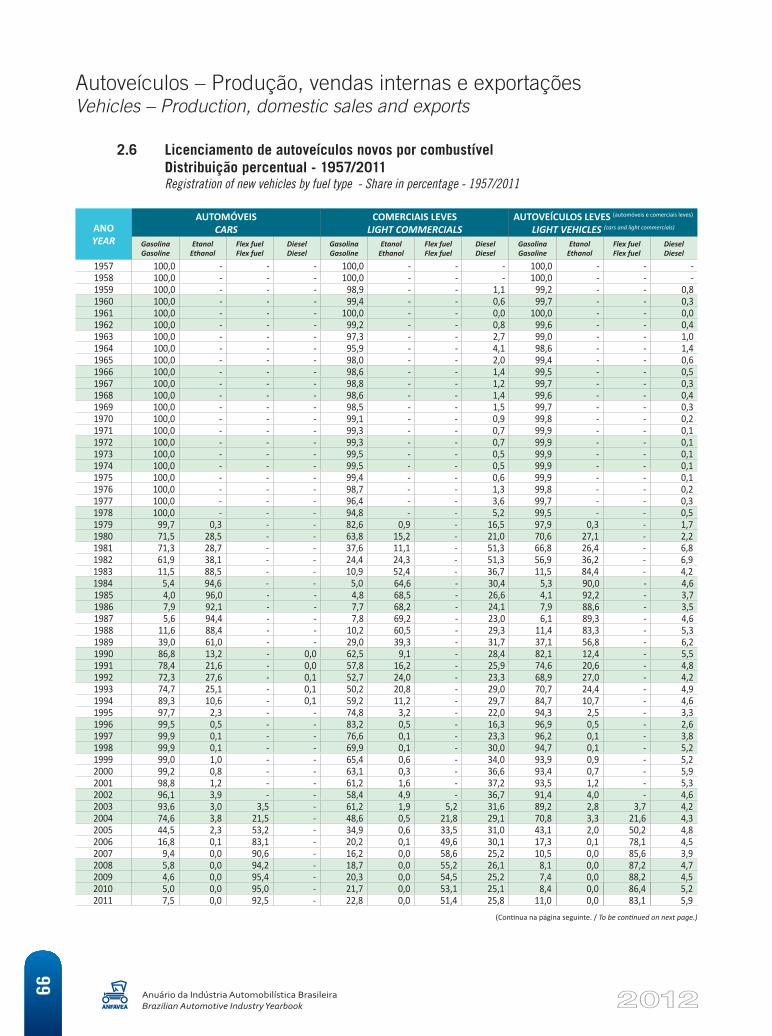
Autoveículos – Produção, vendas internas e exportaçõesVehicles – Production, domestic sales and exports
Anuário da Indústria Automobilística BrasileiraBrazilian Automotive Industry Yearbook
66
ANO YEAR
AUTOMÓVEIS CARS
COMERCIAIS LEVES LIGHT COMMERCIALS
AUTOVEÍCULOS LEVES (automóveis e comerciais leves) LIGHT VEHICLES (cars and light commercials)
GasolinaGasoline
EtanolEthanol
Flex fuel Flex fuel
DieselDiesel
GasolinaGasoline
EtanolEthanol
Flex fuel Flex fuel
DieselDiesel
GasolinaGasoline
EtanolEthanol
Flex fuel Flex fuel
DieselDiesel
1957 100,0 - - - 100,0 - - - 100,0 - - - 1958 100,0 - - - 100,0 - - - 100,0 - - - 1959 100,0 - - - 98,9 - - 1,1 99,2 - - 0,8 1960 100,0 - - - 99,4 - - 0,6 99,7 - - 0,3 1961 100,0 - - - 100,0 - - 0,0 100,0 - - 0,0 1962 100,0 - - - 99,2 - - 0,8 99,6 - - 0,4 1963 100,0 - - - 97,3 - - 2,7 99,0 - - 1,0 1964 100,0 - - - 95,9 - - 4,1 98,6 - - 1,4 1965 100,0 - - - 98,0 - - 2,0 99,4 - - 0,6 1966 100,0 - - - 98,6 - - 1,4 99,5 - - 0,5 1967 100,0 - - - 98,8 - - 1,2 99,7 - - 0,3 1968 100,0 - - - 98,6 - - 1,4 99,6 - - 0,4 1969 100,0 - - - 98,5 - - 1,5 99,7 - - 0,3 1970 100,0 - - - 99,1 - - 0,9 99,8 - - 0,2 1971 100,0 - - - 99,3 - - 0,7 99,9 - - 0,1 1972 100,0 - - - 99,3 - - 0,7 99,9 - - 0,1 1973 100,0 - - - 99,5 - - 0,5 99,9 - - 0,1 1974 100,0 - - - 99,5 - - 0,5 99,9 - - 0,1 1975 100,0 - - - 99,4 - - 0,6 99,9 - - 0,1 1976 100,0 - - - 98,7 - - 1,3 99,8 - - 0,2 1977 100,0 - - - 96,4 - - 3,6 99,7 - - 0,3 1978 100,0 - - - 94,8 - - 5,2 99,5 - - 0,5 1979 99,7 0,3 - - 82,6 0,9 - 16,5 97,9 0,3 - 1,7 1980 71,5 28,5 - - 63,8 15,2 - 21,0 70,6 27,1 - 2,2 1981 71,3 28,7 - - 37,6 11,1 - 51,3 66,8 26,4 - 6,8 1982 61,9 38,1 - - 24,4 24,3 - 51,3 56,9 36,2 - 6,9 1983 11,5 88,5 - - 10,9 52,4 - 36,7 11,5 84,4 - 4,2 1984 5,4 94,6 - - 5,0 64,6 - 30,4 5,3 90,0 - 4,6 1985 4,0 96,0 - - 4,8 68,5 - 26,6 4,1 92,2 - 3,7 1986 7,9 92,1 - - 7,7 68,2 - 24,1 7,9 88,6 - 3,5 1987 5,6 94,4 - - 7,8 69,2 - 23,0 6,1 89,3 - 4,6 1988 11,6 88,4 - - 10,2 60,5 - 29,3 11,4 83,3 - 5,3 1989 39,0 61,0 - - 29,0 39,3 - 31,7 37,1 56,8 - 6,2 1990 86,8 13,2 - 0,0 62,5 9,1 - 28,4 82,1 12,4 - 5,5 1991 78,4 21,6 - 0,0 57,8 16,2 - 25,9 74,6 20,6 - 4,8 1992 72,3 27,6 - 0,1 52,7 24,0 - 23,3 68,9 27,0 - 4,2 1993 74,7 25,1 - 0,1 50,2 20,8 - 29,0 70,7 24,4 - 4,9 1994 89,3 10,6 - 0,1 59,2 11,2 - 29,7 84,7 10,7 - 4,6 1995 97,7 2,3 - - 74,8 3,2 - 22,0 94,3 2,5 - 3,3 1996 99,5 0,5 - - 83,2 0,5 - 16,3 96,9 0,5 - 2,6 1997 99,9 0,1 - - 76,6 0,1 - 23,3 96,2 0,1 - 3,8 1998 99,9 0,1 - - 69,9 0,1 - 30,0 94,7 0,1 - 5,2 1999 99,0 1,0 - - 65,4 0,6 - 34,0 93,9 0,9 - 5,2 2000 99,2 0,8 - - 63,1 0,3 - 36,6 93,4 0,7 - 5,9 2001 98,8 1,2 - - 61,2 1,6 - 37,2 93,5 1,2 - 5,3 2002 96,1 3,9 - - 58,4 4,9 - 36,7 91,4 4,0 - 4,6 2003 93,6 3,0 3,5 - 61,2 1,9 5,2 31,6 89,2 2,8 3,7 4,2 2004 74,6 3,8 21,5 - 48,6 0,5 21,8 29,1 70,8 3,3 21,6 4,3 2005 44,5 2,3 53,2 - 34,9 0,6 33,5 31,0 43,1 2,0 50,2 4,8 2006 16,8 0,1 83,1 - 20,2 0,1 49,6 30,1 17,3 0,1 78,1 4,5 2007 9,4 0,0 90,6 - 16,2 0,0 58,6 25,2 10,5 0,0 85,6 3,9 2008 5,8 0,0 94,2 - 18,7 0,0 55,2 26,1 8,1 0,0 87,2 4,7 2009 4,6 0,0 95,4 - 20,3 0,0 54,5 25,2 7,4 0,0 88,2 4,5 2010 5,0 0,0 95,0 - 21,7 0,0 53,1 25,1 8,4 0,0 86,4 5,2 2011 7,5 0,0 92,5 - 22,8 0,0 51,4 25,8 11,0 0,0 83,1 5,9
(Continua na página seguinte. / To be continued on next page.)
2.6 Licenciamento de autoveículos novos por combustível Distribuição percentual - 1957/2011 Registration of new vehicles by fuel type - Share in percentage - 1957/2011
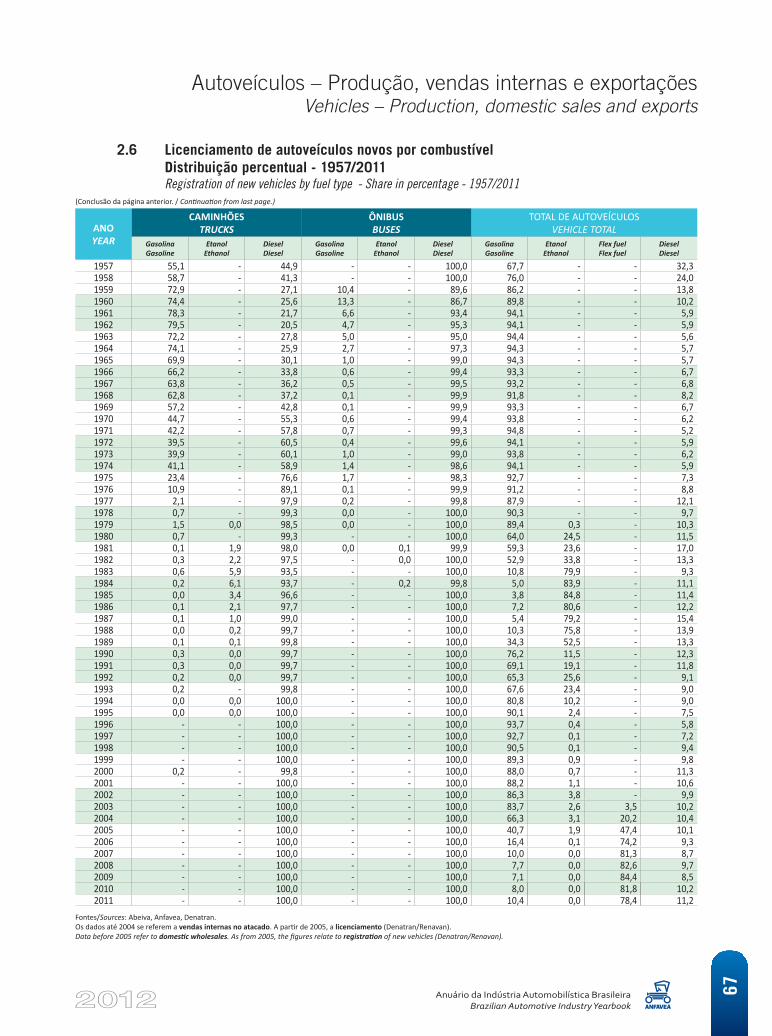
Autoveículos – Produção, vendas internas e exportaçõesVehicles – Production, domestic sales and exports
Anuário da Indústria Automobilística BrasileiraBrazilian Automotive Industry Yearbook
67
ANO YEAR
CAMINHÕES TRUCKS
ÔNIBUS BUSES
TOTAL DE AUTOVEÍCULOS VEHICLE TOTAL
GasolinaGasoline
EtanolEthanol
DieselDiesel
GasolinaGasoline
EtanolEthanol
DieselDiesel
GasolinaGasoline
EtanolEthanol
Flex fuel Flex fuel
DieselDiesel
1957 55,1 - 44,9 - - 100,0 67,7 - - 32,3 1958 58,7 - 41,3 - - 100,0 76,0 - - 24,0 1959 72,9 - 27,1 10,4 - 89,6 86,2 - - 13,8 1960 74,4 - 25,6 13,3 - 86,7 89,8 - - 10,2 1961 78,3 - 21,7 6,6 - 93,4 94,1 - - 5,9 1962 79,5 - 20,5 4,7 - 95,3 94,1 - - 5,9 1963 72,2 - 27,8 5,0 - 95,0 94,4 - - 5,6 1964 74,1 - 25,9 2,7 - 97,3 94,3 - - 5,7 1965 69,9 - 30,1 1,0 - 99,0 94,3 - - 5,7 1966 66,2 - 33,8 0,6 - 99,4 93,3 - - 6,7 1967 63,8 - 36,2 0,5 - 99,5 93,2 - - 6,8 1968 62,8 - 37,2 0,1 - 99,9 91,8 - - 8,2 1969 57,2 - 42,8 0,1 - 99,9 93,3 - - 6,7 1970 44,7 - 55,3 0,6 - 99,4 93,8 - - 6,2 1971 42,2 - 57,8 0,7 - 99,3 94,8 - - 5,2 1972 39,5 - 60,5 0,4 - 99,6 94,1 - - 5,9 1973 39,9 - 60,1 1,0 - 99,0 93,8 - - 6,2 1974 41,1 - 58,9 1,4 - 98,6 94,1 - - 5,9 1975 23,4 - 76,6 1,7 - 98,3 92,7 - - 7,3 1976 10,9 - 89,1 0,1 - 99,9 91,2 - - 8,8 1977 2,1 - 97,9 0,2 - 99,8 87,9 - - 12,1 1978 0,7 - 99,3 0,0 - 100,0 90,3 - - 9,7 1979 1,5 0,0 98,5 0,0 - 100,0 89,4 0,3 - 10,3 1980 0,7 - 99,3 - - 100,0 64,0 24,5 - 11,5 1981 0,1 1,9 98,0 0,0 0,1 99,9 59,3 23,6 - 17,0 1982 0,3 2,2 97,5 - 0,0 100,0 52,9 33,8 - 13,3 1983 0,6 5,9 93,5 - - 100,0 10,8 79,9 - 9,3 1984 0,2 6,1 93,7 - 0,2 99,8 5,0 83,9 - 11,1 1985 0,0 3,4 96,6 - - 100,0 3,8 84,8 - 11,4 1986 0,1 2,1 97,7 - - 100,0 7,2 80,6 - 12,2 1987 0,1 1,0 99,0 - - 100,0 5,4 79,2 - 15,4 1988 0,0 0,2 99,7 - - 100,0 10,3 75,8 - 13,9 1989 0,1 0,1 99,8 - - 100,0 34,3 52,5 - 13,3 1990 0,3 0,0 99,7 - - 100,0 76,2 11,5 - 12,3 1991 0,3 0,0 99,7 - - 100,0 69,1 19,1 - 11,8 1992 0,2 0,0 99,7 - - 100,0 65,3 25,6 - 9,1 1993 0,2 - 99,8 - - 100,0 67,6 23,4 - 9,0 1994 0,0 0,0 100,0 - - 100,0 80,8 10,2 - 9,0 1995 0,0 0,0 100,0 - - 100,0 90,1 2,4 - 7,5 1996 - - 100,0 - - 100,0 93,7 0,4 - 5,8 1997 - - 100,0 - - 100,0 92,7 0,1 - 7,2 1998 - - 100,0 - - 100,0 90,5 0,1 - 9,4 1999 - - 100,0 - - 100,0 89,3 0,9 - 9,8 2000 0,2 - 99,8 - - 100,0 88,0 0,7 - 11,3 2001 - - 100,0 - - 100,0 88,2 1,1 - 10,6 2002 - - 100,0 - - 100,0 86,3 3,8 - 9,9 2003 - - 100,0 - - 100,0 83,7 2,6 3,5 10,2 2004 - - 100,0 - - 100,0 66,3 3,1 20,2 10,4 2005 - - 100,0 - - 100,0 40,7 1,9 47,4 10,1 2006 - - 100,0 - - 100,0 16,4 0,1 74,2 9,3 2007 - - 100,0 - - 100,0 10,0 0,0 81,3 8,7 2008 - - 100,0 - - 100,0 7,7 0,0 82,6 9,7 2009 - - 100,0 - - 100,0 7,1 0,0 84,4 8,5 2010 - - 100,0 - - 100,0 8,0 0,0 81,8 10,2 2011 - - 100,0 - - 100,0 10,4 0,0 78,4 11,2
Fontes/Sources: Abeiva, Anfavea, Denatran.Os dados até 2004 se referem a vendas internas no atacado. A partir de 2005, a licenciamento (Denatran/Renavan). Data before 2005 refer to domestic wholesales. As from 2005, the figures relate to registration of new vehicles (Denatran/Renavan).
2.6 Licenciamento de autoveículos novos por combustível Distribuição percentual - 1957/2011 Registration of new vehicles by fuel type - Share in percentage - 1957/2011
(Conclusão da página anterior. / Continuation from last page.)
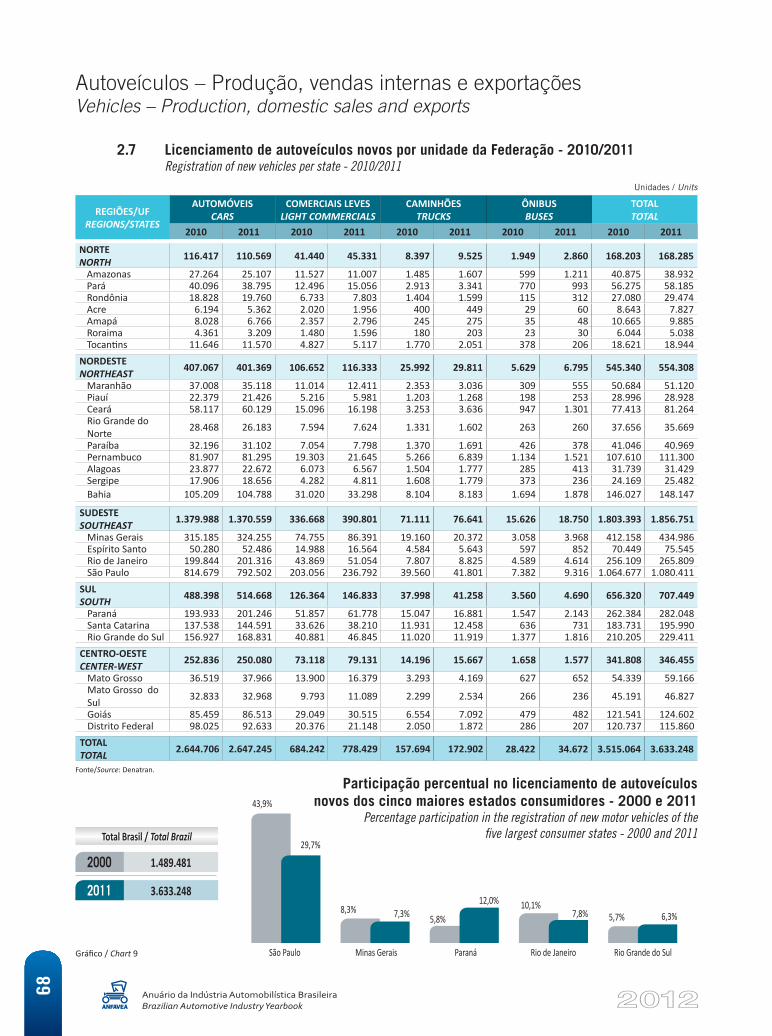
Autoveículos – Produção, vendas internas e exportaçõesVehicles – Production, domestic sales and exports
Anuário da Indústria Automobilística BrasileiraBrazilian Automotive Industry Yearbook
68
Fonte/Source: Denatran.
REGIÕES/UF REGIONS/STATES
AUTOMÓVEIS CARS
COMERCIAIS LEVES LIGHT COMMERCIALS
CAMINHÕES TRUCKS
ÔNIBUS BUSES
TOTAL TOTAL
2010 2011 2010 2011 2010 2011 2010 2011 2010 2011
NORTE NORTH 116.417 110.569 41.440 45.331 8.397 9.525 1.949 2.860 168.203 168.285
Amazonas 27.264 25.107 11.527 11.007 1.485 1.607 599 1.211 40.875 38.932 Pará 40.096 38.795 12.496 15.056 2.913 3.341 770 993 56.275 58.185 Rondônia 18.828 19.760 6.733 7.803 1.404 1.599 115 312 27.080 29.474 Acre 6.194 5.362 2.020 1.956 400 449 29 60 8.643 7.827 Amapá 8.028 6.766 2.357 2.796 245 275 35 48 10.665 9.885 Roraima 4.361 3.209 1.480 1.596 180 203 23 30 6.044 5.038 Tocantins 11.646 11.570 4.827 5.117 1.770 2.051 378 206 18.621 18.944
NORDESTE NORTHEAST 407.067 401.369 106.652 116.333 25.992 29.811 5.629 6.795 545.340 554.308
Maranhão 37.008 35.118 11.014 12.411 2.353 3.036 309 555 50.684 51.120 Piauí 22.379 21.426 5.216 5.981 1.203 1.268 198 253 28.996 28.928 Ceará 58.117 60.129 15.096 16.198 3.253 3.636 947 1.301 77.413 81.264 Rio Grande do Norte 28.468 26.183 7.594 7.624 1.331 1.602 263 260 37.656 35.669
Paraíba 32.196 31.102 7.054 7.798 1.370 1.691 426 378 41.046 40.969 Pernambuco 81.907 81.295 19.303 21.645 5.266 6.839 1.134 1.521 107.610 111.300 Alagoas 23.877 22.672 6.073 6.567 1.504 1.777 285 413 31.739 31.429 Sergipe 17.906 18.656 4.282 4.811 1.608 1.779 373 236 24.169 25.482 Bahia 105.209 104.788 31.020 33.298 8.104 8.183 1.694 1.878 146.027 148.147
SUDESTE SOUTHEAST 1.379.988 1.370.559 336.668 390.801 71.111 76.641 15.626 18.750 1.803.393 1.856.751
Minas Gerais 315.185 324.255 74.755 86.391 19.160 20.372 3.058 3.968 412.158 434.986 Espírito Santo 50.280 52.486 14.988 16.564 4.584 5.643 597 852 70.449 75.545 Rio de Janeiro 199.844 201.316 43.869 51.054 7.807 8.825 4.589 4.614 256.109 265.809 São Paulo 814.679 792.502 203.056 236.792 39.560 41.801 7.382 9.316 1.064.677 1.080.411
SUL SOUTH 488.398 514.668 126.364 146.833 37.998 41.258 3.560 4.690 656.320 707.449
Paraná 193.933 201.246 51.857 61.778 15.047 16.881 1.547 2.143 262.384 282.048 Santa Catarina 137.538 144.591 33.626 38.210 11.931 12.458 636 731 183.731 195.990 Rio Grande do Sul 156.927 168.831 40.881 46.845 11.020 11.919 1.377 1.816 210.205 229.411
CENTRO-OESTE CENTER-WEST 252.836 250.080 73.118 79.131 14.196 15.667 1.658 1.577 341.808 346.455
Mato Grosso 36.519 37.966 13.900 16.379 3.293 4.169 627 652 54.339 59.166 Mato Grosso do Sul 32.833 32.968 9.793 11.089 2.299 2.534 266 236 45.191 46.827
Goiás 85.459 86.513 29.049 30.515 6.554 7.092 479 482 121.541 124.602 Distrito Federal 98.025 92.633 20.376 21.148 2.050 1.872 286 207 120.737 115.860
TOTAL TOTAL 2.644.706 2.647.245 684.242 778.429 157.694 172.902 28.422 34.672 3.515.064 3.633.248
2.7 Licenciamento de autoveículos novos por unidade da Federação - 2010/2011 Registration of new vehicles per state - 2010/2011
Participação percentual no licenciamento de autoveículos novos dos cinco maiores estados consumidores - 2000 e 2011
Percentage participation in the registration of new motor vehicles of the five largest consumer states - 2000 and 2011
Unidades / Units
São Paulo Minas Gerais Paraná Rio de Janeiro Rio Grande do Sul
43,9%
29,7%
8,3% 7,3% 5,8%
12,0% 10,1%7,8% 5,7% 6,3%
Total Brasil / Total Brazil
1.489.481
3.633.248
2000
2011
Gráfico / Chart 9
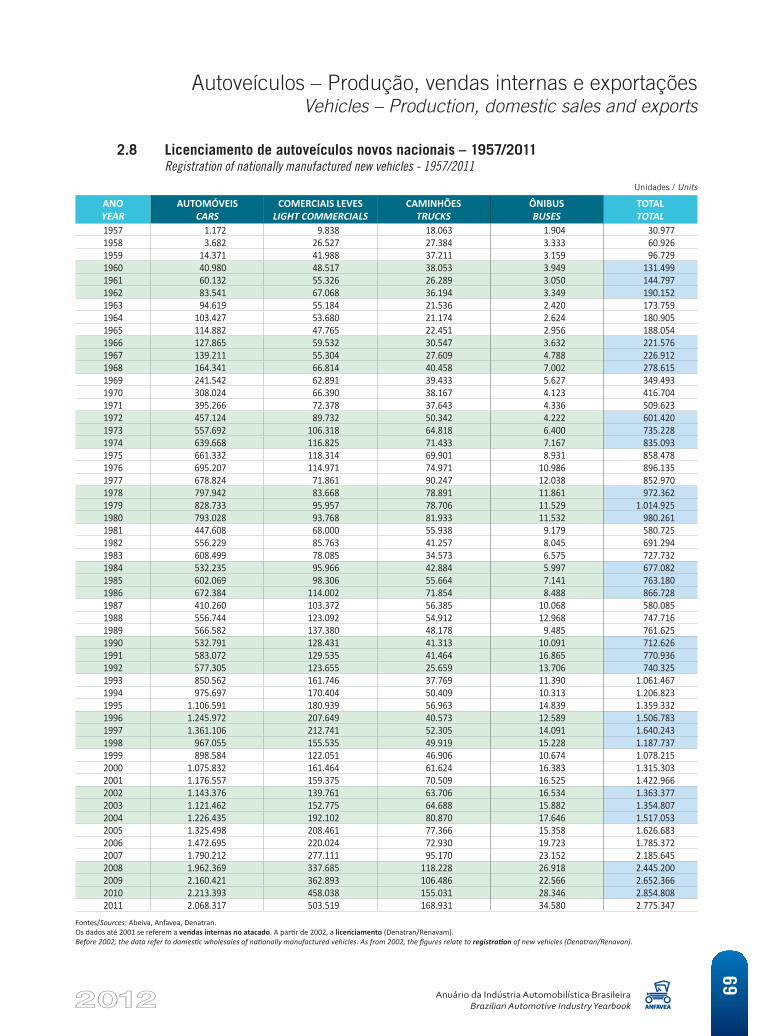
Autoveículos – Produção, vendas internas e exportaçõesVehicles – Production, domestic sales and exports
Anuário da Indústria Automobilística BrasileiraBrazilian Automotive Industry Yearbook
69
2.8 Licenciamento de autoveículos novos nacionais – 1957/2011 Registration of nationally manufactured new vehicles - 1957/2011
ANO YEAR
AUTOMÓVEIS CARS
COMERCIAIS LEVES LIGHT COMMERCIALS
CAMINHÕES TRUCKS
ÔNIBUS BUSES
TOTAL TOTAL
1957 1.172 9.838 18.063 1.904 30.977 1958 3.682 26.527 27.384 3.333 60.926 1959 14.371 41.988 37.211 3.159 96.729 1960 40.980 48.517 38.053 3.949 131.499 1961 60.132 55.326 26.289 3.050 144.797 1962 83.541 67.068 36.194 3.349 190.152 1963 94.619 55.184 21.536 2.420 173.759 1964 103.427 53.680 21.174 2.624 180.905 1965 114.882 47.765 22.451 2.956 188.054 1966 127.865 59.532 30.547 3.632 221.576 1967 139.211 55.304 27.609 4.788 226.912 1968 164.341 66.814 40.458 7.002 278.615 1969 241.542 62.891 39.433 5.627 349.493 1970 308.024 66.390 38.167 4.123 416.704 1971 395.266 72.378 37.643 4.336 509.623 1972 457.124 89.732 50.342 4.222 601.420 1973 557.692 106.318 64.818 6.400 735.228 1974 639.668 116.825 71.433 7.167 835.093 1975 661.332 118.314 69.901 8.931 858.478 1976 695.207 114.971 74.971 10.986 896.135 1977 678.824 71.861 90.247 12.038 852.970 1978 797.942 83.668 78.891 11.861 972.362 1979 828.733 95.957 78.706 11.529 1.014.925 1980 793.028 93.768 81.933 11.532 980.261 1981 447.608 68.000 55.938 9.179 580.725 1982 556.229 85.763 41.257 8.045 691.294 1983 608.499 78.085 34.573 6.575 727.732 1984 532.235 95.966 42.884 5.997 677.082 1985 602.069 98.306 55.664 7.141 763.180 1986 672.384 114.002 71.854 8.488 866.728 1987 410.260 103.372 56.385 10.068 580.085 1988 556.744 123.092 54.912 12.968 747.716 1989 566.582 137.380 48.178 9.485 761.625 1990 532.791 128.431 41.313 10.091 712.626 1991 583.072 129.535 41.464 16.865 770.936 1992 577.305 123.655 25.659 13.706 740.325 1993 850.562 161.746 37.769 11.390 1.061.467 1994 975.697 170.404 50.409 10.313 1.206.823 1995 1.106.591 180.939 56.963 14.839 1.359.332 1996 1.245.972 207.649 40.573 12.589 1.506.783 1997 1.361.106 212.741 52.305 14.091 1.640.243 1998 967.055 155.535 49.919 15.228 1.187.737 1999 898.584 122.051 46.906 10.674 1.078.215 2000 1.075.832 161.464 61.624 16.383 1.315.303 2001 1.176.557 159.375 70.509 16.525 1.422.966 2002 1.143.376 139.761 63.706 16.534 1.363.377 2003 1.121.462 152.775 64.688 15.882 1.354.807 2004 1.226.435 192.102 80.870 17.646 1.517.053 2005 1.325.498 208.461 77.366 15.358 1.626.683 2006 1.472.695 220.024 72.930 19.723 1.785.372 2007 1.790.212 277.111 95.170 23.152 2.185.645 2008 1.962.369 337.685 118.228 26.918 2.445.200 2009 2.160.421 362.893 106.486 22.566 2.652.366 2010 2.213.393 458.038 155.031 28.346 2.854.808 2011 2.068.317 503.519 168.931 34.580 2.775.347
Fontes/Sources: Abeiva, Anfavea, Denatran.Os dados até 2001 se referem a vendas internas no atacado. A partir de 2002, a licenciamento (Denatran/Renavam).Before 2002, the data refer to domestic wholesales of nationally manufactured vehicles. As from 2002, the figures relate to registration of new vehicles (Denatran/Renavan).
Unidades / Units
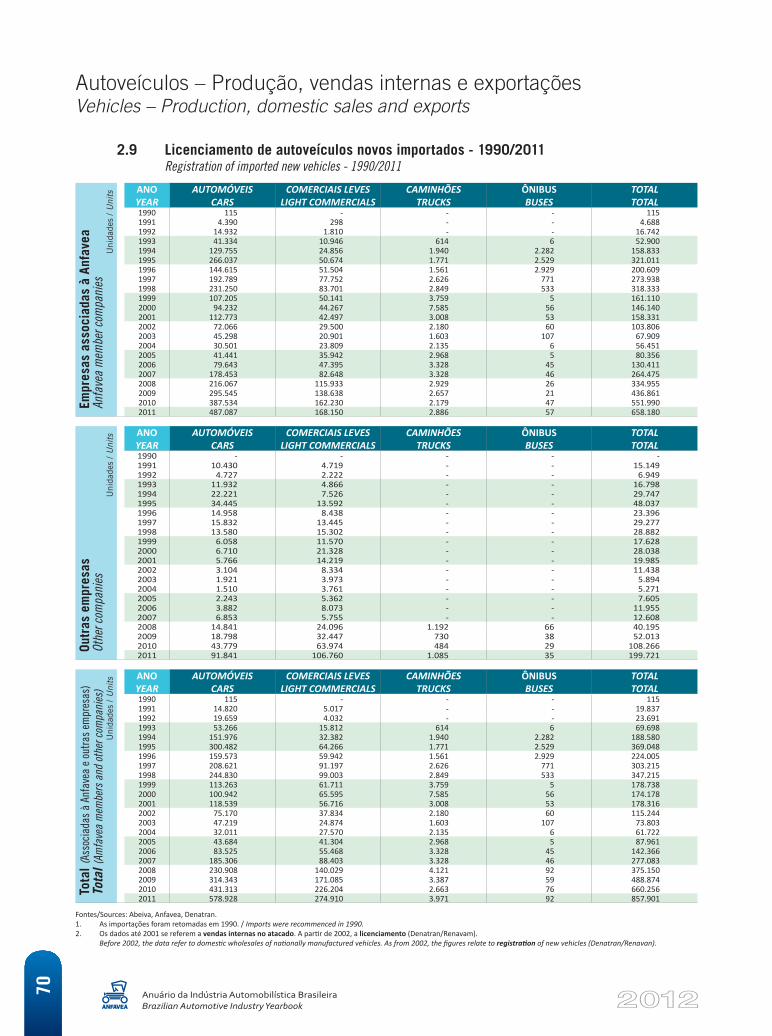
Autoveículos – Produção, vendas internas e exportaçõesVehicles – Production, domestic sales and exports
Anuário da Indústria Automobilística BrasileiraBrazilian Automotive Industry Yearbook
70
Empr
esas
ass
ocia
das
à An
fave
a
Anfa
vea
mem
ber c
ompa
nies
Uni
dade
s / U
nits ANO
YEARAUTOMÓVEIS
CARSCOMERCIAIS LEVES
LIGHT COMMERCIALSCAMINHÕES
TRUCKSÔNIBUS BUSES
TOTAL TOTAL
1990 115 - - - 115 1991 4.390 298 - - 4.688 1992 14.932 1.810 - - 16.742 1993 41.334 10.946 614 6 52.900 1994 129.755 24.856 1.940 2.282 158.833 1995 266.037 50.674 1.771 2.529 321.011 1996 144.615 51.504 1.561 2.929 200.609 1997 192.789 77.752 2.626 771 273.938 1998 231.250 83.701 2.849 533 318.333 1999 107.205 50.141 3.759 5 161.110 2000 94.232 44.267 7.585 56 146.140 2001 112.773 42.497 3.008 53 158.331 2002 72.066 29.500 2.180 60 103.806 2003 45.298 20.901 1.603 107 67.909 2004 30.501 23.809 2.135 6 56.451 2005 41.441 35.942 2.968 5 80.356 2006 79.643 47.395 3.328 45 130.411 2007 178.453 82.648 3.328 46 264.475 2008 216.067 115.933 2.929 26 334.955 2009 295.545 138.638 2.657 21 436.861 2010 387.534 162.230 2.179 47 551.990 2011 487.087 168.150 2.886 57 658.180
Outr
as e
mpr
esas
Ot
her c
ompa
nies
Uni
dade
s / U
nits ANO
YEARAUTOMÓVEIS
CARSCOMERCIAIS LEVES
LIGHT COMMERCIALSCAMINHÕES
TRUCKSÔNIBUS BUSES
TOTAL TOTAL
1990 - - - - - 1991 10.430 4.719 - - 15.149 1992 4.727 2.222 - - 6.949 1993 11.932 4.866 - - 16.798 1994 22.221 7.526 - - 29.747 1995 34.445 13.592 - - 48.037 1996 14.958 8.438 - - 23.396 1997 15.832 13.445 - - 29.277 1998 13.580 15.302 - - 28.882 1999 6.058 11.570 - - 17.628 2000 6.710 21.328 - - 28.038 2001 5.766 14.219 - - 19.985 2002 3.104 8.334 - - 11.438 2003 1.921 3.973 - - 5.894 2004 1.510 3.761 - - 5.271 2005 2.243 5.362 - - 7.605 2006 3.882 8.073 - - 11.955 2007 6.853 5.755 - - 12.608 2008 14.841 24.096 1.192 66 40.195 2009 18.798 32.447 730 38 52.013 2010 43.779 63.974 484 29 108.266 2011 91.841 106.760 1.085 35 199.721
Tota
l (As
soci
adas
à A
nfav
ea e
out
ras
empr
esas
)To
tal (
Amfa
vea
mem
bers
and
othe
r com
pani
es)
Uni
dade
s / U
nits ANO
YEARAUTOMÓVEIS
CARSCOMERCIAIS LEVES
LIGHT COMMERCIALSCAMINHÕES
TRUCKSÔNIBUS BUSES
TOTAL TOTAL
1990 115 - - - 115 1991 14.820 5.017 - - 19.837 1992 19.659 4.032 - - 23.691 1993 53.266 15.812 614 6 69.698 1994 151.976 32.382 1.940 2.282 188.580 1995 300.482 64.266 1.771 2.529 369.048 1996 159.573 59.942 1.561 2.929 224.005 1997 208.621 91.197 2.626 771 303.215 1998 244.830 99.003 2.849 533 347.215 1999 113.263 61.711 3.759 5 178.738 2000 100.942 65.595 7.585 56 174.178 2001 118.539 56.716 3.008 53 178.316 2002 75.170 37.834 2.180 60 115.244 2003 47.219 24.874 1.603 107 73.803 2004 32.011 27.570 2.135 6 61.722 2005 43.684 41.304 2.968 5 87.961 2006 83.525 55.468 3.328 45 142.366 2007 185.306 88.403 3.328 46 277.083 2008 230.908 140.029 4.121 92 375.150 2009 314.343 171.085 3.387 59 488.874 2010 431.313 226.204 2.663 76 660.256 2011 578.928 274.910 3.971 92 857.901
Fontes/Sources: Abeiva, Anfavea, Denatran.1. As importações foram retomadas em 1990. / Imports were recommenced in 1990.2. Os dados até 2001 se referem a vendas internas no atacado. A partir de 2002, a licenciamento (Denatran/Renavam).
Before 2002, the data refer to domestic wholesales of nationally manufactured vehicles. As from 2002, the figures relate to registration of new vehicles (Denatran/Renavan).
2.9 Licenciamento de autoveículos novos importados - 1990/2011 Registration of imported new vehicles - 1990/2011
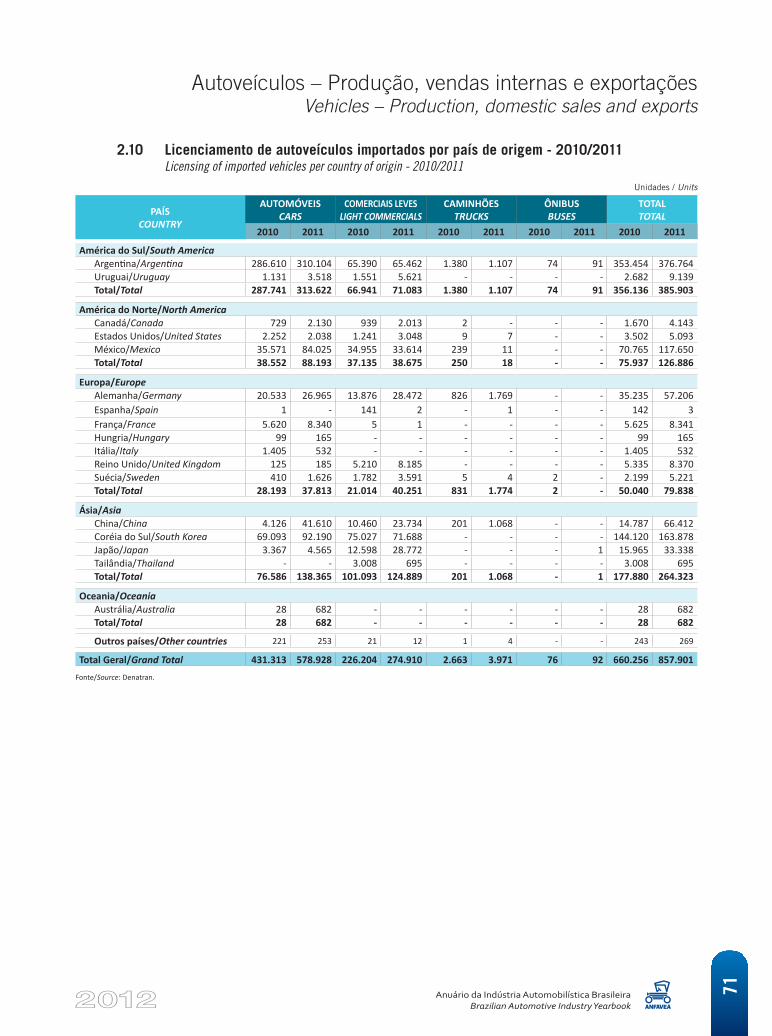
Autoveículos – Produção, vendas internas e exportaçõesVehicles – Production, domestic sales and exports
Anuário da Indústria Automobilística BrasileiraBrazilian Automotive Industry Yearbook
71
PAÍS COUNTRY
AUTOMÓVEIS CARS
COMERCIAIS LEVES LIGHT COMMERCIALS
CAMINHÕES TRUCKS
ÔNIBUS BUSES
TOTAL TOTAL
2010 2011 2010 2011 2010 2011 2010 2011 2010 2011
América do Sul/South AmericaArgentina/Argentina 286.610 310.104 65.390 65.462 1.380 1.107 74 91 353.454 376.764 Uruguai/Uruguay 1.131 3.518 1.551 5.621 - - - - 2.682 9.139 Total/Total 287.741 313.622 66.941 71.083 1.380 1.107 74 91 356.136 385.903
América do Norte/North AmericaCanadá/Canada 729 2.130 939 2.013 2 - - - 1.670 4.143 Estados Unidos/United States 2.252 2.038 1.241 3.048 9 7 - - 3.502 5.093 México/Mexico 35.571 84.025 34.955 33.614 239 11 - - 70.765 117.650 Total/Total 38.552 88.193 37.135 38.675 250 18 - - 75.937 126.886
Europa/EuropeAlemanha/Germany 20.533 26.965 13.876 28.472 826 1.769 - - 35.235 57.206 Espanha/Spain 1 - 141 2 - 1 - - 142 3 França/France 5.620 8.340 5 1 - - - - 5.625 8.341 Hungria/Hungary 99 165 - - - - - - 99 165 Itália/Italy 1.405 532 - - - - - - 1.405 532 Reino Unido/United Kingdom 125 185 5.210 8.185 - - - - 5.335 8.370 Suécia/Sweden 410 1.626 1.782 3.591 5 4 2 - 2.199 5.221 Total/Total 28.193 37.813 21.014 40.251 831 1.774 2 - 50.040 79.838
Ásia/AsiaChina/China 4.126 41.610 10.460 23.734 201 1.068 - - 14.787 66.412 Coréia do Sul/South Korea 69.093 92.190 75.027 71.688 - - - - 144.120 163.878 Japão/Japan 3.367 4.565 12.598 28.772 - - - 1 15.965 33.338 Tailândia/Thailand - - 3.008 695 - - - - 3.008 695 Total/Total 76.586 138.365 101.093 124.889 201 1.068 - 1 177.880 264.323
Oceania/OceaniaAustrália/Australia 28 682 - - - - - - 28 682 Total/Total 28 682 - - - - - - 28 682
Outros países/Other countries 221 253 21 12 1 4 - - 243 269
Total Geral/Grand Total 431.313 578.928 226.204 274.910 2.663 3.971 76 92 660.256 857.901 Fonte/Source: Denatran.
2.10 Licenciamento de autoveículos importados por país de origem - 2010/2011 Licensing of imported vehicles per country of origin - 2010/2011
Unidades / Units
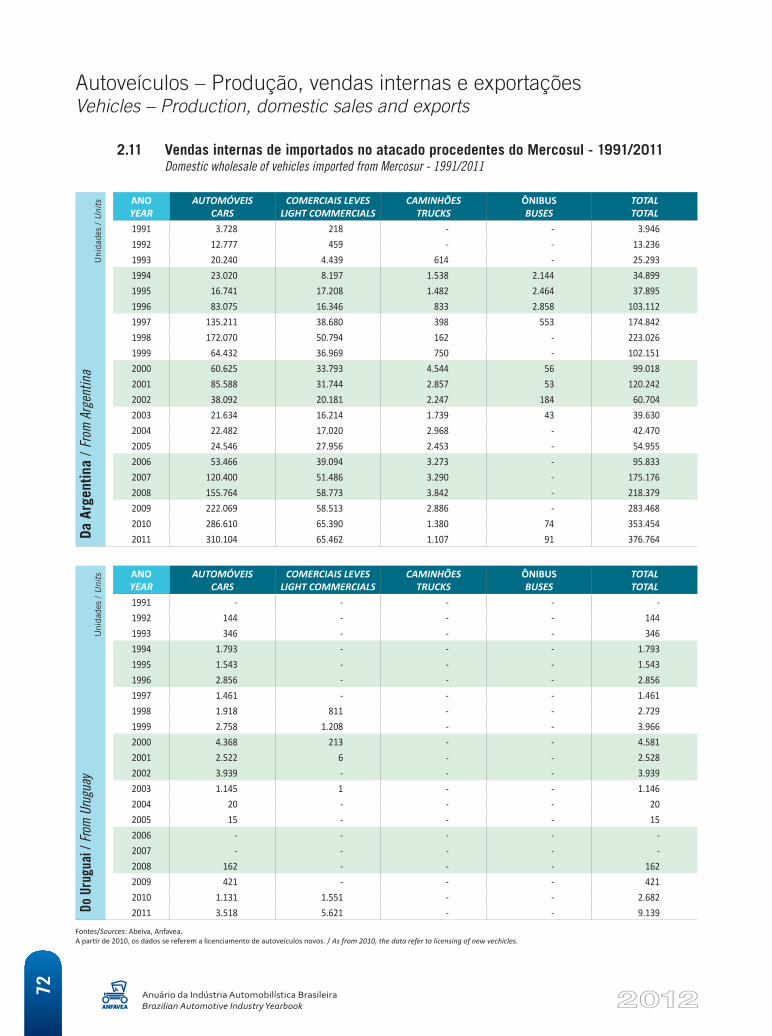
Autoveículos – Produção, vendas internas e exportaçõesVehicles – Production, domestic sales and exports
Anuário da Indústria Automobilística BrasileiraBrazilian Automotive Industry Yearbook
72
Da A
rgen
tina
/ Fro
m A
rgen
tina
Uni
dade
s / U
nits ANO
YEARAUTOMÓVEIS
CARSCOMERCIAIS LEVES
LIGHT COMMERCIALSCAMINHÕES
TRUCKSÔNIBUS BUSES
TOTAL TOTAL
1991 3.728 218 - - 3.946 1992 12.777 459 - - 13.236 1993 20.240 4.439 614 - 25.293 1994 23.020 8.197 1.538 2.144 34.899 1995 16.741 17.208 1.482 2.464 37.895 1996 83.075 16.346 833 2.858 103.112 1997 135.211 38.680 398 553 174.842 1998 172.070 50.794 162 - 223.026 1999 64.432 36.969 750 - 102.151 2000 60.625 33.793 4.544 56 99.018 2001 85.588 31.744 2.857 53 120.242 2002 38.092 20.181 2.247 184 60.704 2003 21.634 16.214 1.739 43 39.630 2004 22.482 17.020 2.968 - 42.470 2005 24.546 27.956 2.453 - 54.955 2006 53.466 39.094 3.273 - 95.833 2007 120.400 51.486 3.290 - 175.176 2008 155.764 58.773 3.842 - 218.379 2009 222.069 58.513 2.886 - 283.468 2010 286.610 65.390 1.380 74 353.454 2011 310.104 65.462 1.107 91 376.764
Do U
rugu
ai /
From
Uru
guay
Uni
dade
s / U
nits ANO
YEARAUTOMÓVEIS
CARSCOMERCIAIS LEVES
LIGHT COMMERCIALSCAMINHÕES
TRUCKSÔNIBUS BUSES
TOTAL TOTAL
1991 - - - - - 1992 144 - - - 144 1993 346 - - - 346 1994 1.793 - - - 1.793 1995 1.543 - - - 1.543 1996 2.856 - - - 2.856 1997 1.461 - - - 1.461 1998 1.918 811 - - 2.729 1999 2.758 1.208 - - 3.966 2000 4.368 213 - - 4.581 2001 2.522 6 - - 2.528 2002 3.939 - - - 3.939 2003 1.145 1 - - 1.146 2004 20 - - - 20 2005 15 - - - 15 2006 - - - - - 2007 - - - - - 2008 162 - - - 162 2009 421 - - - 421 2010 1.131 1.551 - - 2.682 2011 3.518 5.621 - - 9.139
Fontes/Sources: Abeiva, Anfavea. A partir de 2010, os dados se referem a licenciamento de autoveículos novos. / As from 2010, the data refer to licensing of new vechicles.
2.11 Vendas internas de importados no atacado procedentes do Mercosul - 1991/2011 Domestic wholesale of vehicles imported from Mercosur - 1991/2011
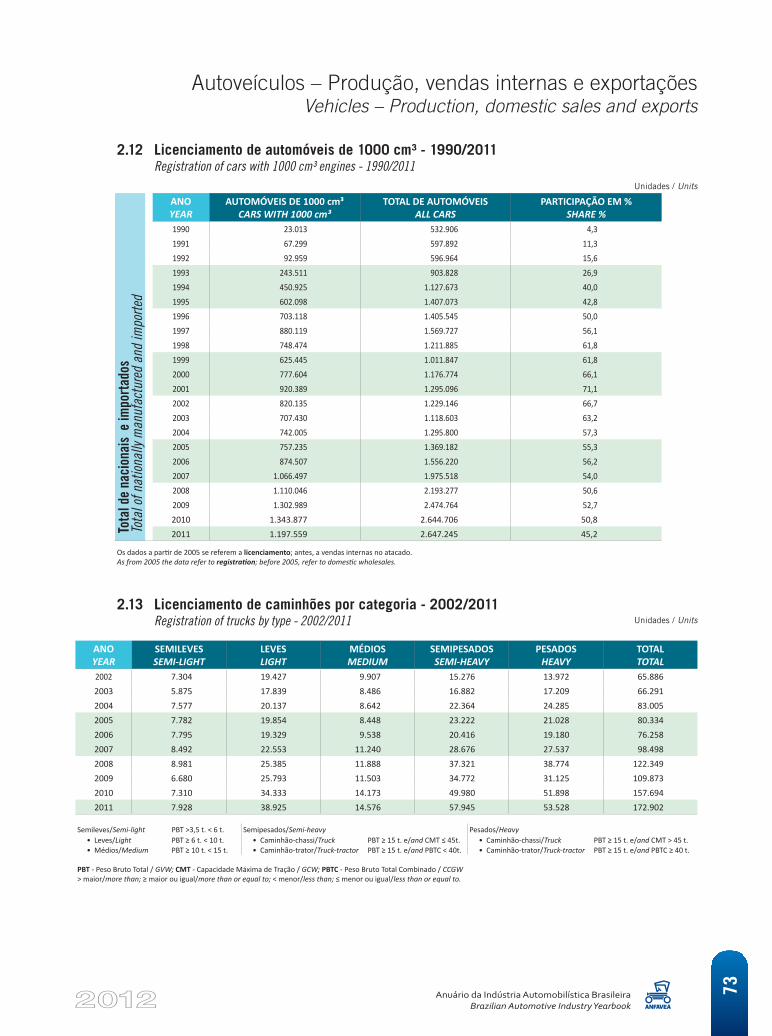
Autoveículos – Produção, vendas internas e exportaçõesVehicles – Production, domestic sales and exports
Anuário da Indústria Automobilística BrasileiraBrazilian Automotive Industry Yearbook
73
Tota
l de
naci
onai
s e
impo
rtad
os
Tota
l of n
ation
ally
man
ufac
ture
d an
d im
porte
d
ANO YEAR
AUTOMÓVEIS DE 1000 cm³ CARS WITH 1000 cm³
TOTAL DE AUTOMÓVEIS ALL CARS
PARTICIPAÇÃO EM % SHARE %
1990 23.013 532.906 4,3 1991 67.299 597.892 11,3 1992 92.959 596.964 15,6 1993 243.511 903.828 26,9 1994 450.925 1.127.673 40,0 1995 602.098 1.407.073 42,8 1996 703.118 1.405.545 50,0 1997 880.119 1.569.727 56,1 1998 748.474 1.211.885 61,8 1999 625.445 1.011.847 61,8 2000 777.604 1.176.774 66,1 2001 920.389 1.295.096 71,1 2002 820.135 1.229.146 66,7 2003 707.430 1.118.603 63,2 2004 742.005 1.295.800 57,3 2005 757.235 1.369.182 55,3 2006 874.507 1.556.220 56,2 2007 1.066.497 1.975.518 54,0 2008 1.110.046 2.193.277 50,6 2009 1.302.989 2.474.764 52,7 2010 1.343.877 2.644.706 50,8 2011 1.197.559 2.647.245 45,2
Os dados a partir de 2005 se referem a licenciamento; antes, a vendas internas no atacado. As from 2005 the data refer to registration; before 2005, refer to domestic wholesales.
Unidades / Units
2.12 Licenciamento de automóveis de 1000 cm³ - 1990/2011 Registration of cars with 1000 cm³ engines - 1990/2011
ANO YEAR
SEMILEVES SEMI-LIGHT
LEVES LIGHT
MÉDIOS MEDIUM
SEMIPESADOS SEMI-HEAVY
PESADOSHEAVY
TOTAL TOTAL
2002 7.304 19.427 9.907 15.276 13.972 65.886 2003 5.875 17.839 8.486 16.882 17.209 66.291 2004 7.577 20.137 8.642 22.364 24.285 83.005 2005 7.782 19.854 8.448 23.222 21.028 80.334 2006 7.795 19.329 9.538 20.416 19.180 76.258 2007 8.492 22.553 11.240 28.676 27.537 98.498 2008 8.981 25.385 11.888 37.321 38.774 122.349 2009 6.680 25.793 11.503 34.772 31.125 109.873 2010 7.310 34.333 14.173 49.980 51.898 157.694 2011 7.928 38.925 14.576 57.945 53.528 172.902
Semileves/Semi-light PBT >3,5 t. < 6 t. Semipesados/Semi-heavy Pesados/Heavy• Leves/Light PBT ≥ 6 t. < 10 t. • Caminhão-chassi/Truck PBT ≥ 15 t. e/and CMT ≤ 45t. • Caminhão-chassi/Truck PBT ≥ 15 t. e/and CMT > 45 t.• Médios/Medium PBT ≥ 10 t. < 15 t. • Caminhão-trator/Truck-tractor PBT ≥ 15 t. e/and PBTC < 40t. • Caminhão-trator/Truck-tractor PBT ≥ 15 t. e/and PBTC ≥ 40 t.
PBT - Peso Bruto Total / GVW; CMT - Capacidade Máxima de Tração / GCW; PBTC - Peso Bruto Total Combinado / CCGW > maior/more than; ≥ maior ou igual/more than or equal to; < menor/less than; ≤ menor ou igual/less than or equal to.
Unidades / Units
2.13 Licenciamento de caminhões por categoria - 2002/2011 Registration of trucks by type - 2002/2011
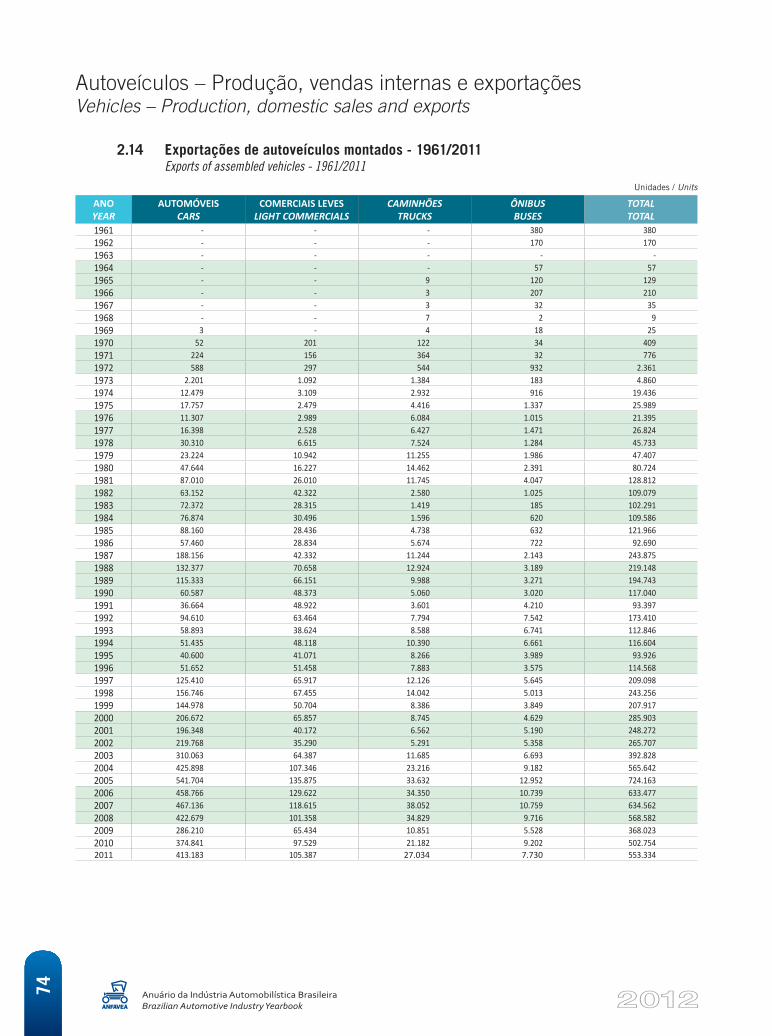
Autoveículos – Produção, vendas internas e exportaçõesVehicles – Production, domestic sales and exports
Anuário da Indústria Automobilística BrasileiraBrazilian Automotive Industry Yearbook
74
ANO YEAR
AUTOMÓVEIS CARS
COMERCIAIS LEVES LIGHT COMMERCIALS
CAMINHÕES TRUCKS
ÔNIBUS BUSES
TOTAL TOTAL
1961 - - - 380 380 1962 - - - 170 170 1963 - - - - - 1964 - - - 57 57 1965 - - 9 120 129 1966 - - 3 207 210 1967 - - 3 32 35 1968 - - 7 2 9 1969 3 - 4 18 25 1970 52 201 122 34 409 1971 224 156 364 32 776 1972 588 297 544 932 2.361 1973 2.201 1.092 1.384 183 4.860 1974 12.479 3.109 2.932 916 19.436 1975 17.757 2.479 4.416 1.337 25.989 1976 11.307 2.989 6.084 1.015 21.395 1977 16.398 2.528 6.427 1.471 26.824 1978 30.310 6.615 7.524 1.284 45.733 1979 23.224 10.942 11.255 1.986 47.407 1980 47.644 16.227 14.462 2.391 80.724 1981 87.010 26.010 11.745 4.047 128.812 1982 63.152 42.322 2.580 1.025 109.079 1983 72.372 28.315 1.419 185 102.291 1984 76.874 30.496 1.596 620 109.586 1985 88.160 28.436 4.738 632 121.966 1986 57.460 28.834 5.674 722 92.690 1987 188.156 42.332 11.244 2.143 243.875 1988 132.377 70.658 12.924 3.189 219.148 1989 115.333 66.151 9.988 3.271 194.743 1990 60.587 48.373 5.060 3.020 117.040 1991 36.664 48.922 3.601 4.210 93.397 1992 94.610 63.464 7.794 7.542 173.410 1993 58.893 38.624 8.588 6.741 112.846 1994 51.435 48.118 10.390 6.661 116.604 1995 40.600 41.071 8.266 3.989 93.926 1996 51.652 51.458 7.883 3.575 114.568 1997 125.410 65.917 12.126 5.645 209.098 1998 156.746 67.455 14.042 5.013 243.256 1999 144.978 50.704 8.386 3.849 207.917 2000 206.672 65.857 8.745 4.629 285.903 2001 196.348 40.172 6.562 5.190 248.272 2002 219.768 35.290 5.291 5.358 265.707 2003 310.063 64.387 11.685 6.693 392.828 2004 425.898 107.346 23.216 9.182 565.642 2005 541.704 135.875 33.632 12.952 724.163 2006 458.766 129.622 34.350 10.739 633.477 2007 467.136 118.615 38.052 10.759 634.562 2008 422.679 101.358 34.829 9.716 568.582 2009 286.210 65.434 10.851 5.528 368.023 2010 374.841 97.529 21.182 9.202 502.754 2011 413.183 105.387 27.034 7.730 553.334
2.14 Exportações de autoveículos montados - 1961/2011 Exports of assembled vehicles - 1961/2011
Unidades / Units
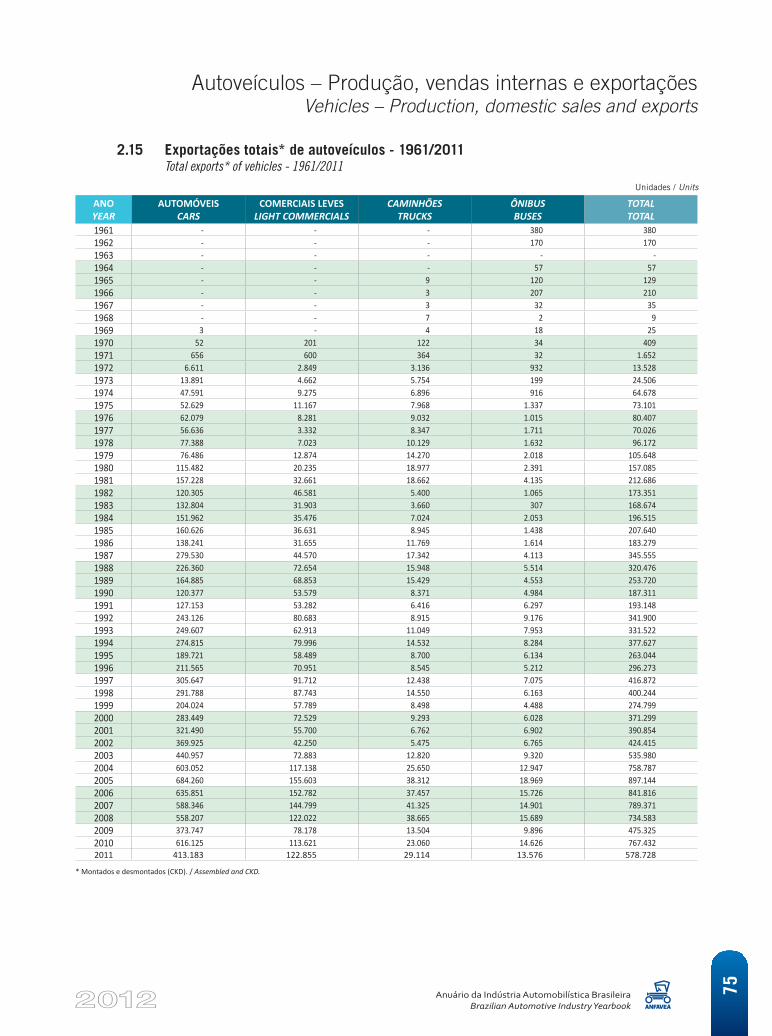
Autoveículos – Produção, vendas internas e exportaçõesVehicles – Production, domestic sales and exports
Anuário da Indústria Automobilística BrasileiraBrazilian Automotive Industry Yearbook
75
ANO YEAR
AUTOMÓVEIS CARS
COMERCIAIS LEVES LIGHT COMMERCIALS
CAMINHÕES TRUCKS
ÔNIBUS BUSES
TOTAL TOTAL
1961 - - - 380 380 1962 - - - 170 170 1963 - - - - - 1964 - - - 57 57 1965 - - 9 120 129 1966 - - 3 207 210 1967 - - 3 32 35 1968 - - 7 2 9 1969 3 - 4 18 25 1970 52 201 122 34 409 1971 656 600 364 32 1.652 1972 6.611 2.849 3.136 932 13.528 1973 13.891 4.662 5.754 199 24.506 1974 47.591 9.275 6.896 916 64.678 1975 52.629 11.167 7.968 1.337 73.101 1976 62.079 8.281 9.032 1.015 80.407 1977 56.636 3.332 8.347 1.711 70.026 1978 77.388 7.023 10.129 1.632 96.172 1979 76.486 12.874 14.270 2.018 105.648 1980 115.482 20.235 18.977 2.391 157.085 1981 157.228 32.661 18.662 4.135 212.686 1982 120.305 46.581 5.400 1.065 173.351 1983 132.804 31.903 3.660 307 168.674 1984 151.962 35.476 7.024 2.053 196.515 1985 160.626 36.631 8.945 1.438 207.640 1986 138.241 31.655 11.769 1.614 183.279 1987 279.530 44.570 17.342 4.113 345.555 1988 226.360 72.654 15.948 5.514 320.476 1989 164.885 68.853 15.429 4.553 253.720 1990 120.377 53.579 8.371 4.984 187.311 1991 127.153 53.282 6.416 6.297 193.148 1992 243.126 80.683 8.915 9.176 341.900 1993 249.607 62.913 11.049 7.953 331.522 1994 274.815 79.996 14.532 8.284 377.627 1995 189.721 58.489 8.700 6.134 263.044 1996 211.565 70.951 8.545 5.212 296.273 1997 305.647 91.712 12.438 7.075 416.872 1998 291.788 87.743 14.550 6.163 400.244 1999 204.024 57.789 8.498 4.488 274.799 2000 283.449 72.529 9.293 6.028 371.299 2001 321.490 55.700 6.762 6.902 390.854 2002 369.925 42.250 5.475 6.765 424.415 2003 440.957 72.883 12.820 9.320 535.980 2004 603.052 117.138 25.650 12.947 758.787 2005 684.260 155.603 38.312 18.969 897.144 2006 635.851 152.782 37.457 15.726 841.816 2007 588.346 144.799 41.325 14.901 789.371 2008 558.207 122.022 38.665 15.689 734.583 2009 373.747 78.178 13.504 9.896 475.325 2010 616.125 113.621 23.060 14.626 767.432 2011 413.183 122.855 29.114 13.576 578.728
* Montados e desmontados (CKD). / Assembled and CKD.
2.15 Exportações totais* de autoveículos - 1961/2011 Total exports* of vehicles - 1961/2011
Unidades / Units
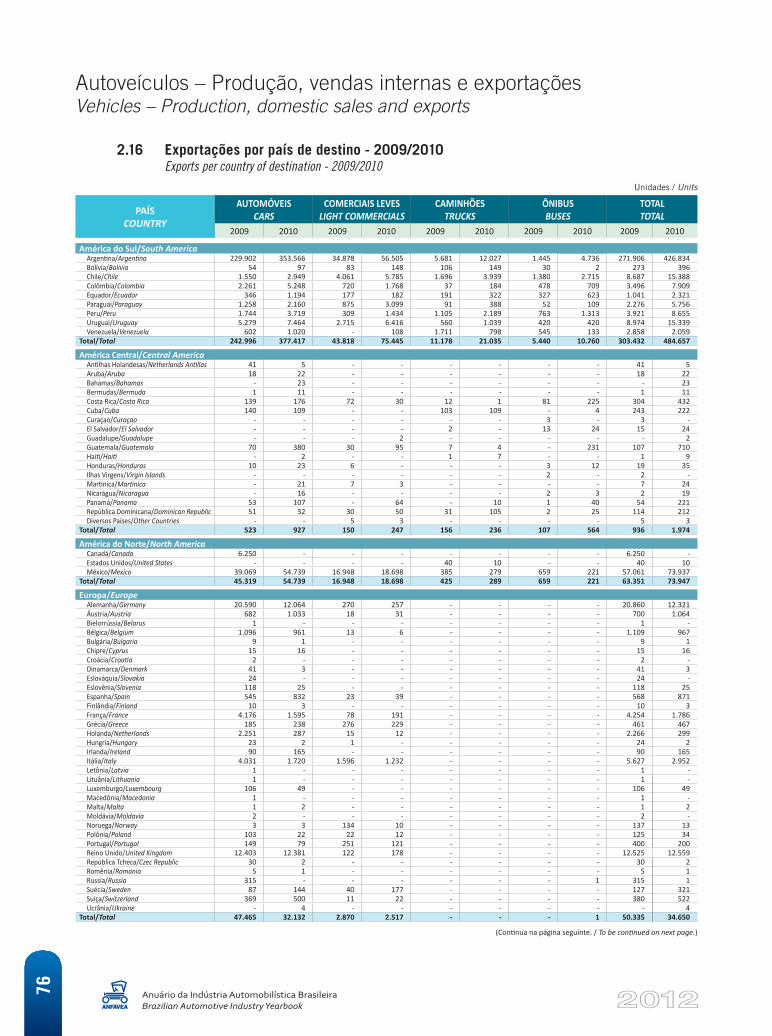
Autoveículos – Produção, vendas internas e exportaçõesVehicles – Production, domestic sales and exports
Anuário da Indústria Automobilística BrasileiraBrazilian Automotive Industry Yearbook
76
(Continua na página seguinte. / To be continued on next page.)
PAÍS COUNTRY
AUTOMÓVEIS CARS
COMERCIAIS LEVES LIGHT COMMERCIALS
CAMINHÕES TRUCKS
ÔNIBUS BUSES
TOTAL TOTAL
2009 2010 2009 2010 2009 2010 2009 2010 2009 2010
América do Sul/South AmericaArgentina/Argentina 229.902 353.566 34.878 56.505 5.681 12.027 1.445 4.736 271.906 426.834 Bolívia/Bolivia 54 97 83 148 106 149 30 2 273 396 Chile/Chile 1.550 2.949 4.061 5.785 1.696 3.939 1.380 2.715 8.687 15.388 Colômbia/Colombia 2.261 5.248 720 1.768 37 184 478 709 3.496 7.909 Equador/Ecuador 346 1.194 177 182 191 322 327 623 1.041 2.321 Paraguai/Paraguay 1.258 2.160 875 3.099 91 388 52 109 2.276 5.756 Peru/Peru 1.744 3.719 309 1.434 1.105 2.189 763 1.313 3.921 8.655 Uruguai/Uruguay 5.279 7.464 2.715 6.416 560 1.039 420 420 8.974 15.339 Venezuela/Venezuela 602 1.020 - 108 1.711 798 545 133 2.858 2.059
Total/Total 242.996 377.417 43.818 75.445 11.178 21.035 5.440 10.760 303.432 484.657
América Central/Central AmericaAntilhas Holandesas/Netherlands Antillas 41 5 - - - - - - 41 5 Aruba/Aruba 18 22 - - - - - - 18 22 Bahamas/Bahamas - 23 - - - - - - - 23 Bermudas/Bermuda 1 11 - - - - - - 1 11 Costa Rica/Costa Rica 139 176 72 30 12 1 81 225 304 432 Cuba/Cuba 140 109 - - 103 109 - 4 243 222 Curaçao/Curaçao - - - - - - 3 - 3 - El Salvador/El Salvador - - - - 2 - 13 24 15 24 Guadalupe/Guadalupe - - - 2 - - - - - 2 Guatemala/Guatemala 70 380 30 95 7 4 - 231 107 710 Haiti/Haiti - 2 - - 1 7 - - 1 9 Honduras/Honduras 10 23 6 - - - 3 12 19 35 Ilhas Virgens/Virgin Islands - - - - - - 2 - 2 - Martinica/Martinica - 21 7 3 - - - - 7 24 Nicarágua/Nicaragua - 16 - - - - 2 3 2 19 Panamá/Panama 53 107 - 64 - 10 1 40 54 221 República Dominicana/Dominican Republic 51 32 30 50 31 105 2 25 114 212 Diversos Países/Other Countries - - 5 3 - - - - 5 3
Total/Total 523 927 150 247 156 236 107 564 936 1.974
América do Norte/North AmericaCanadá/Canada 6.250 - - - - - - - 6.250 - Estados Unidos/United States - - - - 40 10 - - 40 10 México/Mexico 39.069 54.739 16.948 18.698 385 279 659 221 57.061 73.937
Total/Total 45.319 54.739 16.948 18.698 425 289 659 221 63.351 73.947
Europa/EuropeAlemanha/Germany 20.590 12.064 270 257 - - - - 20.860 12.321 Áustria/Austria 682 1.033 18 31 - - - - 700 1.064 Bielorrússia/Belarus 1 - - - - - - - 1 - Bélgica/Belgium 1.096 961 13 6 - - - - 1.109 967 Bulgária/Bulgaria 9 1 - - - - - - 9 1 Chipre/Cyprus 15 16 - - - - - - 15 16 Croácia/Croatia 2 - - - - - - - 2 - Dinamarca/Denmark 41 3 - - - - - - 41 3 Eslováquia/Slovakia 24 - - - - - - - 24 - Eslovênia/Slovenia 118 25 - - - - - - 118 25 Espanha/Spain 545 832 23 39 - - - - 568 871 Finlândia/Finland 10 3 - - - - - - 10 3 França/France 4.176 1.595 78 191 - - - - 4.254 1.786 Grécia/Greece 185 238 276 229 - - - - 461 467 Holanda/Netherlands 2.251 287 15 12 - - - - 2.266 299 Hungria/Hungary 23 2 1 - - - - - 24 2 Irlanda/Ireland 90 165 - - - - - - 90 165 Itália/Italy 4.031 1.720 1.596 1.232 - - - - 5.627 2.952 Letônia/Latvia 1 - - - - - - - 1 - Lituânia/Lithuania 1 - - - - - - - 1 - Luxemburgo/Luxembourg 106 49 - - - - - - 106 49 Macedônia/Macedonia 1 - - - - - - - 1 - Malta/Malta 1 2 - - - - - - 1 2 Moldávia/Moldavia 2 - - - - - - - 2 - Noruega/Norway 3 3 134 10 - - - - 137 13 Polônia/Poland 103 22 22 12 - - - - 125 34 Portugal/Portugal 149 79 251 121 - - - - 400 200 Reino Unido/United Kingdom 12.403 12.381 122 178 - - - - 12.525 12.559 República Tcheca/Czec Republic 30 2 - - - - - - 30 2 Romênia/Romania 5 1 - - - - - - 5 1 Rússia/Russia 315 - - - - - - 1 315 1 Suécia/Sweden 87 144 40 177 - - - - 127 321 Suíça/Switzerland 369 500 11 22 - - - - 380 522 Ucrânia/Ukraine - 4 - - - - - - - 4
Total/Total 47.465 32.132 2.870 2.517 - - - 1 50.335 34.650
2.16 Exportações por país de destino - 2009/2010 Exports per country of destination - 2009/2010
Unidades / Units
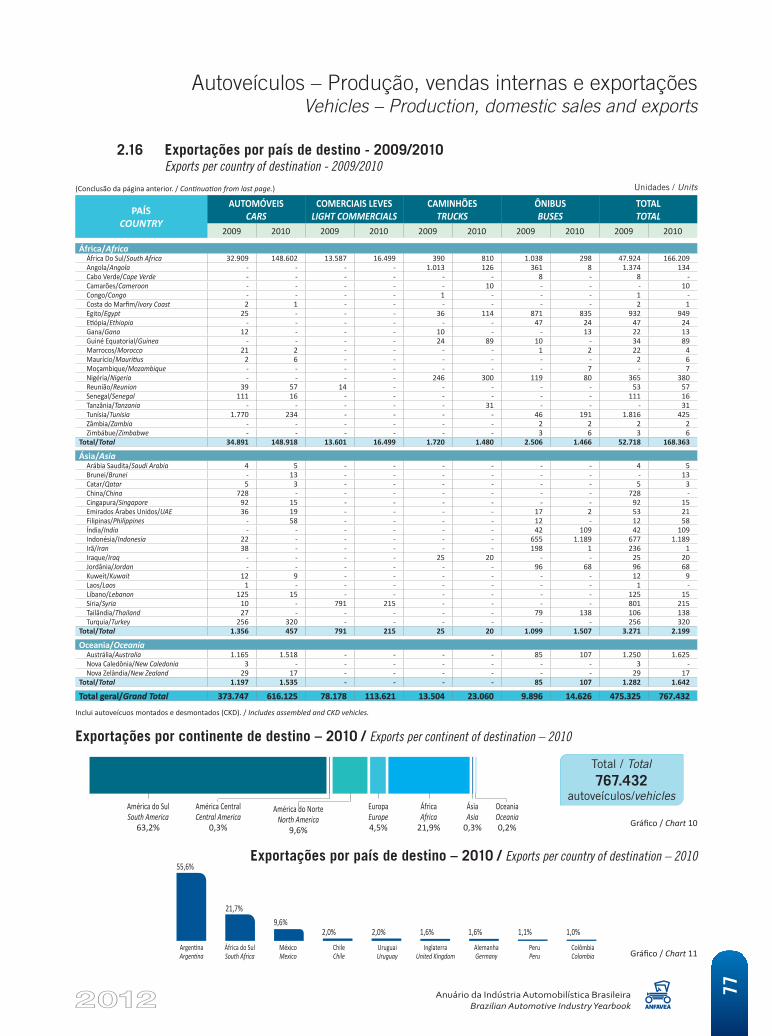
Autoveículos – Produção, vendas internas e exportaçõesVehicles – Production, domestic sales and exports
Anuário da Indústria Automobilística BrasileiraBrazilian Automotive Industry Yearbook
77
(Conclusão da página anterior. / Continuation from last page.)
Inclui autoveícuos montados e desmontados (CKD). / Includes assembled and CKD vehicles.
PAÍS COUNTRY
AUTOMÓVEIS CARS
COMERCIAIS LEVES LIGHT COMMERCIALS
CAMINHÕES TRUCKS
ÔNIBUS BUSES
TOTAL TOTAL
2009 2010 2009 2010 2009 2010 2009 2010 2009 2010
África/AfricaÁfrica Do Sul/South Africa 32.909 148.602 13.587 16.499 390 810 1.038 298 47.924 166.209 Angola/Angola - - - - 1.013 126 361 8 1.374 134 Cabo Verde/Cape Verde - - - - - - 8 - 8 - Camarões/Cameroon - - - - - 10 - - - 10 Congo/Congo - - - - 1 - - - 1 - Costa do Marfim/Ivory Coast 2 1 - - - - - - 2 1 Egito/Egypt 25 - - - 36 114 871 835 932 949 Etiópia/Ethiopia - - - - - - 47 24 47 24 Gana/Gana 12 - - - 10 - - 13 22 13 Guiné Equatorial/Guinea - - - - 24 89 10 - 34 89 Marrocos/Morocco 21 2 - - - - 1 2 22 4 Maurício/Mauritius 2 6 - - - - - - 2 6 Moçambique/Mozambique - - - - - - - 7 - 7 Nigéria/Nigeria - - - - 246 300 119 80 365 380 Reunião/Reunion 39 57 14 - - - - - 53 57 Senegal/Senegal 111 16 - - - - - - 111 16 Tanzânia/Tanzania - - - - - 31 - - - 31 Tunísia/Tunisia 1.770 234 - - - - 46 191 1.816 425 Zâmbia/Zambia - - - - - - 2 2 2 2 Zimbábue/Zimbabwe - - - - - - 3 6 3 6
Total/Total 34.891 148.918 13.601 16.499 1.720 1.480 2.506 1.466 52.718 168.363
Ásia/AsiaArábia Saudita/Saudi Arabia 4 5 - - - - - - 4 5 Brunei/Brunei - 13 - - - - - - - 13 Catar/Qatar 5 3 - - - - - - 5 3 China/China 728 - - - - - - - 728 - Cingapura/Singapore 92 15 - - - - - - 92 15 Emirados Árabes Unidos/UAE 36 19 - - - - 17 2 53 21 Filipinas/Philippines - 58 - - - - 12 - 12 58 Índia/India - - - - - - 42 109 42 109 Indonésia/Indonesia 22 - - - - - 655 1.189 677 1.189 Irã/Iran 38 - - - - - 198 1 236 1 Iraque/Iraq - - - - 25 20 - - 25 20 Jordânia/Jordan - - - - - - 96 68 96 68 Kuweit/Kuwait 12 9 - - - - - - 12 9 Laos/Laos 1 - - - - - - - 1 - Líbano/Lebanon 125 15 - - - - - - 125 15 Síria/Syria 10 - 791 215 - - - - 801 215 Tailândia/Thailand 27 - - - - - 79 138 106 138 Turquia/Turkey 256 320 - - - - - - 256 320
Total/Total 1.356 457 791 215 25 20 1.099 1.507 3.271 2.199
Oceania/OceaniaAustrália/Australia 1.165 1.518 - - - - 85 107 1.250 1.625 Nova Caledônia/New Caledonia 3 - - - - - - - 3 - Nova Zelândia/New Zealand 29 17 - - - - - - 29 17
Total/Total 1.197 1.535 - - - - 85 107 1.282 1.642
Total geral/Grand Total 373.747 616.125 78.178 113.621 13.504 23.060 9.896 14.626 475.325 767.432
2.16 Exportações por país de destino - 2009/2010 Exports per country of destination - 2009/2010
Unidades / Units
Exportações por continente de destino – 2010 / Exports per continent of destination – 2010
Gráfico / Chart 10
Gráfico / Chart 11
América do SulSouth America
63,2%
América CentralCentral America
0,3%
América do NorteNorth America
9,6%
EuropaEurope4,5%
ÁfricaAfrica
21,9%
ÁsiaAsia
0,3%
OceaniaOceania0,2%
Total / Total767.432
autoveículos/vehicles
Exportações por país de destino – 2010 / Exports per country of destination – 2010
ArgentinaArgentina
ChileChile
AlemanhaGermany
África do SulSouth Africa
UruguaiUruguay
PeruPeru
MéxicoMexico
InglaterraUnited Kingdom
ColômbiaColombia
55,6%
21,7%9,6%
2,0% 2,0% 1,6% 1,6% 1,1% 1,0%
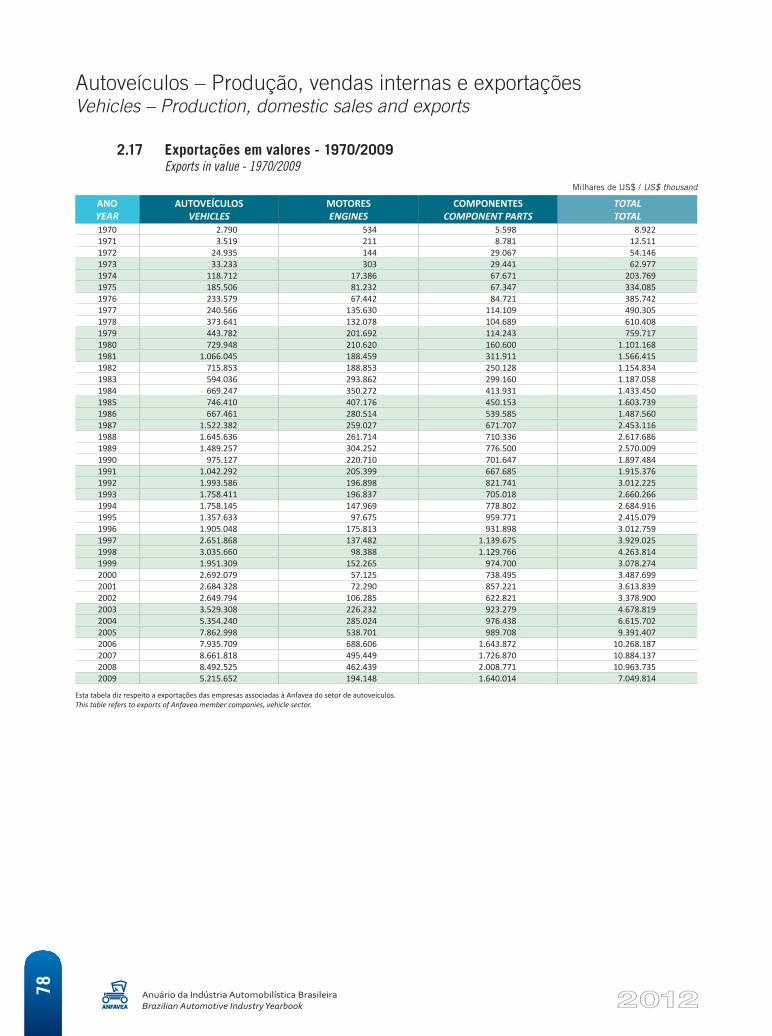
Autoveículos – Produção, vendas internas e exportaçõesVehicles – Production, domestic sales and exports
Anuário da Indústria Automobilística BrasileiraBrazilian Automotive Industry Yearbook
78
ANO YEAR
AUTOVEÍCULOS VEHICLES
MOTORES ENGINES
COMPONENTES COMPONENT PARTS
TOTAL TOTAL
1970 2.790 534 5.598 8.9221971 3.519 211 8.781 12.5111972 24.935 144 29.067 54.1461973 33.233 303 29.441 62.9771974 118.712 17.386 67.671 203.7691975 185.506 81.232 67.347 334.0851976 233.579 67.442 84.721 385.7421977 240.566 135.630 114.109 490.3051978 373.641 132.078 104.689 610.4081979 443.782 201.692 114.243 759.7171980 729.948 210.620 160.600 1.101.1681981 1.066.045 188.459 311.911 1.566.4151982 715.853 188.853 250.128 1.154.8341983 594.036 293.862 299.160 1.187.0581984 669.247 350.272 413.931 1.433.4501985 746.410 407.176 450.153 1.603.7391986 667.461 280.514 539.585 1.487.5601987 1.522.382 259.027 671.707 2.453.1161988 1.645.636 261.714 710.336 2.617.6861989 1.489.257 304.252 776.500 2.570.0091990 975.127 220.710 701.647 1.897.4841991 1.042.292 205.399 667.685 1.915.3761992 1.993.586 196.898 821.741 3.012.2251993 1.758.411 196.837 705.018 2.660.2661994 1.758.145 147.969 778.802 2.684.9161995 1.357.633 97.675 959.771 2.415.0791996 1.905.048 175.813 931.898 3.012.7591997 2.651.868 137.482 1.139.675 3.929.0251998 3.035.660 98.388 1.129.766 4.263.8141999 1.951.309 152.265 974.700 3.078.2742000 2.692.079 57.125 738.495 3.487.6992001 2.684.328 72.290 857.221 3.613.8392002 2.649.794 106.285 622.821 3.378.9002003 3.529.308 226.232 923.279 4.678.8192004 5.354.240 285.024 976.438 6.615.7022005 7.862.998 538.701 989.708 9.391.4072006 7.935.709 688.606 1.643.872 10.268.1872007 8.661.818 495.449 1.726.870 10.884.1372008 8.492.525 462.439 2.008.771 10.963.7352009 5.215.652 194.148 1.640.014 7.049.814
Esta tabela diz respeito a exportações das empresas associadas à Anfavea do setor de autoveículos.This table refers to exports of Anfavea member companies, vehicle sector.
2.17 Exportações em valores - 1970/2009 Exports in value - 1970/2009
Milhares de US$ / US$ thousand
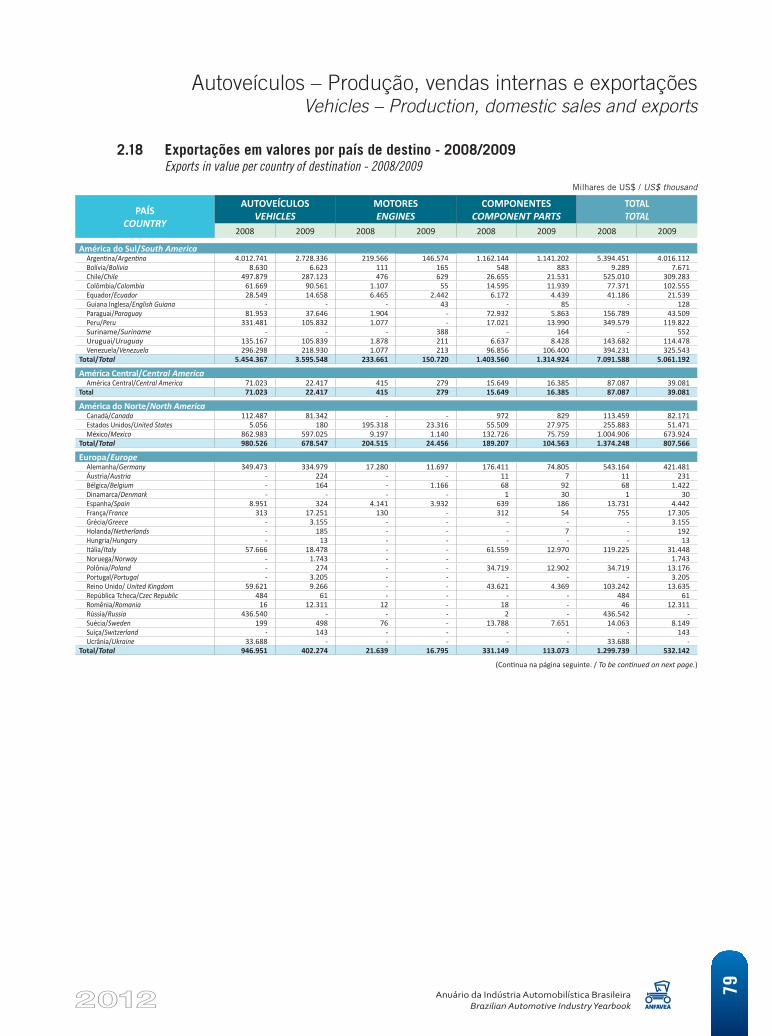
Autoveículos – Produção, vendas internas e exportaçõesVehicles – Production, domestic sales and exports
Anuário da Indústria Automobilística BrasileiraBrazilian Automotive Industry Yearbook
79
(Continua na página seguinte. / To be continued on next page.)
PAÍS COUNTRY
AUTOVEÍCULOS VEHICLES
MOTORES ENGINES
COMPONENTES COMPONENT PARTS
TOTAL TOTAL
2008 2009 2008 2009 2008 2009 2008 2009
América do Sul/South AmericaArgentina/Argentina 4.012.741 2.728.336 219.566 146.574 1.162.144 1.141.202 5.394.451 4.016.112 Bolívia/Bolivia 8.630 6.623 111 165 548 883 9.289 7.671 Chile/Chile 497.879 287.123 476 629 26.655 21.531 525.010 309.283 Colômbia/Colombia 61.669 90.561 1.107 55 14.595 11.939 77.371 102.555 Equador/Ecuador 28.549 14.658 6.465 2.442 6.172 4.439 41.186 21.539 Guiana Inglesa/English Guiana - - - 43 - 85 - 128 Paraguai/Paraguay 81.953 37.646 1.904 - 72.932 5.863 156.789 43.509 Peru/Peru 331.481 105.832 1.077 - 17.021 13.990 349.579 119.822 Suriname/Suriname - - - 388 - 164 - 552 Uruguai/Uruguay 135.167 105.839 1.878 211 6.637 8.428 143.682 114.478 Venezuela/Venezuela 296.298 218.930 1.077 213 96.856 106.400 394.231 325.543
Total/Total 5.454.367 3.595.548 233.661 150.720 1.403.560 1.314.924 7.091.588 5.061.192
América Central/Central AmericaAmérica Central/Central America 71.023 22.417 415 279 15.649 16.385 87.087 39.081
Total 71.023 22.417 415 279 15.649 16.385 87.087 39.081
América do Norte/North AmericaCanadá/Canada 112.487 81.342 - - 972 829 113.459 82.171 Estados Unidos/United States 5.056 180 195.318 23.316 55.509 27.975 255.883 51.471 México/Mexico 862.983 597.025 9.197 1.140 132.726 75.759 1.004.906 673.924
Total/Total 980.526 678.547 204.515 24.456 189.207 104.563 1.374.248 807.566
Europa/EuropeAlemanha/Germany 349.473 334.979 17.280 11.697 176.411 74.805 543.164 421.481 Áustria/Austria - 224 - - 11 7 11 231 Bélgica/Belgium - 164 - 1.166 68 92 68 1.422 Dinamarca/Denmark - - - - 1 30 1 30 Espanha/Spain 8.951 324 4.141 3.932 639 186 13.731 4.442 França/France 313 17.251 130 - 312 54 755 17.305 Grécia/Greece - 3.155 - - - - - 3.155 Holanda/Netherlands - 185 - - - 7 - 192 Hungria/Hungary - 13 - - - - - 13 Itália/Italy 57.666 18.478 - - 61.559 12.970 119.225 31.448 Noruega/Norway - 1.743 - - - - - 1.743 Polônia/Poland - 274 - - 34.719 12.902 34.719 13.176 Portugal/Portugal - 3.205 - - - - - 3.205 Reino Unido/ United Kingdom 59.621 9.266 - - 43.621 4.369 103.242 13.635 República Tcheca/Czec Republic 484 61 - - - - 484 61 Romênia/Romania 16 12.311 12 - 18 - 46 12.311 Rússia/Russia 436.540 - - - 2 - 436.542 - Suécia/Sweden 199 498 76 - 13.788 7.651 14.063 8.149 Suíça/Switzerland - 143 - - - - - 143 Ucrânia/Ukraine 33.688 - - - - - 33.688 -
Total/Total 946.951 402.274 21.639 16.795 331.149 113.073 1.299.739 532.142
2.18 Exportações em valores por país de destino - 2008/2009 Exports in value per country of destination - 2008/2009
Milhares de US$ / US$ thousand
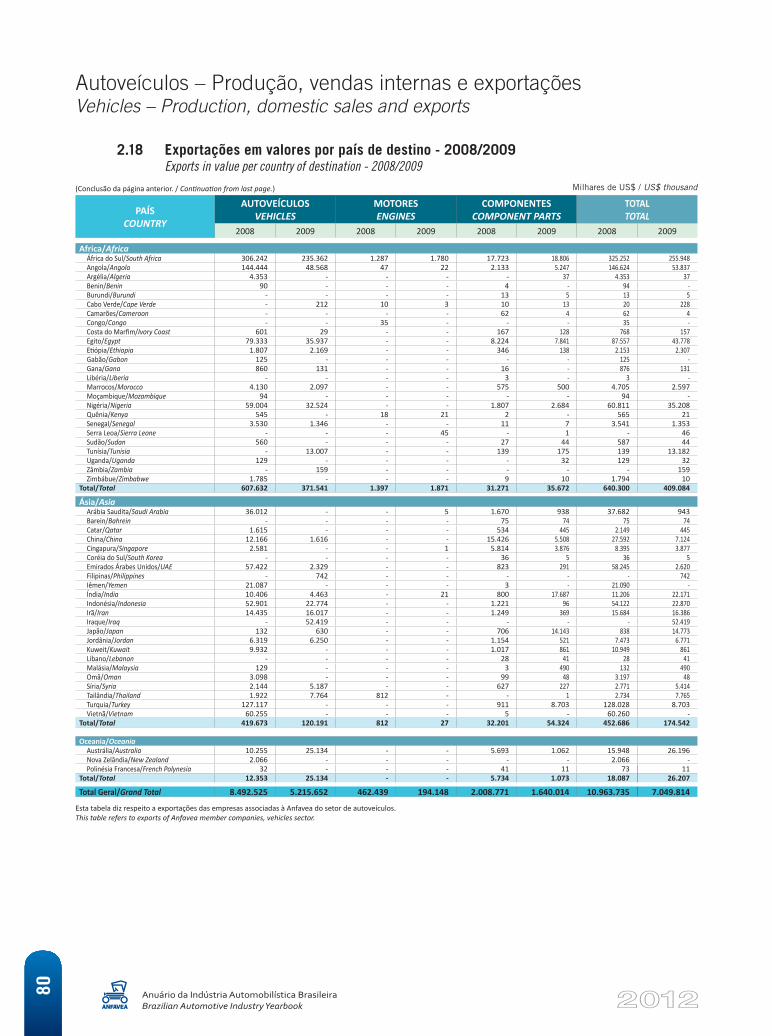
Autoveículos – Produção, vendas internas e exportaçõesVehicles – Production, domestic sales and exports
Anuário da Indústria Automobilística BrasileiraBrazilian Automotive Industry Yearbook
80
PAÍS COUNTRY
AUTOVEÍCULOS VEHICLES
MOTORES ENGINES
COMPONENTES COMPONENT PARTS
TOTAL TOTAL
2008 2009 2008 2009 2008 2009 2008 2009
Africa/AfricaÁfrica do Sul/South Africa 306.242 235.362 1.287 1.780 17.723 18.806 325.252 255.948 Angola/Angola 144.444 48.568 47 22 2.133 5.247 146.624 53.837 Argélia/Algeria 4.353 - - - - 37 4.353 37 Benin/Benin 90 - - - 4 - 94 - Burundi/Burundi - - - - 13 5 13 5 Cabo Verde/Cape Verde - 212 10 3 10 13 20 228 Camarões/Cameroon - - - - 62 4 62 4 Congo/Congo - - 35 - - - 35 - Costa do Marfim/Ivory Coast 601 29 - - 167 128 768 157 Egito/Egypt 79.333 35.937 - - 8.224 7.841 87.557 43.778 Etiópia/Ethiopia 1.807 2.169 - - 346 138 2.153 2.307 Gabão/Gabon 125 - - - - - 125 - Gana/Gana 860 131 - - 16 - 876 131 Libéria/Liberia - - - - 3 - 3 - Marrocos/Morocco 4.130 2.097 - - 575 500 4.705 2.597 Moçambique/Mozambique 94 - - - - - 94 - Nigéria/Nigeria 59.004 32.524 - - 1.807 2.684 60.811 35.208 Quênia/Kenya 545 - 18 21 2 - 565 21 Senegal/Senegal 3.530 1.346 - - 11 7 3.541 1.353 Serra Leoa/Sierra Leone - - - 45 - 1 - 46 Sudão/Sudan 560 - - - 27 44 587 44 Tunísia/Tunisia - 13.007 - - 139 175 139 13.182 Uganda/Uganda 129 - - - - 32 129 32 Zâmbia/Zambia - 159 - - - - - 159 Zimbábue/Zimbabwe 1.785 - - - 9 10 1.794 10
Total/Total 607.632 371.541 1.397 1.871 31.271 35.672 640.300 409.084
Ásia/AsiaArábia Saudita/Saudi Arabia 36.012 - - 5 1.670 938 37.682 943 Barein/Bahrein - - - - 75 74 75 74 Catar/Qatar 1.615 - - - 534 445 2.149 445 China/China 12.166 1.616 - - 15.426 5.508 27.592 7.124 Cingapura/Singapore 2.581 - - 1 5.814 3.876 8.395 3.877 Coréia do Sul/South Korea - - - - 36 5 36 5 Emirados Árabes Unidos/UAE 57.422 2.329 - - 823 291 58.245 2.620 Filipinas/Philippines - 742 - - - - - 742 Iêmen/Yemen 21.087 - - - 3 - 21.090 - Índia/India 10.406 4.463 - 21 800 17.687 11.206 22.171 Indonésia/Indonesia 52.901 22.774 - - 1.221 96 54.122 22.870 Irã/Iran 14.435 16.017 - - 1.249 369 15.684 16.386 Iraque/Iraq - 52.419 - - - - - 52.419 Japão/Japan 132 630 - - 706 14.143 838 14.773 Jordânia/Jordan 6.319 6.250 - - 1.154 521 7.473 6.771 Kuweit/Kuwait 9.932 - - - 1.017 861 10.949 861 Líbano/Lebanon - - - - 28 41 28 41 Malásia/Malaysia 129 - - - 3 490 132 490 Omã/Oman 3.098 - - - 99 48 3.197 48 Síria/Syria 2.144 5.187 - - 627 227 2.771 5.414 Tailândia/Thailand 1.922 7.764 812 - - 1 2.734 7.765 Turquia/Turkey 127.117 - - - 911 8.703 128.028 8.703 Vietnã/Vietnam 60.255 - - - 5 - 60.260 -
Total/Total 419.673 120.191 812 27 32.201 54.324 452.686 174.542
Oceania/OceaniaAustrália/Australia 10.255 25.134 - - 5.693 1.062 15.948 26.196 Nova Zelândia/New Zealand 2.066 - - - - - 2.066 - Polinésia Francesa/French Polynesia 32 - - - 41 11 73 11
Total/Total 12.353 25.134 - - 5.734 1.073 18.087 26.207
Total Geral/Grand Total 8.492.525 5.215.652 462.439 194.148 2.008.771 1.640.014 10.963.735 7.049.814
Esta tabela diz respeito a exportações das empresas associadas à Anfavea do setor de autoveículos.This table refers to exports of Anfavea member companies, vehicles sector.
2.18 Exportações em valores por país de destino - 2008/2009 Exports in value per country of destination - 2008/2009
Milhares de US$ / US$ thousand(Conclusão da página anterior. / Continuation from last page.)
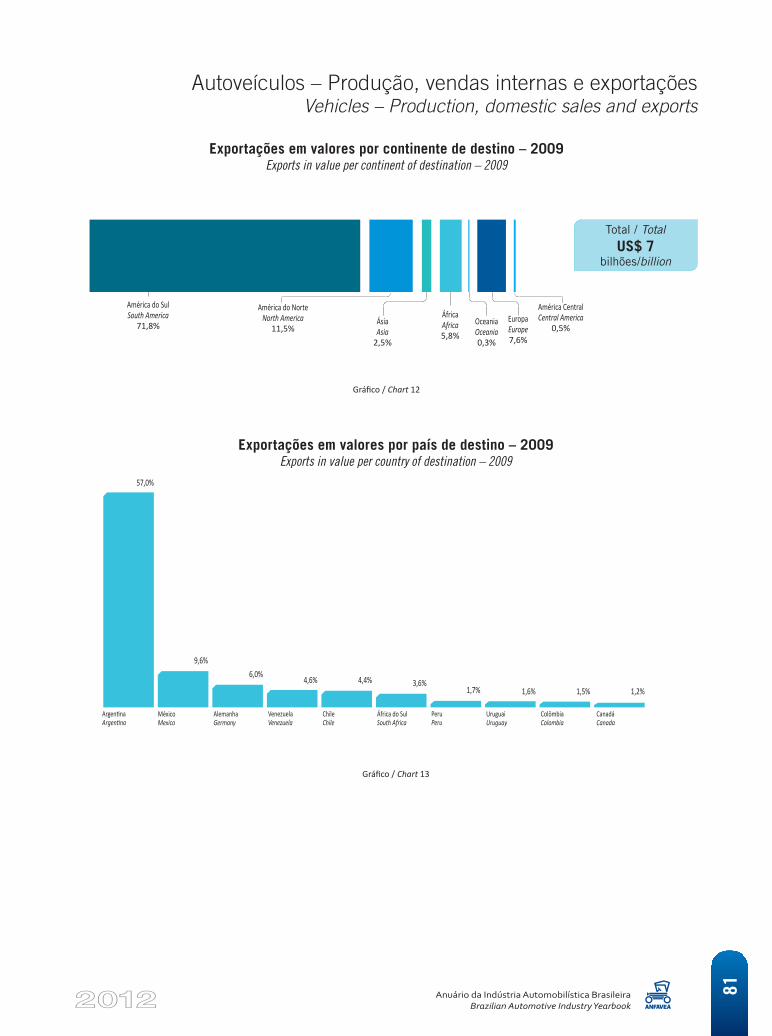
Autoveículos – Produção, vendas internas e exportaçõesVehicles – Production, domestic sales and exports
Anuário da Indústria Automobilística BrasileiraBrazilian Automotive Industry Yearbook
81
Exportações em valores por país de destino – 2009Exports in value per country of destination – 2009
Gráfico / Chart 13
Exportações em valores por continente de destino – 2009Exports in value per continent of destination – 2009
Gráfico / Chart 12
América do SulSouth America
71,8%
América CentralCentral America
0,5%
América do NorteNorth America
11,5%EuropaEurope7,6%
ÁfricaAfrica5,8%
ÁsiaAsia
2,5%
OceaniaOceania0,3%
Total / TotalUS$ 7
bilhões/billion
ArgentinaArgentina
VenezuelaVenezuela
PeruPeru
MéxicoMexico
ChileChile
UruguaiUruguay
AlemanhaGermany
África do SulSouth Africa
ColômbiaColombia
57,0%
9,6%6,0% 4,6% 4,4% 3,6%
1,7% 1,6% 1,5% 1,2%
CanadáCanada
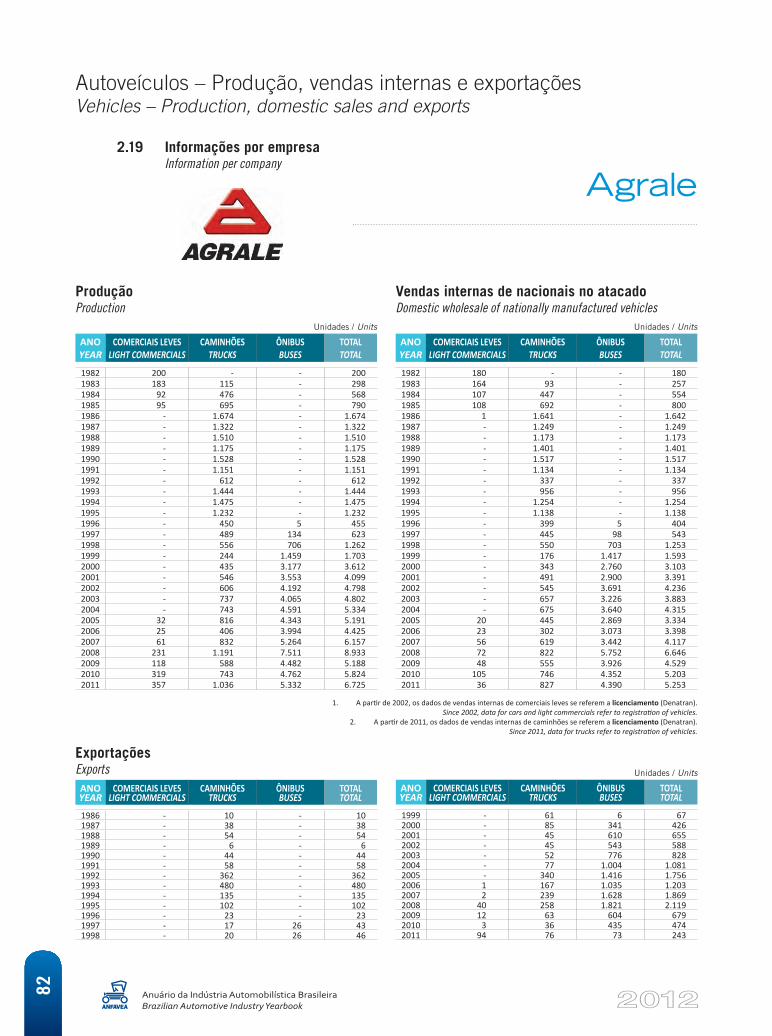
Autoveículos – Produção, vendas internas e exportaçõesVehicles – Production, domestic sales and exports
Anuário da Indústria Automobilística BrasileiraBrazilian Automotive Industry Yearbook
82
1. A partir de 2002, os dados de vendas internas de comerciais leves se referem a licenciamento (Denatran). Since 2002, data for cars and light commercials refer to registration of vehicles.
2. A partir de 2011, os dados de vendas internas de caminhões se referem a licenciamento (Denatran). Since 2011, data for trucks refer to registration of vehicles.
2.19 Informações por empresa Information per company
ProduçãoProduction
Unidades / Units
ANO YEAR
COMERCIAIS LEVES LIGHT COMMERCIALS
CAMINHÕES TRUCKS
ÔNIBUS BUSES
TOTAL TOTAL
1982 200 - - 200 1983 183 115 - 298 1984 92 476 - 568 1985 95 695 - 790 1986 - 1.674 - 1.674 1987 - 1.322 - 1.322 1988 - 1.510 - 1.510 1989 - 1.175 - 1.175 1990 - 1.528 - 1.528 1991 - 1.151 - 1.151 1992 - 612 - 612 1993 - 1.444 - 1.444 1994 - 1.475 - 1.475 1995 - 1.232 - 1.232 1996 - 450 5 455 1997 - 489 134 623 1998 - 556 706 1.262 1999 - 244 1.459 1.703 2000 - 435 3.177 3.612 2001 - 546 3.553 4.099 2002 - 606 4.192 4.798 2003 - 737 4.065 4.802 2004 - 743 4.591 5.334 2005 32 816 4.343 5.191 2006 25 406 3.994 4.425 2007 61 832 5.264 6.157 2008 231 1.191 7.511 8.933 2009 118 588 4.482 5.188 2010 319 743 4.762 5.824 2011 357 1.036 5.332 6.725
Vendas internas de nacionais no atacadoDomestic wholesale of nationally manufactured vehicles
Unidades / Units
ANO YEAR
COMERCIAIS LEVES LIGHT COMMERCIALS
CAMINHÕES TRUCKS
ÔNIBUS BUSES
TOTAL TOTAL
1982 180 - - 180 1983 164 93 - 257 1984 107 447 - 554 1985 108 692 - 800 1986 1 1.641 - 1.642 1987 - 1.249 - 1.249 1988 - 1.173 - 1.173 1989 - 1.401 - 1.401 1990 - 1.517 - 1.517 1991 - 1.134 - 1.134 1992 - 337 - 337 1993 - 956 - 956 1994 - 1.254 - 1.254 1995 - 1.138 - 1.138 1996 - 399 5 404 1997 - 445 98 543 1998 - 550 703 1.253 1999 - 176 1.417 1.593 2000 - 343 2.760 3.103 2001 - 491 2.900 3.391 2002 - 545 3.691 4.236 2003 - 657 3.226 3.883 2004 - 675 3.640 4.315 2005 20 445 2.869 3.334 2006 23 302 3.073 3.398 2007 56 619 3.442 4.117 2008 72 822 5.752 6.646 2009 48 555 3.926 4.529 2010 105 746 4.352 5.203 2011 36 827 4.390 5.253
Agrale
ExportaçõesExportsANO YEAR
COMERCIAIS LEVES LIGHT COMMERCIALS
CAMINHÕES TRUCKS
ÔNIBUS BUSES
TOTAL TOTAL
1986 - 10 - 10 1987 - 38 - 38 1988 - 54 - 54 1989 - 6 - 6 1990 - 44 - 44 1991 - 58 - 58 1992 - 362 - 362 1993 - 480 - 480 1994 - 135 - 135 1995 - 102 - 102 1996 - 23 - 23 1997 - 17 26 43 1998 - 20 26 46
Unidades / Units
ANO YEAR
COMERCIAIS LEVES LIGHT COMMERCIALS
CAMINHÕES TRUCKS
ÔNIBUS BUSES
TOTAL TOTAL
1999 - 61 6 67 2000 - 85 341 426 2001 - 45 610 655 2002 - 45 543 588 2003 - 52 776 828 2004 - 77 1.004 1.081 2005 - 340 1.416 1.756 2006 1 167 1.035 1.203 2007 2 239 1.628 1.869 2008 40 258 1.821 2.119 2009 12 63 604 679 2010 3 36 435 474 2011 94 76 73 243
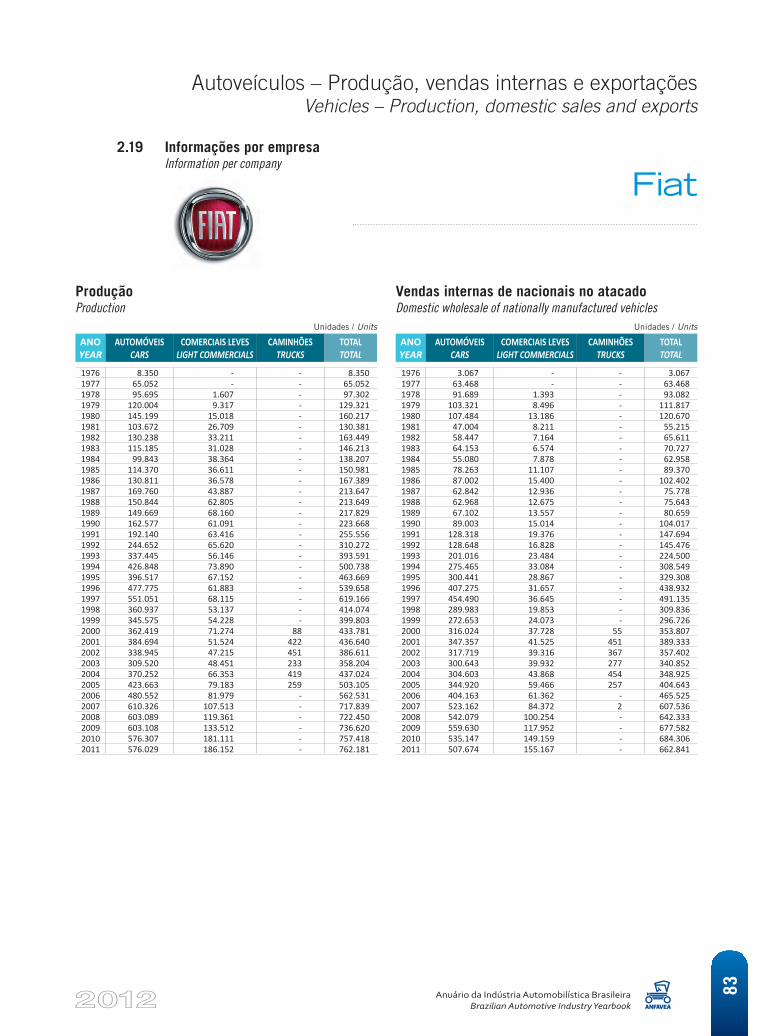
Autoveículos – Produção, vendas internas e exportaçõesVehicles – Production, domestic sales and exports
Anuário da Indústria Automobilística BrasileiraBrazilian Automotive Industry Yearbook
83
2.19 Informações por empresa Information per company
ProduçãoProduction
Unidades / Units
ANO YEAR
AUTOMÓVEIS CARS
COMERCIAIS LEVES LIGHT COMMERCIALS
CAMINHÕES TRUCKS
TOTAL TOTAL
1976 8.350 - - 8.350 1977 65.052 - - 65.052 1978 95.695 1.607 - 97.302 1979 120.004 9.317 - 129.321 1980 145.199 15.018 - 160.217 1981 103.672 26.709 - 130.381 1982 130.238 33.211 - 163.449 1983 115.185 31.028 - 146.213 1984 99.843 38.364 - 138.207 1985 114.370 36.611 - 150.981 1986 130.811 36.578 - 167.389 1987 169.760 43.887 - 213.647 1988 150.844 62.805 - 213.649 1989 149.669 68.160 - 217.829 1990 162.577 61.091 - 223.668 1991 192.140 63.416 - 255.556 1992 244.652 65.620 - 310.272 1993 337.445 56.146 - 393.591 1994 426.848 73.890 - 500.738 1995 396.517 67.152 - 463.669 1996 477.775 61.883 - 539.658 1997 551.051 68.115 - 619.166 1998 360.937 53.137 - 414.074 1999 345.575 54.228 - 399.803 2000 362.419 71.274 88 433.781 2001 384.694 51.524 422 436.640 2002 338.945 47.215 451 386.611 2003 309.520 48.451 233 358.204 2004 370.252 66.353 419 437.024 2005 423.663 79.183 259 503.105 2006 480.552 81.979 - 562.531 2007 610.326 107.513 - 717.839 2008 603.089 119.361 - 722.450 2009 603.108 133.512 - 736.620 2010 576.307 181.111 - 757.418 2011 576.029 186.152 - 762.181
Vendas internas de nacionais no atacadoDomestic wholesale of nationally manufactured vehicles
Unidades / Units
ANO YEAR
AUTOMÓVEIS CARS
COMERCIAIS LEVES LIGHT COMMERCIALS
CAMINHÕES TRUCKS
TOTAL TOTAL
1976 3.067 - - 3.067 1977 63.468 - - 63.468 1978 91.689 1.393 - 93.082 1979 103.321 8.496 - 111.817 1980 107.484 13.186 - 120.670 1981 47.004 8.211 - 55.215 1982 58.447 7.164 - 65.611 1983 64.153 6.574 - 70.727 1984 55.080 7.878 - 62.958 1985 78.263 11.107 - 89.370 1986 87.002 15.400 - 102.402 1987 62.842 12.936 - 75.778 1988 62.968 12.675 - 75.643 1989 67.102 13.557 - 80.659 1990 89.003 15.014 - 104.017 1991 128.318 19.376 - 147.694 1992 128.648 16.828 - 145.476 1993 201.016 23.484 - 224.500 1994 275.465 33.084 - 308.549 1995 300.441 28.867 - 329.308 1996 407.275 31.657 - 438.932 1997 454.490 36.645 - 491.135 1998 289.983 19.853 - 309.836 1999 272.653 24.073 - 296.726 2000 316.024 37.728 55 353.807 2001 347.357 41.525 451 389.333 2002 317.719 39.316 367 357.402 2003 300.643 39.932 277 340.852 2004 304.603 43.868 454 348.925 2005 344.920 59.466 257 404.643 2006 404.163 61.362 - 465.525 2007 523.162 84.372 2 607.536 2008 542.079 100.254 - 642.333 2009 559.630 117.952 - 677.582 2010 535.147 149.159 - 684.306 2011 507.674 155.167 - 662.841
Fiat
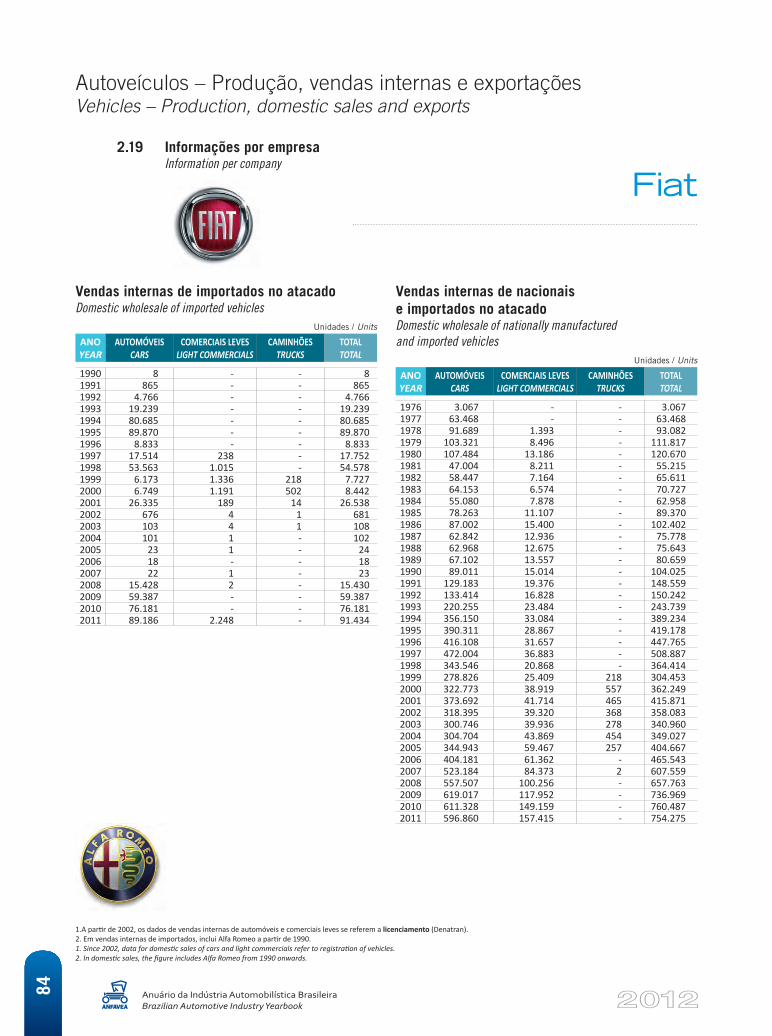
Autoveículos – Produção, vendas internas e exportaçõesVehicles – Production, domestic sales and exports
Anuário da Indústria Automobilística BrasileiraBrazilian Automotive Industry Yearbook
84
1.A partir de 2002, os dados de vendas internas de automóveis e comerciais leves se referem a licenciamento (Denatran).2. Em vendas internas de importados, inclui Alfa Romeo a partir de 1990.1. Since 2002, data for domestic sales of cars and light commercials refer to registration of vehicles.2. In domestic sales, the figure includes Alfa Romeo from 1990 onwards.
2.19 Informações por empresa Information per company
Vendas internas de importados no atacadoDomestic wholesale of imported vehicles
Unidades / Units
ANO YEAR
AUTOMÓVEIS CARS
COMERCIAIS LEVES LIGHT COMMERCIALS
CAMINHÕES TRUCKS
TOTAL TOTAL
1990 8 - - 8 1991 865 - - 865 1992 4.766 - - 4.766 1993 19.239 - - 19.239 1994 80.685 - - 80.685 1995 89.870 - - 89.870 1996 8.833 - - 8.833 1997 17.514 238 - 17.752 1998 53.563 1.015 - 54.578 1999 6.173 1.336 218 7.727 2000 6.749 1.191 502 8.442 2001 26.335 189 14 26.538 2002 676 4 1 681 2003 103 4 1 108 2004 101 1 - 102 2005 23 1 - 24 2006 18 - - 18 2007 22 1 - 23 2008 15.428 2 - 15.430 2009 59.387 - - 59.387 2010 76.181 - - 76.181 2011 89.186 2.248 - 91.434
Vendas internas de nacionais e importados no atacadoDomestic wholesale of nationally manufactured and imported vehicles
Unidades / Units
ANO YEAR
AUTOMÓVEIS CARS
COMERCIAIS LEVES LIGHT COMMERCIALS
CAMINHÕES TRUCKS
TOTAL TOTAL
1976 3.067 - - 3.067 1977 63.468 - - 63.468 1978 91.689 1.393 - 93.082 1979 103.321 8.496 - 111.817 1980 107.484 13.186 - 120.670 1981 47.004 8.211 - 55.215 1982 58.447 7.164 - 65.611 1983 64.153 6.574 - 70.727 1984 55.080 7.878 - 62.958 1985 78.263 11.107 - 89.370 1986 87.002 15.400 - 102.402 1987 62.842 12.936 - 75.778 1988 62.968 12.675 - 75.643 1989 67.102 13.557 - 80.659 1990 89.011 15.014 - 104.025 1991 129.183 19.376 - 148.559 1992 133.414 16.828 - 150.242 1993 220.255 23.484 - 243.739 1994 356.150 33.084 - 389.234 1995 390.311 28.867 - 419.178 1996 416.108 31.657 - 447.765 1997 472.004 36.883 - 508.887 1998 343.546 20.868 - 364.414 1999 278.826 25.409 218 304.453 2000 322.773 38.919 557 362.249 2001 373.692 41.714 465 415.871 2002 318.395 39.320 368 358.083 2003 300.746 39.936 278 340.960 2004 304.704 43.869 454 349.027 2005 344.943 59.467 257 404.667 2006 404.181 61.362 - 465.543 2007 523.184 84.373 2 607.559 2008 557.507 100.256 - 657.763 2009 619.017 117.952 - 736.969 2010 611.328 149.159 - 760.487 2011 596.860 157.415 - 754.275
Fiat
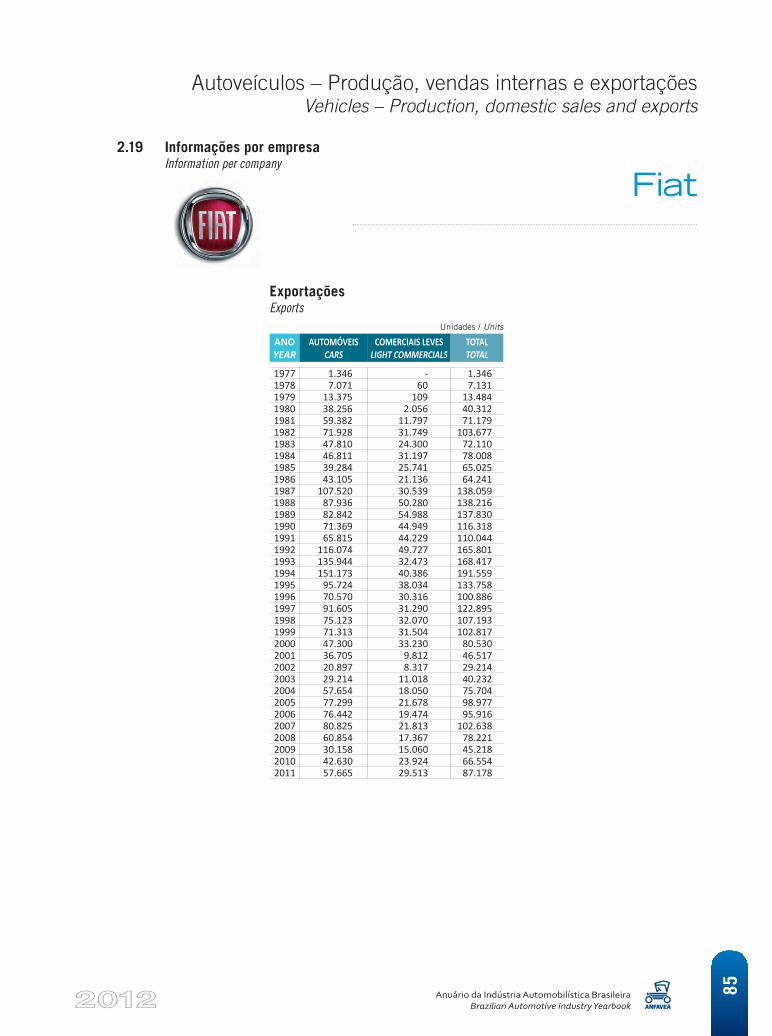
Autoveículos – Produção, vendas internas e exportaçõesVehicles – Production, domestic sales and exports
Anuário da Indústria Automobilística BrasileiraBrazilian Automotive Industry Yearbook
85
2.19 Informações por empresa Information per company
ExportaçõesExports
Unidades / Units
ANO YEAR
AUTOMÓVEIS CARS
COMERCIAIS LEVES LIGHT COMMERCIALS
TOTAL TOTAL
1977 1.346 - 1.346 1978 7.071 60 7.131 1979 13.375 109 13.484 1980 38.256 2.056 40.312 1981 59.382 11.797 71.179 1982 71.928 31.749 103.677 1983 47.810 24.300 72.110 1984 46.811 31.197 78.008 1985 39.284 25.741 65.025 1986 43.105 21.136 64.241 1987 107.520 30.539 138.059 1988 87.936 50.280 138.216 1989 82.842 54.988 137.830 1990 71.369 44.949 116.318 1991 65.815 44.229 110.044 1992 116.074 49.727 165.801 1993 135.944 32.473 168.417 1994 151.173 40.386 191.559 1995 95.724 38.034 133.758 1996 70.570 30.316 100.886 1997 91.605 31.290 122.895 1998 75.123 32.070 107.193 1999 71.313 31.504 102.817 2000 47.300 33.230 80.530 2001 36.705 9.812 46.517 2002 20.897 8.317 29.214 2003 29.214 11.018 40.232 2004 57.654 18.050 75.704 2005 77.299 21.678 98.977 2006 76.442 19.474 95.916 2007 80.825 21.813 102.638 2008 60.854 17.367 78.221 2009 30.158 15.060 45.218 2010 42.630 23.924 66.554 2011 57.665 29.513 87.178
Fiat
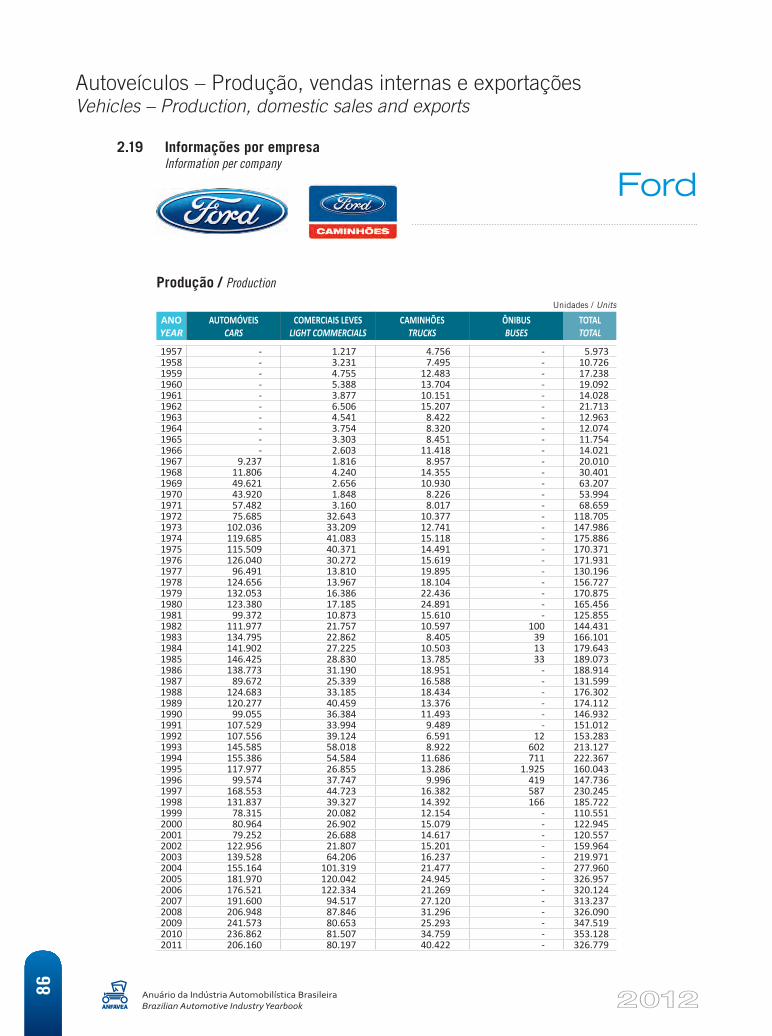
Autoveículos – Produção, vendas internas e exportaçõesVehicles – Production, domestic sales and exports
Anuário da Indústria Automobilística BrasileiraBrazilian Automotive Industry Yearbook
86
2.19 Informações por empresa Information per company
Produção / Production
Unidades / Units
ANO YEAR
AUTOMÓVEIS CARS
COMERCIAIS LEVES LIGHT COMMERCIALS
CAMINHÕES TRUCKS
ÔNIBUS BUSES
TOTAL TOTAL
1957 - 1.217 4.756 - 5.973 1958 - 3.231 7.495 - 10.726 1959 - 4.755 12.483 - 17.238 1960 - 5.388 13.704 - 19.092 1961 - 3.877 10.151 - 14.028 1962 - 6.506 15.207 - 21.713 1963 - 4.541 8.422 - 12.963 1964 - 3.754 8.320 - 12.074 1965 - 3.303 8.451 - 11.754 1966 - 2.603 11.418 - 14.021 1967 9.237 1.816 8.957 - 20.010 1968 11.806 4.240 14.355 - 30.401 1969 49.621 2.656 10.930 - 63.207 1970 43.920 1.848 8.226 - 53.994 1971 57.482 3.160 8.017 - 68.659 1972 75.685 32.643 10.377 - 118.705 1973 102.036 33.209 12.741 - 147.986 1974 119.685 41.083 15.118 - 175.886 1975 115.509 40.371 14.491 - 170.371 1976 126.040 30.272 15.619 - 171.931 1977 96.491 13.810 19.895 - 130.196 1978 124.656 13.967 18.104 - 156.727 1979 132.053 16.386 22.436 - 170.875 1980 123.380 17.185 24.891 - 165.456 1981 99.372 10.873 15.610 - 125.855 1982 111.977 21.757 10.597 100 144.431 1983 134.795 22.862 8.405 39 166.101 1984 141.902 27.225 10.503 13 179.643 1985 146.425 28.830 13.785 33 189.073 1986 138.773 31.190 18.951 - 188.914 1987 89.672 25.339 16.588 - 131.599 1988 124.683 33.185 18.434 - 176.302 1989 120.277 40.459 13.376 - 174.112 1990 99.055 36.384 11.493 - 146.932 1991 107.529 33.994 9.489 - 151.012 1992 107.556 39.124 6.591 12 153.283 1993 145.585 58.018 8.922 602 213.127 1994 155.386 54.584 11.686 711 222.367 1995 117.977 26.855 13.286 1.925 160.043 1996 99.574 37.747 9.996 419 147.736 1997 168.553 44.723 16.382 587 230.245 1998 131.837 39.327 14.392 166 185.722 1999 78.315 20.082 12.154 - 110.551 2000 80.964 26.902 15.079 - 122.945 2001 79.252 26.688 14.617 - 120.557 2002 122.956 21.807 15.201 - 159.964 2003 139.528 64.206 16.237 - 219.971 2004 155.164 101.319 21.477 - 277.960 2005 181.970 120.042 24.945 - 326.957 2006 176.521 122.334 21.269 - 320.124 2007 191.600 94.517 27.120 - 313.237 2008 206.948 87.846 31.296 - 326.090 2009 241.573 80.653 25.293 - 347.519 2010 236.862 81.507 34.759 - 353.128 2011 206.160 80.197 40.422 - 326.779
Ford
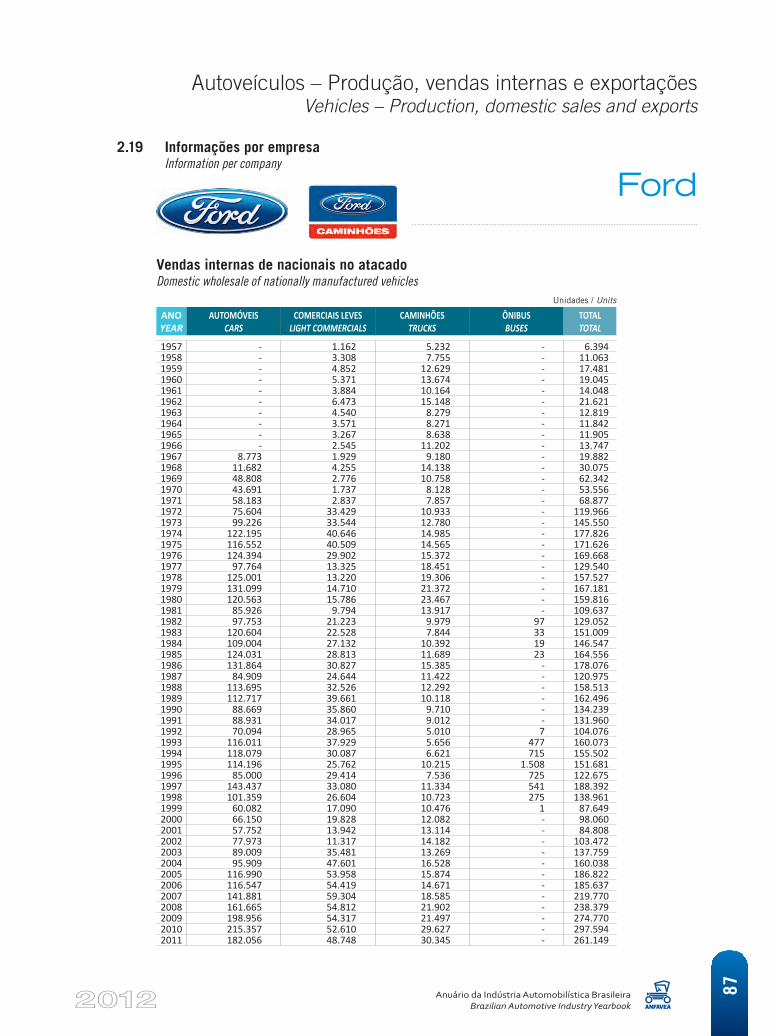
Autoveículos – Produção, vendas internas e exportaçõesVehicles – Production, domestic sales and exports
Anuário da Indústria Automobilística BrasileiraBrazilian Automotive Industry Yearbook
87
Ford2.19 Informações por empresa Information per company
Vendas internas de nacionais no atacadoDomestic wholesale of nationally manufactured vehicles
Unidades / Units
ANO YEAR
AUTOMÓVEIS CARS
COMERCIAIS LEVES LIGHT COMMERCIALS
CAMINHÕES TRUCKS
ÔNIBUS BUSES
TOTAL TOTAL
1957 - 1.162 5.232 - 6.394 1958 - 3.308 7.755 - 11.063 1959 - 4.852 12.629 - 17.481 1960 - 5.371 13.674 - 19.045 1961 - 3.884 10.164 - 14.048 1962 - 6.473 15.148 - 21.621 1963 - 4.540 8.279 - 12.819 1964 - 3.571 8.271 - 11.842 1965 - 3.267 8.638 - 11.905 1966 - 2.545 11.202 - 13.747 1967 8.773 1.929 9.180 - 19.882 1968 11.682 4.255 14.138 - 30.075 1969 48.808 2.776 10.758 - 62.342 1970 43.691 1.737 8.128 - 53.556 1971 58.183 2.837 7.857 - 68.877 1972 75.604 33.429 10.933 - 119.966 1973 99.226 33.544 12.780 - 145.550 1974 122.195 40.646 14.985 - 177.826 1975 116.552 40.509 14.565 - 171.626 1976 124.394 29.902 15.372 - 169.668 1977 97.764 13.325 18.451 - 129.540 1978 125.001 13.220 19.306 - 157.527 1979 131.099 14.710 21.372 - 167.181 1980 120.563 15.786 23.467 - 159.816 1981 85.926 9.794 13.917 - 109.637 1982 97.753 21.223 9.979 97 129.052 1983 120.604 22.528 7.844 33 151.009 1984 109.004 27.132 10.392 19 146.547 1985 124.031 28.813 11.689 23 164.556 1986 131.864 30.827 15.385 - 178.076 1987 84.909 24.644 11.422 - 120.975 1988 113.695 32.526 12.292 - 158.513 1989 112.717 39.661 10.118 - 162.496 1990 88.669 35.860 9.710 - 134.239 1991 88.931 34.017 9.012 - 131.960 1992 70.094 28.965 5.010 7 104.076 1993 116.011 37.929 5.656 477 160.073 1994 118.079 30.087 6.621 715 155.502 1995 114.196 25.762 10.215 1.508 151.681 1996 85.000 29.414 7.536 725 122.675 1997 143.437 33.080 11.334 541 188.392 1998 101.359 26.604 10.723 275 138.961 1999 60.082 17.090 10.476 1 87.649 2000 66.150 19.828 12.082 - 98.060 2001 57.752 13.942 13.114 - 84.808 2002 77.973 11.317 14.182 - 103.472 2003 89.009 35.481 13.269 - 137.759 2004 95.909 47.601 16.528 - 160.038 2005 116.990 53.958 15.874 - 186.822 2006 116.547 54.419 14.671 - 185.637 2007 141.881 59.304 18.585 - 219.770 2008 161.665 54.812 21.902 - 238.379 2009 198.956 54.317 21.497 - 274.770 2010 215.357 52.610 29.627 - 297.594 2011 182.056 48.748 30.345 - 261.149
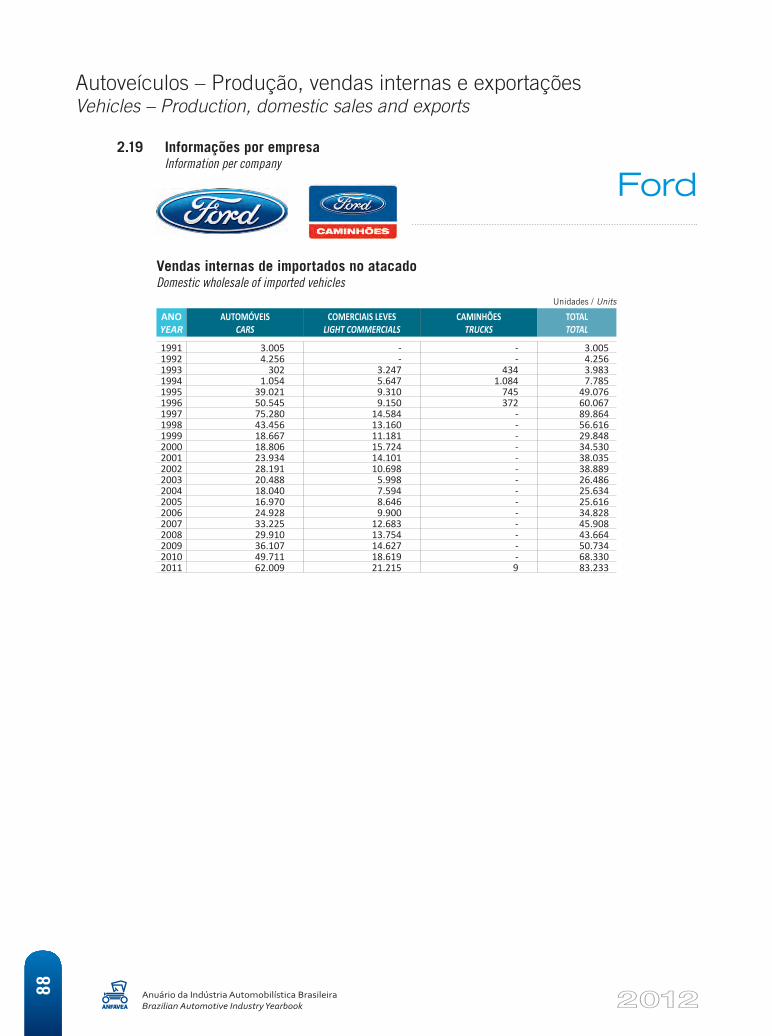
Autoveículos – Produção, vendas internas e exportaçõesVehicles – Production, domestic sales and exports
Anuário da Indústria Automobilística BrasileiraBrazilian Automotive Industry Yearbook
88
2.19 Informações por empresa Information per company
Vendas internas de importados no atacado Domestic wholesale of imported vehicles
Unidades / Units
ANO YEAR
AUTOMÓVEIS CARS
COMERCIAIS LEVES LIGHT COMMERCIALS
CAMINHÕES TRUCKS
TOTAL TOTAL
1991 3.005 - - 3.005 1992 4.256 - - 4.256 1993 302 3.247 434 3.983 1994 1.054 5.647 1.084 7.785 1995 39.021 9.310 745 49.076 1996 50.545 9.150 372 60.067 1997 75.280 14.584 - 89.864 1998 43.456 13.160 - 56.616 1999 18.667 11.181 - 29.848 2000 18.806 15.724 - 34.530 2001 23.934 14.101 - 38.035 2002 28.191 10.698 - 38.889 2003 20.488 5.998 - 26.486 2004 18.040 7.594 - 25.634 2005 16.970 8.646 - 25.616 2006 24.928 9.900 - 34.828 2007 33.225 12.683 - 45.908 2008 29.910 13.754 - 43.664 2009 36.107 14.627 - 50.734 2010 49.711 18.619 - 68.330 2011 62.009 21.215 9 83.233
Ford
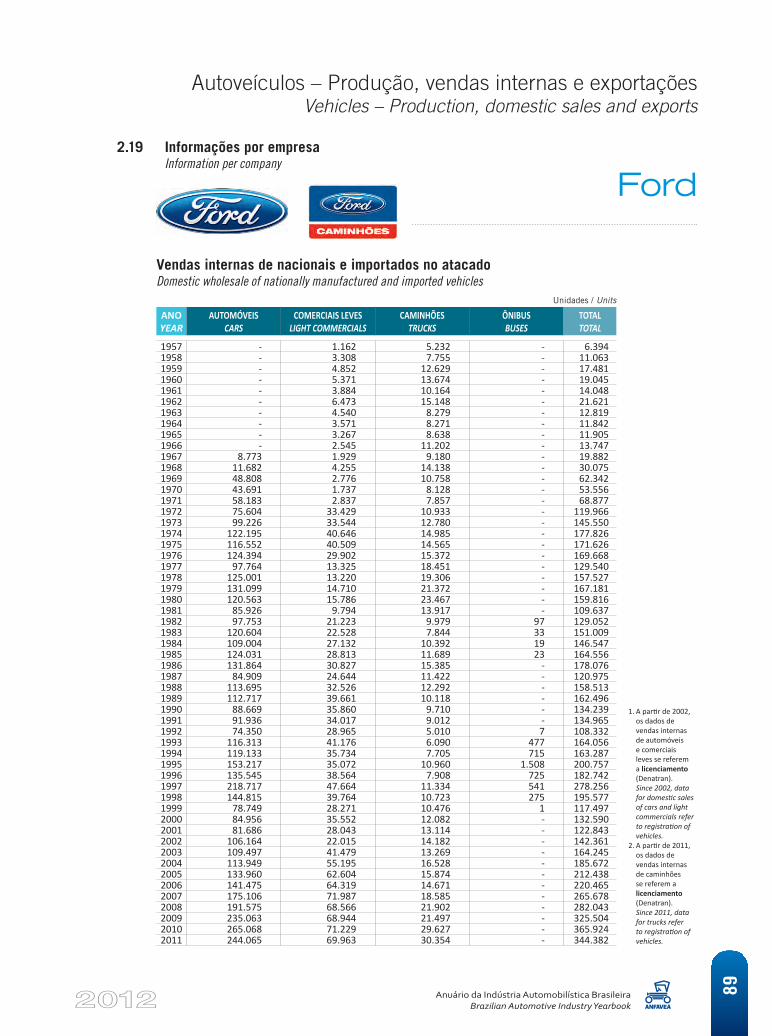
Autoveículos – Produção, vendas internas e exportaçõesVehicles – Production, domestic sales and exports
Anuário da Indústria Automobilística BrasileiraBrazilian Automotive Industry Yearbook
89
2.19 Informações por empresa Information per company
Vendas internas de nacionais e importados no atacadoDomestic wholesale of nationally manufactured and imported vehicles
Unidades / Units
ANO YEAR
AUTOMÓVEIS CARS
COMERCIAIS LEVES LIGHT COMMERCIALS
CAMINHÕES TRUCKS
ÔNIBUS BUSES
TOTAL TOTAL
1957 - 1.162 5.232 - 6.394 1958 - 3.308 7.755 - 11.063 1959 - 4.852 12.629 - 17.481 1960 - 5.371 13.674 - 19.045 1961 - 3.884 10.164 - 14.048 1962 - 6.473 15.148 - 21.621 1963 - 4.540 8.279 - 12.819 1964 - 3.571 8.271 - 11.842 1965 - 3.267 8.638 - 11.905 1966 - 2.545 11.202 - 13.747 1967 8.773 1.929 9.180 - 19.882 1968 11.682 4.255 14.138 - 30.075 1969 48.808 2.776 10.758 - 62.342 1970 43.691 1.737 8.128 - 53.556 1971 58.183 2.837 7.857 - 68.877 1972 75.604 33.429 10.933 - 119.966 1973 99.226 33.544 12.780 - 145.550 1974 122.195 40.646 14.985 - 177.826 1975 116.552 40.509 14.565 - 171.626 1976 124.394 29.902 15.372 - 169.668 1977 97.764 13.325 18.451 - 129.540 1978 125.001 13.220 19.306 - 157.527 1979 131.099 14.710 21.372 - 167.181 1980 120.563 15.786 23.467 - 159.816 1981 85.926 9.794 13.917 - 109.637 1982 97.753 21.223 9.979 97 129.052 1983 120.604 22.528 7.844 33 151.009 1984 109.004 27.132 10.392 19 146.547 1985 124.031 28.813 11.689 23 164.556 1986 131.864 30.827 15.385 - 178.076 1987 84.909 24.644 11.422 - 120.975 1988 113.695 32.526 12.292 - 158.513 1989 112.717 39.661 10.118 - 162.496 1990 88.669 35.860 9.710 - 134.239 1991 91.936 34.017 9.012 - 134.965 1992 74.350 28.965 5.010 7 108.332 1993 116.313 41.176 6.090 477 164.056 1994 119.133 35.734 7.705 715 163.287 1995 153.217 35.072 10.960 1.508 200.757 1996 135.545 38.564 7.908 725 182.742 1997 218.717 47.664 11.334 541 278.256 1998 144.815 39.764 10.723 275 195.577 1999 78.749 28.271 10.476 1 117.497 2000 84.956 35.552 12.082 - 132.590 2001 81.686 28.043 13.114 - 122.843 2002 106.164 22.015 14.182 - 142.361 2003 109.497 41.479 13.269 - 164.245 2004 113.949 55.195 16.528 - 185.672 2005 133.960 62.604 15.874 - 212.438 2006 141.475 64.319 14.671 - 220.465 2007 175.106 71.987 18.585 - 265.678 2008 191.575 68.566 21.902 - 282.043 2009 235.063 68.944 21.497 - 325.504 2010 265.068 71.229 29.627 - 365.924 2011 244.065 69.963 30.354 - 344.382
1. A partir de 2002, os dados de vendas internas de automóveis e comerciais leves se referem a licenciamento (Denatran). Since 2002, data for domestic sales of cars and light commercials refer to registration of vehicles.
2. A partir de 2011, os dados de vendas internas de caminhões se referem a licenciamento (Denatran). Since 2011, data for trucks refer to registration of vehicles.
Ford
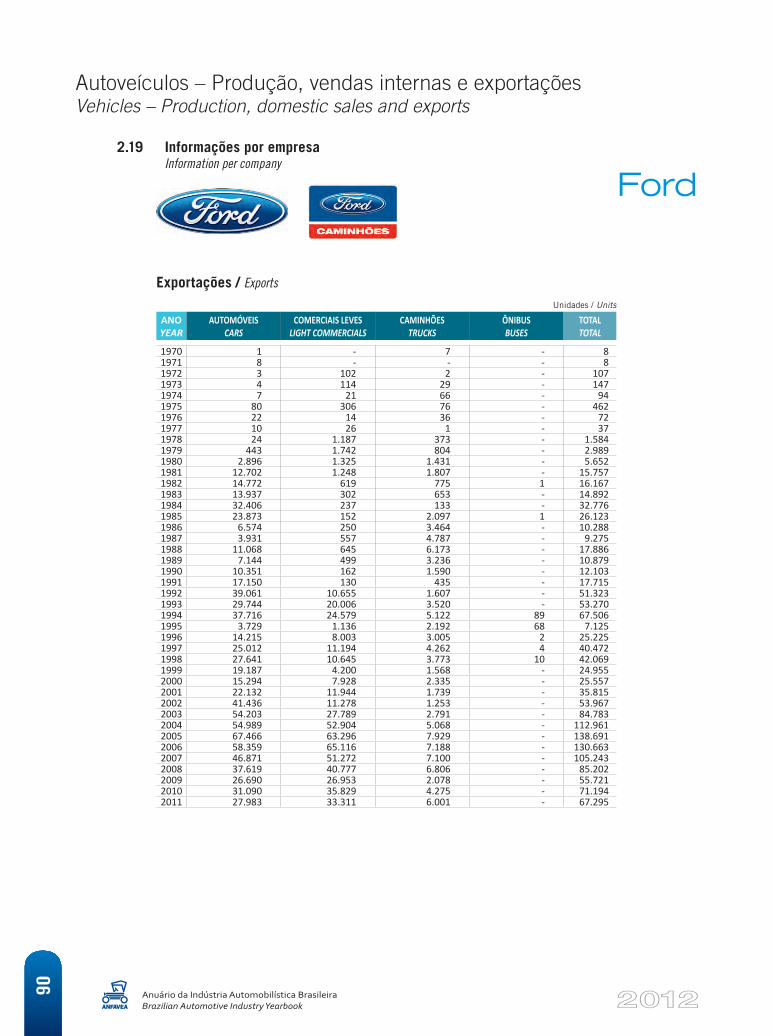
Autoveículos – Produção, vendas internas e exportaçõesVehicles – Production, domestic sales and exports
Anuário da Indústria Automobilística BrasileiraBrazilian Automotive Industry Yearbook
90
2.19 Informações por empresa Information per company
Exportações / Exports
Unidades / Units
ANO YEAR
AUTOMÓVEIS CARS
COMERCIAIS LEVES LIGHT COMMERCIALS
CAMINHÕES TRUCKS
ÔNIBUS BUSES
TOTAL TOTAL
1970 1 - 7 - 8 1971 8 - - - 8 1972 3 102 2 - 107 1973 4 114 29 - 147 1974 7 21 66 - 94 1975 80 306 76 - 462 1976 22 14 36 - 72 1977 10 26 1 - 37 1978 24 1.187 373 - 1.584 1979 443 1.742 804 - 2.989 1980 2.896 1.325 1.431 - 5.652 1981 12.702 1.248 1.807 - 15.757 1982 14.772 619 775 1 16.167 1983 13.937 302 653 - 14.892 1984 32.406 237 133 - 32.776 1985 23.873 152 2.097 1 26.123 1986 6.574 250 3.464 - 10.288 1987 3.931 557 4.787 - 9.275 1988 11.068 645 6.173 - 17.886 1989 7.144 499 3.236 - 10.879 1990 10.351 162 1.590 - 12.103 1991 17.150 130 435 - 17.715 1992 39.061 10.655 1.607 - 51.323 1993 29.744 20.006 3.520 - 53.270 1994 37.716 24.579 5.122 89 67.506 1995 3.729 1.136 2.192 68 7.125 1996 14.215 8.003 3.005 2 25.225 1997 25.012 11.194 4.262 4 40.472 1998 27.641 10.645 3.773 10 42.069 1999 19.187 4.200 1.568 - 24.955 2000 15.294 7.928 2.335 - 25.557 2001 22.132 11.944 1.739 - 35.815 2002 41.436 11.278 1.253 - 53.967 2003 54.203 27.789 2.791 - 84.783 2004 54.989 52.904 5.068 - 112.961 2005 67.466 63.296 7.929 - 138.691 2006 58.359 65.116 7.188 - 130.663 2007 46.871 51.272 7.100 - 105.243 2008 37.619 40.777 6.806 - 85.202 2009 26.690 26.953 2.078 - 55.721 2010 31.090 35.829 4.275 - 71.194 2011 27.983 33.311 6.001 - 67.295
Ford
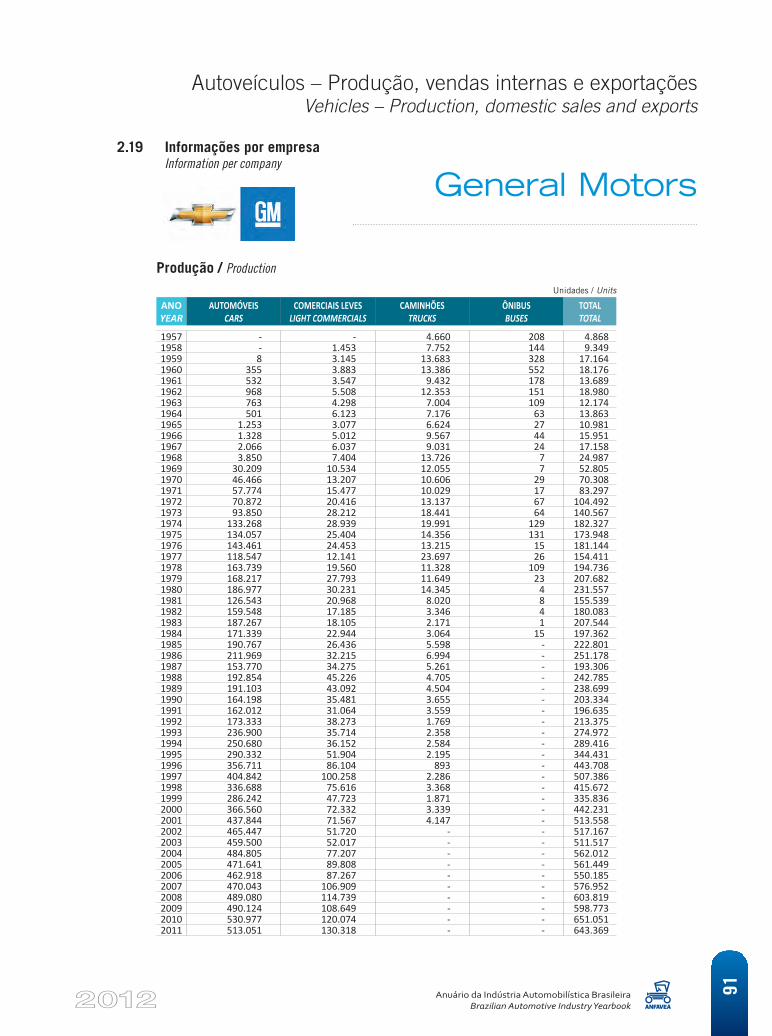
Autoveículos – Produção, vendas internas e exportaçõesVehicles – Production, domestic sales and exports
Anuário da Indústria Automobilística BrasileiraBrazilian Automotive Industry Yearbook
91
2.19 Informações por empresa Information per company
General Motors
Produção / Production
Unidades / Units
ANO YEAR
AUTOMÓVEIS CARS
COMERCIAIS LEVES LIGHT COMMERCIALS
CAMINHÕES TRUCKS
ÔNIBUS BUSES
TOTAL TOTAL
1957 - - 4.660 208 4.868 1958 - 1.453 7.752 144 9.349 1959 8 3.145 13.683 328 17.164 1960 355 3.883 13.386 552 18.176 1961 532 3.547 9.432 178 13.689 1962 968 5.508 12.353 151 18.980 1963 763 4.298 7.004 109 12.174 1964 501 6.123 7.176 63 13.863 1965 1.253 3.077 6.624 27 10.981 1966 1.328 5.012 9.567 44 15.951 1967 2.066 6.037 9.031 24 17.158 1968 3.850 7.404 13.726 7 24.987 1969 30.209 10.534 12.055 7 52.805 1970 46.466 13.207 10.606 29 70.308 1971 57.774 15.477 10.029 17 83.297 1972 70.872 20.416 13.137 67 104.492 1973 93.850 28.212 18.441 64 140.567 1974 133.268 28.939 19.991 129 182.327 1975 134.057 25.404 14.356 131 173.948 1976 143.461 24.453 13.215 15 181.144 1977 118.547 12.141 23.697 26 154.411 1978 163.739 19.560 11.328 109 194.736 1979 168.217 27.793 11.649 23 207.682 1980 186.977 30.231 14.345 4 231.557 1981 126.543 20.968 8.020 8 155.539 1982 159.548 17.185 3.346 4 180.083 1983 187.267 18.105 2.171 1 207.544 1984 171.339 22.944 3.064 15 197.362 1985 190.767 26.436 5.598 - 222.801 1986 211.969 32.215 6.994 - 251.178 1987 153.770 34.275 5.261 - 193.306 1988 192.854 45.226 4.705 - 242.785 1989 191.103 43.092 4.504 - 238.699 1990 164.198 35.481 3.655 - 203.334 1991 162.012 31.064 3.559 - 196.635 1992 173.333 38.273 1.769 - 213.375 1993 236.900 35.714 2.358 - 274.972 1994 250.680 36.152 2.584 - 289.416 1995 290.332 51.904 2.195 - 344.431 1996 356.711 86.104 893 - 443.708 1997 404.842 100.258 2.286 - 507.386 1998 336.688 75.616 3.368 - 415.672 1999 286.242 47.723 1.871 - 335.836 2000 366.560 72.332 3.339 - 442.231 2001 437.844 71.567 4.147 - 513.558 2002 465.447 51.720 - - 517.167 2003 459.500 52.017 - - 511.517 2004 484.805 77.207 - - 562.012 2005 471.641 89.808 - - 561.449 2006 462.918 87.267 - - 550.185 2007 470.043 106.909 - - 576.952 2008 489.080 114.739 - - 603.819 2009 490.124 108.649 - - 598.773 2010 530.977 120.074 - - 651.051 2011 513.051 130.318 - - 643.369
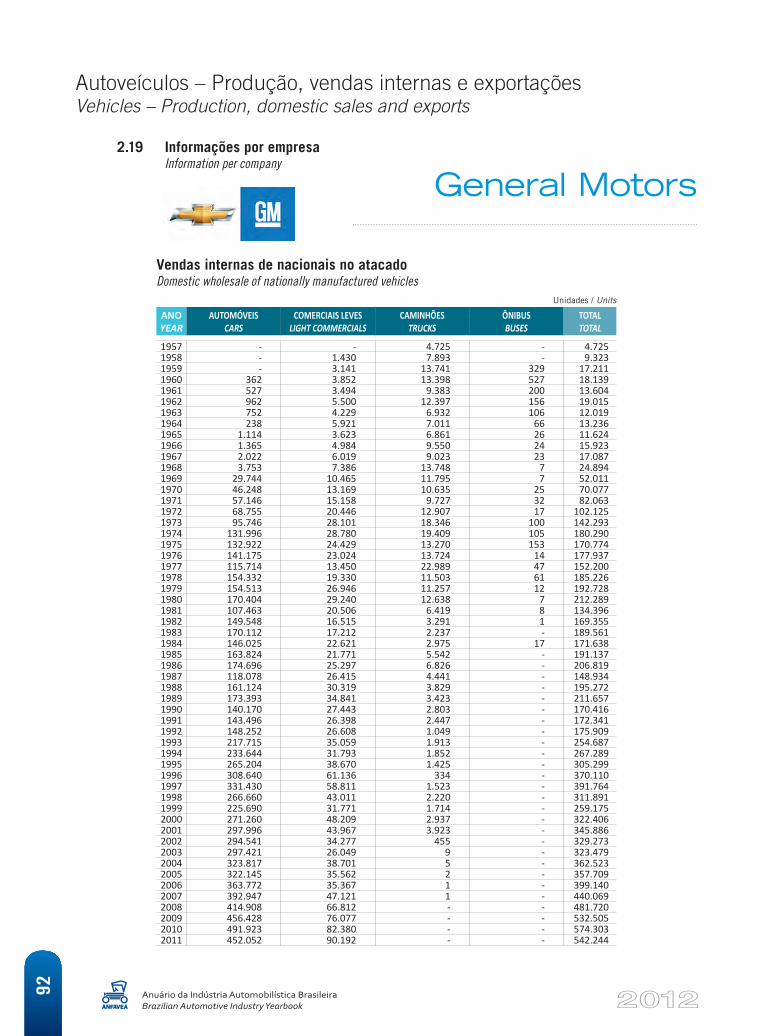
Autoveículos – Produção, vendas internas e exportaçõesVehicles – Production, domestic sales and exports
Anuário da Indústria Automobilística BrasileiraBrazilian Automotive Industry Yearbook
92
2.19 Informações por empresa Information per company
Vendas internas de nacionais no atacado Domestic wholesale of nationally manufactured vehicles
Unidades / Units
ANO YEAR
AUTOMÓVEIS CARS
COMERCIAIS LEVES LIGHT COMMERCIALS
CAMINHÕES TRUCKS
ÔNIBUS BUSES
TOTAL TOTAL
1957 - - 4.725 - 4.725 1958 - 1.430 7.893 - 9.323 1959 - 3.141 13.741 329 17.211 1960 362 3.852 13.398 527 18.139 1961 527 3.494 9.383 200 13.604 1962 962 5.500 12.397 156 19.015 1963 752 4.229 6.932 106 12.019 1964 238 5.921 7.011 66 13.236 1965 1.114 3.623 6.861 26 11.624 1966 1.365 4.984 9.550 24 15.923 1967 2.022 6.019 9.023 23 17.087 1968 3.753 7.386 13.748 7 24.894 1969 29.744 10.465 11.795 7 52.011 1970 46.248 13.169 10.635 25 70.077 1971 57.146 15.158 9.727 32 82.063 1972 68.755 20.446 12.907 17 102.125 1973 95.746 28.101 18.346 100 142.293 1974 131.996 28.780 19.409 105 180.290 1975 132.922 24.429 13.270 153 170.774 1976 141.175 23.024 13.724 14 177.937 1977 115.714 13.450 22.989 47 152.200 1978 154.332 19.330 11.503 61 185.226 1979 154.513 26.946 11.257 12 192.728 1980 170.404 29.240 12.638 7 212.289 1981 107.463 20.506 6.419 8 134.396 1982 149.548 16.515 3.291 1 169.355 1983 170.112 17.212 2.237 - 189.561 1984 146.025 22.621 2.975 17 171.638 1985 163.824 21.771 5.542 - 191.137 1986 174.696 25.297 6.826 - 206.819 1987 118.078 26.415 4.441 - 148.934 1988 161.124 30.319 3.829 - 195.272 1989 173.393 34.841 3.423 - 211.657 1990 140.170 27.443 2.803 - 170.416 1991 143.496 26.398 2.447 - 172.341 1992 148.252 26.608 1.049 - 175.909 1993 217.715 35.059 1.913 - 254.687 1994 233.644 31.793 1.852 - 267.289 1995 265.204 38.670 1.425 - 305.299 1996 308.640 61.136 334 - 370.110 1997 331.430 58.811 1.523 - 391.764 1998 266.660 43.011 2.220 - 311.891 1999 225.690 31.771 1.714 - 259.175 2000 271.260 48.209 2.937 - 322.406 2001 297.996 43.967 3.923 - 345.886 2002 294.541 34.277 455 - 329.273 2003 297.421 26.049 9 - 323.479 2004 323.817 38.701 5 - 362.523 2005 322.145 35.562 2 - 357.709 2006 363.772 35.367 1 - 399.140 2007 392.947 47.121 1 - 440.069 2008 414.908 66.812 - - 481.720 2009 456.428 76.077 - - 532.505 2010 491.923 82.380 - - 574.303 2011 452.052 90.192 - - 542.244
General Motors
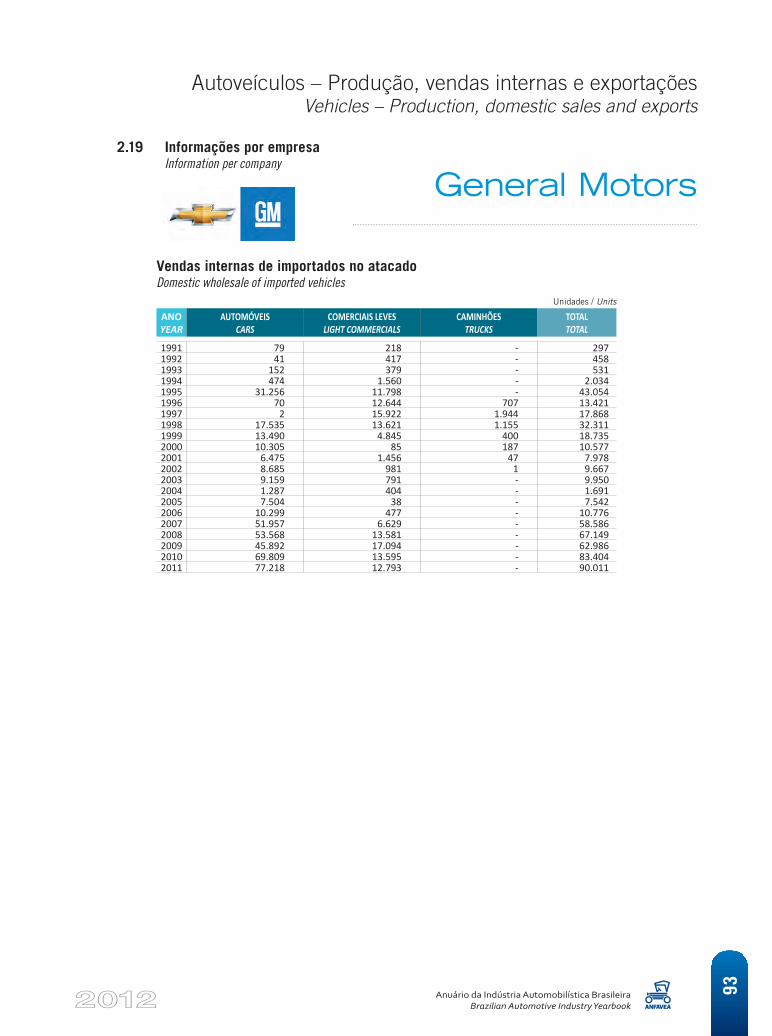
Autoveículos – Produção, vendas internas e exportaçõesVehicles – Production, domestic sales and exports
Anuário da Indústria Automobilística BrasileiraBrazilian Automotive Industry Yearbook
93
2.19 Informações por empresa Information per company
Vendas internas de importados no atacado Domestic wholesale of imported vehicles
Unidades / Units
ANO YEAR
AUTOMÓVEIS CARS
COMERCIAIS LEVES LIGHT COMMERCIALS
CAMINHÕES TRUCKS
TOTAL TOTAL
1991 79 218 - 297 1992 41 417 - 458 1993 152 379 - 531 1994 474 1.560 - 2.034 1995 31.256 11.798 - 43.054 1996 70 12.644 707 13.421 1997 2 15.922 1.944 17.868 1998 17.535 13.621 1.155 32.311 1999 13.490 4.845 400 18.735 2000 10.305 85 187 10.577 2001 6.475 1.456 47 7.978 2002 8.685 981 1 9.667 2003 9.159 791 - 9.950 2004 1.287 404 - 1.691 2005 7.504 38 - 7.542 2006 10.299 477 - 10.776 2007 51.957 6.629 - 58.586 2008 53.568 13.581 - 67.149 2009 45.892 17.094 - 62.986 2010 69.809 13.595 - 83.404 2011 77.218 12.793 - 90.011
General Motors
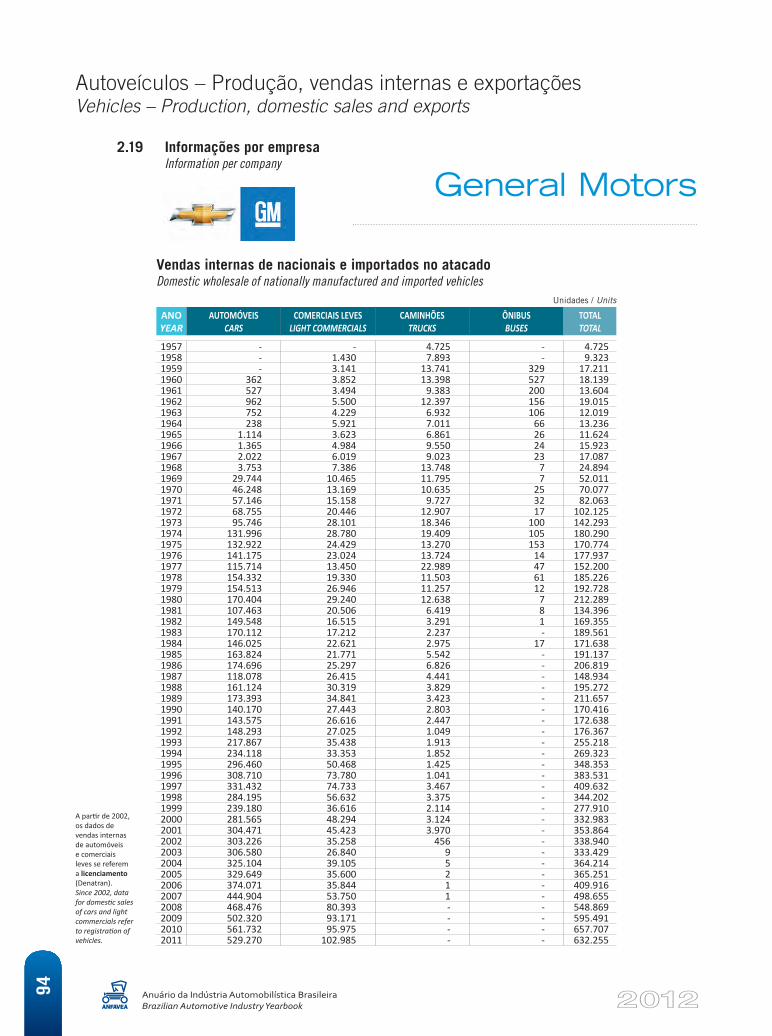
Autoveículos – Produção, vendas internas e exportaçõesVehicles – Production, domestic sales and exports
Anuário da Indústria Automobilística BrasileiraBrazilian Automotive Industry Yearbook
94
2.19 Informações por empresa Information per company
Vendas internas de nacionais e importados no atacado Domestic wholesale of nationally manufactured and imported vehicles
Unidades / Units
ANO YEAR
AUTOMÓVEIS CARS
COMERCIAIS LEVES LIGHT COMMERCIALS
CAMINHÕES TRUCKS
ÔNIBUS BUSES
TOTAL TOTAL
1957 - - 4.725 - 4.725 1958 - 1.430 7.893 - 9.323 1959 - 3.141 13.741 329 17.211 1960 362 3.852 13.398 527 18.139 1961 527 3.494 9.383 200 13.604 1962 962 5.500 12.397 156 19.015 1963 752 4.229 6.932 106 12.019 1964 238 5.921 7.011 66 13.236 1965 1.114 3.623 6.861 26 11.624 1966 1.365 4.984 9.550 24 15.923 1967 2.022 6.019 9.023 23 17.087 1968 3.753 7.386 13.748 7 24.894 1969 29.744 10.465 11.795 7 52.011 1970 46.248 13.169 10.635 25 70.077 1971 57.146 15.158 9.727 32 82.063 1972 68.755 20.446 12.907 17 102.125 1973 95.746 28.101 18.346 100 142.293 1974 131.996 28.780 19.409 105 180.290 1975 132.922 24.429 13.270 153 170.774 1976 141.175 23.024 13.724 14 177.937 1977 115.714 13.450 22.989 47 152.200 1978 154.332 19.330 11.503 61 185.226 1979 154.513 26.946 11.257 12 192.728 1980 170.404 29.240 12.638 7 212.289 1981 107.463 20.506 6.419 8 134.396 1982 149.548 16.515 3.291 1 169.355 1983 170.112 17.212 2.237 - 189.561 1984 146.025 22.621 2.975 17 171.638 1985 163.824 21.771 5.542 - 191.137 1986 174.696 25.297 6.826 - 206.819 1987 118.078 26.415 4.441 - 148.934 1988 161.124 30.319 3.829 - 195.272 1989 173.393 34.841 3.423 - 211.657 1990 140.170 27.443 2.803 - 170.416 1991 143.575 26.616 2.447 - 172.638 1992 148.293 27.025 1.049 - 176.367 1993 217.867 35.438 1.913 - 255.218 1994 234.118 33.353 1.852 - 269.323 1995 296.460 50.468 1.425 - 348.353 1996 308.710 73.780 1.041 - 383.531 1997 331.432 74.733 3.467 - 409.632 1998 284.195 56.632 3.375 - 344.202 1999 239.180 36.616 2.114 - 277.910 2000 281.565 48.294 3.124 - 332.983 2001 304.471 45.423 3.970 - 353.864 2002 303.226 35.258 456 - 338.940 2003 306.580 26.840 9 - 333.429 2004 325.104 39.105 5 - 364.214 2005 329.649 35.600 2 - 365.251 2006 374.071 35.844 1 - 409.916 2007 444.904 53.750 1 - 498.655 2008 468.476 80.393 - - 548.869 2009 502.320 93.171 - - 595.491 2010 561.732 95.975 - - 657.707 2011 529.270 102.985 - - 632.255
A partir de 2002, os dados de vendas internas de automóveis e comerciais leves se referem a licenciamento (Denatran).Since 2002, data for domestic sales of cars and light commercials refer to registration of vehicles.
General Motors
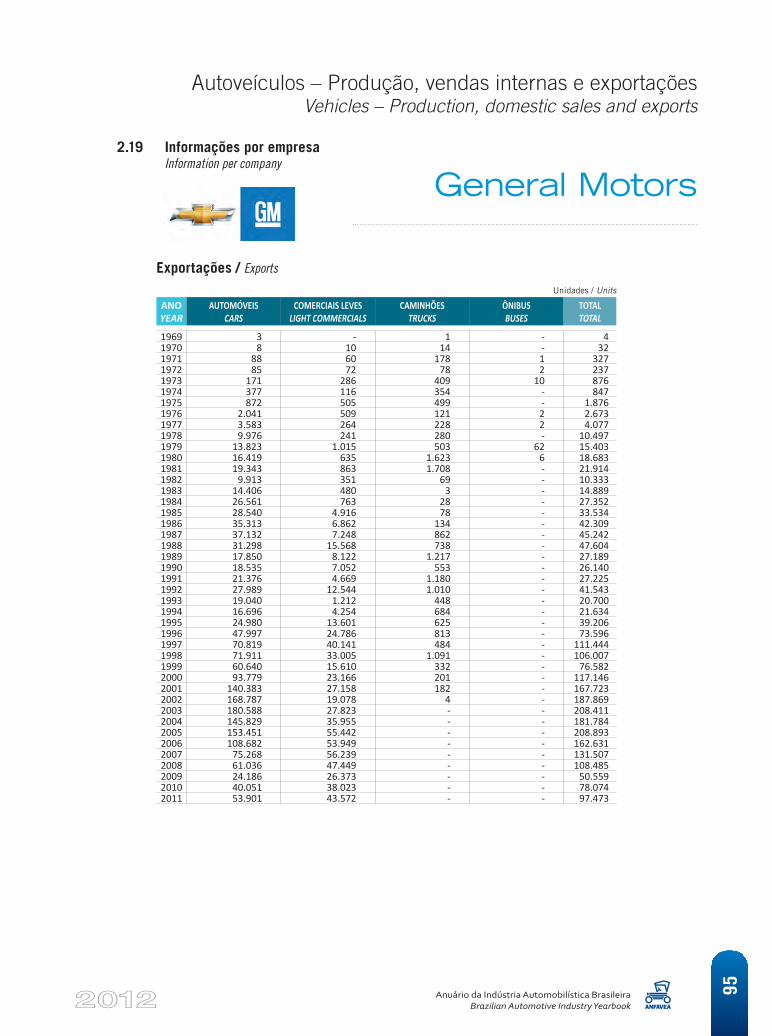
Autoveículos – Produção, vendas internas e exportaçõesVehicles – Production, domestic sales and exports
Anuário da Indústria Automobilística BrasileiraBrazilian Automotive Industry Yearbook
95
2.19 Informações por empresa Information per company
Exportações / Exports
Unidades / Units
ANO YEAR
AUTOMÓVEIS CARS
COMERCIAIS LEVES LIGHT COMMERCIALS
CAMINHÕES TRUCKS
ÔNIBUS BUSES
TOTAL TOTAL
1969 3 - 1 - 4 1970 8 10 14 - 32 1971 88 60 178 1 327 1972 85 72 78 2 237 1973 171 286 409 10 876 1974 377 116 354 - 847 1975 872 505 499 - 1.876 1976 2.041 509 121 2 2.673 1977 3.583 264 228 2 4.0771978 9.976 241 280 - 10.497 1979 13.823 1.015 503 62 15.403 1980 16.419 635 1.623 6 18.683 1981 19.343 863 1.708 - 21.914 1982 9.913 351 69 - 10.333 1983 14.406 480 3 - 14.889 1984 26.561 763 28 - 27.352 1985 28.540 4.916 78 - 33.534 1986 35.313 6.862 134 - 42.309 1987 37.132 7.248 862 - 45.242 1988 31.298 15.568 738 - 47.604 1989 17.850 8.122 1.217 - 27.189 1990 18.535 7.052 553 - 26.140 1991 21.376 4.669 1.180 - 27.225 1992 27.989 12.544 1.010 - 41.543 1993 19.040 1.212 448 - 20.700 1994 16.696 4.254 684 - 21.634 1995 24.980 13.601 625 - 39.206 1996 47.997 24.786 813 - 73.596 1997 70.819 40.141 484 - 111.444 1998 71.911 33.005 1.091 - 106.007 1999 60.640 15.610 332 - 76.582 2000 93.779 23.166 201 - 117.146 2001 140.383 27.158 182 - 167.723 2002 168.787 19.078 4 - 187.869 2003 180.588 27.823 - - 208.411 2004 145.829 35.955 - - 181.784 2005 153.451 55.442 - - 208.893 2006 108.682 53.949 - - 162.631 2007 75.268 56.239 - - 131.507 2008 61.036 47.449 - - 108.485 2009 24.186 26.373 - - 50.559 2010 40.051 38.023 - - 78.074 2011 53.901 43.572 - - 97.473
General Motors
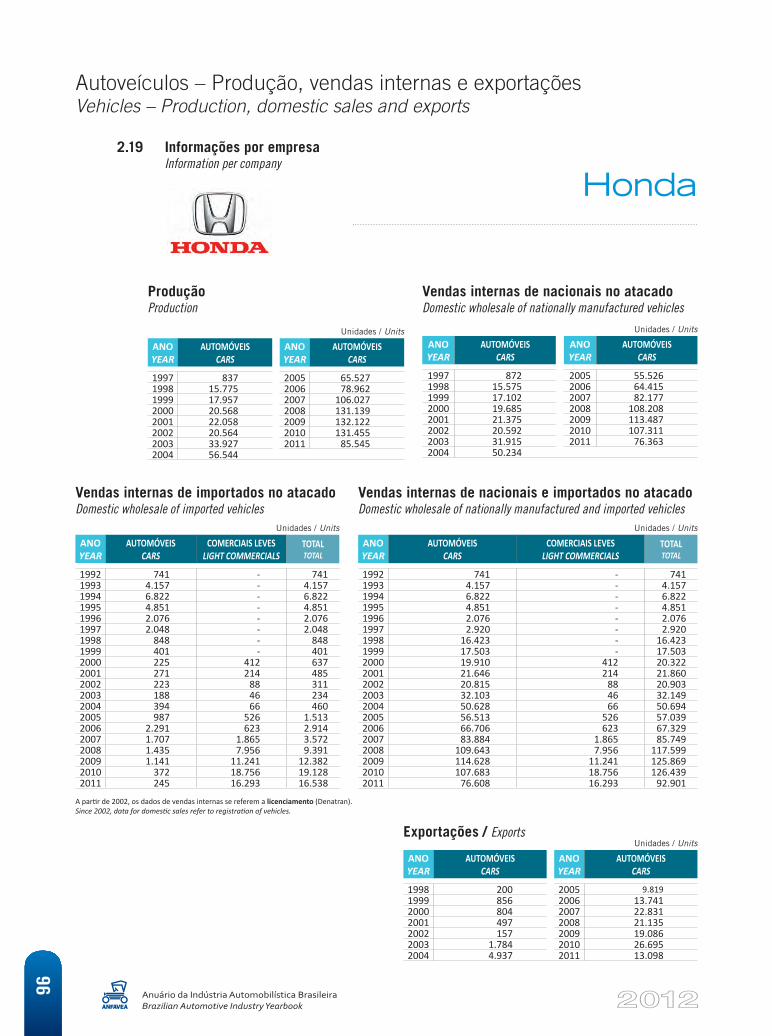
Autoveículos – Produção, vendas internas e exportaçõesVehicles – Production, domestic sales and exports
Anuário da Indústria Automobilística BrasileiraBrazilian Automotive Industry Yearbook
96
A partir de 2002, os dados de vendas internas se referem a licenciamento (Denatran). Since 2002, data for domestic sales refer to registration of vehicles.
2.19 Informações por empresa Information per company
Exportações / ExportsUnidades / Units
ANO YEAR
AUTOMÓVEIS CARS
ANO YEAR
AUTOMÓVEIS CARS
1998 200 2005 9.819 1999 856 2006 13.741 2000 804 2007 22.831 2001 497 2008 21.135 2002 157 2009 19.086 2003 1.784 2010 26.695 2004 4.937 2011 13.098
ProduçãoProduction
Unidades / Units
ANO YEAR
AUTOMÓVEIS CARS
ANO YEAR
AUTOMÓVEIS CARS
1997 837 2005 65.527 1998 15.775 2006 78.962 1999 17.957 2007 106.027 2000 20.568 2008 131.139 2001 22.058 2009 132.122 2002 20.564 2010 131.455 2003 33.927 2011 85.545 2004 56.544
Vendas internas de nacionais no atacadoDomestic wholesale of nationally manufactured vehicles
Unidades / Units
ANO YEAR
AUTOMÓVEIS CARS
ANO YEAR
AUTOMÓVEIS CARS
1997 872 2005 55.526 1998 15.575 2006 64.415 1999 17.102 2007 82.177 2000 19.685 2008 108.208 2001 21.375 2009 113.487 2002 20.592 2010 107.311 2003 31.915 2011 76.363 2004 50.234
Vendas internas de importados no atacadoDomestic wholesale of imported vehicles
Unidades / Units
ANO YEAR
AUTOMÓVEIS CARS
COMERCIAIS LEVES LIGHT COMMERCIALS
TOTALTOTAL
1992 741 - 741 1993 4.157 - 4.157 1994 6.822 - 6.822 1995 4.851 - 4.851 1996 2.076 - 2.076 1997 2.048 - 2.048 1998 848 - 848 1999 401 - 401 2000 225 412 637 2001 271 214 485 2002 223 88 311 2003 188 46 234 2004 394 66 460 2005 987 526 1.513 2006 2.291 623 2.914 2007 1.707 1.865 3.572 2008 1.435 7.956 9.391 2009 1.141 11.241 12.382 2010 372 18.756 19.128 2011 245 16.293 16.538
Vendas internas de nacionais e importados no atacadoDomestic wholesale of nationally manufactured and imported vehicles
Unidades / Units
ANO YEAR
AUTOMÓVEIS CARS
COMERCIAIS LEVES LIGHT COMMERCIALS
TOTALTOTAL
1992 741 - 741 1993 4.157 - 4.157 1994 6.822 - 6.822 1995 4.851 - 4.851 1996 2.076 - 2.076 1997 2.920 - 2.920 1998 16.423 - 16.423 1999 17.503 - 17.503 2000 19.910 412 20.322 2001 21.646 214 21.860 2002 20.815 88 20.903 2003 32.103 46 32.149 2004 50.628 66 50.694 2005 56.513 526 57.039 2006 66.706 623 67.329 2007 83.884 1.865 85.749 2008 109.643 7.956 117.599 2009 114.628 11.241 125.869 2010 107.683 18.756 126.439 2011 76.608 16.293 92.901
Honda
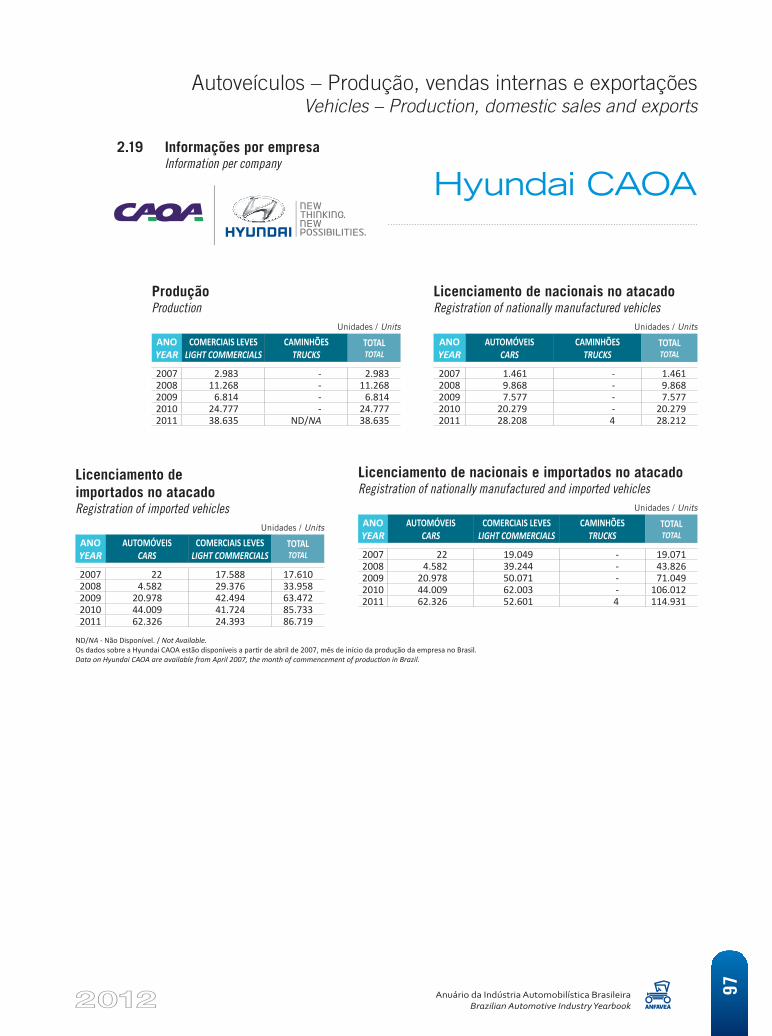
Autoveículos – Produção, vendas internas e exportaçõesVehicles – Production, domestic sales and exports
Anuário da Indústria Automobilística BrasileiraBrazilian Automotive Industry Yearbook
97
ProduçãoProduction
Unidades / Units
ANO YEAR
COMERCIAIS LEVES LIGHT COMMERCIALS
CAMINHÕES TRUCKS
TOTALTOTAL
2007 2.983 - 2.983 2008 11.268 - 11.268 2009 6.814 - 6.814 2010 24.777 - 24.777 2011 38.635 ND/NA 38.635
Licenciamento de nacionais no atacadoRegistration of nationally manufactured vehicles
Unidades / Units
ANO YEAR
AUTOMÓVEIS CARS
CAMINHÕES TRUCKS
TOTALTOTAL
2007 1.461 - 1.461 2008 9.868 - 9.868 2009 7.577 - 7.577 2010 20.279 - 20.279 2011 28.208 4 28.212
ND/NA - Não Disponível. / Not Available.Os dados sobre a Hyundai CAOA estão disponíveis a partir de abril de 2007, mês de início da produção da empresa no Brasil. Data on Hyundai CAOA are available from April 2007, the month of commencement of production in Brazil.
2.19 Informações por empresa Information per company
Licenciamento de importados no atacadoRegistration of imported vehicles
Unidades / Units
ANO YEAR
AUTOMÓVEIS CARS
COMERCIAIS LEVES LIGHT COMMERCIALS
TOTALTOTAL
2007 22 17.588 17.610 2008 4.582 29.376 33.958 2009 20.978 42.494 63.472 2010 44.009 41.724 85.733 2011 62.326 24.393 86.719
Licenciamento de nacionais e importados no atacadoRegistration of nationally manufactured and imported vehicles
Unidades / Units
ANO YEAR
AUTOMÓVEIS CARS
COMERCIAIS LEVES LIGHT COMMERCIALS
CAMINHÕES TRUCKS
TOTALTOTAL
2007 22 19.049 - 19.071 2008 4.582 39.244 - 43.826 2009 20.978 50.071 - 71.049 2010 44.009 62.003 - 106.012 2011 62.326 52.601 4 114.931
Hyundai CAOA
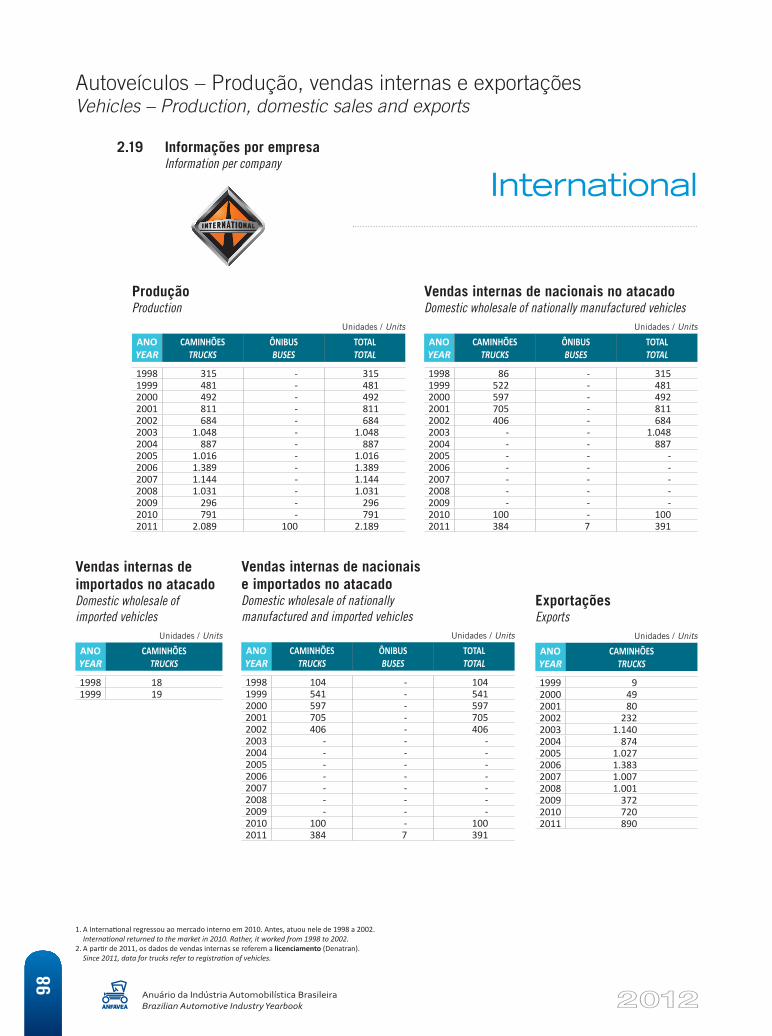
Autoveículos – Produção, vendas internas e exportaçõesVehicles – Production, domestic sales and exports
Anuário da Indústria Automobilística BrasileiraBrazilian Automotive Industry Yearbook
98
2.19 Informações por empresa Information per company
ProduçãoProduction
Unidades / Units
ANO YEAR
CAMINHÕES TRUCKS
ÔNIBUS BUSES
TOTAL TOTAL
1998 315 - 315 1999 481 - 481 2000 492 - 492 2001 811 - 811 2002 684 - 684 2003 1.048 - 1.048 2004 887 - 887 2005 1.016 - 1.016 2006 1.389 - 1.389 2007 1.144 - 1.144 2008 1.031 - 1.031 2009 296 - 296 2010 791 - 791 2011 2.089 100 2.189
Vendas internas de nacionais no atacadoDomestic wholesale of nationally manufactured vehicles
Unidades / Units
ANO YEAR
CAMINHÕES TRUCKS
ÔNIBUS BUSES
TOTAL TOTAL
1998 86 - 315 1999 522 - 481 2000 597 - 492 2001 705 - 811 2002 406 - 684 2003 - - 1.048 2004 - - 887 2005 - - - 2006 - - - 2007 - - - 2008 - - - 2009 - - - 2010 100 - 100 2011 384 7 391
Vendas internas de nacionaise importados no atacadoDomestic wholesale of nationally manufactured and imported vehicles
Unidades / Units
ANO YEAR
CAMINHÕES TRUCKS
ÔNIBUS BUSES
TOTAL TOTAL
1998 104 - 104 1999 541 - 541 2000 597 - 597 2001 705 - 705 2002 406 - 406 2003 - - - 2004 - - - 2005 - - - 2006 - - - 2007 - - - 2008 - - - 2009 - - - 2010 100 - 100 2011 384 7 391
ExportaçõesExports
Unidades / Units
ANO YEAR
CAMINHÕES TRUCKS
1999 9 2000 49 2001 80 2002 232 2003 1.140 2004 874 2005 1.027 2006 1.383 2007 1.007 2008 1.001 2009 372 2010 720 2011 890
Vendas internas de importados no atacadoDomestic wholesale of imported vehicles
Unidades / Units
ANO YEAR
CAMINHÕES TRUCKS
1998 181999 19
International
1. A International regressou ao mercado interno em 2010. Antes, atuou nele de 1998 a 2002. International returned to the market in 2010. Rather, it worked from 1998 to 2002.
2. A partir de 2011, os dados de vendas internas se referem a licenciamento (Denatran). Since 2011, data for trucks refer to registration of vehicles.
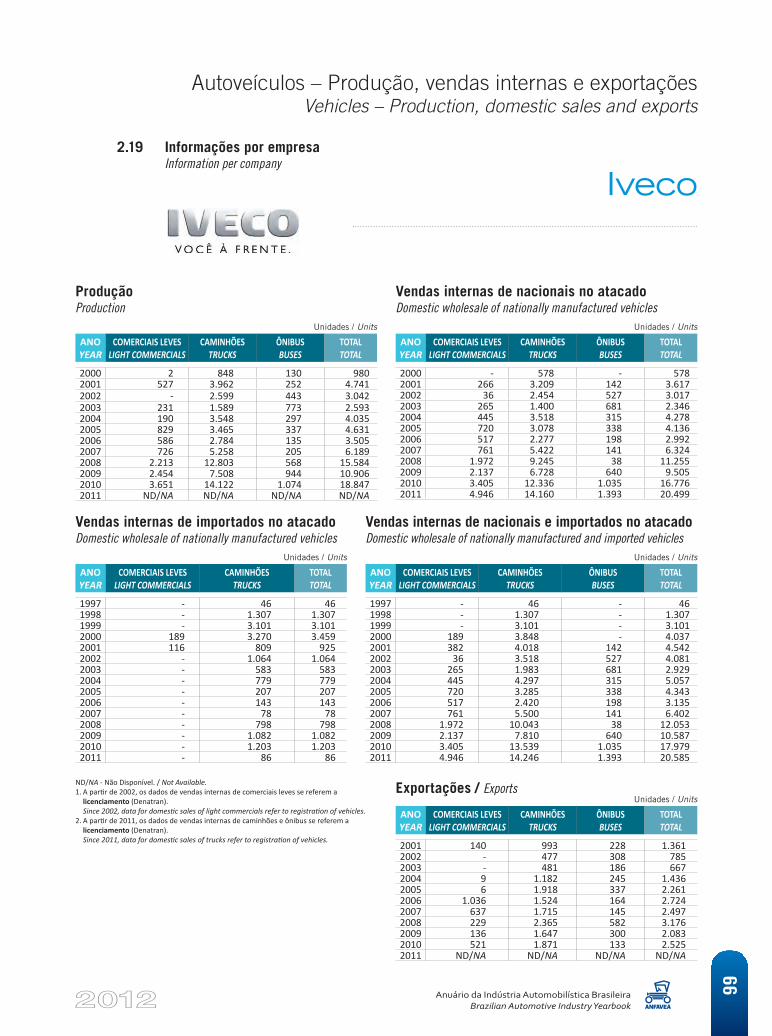
Autoveículos – Produção, vendas internas e exportaçõesVehicles – Production, domestic sales and exports
Anuário da Indústria Automobilística BrasileiraBrazilian Automotive Industry Yearbook
99
2.19 Informações por empresa Information per company
ProduçãoProduction
Unidades / Units
ANO YEAR
COMERCIAIS LEVES LIGHT COMMERCIALS
CAMINHÕES TRUCKS
ÔNIBUS BUSES
TOTAL TOTAL
2000 2 848 130 980 2001 527 3.962 252 4.741 2002 - 2.599 443 3.042 2003 231 1.589 773 2.593 2004 190 3.548 297 4.035 2005 829 3.465 337 4.631 2006 586 2.784 135 3.505 2007 726 5.258 205 6.189 2008 2.213 12.803 568 15.584 2009 2.454 7.508 944 10.906 2010 3.651 14.122 1.074 18.847 2011 ND/NA ND/NA ND/NA ND/NA
Exportações / ExportsUnidades / Units
ANO YEAR
COMERCIAIS LEVES LIGHT COMMERCIALS
CAMINHÕES TRUCKS
ÔNIBUS BUSES
TOTAL TOTAL
2001 140 993 228 1.361 2002 - 477 308 785 2003 - 481 186 667 2004 9 1.182 245 1.436 2005 6 1.918 337 2.261 2006 1.036 1.524 164 2.724 2007 637 1.715 145 2.497 2008 229 2.365 582 3.176 2009 136 1.647 300 2.083 2010 521 1.871 133 2.525 2011 ND/NA ND/NA ND/NA ND/NA
Vendas internas de importados no atacadoDomestic wholesale of nationally manufactured vehicles
Unidades / Units
ANO YEAR
COMERCIAIS LEVES LIGHT COMMERCIALS
CAMINHÕES TRUCKS
TOTAL TOTAL
1997 - 46 46 1998 - 1.307 1.307 1999 - 3.101 3.101 2000 189 3.270 3.459 2001 116 809 925 2002 - 1.064 1.064 2003 - 583 583 2004 - 779 779 2005 - 207 207 2006 - 143 143 2007 - 78 78 2008 - 798 798 2009 - 1.082 1.082 2010 - 1.203 1.203 2011 - 86 86
Vendas internas de nacionais no atacadoDomestic wholesale of nationally manufactured vehicles
Unidades / Units
ANO YEAR
COMERCIAIS LEVES LIGHT COMMERCIALS
CAMINHÕES TRUCKS
ÔNIBUS BUSES
TOTAL TOTAL
2000 - 578 - 578 2001 266 3.209 142 3.617 2002 36 2.454 527 3.017 2003 265 1.400 681 2.346 2004 445 3.518 315 4.278 2005 720 3.078 338 4.136 2006 517 2.277 198 2.992 2007 761 5.422 141 6.324 2008 1.972 9.245 38 11.255 2009 2.137 6.728 640 9.505 2010 3.405 12.336 1.035 16.776 2011 4.946 14.160 1.393 20.499
Vendas internas de nacionais e importados no atacadoDomestic wholesale of nationally manufactured and imported vehicles
Unidades / Units
ANO YEAR
COMERCIAIS LEVES LIGHT COMMERCIALS
CAMINHÕES TRUCKS
ÔNIBUS BUSES
TOTAL TOTAL
1997 - 46 - 46 1998 - 1.307 - 1.307 1999 - 3.101 - 3.101 2000 189 3.848 - 4.037 2001 382 4.018 142 4.542 2002 36 3.518 527 4.081 2003 265 1.983 681 2.929 2004 445 4.297 315 5.057 2005 720 3.285 338 4.343 2006 517 2.420 198 3.135 2007 761 5.500 141 6.402 2008 1.972 10.043 38 12.053 2009 2.137 7.810 640 10.587 2010 3.405 13.539 1.035 17.979 2011 4.946 14.246 1.393 20.585
Iveco
ND/NA - Não Disponível. / Not Available.1. A partir de 2002, os dados de vendas internas de comerciais leves se referem a
licenciamento (Denatran). Since 2002, data for domestic sales of light commercials refer to registration of vehicles.
2. A partir de 2011, os dados de vendas internas de caminhões e ônibus se referem a licenciamento (Denatran). Since 2011, data for domestic sales of trucks refer to registration of vehicles.
Autoveículos – Produção, vendas internas e exportaçõesVehicles – Production, domestic sales and exports
Anuário da Indústria Automobilística BrasileiraBrazilian Automotive Industry Yearbook10
0
ProduçãoProduction
Unidades / Units
ANO YEAR
COMERCIAIS LEVES LIGHT COMMERCIALS
2007 58 2008 405 2009 559 2010 415 2011 597
Licenciamento de nacionaisRegistration of domestic nationally manufactured vehicles
Unidades / Units
ANO YEAR
COMERCIAIS LEVES LIGHT COMMERCIALS
2007 6 2008 270 2009 502 2010 508 2011 457
2.19 Informações por empresa Information per company
Mahindra Bramontby Bramont
Autoveículos – Produção, vendas internas e exportaçõesVehicles – Production, domestic sales and exports
Anuário da Indústria Automobilística BrasileiraBrazilian Automotive Industry Yearbook 10
1
2.19 Informações por empresa Information per company
ProduçãoProduction
Unidades / Units
ANO YEAR
CAMINHÕES TRUCKS
ÔNIBUS BUSES
TOTAL TOTAL
1981 1.488 - 1.488 1982 2.073 - 2.073 1983 2.594 - 2.594 1984 5.396 - 5.396 1985 11.987 - 11.987 1986 15.245 - 15.245 1987 11.548 74 11.622 1988 9.261 346 9.607 1989 8.163 357 8.520 1990 7.988 139 8.127 1991 5.997 133 6.130 1992 3.124 217 3.341 1993 6.212 1.471 7.683 1994 8.642 1.218 9.860 1995 14.353 2.008 16.361 1996 10.461 1.190 11.651 1997 6.697 2.042 8.739 1998 9.833 2.783 12.616 1999 10.641 1.741 12.382 2000 14.631 3.951 18.582 2001 18.989 4.639 23.628 2002 18.570 5.051 23.621 2003 22.649 6.370 29.019 2004 29.271 4.984 34.255 2005 32.781 5.680 38.461 2006 28.632 6.751 35.383 2007 39.328 7.889 47.217 2008 46.029 9.969 55.998 2009 36.994 7.859 44.853 2010 57.442 10.625 68.067 2011 69.275 13.831 83.106
Vendas internas de nacionais no atacadoDomestic wholesale of nationally manufactured vehicles
Unidades / Units
ANO YEAR
CAMINHÕES TRUCKS
ÔNIBUS BUSES
TOTAL TOTAL
1981 1.344 - 1.344 1982 2.060 - 2.060 1983 2.561 - 2.561 1984 5.016 - 5.016 1985 10.262 - 10.262 1986 14.518 - 14.518 1987 9.883 46 9.929 1988 7.536 141 7.677 1989 6.419 140 6.559 1990 7.106 101 7.207 1991 5.408 105 5.513 1992 2.981 73 3.054 1993 5.113 1.099 6.212 1994 8.381 1.289 9.670 1995 10.636 1.549 12.185 1996 7.417 1.320 8.737 1997 8.337 2.301 10.638 1998 8.700 2.521 11.221 1999 9.573 1.760 11.333 2000 13.660 3.451 17.111 2001 17.844 3.985 21.829 2002 18.184 4.311 22.495 2003 20.752 5.400 26.152 2004 25.053 3.702 28.755 2005 23.532 3.511 27.043 2006 22.404 4.924 27.328 2007 29.676 6.779 36.455 2008 37.112 7.862 44.974 2009 34.341 6.727 41.068 2010 48.649 8.715 57.364 2011 50.815 11.139 61.954
Vendas internas importados no atacadoDomestic wholesale of imported vehicles
Unidades / Units
ANO YEAR
CAMINHÕES TRUCKS
ÔNIBUS BUSES
TOTAL TOTAL
2011 6 - 6
MAN
Autoveículos – Produção, vendas internas e exportaçõesVehicles – Production, domestic sales and exports
Anuário da Indústria Automobilística BrasileiraBrazilian Automotive Industry Yearbook10
2
2.19 Informações por empresa Information per company
ExportaçõesExports
Unidades / Units
ANO YEAR
CAMINHÕES TRUCKS
ÔNIBUS BUSES
TOTAL TOTAL
1981 37 - 37 1982 11 - 11 1983 121 - 121 1984 355 - 355 1985 1.523 - 1.523 1986 649 - 649 1987 1.657 39 1.696 1988 1.849 199 2.048 1989 1.865 221 2.086 1990 736 36 772 1991 231 6 237 1992 615 127 742 1993 719 136 855 1994 608 125 733 1995 1.982 45 2.027 1996 1.138 53 1.191 1997 1.735 46 1.781 1998 1.066 257 1.323 1999 1.072 47 1.119 2000 1.316 387 1.703 2001 766 585 1.351 2002 710 695 1.405 2003 1.917 826 2.743 2004 4.142 1.585 5.727 2005 7.141 1.738 8.879 2006 7.777 2.086 9.863 2007 9.578 1.217 10.795 2008 6.964 1.667 8.631 2009 3.954 1.226 5.180 2010 6.401 1.603 8.004 2011 7.660 1.747 9.407
Vendas internas de nacionais e importados no atacadoDomestic wholesale of nationally manufactured and imported vehicles
Unidades / Units
ANO YEAR
CAMINHÕES TRUCKS
ÔNIBUS BUSES
TOTAL TOTAL
1981 1.344 - 1.344 1982 2.060 - 2.060 1983 2.561 - 2.561 1984 5.016 - 5.016 1985 10.262 - 10.262 1986 14.518 - 14.518 1987 9.883 46 9.929 1988 7.536 141 7.677 1989 6.419 140 6.559 1990 7.106 101 7.207 1991 5.408 105 5.513 1992 2.981 73 3.054 1993 5.113 1.099 6.212 1994 8.381 1.289 9.670 1995 10.636 1.549 12.185 1996 7.417 1.320 8.737 1997 8.337 2.301 10.638 1998 8.700 2.521 11.221 1999 9.573 1.760 11.333 2000 13.660 3.451 17.111 2001 17.844 3.985 21.829 2002 18.184 4.311 22.495 2003 20.752 5.400 26.152 2004 25.053 3.702 28.755 2005 23.532 3.511 27.043 2006 22.404 4.924 27.328 2007 29.676 6.779 36.455 2008 37.112 7.862 44.974 2009 34.341 6.727 41.068 2010 48.649 8.715 57.364 2011 50.821 11.139 61.960
MAN
A partir de 2011, os dados de vendas internas de caminhões e ônibus se referem a licenciamento (Denatran).Since 2011, data for domestic sales of trucks and buses refer to registration of vehicles.
Autoveículos – Produção, vendas internas e exportaçõesVehicles – Production, domestic sales and exports
Anuário da Indústria Automobilística BrasileiraBrazilian Automotive Industry Yearbook 10
3
2.19 Informações por empresa Information per company
Produção Production
Unidades / Units
ANO YEAR
AUTOMÓVEIS CARS
COMERCIAIS LEVES LIGHT COMMERCIALS
CAMINHÕES TRUCKS
ÔNIBUS BUSES
TOTAL TOTAL
1957 - - 3.769 1.748 5.517 1958 - - 7.677 3.382 11.059 1959 - - 7.271 2.547 9.818 1960 - - 6.608 3.081 9.689 1961 - - 3.905 3.088 6.993 1962 - - 5.728 3.209 8.937 1963 - - 3.669 2.028 5.697 1964 - - 3.903 2.346 6.249 1965 - - 4.329 2.528 6.857 1966 - - 7.824 3.611 11.435 1967 - - 7.791 4.303 12.094 1968 - - 10.700 6.036 16.736 1969 - - 12.276 5.002 17.278 1970 - - 14.347 3.348 17.695 1971 - - 15.922 3.928 19.850 1972 - - 21.476 4.796 26.272 1973 - - 26.771 5.793 32.564 1974 - - 30.115 7.431 37.546 1975 - - 34.325 9.275 43.600 1976 - - 37.543 11.274 48.817 1977 - - 40.487 12.470 52.957 1978 - - 45.726 13.050 58.776 1979 - - 46.701 12.242 58.943 1980 - - 46.989 13.041 60.030 1981 - - 36.958 11.941 48.899 1982 - - 24.341 8.328 32.669 1983 - - 17.058 5.197 22.255 1984 - - 23.065 6.246 29.311 1985 - - 26.075 6.937 33.012 1986 - - 33.885 9.559 43.444 1987 - - 31.659 11.820 43.479 1988 - - 30.300 15.491 45.791 1989 - - 26.418 11.750 38.168 1990 - - 18.918 12.246 31.164 1991 - - 22.364 19.120 41.484 1992 - - 14.186 19.962 34.148 1993 - - 19.108 14.571 33.679 1994 - - 27.434 13.091 40.525 1995 - - 27.059 14.194 41.253 1996 - - 17.864 12.780 30.644 1997 - - 25.039 15.438 40.477 1998 - - 24.886 14.474 39.360 1999 14.307 - 21.817 9.799 45.923 2000 15.682 - 25.763 12.504 53.949 2001 9.041 1.755 23.653 12.159 46.608 2002 8.168 - 21.021 11.844 41.033 2003 6.989 - 23.507 14.050 44.546 2004 5.560 - 32.157 16.664 54.381 2005 3.655 - 32.333 20.739 56.727 2006 - - 29.546 20.783 50.329 2007 8.349 - 37.195 21.816 67.360 2008 27.095 - 43.363 22.623 93.081 2009 15.211 - 34.231 18.894 68.336 2010 12.260 - 47.089 26.591 85.940 2011 - - ND/NA ND/NA ND/NA
Mercedes-Benz
ND/NA - Não Disponível. / Not Available.
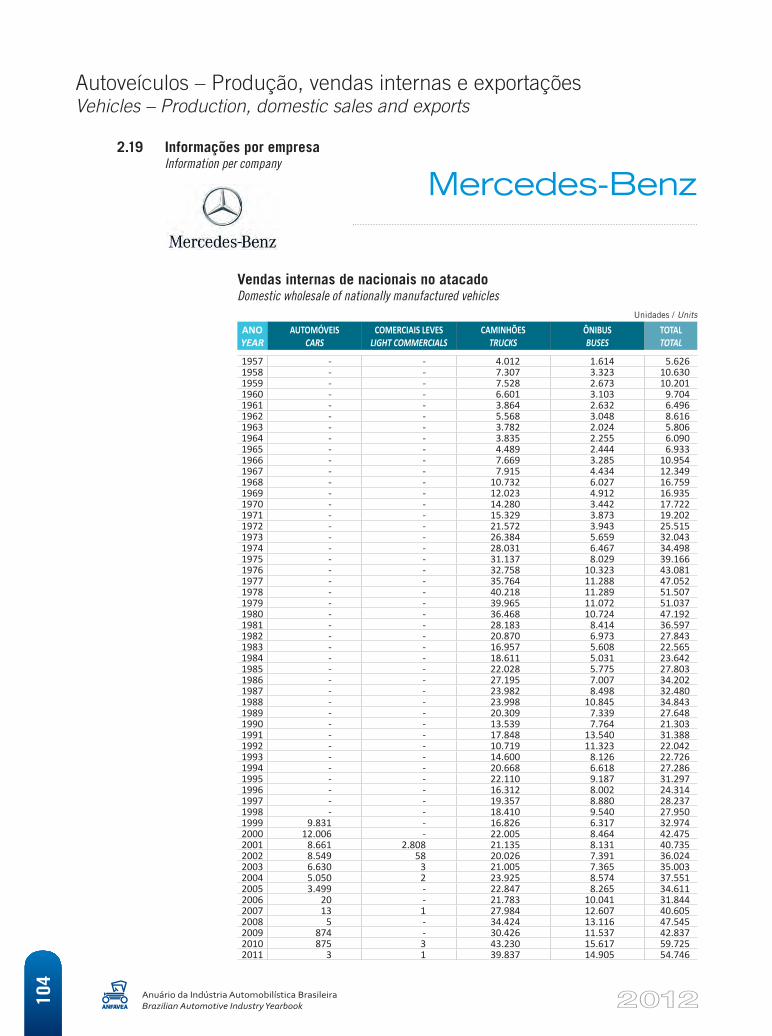
Autoveículos – Produção, vendas internas e exportaçõesVehicles – Production, domestic sales and exports
Anuário da Indústria Automobilística BrasileiraBrazilian Automotive Industry Yearbook10
4
2.19 Informações por empresa Information per company
Vendas internas de nacionais no atacadoDomestic wholesale of nationally manufactured vehicles
Unidades / Units
ANO YEAR
AUTOMÓVEIS CARS
COMERCIAIS LEVES LIGHT COMMERCIALS
CAMINHÕES TRUCKS
ÔNIBUS BUSES
TOTAL TOTAL
1957 - - 4.012 1.614 5.626 1958 - - 7.307 3.323 10.630 1959 - - 7.528 2.673 10.201 1960 - - 6.601 3.103 9.704 1961 - - 3.864 2.632 6.496 1962 - - 5.568 3.048 8.616 1963 - - 3.782 2.024 5.806 1964 - - 3.835 2.255 6.090 1965 - - 4.489 2.444 6.933 1966 - - 7.669 3.285 10.954 1967 - - 7.915 4.434 12.349 1968 - - 10.732 6.027 16.759 1969 - - 12.023 4.912 16.935 1970 - - 14.280 3.442 17.722 1971 - - 15.329 3.873 19.202 1972 - - 21.572 3.943 25.515 1973 - - 26.384 5.659 32.043 1974 - - 28.031 6.467 34.498 1975 - - 31.137 8.029 39.166 1976 - - 32.758 10.323 43.081 1977 - - 35.764 11.288 47.052 1978 - - 40.218 11.289 51.507 1979 - - 39.965 11.072 51.037 1980 - - 36.468 10.724 47.192 1981 - - 28.183 8.414 36.597 1982 - - 20.870 6.973 27.843 1983 - - 16.957 5.608 22.565 1984 - - 18.611 5.031 23.642 1985 - - 22.028 5.775 27.803 1986 - - 27.195 7.007 34.202 1987 - - 23.982 8.498 32.480 1988 - - 23.998 10.845 34.843 1989 - - 20.309 7.339 27.648 1990 - - 13.539 7.764 21.303 1991 - - 17.848 13.540 31.388 1992 - - 10.719 11.323 22.042 1993 - - 14.600 8.126 22.726 1994 - - 20.668 6.618 27.286 1995 - - 22.110 9.187 31.297 1996 - - 16.312 8.002 24.314 1997 - - 19.357 8.880 28.237 1998 - - 18.410 9.540 27.950 1999 9.831 - 16.826 6.317 32.974 2000 12.006 - 22.005 8.464 42.475 2001 8.661 2.808 21.135 8.131 40.735 2002 8.549 58 20.026 7.391 36.024 2003 6.630 3 21.005 7.365 35.003 2004 5.050 2 23.925 8.574 37.551 2005 3.499 - 22.847 8.265 34.611 2006 20 - 21.783 10.041 31.844 2007 13 1 27.984 12.607 40.605 2008 5 - 34.424 13.116 47.545 2009 874 - 30.426 11.537 42.837 2010 875 3 43.230 15.617 59.725 2011 3 1 39.837 14.905 54.746
Mercedes-Benz
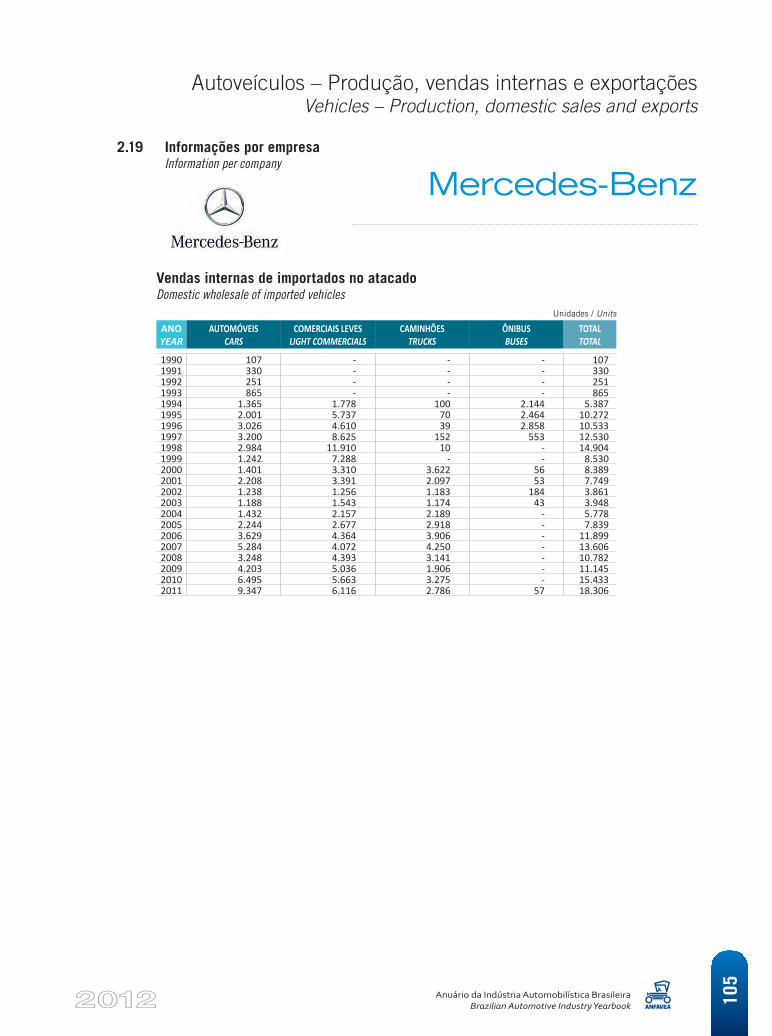
Autoveículos – Produção, vendas internas e exportaçõesVehicles – Production, domestic sales and exports
Anuário da Indústria Automobilística BrasileiraBrazilian Automotive Industry Yearbook 10
5
Vendas internas de importados no atacadoDomestic wholesale of imported vehicles
Unidades / Units
ANO YEAR
AUTOMÓVEIS CARS
COMERCIAIS LEVES LIGHT COMMERCIALS
CAMINHÕES TRUCKS
ÔNIBUS BUSES
TOTAL TOTAL
1990 107 - - - 107 1991 330 - - - 330 1992 251 - - - 251 1993 865 - - - 865 1994 1.365 1.778 100 2.144 5.387 1995 2.001 5.737 70 2.464 10.272 1996 3.026 4.610 39 2.858 10.533 1997 3.200 8.625 152 553 12.530 1998 2.984 11.910 10 - 14.904 1999 1.242 7.288 - - 8.530 2000 1.401 3.310 3.622 56 8.389 2001 2.208 3.391 2.097 53 7.749 2002 1.238 1.256 1.183 184 3.861 2003 1.188 1.543 1.174 43 3.948 2004 1.432 2.157 2.189 - 5.778 2005 2.244 2.677 2.918 - 7.839 2006 3.629 4.364 3.906 - 11.899 2007 5.284 4.072 4.250 - 13.606 2008 3.248 4.393 3.141 - 10.782 2009 4.203 5.036 1.906 - 11.145 2010 6.495 5.663 3.275 - 15.433 2011 9.347 6.116 2.786 57 18.306
2.19 Informações por empresa Information per company
Mercedes-Benz
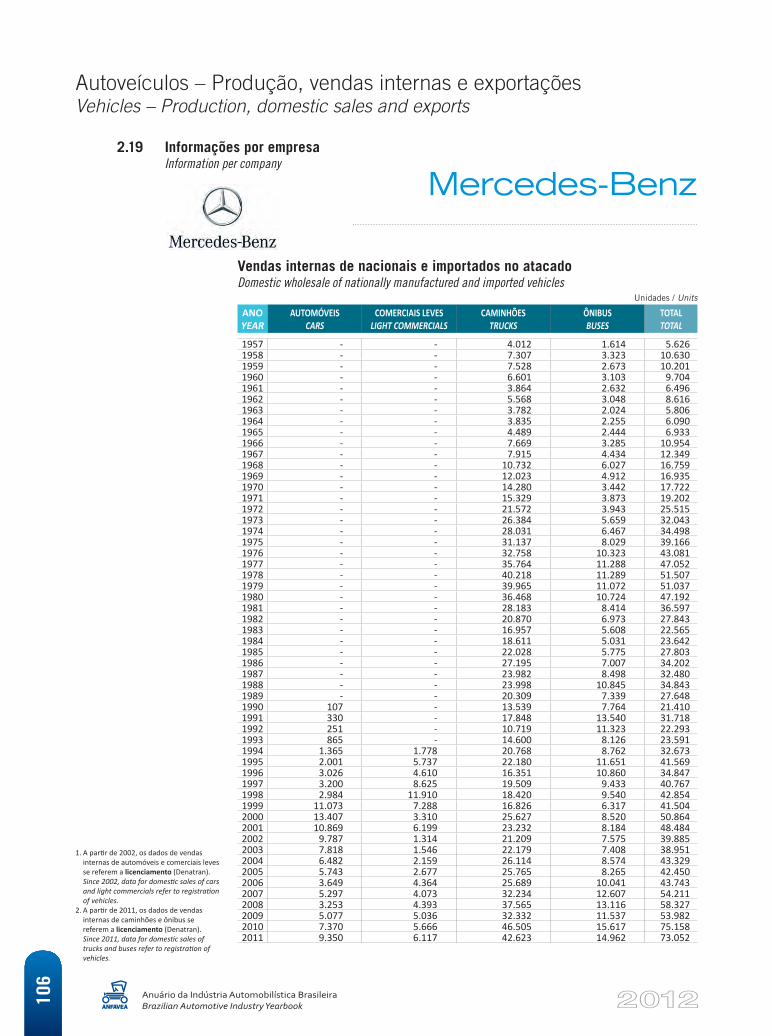
Autoveículos – Produção, vendas internas e exportaçõesVehicles – Production, domestic sales and exports
Anuário da Indústria Automobilística BrasileiraBrazilian Automotive Industry Yearbook10
6
Vendas internas de nacionais e importados no atacadoDomestic wholesale of nationally manufactured and imported vehicles
Unidades / Units
ANO YEAR
AUTOMÓVEIS CARS
COMERCIAIS LEVES LIGHT COMMERCIALS
CAMINHÕES TRUCKS
ÔNIBUS BUSES
TOTAL TOTAL
1957 - - 4.012 1.614 5.626 1958 - - 7.307 3.323 10.630 1959 - - 7.528 2.673 10.201 1960 - - 6.601 3.103 9.704 1961 - - 3.864 2.632 6.496 1962 - - 5.568 3.048 8.616 1963 - - 3.782 2.024 5.806 1964 - - 3.835 2.255 6.090 1965 - - 4.489 2.444 6.933 1966 - - 7.669 3.285 10.954 1967 - - 7.915 4.434 12.349 1968 - - 10.732 6.027 16.759 1969 - - 12.023 4.912 16.935 1970 - - 14.280 3.442 17.722 1971 - - 15.329 3.873 19.202 1972 - - 21.572 3.943 25.515 1973 - - 26.384 5.659 32.043 1974 - - 28.031 6.467 34.498 1975 - - 31.137 8.029 39.166 1976 - - 32.758 10.323 43.081 1977 - - 35.764 11.288 47.052 1978 - - 40.218 11.289 51.507 1979 - - 39.965 11.072 51.037 1980 - - 36.468 10.724 47.192 1981 - - 28.183 8.414 36.597 1982 - - 20.870 6.973 27.843 1983 - - 16.957 5.608 22.565 1984 - - 18.611 5.031 23.642 1985 - - 22.028 5.775 27.803 1986 - - 27.195 7.007 34.202 1987 - - 23.982 8.498 32.480 1988 - - 23.998 10.845 34.843 1989 - - 20.309 7.339 27.648 1990 107 - 13.539 7.764 21.410 1991 330 - 17.848 13.540 31.718 1992 251 - 10.719 11.323 22.293 1993 865 - 14.600 8.126 23.591 1994 1.365 1.778 20.768 8.762 32.673 1995 2.001 5.737 22.180 11.651 41.569 1996 3.026 4.610 16.351 10.860 34.847 1997 3.200 8.625 19.509 9.433 40.767 1998 2.984 11.910 18.420 9.540 42.854 1999 11.073 7.288 16.826 6.317 41.504 2000 13.407 3.310 25.627 8.520 50.864 2001 10.869 6.199 23.232 8.184 48.484 2002 9.787 1.314 21.209 7.575 39.885 2003 7.818 1.546 22.179 7.408 38.951 2004 6.482 2.159 26.114 8.574 43.329 2005 5.743 2.677 25.765 8.265 42.450 2006 3.649 4.364 25.689 10.041 43.743 2007 5.297 4.073 32.234 12.607 54.211 2008 3.253 4.393 37.565 13.116 58.327 2009 5.077 5.036 32.332 11.537 53.982 2010 7.370 5.666 46.505 15.617 75.158 2011 9.350 6.117 42.623 14.962 73.052
2.19 Informações por empresa Information per company
Mercedes-Benz
1. A partir de 2002, os dados de vendas internas de automóveis e comerciais leves se referem a licenciamento (Denatran). Since 2002, data for domestic sales of cars and light commercials refer to registration of vehicles.
2. A partir de 2011, os dados de vendas internas de caminhões e ônibus se referem a licenciamento (Denatran). Since 2011, data for domestic sales of trucks and buses refer to registration of vehicles.
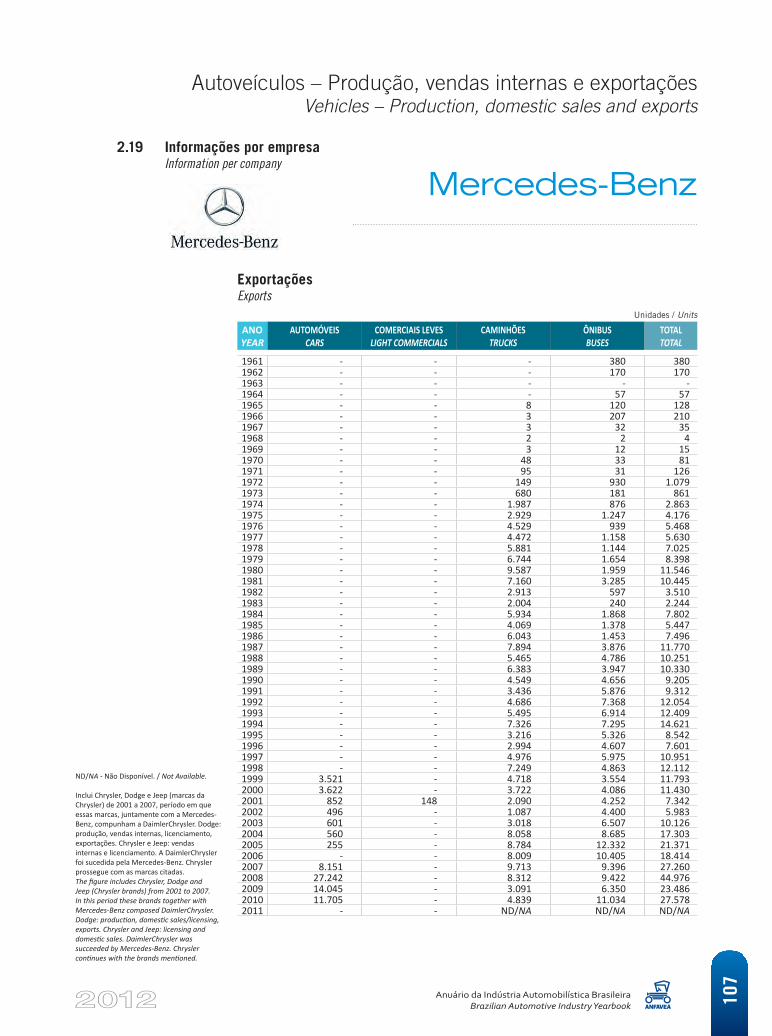
Autoveículos – Produção, vendas internas e exportaçõesVehicles – Production, domestic sales and exports
Anuário da Indústria Automobilística BrasileiraBrazilian Automotive Industry Yearbook 10
7
ND/NA - Não Disponível. / Not Available.
Inclui Chrysler, Dodge e Jeep (marcas da Chrysler) de 2001 a 2007, período em que essas marcas, juntamente com a Mercedes-Benz, compunham a DaimlerChrysler. Dodge: produção, vendas internas, licenciamento, exportações. Chrysler e Jeep: vendas internas e licenciamento. A DaimlerChrysler foi sucedida pela Mercedes-Benz. Chrysler prossegue com as marcas citadas.The figure includes Chrysler, Dodge and Jeep (Chrysler brands) from 2001 to 2007. In this period these brands together with Mercedes-Benz composed DaimlerChrysler. Dodge: production, domestic sales/licensing, exports. Chrysler and Jeep: licensing and domestic sales. DaimlerChrysler was succeeded by Mercedes-Benz. Chrysler continues with the brands mentioned.
2.19 Informações por empresa Information per company
ExportaçõesExports
Unidades / Units
ANO YEAR
AUTOMÓVEIS CARS
COMERCIAIS LEVES LIGHT COMMERCIALS
CAMINHÕES TRUCKS
ÔNIBUS BUSES
TOTAL TOTAL
1961 - - - 380 380 1962 - - - 170 170 1963 - - - - - 1964 - - - 57 57 1965 - - 8 120 128 1966 - - 3 207 210 1967 - - 3 32 35 1968 - - 2 2 4 1969 - - 3 12 15 1970 - - 48 33 81 1971 - - 95 31 126 1972 - - 149 930 1.079 1973 - - 680 181 861 1974 - - 1.987 876 2.863 1975 - - 2.929 1.247 4.176 1976 - - 4.529 939 5.468 1977 - - 4.472 1.158 5.630 1978 - - 5.881 1.144 7.025 1979 - - 6.744 1.654 8.398 1980 - - 9.587 1.959 11.546 1981 - - 7.160 3.285 10.445 1982 - - 2.913 597 3.510 1983 - - 2.004 240 2.244 1984 - - 5.934 1.868 7.802 1985 - - 4.069 1.378 5.447 1986 - - 6.043 1.453 7.496 1987 - - 7.894 3.876 11.770 1988 - - 5.465 4.786 10.251 1989 - - 6.383 3.947 10.330 1990 - - 4.549 4.656 9.205 1991 - - 3.436 5.876 9.312 1992 - - 4.686 7.368 12.054 1993 - - 5.495 6.914 12.409 1994 - - 7.326 7.295 14.621 1995 - - 3.216 5.326 8.542 1996 - - 2.994 4.607 7.601 1997 - - 4.976 5.975 10.951 1998 - - 7.249 4.863 12.112 1999 3.521 - 4.718 3.554 11.793 2000 3.622 - 3.722 4.086 11.430 2001 852 148 2.090 4.252 7.342 2002 496 - 1.087 4.400 5.983 2003 601 - 3.018 6.507 10.126 2004 560 - 8.058 8.685 17.303 2005 255 - 8.784 12.332 21.371 2006 - - 8.009 10.405 18.414 2007 8.151 - 9.713 9.396 27.260 2008 27.242 - 8.312 9.422 44.976 2009 14.045 - 3.091 6.350 23.486 2010 11.705 - 4.839 11.034 27.578 2011 - - ND/NA ND/NA ND/NA
Mercedes-Benz
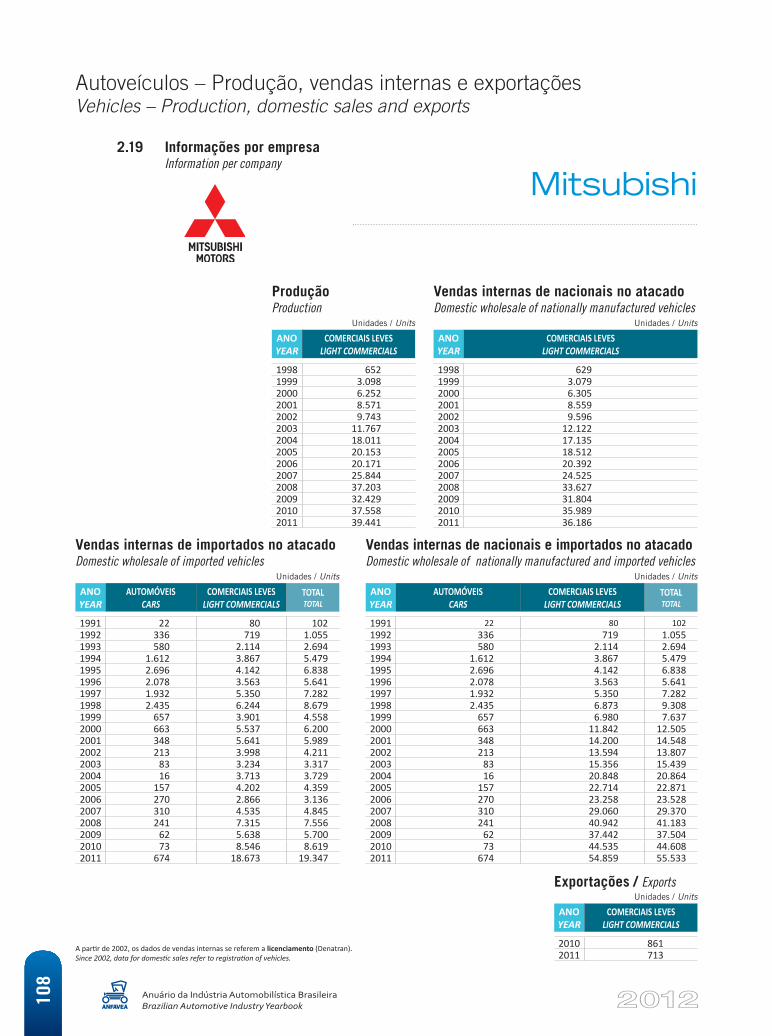
Autoveículos – Produção, vendas internas e exportaçõesVehicles – Production, domestic sales and exports
Anuário da Indústria Automobilística BrasileiraBrazilian Automotive Industry Yearbook10
8
2.19 Informações por empresa Information per company
Exportações / ExportsUnidades / Units
ANO YEAR
COMERCIAIS LEVES LIGHT COMMERCIALS
2010 861 2011 713
Produção Production
Unidades / Units
ANO YEAR
COMERCIAIS LEVES LIGHT COMMERCIALS
1998 652 1999 3.098 2000 6.252 2001 8.571 2002 9.743 2003 11.767 2004 18.011 2005 20.153 2006 20.171 2007 25.844 2008 37.203 2009 32.429 2010 37.558 2011 39.441
Vendas internas de nacionais no atacadoDomestic wholesale of nationally manufactured vehicles
Unidades / Units
ANO YEAR
COMERCIAIS LEVES LIGHT COMMERCIALS
1998 629 1999 3.079 2000 6.305 2001 8.559 2002 9.596 2003 12.122 2004 17.135 2005 18.512 2006 20.392 2007 24.525 2008 33.627 2009 31.804 2010 35.989 2011 36.186
Vendas internas de importados no atacadoDomestic wholesale of imported vehicles
Unidades / Units
ANO YEAR
AUTOMÓVEIS CARS
COMERCIAIS LEVES LIGHT COMMERCIALS
TOTALTOTAL
1991 22 80 102 1992 336 719 1.055 1993 580 2.114 2.694 1994 1.612 3.867 5.479 1995 2.696 4.142 6.838 1996 2.078 3.563 5.641 1997 1.932 5.350 7.282 1998 2.435 6.244 8.679 1999 657 3.901 4.558 2000 663 5.537 6.200 2001 348 5.641 5.989 2002 213 3.998 4.211 2003 83 3.234 3.317 2004 16 3.713 3.729 2005 157 4.202 4.359 2006 270 2.866 3.136 2007 310 4.535 4.845 2008 241 7.315 7.556 2009 62 5.638 5.700 2010 73 8.546 8.619 2011 674 18.673 19.347
Vendas internas de nacionais e importados no atacadoDomestic wholesale of nationally manufactured and imported vehicles
Unidades / Units
ANO YEAR
AUTOMÓVEIS CARS
COMERCIAIS LEVES LIGHT COMMERCIALS
TOTALTOTAL
1991 22 80 102 1992 336 719 1.055 1993 580 2.114 2.694 1994 1.612 3.867 5.479 1995 2.696 4.142 6.838 1996 2.078 3.563 5.641 1997 1.932 5.350 7.282 1998 2.435 6.873 9.308 1999 657 6.980 7.637 2000 663 11.842 12.505 2001 348 14.200 14.548 2002 213 13.594 13.807 2003 83 15.356 15.439 2004 16 20.848 20.864 2005 157 22.714 22.871 2006 270 23.258 23.528 2007 310 29.060 29.370 2008 241 40.942 41.183 2009 62 37.442 37.504 2010 73 44.535 44.608 2011 674 54.859 55.533
A partir de 2002, os dados de vendas internas se referem a licenciamento (Denatran). Since 2002, data for domestic sales refer to registration of vehicles.
Mitsubishi
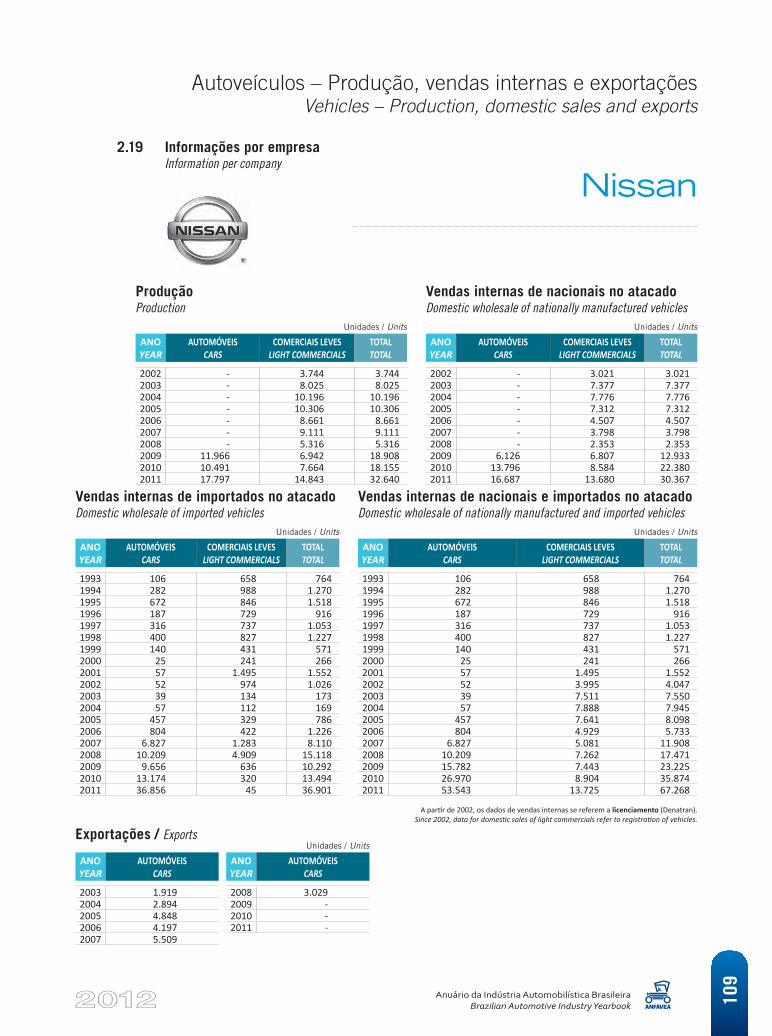
Autoveículos – Produção, vendas internas e exportaçõesVehicles – Production, domestic sales and exports
Anuário da Indústria Automobilística BrasileiraBrazilian Automotive Industry Yearbook 10
9
2.19 Informações por empresa Information per company
ProduçãoProduction
Unidades / Units
ANO YEAR
AUTOMÓVEIS CARS
COMERCIAIS LEVES LIGHT COMMERCIALS
TOTAL TOTAL
2002 - 3.744 3.744 2003 - 8.025 8.025 2004 - 10.196 10.196 2005 - 10.306 10.306 2006 - 8.661 8.6612007 - 9.111 9.1112008 - 5.316 5.3162009 11.966 6.942 18.9082010 10.491 7.664 18.1552011 17.797 14.843 32.640
Vendas internas de nacionais no atacadoDomestic wholesale of nationally manufactured vehicles
Unidades / Units
ANO YEAR
AUTOMÓVEIS CARS
COMERCIAIS LEVES LIGHT COMMERCIALS
TOTAL TOTAL
2002 - 3.021 3.021 2003 - 7.377 7.377 2004 - 7.776 7.776 2005 - 7.312 7.312 2006 - 4.507 4.5072007 - 3.798 3.7982008 - 2.353 2.3532009 6.126 6.807 12.9332010 13.796 8.584 22.3802011 16.687 13.680 30.367
Vendas internas de importados no atacadoDomestic wholesale of imported vehicles
Unidades / Units
ANO YEAR
AUTOMÓVEIS CARS
COMERCIAIS LEVES LIGHT COMMERCIALS
TOTAL TOTAL
1993 106 658 764 1994 282 988 1.270 1995 672 846 1.518 1996 187 729 916 1997 316 737 1.053 1998 400 827 1.227 1999 140 431 571 2000 25 241 266 2001 57 1.495 1.552 2002 52 974 1.026 2003 39 134 173 2004 57 112 169 2005 457 329 786 2006 804 422 1.226 2007 6.827 1.283 8.110 2008 10.209 4.909 15.118 2009 9.656 636 10.292 2010 13.174 320 13.494 2011 36.856 45 36.901
Vendas internas de nacionais e importados no atacadoDomestic wholesale of nationally manufactured and imported vehicles
Unidades / Units
ANO YEAR
AUTOMÓVEIS CARS
COMERCIAIS LEVES LIGHT COMMERCIALS
TOTAL TOTAL
1993 106 658 764 1994 282 988 1.270 1995 672 846 1.518 1996 187 729 916 1997 316 737 1.053 1998 400 827 1.227 1999 140 431 571 2000 25 241 266 2001 57 1.495 1.552 2002 52 3.995 4.047 2003 39 7.511 7.550 2004 57 7.888 7.945 2005 457 7.641 8.098 2006 804 4.929 5.733 2007 6.827 5.081 11.908 2008 10.209 7.262 17.471 2009 15.782 7.443 23.225 2010 26.970 8.904 35.874 2011 53.543 13.725 67.268
Nissan
A partir de 2002, os dados de vendas internas se referem a licenciamento (Denatran).Since 2002, data for domestic sales of light commercials refer to registration of vehicles.
Exportações / ExportsUnidades / Units
ANO YEAR
AUTOMÓVEIS CARS
ANO YEAR
AUTOMÓVEIS CARS
2003 1.919 2008 3.029 2004 2.894 2009 - 2005 4.848 2010 - 2006 4.197 2011 - 2007 5.509
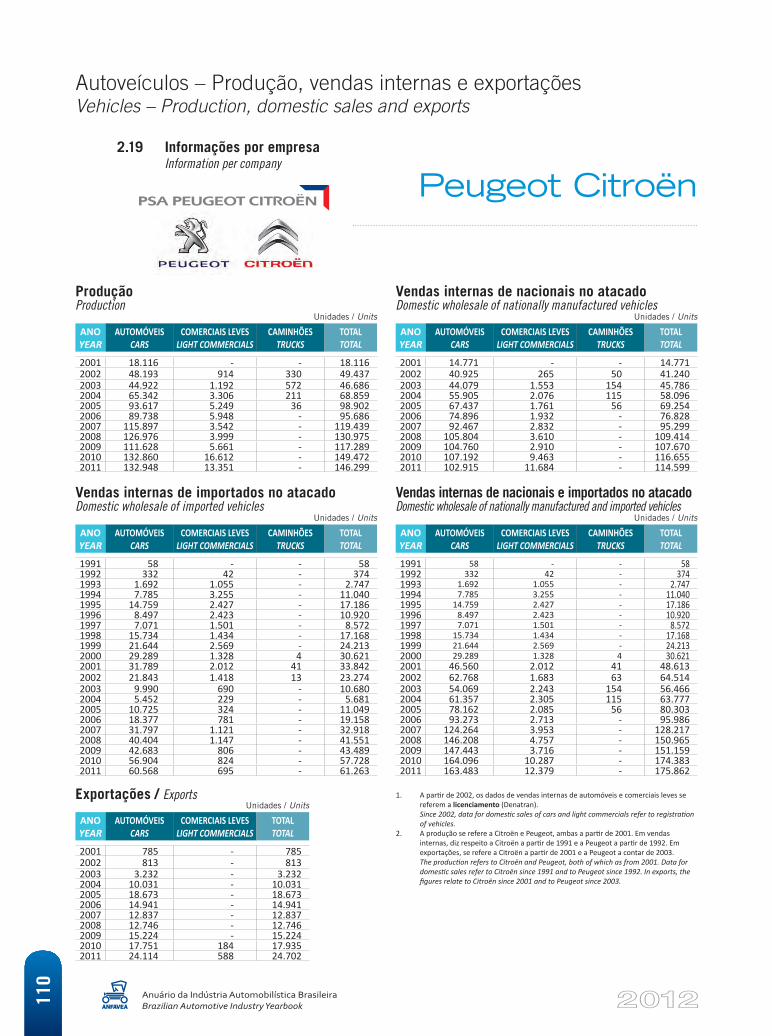
Autoveículos – Produção, vendas internas e exportaçõesVehicles – Production, domestic sales and exports
Anuário da Indústria Automobilística BrasileiraBrazilian Automotive Industry Yearbook11
0
2.19 Informações por empresa Information per company
ProduçãoProduction
Unidades / Units
ANO YEAR
AUTOMÓVEIS CARS
COMERCIAIS LEVES LIGHT COMMERCIALS
CAMINHÕES TRUCKS
TOTAL TOTAL
2001 18.116 - - 18.116 2002 48.193 914 330 49.437 2003 44.922 1.192 572 46.686 2004 65.342 3.306 211 68.859 2005 93.617 5.249 36 98.902 2006 89.738 5.948 - 95.686 2007 115.897 3.542 - 119.439 2008 126.976 3.999 - 130.975 2009 111.628 5.661 - 117.289 2010 132.860 16.612 - 149.472 2011 132.948 13.351 - 146.299
Vendas internas de importados no atacadoDomestic wholesale of imported vehicles
Unidades / Units
ANO YEAR
AUTOMÓVEIS CARS
COMERCIAIS LEVES LIGHT COMMERCIALS
CAMINHÕES TRUCKS
TOTAL TOTAL
1991 58 - - 58 1992 332 42 - 374 1993 1.692 1.055 - 2.747 1994 7.785 3.255 - 11.040 1995 14.759 2.427 - 17.186 1996 8.497 2.423 - 10.920 1997 7.071 1.501 - 8.572 1998 15.734 1.434 - 17.168 1999 21.644 2.569 - 24.213 2000 29.289 1.328 4 30.621 2001 31.789 2.012 41 33.842 2002 21.843 1.418 13 23.274 2003 9.990 690 - 10.680 2004 5.452 229 - 5.681 2005 10.725 324 - 11.049 2006 18.377 781 - 19.158 2007 31.797 1.121 - 32.918 2008 40.404 1.147 - 41.551 2009 42.683 806 - 43.489 2010 56.904 824 - 57.728 2011 60.568 695 - 61.263
Exportações / ExportsUnidades / Units
ANO YEAR
AUTOMÓVEIS CARS
COMERCIAIS LEVES LIGHT COMMERCIALS
TOTAL TOTAL
2001 785 - 785 2002 813 - 813 2003 3.232 - 3.232 2004 10.031 - 10.031 2005 18.673 - 18.673 2006 14.941 - 14.941 2007 12.837 - 12.837 2008 12.746 - 12.746 2009 15.224 - 15.224 2010 17.751 184 17.935 2011 24.114 588 24.702
Vendas internas de nacionais e importados no atacadoDomestic wholesale of nationally manufactured and imported vehicles
Unidades / Units
ANO YEAR
AUTOMÓVEIS CARS
COMERCIAIS LEVES LIGHT COMMERCIALS
CAMINHÕES TRUCKS
TOTAL TOTAL
1991 58 - - 58 1992 332 42 - 374 1993 1.692 1.055 - 2.747 1994 7.785 3.255 - 11.040 1995 14.759 2.427 - 17.186 1996 8.497 2.423 - 10.920 1997 7.071 1.501 - 8.572 1998 15.734 1.434 - 17.168 1999 21.644 2.569 - 24.213 2000 29.289 1.328 4 30.621 2001 46.560 2.012 41 48.613 2002 62.768 1.683 63 64.514 2003 54.069 2.243 154 56.466 2004 61.357 2.305 115 63.777 2005 78.162 2.085 56 80.303 2006 93.273 2.713 - 95.986 2007 124.264 3.953 - 128.217 2008 146.208 4.757 - 150.965 2009 147.443 3.716 - 151.159 2010 164.096 10.287 - 174.383 2011 163.483 12.379 - 175.862
Vendas internas de nacionais no atacadoDomestic wholesale of nationally manufactured vehicles
Unidades / Units
ANO YEAR
AUTOMÓVEIS CARS
COMERCIAIS LEVES LIGHT COMMERCIALS
CAMINHÕES TRUCKS
TOTAL TOTAL
2001 14.771 - - 14.771 2002 40.925 265 50 41.240 2003 44.079 1.553 154 45.786 2004 55.905 2.076 115 58.096 2005 67.437 1.761 56 69.254 2006 74.896 1.932 - 76.828 2007 92.467 2.832 - 95.299 2008 105.804 3.610 - 109.414 2009 104.760 2.910 - 107.670 2010 107.192 9.463 - 116.655 2011 102.915 11.684 - 114.599
Peugeot Citroën
1. A partir de 2002, os dados de vendas internas de automóveis e comerciais leves se referem a licenciamento (Denatran). Since 2002, data for domestic sales of cars and light commercials refer to registration of vehicles.
2. A produção se refere a Citroën e Peugeot, ambas a partir de 2001. Em vendas internas, diz respeito a Citroën a partir de 1991 e a Peugeot a partir de 1992. Em exportações, se refere a Citroën a partir de 2001 e a Peugeot a contar de 2003. The production refers to Citroën and Peugeot, both of which as from 2001. Data for domestic sales refer to Citroën since 1991 and to Peugeot since 1992. In exports, the figures relate to Citroën since 2001 and to Peugeot since 2003.
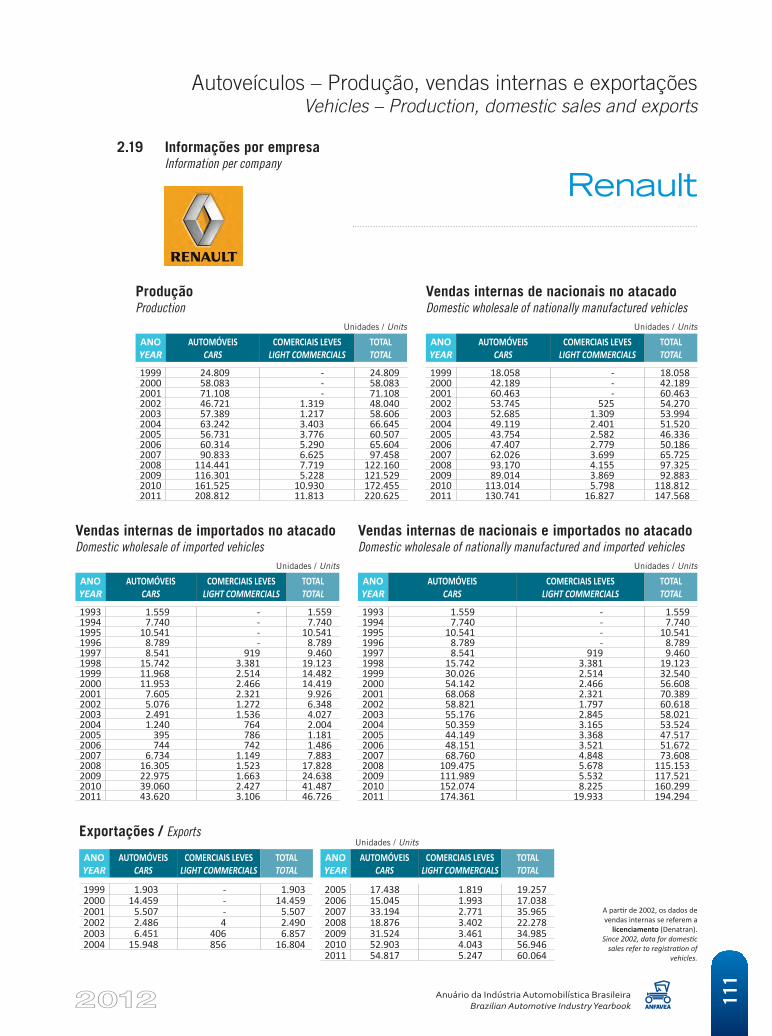
Autoveículos – Produção, vendas internas e exportaçõesVehicles – Production, domestic sales and exports
Anuário da Indústria Automobilística BrasileiraBrazilian Automotive Industry Yearbook 11
1
2.19 Informações por empresa Information per company
ProduçãoProduction
Unidades / Units
ANO YEAR
AUTOMÓVEIS CARS
COMERCIAIS LEVES LIGHT COMMERCIALS
TOTAL TOTAL
1999 24.809 - 24.809 2000 58.083 - 58.083 2001 71.108 - 71.108 2002 46.721 1.319 48.040 2003 57.389 1.217 58.606 2004 63.242 3.403 66.645 2005 56.731 3.776 60.507 2006 60.314 5.290 65.604 2007 90.833 6.625 97.458 2008 114.441 7.719 122.160 2009 116.301 5.228 121.529 2010 161.525 10.930 172.455 2011 208.812 11.813 220.625
Vendas internas de nacionais no atacadoDomestic wholesale of nationally manufactured vehicles
Unidades / Units
ANO YEAR
AUTOMÓVEIS CARS
COMERCIAIS LEVES LIGHT COMMERCIALS
TOTAL TOTAL
1999 18.058 - 18.058 2000 42.189 - 42.189 2001 60.463 - 60.463 2002 53.745 525 54.270 2003 52.685 1.309 53.994 2004 49.119 2.401 51.520 2005 43.754 2.582 46.336 2006 47.407 2.779 50.186 2007 62.026 3.699 65.725 2008 93.170 4.155 97.325 2009 89.014 3.869 92.883 2010 113.014 5.798 118.812 2011 130.741 16.827 147.568
Vendas internas de importados no atacadoDomestic wholesale of imported vehicles
Unidades / Units
ANO YEAR
AUTOMÓVEIS CARS
COMERCIAIS LEVES LIGHT COMMERCIALS
TOTAL TOTAL
1993 1.559 - 1.559 1994 7.740 - 7.740 1995 10.541 - 10.541 1996 8.789 - 8.789 1997 8.541 919 9.460 1998 15.742 3.381 19.123 1999 11.968 2.514 14.482 2000 11.953 2.466 14.419 2001 7.605 2.321 9.926 2002 5.076 1.272 6.348 2003 2.491 1.536 4.027 2004 1.240 764 2.004 2005 395 786 1.181 2006 744 742 1.486 2007 6.734 1.149 7.883 2008 16.305 1.523 17.828 2009 22.975 1.663 24.638 2010 39.060 2.427 41.487 2011 43.620 3.106 46.726
Vendas internas de nacionais e importados no atacadoDomestic wholesale of nationally manufactured and imported vehicles
Unidades / Units
ANO YEAR
AUTOMÓVEIS CARS
COMERCIAIS LEVES LIGHT COMMERCIALS
TOTAL TOTAL
1993 1.559 - 1.559 1994 7.740 - 7.740 1995 10.541 - 10.541 1996 8.789 - 8.789 1997 8.541 919 9.460 1998 15.742 3.381 19.123 1999 30.026 2.514 32.540 2000 54.142 2.466 56.608 2001 68.068 2.321 70.389 2002 58.821 1.797 60.618 2003 55.176 2.845 58.021 2004 50.359 3.165 53.524 2005 44.149 3.368 47.517 2006 48.151 3.521 51.672 2007 68.760 4.848 73.608 2008 109.475 5.678 115.153 2009 111.989 5.532 117.521 2010 152.074 8.225 160.299 2011 174.361 19.933 194.294
Renault
A partir de 2002, os dados de vendas internas se referem a
licenciamento (Denatran).Since 2002, data for domestic
sales refer to registration of vehicles.
Exportações / ExportsUnidades / Units
ANO YEAR
AUTOMÓVEIS CARS
COMERCIAIS LEVES LIGHT COMMERCIALS
TOTAL TOTAL
ANO YEAR
AUTOMÓVEIS CARS
COMERCIAIS LEVES LIGHT COMMERCIALS
TOTAL TOTAL
1999 1.903 - 1.903 2005 17.438 1.819 19.257 2000 14.459 - 14.459 2006 15.045 1.993 17.038 2001 5.507 - 5.507 2007 33.194 2.771 35.965 2002 2.486 4 2.490 2008 18.876 3.402 22.278 2003 6.451 406 6.857 2009 31.524 3.461 34.985 2004 15.948 856 16.804 2010 52.903 4.043 56.946
2011 54.817 5.247 60.064
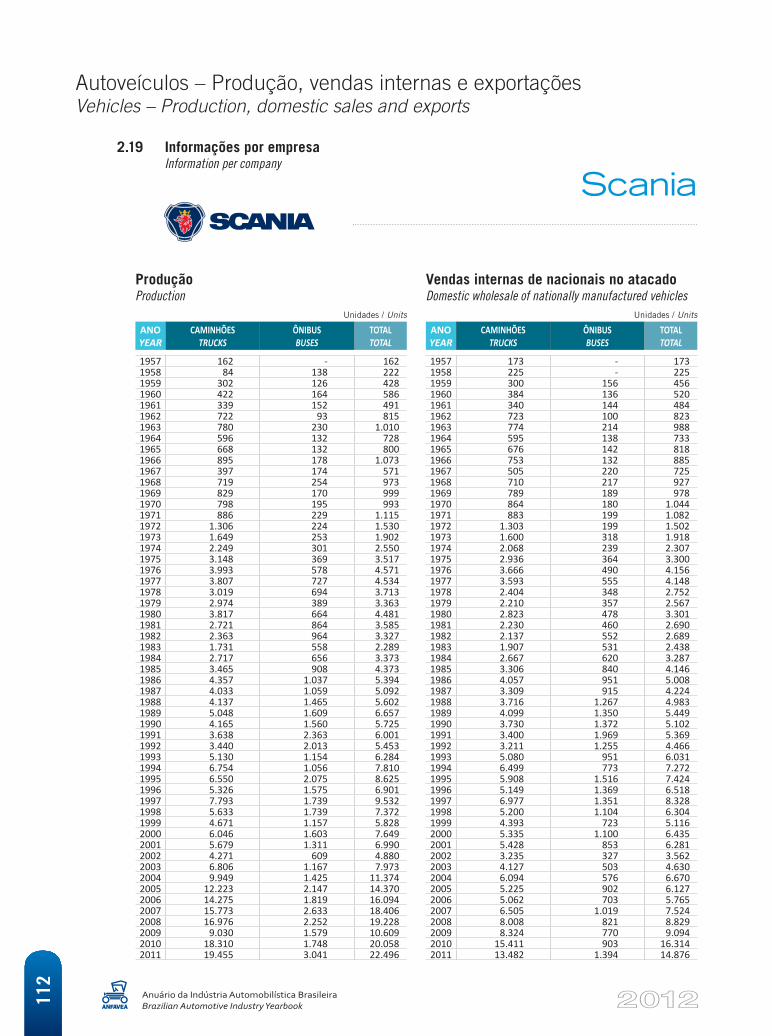
Autoveículos – Produção, vendas internas e exportaçõesVehicles – Production, domestic sales and exports
Anuário da Indústria Automobilística BrasileiraBrazilian Automotive Industry Yearbook11
2
2.19 Informações por empresa Information per company
Produção Production
Unidades / Units
ANO YEAR
CAMINHÕES TRUCKS
ÔNIBUS BUSES
TOTAL TOTAL
1957 162 - 162 1958 84 138 222 1959 302 126 428 1960 422 164 586 1961 339 152 491 1962 722 93 815 1963 780 230 1.010 1964 596 132 728 1965 668 132 800 1966 895 178 1.073 1967 397 174 571 1968 719 254 973 1969 829 170 999 1970 798 195 993 1971 886 229 1.115 1972 1.306 224 1.530 1973 1.649 253 1.902 1974 2.249 301 2.550 1975 3.148 369 3.517 1976 3.993 578 4.571 1977 3.807 727 4.534 1978 3.019 694 3.713 1979 2.974 389 3.363 1980 3.817 664 4.481 1981 2.721 864 3.585 1982 2.363 964 3.327 1983 1.731 558 2.289 1984 2.717 656 3.373 1985 3.465 908 4.373 1986 4.357 1.037 5.394 1987 4.033 1.059 5.092 1988 4.137 1.465 5.602 1989 5.048 1.609 6.657 1990 4.165 1.560 5.725 1991 3.638 2.363 6.001 1992 3.440 2.013 5.453 1993 5.130 1.154 6.284 1994 6.754 1.056 7.810 1995 6.550 2.075 8.625 1996 5.326 1.575 6.901 1997 7.793 1.739 9.532 1998 5.633 1.739 7.372 1999 4.671 1.157 5.828 2000 6.046 1.603 7.649 2001 5.679 1.311 6.990 2002 4.271 609 4.880 2003 6.806 1.167 7.973 2004 9.949 1.425 11.374 2005 12.223 2.147 14.370 2006 14.275 1.819 16.094 2007 15.773 2.633 18.406 2008 16.976 2.252 19.228 2009 9.030 1.579 10.609 2010 18.310 1.748 20.058 2011 19.455 3.041 22.496
Vendas internas de nacionais no atacadoDomestic wholesale of nationally manufactured vehicles
Unidades / Units
ANO YEAR
CAMINHÕES TRUCKS
ÔNIBUS BUSES
TOTAL TOTAL
1957 173 - 173 1958 225 - 225 1959 300 156 456 1960 384 136 520 1961 340 144 484 1962 723 100 823 1963 774 214 988 1964 595 138 733 1965 676 142 818 1966 753 132 885 1967 505 220 725 1968 710 217 927 1969 789 189 978 1970 864 180 1.044 1971 883 199 1.082 1972 1.303 199 1.502 1973 1.600 318 1.918 1974 2.068 239 2.307 1975 2.936 364 3.300 1976 3.666 490 4.156 1977 3.593 555 4.148 1978 2.404 348 2.752 1979 2.210 357 2.567 1980 2.823 478 3.301 1981 2.230 460 2.690 1982 2.137 552 2.689 1983 1.907 531 2.438 1984 2.667 620 3.287 1985 3.306 840 4.146 1986 4.057 951 5.008 1987 3.309 915 4.224 1988 3.716 1.267 4.983 1989 4.099 1.350 5.449 1990 3.730 1.372 5.102 1991 3.400 1.969 5.369 1992 3.211 1.255 4.466 1993 5.080 951 6.031 1994 6.499 773 7.272 1995 5.908 1.516 7.424 1996 5.149 1.369 6.518 1997 6.977 1.351 8.328 1998 5.200 1.104 6.304 1999 4.393 723 5.116 2000 5.335 1.100 6.435 2001 5.428 853 6.281 2002 3.235 327 3.562 2003 4.127 503 4.630 2004 6.094 576 6.670 2005 5.225 902 6.127 2006 5.062 703 5.765 2007 6.505 1.019 7.524 2008 8.008 821 8.829 2009 8.324 770 9.094 2010 15.411 903 16.314 2011 13.482 1.394 14.876
Scania
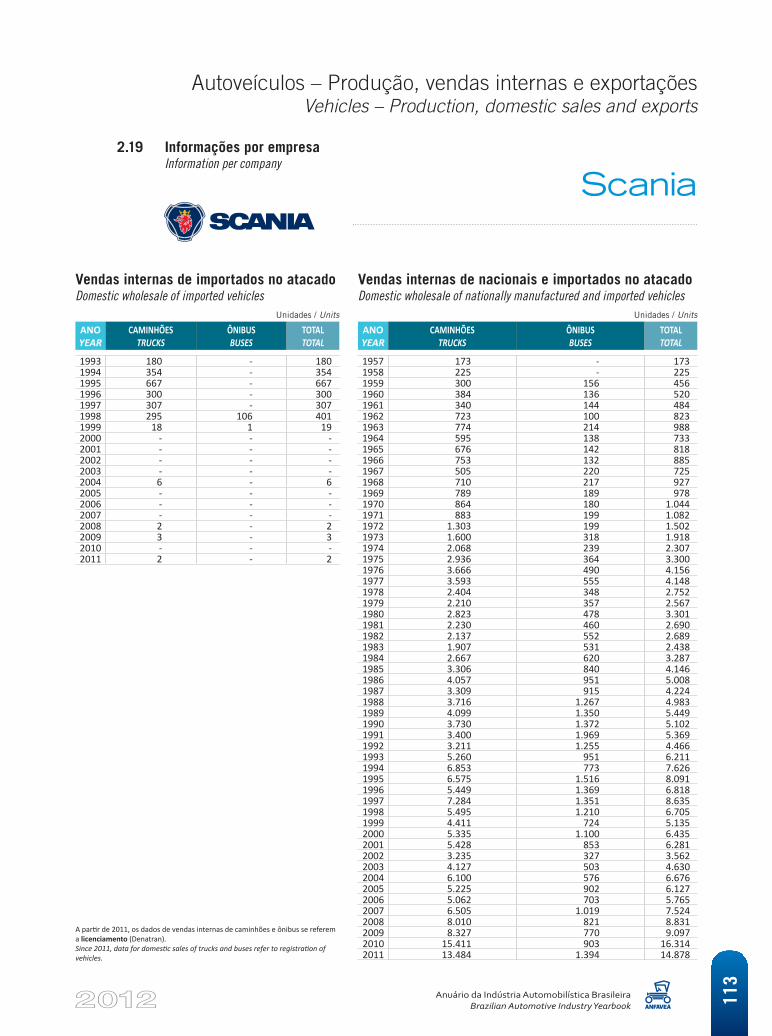
Autoveículos – Produção, vendas internas e exportaçõesVehicles – Production, domestic sales and exports
Anuário da Indústria Automobilística BrasileiraBrazilian Automotive Industry Yearbook 11
3
2.19 Informações por empresa Information per company
Vendas internas de importados no atacadoDomestic wholesale of imported vehicles
Unidades / Units
ANO YEAR
CAMINHÕES TRUCKS
ÔNIBUS BUSES
TOTAL TOTAL
1993 180 - 180 1994 354 - 354 1995 667 - 667 1996 300 - 300 1997 307 - 307 1998 295 106 401 1999 18 1 19 2000 - - - 2001 - - - 2002 - - - 2003 - - - 2004 6 - 6 2005 - - - 2006 - - - 2007 - - - 2008 2 - 2 2009 3 - 3 2010 - - - 2011 2 - 2
Vendas internas de nacionais e importados no atacadoDomestic wholesale of nationally manufactured and imported vehicles
Unidades / Units
ANO YEAR
CAMINHÕES TRUCKS
ÔNIBUS BUSES
TOTAL TOTAL
1957 173 - 173 1958 225 - 225 1959 300 156 456 1960 384 136 520 1961 340 144 484 1962 723 100 823 1963 774 214 988 1964 595 138 733 1965 676 142 818 1966 753 132 885 1967 505 220 725 1968 710 217 927 1969 789 189 978 1970 864 180 1.044 1971 883 199 1.082 1972 1.303 199 1.502 1973 1.600 318 1.918 1974 2.068 239 2.307 1975 2.936 364 3.300 1976 3.666 490 4.156 1977 3.593 555 4.148 1978 2.404 348 2.752 1979 2.210 357 2.567 1980 2.823 478 3.301 1981 2.230 460 2.690 1982 2.137 552 2.689 1983 1.907 531 2.438 1984 2.667 620 3.287 1985 3.306 840 4.146 1986 4.057 951 5.008 1987 3.309 915 4.224 1988 3.716 1.267 4.983 1989 4.099 1.350 5.449 1990 3.730 1.372 5.102 1991 3.400 1.969 5.369 1992 3.211 1.255 4.466 1993 5.260 951 6.211 1994 6.853 773 7.626 1995 6.575 1.516 8.091 1996 5.449 1.369 6.818 1997 7.284 1.351 8.635 1998 5.495 1.210 6.705 1999 4.411 724 5.135 2000 5.335 1.100 6.435 2001 5.428 853 6.281 2002 3.235 327 3.562 2003 4.127 503 4.630 2004 6.100 576 6.676 2005 5.225 902 6.127 2006 5.062 703 5.765 2007 6.505 1.019 7.524 2008 8.010 821 8.831 2009 8.327 770 9.097 2010 15.411 903 16.314 2011 13.484 1.394 14.878
Scania
A partir de 2011, os dados de vendas internas de caminhões e ônibus se referem a licenciamento (Denatran). Since 2011, data for domestic sales of trucks and buses refer to registration of vehicles.
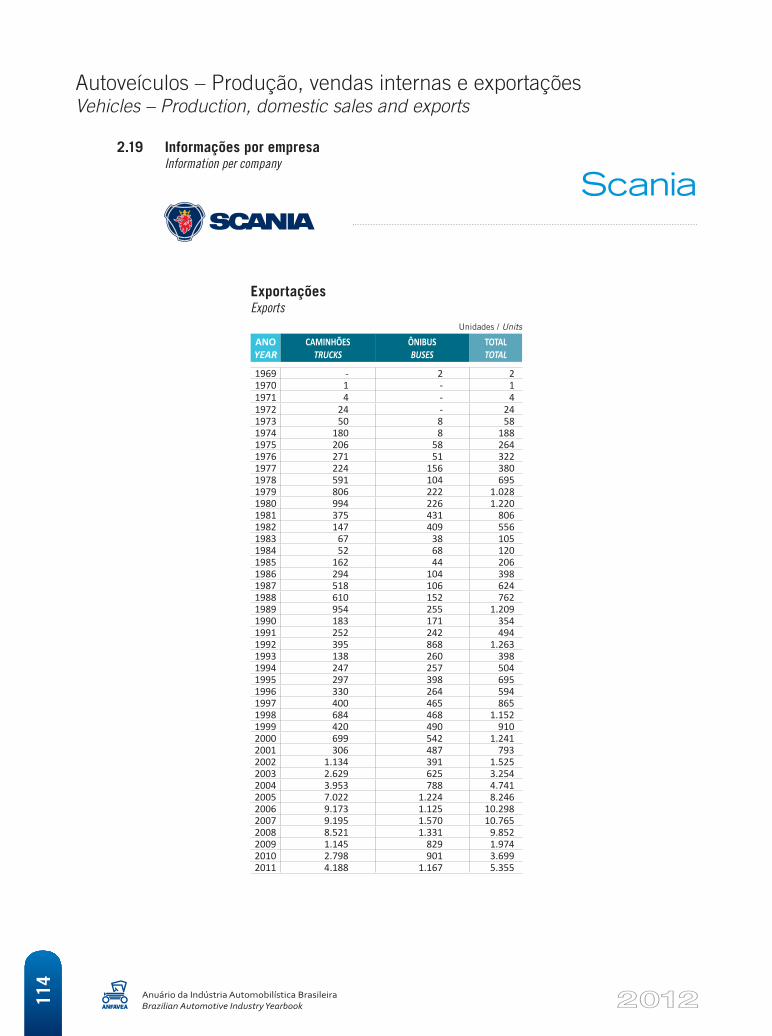
Autoveículos – Produção, vendas internas e exportaçõesVehicles – Production, domestic sales and exports
Anuário da Indústria Automobilística BrasileiraBrazilian Automotive Industry Yearbook11
4
2.19 Informações por empresa Information per company
ExportaçõesExports
Unidades / Units
ANO YEAR
CAMINHÕES TRUCKS
ÔNIBUS BUSES
TOTAL TOTAL
1969 - 2 2 1970 1 - 1 1971 4 - 4 1972 24 - 24 1973 50 8 58 1974 180 8 188 1975 206 58 264 1976 271 51 322 1977 224 156 380 1978 591 104 695 1979 806 222 1.028 1980 994 226 1.220 1981 375 431 806 1982 147 409 556 1983 67 38 105 1984 52 68 120 1985 162 44 206 1986 294 104 398 1987 518 106 624 1988 610 152 762 1989 954 255 1.209 1990 183 171 354 1991 252 242 494 1992 395 868 1.263 1993 138 260 398 1994 247 257 504 1995 297 398 695 1996 330 264 594 1997 400 465 865 1998 684 468 1.152 1999 420 490 910 2000 699 542 1.241 2001 306 487 793 2002 1.134 391 1.525 2003 2.629 625 3.254 2004 3.953 788 4.741 2005 7.022 1.224 8.246 2006 9.173 1.125 10.298 2007 9.195 1.570 10.765 2008 8.521 1.331 9.852 2009 1.145 829 1.974 2010 2.798 901 3.699 2011 4.188 1.167 5.355
Scania
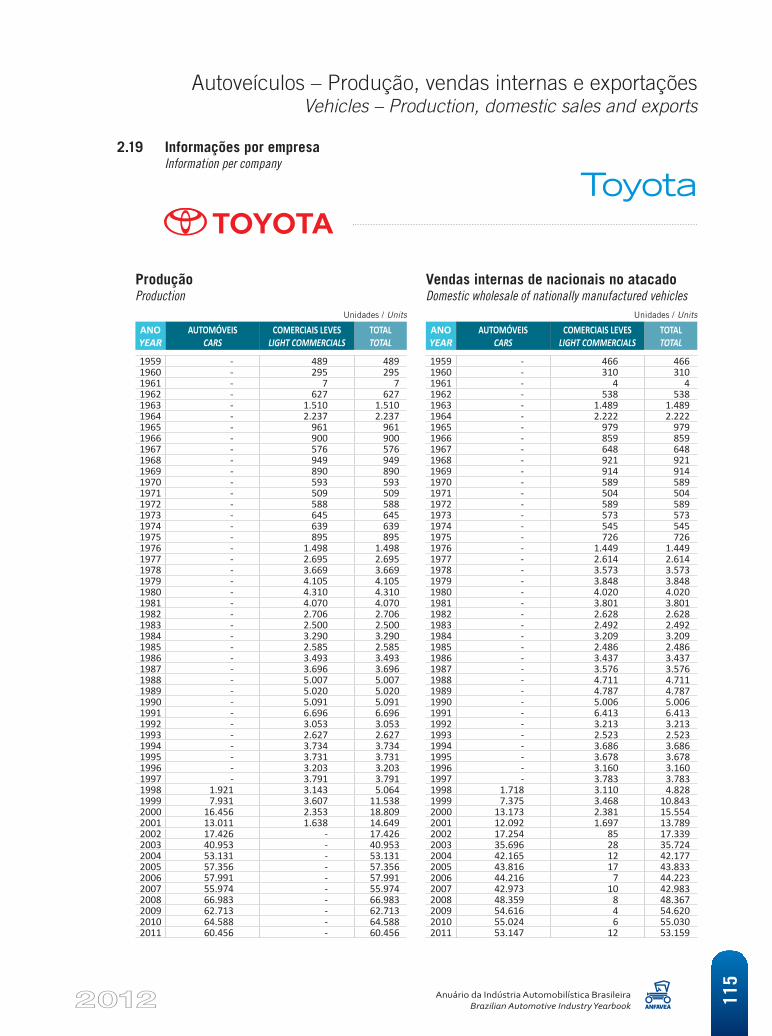
Autoveículos – Produção, vendas internas e exportaçõesVehicles – Production, domestic sales and exports
Anuário da Indústria Automobilística BrasileiraBrazilian Automotive Industry Yearbook 11
5
2.19 Informações por empresa Information per company
Produção Production
Unidades / Units
ANO YEAR
AUTOMÓVEIS CARS
COMERCIAIS LEVES LIGHT COMMERCIALS
TOTAL TOTAL
1959 - 489 489 1960 - 295 295 1961 - 7 7 1962 - 627 627 1963 - 1.510 1.510 1964 - 2.237 2.237 1965 - 961 961 1966 - 900 900 1967 - 576 576 1968 - 949 949 1969 - 890 890 1970 - 593 593 1971 - 509 509 1972 - 588 588 1973 - 645 645 1974 - 639 639 1975 - 895 895 1976 - 1.498 1.498 1977 - 2.695 2.695 1978 - 3.669 3.669 1979 - 4.105 4.105 1980 - 4.310 4.310 1981 - 4.070 4.070 1982 - 2.706 2.706 1983 - 2.500 2.500 1984 - 3.290 3.290 1985 - 2.585 2.585 1986 - 3.493 3.493 1987 - 3.696 3.696 1988 - 5.007 5.007 1989 - 5.020 5.020 1990 - 5.091 5.091 1991 - 6.696 6.696 1992 - 3.053 3.053 1993 - 2.627 2.627 1994 - 3.734 3.734 1995 - 3.731 3.731 1996 - 3.203 3.203 1997 - 3.791 3.791 1998 1.921 3.143 5.064 1999 7.931 3.607 11.538 2000 16.456 2.353 18.809 2001 13.011 1.638 14.649 2002 17.426 - 17.426 2003 40.953 - 40.953 2004 53.131 - 53.131 2005 57.356 - 57.356 2006 57.991 - 57.991 2007 55.974 - 55.974 2008 66.983 - 66.983 2009 62.713 - 62.713 2010 64.588 - 64.588 2011 60.456 - 60.456
Vendas internas de nacionais no atacadoDomestic wholesale of nationally manufactured vehicles
Unidades / Units
ANO YEAR
AUTOMÓVEIS CARS
COMERCIAIS LEVES LIGHT COMMERCIALS
TOTAL TOTAL
1959 - 466 466 1960 - 310 310 1961 - 4 4 1962 - 538 538 1963 - 1.489 1.489 1964 - 2.222 2.222 1965 - 979 979 1966 - 859 859 1967 - 648 648 1968 - 921 921 1969 - 914 914 1970 - 589 589 1971 - 504 504 1972 - 589 589 1973 - 573 573 1974 - 545 545 1975 - 726 726 1976 - 1.449 1.449 1977 - 2.614 2.614 1978 - 3.573 3.573 1979 - 3.848 3.848 1980 - 4.020 4.020 1981 - 3.801 3.801 1982 - 2.628 2.628 1983 - 2.492 2.492 1984 - 3.209 3.209 1985 - 2.486 2.486 1986 - 3.437 3.437 1987 - 3.576 3.576 1988 - 4.711 4.711 1989 - 4.787 4.787 1990 - 5.006 5.006 1991 - 6.413 6.413 1992 - 3.213 3.213 1993 - 2.523 2.523 1994 - 3.686 3.686 1995 - 3.678 3.678 1996 - 3.160 3.160 1997 - 3.783 3.783 1998 1.718 3.110 4.828 1999 7.375 3.468 10.843 2000 13.173 2.381 15.554 2001 12.092 1.697 13.789 2002 17.254 85 17.339 2003 35.696 28 35.724 2004 42.165 12 42.177 2005 43.816 17 43.833 2006 44.216 7 44.223 2007 42.973 10 42.983 2008 48.359 8 48.367 2009 54.616 4 54.620 2010 55.024 6 55.030 2011 53.147 12 53.159
Toyota
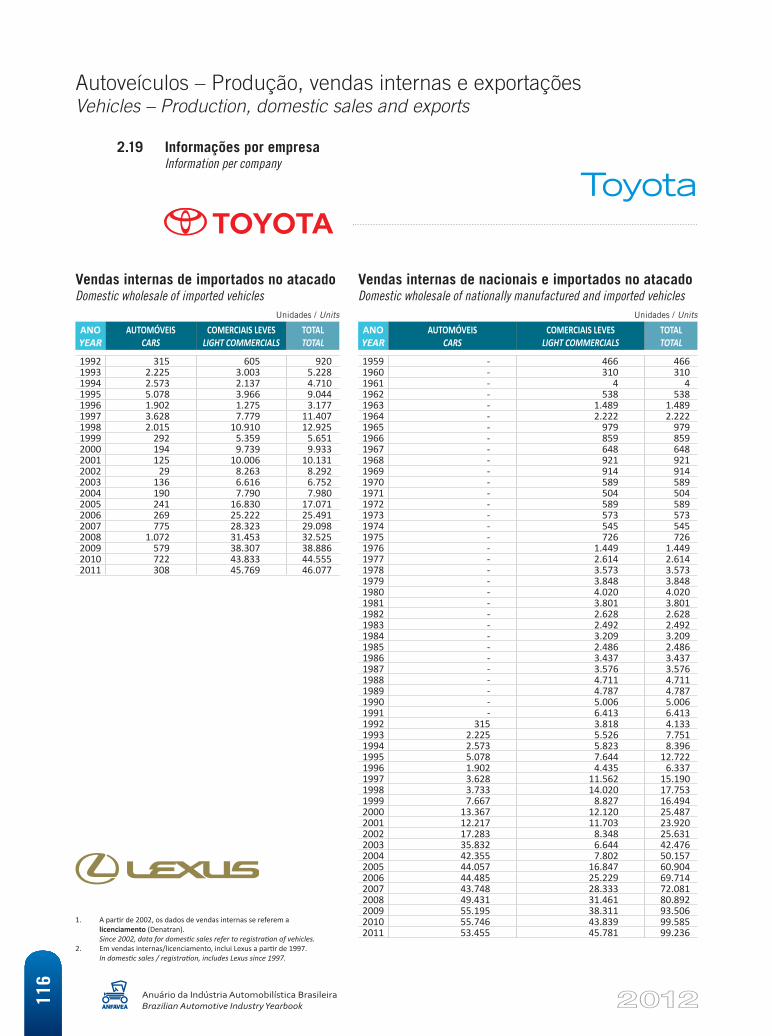
Autoveículos – Produção, vendas internas e exportaçõesVehicles – Production, domestic sales and exports
Anuário da Indústria Automobilística BrasileiraBrazilian Automotive Industry Yearbook11
6
2.19 Informações por empresa Information per company
Vendas internas de importados no atacadoDomestic wholesale of imported vehicles
Unidades / Units
ANO YEAR
AUTOMÓVEIS CARS
COMERCIAIS LEVES LIGHT COMMERCIALS
TOTAL TOTAL
1992 315 605 920 1993 2.225 3.003 5.228 1994 2.573 2.137 4.710 1995 5.078 3.966 9.044 1996 1.902 1.275 3.177 1997 3.628 7.779 11.407 1998 2.015 10.910 12.925 1999 292 5.359 5.651 2000 194 9.739 9.933 2001 125 10.006 10.131 2002 29 8.263 8.292 2003 136 6.616 6.752 2004 190 7.790 7.980 2005 241 16.830 17.071 2006 269 25.222 25.491 2007 775 28.323 29.098 2008 1.072 31.453 32.525 2009 579 38.307 38.886 2010 722 43.833 44.555 2011 308 45.769 46.077
Vendas internas de nacionais e importados no atacadoDomestic wholesale of nationally manufactured and imported vehicles
Unidades / Units
ANO YEAR
AUTOMÓVEIS CARS
COMERCIAIS LEVES LIGHT COMMERCIALS
TOTAL TOTAL
1959 - 466 466 1960 - 310 310 1961 - 4 4 1962 - 538 538 1963 - 1.489 1.489 1964 - 2.222 2.222 1965 - 979 979 1966 - 859 859 1967 - 648 648 1968 - 921 921 1969 - 914 914 1970 - 589 589 1971 - 504 504 1972 - 589 589 1973 - 573 573 1974 - 545 545 1975 - 726 726 1976 - 1.449 1.449 1977 - 2.614 2.614 1978 - 3.573 3.573 1979 - 3.848 3.848 1980 - 4.020 4.020 1981 - 3.801 3.801 1982 - 2.628 2.628 1983 - 2.492 2.492 1984 - 3.209 3.209 1985 - 2.486 2.486 1986 - 3.437 3.437 1987 - 3.576 3.576 1988 - 4.711 4.711 1989 - 4.787 4.787 1990 - 5.006 5.006 1991 - 6.413 6.413 1992 315 3.818 4.133 1993 2.225 5.526 7.751 1994 2.573 5.823 8.396 1995 5.078 7.644 12.722 1996 1.902 4.435 6.337 1997 3.628 11.562 15.190 1998 3.733 14.020 17.753 1999 7.667 8.827 16.494 2000 13.367 12.120 25.487 2001 12.217 11.703 23.920 2002 17.283 8.348 25.631 2003 35.832 6.644 42.476 2004 42.355 7.802 50.157 2005 44.057 16.847 60.904 2006 44.485 25.229 69.714 2007 43.748 28.333 72.081 2008 49.431 31.461 80.892 2009 55.195 38.311 93.506 2010 55.746 43.839 99.585 2011 53.455 45.781 99.236
Toyota
1. A partir de 2002, os dados de vendas internas se referem a licenciamento (Denatran). Since 2002, data for domestic sales refer to registration of vehicles.
2. Em vendas internas/licenciamento, inclui Lexus a partir de 1997. In domestic sales / registration, includes Lexus since 1997.
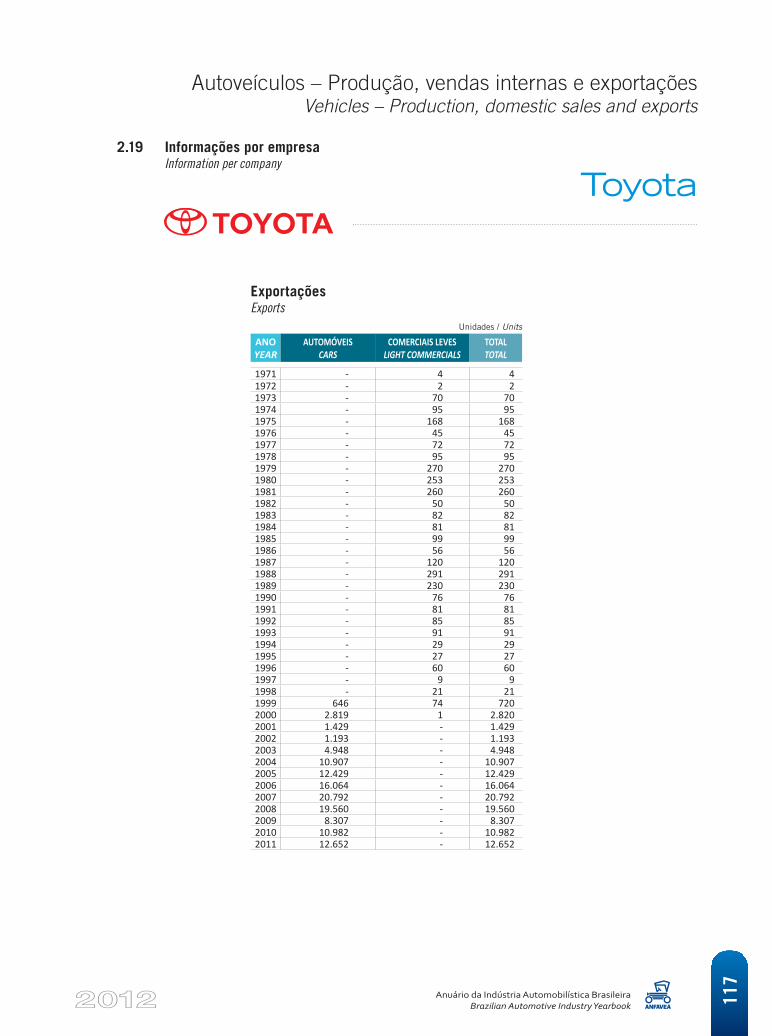
Autoveículos – Produção, vendas internas e exportaçõesVehicles – Production, domestic sales and exports
Anuário da Indústria Automobilística BrasileiraBrazilian Automotive Industry Yearbook 11
7
ExportaçõesExports
Unidades / Units
ANO YEAR
AUTOMÓVEIS CARS
COMERCIAIS LEVES LIGHT COMMERCIALS
TOTAL TOTAL
1971 - 4 4 1972 - 2 2 1973 - 70 70 1974 - 95 95 1975 - 168 168 1976 - 45 45 1977 - 72 72 1978 - 95 95 1979 - 270 270 1980 - 253 253 1981 - 260 260 1982 - 50 50 1983 - 82 82 1984 - 81 81 1985 - 99 99 1986 - 56 56 1987 - 120 120 1988 - 291 291 1989 - 230 230 1990 - 76 76 1991 - 81 81 1992 - 85 85 1993 - 91 91 1994 - 29 29 1995 - 27 27 1996 - 60 60 1997 - 9 9 1998 - 21 21 1999 646 74 720 2000 2.819 1 2.820 2001 1.429 - 1.429 2002 1.193 - 1.193 2003 4.948 - 4.948 2004 10.907 - 10.907 2005 12.429 - 12.429 2006 16.064 - 16.064 2007 20.792 - 20.792 2008 19.560 - 19.560 2009 8.307 - 8.307 2010 10.982 - 10.982 2011 12.652 - 12.652
2.19 Informações por empresa Information per company
Toyota
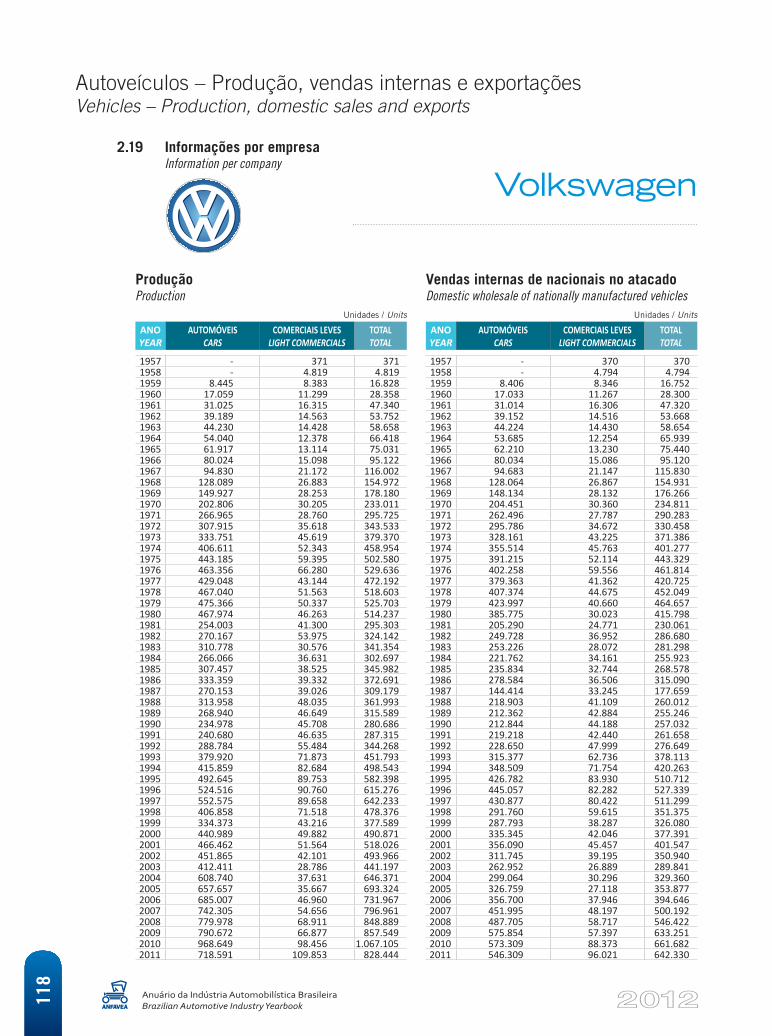
Autoveículos – Produção, vendas internas e exportaçõesVehicles – Production, domestic sales and exports
Anuário da Indústria Automobilística BrasileiraBrazilian Automotive Industry Yearbook11
8
2.19 Informações por empresa Information per company
Produção Production
Unidades / Units
ANO YEAR
AUTOMÓVEIS CARS
COMERCIAIS LEVES LIGHT COMMERCIALS
TOTAL TOTAL
1957 - 371 371 1958 - 4.819 4.819 1959 8.445 8.383 16.828 1960 17.059 11.299 28.358 1961 31.025 16.315 47.340 1962 39.189 14.563 53.752 1963 44.230 14.428 58.658 1964 54.040 12.378 66.418 1965 61.917 13.114 75.031 1966 80.024 15.098 95.122 1967 94.830 21.172 116.002 1968 128.089 26.883 154.972 1969 149.927 28.253 178.180 1970 202.806 30.205 233.011 1971 266.965 28.760 295.725 1972 307.915 35.618 343.533 1973 333.751 45.619 379.370 1974 406.611 52.343 458.954 1975 443.185 59.395 502.580 1976 463.356 66.280 529.636 1977 429.048 43.144 472.192 1978 467.040 51.563 518.603 1979 475.366 50.337 525.703 1980 467.974 46.263 514.237 1981 254.003 41.300 295.303 1982 270.167 53.975 324.142 1983 310.778 30.576 341.354 1984 266.066 36.631 302.697 1985 307.457 38.525 345.982 1986 333.359 39.332 372.691 1987 270.153 39.026 309.179 1988 313.958 48.035 361.993 1989 268.940 46.649 315.589 1990 234.978 45.708 280.686 1991 240.680 46.635 287.315 1992 288.784 55.484 344.268 1993 379.920 71.873 451.793 1994 415.859 82.684 498.543 1995 492.645 89.753 582.398 1996 524.516 90.760 615.276 1997 552.575 89.658 642.233 1998 406.858 71.518 478.376 1999 334.373 43.216 377.589 2000 440.989 49.882 490.871 2001 466.462 51.564 518.026 2002 451.865 42.101 493.966 2003 412.411 28.786 441.197 2004 608.740 37.631 646.371 2005 657.657 35.667 693.324 2006 685.007 46.960 731.967 2007 742.305 54.656 796.961 2008 779.978 68.911 848.889 2009 790.672 66.877 857.549 2010 968.649 98.456 1.067.105 2011 718.591 109.853 828.444
Vendas internas de nacionais no atacadoDomestic wholesale of nationally manufactured vehicles
Unidades / Units
ANO YEAR
AUTOMÓVEIS CARS
COMERCIAIS LEVES LIGHT COMMERCIALS
TOTAL TOTAL
1957 - 370 370 1958 - 4.794 4.794 1959 8.406 8.346 16.752 1960 17.033 11.267 28.300 1961 31.014 16.306 47.320 1962 39.152 14.516 53.668 1963 44.224 14.430 58.654 1964 53.685 12.254 65.939 1965 62.210 13.230 75.440 1966 80.034 15.086 95.120 1967 94.683 21.147 115.830 1968 128.064 26.867 154.931 1969 148.134 28.132 176.266 1970 204.451 30.360 234.811 1971 262.496 27.787 290.283 1972 295.786 34.672 330.458 1973 328.161 43.225 371.386 1974 355.514 45.763 401.277 1975 391.215 52.114 443.329 1976 402.258 59.556 461.814 1977 379.363 41.362 420.725 1978 407.374 44.675 452.049 1979 423.997 40.660 464.657 1980 385.775 30.023 415.798 1981 205.290 24.771 230.061 1982 249.728 36.952 286.680 1983 253.226 28.072 281.298 1984 221.762 34.161 255.923 1985 235.834 32.744 268.578 1986 278.584 36.506 315.090 1987 144.414 33.245 177.659 1988 218.903 41.109 260.012 1989 212.362 42.884 255.246 1990 212.844 44.188 257.032 1991 219.218 42.440 261.658 1992 228.650 47.999 276.649 1993 315.377 62.736 378.113 1994 348.509 71.754 420.263 1995 426.782 83.930 510.712 1996 445.057 82.282 527.339 1997 430.877 80.422 511.299 1998 291.760 59.615 351.375 1999 287.793 38.287 326.080 2000 335.345 42.046 377.391 2001 356.090 45.457 401.547 2002 311.745 39.195 350.940 2003 262.952 26.889 289.841 2004 299.064 30.296 329.360 2005 326.759 27.118 353.877 2006 356.700 37.946 394.646 2007 451.995 48.197 500.192 2008 487.705 58.717 546.422 2009 575.854 57.397 633.251 2010 573.309 88.373 661.682 2011 546.309 96.021 642.330
Volkswagen
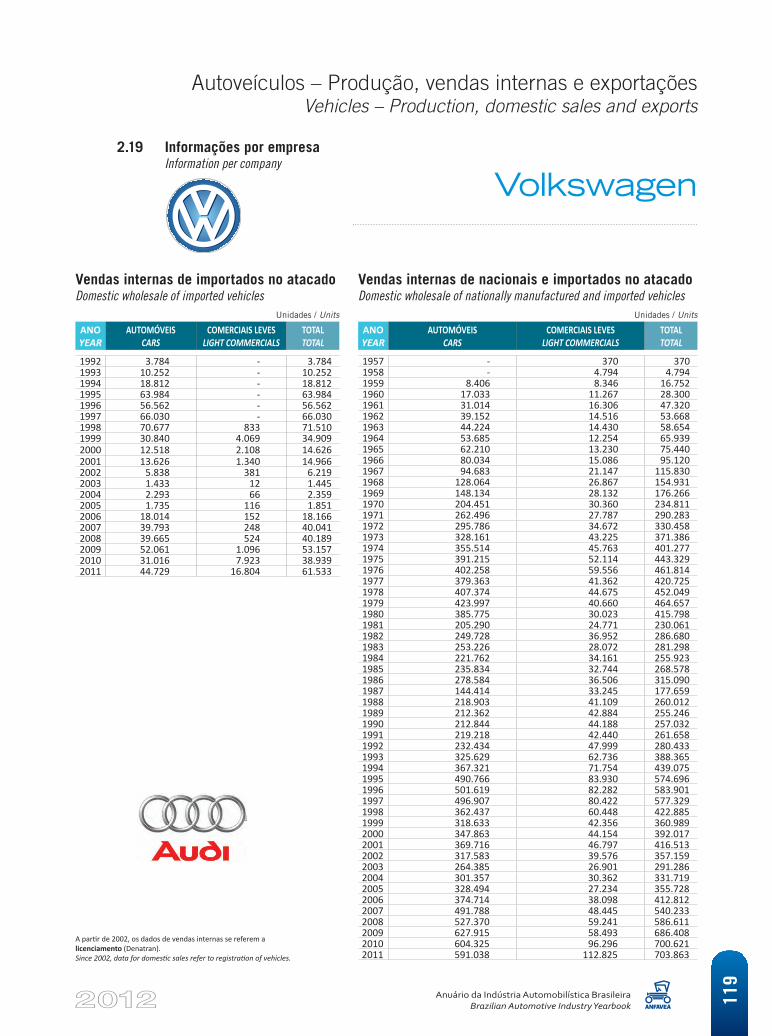
Autoveículos – Produção, vendas internas e exportaçõesVehicles – Production, domestic sales and exports
Anuário da Indústria Automobilística BrasileiraBrazilian Automotive Industry Yearbook 11
9
A partir de 2002, os dados de vendas internas se referem a licenciamento (Denatran). Since 2002, data for domestic sales refer to registration of vehicles.
Vendas internas de importados no atacadoDomestic wholesale of imported vehicles
Unidades / Units
ANO YEAR
AUTOMÓVEIS CARS
COMERCIAIS LEVES LIGHT COMMERCIALS
TOTAL TOTAL
1992 3.784 - 3.784 1993 10.252 - 10.252 1994 18.812 - 18.812 1995 63.984 - 63.984 1996 56.562 - 56.562 1997 66.030 - 66.030 1998 70.677 833 71.510 1999 30.840 4.069 34.909 2000 12.518 2.108 14.626 2001 13.626 1.340 14.966 2002 5.838 381 6.219 2003 1.433 12 1.445 2004 2.293 66 2.359 2005 1.735 116 1.851 2006 18.014 152 18.166 2007 39.793 248 40.041 2008 39.665 524 40.189 2009 52.061 1.096 53.157 2010 31.016 7.923 38.939 2011 44.729 16.804 61.533
Vendas internas de nacionais e importados no atacadoDomestic wholesale of nationally manufactured and imported vehicles
Unidades / Units
ANO YEAR
AUTOMÓVEIS CARS
COMERCIAIS LEVES LIGHT COMMERCIALS
TOTAL TOTAL
1957 - 370 370 1958 - 4.794 4.794 1959 8.406 8.346 16.752 1960 17.033 11.267 28.300 1961 31.014 16.306 47.320 1962 39.152 14.516 53.668 1963 44.224 14.430 58.654 1964 53.685 12.254 65.939 1965 62.210 13.230 75.440 1966 80.034 15.086 95.120 1967 94.683 21.147 115.830 1968 128.064 26.867 154.931 1969 148.134 28.132 176.266 1970 204.451 30.360 234.811 1971 262.496 27.787 290.283 1972 295.786 34.672 330.458 1973 328.161 43.225 371.386 1974 355.514 45.763 401.277 1975 391.215 52.114 443.329 1976 402.258 59.556 461.814 1977 379.363 41.362 420.725 1978 407.374 44.675 452.049 1979 423.997 40.660 464.657 1980 385.775 30.023 415.798 1981 205.290 24.771 230.061 1982 249.728 36.952 286.680 1983 253.226 28.072 281.298 1984 221.762 34.161 255.923 1985 235.834 32.744 268.578 1986 278.584 36.506 315.090 1987 144.414 33.245 177.659 1988 218.903 41.109 260.012 1989 212.362 42.884 255.246 1990 212.844 44.188 257.032 1991 219.218 42.440 261.658 1992 232.434 47.999 280.433 1993 325.629 62.736 388.365 1994 367.321 71.754 439.075 1995 490.766 83.930 574.696 1996 501.619 82.282 583.901 1997 496.907 80.422 577.329 1998 362.437 60.448 422.885 1999 318.633 42.356 360.989 2000 347.863 44.154 392.017 2001 369.716 46.797 416.513 2002 317.583 39.576 357.159 2003 264.385 26.901 291.286 2004 301.357 30.362 331.719 2005 328.494 27.234 355.728 2006 374.714 38.098 412.812 2007 491.788 48.445 540.233 2008 527.370 59.241 586.611 2009 627.915 58.493 686.408 2010 604.325 96.296 700.621 2011 591.038 112.825 703.863
2.19 Informações por empresa Information per company
Volkswagen
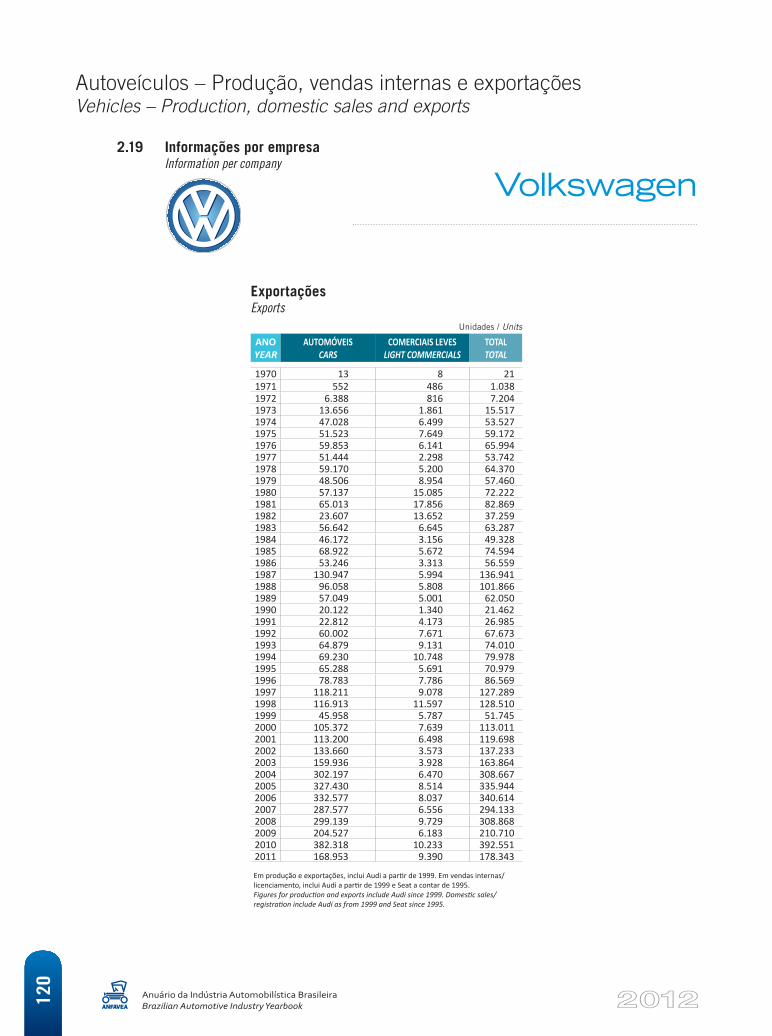
Autoveículos – Produção, vendas internas e exportaçõesVehicles – Production, domestic sales and exports
Anuário da Indústria Automobilística BrasileiraBrazilian Automotive Industry Yearbook12
0
2.19 Informações por empresa Information per company
ExportaçõesExports
Unidades / Units
ANO YEAR
AUTOMÓVEIS CARS
COMERCIAIS LEVES LIGHT COMMERCIALS
TOTAL TOTAL
1970 13 8 21 1971 552 486 1.038 1972 6.388 816 7.204 1973 13.656 1.861 15.517 1974 47.028 6.499 53.527 1975 51.523 7.649 59.172 1976 59.853 6.141 65.994 1977 51.444 2.298 53.742 1978 59.170 5.200 64.370 1979 48.506 8.954 57.460 1980 57.137 15.085 72.222 1981 65.013 17.856 82.869 1982 23.607 13.652 37.259 1983 56.642 6.645 63.287 1984 46.172 3.156 49.328 1985 68.922 5.672 74.594 1986 53.246 3.313 56.559 1987 130.947 5.994 136.941 1988 96.058 5.808 101.866 1989 57.049 5.001 62.050 1990 20.122 1.340 21.462 1991 22.812 4.173 26.985 1992 60.002 7.671 67.673 1993 64.879 9.131 74.010 1994 69.230 10.748 79.978 1995 65.288 5.691 70.979 1996 78.783 7.786 86.569 1997 118.211 9.078 127.289 1998 116.913 11.597 128.510 1999 45.958 5.787 51.745 2000 105.372 7.639 113.011 2001 113.200 6.498 119.698 2002 133.660 3.573 137.233 2003 159.936 3.928 163.864 2004 302.197 6.470 308.667 2005 327.430 8.514 335.944 2006 332.577 8.037 340.614 2007 287.577 6.556 294.133 2008 299.139 9.729 308.868 2009 204.527 6.183 210.710 2010 382.318 10.233 392.551 2011 168.953 9.390 178.343
Volkswagen
Em produção e exportações, inclui Audi a partir de 1999. Em vendas internas/licenciamento, inclui Audi a partir de 1999 e Seat a contar de 1995. Figures for production and exports include Audi since 1999. Domestic sales/registration include Audi as from 1999 and Seat since 1995.
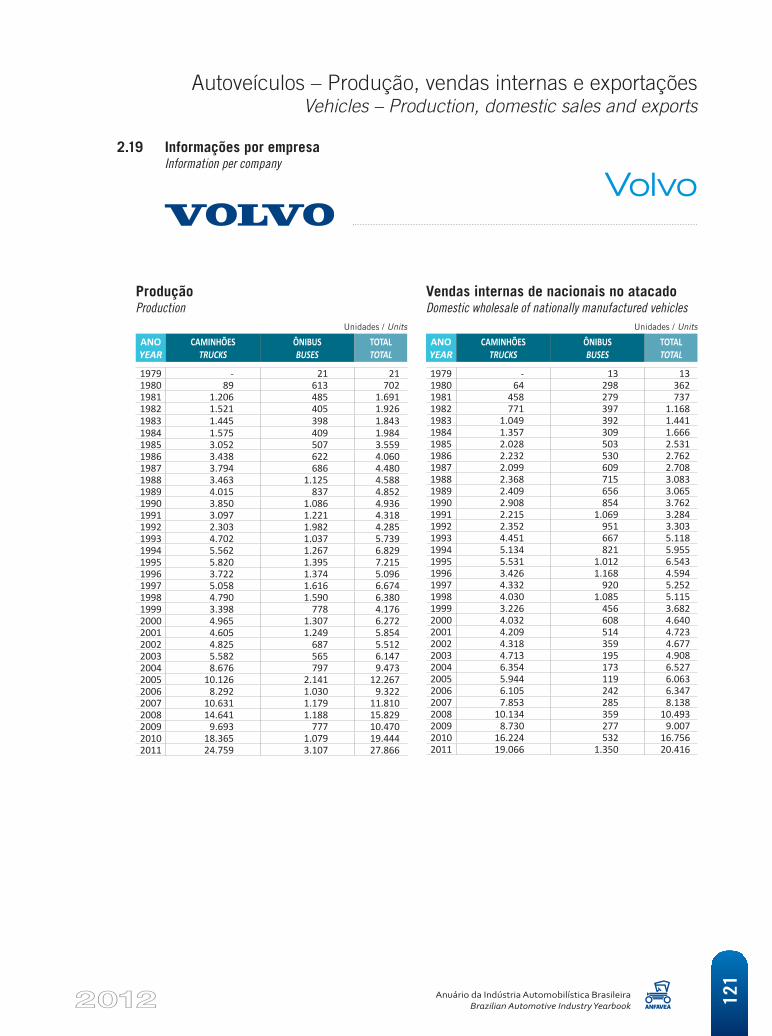
Autoveículos – Produção, vendas internas e exportaçõesVehicles – Production, domestic sales and exports
Anuário da Indústria Automobilística BrasileiraBrazilian Automotive Industry Yearbook 12
1
2.19 Informações por empresa Information per company
ProduçãoProduction
Unidades / Units
ANO YEAR
CAMINHÕES TRUCKS
ÔNIBUS BUSES
TOTAL TOTAL
1979 - 21 21 1980 89 613 702 1981 1.206 485 1.691 1982 1.521 405 1.926 1983 1.445 398 1.843 1984 1.575 409 1.984 1985 3.052 507 3.559 1986 3.438 622 4.060 1987 3.794 686 4.480 1988 3.463 1.125 4.588 1989 4.015 837 4.852 1990 3.850 1.086 4.936 1991 3.097 1.221 4.318 1992 2.303 1.982 4.285 1993 4.702 1.037 5.739 1994 5.562 1.267 6.829 1995 5.820 1.395 7.215 1996 3.722 1.374 5.096 1997 5.058 1.616 6.674 1998 4.790 1.590 6.380 1999 3.398 778 4.176 2000 4.965 1.307 6.272 2001 4.605 1.249 5.854 2002 4.825 687 5.512 2003 5.582 565 6.147 2004 8.676 797 9.473 2005 10.126 2.141 12.267 2006 8.292 1.030 9.322 2007 10.631 1.179 11.810 2008 14.641 1.188 15.829 2009 9.693 777 10.470 2010 18.365 1.079 19.444 2011 24.759 3.107 27.866
Vendas internas de nacionais no atacadoDomestic wholesale of nationally manufactured vehicles
Unidades / Units
ANO YEAR
CAMINHÕES TRUCKS
ÔNIBUS BUSES
TOTAL TOTAL
1979 - 13 13 1980 64 298 362 1981 458 279 737 1982 771 397 1.168 1983 1.049 392 1.441 1984 1.357 309 1.666 1985 2.028 503 2.531 1986 2.232 530 2.762 1987 2.099 609 2.708 1988 2.368 715 3.083 1989 2.409 656 3.065 1990 2.908 854 3.762 1991 2.215 1.069 3.284 1992 2.352 951 3.303 1993 4.451 667 5.118 1994 5.134 821 5.955 1995 5.531 1.012 6.543 1996 3.426 1.168 4.594 1997 4.332 920 5.252 1998 4.030 1.085 5.115 1999 3.226 456 3.682 2000 4.032 608 4.640 2001 4.209 514 4.723 2002 4.318 359 4.677 2003 4.713 195 4.908 2004 6.354 173 6.527 2005 5.944 119 6.063 2006 6.105 242 6.347 2007 7.853 285 8.138 2008 10.134 359 10.493 2009 8.730 277 9.007 2010 16.224 532 16.756 2011 19.066 1.350 20.416
Volvo
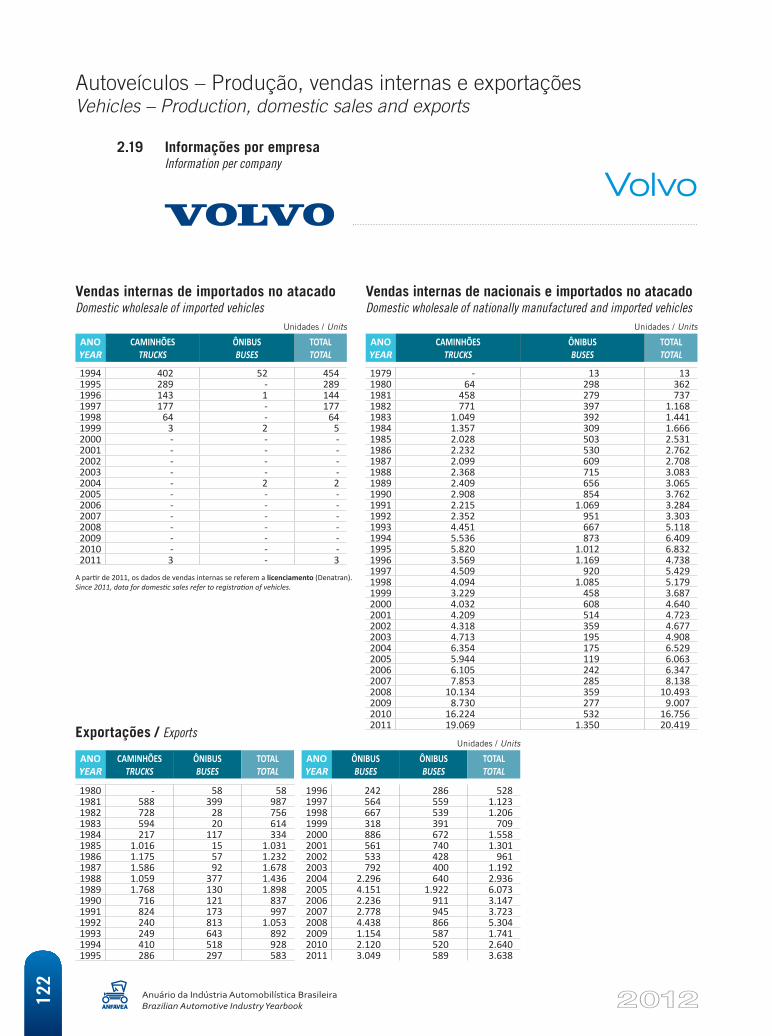
Autoveículos – Produção, vendas internas e exportaçõesVehicles – Production, domestic sales and exports
Anuário da Indústria Automobilística BrasileiraBrazilian Automotive Industry Yearbook12
2
2.19 Informações por empresa Information per company
Vendas internas de importados no atacadoDomestic wholesale of imported vehicles
Unidades / Units
ANO YEAR
CAMINHÕES TRUCKS
ÔNIBUS BUSES
TOTAL TOTAL
1994 402 52 454 1995 289 - 289 1996 143 1 144 1997 177 - 177 1998 64 - 64 1999 3 2 5 2000 - - - 2001 - - - 2002 - - - 2003 - - - 2004 - 2 2 2005 - - - 2006 - - - 2007 - - - 2008 - - - 2009 - - - 2010 - - - 2011 3 - 3
Vendas internas de nacionais e importados no atacadoDomestic wholesale of nationally manufactured and imported vehicles
Unidades / Units
ANO YEAR
CAMINHÕES TRUCKS
ÔNIBUS BUSES
TOTAL TOTAL
1979 - 13 13 1980 64 298 362 1981 458 279 737 1982 771 397 1.168 1983 1.049 392 1.441 1984 1.357 309 1.666 1985 2.028 503 2.531 1986 2.232 530 2.762 1987 2.099 609 2.708 1988 2.368 715 3.083 1989 2.409 656 3.065 1990 2.908 854 3.762 1991 2.215 1.069 3.284 1992 2.352 951 3.303 1993 4.451 667 5.118 1994 5.536 873 6.409 1995 5.820 1.012 6.832 1996 3.569 1.169 4.738 1997 4.509 920 5.429 1998 4.094 1.085 5.179 1999 3.229 458 3.687 2000 4.032 608 4.640 2001 4.209 514 4.723 2002 4.318 359 4.677 2003 4.713 195 4.908 2004 6.354 175 6.529 2005 5.944 119 6.063 2006 6.105 242 6.347 2007 7.853 285 8.138 2008 10.134 359 10.493 2009 8.730 277 9.007 2010 16.224 532 16.756 2011 19.069 1.350 20.419
Exportações / ExportsUnidades / Units
ANO YEAR
CAMINHÕES TRUCKS
ÔNIBUS BUSES
TOTAL TOTAL
ANO YEAR
ÔNIBUS BUSES
ÔNIBUS BUSES
TOTAL TOTAL
1980 - 58 58 1996 242 286 528 1981 588 399 987 1997 564 559 1.123 1982 728 28 756 1998 667 539 1.206 1983 594 20 614 1999 318 391 709 1984 217 117 334 2000 886 672 1.558 1985 1.016 15 1.031 2001 561 740 1.301 1986 1.175 57 1.232 2002 533 428 961 1987 1.586 92 1.678 2003 792 400 1.192 1988 1.059 377 1.436 2004 2.296 640 2.936 1989 1.768 130 1.898 2005 4.151 1.922 6.073 1990 716 121 837 2006 2.236 911 3.147 1991 824 173 997 2007 2.778 945 3.723 1992 240 813 1.053 2008 4.438 866 5.304 1993 249 643 892 2009 1.154 587 1.741 1994 410 518 928 2010 2.120 520 2.640 1995 286 297 583 2011 3.049 589 3.638
Volvo
A partir de 2011, os dados de vendas internas se referem a licenciamento (Denatran). Since 2011, data for domestic sales refer to registration of vehicles.
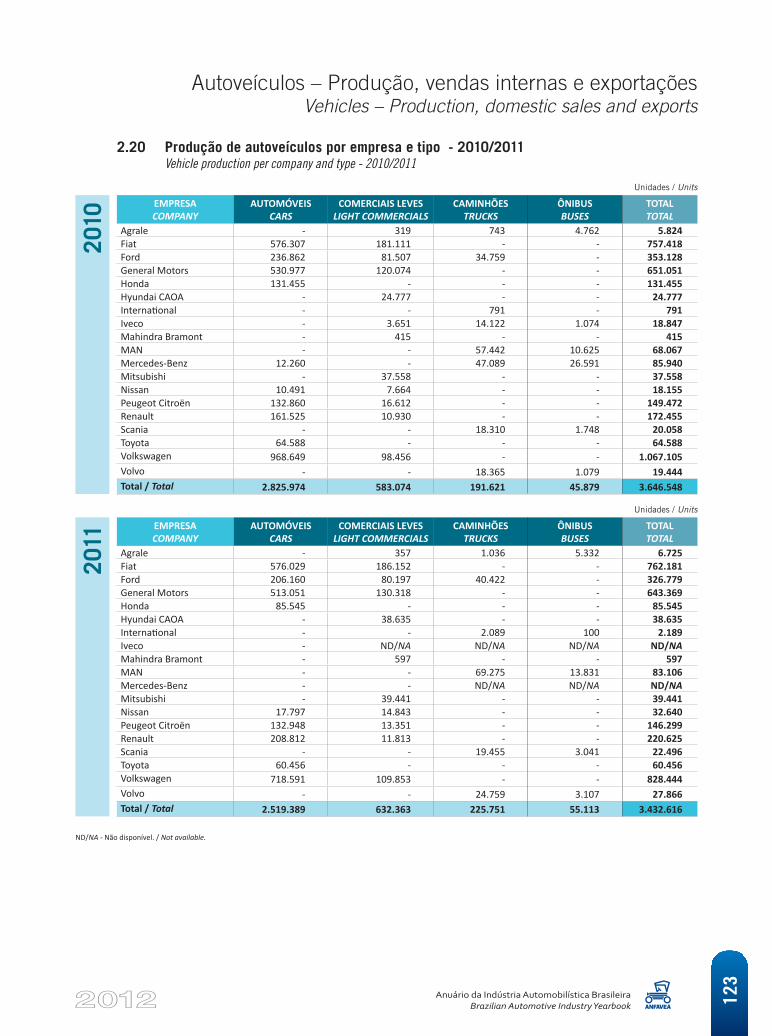
Autoveículos – Produção, vendas internas e exportaçõesVehicles – Production, domestic sales and exports
Anuário da Indústria Automobilística BrasileiraBrazilian Automotive Industry Yearbook 12
3
2.20 Produção de autoveículos por empresa e tipo - 2010/2011 Vehicle production per company and type - 2010/2011
2010
EMPRESA COMPANY
AUTOMÓVEIS CARS
COMERCIAIS LEVES LIGHT COMMERCIALS
CAMINHÕES TRUCKS
ÔNIBUS BUSES
TOTAL TOTAL
Agrale - 319 743 4.762 5.824 Fiat 576.307 181.111 - - 757.418 Ford 236.862 81.507 34.759 - 353.128 General Motors 530.977 120.074 - - 651.051 Honda 131.455 - - - 131.455 Hyundai CAOA - 24.777 - - 24.777 International - - 791 - 791 Iveco - 3.651 14.122 1.074 18.847 Mahindra Bramont - 415 - - 415 MAN - - 57.442 10.625 68.067 Mercedes-Benz 12.260 - 47.089 26.591 85.940 Mitsubishi - 37.558 - - 37.558 Nissan 10.491 7.664 - - 18.155 Peugeot Citroën 132.860 16.612 - - 149.472 Renault 161.525 10.930 - - 172.455 Scania - - 18.310 1.748 20.058 Toyota 64.588 - - - 64.588 Volkswagen 968.649 98.456 - - 1.067.105 Volvo - - 18.365 1.079 19.444 Total / Total 2.825.974 583.074 191.621 45.879 3.646.548
2011
EMPRESA COMPANY
AUTOMÓVEIS CARS
COMERCIAIS LEVES LIGHT COMMERCIALS
CAMINHÕES TRUCKS
ÔNIBUS BUSES
TOTAL TOTAL
Agrale - 357 1.036 5.332 6.725 Fiat 576.029 186.152 - - 762.181 Ford 206.160 80.197 40.422 - 326.779 General Motors 513.051 130.318 - - 643.369 Honda 85.545 - - - 85.545 Hyundai CAOA - 38.635 - - 38.635 International - - 2.089 100 2.189 Iveco - ND/NA ND/NA ND/NA ND/NA Mahindra Bramont - 597 - - 597 MAN - - 69.275 13.831 83.106 Mercedes-Benz - - ND/NA ND/NA ND/NAMitsubishi - 39.441 - - 39.441 Nissan 17.797 14.843 - - 32.640 Peugeot Citroën 132.948 13.351 - - 146.299 Renault 208.812 11.813 - - 220.625 Scania - - 19.455 3.041 22.496 Toyota 60.456 - - - 60.456 Volkswagen 718.591 109.853 - - 828.444 Volvo - - 24.759 3.107 27.866 Total / Total 2.519.389 632.363 225.751 55.113 3.432.616
ND/NA - Não disponível. / Not available.
Unidades / Units
Unidades / Units
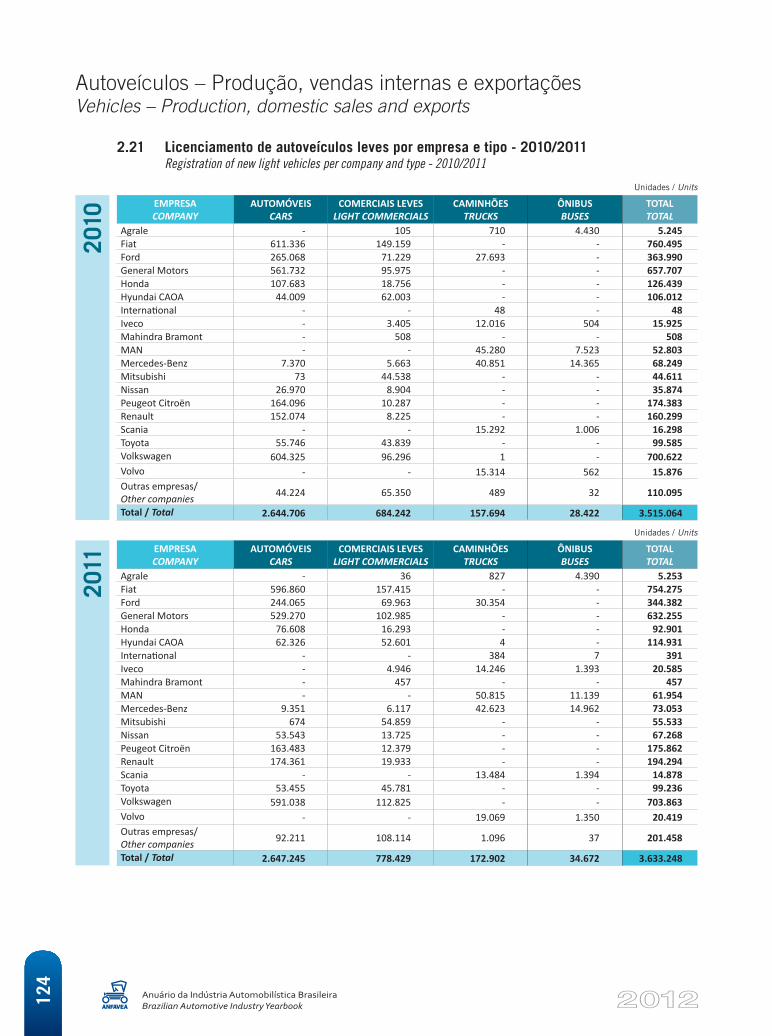
Autoveículos – Produção, vendas internas e exportaçõesVehicles – Production, domestic sales and exports
Anuário da Indústria Automobilística BrasileiraBrazilian Automotive Industry Yearbook12
4
2010
EMPRESA COMPANY
AUTOMÓVEIS CARS
COMERCIAIS LEVES LIGHT COMMERCIALS
CAMINHÕES TRUCKS
ÔNIBUS BUSES
TOTAL TOTAL
Agrale - 105 710 4.430 5.245 Fiat 611.336 149.159 - - 760.495 Ford 265.068 71.229 27.693 - 363.990 General Motors 561.732 95.975 - - 657.707 Honda 107.683 18.756 - - 126.439 Hyundai CAOA 44.009 62.003 - - 106.012 International - - 48 - 48 Iveco - 3.405 12.016 504 15.925 Mahindra Bramont - 508 - - 508 MAN - - 45.280 7.523 52.803 Mercedes-Benz 7.370 5.663 40.851 14.365 68.249 Mitsubishi 73 44.538 - - 44.611 Nissan 26.970 8.904 - - 35.874 Peugeot Citroën 164.096 10.287 - - 174.383 Renault 152.074 8.225 - - 160.299 Scania - - 15.292 1.006 16.298 Toyota 55.746 43.839 - - 99.585 Volkswagen 604.325 96.296 1 - 700.622 Volvo - - 15.314 562 15.876 Outras empresas/Other companies 44.224 65.350 489 32 110.095
Total / Total 2.644.706 684.242 157.694 28.422 3.515.064
2011
EMPRESA COMPANY
AUTOMÓVEIS CARS
COMERCIAIS LEVES LIGHT COMMERCIALS
CAMINHÕES TRUCKS
ÔNIBUS BUSES
TOTAL TOTAL
Agrale - 36 827 4.390 5.253 Fiat 596.860 157.415 - - 754.275 Ford 244.065 69.963 30.354 - 344.382 General Motors 529.270 102.985 - - 632.255 Honda 76.608 16.293 - - 92.901 Hyundai CAOA 62.326 52.601 4 - 114.931 International - - 384 7 391 Iveco - 4.946 14.246 1.393 20.585 Mahindra Bramont - 457 - - 457 MAN - - 50.815 11.139 61.954 Mercedes-Benz 9.351 6.117 42.623 14.962 73.053 Mitsubishi 674 54.859 - - 55.533 Nissan 53.543 13.725 - - 67.268 Peugeot Citroën 163.483 12.379 - - 175.862 Renault 174.361 19.933 - - 194.294 Scania - - 13.484 1.394 14.878 Toyota 53.455 45.781 - - 99.236 Volkswagen 591.038 112.825 - - 703.863 Volvo - - 19.069 1.350 20.419 Outras empresas/Other companies 92.211 108.114 1.096 37 201.458
Total / Total 2.647.245 778.429 172.902 34.672 3.633.248
Unidades / Units
2.21 Licenciamento de autoveículos leves por empresa e tipo - 2010/2011 Registration of new light vehicles per company and type - 2010/2011
Unidades / Units
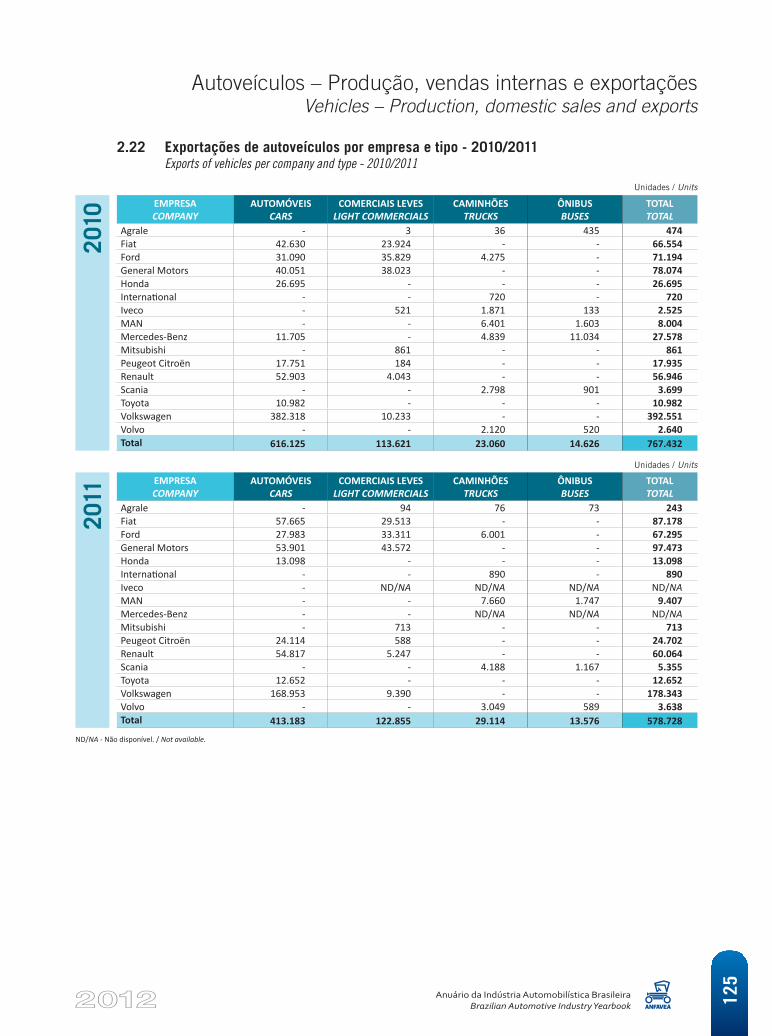
Autoveículos – Produção, vendas internas e exportaçõesVehicles – Production, domestic sales and exports
Anuário da Indústria Automobilística BrasileiraBrazilian Automotive Industry Yearbook 12
5
2.22 Exportações de autoveículos por empresa e tipo - 2010/2011 Exports of vehicles per company and type - 2010/2011
2010
EMPRESA COMPANY
AUTOMÓVEIS CARS
COMERCIAIS LEVES LIGHT COMMERCIALS
CAMINHÕES TRUCKS
ÔNIBUS BUSES
TOTAL TOTAL
Agrale - 3 36 435 474 Fiat 42.630 23.924 - - 66.554 Ford 31.090 35.829 4.275 - 71.194 General Motors 40.051 38.023 - - 78.074 Honda 26.695 - - - 26.695 International - - 720 - 720 Iveco - 521 1.871 133 2.525 MAN - - 6.401 1.603 8.004 Mercedes-Benz 11.705 - 4.839 11.034 27.578 Mitsubishi - 861 - - 861 Peugeot Citroën 17.751 184 - - 17.935 Renault 52.903 4.043 - - 56.946 Scania - - 2.798 901 3.699 Toyota 10.982 - - - 10.982 Volkswagen 382.318 10.233 - - 392.551 Volvo - - 2.120 520 2.640 Total 616.125 113.621 23.060 14.626 767.432
2011
EMPRESA COMPANY
AUTOMÓVEIS CARS
COMERCIAIS LEVES LIGHT COMMERCIALS
CAMINHÕES TRUCKS
ÔNIBUS BUSES
TOTAL TOTAL
Agrale - 94 76 73 243 Fiat 57.665 29.513 - - 87.178 Ford 27.983 33.311 6.001 - 67.295 General Motors 53.901 43.572 - - 97.473 Honda 13.098 - - - 13.098 International - - 890 - 890 Iveco - ND/NA ND/NA ND/NA ND/NA MAN - - 7.660 1.747 9.407 Mercedes-Benz - - ND/NA ND/NA ND/NA Mitsubishi - 713 - - 713 Peugeot Citroën 24.114 588 - - 24.702 Renault 54.817 5.247 - - 60.064 Scania - - 4.188 1.167 5.355 Toyota 12.652 - - - 12.652 Volkswagen 168.953 9.390 - - 178.343 Volvo - - 3.049 589 3.638 Total 413.183 122.855 29.114 13.576 578.728
ND/NA - Não disponível. / Not available.
Unidades / Units
Unidades / Units

Máquinas agrícolas automotrizes Produção, vendas internas
e exportaçõesAgricultural machinery - Production, domestic sales and exports
3
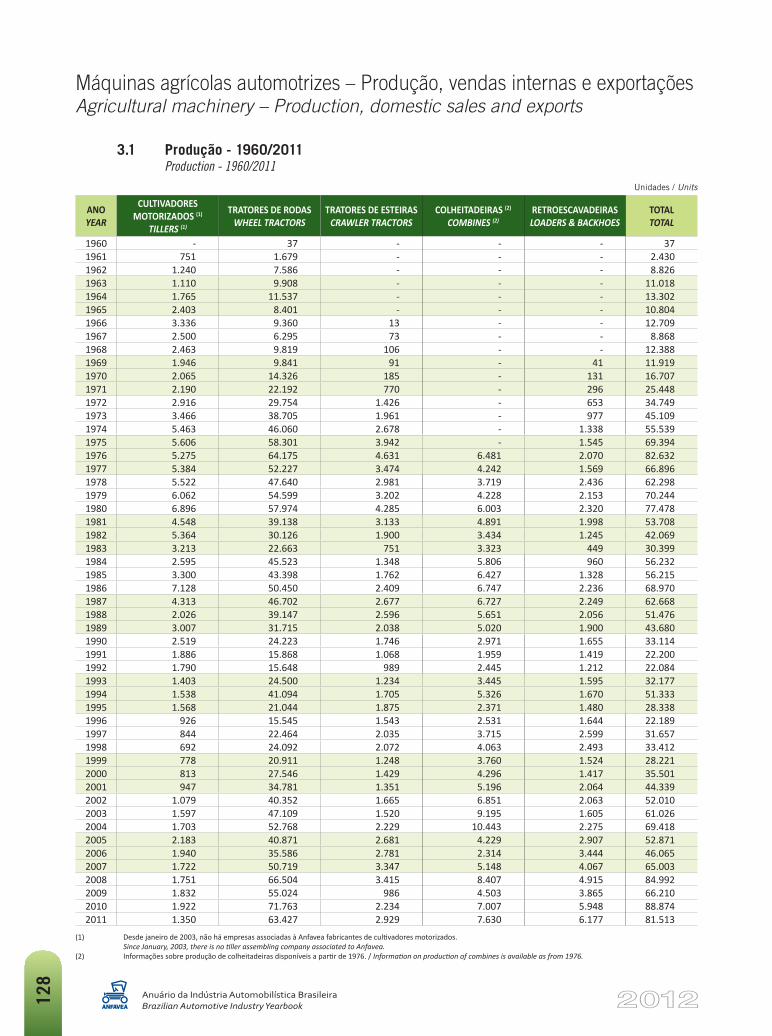
Máquinas agrícolas automotrizes – Produção, vendas internas e exportaçõesAgricultural machinery – Production, domestic sales and exports
Anuário da Indústria Automobilística BrasileiraBrazilian Automotive Industry Yearbook12
8
ANO YEAR
CULTIVADORES MOTORIZADOS (1)
TILLERS (1)
TRATORES DE RODAS WHEEL TRACTORS
TRATORES DE ESTEIRAS CRAWLER TRACTORS
COLHEITADEIRAS (2) COMBINES (2)
RETROESCAVADEIRAS LOADERS & BACKHOES
TOTAL TOTAL
1960 - 37 - - - 371961 751 1.679 - - - 2.4301962 1.240 7.586 - - - 8.8261963 1.110 9.908 - - - 11.0181964 1.765 11.537 - - - 13.3021965 2.403 8.401 - - - 10.8041966 3.336 9.360 13 - - 12.7091967 2.500 6.295 73 - - 8.8681968 2.463 9.819 106 - - 12.3881969 1.946 9.841 91 - 41 11.9191970 2.065 14.326 185 - 131 16.7071971 2.190 22.192 770 - 296 25.4481972 2.916 29.754 1.426 - 653 34.7491973 3.466 38.705 1.961 - 977 45.1091974 5.463 46.060 2.678 - 1.338 55.5391975 5.606 58.301 3.942 - 1.545 69.3941976 5.275 64.175 4.631 6.481 2.070 82.6321977 5.384 52.227 3.474 4.242 1.569 66.8961978 5.522 47.640 2.981 3.719 2.436 62.2981979 6.062 54.599 3.202 4.228 2.153 70.2441980 6.896 57.974 4.285 6.003 2.320 77.4781981 4.548 39.138 3.133 4.891 1.998 53.7081982 5.364 30.126 1.900 3.434 1.245 42.0691983 3.213 22.663 751 3.323 449 30.3991984 2.595 45.523 1.348 5.806 960 56.2321985 3.300 43.398 1.762 6.427 1.328 56.2151986 7.128 50.450 2.409 6.747 2.236 68.9701987 4.313 46.702 2.677 6.727 2.249 62.6681988 2.026 39.147 2.596 5.651 2.056 51.4761989 3.007 31.715 2.038 5.020 1.900 43.6801990 2.519 24.223 1.746 2.971 1.655 33.1141991 1.886 15.868 1.068 1.959 1.419 22.2001992 1.790 15.648 989 2.445 1.212 22.0841993 1.403 24.500 1.234 3.445 1.595 32.1771994 1.538 41.094 1.705 5.326 1.670 51.3331995 1.568 21.044 1.875 2.371 1.480 28.3381996 926 15.545 1.543 2.531 1.644 22.1891997 844 22.464 2.035 3.715 2.599 31.6571998 692 24.092 2.072 4.063 2.493 33.4121999 778 20.911 1.248 3.760 1.524 28.2212000 813 27.546 1.429 4.296 1.417 35.5012001 947 34.781 1.351 5.196 2.064 44.3392002 1.079 40.352 1.665 6.851 2.063 52.0102003 1.597 47.109 1.520 9.195 1.605 61.0262004 1.703 52.768 2.229 10.443 2.275 69.4182005 2.183 40.871 2.681 4.229 2.907 52.8712006 1.940 35.586 2.781 2.314 3.444 46.0652007 1.722 50.719 3.347 5.148 4.067 65.0032008 1.751 66.504 3.415 8.407 4.915 84.9922009 1.832 55.024 986 4.503 3.865 66.2102010 1.922 71.763 2.234 7.007 5.948 88.8742011 1.350 63.427 2.929 7.630 6.177 81.513
(1) Desdejaneirode2003,nãoháempresasassociadasàAnfaveafabricantesdecultivadoresmotorizados. Since January, 2003, there is no tiller assembling company associated to Anfavea.(2) Informaçõessobreproduçãodecolheitadeirasdisponíveisapartirde1976./Information on production of combines is available as from 1976.
3.1 Produção - 1960/2011 Production - 1960/2011
Unidades / Units
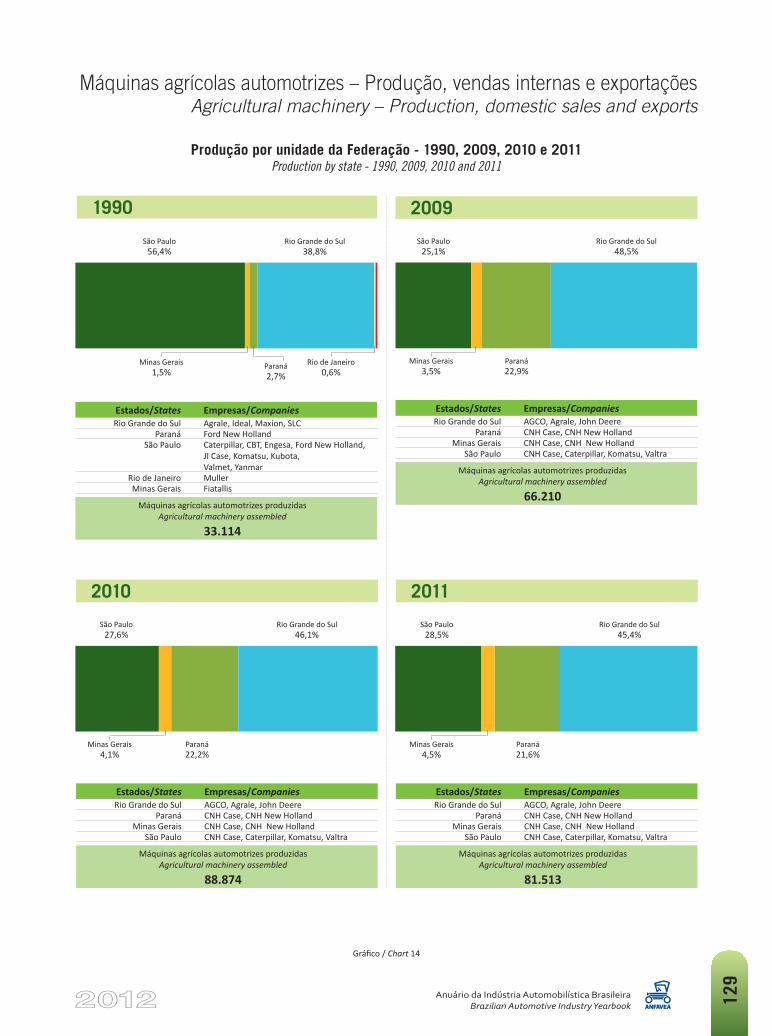
Máquinas agrícolas automotrizes – Produção, vendas internas e exportaçõesAgricultural machinery – Production, domestic sales and exports
Anuário da Indústria Automobilística BrasileiraBrazilian Automotive Industry Yearbook 12
9
Gráfico/Chart 14
São Paulo25,1%
Minas Gerais3,5%
Paraná22,9%
Rio Grande do Sul48,5%
São Paulo28,5%
São Paulo27,6%
Minas Gerais4,5%
Minas Gerais4,1%
Paraná21,6%
Paraná22,2%
Rio Grande do Sul45,4%
Rio Grande do Sul46,1%
São Paulo56,4%
Minas Gerais1,5%
Rio de Janeiro0,6%
Paraná2,7%
Rio Grande do Sul38,8%
1990 2009
20112010
Estados/States Empresas/CompaniesRio Grande do Sul AGCO, Agrale, John Deere
Paraná CNH Case, CNH New HollandMinas Gerais CNH Case, CNH New Holland
São Paulo CNH Case, Caterpillar, Komatsu, Valtra
MáquinasagrícolasautomotrizesproduzidasAgricultural machinery assembled
66.210
Estados/States Empresas/CompaniesRio Grande do Sul AGCO, Agrale, John Deere
Paraná CNH Case, CNH New HollandMinas Gerais CNH Case, CNH New Holland
São Paulo CNH Case, Caterpillar, Komatsu, Valtra
MáquinasagrícolasautomotrizesproduzidasAgricultural machinery assembled
81.513
Estados/States Empresas/CompaniesRio Grande do Sul AGCO, Agrale, John Deere
Paraná CNH Case, CNH New HollandMinas Gerais CNH Case, CNH New Holland
São Paulo CNH Case, Caterpillar, Komatsu, Valtra
MáquinasagrícolasautomotrizesproduzidasAgricultural machinery assembled
88.874
Estados/States Empresas/CompaniesRio Grande do Sul Agrale, Ideal, Maxion, SLC
Paraná Ford New HollandSão Paulo
Caterpillar, CBT, Engesa, Ford New Holland, JI Case, Komatsu, Kubota, Valmet, Yanmar
Rio de Janeiro MullerMinas Gerais Fiatallis
MáquinasagrícolasautomotrizesproduzidasAgricultural machinery assembled
33.114
Produção por unidade da Federação - 1990, 2009, 2010 e 2011Production by state - 1990, 2009, 2010 and 2011
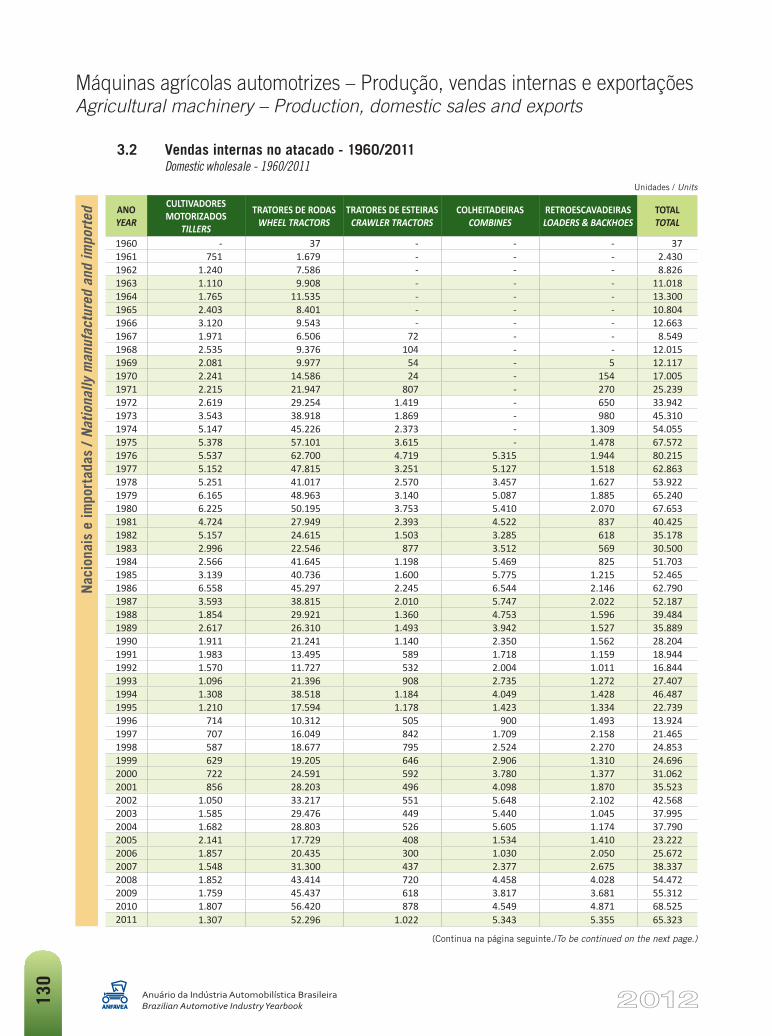
Máquinas agrícolas automotrizes – Produção, vendas internas e exportaçõesAgricultural machinery – Production, domestic sales and exports
Anuário da Indústria Automobilística BrasileiraBrazilian Automotive Industry Yearbook13
0
3.2 Vendas internas no atacado - 1960/2011 Domestic wholesale - 1960/2011
Nac
iona
is e
impo
rtad
as /
Natio
nally
man
ufac
ture
d an
d im
port
ed ANO YEAR
CULTIVADORES MOTORIZADOS
TILLERS
TRATORES DE RODAS WHEEL TRACTORS
TRATORES DE ESTEIRAS CRAWLER TRACTORS
COLHEITADEIRAS COMBINES
RETROESCAVADEIRAS LOADERS & BACKHOES
TOTAL TOTAL
1960 - 37 - - - 371961 751 1.679 - - - 2.4301962 1.240 7.586 - - - 8.8261963 1.110 9.908 - - - 11.0181964 1.765 11.535 - - - 13.3001965 2.403 8.401 - - - 10.8041966 3.120 9.543 - - - 12.6631967 1.971 6.506 72 - - 8.5491968 2.535 9.376 104 - - 12.0151969 2.081 9.977 54 - 5 12.1171970 2.241 14.586 24 - 154 17.0051971 2.215 21.947 807 - 270 25.2391972 2.619 29.254 1.419 - 650 33.9421973 3.543 38.918 1.869 - 980 45.3101974 5.147 45.226 2.373 - 1.309 54.0551975 5.378 57.101 3.615 - 1.478 67.5721976 5.537 62.700 4.719 5.315 1.944 80.2151977 5.152 47.815 3.251 5.127 1.518 62.8631978 5.251 41.017 2.570 3.457 1.627 53.9221979 6.165 48.963 3.140 5.087 1.885 65.2401980 6.225 50.195 3.753 5.410 2.070 67.6531981 4.724 27.949 2.393 4.522 837 40.4251982 5.157 24.615 1.503 3.285 618 35.1781983 2.996 22.546 877 3.512 569 30.5001984 2.566 41.645 1.198 5.469 825 51.7031985 3.139 40.736 1.600 5.775 1.215 52.4651986 6.558 45.297 2.245 6.544 2.146 62.7901987 3.593 38.815 2.010 5.747 2.022 52.1871988 1.854 29.921 1.360 4.753 1.596 39.4841989 2.617 26.310 1.493 3.942 1.527 35.8891990 1.911 21.241 1.140 2.350 1.562 28.2041991 1.983 13.495 589 1.718 1.159 18.9441992 1.570 11.727 532 2.004 1.011 16.8441993 1.096 21.396 908 2.735 1.272 27.4071994 1.308 38.518 1.184 4.049 1.428 46.4871995 1.210 17.594 1.178 1.423 1.334 22.7391996 714 10.312 505 900 1.493 13.9241997 707 16.049 842 1.709 2.158 21.4651998 587 18.677 795 2.524 2.270 24.8531999 629 19.205 646 2.906 1.310 24.6962000 722 24.591 592 3.780 1.377 31.0622001 856 28.203 496 4.098 1.870 35.5232002 1.050 33.217 551 5.648 2.102 42.5682003 1.585 29.476 449 5.440 1.045 37.9952004 1.682 28.803 526 5.605 1.174 37.7902005 2.141 17.729 408 1.534 1.410 23.2222006 1.857 20.435 300 1.030 2.050 25.6722007 1.548 31.300 437 2.377 2.675 38.3372008 1.852 43.414 720 4.458 4.028 54.4722009 1.759 45.437 618 3.817 3.681 55.3122010 1.807 56.420 878 4.549 4.871 68.5252011 1.307 52.296 1.022 5.343 5.355 65.323
(Continua na página seguinte./To be continued on the next page.)
Unidades / Units
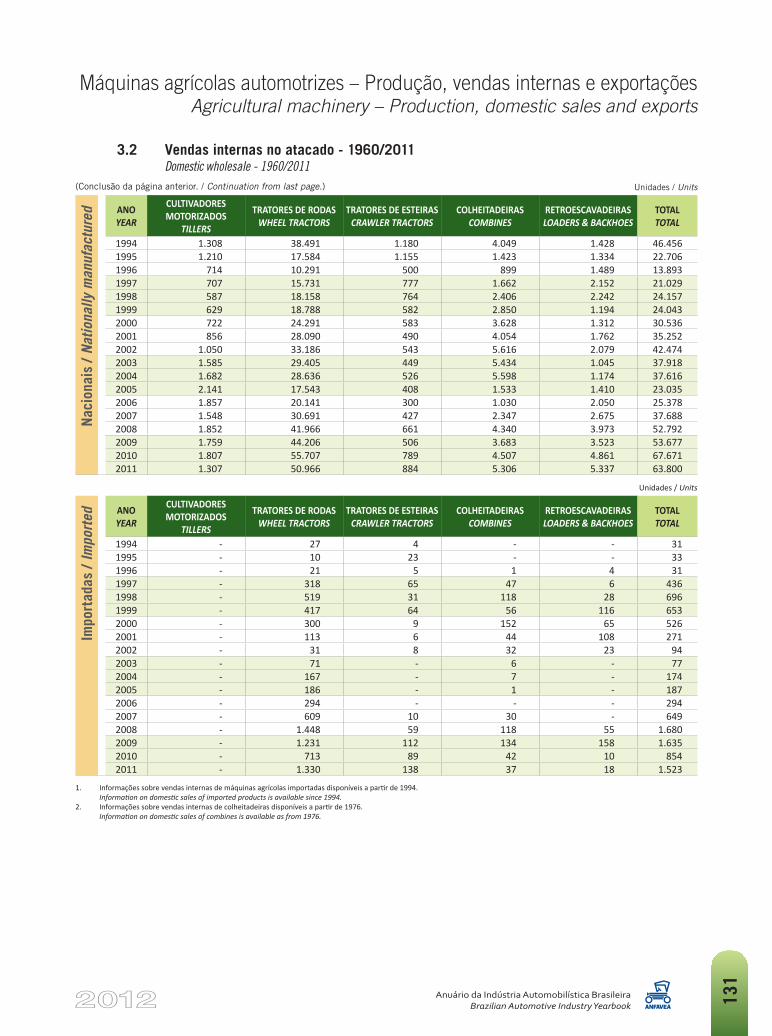
Máquinas agrícolas automotrizes – Produção, vendas internas e exportaçõesAgricultural machinery – Production, domestic sales and exports
Anuário da Indústria Automobilística BrasileiraBrazilian Automotive Industry Yearbook 13
1
(Conclusão da página anterior. / Continuation from last page.)
3.2 Vendas internas no atacado - 1960/2011 Domestic wholesale - 1960/2011
Nac
iona
is /
Natio
nally
man
ufac
ture
d ANO YEAR
CULTIVADORES MOTORIZADOS
TILLERS
TRATORES DE RODAS WHEEL TRACTORS
TRATORES DE ESTEIRAS CRAWLER TRACTORS
COLHEITADEIRAS COMBINES
RETROESCAVADEIRAS LOADERS & BACKHOES
TOTAL TOTAL
1994 1.308 38.491 1.180 4.049 1.428 46.4561995 1.210 17.584 1.155 1.423 1.334 22.7061996 714 10.291 500 899 1.489 13.8931997 707 15.731 777 1.662 2.152 21.0291998 587 18.158 764 2.406 2.242 24.1571999 629 18.788 582 2.850 1.194 24.0432000 722 24.291 583 3.628 1.312 30.5362001 856 28.090 490 4.054 1.762 35.2522002 1.050 33.186 543 5.616 2.079 42.4742003 1.585 29.405 449 5.434 1.045 37.9182004 1.682 28.636 526 5.598 1.174 37.6162005 2.141 17.543 408 1.533 1.410 23.0352006 1.857 20.141 300 1.030 2.050 25.3782007 1.548 30.691 427 2.347 2.675 37.6882008 1.852 41.966 661 4.340 3.973 52.7922009 1.759 44.206 506 3.683 3.523 53.6772010 1.807 55.707 789 4.507 4.861 67.6712011 1.307 50.966 884 5.306 5.337 63.800
Unidades/Units
Impo
rtad
as /
Impo
rted ANO
YEAR
CULTIVADORES MOTORIZADOS
TILLERS
TRATORES DE RODAS WHEEL TRACTORS
TRATORES DE ESTEIRAS CRAWLER TRACTORS
COLHEITADEIRAS COMBINES
RETROESCAVADEIRAS LOADERS & BACKHOES
TOTAL TOTAL
1994 - 27 4 - - 311995 - 10 23 - - 331996 - 21 5 1 4 311997 - 318 65 47 6 4361998 - 519 31 118 28 6961999 - 417 64 56 116 6532000 - 300 9 152 65 5262001 - 113 6 44 108 2712002 - 31 8 32 23 942003 - 71 - 6 - 772004 - 167 - 7 - 1742005 - 186 - 1 - 1872006 - 294 - - - 2942007 - 609 10 30 - 6492008 - 1.448 59 118 55 1.6802009 - 1.231 112 134 158 1.6352010 - 713 89 42 10 8542011 - 1.330 138 37 18 1.523
1. Informaçõessobrevendasinternasdemáquinasagrícolasimportadasdisponíveisapartirde1994. Information on domestic sales of imported products is available since 1994.
2. Informaçõessobrevendasinternasdecolheitadeirasdisponíveisapartirde1976. Information on domestic sales of combines is available as from 1976.
Unidades / Units
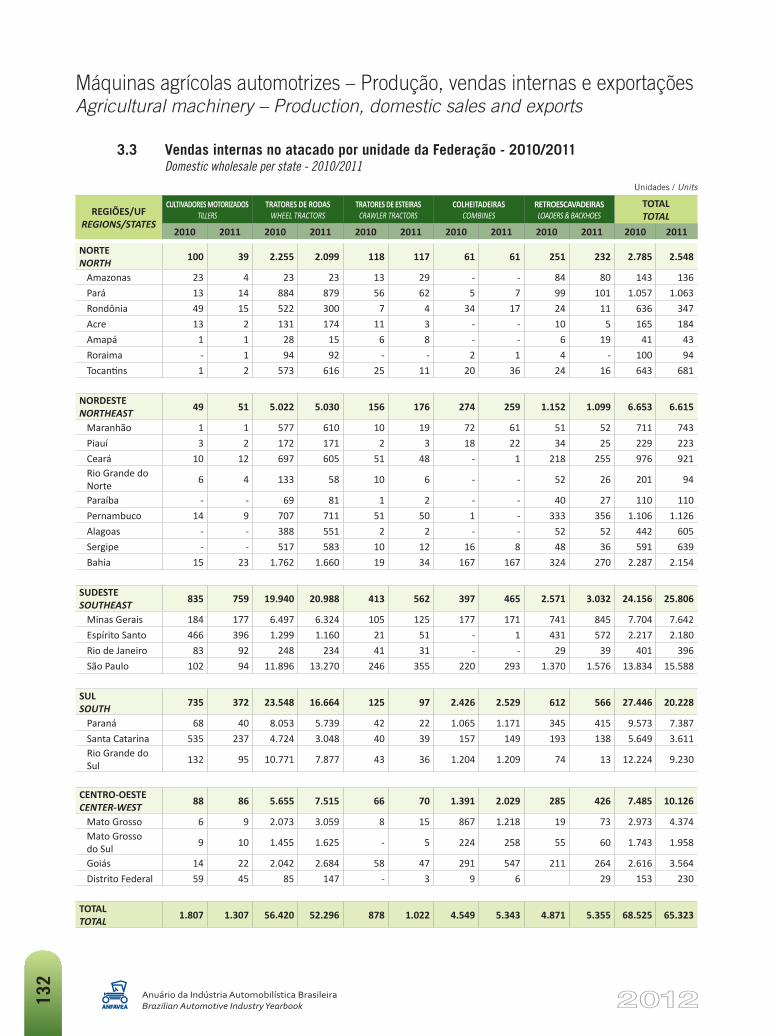
Máquinas agrícolas automotrizes – Produção, vendas internas e exportaçõesAgricultural machinery – Production, domestic sales and exports
Anuário da Indústria Automobilística BrasileiraBrazilian Automotive Industry Yearbook13
2
REGIÕES/UF REGIONS/STATES
CULTIVADORES MOTORIZADOS TILLERS
TRATORES DE RODAS WHEEL TRACTORS
TRATORES DE ESTEIRAS CRAWLER TRACTORS
COLHEITADEIRAS COMBINES
RETROESCAVADEIRAS LOADERS & BACKHOES
TOTAL TOTAL
2010 2011 2010 2011 2010 2011 2010 2011 2010 2011 2010 2011
NORTE NORTH 100 39 2.255 2.099 118 117 61 61 251 232 2.785 2.548
Amazonas 23 4 23 23 13 29 - - 84 80 143 136 Pará 13 14 884 879 56 62 5 7 99 101 1.057 1.063 Rondônia 49 15 522 300 7 4 34 17 24 11 636 347 Acre 13 2 131 174 11 3 - - 10 5 165 184 Amapá 1 1 28 15 6 8 - - 6 19 41 43 Roraima - 1 94 92 - - 2 1 4 - 100 94 Tocantins 1 2 573 616 25 11 20 36 24 16 643 681
NORDESTE NORTHEAST 49 51 5.022 5.030 156 176 274 259 1.152 1.099 6.653 6.615
Maranhão 1 1 577 610 10 19 72 61 51 52 711 743 Piauí 3 2 172 171 2 3 18 22 34 25 229 223 Ceará 10 12 697 605 51 48 - 1 218 255 976 921 Rio Grande do Norte 6 4 133 58 10 6 - - 52 26 201 94
Paraíba - - 69 81 1 2 - - 40 27 110 110 Pernambuco 14 9 707 711 51 50 1 - 333 356 1.106 1.126 Alagoas - - 388 551 2 2 - - 52 52 442 605 Sergipe - - 517 583 10 12 16 8 48 36 591 639 Bahia 15 23 1.762 1.660 19 34 167 167 324 270 2.287 2.154
SUDESTE SOUTHEAST 835 759 19.940 20.988 413 562 397 465 2.571 3.032 24.156 25.806
Minas Gerais 184 177 6.497 6.324 105 125 177 171 741 845 7.704 7.642 Espírito Santo 466 396 1.299 1.160 21 51 - 1 431 572 2.217 2.180 Rio de Janeiro 83 92 248 234 41 31 - - 29 39 401 396 São Paulo 102 94 11.896 13.270 246 355 220 293 1.370 1.576 13.834 15.588
SUL SOUTH 735 372 23.548 16.664 125 97 2.426 2.529 612 566 27.446 20.228
Paraná 68 40 8.053 5.739 42 22 1.065 1.171 345 415 9.573 7.387 Santa Catarina 535 237 4.724 3.048 40 39 157 149 193 138 5.649 3.611 Rio Grande do Sul 132 95 10.771 7.877 43 36 1.204 1.209 74 13 12.224 9.230
CENTRO-OESTE CENTER-WEST 88 86 5.655 7.515 66 70 1.391 2.029 285 426 7.485 10.126
Mato Grosso 6 9 2.073 3.059 8 15 867 1.218 19 73 2.973 4.374 Mato Grosso do Sul 9 10 1.455 1.625 - 5 224 258 55 60 1.743 1.958
Goiás 14 22 2.042 2.684 58 47 291 547 211 264 2.616 3.564 Distrito Federal 59 45 85 147 - 3 9 6 29 153 230
TOTAL TOTAL 1.807 1.307 56.420 52.296 878 1.022 4.549 5.343 4.871 5.355 68.525 65.323
3.3 Vendas internas no atacado por unidade da Federação - 2010/2011 Domestic wholesale per state - 2010/2011
Unidades / Units
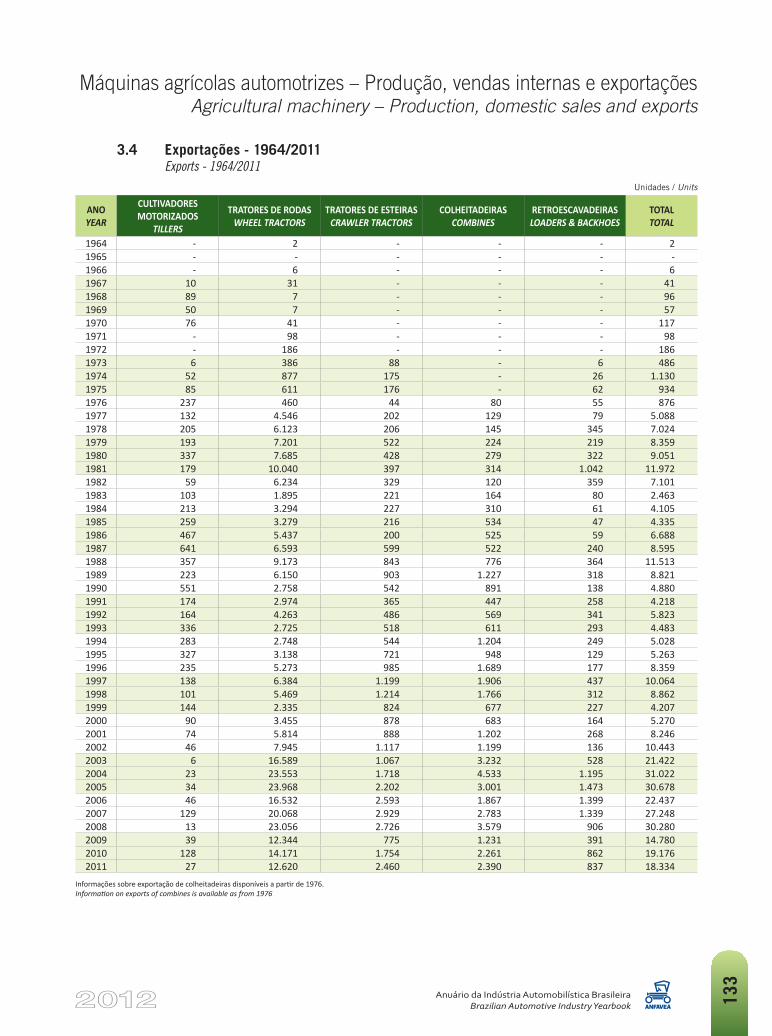
Máquinas agrícolas automotrizes – Produção, vendas internas e exportaçõesAgricultural machinery – Production, domestic sales and exports
Anuário da Indústria Automobilística BrasileiraBrazilian Automotive Industry Yearbook 13
3
ANO YEAR
CULTIVADORES MOTORIZADOS
TILLERS
TRATORES DE RODAS WHEEL TRACTORS
TRATORES DE ESTEIRAS CRAWLER TRACTORS
COLHEITADEIRAS COMBINES
RETROESCAVADEIRAS LOADERS & BACKHOES
TOTAL TOTAL
1964 - 2 - - - 21965 - - - - - -1966 - 6 - - - 61967 10 31 - - - 411968 89 7 - - - 961969 50 7 - - - 571970 76 41 - - - 1171971 - 98 - - - 981972 - 186 - - - 1861973 6 386 88 - 6 4861974 52 877 175 - 26 1.1301975 85 611 176 - 62 9341976 237 460 44 80 55 8761977 132 4.546 202 129 79 5.0881978 205 6.123 206 145 345 7.0241979 193 7.201 522 224 219 8.3591980 337 7.685 428 279 322 9.0511981 179 10.040 397 314 1.042 11.9721982 59 6.234 329 120 359 7.1011983 103 1.895 221 164 80 2.4631984 213 3.294 227 310 61 4.1051985 259 3.279 216 534 47 4.3351986 467 5.437 200 525 59 6.6881987 641 6.593 599 522 240 8.5951988 357 9.173 843 776 364 11.5131989 223 6.150 903 1.227 318 8.8211990 551 2.758 542 891 138 4.8801991 174 2.974 365 447 258 4.2181992 164 4.263 486 569 341 5.8231993 336 2.725 518 611 293 4.4831994 283 2.748 544 1.204 249 5.0281995 327 3.138 721 948 129 5.2631996 235 5.273 985 1.689 177 8.3591997 138 6.384 1.199 1.906 437 10.0641998 101 5.469 1.214 1.766 312 8.8621999 144 2.335 824 677 227 4.2072000 90 3.455 878 683 164 5.2702001 74 5.814 888 1.202 268 8.2462002 46 7.945 1.117 1.199 136 10.443 2003 6 16.589 1.067 3.232 528 21.422 2004 23 23.553 1.718 4.533 1.195 31.022 2005 34 23.968 2.202 3.001 1.473 30.678 2006 46 16.532 2.593 1.867 1.399 22.437 2007 129 20.068 2.929 2.783 1.339 27.248 2008 13 23.056 2.726 3.579 906 30.280 2009 39 12.344 775 1.231 391 14.780 2010 128 14.171 1.754 2.261 862 19.176 2011 27 12.620 2.460 2.390 837 18.334
Informaçõessobreexportaçãodecolheitadeirasdisponíveisapartirde1976. Information on exports of combines is available as from 1976
3.4 Exportações - 1964/2011 Exports - 1964/2011
Unidades / Units
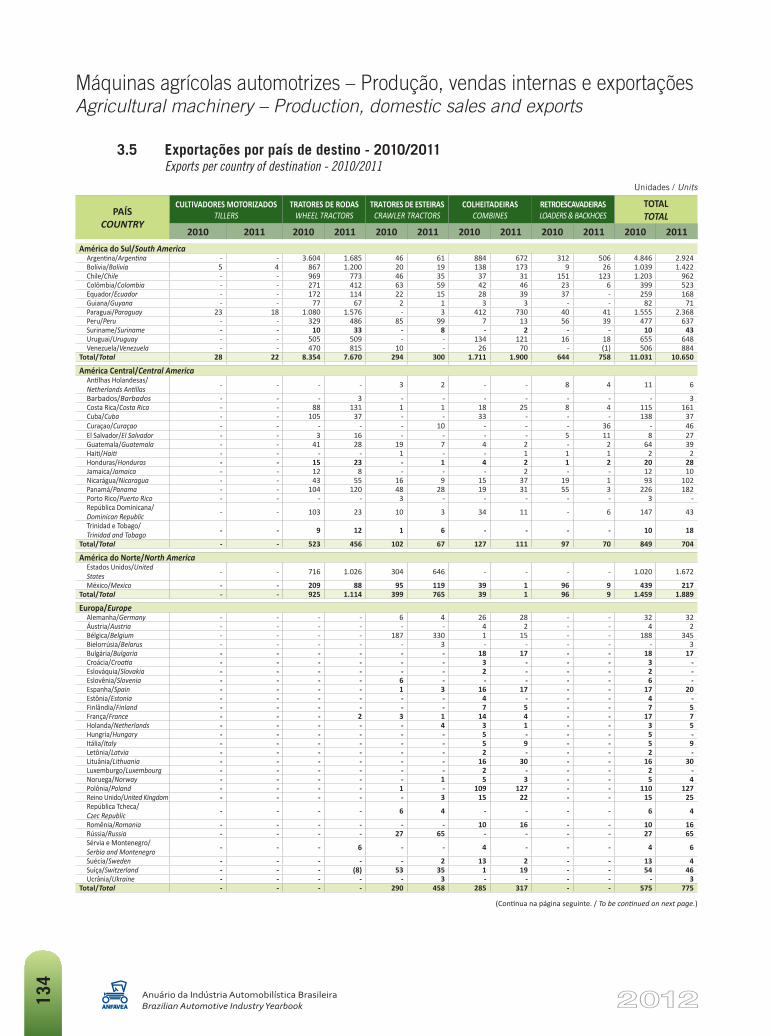
Máquinas agrícolas automotrizes – Produção, vendas internas e exportaçõesAgricultural machinery – Production, domestic sales and exports
Anuário da Indústria Automobilística BrasileiraBrazilian Automotive Industry Yearbook13
4
3.5 Exportações por país de destino - 2010/2011 Exports per country of destination - 2010/2011
Unidades / Units
PAÍS COUNTRY
CULTIVADORES MOTORIZADOS TILLERS
TRATORES DE RODAS WHEEL TRACTORS
TRATORES DE ESTEIRAS CRAWLER TRACTORS
COLHEITADEIRAS COMBINES
RETROESCAVADEIRAS LOADERS & BACKHOES
TOTAL TOTAL
2010 2011 2010 2011 2010 2011 2010 2011 2010 2011 2010 2011América do Sul/South America
Argentina/Argentina - - 3.604 1.685 46 61 884 672 312 506 4.846 2.924 Bolívia/Bolivia 5 4 867 1.200 20 19 138 173 9 26 1.039 1.422 Chile/Chile - - 969 773 46 35 37 31 151 123 1.203 962 Colômbia/Colombia - - 271 412 63 59 42 46 23 6 399 523 Equador/Ecuador - - 172 114 22 15 28 39 37 - 259 168 Guiana/Guyana - - 77 67 2 1 3 3 - - 82 71 Paraguai/Paraguay 23 18 1.080 1.576 - 3 412 730 40 41 1.555 2.368 Peru/Peru - - 329 486 85 99 7 13 56 39 477 637 Suriname/Suriname - - 10 33 - 8 - 2 - - 10 43 Uruguai/Uruguay - - 505 509 - - 134 121 16 18 655 648 Venezuela/Venezuela - - 470 815 10 - 26 70 - (1) 506 884
Total/Total 28 22 8.354 7.670 294 300 1.711 1.900 644 758 11.031 10.650
América Central/Central AmericaAntilhasHolandesas/Netherlands Antillas - - - - 3 2 - - 8 4 11 6
Barbados/Barbados - - - 3 - - - - - - - 3 CostaRica/Costa Rica - - 88 131 1 1 18 25 8 4 115 161 Cuba/Cuba - - 105 37 - - 33 - - - 138 37 Curaçao/Curaçao - - - - - 10 - - - 36 - 46 ElSalvador/El Salvador - - 3 16 - - - - 5 11 8 27 Guatemala/Guatemala - - 41 28 19 7 4 2 - 2 64 39 Haiti/Haiti - - - - 1 - - 1 1 1 2 2 Honduras/Honduras - - 15 23 - 1 4 2 1 2 20 28 Jamaica/Jamaica - - 12 8 - - - 2 - - 12 10 Nicarágua/Nicaragua - - 43 55 16 9 15 37 19 1 93 102 Panamá/Panama - - 104 120 48 28 19 31 55 3 226 182 PortoRico/Puerto Rico - - - - 3 - - - - - 3 - RepúblicaDominicana/Dominican Republic - - 103 23 10 3 34 11 - 6 147 43
TrinidadeTobago/ Trinidad and Tobago - - 9 12 1 6 - - - - 10 18
Total/Total - - 523 456 102 67 127 111 97 70 849 704
América do Norte/North AmericaEstadosUnidos/United States - - 716 1.026 304 646 - - - - 1.020 1.672
México/Mexico - - 209 88 95 119 39 1 96 9 439 217 Total/Total - - 925 1.114 399 765 39 1 96 9 1.459 1.889
Europa/EuropeAlemanha/Germany - - - - 6 4 26 28 - - 32 32 Áustria/Austria - - - - - - 4 2 - - 4 2 Bélgica/Belgium - - - - 187 330 1 15 - - 188 345 Bielorrúsia/Belarus - - - - - 3 - - - - - 3 Bulgária/Bulgaria - - - - - - 18 17 - - 18 17 Croácia/Croatia - - - - - - 3 - - - 3 - Eslováquia/Slovakia - - - - - - 2 - - - 2 - Eslovênia/Slovenia - - - - 6 - - - - - 6 - Espanha/Spain - - - - 1 3 16 17 - - 17 20 Estônia/Estonia - - - - - - 4 - - - 4 - Finlândia/Finland - - - - - - 7 5 - - 7 5 França/France - - - 2 3 1 14 4 - - 17 7 Holanda/Netherlands - - - - - 4 3 1 - - 3 5 Hungria/Hungary - - - - - - 5 - - - 5 - Itália/Italy - - - - - - 5 9 - - 5 9 Letônia/Latvia - - - - - - 2 - - - 2 - Lituânia/Lithuania - - - - - - 16 30 - - 16 30 Luxemburgo/Luxembourg - - - - - - 2 - - - 2 - Noruega/Norway - - - - - 1 5 3 - - 5 4 Polônia/Poland - - - - 1 - 109 127 - - 110 127 ReinoUnido/United Kingdom - - - - - 3 15 22 - - 15 25 RepúblicaTcheca/ Czec Republic - - - - 6 4 - - - - 6 4
Romênia/Romania - - - - - - 10 16 - - 10 16 Rússia/Russia - - - - 27 65 - - - - 27 65 SérviaeMontenegro/ Serbia and Montenegro - - - 6 - - 4 - - - 4 6
Suécia/Sweden - - - - - 2 13 2 - - 13 4 Suíça/Switzerland - - - (8) 53 35 1 19 - - 54 46 Ucrânia/Ukraine - - - - - 3 - - - - - 3
Total/Total - - - - 290 458 285 317 - - 575 775
(Continuanapáginaseguinte./To be continued on next page.)
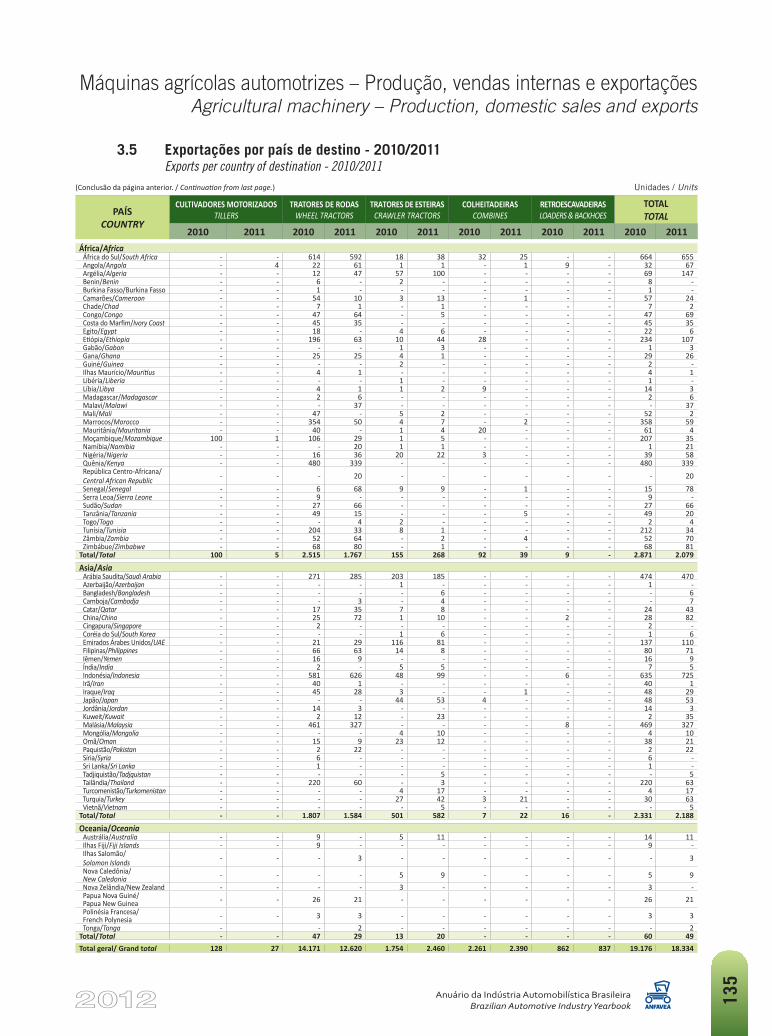
Máquinas agrícolas automotrizes – Produção, vendas internas e exportaçõesAgricultural machinery – Production, domestic sales and exports
Anuário da Indústria Automobilística BrasileiraBrazilian Automotive Industry Yearbook 13
5
(Conclusãodapáginaanterior./Continuation from last page.)
3.5 Exportações por país de destino - 2010/2011 Exports per country of destination - 2010/2011
Unidades / Units
PAÍS COUNTRY
CULTIVADORES MOTORIZADOS TILLERS
TRATORES DE RODAS WHEEL TRACTORS
TRATORES DE ESTEIRAS CRAWLER TRACTORS
COLHEITADEIRAS COMBINES
RETROESCAVADEIRAS LOADERS & BACKHOES
TOTAL TOTAL
2010 2011 2010 2011 2010 2011 2010 2011 2010 2011 2010 2011África/AfricaÁfricadoSul/South Africa - - 614 592 18 38 32 25 - - 664 655 Angola/Angola - 4 22 61 1 1 - 1 9 - 32 67 Argélia/Algeria - - 12 47 57 100 - - - - 69 147 Benin/Benin - - 6 - 2 - - - - - 8 - BurkinaFasso/BurkinaFasso - - 1 - - - - - - - 1 - Camarões/Cameroon - - 54 10 3 13 - 1 - - 57 24 Chade/Chad - - 7 1 - 1 - - - - 7 2 Congo/Congo - - 47 64 - 5 - - - - 47 69 CostadoMarfim/Ivory Coast - - 45 35 - - - - - - 45 35 Egito/Egypt - - 18 - 4 6 - - - - 22 6 Etiópia/Ethiopia - - 196 63 10 44 28 - - - 234 107 Gabão/Gabon - - - - 1 3 - - - - 1 3 Gana/Ghana - - 25 25 4 1 - - - - 29 26 Guiné/Guinea - - - - 2 - - - - - 2 - IlhasMaurício/Mauritius - - 4 1 - - - - - - 4 1 Libéria/Liberia - - - - 1 - - - - - 1 - Líbia/Libya - - 4 1 1 2 9 - - - 14 3 Madagascar/Madagascar - - 2 6 - - - - - - 2 6 Malavi/Malawi - - - 37 - - - - - - - 37 Mali/Mali - - 47 - 5 2 - - - - 52 2 Marrocos/Morocco - - 354 50 4 7 - 2 - - 358 59 Mauritânia/Mauritania - - 40 - 1 4 20 - - - 61 4 Moçambique/Mozambique 100 1 106 29 1 5 - - - - 207 35 Namíbia/Namibia - - - 20 1 1 - - - - 1 21 Nigéria/Nigeria - - 16 36 20 22 3 - - - 39 58 Quênia/Kenya - - 480 339 - - - - - - 480 339 RepúblicaCentro-Africana/Central African Republic - - - 20 - - - - - - - 20
Senegal/Senegal - - 6 68 9 9 - 1 - - 15 78 SerraLeoa/Sierra Leone - - 9 - - - - - - - 9 - Sudão/Sudan - - 27 66 - - - - - - 27 66 Tanzânia/Tanzania - - 49 15 - - - 5 - - 49 20 Togo/Togo - - - 4 2 - - - - - 2 4 Tunísia/Tunisia - - 204 33 8 1 - - - - 212 34 Zâmbia/Zambia - - 52 64 - 2 - 4 - - 52 70 Zimbábue/Zimbabwe - - 68 80 - 1 - - - - 68 81
Total/Total 100 5 2.515 1.767 155 268 92 39 9 - 2.871 2.079
Asia/AsiaArábiaSaudita/Saudi Arabia - - 271 285 203 185 - - - - 474 470 Azerbaijão/Azerbaijan - - - - 1 - - - - - 1 - Bangladesh/Bangladesh - - - - - 6 - - - - - 6 Camboja/Cambodja - - - 3 - 4 - - - - - 7 Catar/Qatar - - 17 35 7 8 - - - - 24 43 China/China - - 25 72 1 10 - - 2 - 28 82 Cingapura/Singapore - - 2 - - - - - - - 2 - CoréiadoSul/South Korea - - - - 1 6 - - - - 1 6 EmiradosÁrabesUnidos/UAE - - 21 29 116 81 - - - - 137 110 Filipinas/Philippines - - 66 63 14 8 - - - - 80 71 Iêmen/Yemen - - 16 9 - - - - - - 16 9 Índia/India - - 2 - 5 5 - - - - 7 5 Indonésia/Indonesia - - 581 626 48 99 - - 6 - 635 725 Irã/Iran - - 40 1 - - - - - - 40 1 Iraque/Iraq - - 45 28 3 - - 1 - - 48 29 Japão/Japan - - - - 44 53 4 - - - 48 53 Jordânia/Jordan - - 14 3 - - - - - - 14 3 Kuweit/Kuwait - - 2 12 - 23 - - - - 2 35 Malásia/Malaysia - - 461 327 - - - - 8 - 469 327 Mongólia/Mongolia - - - - 4 10 - - - - 4 10 Omã/Oman - - 15 9 23 12 - - - - 38 21 Paquistão/Pakistan - - 2 22 - - - - - - 2 22 Síria/Syria - - 6 - - - - - - - 6 - SriLanka/Sri Lanka - - 1 - - - - - - - 1 - Tadjiquistão/Tadjquistan - - - - - 5 - - - - - 5 Tailândia/Thailand - - 220 60 - 3 - - - - 220 63 Turcomenistão/Turkomenistan - - - - 4 17 - - - - 4 17 Turquia/Turkey - - - - 27 42 3 21 - - 30 63 Vietnã/Vietnam - - - - - 5 - - - - - 5
Total/Total - - 1.807 1.584 501 582 7 22 16 - 2.331 2.188
Oceania/OceaniaAustrália/Australia - - 9 - 5 11 - - - - 14 11 IlhasFiji/Fiji Islands - - 9 - - - - - - - 9 - IlhasSalomão/ Solomon Islands - - - 3 - - - - - - - 3
NovaCaledônia/ New Caledonia - - - - 5 9 - - - - 5 9 NovaZelândia/NewZealand - - - - 3 - - - - - 3 - PapuaNovaGuiné/ Papua New Guinea - - 26 21 - - - - - - 26 21 PolinésiaFrancesa/ French Polynesia - - 3 3 - - - - - - 3 3 Tonga/Tonga - - 2 - - - - - - - 2
Total/Total - - 47 29 13 20 - - - - 60 49 Total geral/ Grand total 128 27 14.171 12.620 1.754 2.460 2.261 2.390 862 837 19.176 18.334
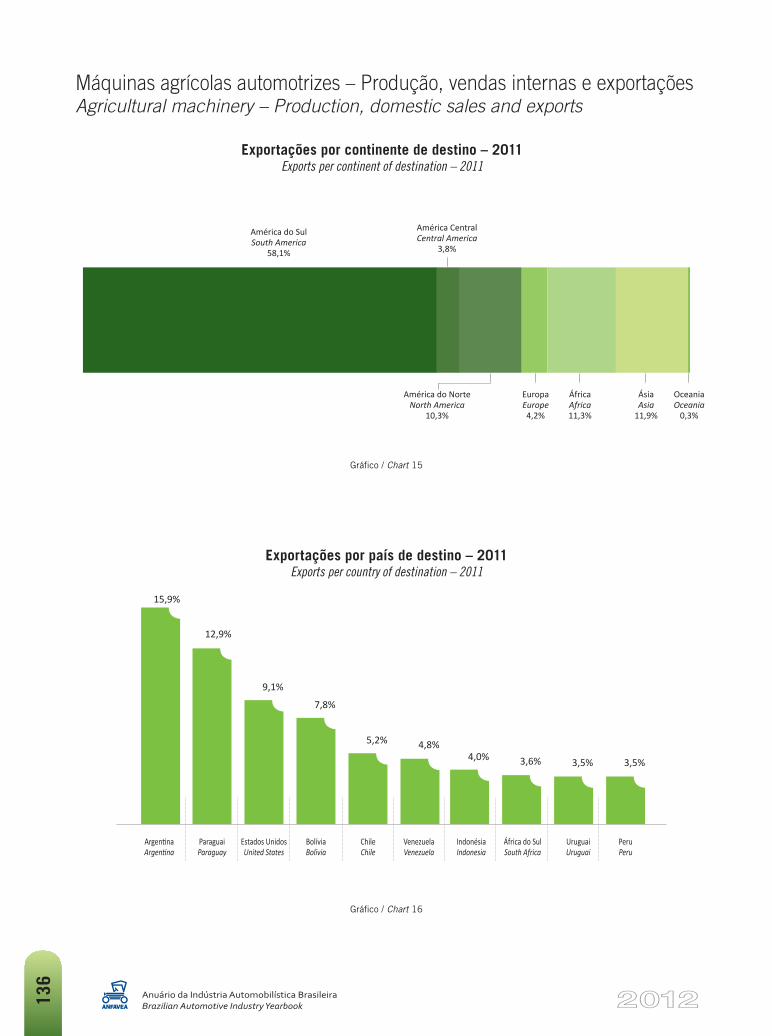
Máquinas agrícolas automotrizes – Produção, vendas internas e exportaçõesAgricultural machinery – Production, domestic sales and exports
Anuário da Indústria Automobilística BrasileiraBrazilian Automotive Industry Yearbook13
6
Gráfico / Chart 15
Exportações por continente de destino – 2011Exports per continent of destination – 2011
Gráfico / Chart 16
Exportações por país de destino – 2011Exports per country of destination – 2011
América do SulSouth America
58,1%
América CentralCentral America
3,8%
América do NorteNorth America
10,3%
EuropaEurope4,2%
ÁfricaAfrica11,3%
ÁsiaAsia
11,9%
OceaniaOceania
0,3%
15,9%
12,9%
9,1%
7,8%
5,2% 4,8%4,0% 3,6% 3,5% 3,5%
ParaguaiParaguay
ChileChile
BolíviaBolivia
Estados UnidosUnited States
África do SulSouth Africa
UruguaiUruguai
IndonésiaIndonesia
VenezuelaVenezuela
PeruPeru
ArgentinaArgentina
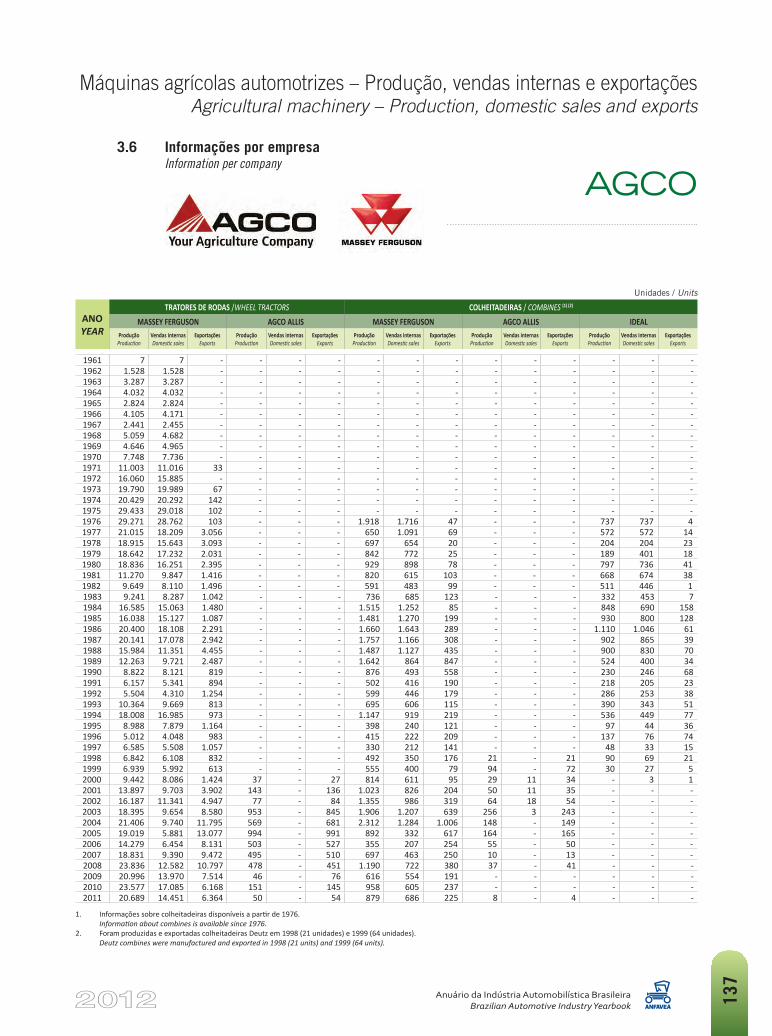
Máquinas agrícolas automotrizes – Produção, vendas internas e exportaçõesAgricultural machinery – Production, domestic sales and exports
Anuário da Indústria Automobilística BrasileiraBrazilian Automotive Industry Yearbook 13
7
3.6 Informações por empresa Information per company
Unidades / Units
ANO YEAR
TRATORES DE RODAS/WHEEL TRACTORS COLHEITADEIRAS/COMBINES (1) (2)
MASSEY FERGUSON AGCO ALLIS MASSEY FERGUSON AGCO ALLIS IDEALProdução
ProductionVendas internasDomestic sales
ExportaçõesExports
ProduçãoProduction
Vendas internasDomestic sales
ExportaçõesExports
ProduçãoProduction
Vendas internasDomestic sales
ExportaçõesExports
ProduçãoProduction
Vendas internasDomestic sales
ExportaçõesExports
ProduçãoProduction
Vendas internasDomestic sales
ExportaçõesExports
1961 7 7 - - - - - - - - - - - - -1962 1.528 1.528 - - - - - - - - - - - - -1963 3.287 3.287 - - - - - - - - - - - - -1964 4.032 4.032 - - - - - - - - - - - - -1965 2.824 2.824 - - - - - - - - - - - - -1966 4.105 4.171 - - - - - - - - - - - - -1967 2.441 2.455 - - - - - - - - - - - - -1968 5.059 4.682 - - - - - - - - - - - - -1969 4.646 4.965 - - - - - - - - - - - - -1970 7.748 7.736 - - - - - - - - - - - - -1971 11.003 11.016 33 - - - - - - - - - - - -1972 16.060 15.885 - - - - - - - - - - - - -1973 19.790 19.989 67 - - - - - - - - - - - -1974 20.429 20.292 142 - - - - - - - - - - - -1975 29.433 29.018 102 - - - - - - - - - - - -1976 29.271 28.762 103 - - - 1.918 1.716 47 - - - 737 737 41977 21.015 18.209 3.056 - - - 650 1.091 69 - - - 572 572 141978 18.915 15.643 3.093 - - - 697 654 20 - - - 204 204 231979 18.642 17.232 2.031 - - - 842 772 25 - - - 189 401 181980 18.836 16.251 2.395 - - - 929 898 78 - - - 797 736 411981 11.270 9.847 1.416 - - - 820 615 103 - - - 668 674 381982 9.649 8.110 1.496 - - - 591 483 99 - - - 511 446 11983 9.241 8.287 1.042 - - - 736 685 123 - - - 332 453 71984 16.585 15.063 1.480 - - - 1.515 1.252 85 - - - 848 690 1581985 16.038 15.127 1.087 - - - 1.481 1.270 199 - - - 930 800 1281986 20.400 18.108 2.291 - - - 1.660 1.643 289 - - - 1.110 1.046 611987 20.141 17.078 2.942 - - - 1.757 1.166 308 - - - 902 865 391988 15.984 11.351 4.455 - - - 1.487 1.127 435 - - - 900 830 701989 12.263 9.721 2.487 - - - 1.642 864 847 - - - 524 400 341990 8.822 8.121 819 - - - 876 493 558 - - - 230 246 681991 6.157 5.341 894 - - - 502 416 190 - - - 218 205 231992 5.504 4.310 1.254 - - - 599 446 179 - - - 286 253 381993 10.364 9.669 813 - - - 695 606 115 - - - 390 343 511994 18.008 16.985 973 - - - 1.147 919 219 - - - 536 449 771995 8.988 7.879 1.164 - - - 398 240 121 - - - 97 44 361996 5.012 4.048 983 - - - 415 222 209 - - - 137 76 741997 6.585 5.508 1.057 - - - 330 212 141 - - - 48 33 151998 6.842 6.108 832 - - - 492 350 176 21 - 21 90 69 211999 6.939 5.992 613 - - - 555 400 79 94 - 72 30 27 52000 9.442 8.086 1.424 37 - 27 814 611 95 29 11 34 - 3 12001 13.897 9.703 3.902 143 - 136 1.023 826 204 50 11 35 - - - 2002 16.187 11.341 4.947 77 - 84 1.355 986 319 64 18 54 - - - 2003 18.395 9.654 8.580 953 - 845 1.906 1.207 639 256 3 243 - - - 2004 21.406 9.740 11.795 569 - 681 2.312 1.284 1.006 148 - 149 - - - 2005 19.019 5.881 13.077 994 - 991 892 332 617 164 - 165 - - - 2006 14.279 6.454 8.131 503 - 527 355 207 254 55 - 50 - - - 2007 18.831 9.390 9.472 495 - 510 697 463 250 10 - 13 - - - 2008 23.836 12.582 10.797 478 - 451 1.190 722 380 37 - 41 - - - 2009 20.996 13.970 7.514 46 - 76 616 554 191 - - - - - - 2010 23.577 17.085 6.168 151 - 145 958 605 237 - - - - - - 2011 20.689 14.451 6.364 50 - 54 879 686 225 8 - 4 - - -
1. Informaçõessobrecolheitadeirasdisponíveisapartirde1976. Information about combines is available since 1976.
2. ForamproduzidaseexportadascolheitadeirasDeutzem1998(21unidades)e1999(64unidades). Deutz combines were manufactured and exported in 1998 (21 units) and 1999 (64 units).
AGCO
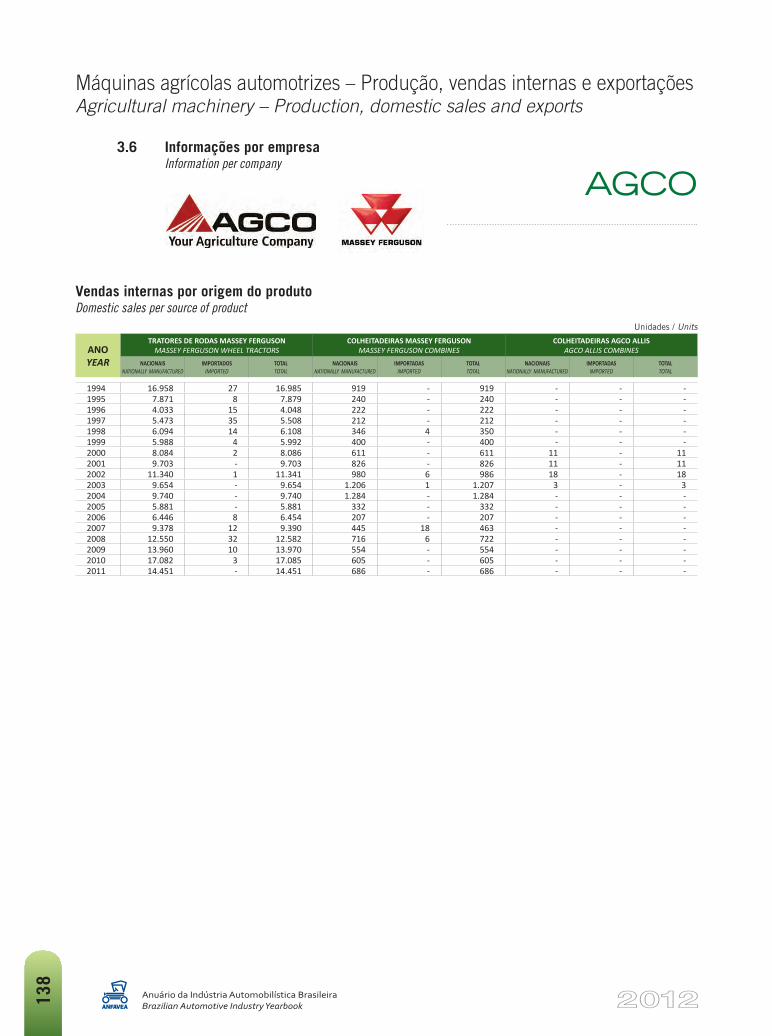
Máquinas agrícolas automotrizes – Produção, vendas internas e exportaçõesAgricultural machinery – Production, domestic sales and exports
Anuário da Indústria Automobilística BrasileiraBrazilian Automotive Industry Yearbook13
8
3.6 Informações por empresa Information per company
Vendas internas por origem do produtoDomestic sales per source of product
Unidades / Units
ANO YEAR
TRATORES DE RODAS MASSEY FERGUSON MASSEY FERGUSON WHEEL TRACTORS
COLHEITADEIRAS MASSEY FERGUSON MASSEY FERGUSON COMBINES
COLHEITADEIRAS AGCO ALLIS AGCO ALLIS COMBINES
NACIONAISNATIONALLY MANUFACTURED
IMPORTADOSIMPORTED
TOTALTOTAL
NACIONAISNATIONALLY MANUFACTURED
IMPORTADASIMPORTED
TOTALTOTAL
NACIONAISNATIONALLY MANUFACTURED
IMPORTADASIMPORTED
TOTALTOTAL
1994 16.958 27 16.985 919 - 919 - - -1995 7.871 8 7.879 240 - 240 - - -1996 4.033 15 4.048 222 - 222 - - -1997 5.473 35 5.508 212 - 212 - - -1998 6.094 14 6.108 346 4 350 - - -1999 5.988 4 5.992 400 - 400 - - -2000 8.084 2 8.086 611 - 611 11 - 112001 9.703 - 9.703 826 - 826 11 - 112002 11.340 1 11.341 980 6 986 18 - 182003 9.654 - 9.654 1.206 1 1.207 3 - 32004 9.740 - 9.740 1.284 - 1.284 - - -2005 5.881 - 5.881 332 - 332 - - -2006 6.446 8 6.454 207 - 207 - - -2007 9.378 12 9.390 445 18 463 - - -2008 12.550 32 12.582 716 6 722 - - -2009 13.960 10 13.970 554 - 554 - - -2010 17.082 3 17.085 605 - 605 - - -2011 14.451 - 14.451 686 - 686 - - -
AGCO
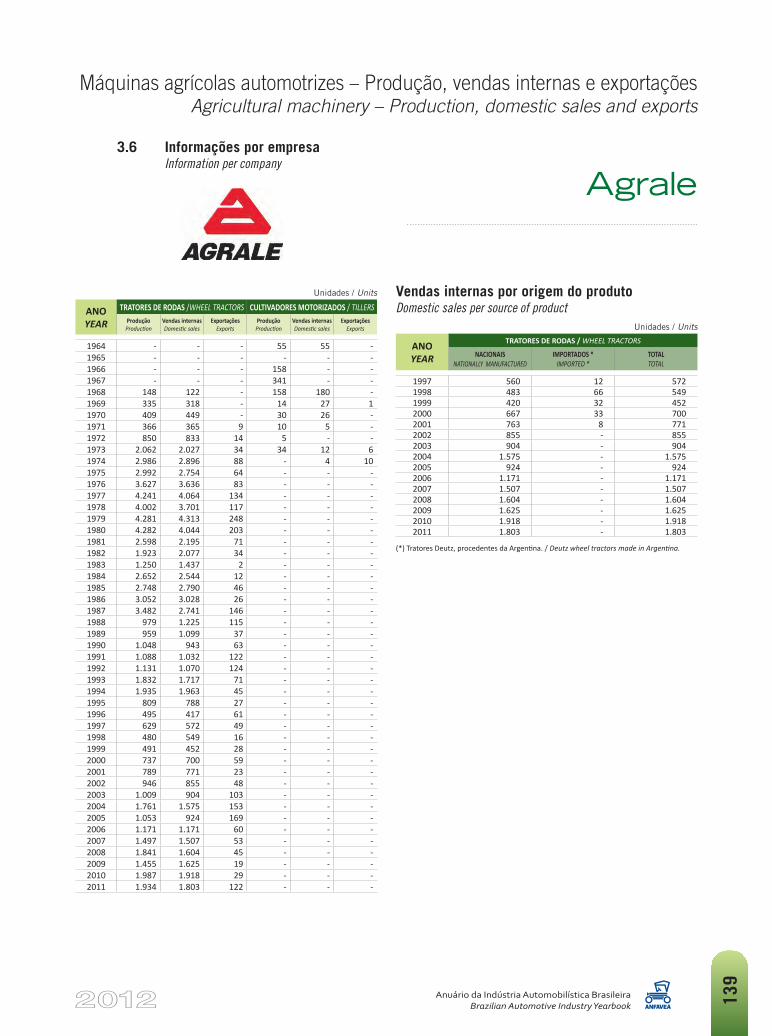
Máquinas agrícolas automotrizes – Produção, vendas internas e exportaçõesAgricultural machinery – Production, domestic sales and exports
Anuário da Indústria Automobilística BrasileiraBrazilian Automotive Industry Yearbook 13
9
3.6 Informações por empresa Information per company
Unidades / Units
ANO YEAR
TRATORES DE RODAS/WHEEL TRACTORS CULTIVADORES MOTORIZADOS /TILLERSProdução
ProductionVendas internasDomestic sales
ExportaçõesExports
ProduçãoProduction
Vendas internasDomestic sales
ExportaçõesExports
1964 - - - 55 55 -1965 - - - - - -1966 - - - 158 - -1967 - - - 341 - -1968 148 122 - 158 180 -1969 335 318 - 14 27 11970 409 449 - 30 26 -1971 366 365 9 10 5 -1972 850 833 14 5 - -1973 2.062 2.027 34 34 12 61974 2.986 2.896 88 - 4 101975 2.992 2.754 64 - - -1976 3.627 3.636 83 - - -1977 4.241 4.064 134 - - -1978 4.002 3.701 117 - - -1979 4.281 4.313 248 - - -1980 4.282 4.044 203 - - -1981 2.598 2.195 71 - - -1982 1.923 2.077 34 - - -1983 1.250 1.437 2 - - -1984 2.652 2.544 12 - - -1985 2.748 2.790 46 - - -1986 3.052 3.028 26 - - -1987 3.482 2.741 146 - - -1988 979 1.225 115 - - -1989 959 1.099 37 - - -1990 1.048 943 63 - - -1991 1.088 1.032 122 - - -1992 1.131 1.070 124 - - -1993 1.832 1.717 71 - - -1994 1.935 1.963 45 - - -1995 809 788 27 - - -1996 495 417 61 - - -1997 629 572 49 - - -1998 480 549 16 - - -1999 491 452 28 - - -2000 737 700 59 - - -2001 789 771 23 - - -2002 946 855 48 - - -2003 1.009 904 103 - - -2004 1.761 1.575 153 - - -2005 1.053 924 169 - - -2006 1.171 1.171 60 - - -2007 1.497 1.507 53 - - -2008 1.841 1.604 45 - - -2009 1.455 1.625 19 - - -2010 1.987 1.918 29 - - -2011 1.934 1.803 122 - - -
Agrale
Vendas internas por origem do produtoDomestic sales per source of product
Unidades / Units
ANO YEAR
TRATORES DE RODAS / WHEEL TRACTORS
NACIONAISNATIONALLY MANUFACTURED
IMPORTADOS *IMPORTED *
TOTALTOTAL
1997 560 12 5721998 483 66 5491999 420 32 4522000 667 33 7002001 763 8 7712002 855 - 8552003 904 - 9042004 1.575 - 1.5752005 924 - 9242006 1.171 - 1.1712007 1.507 - 1.5072008 1.604 - 1.6042009 1.625 - 1.6252010 1.918 - 1.9182011 1.803 - 1.803
(*)TratoresDeutz,procedentesdaArgentina./ Deutz wheel tractors made in Argentina.
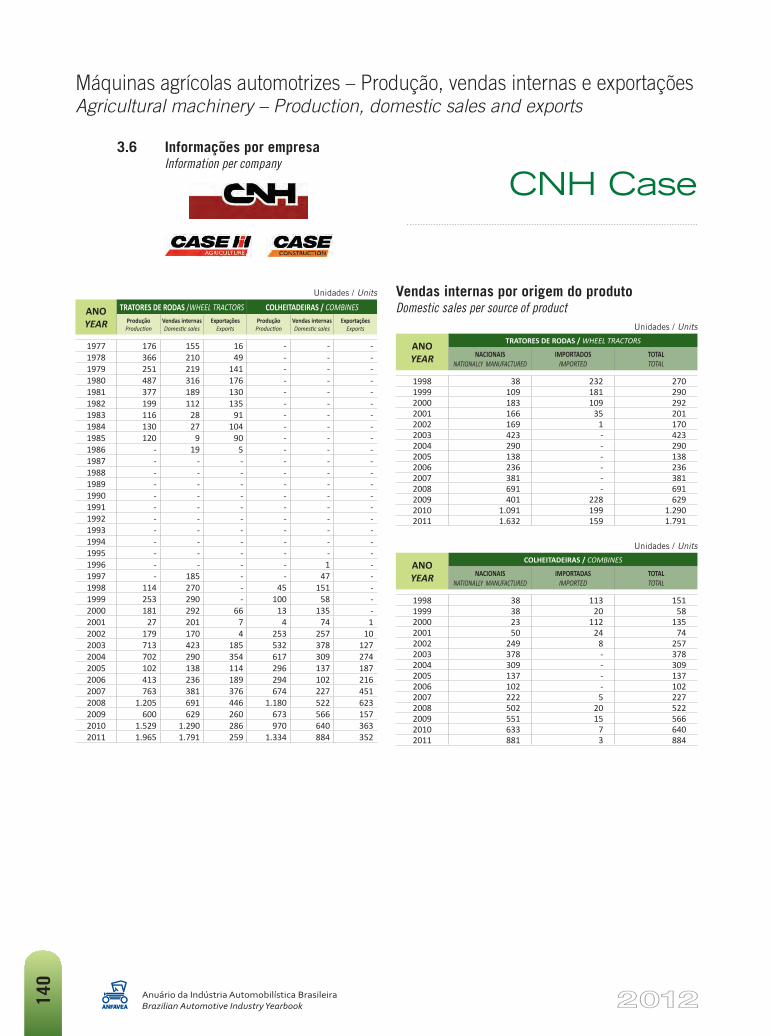
Máquinas agrícolas automotrizes – Produção, vendas internas e exportaçõesAgricultural machinery – Production, domestic sales and exports
Anuário da Indústria Automobilística BrasileiraBrazilian Automotive Industry Yearbook14
0
3.6 Informações por empresa Information per company
Unidades / Units
ANO YEAR
TRATORES DE RODAS/WHEEL TRACTORS COLHEITADEIRAS / COMBINESProdução
ProductionVendas internasDomestic sales
ExportaçõesExports
ProduçãoProduction
Vendas internasDomestic sales
ExportaçõesExports
1977 176 155 16 - - -1978 366 210 49 - - -1979 251 219 141 - - -1980 487 316 176 - - -1981 377 189 130 - - -1982 199 112 135 - - -1983 116 28 91 - - -1984 130 27 104 - - -1985 120 9 90 - - -1986 - 19 5 - - -1987 - - - - - -1988 - - - - - -1989 - - - - - -1990 - - - - - -1991 - - - - - -1992 - - - - - -1993 - - - - - -1994 - - - - - -1995 - - - - - -1996 - - - - 1 -1997 - 185 - - 47 -1998 114 270 - 45 151 -1999 253 290 - 100 58 -2000 181 292 66 13 135 -2001 27 201 7 4 74 12002 179 170 4 253 257 102003 713 423 185 532 378 1272004 702 290 354 617 309 2742005 102 138 114 296 137 1872006 413 236 189 294 102 2162007 763 381 376 674 227 4512008 1.205 691 446 1.180 522 6232009 600 629 260 673 566 1572010 1.529 1.290 286 970 640 3632011 1.965 1.791 259 1.334 884 352
CNH Case
Vendas internas por origem do produtoDomestic sales per source of product
Unidades / Units
ANO YEAR
TRATORES DE RODAS / WHEEL TRACTORS
NACIONAISNATIONALLY MANUFACTURED
IMPORTADOSIMPORTED
TOTALTOTAL
1998 38 232 2701999 109 181 2902000 183 109 2922001 166 35 2012002 169 1 1702003 423 - 4232004 290 - 2902005 138 - 1382006 236 - 2362007 381 - 3812008 691 - 6912009 401 228 6292010 1.091 199 1.2902011 1.632 159 1.791
Unidades / Units
ANO YEAR
COLHEITADEIRAS / COMBINES
NACIONAISNATIONALLY MANUFACTURED
IMPORTADASIMPORTED
TOTALTOTAL
1998 38 113 1511999 38 20 582000 23 112 1352001 50 24 742002 249 8 2572003 378 - 3782004 309 - 3092005 137 - 1372006 102 - 1022007 222 5 2272008 502 20 5222009 551 15 5662010 633 7 6402011 881 3 884
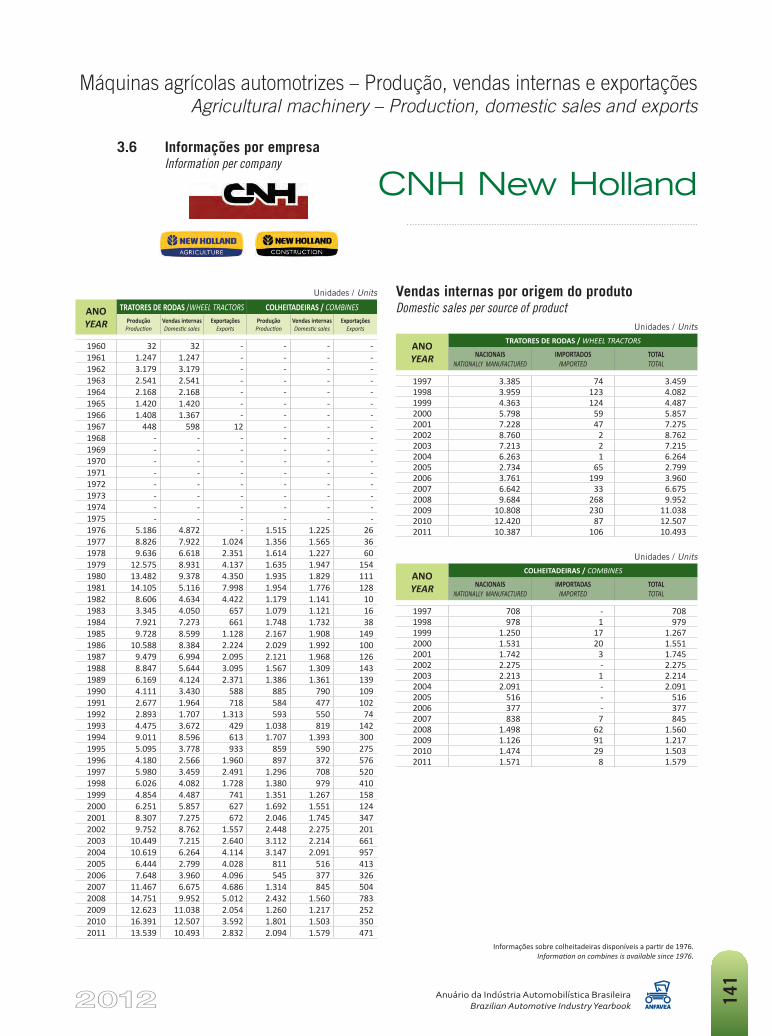
Máquinas agrícolas automotrizes – Produção, vendas internas e exportaçõesAgricultural machinery – Production, domestic sales and exports
Anuário da Indústria Automobilística BrasileiraBrazilian Automotive Industry Yearbook 14
1
Unidades / Units
ANO YEAR
TRATORES DE RODAS/WHEEL TRACTORS COLHEITADEIRAS / COMBINES Produção
ProductionVendas internasDomestic sales
ExportaçõesExports
ProduçãoProduction
Vendas internasDomestic sales
ExportaçõesExports
1960 32 32 - - - -1961 1.247 1.247 - - - -1962 3.179 3.179 - - - -1963 2.541 2.541 - - - -1964 2.168 2.168 - - - -1965 1.420 1.420 - - - -1966 1.408 1.367 - - - -1967 448 598 12 - - -1968 - - - - - -1969 - - - - - -1970 - - - - - -1971 - - - - - -1972 - - - - - -1973 - - - - - -1974 - - - - - -1975 - - - - - -1976 5.186 4.872 - 1.515 1.225 261977 8.826 7.922 1.024 1.356 1.565 361978 9.636 6.618 2.351 1.614 1.227 601979 12.575 8.931 4.137 1.635 1.947 1541980 13.482 9.378 4.350 1.935 1.829 1111981 14.105 5.116 7.998 1.954 1.776 1281982 8.606 4.634 4.422 1.179 1.141 101983 3.345 4.050 657 1.079 1.121 161984 7.921 7.273 661 1.748 1.732 381985 9.728 8.599 1.128 2.167 1.908 1491986 10.588 8.384 2.224 2.029 1.992 1001987 9.479 6.994 2.095 2.121 1.968 1261988 8.847 5.644 3.095 1.567 1.309 1431989 6.169 4.124 2.371 1.386 1.361 1391990 4.111 3.430 588 885 790 1091991 2.677 1.964 718 584 477 1021992 2.893 1.707 1.313 593 550 741993 4.475 3.672 429 1.038 819 1421994 9.011 8.596 613 1.707 1.393 3001995 5.095 3.778 933 859 590 2751996 4.180 2.566 1.960 897 372 5761997 5.980 3.459 2.491 1.296 708 5201998 6.026 4.082 1.728 1.380 979 4101999 4.854 4.487 741 1.351 1.267 1582000 6.251 5.857 627 1.692 1.551 1242001 8.307 7.275 672 2.046 1.745 3472002 9.752 8.762 1.557 2.448 2.275 2012003 10.449 7.215 2.640 3.112 2.214 6612004 10.619 6.264 4.114 3.147 2.091 9572005 6.444 2.799 4.028 811 516 4132006 7.648 3.960 4.096 545 377 3262007 11.467 6.675 4.686 1.314 845 5042008 14.751 9.952 5.012 2.432 1.560 7832009 12.623 11.038 2.054 1.260 1.217 2522010 16.391 12.507 3.592 1.801 1.503 3502011 13.539 10.493 2.832 2.094 1.579 471
CNH New Holland
Vendas internas por origem do produtoDomestic sales per source of product
Unidades / Units
ANO YEAR
TRATORES DE RODAS / WHEEL TRACTORS
NACIONAISNATIONALLY MANUFACTURED
IMPORTADOSIMPORTED
TOTALTOTAL
1997 3.385 74 3.4591998 3.959 123 4.0821999 4.363 124 4.4872000 5.798 59 5.8572001 7.228 47 7.2752002 8.760 2 8.7622003 7.213 2 7.2152004 6.263 1 6.2642005 2.734 65 2.7992006 3.761 199 3.9602007 6.642 33 6.6752008 9.684 268 9.9522009 10.808 230 11.0382010 12.420 87 12.5072011 10.387 106 10.493
Unidades / Units
ANO YEAR
COLHEITADEIRAS / COMBINES
NACIONAISNATIONALLY MANUFACTURED
IMPORTADASIMPORTED
TOTALTOTAL
1997 708 - 7081998 978 1 9791999 1.250 17 1.2672000 1.531 20 1.5512001 1.742 3 1.7452002 2.275 - 2.2752003 2.213 1 2.2142004 2.091 - 2.0912005 516 - 5162006 377 - 3772007 838 7 8452008 1.498 62 1.5602009 1.126 91 1.2172010 1.474 29 1.5032011 1.571 8 1.579
3.6 Informações por empresa Information per company
Informaçõessobrecolheitadeirasdisponíveisapartirde1976. Information on combines is available since 1976.
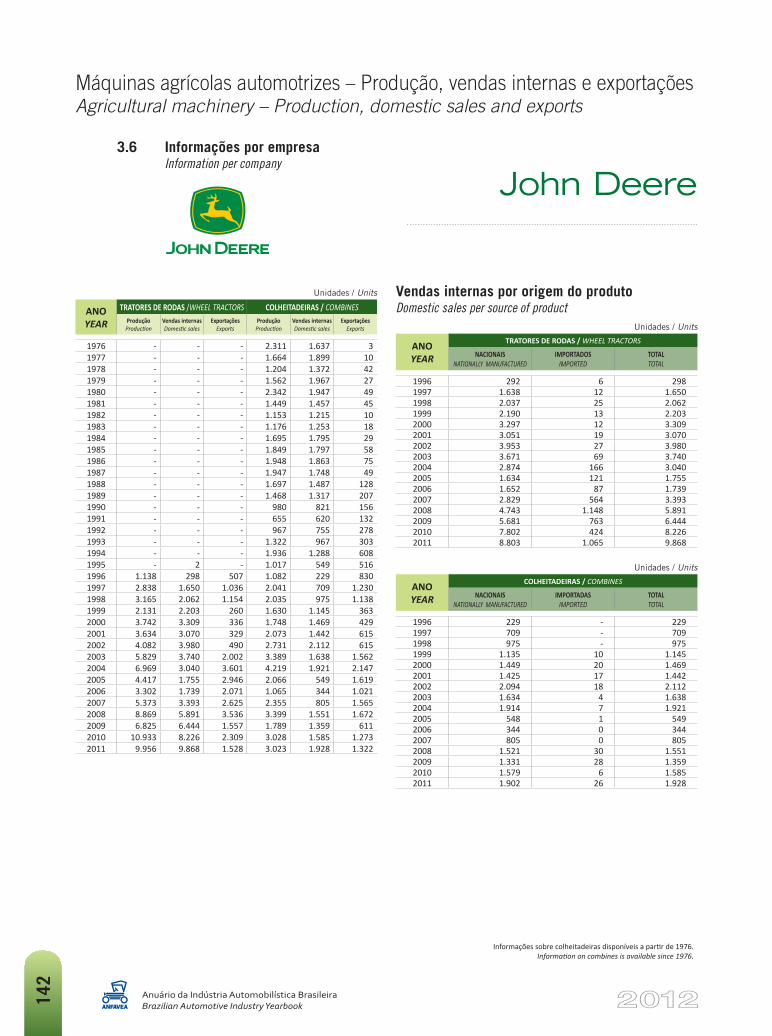
Máquinas agrícolas automotrizes – Produção, vendas internas e exportaçõesAgricultural machinery – Production, domestic sales and exports
Anuário da Indústria Automobilística BrasileiraBrazilian Automotive Industry Yearbook14
2
Unidades / Units
ANO YEAR
TRATORES DE RODAS/WHEEL TRACTORS COLHEITADEIRAS / COMBINESProdução
ProductionVendas internasDomestic sales
ExportaçõesExports
ProduçãoProduction
Vendas internasDomestic sales
ExportaçõesExports
1976 - - - 2.311 1.637 31977 - - - 1.664 1.899 101978 - - - 1.204 1.372 421979 - - - 1.562 1.967 271980 - - - 2.342 1.947 491981 - - - 1.449 1.457 451982 - - - 1.153 1.215 101983 - - - 1.176 1.253 181984 - - - 1.695 1.795 291985 - - - 1.849 1.797 581986 - - - 1.948 1.863 751987 - - - 1.947 1.748 491988 - - - 1.697 1.487 1281989 - - - 1.468 1.317 2071990 - - - 980 821 1561991 - - - 655 620 1321992 - - - 967 755 2781993 - - - 1.322 967 3031994 - - - 1.936 1.288 6081995 - 2 - 1.017 549 5161996 1.138 298 507 1.082 229 8301997 2.838 1.650 1.036 2.041 709 1.2301998 3.165 2.062 1.154 2.035 975 1.1381999 2.131 2.203 260 1.630 1.145 3632000 3.742 3.309 336 1.748 1.469 4292001 3.634 3.070 329 2.073 1.442 6152002 4.082 3.980 490 2.731 2.112 6152003 5.829 3.740 2.002 3.389 1.638 1.5622004 6.969 3.040 3.601 4.219 1.921 2.1472005 4.417 1.755 2.946 2.066 549 1.6192006 3.302 1.739 2.071 1.065 344 1.0212007 5.373 3.393 2.625 2.355 805 1.5652008 8.869 5.891 3.536 3.399 1.551 1.6722009 6.825 6.444 1.557 1.789 1.359 6112010 10.933 8.226 2.309 3.028 1.585 1.2732011 9.956 9.868 1.528 3.023 1.928 1.322
John Deere
Vendas internas por origem do produtoDomestic sales per source of product
Unidades / Units
ANO YEAR
TRATORES DE RODAS / WHEEL TRACTORS
NACIONAISNATIONALLY MANUFACTURED
IMPORTADOSIMPORTED
TOTALTOTAL
1996 292 6 2981997 1.638 12 1.6501998 2.037 25 2.0621999 2.190 13 2.2032000 3.297 12 3.3092001 3.051 19 3.0702002 3.953 27 3.9802003 3.671 69 3.7402004 2.874 166 3.0402005 1.634 121 1.7552006 1.652 87 1.7392007 2.829 564 3.3932008 4.743 1.148 5.8912009 5.681 763 6.4442010 7.802 424 8.2262011 8.803 1.065 9.868
Unidades / Units
ANO YEAR
COLHEITADEIRAS / COMBINES
NACIONAISNATIONALLY MANUFACTURED
IMPORTADAS IMPORTED
TOTALTOTAL
1996 229 - 2291997 709 - 7091998 975 - 9751999 1.135 10 1.1452000 1.449 20 1.4692001 1.425 17 1.4422002 2.094 18 2.1122003 1.634 4 1.6382004 1.914 7 1.9212005 548 1 5492006 344 0 3442007 805 0 8052008 1.521 30 1.5512009 1.331 28 1.3592010 1.579 6 1.5852011 1.902 26 1.928
3.6 Informações por empresa Information per company
Informaçõessobrecolheitadeirasdisponíveisapartirde1976. Information on combines is available since 1976.
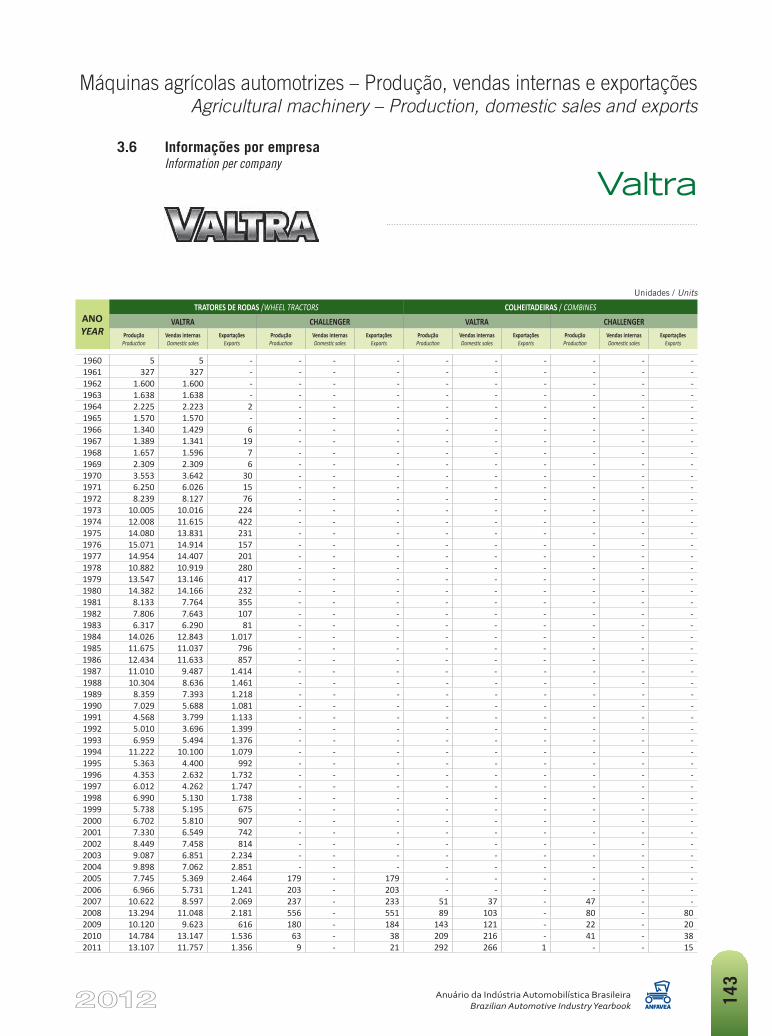
Máquinas agrícolas automotrizes – Produção, vendas internas e exportaçõesAgricultural machinery – Production, domestic sales and exports
Anuário da Indústria Automobilística BrasileiraBrazilian Automotive Industry Yearbook 14
3
3.6 Informações por empresa Information per company
Valtra
Unidades / Units
ANO YEAR
TRATORES DE RODAS/WHEEL TRACTORS COLHEITADEIRAS/COMBINES VALTRA CHALLENGER VALTRA CHALLENGER
ProduçãoProduction
Vendas internasDomestic sales
ExportaçõesExports
ProduçãoProduction
Vendas internasDomestic sales
ExportaçõesExports
ProduçãoProduction
Vendas internasDomestic sales
ExportaçõesExports
ProduçãoProduction
Vendas internasDomestic sales
ExportaçõesExports
1960 5 5 - - - - - - - - - -1961 327 327 - - - - - - - - - -1962 1.600 1.600 - - - - - - - - - -1963 1.638 1.638 - - - - - - - - - -1964 2.225 2.223 2 - - - - - - - - -1965 1.570 1.570 - - - - - - - - - -1966 1.340 1.429 6 - - - - - - - - -1967 1.389 1.341 19 - - - - - - - - -1968 1.657 1.596 7 - - - - - - - - -1969 2.309 2.309 6 - - - - - - - - -1970 3.553 3.642 30 - - - - - - - - -1971 6.250 6.026 15 - - - - - - - - -1972 8.239 8.127 76 - - - - - - - - -1973 10.005 10.016 224 - - - - - - - - -1974 12.008 11.615 422 - - - - - - - - -1975 14.080 13.831 231 - - - - - - - - -1976 15.071 14.914 157 - - - - - - - - -1977 14.954 14.407 201 - - - - - - - - -1978 10.882 10.919 280 - - - - - - - - -1979 13.547 13.146 417 - - - - - - - - -1980 14.382 14.166 232 - - - - - - - - -1981 8.133 7.764 355 - - - - - - - - -1982 7.806 7.643 107 - - - - - - - - -1983 6.317 6.290 81 - - - - - - - - -1984 14.026 12.843 1.017 - - - - - - - - -1985 11.675 11.037 796 - - - - - - - - -1986 12.434 11.633 857 - - - - - - - - -1987 11.010 9.487 1.414 - - - - - - - - -1988 10.304 8.636 1.461 - - - - - - - - -1989 8.359 7.393 1.218 - - - - - - - - -1990 7.029 5.688 1.081 - - - - - - - - -1991 4.568 3.799 1.133 - - - - - - - - -1992 5.010 3.696 1.399 - - - - - - - - -1993 6.959 5.494 1.376 - - - - - - - - -1994 11.222 10.100 1.079 - - - - - - - - -1995 5.363 4.400 992 - - - - - - - - -1996 4.353 2.632 1.732 - - - - - - - - -1997 6.012 4.262 1.747 - - - - - - - - -1998 6.990 5.130 1.738 - - - - - - - - -1999 5.738 5.195 675 - - - - - - - - -2000 6.702 5.810 907 - - - - - - - - -2001 7.330 6.549 742 - - - - - - - - -2002 8.449 7.458 814 - - - - - - - - -2003 9.087 6.851 2.234 - - - - - - - - -2004 9.898 7.062 2.851 - - - - - - - - -2005 7.745 5.369 2.464 179 - 179 - - - - - -2006 6.966 5.731 1.241 203 - 203 - - - - - -2007 10.622 8.597 2.069 237 - 233 51 37 - 47 - -2008 13.294 11.048 2.181 556 - 551 89 103 - 80 - 802009 10.120 9.623 616 180 - 184 143 121 - 22 - 202010 14.784 13.147 1.536 63 - 38 209 216 - 41 - 382011 13.107 11.757 1.356 9 - 21 292 266 1 - - 15
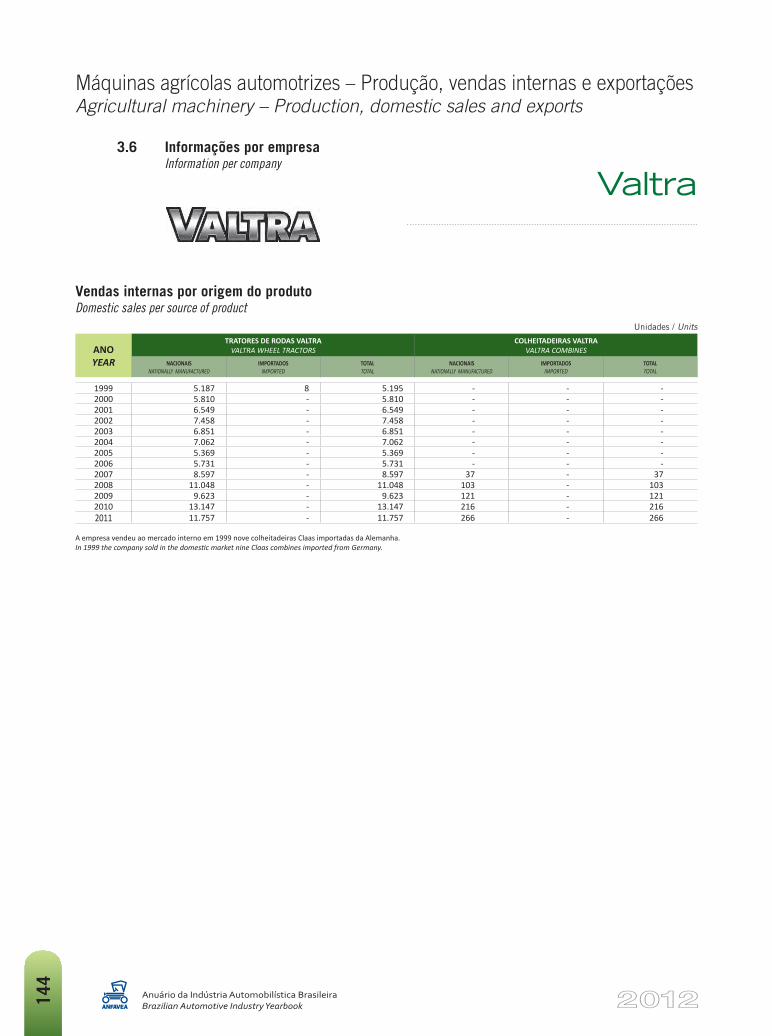
Máquinas agrícolas automotrizes – Produção, vendas internas e exportaçõesAgricultural machinery – Production, domestic sales and exports
Anuário da Indústria Automobilística BrasileiraBrazilian Automotive Industry Yearbook14
4
3.6 Informações por empresa Information per company
Vendas internas por origem do produtoDomestic sales per source of product
Unidades / Units
ANO YEAR
TRATORES DE RODAS VALTRA VALTRA WHEEL TRACTORS
COLHEITADEIRAS VALTRA VALTRA COMBINES
NACIONAISNATIONALLY MANUFACTURED
IMPORTADOSIMPORTED
TOTALTOTAL
NACIONAISNATIONALLY MANUFACTURED
IMPORTADOSIMPORTED
TOTALTOTAL
1999 5.187 8 5.195 - - -2000 5.810 - 5.810 - - -2001 6.549 - 6.549 - - -2002 7.458 - 7.458 - - -2003 6.851 - 6.851 - - -2004 7.062 - 7.062 - - -2005 5.369 - 5.369 - - -2006 5.731 - 5.731 - - -2007 8.597 - 8.597 37 - 372008 11.048 - 11.048 103 - 1032009 9.623 - 9.623 121 - 1212010 13.147 - 13.147 216 - 2162011 11.757 - 11.757 266 - 266
A empresa vendeu ao mercado interno em 1999 nove colheitadeiras Claas importadas da Alemanha. In 1999 the company sold in the domestic market nine Claas combines imported from Germany.
Valtra
Referências internacionaisInternational data
4
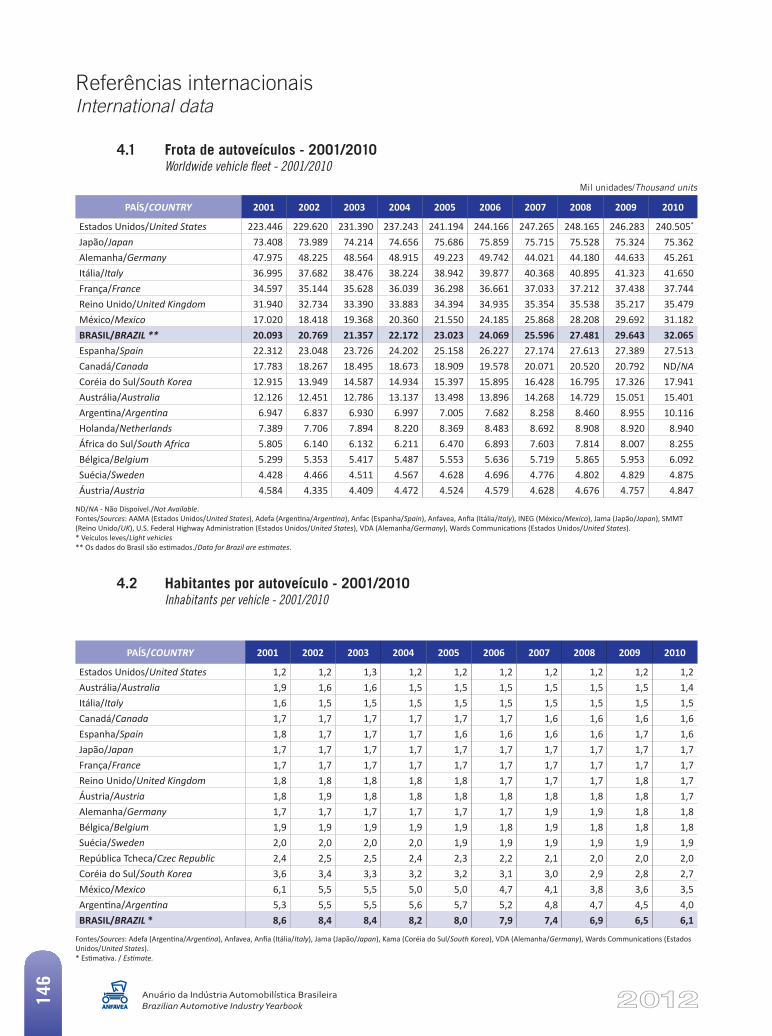
Referências internacionaisInternational data
Anuário da Indústria Automobilística BrasileiraBrazilian Automotive Industry Yearbook14
6
Mil unidades/Thousand units
4.1 Frota de autoveículos - 2001/2010 Worldwide vehicle fleet - 2001/2010
PAÍS/COUNTRY 2001 2002 2003 2004 2005 2006 2007 2008 2009 2010
Estados Unidos/United States 223.446 229.620 231.390 237.243 241.194 244.166 247.265 248.165 246.283 240.505* Japão/Japan 73.408 73.989 74.214 74.656 75.686 75.859 75.715 75.528 75.324 75.362 Alemanha/Germany 47.975 48.225 48.564 48.915 49.223 49.742 44.021 44.180 44.633 45.261 Itália/Italy 36.995 37.682 38.476 38.224 38.942 39.877 40.368 40.895 41.323 41.650 França/France 34.597 35.144 35.628 36.039 36.298 36.661 37.033 37.212 37.438 37.744 Reino Unido/United Kingdom 31.940 32.734 33.390 33.883 34.394 34.935 35.354 35.538 35.217 35.479 México/Mexico 17.020 18.418 19.368 20.360 21.550 24.185 25.868 28.208 29.692 31.182 BRASIL/BRAZIL ** 20.093 20.769 21.357 22.172 23.023 24.069 25.596 27.481 29.643 32.065 Espanha/Spain 22.312 23.048 23.726 24.202 25.158 26.227 27.174 27.613 27.389 27.513 Canadá/Canada 17.783 18.267 18.495 18.673 18.909 19.578 20.071 20.520 20.792 ND/NACoréia do Sul/South Korea 12.915 13.949 14.587 14.934 15.397 15.895 16.428 16.795 17.326 17.941 Austrália/Australia 12.126 12.451 12.786 13.137 13.498 13.896 14.268 14.729 15.051 15.401 Argentina/Argentina 6.947 6.837 6.930 6.997 7.005 7.682 8.258 8.460 8.955 10.116 Holanda/Netherlands 7.389 7.706 7.894 8.220 8.369 8.483 8.692 8.908 8.920 8.940 África do Sul/South Africa 5.805 6.140 6.132 6.211 6.470 6.893 7.603 7.814 8.007 8.255 Bélgica/Belgium 5.299 5.353 5.417 5.487 5.553 5.636 5.719 5.865 5.953 6.092 Suécia/Sweden 4.428 4.466 4.511 4.567 4.628 4.696 4.776 4.802 4.829 4.875 Áustria/Austria 4.584 4.335 4.409 4.472 4.524 4.579 4.628 4.676 4.757 4.847
ND/NA - Não Dispoível./Not Available.Fontes/Sources: AAMA (Estados Unidos/United States), Adefa (Argentina/Argentina), Anfac (Espanha/Spain), Anfavea, Anfia (Itália/Italy), INEG (México/Mexico), Jama (Japão/Japan), SMMT (Reino Unido/UK), U.S. Federal Highway Administration (Estados Unidos/United States), VDA (Alemanha/Germany), Wards Communications (Estados Unidos/United States).* Veículos leves/Light vehicles** Os dados do Brasil são estimados./Data for Brazil are estimates.
PAÍS/COUNTRY 2001 2002 2003 2004 2005 2006 2007 2008 2009 2010
Estados Unidos/United States 1,2 1,2 1,3 1,2 1,2 1,2 1,2 1,2 1,2 1,2Austrália/Australia 1,9 1,6 1,6 1,5 1,5 1,5 1,5 1,5 1,5 1,4Itália/Italy 1,6 1,5 1,5 1,5 1,5 1,5 1,5 1,5 1,5 1,5Canadá/Canada 1,7 1,7 1,7 1,7 1,7 1,7 1,6 1,6 1,6 1,6Espanha/Spain 1,8 1,7 1,7 1,7 1,6 1,6 1,6 1,6 1,7 1,6Japão/Japan 1,7 1,7 1,7 1,7 1,7 1,7 1,7 1,7 1,7 1,7França/France 1,7 1,7 1,7 1,7 1,7 1,7 1,7 1,7 1,7 1,7Reino Unido/United Kingdom 1,8 1,8 1,8 1,8 1,8 1,7 1,7 1,7 1,8 1,7Áustria/Austria 1,8 1,9 1,8 1,8 1,8 1,8 1,8 1,8 1,8 1,7Alemanha/Germany 1,7 1,7 1,7 1,7 1,7 1,7 1,9 1,9 1,8 1,8Bélgica/Belgium 1,9 1,9 1,9 1,9 1,9 1,8 1,9 1,8 1,8 1,8Suécia/Sweden 2,0 2,0 2,0 2,0 1,9 1,9 1,9 1,9 1,9 1,9República Tcheca/Czec Republic 2,4 2,5 2,5 2,4 2,3 2,2 2,1 2,0 2,0 2,0Coréia do Sul/South Korea 3,6 3,4 3,3 3,2 3,2 3,1 3,0 2,9 2,8 2,7México/Mexico 6,1 5,5 5,5 5,0 5,0 4,7 4,1 3,8 3,6 3,5Argentina/Argentina 5,3 5,5 5,5 5,6 5,7 5,2 4,8 4,7 4,5 4,0BRASIL/BRAZIL * 8,6 8,4 8,4 8,2 8,0 7,9 7,4 6,9 6,5 6,1
Fontes/Sources: Adefa (Argentina/Argentina), Anfavea, Anfia (Itália/Italy), Jama (Japão/Japan), Kama (Coréia do Sul/South Korea), VDA (Alemanha/Germany), Wards Communications (Estados Unidos/United States).* Estimativa. / Estimate.
4.2 Habitantes por autoveículo - 2001/2010 Inhabitants per vehicle - 2001/2010
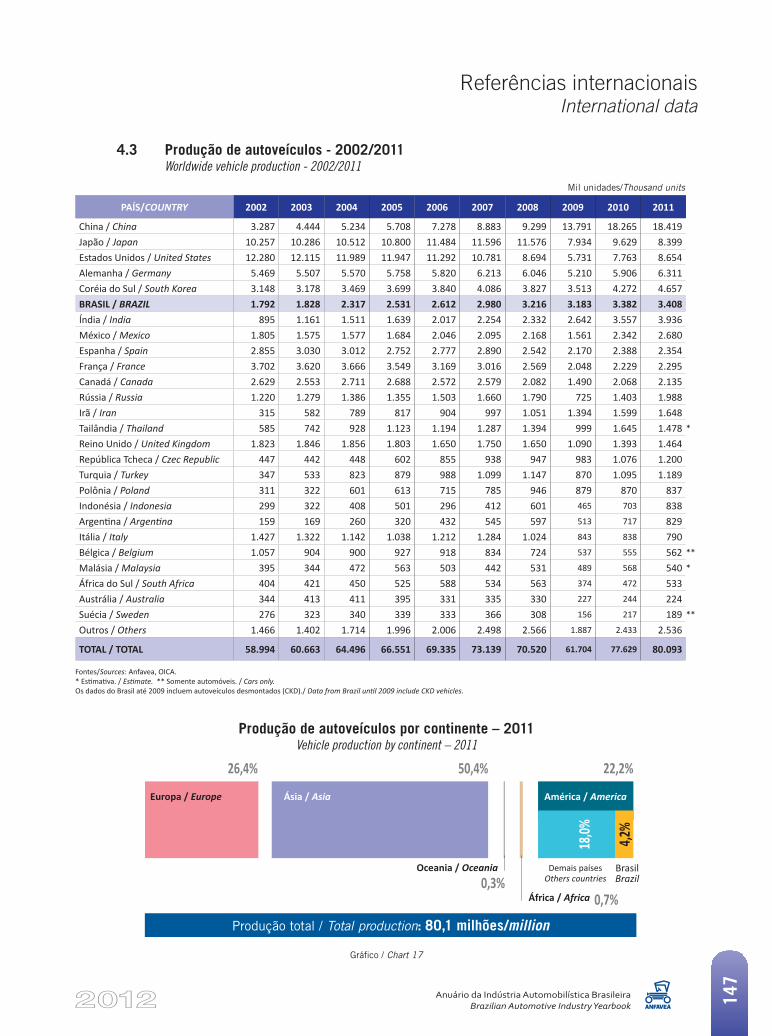
Referências internacionaisInternational data
Anuário da Indústria Automobilística BrasileiraBrazilian Automotive Industry Yearbook 14
7
Gráfico / Chart 17
Produção de autoveículos por continente – 2011Vehicle production by continent – 2011
Mil unidades/Thousand units
4.3 Produção de autoveículos - 2002/2011 Worldwide vehicle production - 2002/2011
PAÍS/COUNTRY 2002 2003 2004 2005 2006 2007 2008 2009 2010 2011
China / China 3.287 4.444 5.234 5.708 7.278 8.883 9.299 13.791 18.265 18.419Japão / Japan 10.257 10.286 10.512 10.800 11.484 11.596 11.576 7.934 9.629 8.399Estados Unidos / United States 12.280 12.115 11.989 11.947 11.292 10.781 8.694 5.731 7.763 8.654Alemanha / Germany 5.469 5.507 5.570 5.758 5.820 6.213 6.046 5.210 5.906 6.311Coréia do Sul / South Korea 3.148 3.178 3.469 3.699 3.840 4.086 3.827 3.513 4.272 4.657BRASIL / BRAZIL 1.792 1.828 2.317 2.531 2.612 2.980 3.216 3.183 3.382 3.408Índia / India 895 1.161 1.511 1.639 2.017 2.254 2.332 2.642 3.557 3.936México / Mexico 1.805 1.575 1.577 1.684 2.046 2.095 2.168 1.561 2.342 2.680Espanha / Spain 2.855 3.030 3.012 2.752 2.777 2.890 2.542 2.170 2.388 2.354França / France 3.702 3.620 3.666 3.549 3.169 3.016 2.569 2.048 2.229 2.295Canadá / Canada 2.629 2.553 2.711 2.688 2.572 2.579 2.082 1.490 2.068 2.135Rússia / Russia 1.220 1.279 1.386 1.355 1.503 1.660 1.790 725 1.403 1.988Irã / Iran 315 582 789 817 904 997 1.051 1.394 1.599 1.648Tailândia / Thailand 585 742 928 1.123 1.194 1.287 1.394 999 1.645 1.478 *
Reino Unido / United Kingdom 1.823 1.846 1.856 1.803 1.650 1.750 1.650 1.090 1.393 1.464República Tcheca / Czec Republic 447 442 448 602 855 938 947 983 1.076 1.200Turquia / Turkey 347 533 823 879 988 1.099 1.147 870 1.095 1.189Polônia / Poland 311 322 601 613 715 785 946 879 870 837Indonésia / Indonesia 299 322 408 501 296 412 601 465 703 838Argentina / Argentina 159 169 260 320 432 545 597 513 717 829Itália / Italy 1.427 1.322 1.142 1.038 1.212 1.284 1.024 843 838 790Bélgica / Belgium 1.057 904 900 927 918 834 724 537 555 562 **
Malásia / Malaysia 395 344 472 563 503 442 531 489 568 540 *
África do Sul / South Africa 404 421 450 525 588 534 563 374 472 533Austrália / Australia 344 413 411 395 331 335 330 227 244 224Suécia / Sweden 276 323 340 339 333 366 308 156 217 189 **
Outros / Others 1.466 1.402 1.714 1.996 2.006 2.498 2.566 1.887 2.433 2.536
TOTAL / TOTAL 58.994 60.663 64.496 66.551 69.335 73.139 70.520 61.704 77.629 80.093
Fontes/Sources: Anfavea, OICA.* Estimativa. / Estimate. ** Somente automóveis. / Cars only.Os dados do Brasil até 2009 incluem autoveículos desmontados (CKD)./ Data from Brazil until 2009 include CKD vehicles.
Produção total / Total production: 80,1 milhões/million
26,4% 50,4% 22,2%
18,0% 4,2
%
0,3%0,7%
Europa / Europe Ásia / Asia
Oceania / Oceania
África / Africa
América / America
Demais paísesOthers countries
BrasilBrazil
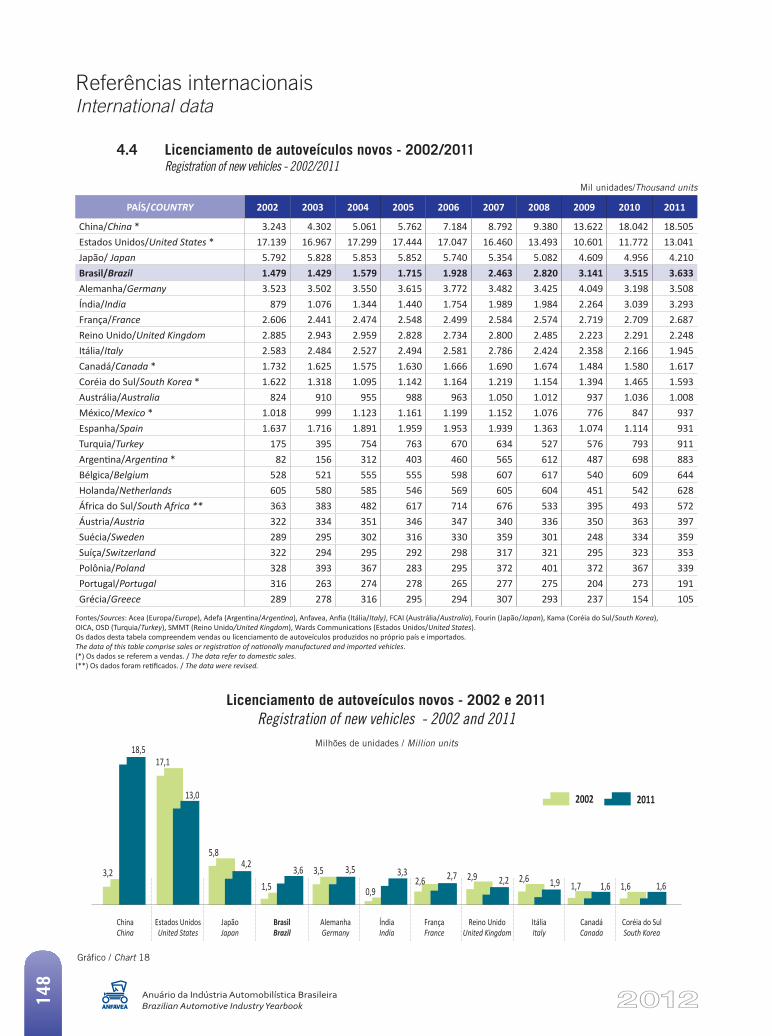
Referências internacionaisInternational data
Anuário da Indústria Automobilística BrasileiraBrazilian Automotive Industry Yearbook14
8
Mil unidades/Thousand units
4.4 Licenciamento de autoveículos novos - 2002/2011 Registration of new vehicles - 2002/2011
PAÍS/COUNTRY 2002 2003 2004 2005 2006 2007 2008 2009 2010 2011
China/China * 3.243 4.302 5.061 5.762 7.184 8.792 9.380 13.622 18.042 18.505 Estados Unidos/United States * 17.139 16.967 17.299 17.444 17.047 16.460 13.493 10.601 11.772 13.041 Japão/ Japan 5.792 5.828 5.853 5.852 5.740 5.354 5.082 4.609 4.956 4.210 Brasil/Brazil 1.479 1.429 1.579 1.715 1.928 2.463 2.820 3.141 3.515 3.633 Alemanha/Germany 3.523 3.502 3.550 3.615 3.772 3.482 3.425 4.049 3.198 3.508 Índia/India 879 1.076 1.344 1.440 1.754 1.989 1.984 2.264 3.039 3.293 França/France 2.606 2.441 2.474 2.548 2.499 2.584 2.574 2.719 2.709 2.687 Reino Unido/United Kingdom 2.885 2.943 2.959 2.828 2.734 2.800 2.485 2.223 2.291 2.248 Itália/Italy 2.583 2.484 2.527 2.494 2.581 2.786 2.424 2.358 2.166 1.945 Canadá/Canada * 1.732 1.625 1.575 1.630 1.666 1.690 1.674 1.484 1.580 1.617 Coréia do Sul/South Korea * 1.622 1.318 1.095 1.142 1.164 1.219 1.154 1.394 1.465 1.593 Austrália/Australia 824 910 955 988 963 1.050 1.012 937 1.036 1.008 México/Mexico * 1.018 999 1.123 1.161 1.199 1.152 1.076 776 847 937 Espanha/Spain 1.637 1.716 1.891 1.959 1.953 1.939 1.363 1.074 1.114 931 Turquia/Turkey 175 395 754 763 670 634 527 576 793 911 Argentina/Argentina * 82 156 312 403 460 565 612 487 698 883 Bélgica/Belgium 528 521 555 555 598 607 617 540 609 644 Holanda/Netherlands 605 580 585 546 569 605 604 451 542 628 África do Sul/South Africa ** 363 383 482 617 714 676 533 395 493 572 Áustria/Austria 322 334 351 346 347 340 336 350 363 397 Suécia/Sweden 289 295 302 316 330 359 301 248 334 359 Suíça/Switzerland 322 294 295 292 298 317 321 295 323 353 Polônia/Poland 328 393 367 283 295 372 401 372 367 339 Portugal/Portugal 316 263 274 278 265 277 275 204 273 191 Grécia/Greece 289 278 316 295 294 307 293 237 154 105
Fontes/Sources: Acea (Europa/Europe), Adefa (Argentina/Argentina), Anfavea, Anfia (Itália/Italy), FCAI (Austrália/Australia), Fourin (Japão/Japan), Kama (Coréia do Sul/South Korea), OICA, OSD (Turquia/Turkey), SMMT (Reino Unido/United Kingdom), Wards Communications (Estados Unidos/United States).Os dados desta tabela compreendem vendas ou licenciamento de autoveículos produzidos no próprio país e importados. The data of this table comprise sales or registration of nationally manufactured and imported vehicles.(*) Os dados se referem a vendas. / The data refer to domestic sales. (**) Os dados foram retificados. / The data were revised.
Gráfico / Chart 18
Milhões de unidades / Million units
Licenciamento de autoveículos novos - 2002 e 2011Registration of new vehicles - 2002 and 2011
5,8
3,2
18,5
13,0
4,2 3,6 3,5 3,3 2,7 2,2 1,9 1,6 1,61,53,5
0,92,6 2,9 2,6
1,7 1,6
17,1
Estados UnidosUnited States
JapãoJapan
AlemanhaGermany
BrasilBrazil
FrançaFrance
ItáliaItaly
ÍndiaIndia
Reino UnidoUnited Kingdom
CanadáCanada
Coréia do SulSouth Korea
ChinaChina
2002 2011
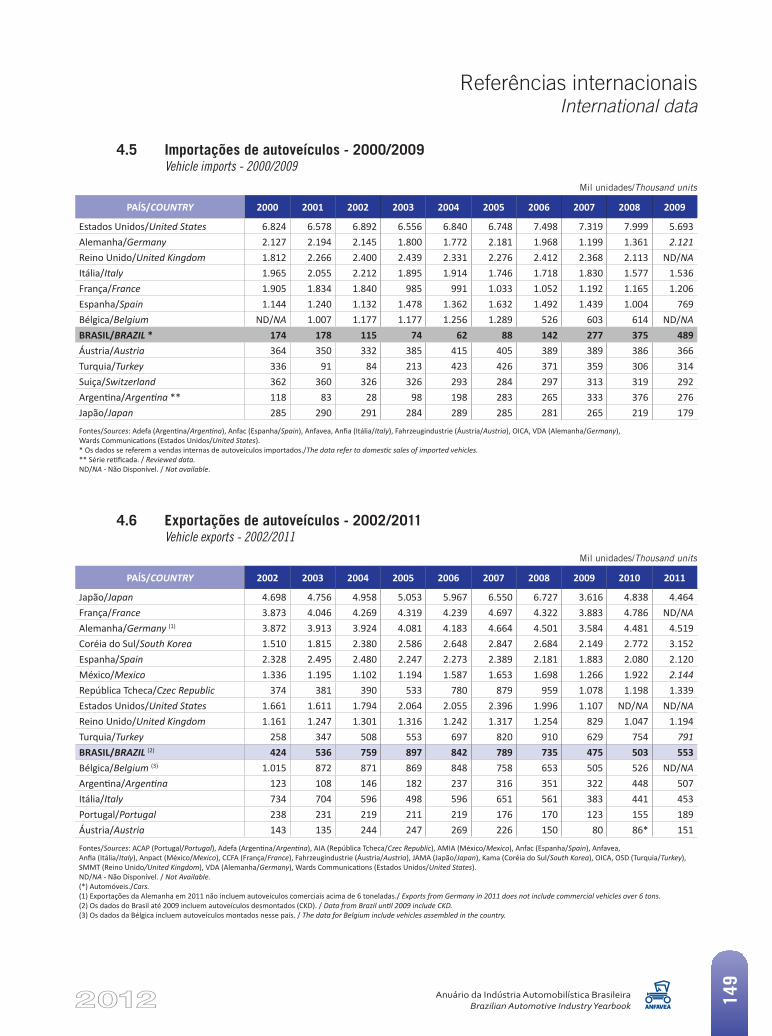
Referências internacionaisInternational data
Anuário da Indústria Automobilística BrasileiraBrazilian Automotive Industry Yearbook 14
9
Mil unidades/Thousand units
4.5 Importações de autoveículos - 2000/2009 Vehicle imports - 2000/2009
PAÍS/COUNTRY 2000 2001 2002 2003 2004 2005 2006 2007 2008 2009
Estados Unidos/United States 6.824 6.578 6.892 6.556 6.840 6.748 7.498 7.319 7.999 5.693Alemanha/Germany 2.127 2.194 2.145 1.800 1.772 2.181 1.968 1.199 1.361 2.121Reino Unido/United Kingdom 1.812 2.266 2.400 2.439 2.331 2.276 2.412 2.368 2.113 ND/NAItália/Italy 1.965 2.055 2.212 1.895 1.914 1.746 1.718 1.830 1.577 1.536França/France 1.905 1.834 1.840 985 991 1.033 1.052 1.192 1.165 1.206Espanha/Spain 1.144 1.240 1.132 1.478 1.362 1.632 1.492 1.439 1.004 769Bélgica/Belgium ND/NA 1.007 1.177 1.177 1.256 1.289 526 603 614 ND/NABRASIL/BRAZIL * 174 178 115 74 62 88 142 277 375 489Áustria/Austria 364 350 332 385 415 405 389 389 386 366Turquia/Turkey 336 91 84 213 423 426 371 359 306 314Suiça/Switzerland 362 360 326 326 293 284 297 313 319 292Argentina/Argentina ** 118 83 28 98 198 283 265 333 376 276Japão/Japan 285 290 291 284 289 285 281 265 219 179
Fontes/Sources: Adefa (Argentina/Argentina), Anfac (Espanha/Spain), Anfavea, Anfia (Itália/Italy), Fahrzeugindustrie (Áustria/Austria), OICA, VDA (Alemanha/Germany), Wards Communications (Estados Unidos/United States).* Os dados se referem a vendas internas de autoveículos importados./The data refer to domestic sales of imported vehicles.** Série retificada. / Reviewed data.ND/NA - Não Disponível. / Not available.
Mil unidades/Thousand units
4.6 Exportações de autoveículos - 2002/2011 Vehicle exports - 2002/2011
PAÍS/COUNTRY 2002 2003 2004 2005 2006 2007 2008 2009 2010 2011
Japão/Japan 4.698 4.756 4.958 5.053 5.967 6.550 6.727 3.616 4.838 4.464França/France 3.873 4.046 4.269 4.319 4.239 4.697 4.322 3.883 4.786 ND/NAAlemanha/Germany (1) 3.872 3.913 3.924 4.081 4.183 4.664 4.501 3.584 4.481 4.519Coréia do Sul/South Korea 1.510 1.815 2.380 2.586 2.648 2.847 2.684 2.149 2.772 3.152Espanha/Spain 2.328 2.495 2.480 2.247 2.273 2.389 2.181 1.883 2.080 2.120México/Mexico 1.336 1.195 1.102 1.194 1.587 1.653 1.698 1.266 1.922 2.144República Tcheca/Czec Republic 374 381 390 533 780 879 959 1.078 1.198 1.339Estados Unidos/United States 1.661 1.611 1.794 2.064 2.055 2.396 1.996 1.107 ND/NA ND/NAReino Unido/United Kingdom 1.161 1.247 1.301 1.316 1.242 1.317 1.254 829 1.047 1.194Turquia/Turkey 258 347 508 553 697 820 910 629 754 791BRASIL/BRAZIL (2) 424 536 759 897 842 789 735 475 503 553Bélgica/Belgium (3) 1.015 872 871 869 848 758 653 505 526 ND/NAArgentina/Argentina 123 108 146 182 237 316 351 322 448 507Itália/Italy 734 704 596 498 596 651 561 383 441 453Portugal/Portugal 238 231 219 211 219 176 170 123 155 189Áustria/Austria 143 135 244 247 269 226 150 80 86* 151
Fontes/Sources: ACAP (Portugal/Portugal), Adefa (Argentina/Argentina), AIA (República Tcheca/Czec Republic), AMIA (México/Mexico), Anfac (Espanha/Spain), Anfavea, Anfia (Itália/Italy), Anpact (México/Mexico), CCFA (França/France), Fahrzeugindustrie (Áustria/Austria), JAMA (Japão/Japan), Kama (Coréia do Sul/South Korea), OICA, OSD (Turquia/Turkey), SMMT (Reino Unido/United Kingdom), VDA (Alemanha/Germany), Wards Communications (Estados Unidos/United States).ND/NA - Não Disponível. / Not Available.(*) Automóveis./Cars.(1) Exportações da Alemanha em 2011 não incluem autoveículos comerciais acima de 6 toneladas./ Exports from Germany in 2011 does not include commercial vehicles over 6 tons.(2) Os dados do Brasil até 2009 incluem autoveículos desmontados (CKD). / Data from Brazil until 2009 include CKD.(3) Os dados da Bélgica incluem autoveículos montados nesse país. / The data for Belgium include vehicles assembled in the country.
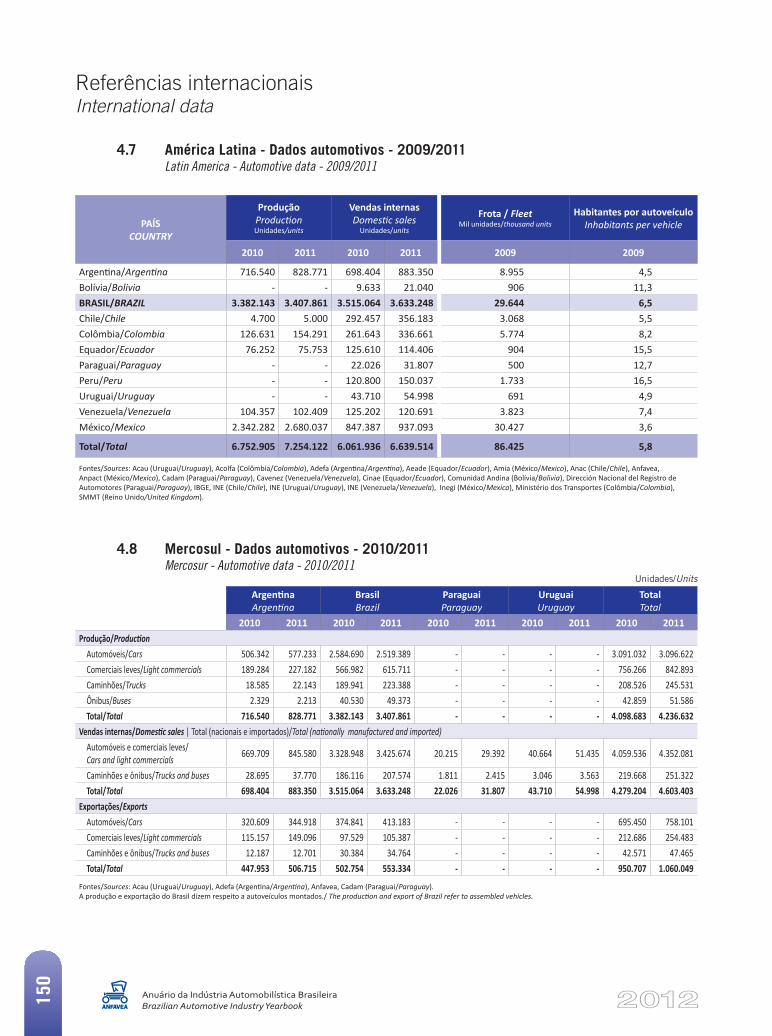
Referências internacionaisInternational data
Anuário da Indústria Automobilística BrasileiraBrazilian Automotive Industry Yearbook15
0
PAÍSCOUNTRY
Produção Production Unidades/units
Vendas internas Domestic sales
Unidades/units
Frota / Fleet Mil unidades/thousand units
Habitantes por autoveículo Inhabitants per vehicle
2010 2011 2010 2011 2009 2009
Argentina/Argentina 716.540 828.771 698.404 883.350 8.955 4,5 Bolívia/Bolivia - - 9.633 21.040 906 11,3 BRASIL/BRAZIL 3.382.143 3.407.861 3.515.064 3.633.248 29.644 6,5Chile/Chile 4.700 5.000 292.457 356.183 3.068 5,5 Colômbia/Colombia 126.631 154.291 261.643 336.661 5.774 8,2 Equador/Ecuador 76.252 75.753 125.610 114.406 904 15,5 Paraguai/Paraguay - - 22.026 31.807 500 12,7 Peru/Peru - - 120.800 150.037 1.733 16,5 Uruguai/Uruguay - - 43.710 54.998 691 4,9 Venezuela/Venezuela 104.357 102.409 125.202 120.691 3.823 7,4 México/Mexico 2.342.282 2.680.037 847.387 937.093 30.427 3,6
Total/Total 6.752.905 7.254.122 6.061.936 6.639.514 86.425 5,8
Fontes/Sources: Acau (Uruguai/Uruguay), Acolfa (Colômbia/Colombia), Adefa (Argentina/Argentina), Aeade (Equador/Ecuador), Amia (México/Mexico), Anac (Chile/Chile), Anfavea, Anpact (México/Mexico), Cadam (Paraguai/Paraguay), Cavenez (Venezuela/Venezuela), Cinae (Equador/Ecuador), Comunidad Andina (Bolívia/Bolivia), Dirección Nacional del Registro de Automotores (Paraguai/Paraguay), IBGE, INE (Chile/Chile), INE (Uruguai/Uruguay), INE (Venezuela/Venezuela), Inegi (México/Mexico), Ministério dos Transportes (Colômbia/Colombia), SMMT (Reino Unido/United Kingdom).
Argentina Argentina
Brasil Brazil
Paraguai Paraguay
Uruguai Uruguay
Total Total
2010 2011 2010 2011 2010 2011 2010 2011 2010 2011Produção/Production
Automóveis/Cars 506.342 577.233 2.584.690 2.519.389 - - - - 3.091.032 3.096.622 Comerciais leves/Light commercials 189.284 227.182 566.982 615.711 - - - - 756.266 842.893 Caminhões/Trucks 18.585 22.143 189.941 223.388 - - - - 208.526 245.531 Ônibus/Buses 2.329 2.213 40.530 49.373 - - - - 42.859 51.586 Total/Total 716.540 828.771 3.382.143 3.407.861 - - - - 4.098.683 4.236.632
Vendas internas/Domestic sales | Total (nacionais e importados)/Total (nationally manufactured and imported)Automóveis e comerciais leves/ Cars and light commercials 669.709 845.580 3.328.948 3.425.674 20.215 29.392 40.664 51.435 4.059.536 4.352.081
Caminhões e ônibus/Trucks and buses 28.695 37.770 186.116 207.574 1.811 2.415 3.046 3.563 219.668 251.322 Total/Total 698.404 883.350 3.515.064 3.633.248 22.026 31.807 43.710 54.998 4.279.204 4.603.403
Exportações/ExportsAutomóveis/Cars 320.609 344.918 374.841 413.183 - - - - 695.450 758.101 Comerciais leves/Light commercials 115.157 149.096 97.529 105.387 - - - - 212.686 254.483 Caminhões e ônibus/Trucks and buses 12.187 12.701 30.384 34.764 - - - - 42.571 47.465 Total/Total 447.953 506.715 502.754 553.334 - - - - 950.707 1.060.049
Fontes/Sources: Acau (Uruguai/Uruguay), Adefa (Argentina/Argentina), Anfavea, Cadam (Paraguai/Paraguay).A produção e exportação do Brasil dizem respeito a autoveículos montados./ The production and export of Brazil refer to assembled vehicles.
4.7 América Latina - Dados automotivos - 2009/2011 Latin America - Automotive data - 2009/2011
4.8 Mercosul - Dados automotivos - 2010/2011 Mercosur - Automotive data - 2010/2011
Unidades/Units
EntidadesExposições
AnunciantesOrganizations
Exhibitions Advertisers
5
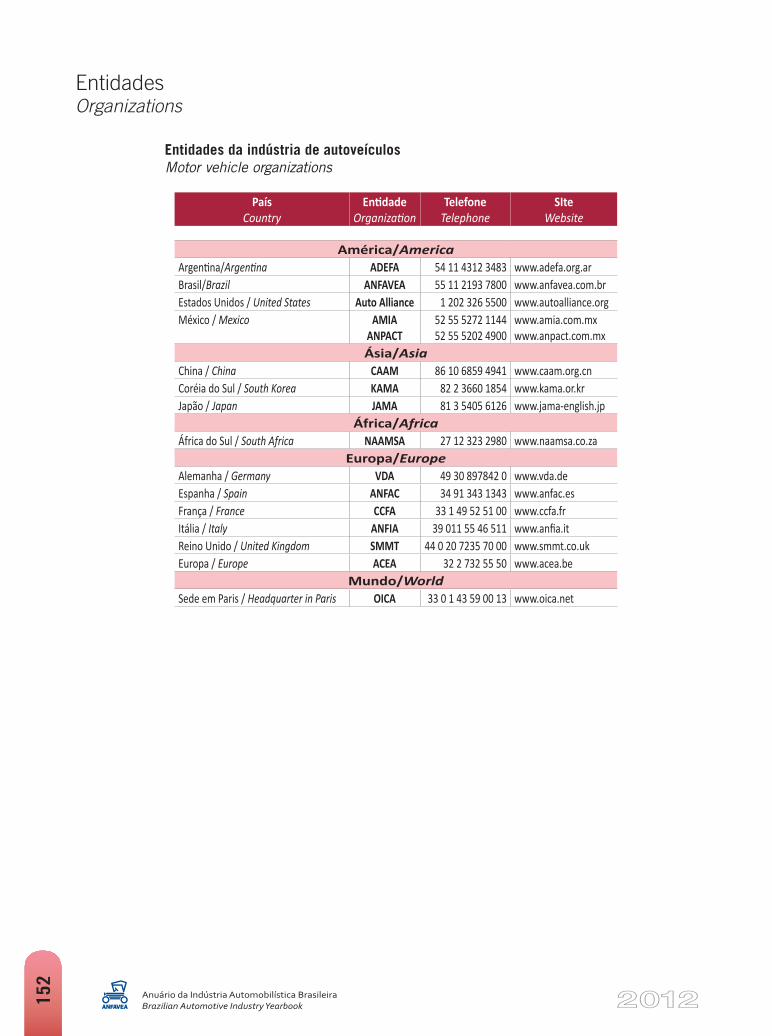
EntidadesOrganizations
Anuário da Indústria Automobilística BrasileiraBrazilian Automotive Industry Yearbook15
2
País Country
Entidade Organization
Telefone Telephone
SIte Website
América/AmericaArgentina/Argentina ADEFA 54 11 4312 3483 www.adefa.org.arBrasil/Brazil ANFAVEA 55 11 2193 7800 www.anfavea.com.brEstados Unidos / United States Auto Alliance 1 202 326 5500 www.autoalliance.orgMéxico / Mexico AMIA
ANPACT52 55 5272 1144 52 55 5202 4900
www.amia.com.mx www.anpact.com.mx
Ásia/AsiaChina / China CAAM 86 10 6859 4941 www.caam.org.cnCoréia do Sul / South Korea KAMA 82 2 3660 1854 www.kama.or.krJapão / Japan JAMA 81 3 5405 6126 www.jama-english.jp
África/AfricaÁfrica do Sul / South Africa NAAMSA 27 12 323 2980 www.naamsa.co.za
Europa/EuropeAlemanha / Germany VDA 49 30 897842 0 www.vda.deEspanha / Spain ANFAC 34 91 343 1343 www.anfac.esFrança / France CCFA 33 1 49 52 51 00 www.ccfa.frItália / Italy ANFIA 39 011 55 46 511 www.anfia.itReino Unido / United Kingdom SMMT 44 0 20 7235 70 00 www.smmt.co.ukEuropa / Europe ACEA 32 2 732 55 50 www.acea.be
Mundo/WorldSede em Paris / Headquarter in Paris OICA 33 0 1 43 59 00 13 www.oica.net
Entidades da indústria de autoveículos Motor vehicle organizations
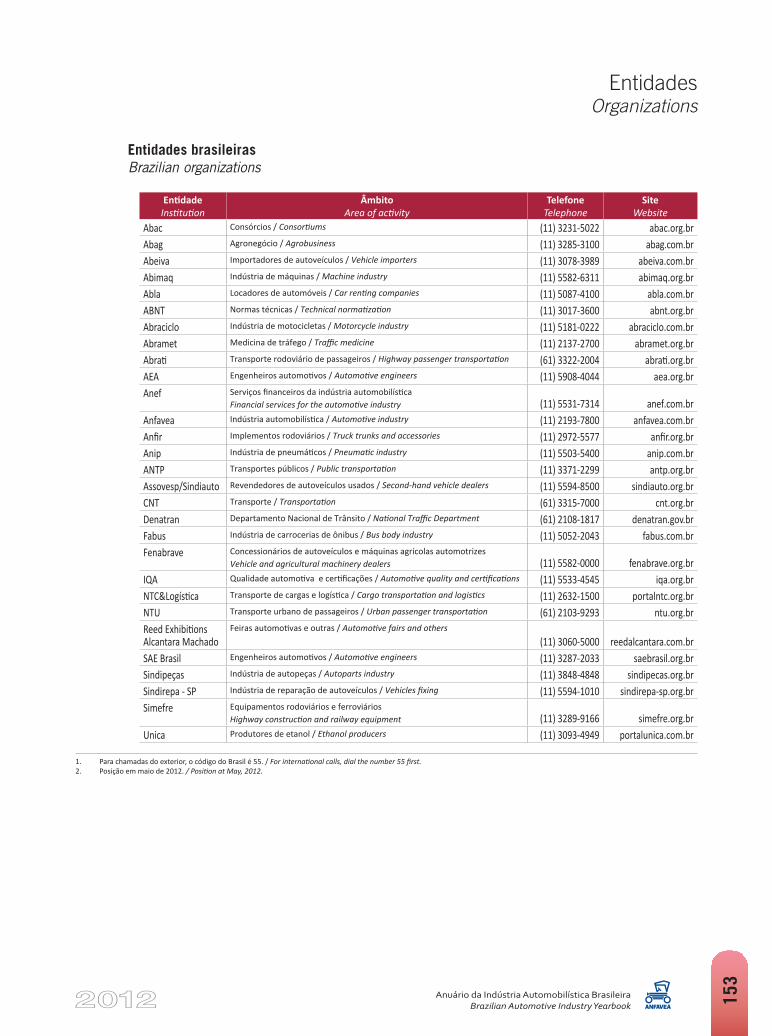
EntidadesOrganizations
Anuário da Indústria Automobilística BrasileiraBrazilian Automotive Industry Yearbook 15
3
Entidade Institution
Âmbito Area of activity
Telefone Telephone
Site Website
Abac Consórcios / Consortiums (11) 3231-5022 abac.org.brAbag Agronegócio / Agrobusiness (11) 3285-3100 abag.com.brAbeiva Importadores de autoveículos / Vehicle importers (11) 3078-3989 abeiva.com.brAbimaq Indústria de máquinas / Machine industry (11) 5582-6311 abimaq.org.brAbla Locadores de automóveis / Car renting companies (11) 5087-4100 abla.com.brABNT Normas técnicas / Technical normatization (11) 3017-3600 abnt.org.brAbraciclo Indústria de motocicletas / Motorcycle industry (11) 5181-0222 abraciclo.com.brAbramet Medicina de tráfego / Traffic medicine (11) 2137-2700 abramet.org.brAbrati Transporte rodoviário de passageiros / Highway passenger transportation (61) 3322-2004 abrati.org.brAEA Engenheiros automotivos / Automotive engineers (11) 5908-4044 aea.org.brAnef Serviços financeiros da indústria automobilística
Financial services for the automotive industry (11) 5531-7314 anef.com.brAnfavea Indústria automobilística / Automotive industry (11) 2193-7800 anfavea.com.brAnfir Implementos rodoviários / Truck trunks and accessories (11) 2972-5577 anfir.org.brAnip Indústria de pneumáticos / Pneumatic industry (11) 5503-5400 anip.com.brANTP Transportes públicos / Public transportation (11) 3371-2299 antp.org.brAssovesp/Sindiauto Revendedores de autoveículos usados / Second-hand vehicle dealers (11) 5594-8500 sindiauto.org.brCNT Transporte / Transportation (61) 3315-7000 cnt.org.brDenatran Departamento Nacional de Trânsito / National Traffic Department (61) 2108-1817 denatran.gov.brFabus Indústria de carrocerias de ônibus / Bus body industry (11) 5052-2043 fabus.com.brFenabrave Concessionários de autoveículos e máquinas agrícolas automotrizes
Vehicle and agricultural machinery dealers (11) 5582-0000 fenabrave.org.brIQA Qualidade automotiva e certificações / Automotive quality and certifications (11) 5533-4545 iqa.org.brNTC&Logística Transporte de cargas e logística / Cargo transportation and logistics (11) 2632-1500 portalntc.org.brNTU Transporte urbano de passageiros / Urban passenger transportation (61) 2103-9293 ntu.org.brReed Exhibitions Alcantara Machado
Feiras automotivas e outras / Automotive fairs and others(11) 3060-5000 reedalcantara.com.br
SAE Brasil Engenheiros automotivos / Automotive engineers (11) 3287-2033 saebrasil.org.brSindipeças Indústria de autopeças / Autoparts industry (11) 3848-4848 sindipecas.org.brSindirepa - SP Indústria de reparação de autoveículos / Vehicles fixing (11) 5594-1010 sindirepa-sp.org.brSimefre Equipamentos rodoviários e ferroviários
Highway construction and railway equipment (11) 3289-9166 simefre.org.brUnica Produtores de etanol / Ethanol producers (11) 3093-4949 portalunica.com.br
Entidades brasileiras Brazilian organizations
1. Para chamadas do exterior, o código do Brasil é 55. / For international calls, dial the number 55 first.2. Posição em maio de 2012. / Position at May, 2012.
Anuário da Indústria Automobilística BrasileiraBrazilian Automotive Industry Yearbook
154
Salão Internacional do AutomóvelSão Paulo - SP • Anos pares/Even years
www.salaodoautomovel.com.br
Fenatran - Salão Internacional do Transporte (veículos de carga/freight transportation vehicles)
São Paulo - SP • Anos ímpares/Uneven yearswww.fenatran.com.br
Exposições patrocinadas pela Anfavea Exhibitions sponsored by Anfavea
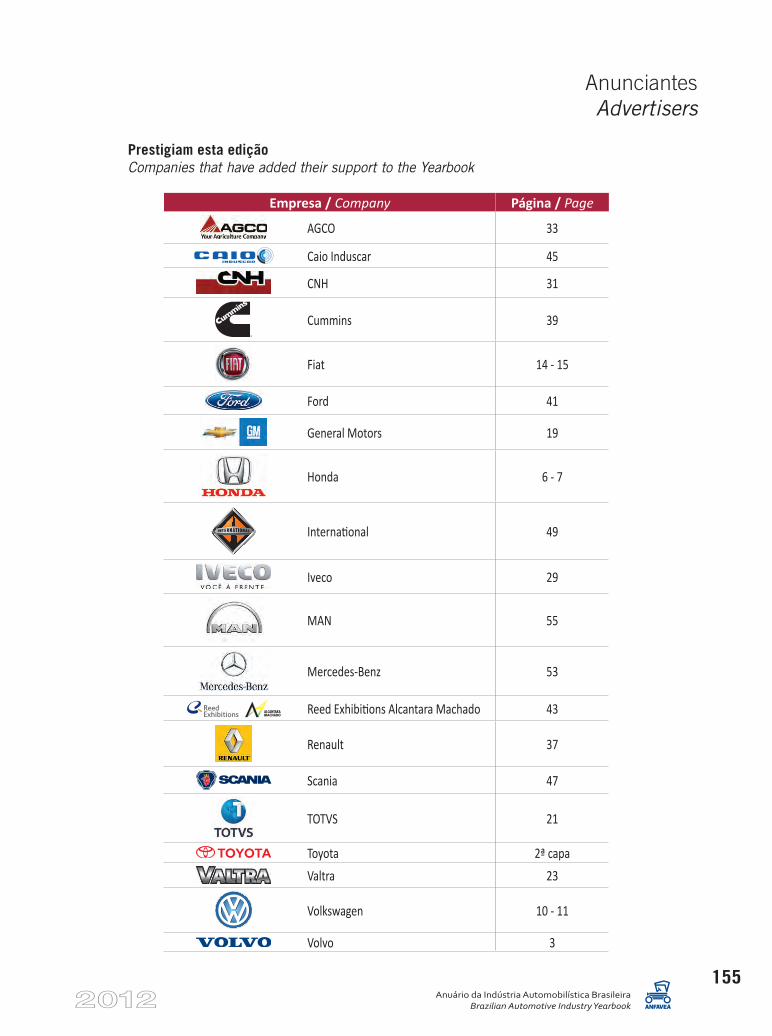
Anuário da Indústria Automobilística BrasileiraBrazilian Automotive Industry Yearbook
155
Empresa / Company Página / Page
AGCO 33
Caio Induscar 45
CNH 31
Cummins 39
Fiat 14 - 15
Ford 41
General Motors 19
Honda 6 - 7
International 49
Iveco 29
MAN 55
Mercedes-Benz 53
Reed Exhibitions Alcantara Machado 43
Renault 37
Scania 47
TOTVS 21
Toyota 2ª capaValtra 23
Volkswagen 10 - 11
Volvo 3
Prestigiam esta edição Companies that have added their support to the Yearbook
AnunciantesAdvertisers