universidade federal do rio grande furg instituto de ...ƒo_final.pdf · tornar melhor,...
TRANSCRIPT

Universidade Federal do Rio Grande – FURG
Instituto de Oceanografia
Programa de Pós-Graduação em Aquicultura
TOXICIDADE DA AMÔNIA E DO NITRITO EM JUVENIS
DE LINGUADO Paralichthys orbignyanus
Lucas Campos Maltez
Rio Grande, RS
2017

ii
UNIVERSIDADE FEDERAL DO RIO GRANDE-FURG
INSTITUTO DE OCEANOGRAFIA
PROGRAMA DE PÓS-GRADUAÇÃO EM AQUICULTURA
TOXICIDADE DA AMÔNIA E DO NITRITO EM JUVENIS DE LINGUADO
Paralichthys orbignyanus
Lucas Campos Maltez
Orientador: Prof. Dr. Luciano de Oliveira Garcia
Rio Grande, RS
Março de 2017
Tese apresentada como parte dos
requisitos para obtenção do grau de
Doutor em Aquicultura pelo
Programa de Pós-Graduação em
Aquicultura da Universidade Federal
do Rio Grande.

iii
“Você não pode mudar o vento, mas pode ajustar as
velas do barco para chegar onde quer.”
Confúcio
iv
AGRADECIMENTOS
Ao meu orientador Prof. Dr. Luciano de Oliveira Garcia, não só pela orientação e
ensinamentos fundamentais nesta etapa da minha formação acadêmica, como também pela
amizade e por demonstrar que ficar tranquilo e de bem com a vida, sem esquecer as
responsabilidades, torna tudo mais fácil.
Aos mais que apenas colegas, mas sim amigos do Laboratório de Aquicultura
Continental: Lilian, Lucas, Daniel, Giovanna, Lili, Blade. Obrigado por fazer do LAC um
lugar no qual me sinto em casa! Ao Dr. Barbas, que também ainda faz parte dessa equipe,
mesmo estando lá no outro extremo do Brasil, que sempre se dispôs a me ajudar e
aconselhar.
Aos demais amigos cassineiros, aos de longe, e até aos de muito longe, com quem
gosto de compartilhar os bons momentos, mas que também sei que posso dividir os meus
problemas.
A todos os professores do Programa de Pós-Graduação em Aquicultura, por todo o
conhecimento repassado, o que me motivou a querer aprender cada vez mais. Em especial
aos professores Dr. Luis André Sampaio, Dr. Luis Alberto Romano e Dr. José Monserrat
por abrir as portas de seus laboratórios para que este projeto pudesse ser executado e por
suas valiosas contribuições ao longo do desenvolvimento do trabalho.
Aos técnicos e ex-técnicos da FURG, em especial ao Dr. Diogão e ao Sandro, e a
todos aqueles que participaram de alguma forma na construção dessa tese, seja ajudando na
parte experimental, em alguma análise ou tirando alguma das muitas dúvidas que sempre
me surgiam. Estendo ainda meus agradecimentos a todos os demais funcionários da FURG,
pelas diversas funções indispensáveis que exercem dentro da universidade.
A cada um dos membros da banca, por me conceder seu precioso tempo, que
certamente será traduzido em críticas construtivas e sugestões buscando sempre melhorar o
trabalho.
Aos meus pais, Raymundo e Kátia, onde sempre encontrei todo apoio que precisei e
que apesar dos 3400 km entre Rio Grande e Salvador, sempre se fizeram presentes.
v
À Mariana Holanda, que embarcou nessa viagem desconhecida de quatro anos
comigo, e agora estamos chegando ao destino, com a certeza de que foi a escolha certa.
Muito obrigado pelo amor, carinho e compreensão, e por ser meu maior incentivo para me
tornar melhor, profissionalmente e como pessoa, a cada dia. Ao Duke e à Duna, por
completar essa família, trazendo ainda mais alegria a casa.
À FURG e ao Programa de Pós Graduação em Aquicultura, pela oportunidade de
realizar o doutorado, e a CAPES e ao CNPq pelo suporte financeiro que permitiram o
desenvolvimento deste trabalho.

vi
ÍNDICE
RESUMO GERAL................................................................................................................1
ABSTRACT...........................................................................................................................3
INTRODUÇÃO GERAL......................................................................................................5
OBJETIVO GERAL...........................................................................................................21
OBJETIVOS ESPECÍFICOS............................................................................................21
HIPÓTESES........................................................................................................................22
REFERÊNCIAS BIBLIOGRÁFICAS..............................................................................22
CAPÍTULO 1: Secondary stress responses in juvenile Brazilian flounder Paralichthys
orbignyanus throughout and after exposure to sub-lethal levels of ammonia and
nitrite.....................................................................................................................................32
CAPÍTULO 2: Ammonia exposure and subsequent recovery trigger oxidative stress
responses in juveniles of Brazilian flounder Paralichthys orbignyanus...............................58
CAPÍTULO 3: Oxidative stress and antioxidant responses in juvenile Brazilian flounder
Paralichthys orbignyanus exposed to sub-lethal levels of nitrite.........................................84
CONCLUSÕES.................................................................................................................114
CONSIDERAÇÕES FINAIS E PERSPECTIVAS........................................................114

1
RESUMO GERAL 1
2
O linguado Paralichthys orbignyanus é uma espécie que apresenta grande potencial para a 3
aquicultura intensiva, onde o acúmulo de compostos nitrogenados pode ser um dos 4
principais limitantes a produção. A amônia e o nitrito são os mais tóxicos dentre estes 5
compostos, sendo capazes de induzir diversos distúrbios fisiológicos nos peixes, mesmo se 6
em níveis subletais. Portanto, a presente tese teve como objetivo determinar os efeitos 7
subletais da exposição à amônia e ao nitrito, e posterior recuperação em juvenis do 8
linguado utilizando parâmetros sanguíneos, de estresse oxidativo e histopatologia como 9
biomarcadores. Foram realizados dois experimentos, nos quais os peixes foram expostos a 10
três concentrações de amônia (0,12; 0,28 e 0,57 mg NH3-N.L-1
) ou nitrito (5,72; 10,43 e 11
15,27 mg NO2-N.L-1
), além de um tratamento controle, durante 10 dias. Em seguida os 12
animais foram mantidos por mais 10 dias em água livre ou com concentrações mínimas de 13
amônia (0.00 mg NH3-N.L-1
) ou nitrito (0.05 mg NO2-N.L-1
) para avaliar a recuperação. 14
Foram coletadas amostras de sangue, brânquia, fígado, músculo e cérebro de 9 peixes por 15
tratamento após 1, 5 e 10 dias de exposição, e ao final da recuperação. Os resultados 16
demonstram que os efeitos atribuídos à ação tóxica da amônia e do nitrito nos juvenis de 17
linguado foram influenciados pelo tempo de exposição e concentração, e mesmo nas 18
concentrações mais baixas testadas de ambos os compostos, houve perturbação da 19
homeostase de alguns dos parâmetros. A análise dos parâmetros sanguíneos (glicose, Na+, 20
K+, Ca
++, HCO3
−, pCO2, pH, perfil leucocitário) durante a exposição a amônia e nitrito 21
indicaram diferentes distúrbios metabólicos, osmorregulatórios, ácido-base e na resposta 22
imune dos peixes. A indução a uma condição pró-oxidante nas brânquias, fígado e músculo 23
também foi demonstrada como mais um dos mecanismos de toxicidade destes compostos 24
para a espécie. A inibição do sistema antioxidante (redução da capacidade antioxidante 25
total e da atividade da enzima antioxidante glutationa-S-transferase) e/ou aumento nos 26
níveis de dano oxidativo em lipídio e proteínas demonstram este efeito. Além disso, a 27
ativação de diferentes defesas antioxidantes enzimáticas e não enzimáticas foi observada, 28
indicando a um mecanismo adaptativo para combater ou minimizar o estresse oxidativo. 29
Não foram evidenciadas alterações histopatológicas no cérebro, no fígado e nas brânquias 30
dos peixes decorrentes da exposição à amônia ou ao nitrito. Após o período de recuperação, 31

2
apenas os peixes submetidos ao tratamento 5,72 mg NO2-N.L-1
apresentaram todos os 1
parâmetros sanguíneos e de estresse oxidativo dentro dos valores basais. Para os demais 2
tratamentos do experimento com nitrito e nos peixes expostos a amônia, este 3
restabelecimento ocorreu apenas em parte dos parâmetros. Como conclusão, concentrações 4
a partir de 0,12 mg NH3-N.L-1
e 5,72 mg NO2-N.L-1
causam diversas alterações fisiológicas 5
nos juvenis de linguado, portanto devem ser evitadas nos sistemas de produção. O período 6
de recuperação de 10 dias foi capaz de levar ao restabelecimento parcial ou total da 7
condição fisiológica dos peixes, dependendo do composto e concentração ao qual foram 8
expostos. A recuperação completa foi demonstrada apenas nos peixes expostos a 5,72 mg 9
NO2-N.L-1
. 10
11
Palavras-chave: composto nitrogenado, estresse oxidativo, histologia, parâmetro 12
sanguíneo, recuperação, toxicidade 13
14

3
ABSTRACT 1
2
The flounder Paralichthys orbignyanus is a species with high potential for intensive 3
aquaculture, in which the accumulation of nitrogen compounds is one of the main limiting 4
factors to production. Ammonia and nitrite are the most toxic among these compounds, 5
being able to induce many physiological disturbances in fish, even when in sublethal levels. 6
Therefore, the present thesis aimed to determine the sublethal effects of exposure to 7
ammonia and nitrite and posterior recovery in juvenile flounder using blood and oxidative 8
stress parameters and histopathology as biomarkers. Two experiments were performed, in 9
which the fish were exposed to three concentrations of ammonia (0.12; 0.28 and 0.57 mg 10
NH3-N.L-1
) or nitrite (5.72; 10.43 and 15.27 mg NO2-N.L-1
), plus a control, during 10 days. 11
Then the animals were maintained for more 10 days in water with minimum concentrations 12
of ammonia and nitrite to evaluate the recovery. Blood, gills, liver, muscle and brain were 13
sampled from nine fish per treatment after 1, 5 and 10 days of exposure and at the end of 14
recovery. The results demonstrate that the effects attributed to the toxic action of ammonia 15
and nitrite in juvenile flounder were influenced by the exposure time and concentration. 16
However, even in the lowest concentrations tested for both compounds, there was 17
disturbance of the homeostasis of some of the parameters. The analysis of blood parameters 18
(glucose, Na+, K
+, Ca
++, HCO3
−, pCO2, pH, leukocyte profile) during the exposure to 19
ammonia and nitrite indicated different metabolic, osmoregulatory and acid-base 20
disturbances and immune responses of fish. Induction to a pro-oxidant condition in the 21
gills, liver and muscle was also demonstrated as one of the toxicity mechanisms of these 22
compounds to the species. The inhibition of the antioxidant system (reduction of total 23
antioxidant capacity and of the activity of the antioxidant enzyme glutathione-S-24
transferase) and/or increase of oxidative damage levels in lipids and proteins demonstrate 25
this effect. Furthermore, the activation of different enzymatic and non-enzymatic 26
antioxidant defenses was observed, indicating an adaptive mechanism to combat or 27
minimize the oxidative stress. Histopathological changes in the brain, liver and gills of fish 28
exposed to ammonia or nitrite were not evidenced. After the recovery period, only the fish 29
submitted to treatment 5.72 mg NO2-N.L-1
presented all blood and oxidative stress 30
parameters within the baseline values. For the other treatments of the nitrite experiment and 31

4
the fish exposed to ammonia, this restoration occurred only for some of the parameters. In 1
conclusion, concentrations from 0.12 mg NH3-N.L-1
and 5.72 mg NO2-N.L-1
cause several 2
physiological alterations in juvenile flounder, and should be avoided in production systems. 3
The period of recovery of 10 days was able to induce partial or total reestablishment of the 4
fish physiological condition, depending of the compound and concentration to which they 5
were exposed. Only fish exposed to 5.72 mg NO2-N.L-1
showed complete resumption of 6
normal physiological condition after recovery. 7
8
Keywords: blood parameter, histology, nitrogen compound, oxidative stress, recovery, 9
toxicity 10
11
5
1. INTRODUÇÃO 1
2
1.1. Aquicultura 3
4
Em um cenário global marcado pelo aumento populacional e uma crescente 5
competição por recursos naturais, a produção de alimento para a humanidade será um dos 6
maiores desafios para as próximas décadas. Diante deste panorama, a aquicultura tem 7
despontado como uma alternativa viável para o uso dos recursos naturais disponíveis para 8
produção de proteínas de alta qualidade, de modo econômico, social e ambientalmente 9
sustentável (Troell et al., 2014; FAO, 2016). 10
A aquicultura é o setor de produção de alimentos de origem animal que mais cresce 11
atualmente, o que se deve principalmente a um rápido aumento na demanda por pescado, 12
enquanto a produção pesqueira permanece praticamente constante. No ano de 2014, a 13
produção mundial de pescado foi de 167,2 milhões de toneladas, das quais 73,8 milhões de 14
toneladas (44,1 %) foram provenientes da aquicultura. O Brasil encontra-se na 14ª posição 15
no ranking dos países com maior produção aquícola no mundo, com uma produção total de 16
562,5 mil toneladas, sendo a piscicultura continental (474,3 mil toneladas) a principal 17
responsável por esta produção (FAO, 2016). 18
Por outro lado, a piscicultura marinha ainda é incipiente no país (FAO, 2016), 19
apesar do extenso litoral e de uma ictiofauna nativa rica em espécies com potencial para a 20
aquicultura, que conferem ao Brasil múltiplas possibilidades para o crescimento da 21
atividade. Nos últimos anos, a introdução do beijupirá Rachycentron canadum na 22
piscicultura marinha brasileira não só motivou pesquisas, como iniciativas no setor 23
produtivo, proporcionando ótimas perspectivas para o desenvolvimento da atividade e 24
mudança deste cenário (Sampaio et al., 2010). Entretanto, a carência de insumos (ração, 25
equipamentos, estruturas de produção) e serviços especializados (mão-de-obra, seguro 26
aquícola), e a ineficiência nas questões legais para cessão de águas públicas e licenciamento 27
ambiental ainda são os principais entraves para o crescimento da piscicultura marinha no 28
Brasil (Cavalli et al., 2011). Outro ponto chave necessário para impulsionar a atividade é o 29
desenvolvimento de pacotes tecnológicos adequados para a criação de outras espécies 30
6
nativas com potencial para aquicultura. O robalo-peva Centropomus parallelus, o peixe-rei 1
marinho Odontesthes argentinensis, a tainha Mugil liza e o linguado Paralichtys 2
orbignyanus são algumas dessas espécies (Baldisserotto & Gomes, 2010). 3
4
1.2. Linguado Paralichthys orbignyanus 5
6
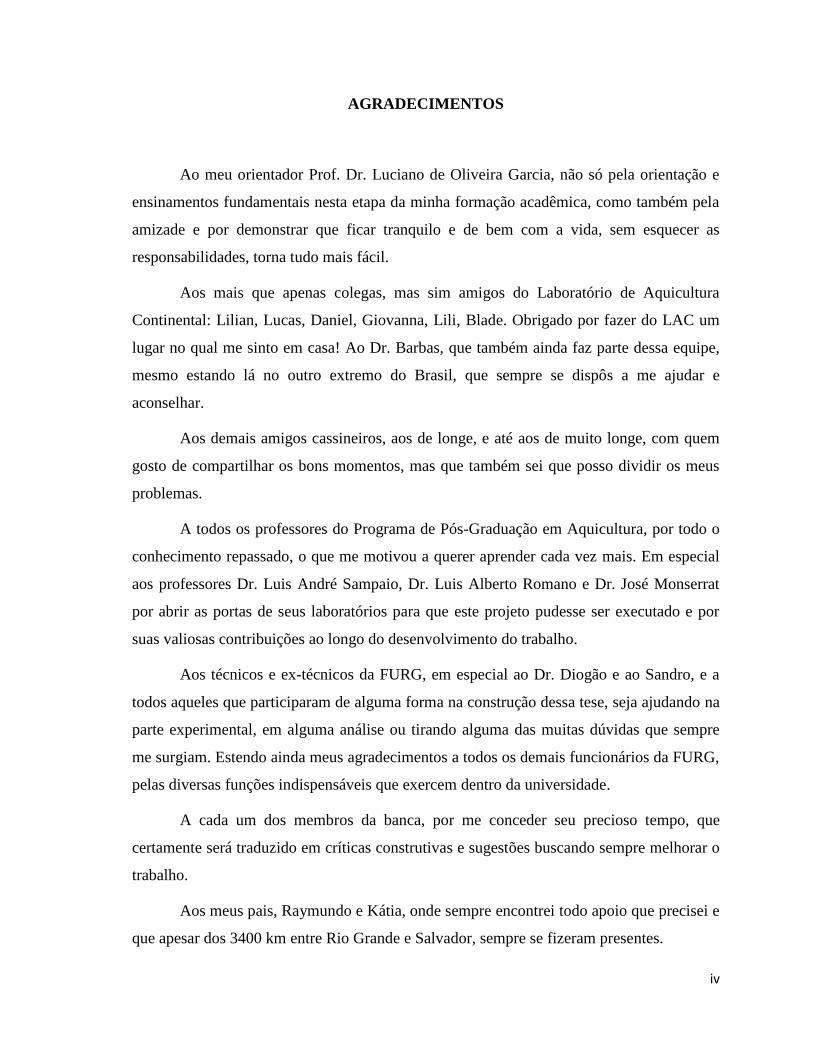
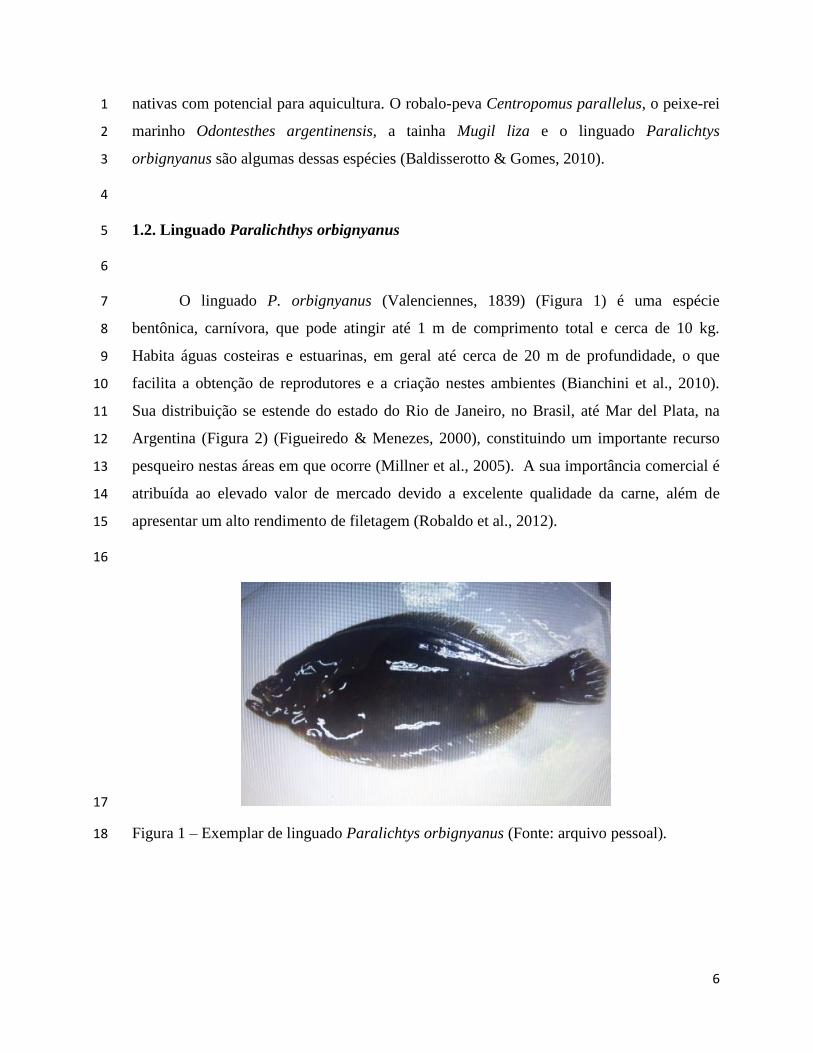
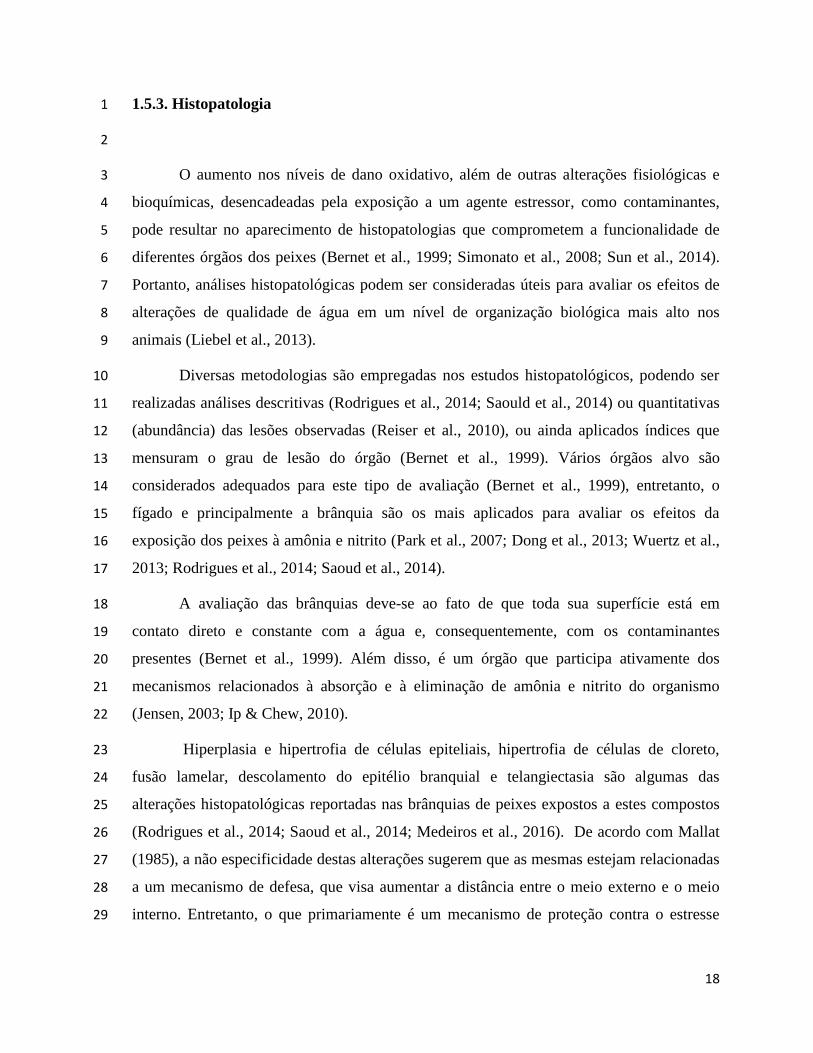
O linguado P. orbignyanus (Valenciennes, 1839) (Figura 1) é uma espécie 7
bentônica, carnívora, que pode atingir até 1 m de comprimento total e cerca de 10 kg. 8
Habita águas costeiras e estuarinas, em geral até cerca de 20 m de profundidade, o que 9
facilita a obtenção de reprodutores e a criação nestes ambientes (Bianchini et al., 2010). 10
Sua distribuição se estende do estado do Rio de Janeiro, no Brasil, até Mar del Plata, na 11
Argentina (Figura 2) (Figueiredo & Menezes, 2000), constituindo um importante recurso 12
pesqueiro nestas áreas em que ocorre (Millner et al., 2005). A sua importância comercial é 13
atribuída ao elevado valor de mercado devido a excelente qualidade da carne, além de 14
apresentar um alto rendimento de filetagem (Robaldo et al., 2012). 15
16
17
Figura 1 – Exemplar de linguado Paralichtys orbignyanus (Fonte: arquivo pessoal). 18

7
1
Figura 2 – Distribuição geográfica e probabilidade relativa de ocorrência do linguado 2
Paralichtys orbignyanus (Fonte: FishBase – www.fishbase.org). 3
4
Esta espécie apresenta uma ampla tolerância aos fatores ambientais, como pH 5
(Wasielesky et al. 1997), temperatura (Okamoto & Sampaio, 2012; Garcia et al. 2015), 6
salinidade (Sampaio & Bianchini, 2002) e compostos nitrogenados (Bianchini et al. 1996), 7
bem como a procedimentos de manejo, incluindo anestesia, transporte e captura (Bolasina 8
et al., 2011; Benovit et al., 2012). Além disso, sua desova e larvicultura têm sido realizadas 9
com sucesso em condições de laboratório, permitindo a produção de juvenis com altas 10
taxas de sobrevivência (Sampaio et al. 2007; 2008). 11
Em virtude das características citadas, o linguado é uma das espécies consideradas 12
promissoras para o desenvolvimento da piscicultura marinha no Brasil (Sampaio et al. 13
2007). Apesar da produção comercial ainda não ser uma realidade, a criação desta espécie 14
de forma intensiva, utilizando sistemas de recirculação de água (SRA) vem sendo realizado 15
em escala experimental no Laboratório de Piscicultura Estuarina e Marinha da FURG. 16
Entretanto, ainda há necessidade de mais estudos que proporcionem informações relevantes 17
para que o processo de criação do linguado se torne uma alternativa viável comercialmente 18
nestes sistemas. 19
20

8
1.3. Sistema de recirculação de água 1
2
A intensificação dos sistemas de produção na aquicultura é importante para permitir 3
o desenvolvimento sustentável da atividade, pois aumenta a produtividade e minimiza o uso 4
de espaço e água e a produção de efluentes (Klinger & Naylor, 2012). Entretanto, o 5
incremento da densidade de estocagem exige uma maior atenção ao monitoramento e 6
controle dos parâmetros de qualidade de água, evitando que os organismos sejam mantidos 7
em condições indesejáveis, que afetem o bem-estar e desempenho dos mesmos (Boyd & 8
Tucker, 2012). 9
Dentre os parâmetros de qualidade da água, um dos maiores limitantes para a 10
aquicultura intensiva, sobretudo em sistemas fechados com pequenas taxas de renovação de 11
água, é o acúmulo de compostos nitrogenados, que pode ocorre devido principalmente à 12
excreção dos animais e decomposição de matéria orgânica, tais como sobras de ração e 13
fezes (Ebeling & Timmons, 2012). 14
Apesar de o nitrogênio ser indispensável aos organismos, o problema associado ao 15
acúmulo deste nutriente no ambiente de cultivo está relacionado ao fato de que, alguns 16
compostos nitrogenados, em especial a amônia e nitrito apresentam elevada toxicidade para 17
os peixes (Randall & Tsui, 2002; Jensen, 2003). O uso do SRA (Figura 3a) é uma das 18
alternativas para se intensificar a produção, sem que estes compostos atinjam concentrações 19
indesejáveis. Nestes sistemas, a remoção da amônia e nitrito é assegurada pelo processo de 20
nitrificação que ocorre no biofiltro (Figura 3b). Este processo envolve duas etapas, nas 21
quais a amônia é oxidada a nitrito, e este por sua vez a nitrato, pela ação de bactérias como 22
por exemplo, as dos gêneros Nitrosomonas e Nitrobacter, de acordo com as reações: 23
Nitrosomonas: NH4+ + 1,5O2 → NO2
- + 2H
+ + H2O 24
Nitrobacter: NO2- + 0,5O2 → NO3
- 25
Como produto final da nitrificação, o nitrato tende a acumular em SRA (Ebeling & 26
Timmons, 2012), entretanto este composto é menos tóxico que a amônia e o nitrito para os 27
peixes, principalmente em água salgada, tornando-se um problema apenas em 28
concentrações extremamente elevadas (Baldisserotto, 2013). 29

9
1
2
Figura 3 – Sistemas de recirculação de água (a) com biofiltro (b) do Laboratório de 3
Piscicultura Estuarina e Marinha da FURG (Fonte: arquivo pessoal). 4
5
Apesar da comprovada eficiência do SRA no controle das concentrações de amônia 6
e nitrito, para que isto ocorra o sistema deve ser planejado e construído adequadamente. 7
Assim, deve-se levar em conta o tipo de cultivo a ser empregado (espécie, densidade de 8
estocagem, manejo alimentar, critérios de qualidade da água), de modo que o processo de 9
nitrificação seja eficiente (Ebeling & Timmons, 2012). Entretanto, em sistemas que não 10
apresentem um design adequado, que o biofiltro não esteja devidamente maturado, ou que a 11
ação das bactérias nitrificantes seja afetada negativamente por algum fator, estes compostos 12
nitrogenados podem atingir níveis tóxicos para os organismos cultivados. 13
14
1.4. Amônia e nitrito: definições e toxicidade 15
16
No ambiente aquático, a amônia existe em sob duas formas: a amônia não ionizada 17
(NH3) e a amônia ionizada ou íon amônio (NH4+). A soma de ambas as formas é 18
denominada de nitrogênio amoniacal total ou simplesmente amônia total (NAT), a qual 19
pode ser mensurada através de técnicas analíticas. A proporção relativa de cada uma das 20
formas depende da temperatura, salinidade e principalmente do pH da água. A fração NH3 21

10
aumenta com o aumento da temperatura e pH, e com a redução da salinidade (Boyd & 1
Tucker, 2012). 2
A toxicidade da amônia é usualmente descrita em termos das concentrações de NH3 3
(Boyd & Tucker, 2012), o que leva a interpretações equivocadas de que esta forma 4
realmente seja mais tóxica. O que acontece de fato é que a NH3 por sua natureza lipofílica 5
atravessa facilmente as membranas branquiais por difusão (Ip & Chew, 2010), e elevadas 6
concentrações de NH3 também comprometem a excreção, favorecendo o acúmulo de 7
amônia nos tecidos dos peixes. A excreção da NH3 por difusão ocorre pela via transcelular 8
através das glicoproteínas Rhesus (Rhbg e Rhcg) devido ao gradiente sangue-água 9
favorável, o qual pode ser reduzido ou invertido quando a concentração de NH3 no 10
ambiente é alta. Além disso, em espécies de água doce e algumas adaptadas a água salgada, 11
a amônia também pode ser eliminada através das células de cloreto, onde é dependente ou 12
facilitada pela excreção de H+ pela V-ATPase e/ou pelo antiporte Na
+/H
+ (Baldisserotto, 13
2013). O mecanismo primário de toxicidade da amônia nos peixes está relacionado ao 14
efeito despolarizante do íon NH4+ nos neurônios e músculo branco, o que leva a uma 15
ativação excessiva de receptores glutamatérgicos do tipo NMDA (N-metil D-Aspartato). 16
Esta ativação excessiva ocasiona a depleção de ATP e um aumento na concentração 17
intracelular de Ca2+
ativando enzimas Ca2+
-dependentes que desencadeiam uma série de 18
reações que levam a morte celular (Randall & Tsui, 2002). 19
Assim como a amônia, o nitrito também está presente em duas formas na água: 20
ácido nítrico (HNO2) e nitrito ionizado (NO2-), e o equilíbrio entre as duas formas depende 21
do pH. Porém, em valores de pH da água acima de 5,5 apenas o NO2- está presente, 22
portanto esta é a forma a ser considerada quando se fala em termos de toxicidade do nitrito 23
nos sistemas de produção aquícola (Baldisserotto, 2013). 24
Em peixes de água doce, o nitrito é absorvido do ambiente através das brânquias, 25
via antiporte Cl-/HCO3
-, competindo com o Cl
- (Jensen, 2003). Por conta desta competição 26
entre o Cl- e o nitrito pelo mesmo transportador, salinidades elevadas podem reduzir a 27
toxicidade deste composto para os peixes (Wuertz et al., 2013). Entretanto, como a 28
permeabilidade do epitélio branquial de peixes marinhos é relativamente alta, a entrada de 29
nitrito pode ocorrer por difusão a favor do gradiente eletroquímico (Jensen, 2003; 30
Baldisserotto, 2013). Outra importante via de absorção do nitrito também ocorre em peixes 31
11
marinhos ou adaptados a água do mar. Por serem hiposmóticos em relação ao meio, 1
precisam beber água para compensar a perda por osmose, e o nitrito é absorvido 2
principalmente no intestino, também em substituição ao Cl- nos simportes Na
+/K
+/2Cl
- e 3
Na+/Cl
- (Grossel & Jensen, 2000). 4
O nitrito que é absorvido durante a exposição tende a se acumular inicialmente no 5
plasma (Hvas et al., 2016) e, posteriormente, se difunde para os eritrócitos, onde oxida o 6
Fe2+
da hemoglobina a Fe3+
, formando a metahemoglobina que não é capaz de transportar 7
oxigênio, ocasionando uma hipóxia funcional nos peixes (Jensen, 2003). 8
Além dos mecanismos de toxicidade primários descritos, a exposição à amônia e 9
nitrito pode induzir uma ampla variedade de alterações fisiológicas (Baldisserotto et al., 10
2014; Jia et al., 2015), morfológicas (Saoud et al., 2014; Rodrigues et al., 2014) e até 11
comportamentais (Schram et al., 2010; Roques et al., 2015) nos peixes. Os efeitos tóxicos 12
de ambos os compostos são espécie-específicos e dependem da concentração e duração da 13
exposição (Kroupova et al., 2005; USEPA, 2013), podendo em casos extremos levar até a 14
morte dos animais (Medeiros et al., 2016; Pinto et al., 2016). 15
Entretanto, na aquicultura, a exposição a concentrações subletais pode ser um 16
problema grave, pois muitas vezes seus efeitos não são detectáveis através da simples 17
observação dos animais e de seu comportamento pelo produtor. Porém, o estresse causado 18
nos peixes pode levar a uma redução no desempenho zootécnico (Paust et al., 2011; Ciji et 19
al., 2014), ao comprometimento imunológico aumentando a susceptibilidade a doenças 20
(Chen et al., 2011; Jia et al., 2016), e até a perda de qualidade do produto final (Veeck et 21
al., 2013). 22
23
1.5. Estresse 24
25
Iwama et al. (2011) apontam que existe uma dificuldade em se estabelecer uma 26
definição universal de estresse, diante da grande diversidade de definições já propostas até 27
então por diferentes autores. Nesta tese, o termo estresse será aplicado para caracterizar um 28
estado desencadeado por um agente estressor, no qual a homeostase ou condição biológica 29
basal foi alterada (Barton & Iwama, 1991). Este desbalanço da homeostase pode resultar de 30
12
algum efeito direto desencadeado pelo estressor, como por exemplo, a formação de 1
metahemoglobina induzida pela exposição ao nitrito. Além disso, o estresse pode estar 2
relacionado a uma resposta adaptativa ou compensatória inespecífica, desencadeada pela 3
ativação do sistema nervoso simpático. Este ajuste fisiológico permite aos organismos uma 4
maior chance de sobrevivência diante de uma condição desfavorável, e pode ou não ser 5
prejudicial dependendo da severidade e duração (Bonga, 1997; Barton, 2002). 6
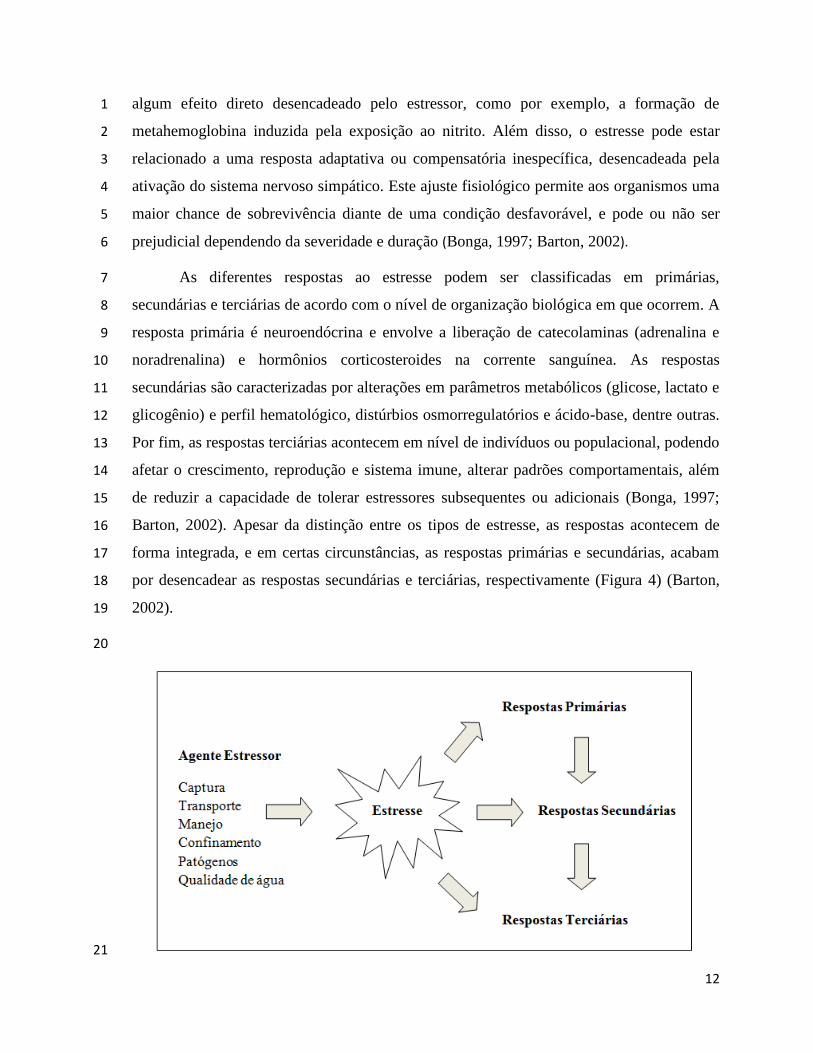
As diferentes respostas ao estresse podem ser classificadas em primárias, 7
secundárias e terciárias de acordo com o nível de organização biológica em que ocorrem. A 8
resposta primária é neuroendócrina e envolve a liberação de catecolaminas (adrenalina e 9
noradrenalina) e hormônios corticosteroides na corrente sanguínea. As respostas 10
secundárias são caracterizadas por alterações em parâmetros metabólicos (glicose, lactato e 11
glicogênio) e perfil hematológico, distúrbios osmorregulatórios e ácido-base, dentre outras. 12
Por fim, as respostas terciárias acontecem em nível de indivíduos ou populacional, podendo 13
afetar o crescimento, reprodução e sistema imune, alterar padrões comportamentais, além 14
de reduzir a capacidade de tolerar estressores subsequentes ou adicionais (Bonga, 1997; 15
Barton, 2002). Apesar da distinção entre os tipos de estresse, as respostas acontecem de 16
forma integrada, e em certas circunstâncias, as respostas primárias e secundárias, acabam 17
por desencadear as respostas secundárias e terciárias, respectivamente (Figura 4) (Barton, 18
2002). 19
20
21
13
Figura 4 – Respostas (primárias, secundárias e terciárias) de estresse frente a um agente 1
estressor e as possíveis relações entre os diferentes tipos de resposta (Fonte: Adaptado de 2
Barton, 2002). 3
Considerando que o estresse relacionado a níveis elevados de amônia e nitrito nos 4
sistema de produção é um risco em potencial, sobretudo na aquicultura intensiva, 5
reconhecer as respostas biológicas envolvidas e os limites de tolerância do organismo 6
cultivado é fundamental para estabelecer uma estratégia de manejo adequada, assegurando 7
o bem-estar animal e a produção (Conte, 2004; Iwama et al., 2011). Neste sentido, a 8
avaliação de respostas primárias e/ou secundárias de estresse é fundamental, pois fornece 9
um diagnóstico precoce acerca dos efeitos tóxicos decorrentes da exposição a níveis 10
indesejáveis destes compostos. Desta forma, o monitoramento de parâmetros que 11
mensurem estas respostas deve ser uma prática rotineira na aquicultura, a fim de permitir a 12
tomada das medidas corretivas necessárias (Satheeshkumar et al., 2012), evitando outros 13
efeitos de longo prazo como a redução no desempenho zootécnico dos animais. 14
Diversos biomarcadores tem sido aplicados na avaliação do estresse desencadeado 15
pela amônia ou nitrito nos peixes, dentro os quais se pode citar: os parâmetros sanguíneos 16
(Clifford et al., 2015; Hvas et al., 2016) e de estresse oxidativo (Jia et al., 2015; Li et al., 17
2016) e análises histopatológicas (Wuertz et al., 2013; Banihashemi et al., 2016). Vale 18
ressaltar que, quando viável, a utilização de múltiplos biomarcadores é recomendada, pois 19
permite uma compreensão mais ampla e integrada dos efeitos tóxicos destes compostos. 20
21
1.5.1. Parâmetros sanguíneos 22
23
O perfil hematológico e de outros parâmetros bioquímicos e fisiológicos do sangue 24
dos peixes está intimamente relacionado com as respostas fisiológicas frente a fatores 25
ambientais (Roche & Bogé, 1996; Clauss et al., 2008). Alterações nas características 26
sanguíneas estão entre as primeiras respostas observadas nos peixes submetidos a situações 27
de estresse e podem refletir o comprometimento de diversas funções biológicas (trocas 28
gasosas, manutenção do equilíbrio iônico e ácido-base, eliminação de resíduos metabólitos, 29
dentre outras) nas quais o sangue está envolvido (Heath, 1995). Além disso, a coleta de 30

14
sangue (Figura 5) dos animais é um procedimento não letal e as análises de modo geral, 1
fornecem resultados rápidos (Satheeshkumar et al., 2012). Devido a estas vantagens, o 2
monitoramento dos parâmetros sanguíneos é uma ferramenta que vem sendo amplamente 3
utilizada na avaliação do estado de saúde e bem estar dos animais (Satheeshkumar et al., 4
2012; Segner et al., 2012; Dal’Bó et al., 2015). 5
6
7
Figura 5 – Coleta de sangue via veia caudal em juvenil de Paralichtys orbignyanus (Fonte: 8
arquivo pessoal). 9
10
Diante das diferentes alterações fisiológicas decorrentes do estresse, uma grande 11
diversidade de parâmetros sanguíneos pode ser utilizada para identificar esta condição nos 12
peixes (Segner et al., 2012; Dal’Bó et al., 2015). Todavia, a escolha dos parâmetros 13
adequados para esta avaliação é fundamental e deve ser feita de acordo com o estressor, 14
sobre o qual os efeitos querem ser investigados. Dentre as alterações fisiológicas resultantes 15
do estresse ocasionado pela exposição a níveis indesejáveis de amônia e nitrito, incluem-se 16
distúrbios respiratórios, iônicos, ácido-base, metabólicos e imunológicos. Como 17
consequência destes distúrbios, concentrações plasmáticas de glicose e íons (Na+, K
+, Ca
2+ 18
e HCO3−), pressão parcial de gases (pO2 e pCO2), pH e o perfil leucocitário estão entre os 19
parâmetros sanguíneos que podem ter a homeostase afetada, demonstrando a aplicabilidade 20
dos mesmos como biomarcadores na avaliação dos efeitos tóxicos destes compostos 21

15
(Vosyliene & Kazlauskiene, 2004; Wood & Nawata, 2011; Saoud et al., 2014; Clifford et 1
al., 2015; Jia et al., 2015; Hvas et al., 2016). 2
3
1.5.2. Estresse oxidativo 4
5
Durante o processo de produção de energia por via aeróbica, a redução tetravalente 6
do oxigênio molecular (O2) na mitocôndria resulta na formação de água. Entretanto, mesmo 7
em condições fisiológicas normais dos organismos, em torno de 1 a 3% do oxigênio 8
metabolizado nos diversos processos endógenos é apenas parcialmente reduzido, formando 9
as espécies reativas de oxigênio (ERO) (Livingstone, 2003), tais como os radicais 10
superóxido (O2-) e hidroxila (OH
-) e o peróxido de hidrogênio (H2O2). Esta produção de 11
radicais livres dá origem ao termo ―Paradoxo do Oxigênio‖, pois apesar de essencial para a 12
vida dos organismos aeróbios, o oxigênio também pode ter efeitos prejudiciais inerentes ao 13
seu metabolismo (Davies, 2016). Os efeitos deletérios das ERO estão relacionados à 14
capacidade que possuem de oxidar e danificar biomoléculas, como proteínas, lipídeos, 15
DNA e RNA, prejudicando ou levando a perda de suas funções biológicas (Halliwell & 16
Gutteridge, 2015). 17
Os peixes, como todos os organismos aeróbios, desenvolveram evolutivamente um 18
complexo sistema antioxidante composto de diversas defesas não enzimáticas e enzimáticas 19
que atuam impedindo a formação e ação das ERO’s, ou favorecendo o reparo e a 20
reconstituição de moléculas que sofreram dano oxidativo (Halliwell & Gutteridge, 2015). 21
Os antioxidantes não enzimáticos são representados por moléculas de baixo peso 22
molecular, como o tripeptídeo glutationa (GSH), as metalotioneínas (MTs), o ácido 23
ascórbico (vitamina C), o β-caroteno e o α-tocoferol, precursores das vitaminas A e E, 24
respectivamente, os carotenóides, os flavonóides, além de minerais como o zinco, o cobre, 25
o selênio e o magnésio. 26
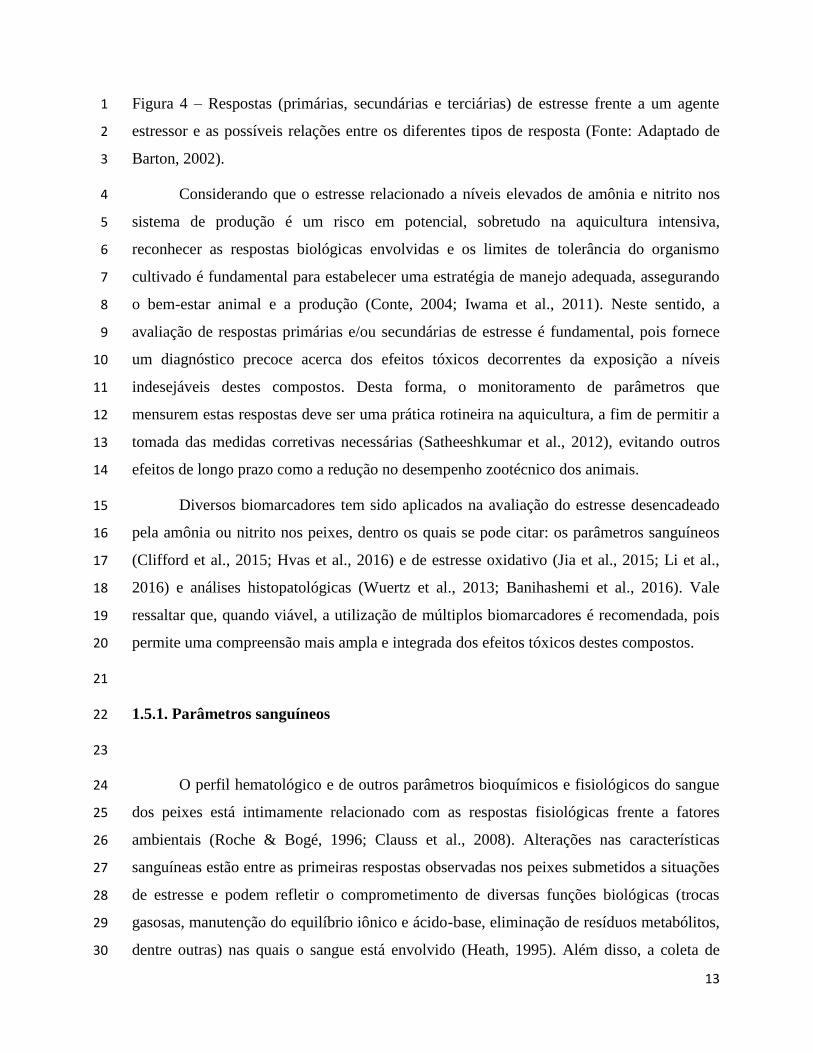
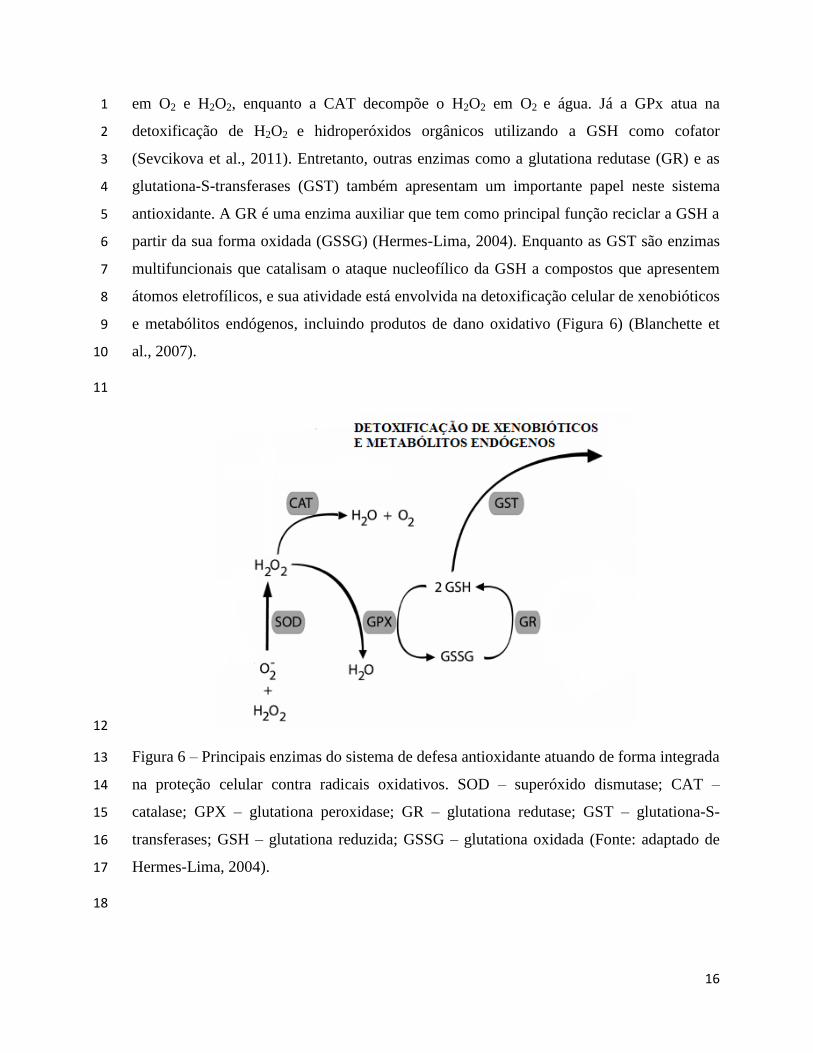
Entre as principais enzimas envolvidas no sistema antioxidante temos a superóxido 27
dismutase (SOD), a catalase (CAT) e a glutationa peroxidase (GPx), as quais são 28
consideradas a primeira linha de defesa celular, devido a sua atuação direta na conversão 29
em formas menos reativas ou na eliminação das ERO. A SOD catalisa a dismutação do O2- 30
16
em O2 e H2O2, enquanto a CAT decompõe o H2O2 em O2 e água. Já a GPx atua na 1
detoxificação de H2O2 e hidroperóxidos orgânicos utilizando a GSH como cofator 2
(Sevcikova et al., 2011). Entretanto, outras enzimas como a glutationa redutase (GR) e as 3
glutationa-S-transferases (GST) também apresentam um importante papel neste sistema 4
antioxidante. A GR é uma enzima auxiliar que tem como principal função reciclar a GSH a 5
partir da sua forma oxidada (GSSG) (Hermes-Lima, 2004). Enquanto as GST são enzimas 6
multifuncionais que catalisam o ataque nucleofílico da GSH a compostos que apresentem 7
átomos eletrofílicos, e sua atividade está envolvida na detoxificação celular de xenobióticos 8
e metabólitos endógenos, incluindo produtos de dano oxidativo (Figura 6) (Blanchette et 9
al., 2007). 10
11
12
Figura 6 – Principais enzimas do sistema de defesa antioxidante atuando de forma integrada 13
na proteção celular contra radicais oxidativos. SOD – superóxido dismutase; CAT – 14
catalase; GPX – glutationa peroxidase; GR – glutationa redutase; GST – glutationa-S-15
transferases; GSH – glutationa reduzida; GSSG – glutationa oxidada (Fonte: adaptado de 16
Hermes-Lima, 2004). 17
18

17
A atuação destas defesas antioxidantes e dos pró-oxidantes no organismo dos 1
animais apresenta um equilíbrio em condições normais. Entretanto, em resposta a agentes 2
estressores, incluindo alterações em variáveis ambientais ou durante a exposição a 3
poluentes, pode haver a perturbação deste equilíbrio (Lushchak, 2011; Stoliar & Lushchak, 4
2012). O estresse oxidativo pode ser definido como aumento transitório ou crônico na 5
concentração de ERO, quando este desequilíbrio acontece em favor dos pró-oxidantes, 6
resultando em aumento nos níveis de dano oxidativo (Lushchak, 2011; Halliwell & 7
Gutteridge, 2015). 8
Apesar de ser um tema ainda relativamente pouco estudado, trabalhos recentes tem 9
demonstrado que a exposição à amônia ou ao nitrito pode induzir a um aumento na 10
produção de radicais livres, incluindo ERO e espécies reativas de nitrogênio (ERN), nos 11
tecidos de peixes (Sinha et al., 2014; Cheng et al., 2015; Jensen et al., 2015). A produção 12
excessiva destes agentes oxidantes leva a ativação de fatores de transcrição redox-sensível 13
(FoxO, Nrf2, p53, HIF-1α, NF-κB, etc.) e a modificação covalente de proteínas 14
antioxidantes, resultando no aumento da expressão e atividade de enzimas antioxidantes 15
(Hermes-Lima et al., 2015). Este tipo de mecanismo adaptativo para minimizar o estresse 16
oxidativo já foi demonstrado para enzimas como a SOD, CAT, GPx, GST, dentre outras, 17
durante a exposição de peixes à amônia (Sinha et al., 2014; Li et al., 2016) e ao nitrito (Ciji 18
et al., 2012; Sun et al., 2014). Entretanto, em certas condições de estresse mais severas, 19
como a exposição prolongada ou a concentrações mais altas destes compostos, pode haver 20
falha do sistema de defesa antioxidante, resultando, por exemplo, em redução da atividade 21
de enzimas e concentrações de GSH (Jia et al., 2015; Li et al., 2016). 22
Diante da capacidade que a amônia e o nitrito apresentam de elevar a produção de 23
agentes oxidantes e de diminuir a eficácia do sistema antioxidante, o aumento nos níveis de 24
dano oxidativo é esperado, e já foi demonstrado em lipídeos, proteínas e até DNA nos 25
tecidos de peixes (Sinha et al., 2014; Sun et al., 2014; Cheng et al., 2015; Jia et al., 2015; Li 26
et al., 2016; Lisser et al., 2017). Esta condição, além de comprometer as funções 27
fisiológicas dos animais (Livingstone, 2003; Valavanidis et al., 2006), pode também causar 28
alterações na qualidade da carne (Zhang et al., 2016), afetando negativamente a aquicultura. 29
30
18
1.5.3. Histopatologia 1
2
O aumento nos níveis de dano oxidativo, além de outras alterações fisiológicas e 3
bioquímicas, desencadeadas pela exposição a um agente estressor, como contaminantes, 4
pode resultar no aparecimento de histopatologias que comprometem a funcionalidade de 5
diferentes órgãos dos peixes (Bernet et al., 1999; Simonato et al., 2008; Sun et al., 2014). 6
Portanto, análises histopatológicas podem ser consideradas úteis para avaliar os efeitos de 7
alterações de qualidade de água em um nível de organização biológica mais alto nos 8
animais (Liebel et al., 2013). 9
Diversas metodologias são empregadas nos estudos histopatológicos, podendo ser 10
realizadas análises descritivas (Rodrigues et al., 2014; Saould et al., 2014) ou quantitativas 11
(abundância) das lesões observadas (Reiser et al., 2010), ou ainda aplicados índices que 12
mensuram o grau de lesão do órgão (Bernet et al., 1999). Vários órgãos alvo são 13
considerados adequados para este tipo de avaliação (Bernet et al., 1999), entretanto, o 14
fígado e principalmente a brânquia são os mais aplicados para avaliar os efeitos da 15
exposição dos peixes à amônia e nitrito (Park et al., 2007; Dong et al., 2013; Wuertz et al., 16
2013; Rodrigues et al., 2014; Saoud et al., 2014). 17
A avaliação das brânquias deve-se ao fato de que toda sua superfície está em 18
contato direto e constante com a água e, consequentemente, com os contaminantes 19
presentes (Bernet et al., 1999). Além disso, é um órgão que participa ativamente dos 20
mecanismos relacionados à absorção e à eliminação de amônia e nitrito do organismo 21
(Jensen, 2003; Ip & Chew, 2010). 22
Hiperplasia e hipertrofia de células epiteliais, hipertrofia de células de cloreto, 23
fusão lamelar, descolamento do epitélio branquial e telangiectasia são algumas das 24
alterações histopatológicas reportadas nas brânquias de peixes expostos a estes compostos 25
(Rodrigues et al., 2014; Saoud et al., 2014; Medeiros et al., 2016). De acordo com Mallat 26
(1985), a não especificidade destas alterações sugerem que as mesmas estejam relacionadas 27
a um mecanismo de defesa, que visa aumentar a distância entre o meio externo e o meio 28
interno. Entretanto, o que primariamente é um mecanismo de proteção contra o estresse 29
19
ambiental, pode acabar se tornando prejudicial para o organismo, dificultando trocas 1
gasosas, excreção e processos osmorregulatórios. 2
O fígado apresenta funções metabólicas vitais, sendo o principal órgão envolvido 3
nos processos de biotransformação e detoxificação de xenobióticos, e a presença de 4
contaminantes rapidamente induz alterações estruturais, bioquímicas e moleculares, que 5
podem resultar em lesões neste tecido dos peixes (Bernet et al.,1999). Dilatação sinusoidal, 6
degeneração hidrópica, deposição lipídica nos hepatócitos, desintegração de hepatócitos e 7
necrose são alguns dos exemplos de lesões hepáticas relacionadas à toxicidade da amônia 8
ou do nitrito (Benli et al., 2008; Rodrigues et al., 2014; Thangam, 2014). 9
Rodrigues et al. (2014) demonstraram pela primeira vez que alterações 10
histopatológicas como a proliferação de células de glia e espaço de Virchow-Robin 11
indicando satelitose e edema perisvascular severo, respectivamente, também podem ocorrer 12
no cérebro de peixes relacionadas ao potencial neurotóxico da amônia. Entretanto, com 13
relação ao nitrito, não foram encontrados na literatura trabalhos que demonstrem o 14
aparecimento de lesões no cérebro de peixes associadas aos feitos tóxicos deste composto. 15
16
1.6. Recuperação 17
18
Mesmo durante a exposição à amônia ou ao nitrito, os peixes são capazes de realizar 19
ajustes fisiológicos adaptativos que podem restabelecer a homeostase de certos parâmetros, 20
os quais acabam apenas sendo alterados transitoriamente (Martinez & Souza, 2002; Sinha 21
et al., 2012). Em certas condições, entretanto, é necessário que o agente estressor seja 22
eliminado para que o animal consiga restabelecer a sua condição fisiológica normal. Esta 23
informação é corroborada por trabalhos prévios que demonstram que a transferência para 24
água com concentração mínima ou livre de amônia e nitrito é suficiente para a recuperação 25
dos animais (Knudsen & Jensen, 1997; Gisbert et al., 2004; Yang et al., 2010). 26
Esta recuperação esta relacionada à capacidade que os peixes naturalmente possuem 27
em eliminar o excesso desses compostos dos organismos, a qual durante a exposição acaba 28
se tornando comprometida ou insuficiente (Jensen, 2003; Clifford et al., 2015). Uma vez 29
que são transferidos para uma água com boa qualidade, ocorre gradualmente a 30

20
detoxificação do excesso de amônia e nitrito que se acumularam no plasma e tecidos dos 1
peixes (Knudsen & Jensen, 1997; Gisbert et al., 2004; Clifford et al., 2015), e as alterações 2
fisiológicas decorrentes de seus efeitos tóxicos tendem a diminuir ou desaparecer com o 3
tempo. Este tempo necessário para o restabelecimento da homeostase pode variar desde 4
horas (Gisbert et al., 2004) até alguns dias (3-15), dependendo da espécie, do composto ao 5
qual o peixe foi exposto e do parâmetro avaliado (Knudsen & Jensen, 1997; Gisbert et al., 6
2004;Yang et al., 2010). 7
Na aquicultura, o período de recuperação é fundamental após qualquer evento ou 8
procedimento de manejo que atue como um estressor para os peixes, visando minimizar os 9
efeitos de um estresse subsequente (Wedemeyer, 2012), e até a perda da qualidade do 10
produto final, devido a uma condição estressante pré-abate (Terlouw et al., 2008; Veeck et 11
al., 2013). Apesar da importância, as respostas fisiológicas durante a recuperação pós-12
exposição à amônia e nitrito ainda são relativamente pouco estudadas nos peixes e uma 13
maior atenção deve ser dada neste sentido. 14
15
1.7. Toxicidade da amônia e nitrito no Paralichthys orbignyanus 16
17
Atualmente, o conhecimento acerca dos efeitos tóxicos da amônia e do nitrito para o 18
linguado é limitado apenas à determinação das concentrações letais (CL50-96h) em duas 19
condições experimentais de salinidade e temperatura: ―condição de inverno‖ (0 ‰ e 12°C) 20
e ―condição de verão‖ (30 ‰ e 25°C). Os valores obtidos para a CL50-96h foram maiores na 21
"condição de verão" (0,67 mg NH3-N.L-1
e 30,57 mg NO2-N.L-1
) do que na "condição de 22
inverno"( 0,19 mg NH3-N.L-1
e 24,01 mg NO2-N.L-1
) para ambos os compostos (Bianchini 23
et al., 1996). Estes resultados demonstram a influência de outros parâmetros ambientais na 24
toxicidade da amônia e nitrito, e que, principalmente em água salgada e temperaturas 25
elevadas, o linguado apresenta uma boa tolerância a estes compostos. 26
Entretanto, não existem trabalhos que demonstrem os efeitos do estresse ocasionado 27
pela exposição do linguado a concentrações subletais destes compostos, as quais podem ser 28
um fator limitante para sua produção em sistemas intensivos, incluindo SRA. A avaliação 29
da recuperação dos animais em água com boa qualidade (concentrações mínimas ou livre 30
21
de amônia não-ionizada e nitrito) após um período de exposição também ainda não foi 1
estudada para a espécie. Desta forma, as informações obtidas na presente tese poderão 2
contribuir para a compreensão dos mecanismos de toxicidade da amônia e nitrito no 3
linguado, bem como das respostas fisiológicas da espécie frente a níveis indesejáveis dos 4
mesmos e durante a recuperação. Na perspectiva da aquicultura, os dados gerados irão 5
auxiliar no estabelecimento de critérios de qualidade de água nos sistemas de produção, 6
bem como no desenvolvimento de estratégias de manejo adequadas. Além disso, as 7
respostas dos diferentes biomarcadores avaliados servirão como referência, quando da 8
aplicação dos mesmos, para monitorar o estado fisiológico e bem estar dos animais e 9
relacioná-los com as concentrações de amônia e nitrito na água. 10
11
2. OBJETIVOS 12
13
2.1. Objetivo geral 14
15
- Avaliar os efeitos subletais da exposição à amônia e nitrito, e posterior 16
recuperação em juvenis do linguado Paralichthys orbignyanus utilizando parâmetros 17
sanguíneos, de estresse oxidativo e análises histopatológicas como biomarcadores. 18
19
2.2. Objetivos específicos 20
21
- Determinar as alterações nos parâmetros sanguíneos (glicose, Na+, K
+, Ca
2+, 22
HCO3−, pO2, pCO2, pH e contagem diferencial de leucócitos) ocasionadas pela exposição 23
dos juvenis de linguado a diferentes concentrações subletais de amônia e nitrito; 24
- Avaliar os efeitos da exposição a concentrações subletais de amônia e nitrito no 25
sistema de defesa antioxidante e nos níveis de dano oxidativo no fígado, no músculo e nas 26
brânquias em juvenis de linguado; 27

22
- Verificar se ocorrem alterações histopatológicas no fígado, brânquias e cérebro de 1
juvenis de linguado submetidos a concentrações subletais de amônia e nitrito; 2
- Avaliar se a recuperação em água livre ou com concentrações mínimas de amônia 3
e nitrito é suficiente para o restabelecimento da condição fisiológica normal dos juvenis de 4
linguado após a exposição a diferentes concentrações destes compostos. 5
6
3. HIPÓTESES 7
8
- Concentrações subletais de amônia e nitrito são agentes estressores para os juvenis 9
de linguado, o que resulta em alterações nos parâmetros sanguíneos, induz o estresse 10
oxidativo e o aparecimento de histopatologias; 11
- As alterações nos parâmetros sanguíneos, de estresse oxidativo e histopatológicas 12
decorrentes da exposição de juvenis de linguado à amônia ou ao nitrito dependem do tempo 13
de exposição e concentração; 14
- A recuperação em água livre ou com concentrações mínimas de amônia e nitrito é 15
capaz de reverter as alterações fisiológicas ocasionadas pela exposição a estes compostos 16
nos juvenis de linguado; 17
- A recuperação dos juvenis de linguado é dependente da concentração de amônia 18
ou nitrito a qual foram expostos. 19
20
4. REFERÊNCIAS BIBLIOGRÁFICAS 21
22
Baldisserotto, B., 2013. Fisiologia de peixes aplicada à piscicultura, terceira ed. Editora da 23
UFSM, Santa Maria. 24
Baldisserotto, B., Gomes, L.C., 2010. Espécies nativas para a piscicultura no Brasil, 25
segunda ed. Editora da UFSM, Santa Maria. 26
Baldisserotto, B., Martos-Sitcha, J.A., Menezes, C.C., Toni, C., Prati, R.L., Garcia, L.O., 27
Salbegoa, J., Mancera, J.M., Martínez-Rodríguez, G., 2014. The effects of ammonia and 28

23
water hardness on the hormonal, osmoregulatory and metabolic responses of the freshwater 1
silver catfish Rhamdia quelen. Aquat. Toxicol. 152, 341-352. 2
Banihashemi, E.S., Khara, H., Pajand, Z., Rahnandeh, M., 2016. Histopathological study of 3
gill, kidney and liver of Persian Sturgeon (Acipenser persicus Borodin, 1897) and Stellate 4
(Acipenser stellatus Pallas, 1811) exposed to sublethal concentration of un-ionised 5
ammonia UAN. J. Parasit. Dis. 40, 1443-1450. 6
Barton, B.A., Iwama, G.K., 1991. Physiological changes in fish from stress in aquaculture 7
with emphasis on the response and effects of corticosteroids. Annu. Rev. Fish Dis. 1, 3-26. 8
Barton, B.A., 2002. Stress in fishes: a diversity of responses with particular reference to 9
changes in circulating corticosteroids. Integr. Comp. Biol. 42, 517-525. 10
Benli, A.Ç.K., Köksal, G., Özkul, A., 2008. Sublethal ammonia exposure of Nile tilapia 11
(Oreochromis niloticus L.): effects on gill, liver and kidney histology. Chemosphere 72, 12
1355-1358. 13
Benovit, S.C., Gressler, L.T., Silva, L.L., Garcia, L.O., Okamoto, M.H., Pedron, J.S., 14
Sampaio, L.A., Rodrigues, R.V., Heinzmann, B.M., Baldisserotto, B., 2012. Anesthesia and 15
transport of Brazilian flounder, Paralichthys orbignyanus, with essential oils of Aloysia 16
gratissima and Ocimum gratissimum. J. World. Aquac. Soc. 43, 896-900. 17
Bernet, D., Schmidt, H., Meier, W., Burkhardt‐Holm, P., Wahli, T., 1999. Histopathology 18
in fish: proposal for a protocol to assess aquatic pollution. J. Fish Dis. 22, 25-34. 19
Bianchini, A., Wasielesky, Jr, W., Miranda Filho, K.C., 1996. Toxicity of nitrogenous 20
compounds to juveniles of flatfish Paralichthys orbignyanus. Bull. Environ. Contam. 21
Toxicol. 56, 453-459. 22
Bianchini, A., Robaldo, R.B., Sampaio, L.A., 2010. Cultivo do linguado (Paralichthys 23
orbignyanus), in: Baldisserotto, B., Gomes, L. C. (Eds.), Espécies nativas para piscicultura 24
no Brasil, segunda ed. Editora UFSM, Santa Maria, pp. 559-587. 25
Blanchette, B., Feng, X., Singh, B.R., 2007. Marine glutathione S-transferases. Mar. 26
Biotechnol., 9, 513-542. 27
Bolasina, S.N., 2011. Stress response of juvenile flounder (Paralichthys orbignyanus, 28
Valenciennes 1839), to acute and chronic stressors. Aquaculture 313, 140-143. 29

24
Bonga, S.W., 1997. The stress response in fish. Physiol. Rev. 77, 591-625. 1
Boyd, C.E., Tucker, C.S., 2012. Pond aquaculture water quality management. Springer 2
Science & Business Media, Nova Iorque. 3
Cavalli, R.O., Domingues, E.C., Hamilton, S., 2011. Desenvolvimento da produção de 4
peixes em mar aberto no Brasil: possibilidades e desafios. R. Bras. Zootec. 40, 155-164. 5
Chen, J.Z., Zhang, X.L., Hu, G.D., Qu, J.H., Fan, L.M., Song, C., 2011. The immune 6
response of GIFT Oreochromis niloticus and its susceptibility to Streptococcus iniae under 7
stress in different ammonia. J. Ecol. Environ. Sci. 20, 629-634. 8
Cheng, C.H., Yang, F.F., Ling, R.Z., Liao, S.A., Miao, Y.T., Ye, C.X., Wang, A.L., 2015. 9
Effects of ammonia exposure on apoptosis, oxidative stress and immune response in 10
pufferfish (Takifugu obscurus). Aquat. Toxicol. 164, 61-71. 11
Ciji, A., Sahu, N.P., Pal, A.K., Dasgupta, S., Akhtar, M.S., 2012. Alterations in serum 12
electrolytes, antioxidative enzymes and haematological parameters of Labeo rohita on 13
short-term exposure to sublethal dose of nitrite. Fish Physiol. Biochem. 38, 1355-1365. 14
Ciji, A., Sahu, N.P., Pal, A.K., Akhtar, M.S., Tincy, V., Mishal, P., Das, P., 2014. Effect of 15
dietary vitamin E and nitrite exposure on growth and metabolic variables of Labeo rohita 16
juveniles. Natl. Acad. Sci. Lett. 37, 123-129. 17
Clauss, T.M., Dove, A.D., Arnold, J.E., 2008. Hematologic disorders of fish. Vet. Clin. 18
North. Am. Exot. Anim. Pract. 11, 445-462. 19
Clifford, A.M., Goss, G.G., Wilkie, M.P., 2015. Adaptations of a deep sea scavenger: High 20
ammonia tolerance and active NH4+ excretion by the Pacific hagfish (Eptatretus stoutii). 21
Comp. Biochem. Physiol. A Mol. Integr. Physiol. 182, 64-74. 22
Conte, F.S., 2004. Stress and the welfare of cultured fish. Appl. Anim. Behav. Sci. 86, 205-23
223. 24
Dal'Bó, G.A., Sampaio, F.G., Losekann, M.E., Queiroz, J.F.D., Luiz, A.J.B., Wolf, V.H. 25
G., Gonçalves, V.T., Carra, M.L., 2015. Hematological and morphometric blood value of 26
four cultured species of economically important tropical foodfish. Neotropic. Ichthyol. 13, 27
439-446. 28
25
Davies, K.J., 2016. The Oxygen Paradox, oxidative stress, and ageing. Arch. Biochem. 1
Biophys. 595, 28-32. 2
Dong, X., Zhang, X., Qin, J., Zong, S., 2013. Acute ammonia toxicity and gill 3
morphological changes of Japanese flounder Paralichthys olivaceus in normal versus 4
supersaturated oxygen. Aquac. Res. 44, 1752-1759. 5
Ebeling, J.M., Timmons, M.B., 2012. Recirculating aquaculture systems, in: Tidwell, J. 6
(Ed.), Aquaculture Production Systems. John Wiley & Sons, pp 245-277. 7
FAO – Food and Agriculture Organization of the United Nations, 2016. The State of World 8
Fisheries and Aquaculture – Contributing to food security and nutrition for all. Rome. 9
Figueiredo, J.L., Menezes, N.A., 2000. Manual de peixes marinhos do sudeste do Brasil. 10
São Paulo, Museu de Zoologia / USP. 11
Garcia, L.O., Okamoto, M.H., Riffel, A.P.K., Saccol, E.M., Pavanato, M.A., Sampaio, 12
L.A., 2015. Oxidative stress parameters in juvenile Brazilian flounder Paralichthys 13
orbignyanus (Valenciennes, 1839) (Pleuronectiformes: Paralichthyidae) exposed to cold 14
and heat shocks. Neotropic. Ichthyol. 13, 607-612. 15
Gisbert, E., Rodrıguez, A., Cardona, L., Huertas, M., Gallardo, M.A., Sarasquete, C., Sala-16
Rabanal, M., Ibarz, A., Sánchez, J., Castello-Orvay, F., 2004. Recovery of Siberian 17
sturgeon yearlings after an acute exposure to environmental nitrite: changes in the 18
plasmatic ionic balance, Na+–K+ ATPase activity, and gill histology. Aquaculture 239, 19
141-154. 20
Grosell, M., Jensen, F. B., 2000. Uptake and effects of nitrite in the marine teleost fish 21
Platichthys flesus. Aquat. toxicol. 50, 97-107. 22
Halliwell, B., Gutteridge, J.M., 2015. Free radicals in biology and medicine, quinta ed. 23
Oxford University Press, Estados Unidos da América. 24
Heath, A.G., 1995. Water pollution and fish physiology, segunda ed. CRC Press, Boca 25
Raton. 26
Hermes-Lima, M., 2004. Oxygen in biology and biochemistry: role of free radicals, in: 27
Storey, K.B. (Ed.), Functional metabolism: Regulation and adaptation. Wiley‐Liss, 28
Hoboken, pp. 319-368. 29

26
Hermes-Lima, M., Moreira, D.C., Rivera-Ingraham, G.A., Giraud-Billoud, M., Genaro-1
Mattos, T.C., Campos, É.G., 2015. Preparation for oxidative stress under hypoxia and 2
metabolic depression: revisiting the proposal two decades later. Free Radic. Biol. Med. 89, 3
1122-1143. 4
Hvas, M., Damsgaard, C., Jensen, F.B., Bayley, M., 2016. The effect of environmental 5
hypercapnia and size on nitrite toxicity in the striped catfish (Pangasianodon 6
hypophthalmus). Aquat. Toxicol. 176, 151-160. 7
Ip, Y.K., Chew, S.F., 2010. Ammonia production, excretion, toxicity, anddefense in fish: A 8
review. Front. Physiol. 1, 134. 9
Iwama, G.K., Pickering, A.D., Sumpter, J.P., Schreck, C. B., 2011. Fish stress and health in 10
aquaculture. Cambridge University Press, Nova Iorque. 11
Jensen, F.B., 2003. Nitrite disrupts multiple physiological functions in aquatic animals. 12
Comp. Biochem. Physiol. A Mol. Integ. Physiol. 135, 9-24. 13
Jensen, F.B., Gerber, L., Hansen, M.N., Madsen, S.S., 2015. Metabolic fates and effects of 14
nitrite in brown trout under normoxic and hypoxic conditions: blood and tissue nitrite 15
metabolism and interactions with branchial NOS, Na+/K+-ATPase and hsp70 expression. J. 16
Exp. Biol. 218, 2015-2022. 17
Jia, R., Han, C., Lei, J.L., Liu, B.L., Huang, B., Huo, H.H., Yin, S.T., 2015. Effects of 18
nitrite exposure on haematological parameters, oxidative stress and apoptosis in juvenile 19
turbot (Scophthalmus maximus). Aquat. Toxicol. 169, 1-9. 20
Jia, R., Liu, B.L., Han, C., Huang, B., Lei, J.L., 2016. The physiological performance and 21
immune response of juvenile turbot (Scophthalmus maximus) to nitrite exposure. Comp. 22
Biochem. Physiol. C Toxicol. Pharmacol. 181, 40-46. 23
Klinger, D., Naylor, R., 2012. Searching for solutions in aquaculture: charting a sustainable 24
course. Annu. Rev. Environ. Resour. 37, 247-276. 25
Knudsen, P.K., Jensen, F.B., 1997. Recovery from nitrite-induced methaemoglobinaemia 26
and potassium balance disturbances in carp. Fish Physiol. Biochem. 16, 1-10. 27
Kroupova, H., Machova, J., Svobodova, Z., 2005. Nitrite influence on fish: a review. Vet. 28
Med. 50, 461. 29

27
Li, M., Gong, S., Li, Q., Yuan, L., Meng, F., Wang, R., 2016. Ammonia toxicity induces 1
glutamine accumulation, oxidative stress and immunosuppression in juvenile yellow catfish 2
Pelteobagrus fulvidraco. Comp. Biochem. Physiol. C Toxicol. Pharmacol.183, 1-6. 3
Liebel, S., Tomotake, M.E.M., Ribeiro, C.A.O., 2013. Fish histopathology as biomarker to 4
evaluate water quality. Ecotoxicol. Environ. Contam. 8, 09-15. 5
Lisser, D.F., Lister, Z.M., Pham-Ho, P.Q., Scott, G.R., Wilkie, M.P., 2017. Relationship 6
between oxidative stress and brain swelling in goldfish (Carassius auratus) exposed to high 7
environmental ammonia. Am. J. Physiol. Regul. Integr. Comp. Physiol. 312, R114-R124. 8
Livingstone, D.R., 2003. Oxidative stress in aquatic organisms in relation to pollution and 9
aquaculture. Rev. Med. Vet. 154, 427-430. 10
Lushchak, V.I., 2011. Environmentally induced oxidative stress in aquatic animals. Aquat. 11
Toxicol. 101, 13-30. 12
Mallatt, J., 1985. Fish gill structural changes induced by toxicants and other irritants: a 13
statistical review. Can. J. Fish. Aquat. Sci. 42, 630-648. 14
Martinez, C.B., Souza, M.M., 2002. Acute effects of nitrite on ion regulation in two 15
neotropical fish species. Comp. Biochem. Physiol. A Mol. Integ. Physiol. 133, 151-160. 16
Medeiros, R.S., Lopez, B.A., Sampaio, L.A., Romano, L.A., Rodrigues, R.V., 2016. 17
Ammonia and nitrite toxicity to false clownfish Amphiprion ocellaris. Aquacult. Int. 24, 18
985-993. 19
Millner, R., Walsh, S.J., Diaz de Astarloa, J.M., 2005. Atlantic Flatfish Fisheries, 20
in:Gibson, R.N. (Ed.), Flatfishes: Biology and Exploitation. Blackwell Science Ltd, 21
Oxford, pp. 240-271. 22
Okamoto, M.H., Sampaio, L.A., 2012. Sobrevivência e crescimento de juvenis do linguado 23
Paralichthys orbignyanus criados em diferentes temperaturas. Atlântica 34, 57-61. 24
Park, I.S., Lee, J., Hur, J.W., Song, Y.C., Na, H.C., Noh, C. H., 2007. Acute Toxicity and 25
Sublethal Effects of Nitrite on Selected Hematological Parameters and Tissues in Dark‐26
banded Rockfish, Sebastes inermis. J. World Aquacult. Soc. 38, 188-199. 27

28
Paust, L.O., Foss, A., Imsland, A.K., 2011. Effects of chronic and periodic exposure to 1
ammonia on growth, food conversion efficiency and blood physiology in juvenile Atlantic 2
halibut (Hippoglossus hippoglossus L.). Aquaculture 315, 400-406. 3
Pinto, D.S.B., Maltez, L.C., Stringhetta, G.R., Pellegrin, L., Nitz, L.F., Figueiredo, M.R.C., 4
Garcia, L.O., 2016. Ammonia and nitrite acute toxicity in juvenile piavuçu Leporinus 5
macrocephalus (Actinopterygii, Anostomidae). Pan-Am. J. Aquat. Sci. 11, 292-300. 6
Reiser, S., Schroeder, J.P., Wuertz, S., Kloas, W., Hanel, R., 2010. Histological and 7
physiological alterations in juvenile turbot (Psetta maxima, L.) exposed to sublethal 8
concentrations of ozone-produced oxidants in ozonated seawater. Aquaculture 307, 157-9
164. 10
Randall, D.J., Tsui, T.K.N., 2002. Ammonia toxicity in fish. Mar. Pollut. Bull. 45, 17-23. 11
Robaldo, R.B., Rodrigues, R.V., Okamoto, M.H., Sampaio, L.A., 2012. Processing yield of 12
wild‐caught and indoor‐reared Brazilian flounder Paralichthys orbignyanus. J. Appl. 13
Ichthyol. 28, 815-817. 14
Roche, H., Bogé, G., 1996. Fish blood parameters as a potential tool for identification of 15
stress caused by environmental factors and chemical intoxication. Mar. Environ. Res. 41, 16
27-43. 17
Rodrigues, R.V., Romano, L.A., Schwarz, M.H., Delbos, B., Sampaio, L.A., 2014. Acute 18
tolerance and histopathological effects of ammonia on juvenile maroon clownfish Premnas 19
biaculeatus (Block 1790). Aquac. Res. 45, 1133-1139. 20
Roques, J.A., Schram, E., Spanings, T., Schaik, T., Abbink, W., Boerrigter, J., Vries, P., 21
Vis, H., Flik, G., 2015. The impact of elevated water nitrite concentration on physiology, 22
growth and feed intake of African catfish Clarias gariepinus (Burchell 1822). Aquac. Res. 23
46, 1384-1395. 24
Sampaio, L.A., Bianchini, A., 2002. Salinity effects on osmoregulation and growth of the 25
euryhaline flounder Paralichthys orbignyanus. J. Exp. Mar. Biol. Ecol. 269, 187-196 26
Sampaio, L.A., Freitas, L.S., Okamoto, M.H., Louzada, L.R., Rodrigues, R.V., Robaldo, R. 27
B., 2007. Effects of salinity on Brazilian flounder Paralichthys orbignyanus from 28
fertilization to juvenile settlement. Aquaculture 262, 340-346. 29
29
Sampaio, L.A., Robaldo, R.B., Bianchini, A., 2008. Hormone‐induced ovulation, natural 1
spawning and larviculture of Brazilian flounder Paralichthys orbignyanus (Valenciennes, 2
1839). Aquac. Res. 39, 712-717. 3
Sampaio, L.A., Tesser, M.B., Wasielesky Junior, W., 2010. Avanços da maricultura na 4
primeira década do século XXI: piscicultura e carcinocultura marinha. R. Bras. Zootec. 39, 5
102-111. 6
Saoud, P., Naamani, S., Ghanawi, J., Nasser, N., 2014. Effects of acute and chronic nitrite 7
exposure on rabbitfish Siganus rivulatus growth, hematological parameters, and gill 8
histology. J. Aquac. Res. Dev. 5, 263-271. 9
Satheeshkumar, P., Ananthan, G., Senthilkumar, D., Khan, A.B., Jeevanantham, K., 2012. 10
Comparative investigation on haematological and biochemical studies on wild marine 11
teleost fishes from Vellar estuary, southeast coast of India. Comp. Clin. Path., 21, 275-281. 12
Schram, E., Roques, J.A., Abbink, W., Spanings, T., de Vries, P., Bierman, S., van de Vis, 13
H., Flik, G., 2010. The impact of elevated water ammonia concentration on physiology, 14
growth and feed intake of African catfish (Clarias gariepinus). Aquaculture 306, 108-115. 15
Segner, H., Sundh, H., Buchmann, K., Douxfils, J., Sundell, K.S., Mathieu, C., Ruane, N., 16
Jutfelt, F., Toften, H., Vaughan, L., 2012. Health of farmed fish: its relation to fish welfare 17
and its utility as welfare indicator. Fish Physiol. Biochem. 38, 85-105. 18
Sevcikova, M., Modra, H., Slaninova, A., Svobodova, Z., 2011. Metals as a cause of 19
oxidative stress in fish: a review. Vet. Med. 56, 537-546. 20
Simonato, J.D., Guedes, C.L., Martinez, C.B., 2008. Biochemical, physiological, and 21
histological changes in the neotropical fish Prochilodus lineatus exposed to diesel oil. 22
Ecotox. Environ. Saf. 69, 112-120. 23
Sinha, A.K., Liew, H.J., Diricx, M., Blust, R., De Boeck, G., 2012. The interactive effects 24
of ammonia exposure, nutritional status and exercise on metabolic and physiological 25
responses in gold fish (Carassius auratus L.). Aquat. Toxicol. 109, 33-46. 26
Sinha, A.K., AbdElgawad, H., Giblen, T., Zinta, G., De Rop, M., Asard, H., Blust, R., De 27
Boeck, G., 2014. Anti-oxidative defences are modulated differentially in three freshwater 28
teleosts in response to ammonia-induced oxidative stress. PloS One 9, e95319. 29

30
Stoliar, O.B., Lushchak, V.I., 2012. Environmental pollution and oxidative stress in fish, in: 1
Lushchak, Volodymyr (Ed.), Oxidative Stress — Environmental Induction and Dietary 2
Antioxidants. InTech, Rijeka, pp. 131-166. 3
Sun, S., Ge, X., Zhu, J., Xuan, F., Jiang, X., 2014. Identification and mRNA expression of 4
antioxidant enzyme genes associated with the oxidative stress response in the Wuchang 5
bream (Megalobrama amblycephala Yih) in response to acute nitrite exposure. Comp. 6
Biochem. Physiol. C Toxicol. Pharmacol. 159, 69-77. 7
Thangam, Y., 2014. Effect of acute and sublethal toxicity of nitrite to fresh water fish 8
Cirrhinus Mrigala. Int. J. Sci. Eng. Res. 5, 789-795. 9
Terlouw, E.M.C., Arnould, C., Auperin, B., Berri, C., Le Bihan-Duval, E., Deiss, V., 10
Lefèvre, F., Lensink, B.J., Mounier, L., 2008. Pre-slaughter conditions, animal stress and 11
welfare: current status and possible future research. Animal 2, 1501-1517. 12
Troell, M., Naylor, R. L., Metian, M., Beveridge, M., Tyedmers, P.H., Folke, C., Arrow, K. 13
J., Barrett, S., Crépin, A., Ehrlich, P.R., Gren, Å., Kautsky, N., Levin, S.A., Nyborg, K., 14
Österblom, H., Polasky, S., Scheffer, M., Walker, B.H., Xepapadeas, T., Zeeuw, A., 2014. 15
Does aquaculture add resilience to the global food system?. Proc. Natl. Acad. Sci. 111, 16
13257-13263. 17
USEPA – United States Environmental Protection Agency, 2013. Aquatic Life Ambient 18
Water Quality Criteria for Ammonia - Freshwater 2013. EPA 822-R-13-001. National 19
Technichal Information Service, Springfield, VA, USA. 20
Valavanidis, A., Vlahogianni, T., Dassenakis, M., Scoullos, M., 2006. Molecular 21
biomarkers of oxidative stress in aquatic organisms in relation to toxic environmental 22
pollutants. Ecotoxicol. Environ. Saf. 64, 178-189. 23
Veeck, A.P.L., Garcia, L.O., Baldisserotto, B., Zaniboni Filho, E., Emanuelli, T., 2013. 24
Proximate composition and lipid stability of dourado (Salminus brasilensis, Cuvier, 1817) 25
fillets exposed to different levels of ammonia and oxygen in vivo. J. Sci. Food Agr. 93, 26
2590-2595. 27
31
Vosylienė, M.Z., Kazlauskienė, N., 2004. Comparative studies of sublethal effects of 1
ammonia on rainbow trout (Oncorhynchus mykiss) at different stages of its development. 2
Acta Zool. Lit. 14, 13-18. 3
Wasielesky, W., Bianchini, A., Santos, M.H., Poersch, L.H., 1997. Tolerance of juvenile 4
flatfish Paralichthys orbignyanus to acid stress. J. World Aquac. Soc. 28, 202-204. 5
Wedemeyer, G., 2012. Physiology of Fish in Intensive Culture Systems. Springer Science 6
& Business Media, Dordrecht. 7
Wood, C.M., Nawata, C.M., 2011. A nose-to-nose comparison of the physiological and 8
molecular responses of rainbow trout to high environmental ammonia in seawater versus 9
freshwater. J. Exp. Biol. 214, 3557-3569. 10
Wuertz, S., Schulze, S.G.E., Eberhardt, U., Schulz, C., Schroeder, J.P., 2013. Acute and 11
chronic nitrite toxicity in juvenile pike-perch (Sander lucioperca) and its compensation by 12
chloride. Comp. Biochem. Physiol. C Toxicol. Pharmacol. 157, 352-360. 13
Yang, W., Xiang, F., Sun, H., Chen, Y., Minter, E., Yang, Z., 2010. Changes in the selected 14
hematological parameters and gill Na+/K
+ ATPase activity of juvenile crucian carp 15
Carassius auratus during elevated ammonia exposure and the post-exposure recovery. 16
Biochem. Syst. Ecol. 38, 557-562. 17
Zhang, L., Feng, L., Jiang, W.D., Liu, Y., Jiang, J., Li, S.H., Tang, L., Kuang, S.Y., Zhou, 18
X.Q., 2016. The impaired flesh quality by iron deficiency and excess is associated with 19
increasing oxidative damage and decreasing antioxidant capacity in the muscle of 20
younggrass carp (Ctenopharyngodon idellus). Aquacult. Nutr. 22, 191-201. 21
22

32
CAPÍTULO 1 1
2
Secondary stress responses in juvenile Brazilian flounder Paralichthys orbignyanus 3
throughout and after exposure to sub-lethal levels of ammonia and nitrite 4
5
Lucas Campos Malteza, Marcelo Hideo Okamoto
b, Diogo Luiz de Alcantara Lopes
b, Luis André Luz Barbas
d, 6
Luis Alberto Romanoc, Luís André Sampaio
b and Luciano Garcia
a* 7
8 aLaboratório de Aquacultura Continental, Instituto de Oceanografia, Universidade Federal do Rio Grande – 9
FURG, Rio Grande, RS, Brazil. 10 bLaboratório de Piscicultura Estuarina e Marinha, Instituto de Oceanografia, Universidade Federal do Rio 11
Grande – FURG, Rio Grande, RS, Brazil. 12 cLaboratório de Patologia e Imunologia de Organismos Aquáticos, Instituto de Oceanografia, Universidade 13
Federal do Rio Grande – FURG, Rio Grande, RS, Brazil. 14 dLaboratório de Aquacultura de Espécies Tropicais, Instituto Federal de Educação Ciência e Tecnologia do 15
Pará, Castanhal – PA, Brazil. 16
17
*Corresponding author: Laboratório de Aquacultura Continental, Universidade Federal do Rio Grande – 18
FURG, 96201-900, Rio Grande, RS, Brazil. Phone: +55 53 3237-3003; E-mail address: 19
21
22
23
24
25
26
27
28
29
30
31
32
33
34
35
36
Artigo formatado e submetido para a revista Aquaculture 37

33
Abstract 1
2
The aim of this study was to investigate the secondary stress responses in blood of juvenile 3
Brazilian flounder Paralichthys orbignyanus throughout exposure to sub-lethal levels of 4
ammonia and nitrite and after recovery in water with minimum concentrations of these 5
compounds. Fish were exposed to three concentrations of ammonia (0.12; 0.28 and 0.57 mg 6
NH3-N.L-1
) or nitrite (5.72; 10.43 and 15.27 mg NO2-N.L-1
), plus a control, for 10 days 7
followed by the same time for recovery. Blood parameters (glucose, Na+, K
+, Ca
2+ and 8
HCO3− concentrations, pO2, pCO2, pH and differential leukocyte count) were measured 9
after 1, 5 and 10 days of exposure, and after recovery. Fish exposed to all ammonia 10
concentrations presented lower glucose levels after 10 days of exposure and higher values 11
after recovery. Although ammonia induced initial ionic disturbances (Na+, K
+, Ca
2+), basal 12
levels were restored still over the course of exposure. A metabolic blood alkalosis occurred 13
from the 5th
day of exposure and forward until the end of the experiment (day 20). Nitrite 14
exposure caused hyperglicemia, increased plasma K+ levels and respiratory alkalosis, 15
whereas a metabolic acidosis was observed in fish after recovery. The differential leukocyte 16
count revealed an increased proportion of monocytes and granulocytes, or only monocytes. 17
Yet, reductions of lymphocytes in response to intermediate concentrations of ammonia 18
(0.28 mg NH3-N.L-1
at day 1) and nitrite (10.43 mg.L-1
at day 5), and after recovery in 19
treatments 0.28 and 0.57 mg NH3-N.L-1
were observed. Exposure to ammonia also 20
decreased the proportion of granulocytes at day 5. In conclusion, exposure to sub-lethal 21
levels of ammonia and nitrite for 10 days led to alterations in blood parameters of juvenile 22
Brazilian flounder, and concentrations at 0.12 mg NH3-N.L-1
and 5.72 mg NO2-N.L-1 23
should be avoided to prevent physiological disorders that can compromise aquaculture 24
production. Furthermore, only fish exposed to 5.72 mg NO2-N.L-1
following a 10-days 25
recovery period showed complete resumption of normal physiological condition. 26
27
Keywords: blood parameters; estuarine fish; homeostasis; nitrogen compounds; toxicity 28
29
34
1. Introduction 1
2
The Brazilian flounder Paralichthys orbignyanus inhabits estuaries and shallow 3
coastal waters of the southwestern Atlantic Ocean, from Rio de Janeiro, Brazil to 4
Argentinian Patagonia, representing an important fishery resource in South America 5
(Millner et al., 2005). It is considered a promising species for the development of intensive 6
marine aquaculture due to its wide tolerance to changes in water quality (Bianchini et al. 7
1996; Wasielesky et al. 1997; Sampaio and Bianchini, 2002; Okamoto and Sampaio, 2012) 8
and handling (Bolasina, 2011). Spawning, larviculture and juvenile production have been 9
successfully achieved in Brazilian flounder (Sampaio et al., 2007; Sampaio et al., 2008). 10
Build-up of nitrogen compounds is one of the most important limiting factors in 11
intensive aquaculture. In recirculating aquaculture systems (RAS), ammonia and nitrite are 12
removed via the nitrification process whereby bacteria inside the biofilter oxidize ammonia 13
to nitrite, and subsequently to nitrate (Blancheton et al., 2013). However, imbalances within 14
these bacterial processes may lead to increments in concentrations of these compounds, 15
which are extremely toxic to fish (Randall and Tsui, 2002; Jensen, 2003). 16
The accumulation of ammonia in production systems occurs due to decomposition 17
of the organic matter and fish excretion, being the main by-product of protein catabolism in 18
most teleost species (Wilkie, 2002). Ammonia exists in ionized (NH4+) and un-ionized 19
forms (NH3), and its toxicity is mainly attributed to un-ionized form, which can readily 20
diffuse across gill membranes because of its high solubility in lipids (Ip and Chew, 2010). 21
High concentrations of environmental ammonia impair the blood-to-water gradient for NH3 22
diffusion and therefore, ammonia build-up in blood and tissues is favoured by the 23
decreased gill excretion (Wilkie and Wood, 1996). According to Randall and Tsui (2002), 24
the main cause of ammonia toxicity is related to the depolarizing effect of the ion NH4+
in 25
neurons, leading to excessive activation of N-Methyl-D-Aspartate (NMDA) type glutamate 26
receptors. Over activation of these receptors leads to an influx of Ca2+
to cells, which in 27
turn activates Ca2+
-dependent enzymes, being followed by a series of reactions that can 28
ultimately cause cell death. 29
Environmental nitrite is taken up across the gill epithelium via the active chloride 30
uptake mechanism, following further accumulation in the extracellular fluid (Bath and 31

35
Eddy, 1980). In marine fish, the intestinal epithelium is another important route for nitrite 1
uptake (Grosell and Jensen, 2000). From the blood plasma, nitrite diffuses into red blood 2
cells (RBCs) oxidizing hemoglobin Fe2+
to Fe3+
and thus giving rise to the formation of 3
methemoglobin (metHb), losing its oxygen-binding capacity (Jensen, 2003). 4
In addition to the primary toxic mechanisms as aforementioned, exposure to 5
ammonia and nitrite can also induce metabolic, ionic, acid-base and immune changes in 6
fish, which led to alterations of some blood parameters as glucose, concentration of 7
electrolytes, partial pressure of gases, pH and leukocyte profile (Vosyliene and 8
Kazlauskiene, 2004; Wood and Nawata, 2011; Saoud et al., 2014; Jia et al., 2015; Hvas et 9
al., 2016). These secondary stress responses are early signs of compromise to fish health, 10
and therefore should not be overlooked, for they can provide relevant information to 11
establish nontoxic thresholds for NH3-N and NO2-N concentrations. Maintaining safe 12
thresholds for nitrogen compounds in RAS is critical to avoid stress, which, if linger on 13
above safe levels, may eventually progress to tertiary responses (Barton et al., 2002) such 14
as growth suppression (Paust et al., 2011; Ciji et al., 2014), diseases and fish death 15
(Medeiros et al., 2016). 16
Information on the suitable time length to allow for ammonia and nitrite 17
detoxification from plasma and tissues of fish is very scarce. Although some studies have 18
shown resumption of normal physiological conditions during recovery in fish previously 19
exposed to ammonia and nitrite (Gisbert et al., 2004; Yang et al., 2010), such similar results 20
cannot be simply expected when different concentrations, time of exposure, or distinct 21
species are used. Different species might require distinct time frames for resumption of 22
homeostasis. Fish reared in intensive aquaculture systems that have been exposed to 23
oscillations in nitrogen compounds should undergo an adequate recovery period in 24
ammonia- and nitrite-free water, in order to minimize the risk of cumulative stress 25
(Wedemeyer, 2012) and to decrease impairment of end-products due to pre-slaughter stress 26
(Terlouw et al., 2008). 27
Studies dealing with ammonia and nitrite toxicity to the Brazilian flounder are 28
limited to the determination of lethal concentration (LC50-96h) in two experimental 29
conditions of salinity and temperature: the "winter condition" (0‰ and 12°C) and the 30
"summer condition" (30‰ and 25°C). Values for LC50-96h were 0.67 mg NH3-N.L-1
and 31

36
30.57 mg NO2-N.L-1
in "summer condition", and 0.19 mg NH3-N.L-1
and 24.01 mg NO2-1
N.L-1
in "winter condition" (Bianchini et al., 1996). Responses of Brazilian flounder 2
exposed to sub-lethal levels of these compounds, following a recovery period in ammonia- 3
and nitrite-free water are unknown. Thus, the aim of this study was to assess the effects of 4
exposure to sub-lethal levels of un-ionized ammonia and nitrite on secondary stress 5
responses of juvenile P. orbignyanus. Furthermore, responses of fish allowed to recover in 6
ammonia- and nitrite-free water were also monitored. 7
8
2. Materials and methods 9
10
2.1. Fish and experimental conditions 11
12
Juvenile Brazilian flounders were produced and reared at the Laboratory of Marine 13
Fish Culture of the Federal University of Rio Grande - FURG in southern Brazil. The 14
experimental protocol was approved by the Committee on Animal Experimentation of 15
FURG under the registration number 23116.001030/2016-15. 16
Two experiments were performed: 180 fish (107.3 ± 1.9 g and 21.2 ± 0.1 cm) were 17
exposed to ammonia (Experiment 1 – E1), and another 180 fish (310.0 ± 5.6 g and 29.4 ± 18
0.2 cm) were exposed to nitrite (Experiment 2 – E2). Fish were randomly distributed in 12 19
tanks (250 L useful volume) consisting of four RAS for acclimation to experimental 20
conditions during 20 days. 21
The juveniles were fed twice daily (3% of total biomass) with commercial diet (46% 22
crude protein) throughout the acclimation period and experiments. Uneaten food and faeces 23
were siphoned out after feeding and the water was replenished at the same experimental 24
conditions. 25
After the acclimation period, fish were exposed for 10 days to three sub-lethal 26
concentrations of ammonia (E1): 0.12 ± 0.01; 0.28 ± 0.02 and 0.57 ± 0.02 mg NH3-N.L-1
or 27
nitrite (E2): 5.72 ± 0.02; 10.43 ± 0.05 and 15.27 ± 0.04 mg NO2-N.L-1
, plus a control (E1 - 28
0.05 ± 0.01 mg NH3-N.L-1
; E2 - 0.08 ± 0.01 mg NO2-N.L-1
), being each treatment in 29
triplicate. Water flow was turned off and throughout the exposure period fish were kept in a 30

37
semi-static system. Concentrations tested were chosen based on the safe levels of un-1
ionized ammonia (0.067 mg NH3-N.L-1
) and nitrite (3.06 mg NO2-N.L-1
) that were 2
estimated by Bianchini et al. (1996) in seawater. The desired ammonia and nitrite 3
concentrations were obtained by the addition of ammonium chloride (NH3Cl4) or sodium 4
nitrite (NaNO2) (Synth, Brazil) solutions, or water exchanges. In both experiments, at the 5
end of the exposure period, water was entirely renewed in all tanks, water recirculation was 6
re-established and fish remained for another 10 days in a RAS for the evaluation of 7
recovery (E1 – 0.00 ± 0.00 mg NH3-N.L-1
; E2 – 0.05 ± 0.01 mg NO2-N.L-1
). 8
Water quality parameters were measured daily before the first feeding: temperature 9
and dissolved oxygen (oximeter YSI 55), salinity (refractometer), pH (pH meter, WTW 10
315i), total ammonia (UNESCO, 1983), un-ionized ammonia (Colt, 2002), nitrite 11
(Bendschneider and Robinson, 1952), and total alkalinity (Eaton et al., 2005). Water quality 12
was maintained as follows: salinity (E1 – 27.82 ± 0.06; E2 – 23.91 ± 0.05), temperature (E1 13
– 22.65 ± 0.07 °C; E2 – 21.68 ± 0.10 °C), dissolved oxygen concentration (E1 – 6.88 ± 14
0.01 mg O2.L-1
; E2 – 7.34 ± 0.02 mg O2.L-1
), pH (E1 – 8.20 ± 0.01; E2 – 8.17 ± 0.01), 15
alkalinity (E1 – 168.85 ± 1.19 mg CaCO3.L-1
; E2 – 232.19 ± 1.50 mg CaCO3.L-1
). 16
Photoperiod was fixed at 12 h Light: 12 h Dark. 17
18
2.2. Blood sampling and analyses 19
20
Feeding was discontinued 24 hours prior to each sampling day and three fish per 21
tank (nine per treatment) were collected after 1, 5 and 10 days of exposure, and after the 22
recovery period (day 20). After collection, fish were anaesthetized with benzocaine 23
hydrochloride (50 ppm) and blood samples were obtained by caudal puncture using 24
heparinized syringes. 25
The blood glucose was measured using a glucose meter (Accu-Chek Advantage; 26
Roche Diagnosis®). Ions (Na
+, K
+ and Ca
2+) and bicarbonate concentration (HCO3
-), partial 27
pressure of gases (pCO2 and pO2) and pH and were measured with a portable i-STAT®
28
clinical analyser using CG8+ cartridges (Abbott laboratories, Chicago, IL, USA). Values 29
for pO2, pCO2, HCO3 and pH were corrected for the water temperature with the assumption 30
that water temperature and fish body temperatures were equivalent (Hanley et al., 2010). 31

38
Corrections were made according to the manufacturer's specifications. The accuracy of the 1
gained data using an i-STAT device has been questioned when compared to data from 2
conventional laboratory analyses, because some discrepancies can occur (Harter et al., 3
2014). However, when using i-STAT measurements, the focus should not be on attaining 4
absolute values, but in other ways, allow for comparisons among experimental treatments 5
(Calabrese et al., 2017) or assess conditions in which precision is more relevant than 6
accuracy (Davidson et al., 2014). Beyond that, monitoring of blood parameters using i-7
STAT may be a useful and practical tool for a quick evaluation of stress in animals. Many 8
recent studies have used i-STAT-based analyses on fish (Barbas et al., 2016; Hvas et al., 9
2016; Calabrese et al., 2017). 10
Blood smears were prepared and stained with May-Grünwald-Giemsa (Rosenfeld, 11
1947). Two thousand cells per slide were counted under a microscope (100x) for 12
differential counting of leukocytes (monocytes, lymphocytes and granulocytes). 13
14
2.3. Statistical analysis 15
16
All data were expressed as means ± standard error (SEM). To verify the normality 17
and homogeneity of variances, data were submitted to Kolmogorov-Smirnov and Levene 18
tests, respectively. After assumptions were satisfied, one-way ANOVA and Tukey test 19
were performed to check for differences among treatments (Ammonia/Nitrite 20
concentrations) within the same sampling day. The significance level was set at p < 0.05 in 21
all cases. 22
23
3. Results 24
25
The survival rate of juvenile Brazilian flounder was 100% in both experiments. 26
Glucose levels were significantly lower in juvenile Brazilian flounder irrespective 27
of ammonia concentration when compared to control after 10 days of exposure, whereas 28
after the recovery period, all treatments showed higher glycemia than control (Table 1). 29
39
The blood K+
concentration was higher in fish exposed to ammonia, regardless of 1
concentration, in relation to control on day 1. Ca2+
concentrations increased after one day of 2
exposure in treatment 0.57 mg NH3-N.L-1
compared to control. At the first day of exposure, 3
Na+ concentration was higher in treatment 0.57 mg NH3-N.L
-1 compared to treatment 0.12 4
mg NH3-N.L-1
and control, and in the treatment 0.28 mg NH3-N.L-1
compared to control. 5
On day 5, concentration of Na+ was lower in treatment 0.57 mg NH3-N.L
-1 compared to 6
control (Table 1). 7
The pO2 levels were higher in treatment 0.57 mg NH3-N.L-1
compared to treatment 8
0.12 mg NH3-N.L-1
at day 1. Fish exposed to 0.57 mg NH3-N.L-1
for one day had a 9
reduction in pCO2 and HCO3- concentration in relation to all other treatments. On day 5, the 10
HCO3-
concentration was higher in treatment 0.57 mg NH3-N.L-1
when compared to 11
treatment 0.12 mg NH3-N.L-1
. The pH increased significantly in treatments 0.28 and 0.57 12
mg NH3-N.L-1
in relation to control at day 5. At the end of the exposure period (day 10), 13
the HCO3- concentration was higher in fish exposed to 0.28 mg NH3.L
-1 compared to the 14
other treatments. In the same day (day 10), the pH was higher in treatment 0.28 mg NH3-15
N.L-1
when compared to the others, and in treatment 0.57 mg NH3-N.L-1
in comparison 16
with control. After the recovery period, the HCO3- concentration was higher in treatments 17
0.28 and 0.57 mg NH3-N.L-1
than in control, being the pH also higher in these treatments in 18
relation to control and treatment 0.12 NH3-N.L-1
(Table 1). 19
Brazilian flounder exposed for one day to 0.28 mg NH3-N.L-1
showed increased 20
proportion of monocytes and reduced lymphocytes when compared to other treatments. The 21
proportion of granulocytes was higher in treatment 0.28 mg NH3-N.L-1
in relation to the 22
treatment 0.57 mg NH3-N.L-1
. Fish exposed to ammonia, irrespective of concentration 23
showed decreased proportion of granulocytes in relation to control on day 5. After 24
recovery, proportion of granulocytes increased in treatment 0.57 mg NH3-N.L-1
in relation 25
to control and treatment 0.12 mg NH3-N.L-1
, and this proportion increment was also 26
observed in treatment 0.28 mg NH3-N.L-1
compared to control. There was a reduction in 27
lymphocytes in treatments 0.28 and 0.57 mg NH3-N.L-1
compared to control and 0.12 mg 28
NH3-N.L-1
after the recovery period (Table 2). 29
Blood glucose was higher in fish exposed to treatments 10.43 and 15.27 mg NO2-30
N.L-1
compared to the other treatments at the end of the exposure period (day 10). On day 31

40
5, the K+ concentration was higher in treatment 15.27 mg NO2-N.L
-1 compared to all other 1
treatments, whereas on the 10th
day it was higher in treatments 10.43 e 15.27 mg NO2-N.L-1
2
than that of control. There was an elevation and a reduction in Na+ concentrations in 3
treatment 15.27 mg NO2-N.L-1
compared to all other treatments at day 5 and after recovery, 4
respectively. The pCO2 levels were lower in all treatments exposed to nitrite as compared 5
to control throughout the exposure period (1, 5 and 10 days). After five days of exposure, 6
the HCO3- concentration was lower in treatment 15.27 mg NO2-N.L
-1 compared to all other 7
treatments and in treatments 5.72 and 10.43 mg NO2-N.L-1
when compared to control. Fish 8
exposed to 15.27 mg NO2-N.L-1
had a reduction in blood pH compared to 5.72 mg NO2-9
N.L-1
and control on day 5. Blood pH increased significantly in all treatments compared to 10
controls on days 1 and 10. After the recovery period, treatments 10.43 and 15.27 mg NO2-11
N.L-1
had significantly lower HCO3- concentrations compared to treatment 5.72 mg NO2-12
N.L-1
and control, whereas the pH values were lower in treatment 15.27 mg NO2-N.L-1
in 13
relation to all others treatments, and in treatment 10.43 mg NO2-N.L-1
compared to control 14
(Table 3). 15
Exposure to 10.43 mg NO2-N.L-1
during five days led to increased percentage of 16
monocytes and granulocytes, and a reduction in lymphocytes, compared to all other 17
treatments. After recovery, the treatment 15.27 NO2-N.L-1
showed a reduced proportion of 18
lymphocytes and an increased proportion of granulocytes relative to treatment 10.43 NO2-19
N.L-1
(Table 4). 20
21
4. Discussion 22
23
The build-up of toxic nitrogen compounds imposes a potential risk for intensive 24
aquaculture, and exposure to certain levels of ammonia and nitrite can be lethal to fish 25
(Medeiros et al., 2016). In the present study, the absence of mortality in fish exposed to 26
concentrations of up to 0.57 mg NH3-N.L-1
or 15.27 mg NO2-N.L-1
for 10 days, is in 27
agreement with the observations of Bianchini et al. (1996) when evaluating acute toxicity 28
for P. orbignyanus in seawater (30‰ and 25°C) for 96 h. These authors demonstrated 29
100% of survival in fish exposed to concentrations around 0.54 mg NH3-N.L-1
and 10 mg 30
NO2-N.L-1
, and mortality occurred only at concentrations 0.67 mg NH3-N.L-1
and 20 mg 31
41
NO2-N.L-1
or above. However, taking into account the different exposure time between the 1
two studies, our results suggest that the species is capable of tolerating longer periods of 2
exposure to these ammonia and nitrite concentration ranges, without mortality, which is an 3
important feature of a candidate species for intensive aquaculture. 4
Despite the absence of mortality, evaluation of blood parameters revealed the 5
triggering of several secondary stress responses, which were time and concentration 6
dependent. The required physiological adaptations which increase the chances of survival 7
under stress conditions, involve energy expenditure that is likely to impair other biological 8
processes closely related to aquaculture productivity, as in the case of growth, reproduction 9
and tolerance to additional stress (Bonga, 1997; Barton, 2002). Therefore, the knowledge 10
on the ammonia- and nitrite-induced changes in blood, combined with a periodic 11
monitoring of fish blood and water quality, allows for an early diagnosis of stress induced 12
by deleterious levels of these compounds in the production system, therefore reducing the 13
possibility of more severe or long-term effects. 14
Nitrogenous compounds can provoke the release of catecholamine and cortisol to 15
the bloodstream as primary stress responses in fish. Elevation of plasma cortisol induces 16
the mobilization of energy substrates, resulting in increased plasma glucose levels, which in 17
turn, is related to carbohydrate metabolism, such as glycogenolysis and gluconeogenesis 18
(Bonga, 1997). Increased glucose levels were observed in Brazilian flounder after recovery 19
irrespective of ammonia treatment, and hyperglycemia was also caused by higher nitrite 20
concentrations (10.43 and 15.27 mg NO2-N.L-1
) after 10 days of exposure, indicating an 21
increased metabolic demand in either cases. In contrast, reduced plasma glucose levels 22
were observed after 10 days of exposure to ammonia. Similar response was also reported 23
by Baldisserotto et al. (2014) for silver catfish Rhamdia quelen exposed to 0.18 and 0.50 24
mg NH3-N.L-1
for five days. This reduction is presumably caused by the depletion of 25
glycogen reserves in the liver and muscle during ammonia-induced stress (Miron et al., 26
2008). 27
Exposure to ammonia and nitrite caused osmoregulatory disturbances in Brazilian 28
flounder, which led to alterations in plasma electrolyte concentrations. Fish exposed to 29
ammonia (0.12 - 0.57 mg NH3-N.L-1
) showed an initial elevation (day 1) of plasma K+ 30
concentration. This result was similar to those observed for Atlantic cod Gadus morhua 31

42
(Remen et al., 2008) and turbot Scophthalmus maximus (Person-Le Ruyet et al., 2003). The 1
primary mechanism of ammonia toxicity concerns to the ability of NH4+ in replacing K
+ in 2
neurons (Binstock and Lecar, 1969) and muscle (Beaumont et al., 2000). This could have 3
decreased the concentration of K+
in the intracellular fluids, as demonstrated in the muscle 4
of rainbow trout Oncorhynchus mykiss (Vedel et al., 1998), and in turn, promoted an 5
elevation of K+ concentration in the blood plasma. 6
Elevation of plasma K+ concentrations in juvenile Brazilian flounder exposed to 7
10.43 (day 10) and 15.27 mg NO2-N.L-1
(days 5 and 10) was probably caused by the 8
release of K+ from RBCs and skeletal muscle. In RBCs, the K
+ efflux is related to the 9
formation of metHb, which activates the K+/Cl
- cotransport (Jensen, 1992). The transport 10
mechanism involved in the K+ losses from the muscle seems to be similar to that observed 11
in RBCs (Knudsen and Jensen, 1997). Hyperkalemia has been demonstrated in several 12
species during nitrite exposure (Grosell and Jensen, 2000; Gisbert et al., 2004; Ciji et al., 13
2012; Jia et al., 2015). 14
Increased plasma Ca2+
concentrations of fish exposed to 0.57 mg NH3-N.L-1
(day 1) 15
are likely a transient disturbance of calcium exchanges through the gill and intestine and/or 16
come from internal pools (Person-Le Ruyet et al., 2003). Silver catfish exposed to ammonia 17
(0.18 - 0.50 mg NH3-N.L-1
) for 24 h also showed increased plasma Ca2+
concentrations, 18
with subsequent restoration of basal levels after 5 days (Baldisserotto et al., 2014), 19
resembling the results of the present study. 20
Juvenile Brazilian flounder showed increased plasmatic concentration of Na+ when 21
exposed to 0.28 and 0.57 mg NH3-N.L-1
(day 1) and 15.27 mg NO2-N.L-1
(day 5). Similar 22
results were reported for European sea bass Dicentrarchus labrax (Sinha et al., 2015) and 23
Atlantic Salmon Salmo salar in seawater (Knoph and Thorud, 1996) during ammonia 24
exposure and for sea bass exposed to nitrite (Woo and Chiu, 1997). The rise in Na+
plasma 25
concentrations suggests a reduction of Na+ excretion. This could be related to an inhibition 26
of branchial Na+/K
+ ATPase activity and/or Na
+/NH4
+ exchange mechanism, which are 27
involved in ammonia excretion (Weihrauch et al., 2009). In contrast, the Na+
plasma 28
concentration of fish subjected to 0.57 mg NH3-N.L-1
was reduced on the 5th
day. These 29
results resemble those observed for turbot after seven days of exposure to 0.73 and 0.88 mg 30
NH3-N.L-1
(Person-Le Ruyet et al., 2003) and can be explained by different osmoregulatory 31

43
imbalances. More Na+ is excreted across the gills due to an enhanced in Na
+/K
+-ATPase 1
activity, which is triggered by endocrine stress responses (McCormick, 2001). Ionic 2
disturbances between intra and extracellular fluids (Vedel et al., 1998) and reduction of Na+
3
uptake due to competition for active transport between Na+ and NH4
+ (Schmidt-Nielsen, 4
1997) are also causes of lessened plasma Na+ concentrations. 5
The ionic disturbances associated with ammonia toxicity were limited to the first 5 6
days of exposure. These results indicate an adaptation of Brazilian flounder to 7
environmental ammonia, which involves physiological adjustments to recover and maintain 8
normal osmoregulation, without requiring a recovery period in ammonia-free water. In the 9
nitrite experiment, the 10 days of recovery sufficed to restore the basal levels of plasma K+, 10
which was the only altered ionic parameter at the end of the exposure. 11
Acid-base regulation is essential to maintain the physiological and biochemical 12
functions and consequently, the whole animal performance. Fish can regulate an acid–base 13
disturbance through modulations in ventilation rate to modify blood pCO2 and mainly by 14
ionic regulation across the gills (Evans et al., 2005; Perry and Gilmour, 2006). Brazilian 15
flounder juveniles exposed to 0.57 mg NH3-N.L-1
(day 1) and all nitrite concentrations (day 16
5) presented a reduction in pCO2 and bicarbonate concentration, which indicates a 17
compensatory mechanism to regulate the acid-base status. However, exposure to ammonia 18
and nitrite also elicits changes in blood pH, which is an indication of failure in acid-base 19
regulation. 20
Exposure to 0.28 and 0.57 mg NH3-N.L-1
induced a slight metabolic alkalosis from 21
day 5 and forward, throughout the exposure period, and even after recovery. Similarly, 22
Nawata et al. (2015) reported a slight alkalosis and a significant rise in plasma bicarbonate 23
of spiny dogfish shark Squalus acanthias during ammonia exposure. Clifford et al. (2015) 24
also found a metabolic alkalosis characterized by a rise in plasma bicarbonate concentration 25
and an unchanged plasma pCO2 in Pacific hagfish Eptatretus stoutii exposed to ammonia. 26
Rainbow trout acclimated to seawater experienced a gradual increase in blood pH as the 27
ammonia exposure continued during 24 h without changes in plasma bicarbonate (Wilson 28
and Taylor, 1992). Analysis of blood non-respiratory acid-base status of seawater fish 29
exposed to ammonia revealed a metabolic acid consumption (base load) through the 30
conversion of NH3 to NH4+ and subsequently extrusion via NH4
+/Na
+ exchange (Wilson 31

44
and Taylor, 1992; Clifford et al., 2015). For fish living in small volumes of water, as it 1
occurs in intensive production systems, it is possible that acid excretions may have a 2
significant impact on environmental pH. Water acidification and blood alkalosis reduce the 3
concentration of NH3 in the water and increase it in plasma, respectively, raising NH3 4
plasma-water gradient and therefore its excretion (Chew et al., 2003). Thus, under certain 5
conditions, fish can take advantage of the mechanisms of ionic and acid-base regulation to 6
facilitate the detoxification of excessive ammonia. 7
Increased blood pH levels in fish exposed to all nitrite concentrations on days 1 and 8
10 indicate a respiratory alkalosis as a consequence of reductions in blood pCO2, which in 9
turn could be caused by hyperventilation (Williams et al., 1997). Metahemoglobin-related 10
reductions in blood O2 content during nitrite intoxication may be a trigger mechanism for 11
hyperventilation (Aggergaard and Jensen, 2001). Another strategy observed in fish during 12
nitrite exposure would be to reduce the metabolism to decrease the oxygen demand (Espina 13
& Alcaraz, 1993), resulting in lower blood pCO2 (Williams et al., 1997). 14
The period of recovery was sufficient for resumption of pCO2 to baseline levels 15
irrespective of treatment. The loss of nitrite to the environment across the gills and via the 16
urine, recovery of functional hemoglobin levels due to the methaemoglobin-reductase 17
system and the ability to oxidise nitrite to nitrate, are efficient mechanisms involved in the 18
detoxification and recovery from nitrite exposure (Jensen, 2003). Thus, the return of pCO2 19
values and plasma K+ concentrations to baseline levels can be an indication of restored 20
functional hemoglobin levels. However, fish exposed to 10.43 and 15.27 mg NO2-N.L-1
21
(day 20) had a decreased concentration of bicarbonate and pH, indicating a metabolic 22
acidosis. According to Clifford et al. (2015), the stepwise correction of the alkalosis was 23
likely due to an increase in the addition of metabolic acid to the blood, resulting in a 24
temporary acidosis during recovery. Metabolic acidosis was more pronounced in the 25
highest nitrite concentration concomitantly with the decreased plasma Na+. Since the 26
excretion of H+ is related to the uptake of Na
+ (Perry and Gilmour, 2006), this result 27
suggests a possible reduction in Na+/H
+ exchange mechanisms, leading to an acid load. 28
Nevertheless, further studies are needed for a better understanding of the ionic and acid-29
base changes observed during recovery from nitrite exposure. 30

45
The use of leukocyte profiles to assess immune responses is also an important tool 1
for the monitoring of stress in fish (Davis et al., 2008; Souza Neves et al., 2014; Zebral et 2
al., 2015). Brazilian flounder exposed to intermediate concentrations of ammonia (0.28 mg 3
NH3-N.L-1
on day 1) and nitrite (10.43 mg NO2-N.L-1
on day 5), and after recovery for 4
those previously exposed to 0.28 and 0.57 mg NH3-N.L-1
, presented increased proportion of 5
monocytes and/or granulocytes, and reduced number of lymphocytes. This pattern is 6
described as a common secondary stress response in fish (Davis et al., 2008) and represents 7
an innate immune response (Miller et al., 1998). Increased proportion of granulocytes, and 8
decreased lymphocytes were observed in rainbow trout (Vosyliene and Kazlauskiene, 9
2004) and common carp Cyprinus carpio (Dabrowska and Wlasow, 1986) exposed to 10
sublethal levels of ammonia. Saoud et al. (2014) demonstrated an increased proportion of 11
eosinophils and neutrophils, two types of granulocytes, during exposure of rabitfish 12
Siganus rivulatus for 56 days to nitrite (up to 40 mg NO2-N.L-1
). Immune response of 13
Brazilian flounder exposed to intermediate concentrations revealed a protective mechanism 14
response at these concentrations. However, at higher concentrations or longer exposure, 15
this response was not activated probably due to the higher magnitude of stress (Svobodova 16
et al. 1994), as observed in mrigal Cirrhinus mrigala (Das et al., 2004) and rabitfish S. 17
rivulatus (Saoud et al., 2014) exposed to ammonia and nitrite, respectively. 18
Otherwise, irrespective of concentration, exposure to ammonia induced a decreased 19
proportion of granulocytes at day 5, indicating an immunosuppressive effect of ammonia 20
and/or a migration of these cells from blood stream to other tissues. The suppression of the 21
immune system responses increases the susceptibility to diseases during stress (Nardocci et 22
al., 2014), which can be a serious problem for aquaculture development, especially at high 23
stocking densities. 24
Briefly, the alterations in secondary stress responses of Brazilian flounder were 25
present even in fish exposed to the lowest concentration of either compounds (0.12 mg 26
NH3-N.L-1
and 5.72 mg NO2-N.L-1
). Thus, these are defined as the lowest-observable-effect 27
concentration for the species and provide relevant information for the establishment of safe 28
thresholds of NH3-N and NO2-N concentrations in production systems. The findings of this 29
study also demonstrated that recovery responses after transfer of Brazilian flounder to good 30
quality water for a period of 10 days were dependent both on the concentration and toxic 31

46
compound to which the fish were exposed. The return of all parameters to basal levels was 1
demonstrated in treatment 5.72 mg NO2-N.L-1
. As for the other treatments, only some 2
parameters were restored to normal levels (as in treatments 0.12 mg NH3-N.L-1
; 10.43 and 3
15.27 mg NO2-N.L-1
) or no recovery was observed (as in the case of 0.28 and 0.57 mg 4
NH3-N.L-1
treatments), suggesting that a longer recovery time is necessary, especially for 5
fish exposed to ammonia. 6
7
5. Conclusion 8
9
Exposure to ammonia and nitrite caused metabolic, ionic and acid-base 10
disturbances, with modulation of immune responses in juvenile Brazilian flounder. In this 11
perspective, concentrations at 0.12 mg NH3-N.L-1
and 5.72 mg NO2-N.L-1
should be 12
avoided in production systems in order to prevent physiological disorders, which are likely 13
to negatively impact P. orbignyanus performance reared under intensive production 14
systems. Furthermore, only fish exposed to 5.72 mg NO2-N.L-1
following a 10-days 15
recovery period showed complete resumption of normal physiological condition. 16
17
Acknowledgements 18
19
This study was supported by research funds from Conselho Nacional de Pesquisa e 20
Desenvolvimento Científico (CNPq) and Coordenação de Aperfeiçoamento de Pessoal de 21
Nível Superior (CAPES). The authors are grateful to CNPq for research fellowships 22
provided for Dr. L. Garcia, Dr. L. Sampaio and Dr. L. Romano, and to CAPES for a PhD 23
scholarship provided for MSc. Lucas C. Maltez. 24
25
References 26
27
Aggergaard, S., Jensen, F. B., 2001. Cardiovascular changes and physiological response 28
during nitrite exposure in rainbow trout. J. Fish Biol. 59, 13-27. 29
Baldisserotto, B., Martos-Sitcha, J. A., Menezes, C. C., Toni, C., Prati, R. L., Garcia, L., 30
Salbegoa, J., Mancera, J. M., Martínez-Rodríguez, G., 2014. The effects of ammonia and 31
47
water hardness on the hormonal, osmoregulatory and metabolic responses of the freshwater 1
silver catfish Rhamdia quelen. Aquat. Toxicol. 152, 341-352. 2
Barbas, L. A. L., Stringhetta, G. R., de Oliveira Garcia, L., Figueiredo, M. R. C., & 3
Sampaio, L. A., 2016. Jambu, Spilanthes acmella as a novel anaesthetic for juvenile 4
tambaqui, Colossoma macropomum: Secondary stress responses during recovery. 5
Aquaculture 456, 70-75. 6
Barton, B. A., 2002. Stress in fishes: a diversity of responses with particular reference to 7
changes in circulating corticosteroids. Integr. Comp. Biol. 42, 517-525. 8
Bath, R. N., Eddy, F. B., 1980. Transport of nitrite across fish gills. J. Exp. Zool. 214, 119-9
121. 10
Beaumont, M. W., Taylor, E. W., Butler, P. J., 2000. The resting membrane potential of 11
white muscle from brown trout (Salmo trutta) exposed to copper in soft, acidic water. J. 12
Exp. Biol. 203, 2229-2236. 13
Bendschneider, K., Robinson, R.J.,1952. A new spectrophotometric method for the 14
determination of nitrite in sea water. J. Mar.Res. 11, 87-96. 15
Bianchini, A., Wasielesky, Jr, W., & Miranda Filho, K. C., 1996. Toxicity of nitrogenous 16
compounds to juveniles of flatfish Paralichthys orbignyanus. Bull. Environ. Contam. 17
Toxicol. 56, 453-459. 18
Binstock, L., Lecar, H., 1969. Ammonium ion currents in the squid giant axon. The J. Gen. 19
Physiol. 53, 342-361. 20
Blancheton, J. P., Attramadal, K. J. K., Michaud, L., d’Orbcastel, E. R., Vadstein, O. 21
(2013). Insight into bacterial population in aquaculture systems and its implication. 22
Aquacult. Eng. 53, 30-39. 23
Bolasina, S. N., 2011. Stress response of juvenile flounder (Paralichthys orbignyanus, 24
Valenciennes 1839), to acute and chronic stressors. Aquaculture. 313, 140-143. 25
Bonga, S. W., 1997. The stress response in fish. Physiol. Rev. 77, 591-625. 26
Calabrese, S., Nilsen, T. O., Kolarevic, J., Ebbesson, L. O. E., Pedrosa, C., Fivelstad, S., 27
Hosfeld, C., Stefansson, S. O., Terjesen, B. F., Takle, H., Martins, C. I. M., Sveier, H., 28

48
Mathisen, F., Imsland, A. K., Handeland, S. O., 2017. Stocking density limits for post-1
smolt Atlantic salmon (Salmo salar L.) with emphasis on production performance and 2
welfare. Aquaculture 468, 363-370. 3
Chew, S. F., Hong, L. N., Wilson, J. M., Randall, D. J., Ip, Y. K., 2003. Alkaline 4
environmental pH has no effect on ammonia excretion in the mudskipper 5
Periophthalmodon schlosseri but inhibits ammonia excretion in the related species 6
Boleophthalmus boddaerti. Physiol. Biochem. Zool. 76, 204-214. 7
Ciji, A., Sahu, N. P., Pal, A. K., Akhtar, M. S., Tincy, V., Mishal, P., Das, P., 2014. Effect 8
of dietary vitamin E and nitrite exposure on growth and metabolic variables of Labeo 9
rohita juveniles. Natl. Acad. Sci. Lett. 37, 123-129. 10
Ciji, A., Sahu, N. P., Pal, A. K., Dasgupta, S., Akhtar, M. S., 2012. Alterations in serum 11
electrolytes, antioxidative enzymes and haematological parameters of Labeo rohita on 12
short-term exposure to sublethal dose of nitrite. Fish Physiol. Biochem. 38, 1355-1365. 13
Clifford, A. M., Goss, G. G., Wilkie, M. P., 2015. Adaptations of a deep sea scavenger: 14
High ammonia tolerance and active NH4+ excretion by the Pacific hagfish (Eptatretus 15
stoutii). Comp. Biochem. Physiol. A Mol. Integr. Physiol. 182, 64-74. 16
Colt, J., 2002. List of spreadsheets prepared as a complement (available in 17
(http://www.fisheries.org/afs/hatchery.html) to the book Fish Hatchery Management, 18
Second edition. Wedemeyer, G.A. (Ed.) American Fisheries Society Publication, p. 751. 19
Dabrowska, H., Własow, T.,1986. Sublethal effect of ammonia on certain biochemical and 20
haematological indicators in common carp (Cyprinus carpio L.). Comp. Biochem. Physiol. 21
C Pharmacol. 83, 179-184. 22
Das, P. C., Ayyappan, S., Jena, J. K., Das, B. K., 2004. Acute toxicity of ammonia and its 23
sub‐lethal effects on selected haematological and enzymatic parameters of mrigal, 24
Cirrhinus mrigala (Hamilton). Aquac. Res. 35, 134-143. 25
Davidson, J., Good, C., Welsh, C., & Summerfelt, S. T., 2014. Comparing the effects of 26
high vs. low nitrate on the health, performance, and welfare of juvenile rainbow trout 27
Oncorhynchus mykiss within water recirculating aquaculture systems. Aquacult. Eng. 59, 28
30-40. 29
49
Davis, A. K., Maney, D. L., Maerz, J. C., 2008. The use of leukocyte profiles to measure 1
stress in vertebrates: a review for ecologists. Funct. Ecol. 22, 760-772. 2
Eaton, A. D., Clesceri, L. S., Rice, E. W., Greenberg, A.E., 2005. Standard methods for the 3
examination of water and wastewater, 21st ed. American Public Health Association, 4
Washington. 5
Espina, S., Alcaraz, G., 1993. Effect of nitrite on the respiratory response of grass carp 6
Ctenopharyngodon idella (Val.) with relation to chloride. Comp. Biochem. Physiol C 7
Pharmacol. Toxicol. Endocrinol. 106, 761-764. 8
Evans, D. H., Piermarini, P. M., Choe, K. P., 2005. The multifunctional fish gill: dominant 9
site of gas exchange, osmoregulation, acid-base regulation, and excretion of nitrogenous 10
waste. Physiol. Rev. 85, 97-177. 11
Gisbert, E., Rodrıguez, A., Cardona, L., Huertas, M., Gallardo, M. A., Sarasquete, C., Sala-12
Rabanald, M., Ibarzd, A., Sánchezd, J., Castello-Orvay, F., 2004. Recovery of Siberian 13
sturgeon yearlings after an acute exposure to environmental nitrite: changes in the 14
plasmatic ionic balance, Na+–K+ ATPase activity, and gill histology. Aquaculture. 239, 15
141-154. 16
Grosell, M., & Jensen, F. B., 2000. Uptake and effects of nitrite in the marine teleost fish 17
Platichthys flesus. Aquat. toxicol. 50, 97-107. 18
Hanley, C. S., Clyde. V. L., Wallace, R. S., Paul-Murphy, J., Patterson, T. A., Keuler, N. 19
S., Sladky, K. K., 2010. Effects of anesthesia and surgery on serial blood gas values and 20
lactate concentrations in yellow perch (Perca flavescens), walleye pike (Sander vitreus), 21
and koi (Cyprinus carpio). J. Am. Vet. Med. Assoc. 236, 1104-1108. 22
Harter, T. S., Shartau, R. B., Brauner, C. J., & Farrell, A. P., 2014. Validation of the i-23
STAT system for the analysis of blood parameters in fish. Conserv Physiol 2, cou037. 24
Hvas, M., Damsgaard, C., Jensen, F. B., & Bayley, M., 2016. The effect of environmental 25
hypercapnia and size on nitrite toxicity in the striped catfish (Pangasianodon 26
hypophthalmus). Aquat. Toxicol. 176, 151-160. 27
Ip, Y. K., Chew, S. F., 2010. Ammonia production, excretion, toxicity, and defense in fish: 28
A review. Front. Physiol. 1, 134. 29

50
Jensen, F. B., 1992. Influence of haemoglobin conformation, nitrite and eicosanoids on K+ 1
transport across the carp red blood cell membrane. J. Exp. Biol. 171, 349-371. 2
Jensen, F. B., 2003. Nitrite disrupts multiple physiological functions in aquatic animals. 3
Comp. Biochem. Physiol. A Mol. Integ. Physiol. 135, 9-24. 4
Jia, R., Han, C., Lei, J. L., Liu, B. L., Huang, B., Huo, H. H., Yin, S. T., 2015. Effects of 5
nitrite exposure on haematological parameters, oxidative stress and apoptosis in juvenile 6
turbot (Scophthalmus maximus). Aquat. Toxicol. 169, 1-9. 7
Knoph, M. B., Thorud, K., 1996. Toxicity of ammonia to Atlantic salmon (Salmo salar L.) 8
in seawater—Effects on plasma osmolality, ion, ammonia, urea and glucose levels and 9
hematologic parameters. Comp. Biochem. Physiol. A Physiol. 113, 375-381. 10
Knudsen, P. K., Jensen, F. B., 1997. Recovery from nitrite-induced methaemoglobinaemia 11
and potassium balance disturbances in carp. Fish Physiol.Biochem.. 16, 1-10. 12
McCormick, S. D., 2001. Endocrine control of osmoregulation in teleost fish. Am. Zool. 13
41, 781-794. 14
Medeiros, R. S., Lopez, B. A., Sampaio, L. A., Romano, L. A., & Rodrigues, R. V., 2016. 15
Ammonia and nitrite toxicity to false clownfish Amphiprion ocellaris. Aquacult. Int. 24, 16
985–993. 17
Miller, N., Wilson, M., Bfufltén, E., Stuge, T., Warr, G., Ciem, W., 1998. Functional and 18
molecular characterization of teleost leukocytes. Immunol. Rev. 166, 187-197. 19
Millner, R., Walsh, S. J., Diaz de Astarloa, J. M., 2005. Atlantic flatfish fisheries. In: 20
Gibson, R. N., Nash, R. D. M., Geffen, A. J., Van Der Veer, H. W. (Eds.), Flatfishes: 21
Biology and Exploitation. Blackwell Science Ltd, Oxford, pp. 240-271. 22
Miron, D. D. S., Moraes, B., Becker, A. G., Crestani, M., Spanevello, R., Loro, V. L., 23
Baldisserotto, B., 2008. Ammonia and pH effects on some metabolic parameters and gill 24
histology of silver catfish, Rhamdia quelen (Heptapteridae). Aquaculture. 277, 192-196. 25
Nardocci, G., Navarro, C., Cortés, P. P., Imarai, M., Montoya, M., Valenzuela, B., Jarab, 26
P., Acuña-Castillob, C., Fernández, R., 2014. Neuroendocrine mechanisms for immune 27
system regulation during stress in fish. Fish Shellfish Immunol. 40, 531-538. 28

51
Nawata, C. M., Walsh, P. J., Wood, C. M., 2015. Physiological and molecular responses of 1
the spiny dogfish shark (Squalus acanthias) to high environmental ammonia: scavenging 2
for nitrogen. J. Exp. Biol. 218, 238-248. 3
Okamoto, M. H., Sampaio, L. A., 2012. Sobrevivência e crescimento de juvenis do 4
linguado Paralichthys orbignyanus criados em diferentes temperaturas. Atlântica. 34, 57-5
61. 6
Paust, L. O., Foss, A., Imsland, A. K., 2011. Effects of chronic and periodic exposure to 7
ammonia on growth, food conversion efficiency and blood physiology in juvenile Atlantic 8
halibut (Hippoglossus hippoglossus L.). Aquaculture. 315, 400-406. 9
Perry, S. F., Gilmour, K. M., 2006. Acid–base balance and CO2 excretion in fish: 10
unanswered questions and emerging models. Respir. Physiol.Neurobiol. 154, 199-215. 11
Person-Le Ruyet, J., Lamers, A., Roux, A. L., Severe, A., Boeuf, G., Mayer‐Gostan, N., 12
2003. Long‐term ammonia exposure of turbot: effects on plasma parameters. J. Fish Biol. 13
62, 879-894. 14
Randall, D. J., Tsui, T. K. N., 2002. Ammonia toxicity in fish. Mar. Pollut. Bull.. 45, 17-23. 15
Remen, M., Imsland, A. K., Stefansson, S. O., Jonassen, T. M., Foss, A., 2008. Interactive 16
effects of ammonia and oxygen on growth and physiological status of juvenile Atlantic cod 17
(Gadus morhua). Aquaculture. 274, 292-299. 18
Rosenfeld, G.,1947. Corante pancrômico para hematologia e citologia clínica. Nova 19
combinação dos componentes do May-Grünwald e do Giemsa num só corante de emprego 20
rápido. Mem. Inst. Butantan, 20, 329-334. 21
Sampaio, L. A., Bianchini, A., 2002. Salinity effects on osmoregulation and growth of the 22
euryhaline flounder Paralichthys orbignyanus. J. Exp. Mar. Biol. Ecol. 269, 187-196. 23
Sampaio, L. A., Freitas, L. S., Okamoto, M. H., Louzada, L. R., Rodrigues, R. V., Robaldo, 24
R. B., 2007. Effects of salinity on Brazilian flounder Paralichthys orbignyanus from 25
fertilization to juvenile settlement. Aquaculture. 262, 340-346. 26
Sampaio, L. A., Robaldo, R. B., Bianchini, A., 2008. Hormone‐induced ovulation, natural 27
spawning and larviculture of Brazilian flounder Paralichthys orbignyanus (Valenciennes, 28
1839). Aquac. Res. 39, 712-717. 29

52
Saoud, P., Naamani, S., Ghanawi, J., Nasser, N., 2014. Effects of acute and chronic nitrite 1
exposure on rabbitfish Siganus rivulatus growth, hematological parameters, and gill 2
histology. J. Aquac. Res. Development. 5, 1-9. 3
Schmidt-Nielsen, K., 1997. Animal physiology: adaptation and environment, fifth ed. 4
Cambridge University Press, Cambridge. 5
Sinha, A. K., Rasoloniriana, R., Dasan, A. F., Pipralia, N., Blust, R., De Boeck, G., 2015. 6
Interactive effect of high environmental ammonia and nutritional status on 7
ecophysiological performance of European sea bass (Dicentrarchus labrax) acclimated to 8
reduced seawater salinities. Aquat. Toxicol. 160, 39-56. 9
Souza Neves, M., Barbas, L. A. L. Fujimoto, R. Y., 2014. Hematology and recovery 10
response in jacundá, Crenicichla saxatilis (Linnaeus, 1758) after short‐term handling stress. 11
J. Appl. Ichthyol. 30, 42-47. 12
Svobodova Z., Vykusova B., Machova J., 1994. The effects of pollutants on selected 13
haematological and biochemical parameters in fish. In: Muller, R., Lloyd, R. (Eds.), 14
Sublethal and Chronic Effects of Pollutants on Freshwater Fish. FAO Fishing News Books, 15
Oxford, pp. 39-52. 16
Terlouw, E. M. C., Arnould, C., Auperin, B., Berri, C., Le Bihan-Duval, E., Deiss, V., 17
Lefèvre, F., Lensink, B. J. & Mounier, L. 2008. Pre-slaughter conditions, animal stress and 18
welfare: current status and possible future research. Animal. 2, 1501-1517. 19
UNESCO., 1983. Chemical methods for use in marine environmental monitoring. Manual 20
and Guides 12. Intergovernamental Oceanographic Commissiony. Paris. 21
Vedel, N. E., Korsgaard, B., Jensen, F. B., 1998. Isolated and combined exposure to 22
ammonia and nitrite in rainbow trout (Oncorhynchus mykiss): effects on electrolyte status, 23
blood respiratory properties and brain glutamine/glutamate concentrations. Aquat. Toxicol. 24
41,325-342. 25
Vosylienė, M. Z., Kazlauskienė, N., 2004. Comparative studies of sublethal effects of 26
ammonia on rainbow trout (Oncorhynchus mykiss) at different stages of its development. 27
Acta Zool. Litu. 14, 13-18. 28

53
Wasielesky, W., Bianchini, A., Santos, M. H., Poersch, L. H., 1997. Tolerance of juvenile 1
flatfish Paralichthys orbignyanus to acid stress. J. World Aquac. Soc. 28, 202-204. 2
Wedemeyer, G. (2012). Physiology of Fish in Intensive Culture Systems. Springer Science 3
& Business Media. 4
Weihrauch, D., Wilkie, M. P., Walsh, P. J., 2009. Ammonia and urea transporters in gills of 5
fish and aquatic crustaceans. J. Exp. Biol. 212, 1716-1730. 6
Wilkie, M. P., Wood, C. M., 1996. The adaptations of fish to extremely alkaline 7
environments. Comp. Biochem. Physiol. B Biochem. Mol. Biol. 113, 665-673. 8
Wilkie, M.P., 2002. Ammonia excretion and urea handling by fish gills: present 9
understanding and future research challenges. J. Exp. Zool. 293, 284–301. 10
Williams, E. M., Nelson, J. A., Heisler, N., 1997. Cardio‐respiratory function in carp 11
exposed to environmental nitrite. J. Fish Biol. 50, 137-149. 12
Wilson, R. W., Taylor, E. W., 1992. Transbranchial ammonia gradients and acid-base 13
responses to high external ammonia concentration in rainbow trout (Oncorhynchus mykiss) 14
acclimated to different salinities. J. Exp. Biol. 166, 95-112. 15
Woo, N. Y. S., Chiu, S. F., 1997. Metabolic and osmoregulatory responses of the sea bass 16
Lates calcarifer to nitrite exposure. Environ. Toxicol. Water Qual. 12, 257-264. 17
Wood, C. M., Nawata, C. M., 2011. A nose-to-nose comparison of the physiological and 18
molecular responses of rainbow trout to high environmental ammonia in seawater versus 19
freshwater. J. Exp. Biol. 214, 3557-3569. 20
Yang, W., Xiang, F., Sun, H., Chen, Y., Minter, E., & Yang, Z. 2010. Changes in the 21
selected hematological parameters and gill Na+/K+ ATPase activity of juvenile crucian 22
carp Carassius auratus during elevated ammonia exposure and the post-exposure recovery. 23
Biochem. Syst. Ecol. 38, 557-562. 24
Zebral, Y. D., Zafalon‐Silva, B., Mascarenhas, M. W., Robaldo, R. B., 2015. Leucocyte 25
profile and growth rates as indicators of crowding stress in pejerrey fingerlings 26
(Odontesthes bonariensis). Aquac. Res. 46, 2270-2276. 27
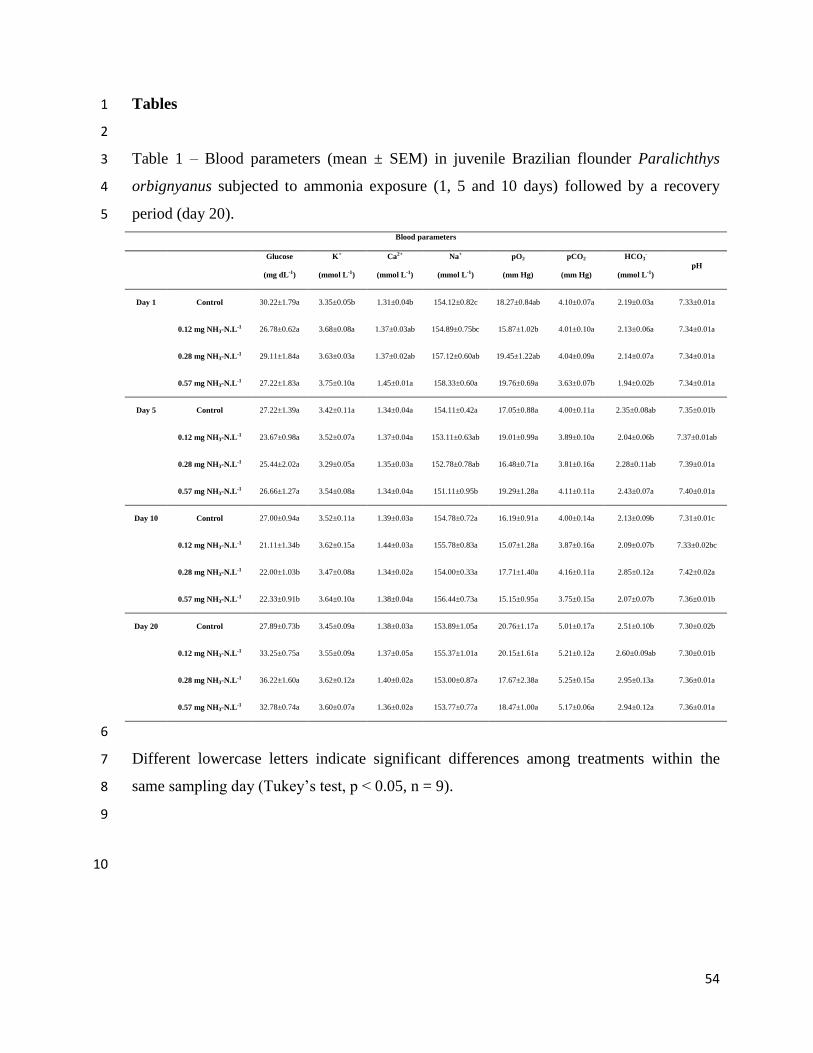
54
Tables 1
2
Table 1 – Blood parameters (mean ± SEM) in juvenile Brazilian flounder Paralichthys 3
orbignyanus subjected to ammonia exposure (1, 5 and 10 days) followed by a recovery 4
period (day 20). 5
Blood parameters
Glucose
(mg dL-1)
K+
(mmol L-1)
Ca2+
(mmol L-1)
Na+
(mmol L-1)
pO2
(mm Hg)
pCO2
(mm Hg)
HCO3-
(mmol L-1)
pH
Day 1 Control 30.22±1.79a 3.35±0.05b 1.31±0.04b 154.12±0.82c 18.27±0.84ab 4.10±0.07a 2.19±0.03a 7.33±0.01a
0.12 mg NH3-N.L-1 26.78±0.62a 3.68±0.08a 1.37±0.03ab 154.89±0.75bc 15.87±1.02b 4.01±0.10a 2.13±0.06a 7.34±0.01a
0.28 mg NH3-N.L-1 29.11±1.84a 3.63±0.03a 1.37±0.02ab 157.12±0.60ab 19.45±1.22ab 4.04±0.09a 2.14±0.07a 7.34±0.01a
0.57 mg NH3-N.L-1 27.22±1.83a 3.75±0.10a 1.45±0.01a 158.33±0.60a 19.76±0.69a 3.63±0.07b 1.94±0.02b 7.34±0.01a
Day 5 Control 27.22±1.39a 3.42±0.11a 1.34±0.04a 154.11±0.42a 17.05±0.88a 4.00±0.11a 2.35±0.08ab 7.35±0.01b
0.12 mg NH3-N.L-1 23.67±0.98a 3.52±0.07a 1.37±0.04a 153.11±0.63ab 19.01±0.99a 3.89±0.10a 2.04±0.06b 7.37±0.01ab
0.28 mg NH3-N.L-1 25.44±2.02a 3.29±0.05a 1.35±0.03a 152.78±0.78ab 16.48±0.71a 3.81±0.16a 2.28±0.11ab 7.39±0.01a
0.57 mg NH3-N.L-1 26.66±1.27a 3.54±0.08a 1.34±0.04a 151.11±0.95b 19.29±1.28a 4.11±0.11a 2.43±0.07a 7.40±0.01a
Day 10 Control 27.00±0.94a 3.52±0.11a 1.39±0.03a 154.78±0.72a 16.19±0.91a 4.00±0.14a 2.13±0.09b 7.31±0.01c
0.12 mg NH3-N.L-1 21.11±1.34b 3.62±0.15a 1.44±0.03a 155.78±0.83a 15.07±1.28a 3.87±0.16a 2.09±0.07b 7.33±0.02bc
0.28 mg NH3-N.L-1 22.00±1.03b 3.47±0.08a 1.34±0.02a 154.00±0.33a 17.71±1.40a 4.16±0.11a 2.85±0.12a 7.42±0.02a
0.57 mg NH3-N.L-1 22.33±0.91b 3.64±0.10a 1.38±0.04a 156.44±0.73a 15.15±0.95a 3.75±0.15a 2.07±0.07b 7.36±0.01b
Day 20 Control 27.89±0.73b 3.45±0.09a 1.38±0.03a 153.89±1.05a 20.76±1.17a 5.01±0.17a 2.51±0.10b 7.30±0.02b
0.12 mg NH3-N.L-1 33.25±0.75a 3.55±0.09a 1.37±0.05a 155.37±1.01a 20.15±1.61a 5.21±0.12a 2.60±0.09ab 7.30±0.01b
0.28 mg NH3-N.L-1 36.22±1.60a 3.62±0.12a 1.40±0.02a 153.00±0.87a 17.67±2.38a 5.25±0.15a 2.95±0.13a 7.36±0.01a
0.57 mg NH3-N.L-1 32.78±0.74a 3.60±0.07a 1.36±0.02a 153.77±0.77a 18.47±1.00a 5.17±0.06a 2.94±0.12a 7.36±0.01a
6
Different lowercase letters indicate significant differences among treatments within the 7
same sampling day (Tukey’s test, p < 0.05, n = 9). 8
9
10

55
Table 2 – Differential leukocyte count (monocytes, lymphocytes and granulocytes) (mean ± 1
SEM) in juvenile Brazilian flounder Paralichthys orbignyanus exposed to ammonia (1, 5 2
and 10 days) followed by a recovery period (day 20). 3
Monocyte (%) Granulocyte (%) Lymphocyte (%)
Day 1 Control 3.38±0.87b 3.16±0.86ab 93.45±0.86a
0.12 mg NH3-N.L-1
1.79±0.49b 3.32±0.50ab 94.88±0.55a
0.28 mg NH3-N.L-1
6.89±0.36a 5.83±1.18a 87.28±1.29b
0.57 mg NH3-N.L-1
3.62±0.55b 1.94±0.55b 94.44±0.78a
Day 5 Control 2.69±0.82a 5.64±1.23a 92.80±1.59a
0.12 mg NH3-N.L-1
2.97±0.91a 1.24±0.47b 95.80±1.27a
0.28 mg NH3-N.L-1
4.27±0.69a 1.12±0.27b 94.61±0.78a
0.57 mg NH3-N.L-1
5.13±1.06a 1.49±0.30b 93.38±0.94a
Day 10 Control 0.83±0.54a 1.48±0.56a 97.69±1.05a
0.12 mg NH3-N.L-1
0.96±0.26a 0.00±0.00a 99.04±0.26a
0.28 mg NH3-N.L-1
1.71±0.52a 0.99±0.44a 97.30±0.69a
0.57 mg NH3-N.L-1
1.93±0.83a 0.19±0.16a 97.87±0.87a
Day 20 Control 1.23±0.39ab 0.74±0.30c 98.02±0.67a
0.12 mg NH3-N.L-1
0.66±0.15b 1.32±0.15bc 98.01±0.26a
0.28 mg NH3-N.L-1
1.47±0.40ab 4.33±1.35ab 94.19±1.58b
0.57 mg NH3-N.L-1
3.55±1.18a 4.68±0.49a 91.77±1.04b
4
Different lowercase letters indicate significant differences among treatments within the 5
same sampling day (Tukey’s test, p < 0.05, n = 9). 6
7
8

56
Table 3 – Blood parameters (mean ± SEM) in juvenile Brazilian flounder Paralichthys 1
orbignyanus exposed to nitrite (1, 5 and 10 days) followed by a recovery period (day 20). 2
Blood parameters
Glucose
(mg dL-1)
K+
(mmol L-1)
Ca2+
(mmol L-1)
Na+
(mmol L-1)
pO2
(mm Hg)
pCO2
(mm Hg)
HCO3-
(mmol L-1)
pH
Day 1 Control 27.67±2.83a 3.61±0.05ab 1.27±0.05a 155.55±0.97a 12.62±0.97a 5.67±0.06a 3.10±0.10a 7.34±0.01b
5.72 mg NO2-N.L-1 29.22±1.25a 3.52±0.09ab 1.13±0.05a 156.33±0.50a 11.41±0.83a 5.06±0.17b 3.24±0.11a 7.41±0.01a
10.43 mg NO2-N.L-1 28.67±2.35a 3.38±0.04b 1.15±0.06a 154.22±0.76a 13.86±1.05a 4.91±0.13b 3.21±0.10a 7.43±0.01a
15.27 mg NO2-N.L-1 28.44±1.24a 3.76±0.06a 1.22±0.07a 154.22±1.12a 12.18±1.26a 4.77±0.07b 3.10±0.08a 7.40±0.01a
Day 5 Control 25.89±1.54a 3.51±0.12b 1.12±0.04a 155.67±0.47b 13.43±1.21a 5.21±0.10a 3.24±0.07a 7.41±0.01a
5.72 mg NO2-N.L-1 27.11±0.48a 3.44±0.07b 1.11±0.05a 155.55±0.41b 14.26±0.58a 4.46±0.18b 2.78±0.11b 7.40±0.02a
10.43 mg NO2-N.L-1 28.44±1.51a 3.47±0.14b 1.19±0.03a 156.42±0.28b 15.17±0.51a 4.71±0.08b 2.81±0.13b 7.37±0.01ab
15.27 mg NO2-N.L-1 26.67±1.30a 4.04±0.05a 1.07±0.04a 158.44±0.18a 16.43±0.99a 4.45±0.10b 2.38±0.07c 7.34±0.02b
Day 10 Control 23.67±0.75b 3.42±0.09b 1.05±0.4a 154.33±0.83a 12.68±1.19a 4.82±0.18a 2.77±0.12a 7.37±0.01b
5.72 mg NO2-N.L-1 24.11±0.39b 3.57±0.05ab 1.19±0.07a 155.44±0.69a 12.65±0.68a 4.19±0.21b 2.87±0.12a 7.43±0.01a
10.43 mg NO2-N.L-1 31.22±0.90a 3.73±0.07a 1.09±0.06a 154.44±0.47a 13.21±1.11a 4.20±0.13b 3.03±0.12a 7.46±0.01a
15.27 mg NO2-N.L-1 33.11±0.89a 3.78±0.08a 1.21±0.05a 155.78±0.36a 13.96±0.71a 4.01±0.07b 2.74±0.06a 7.43±0.01a
Day 20 Control 25.44±1.48a 3.58±0.06a 1.19±0.05a 155.11±0.61a 15.28±1.08a 5.35±0.16a 3.17±0.05a 7.41±0.01a
5.72 mg NO2-N.L-1 22.45±1.16a 3.58±0.13a 1.19±0.03a 155.56±0.44a 14.10±1.00a 5.51±0.10a 3.37±0.08a 7.38±0.01ab
10.43 mg NO2-N.L-1 24.11±0.68a 3.68±0.09a 1.12±0.07a 155.55±0.71a 14.07±0.55a 5.08±0.16a 2.83±0.08b 7.36±0.01b
15.27 mg NO2-N.L-1 26.77±1.15a 3.52±0.05a 1.00±0.05a 151.78±0.94b 13.96±0.75a 5.39±0.12a 2.87±0.06b 7.31±0.01c
3
Different lowercase letters indicate significant differences among treatments within the 4
same sampling day (Tukey’s test, p < 0.05, n = 9). 5
6
7
8
9
10
11
12
13

57
Table 4 – Differential leukocyte count (monocytes, lymphocytes and granulocytes) (mean ± 1
SEM) in juvenile Brazilian flounder Paralichthys orbignyanus exposed to nitrite (1, 5 and 2
10 days) following a recovery period (day 20). 3
4
Monocyte (%) Granulocyte (%) Lymphocyte (%)
Day 1 Control 3.40±1.74a 2.33±1.20a 93.67±2.73a
5.72 mg NO2-N.L-1
2.29±0.33a 4.55±2.28a 93.16±2.45a
10.43 mg NO2-N.L-1
3.62±1.45a 3.27±0.88a 93.11±2.09a
15.27 mg NO2-N.L-1
2.50±1.50a 2.22±0.78a 95.28±2.25a
Day 5 Control 1.32±0.34b 1.31±0.33b 97.37±0.34a
5.72 mg NO2-N.L-1
1.96±0.59b 1.93±0.54b 96.11±0.54a
10.43 mg NO2-N.L-1
7.49±0.86a 14.62±2.67a 77.90±3.53b
15.27 mg NO2-N.L-1
1.29±0.85b 0.65±0.65b 98.06±0.97a
Day 10 Control 1.64±0.86a 4.26±1.18a 94.11±2.04a
5.72 mg NO2-N.L-1
2.22±0.85a 4.19±1.14a 93.55±1.36a
10.43 mg NO2-N.L-1
2.99±0.58a 2.50±0.87a 94.51±1.45a
15.27 mg NO2-N.L-1
2.39±0.44a 5.89±2.62a 91.71±2.04a
Day 20 Control 1.90±1.10a 1.58±0.83ab 96.52±0.82ab
5.72 mg NO2-N.L-1
0.66±0.33a 2.30±1.30ab 97.05±1.50ab
10.43 mg NO2-N.L-1
1.97±0.01a 4.61±1.20a 93.40±1.20b
15.27 mg NO2-N.L-1
1.28±0.33a 0.31±0.32b 98.41±0.32a
5
Different lowercase letters indicate significant differences among treatments within the 6
same sampling day (Tukey’s test, p < 0.05, n = 9). 7
8
9
10

58
CAPÍTULO 2 1
2
Ammonia exposure and subsequent recovery trigger oxidative stress responses in 3
juveniles of Brazilian flounder Paralichthys orbignyanus 4
5
Lucas Campos Maltez1, Giovanna Rodrigues Stringhetta
1, Alain Danilo Enamorado
2, Marcelo Hideo 6
Okamoto3, Luis Alberto Romano
4, José Maria Monserrat
2, Luís André Sampaio
3 and Luciano Garcia
1* 7
8 1Laboratório de Aquacultura Continental, Instituto de Oceanografia, Universidade Federal do Rio Grande – 9
FURG, Rio Grande, RS, Brasil. 10 2Laboratório de Bioquímica Funcional de Organismos Aquáticos, Universidade Federal do Rio Grande – 11
FURG, Rio Grande, RS, Brasil. 12 3Laboratório de Piscicultura Estuarina e Marinha, Instituto de Oceanografia, Universidade Federal do Rio 13
Grande – FURG, Rio Grande, RS, Brasil. 14 4Laboratório de Patologia e Imunologia de Organismos Aquáticos, Instituto de Oceanografia, Universidade 15
Federal do Rio Grande – FURG, Rio Grande, RS, Brasil. 16
17
*Corresponding author: Laboratório de Aquacultura Continental, Instituto de Oceanografia, 18
Universidade Federal do Rio Grande – FURG, 96201-900, Rio Grande, RS, Brasil. Phone: 55 53 19
3237-3003; E-mail address: [email protected] 20
21
22
23
24
25
26
27
28
29
30
31
32
Artigo formatado e submetido para a revista Fish Physiology and Biochemistry 33
34

59
Abstract 1
2
It was evaluated the effects of ammonia exposure and recovery on oxidative stress 3
parameters and histology of juvenile Brazilian flounder Paralichthys orbignyanus. The fish 4
were exposed to 0.05 (control), 0.12, 0.28 and 0.57 mg NH3-N L-1
for 10 days followed by 5
the same recovery time in ammonia free-water. Gill, liver and muscle samples (n=9) were 6
collected after 1, 5 and 10 days of exposure and after recovery for oxidative stress analysis 7
(Antioxidant Capacity Against Peroxyl Radicals (ACAP); Glutathione-S-transferase (GST) 8
activity; lipoperoxidation levels measured through thiobarbituric acid reactive substances 9
(TBARS) content). For the histological assessment, it was collected gill, liver, and brain 10
samples. Exposure to all NH3-N concentrations induced different time- and concentration-11
dependent changes in oxidative stress parameters. Reduced antioxidant capacity of liver 12
and muscle, and enhanced TBARS levels of gill and liver were demonstrated. Differently, 13
high ammonia concentration elicited lower hepatic TBARS levels. Enhanced GST activity 14
in all organs and increased antioxidant capacity of gills were also observed. No ammonia-15
induced histopathological effects were demonstrated. After recovery, most of the 16
parameters (liver ACAP, GST activity in muscle and liver, and TBARS in gills) returned to 17
baseline levels. However, liver TBARS and gills GST activity remained altered in 18
treatment 0.57 mg NH3-N L-1
. The recovery period also led to a decrease in gills 19
antioxidant capacity and an increase in muscle antioxidant capacity. In conclusion, 20
concentrations from 0.12 mg NH3-N L-1
induce oxidative stress and antioxidant responses 21
in juvenile Brazilian flounder. Moreover, 10-day recovery period was not sufficient to 22
restore fish homeostasis. 23
Keywords: nitrogen compound; lipid peroxidation; antioxidant system; glutathione-S-24
transferase; histology 25
26
27
28
29

60
Introduction 1
2
Aquaculture is the fastest growing animal food production sector, mainly due to the 3
stagnation of global capture fishery production and rapidly rising in demand for seafood 4
(FAO 2016). The use of recirculating aquaculture system (RAS) is an interesting strategy 5
for intensification of production in a more environmentally sustainable manner, reducing 6
land and freshwater use and minimizing wastewater production (Klinger and Naylor 2012). 7
One of the most limiting factors in intensive aquaculture system is the buildup of 8
nitrogenous compounds, mainly ammonia due to its high toxicity to fish (Randall and Tsui 9
2002). In RAS, ammonia is removed in biofilters by nitrification process, in which 10
nitrifying bacteria oxidize ammonia into nitrite and nitrite into nitrate (Schreier et al. 2010). 11
However, a system functioning in an inadequate way or not properly planned can lead to an 12
insufficient nitrification process to oxidize the input of ammonia, which in turn 13
accumulates in the water. 14
In aquatic environments, ammonia exists in ionized (NH4+) and un-ionized (NH3) 15
forms and the NH3 form can readily diffuse across gill membranes. Furthermore, ammonia 16
excretion is inhibited at high NH3 due to reduced gradient for diffusive elimination (Wilkie 17
and Wood 1996). Therefore, the buildup of ammonia in blood and tissues can lead to 18
physiological, biochemical, morphological and behavioral changes in fish (Schram et al. 19
2010; Kolarevic et al. 2012; Dong et al. 2013; Baldisserotto et al. 2014; Cheng et al. 2015). 20
These alterations can result in reduction of growth performance (Paust et al. 2011), 21
increased susceptibility to diseases (Ackerman et al. 2006) and death (Medeiros et al. 22
2016), all factors that affect the production of aquaculture systems. 23
Oxidative stress is a biochemical response frequently triggered by environmental 24
variables and pollutants in aquatic organisms (Monserrat et al. 2007; Lushchak 2011; 25
Stoliar and Lushchak 2012). This condition is defined as a transiently or chronically 26
enhanced concentration of reactive oxygen species (ROS) due to an unbalanced state 27
between pro-oxidants and antioxidants, resulting in damage of cellular constituents, such as 28
DNA, proteins, and lipids (Lushchak 2011; Halliwell and Gutteridge 2015). In recent years, 29
studies have shown that exposure of fish to ammonia can induce oxidative stress by 30
enhancing ROS production and/or by a decrease in antioxidant defenses (Ching et al. 2009; 31

61
Hegazi et al. 2010; Yang et al. 2010a; Sinha et al. 2014; Sun et al. 2014; Cheng et al. 2015). 1
However, the response of oxidative stress parameters after recovery in ammonia free-water 2
is still unknown. 3
The use of histopathological investigations is also a sensitive tool to assess health 4
status of fish since tissue alterations of target organs may occur due to environmental 5
stressors and related biochemical responses (Schwaiger et al. 1997; Rašković et al. 2013). 6
Several studies demonstrate that exposure to environmental ammonia induces tissue 7
injuries in different fish organs, such as gill, liver, and brain (Roumieh et al. 2013; 8
Rodrigues et al. 2014). The recovery of damaged tissues was also demonstrated for fish 9
kept in ammonia free water for 7 or 14 days (Ravindrababu and Neeraja 2012). 10
The Brazilian flounder Paralichthys orbignyanus occurs in estuaries and shallow 11
coastal waters of the southwestern Atlantic Ocean, from Rio de Janeiro, Brazil to Mar del 12
Plata, Argentina (Figueiredo and Menezes 2000; Millner et al. 2005). This species is an 13
important fishing resource in these areas and presents a wide tolerance to water quality 14
parameters (Bianchini et al. 1996; Wasielesky et al. 1997; Wasielesky et al. 1998; Sampaio 15
and Bianchini 2002, Okamoto and Sampaio 2012; Garcia et al. 2015) and handling 16
procedures (Bolasina 2011). In addition, the spawning, larviculture and juvenile production 17
has been successfully performed (Sampaio et al. 2007; Sampaio et al. 2008). Thus, the 18
Brazilian flounder is a species with a great potential to intensive aquaculture (Sampaio et 19
al. 2007). However, limited information exists related to the toxicity of ammonia to this 20
species (Bianchini et al. 1996) and more studies are necessary to evaluate the mechanisms 21
of toxicity and defense strategies during exposure and recovery. 22
Therefore, the aim of the present study was to assess the effects of sub-lethal 23
ammonia exposure and followed recovery on oxidative stress parameters (glutathione-S-24
transferase (GST) activity , total antioxidant capacity against peroxyl radicals (ACAP) and 25
lipid peroxidation levels) and histology of different juvenile Brazilian flounder tissues. 26
27
28
29
Materials and methods 30

62
1
Fish and experimental conditions 2
3
The juveniles Brazilian flounder (107.3 ± 1.9 g and 21.2 ± 0.1 cm) were produced 4
and reared at the Aquaculture Marine Station of the Universidade Federal do Rio Grande - 5
FURG in Rio Grande do Sul, Southern Brazil. The experimental protocol and use of fish 6
were approved by the Committee on Animal Experimentation of FURG under registration 7
number 23116.001030/2016-15. 8
Fish (15 per tank) were distributed randomly in 12 tanks (250 L useful volume) in 9
four recirculation system for acclimation to experimental conditions during 20 days. The 10
fish were fed twice daily (3% of total biomass) with commercial diet (46% crude protein) 11
throughout the acclimation and experimental period. Photoperiod was fixed at 12 h Light : 12
12h Dark. 13
After the acclimation period, the fish were exposed to 0.05 ± 0.01 (control), 0.12 ± 14
0.01, 0.28 ± 0.02 and 0.57 ± 0.02 mg NH3-N L-1
in triplicate for 10 days in a semi-static 15
system. The tested concentrations were chosen above the safety level (0.06 mg NH3-N L-1
) 16
obtained for this species in saltwater by Bianchini et al. (1996). The desired ammonia 17
concentrations were obtained by adding ammonium chloride (NH3Cl4) (Synth, Brazil) 18
solutions or water exchange of the tanks. After the exposure period, fish remained for 10 19
days in recirculation system for assessment of recovery in ammonia free-water. 20
Temperature and dissolved oxygen (oximeter YSI 55), salinity (refractometer), pH 21
(pH meter, WTW 315i), total alkalinity (Eaton et al. 2005), total (Intergovernmental 22
Oceanographic Commission 1983) and un-ionized ammonia (Colt 2002), and nitrite 23
(Bendschneider and Robinson 1952) were measured daily before first feeding. All 24
parameters were maintained as follows: temperature (22.65 ± 0.07 °C), dissolved oxygen 25
concentration (6.88 ± 0.01 mg L-1
), salinity (27.82 ± 0.06), pH (8.20 ± 0.01), alkalinity 26
(168.85 ± 1.19 mg CaCO3 L-1
) and nitrite (0.92 ± 0.11 mg L-1
). 27
28
Organ sampling 29
30
63
Nine fish of each treatment (three per tank) were netted after 1, 5 and 10 days of 1
exposure, and after recovery period (day 20). Fish were immediately euthanized with a 2
lethal dose of hydrochloride benzocaine (500 ppm), and samples of gills, liver, brain, and 3
muscle were collected. Feeding was ceased 24 h prior each sampling day. 4
5
Oxidative stress analyses 6
7
Organs homogenization 8
9
Samples of gill, liver and muscle tissues were maintained in an ultra-freezer (-80 ºC) 10
and then homogenized (1:5; w/v) in a Tris–HCl (100 mM, pH 7.75) buffer with EDTA (2 11
mM) and Mg2+
(5 mM) (da Rocha et al. 2009). The supernatants resulting from the 12
centrifugation of the homogenates (10000 x g, 20 minutes, 4ºC) were used for all analyses. 13
The total protein content of homogenized samples was determined in a microplate reader 14
(BioTek LX 800) using a commercial kit (Doles®) based on the Biuret assay (550 nm). 15
16
Glutathione-S-transferase activity 17
18
GST activity was determined following the conjugation of 1 mM glutathione (GSH) 19
and 1 mM1-chloro-2,4-dinitrobenzene (CDNB) according to Habig et al. (1974) and Habig 20
and Jakoby (1981). Potassium phosphate buffer (KH2PO4 – 0.05 M; K2HPO4 – 0.05 M; pH 21
= 7.0) was used as reaction medium (previously heated at 25 ºC with a water bath). The 22
absorbance (340 nm) was read in transparent 96 wells microplate using a 23
spectrofluorometer (Victor 2, Perkin Elmer, MA, USA). The data were expressed as nmol 24
of CNDB-GSH conjugate min-1
mg wet tissue-1
. 25
26
Total antioxidant capacity against peroxyl radicals 27
28
ACAP was determined through detection of ROS in samples treated or not with a 29
peroxyl radical generator, according to the method described by Amado et al. (2009). All 30
samples were previously diluted with homogenization buffer to 2.0 mg protein mL-1
and 31
then exposed to peroxyl radicals generated by thermal (37°C) decomposition of 2,2′-azobis 32
64
(2 methylpropionamidine) dihydrochloride (ABAP, 4 mM). Peroxyl radicals reacted with a 1
fluorescent substrate (2′,7′ dichlorofluorescein diacetate - H2DCF-DA) and fluorometry 2
(excitation: 485 nm; emission: 520 nm) was measured through a microplate reader (Victor 3
2, Perkin Elmer) with readings at every 5 minutes, during 35 minutes. The results were 4
expressed as a relative area (the difference between the ROS area with and without ABAP 5
relative to the without ABAP). For interpretation purposes of the results, a higher relative 6
area means a lower antioxidant capacity. 7
8
Lipid Peroxidation 9
10
The lipid peroxidation levels were measured according Oakes and Van Der Kraak 11
(2003). To determine the thiobarbituric acid reactive substances (TBARS) by the 12
quantification of MDA (malondialdehyde), 20 µL of BHT solution (67 µM), 150 µL 20% 13
acetic acid solution, 150 µL 0.8 % TBA solution, 50 µL Milli-Q H2O, and 20 µL of 8.1% 14
SDS were added to samples (gills: 40 µL; liver: 60 µL; muscle: 100 µL) before being 15
heated at 95 ºC during 30 minutes. Thereafter, 100 µL of Milli-Q H2O and 500 µL of n-16
butanol were added to the final solution. The remaining supernatant after centrifugation 17
(3,000 x g, 10 minutes, 15 ºC) was used to determine the fluorescence (excitation: 520 nm; 18
emission: 580 nm) and the results were expressed as nmol TMP mg wet tissue-1
, where 19
TMP stands for tetramethoxypropane (ACROS Organics), employed as standard. 20
21
Histopathological analysis 22
23
The samples of gill tissues were fixed in Bouin’s solution, and brain and liver 24
samples were fixed in 10% buffered formalin. Samples were dehydrated using sequentially 25
increasing concentrations of ethanol, cleared in xylene and embedded in Paraplast®
with an 26
automatic tissue processor (LUPETEC, PT 05, Brazil). The sections (5 µm) were prepared 27
using a microtome (LUPETEC, MRP03, Brazil), stained with hematoxylin-eosin (H-E) and 28
slides analyzed with an optical microscope (ZEISS, PRIMO STAR). 29
30
Statistical analysis 31
32

65
All data were expressed as means ± standard error (SEM) and analysed through 1
analysis of variance (ANOVA). ANOVA assumptions (normality and variance 2
homogeneity) were previously verified by Kolmogorov-Smirnov and Levene tests, 3
respectively. Two-way ANOVA (factors: ammonia concentrations and exposure time) and 4
Tukey tests were performed to check differences among treatments. For all analysis, the 5
significance level was set at 5% (α = 0.05). 6
7
Results 8
9
The fish survival rate was 100% throughout the period of exposure and recovery for 10
all treatments. 11
Fish exposed to 0.28 and 0.57 mg NH3-N L-1
showed higher antioxidant 12
competence on gills compared to control and to the treatment 0.12 mg NH3-N L-1
at day 1, 13
and lower values compared to control after the recovery period (Fig. 1a). The ACAP on the 14
liver were lower than the control in fish exposed to treatments 0.28 and 0.57 mg NH3-N L-1
15
during the entire period of exposure (days 1, 5 and 10), and to treatment 0.12 mg NH3-N L-
16
1 only at day 1 (Fig. 1b). On the muscle, a lower ACAP were also demonstrated in 17
treatment 0.57 mg NH3-N L-1
compared to control at days 1 and 5, and in treatment 0.28 18
mg NH3-N L-1
in relation to control and to treatment 0.12 mg NH3-N L-1
at day 5. The 19
muscle ACAP was higher for all NH3-N treatments compared to control after the recovery 20
period (Fig. 1c). 21
The GST activity was higher on the gills of fish exposed to all ammonia 22
concentrations when compared to control at day 1, and in treatments 0.28 and 0.57 mg 23
NH3-N L-1
in relation to control and to treatment 0.12 mg NH3-N L-1
at the end of the 24
exposure period (day 10). After recovery, only treatment 0.57 mg NH3-N L-1
remained 25
higher than the control (Fig. 2a). Fish exposed to 0.28 and 0.57 mg NH3-N L-1
presented 26
higher GST activity of liver compared to control and to treatment 0.12 mg NH3-N L-1
at 27
days 1 and 10 (Fig. 2b). An enhanced GST activity was also observed on the muscle of fish 28
exposed to 0.28 or 0.57 mg NH3-N L-1
when compared to control at day 10 (Fig. 2c). 29
The TBARS levels were higher in relation to control and to 0.12 mg NH3-N L-1
on 30
the gills of fish exposed to 0.28 and 0.57 mg NH3-N L-1
at day 10 (Fig. 3a). The values for 31
66
this parameter are significantly lower on the liver of fish exposed to treatment 0.57 mg 1
NH3-N L-1
, compared to control and to all the other treatments, at days 1 and 5, 2
respectively. At day 10, the levels of TBARS presented higher values in treatment 0.28 mg 3
NH3-N L-1
in relation to the others, and lower values in treatment 0.57 mg NH3-N L-1
4
compared to control. After recovery, the values were lower on the liver of fish exposed to 5
the treatment 0.57 mg NH3-N L-1
in relation to control and treatment 0.12 mg NH3-N L-1
, 6
and in treatment 0.28 mg NH3-N L-1
compared to treatment 0.12 mg NH3-N L-1
(Fig. 3b). 7
No significant differences were registered among treatments for TBARS levels on the 8
muscle (Fig. 3c). 9
The histological analysis did not reveal any morphological alteration in brain, gills, 10
and liver of flounder juveniles resulting from the experimental treatments. 11
12
Discussion 13
14
Under normal physiological conditions, around 0.1% of the oxygen consumed in 15
aerobic metabolism is converted in the mitochondria into ROS (Fridovich 2004), such as 16
superoxide radical (O2-), hydrogen peroxide (H2O2), and the hydroxyl radical (HO
.), which 17
can oxidize and damage several biomolecules (Halliwell and Gutteridge 2015). Despite a 18
not complete understanding of the mechanisms involved, previous evidences indicate that 19
ammonia can trigger a pro-oxidant scenario in different fish organs (Hegazi et al. 2010; 20
Sinha et al. 2014; Cheng et al. 2015; Li et al. 2016). In the present study, changes in 21
oxidative stress parameters of Brazilian flounder juveniles were found depending on the 22
exposure time and concentration, and reflect the toxic effects of this compound at 23
biochemical level and possible adaptive responses. 24
Fish, like other aerobic organisms, present a complex antioxidant system with 25
several enzymatic and non-enzymatic defences to protect tissues against oxidative damage 26
(Halliwell and Gutteridge 2015). The analysis of total antioxidant capacity evaluates the 27
overall antioxidant status, without distinguishing between enzymatic and non-enzymatic 28
components of the antioxidant system. The basal total antioxidant capacity of Brazilian 29
flounder tissues was higher in gill, followed by the liver and muscle, in this order, 30

67
indicating variability in antioxidant competence among different organs. The values found 1
in the liver and gill were like those reported for Micropogonias furnieri, Pimelodus 2
pintado, Loricariichthys anus and Parapimelodus nigribarbis using the same technique (Da 3
Rocha et al. 2009). In contrast, the muscle presented an extremely low antioxidant capacity, 4
differently than demonstrated for other fish species (Amado et al. 2009; Da Rocha et al. 5
2009; Enamorado et al. 2015). This is possibly related to the very low swimming activity of 6
the species (Wilhelm Filho et al. 1993), which results in reduced metabolism and 7
consequently little generation of ROS in this organ, as demonstrated by the TBARS levels 8
that show the same pattern (gill > liver > muscle) found for total antioxidant competence. 9
Therefore, reduced antioxidant defences are sufficient to maintain tolerable levels of 10
oxidative damage in this organ. 11
Besides the differences in antioxidant competence among organs, the response to a 12
stressor is also organ-specific. Exposure to ammonia lead to a reduction in the total 13
antioxidant capacity in liver (0.12 mg NH3-N L-1
on day 1; 0.28 and 0.57 mg NH3-N L-1
on 14
days 1, 5 and 10) and muscle (0.28 mg NH3-N L-1
on day 5; 0.57 mg NH3-N L-1
on days 1 15
and 5) of Brazilian flounder. Previous studies have reported that ammonia-induced 16
oxidative stress is at least in part related to inhibition of antioxidant defences (Yang et al. 17
2011; Li et al. 2016), resulting in increased susceptibility to suffer oxidative damage. The 18
gill showed a different response with an initial induction of antioxidant defence 19
mechanisms demonstrated by an increase in antioxidant capacity of fish exposed to 0.28 20
and 0.57 mg NH3-N L-1
on day 1. Other authors also demonstrate various antioxidants 21
responses, such as increased synthesis of glutathione and induced activity of various 22
antioxidant enzymes as an attempt to alleviate ammonia-induced oxidative stress in fish 23
organs (Ching et al. 2009; Hegazi et al. 2010; Yang et al. 2010a; Sinha et al. 2014). 24
The glutathione S-transferases (GSTs) are a family of multifunctional enzymes that 25
play an important role as antioxidant defence. These enzymes catalyse the nucleophilic 26
attack of reduced glutathione (GSH) on electrophilic groups and are involved in 27
detoxification of xenobiotic and endogenous metabolites including products of oxidative 28
damage (Blanchette et al. 2007), and the determination of their activity is a useful 29
biochemical biomarker of environmental stress (Carvalho-Neta and Abreu-Silva 2013). In 30
the present study, ammonia exposure led to an initial (day 1) increased GST activity in the 31
68
gills (0.12, 0.28 and 0.57 mg NH3-N L-1
) and liver (0.28 and 0.57 mg NH3-N L-1
) of fish, 1
followed by a return to baseline levels on day 5. GST activity also showed an increase in all 2
organs (gill, liver, and muscle) of fish exposed to 0.28 and 0.57 mg NH3-N L-1
at the end of 3
the exposure period (day 10), indicating that the activity of this enzyme is part of an 4
adaptive response against a pro-oxidant condition induced by ammonia exposure at 5
different times. The enhanced ROS formation during an environmental stress situation 6
causing the activation of redox-sensitive transcription factors (Nrf2, for example) and ROS-7
mediated covalent modification of antioxidant proteins led to enhancement of antioxidant 8
defences (Hermes-Lima et al. 2015). Similar patterns of GST activity were reported for 9
Nile tilapia Oreochromis niloticus (Hegazi et al. 2010), rainbow trout Oncorhynchus mykiss 10
(Farzad et al. 2015) and rockfish Sebastes schlegelii (Kim et al. 2015) exposed to ammonia. 11
Additionally, the increased GST activity can also suggest a role of glutathione system in the 12
detoxification of ammonia (Farzad et al. 2015; Kim et al. 2015). This could explain the 13
high ammonia tolerant capability of this species point out by Bianchini et al. (1996). In 14
further studies, GSH is an important parameter that should also be evaluated to a better 15
comprehension of these biochemical mechanisms against ammonia toxicity. 16
The compromise of the antioxidant system and/or the ROS overproduction during 17
ammonia exposure (Sinha et al. 2014; Cheng et al. 2015) can result in enhanced oxidative 18
damage of proteins, lipids and DNA as demonstrated in other fish species (Hegazi et al. 19
2010; Sinha et al. 2014; Sun et al. 2014; Cheng et al. 2015). In present study, this condition 20
was demonstrated by the increased TBARS contents in gills (0.28 and 0.57 mg NH3-N L-1
) 21
and liver (0.28 mg NH3-N L-1
) on day 10. The TBARS assay quantifies by-end products of 22
lipid peroxidation (LPO), which is a chain reaction, initiated by the action of a hydroxyl 23
radical that led to an oxidative degradation of polyunsaturated fatty acids (PUFA). The 24
main effect of LPO is the decrease in membrane fluidity due to PUFA oxidation, affecting 25
several biological processes (Halliwell and Gutteridge 2015). According to the 26
classification of oxidative stress based on its intensity proposed by Lushchak (2014), in the 27
present study, ammonia exposure induce a low intensity (mild) oxidative stress in liver and 28
gill of Brazilian flounder, which is characterized by a slightly enhanced level of oxidative 29
damage and enhanced activity of antioxidant enzymes (as observed for GST). Although 30
the results found for ACAP and GST activity also suggest a potential pro-oxidant condition 31

69
in the muscle, the TBARS levels were kept in baseline levels indicating less harmful effects 1
of ammonia in this organ. 2
Sun et al. (2014) exposed juvenile bighead carp Hypophthalmichthys nobilis to 3
0.053, 0.106, 0.159 and 0.212 mg NH3-N L-1
for six weeks and reported an increase in 4
TBARS levels only in the two lower concentrations. These same authors suggest that at 5
higher concentrations of ammonia, a lack of increase in TBARS levels may indicate more 6
severe effects, possibly related to a decreased PUFA levels. This may be a possible 7
explanation for the reduction in liver TBARS levels of the fish exposed to 0.57 mg NH3-N 8
L-1
throughout the experimental period in the present study. Results of Li et al. (2014) 9
support this possibility, since they showed an enhance in saturated fatty acids content and 10
lower levels of PUFA in juvenile dark barbel catfish Pelteobagrus vachelli exposed to 0.12 11
mg NH3-N L-1
for 14 days. Gottschalk and Zwingmann (2009) also demonstrates that 12
ammonia caused alterations in the metabolism and composition of fatty acids, leading to 13
increased mono and decreased polyunsaturated fatty acids levels in cultured astrocytes. 14
In the context of aquaculture, the oxidative stress and the energy cost involved in 15
antioxidant responses can result in negative implications for the health and performance of 16
animals affecting productivity, and led to the impairment of final product (Zhang et al. 17
2016). The inclusion of antioxidants in the diet may be an interesting strategy to minimize 18
the ammonia-induced oxidative stress (Pan et al. 2011; Kütter et al. 2014; Enamorado et al. 19
2015) and can be the subject of future studies with Brazilian flounder. 20
The transfer of fish to ammonia free-water after a period of exposure can allow the 21
recovery of the basal physiological conditions as demonstrated by Yang et al. (2010b), 22
assessing haematological parameters and gill Na+/K
+ ATPase activity of juvenile crucian 23
carp Carassius auratus. However, this is the first study that evaluates the effects of 24
ammonia recovery on oxidative stress parameters of fish and the results demonstrate that 25
recovery capacity is variable, depending on the exposure concentration, the parameter 26
evaluated and organ. After recovery, most of the parameters (liver ACAP, GST activity in 27
muscle and liver, and TBARS in gill) that differ from the control at the end of the exposure 28
period returned to baseline levels, regardless of treatment, indicating that the 10-day period 29
was long enough for the recovery of these parameters. Differently, as in the case of liver 30
TBARS and gill GST activity, the recovery of normal levels was demonstrated only in fish 31
70
exposed to 0.28 mg NH3-N L-1
, remaining altered at the highest concentration (0.57 mg 1
NH3-N L-1
). The recovery period also triggered new changes in antioxidant defenses, 2
including a decrease in ACAP of the gills of fish exposed to 0.28 and 0.57 mg NH3-N L-1
, 3
and an increase in antioxidant capacity of muscle in all concentrations of ammonia. The 4
decrease in antioxidant capacity combined with increased GST activity suggests a pro-5
oxidant scenario in the gills during recovery, possibly related to the process of ammonia 6
detoxification and/or oxidative damage products removal. In muscle, the response observed 7
may be an adaptive antioxidant response to prevent possible enhanced oxidative damage 8
during recovery. Based on our findings, we suggest that a longer time is required to restore 9
the complete normal physiological conditions, however, further studies should be 10
conducted for a more accurate determination of the required time. 11
Besides the recovery in ammonia-free water, it is worth mentioning that certain 12
biochemical adjustments can occur in fish even during exposure period restoring the 13
homeostasis, as shown in treatment 0.12 mg NH3-N L-1
. From the fifth day of exposure, 14
fish exposed to this lower ammonia concentration presented a recovery of basal levels of 15
some parameters (gill GST activity, liver ACAP), which were transiently changed only on 16
day 1, indicating an adaptation to this level of the environmental ammonia 17
The ammonia production, excretion and toxicity in fish involve several 18
physiological and biochemical mechanisms in different organs such as brain, liver, and gill 19
(Ip and Chew 2010), and exposure to undesirable levels of environmental ammonia can 20
also result in histopathogical alterations to these tissues (Rodrigues et al. 2014). However, 21
no negative effect was evidenced in histological sections of brain, liver and gills of juvenile 22
Brazilian flounder during ammonia exposure or subsequent recovery in ammonia free-23
water. No hispathological alterations were also demonstrated in gill of silver perch 24
Bidyanus bidyanus exposed to 0.14 mg NH3-N L-1
for 39 days (Frances et al. 2000). 25
Medeiros et al. (2016) showed enhanced gill lesion in false clownfish Amphiprion ocellaris 26
only at 0.57 mg NH3-N L-1
, while concentrations up to 0.23 mg NH3-N L-1
did not differ 27
from the control, in acute toxicity test (96 h). The absence of histopathological effects 28
while the parameters of oxidative stress presented several alterations indicating the toxic 29
effects of ammonia, is related to the fact that these biochemical responses can be early 30
indicators of biological damage (Bernet et al. 1999). Similar results were also demonstrated 31
71
in fish exposed to other environmental contaminants (Velisek et al. 2011; Zivna et al. 2013; 1
Sevcikova et al. 2016). This result demonstrates a good tolerance of the species to this 2
nitrogenous compound, since its effects were limited to biochemical level without leading 3
to a more severe impairment of assessed organs, which can affect its vital functions. 4
It is important to point out that present results also demonstrate the relevance of 5
using multiple biomarkers of different organization levels for assessment of the effects 6
related to environmental stressors on aquatic organisms. Furthermore, oxidative stress 7
parameters can be used as a more sensitive tool to determine water quality criteria for 8
aquaculture, aiming a more appropriate management, especially in intensive systems, such 9
as RAS. 10
The present study shows that ammonia exposure to concentrations ranging from 11
0.12 to 0.57 mg NH3-N L-1
throughout 10 days induces different changes in oxidative stress 12
parameters in a time- and concentration-dependent way, but does not cause histological 13
changes in juvenile Brazilian flounders. The activation of antioxidant defenses in an 14
adaptive response to prevent organs from oxidative damage, and a reduction in the total 15
antioxidant competence were observed in all tested concentrations, indicating that ammonia 16
exposure can lead to a disruption of homeostasis even at the lowest concentration. 17
However, only in fish exposed to 0.28 and 0.57 mg NH3-N L-1
a mild oxidative stress was 18
evidenced. In addition, the recovery period (10 days) was not sufficient to complete re-19
establishment of fish homeostasis and induced further changes in antioxidant defenses. 20
21
22
23
Acknowledgements 24
25
This study was supported by research funds from Conselho Nacional de Pesquisa e 26
Desenvolvimento Científico (CNPq) and Coordenação de Aperfeiçoamento de Pessoal de 27
Nível Superior (CAPES). The authors are grateful to CNPq for productivity research 28
fellowships provided for L. Garcia, L. Sampaio, L. Romano and J. Monserrat, and to 29
CAPES for a PhD scholarship provided for MSc. Lucas C. Maltez. 30
31

72
Conflict of interest 1
2
The authors declare that they have no conflict of interest. 3
4
References 5
6
Ackerman PA, Wicks BJ, Iwama GK, Randall DJ (2006) Low levels of environmental 7
ammonia increase susceptibility to disease in Chinook salmon smolts. Physiol Biochem 8
Zool 79:695–707. doi: 10.1086/504615 9
Amado LL, Garcia ML, Ramos PB, Freitas RF, Zafalon B, Ferreira JL, Yunes JS, 10
Monserrat JM (2009) A method to measure total antioxidant capacity against peroxyl 11
radicals in aquatic organisms: Application to evaluate microcystins toxicity. Sci Total 12
Environ 407:2115-23. doi: 10.1016/j.scitotenv.2008.11.038 13
Baldisserotto B, Martos-Sitcha JA, Menezes CC, Toni C, Prati RL, Garcia L de O, Salbego 14
J, Mancera JM, Martínez-Rodríguez G (2014) The effects of ammonia and water hardness 15
on the hormonal, osmoregulatory and metabolic responses of the freshwater silver catfish 16
Rhamdia quelen. Aquat Toxicol 152:341-352. doi: 10.1016/j.aquatox.2014.04.023 17
Bendschneider K, Robinson RJ (1952) A new spectrophotometric method for the 18
determination of nitrite in sea water. J Mar Res 11:87-96 19
Bernet D, Schmidt H, Meier W, Burkhardt-Holm P, Wahli T (1999) Histopathology in fish: 20
proposal for a protocol to assess aquatic pollution. J Fish Dis 22:25-34. doi: 21
10.1046/j.1365-2761.1999.00134.x 22
Bianchini A, Wasielesky W, Filho KC (1996) Toxicity of nitrogenous compounds to 23
juveniles of flatfish Paralichthys orbignyanus. Bull Environ Contam Toxicol 56:453-459. 24
doi: 10.1007/s001289900065 25
Blanchette B, Feng X, Singh BR (2007) Marine glutathione S-transferases. Mar Biotechnol 26
9:513-542. doi: 10.1007/s10126-007-9034-0 27

73
Bolasina SN (2011) Stress response of juvenile flounder (Paralichthys orbignyanus, 1
Valenciennes 1839), to acute and chronic stressors. Aquaculture 313:140-143. doi: 2
10.1016/j.aquaculture.2011.01.011 3
Carvalho-Neta RN, Abreu-Silva AL (2013) Glutathione S-Transferase as biomarker in 4
Sciades herzbergii (Siluriformes: Ariidae) for environmental monitoring: the case study of 5
São Marcos Bay, Maranhão, Brazil. Lat Am J Aquat Res 41:217-225. doi: 10.3856/vol41-6
issue2-fulltext-2 7
Cheng CH, Yang FF, Ling RZ, Liao SA, Miao YT, Ye CX, Wang AL (2015) Effects of 8
ammonia exposure on apoptosis, oxidative stress and immune response in pufferfish 9
(Takifugu obscurus). Aquat Toxicol 164:61-71. doi: 10.1016/j.aquatox.2015.04.004 10
Ching B, Chew SF, Wong WP, Ip YK (2009) Environmental ammonia exposure induces 11
oxidative stress in gills and brain of Boleophthalmus boddarti (mudskipper). Aquat Toxicol 12
95:203-212. doi: 10.1016/j.aquatox.2009.09.004 13
Colt J (2002) List of spreadsheets prepared as a complement. In: Wedemeyer GA (ed) Fish 14
hatchery management, 2nd ed. American Fish Society Publication. 15
http://www.fisheries.org/afs/hatchery.html. Accessed 10 April 2013 16
Da Rocha AM, de Freitas DP, Burns M, Vieira JP, de la Torre FR, Monserrat JM (2009) 17
Seasonal and organ variations in antioxidant capacity, detoxifying competence and 18
oxidative damage in freshwater and estuarine fishes from Southern Brazil. Comp Biochem 19
Phys C Toxicol Pharmacol 150:512-520. doi: 10.1016/j.cbpc.2009.07.012 20
Dong X, Zhang X, Qin J, Zong S (2013) Acute ammonia toxicity and gill morphological 21
changes of Japanese flounder Paralichthys olivaceus in normal versus supersaturated 22
oxygen. Aquac Res 44:1752-1759. doi: 10.1111/j.1365-2109.2012.03181.x 23
Eaton AD, Clesceri LS, Rice EW, Greenberg AE (2005) Standard methods for the 24
examination of water and wastewater, 21st edition. American Public Health Association, 25
Washington, D.C. 26
Enamorado AD, Martins AC, Flores JA, Tesser MB, Caldas SS, Primel EG, Monserrat JM 27
(2015) Biochemical responses over time in common carp Cyprinus carpio (Teleostei, 28
74
Cyprinidae) during fed supplementation with α-lipoic acid. Comp Biochem Phys A Mol 1
Integr Physiol 188:9-16. doi: 10.1016/j.cbpa.2015.05.023 2
FAO – Food and Agriculture Organization of the United Nations (2016) The State of World 3
Fisheries and Aquaculture – Contributing to food security and nutrition for all. Rome. 4
http://www.fao.org/3/a-i5555e.pdf. Accessed 13 February 2017 5
Farzad R, Inanlou DN, Cohan RA, Ghorbani M (2015) Effects of the industrial pollution on 6
glutathione s-tranferase in the liver of rainbow trout. Bulg Chem Commun, 47:720-724 7
Figueiredo JL, Menezes NA (2000) Manual de peixes marinhos do sudeste do Brasil. São 8
Paulo, Museu de Zoologia / USP 9
Frances J, Nowak BF, Allan GL (2000) Effects of ammonia on juvenile silver perch 10
(Bidyanus bidyanus). Aquaculture 183:95-103. doi: 10.1016/S0044-8486(99)00286-0 11
Fridovich I (2004) Mitochondria: are they the seat of senescence? Aging Cell 3:13-16. doi: 12
10.1046/j.1474-9728.2003.00075.x 13
Garcia LO, Okamoto MH, Riffel AP, Saccol EM, Pavanato MA, Sampaio LA (2015) 14
Oxidative stress parameters in juvenile Brazilian flounder Paralichthys orbignyanus 15
(Valenciennes, 1839) (Pleuronectiformes: Paralichthyidae) exposed to cold and heat 16
shocks. Neotrop Ichthyol 13:607-612. doi: 10.1590/1982-0224-20140148 17
Gottschalk S, Zwingmann C (2009) Altered fatty acid metabolism and composition in 18
cultured astrocytes under hyperammonemic conditions. J Neurochem 109:258-264. doi: 19
10.1111/j.1471-4159.2009.05985.x 20
Habig WH, Jakoby WB (1981) Assays for differentiation of glutathione S-transferases. 21
Methods Enzymol. 77:398–405 22
Habig WH, Pabst MJ, Jakoby WB (1974) Glutathione S-transferases: the first enzymatic 23
step in mercapturic acid formation. J Biol Chem 249:7130-7139 24
Halliwell B, Gutteridge JM (2015) Free radicals in biology and medicine. Oxford University 25
Press, USA 26
75
Hegazi MM, Attia ZI, Ashour OA (2010) Oxidative stress and antioxidant enzymes in liver 1
and white muscle of Nile tilapia juveniles in chronic ammonia exposure. Aquat Toxicol 2
99:118-125. doi: 10.1016/j.aquatox.2010.04.007 3
Hermes-Lima M, Moreira DC, Rivera-Ingraham GA, Giraud-Billoud M, Genaro-Mattos 4
TC, Campos ÉG (2015) Preparation for oxidative stress under hypoxia and metabolic 5
depression: revisiting the proposal two decades later. Free Radical Bio Med 89:1122-1143. 6
doi: 10.1016/j.freeradbiomed.2015.07.156 7
Intergovernmental Oceanographic Commission (1983) Chemical methods for use in marine 8
environmental monitoring. UNESCO, Paris 9
Ip YK, Chew SF (2010) Ammonia production, excretion, toxicity, and defense in fish: A 10
review. Front Physiol 1:134. doi: 10.3389/fphys.2010.00134 11
Kim SH, Kim JH, Park MA, Hwang SD, Kang JC (2015) The toxic effects of ammonia 12
exposure on antioxidant and immune responses in Rockfish, Sebastes schlegelii during 13
thermal stress. Environ Toxicol Pharmacol 40:954-959. doi: 10.1016/j.etap.2015.10.006 14
Klinger D, Naylor R (2012) Searching for solutions in aquaculture: charting a sustainable 15
course. Annu Rev Env Resour 37:247-276. doi: 10.1146/annurev-environ-021111-161531 16
Kolarevic J, Takle H, Felip O, Ytteborg E, Selset R, Good CM, Baeverfjord G, Asgård T, 17
Terjesen BF (2012) Molecular and physiological responses to long-term sub-lethal 18
ammonia exposure in Atlantic salmon (Salmo salar). Aquat Toxicol 124:48-57. doi: 19
10.1016/j.aquatox.2012.07.003 20
Kütter MT, Romano LA, Ventura-Lima J, Tesser MB, Monserrat JM (2014) Antioxidant 21
and toxicological effects elicited by alpha-lipoic acid in aquatic organisms. Comp Biochem 22
Phys C Toxicol Pharmacol 162:70-76. doi: 10.1016/j.cbpc.2014.03.008 23
Li M, Gong S, Li Q, Yuan L, Meng F, Wang R (2016) Ammonia toxicity induces 24
glutamine accumulation, oxidative stress and immunosuppression in juvenile yellow catfish 25
Pelteobagrus fulvidraco. Comp Biochem Phys C Toxicol Pharmacol 183-184:1-6. doi: 26
10.1016/j.cbpc.2016.01.005 27

76
Li M, Yu N, Qin JG, Li E, Du Z, Chen L (2014) Effects of ammonia stress, dietary linseed 1
oil and Edwardsiella ictaluri challenge on juvenile darkbarbel catfish Pelteobagrus 2
vachelli. Fish Shellfish Immun 38:158-165. doi: 10.1016/j.fsi.2014.03.015 3
Lushchak VI (2011) Environmentally induced oxidative stress in aquatic animals. Aquat 4
Toxicol 101:13-30. doi: 10.1016/j.aquatox.2010.10.006 5
Lushchak VI (2014) Free radicals, reactive oxygen species, oxidative stress and its 6
classification. Chem-Biol Interact 224:164-175. doi: 10.1016/j.cbi.2014.10.016 7
Medeiros RS, Lopez BA, Sampaio LA, Romano LA, Rodrigues RV (2016) Ammonia and 8
nitrite toxicity to false clownfish Amphiprion ocellaris. Aquacult Int 24:985-993. doi: 9
10.1007/s10499-015-9965-9 10
Millner R, Walsh SJ, Díaz de Astarloa JM (2005) Atlantic flatfish fisheries. In: Gibson RN 11
(ed) Flatfishes: biology and exploitation, 1st edn. Blackwell Science, Oxford, pp 240-271 12
Monserrat JM, Martínez PE, Geracitano LA, Amado LL, Martins CM, Pinho GL, Chaves 13
IS, Ferreira-Cravo M, Ventura-Lima J, Bianchini A (2007) Pollution biomarkers in 14
estuarine animals: Critical review and new perspectives. Comp Biochem Phys C Toxicol 15
Pharmacol 146:221-234. doi: 10.1016/j.cbpc.2006.08.012 16
Oakes KD, Van Der Kraak GJ (2003) Utility of the TBARS assay in detecting oxidative 17
stress in white sucker (Catostomus commersoni) populations exposed to pulp mill effluent. 18
Aquat Toxicol 63:447-463. doi: 10.1016/S0166-445X(02)00204-7 19
Okamoto MH, Sampaio LA (2012) Sobrevivência e crescimento de juvenis do linguado 20
Paralichthys orbignyanus criados em diferentes temperaturas. Atlântica (Rio Grande), 21
34:57-61. doi: 10.5088/atlântica.v34i1.2710 22
Pan CH, Chien YH, Wang YJ (2011) Antioxidant defence to ammonia stress of characins 23
(Hyphessobrycon eques Steindachner) fed diets supplemented with carotenoids. Aquacult 24
Nutr 17:258-266. doi: 10.1111/j.1365-2095.2009.00747.x 25
Paust LO, Foss A, Imsland AK (2011) Effects of chronic and periodic exposure to 26
ammonia on growth, food conversion efficiency and blood physiology in juvenile Atlantic 27
halibut (Hippoglossus hippoglossus L.). Aquaculture 315:400-406. doi: 28
10.1016/j.aquaculture.2011.03.008 29

77
Randall DJ, Tsui TK (2002) Ammonia toxicity in fish. Mar Pollut Bull 45:17-23. doi: 1
10.1016/S0025-326X(02)00227-8 2
Rašković B, Jarić I, Koko V, Spasić M, Dulić Z, Marković Z, Poleksić V (2013) 3
Histopathological indicators: a useful fish health monitoring tool in common carp 4
(Cyprinus carpio Linnaeus, 1758) culture. Cent Eur J Biol 8:975-985. doi: 10.2478/s11535-5
013-0220-y 6
Ravindrababu G, Neeraja, P (2012) Histological changes in certain tissues of fish on 7
ambient ammonia stress and post ammonia state (Recovery). Int. J. Adv. Biol. Res 2:430-8
435. 9
Rodrigues RV, Romano LA, Schwarz MH, Delbos B, Sampaio LA (2014) Acute tolerance 10
and histopathological effects of ammonia on juvenile maroon clownfish Premnas 11
biaculeatus (Block 1790). Aquac Res 45:1133-1139. doi: 10.1111/are.12054 12
Roumieh R, Barakat A, Abdelmeguid NE, Ghanawi J, Saoud IP (2013) Acute and chronic 13
effects of aqueous ammonia on marbled spinefoot rabbitfish, Siganus rivulatus (Forsskål 14
1775). Aquac Res 44:1777-1790. doi: 10.1111/j.1365-2109.2012.03188.x 15
Sampaio LA, Bianchini A (2002) Salinity effects on osmoregulation and growth of the 16
euryhaline flounder Paralichthys orbignyanus. J Exp Mar Biol Ecol 269:187-196. doi: 17
10.1016/S0022-0981(01)00395-1 18
Sampaio LA, Freitas LS, Okamoto MH, Louzada LR, Rodrigues RV, Robaldo RB (2007) 19
Effects of salinity on Brazilian flounder Paralichthys orbignyanus from fertilization to 20
juvenile settlement. Aquaculture 262:340-346. doi: 10.1016/j.aquaculture.2006.09.046 21
Sampaio LA, Robaldo RB, Bianchini A (2008) Hormone‐induced ovulation, natural 22
spawning and larviculture of Brazilian flounder Paralichthys orbignyanus (Valenciennes, 23
1839). Aquac Res 39:712-717. doi: 10.1111/j.1365-2109.2008.01923.x 24
Schram E, Roques JA, Abbink W, Spanings T, de Vries P, Bierman S, van de Vis H, Flik G 25
(2010) The impact of elevated water ammonia concentration on physiology, growth and 26
feed intake of African catfish (Clarias gariepinus). Aquaculture 306:108-115. doi: 27
10.1016/j.aquaculture.2010.06.005 28
78
Schreier HJ, Mirzoyan N, Saito K (2010) Microbial diversity of biological filters in 1
recirculating aquaculture systems. Curr Opin Biotech 21:318–325. doi: 2
10.1016/j.copbio.2010.03.011 3
Schwaiger J, Wanke R, Adam S, Pawert M, Honnen W, Triebskorn R (1997) The use of 4
histopathological indicators to evaluate contaminant-related stress in fish. J Aquat Ecosyst 5
Stress Recovery 6:75-86. doi: 10.1023/A:1008212000208 6
Sevcikova M, Modra H, Blahova J, Dobsikova R, Plhalova L, Zitka O, Hynek D, Kizek R, 7
Skoric M, Svobodova Z (2016) Biochemical, haematological and oxidative stress responses 8
of common carp (Cyprinus carpio L.) after sub-chronic exposure to copper. Vet Med 9
61:35-50. doi: 10.17221/8681-VETMED 10
Sinha AK, AbdElgawad H, Giblen T, Zinta G, De Rop M, Asard H, Blust R, De Boeck G 11
(2014) Anti-oxidative defences are modulated differentially in three freshwater teleosts in 12
response to ammonia-induced oxidative stress. Plos One 9: e95319. doi: 13
10.1371/journal.pone.0095319 14
Stoliar OB, Lushchak VI (2012) Environmental pollution and oxidative stress in fish. In: 15
Lushchak VI (ed) Oxidative Stress - Environmental Induction and Dietary Antioxidants. 16
InTech. http://www.intechopen.com/books/oxidative-stress-environmental-induction-and-17
dietary-antioxidants/environmental-pollution-and-oxidative-stress-in-fish. Accessed 2 18
February 2017 19
Sun H, Wang W, Li J, Yang Z (2014) Growth, oxidative stress responses, and gene 20
transcription of juvenile bighead carp (Hypophthalmichthys nobilis) under chronic-term 21
exposure of ammonia. Environ Toxicol Chem 33:1726-1731. doi: 10.1002/etc.2613 22
Velisek J, Stara A, Kolarova J, Svobodova Z (2011) Biochemical, physiological and 23
morfological responses in common carp (Cyprinus carpio L.) after long-term exposure to 24
terbutryn in real environmental concentration. Pestic Biochem Phys 100:305-313. doi: 25
10.1016/j.pestbp.2011.05.004 26
Wasielesky W, Bianchini A, Miranda FK (1998) Tolerancia a la temperatura de juveniles 27
de lenguado Paralichthys orbignyanus. Frente Marítimo 17:43-48. 28

79
Wasielesky W, Bianchini A, Santos MH, Poersch LH (1997) Tolerance of juvenile flatfish 1
Paralichthys orbignyanus to acid stress. J World Aquacult Soc 28:202-204. doi: 2
10.1111/j.1749-7345.1997.tb00857.x 3
Wilhelm Filho D, Giulivi C, Boveris A (1993) Antioxidant defences in marine fish-I. 4
Teleosts. Comp Biochem Phys C Pharmacol Toxicol Endocrinol 106:409-413. doi: 5
10.1016/0742-8413(93)90154-D 6
Wilkie MP, Wood CM (1996) The adaptations of fish to extremely alkaline environments. 7
Comp Biochem Phys B Biochem Mol Biol 113:665-673. doi: 10.1016/0305-8
0491(95)02092-6 9
Yang W, Sun H, Xiang F, Yang Z, Chen Y (2011) Response of juvenile crucian carp 10
(Carassius auratus) to long-term ammonia exposure: feeding, growth, and antioxidant 11
defenses. J Freshwater Ecol 26:563-570. doi: 10.1080/02705060.2011.570944 12
Yang W, Xiang F, Liang L, Yang Z, (2010a) Toxicity of ammonia and its effects on 13
oxidative stress mechanisms of juvenile crucian carp (Carassius auratus). J Freshwater 14
Ecol 25:297-302. doi: 10.1080/02705060.2010.9665080 15
Yang W, Xiang F, Sun H, Chen Y, Minter E, Yang Z (2010b) Changes in the selected 16
hematological parameters and gill Na+/K+ ATPase activity of juvenile crucian carp 17
Carassius auratus during elevated ammonia exposure and the post-exposure recovery. 18
Biochem Syst Ecol 38:557-562. doi: 10.1016/j.bse.2010.06.005 19
Zhang L, Feng L, Jiang WD, Liu Y, Jiang J, Li SH, Tang L, Kuang SY, Zhou XQ (2016) 20
The impaired flesh quality by iron deficiency and excess is associated with increasing 21
oxidative damage and decreasing antioxidant capacity in the muscle of young grass carp 22
(Ctenopharyngodon idellus). Aquacult Nutr 22:191-201. doi: 10.1111/anu.12237 23
Zivna D, Plhalova L, Praskova E, Stepanova S, Siroka Z, Sevcikova M, Blahova J, 24
Bartoskova M, Marsalek P, Skoric M, Svobodova Z (2013) Oxidative stress parameters in 25
fish after subchronic exposure to acetylsalicylic acid. Neuroendocrinol Lett 34:116-122 26
27
28

80
Figure Captions 1
2
Fig. 1 Total antioxidant capacity against peroxyl radicals (ACAP) (relative area) in gill (a), 3
liver (b) and muscle (c) of juvenile Brazilian flounder Paralichthys orbignyanus exposed to 4
ammonia and after recovery in ammonia-free water. Data were expressed as means ± SEM 5
(n=9). Different lowercase letters indicate significant differences among treatments within 6
the same sampling day (Tukey’s test, p <0.05). 7
8
Fig. 2 Glutathione-S-transferase (GST) activity (nmol CNDB-GSH min-1
mg wet tissue-1
) 9
in gill (a), liver (b) and muscle (c) of juvenile Brazilian flounder Paralichthys orbignyanus 10
exposed to ammonia and after recovery in ammonia-free water. Data were expressed as 11
means ± SEM (n=9). Different lowercase letters indicate significant differences among 12
treatments within the same sampling day (Tukey’s test, p <0.05). 13
14
Fig. 3 Thiobarbituric acid reactive substances (TBARS) content (nmol TMP mg wet tissue-15
1) in gill (a), liver (b) and muscle (c) of juvenile Brazilian flounder Paralichthys 16
orbignyanus exposed to ammonia and after recovery in ammonia-free water. Data were 17
expressed as means ± SEM (n=9). Different lowercase letters indicate significant 18
differences among treatments within the same sampling day (Tukey’s test, p <0.05). 19
20
21
22
23
24
25
26
27
28
29
30
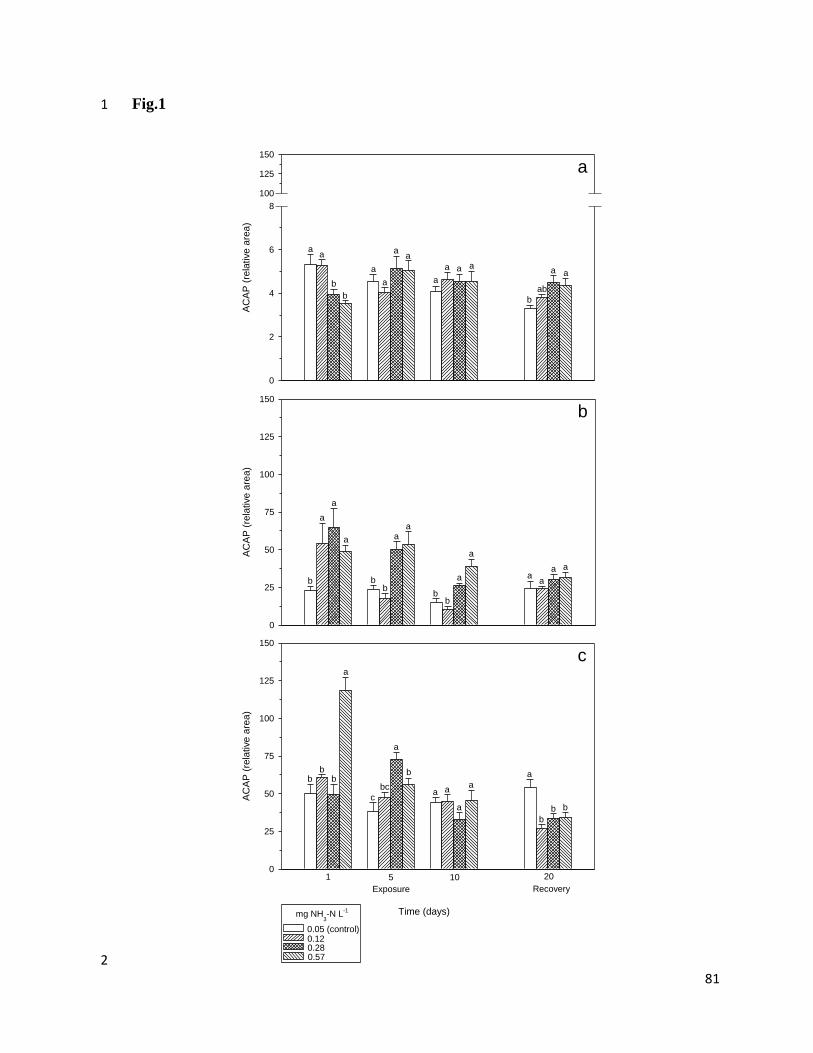
81
Fig.1 1
AC
AP
(re
lative a
rea)
0
2
4
6
8
100
125
150
aa
b
b
a
a
aa
b
ab
a aa a
a
a
a
AC
AP
(re
lative a
rea)
0
25
50
75
100
125
150
b
a
a
a
bb
aa
aa
a a
a
a
bb
b
Time (days)
AC
AP
(re
lative a
rea)
0
25
50
75
100
125
150
1 5 10 20
Exposure Recovery
bb
b
a
c
bc
a
b a
b
b ba
aa a
c
mg NH3-N L
-1
0.05 (control)0.120.280.57 2

82
Fig. 2 1
GS
T a
ctivity (
nm
ol C
ND
B-G
SH
min
-1 m
g w
et
tissue
-1)
0.00
0.50
1.00
1.50
2.00
2.50
b
a a aa
aa
a
b
abab
a
a
a
b b
a
GS
T a
ctivity (
nm
ol C
ND
B-G
SH
min
-1 m
g w
et
tissue
-1)
0.00
0.50
1.00
1.50
2.00
2.50
b
b
a
a
a
aa
a
a
a a a
a
a
b
b
b
Time (days)
GS
T a
ctivity (
nm
ol C
ND
B-G
SH
min
-1 m
g w
et
tissue
-1)
0.00
0.02
0.04
0.06
0.08
0.10
2.00
2.25
2.50
1 5 10 20
Exposure Recovery
a
a
a
a
aa
a
a
aa
a
a
a
a
b
ab
c
mg NH3-N L
-1
0.05 (control)0.120.280.57
2
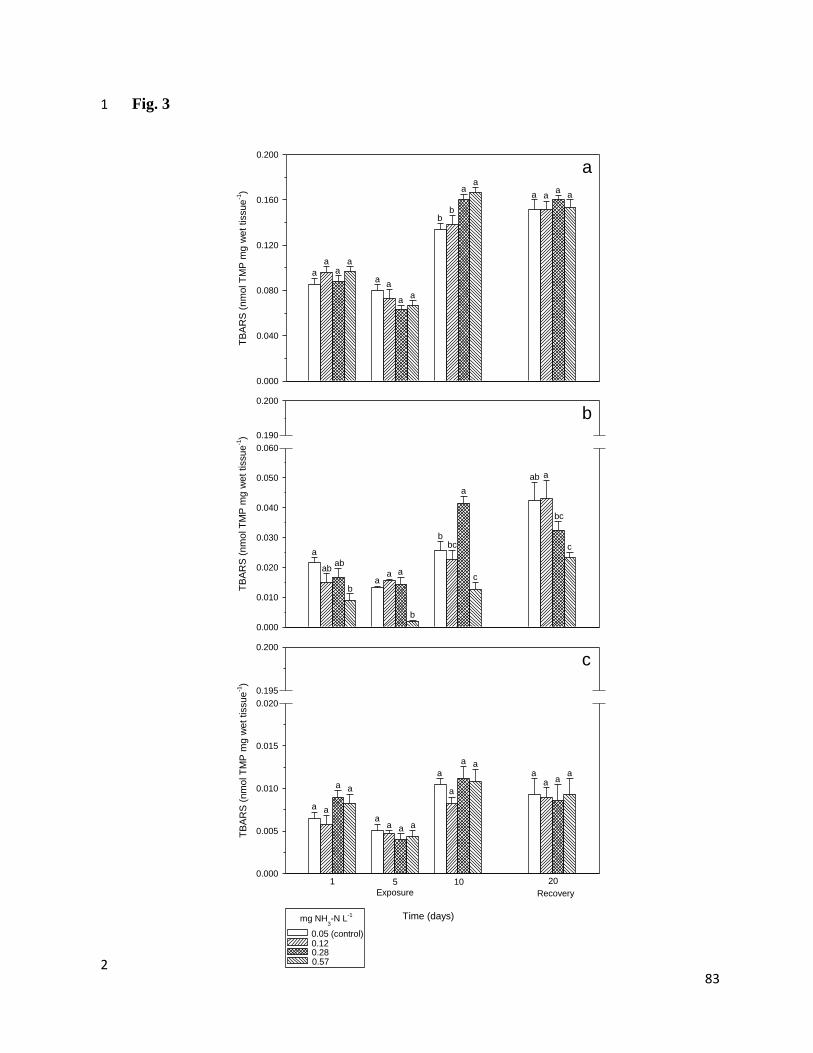
83
Fig. 3 1
TB
AR
S (
nm
ol T
MP
mg
we
t tissu
e-1)
0.000
0.010
0.020
0.030
0.040
0.050
0.060
0.190
0.200
TB
AR
S (
nm
ol T
MP
mg
we
t tissu
e-1)
0.000
0.040
0.080
0.120
0.160
0.200
a
aa
a
aa
aa
a aa
aa
a
bb
a
b
Time (days)
TB
AR
S (
nm
ol T
MP
mg
we
t tissu
e-1)
0.000
0.005
0.010
0.015
0.020
0.195
0.200
a
abab
ba
a a
b
ab a
bc
c
a
c
bbc
1 5 10 20
Exposure Recovery
a a
a a
aa a a
aa a
a
a aa
a
c
mg NH3-N L
-1
0.05 (control)0.120.280.57 2
84
CAPÍTULO 3 1
2
Oxidative stress and antioxidant responses in juvenile Brazilian flounder Paralichthys 3
orbignyanus exposed to sub-lethal levels of nitrite 4
5
Lucas Campos Malteza, Lilian Fiori Nitz
a, Lucas Pellegrin
a, Giovanna Rodrigues 6
Stringhettaa, Marcelo Hideo Okamoto
b, Luis Alberto Romano
c, José Maria 7
Monserratd, Luís André Sampaio
b, Luciano Garcia
a* 8
9 aLaboratório de Aquacultura Continental, Instituto de Oceanografia, Universidade Federal do Rio Grande – 10
FURG, Rio Grande, RS, Brazil. 11 bLaboratório de Piscicultura Estuarina e Marinha, Instituto de Oceanografia, Universidade Federal do Rio 12
Grande – FURG, Rio Grande, RS, Brazil. 13 cLaboratório de Patologia e Imunologia de Organismos Aquáticos, Instituto de Oceanografia, Universidade 14
Federal do Rio Grande – FURG, Rio Grande, RS, Brazil. 15 dLaboratório de Bioquímica Funcional de Organismos Aquáticos, Instituto de Oceanografia, Universidade 16
Federal do Rio Grande – FURG, Rio Grande, RS, Brazil. 17
18
Running title: Nitrite-induced oxidative stress in Paralichthys orbignyanus 19
20
ms. has 29 pages, 6 figures 21
22
*Corresponding author: 23
Dr. Luciano de Oliveira Garcia 24
Laboratório de Aquacultura Continental, Universidade Federal do Rio Grande – FURG 25
96201-900, Rio Grande, RS, Brazil 26
Phone: +55 53 3237-3003 27
29
30
31
32
33
Artigo formatado e submetido para a revista Comparative Biochemistry and Physiology - 34
Part C: Toxicology & Pharmacology 35
85
Abstract 1
This study evaluated the effects of short-term exposure to sub-lethal levels of nitrite on 2
total protein content, oxidative stress parameters and histology of juvenile Brazilian 3
flounder Paralichthys orbignyanus. An assessment of fish recovery was also performed. 4
Fish were exposed to 0.08 (control), 5.72, 10.43 and 15.27 mg NO2-N L-1
for 10 days 5
followed by the same recovery time. Gill, liver and muscle samples were collected after 1, 6
5 and 10 days of exposure and after recovery for the measurement of total protein content, 7
antioxidant capacity against peroxyl radicals (ACAP), glutathione-S-transferase (GST) 8
activity, content of non-protein (NPSH) and protein thiols (PSH), and lipid peroxidation 9
levels by thiobarbituric acid reactive substances (TBARS) content. For the 10
histopathological evaluation, samples of gill, liver and brain tissues were collected. Nitrite 11
exposure induced alterations pertained to reduced total protein content, compromising of 12
the overall antioxidant system (reduced ACAP and GST activity) and enhanced oxidative 13
damage in lipids and proteins. Increases in GST activity, NPSH and PSH contents were 14
also demonstrated. No nitrite-induced histopathological effects were found. The recovery 15
period allowed for resumption of basal levels for all (treatment 5.72 mg NO2-N.L-1
) or 16
some of the evaluated parameters (other treatments). In conclusion, exposure to nitrite 17
concentrations from 5.72 to 15.27 mg NO2-N.L-1
caused changes in protein content and 18
induced oxidative stress and antioxidant responses of juvenile Brazilian flounder. The 19
recovery period led to complete or partial resumption of homeostasis depending on the 20
nitrite concentrations at which the fish were previously exposed. 21
22
Key words: fish, lipoperoxidation, nitrogen compound, recovery, thiol groups, toxicity 23
24
1. Introduction 25
26
Nitrite (NO2-) is an intermediate product in bacterial nitrification and denitrification 27
processes and therefore constitutes a component of the nitrogen cycle in aquatic 28
environments. In intensive fish culture systems, especially in recirculation aquaculture 29
systems (RAS), imbalances of nitrifying bacteria activity present in biofilter, may lead to a 30
build-up of nitrite. This nitrogen compound causes a potential risk to cultured species due 31
to its high toxicity (Jensen, 2003; Kroupova et al., 2005). Besides, the deleterious effects of 32

86
nitrite exposure can adversely affect growth (Ciji et al., 2014), immune system (Jia et al., 1
2016) and survival of fish (Wuertz et al., 2013) resulting in production losses. 2
The mechanisms of nitrite uptake and toxicity are widely discussed for freshwater 3
organisms but poorly studied on estuarine and marine fish (Tomasso, 2012; Jia et al., 4
2015). Nitrite is generally less toxic in saltwater due to the high chloride concentration and 5
to the opposite osmotic gradients, which reduce nitrite influx via competition with chloride 6
active uptake in gill (Jensen, 2003). However, potential routes for nitrite uptake have been 7
demonstrated in intestinal (Grosell and Jensen, 2000) and gill (inward diffusion) epithelium 8
of saltwater species (Jensen, 2003), and can lead to a build-up of this compound in blood 9
plasma (Park et al., 2013) and other organs, such as muscle, gills and liver (Huertas et al., 10
2002). The main physiological disorder related to nitrite accumulation is the oxidation of 11
functional hemoglobin (Hb) to methemoglobin (metHb), which cannot transport oxygen. In 12
addition to inducing functional hypoxia due to methemoglobinemia, exposure to nitrite can 13
affect multiple physiological functions in fish (Jensen, 2003). 14
The imbalance between pro-oxidants and antioxidant defenses which leads to an oxidative 15
stress condition (Halliwell and Gutteridge, 2015) is one of these nitrite-induced 16
disturbances at the biochemical level. Exposure of fish to nitrite can enhance the 17
intracellular generation of reactive oxygen species (ROS) (Sun et al., 2014a) and reactive 18
nitrogen species (RNS) (Jensen and Hansen, 2011; Jensen et al., 2015), and/or reduce 19
antioxidant defenses (Jia et al., 2015). Therefore, increased levels of oxidative damage in 20
different macromolecules such as lipids and proteins have already been demonstrated (Sun 21
et al., 2014a; Jia et al., 2015). Furthermore, the non-enzymatic antioxidant defenses such as 22
reduced glutathione (GSH) plays an important role in preventing Hb oxidation by nitrite 23
(Smith and Nunn, 1984; Doblander and Lackner, 1996) and elevated activities of several 24
antioxidant enzymes provide protection against oxidative damage during nitrite exposure 25
(Ciji et al., 2012). 26
At a higher biological organization level, exposure to environmental stressors and related 27
biochemical responses can also induce histopathological changes in specific target organs 28
resulting in impairment of their vital functions (Bernet et al., 1999). These kinds of changes 29
were already demonstrated in fish exposed to nitrite by some authors (Saoud et al., 2014; 30
Medeiros et al., 2016). Differently, other studies did not find a relationship between 31
histological lesions and nitrite toxicity (Wuertz et al., 2013; Roques et al., 2015). In fact, 32

87
the application of multiple biomarkers provides a more reliable and integrative assessment 1
of toxic effects related to contaminants (Saleh and Marie, 2016). 2
Despite the different toxic effects, undesirable nitrite concentrations are often transient in 3
aquatic ecosystems and aquaculture systems (Jensen, 2003). The return of fish to nitrite-4
free water after an exposure episode is generally sufficient to induce nitrite detoxification 5
from the organism and to reverse physiological disturbances within a few days as 6
demonstrated by previous studies (Jensen et al., 1987; Knudsen & Jensen, 1997; Gisbert et 7
al., 2004). Fish are capable of detoxifying nitrite by oxidising it to low-toxic nitrate through 8
different biochemical pathways involving the enzymes catalase and cytochrome oxidase, 9
and mainly via haemoglobin oxidation (Doblander and Lackner, 1996). 10
Since this mechanism of nitrite detoxification is the same involved on metHb formation, 11
the metHb reductase systems play an important role not only for the ressumptions of 12
normal Hb levels but also indirectly assist the nitrite detoxification process (Jensen, 2003). 13
Excretion of nitrite to the environment across the gills and via the urine are also 14
mechanisms involved in the elimination thereof (Zachariasen, 2001). However, the 15
recovery responses of fish after nitrite exposure are still understudied and there are no 16
works that perform this evaluation using oxidative stress parameters. For aquaculture 17
purposes, the provision of a suitable recovery period for nitrite-exposed fish is critical to 18
minimize the chances of cumulative effects if fish are subject to additional stressors 19
(Wedemeyer, 2012). 20
The Brazilian flounder Paralichthys orbignyanus (Valenciennes, 1839) is a native species 21
to South America, inhabiting estuarine and coastal waters from Brazil to Argentina 22
(Figueiredo and Menezes, 2000; Millner et al., 2005). This is a promising species for 23
intensive aquaculture due its commercial importance, easy adaptation to captivity 24
conditions and wide tolerance to distinct water quality conditions (Bianchini et al., 2010). 25
However, the knowledge about nitrite toxicity, a potential problem in intensive systems, is 26
quite limited regarding this species (Bianchini et al., 1996) and the sub-lethal effects of 27
exposure to this compound and recovery responses are still unknown. 28
Therefore, the aim of this study was to investigate the effects of exposure to sublethal 29
concentrations of nitrite on oxidative stress parameters and histopatology in different 30
tissues of juvenile Brazilian flounder P. orbignyanus. Moreover, an assessment of fish 31
recovery after a period in water with minimum nitrite concentrations was also performed. 32
88
1
2. Materials and methods 2
3
2.1 Ethical procedures 4
The experimental protocol was approved by the Committee on Animal Experimentation of 5
FURG (process number 23116.001030/2016-15). 6
7
2.2 Fish and experimental conditions 8
The juveniles Brazilian flounder (310.0 ± 5.6 g and 29.4 ± 0.2 cm) were obtained from the 9
Aquaculture Marine Station of the Universidade Federal do Rio Grande - FURG in Rio 10
Grande do Sul, south Brazil. Prior to the experiment, 180 fish were randomly distributed in 11
twelve 300 L circular tanks (15 fish per tank) organized in four recirculation systems which 12
were connected to their respective biological and mechanical filters. Fish were acclimated 13
for 20 days, fed twice daily (3% of total biomass) with commercial diet (46% crude 14
protein) throughout the acclimation and experimental periods. Photoperiod was fixed at 12 15
h Light :12 h Dark. 16
The fish were exposed to 0.08 ± 0.01(control), 5.72 ± 0.02, 10.43 ± 0.05 and 15.27 ± 0.04 17
mg NO2-N.L-1
in triplicate for 10 days in a semi-static system. Test concentrations were 18
chosen above the safety level (3.06 mg NH3-N.L-1
) for the species in seawater (Bianchini et 19
al., 1996) and reached through the addition of aliquots from a sodium nitrite (NaNO2; 20
Synth, Brazil) solution to the experimental units. The analytical verification of the desired 21
nitrite concentrations was performed daily according to Bendschneider and Robinson 22
(1952). After the exposure period, fish remained for 10 days in a recirculation system to 23
recover under minimum nitrite concentrations (0.05 ± 0.01 mg NO2-N.L-1
). 24
The water quality parameters temperature (23.91 ± 0.05 ºC) and dissolved oxygen (7.34 ± 25
0.02 mg.L-1
) (oximeter YSI 55), salinity (23.91 ± 0.05) (refractometer), pH (8.17 ± 0.01) 26
(pH meter, WTW 315i), total (0.27 ± 0.02 mg.L-1
) (UNESCO, 1983) and un-ionized 27
ammonia (< 0.01 mg.L-1
) (Colt, 2002), and total alkalinity (232.19 ± 1.50 mg CaCO3.L-1
) 28
(Eaton et al., 2005) were measured daily during the acclimation and experimental periods, 29
and always before the first feeding. 30
31
2.3 Organ sampling 32

89
After 1, 5 and 10 days of exposure and after a recovery period (day 20), nine fish were 1
randomly netted from each treatment and immediately euthanized with a lethal 2
concentration of hydrochloride benzocaine (500 ppm). Samples of gills, liver, brain and 3
muscle tissues were collected. Feeding was ceased 24 hours prior to each sampling day. 4
5
2.4 Organ homogenization and total protein content 6
Samples of gill, liver and muscle tissues were stored at -80 ºC and then homogenized 7
(1:5,w/v) in a Tris–HCl (100 mM, pH 7.75) buffer with EDTA (2 mM) and Mg2+
(5 mM). 8
The supernatants resulting from the centrifugation of the homogenates (10000 x g, 20 9
minutes, at 4ºC) were used for all analyses (da Rocha et al., 2009). The total protein content 10
of homogenized samples was determined in a microplate reader (BioTek LX 800) using a 11
commercial kit (Doles®) based on the Biuret assay (550 nm). 12
13
2.5 Total antioxidant capacity against peroxyl radicals 14
All samples were previously diluted with homogenization buffer to 2.0 mg protein mL-1
15
and the total antioxidant capacity against peroxyl radicals (ACAP) was determined 16
according to the method described by Amado et al. (2009). Fluorometry (excitation: 485 17
nm; emission: 520 nm) was measured through a spectrofluorimeter (Victor 2, Perkin Elmer, 18
MA, USA) with readings at every 5 minutes, during 30 minutes (gill and liver samples) or 19
at every 20 minutes, during 120 minutes (muscle samples). The ACAP values (expressed as 20
a relative area) were calculated using the expression proposed by Monserrat et al. (2014). 21
For interpretation purposes, a higher relative area means a lower antioxidant capacity. 22
23
2.6 Glutathione-S-transferase activity 24
Glutathione-S-transferase (GST) activity was determined following the conjugation of 1 25
mM glutathione (GSH) and 1 mM 1-chloro-2,4-dinitrobenzene (CDNB) according to Habig 26
et al. (1974) and Habig and Jakoby (1981). The absorbance (340 nm) was read in 96-wells 27
transparent microplates using a microplate reader (Biotek Elx 800). 28
29
2.7 Content of non-protein and protein thiols 30
For the measurement of non-proteic (NPSH) and proteic (PSH) thiols, the employed 31
method using DTNB (5,5-dithiobis-(2-nitrobenzoic acid; Sigma) was based on Sedlak and 32

90
Lindsay (1968). Determination of NPSH content in the samples was measured after 1
deproteinization with trichloro acetic acid (TCA 50%). The pellet formed by the 2
precipitated protein was re-suspended with homogenization buffer for determination of 3
PSH content. The absorbance readings (405 nm) were performed using a microplate reader 4
(Biotek Elx 800). 5
6
2.8 Lipid Peroxidation 7
The lipid peroxidation levels were measured according Oakes and Van Der Kraak (2003). 8
This method quantifies malondialdehyde (MDA) levels, a by-product of lipid peroxidation, 9
by measuring thiobarbituric acid-reactive substances (TBARS). Fluorometric 10
measurements (excitation: 520 nm, emission: 580 nm) was performed in spectrofluorimeter 11
(Victor 2, Perkin Elmer, MA, USA) and the results were expressed as nmol TMP mg wet 12
tissue-1
, where TMP stands for tetramethoxypropane (ACROS Organics), employed as a 13
standard. 14
15
2.9 Histopathological evaluation 16
Gill samples were fixed in Bouin’s solution, while brain and liver samples were fixed in 17
10% buffered formalin. Samples were dehydrated using sequentially increasing 18
concentrations of ethanol, cleared in xylene and embedded in paraplast with an automatic 19
tissue processor (LUPETEC, PT 05, Brazil). The sections (5 µm) were prepared using a 20
microtome (LUPETEC, MRP03, Brazil), stained with hematoxylin-eosin and slides were 21
analyzed using an optical microscope (ZEISS, PRIMO STAR). 22
23
2.10 Statistical analysis 24
All data were expressed as means ± standard error (S.E.M). One-way ANOVA and Tukey’s 25
test were performed to check differences among treatments on the same day. The data of 26
non-protein thiols content in gills did not meet the assumptions for ANOVA and therefore 27
the non-parametric Kruskall-Wallis’test followed by a multiple comparisons’ test. The 28
significance level was set at 5% in all cases (p<0.05). 29
30
3. Results 31
32
91
No mortality occurred for any of the experimental treatments throughout the exposure and 1
recovery periods. 2
3
3.1 Total protein content 4
The total protein content in gill was significantly lower in juvenile Brazilian flounder 5
exposed to 5.72 mg NO2-N.L-1
compared to other experimental groups at day 1, and 6
compared to treatment 10.43 mg NO2-N.L-1
at the 10th
day of exposure. After recovery, the 7
values were higher in the gill of fish subjected to 5.72 mg NO2-N.L-1
compared to those 8
exposed to 10.43 and 15.27 mg NO2-N.L-1
. However, treatments did not differ significantly 9
from controls at day 10 and after recovery (Figure 1A). The total protein content was 10
significantly lower in liver of fish exposed to 10.43 and 15.27 mg NO2-N.L-1
in relation to 11
control and 5.72 mg NO2-N.L-1
at day 10 (Figure 1B). The total protein content of muscle 12
was also significantly lower in fish exposed to 15.27 mg NO2-N.L-1
in relation to other 13
treatments, and in fish exposed to 10.43 mg NO2-N.L-1
compared to control fish and to 14
those exposed to 5.72 mg NO2-N.L-1
at day 5 (Figure 1C). No differences were found 15
among treatments after recovery in liver and muscle (Figure 1B-C). 16
17
3.2 Total antioxidant capacity against peroxyl radicals 18
Reduced antioxidant competence in relation to control were observed in gills of fish 19
exposed to all NO2-N.L-1
concentrations on day 1 and a similar condition was observed in 20
gills of fish exposed to 15.27 mg NO2-N.L-1
on day 5 (Figure 2A). The antioxidant 21
competence in the liver of fish exposed to treatment 15.27 mg NO2-N.L-1
was significantly 22
lower than that of their respective control during the entire period of exposure (days 1, 5 23
and 10). Moreover, treatments 5.72 and 10.43 mg NO2-N.L-1
showed lower antioxidant 24
competence compared to controls at days 5 and 10 (Figure 2B). Exposure to 15.27 and 5.72 25
mg NO2-N.L-1
reduced antioxidant competence in muscle as compared to controls on day 1 26
and at the end of exposure period (day 10), respectively (Figure 2C). Regardless of organ, 27
no differences were found among treatments after recovery (Figure 2A-B-C). 28
29
3.3 Glutathione-S-transferase activity 30
The GST activity in gills was lower in treatment of 15.27 mg NO2-N.L-1
compared to 31
control group and to concentration of 5.72 mg NO2-N.L-1
, and in treatments of 10.43 mg 32

92
NO2-N.L-1
compared to control at day 5. No differences were found among treatments after 1
recovery (Figure 3A). Liver of fish exposed to 10.43 and 15.27 mg NO2-N.L-1
showed 2
enhanced GST activity compared to other experimental groups at day 10. Differently, fish 3
exposed to 15.27 mg NO2-N.L-1
had a lower GST activity in relation to control and 4
treatment 5.72 mg NO2-N.L-1
after recovery (Figure 3B). During the exposure period, 5
muscle GST activity showed higher values in fish exposed to 15.27 mg NO2-N.L-1
6
compared to all groups at day 5, and lower values in treatment 5.72 mg NO2-N.L-1
at day 7
10, in comparison to all other treatments. Reduced GST activity was observed in treatment 8
15.27 mg NO2-N.L-1
compared to control after recovery (Figure 3C). 9
10
3.4 Content of non-protein thiols 11
The NPSH content were higher in the gill of fish exposed to the treatment 15.27 mg NO2-12
N.L-1
in relation to control and to treatment 5.72 mg NO2-N.L-1
, and in treatment 10.43 mg 13
NO2-N.L-1
in relation to control at day 10. After recovery, higher contents of NPSH were 14
found in treatments 10.43 and 15.27 mg NO2-N.L-1
compared to control and to treatment 15
5.72 mg NO2-N.L-1
(Figure 4A). On day 1, hepatic NPSH content were higher in fish 16
exposed to the treatment 15.27 mg NO2-N.L-1
in relation to control fish and to those 17
exposed to 5.72 mg NO2-N.L-1
. On day 5, higher values of this parameter were observed in 18
treatments 10.43 and 15.27 mg NO2-N.L-1
compared to control and to treatment 5.72 mg 19
NO2-N.L-1
. NPSH contents were also higher in liver of fish exposed to 15.27 mg NO2-N.L-1
20
compared to control and to treatment 5.72 mg NO2-N.L-1
, and in fish exposed to 10.43 mg 21
NO2-N.L-1
compared to control fish, at day 10. NPSH content was higher in liver of fish 22
exposed to 15.27 mg NO2-N.L-1
compared to control after the recovery (Figure 4B). In 23
muscle, NPSH content was higher in fish exposed to 15.27 mg NO2-N.L-1
compared to 24
other groups on the 10th
day of exposure. Elevations in NPSH content were also found in 25
treatments 10.43 and 15.27 mg NO2-N.L-1
compared to control and to treatment 5.72 mg 26
NO2-N.L-1
after recovery (Figure 4C). 27
28
3.5 Content of protein thiols 29
Exposure of fish to 15.27 mg NO2-N.L-1
and all NO2-N treatments led to a reduced content 30
of PSH in gill in comparison with controls at day 1 and 5, respectively. No differences were 31
found among treatments after recovery (Figure 5A). In liver, enhanced PSH content was 32

93
observed in treatments 10.43 and 15.27 mg NO2-N.L-1
compared to control and to 1
treatment 5.72 NO2-N.L-1
at the end of exposure and after recovery (Figure 5B). Nitrite 2
exposure induced a progressive enhanced of muscle PSH content over increasing 3
concentrations on days 5 and 10. At these days, PSH contents were higher in fish exposed 4
to 15.27 mg NO2-N.L-1
compared to all groups, and higher in fish exposed to 10.43 mg 5
NO2-N.L-1
compared to control fish. After recovery, treatment 5.72 mg NO2-N.L-1
6
presented higher PSH content than that of the 10.43 mg NO2-N.L-1
– exposed fish, 7
however, both treatments did not differ from control (Figure 5-C). 8
9
3.6 Lipid Peroxidation – TBARS 10
The TBARS levels in gill of Brazilian flounder exposed to all NO2-N treatments were 11
higher than those of the control group at day 1. On the 5th
day of exposure, the treatment 12
5.72 mg NO2-N.L-1
showed higher values compared to control, whereas treatment 15.27 13
mg NO2-N.L-1
had lower TBARS content in relation to any of the treatments. No 14
differences were found among treatments after recovery (Figure 6A). The liver of fish had 15
lower TBARS levels in treatments 10.43 and 15.27 mg NO2-N.L-1
compared to control and 16
to treatment 5.72 mg NO2-N.L-1
at day 10. A reduced TBARS level was also observed in 17
fish subjected to treatment 15.27 mg NO2-N.L-1
in comparison to control fish after recovery 18
(Figure 6B). Significant differences in muscle TBARS levels were detected only on day 10, 19
when the values were higher in fish exposed to 15.27 mg NO2-N.L-1
compared to control 20
and treatment 5.72 mg NO2-N.L-1
. After recovery, no differences were found among 21
treatments (Figure 6C). 22
23
3.7 Histopathological investigation 24
The histological investigation did not reveal any morphological alterations in gills, liver 25
and brain of flounder juveniles during nitrite exposure or after recovery period. 26
27
4. Discussion 28
29
In natural environments, nitrite typically occurs at very low concentrations, however, toxic 30
levels of this compound can be found in polluted waters or aquaculture production systems, 31
particularly in RAS (Kroupová et al., 2016). Understanding how nitrite affects animals is 32
94
essential to establish appropriate management strategies, to avoid deleterious effects 1
(Tomasso, 2012). In the present study, exposure to nitrite concentrations ranging from 5.72 2
to 15.27 mg NO2-N.L-1
for 10 days led to changes in protein content and caused oxidative 3
stress, without the occurrence of histopathological alterations in the assessed organs of 4
juvenile Brazilian flounder. The observed nitrite-induced effects were organ-, time- and 5
concentration-dependent. 6
Metabolic alterations, which are triggered during stress condition (Bonga, 1997), can lead 7
to reduced protein content in tissues of fish exposed to environmental contaminants (Liu et 8
al., 2010; Feng et al., 2014), as seen with nitrite toxicity reported in this study. The 9
reduction in total protein could indicate either an inhibition of synthesis or increased 10
degradation or breakdown (Firat et al., 2011). The protein catabolism is a general stress 11
response to cope with the high energy demand, when glycogen reserves are depleted (Oruc, 12
2011). While proteins are the major organic constituents of fish tissues and closely 13
involved with biological processes (Halver and Hardy, 2002), changes in its normal 14
metabolism can be linked to further physiological alterations. 15
The oxidative stress induced by environmental contaminants in fish is a result of enhanced 16
ROS production and/or weakening of the antioxidant system (Lushchak, 2016), which is 17
comprised of low-molecular-weight antioxidants and several enzymes (Martínez-Álvarez et 18
al., 2005). Nitrite exposure led to reduced total antioxidant competence in gill, liver and 19
muscle of Brazilian flounder, making these organs more susceptible to further ROS attack. 20
The impairment of a specific enzymatic defence was also demonstrated by some inhibition 21
of GST activity in muscle and gill, thus corroborating the nitrite-induced deleterious effects 22
in antioxidant and detoxifying system. Similarly, reduced enzymatic and non-enzymatic 23
antioxidant defences were demonstrated in gills of juvenile turbot (Scophthalmus maximus) 24
exposed for 96 h to similar concentrations (5.60 and 11.20 mg NO2-N.L-1
) of nitrite used 25
herein (Jia et al., 2015). These results suggest an enhanced production of free-radicals, as 26
ROS and RNS, resulting in expenditure or inhibition of antioxidant components due to 27
oxidative damage (Sun et al., 2012; Jia et al., 2015). Furthermore, coping with stress 28
involves several physiological adjustments to supply increased energy demand (Barton, 29
2002), which can lead to a deficiency in antioxidants production in the organism. The 30
lowering of protein content seems support this idea. 31
95
Otherwise, in certain conditions of ROS overproduction, the activation of redox-sensitive 1
transcription factors and ROS-mediated covalent modification of antioxidant proteins can 2
trigger antioxidant responses (Hermes-Lima et al., 2015). Enhanced gene expression and 3
activity of antioxidant enzymes have already been described in fish as an adaptive 4
mechanism to prevent oxidative stress induced by environmental nitrite (Ciji et al., 2012; 5
Sun et al., 2014a). In the present study, fish exposed to 10.43 and 15.27 mg NO2-N.L-1
6
triggered similar protective response mechanisms within the antioxidant system, 7
characterized by increases in GST activity and more evidently by elevations in the thiol 8
contents. 9
GST represent the major group of xenobiotic detoxification enzymes and are often used as 10
biomarkers of aquatic environmental contamination. The main role of these enzymes is the 11
catalysis of nucleophilic attack of the sulfur atom of GSH to electrophilic substrates 12
providing cellular defence against chemically induced toxicity (Blanchette et al., 2007). 13
Enhanced GST activity mediated by a prooxidant condition promotes the detoxification of 14
some toxic carbonyl-, peroxide-, and epoxide-containing metabolites produced by oxidative 15
damage (Hayes and Pulford, 1995). 16
Sinhorin et al. (2014) observed that when enzymatic defences are impaired or insufficient 17
to counteract oxidative radicals, non-enzymatic antioxidants including thiols levels are 18
enhanced so as to prevent the occurrence of auto-oxidation reactions. Increased levels of 19
NPSH (all tissues) and PSH (liver and muscle) in nitrite-exposed Brazilian flounder could 20
result either from enhanced synthesis, or decreased consumption and/or degradation (Husak 21
et al., 2017). It is recognized that nitrite accumulation in fish organism can cause excessive 22
production of nitric oxide (NO) (Jensen and Hansen, 2011) and the GSH biosynthetic 23
pathway can be stimulated in response to enhanced NO levels to protect cells against 24
oxidative or nitrosative stress (Moellering et al., 1998). These mechanisms can explain the 25
enhanced NPSH contents in the present study, since GSH is the predominant non-protein 26
thiol in cells (Dickinson and Forman, 2002). GSH is synthesized mainly in the liver and 27
released to the bloodstream before being distributed to other tissues (Peña et al., 2000). 28
This could explain the early increment in hepatic NPSH content on the first day of 29
exposure, whereas increases in this parameter were observed only on day 10 for gill and 30
muscle tissues. Besides the important role as an antioxidant, GSH can covalently modify 31
cysteine residues of protein thiols in a reversible process called S-glutathionylation, 32
96
avoiding irreversible oxidative damage and regulate protein function (Jakob and 1
Reichmann, 2013; Halliwell and Guteridge, 2015). Thus, enhanced PSH content is an 2
indication of reduced oxidative damage in proteins, possibly mediated by higher GSH 3
availability. 4
Considering the metahemoglobinemia as the main effect of nitrite toxicity (Jensen, 2003), 5
the up regulation of certain antioxidants, including GSH, can improve the tolerance of fish 6
to this compound, by shielding oxidation of haemoglobin (Smith and Nunn, 1984). Zhou et 7
al. (2013) reported an improved antioxidant capability and a higher tolerance to nitrite in 8
GIFT Oreochromis niloticus previously fed with dietary GSH. However, future studies 9
evaluating the relation between oxidative stress responses in blood and metahemoglobin 10
content can shed light on the role of the antioxidant system of Brazilian flounder against 11
nitrite-induced haemoglobin oxidation. 12
When antioxidant system is unable to efficiently counteract ROS and RNS, enhanced levels 13
of oxidative damage occurs. The higher TBARS values showed in gill on days 1 and 5, and 14
in muscle of fish exposed to 15.27 mg NO2-N.L-1
at the end of exposure, indicate enhanced 15
levels of lipid peroxidation end products (Halliwell and Gutteridge, 2015). Concomitantly, 16
the reduction in PSH content in gill could be also interpreted as a signal of a more oxidative 17
environment in cells leading to protein oxidation (Mitton et al., 2016). Our results are in 18
agreement with previous works that demonstrated nitrite-induced oxidative damage in 19
lipids and proteins of fish tissues (Sun et al., 2014a; Jia et al., 2015). The gill was the most 20
affected organ and the enhanced levels of oxidative damage in the first 5 days of exposure 21
are consistent with the impairment of antioxidant system at these days. Oxidative stress 22
responses can be influenced both by metabolism and basal redox condition of each organ 23
(da Rocha et al., 2009). Among the analyzed organs, the gill presented higher basal levels 24
of TBARS and lower content of thiol groups which is an indication of a pre-existing and 25
more intense pro-oxidant environment, making it more susceptible to oxidative damage 26
during a stress condition. 27
After enhanced TBARS values on day 1, the gills of fish exposed to 15.27 mg NO2-N.L-1
28
had lower levels of this parameter on day 5. This result may indicate more severe effects, 29
possibly related to a decrease in polyunsaturated fatty acids levels due to early oxidative 30
degradation (Sun et al., 2014b). Similarly, this is a possible explanation for the reduced 31
TBARS levels in the liver of fish exposed to 10.43 and 15.27 mg NO2-N.L-1
on day 10. 32

97
However, the reduced hepatic TBARS could also be related to a higher detoxification of 1
LPO end products as the MDA, due to the concurrently increase in GST activity. 2
Generally, it is important to highlight that some of nitrite-induced effects showed in this 3
study were transitory, occurring on the first and/or fifth day of exposure with subsequent 4
recovery of homeostasis, even during the exposure period. This pattern suggests that 5
Brazilian flounder presents biochemical compensatory mechanisms which confer to the 6
species a certain degree of adaptation to high levels of environmental nitrite. 7
Adverse biochemical and physiological changes, including enhanced oxidative damage of 8
macromolecules as lipids and proteins result in pathological alterations in tissues of fish 9
exposed to nitrite (Sun et al., 2014a). Although nitrite exposure induced oxidative stress in 10
juvenile Brazilian flounder, no histological abnormalities were found, indicating that toxic 11
effects of this compound were limited to the biochemical level. These results are in 12
agreement with other studies that evaluated the effects of contaminants on fish (Velisek et 13
al., 2011; Zivna et al., 2013; Sevcikova et al., 2016; Simonato et al., 2016), in which time 14
and/or nitrite concentrations were insufficient to cause further severe tissue damage 15
(Wuertz et al., 2013; Roques et al., 2015). Thus, the absence of histological alterations in 16
fish exposed to concentrations above the safety level (Bianchinni et al., 1996) suggest a 17
higher tolerance to nitrite than it would have been expected for this species. 18
The recovery period of 10 days was sufficient to restore basal levels of all analysed 19
parameters in fish exposed to the lowest nitrite concentration indicating a complete 20
reestablishment of homeostasis in this case. Differently, fish exposed to the other two 21
highest nitrite concentrations presented partial recovery, with return to basal levels only for 22
some parameters, and then a longer time is possibly required for complete recovery. NPSH 23
content in all tissues (except in liver of fish exposed to 10.43 mg NO2-N.L-1
) and hepatic 24
PSH levels were elevated in both treatments, suggesting a remaining effect of exposure 25
period and/or a role of thiols in nitrite detoxification and recovery of related physiological 26
disturbances. The recovery of basal TBARS content was demonstrated in fish exposed to 27
10.43 mg NO2-N.L-1
, while remained altered in liver of fish subjected to 15.27 mg NO2-28
N.L-1
as well as at the end of the exposure period. This is explained by a more severe effect 29
at higher concentrations. Reduced GST activity in liver and muscle was also observed in 30
treatment 15.27 mg NO2-N.L-1
after recovery. There is no evidence of a pro-oxidant 31
scenario triggered during the recovery period that can result in an inhibition of GST activity 32

98
by oxidative damage. On the contrary, antioxidant enzymes activity as GST is modulated 1
by ROS action and concentrations of oxidative damage products in tissues (Hermes-Lima 2
et al., 2015). Thus, the down-regulation of GST activity also can be expected due to a less 3
oxidant condition and/or reduced levels of oxidative damage products, as showed for liver 4
TBARS. 5
For Brazilian flounder aquaculture, negative implications can result from nitrite-induced 6
oxidative stress. This condition is known to be responsible for a variety of adverse health 7
effects and diseases in living organism (Livingstone, 2003; Valavanidis et al., 2006), and 8
also can lead to an impairment of final product due to higher oxidative degradation (Zhang 9
et al., 2016). Additionally, the increased energy cost related to stress, can result in tertiary 10
stress responses as reduced growth and reproductive performances (Barton, 2002). Hence, 11
concentrations of nitrite at 5.72 mg NO2-N.L-1
or above should be avoided in production 12
systems, even in the case of short-term exposure. Therefore, the constant monitoring of 13
nitrite levels becomes critical to ensure an adequate management of water quality, 14
especially in intensive production systems. As further research endeavours, we also suggest 15
that investigations on the use of strategies to improve the antioxidant system, such as the 16
inclusion of dietary antioxidants, should be conducted for it can potentially minimize nitrite 17
toxicity in this species. 18
In conclusion, the results of the present study revealed that short-term (10 days) exposure to 19
nitrite concentrations from 5.72 mg NO2-N.L-1
compromises the overall antioxidant system 20
and induced oxidative stress, without inducing histopathological alterations in juvenile 21
Brazilian flounder. Enhanced non-protein and protein thiols were also demonstrated as an 22
adaptive antioxidant response against nitrite toxicity. In addition, the recovery period was 23
sufficient for a complete (treatment 5.72 mg NO2-N.L-1
) or partial resumption (treatment 24
10.43 and 15.27 mg NO2-N.L-1
) of physiological condition depending on the nitrite 25
concentrations at which the fish were exposed. 26
27
Acknowledgements 28
29
This study was supported by research funds from Conselho Nacional de Pesquisa e 30
Desenvolvimento Científico (CNPq) and Coordenação de Aperfeiçoamento de Pessoal de 31
Nível Superior (CAPES). The authors are grateful to CNPq for research fellowships 32
99
provided for L. Garcia, L. Sampaio, L. Romano and J. Monserrat, and to CAPES for a PhD 1
scholarship provided for MSc. Lucas C. Maltez. We are grateful to Dr. L.A. Barbas for his 2
valuable contributions during the writing of this manuscript. 3
4
References 5
6
Amado, L.L., Longaray Garcia, M., Ramos, P.B., Freitas, R.F., Zafalon, B., Ribas Ferreira, 7
J.L., Yunes, J.S., Monserrat, J.M., 2009. A method to measure total antioxidant 8
capacity against peroxyl radicals in aquatic organisms: Application to evaluate 9
microcystins toxicity. Sci. Total Environ. 407, 2115–2123. 10
Barton, B. A., 2002. Stress in fishes: a diversity of responses with particular reference to 11
changes in circulating corticosteroids. Integr. Comp. Biol. 42, 517-525. 12
Bendschneider, K., Robinson, R.J. 1952. A new spectrophotometric method for the 13
determination of nitrite in sea water. J. Mar. Res. 11, 87-96. 14
Bernet, D., Schmidt, H., Meier, W., Burkhardt‐Holm, P., & Wahli, T., 1999. 15
Histopathology in fish: proposal for a protocol to assess aquatic pollution. J. Fish 16
Dis. 22, 25-34. 17
Bianchini, A., Robaldo, R.B., Sampaio, L.A., 2010. Cultivo do linguado (Paralichthys 18
orbignyanus). In: Baldisserotto, B., Gomes, L.C. (Eds.), Espécies nativas para 19
piscicultura no Brasil, 2ª edição. Editora UFSM, Santa Maria, Brasil, pp. 559-587. 20
Bianchini, A., Wasielesky Jr., W., Miranda Filho, K.C., 1996. Toxicity of nitrogenous 21
compounds to juveniles of flatfish Paralichthys orbignyanus. Bull. Environ. 22
Contam. Toxicol. 56, 453-459. 23
Blanchette, B., Feng, X., Singh, B.R., 2007. Marine glutathione S-transferases. Mar. 24
Biotechnol. 9, 513-542. 25
Bonga, S.W., 1997. The stress response in fish. Physiol. Rev. 77, 591-625. 26
Ciji, A., Sahu, N.P., Pal, A.K., Akhtar, M.S., Tincy, V., Mishal, P., Das, P., 2014. Effect of 27
dietary vitamin E and nitrite exposure on growth and metabolic variables of Labeo 28
rohita juveniles. Natl. Acad. Sci. Lett. 37, 123-129. 29
Ciji, A., Sahu, N.P., Pal, A.K., Dasgupta, S., Akhtar, M.S., 2012. Alterations in serum 30
electrolytes, antioxidative enzymes and haematological parameters of Labeo rohita 31
100
on short-term exposure to sublethal dose of nitrite. Fish Physiol. Biochem. 38, 1
1355-1365. 2
Colt, J., 2002. List of spreadsheets prepared as a complement. In: Wedemeyer GA (ed) Fish 3
hatchery management, 2nd ed. American Fish Society Publication. 4
http://www.fisheries.org/afs/hatchery.html. Accessed 10 April 2013 5
Da Rocha, A.M., de Freitas, D.S., Burns, M., Vieira, J.P., de La Torre, F.R., Monserrat, 6
J.M., 2009. Seasonal and organ variations in antioxidant capacity, detoxifying 7
competence and oxidative damage in freshwater and estuarine fishes from Southern 8
Brazil. Comp. Biochem. Phys. C. 150, 512-520. 9
Dickinson, D.A., Forman, H. J., 2002. Cellular glutathione and thiols metabolism. Biochem. 10
Pharmacol. 64, 1019-1026. 11
Doblander, C., Lackner, R., 1996. Metabolism and detoxification of nitrite by trout 12
hepatocytes. Biochim. Biophys. Acta 1289, 270-274. 13
Eaton, A.D., Clesceri, L.S., Rice, E.W., Greenberg, A.E., 2005. Standard methods for the 14
examination of water and wastewater, 21st edition. American Public Health 15
Association, Washington. 16
Feng, M., Qu, R., Li, Y., Wei, Z., Wang, Z., 2014. Biochemical biomarkers in liver and gill 17
tissues of freshwater fish Carassius auratus following in vivo exposure to 18
hexabromobenzene. Environ. Toxicol. 29, 1460-1470. 19
Figueiredo, J.L., Menezes, N.A., 2000. Manual de peixes marinhos do sudeste do Brasil. 20
São Paulo, Museu de Zoologia / USP. 21
Fırat, Ö., Cogun, H.Y., Yüzereroğlu, T.A., Gök, G., Fırat, Ö., Kargin, F., Kötemen, Y., 22
2011. A comparative study on the effects of a pesticide (cypermethrin) and two 23
metals (copper, lead) to serum biochemistry of Nile tilapia, Oreochromis niloticus. 24
Fish Physiol. Biochem. 37, 657-666. 25
Gisbert, E., Rodrıguez, A., Cardona, L., Huertas, M., Gallardo, M.A., Sarasquete, C., Sala-26
Rabanal, M., Ibarz, A., Sánchez, J., Castello-Orvay, F., 2004. Recovery of Siberian 27
sturgeon yearlings after an acute exposure to environmental nitrite: changes in the 28
plasmatic ionic balance, Na+–K
+ ATPase activity, and gill histology. Aquaculture 29
239, 141-154. 30
Grosell, M., Jensen, F.B., 2000. Uptake and effects of nitrite in the marine teleost fish 31
Platichthys flesus. Aquat. Toxicol. 50, 97-107. 32

101
Habig, W.H., Jakoby, W.B., 1981. Assays for differentiation of glutathione S-transferases. 1
Methods Enzymol. 77, 398–405. 2
Habig, W.H., Pabst, M.J., Jakoby, W.B., 1974. Glutathione S-transferases: the first 3
enzymatic step in mercapturic acid formation. J. Biol. Chem. 249, 7130–7139. 4
Halliwell, B., Gutteridge, J.M., 2015. Free Radicals in Biology and Medicine. Oxford 5
University Press, USA. 6
Halver, J.E., Hardy, R.W., 2002. Fish Nutrition. Academic press, United States of America. 7
Hayes, J.D., Pulford, D.J., 1995. The glutathione-S-transferase supergene family: 8
regulation of GST and the contribution of the lisoenzymes to cancer 9
chemoprotection and drug resistance part II. Crit. Rev. Biochem. Mol. 30, 521-600. 10
Hermes-Lima, M., Moreira, D.C., Rivera-Ingraham, G.A., Giraud-Billoud, M., Genaro-11
Mattos, T.C., Campos, É.G., 2015. Preparation for oxidative stress under hypoxia 12
and metabolic depression: revisiting the proposal two decades later. Free Radic. 13
Biol. Med. 89, 1122-1143. 14
Huertas, M., Gisbert, E., Rodrıguez, A., Cardona, L., Williot, P., Castello-Orvay, F., 2002. 15
Acute exposure of Siberian sturgeon (Acipenser baeri, Brandt) yearlings to nitrite: 16
median-lethal concentration (LC 50) determination, haematological changes and 17
nitrite accumulation in selected tissues. Aquat. Toxicol. 57, 257-266. 18
Husak, V.V., Mosiichuk, N.M., Storey, J.M., Storey, K.B., Lushchak, V. I., 2017. Acute 19
exposure to the penconazole-containing fungicide Topas partially augments 20
antioxidant potential in goldfish tissues. Comp. Biochem. Phys. C. 193, 1-8. 21
Jakob, U., Reichmann, D., 2013. Oxidative stress and redox regulation. Springer, 22
Dordrecht. 23
Jensen, F. B., 2003. Nitrite disrupts multiple physiological functions in aquatic animals. 24
Comp. Biochem. Physiol. A. 135, 9-24. 25
Jensen, F.B., Andersen, N.A., Heisler, N., 1987. Effects of nitrite exposure on blood 26
respiratory properties, acid-base and electrolyte regulation in the carp (Cyprinus 27
carpio). J Comp. Physiol. B. 157, 533-541. 28
Jensen, F.B., Gerber, L., Hansen, M.N., Madsen, S.S., 2015. Metabolic fates and effects of 29
nitrite in brown trout under normoxic and hypoxic conditions: blood and tissue 30
nitrite metabolism and interactions with branchial NOS, Na+/K
+-ATPase and hsp70 31
expression. J. Exp. Biol. 218, 2015-2022. 32
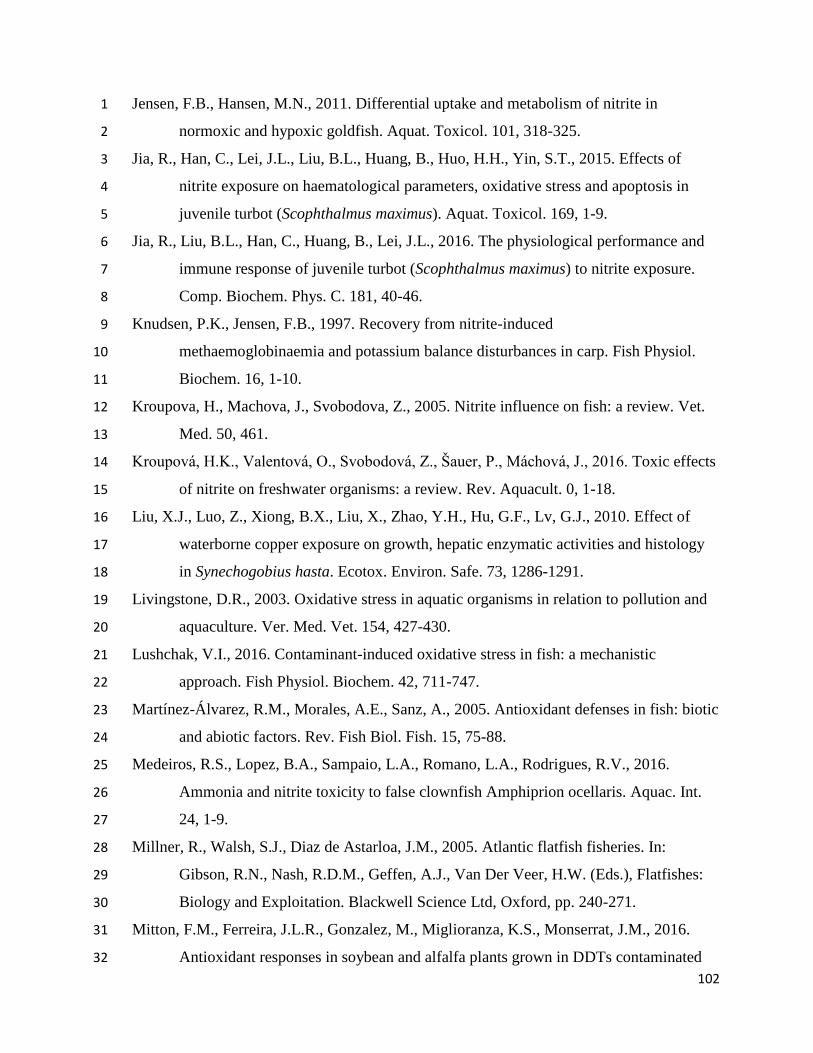
102
Jensen, F.B., Hansen, M.N., 2011. Differential uptake and metabolism of nitrite in 1
normoxic and hypoxic goldfish. Aquat. Toxicol. 101, 318-325. 2
Jia, R., Han, C., Lei, J.L., Liu, B.L., Huang, B., Huo, H.H., Yin, S.T., 2015. Effects of 3
nitrite exposure on haematological parameters, oxidative stress and apoptosis in 4
juvenile turbot (Scophthalmus maximus). Aquat. Toxicol. 169, 1-9. 5
Jia, R., Liu, B.L., Han, C., Huang, B., Lei, J.L., 2016. The physiological performance and 6
immune response of juvenile turbot (Scophthalmus maximus) to nitrite exposure. 7
Comp. Biochem. Phys. C. 181, 40-46. 8
Knudsen, P.K., Jensen, F.B., 1997. Recovery from nitrite-induced 9
methaemoglobinaemia and potassium balance disturbances in carp. Fish Physiol. 10
Biochem. 16, 1-10. 11
Kroupova, H., Machova, J., Svobodova, Z., 2005. Nitrite influence on fish: a review. Vet. 12
Med. 50, 461. 13
Kroupová, H.K., Valentová, O., Svobodová, Z., Šauer, P., Máchová, J., 2016. Toxic effects 14
of nitrite on freshwater organisms: a review. Rev. Aquacult. 0, 1-18. 15
Liu, X.J., Luo, Z., Xiong, B.X., Liu, X., Zhao, Y.H., Hu, G.F., Lv, G.J., 2010. Effect of 16
waterborne copper exposure on growth, hepatic enzymatic activities and histology 17
in Synechogobius hasta. Ecotox. Environ. Safe. 73, 1286-1291. 18
Livingstone, D.R., 2003. Oxidative stress in aquatic organisms in relation to pollution and 19
aquaculture. Ver. Med. Vet. 154, 427-430. 20
Lushchak, V.I., 2016. Contaminant-induced oxidative stress in fish: a mechanistic 21
approach. Fish Physiol. Biochem. 42, 711-747. 22
Martínez-Álvarez, R.M., Morales, A.E., Sanz, A., 2005. Antioxidant defenses in fish: biotic 23
and abiotic factors. Rev. Fish Biol. Fish. 15, 75-88. 24
Medeiros, R.S., Lopez, B.A., Sampaio, L.A., Romano, L.A., Rodrigues, R.V., 2016. 25
Ammonia and nitrite toxicity to false clownfish Amphiprion ocellaris. Aquac. Int. 26
24, 1-9. 27
Millner, R., Walsh, S.J., Diaz de Astarloa, J.M., 2005. Atlantic flatfish fisheries. In: 28
Gibson, R.N., Nash, R.D.M., Geffen, A.J., Van Der Veer, H.W. (Eds.), Flatfishes: 29
Biology and Exploitation. Blackwell Science Ltd, Oxford, pp. 240-271. 30
Mitton, F.M., Ferreira, J.L.R., Gonzalez, M., Miglioranza, K.S., Monserrat, J.M., 2016. 31
Antioxidant responses in soybean and alfalfa plants grown in DDTs contaminated 32
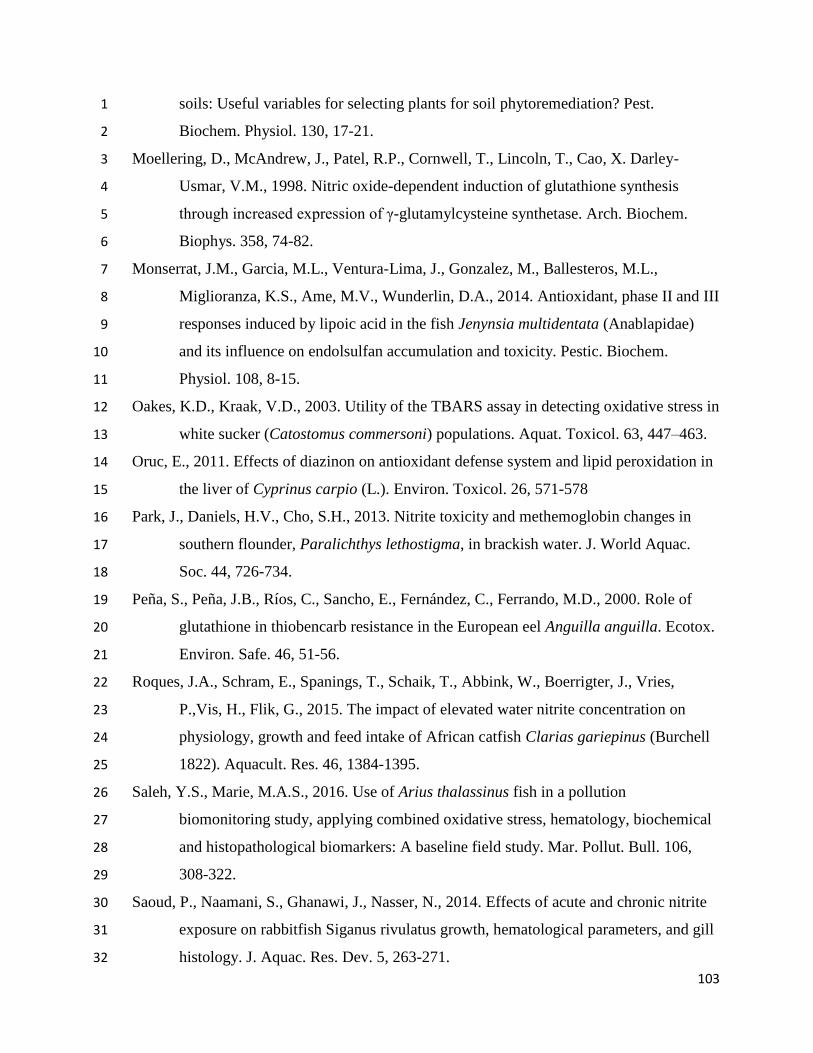
103
soils: Useful variables for selecting plants for soil phytoremediation? Pest. 1
Biochem. Physiol. 130, 17-21. 2
Moellering, D., McAndrew, J., Patel, R.P., Cornwell, T., Lincoln, T., Cao, X. Darley-3
Usmar, V.M., 1998. Nitric oxide-dependent induction of glutathione synthesis 4
through increased expression of γ-glutamylcysteine synthetase. Arch. Biochem. 5
Biophys. 358, 74-82. 6
Monserrat, J.M., Garcia, M.L., Ventura-Lima, J., Gonzalez, M., Ballesteros, M.L., 7
Miglioranza, K.S., Ame, M.V., Wunderlin, D.A., 2014. Antioxidant, phase II and III 8
responses induced by lipoic acid in the fish Jenynsia multidentata (Anablapidae) 9
and its influence on endolsulfan accumulation and toxicity. Pestic. Biochem. 10
Physiol. 108, 8-15. 11
Oakes, K.D., Kraak, V.D., 2003. Utility of the TBARS assay in detecting oxidative stress in 12
white sucker (Catostomus commersoni) populations. Aquat. Toxicol. 63, 447–463. 13
Oruc, E., 2011. Effects of diazinon on antioxidant defense system and lipid peroxidation in 14
the liver of Cyprinus carpio (L.). Environ. Toxicol. 26, 571-578 15
Park, J., Daniels, H.V., Cho, S.H., 2013. Nitrite toxicity and methemoglobin changes in 16
southern flounder, Paralichthys lethostigma, in brackish water. J. World Aquac. 17
Soc. 44, 726-734. 18
Peña, S., Peña, J.B., Ríos, C., Sancho, E., Fernández, C., Ferrando, M.D., 2000. Role of 19
glutathione in thiobencarb resistance in the European eel Anguilla anguilla. Ecotox. 20
Environ. Safe. 46, 51-56. 21
Roques, J.A., Schram, E., Spanings, T., Schaik, T., Abbink, W., Boerrigter, J., Vries, 22
P.,Vis, H., Flik, G., 2015. The impact of elevated water nitrite concentration on 23
physiology, growth and feed intake of African catfish Clarias gariepinus (Burchell 24
1822). Aquacult. Res. 46, 1384-1395. 25
Saleh, Y.S., Marie, M.A.S., 2016. Use of Arius thalassinus fish in a pollution 26
biomonitoring study, applying combined oxidative stress, hematology, biochemical 27
and histopathological biomarkers: A baseline field study. Mar. Pollut. Bull. 106, 28
308-322. 29
Saoud, P., Naamani, S., Ghanawi, J., Nasser, N., 2014. Effects of acute and chronic nitrite 30
exposure on rabbitfish Siganus rivulatus growth, hematological parameters, and gill 31
histology. J. Aquac. Res. Dev. 5, 263-271. 32

104
Sedlak, J., Lindsay, R.H., 1968. Estimation of total, protein-bound, and nonprotein 1
sulfhydryl groups in tissue with Ellman’s reagent. Anal. Biochem. 25, 192–205. 2
Sevcikova, M., Modra, H., Blahova, J., Dobsikova, R., Plhalova, L., Zitka, O., Hynek, D., 3
Kizek, R., Skoric, M., Svobodova, Z., 2016. Biochemical, haematological and 4
oxidative stress responses of common carp (Cyprinus carpio L.) after sub-chronic 5
exposure to copper. Vet. Med. 61, 35-50. 6
Simonato, J.D., Mela, M., Doria, H.B., Guiloski, I.C., Randi, M.A., Carvalho, P.S., Meletti, 7
P.C., Assis, H.C.S., Bianchini, A., Martinez, C.B., 2016. Biomarkers of waterborne 8
copper exposure in the Neotropical fish Prochilodus lineatus. Aquat. Toxicol. 170, 9
31-41. 10
Sinhorin, V.D.G., Sinhorin, A.P., dos Santos Teixeira, J.M., Miléski, K.M.L., Hansen, P.C., 11
Moreira, P.S.A., Kawashita, N.H., Baviera, A.M., Loro, V.L., 2014. Effects of the 12
acute exposition to glyphosate-based herbicide on oxidative stress parameters and 13
antioxidant responses in a hybrid Amazon fish surubim (Pseudoplatystoma sp). 14
Ecotox. Environ. Safe. 106, 181-187. 15
Smith, R.C., Nunn, V., 1984. Prevention by 3-N-ribosyluric acid of the oxidation of bovine 16
hemoglobin by sodium nitrite. Arch. Biochem. Biophys. 232, 348-353. 17
Sun, H., Li, J., Tang, L., Yang, Z., 2012. Responses of crucian carp Carassius auratus to 18
long-term exposure to nitrite and low dissolved oxygen levels. Biochem. Syst. Ecol. 19
44, 224-232. 20
Sun, H., Wang, W., Li, J., Yang, Z., 2014b. Growth, oxidative stress responses, and gene 21
transcription of juvenile bighead carp (Hypophthalmichthys nobilis) under chronic-22
term exposure of ammonia. Environ. Toxicol. Chem. 33, 1726–1731. 23
Sun, S., Ge, X., Zhu, J., Xuan, F., Jiang, X., 2014a. Identification and mRNA expression of 24
antioxidant enzyme genes associated with the oxidative stress response in the 25
Wuchang bream (Megalobrama amblycephala Yih) in response to acute nitrite 26
exposure. Com. Biochem. Phys. C. 159, 69-77. 27
Tomasso, J.R., 2012. Environmental nitrite and aquaculture: a perspective. Aquacult. Int. 28
20, 1107-1116. 29
UNESCO, 1983. Chemical methods for use in marine environmental monitoring. Manual 30
and Guides 12, Intergovernamental Oceanographic Commissiony. Paris, France. 31

105
Valavanidis, A., Vlahogianni, T., Dassenakis, M., Scoullos, M., 2006. Molecular 1
biomarkers of oxidative stress in aquatic organisms in relation to toxic 2
environmental pollutants. Ecotox. Environ. Safe. 64, 178-189. 3
Velisek, J., Stara, A., Kolarova, J., Svobodova, Z., 2011. Biochemical, physiological and 4
morfological responses in common carp (Cyprinus carpio L.) after long-term 5
exposure to terbutryn in real environmental concentration. Pestic. Biochem. Physiol. 6
100, 305-313. 7
Wedemeyer, G., 2012. Physiology of Fish in Intensive Culture Systems. Springer Science 8
& Business Media. 9
Wuertz, S., Schulze, S.G.E., Eberhardt, U., Schulz, C., Schroeder, J.P., 2013. Acute and 10
chronic nitrite toxicity in juvenile pike-perch (Sander lucioperca) and its 11
compensation by chloride. Comp. Biochem. Phys. C. 157, 352-360. 12
Zachariasen, F., 2001. Intraspecific differences in nitrite tolerance of rainbow trout. The 13
role of gill and kidney. Thesis, Institute of Biology, University of Southern 14
Denmark, Odense. 15
Zhang, L., Feng, L., Jiang, W.D., Liu, Y., Jiang, J., Li, S.H., Tang, L., Kuang, S.Y., Zhou, 16
X.Q., 2016. The impaired flesh quality by iron deficiency and excess is associated 17
with increasing oxidative damage and decreasing antioxidant capacity in the muscle 18
of young grass carp (Ctenopharyngodon idellus). Aquacult. Nutr. 22, 191-201. 19
Zhou, T. T., Cao, J. M., Huang, Y. H., Wang, G. X., Zhao, H. X., Sun, Z. W., & Liu, Q. F. 20
2013. Effects of dietary glutathione on antioxidant capability and resistance to 21
nitrite exposure of GIFT Oreochromis niloticus. Freshw. Fish. 1. 22
Zivna, D., Plhalova, L., Praskova, E., Stepanova, S., Siroka, Z., Sevcikova, M., Blahova, J., 23
Bartoskova, M., Marsalek, P., Skoric, M., Svobodova, Z., 2013. Oxidative stress 24
parameters in fish after subchronic exposure to acetylsalicylic acid. 25
Neuroendocrinol. Lett. 34, 116-122. 26
27
28
29
30
31
32

106
Legends 1
2
Figure 1. Total protein content in gill, liver and muscle of juvenile Brazilian flounder. 3
Total protein content (mg g wet tissue-1
) in gill (A), liver (B) and muscle (C) of juvenile 4
Brazilian flounder Paralichthys orbignyanus exposed to nitrite for 1, 5 and 10 days and 5
after recovery (day 20). Data were expressed as means ± S.E.M (n=9). Different lowercase 6
letters indicate significant differences among treatments at the same day (p <0.05). 7
8
Figure 2. Total antioxidant capacity against peroxyl radicals in gill, liver and muscle 9
of juvenile Brazilian flounder.Total antioxidant capacity against peroxyl radicals (ACAP) 10
(relative area) in gill (A), liver (B) and muscle (C) of juvenile Brazilian flounder 11
Paralichthys orbignyanus exposed to nitrite for 1, 5 and 10 days and after recovery (day 12
20). Data were expressed as means ± S.E.M (n=9). Different lowercase letters indicate 13
significant differences among treatments at the same day (p <0.05). 14
15
Figure 3. Glutathione-S-transferase activity in gill, liver and muscle of juvenile 16
Brazilian flounder. Glutathione-S-transferase (GST) activity (nmol CNDB-GSH min-1
mg 17
wet tissue-1
) in gill (A), liver (B) and muscle (C) of juvenile Brazilian flounder 18
Paralichthys orbignyanus exposed to nitrite for 1, 5 and 10 days and after recovery (day 19
20). Data were expressed as means ± S.E.M (n=9). Different lowercase letters indicate 20
significant differences among treatments at the same day (p <0.05). 21
22
Figure 4. Content of non-protein thiols in gill, liver and muscle of juvenile Brazilian 23
flounder. Content of non-protein thiols (NPSH) (nmol SH mg wet tissue
-1) in gill (A), liver 24
(B) and muscle (C) of juvenile Brazilian flounder Paralichthys orbignyanus exposed to 25
nitrite for 1, 5 and 10 days and after recovery (day 20). Data were expressed as means ± 26
S.E.M (n=9). Different lowercase letters indicate significant differences among treatments 27
at the same day (p <0.05). 28
29
Figure 5. Content of protein thiols in gill, liver and muscle of juvenile Brazilian 30
flounder. Content of protein thiols (PSH) (nmol SH mg protein
-1) in gill (A), liver (B) and 31
muscle (C) of juvenile Brazilian flounder Paralichthys orbignyanus exposed to nitrite for 32

107
1, 5 and 10 days and after recovery (day 20). Data were expressed as means ± S.E.M (n=9). 1
Different lowercase letters indicate significant differences among treatments at the same 2
day (p <0.05). 3
4
Figure 6. Content of thiobarbituric acid reactive substances in gill, liver and muscle of 5
juvenile Brazilian flounder. Thiobarbituric acid reactive substances (TBARS) content 6
(nmol TMP mg wet tissue-1
) in gill (A), liver (B) and muscle (C) of juvenile Brazilian 7
flounder Paralichthys orbignyanus exposed to nitrite for 1, 5 and 10 days and after 8
recovery (day 20). Data were expressed as means ± S.E.M (n=9). Different lowercase 9
letters indicate significant differences among treatments at the same day (p <0.05). 10
11
12
13
14
15
16
17
18
19
20
21
22
23
24
25
26
27
28
29
30
31
32
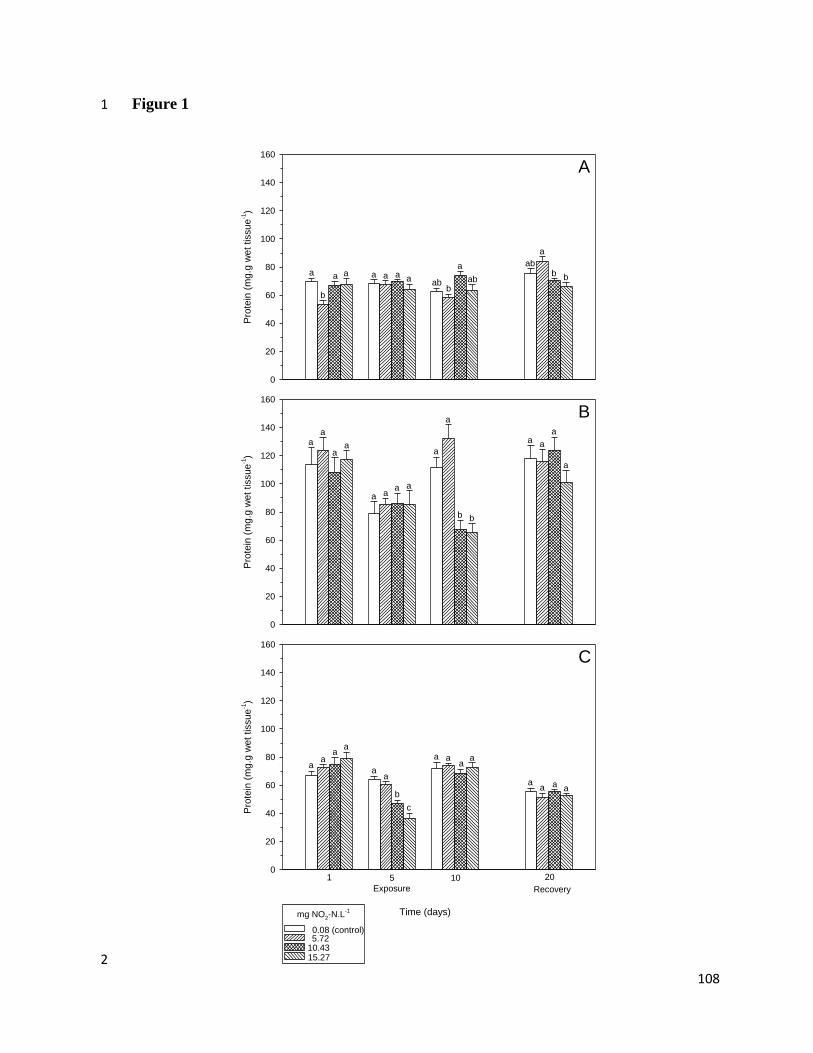
108
Figure 1 1
Time (days)
Pro
tein
(m
g.g
wet
tissue
-1)
0
20
40
60
80
100
120
140
160
1 5 10 20
Exposure Recovery
aa
aa
aa
b
c
aa a a
aaa a
C
mg NO2-N.L-1
0.08 (control)5.72
10.4315.27
Pro
tein
(m
g.g
wet
tissue
-1)
0
20
40
60
80
100
120
140
160
aa
aa
a aa a
a
aa
a
a
b
a
b
B
Pro
tein
(m
g.g
wet
tissue
-1)
0
20
40
60
80
100
120
140
160
a
b
a a a a a a b
abb
a
a
ababb
A
2
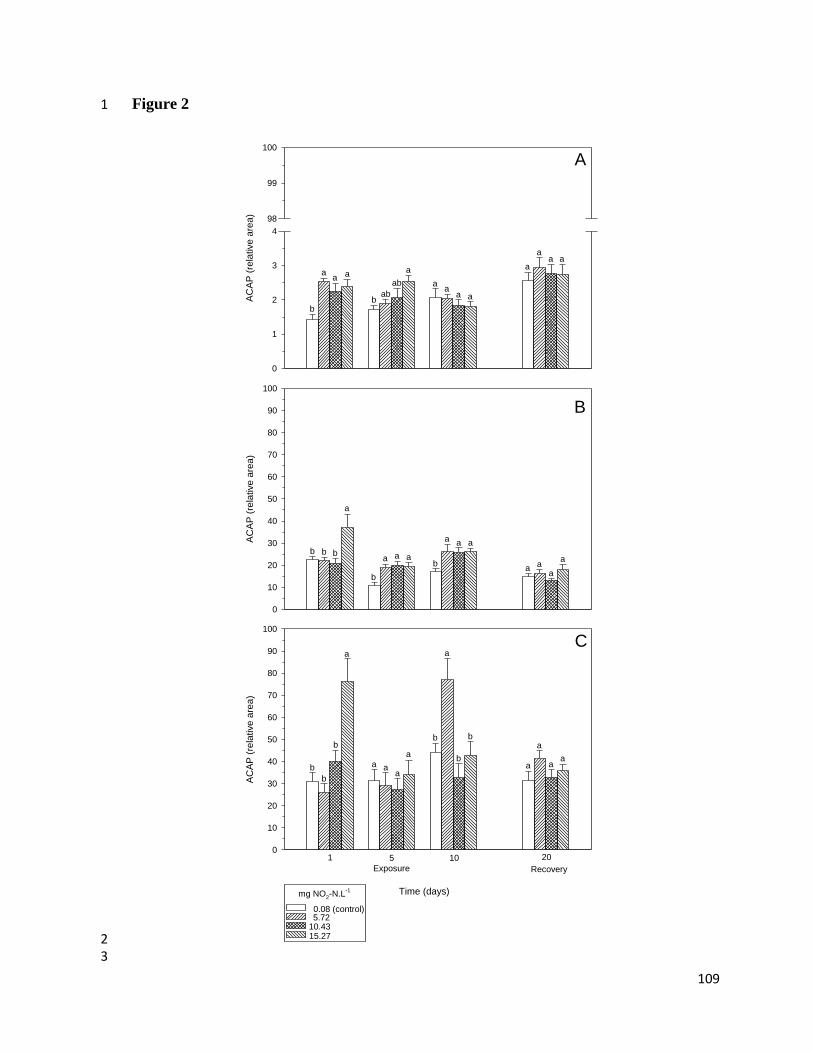
109
Figure 2 1
AC
AP
(re
lative
are
a)
0
1
2
3
4
98
99
100
b
aa a
bab
ab
a a
aa a
a a
aa
A
AC
AP
(re
lative
are
a)
0
10
20
30
40
50
60
70
80
90
100
B
b b b
a
b
a a a
a aa
a
a a
b
a
Time (days)
AC
AP
(re
lative
are
a)
0
10
20
30
40
50
60
70
80
90
100
1 5 10 20
Exposure Recovery
b
b
b
a
a aa
a
a
a
aab
b
a
b
C
mg NO2-N.L-1
0.08 (control)5.72
10.4315.27 2
3
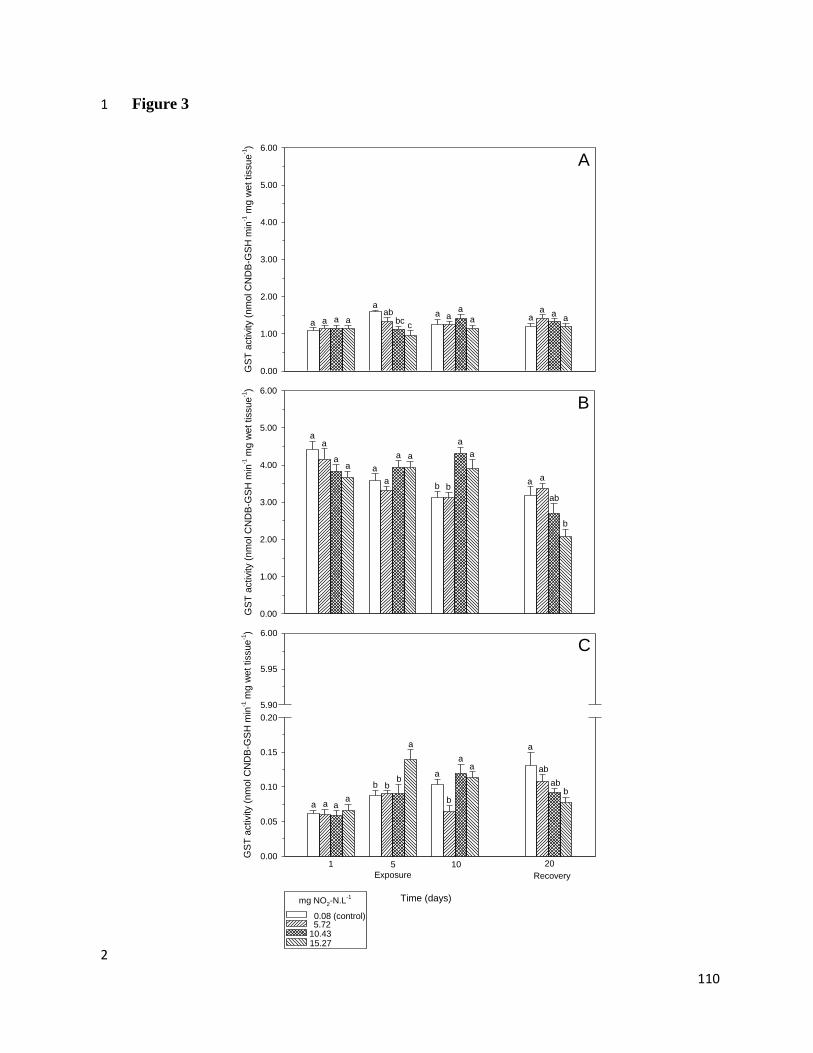
110
Figure 3 1
Time (days)
GS
T a
ctivity (
nm
ol C
ND
B-G
SH
min
-1 m
g w
et
tissu
e-1)
0.00
0.05
0.10
0.15
0.20
5.90
5.95
6.00
1 5 10 20
Exposure Recovery
a a aa
b bb
a a
ab
abb
b
aa
a
C
mg NO2-N.L-1
0.08 (control)5.72
10.4315.27
GS
T a
ctivity (
nm
ol C
ND
B-G
SH
min
-1 m
g w
et
tissu
e-1)
0.00
1.00
2.00
3.00
4.00
5.00
6.00
GS
T a
ctivity (
nm
ol C
ND
B-G
SH
min
-1 m
g w
et
tissu
e-1)
0.00
1.00
2.00
3.00
4.00
5.00
6.00
a a a a
aab
bcc
aa a
aa
aa a
A
aa
aa a
a
a a
a a
ab
b
a
a
b b
B
2
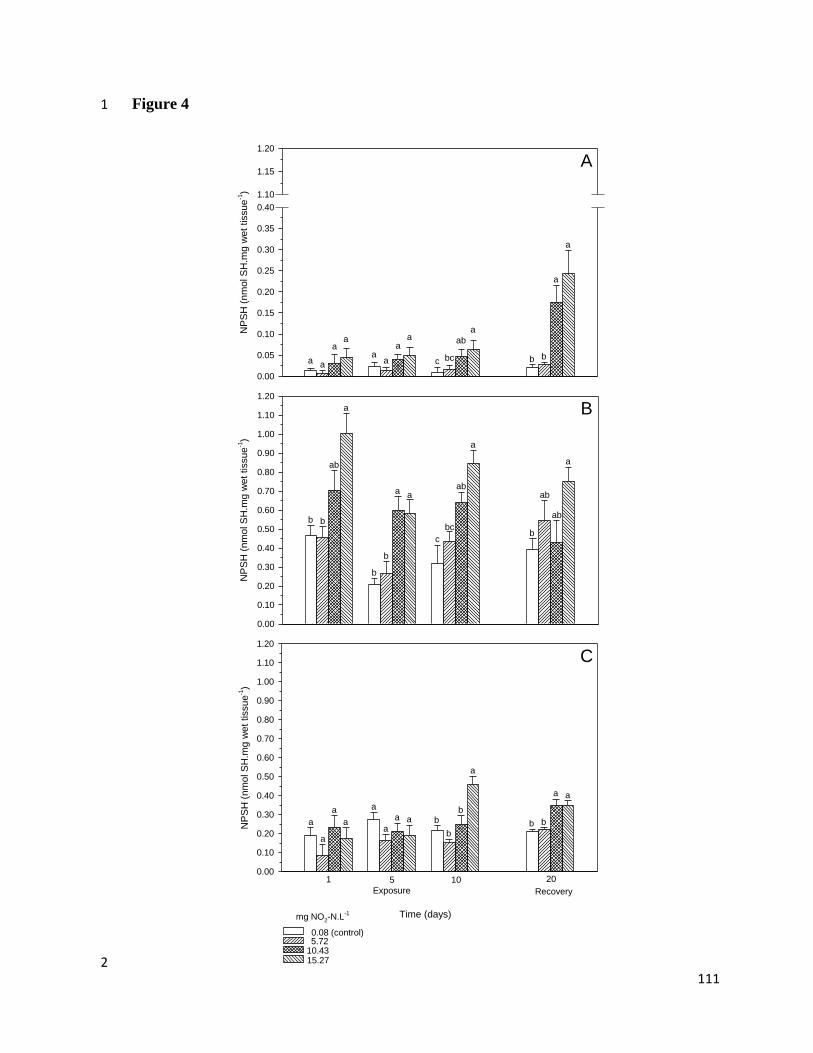
111
Figure 4 1
NP
SH
(nm
ol S
H.m
g w
et
tissue
-1)
0.00
0.05
0.10
0.15
0.20
0.25
0.30
0.35
0.40
1.10
1.15
1.20
a a
aa
aa
aa
b
a
a
b
ab
a
c bc
A
Time (days)
NP
SH
(nm
ol S
H.m
g w
et
tissue
-1)
0.00
0.10
0.20
0.30
0.40
0.50
0.60
0.70
0.80
0.90
1.00
1.10
1.20
NP
SH
(nm
ol S
H.m
g w
et
tissue
-1)
0.00
0.10
0.20
0.30
0.40
0.50
0.60
0.70
0.80
0.90
1.00
1.10
1.20
b b
ab
a
b
b
a a ab
a
ab
b
ab
a
c
bc
B
1 5 10 20
Exposure Recovery
a
a
a
a
a
a
a a
a
b
a
bb
a
bb
C
mg NO2-N.L-1
0.08 (control)5.72
10.4315.27 2

112
Figure 5 1
PS
H (
nm
ol S
H.m
g p
rote
in-1)
0.0
0.2
0.4
0.6
0.8
1.0
1.2
1.4
1.6
1.8
2.0
19.0
19.2
19.4
19.6
19.8
20.0
a
abab
b
a
b
b
b
a
a
aa
a
a
a
a
A
PS
H (
nm
ol S
H.m
g p
rote
in-1)
0.0
2.0
4.0
6.0
8.0
10.0
12.0
14.0
16.0
18.0
20.0
a aa
a
a aa a
b
aab
a
a
bb
Time (days)
PS
H (
nm
ol S
H.m
g p
rote
in-1)
0.0
2.0
4.0
6.0
8.0
10.0
12.0
14.0
16.0
18.0
20.0
B
15.27
1 5 10 20
Exposure Recovery
a a
a
a
c
c
b
a
ab
b
a
ab
c
a
b
c
C
mg NO2-N.L-1
0.08 (control)5.72
10.43
2
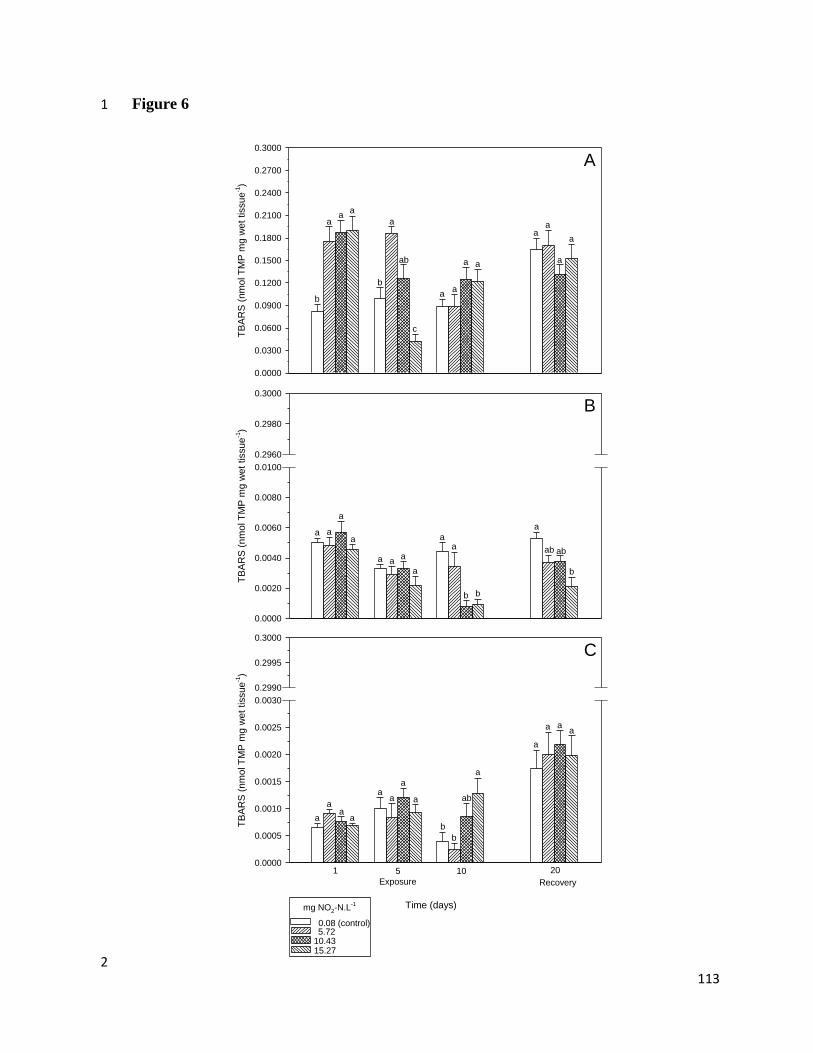
113
Figure 6 1
TB
AR
S (
nm
ol T
MP
mg
wet
tissue
-1)
0.0000
0.0300
0.0600
0.0900
0.1200
0.1500
0.1800
0.2100
0.2400
0.2700
0.3000
b
aa
a
b
a
ab
c
aa
a
a
a a
aa
A
TB
AR
S (
nm
ol T
MP
mg
we
t tissu
e-1)
0.0000
0.0020
0.0040
0.0060
0.0080
0.0100
0.2960
0.2980
0.3000
a a
a
a
a aa
a
ab
a
ab
b
b b
aa
B
Time (days)
TB
AR
S (
nm
ol T
MP
mg
we
t tissu
e-1)
0.0000
0.0005
0.0010
0.0015
0.0020
0.0025
0.0030
0.2990
0.2995
0.3000
1 5 10 20
Exposure Recovery
a
aa
a
aa
a
a
a
a aa
b
a
ab
b
C
mg NO2-N.L-1
0.08 (control)5.72
10.4315.27
2

114
5. CONCLUSÕES 1
2
- A exposição a concentrações partir de 0,12 mg NH3-N.L-1
e 5,72 mg NO2-N.L-1
3
por um período de 10 dias induzem diversas alterações fisiológicas e bioquímicas, de modo 4
tempo e concentração-dependentes, em juvenis de P. orbignyanus. 5
- Os efeitos decorrentes da exposição à amônia e nitrito em P. orbignyanus incluem 6
distúrbios metabólicos, osmorregulatórios, ácido-base, e na resposta imune, além da 7
indução ao estresse oxidativo e a ativação de respostas antioxidantes. 8
- A exposição a concentrações de até 0,57 mg NH3-N.L-1
e 15,27 mg NO2-N.L-1
por 9
um período de 10 dias não foi suficiente para ocasionar alterações histopatológicas no 10
cérebro, brânquia e fígado de P. orbignyanus. 11
- O período de recuperação de 10 dias foi capaz de reverter todas ou parte das 12
alterações nos parâmetros sanguíneos e de estresse oxidativo ocasionados nos juvenis de P. 13
orbignyanus, dependendo do composto e concentração que foram expostos. A recuperação 14
completa foi demonstrada apenas nos peixes expostos a 5,72 mg NO2-N.L-1
. 15
16
6. CONSIDERAÇÕES FINAIS E PERSPECTIVAS 17
18
- Com base nos resultados obtidos, concentrações de amônia e nitrito a partir de 19
0,12 mg NH3-N.L-1
e 5,72 mg NO2-N.L-1
, respectivamente, devem ser evitadas nos sistemas 20
de produção do linguado P. orbignyanus, uma vez que foram capazes de causar estresse nos 21
peixes, mesmo em curto prazo (1 a 10 dias). Vale ressaltar que esta é uma recomendação 22
para condições de cultivo semelhantes as do presente estudo e não deve ser generalizada, 23
uma vez que a toxicidade destes compostos pode ser influenciada por diversos fatores 24
bióticos e abióticos. No presente estudo, mesmo as concentrações mais baixas testadas de 25
ambos os compostos induziram alterações na homeostase dos peixes. Portanto, recomenda-26
se que futuros trabalhos sejam realizados avaliando os efeitos da exposição a concentrações 27
inferiores a 0,12 mg NH3-N.L-1
e 5,72 mg NO2-N.L-1
, bem como a interação com outras 28

115
variáveis, o que poderá permitir o estabelecimento mais preciso de quais os níveis seguros 1
de amônia e nitrito na água para espécie em diferentes condições. 2
- O monitoramento não só da qualidade de água, mas também do estado fisiológico 3
dos peixes deve ser uma prática rotineira nos sistemas de produção aquícola, permitindo a 4
detecção de condições estressantes para os animais e a tomada de medidas necessárias de 5
maneira precoce. 6
- Os parâmetros sanguíneos e de estresse oxidativo aplicados nesta tese 7
demonstraram ser excelentes biomarcadores para detectar os efeitos deletérios ocasionados 8
pela exposição de juvenis de linguado a níveis subletais de amônia e nitrito. 9
- Uma vez que o estresse oxidativo foi um dos efeitos tóxicos da amônia e nitrito 10
para os juvenis de linguado, a busca por alternativas que melhorem o sistema antioxidante, 11
como a inclusão de antioxidantes na dieta, pode potencialmente minimizar ou evitar este 12
efeito. Portanto, recomenda-se que esta hipótese seja testada em futuros estudos com a 13
espécie. 14
- Um período de 10 dias de recuperação em água livre ou com concentrações 15
mínimas de nitrito é recomendado para restabelecer as condições fisiológicas normais de 16
juvenis de linguado que tenham sido expostos a concentrações até 5,72 mg NO2-N.L-1
. Para 17
peixes expostos a concentrações de amônia e nitrito a partir de 0,12 mg NH3-N.L-1
e 10,43 18
mg NO2-N.L-1
, respectivamente, sugere-se que um período de recuperação mais longo seja 19
necessário, o qual deverá ser estabelecido a partir de novos estudos. 20
21