universidade federal de uberlÂndia instituto de …€¦ · iii universidade federal de ube...
TRANSCRIPT

i
UNIVERSIDADE FEDERAL DE UBERLÂNDIA INSTITUTO DE GENÉTICA E BIOQUÍMICA
PÓS-GRADUAÇÃO EM GENÉTICA E BIOQUÍMICA
Dinâmica de Marcadores Salivares de Atividade Autônoma e
Adrenocortical em Resposta à Competição de Elite
Aluno: Miguel Mauricio Díaz Gómez
Orientador: Prof. Dr. Foued Salmen Espindola
UBERLÂNDIA - MG
2011

ii
UNIVERSIDADE FEDERAL DE UBERLÂNDIA INSTITUTO DE GENÉTICA E BIOQUÍMICA
PÓS-GRADUAÇÃO EM GENÉTICA E BIOQUÍMICA
Dinâmica de Marcadores Salivares de Atividade Autônoma e
Adrenocortical em Resposta à Competição de Elite
Aluno: Miguel Mauricio Díaz Gómez
Orientador: Prof. Dr. Foued Salmen Espindola
Dissertação apresentada à Universidade Federal de Uberlândia como parte dos requisitos para obtenção do Título de Mestre em Genética e Bioquímica (Área Bioquímica)
UBERLÂNDIA - MG
2011

iii
UNIVERSIDADE FEDERAL DE UBERLÂNDIA INSTITUTO DE GENÉTICA E BIOQUÍMICA
PÓS-GRADUAÇÃO EM GENÉTICA E BIOQUÍMICA
Dinâmica de Marcadores Salivares de Atividade Autônoma e
Adrenocortical em Resposta à Competição de Elite
ALUNO: Miguel Mauricio Díaz Gómez
COMISSÃO EXAMINADORA
Presidente: Prof. Dr. Foued Salmen Espindola (Orientador)
Examinadores
Prof. Dr. Nilo Resende Viana
Profa. Dra. Deborah Suchecki
Data da Defesa: ______ /_____ /______
As sugestões da Comissão Examinadora e as Normas PGGB para o formato da
Dissertação foram contempladas
__________________________________________
(Foued Salmen Espindola)

iv
a Foued Salmen Espindola,
pela oportunidade, a confiança e o respeito.

v
Índice
APRESENTAÇÃO ...................................................................................................................................1
CAPITULO 1 ..............................................................................................................................................2
HOMEOSTASIA E ESTRESSE.....................................................................................................................3
EFETORES NEUROENDÓCRINOS DA RESPOSTA AO ESTRESSE .......................................................3
REAÇÕES DE FUGA OU LUTA E BUSCA DE APOIO ..............................................................................5
MARCADORES SALIVARES .......................................................................................................................6
ESPORTE PROFESSIONAL COMO MODELO DE ESTRESSE ................................................................8
REFERENCIAS..............................................................................................................................................9
CAPITULO 2 ........................................................................................................................................... 12
RESUMO..................................................................................................................................................... 13
ABSTRACT................................................................................................................................................. 14
INTRODUCTION ......................................................................................................................................... 15
METHODS .................................................................................................................................................. 16
SUBJECTS ..................................................................................................................................................................16
DESIGN .......................................................................................................................................................................17
MEASURES ................................................................................................................................................................17
AEROBIC CAPACITY ................................................................................................................................................17
SALIVA SAMPLING AND HANDLING ....................................................................................................................18
SALIVARY CORTISOL .............................................................................................................................................18
PSYCHOMETRIC INSTRUMENTS .........................................................................................................................18
STATISTICAL ANALYSIS ........................................................................................................................................19
RESULTS.................................................................................................................................................... 19
THE CORTISOL AWAKENING RESPONSE .........................................................................................................19
PRE AND POST-COMPETITION PROFILE OF CORTISOL ..............................................................................20
PSYCHOMETRIC VARIABLES AND REPORTS OF PERFORMANCE............................................................20
ASSOCIATIONS BETWEEN THE CAR AND MOOD STATES.........................................................................20
ASSOCIATIONS BETWEEN THE CAR AND PERFORMANCE.......................................................................21
DISCUSSION .............................................................................................................................................. 21
CONCLUSIONS .......................................................................................................................................... 25
TABLE 1 ..................................................................................................................................................... 27
TABLE 2 ..................................................................................................................................................... 28
FIGURE 1 ................................................................................................................................................... 29
FIGURE 2 ................................................................................................................................................... 30
REFERENCES ............................................................................................................................................ 31
CAPITULO 3 ........................................................................................................................................... 35
RESUMO..................................................................................................................................................... 36
ABSTRACT................................................................................................................................................. 37
INTRODUCTION ......................................................................................................................................... 38
METHODS .................................................................................................................................................. 40
SUBJECTS ..................................................................................................................................................................40

vi
EXPERIMENTAL DESIGN........................................................................................................................................40
MEASURES ................................................................................................................................................ 41
AEROBIC CAPACITY ................................................................................................................................................41
SALIVA SAMPLING AND HANDLING ....................................................................................................................41
WESTERN BLOTTING FOR SAA AND CGA......................................................................................................41
PRODUCTION OF THE ANTIBODY FOR SAA ...................................................................................................42
PSYCHOMETRIC INSTRUMENTS .........................................................................................................................42
STATISTICAL ANALYSES ........................................................................................................................ 43
RESULTS.................................................................................................................................................... 43
MAIN CHARACTERISTICS OF SUBJECTS..........................................................................................................43
AVERAGED CONCENTRATIONS OF SALIVARY MARKERS OF SYMPATHETIC ACTIVITY ....................43
DIURNAL PROFILE OF SALIVARY MARKERS OF SYMPATHETIC ACTIVITY DURING COMPETITION 43
POSITIVE AND NEGATIVE AFFECT SCORES....................................................................................................44
DISCUSSION .............................................................................................................................................. 44
CONCLUSIONS .......................................................................................................................................... 49
TABLE 1 ..................................................................................................................................................... 51
TABLE 2 ..................................................................................................................................................... 52
FIGURES .................................................................................................................................................... 53
REFERENCES ............................................................................................................................................ 55

1
Apresentação
Os estudos apresentados nesta dissertação foram delineados para
examinar alguns dos eventos biológicos subjacentes à exposição a estímulos
adversos (estresse). De interesse particular é a resposta do cortisol salivar, alfa-
amilase, cromogranina A e proteína total na saliva à competição esportiva
profissional. Foi postulado que a magnitude de variação do cortisol ao acordar
indicaria mudanças similares em estados de humor e níveis de desempenho
durante o dia (capítulo 2) e que a o comportamento de marcadores de atividade
simpática dependia dos mecanismos responsáveis pela sua secreção na saliva
e não de propriedades particulares a cada analito (capítulo 3). Uma competição
em natação de nível nacional foi utilizada como modelo de estresse. Os
participantes (atletas profissionais) foram avaliados ao longo dos dois primeiros
dias de competição e durante dois dias consecutivos de treinamento para a
obtenção de parâmetros de base. Os resultados de ambos os estudos podem
ser resumidos em dois achados principais: 1) a resposta do cortisol ao acordar
não necessariamente representa um grau similar de variação em estados de
humor e níveis de desempenho e 2) existe uma variação proporcional na
concentração de diferentes proteínas na saliva em função de uma maior
atividade simpática. Os resultados destes trabalhos sugerem ao leitor diferenças
na resposta a estímulos adversos em diferentes populações e técnicas simples
para a valoração da reatividade simpática na resposta ao estresse.

2
Capitulo 1 Fundamentação Teórica

3
Homeostasia e Estresse
Os seres vivos conseguem manter um estado constante nas propriedades
físico-químicas do seu meio interno através de múltiplos mecanismos de auto-
regulação. Este estado de equilíbrio dinâmico é denominado ‘homeostasia’ e é
um conceito central ao estudo e entendimento do estresse como processo
fisiológico. O estresse é definido como o estado de ameaça, real ou percebida, à
homeostasia como conseqüência da exposição a estímulos adversos
(estressores)1.Em resposta a tais estímulos, uma serie de processos fisiológicos
e comportamentais é rapidamente iniciada com o objetivo de manter ou re-
estabelecer o equilíbrio do meio interno. A atenção, por exemplo, melhora e as
funções cerebrais são orientadas ao estimulo estressor. As freqüências cardíaca
e respiratória aumentam, o sangue é re-dirigido à musculatura ativa e processos
catabólicos de obtenção de energia são priorizados. Estas respostas são
geralmente transitórias e tem como objetivo maximizar as chances de
supervivência do organismo2.
O grau de intensidade da resposta a estímulos adversos depende, por
sua vez, da gravidade, duração e freqüência do estimulo. Não todos os
estímulos adversos provenientes do ambiente conseguem provocar a mesma
proporção neste tipo de respostas3. Da mesma forma, devido a que em
essência, todos os processos biológicos em um organismo estão direta ou
indiretamente orientados à manutenção da homeostasia, o conceito de estresse
é apropriado em situações imprevisíveis e de ausência de controle que
provocam alterações fisiológicas e comportamentais4.
Efetores Neuroendócrinos da Resposta ao Estresse
A resposta ao estresse é iniciada por uma rede de estruturas neuronais
que recebem constantemente informação de altos centros no sistema nervoso
central (SNC), a periferia e o ambiente5. Este sistema provê informação à
glândula pituitária e núcleos pontomedulares que, pela sua vez, controlam a

4
resposta neuroendócrina e autonômica do organismo por meio dos eixos o
hipotalâmico –pituitário -adrenal (HPA) e o simpático –adrenomedular (SAM)5,6
Neurônios do núcleo para-ventricular do hipotálamo, da medula e do
lócus coeruleus (LC) são os coordenadores centrais da resposta a estímulos
adversos7. Células do LC e outras células noradrenérgicas da medula são
conhecidas como o sistema LC/norepinefrina (NE), responsável por controlar a
estimulação do sistema nervoso simpático (SNS) induzida por estresse. No
cérebro, a NE funciona como um sinal de alarme que provoca estados
pronunciados de excitação e vigilância enquanto diminui funções vegetativas
como comer e dormir7.
O mediador químico mais importante da resposta central ao estresse é o
hormônio liberador de corticotropina (CRH)8. Estímulos adversos são um potente
ativador da liberação de CRH pelo hipotálamo e outros locais como o córtex
cerebral, o tronco encefálico e a medula9. As células cromafins da medula
adrenal são inervadas por nervos pré-ganglionares do nervo esplânico. Tais
células medulares produzem catecolaminas10, as quais circulam no plasma
ligadas à albumina e induzem a estimulação do SNS. A ativação do SNS provê
um mecanismo de resposta rápida que controla a reação do organismo ao
estressor11. Além de ativar o SNS, a liberação de CRH durante o estresse,
associada à liberação de arginina vasopressina (AVP), resulta em maior
secreção de hormônio adrenocorticotrópico (ACTH)7. A secreção de ACTH pela
glândula pituitária anterior estimula o córtex adrenal para secretar grandes
quantidades de glicocorticóides (principalmente cortisol, em primatas)12. Os
glicocorticóides são o produto final da estimulação do eixo HPA e participam do
controle da homeostasia do todo o organismo13. Após a sua liberação pelo
córtex adrenal em resposta ao ACTH, os glicocorticóides exercem
retroalimentação negativa sobre a glândula pituitária, os neurônios produtores de
CRH no hipotálamo e o sistema LC/NE13. A retroalimentação inibitória dos
glicocorticóides limita a exposição dos tecidos a estes hormônios, minimizando

5
assim seus efeitos catabólicos, lipogênicos, anti-reprodutivos e
imunossupressores.
Reações de Fuga ou Luta e Busca de Apoio
A ativação do sistema nervoso durante situações adversas é denominada
como a reação de fuga ou luta. A secreção de epinefrina como resultado de uma
maior atividade do SNS em situações de perigo e onde é requerida atividade
física resulta numa complexa integração de sistemas orientados como
mencionado anteriormente, a maximizar as chances de supervivência do
organismo. De forma geral, os efeitos da ativação do SNS em resposta ao
estresse são14:
• Aumento na glicogenólise hepática e muscular.
• Aumento na disponibilidade de gordura como substrato energético.
• Aumento na freqüência e contratilidade cardíaca com subseqüente
aumento no debito cardíaco.
• Redistribuição do fluxo sanguíneo desde a musculatura lisa para o
músculo esquelético.
• Aumento na freqüência respiratória.
• Aumento dos níveis de fatores de coagulação no sangue.
• Diminuição na motilidade gástrica.
• Melhoria nos níveis de atenção e aumentos nos níveis de ansiedade.
A reação de fuga ou luta, no entanto, é mais característica de machos do
que fêmeas. Devido ao papel reprodutivo e de cuidado desenvolvido pelas
fêmeas na maioria das espécies, incluindo a humana, a resposta ao estresse em
fêmeas está mais relacionada à ‘busca de apoio’ (tend-and-befriend) do que ao
confronto físico ou a fuga em si15. Tem sido sugerido que em fêmeas existe de

6
fato uma ativação do eixo HPA e do SNS em resposta ao estresse. Porém, a
mesma é modulada por ocitocina e opióides endógenos permitindo assim às
fêmeas sobreviver e cuidar das suas crias sem necessariamente lutar por elas
ou abandoná-las15. A ocitocina é produzida nos núcleos supra-óptico e
paraventricular do hipotálamo e transportada à glândula pituitária onde é
liberada na circulação. Pequenas quantidades de ocitocina podem também ser
sintetizadas no córtex adrenal e no timo16. Por outro lado, ß-endorfinas são
produzidas no lobo intermediário da pituitária, no córtex adrenal e em células
imunológicas17,18. Adicionalmente, as ß-endorfinas regulam a liberação de
ocitocina, vasopressina, NE e cortisol, o que possivelmente contribui às
diferencias na resposta ao estresse entre machos e fêmeas15.
Outros hormônios como o glucagon, hormônio de crescimento e
aldosterona são também liberados durante a resposta ao estresse enquanto que
hormônios com funções anabólicas como a testosterona e a insulina geralmente
diminuem5. É provável que a taxa de secreção de praticamente todos os
hormônios seja alterada durante situações adversas. No entanto, devido a que o
cortisol e as catecolaminas são os principais reguladores das respostas de fuga
ou luta ou ‘busca de apoio’, são estes os que com preferência são incluídos no
estudo e entendimento da resposta fisiológica e comportamental ao estresse.
Marcadores Salivares
A saliva é um fluido oral complexo produzido e secretado pelas glândulas
salivares. Consiste de água (99%), eletrólitos, proteínas e outros metabólitos de
baixo peso molecular19. A saliva é produzida por três principais pares de
glândulas (a parótida, a submandibular e a sublingual) e centos de glândulas
menores espalhadas pela cavidade oral. Em essência, a estimulação simpática
das glândulas resulta em secreção de proteínas enquanto que a inervação
parassimpática é responsável pela secreção de água e eletrólitos20. A saliva é
fundamental para a preservação e manutenção da saúde dos tecidos orais e tem

7
diversas funções que variam desde a iniciação da digestão de alimentos até a
lubrificação21.
A saliva apresenta várias vantagens sobre outros biofluidos como o
sangue e a urina devido à facilidade de sua coleta e manipulação. Além das
substâncias naturalmente presentes na saliva como enzimas digestivas e
proteínas antimicrobianas, outras substâncias circulantes no sangue podem se
difundir na saliva e ser encontradas em menores concentrações. De particular
interesse nesta dissertação é o cortisol salivar. Por ser um hormônio esteróide,
o cortisol consegue se difundir na saliva sem necessidade de um transporte
ativo e sua concentração na saliva (~5% do total liberado no plasma) é
altamente correlacionada com a fração livre no sangue.
Atualmente, a análise de cortisol salivar como marcador de atividade
adrenocortical é amplamente aceita e difundida na prática clínica e pesquisa
biológica. A variação na concentração de cortisol tem sido utilizada no estudo de
diferenças no comportamento competitivo em primatas22, relações entre a perda
de capital no mercado de valores e estados fisiológicos23, estados de humor e
índice de desempenho24, fobias25, entre outras.
Enquanto o cortisol salivar é utilizado como marcador da atividade do eixo
HPA, tem-se sugerido que outras substâncias na saliva podem ser indicadores
da resposta do SNS ao estresse. Considerando que a secreção de proteínas na
saliva é regulada por inervação simpática20, a concentração e atividade de
proteínas salivares, principalmente da alfa-amilase (sAA) e a cromogranina A
salivar (CgA) tem sido utilizadas para avaliar a reatividade do SNS a estímulos
adversos. A utilidade de ambas as proteínas na avaliação da atividade do SNS
foi corroborada por estudos que demonstraram uma maior taxa de secreção
após a administração de agentes adrenérgicos26e a inibição da sua secreção
sob tratamento com beta-bloqueadores inclusive após o processamento de
fortes emoções em sujeitos saudáveis27.
8
Esporte Profissional Como Modelo de Estresse
A natureza competitiva do esporte tem a característica de induzir
variações nos estados de humor. Com freqüência a prevalência de estados de
humor negativos ou de excitação é maior do que a presença de estados
positivos como a tranqüilidade. No esporte de rendimento, níveis consideráveis
de estresse são experimentados por atletas principalmente porque do seu
desempenho depende sua retribuição econômica, seu sucesso profissionalalém
da sua própria satisfação pessoal. É sabido que os estados de ansiedade,
excitação e de humor em geral experimentados momentos antes, durante e
após uma competição, estão associados a níveis de magnitude similar na
ativação do SNS28,29 e dependem da forma como a competição é percebida.
Assim, a prevalência de estados de ansiedade, medo ou agressividade está
condicionada a como cada indivíduo lida com o estresse. De forma geral, uma
baixa atividade do eixo HPA e do SNS está relacionada com estados de humor
positivos30 enquanto que uma maior atividade se relaciona como estados de
humor negativo24,31.
Considerando o anterior, não é difícil entender porque a competição
esportiva profissional oferece um contexto excepcional na avaliação da resposta
ao estresse. Além de lidar com uma série de estressores sociais e logísticos
durante a preparação e na competição em si, os atletas devem manter altos
níveis de desempenho (mental e físico) durante as mesmas. Devido a que o
critério de avaliação durante competições esportivas é simples e bem definido e
que as mesmas são altamente organizadas, a avaliação dos sujeitos é também
objetiva e padronizada, permitindo um maior rigor cientifico no delineamento
experimental dos estudos. Finalmente, os sujeitos são avaliados durante suas
atividades do dia-a-dia e em conseqüência induz respostas reais ao estresse.
.

9
Referências
1. Kyrou, I. & Tsigos, C. Stress hormones: physiological stress and regulation of
metabolism. Current Opinion in Pharmacology9, 787-793 (2009).
2. McEwen, B.S. Stress, adaptation, and disease. Allostasis and allostatic load.
Ann. N. Y. Acad. Sci840, 33-44 (1998).
3. Charmandari, E., Tsigos, C. & Chrousos, G. Endocrinology of the stress
response. Annu. Rev. Physiol67, 259-284 (2005).
4. Koolhaas, J.M. et al. Stress revisited: a critical evaluation of the stress
concept. Neurosci Biobehav Rev35, 1291-1301 (2011).
5. Tsigos, C. & Chrousos, G.P. Hypothalamic-pituitary-adrenal axis,
neuroendocrine factors and stress. J Psychosom Res53, 865-871 (2002).
6. Mayer, E.A., Naliboff, B.D., Chang, L. & Coutinho, S.V. V. Stress and irritable
bowel syndrome. Am. J. Physiol. Gastrointest. Liver Physiol280, G519-524
(2001).
7. Chrousos, G.P. & Gold, P.W. The concepts of stress and stress system
disorders. Overview of physical and behavioral homeostasis. JAMA267,
1244-1252 (1992).
8. Mayer, E.A. The neurobiology of stress and gastrointestinal disease. Gut47,
861-869 (2000).
9. Habib, K.E., Gold, P.W. & Chrousos, G.P. Neuroendocrinology of stress.
Endocrinol. Metab. Clin. North Am30, 695-728; vii-viii (2001).
10. McCance, K.L. & Huether, S.E. Pathophysiology: The Biologic Basis for
Disease in Adults And Children Fifth Edition. (Mosby: 2005).
11. Stratakis, C.A. & Chrousos, G.P. Neuroendocrinology and pathophysiology of
the stress system. Ann. N. Y. Acad. Sci771, 1-18 (1995).
12. Habib, K.E., Gold, P.W. & Chrousos, G.P. Neuroendocrinology of stress.
Endocrinol. Metab. Clin. North Am30, 695-728; vii-viii (2001).
13. Tsigos, C. & Chrousos, G.P. Hypothalamic-pituitary-adrenal axis,
neuroendocrine factors and stress. J Psychosom Res53, 865-871 (2002).

10
14. Widmaier, E., Raff, H. & Strang, K. Vander’s Human Physiology: The
Mechanisms of Body Function (Human Physiology. (McGraw-Hill
Science/Engineering/Math: 2010).
15. Taylor, S.E. et al. Biobehavioral responses to stress in females: tend-and-
befriend, not fight-or-flight. Psychol Rev107, 411-429 (2000).
16. Brunton, P.J. & Russell, J.A. Endocrine induced changes in brain function
during pregnancy. Brain Res1364, 198-215 (2010).
17. Ben-Eliyahu, S. The promotion of tumor metastasis by surgery and stress:
immunological basis and implications for psychoneuroimmunology. Brain
Behav. Immun17 Suppl 1, S27-36 (2003).
18. Kavelaars, A., Ballieux, R.E. & Heijnen, C.J. Beta-endorphin secretion by
human peripheral blood mononuclear cells: regulation by glucocorticoids. Life
Sci46, 1233-1240 (1990).
19. Malamud, D. Saliva as a diagnostic fluid. Dent. Clin. North Am55, 159-178
(2011).
20. Proctor, G.B. & Carpenter, G.H. Regulation of salivary gland function by
autonomic nerves. Auton Neurosci133, 3-18 (2007).
21. Twetman, S. Treatment protocols: nonfluoride management of the caries
disease process and available diagnostics. Dent. Clin. North Am54, 527-540
(2010).
22. Wobber, V. et al. Differential changes in steroid hormones before competition
in bonobos and chimpanzees. Proceedings of the National Academy of
Sciences107, 12457 -12462 (2010).
23. Coates, J.M. & Herbert, J. Endogenous steroids and financial risk taking on a
London trading floor. Proceedings of the National Academy of Sciences105,
6167 -6172 (2008).
24. Adam, E.K., Hawkley, L.C., Kudielka, B.M. & Cacioppo, J.T. Day-to-day
dynamics of experience–cortisol associations in a population-based sample
of older adults. Proceedings of the National Academy of Sciences103, 17058
-17063 (2006).

11
25. Soravia, L.M. et al. Glucocorticoids reduce phobic fear in humans.
Proceedings of the National Academy of Sciences103, 5585 -5590 (2006).
26. Ehlert, U., Erni, K., Hebisch, G. & Nater, U. Salivary alpha-amylase levels
after yohimbine challenge in healthy men. J. Clin. Endocrinol. Metab91, 5130-
5133 (2006).
27. van Stegeren, A., Rohleder, N., Everaerd, W. & Wolf, O.T. Salivary alpha
amylase as marker for adrenergic activity during stress: effect of
betablockade. Psychoneuroendocrinology31, 137-141 (2006).
28. Kraemer, W.J. et al. Physiological and performance responses to tournament
wrestling. Med Sci Sports Exerc33, 1367-1378 (2001).
29. Baron, R. et al. Catecholamine excretion and heart rate as factors of
psychophysical stress in table tennis. Int J Sports Med13, 501-505 (1992).
30. Dockray, S. & Steptoe, A. Positive affect and psychobiological processes.
Neurosci Biobehav Rev35, 69-75 (2010).
31. Rohleder, N. & Nater, U.M. Determinants of salivary alpha-amylase in
humans and methodological considerations. Psychoneuroendocrinology34,
469-485 (2009).

12
Capitulo 2
The Cortisol Awakening Response and Perceived
Upcoming Demands in Well-trained Men
(Submetido e formatado segundo as normas da revista Physiology and
Behavior)

13
Resumo
O presente estudo investigou a variação da resposta do cortisol ao acordar
(CAR) em relação com estados de humor e desempenho durante uma
competição de natação profissional. Onze atletas foram examinados durantes
dois dias consecutivos de competição. Em cada dia, a concentração de cortisol
salivar foi determinada ao acordar, 30 e 60 minutos após acordar,
imediatamente antes de aquecer para a competição e 5, 20 e 40 minutos depois
da competição. O Perfil de Estados de Humor e reportes próprios de
desempenho foram incluídos como instrumentos psicométricos. A CAR não foi
diferente entre os dias de competição e controle e não houve relação com o
desempenho em nenhum dos dois dias. No entanto, houve diferença antes de e
após o evento entre os dias de competição e controle. A percepção de um
desafio que irá acontecer durante o dia não necessariamente reflete a mesma
magnitude de variação na CAR em sujeitos bem treinados. Isto pode ser devido
a melhores mecanismos para lidar com o estresse e a fase e hora da
competição em que os sujeitos foram avaliados.
Palavras Chave: Resposta do Cortisol ao Acordar; Estados de Humor;
Competição; Esporte; Exercício; Saliva.

14
Abstract
This study examined the variation in the cortisol awakening response (CAR) in
relation to mood states and performance during professional swimming
competition. Eleven athletes were examined during two consecutive days of
competition. On each day salivary cortisol was determined upon awakening, 30
and 60 min post awakening, immediately before warming up for competition and
5, 20 and 60 min after competition. Psychometric instruments included the Profile
of Mood States and self-reports of performance. CARs did not differ between
competition and non-competition days and were not related to performance on
any day. However, difference was observed in the concentration of cortisol prior
to and after the contest between competition and non-competition days.
Perceived demands of the day ahead might not reflect the same magnitude of
variation in the CAR in well-trained men. Explanations for this include better
coping mechanisms and response towards the phase and time of competition.
Keywords: Cortisol Awakening Response; Mood States; Competition; Sports;
Exercise; Saliva.

15
1.Introduction
Evidence indicates that alterations in behavior are governed by physiologic
adaptive responses. In particular, the effect of adverse environments on behavior
is dictated mainly, by variations in the secretion of cortisol [1]. Cortisol is released
from the adrenal cortex into circulation and serves a wide range of physiological,
behavioral and cognitive functions such as dampening the immune system,
regulating glucose and fat metabolism, altering mood, and impairing memory
formation and consolidation in response to chronic threatening circumstances
[2,3].
Cortisol secretion shows a diurnal rhythm with the highest concentrations in the
early morning upon awakening and decreasing concentrations over the day [4]. A
distinctive feature of the circadian oscillation of cortisol, the cortisol awakening
response (CAR), is a steep increase in the concentration of cortisol
approximately 30 min following awakening [5,6]. The CAR is thought to reflect
the sensitivity of the HPA axis to stress and other pathologies. Whereas an
increased CAR has been reported in subjects with chronic stress [7,8], and work
overload [9], a diminished CAR is common in patients with fatigue, burnout or
exhaustion-related symptoms [10,11]. Among the explanations for such
difference in cortisol profiles is the reasoning that chronic stress exposure will
eventually lead to HPA axis hypo-activity, either by means of reduced
biosynthesis of hormones on different levels of the HPA axis, or enhanced
sensitivity to the negative feedback of cortisol [12]. However, so far no conclusive
proof has been established.
Recently, it was suggested that in healthy individuals higher wakeup cortisol
levels serve a metabolic purpose and so the CAR would act as a “booting”-like
mechanism to help one meet the perceived demands of the upcoming day [13].
This hypothesis has gained further support when considered that the CAR could
be under control not only of the hypothalamus and the pituitary, but also the

16
hippocampus, which is central in the formation and retrieval of memory (For
review see [14] and [15]) .
Professional sports competition offers an exceptional scenario in which to assess
the stress response. First, it poses a distinct psychological and physiological
challenge to athletes. Not only do they cope with a wide range of organizational
and social stressors both in preparation to and during competition, but also they
are to sustain high levels of performance through all phases of competition.
Secondly, it is highly organized and regulated and criteria of performance are
clear. Therefore, collection of data and assessment of subjects is objective and
standardized. Lastly, subjects are assessed in real-life environments, which elicit
genuine responses to threatening situations. Here we assessed professional
swimmers during two consecutive days of elite competition to further explore the
proposition of the CAR as a mechanism responsive to the perceived demands of
the forthcoming day. We hypothesized that 1) athletes would show an altered
CAR on competition days and 2) the features of the CAR (increased or
decreased when compared to non-competition days) would help predict
performance later on the same day.
2. Methods
2.1. Subjects
Subjects were 11 male professional swimmers (age 21.5 ± 2.16 years) each with
at least five years of experience in competition. Subjects were recruited from a
team before a national swimming contest. The performance of each athlete in
this competition is used to partially define his status on the team and his salary.
None of the subjects smoked, or was under any kind of medication during the
study. Two weeks before the competition subjects were informed of the
experimental procedures and gave their written informed consent. The
experimental protocol was approved by the Institutional Review Board.

17
2.2. Design
Subjects were asked to collect saliva samples throughout the first two days of a
one-week national competition. A total of seven saliva samples were collected
per day at the following times: (T1) upon awakening [while still lying in bed], (T2)
30 minutes later, (T3) one hour later [around 08:00h], (T4) immediately before
warming up for competition [around 16:00h], (T5) five, (T6) 20 and (T7) 40
minutes after the competition [around 19:00h]. Subjects had approximately one
hour to warm-up and all competition events took place no more than 1.5 hours
after this. Subjects were provided with POMS questionnaires and labeled
collection vials for saliva collection in the morning. Also, subjects were instructed
to refrain from eating, drinking (anything but water) or tooth brushing during the
first hour after awakening, and at least one hour before T4. Two weeks after the
competition, the event was recreated at the training facilities of the swimming
team for control values. Subjects performed on the same day of the week and
time of the day that the real competition. Water temperature (25-28°C) was also
controlled to match that of the competition. Subjects were encouraged by their
coaches to perform with the same intensity and on similar swimming times during
the non-competition days.
2.3. Measures
2.3.1. Aerobic capacity
One week before the competition VO2max was determined during an incremental
exercise test on an electronic treadmill ergometer (MicroMed Biotechnology
C200) with simultaneous measurements of respiratory gas exchanges (Cortex,
Metasoft 3.1) until voluntary exhaustion. Criteria to validate the test included at
least two of the following parameters: plateau in VO2, respiratory exchange ratio
> 1.1, and predicted maximal heart rate.

18
2.3.2. Saliva sampling and handling
Saliva (±2mL) was collected in collection vials with no exogenous stimulation
using the guidelines proposed by Granger et al., (2007) [16]. Briefly, subjects
were asked to imagine they were eating food and to slowly and gently move their
jaws as if they were chewing. Saliva was drooled into the collection vials after
two minutes. Samples were placed on ice, transported to the laboratory and
stored frozen at -20°C until analysis.
2.3.3. Salivary Cortisol
On the day of analysis samples were thawed and centrifuged at 1500 x g for 15
minutes. Salivary cortisol concentrations were determined employing an enzyme
immunoassay (Salimetrics, State College, PA). The test used 25 µL of saliva per
determination, has a lower limit of sensitivity of 0.003 µg/dL, an average intra-
and inter-assay coefficient of variations of 3.5% and 5.1%, respectively. Since
the collection of the first three samples was not overseen by the research staff,
subjects were given clear and concise directions regarding collection procedures
and the importance of punctuality. Subjects were also asked to record collection
times and those providing samples deviating more than 10 minutes from the
appropriate times were excluded from the analyses. All samples from each
subject were assayed on the same plate and in duplicate.
2.3.4. Psychometric Instruments
Subjects completed the Profile of Mood States (POMS), immediately after
collecting saliva at times T2, T4 and T6. The POMS is a 65-item questionnaire
measuring tension, depression, anger, confusion, vigor and fatigue on a 5-point
Likert scale [17]. At the end of each day, subjects were also asked to rate their
performance based on the time and placing in the competition on a scale of 1
(poor) to 5 (outstanding). Only time was chosen as criterion of performance
during non-competition days.

19
2.4. Statistical Analysis
Log-transformations were performed to normalize skewed variables when
necessary. To verify normal distribution the Lilliefors significance correction was
applied. All analyses were conducted with the log-transformed values. However,
non-transformed data are shown for the sake of interpretation. Salivary cortisol
levels were computed as follows: for the CAR, 1) the area under the curve with
respect to ground (AUCg) and 2) the area under the curve with respect to
increase (AUCi) by using the trapezoid formula [18]. Both the AUCg and AUCi
were calculated for the diurnal profile of cortisol including all samples (T1-T7), in
addition to the response prior to and after competition with samples T4-T7. For
comparison of psychometric and performance data after log-transformations the
Mann–Whitney–Wilcoxon test was used. Spearman’s rank correlation coefficient
was used among variables. For all analyses, significance levels was α = 0.05.
Results shown are means ± SD.
3. Results
3.1. The cortisol awakening response
As shown in Figure 1 cortisol values followed the regular awakening response
with the highest levels 30 minutes after waking followed by a decrease. Areas
under the curve did not differ between competition and non-competition days
[Day 1; AUCg: competition mean = 59.24 ± 8.6, control mean = 54.27 ± 16.6,
t(10) = .79, p = 0.44; AUCi: competition mean = 14.87 ± 14.8, control mean =
11.76 ± 10.4, t(10) = .42, p = 0.67] [ Day 2; AUCg: competition mean = 65.63 ±
19.1, control mean = 46.42 ± 18.9, t(8) = 2.27, p = 0.15; AUCi: competition mean
13.56 ± 5.6, control mean 9.98 ± 8.1, t(8) = 1.59, p = 0.44]. Furthermore, no
difference was seen in the AUCg when all seven cortisol samples (T1-T7) were
included [Day 1; competition mean = 574.26 ± 102.9, control mean = 429.65 ±
126.9, t(8) = 2.51, p =0.055] [Day 2; competition mean 598.57 ± 176.1, control

20
mean 362.90 ± 150, t(8) = 2.76, p = 0.052]. Figure 1 and 2 show the CAR and
the diurnal variation of cortisol on both days of competition and control.
3.2. Pre and post-competition profile of cortisol
Figure 2 shows the pre and post-competition profile of cortisol. Areas under the
curve with respect to ground were different on both days [Day 1; AUCg:
competition mean 156.2 ± 31, control mean = 93.37 ± 30.8, t(10) = 1.87, p =
0.008] [Day 2; AUCg: competition mean: 142.7 ± 40.2, control mean 65.13 ±
37.7, t(10) = .53, p = 0.001]. Nevertheless, the same pattern was not observed
for the AUCi [Day 1; AUCi: competition mean = 32.37 ± 23.4, control mean =
35.53 ± 25.7, t(10) = .85, p = 0.71] [Day 2; AUCi: competition mean = 12.45 ±
11.5, control mean = 11.12 ± 5.2, t(10) = 1.7, p = 0.82].
3.3. Psychometric variables and reports of performance
Table 1 shows mood variation during competition and non-competition days.
Total mood disturbance differed from control at times T2 [t(10) = 4.51, p = 0.002],
T4 [t(10) = 2.65, p = 0.004] and T6 [t(10) = 2.13, p = 0.33] on the first day and at
T2 [t(10) = 2.54, p = 0.03] on the second day. Table 2 shows time of swimming
and self-reports of performance. No difference was observed in either time or
performance between days of competition and control.
3.4. Associations between the CAR and mood states
We observed negative, but not significant correlations between the CAR and total
mood disturbance at T2 on both competition days [Day 1; AUCg: r(11) = -.59, p =
0.55; AUCi: r(11) = -.55, p = 0.07] [Day 2; AUCg: r(11) = -.90, p = 0.08; AUCi:
r(11) = -.70, p = 0.23]. The same was seen when all seven cortisol samples (T1-
T7) were considered [Day 1; AUCg: r(11) = -.78, p = 0.051; AUCi: r(11) = -.20, p
=0.71] [Day 2: AUCg: r(11) = -.89, p = 0.08; AUCi: r(11) = -.30, p = 0.68].
Furthermore, we did not find any associations between mood disturbance at T6

21
on the first day and the CAR on the second day on both competition and non-
competition days [AUCg: r(11) = .61, p = 0.28; AUCi: r(11) = .27, p = 0.74]
3.5. Associations between the CAR and performance
We did not find significant correlations between the CAR and self-reports of
performance on any day [Day 1; AUCg: r(11) = .09, p = 0.77; AUCi: r(11) = -.41,
p = 0.19] [Day 2; AUCg r(11) = .34, p = 0.12; AUCi: r(11) = .21, p = 0.09]. The
same was seen when all seven cortisol samples (T1-T7) were considered [Day 1;
AUCg: r(11) = .10, p = 0.78; AUCi: r(11) = .38, p = 0.69] [Day 2; AUCg: r(11) = -
.23, p = 0.61; AUCi: r(11) = -.60, p = 0.86].
4. Discussion
Contrary to our initial hypothesis, we did not find any associations among the
CAR, mood disturbance and performance. Interestingly, mood disturbance and
performance were different between days of competition and control. Initially, we
thought larger CARs would be seen on competition days mostly because of the
psychological pressure posed by the competition. The subjects of this study, for
instance, spend most of the year training for three main events, which are used
by their team to define their competitive status, their salary and by the national
swimming federation as trials for the selection of the national team. Since this
study was conducted on one of these events, we thought that the anticipation of
competition would be reflected on the morning profile of cortisol.
The postulation of the CAR as a “booting”-like mechanism [13], comes from
several lines of evidence showing higher CARs on weekdays than on weekends
[7,19], in individuals who regularly wake up early in the morning as well as
conditions of chronic stress such as low socioeconomic status [20], work
overload [9,21], and the fact that no CARs were reported when subjects wake up
in the middle of the night [22]. Furthermore, from a physiological rather than a
psychological perspective, there is conjectural evidence linking the CAR under

22
partial control of the hippocampus, which has an important role in the
consolidation and activation of memory representations as well as time and
spatial navigation of the self [15,23]. Thus, although hypothetical, it seems
plausible that higher cortisol levels in the morning are associated with significant
perceived components of novelty and workload later in the day.
However, CARs in this study did not differ between days of competition and
control even though the swimming contest was clearly of major importance to the
subjects. It may be argued that experience in competition and socioeconomic
status played an important factor on the psychological response to challenge. All
subjects had had frequent participation in national and international contests for
the last five years prior to this study. In addition, they come from a medium and
high socioeconomic status, thus psychological duress related to the financial
consequences of performance would be little. In this respect, a thorough study on
the diurnal profile of cortisol secretion related to ballroom dancing competition
reported that 1) the response to competition does not seem to adjust with
experience, so both novice and veteran athletes show a significant increase in
cortisol prior to competing and 2) among the psychological variables responsible
for the rise in cortisol before a competition, the threat to the social-self is one of
the most potent factors to affect the HPA axis [24]. Furthermore, moderately high
negative correlations were observed between mood states 30 min post
awakening (T2) and the CAR as well as differences between mood states on
days of competition and control. This indicates that the contest was in fact
perceived as a strong psychological stimulus and that the lack of association
between the CAR and performance was most likely not due to chance.
Evidence of the CAR in healthy individuals as a signature of a burdensome day
is still controversial. In fact, while a significant body of research has associated
alterations in the CAR with stress-related conditions, few studies have been
directed to explicitly test this hypothesis. For instance, prior-day feelings of
loneliness, sadness and threat have predicted increased CARs the next morning.
Decreased CARs have also been associated with feelings of tension and anger

23
later the same day in older adults [13]. On the other hand, no associations were
reported between the CAR and same-day anticipations of a busier day in young
women [25]. Our results add to this body of evidence by showing that distinct
psychological and physiological challenges later in the day do not necessarily
reflect the same magnitude of variation in the CAR in well-trained young men.
Interestingly, there was an increase in the diurnal profile of cortisol from the first
to the second day of competition to the point of almost reaching statistical
significance (p = 0.052). The format of this kind of competitions consists of
eliminatory rounds, so athletes are faced against bigger challenges (faster
opponents) with each subsequent day of competition. Thus, it might have been
possible that the CAR showed responses of greater extent on the final stages of
competition as both the opponents and the consequences of winning or losing
were also of major importance. However, until this finding is replicated including
week-long assessments of cortisol, we have elected to avoid speculation about
its meaning.
On the other hand, the cortisol profile observed immediately before and after
swimming was notably higher on competition days. Such rise in the concentration
of cortisol prior to sports competition has been attributed to the intensity of
physical exercise [26], an improved anaerobic metabolism [27] and the
expectation of competition itself [24,28]. The fact that higher concentrations of
cortisol were seen on competition days and that no difference in swimming time
or performance between days of competition and control were present lead us to
believe that the difference in cortisol was due to psychological and not
physiological factors. Although it may be argued that it is usually difficult to
achieve similar levels of performance during training due to the lack of pressure
and motivation, it is also unlikely that little variation in intensity resulted in such
different profiles of cortisol both before and after exercising [24]. The increase in
cortisol on competition days is more likely related to mood states variations and
coping mechanisms. Previous research indicates that higher concentrations of
cortisol both prior to and after competition are associated with motivation [29],
competitiveness and mental preparation in males, social bonding in females [28]

24
and with high insecurity indexes and poor performance in fighters [30]. We did
not find any correlations between concentrations of cortisol prior to swimming
and performance. However, higher concentrations of cortisol were associated
with a higher score of mood disturbance on the first day of competition.
It is noteworthy to mention that the time at which the contest took place might
have influenced the dynamics of the CAR. Athletes were to start warming-up at
16:00h and all contests took place approximately two hours later. Considering
that they were to wake up at 07:00h, it is possible that subjects only became fully
involved in competition early in the afternoon. Well-trained subjects have
previously shown lower cortisol responses to a series of adverse psychological
stimuli [31]. Thus, early in the morning they might have coped better with the
pressure of having to compete and only showed significant variations in the
concentration of cortisol once they perceived the contest was imminent. Further
studies should examine whether the time at which athletes are to compete has
some effect on the profile of the CAR.
Limitations to this study include the modest sample size and saliva collection
procedures during the morning. Nevertheless, our sample was also very
homogeneous. The subjects in this study were all male, within a narrow age
range, had a very high and similar level of performance in addition to an
extensive experience in professional competition. Furthermore, we included a
comprehensive diurnal profile of cortisol with a total of seven samples per day,
which allowed us to observe timely variations in the concentration of cortisol both
before and after the competition. Finally, baseline values were obtained from the
same subjects in a carefully recreated event that matched day-of-the-week and
time-of-the-day assessments. Several other studies on the associations of the
CAR and mood states in humans have used similar or even smaller samples and
some found corresponding results to our study [24,25,32-37]. Thus, we believe
the assumption of a null hypothesis in this study is valid and little, if any, variation
would have been seen with a larger sample. Moreover, although including a
larger sample would be desirable, experimental designs often interfere with

25
training sessions or competition events further complicating the evaluation of the
stress response in this particular population. Regarding collection of saliva
samples in the morning, the subjects in this study together with the coaching and
two members of the research staff were housed at the same hotel during the
competition. Eating times were strictly controlled by the coaching staff and
breakfast was scheduled promptly after T3. All collection vials were collected by
the research staff at approximately 08:00 immediately after T3, thus subjects had
corresponding waking times. In addition to this, samples collected more than 10
minutes deviating from the scheduled times were not considered in the analysis.
Consequently, we believe that the limitations in our study are counterbalanced by
the uniformity of the sample, the thorough design and the caution taken when
collection of saliva was not overseen.
5. Conclusions
Our results indicate that distinct psychological and physiological challenges later
in the day do not necessarily reflect the same extent of variation in the CAR in
well-trained men. Likewise, the features of the CAR were not associated with
performance or mood disturbance. Since differences in the concentration of
cortisol were seen only prior to and after exercising and the swimming contests
took place late in the afternoon, examining variations in the CAR when the
competition is held in the morning would help to explain the hypothesis of the
CAR as a mechanism subjected to the perceived demands of the day ahead.

26
Conflict of interest
None declared.
Role of the Funding Source
This study was supported by grants from the funding agency FAPEMIG. The
funding agency had no role in designing the study, collecting or analyzing data,
writing the report or in submitting the manuscript for publication. M.D. and O.B.
receive graduate fellowships from CNPQ.
Acknowledgments
We are grateful to participants for their involvement, compliance and
understanding towards the instructions given throughout the study. Thanks are
also due to Mr. G. Degani and Mr. W. Pires for their support and consideration to
include members of their team to conduct this work.

27
Table 1. Demographic features and mood disturbance scores of subjects during competition and non-competition days. For mood disturbance scores, the upper
line (in bold) and lower line indicate competition and non-competition days, respectively. Values are means(SD).
Age 21.55 (2.16) years
BMI 22.7 (2.5)
VO2 Max 52.7 (3.28) ml/kg.min
Competition Experience
8.7 (2.8) years
Day 1 Day 2
POMS Subscale Scores
T2 p T4 p T6 p T2 p T4 p T6 p
Tension –Anxiety
8.8 (4.0)
3.3 (2.6) 0.067
13.3 (6.4)
3.8 (1.4) 0.015
10.3 (6.7)
3.0 (0.6) 0.036
9.8 (4.2)
4.0 (3.8) 0.103
10.0 (4.6)
6.0 (2.5) 0.180
7.6 (6.5)
2.4 (0.5) 0.127
Depression 3.5 (2.3)
1.5 (2.0) 0.075
3.6 (2.0)
1.3 (1.5) 0.008
13.8 (10.8)
5.5 (6.3) 0.079
4.0 (1.8)
1.8 (2.4) 0.140
2.2 (1.6)
0.4 (0.8) 0.070
7.4 (8.6)
4.2 (3.6) 0.330
Anger – Hostility 7.8 (2.9)
4.5 (5.6) 0.155
9.8 (5.1)
4.3 (5.0) 0.006
16.6 (12.4)
5.6 (5.0) 0.043
7.6 (4.8)
2.2 (4.3) 0.152
5.2 (4.7)
2.6 (3.7) 0.303
9.2 (10.8)
4.2 (2.8) 0.409
Vigor – Activity
17.6 (5.2)
15.6 (5.7) 0.556
19.5 (5.2)
17.5 (2.8) 0.462
12.6 (5.5)
11.8 (4.3) 0.448
18.2 (4.1)
17.8 (5.0) 0.919
18.8 (6.2)
20.6 (4.2) 0.255
15.0 (7.3)
16.0 (8.2) 0.767
Fatigue 6.6 (3.6)
4.1 (3.6) 0.175
5.5 (4.7)
3.5 (3.9) 0.135
18.1 (6.7)
12.5 (7.6) 0.022
5.4 (3.2)
4.8 (4.6) 0.740
4.2 (4.7)
2.6 (2.7) 0.412
12.4 (11.1)
8.8 (8.4) 0.125
Confusion-Bewilderment
10.0 (2.6)
3.6 (1.3) 0.007
10.0 (3.3)
5.1 (1.7) 0.016
9.0 (3.8)
5.8 (3.4) 0.048
9.2 (3.2)
4.0 (2.3) 0.073
8.4 (5.3)
4.2 (1.3) 0.186
7.4 (5.7)
4.8 (2.3) 0.377
Total Mood Disturbance
21.0 (8.9)
3.1 (3.3) 0.002
21.5 (13.4)
4.3 (8.4) 0.004
52.3 (31.8)
20.0 (20.3) 0.033
17.2 (11.6)
3.0 (4.7) 0.030
15.0 (15.30)
0.8 (1.7) 0.089
33.6 (31.3)
16.1 (11.0) 0.113
* For mood disturbance scores, the upper line (in bold) and lower line indicate days of competition and control, respectively. Values are means (SD).

28
Table 2. Time of swimming and self-reports of performance during days of competition and control.
Day 1 p Day 2 p
Time of swimming (seconds)
53.16 (2.02)
53.43 (1.88) 0.76
52.46 (1.06)
53.62 (1.71) 0.085
Performance 3.63 (0.67)
3.18 (0.60) 0.11
3.71 (0.64)
3.27 (0.46) 0.074
* The upper line (in bold) and lower line indicate competition and control, respectively. Values are means (SD).

29
Figure 1
Morning profile of salivary cortisol at awakening, 30 ad 60 minutes later during
competition and non-competition days. Values are means and error bars indicate
SD.

30
Figure 2
Diurnal profile of salivary cortisol during competition and non-competition days. The dotted vertical line indicates time of
swimming. Values are means and error bars indicate SD.
31
References
[1] Charmandari E, Tsigos C, Chrousos G. Endocrinology of the stress response.
Annu Rev Physiol 2005;67:259-284.
[2] Erickson K, Drevets W, Schulkin J. Glucocorticoid regulation of diverse
cognitive functions in normal and pathological emotional states. Neurosci
Biobehav Rev 2003;27(3):233-246.
[3] Herbert J, Goodyer IM, Grossman AB, et al. Do corticosteroids damage the
brain? J Neuroendocrinol 2006;18(6):393-411.
[4] Venkataraman S, Munoz R, Candido C, Witchel SF. The hypothalamic-
pituitary-adrenal axis in critical illness. Rev Endocr Metab Disord 2007;8(4):365-
373.
[5] Pruessner JC, Wolf OT, Hellhammer DH, et al. Free cortisol levels after
awakening: a reliable biological marker for the assessment of adrenocortical
activity. Life Sci 1997;61(26):2539-2549.
[6] Wilhelm I, Born J, Kudielka BM, Schlotz W, Wüst S. Is the cortisol awakening
rise a response to awakening? Psychoneuroendocrinology 2007;32(4):358-366.
[7] Schlotz W, Hellhammer J, Schulz P, Stone AA. Perceived work overload and
chronic worrying predict weekend-weekday differences in the cortisol awakening
response. Psychosom Med 2004;66(2):207-214.
[8] Wüst S, Federenko I, Hellhammer DH, Kirschbaum C. Genetic factors,
perceived chronic stress, and the free cortisol response to awakening.
Psychoneuroendocrinology 2000;25(7):707-720.
[9] Schulz P, Kirschbaum C, Prüßner J, Hellhammer D. Increased free cortisol
secretion after awakening in chronically stressed individuals due to work
overload. Stress Med 1998;14(2):91-97.

32
[10] Nater UM, Maloney E, Boneva RS, et al. Attenuated morning salivary cortisol
concentrations in a population-based study of persons with chronic fatigue
syndrome and well controls. J Clin Endocrinol Metab 2008;93(3):703-709.
[11] Roberts ADL, Wessely S, Chalder T, Papadopoulos A, Cleare AJ. Salivary
cortisol response to awakening in chronic fatigue syndrome. Br J Psychiatry
2004;184:136-141.
[12] Fries E, Hesse J, Hellhammer J, Hellhammer DH. A new view on
hypocortisolism. Psychoneuroendocrinology 2005;30(10):1010-1016.
[13] Adam EK, Hawkley LC, Kudielka BM, Cacioppo JT. Day-to-day dynamics of
experience--cortisol associations in a population-based sample of older adults.
Proc Natl Acad Sci U.S.A. 2006;103(45):17058-17063.
[14] Chida Y, Steptoe A. Cortisol awakening response and psychosocial factors:
a systematic review and meta-analysis. Biol Psychol 2009;80(3):265-278.
[15] Fries E, Dettenborn L, Kirschbaum C. The cortisol awakening response
(CAR): facts and future directions. Int J Psychophysiol 2009;72(1):67-73.
[16] Granger DA, Kivlighan KT, Fortunato C, et al. Integration of salivary
biomarkers into developmental and behaviorally-oriented research: problems and
solutions for collecting specimens. Physiol Behav 2007;92(4):583-590.
[17] Droppleman M Douglas M.; Maurice Lorr; Leo F. Psychiatric Rating Scales:
Profile of Mood States (POMS). Hoffmann-La Roche Inc.; 1971.
[18] Pruessner JC, Kirschbaum C, Meinlschmid G, Hellhammer DH. Two
formulas for computation of the area under the curve represent measures of total
hormone concentration versus time-dependent change.
Psychoneuroendocrinology 2003;28(7):916-931.
[19] Kunz-Ebrecht SR, Kirschbaum C, Marmot M, Steptoe A. Differences in
cortisol awakening response on work days and weekends in women and men
from the Whitehall II cohort. Psychoneuroendocrinology 2004;29(4):516-528.

33
[20] Wright CE, Steptoe A. Subjective socioeconomic position, gender and
cortisol responses to waking in an elderly population. Psychoneuroendocrinology
2005;30(6):582-590.
[21] Steptoe A, Cropley M, Griffith J, Kirschbaum C. Job strain and anger
expression predict early morning elevations in salivary cortisol. Psychosom Med
2000;62(2):286-292.
[22] Dettenborn L, Rosenloecher F, Kirschbaum C. No effects of repeated forced
wakings during three consecutive nights on morning cortisol awakening
responses (CAR): a preliminary study. Psychoneuroendocrinology 2007;32(8-
10):915-921.
[23] Clow A, Hucklebridge F, Stalder T, Evans P, Thorn L. The cortisol
awakening response: more than a measure of HPA axis function. Neurosci
Biobehav Rev 2010;35(1):97-103.
[24] Rohleder N, Beulen SE, Chen E, Wolf JM, Kirschbaum C. Stress on the
dance floor: the cortisol stress response to social-evaluative threat in competitive
ballroom dancers. Pers Soc Psychol Bull 2007;33(1):69-84.
[25] Stalder T, Evans P, Hucklebridge F, Clow A. State associations with the
cortisol awakening response in healthy females. Psychoneuroendocrinology
2010;35(8):1245-1252.
[26] Mujika I, Padilla S, Pyne D, Busso T. Physiological changes associated with
the pre-event taper in athletes. Sports Med 2004;34(13):891-927.
[27] Stupnicki R, Obmiński Z, Klusiewicz A, Viru A. Pre-exercise serum cortisol
concentration and responses to laboratory exercise. Eur J Appl Physiol Occup
Physiol 1995;71(5):439-443.
[28] Kivlighan KT, Granger DA, Booth A. Gender differences in testosterone and
cortisol response to competition. Psychoneuroendocrinology 2005;30(1):58-71.

34
[29] Viru M, Hackney AC, Karelson K, et al. Competition effects on physiological
responses to exercise: performance, cardiorespiratory and hormonal factors.
Acta Physiol Hung 2010;97(1):22-30.
[30] Parmigiani S, Dadomo H, Bartolomucci A, et al. Personality traits and
endocrine response as possible asymmetry factors of agonistic outcome in
karate athletes. Aggress Behav 2009;35(4):324-333.
[31] Rimmele U, Zellweger BC, Marti B, et al. Trained men show lower cortisol,
heart rate and psychological responses to psychosocial stress compared with
untrained men. Psychoneuroendocrinology 2007;32(6):627-635.
[32] Böhnke R, Bertsch K, Kruk MR, Naumann E. The relationship between basal
and acute HPA axis activity and aggressive behavior in adults. J Neural Transm
2010;117(5):629-637.
[33] Dahlgren A, Kecklund G, Theorell T, Akerstedt T. Day-to-day variation in
saliva cortisol--relation with sleep, stress and self-rated health. Biol Psychol
2009;82(2):149-155.
[34] Griefahn B, Robens S. The normalization of the cortisol awakening response
and of the cortisol shift profile across consecutive night shifts--an experimental
study. Psychoneuroendocrinology 2010;35(10):1501-1509.
[35] Gustafsson K, Lindfors P, Aronsson G, Lundberg U. Relationships between
self-rating of recovery from work and morning salivary cortisol. J Occup Health
2008;50(1):24-30.
[36] Strahler K, Ehrlenspiel F, Heene M, Brand R. Competitive anxiety and
cortisol awakening response in the week leading up to a competition. Psychol
Sport Exer 2010;11(2):148-154.
[37] Weik U, Deinzer R. Alterations of postawakening cortisol parameters during
a prolonged stress period: Results of a prospective controlled study. Horm Behav
2010;58(3):405-409.

35
Capitulo 3
Differential Changes in Salivary Markers of Autonomic Activity in Response to Elite
Competition (Submetido e formatado segundo as normas da revista Psychology in Sport and
Exercise)

36
Resumo
O presente estudo investigou a resposta de proteína total na saliva (TP) alfa-
amilase (sAA) e cromogranina A (CgA) à competição esportiva e sua relação
com estados de humor. Onze atletas profissionais foram examinados durante o
primeiro dia de um evento nacional em natação e durante um evento simulado
num dia de treinamento no mesmo dia da semana e no mesmo horário que a
competição real. A concentração de TP foi determinada pelo método de Bradford
e a de sAA e CgA por western blotting ao acordar, 30 e 60 minutos depois,
imediatamente antes de aquecer para o evento e 5, 20 e 40 minutos depois do
mesmo. A escala de estado de humor PANAS-X (Positive Affect and Negative
Affect Schedule) foi incluída como instrumento psicométrico. A concentração de
TP, sAA e CgA foi diferente dos dias de controle unicamente antes e 5 minutos
após a competição. Não houve diferença na área sob a curva do perfil diurno de
cada marcador entre os dias de competição e controle. TP e CgA tiveram uma
resposta similar à competição do que sAA. Isto pode ser atribuído aos
mecanismos de secreção de proteína na saliva quando a coleta da mesma é
feita sem estimulação exógena. Estímulos psicológicos adversos parecem
alterar o ritmo regular de secreção destes marcadores só momentos prévios e
posteriores a situações estressantes.
Palavras Chave: Proteína Total, Alfa-amilase, Cromogranina A, Saliva,
Competição, Exercise, Psico-fisiologia, Stresse.

37
Abstract
Objective: We investigated the response of salivary total protein (TP), alpha-amylase
(sAA) and chromogranin A (CgA) to sporting competition and their relation with positive
and negative affect.
Methods: Eleven professional swimmers were examined during the first day of a
national contest and on a recreated event that matched time-of-the-day and day-of-the-
week assessments two weeks later. Total protein was determined by the Bradford
method and sAA and CgA by western blotting upon awakening, 30 and 60 min post
awakening, immediately before warming up for competition and 5, 20 and 60 min after
competition. Psychometric instruments included the Positive Affect and Negative Affect
Schedule - X (PANAS-X).
Results: The concentrations of TP, sAA and CgA differed from controls only prior to and
5 min after the event. We observed associations between higher negative affect scores
with higher levels of TP, sAA and CgA prior to the event on the competition day. Areas
under the curve did not differ from controls for TP, sAA or CgA.
Conclusion: TP and CgA showed a similar reactivity to sporting competition than sAA,
which may be attributed to the mechanisms responsible for protein secretion into saliva
when collection is performed with no exogenous stimulation. Strong adverse
psychological stimuli only seem to override the regular rhythm of salivary proteins
moments before and after stressful situations.
Keywords: Alpha-amylase; Chromogranin A; Total Protein; Saliva; Competition;
Exercise; Psychophysiology; Stress.

38
Introduction
The stress response is subserved by components in the autonomic nervous system
(ANS) and the hypothalamic-pituitary-adrenocortical (HPA) axis. The ANS stimulates
the adrenal medulla to produce catecholamines whereas glucocorticoids are the final
effectors of the HPA axis (Tsigos & Chrousos, 2002). More than a decade ago, salivary
alpha-amylase (sAA) was suggested as a surrogate marker for autonomic activity given
that its release into saliva is elicited by stimulation of the salivary glands by sympathetic
and parasympathetic nerves (Rohleder & U. M. Nater, 2009). Furthermore, following
research demonstrated that beta-adrenergic agonists are capable of stimulating sAA
release without increasing salivary flow (Ehlert, Erni, Hebisch, & U. Nater, 2006) and
beta-blocking agents inhibit sAA secretion in response to psychological challenges (A.
van Stegeren, Rohleder, Everaerd, & O. T. Wolf, 2006). This pattern of evidence has
resulted in the incorporation of sAA into a wide series of behavioural studies in which
the sAA response to adverse environments has been measured and even successfully
applied in clinical (Uesato et al., 2010) and military settings (Cosenzo, Fatkin, & Patton,
2007).
Chromogranin A (CgA), on the other hand, is co-stored and co-released with
catecholamines from secretory vesicles in the adrenal medulla and post-ganglionic
sympathetic axons (Zhang et al., 2006). Chromogranin A is also produced by the
submandibular gland and secreted into saliva under autonomic control and presents
antifungal and antimicrobial properties (Lugardon et al., 2000; Saruta et al., 2005; Strub
et al., 1996). Salivary CgA has received some attention as a marker of psychological
stress and similar responses to adverse psychological stimuli than sAA have been
reported. In particular, higher concentrations of CgA were present after lectures to
university graduates in young professors (Filaire, Dreux, Massart, Nourrit, et al., 2009b),
after moderate exercise (Allgrove, Gomes, Hough, & Gleeson, 2008), and following
cognitive assessments (Kanamaru, Kikukawa, & Shimamura, 2006).

39
Although sAA and CgA are secreted into saliva from different glands, the parotid and
submandibular glands, respectively, the secretion of both proteins into saliva from these
glands is under autonomic control. In addition to the parotid and submandibular glands,
the sublingual and numerous minor glands also contribute to the secretion and
composition of whole mouth saliva. Essentially, parasympathetic input to salivary glands
produces most of the fluid in saliva whereas sympathetic stimulation results in protein
secretion (Proctor & Carpenter, 2007). Although this view is somewhat simplistic and
exceptions to such pattern of saliva secretion exist, one could expect to observe similar
responses of both sAA and CgA to adverse environments. By the same token, it could
be speculated that not only sAA and CgA but also salivary total protein (TP) showed a
similar response to hostile stimuli. However, most psychophysiological research on
salivary correlates of autonomic activity has focused on sAA and missing are reports
that enable us to speculate whether the variation in the composition of saliva in
anticipation of and in response to psychological and physiological demands is particular
to the dynamics of single markers or dependent on the mechanisms responsible for
their secretion into saliva.
Professional sports competition offers a unique scenario in which to assess the
response to stress. It involves social comparison and evaluation and is a significant
source of pressure for athletes (Gucciardi & Dimmock, 2008). Secondly, it is highly
organized and criteria of performance are clear. Therefore, collection of data and
assessment of subjects is objective and standardized. Moreover, since subjects are
assessed in real-life environments, authentic responses to adverse stimuli are
observed. It is well established that competition induces sympathetic arousal both in
anticipation of and in response to the event (Baron et al., 1992; Kraemer et al., 2001).
Such variation in autonomic activity is related to the perceived nature and demands
posed by the competition. Thus, subjects may experience feelings from worry and fear
to vigour and aggressiveness depending on how they cope with stress. To a large
extent, a lower reactivity of the HPA axis and the ANS system has been associated with
positive affect (Dockray & Steptoe, 2010) whereas a higher reactivity is related to
40
negative affect (Adam, Hawkley, Kudielka, & Cacioppo, 2006; Rohleder & U. M. Nater,
2009).
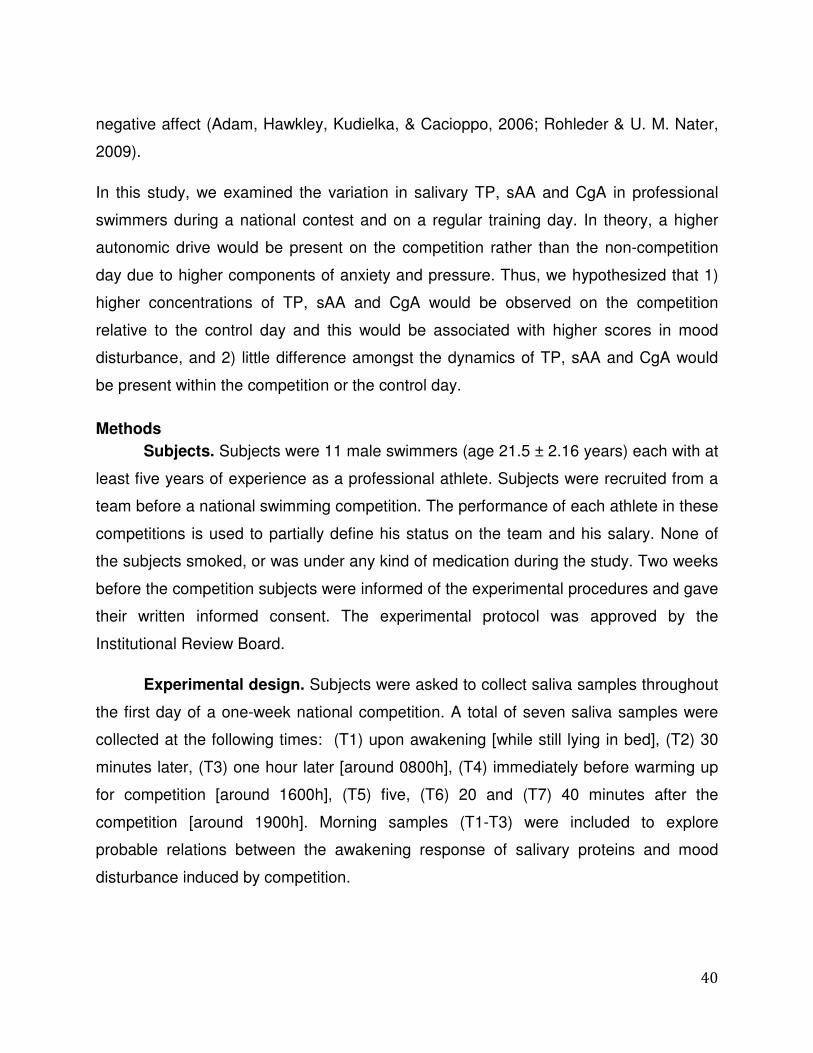
In this study, we examined the variation in salivary TP, sAA and CgA in professional
swimmers during a national contest and on a regular training day. In theory, a higher
autonomic drive would be present on the competition rather than the non-competition
day due to higher components of anxiety and pressure. Thus, we hypothesized that 1)
higher concentrations of TP, sAA and CgA would be observed on the competition
relative to the control day and this would be associated with higher scores in mood
disturbance, and 2) little difference amongst the dynamics of TP, sAA and CgA would
be present within the competition or the control day.
Methods Subjects. Subjects were 11 male swimmers (age 21.5 ± 2.16 years) each with at
least five years of experience as a professional athlete. Subjects were recruited from a
team before a national swimming competition. The performance of each athlete in these
competitions is used to partially define his status on the team and his salary. None of
the subjects smoked, or was under any kind of medication during the study. Two weeks
before the competition subjects were informed of the experimental procedures and gave
their written informed consent. The experimental protocol was approved by the
Institutional Review Board.
Experimental design. Subjects were asked to collect saliva samples throughout
the first day of a one-week national competition. A total of seven saliva samples were
collected at the following times: (T1) upon awakening [while still lying in bed], (T2) 30
minutes later, (T3) one hour later [around 0800h], (T4) immediately before warming up
for competition [around 1600h], (T5) five, (T6) 20 and (T7) 40 minutes after the
competition [around 1900h]. Morning samples (T1-T3) were included to explore
probable relations between the awakening response of salivary proteins and mood
disturbance induced by competition.

41
Subjects were instructed to refrain from eating, drinking (anything but water) or tooth
brushing during the first hour after awakening, or at least one hour before T4. Subjects
were also asked to refrain from alcohol or caffeinated beverages at least 24 hours prior
days of saliva collection. Two weeks after the competition, the event was recreated at
the training facilities of the swimming team for control values. Subjects performed on the
same day of the week and time of the day that the real competition. Water temperature
(25-28°C) was also controlled to match that of the competition. Subjects were
encouraged by their coaches to perform with the same intensity and on similar
swimming times during the control day.
Measures Aerobic capacity. One week before the competition VO2max was determined
during an incremental exercise test on an electronic treadmill ergometer (MicroMed
Biotechnology C200) with simultaneous measurements of respiratory gas exchanges
(Cortex, Metasoft 3.1) until voluntary exhaustion. Criteria to validate the test included at
least two of the following parameters: plateau in VO2, respiratory exchange ratio > 1.1,
and predicted maximal heart rate.
Saliva sampling and handling. Whole mouth saliva was collected into collection
vials with no exogenous stimulation using the guidelines proposed by Granger and
colleagues (2007). Briefly, subjects were asked to imagine they were eating food and to
slowly and gently move their jaws as if they were chewing. Saliva was drooled into pre-
weighted conical polypropylene tubes after two minutes. Immediately after the event
(before T5) subjects were given 70 ml of distilled water to wash their mouths. Subjects
were asked to spit the water and to swallow in order to empty the mouth before saliva
was collected. Samples were placed on ice, transported to the laboratory and stored
frozen at -20°C until analysis.
Western blotting for sAA and CgA. On the day of analysis samples were
thawed and centrifuged at 3000 rpm for 15 minutes. Concentration of total protein in
samples was determined using the Bradford method (Bradford, 1976). All samples from

42
each subject were assayed on the same plate in duplicate. In order to avoid possible
effects of salivary flow rate on the concentration of proteins, especially after exercising
(dehydration), ten micrograms of total protein from each sample were denatured under
reducing conditions and applied on 5–20% SDS–polyacrylamide gradient gels. Proteins
were separated and then transferred onto nitrocellulose membranes in transfer buffer
(25 mM Tris, 190 mM glycine, 20% MeOH, pH 7.8-8.4) for two hours at 200mA and 4°C.
Protein transfer was confirmed by visualization with Ponceau. Membranes were blocked
for 4 hours at 4°C in blocking buffer (5% non-fat dry milk in PBS w/v). Membranes were
then incubated overnight at 4°C with purified polyclonal rabbit anti-human sAA (dilution
1:5000) and mouse monoclonal anti-human CgA (dilution 1:1000), respectively, and
subsequently incubated with secondary antibodies for two hours. After incubations with
specific primary and then secondary antibodies, labelled proteins were detected using
ECL reagents and exposing the developed blots to GE Healthcare films.
Densitometrical analysis of the spots was performed using ImageJ (U. S. National
Institutes of Health, Bethesda, Maryland, USA) by a researcher blinded to the
experimental groups (competition vs. non-competition day). The area in pixels of each
spot was determined in triplicate and means were used for statistical analyses.
Production of the antibody for sAA. One rabbit was immunized by a
subcutaneous injection of 500ug/mL of human sAA and Freund’s complete adjuvant
followed by two booster injections of 250µg/mL with Freund’s incomplete adjuvant two
weeks apart. Blood was collected from the ear vein one week before the first
administration, one week after the first two administrations and two weeks after the last
administration. Serum levels of anti-human sAA were determined by ELISA and the
specificity of the purified antibody was verified by Western Blotting. The rabbit was kept
in constant temperature of 22 ± 2 °C in 12:12 dark–light cycle with constant access to
chow and water. All animal procedures were approved by the Animal Ethics Committee.
The anti-human CgA antibody was purchased from Millipore (Temecula, CA).
Psychometric instruments. Subjects completed the Positive and Negative
Affect Schedule-X (PANAS-X), immediately after collecting saliva at times T2, T4 and
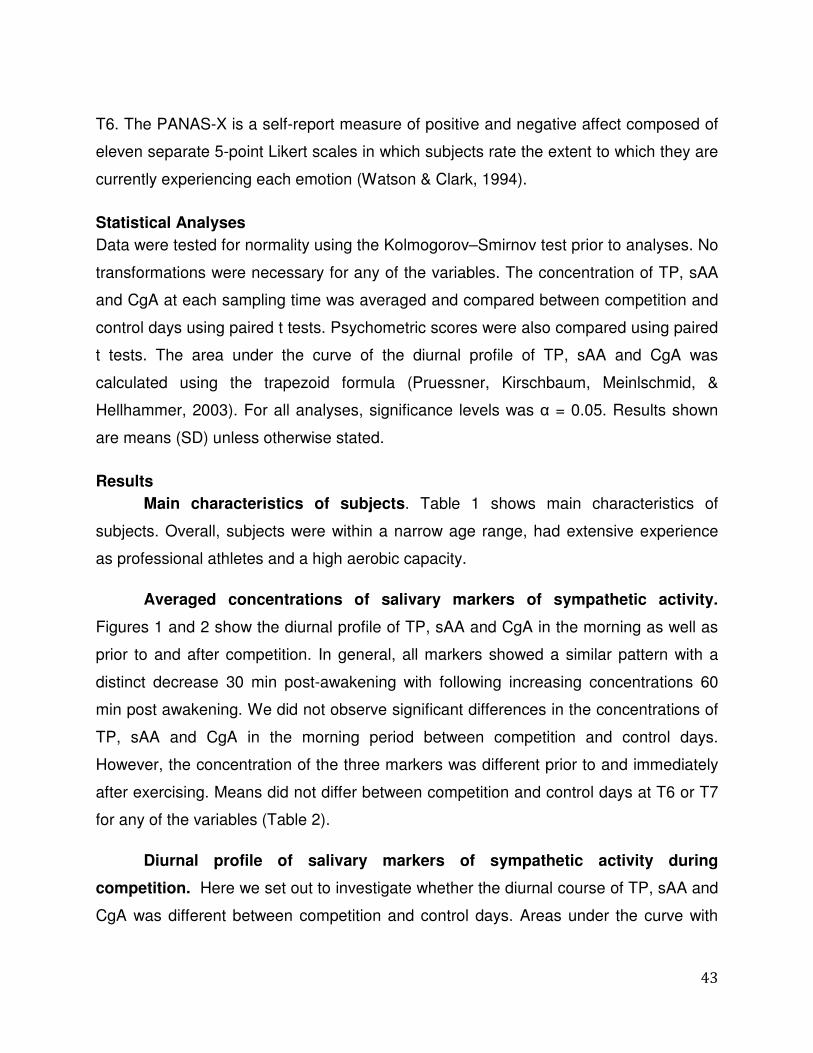
43
T6. The PANAS-X is a self-report measure of positive and negative affect composed of
eleven separate 5-point Likert scales in which subjects rate the extent to which they are
currently experiencing each emotion (Watson & Clark, 1994).
Statistical Analyses Data were tested for normality using the Kolmogorov–Smirnov test prior to analyses. No
transformations were necessary for any of the variables. The concentration of TP, sAA
and CgA at each sampling time was averaged and compared between competition and
control days using paired t tests. Psychometric scores were also compared using paired
t tests. The area under the curve of the diurnal profile of TP, sAA and CgA was
calculated using the trapezoid formula (Pruessner, Kirschbaum, Meinlschmid, &
Hellhammer, 2003). For all analyses, significance levels was α = 0.05. Results shown
are means (SD) unless otherwise stated.
Results Main characteristics of subjects. Table 1 shows main characteristics of
subjects. Overall, subjects were within a narrow age range, had extensive experience
as professional athletes and a high aerobic capacity.
Averaged concentrations of salivary markers of sympathetic activity.
Figures 1 and 2 show the diurnal profile of TP, sAA and CgA in the morning as well as
prior to and after competition. In general, all markers showed a similar pattern with a
distinct decrease 30 min post-awakening with following increasing concentrations 60
min post awakening. We did not observe significant differences in the concentrations of
TP, sAA and CgA in the morning period between competition and control days.
However, the concentration of the three markers was different prior to and immediately
after exercising. Means did not differ between competition and control days at T6 or T7
for any of the variables (Table 2).
Diurnal profile of salivary markers of sympathetic activity during
competition. Here we set out to investigate whether the diurnal course of TP, sAA and
CgA was different between competition and control days. Areas under the curve with

44
respect to ground (AUCg) [TP t(4) =0.95, p =0.39; sAA t(6) =1.11, p=0.31; CgA t(4)=
0.48, p=0.65] and with respect to increase (AUCi) [TP t(8) =1.4, p=0.17; sAA t(4) = 4.2,
p=0.07; CgA t(4)= 1.53, p=0.19] did not differ for any variable between competition and
control days.
Positive and negative affect scores. Table 1 shows positive and negative
affect scores throughout competition and control days. Overall, we found different and
higher negative scores in the morning and prior to competition whereas different but
lower positive scores prior to and after competition than on the control day. Cronbach’s
alpha value was 0.84 and 0.86 for the Positive and Negative Affect scales, respectively.
Discussion In order to understand the dynamics of salivary markers of autonomic activity prior to
and after competition, the mechanisms of protein secretion into saliva must be
considered. In essence, saliva is constantly secreted at a basal rate from three pairs of
major glands (parotid, submandibular and sublingual) and from numerous minor glands
spread over the oral mucosa. However, copious salivary secretion is induced upon
sensory and mechanical stimuli by autonomic control to the salivary glands (Mese &
Matsuo, 2007). Whereas parasympathetic nerves are mainly responsible for the
secretion of water and electrolytes, sympathetic nerves are predominantly responsible
for the secretion of proteins. Exceptions to this include, amongst others, the secretion of
sAA from glands mainly stimulated by parasympathetic nerves, such as the palate and
the sublingual glands (Jos A Bosch, Veerman, de Geus, & Proctor, 2011), and
increased salivary secretion of immunoglobulin A as a result of stimuli from both
sympathetic and parasympathetic nerves to plasma cells (Proctor & Carpenter, 2007).
Nevertheless, evidence suggests that the rate of protein secretion into saliva by
sympathetic stimuli is superimposed upon parasympathetic stimulation when glands are
simultaneously innervated (Proctor & Carpenter, 2007). In addition to this, it is thought
that the neural pathways that innervate salivary glands are under control of higher
centres of the brains such as the cerebral cortex and the limbic centre. Consequently,

45
the composition and volume of saliva is responsive not only to sensory and mechanical
stimuli, but also emotional states e.g., stress (Mese & Matsuo, 2007).
In line with our original hypothesis, we found a marked elevation of TP, sAA and CgA
prior to and after competition. However, in contrast to our expectations we did not
observe differential changes in the concentration of salivary proteins upon awakening
and 60 min later even though higher negative affect scores were reported. This finding
might be interpreted as follows. First, given the extensive experience of subjects in
competition, they may have engaged mentally in competition only later in the day as the
contest was approaching. Secondly, the magnitude of the feelings experienced early in
the morning, although different from the control day, was not sufficiently intense to
evoke significant sympathetic arousal.
A considerable body of research has been dedicated to assess the response of markers
of autonomic activity both in anticipation of and after adverse environments. Our
findings are consistent with some (J A Bosch, H. S. Brand, Ligtenberg, Bermond, et al.,
1996a; Chatterton, Vogelsong, Lu, & Hudgens, 1997; Kanamaru et al., 2006; U. M.
Nater et al., 2005), but not all (Kivlighan & Granger, 2006), studies that have reported
significant increases in the activity of sAA and the concentration of CgA before
academic and social evaluations and parachute jumping but not in collegiate
competition. The subjects in our study were assessed during a national swimming
contest. All subjects were professional athletes and their performance in the competition
had significant consequences on their salary and competitive status within their team.
Thus, and although speculative, it seems that in situations in which the outcome of the
challenge poses serious threats to the self as those seen in contexts of assessment of
job performance or physical danger, a rise in the activity and concentration of these
proteins before taking part in stressful situations could be expected.
In contrast to CgA, the increase in the activity of sAA after challenging environments
seems to be unequivocal (Kivlighan & Granger, 2006; U. M. Nater et al., 2005; A. H. van
Stegeren, O. T. Wolf, & Kindt, 2008). Whereas there is evidence that the concentration
46
of CgA increases after strong negative stimuli (Allgrove et al., 2008; Edith Filaire, B.
Dreux, Massart, Nourrit, et al., 2009b; Kanamaru et al., 2006) not all studies have been
able to reproduce such results (Wagner et al., 2010; T. Yamakoshi et al., 2009). It has
been proposed that catestain, which is co-secreted with CgA, inhibits further CgA
release by acting as a non-competitive cholinergic antagonist and therefore as a
feedback mechanism for sympathoadrenal activity (T. Yamakoshi et al., 2009).
However, evidence for this mechanism exists only for the release of catecholamines
from the adrenal medulla and not from the submandibular gland. On the other hand, it
may be argued that in our study such rise in TP, sAA and CgA would be evident due to
a higher sympathetic drive associated with exercise. Nonetheless, subjects performed
within similar swimming times on the control day and it is unlikely that little difference in
intensity resulted in such divergent profiles in the concentration of proteins prior to and
immediately after the contest. Furthermore, we also found higher negative and lower
positive affect scores relative to the control day before the contest. Thus, we believe the
variation in the concentrations of proteins between days was in fact due to
psychological factors associated with the threat to the self posed by the competition.
Future studies would certainly benefit from more precise parameters of exercise
intensity such as lactate in order to better explain the divergence in the profile of
proteins when physical challenges are chosen to assess the response to stress
(Rohleder, Beulen, Chen, J. M. Wolf, & Kirschbaum, 2007).
Salivary alpha-amylase is a digestive enzyme that hydrolyzes starch to glucose and
maltose (Scannapieco, Torres, & Levine, 1993). It has been suggested that increases in
the activity of sAA after physiological challenges may be associated with a more
efficient replenishment of energy storages (Kivlighan & Granger, 2006). Considering the
adaptive response to stress (Motzer & Hertig, 2004) it makes sense that not only
digestive proteins (sAA), but also immune proteins (CgA) increased immediately after
acute exposure to physiological and psychological threats. However, it is worth
mentioning that when exercise is chosen to assess the stress response special
attention must be paid to salivary flow after exercise since dehydration can strongly

47
influence the concentration of salivary proteins. While lower rates of salivary flow have
only been reported after prolonged exercise (<30 min) (Walsh, Montague, Callow, &
Rowlands, 2004) and in our study subjects were assessed after contests that took no
more than two minutes, we addressed this issue by determining the concentration of
both sAA and CgA using the same quantity of protein from each sample (10µg)
independently of the volume of saliva collected as previously suggested (de Oliveira et
al., 2010). Thus, when controlled for protein concentration, our results are in line with
recent research that shows peak levels of sAA approximately 5-10 min after the adverse
stimuli and a subsequent decrease reaching baseline levels 20-30 min later (Allgrove et
al., 2008; Edith Filaire, B. Dreux, Massart, Nourrit, et al., 2009b; Kivlighan & Granger,
2006) adding to the proposition of Kivlighan and colleagues of an increased
concentration of digestive and immune salivary proteins in response to acute adverse
demands.
Several of the findings of our study are novel. First, to the best of our knowledge this is
the first demonstration of the reactivity of TP and CgA to professional competition.
Interestingly, both TP and CgA showed a similar response to competition than sAA with
differential changes in anticipation of and after the contest. This may have important
repercussions in psychophysiological research. Since the proposition of sAA as
surrogate marker of sympathetic activity a significant series of studies has assessed the
variation in its activity under different conditions. However, from a laboratorial
standpoint, determining the concentration of TP is faster, cheaper and more practical
than traditional kinetic or immune- assays. In this respect, TP has been successfully
applied to monitor exercise intensity and hydration status (Bortolini et al., 2009; Neil P
Walsh, J. C. Montague, Callow, et al., 2004). Clearly, further research needs to
corroborate whether the pattern of secretion of sAA and CgA is similar than TP in other
adverse environments. Secondly, it appears that the dynamics of such markers are not
strongly associated with variations in negative and positive emotions. Probably, other
scales with predominant components of tension, anxiety and excitement as seen in
sympathetic arousal would have been more appropriate to detect the same magnitude

48
of variation, if any, between negative and positive affect and salivary proteins. Finally,
distinct challenging psychological stimuli represented here by professional competition
only seem to override the regular rhythm of salivary proteins prior to and immediately
after the contest. In accordance with the morning profile of our data are previous
studies that have reported diurnal rhythms of sAA and CgA with nadir concentrations
early in the morning and an awakening response with a steep decrease 30 min after
awakening (Den, Toda, Ohira, & Morimoto, 2011; J. Strahler, Berndt, Kirschbaum, &
Rohleder, 2010).
On the other hand, the results of this study have to be interpreted in light of some
methodological limitations. First, we controlled the concentration of protein and flow rate
only for sAA and CgA. Recent data suggests that the activity of sAA is not dependent of
secretion rate (Rohleder, J. M. Wolf, Maldonado, & Kirschbaum, 2006) and that only
prolonged exercise causes significant loss of water (Neil P Walsh, J. C. Montague,
Callow, et al., 2004). Although in our study subjects took no more than 2 min to finish
the contest, future studies should examine whether exercise of short duration and high
intensity has some effect on TP secretion rate. Secondly, we used a sample of subjects
of modest size. We chose to assess the response to stress in sporting competition
because it poses significant psychological and physiological demands to subjects. Also,
it elicits genuine responses to stress since subjects are assessed in real-life situations.
It is usually difficult to include a larger sample size in experimental studies because
there are few professional teams with larger and homogenous groups of athletes. In
addition, experimental designs often interfere with training sessions or competition
events. To compensate for sample size, we designed a comprehensive protocol that
allowed us to observe timely variations in the concentrations of protein prior to and in
response to the task. Further, subjects were all male, within a narrow age range, had
similar levels of performance and extensive experience in competition. Additionally,
baseline values were obtained from the same subjects in a carefully recreated event
that matched time-of-the-day and day-of-the-week assessments. Several other studies
on the variation in salivary constituents in response to stress and exercise have

49
included similar if not smaller samples (Bullock, Cox, Martin, & Marino, 2009; Filaire,
Alix, Ferrand, & Verger, 2009; Fortes & Whitham, 2011; U. M. Nater et al., 2005; Noto,
Kudo, & Hirota, 2010; Oliver, Laing, Wilson, Bilzon, & Walsh, 2008; Ship & Fischer,
1999; K. Strahler, Ehrlenspiel, Heene, & R. Brand, 2010) and some have reported
equivalent results than our study. Thus, although it would be desirable to work with a
larger group, we believe based on previous research, that our experimental design and
the characteristics of the subjects that little, if any, difference in the dynamics of TP, sAA
and CgA would have been observed with a larger population.
Conclusions Taken together, these data indicate that TP, sAA and CgA show a similar pattern of
reactivity towards professional competition. Also, the dynamics of such markers do not
strictly reflect alterations in negative and positive emotions. Finally, changes in the
concentration of sAA, CgA and TP become apparent only moments before and after
taking part in competition.

50
Conflict of interest
None declared.
Role of the Funding Source
This study was supported by grants from the funding agency FAPEMIG. The funding
agency had no role in designing the study, collecting or analyzing data, writing the
report or in submitting the manuscript for publication. M.D. and O.B. receive graduate
fellowships from CNPq.
Acknowledgments
We are grateful to participants for their involvement, compliance and understanding
towards the instructions given throughout the study. Thanks are also due to Mr. G.
Degani and Mr. W. Pires for their support and consideration to include members of their
team to conduct this work..

51
Table 1 Main characteristics of subjects and positive and negative affect scores during
competition and control days.
Values in the upper line (bold) indicate scores during competition whereas values in the
lower line indicate scores during the control day. Values are means (SD).
Age 21.55 (2.16) years
BMI 22.7 (2.5)
VO2 Max 52.7 (3.28) ml/kg.min
Competition experience 8.7 (2.8) years
Collection Times T2 T4 T6
Negative Affect 18.6 (3.67)*
10.8 (1.03)
21.6 (6.93)*
12.0 (1.70)
20.0 (7.13)
15.60 (4.50)
Positive Affect 28.5 (5.64)
31.0 (9.17)
29.8 (4.84)
38.0 (6.16)
23.1 (3.28)*
30.7 (3.16)
* Significantly different from controls at p<0.05.

52
Table 2 Variation in sAA, CgA and TP during Competition and Control Days.
Values in the upper line (bold) indicate competition whereas the lower line indicates the control day. Values are means (SD).
Collection Times
T1 T2 T3 T4 T5 T6 T7
sAA (pixel density)
9377 (2195)
5789 (1495)
8711 (1620)
5984 (1097)
9455 (2102)
6985 (2408)
19420 (2073)*
13721 (1206)
22274 (2285)*
15571 (2245)
16493 (4233)
14222 (4577)
20042 (2917)
16478 (3069)
CgA (pixel density)
8785 (4114)
3117 (2994)
6693 (3985)
2134 (1998)
8239 (2341)
5505 (2145)
25190 (3564)*
14955 (2495)
28592 (4382)*
16698 (3489)
14973 (2349)
16376 (4981)
10994 (3997)
16763 (3467)
TP (µg/µL)
1.15 (0.05)
1.28 (0.07)
0.95 (0.10)
0.79 (0.09)
1.00 (0.09)
1.19 (0.11)
1.35 (0.09)*
1.06 (0.07)
1.42 (0.07)*
1.14 (0.06)
1.21 (0.09)
1.28 (0.10)
1.10 (0.11)
1.23 (0.10)
* Significantly different from controls at p<0.05.

53
Figures

54

55
References
Adam, E. K., Hawkley, L. C., Kudielka, B. M., & Cacioppo, J. T. (2006). Day-to-day
dynamics of experience--cortisol associations in a population-based sample of
older adults. Proceedings of the National Academy of Sciences of the United
States of America, 103(45), 17058-17063. doi:10.1073/pnas.0605053103
Allgrove, J. E., Gomes, E., Hough, J., & Gleeson, M. (2008). Effects of exercise
intensity on salivary antimicrobial proteins and markers of stress in active men.
Journal of Sports Sciences, 26(6), 653-661. doi:10.1080/02640410701716790
Baron, R., Petschnig, R., Bachl, N., Raberger, G., Smekal, G., & Kastner, P. (1992).
Catecholamine excretion and heart rate as factors of psychophysical stress in
table tennis. International Journal of Sports Medicine, 13(7), 501-505.
doi:10.1055/s-2007-1021306
Bortolini, M. J. S., De Agostini, G. G., Reis, I. T., Lamounier, Romeu Paulo Martins
Silva, Blumberg, J. B., & Espindola, Foued Salmen. (2009). Total protein of
whole saliva as a biomarker of anaerobic threshold. Research Quarterly for
Exercise and Sport, 80(3), 604-610.
Bosch, J A, Brand, H. S., Ligtenberg, T. J., Bermond, B., Hoogstraten, J., & Nieuw
Amerongen, A. V. (1996a). Psychological stress as a determinant of protein
levels and salivary-induced aggregation of Streptococcus gordonii in human
whole saliva. Psychosomatic Medicine, 58(4), 374-382.
Bosch, Jos A, Veerman, E. C. I., de Geus, E. J., & Proctor, G. B. (2011). α-Amylase as
a reliable and convenient measure of sympathetic activity: don’t start salivating

56
just yet! Psychoneuroendocrinology, 36(4), 449-453.
doi:10.1016/j.psyneuen.2010.12.019
Bradford, M. M. (1976). A rapid and sensitive method for the quantitation of microgram
quantities of protein utilizing the principle of protein-dye binding. Analytical
Biochemistry, 72, 248-254.
Bullock, N., Cox, A. J., Martin, D. T., & Marino, F. E. (2009). Resting salivary and
plasma cortisol in elite athletes following long-haul travel from Australia to
Canada. Journal of Science and Medicine in Sport / Sports Medicine Australia,
12(2), 300-302. doi:10.1016/j.jsams.2007.11.004
Chatterton, R. T., Jr, Vogelsong, K. M., Lu, Y. C., & Hudgens, G. A. (1997). Hormonal
responses to psychological stress in men preparing for skydiving. The Journal of
Clinical Endocrinology and Metabolism, 82(8), 2503-2509.
Cosenzo, K. A., Fatkin, L. T., & Patton, D. J. (2007). Ready or not: enhancing
operational effectiveness through use of readiness measures. Aviation, Space,
and Environmental Medicine, 78(5 Suppl), B96-106.
Den, R., Toda, M., Ohira, M., & Morimoto, K. (2011). Levels of awakening salivary CgA
in response to stress in healthy subjects. Environmental Health and Preventive
Medicine, 16(3), 155-157. doi:10.1007/s12199-010-0179-5
Dockray, S., & Steptoe, A. (2010). Positive affect and psychobiological processes.
Neuroscience and Biobehavioral Reviews, 35(1), 69-75.
doi:10.1016/j.neubiorev.2010.01.006

57
Ehlert, U., Erni, K., Hebisch, G., & Nater, U. (2006). Salivary alpha-amylase levels after
yohimbine challenge in healthy men. The Journal of Clinical Endocrinology and
Metabolism, 91(12), 5130-5133. doi:10.1210/jc.2006-0461
Filaire, E., Alix, D., Ferrand, C., & Verger, M. (2009). Psychophysiological stress in
tennis players during the first single match of a tournament.
Psychoneuroendocrinology, 34(1), 150-157. doi:10.1016/j.psyneuen.2008.08.022
Filaire, E., Dreux, B., Massart, A., Nourrit, B., Rama, L. M., & Teixeira, A. (2009b).
Salivary alpha-amylase, cortisol and chromogranin A responses to a lecture:
impact of sex. European Journal of Applied Physiology, 106(1), 71-77.
doi:10.1007/s00421-009-0991-z
Fortes, M. B., & Whitham, M. (2011). Salivary Hsp72 does not track exercise stress and
caffeine-stimulated plasma Hsp72 responses in humans. Cell Stress &
Chaperones, 16(3), 345-352. doi:10.1007/s12192-010-0244-4
Granger, D. A., Kivlighan, K. T., Fortunato, C., Harmon, A. G., Hibel, L. C., Schwartz, E.
B., & Whembolua, G.-L. (2007). Integration of salivary biomarkers into
developmental and behaviorally-oriented research: problems and solutions for
collecting specimens. Physiology & Behavior, 92(4), 583-590.
doi:10.1016/j.physbeh.2007.05.004
Gucciardi, D. F., & Dimmock, J. A. (2008). Choking under pressure in sensorimotor
skills: Conscious processing or depleted attentional resources? Psychology of
Sport and Exercise, 9(1), 45-59. doi:10.1016/j.psychsport.2006.10.007

58
Kanamaru, Y., Kikukawa, A., & Shimamura, K. (2006). Salivary chromogranin-A as a
marker of psychological stress during a cognitive test battery in humans. Stress
(Amsterdam, Netherlands), 9(3), 127-131. doi:10.1080/14769670600909594
Kivlighan, K. T., & Granger, D. A. (2006). Salivary alpha-amylase response to
competition: relation to gender, previous experience, and attitudes.
Psychoneuroendocrinology, 31(6), 703-714. doi:10.1016/j.psyneuen.2006.01.007
Kraemer, W. J., Fry, A. C., Rubin, M. R., Triplett-McBride, T., Gordon, S. E., Koziris, L.
P., Lynch, J. M., et al. (2001). Physiological and performance responses to
tournament wrestling. Medicine and Science in Sports and Exercise, 33(8), 1367-
1378.
Lugardon, K., Raffner, R., Goumon, Y., Corti, A., Delmas, A., Bulet, P., Aunis, D., et al.
(2000). Antibacterial and antifungal activities of vasostatin-1, the N-terminal
fragment of chromogranin A. The Journal of Biological Chemistry, 275(15),
10745-10753.
Mese, H., & Matsuo, R. (2007). Salivary secretion, taste and hyposalivation. Journal of
Oral Rehabilitation, 34(10), 711-723. doi:10.1111/j.1365-2842.2007.01794.x
Motzer, S. A., & Hertig, V. (2004). Stress, stress response, and health. The Nursing
Clinics of North America, 39(1), 1-17. doi:10.1016/j.cnur.2003.11.001
Nater, U. M., Rohleder, N., Gaab, J., Berger, S., Jud, A., Kirschbaum, C., & Ehlert, U.
(2005). Human salivary alpha-amylase reactivity in a psychosocial stress
paradigm. International Journal of Psychophysiology: Official Journal of the

59
International Organization of Psychophysiology, 55(3), 333-342.
doi:10.1016/j.ijpsycho.2004.09.009
Noto, Y., Kudo, M., & Hirota, K. (2010). Back massage therapy promotes psychological
relaxation and an increase in salivary chromogranin A release. Journal of
Anesthesia, 24(6), 955-958. doi:10.1007/s00540-010-1001-7
de Oliveira, V. N., Bessa, A., Lamounier, R P M S, de Santana, M. G., de Mello, M. T.,
& Espindola, F S. (2010). Changes in the salivary biomarkers induced by an
effort test. International Journal of Sports Medicine, 31(6), 377-381.
doi:10.1055/s-0030-1248332
Oliver, S. J., Laing, S. J., Wilson, S., Bilzon, J. L. J., & Walsh, N. P. (2008). Saliva
indices track hypohydration during 48h of fluid restriction or combined fluid and
energy restriction. Archives of Oral Biology, 53(10), 975-980.
doi:10.1016/j.archoralbio.2008.05.002
Proctor, G. B., & Carpenter, G. H. (2007). Regulation of salivary gland function by
autonomic nerves. Autonomic Neuroscience: Basic & Clinical, 133(1), 3-18.
doi:10.1016/j.autneu.2006.10.006
Pruessner, J. C., Kirschbaum, C., Meinlschmid, G., & Hellhammer, D. H. (2003). Two
formulas for computation of the area under the curve represent measures of total
hormone concentration versus time-dependent change.
Psychoneuroendocrinology, 28(7), 916-931.
Rohleder, N., Beulen, S. E., Chen, E., Wolf, J. M., & Kirschbaum, C. (2007). Stress on
the dance floor: the cortisol stress response to social-evaluative threat in

60
competitive ballroom dancers. Personality & Social Psychology Bulletin, 33(1),
69-84. doi:10.1177/0146167206293986
Rohleder, N., & Nater, U. M. (2009). Determinants of salivary alpha-amylase in humans
and methodological considerations. Psychoneuroendocrinology, 34(4), 469-485.
doi:10.1016/j.psyneuen.2008.12.004
Rohleder, N., Wolf, J. M., Maldonado, E. F., & Kirschbaum, C. (2006). The psychosocial
stress-induced increase in salivary alpha-amylase is independent of saliva flow
rate. Psychophysiology, 43(6), 645-652. doi:10.1111/j.1469-8986.2006.00457.x
Saruta, J., Tsukinoki, K., Sasaguri, K., Ishii, H., Yasuda, M., Osamura, Y. R., Watanabe,
Yoshihisa, et al. (2005). Expression and localization of chromogranin A gene and
protein in human submandibular gland. Cells, Tissues, Organs, 180(4), 237-244.
doi:10.1159/000088939
Scannapieco, F. A., Torres, G., & Levine, M. J. (1993). Salivary alpha-amylase: role in
dental plaque and caries formation. Critical Reviews in Oral Biology and
Medicine: An Official Publication of the American Association of Oral Biologists,
4(3-4), 301-307.
Ship, J. A., & Fischer, D. J. (1999). Metabolic indicators of hydration status in the
prediction of parotid salivary-gland function. Archives of Oral Biology, 44(4), 343-
350.
van Stegeren, A. H., Wolf, O. T., & Kindt, M. (2008). Salivary alpha amylase and cortisol
responses to different stress tasks: impact of sex. International Journal of

61
Psychophysiology: Official Journal of the International Organization of
Psychophysiology, 69(1), 33-40. doi:10.1016/j.ijpsycho.2008.02.008
van Stegeren, A., Rohleder, N., Everaerd, W., & Wolf, O. T. (2006). Salivary alpha
amylase as marker for adrenergic activity during stress: effect of betablockade.
Psychoneuroendocrinology, 31(1), 137-141. doi:10.1016/j.psyneuen.2005.05.012
Strahler, J., Berndt, C., Kirschbaum, C., & Rohleder, N. (2010). Aging diurnal rhythms
and chronic stress: Distinct alteration of diurnal rhythmicity of salivary alpha-
amylase and cortisol. Biological Psychology, 84(2), 248-256.
doi:10.1016/j.biopsycho.2010.01.019
Strahler, K., Ehrlenspiel, F., Heene, M., & Brand, R. (2010). Competitive anxiety and
cortisol awakening response in the week leading up to a competition. Psychology
of Sport and Exercise, 11(2), 148-154. doi:10.1016/j.psychsport.2009.10.003
Strub, J. M., Goumon, Y., Lugardon, K., Capon, C., Lopez, M., Moniatte, M., Van
Dorsselaer, A., et al. (1996). Antibacterial activity of glycosylated and
phosphorylated chromogranin A-derived peptide 173-194 from bovine adrenal
medullary chromaffin granules. The Journal of Biological Chemistry, 271(45),
28533-28540.
Tsigos, C., & Chrousos, G. P. (2002). Hypothalamic-pituitary-adrenal axis,
neuroendocrine factors and stress. Journal of Psychosomatic Research, 53(4),
865-871.
Uesato, M., Nabeya, Y., Akai, T., Inoue, M., Watanabe, Yoshiyuki, Kawahira, H.,
Mamiya, T., et al. (2010). Salivary amylase activity is useful for assessing

62
perioperative stress in response to pain in patients undergoing endoscopic
submucosal dissection of gastric tumors under deep sedation. Gastric Cancer:
Official Journal of the International Gastric Cancer Association and the Japanese
Gastric Cancer Association, 13(2), 84-89. doi:10.1007/s10120-009-0541-8
Wagner, J., Cik, M., Marth, E., Santner, B. I., Gallasch, E., Lackner, A., & Raggam, R.
B. (2010). Feasibility of testing three salivary stress biomarkers in relation to
naturalistic traffic noise exposure. International Journal of Hygiene and
Environmental Health, 213(2), 153-155. doi:10.1016/j.ijheh.2009.08.004
Walsh, N. P., Montague, J. C., Callow, N., & Rowlands, A. V. (2004). Saliva flow rate,
total protein concentration and osmolality as potential markers of whole body
hydration status during progressive acute dehydration in humans. Archives of
Oral Biology, 49(2), 149-154.
Watson, D., & Clark, L.A. (1994). The PANAS-X: Manual for the positive and negative
affect schedule-expanded form. Unpublished manuscript, University of Iowa,
Iowa City, IA.
Yamakoshi, T., Park, S.-B., Jang, W.-C., Kim, K., Yamakoshi, Y., & Hirose, H. (2009).
Relationship between salivary Chromogranin-A and stress induced by simulated
monotonous driving. Medical & Biological Engineering & Computing, 47(4), 449-
456. doi:10.1007/s11517-009-0447-y
Zhang, K., Rao, F., Wen, G., Salem, R. M., Vaingankar, S., Mahata, M., Mahapatra, N.
R., et al. (2006). Catecholamine storage vesicles and the metabolic syndrome: The role
of the chromogranin A fragment pancreastatin. Diabetes, Obesity & Metabolism, 8(6),
621-633. doi:10.1111/j.1463-1326.2006.00575.x