universidade de lisboa faculdade de ciências departamentos...
TRANSCRIPT

Universidade de Lisboa
Faculdade de Ciências
Departamentos de Biologia Animal
Ecological indicators of grazing effects in cork oak woodlands:
an integrated approach
João Pedro Silva Daun e Lorena Santos
Dissertação de Mestrado
Mestrado em Ecologia e Gestão Ambiental
2013


Universidade de Lisboa
Faculdade de Ciências
Departamentos de Biologia Animal
Ecological indicators of grazing effects in cork oak woodlands:
an integrated approach
João Pedro Silva Daun e Lorena Santos
Dissertação de Mestrado
Mestrado em Ecologia e Gestão Ambiental
Orientadores:
Professora Doutora Margarida Santos-Reis e Doutor Pedro Pinho
2013


Acknowledgements / Agradecimentos
Em primeiro lugar, tenho de agradecer aos meus orientadores: Professora Margarida Santos-Reis e Dr.
Pedro Pinho. Foram muito para além do que se pode esperar de um orientador, e nunca esquecerei o
investimento que fizeram em mim. Inicialmente, prometi a mim próprio que tentaria aprender o máximo
possível sobre a sua forma de pensar e de trabalhar, mas acabei por perceber, com o tempo, que as suas
capacidades ultrapassam uma simples filosofia de fazer Ciência e de gerir e resolver problemas. Percebi
que a sua experiência foi construída com muito trabalho e paixão, e que só após a ultrapassagem de
muitas barreiras me será possível começar a compreender o modo como fazem o que fazem. Serão uma
referência que terei para o resto da vida.
À Professora Cristina Máguas agradeço o apoio e disponibilidade que foi tendo para as minhas dúvidas, e
o facto de me ter apresentado a um dos meus orientadores, o Dr. Pedro Pinho.
À Professora Cristina Branquinho, pelo entusiasmo e dinamismo que foi sempre mostrando quando
conversávamos.
À Sandra Alcobia e à Paula Gonçalves agradeço a experiência de campo que me deram, e a esta última
também agradeço todo o apoio logístico adicional. Infelizmente, nunca poderei devolver os anos de vida
que lhes tirei quando as acompanhei no campo, mas procurarei levar as lições que aprendi para o resto do
meu percurso pessoal e profissional.
Aos companheiros entomólogos, que tornaram o processo de triagem e identificação de escaravelhos
muito mais fácil, não só por todos os conselhos e apoio que me foram dando, mas igualmente por me
deixarem bem disposto e me fazerem sentir bem-vindo. Obrigado: Mário, Carla, Israel, Pedro, Ana, Sílvia
e Carlos. Extendo o agradecimento ao Professor Artur Serrano e ao Joaquin Hortal por todo o apoio
científico que foram dando, mesmo não sendo meus orientadores, e o à-vontade que me deram para atacar
esta parte do trabalho.
Na sala de bolseiros, o meu obrigado à Adriana, Catarina, Melanie, Sofia, Susana e Teresa. À Alice
Nunes, agradeço o facto de me ter ajudado a planear a parte das plantas e a adaptar todo o processo à
necessidade de rapidez e simplicidade. À Paula Matos e à Silvana Munzi, por todo o apoio complementar
na parte dos líquenes. Ao Rodrigo Maia, os conselhos muito práticos que me ajudaram a ultrapassar a
atrapalhação inicial com o processo de moagem e encapsulamento de forma bastante eficaz.
A todos com quem me cruzei na Companhia das Lezírias, que foram sempre simpáticos e prestáveis e ao
Eduardo e Filipa, que me alegraram alguns finais de dia de trabalho. Aos Professores Rui Rebelo e
Francisco Petrucci-Fonseca, por tornarem a minha passagem pela Ribeira Abaixo mais fácil e cómoda.
Aos meus pais, que me estão a apoiar de uma forma muito especial nesta fase de transição da minha vida
e na opção de seguir aquela que é cada vez mais uma grande paixão minha. Aos meus restantes amigos,
com os quais fui partilhando alegrias e frustrações e que demonstraram estar presentes quando precisei
deles. A minha vida é infinitamente melhor por vos ter.
Como está bem claro acima, muitos foram os que se cruzaram comigo e me apoiaram, nesta grande
jornada de trabalho. Sempre mantive uma enorme ambição, talvez grande demais, mas acho que fica
provado que, por mais hercúlea que seja a tarefa a que nos propomos, se tivermos as pessoas certas ao
nosso lado e a recompensar a nossa paixão e entrega, conseguimos atingir os nossos objectivos.


The article that composes this M.Sc. thesis was prepared for submission to the
“Agriculture, Ecosystems, & Environment” Journal, following therefore its publication
rules. The thesis was inserted in the LTER project, more specifically in two of the
LTER-Montado sites (LTER/BIA-BEC/0048/2009).


Table of Contents
Resumo 1
Context 7
Article 12
1. Abstract 12
2. Introduction 13
3. Methods 18
3.1 Study areas 18
3.2 Sampling design 20
3.2.1 Lichens 20
3.2.2 Vascular plants & soil cover 21
3.2.3. Coprophagous beetles 21
3.2.4 Tree leaves 22
3.3. Data analysis 23
3.3.1. Selection of variables as indicators for the effect of grazing 23
3.3.2 Index of Ecological Integrity 24
4. Results 25
4.1 Communities analysis 25
4.2 Functional groups and isotopic composition 27
4.3 Index of Ecological Integrity 33
5. Discussion 35
5.1. Selection of variables as indicators for the effect of grazing 36
5.1.1 Communities analysis 36
5.1.2 Functional groups and isotopic composition 36
Lichens 37
Vascular plants and soil cover 37
Coprophagous beetles 40
Isotopic and elemental analysis 40
5.2 Index of Ecological Integrity 42
5.3 Ecosystem functioning 43
Grazing impacts 43
Integration of the N-cycle and overall ecosystem state 44
5.4 Applications of these indicators and methodologies 46
5.4.1 Easiness of use 46
5.4.2 Application at a Small scale - Human impacts management (property managers) 47
5.4.3 Large scale - Decision-makers and public interest 48
6. Conclusions 49
7. References 50
Perspectives and Outreach 60
Figure Index 63
Table Index 63
Appendixes 64


Ecological indicators of grazing effects in cork oak woodlands: an integrated approach
Ecologia e Gestão Ambiental 2012/2013 1
Resumo
Uma vez que o consumo de carne e lactinícios tem vindo a aumentar no mundo, cada
vez mais surge o desafio de desenvolver formas sustentáveis de produção. Assim, neste
trabalho aborda-se também um aspecto essencial da alimentação humana, com uma
forma de criação de gado sustentável, sem colocar em risco o futuro equilíbrio natural
do ecossistema.
Os indicadores ecológicos têm vindo a ser crescentemente utilizados na monitorização
de sistemas naturais, sendo definidos como características mensuráveis de estrutura,
composição e função, que reflectem condições bióticas ou abióticas, processos e
perturbações dos mesmos. O estudo e aplicação de indicadores ecológicos pode,
portanto, tornar-se útil na averiguação de mudanças importantes nos ecossistemas.
De modo a combinar ambos os factores expressos anteriormente, ou seja, a produção de
gado e a análise da mudança que esta pode causar, o objectivo do presente estudo foi
selecionar indicadores ecológicos para o medir o impacto da pastorícia no ecossistema
Montado.
Os Montados são sistemas agro-silvo-pastorais dinâmicos com múltiplas oportunidades
de exploração humana, uma das quais a pastorícia. Para que essa exploração decorra da
melhor forma, é necessário que o habitat se mantenha em boas condições ambientais.
Há por isso uma forte relação de dependência entre a gestão que Homem faz e a sua
estabilidade ecológica.
Para procurar seleccionar indicadores relevantes do efeito da pastorícia foram
selecionadas duas áreas de estudo (Companhia das Lezírias (CL) e na Herdade da
Ribeira Abaixo (HRA)) onde foram considerados dois tratamentos: pastoreio e exclusão
de pastoreio (controlo). Na CL, o pastoreio refere-se a gado bovino e na HRA a ovino.

Ecological indicators of grazing effects in cork oak woodlands: an integrated approach
Ecologia e Gestão Ambiental 2012/2013 2
A exclusão ao pastoreio na CL ocorre desde 2008 enquanto a HRA não tem pastoreio
nos locais de controlo há mais de 20 anos. Para cada tratamento, foram amostradas 9
áreas circulares de cerca de um hectare, totalizando trinta e seis sítios de amostragem.
A CL é uma propriedade do Estado, localizada em Samora Correia, a 40 km de Lisboa,
com 18000 ha entregues à exploração agro-silvo-pastoril. Os solos da zona amostrada
são maioritariamente arenosos. Em toda a extenção do espaço amostrado, não há
grandes variações de inclinação do terreno. As suas zonas de pastoreio são Pastagens
Permanentes Biodiversas Ricas em Leguminosas, que foram plantadas em 2007, no
local amostrado, de forma a aumentar a produtividade pastoril e conteúdo em carbono
da matéria orgânica do solo. Estas áreas de pastoreio são pastadas no meses de Outono e
Inverno, período após o qual o gado bovino é transferido para outras pastagens.
A HRA está localizada na Serra de Grândola, em Grândola, 100 km a Sul de Lisboa.
Neste estudo não só foi usada a área da HRA (221ha), para os locais de amostragem do
tratamento sem pastoreio, como também propriedades circundantes, pastoreadas por
gado ovino. Os seus solos são marcados pela presença de xistos e grauvaques, com
litosolos pobres em matéria orgânica. Na HRA, a inclinação do terreno é distinta da CL,
já que estamos numa zona de serra, com vários pequenos montes que surgem no espaço
amostrado.
Os indicadores ecológicos seleccionados para avaliação incluíram líquenes epífitos,
plantas vasculares, escaravelhos coprófagos e a caracterização elementar e isotópica de
folhas de sobreiro. Os líquenes, plantas e escaravelhos coprófagos representam
indicadores bióticos e a análise elementar e isotópica das folhas de sobreiro indicadores
abióticos.
A amostragem decorreu durante os períodos de Janeiro e Fevereiro para os líquenes. Os
líquenes foram amostrados na superfície do tronco dos sobreiros, seguindo o protocolo

Ecological indicators of grazing effects in cork oak woodlands: an integrated approach
Ecologia e Gestão Ambiental 2012/2013 3
europeu standard. Entre os dois locais, 120 árvores foram amostradas no total. Foram
registadas as espécies de macrolíquenes epifíticos e também a sua frequência. As
espécies que não foi possível identificar no campo foram recolhidas e identificadas em
laboratório. Os dados foram organizados por abundância de espécies e de grupos
funcionais a que essas espécies pertencem (“oligotróficos”, “mesotróficos” e
“nitrófilos”).
A amostragem de plantas decorreu em Maio de 2013. A frequência de plantas
vasculares e cobertura de solo foram registadas segundo o método do ponto de
intersecção, em que uma vareta metálica é colocada perpendicularmente ao solo e
anotados os elementos que lhe toquem. Em cada sítio de amostragem foram efetuados
dois transectos de 10m, com 21 pontos regularmente espaçado por transeto. Os
indicadores amostrados foram os grupos funcionais quanto à forma de crescimento
(arbustivas, basais e semi-basais, erectas, em tufos e trepadeiras. Os indicadores do solo
foram solo nú, líquenes, musgo, pedras, folhada, e vegetação morta.
Os insectos coprófagos foram amostrados através de duas armadilhas de queda em cada
sítio de amostragem. Uma delas foi colocada em espaço aberto (sem cobertura de
vegetação), e a outra em espaço fechado (coberta por árvores e/ou arbustos). Cada
armadilha consistia num pequeno recipiente, coberto por uma rede plástica sobre a qual
foram colocados excrementos de vaca. Foram deixadas no local durante 48 horas. Os
insectos recolhidos foram trazidos para laboratório para triagem, tendo sido isolados os
escaravelhos coprófagos da subfamília Aphodiinae e das famílias Scarabaeidae e
Geotrupidae, e esses foram identificados ao nível da espécie. Os dados foram
organizados por abundância de espécies e por grupos funcionais a que essas espécies
pertencem (“tunnelers” e “dwellers”), sendo divididos também por tamanho (pequenos
e grandes).

Ecological indicators of grazing effects in cork oak woodlands: an integrated approach
Ecologia e Gestão Ambiental 2012/2013 4
As folhas de sobreiro foram recolhidas das mesmas árvores onde os líquenes foram
amostrados, também em Janeiro e Fevereiro de 2013. Cerca de 10 folhas de cada árvore
foram secas, moídas e analisadas quando ao seu conteúdo em Carbono e Azoto e
respectivos isótopos. Os indicadores resultantes foram o rácio Carbono/Azoto, o δ13C e
o δ15N.
O processo de tratamento estatístico dos dados envolveu análises multivariadas
(DCCA/RDA/CCA) e univariada não-paramétrica (testes U de Mann-Whitney).
Começou por realizar-se uma análise multivariada das espécies de líquenes e insetos
coprófagos, para compreender a composição das comunidades e a sua relação com o
pastoreio. Os resultados mostraram que o principal factor organizativo das comunidades
não foi o pastoreio, mas sim as áreas de estudo e/ou a espécie de gado. Prosseguiu-se
testando os restantes indicadores baseados em grupos funcionais e na análise elementar
e isotópica das folhas. Estes indicadores foram comparados considerando o tratamento e
a área de estudo, através de testes não paramétricos U de Mann-Whitney. e
graficamente representados em boxplots. De acordo com os resultados, os indicadores
foram distribuídos por três grupos. O primeiro contém os que são significativamente
diferentes para o efeito do tratamento nas duas áreas de estudo. O segundo grupo,
contém os indicadores que só são estatisticamente distintos no tratamento numa das
áreas de estudo. O terceiro, tem aqueles que, ou mostram tendências opostas nas duas
áreas de estudo, ou não têm diferenças com significância estatítica em nenhuma das
duas. Integraram o primeiro grupo os arbustos, as plantas semi-basais, e escaravelhos
coprófagos “tunnelers” (escavadores de túneis) de tamanho pequeno. Estes três
indicadores foram assim apontados como melhores indicadores para o impacto da
pastorícia no Montado.

Ecological indicators of grazing effects in cork oak woodlands: an integrated approach
Ecologia e Gestão Ambiental 2012/2013 5
De seguida foi feita uma análise multivariada com os indicadores do primeiro grupo. O
passo seguinte foi incluir outras variáveis ambientais através de uma análise parcial.
Deste modo, averiguou-se o efeito que estas novas variáveis (usadas como covariáveis)
terão nos dados iniciais, procurando-se isolar o efeito da pastorícia. Esta análise
permitiu verificar que as variáveis radiação solar potencial, inclinação e densidade de
árvores em cada local de amostragem não tiveram influência no resultado obtido
anteriormente.
Finalmente, através dos “scores” do primeiro eixo da análise parcial foi construído um
índice de integridade ecológica que ajudou a entender de que forma os espaços são
impactados pela pastorícia.
O índice resultante apontou a seguinte ordenação das áreas de estudo e tratamentos: em
primeiro lugar, como menos impactada surgiu a HRA não pastoreada. Segui-se a CL
também não pastoreada. Em terceiro, ficou a CL pastoreada, e por último, ou seja, a
mais impactada pela actividade pastoril, a HRA pastoreada.
Concluindo, esta ordenação permite compreender melhor o impacto da pastorícia nas
áreas estudadas. Os usos deste índice podem estender-se a outras problemáticas
ambientais (tal como o abandono agrícola e as actividades de exploração florestal), e
são uma boa ferramenta de análise e de informação para o público geral ou para
gestores e políticos. Adicionalmente, poderão ajudar na monitorização de impactos da
actividade humana e do estado do ecossistema em locais de relevância ecológica, na
avaliação de acções de conservação e na prioritização alvos de novas medidas de
protecção ambiental.
Palavras-chave: pastoreio; Montado; multi-taxa; indicadores ecológicos; gestão
ambiental

Ecological indicators of grazing effects in cork oak woodlands: an integrated approach
Ecologia e Gestão Ambiental 2012/2013 6

Ecological indicators of grazing effects in cork oak woodlands: an integrated approach
Ecologia e Gestão Ambiental 2012/2013 7
Context
This project is focused in studying the application of ecological indicators to assess the
impacts of human activities. One of the activities that is essential to humans and also
has an impact on ecosystems is grazing. It was approached as the main problem in this
project because of how vital it is to feed humankind and to provide a balanced economic
exploitation of the land. The Montado is an ecosystem where grazing plays a very
important role. In few other places there is such equilibrium between human
intervention, ecological preservation and biological diversity.
If not managed properly, grazing is an activity that can become self-limiting. When the
regime is too intensive, trampling and vegetation consumption exhaust the capacity of
the habitat to sustain pastures, ending the possibility of further exploration. However,
with the absence of grazing, there is an increase in shrub density that can alter the
vegetation structure, as the system moves to another phase of the ecological succession.
This may transform the landscape in a manner that the Montado can no longer be
recognized as one, evolving to a shrubland. Once this happens, human exploitation of
the land becomes increasingly hard.
From the beginning, the selection of the different taxonomical groups that would take
part in the project was a straight-forward process. Initially, there was a very wide range
of possibilities. The indicators that were integrated in this study fulfilled the conditions
of both being quickly and easily put in practice during the course of just one year. The
input from specialists in different areas was very helpful in confirming their adequacy
for the problem at hand. As in Nature a lot of interactions that regulate the ecosystems
are interconnected as a complex network, a single indicator may not be enough to
capture all this variability. Therefore, this study focuses in the combination of several of

Ecological indicators of grazing effects in cork oak woodlands: an integrated approach
Ecologia e Gestão Ambiental 2012/2013 8
them, to strengthen their potential as a whole. The number of studies with multiple taxa,
however, is rather low, reinforcing the need for a new one.
Moreover, another consideration to be taken into account and that helped in selecting
the main problematic hereby studied is the human perspective. More than considering
what the impacts on the environment alone are, there should be a specific concern with
the economical side of the management of the sites. These sites are being exploited for
profit that guarantees the livelihood of some people, through the diverse services they
can offer. It is then useful to understand how that exploitation may undermine itself, in
order to protect the future of the land, from an ecological and economic standpoint. By
ensuring these two components are kept on the table, it becomes easier to manage a
healthy ecosystem.
To land managers in Montado areas, it is particularly relevant to know and understand
which the best procedures are, especially at the long-term, in order to preserve the space
that provides their livelihood. One of the strong points of this study, and others alike, is
to provide managers with the necessary tools to make the best decisions, while being
responsible towards biodiversity and the environment. On the other hand, in most cases
it is hard for them to access the information and conclusions that the scientific
community provides. Academia should commit to making an effort to disseminate the
benefits of their work and make them more readily available.
For being a very sensitive habitat and for its role on the conservation of biodiversity,
being a biodiversity hotspot, the Montado deserves special attention. Other factor that
makes it so unique is the number of possible economical activities in the same space
and the opportunities it provides in helping local communities in a healthy and
environmentally friendly way. Although they are not discussed in this work, other
goods and services provided by Montado include mushrooms, medicinal herbs and

Ecological indicators of grazing effects in cork oak woodlands: an integrated approach
Ecologia e Gestão Ambiental 2012/2013 9
timber, the aesthetical value of the land, its ability to provide leisure activities and job
creation in rural areas.
In Portugal, ecological indicators are not widely applied yet. This work intends to
contribute to foster its application. The timing for this approach seems the right one
since society – not only in Portugal, but worldwide - is increasingly worried about
environmental issues, wanting to be better informed. On the other hand, the economic
crisis asks for more focused investments. Indicators reduce the cost and time investment
in ecosystems monitoring and public information. For being about efficiency and
effectiveness and for many other reasons, this area of research bares strong
opportunities for the future. Also due to the current economic crisis, some people are
returning to the rural areas, which may increase agricultural activity in a near future. At
the moment, developing monitoring tools to accompany the additional impacts of
change in land use seems to be particularly relevant.
New research projects, and resulting papers, increase in number every year making it
increasingly hard to have fresh ideas. The current project took a path that was not found
in the literature. While it applies many of the concepts in use in other works, the
approach to the data is conducted in an innovative way, combining the previous
knowledge with a new perspective.
The context of the Montado including: its sensitivity, ecological and economic
importance, academia interaction with managers, its relevance for Portugal and other
countries and the role that grazing may play on the ecosystem has been put forth. Now,
it is time to advance with the application of ecological indicators for studying the effects
of grazing.

Ecological indicators of grazing effects in cork oak woodlands: an integrated approach
Ecologia e Gestão Ambiental 2012/2013 10

Ecological indicators of grazing effects in cork oak woodlands: an integrated approach
Ecologia e Gestão Ambiental 2012/2013 11

Ecological indicators of grazing effects in cork oak woodlands: an integrated approach
Ecologia e Gestão Ambiental 2012/2013 12
Article
Title: Ecological indicators of grazing effects in cork oak woodlands: an integrated
approach
1. Abstract
Lichens, vascular plants, coprophagous beetles and cork oak leaves were assessed as to
their effectiveness as ecological indicators for the effects of grazing in cork oak
woodlands (Montados). More than considering the individual information gathered
from each of these groups, our goal was to integrate them, in order to simplify the
complex interactions established among them. The sampling was performed in two
study areas, one grazed by cows and the other by sheep, and two treatments were
considered at each: grazed and grazing-excluded (control). Indicators based on species
(community organization), functional groups and abiotic factors were tested. The results
showed that communities’ organization of lichens and coprophagous beetles was more
related to the study area/livestock species rather than to the grazing effect. However,
some of the functional groups proved to be robust indicators for the effects of grazing.
On the basis of such information an integrative Index of Ecological Integrity was built,
using the best individual indicators that assisted us in comparing the relative magnitude
of grazing impact on the study areas. This index can be tested at a broader scale,
involving other pastoral systems, and also be used by land managers and policy-makers
to prioritize measures of conservation or protection of the environment.

Ecological indicators of grazing effects in cork oak woodlands: an integrated approach
Ecologia e Gestão Ambiental 2012/2013 13
Highlights
This study looks for indicators for the effect of grazing in the Montado ecosystem.
Lichens, plants, coprophagous beetles and cork oak leaves were tested.
Plants and coprophagous beetles responded more clearly to grazing.
An integrative Index of Ecological Integrity was built to compare the study areas.
Keywords: ecological integrity index; multi-taxa; Montado ecosystem; land
management.
2. Introduction
An indicator provides evidence for trends or phenomena that are not immediately
detectable (Hammond et al., 1995). Environmental indicators are often interchangeable
with the term of ecological indicators (Niemi and McDonald, 2004), although
ecological indicators should be considered a subset of environmental indicators (NRC,
2000) that tries to narrow down from the complexity of all the elements in a causal
chain that links human activities to environmental and social responses to some impacts
(Smeets and Weterings, 1999). Environmental indicators then focus on isolating the key
aspects of the environmental condition, large-scale patterns and appropriate actions
(Niemeijer, 2002).
Niemi and McDonald (2004) combine the terms by Young and Sanzone (2002)
(USEPA) and the Hierarchy of Noss (1990) to define ecological indicators as:
“measurable characteristics of the structure (e.g., genetic, population, habitat, and
landscape pattern), composition (e.g., genes, species, populations, communities, and

Ecological indicators of grazing effects in cork oak woodlands: an integrated approach
Ecologia e Gestão Ambiental 2012/2013 14
landscape types), or function (e.g., genetic, demographic/life history, ecosystem, and
landscape disturbance processes) of ecological systems”. These indicators can reflect
biotic condition, chemical and physical characteristics, ecological processes, and
disturbance (Harwell et al., 1999; Young and Sanzone, 2002). They are frequently
biological in nature, due to their sensitive response to chemical, physical and other
biological phenomena (Niemi and McDonald, 2004). The most common roles they
assume are to become an early-warning system (through the assessment of the state of
the environment) or to go to the root cause of disturbance (Dale and Beyeler, 2001). In
the present work, several variables are going to be evaluated as ecological indicators on
their effectiveness in detecting the impacts and changes on the environment that
originate from grazing activity.
Livestock management is an increasingly hot topic in the twenty-first century, as the
population and meat and dairy consumption increase (FAO, 2002). Integrating the
animals in a healthy environment for their growth and preserving the pastures and
ecosystems they feed on can be a challenge and a research priority. Here, the two
livestock species being studied are cattle and sheep. Among the main impacts these
animals generate with their feeding habits and roaming behaviour are vegetation
reduction, trampling, and dung and urine production (Perevolotsky and Seligman,
1999). However, grazing also has its benefits such as reducing the need for mechanic
vegetation clearing, which costs money and can disturb the soil balance. Livestock also
is responsible for slowing down succession, impeding the evolution of grasslands to
shrublands and then forests. Land managers are interested in preserving the balance of
the Montado as it is, because that state allows them to better exploit the land, and to
continue their activity, without an increase in biomass becoming an obstacle, through
the overdevelopment of shrubs (Chapin III et al., 2002). Non-grazing retards the

Ecological indicators of grazing effects in cork oak woodlands: an integrated approach
Ecologia e Gestão Ambiental 2012/2013 15
transition of pastures to shrubs and trees and shrub association (Bernáldez, 1991; Sluiter
and de Jong, 2007; Tasser et al., 2007; Tzanopoulos et al., 2007; Verburg et al., 2009).
The extent to which this change impacts the Montado ecosystem will be studied in the
present work.
The Montado is an agro-sylvo-pastoral system, shaped and explored by humans, in a
way that has produced a co-dependence relationship between human activities and the
forest to foster its sustainability. This system has a savannah-like physiognomy, and in
Portugal is dominated by two oak species: cork (Quercus suber) and holm (Quercus ilex
subsp. ballota), with varying densities (Pinto-Correia et al., 2011). It is concentrated
mainly in the Alentejo region, where 730.000 of the total 800.000 ha in the country are
located. In Spain, the equivalent system is named dehesa. Spain has an area of about 2
million hectares of this ecosystem (Pinto-Correia et al., 2011). Besides the Iberian
Peninsula, these woodlands can be found scattered around the western-Mediterranean,
in both the south of Europe and North Africa. Its geographical distribution (region
considered a biodiversity hotspot – Myers et al., 2000), economic significance and
natural value demand strong research contributing to its long-term sustainability.
Grazing is a functional layer of the system and is instrumental for its preservation. The
Montado system, due to its complexity resulting from multiple activities, requires
control and science-based advice in order to maintain an equilibrium and subsequent
sustainability (Pinheiro et al., 2008; Pinto-Correia et al., 2011; Ribeiro et al., 2004). It is
this equilibrium that ensures profitability, in a sector that is so important to the
Portuguese economy. The desire for the maintenance of this stability becomes more
understandable when we consider the fact that Portugal has 33% of the area of cork oak
in the world and is responsible for 54% of the world cork production (Ribeiro et al.
2010).

Ecological indicators of grazing effects in cork oak woodlands: an integrated approach
Ecologia e Gestão Ambiental 2012/2013 16
The concept of ecological integrity (also known as ecosystem health) is becoming more
relevant in ecological research, although not without some controversy. Some authors
relate it to human health, while others insist on how it deserves its own definition.
Generally, an ecosystem can be said to be healthy if it retains its stability and
sustainability, while maintaining its organization and being resilient to change and
impact as it provides for human needs (Haskell et al., 1992; Woodley et al., 1993;
Sampson et al., 1994; Vora, 1997). The concept seems to be perfectly aligned with the
objectives of this study. The Montado is one of the systems where the ecological
balance is most at stake, and where the need to keep providing goods and services is
essential for both ends (ecosystem and humans). Ecological integrity is a dynamic
concept, involving structure, function and composition of the environment, resilience
and stability. Many variations of these components are combined into definitions
proposed by Cairns (1997), Shackell and colleagues (1993), among others. These
definitions revolve around the same conceptual core, being similar and using the
properties that are listed above. The main problem with a concept like this is perhaps
the definition of the equilibrium state. In cases other than semi-natural ecosystems, it
can be feasible to find a more “pristine, natural” site – and even that is becoming hard,
now that humans influence the ecosystems everywhere on Earth in such a tremendous
way (Zalasiewicz et al., 2010). The word health itself offers an aid to interpret integrity
as lack of “disease”, meaning no symptoms or signs of degradation and decaying
quality or performance. This metaphor was proposed by Schaeffer and others (1988),
and Rapport (1989, 1992, 1995a,b), to easily convey the message of how ecosystems
function to the general public. For being (1) sufficiently sensitive to provide an early
warning of change; (2) distributed over a broad geographical area, or otherwise widely
applicable; (3) capable of providing a continuous assessment over a wide range of

Ecological indicators of grazing effects in cork oak woodlands: an integrated approach
Ecologia e Gestão Ambiental 2012/2013 17
stress; (4) relatively independent of sample size; (5) easy and cost-effective to measure,
collect, assay, and/or calculate; (6) able to differentiate between natural cycles or trends
and those induced by anthropogenic stress; and (7) relevant to ecologically significant
phenomena (Cook, 1976; Sheehan, 1984; Munn, 1988; Noss, 1990), good indicators
are intended to be the best tool to capture those “symptoms” in the most efficient way.
The diagnosis is the only way to prevent “death” when it is still safe to correct practices.
The combination of sensitivity, traceable change over time and ease of data gathering
constitute unique advantages to make this diagnosis worth-while to keep doing
regularly.
In this work four biological groups will be tested as ecological indicators: lichens,
vascular plants, coprophagous beetles and cork oak leaves. These are groups whose
methods and application was successful in previous examples (Herrick et al., 2009;
Pinho et al., 2011; Hortal and Lobo, 2005; Bai et al., 2012). Bearing in mind the
biological groups this study goes over, it could be added that they reflect different
stages of the nitrogen cycle (Dawson et al., 2002; Garnier et al., 2007; Nichols et al.,
2008; Pinho et al., 2011). However, an integration of these groups may provide an
innovative approach and be more efficient by retaining the complexity of interactions
between the system components. Other than being known to work in isolation, the
reasons why these indicators were selected were the knowledge on the ecology of these
groups and the quickness and low difficulty of application, making their use for grazing
possible.
Knowing the negative impacts that grazing may have on the system of Montado, the
question is if those impacts are big enough to make grazing very influential on the
habitat dynamics. If the answer is positive, then this can mean the same indicators that
are able to reflect grazing impacts, may also be adequate for ecosystem health, in a

Ecological indicators of grazing effects in cork oak woodlands: an integrated approach
Ecologia e Gestão Ambiental 2012/2013 18
broader way. Bearing in mind the biological groups this study goes over, it could also
be added that they reflect different stages of the nitrogen cycle (Dawson et al., 2002;
Garnier et al., 2007; Nichols et al., 2008; Pinho et al., 2011).
A meta-analysis of the current state of research in this field was performed. In Google
Scholar, out of 30.400 results for “ecological indicators”, only 109 also included the
word “multi-taxa”, a very low ratio of 0.36%, and 54 of those 109 were performed since
2009, demonstrating that this trend is recent. If the word “Mediterranean” is included,
the number drops down to 35 studies; only 29 for “grazing”, “ecological indicators” and
“multi-taxa”. These numbers highlight the innovation of this study and the need for this
and more studies alike in the future.
The main objective of the work was to select indicators for the analysis of the impacts
of grazing. This was carried out on two different study areas, which are grazed by two
different livestock species. The results are expected to provide an evaluation of current
state and future tendencies of the ecosystem integrity and also tools for human
management of Montados. The ever-expanding science of biological indicators is being
increasingly applied and becoming a part of bigger organizations, responsible for large-
scale operations. To know the extent to which this evolution is taking place, an overlook
of the application of indicators on different scales will also be presented in this paper.
3. Methods
3.1 Study areas
This work was conducted in Portugal, south-west Europe, in two areas with different
geomorphologic and pasture characteristics (Appendix I): Companhia das Lezírias (CL)
and Herdade da Ribeira Abaixo (HRA).

Ecological indicators of grazing effects in cork oak woodlands: an integrated approach
Ecologia e Gestão Ambiental 2012/2013 19
Both study areas are characterized by a Mediterranean climate and are mainly covered
by savannah-like cork oak (Q. suber) woodlands. The two areas are Long Term
Ecological Research sites (LTER) devoted to the study of these woodlands and are
under an extensive grazing regime (cows at CL and sheep at HRA) that includes low
livestock density and a rotation system.
CL is located c. 40 km East of Lisbon, in the municipality of Samora Correia (38º 52' N,
08º 51' W). It is a state-owned property (18000 ha) devoted to agro-sylvo-pastoral
activities. The mean annual temperature is 16.3 ºC and annual rainfall averages 700 mm
(local weather station, 2002 to 2010). CL is located in a plain area with sandy soils that
were sowed with biodiverse pastures in 2007, on the basis of a legume-rich seed
mixture, aiming to increase pasture productivity and the carbon content of the soil
organic matter (Teixeira et al. 2011). Sowing was done in 2007 and the areas were
thereafter pastured. On the sampling year, there was grazing by cattle on two periods:
one from 25/09/12 until 17/12/12 (83 days) and another between 25/01/13 and 12/04/13
(72 days). The stocking rate was 1.24 LSU (livestock units) /ha.
HRA is located in Serra de Grândola, in the municipality of Grândola (38º 05’ N - 38º
08’ N; 8º 33’ W - 8º 38’ W), 100 km south of Lisbon. Besides this state-owned property
(221ha), mostly used for scientific research (Field Station of the Centre for
Environmental Biology), this study area further includes areas from the adjoining
private owned proprieties, totalizing an extra 61 ha. The mean annual temperature is
15.6ºC and the annual rainfall averages 500 mm (Comissão Nacional do Ambiente
1983; 1967 to 1980). HRA is located in a moderate rolling mountain (Serra de
Grândola) dominated by schist and greywacke rocks that are covered with lithosols poor
in organic matter (Pereira et al. 2009). In this area, pastures are natural and have been
continuously grazed by sheep (c. 0.76-0.95 LSU/ha).

Ecological indicators of grazing effects in cork oak woodlands: an integrated approach
Ecologia e Gestão Ambiental 2012/2013 20
3.2 Sampling design
To establish ecological indicators for the effects of grazing two treatments were
compared in each study area (CL and HRA): grazing and grazing-exclusion (control). In
CL grazing excluded sites (control) were fenced in 2008, while at HRA these have been
devoid of grazing for more than 20 years. For each treatment, in areas with
homogeneous tree cover, nine 1 ha circles, were sampled for biotic (lichens, vascular
plants, and coprophagous beetles species richness and functional groups) and abiotic
(tree leaves elemental and isotopic composition) parameters, totalising 36 sampling sites
(2 areas*2 treatments*9 replicates).
3.2.1 Lichens
During January and February 2013, the 3-4 mature cork oaks closest to the centroid of
each sampling site were surveyed for epiphytic macrolichen diversity (total of 120
trees). The sampling procedure was one adaption of the standard European protocol
(Asta et al., 2002), already tested in Mediterranean ecosystems (e.g. Stofer et al. 2006,
Pinho et al. 2011,2012). Sampled trees had a perimeter >65 cm, nearly straight trunks (<
10º inclination from a vertical position) and a healthy appearance. Sampling was done
always in virgin cork, i.e., either on trees which were never harvested or above the level
of cork extraction. On each tree trunk, a vertical sampling grid (five 10cm x 10cm
squares) was placed 130 to 210 cm from the ground at each of the four main cardinal
orientations (N, S, W, E). Observed species were then recorded as present in a
frequency of 1 to 5, depending on the number of grid squares they were identified on.

Ecological indicators of grazing effects in cork oak woodlands: an integrated approach
Ecologia e Gestão Ambiental 2012/2013 21
We additionally recorded GPS coordinates, tree perimeter at breast height, and sampling
height. Most species were identified in the field but when needed samples were
collected for laboratorial identification. Small species of the Usnea genus posed
identification problems and were recorded as Usnea spp, with the exception of Usnea
rubicunda, an easier species to identify. Nomenclature used follows the online database
ITALIC (Nimis and Martellos, 2008). Species richness and frequency of functional
groups regarding nitrogen tolerance (Nimis and Martellos 2008) were calculated.
3.2.2 Vascular plants & soil cover
During May 2013, vascular plants & soil cover were sampled using the point-intercept
method, adapted from (Herrick et al., 2009). For each sampling site, two 10 m transects
(72 in total) with 0.5 m separated points (21 points/transect) were used. At each point all
plants touching the sampling pole (a thin metal pole positioned orthogonally to the
ground) were recorded according to growth form (functional groups): shrubs, rosettes,
semi-rosettes, erect leafy, tussock forming and climbers. Whenever necessary, samples
were collected for clarification in the laboratory. Soil cover categories were: bare soil,
lichens, mosses, rocks, dead leaves and plant litter. All transects were georeferenced.
Data were expressed in occurrence frequency.
3.2.3. Coprophagous beetles
During May 2013, following Hortal and Lobo (2005) approach, a pair of pitfall traps
were placed at each sampling site, one in an open area (exposed to sunlight) and another

Ecological indicators of grazing effects in cork oak woodlands: an integrated approach
Ecologia e Gestão Ambiental 2012/2013 22
in a closed one (shaded by trees or shrubs) (total of 72 traps). The distance between
traps was no less than 20 m. Each pitfall consisted of a large plastic container (diameter:
26 cm; depth: 10 cm) buried and levelled to the ground, topped by a rigid plastic net
with about 250 g of bait (cattle dung) placed over it. Following the recommendations by
Lobo and colleagues (1988) and Veiga and others (1989), the baited traps were set in
place for 48h. All collected insects were preserved in 70% alcohol and brought to the
laboratory for identification. In the laboratory, the coprophagous beetles of the
subfamilies Aphodiinae, Scarabaeidae, and family Geotrupidae (superfamily
Scarabaeoidea) were separated from other by-catch organisms and identified to the
species-level using Baraud (1992). Veiga (1998) and Dellacasa and Dellacasa (2006)
were used for Aphodiinae and Piera and Colón (2000) for Scarabaeidae and
Geotrupidae. Coprophagous beetles’ richness and frequency of functional groups
regarding size (small/large tunnelers and dwellers) were calculated.
3.2.4 Tree leaves
During January and February 2013 a composite sample of leaves was taken on each
sampling site, considering 10 fully expanded leaves collected from sunlit parts of the
canopy (3-4 leaves from each tree sampled for lichens). The leaves were then ground to
a fine powder using a ball mill (MM 2000, Glen Creston) after being dried for 72 hours
(temperature 60 ºC). 13C/12C and 15N/14N ratios in the samples were determined by
continuous flow isotope mass spectrometry (CF-IRMS) (Preston and Owens, 1983), on
a Hydra 20-22 (Sercon, UK) stable isotope ratio mass spectrometer, coupled to an
EuroEA (EuroVector, Italy) elemental analyser for online sample preparation by
Dumas-combustion. The standards used were IAEA-N1 and USGS-35 for nitrogen

Ecological indicators of grazing effects in cork oak woodlands: an integrated approach
Ecologia e Gestão Ambiental 2012/2013 23
isotope ratio, and IAEA-CH6 and IAEA-CH7 for carbon isotope ratio; δ15N results
were referred to Air and δ13C to PeeDee Belemnite (PDB). Precision of the isotope
ratio analysis, calculated using values from 6 to 9 replicates of laboratory standard
material interspersed among samples in every batch analysis, was ≤ 0.2‰. Elemental
composition on N and C (%N and %C) and isotopic composition (δ15N, δ13C) were
determined by the Stable Isotopes and Instrumental Analysis Facility (SIIAF) of the
Centre for Environmental Biology (CBA), University of Lisbon - Portugal.
3.3. Data analysis
We used a two-step analytical approach. First, we tested which variables could be used
as ecological indicators of grazing effects and then used those variables to build an
Index of Ecological Integrity.
Two types of biotic variables (communities’ composition - lichens or coprophagous
beetles; functional groups - lichens, vascular plants and coprophagous beetles) and one
abiotic (isotopic composition of tree leaves) were tested as ecological indicators.
3.3.1. Selection of variables as indicators for the effect of grazing
Communities’ composition was tested through direct ordination analysis, after
determining if relationships were linear or unimodal. This was done using Detrended
Canonical Correspondence Analysis (DCCA) which measures the beta diversity in
community composition along species-dependent gradients (i.e., not accounting for
environmental variables). According to Leps and Smilauer (2003) the reported “gradient
length” was used to choose either a linear (RDA, Redundancy Analysis, for gradient

Ecological indicators of grazing effects in cork oak woodlands: an integrated approach
Ecologia e Gestão Ambiental 2012/2013 24
lengths smaller than 4) or an unimodal ordination (CCA, Canonical Correspondence
Analysis, for gradient lengths larger than 4). In both approaches, site and treatment were
used as environmental variables. If the main communities’ axis was governed by the
grazing/grazing exclusion treatment the communities’ composition was kept for further
analysis, being discarded if the study area emerged as the main factor. Results were
represented as scatterplots of variables and environmental variables.
Functional groups and leaf isotopic composition were tested looking for significant
differences between treatment and study areas. As variables’ distribution approached
but not fulfilled normality, the non-parametric Mann-Whitney’s U rank-test was
performed to assess the statistical significance of observed differences. Variables
presenting significant differences between treatments and/or study areas were chosen
for subsequent analysis. Results were represented as boxplots.
3.3.2 Index of Ecological Integrity
To build the Index of Ecological Integrity, a direct ordination analysis was carried out
on the selected variables, considering treatment and study areas as environmental
variables. As weighting factors of each variable, we used the respective scores obtained
on the first axis, which were multiplied by the standardized values of each variable. The
index was calculated for each sampling site, and for comparison between study areas we
used boxplots.
An additional test was carried out to assess the potential influence of other
environmental factors on this index. This was done by performing a partial RDA with
the slope, annual potential solar radiation and tree density as covariables. These
variables were chosen from a set of abiotic variables that more likely could influence
Ecological indicators of grazing effects in cork oak woodlands: an integrated approach
Ecologia e Gestão Ambiental 2012/2013 25
the tested ecological indicators. Slope and annual potential solar radiation were
calculated in ArcGis 10 (ESRI 2010) using a digital terrain model with 10 m resolution,
from national cartography (1:25000). Potential Solar Radiation measures the amount of
energy potentially arriving to each sampling site, and considers both the site and the
nearby orography. Tree density was determined within each sampling site by manual
interpretation of aerial orthophoto maps. The data was stored and organized for
statistical analysis in an excel datasheet file (Microsoft Excel, 2010). The boxplots and
Mann-Whitney’s U tests were performed using STATISTICA software (Statsoft Inc.,
2010) and all multivariate analyses were run using the software package CANOCO
(ver. 4.5, ter Braak and Smilauer 2003).
4. Results
4.1 Communities analysis
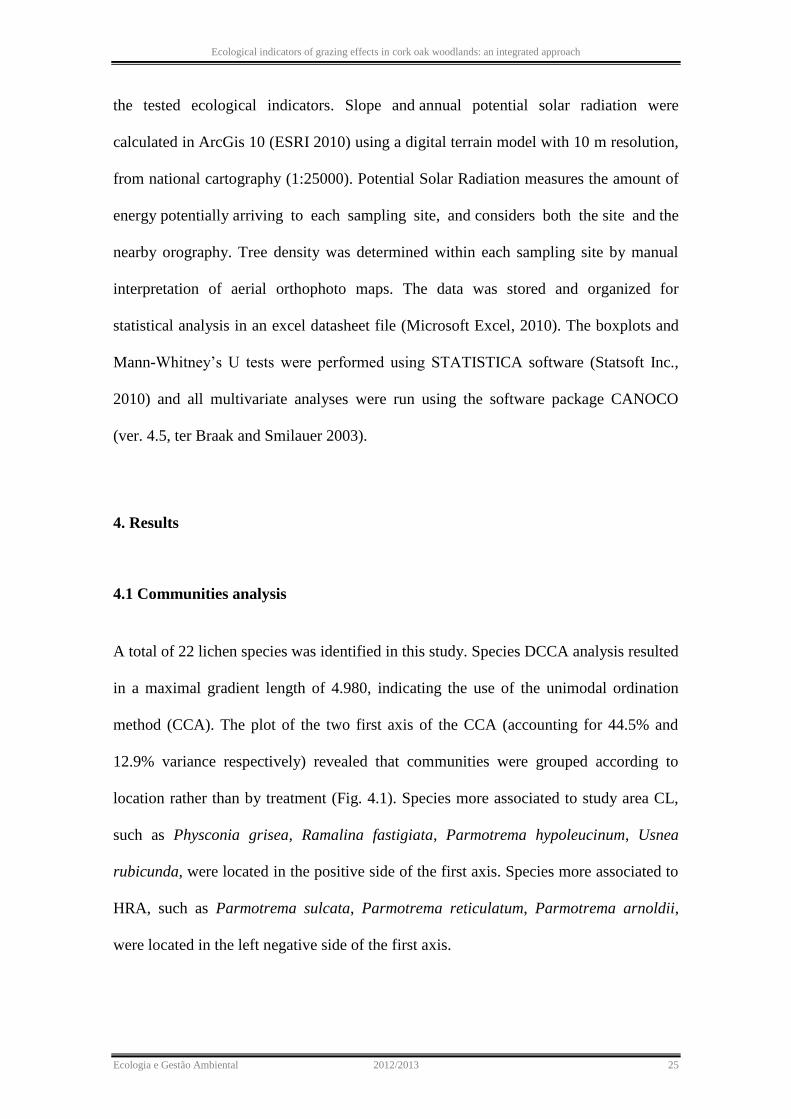
A total of 22 lichen species was identified in this study. Species DCCA analysis resulted
in a maximal gradient length of 4.980, indicating the use of the unimodal ordination
method (CCA). The plot of the two first axis of the CCA (accounting for 44.5% and
12.9% variance respectively) revealed that communities were grouped according to
location rather than by treatment (Fig. 4.1). Species more associated to study area CL,
such as Physconia grisea, Ramalina fastigiata, Parmotrema hypoleucinum, Usnea
rubicunda, were located in the positive side of the first axis. Species more associated to
HRA, such as Parmotrema sulcata, Parmotrema reticulatum, Parmotrema arnoldii,
were located in the left negative side of the first axis.
Ecological indicators of grazing effects in cork oak woodlands: an integrated approach
Ecologia e Gestão Ambiental 2012/2013 26
Fig. 4.1 – Ordination diagram (CCA) with all lichen species and the study areas separated by treatment
as environmental variables. “e” is for grazing excluded, “g” for grazed. 44.5% and 12.9% variance
was explained by the first and second axis, respectively.
A total of 14 coprophagous beetles species (each with more than 20 captured
individuals) were used to perform the DCCA analysis, resulting in a maximal gradient
length of 1.683. The two first axis of the linear ordination analysis (RDA) accounted for
47.3% and 3.1% of the species variance (Fig. 4.2). Again, communities were found to
be organized by study area rather than treatment. Traps placed in open and closed
vegetation belonging to the same study area and treatment were located close in the
plot, with CL grazing-excluded sampling sites being further apart. Interestingly, most
species were located on the negative portion of the second axis, together with the
grazing treatments, suggesting that a higher frequency of most species was associated
with grazing for both study areas.

Ecological indicators of grazing effects in cork oak woodlands: an integrated approach
Ecologia e Gestão Ambiental 2012/2013 27
Fig. 4.2 - Ordination diagram (RDA) with the coprophagous beetles species having a representation of
more than 20 captured individuals, divided by (C)losed and (O)pen setting, and the study areas
separated by treatment as environmental variables. “e” is for grazing excluded, “g” for grazed.
47.3% and 3.1% variance was explained by the first and second axis, respectively. (The lines of
the arrows of the species were removed for graphical clarity)
Lichens and coprophagous beetle species were re-analysed together. The preceding
DCCA resulted in a maximal gradient length of 2.025, pointing to the linear ordination
method. The results of the consequent RDA accounted for 59.0% and 6.1% of the
species variance (see Appendix II). As with previous analysis, communities were
grouped by study area, rather than treatment.
4.2 Functional groups and isotopic composition
Functional groups of lichens, plants, coprophagous beetles and leaves’ isotopic
composition were individually tested as ecological indicators of the effects of grazing.
According to the results of the Mann-Whitney’s U tests, three groups of indicators were
separated. The first group includes the indicators which allow the distinction between

Ecological indicators of grazing effects in cork oak woodlands: an integrated approach
Ecologia e Gestão Ambiental 2012/2013 28
the treatments for both study areas. More specifically, to be in this group, the indicators
must reveal a significant difference between grazing and grazing-exclusion plots in both
study areas, and the direction of the difference must be the same (i.e., either increasing
or decreasing in both study areas). The second group includes indicators that have
significant differences between treatments only in one study area, while the direction of
the trend is the same in the two areas. Finally, a third group included indicators that
result in non-significant differences between treatments or result in contrasting trends
for the study areas.
The frequency of semi-rosettes, shrubs and number of small tunnelers showed
significant differences between treatments for both study areas (p-values in Table 1,
below) (Fig. 4.3). Shrubs were almost non-existing in CLg, and have a low abundance
in HRAg. In both study areas, there is a significant increase of shrubs in the respective
grazing excluded sampling sites. Semi-Rosettes showed the oposite trend, presenting a
low frequency on the grazing-exclusion sampling sites and increasing in the grazed
ones. The number of small tunnelers per trap presented the same trend as semi-rosettes,
being significantly higher in the grazed sampling sites.
Boxplot - Shrubs
Median
25%-75%
Non-Outlier Range
Outliers
Extremes
CLe CLg HRAe HRAg
Study area
-5
0
5
10
15
20
25
30
35
40
45
Sh
rubs
Boxplot - Semi-rosettes
Median
25%-75%
Non-Outlier Range
Outliers
Extremes
CLe CLg HRAe HRAg
Study area
-2
0
2
4
6
8
10
12
14
16
18
20
22
24
Se
mi-
rose
tte
s
Boxplot - Small tunnelers per trap
Median 25%-75% Non-Outlier Range Outliers Extremes
CLe CLg HRAe HRAg
Study area
0
20
40
60
80
100
120
140
160
n
Fig. 4.3 - Boxplots for thefrequency of shrubs (a), semi-rosettes (b) and number of small tunnelers per
trap (c). Different letters indicate statistically significant difference (Mann-Whitney’s U test;
p values in Table 1). “e” is for grazing excluded, “g” for grazed.
a
b,d,f
a,e,h
c,g,i
b,d,f
c,e,h
a,g,i
a c,f,h
a,e,g
b,d,f
a
a) b) c)

Ecological indicators of grazing effects in cork oak woodlands: an integrated approach
Ecologia e Gestão Ambiental 2012/2013 29
1Table 1 – p-values for the Mann-Whitney’s U test performed for the boxplots in Fig. 4.3.
CLe/CLg CLe/HRAe CLe/HRAg CLg/HRAe CLg/HRAg HRAe/HRAg
Bushes 0,002316 0,027276 0,452913 0,000412 0,008072 0,001086
Semi-Rosettes 0.008072 0,723932 0,000792 0,011849 0,289316 0,001086
Small Tunnelers 0,000156 0,669291 0,005366 0,000012 0,027887 0,000597
The second group comprised the majority of the indicators tested (see Fig. 4.4).
Mesotrophic lichens decreased slightly but not significantly with grazing in HRA, but
significantly in CL. Most vascular plants and soil cover indicators were also found in
this group: frequency of dead leaves, rocks, bare soil, erect leafy. Coprophagous beetles
were represented though big tunnelers and small dwellers, with both showing
significative differences in CL, but not in HRA. Tree leaves carbon/nitrogen ratio and
δ15N also showed a statistical trend but only for one study area (HRA).
a)

Ecological indicators of grazing effects in cork oak woodlands: an integrated approach
Ecologia e Gestão Ambiental 2012/2013 30
Boxplot - Rocks or gravel
Median 25%-75% Non-Outlier Range Outliers Extremes
CLe CLg HRAe HRAg
Study area
-1
0
1
2
3
4
5
6
7
8
R a
a,c,d
a,c,e
b,d,f
Boxplot - Bare soil
Median
25%-75%
Non-Outlier Range
Outliers
Extremes
CLe CLg HRAe HRAg
Study area
-5
0
5
10
15
20
25
30
35
40
45
BS
a
b,c,e
a,d,g
a,f,g
Boxplot - Erect-leafy
Median 25%-75% Non-Outlier Range Outliers Extremes
CLe CLg HRAe HRAg
Study area
0
10
20
30
40
50
60
70
80
E
a
a,c,d
b,e,f
a,c,g
d)
b)
c)
e)

Ecological indicators of grazing effects in cork oak woodlands: an integrated approach
Ecologia e Gestão Ambiental 2012/2013 31
Fig. 4.4 - Boxplots for the frequency of mesotrophic lichens (a), dead tree leaves (b), rocks or gravel
(c), bare soil (d), erect leafy (e), big tunnelers per trap (f), small dwellers per trap (g), C:N
ratio (h), and δ15N (i) . Different letters indicate statistically significant difference (Mann-
Whitney’s U test; p values in Table A, Appendix III). “e” is for grazing excluded, “g” for
grazed..
In the third group, we could find the indicators frequency of oligo- and nitrophilic
lichens, vegetation litter, moss cover and soil lichens (see Fig. 4.5). The isotopic
discrimination of 13C and number of big dwellers per trap were also included in this
group.
Boxplot - Big tunnelers per trap
Median 25%-75% Non-Outlier Range Outliers Extremes
CLe CLg HRAe HRAg
Study area
-2
0
2
4
6
8
10
12
14n
a
b,c,e
a,d,g a,f,g
Boxplot - Small dwellers per trap
Median 25%-75% Non-Outlier Range Outliers Extremes
CLe CLg HRAe HRAg
Study area
-2
0
2
4
6
8
10
12
14
16
18
20
22
24
26
n
a
b,c,e
a,d,g
a,f,g
f) g)
h) i)

Ecological indicators of grazing effects in cork oak woodlands: an integrated approach
Ecologia e Gestão Ambiental 2012/2013 32
Boxplot - Vegetation litter
Median
25%-75%
Non-Outlier Range
Outliers
Extremes
CLe CLg HRAe HRAg
Study area
-5
0
5
10
15
20
25
30
35
40
45
PL
a
a,b,d
a,c,f
a,e,f Boxplot - Moss cover
Median
25%-75%
Non-Outlier Range
Outliers
Extremes
CLe CLg HRAe HRAg
Study area
-2
0
2
4
6
8
10
12
14
16
18
M
a a,c,d
b,c,e
a,d,f
Boxplot - Soil lichens
Median
25%-75%
Non-Outlier Range
Outliers
Extremes
CLe CLg HRAe HRAg
Study area
-1
0
1
2
3
4
5
6
7
L
a
a
a
a
Boxplot - d13C
Median
25%-75%
Non-Outlier Range
Outliers
Extremes
CLe CLg HRAe HRAg
Study area
-33
-32
-31
-30
-29
-28
-27
-26
-25
d13C
a
b,d,ea,d,f
c,e,g
a) b)
c) d)
e)
f)

Ecological indicators of grazing effects in cork oak woodlands: an integrated approach
Ecologia e Gestão Ambiental 2012/2013 33
Fig. 4.5 - Boxplots for the frequency of oligotrophic (a) and nitrophilic lichens (b), vegetation litter (c),
moss cover (d), soil cover (e), δ13 (f), and number of big dwellers per trap (g). Different
letters indicate statistically significant difference (Mann-Whitney’s U test; p values in Table
B, Appendix III). “e” is for grazing excluded, “g” for grazed.
4.3 Index of Ecological Integrity
The proposed IEI revealed a good separation of grazed and grazing-excluded
treatments, consistent for both study areas (Fig. 4.6-a). When accounting for the effect
of several covariables this trend was maintained (Fig. 4.6-b).
Boxplot - Big dwellers per trap
Median
25%-75%
Non-Outlier Range
Outliers
Extremes
CLe CLg HRAe HRAg
Study area
-2
0
2
4
6
8
10
12
n
a
a,d,f
b,e,h c,g,h
g)
a)

Ecological indicators of grazing effects in cork oak woodlands: an integrated approach
Ecologia e Gestão Ambiental 2012/2013 34
Fig. 4.6 – (a): Two first axis of an RDA with the selected indicators: semi-Rosettes, shrubs and small
tunnelers, considering study areas and treatment as environmental variables. 45.0% and
2.6% variance was explained by the first and second axis, respectively. (b): partial RDA
considering as covariables tree density, annual potential solar radiation and slope. “e” is
for grazing excluded, “g” for grazed. 40.4% and 1.9% variance was explained by the first
and second axis, respectively. (The lines of the arrows of the species were removed for
graphical clarity)
The lowest values of the IEI index were associated to more impact of grazing. There
were statistically significant differences observed among the grazed and the grazing-
excluded treatment, for both study areas. Comparing all sampling sites, taking into
consideration the impact of grazing sampling sites were ordered as HRAg, CLg, CLe,
HRAe (from higher to lower impact) (Fig. 4.7).
b)

Ecological indicators of grazing effects in cork oak woodlands: an integrated approach
Ecologia e Gestão Ambiental 2012/2013 35
Boxplot - Index for Ecologial Integrity
Median
25%-75%
Non-Outlier Range
Outliers
Extremes
Cle CLg HRAe HRAg
Study area
-0,1
0,0
0,1
0,2
0,3
0,4
0,5
0,6
0,7
0,8
Index
a
b,d,f
a,e,g
c,f,h
Fig. 4.7 – Boxplot of the Index of Ecological Integrity for sampling sites. The lowest values were
associated to more impact of grazing, the letters indicate statistically significant difference
(Man-Whitney’s U test; p-values in Table 2, below). “e” is for grazing excluded, “g” for
grazed.
2Table 2 - p-values for the Mann-Whitney’s U test performed for the boxplot in Fig. 4.7.
CLe/CLg CLe/HRAe CLe/HRAg CLg/HRAe CLg/HRAg HRAe/HRAg
Index 0,008072 0,157705 0,002680 0,000412 0,185327 0,000412
5. Discussion
This study provided an innovative perspective on the development of ecological
indicators for the effect of grazing on cork-oak woodlands, by combining several
indicators from different ecological groups and by calculating an index for measuring
the impact of grazing at the ecosystem level.
Although this multi-taxa approach is rather uncommon in literature, it provided not only
a measure of the impact of grazing on species but also the opportunity of understanding
the impacts of grazing on ecosystem functioning, e.g. on the nitrogen cycle. Due to its

Ecological indicators of grazing effects in cork oak woodlands: an integrated approach
Ecologia e Gestão Ambiental 2012/2013 36
integrative perspective the use of the Index of Ecological Integrity, rather than
indicating a simple pressure (e.g. reflecting the amount of cattle), it reflects the effects
of grazing pressure on the ecosystem.
This work was possible by selecting the most responsive indicators for the effects of
grazing, looking at communities’ organization, functional groups and leaves isotopic
composition, and using them to calculate an integrative index.
5.1. Selection of variables as indicators for the effect of grazing
5.1.1 Communities analysis
In the light of the ordination analyses of species, unexpectedly there was a separation of
the study areas but not of treatment (grazing regime). This means that the composition
of the communities of lichens and coprophagous beetles are very different between
study areas and their variation is probably more indicative of site-specific dynamics or
of the prevailing influence of macroclimate conditions. Therefore, species ordinations
should not be used for the purpose of indication of grazing impact.
5.1.2 Functional groups and isotopic composition
Looking at functional groups and tree leaves isotopic composition allowed the selection
of the most responsive indicators: frequency of shrubs, frequency of semi-rosettes and
abundance of coprophagous beetles. These were included in the “first group” of
indicators (variables which separate treatments in both study areas) (Fig. 4.3). In general
this result is supported by other studies on the effect of grazing on these groups (Braga
et al., 2013; De Bello et al., 2005; Peco et al., 2012). The remaining indicators were

Ecological indicators of grazing effects in cork oak woodlands: an integrated approach
Ecologia e Gestão Ambiental 2012/2013 37
included in a second group (variables which separate treatments in one study area) or
third (variables which did not separate treatments in none of the study area) group. All
indicators are further discussed below.
Lichens
It is known that lichens respond to grazing intensity (Pinho et al. 2012), but their use as
indicators in this case was not possible due to a non-significant effect of grazing. The
mesotrophic functional group show a higher sensitivity than the oligotrophic with
significant differences in CL suggesting that the non-grazed sampling sites may be
showing signs of recovery. Regarding the oligotrophic functional groups, their low
abundance independently of treatment at both study areas suggests that this functional
group could be affected by past or nearby grazing, even at the control sites. In fact
nitrophilic lichens had similar values in grazed and grazing-excluded sites in CL. This
could also be reflecting the influence of atmospheric ammonia emitted by cattle to the
nearby non-grazed areas. In fact, grazed and control sites are located at less than 500 m
from each other, a distance that can be overcome by atmospheric ammonia (Sutton et al.
1998). However in HRA, the nitrophilic are more frequent in the grazed plots, likely
reflecting the higher availability of nutrients, especially atmospheric ammonia, which is
known to favour nitrophilic species (Pinho et al., 2011).
Vascular plants and soil cover
The results of shrubs and semi-rosettes are probably related to the food preferences,
once animals feed on shrubs (Öckinger et al., 2006), while semi-rosettes, being smaller

Ecological indicators of grazing effects in cork oak woodlands: an integrated approach
Ecologia e Gestão Ambiental 2012/2013 38
and more horizontally shaped, are less grazed than erect plants, which are much easier
to graze (Kahmen and Poschlod, 2004).
Among the tested indicators, we also found a large number that provided a weaker but
meaningful response to grazing (the “second group”). It should be noted that the grazing
intensities were low in both study areas, and perhaps low enough to not trigger all the
common effects of grazing. Nevertheless, the elements in this group could be used to
understand the underlying dynamics altered by grazing.
The trends of dead leaves between treatments were possibly related with vegetation
structure, because shrubs and higher plants could block the sweeping of the leaves by
the wind.
Soil lichens showed a trend to decrease in the grazed plots, although no significant
differences between any study areas were registered. It is known that trampling plays a
significant role in the growth of soil lichens, which are considered a sign of lack of
disturbance (Rai et al., 2011). Here, they are likely attesting to the fact that the soil
under grazing exclusion is no longer stepped on.
The presence of rocks at ground surface level, which include small rocks and gravel,
varied in the same way on both study areas, albeit only in HRA the difference among
treatments was significant. Grazing impacts like plant cover removal or trampling may
explain the differences between treatments, as animals compact the more exposed soil
and erode it to an extent where rocks show up on the surface. The resulting interrill
erosion is correlated with the presence of rock and gravel at the soil surface (Gutierrez
et al., 1996). The more significant results in HRA could be the soil nature (schist and
greywacke), contrasting to the sandy nature of the soils in CL. Also the higher slope in
HRA can be contributing to the more significant results in HRA, with the slope

Ecological indicators of grazing effects in cork oak woodlands: an integrated approach
Ecologia e Gestão Ambiental 2012/2013 39
contributing to the speed the water gains on the surface, consequently exposing rocks
more frequently.
When comparing the weight of both livestock species in this study, as well as the soil
characteristics, it should not be surprising how much bare soil was found in the grazed
area of CL vs. the grazed area of HRA. This is valid when comparing the two study
areas, but also when the focus is on the treatment. Naturally, the difference in the
livestock behaviour and management will be reflected on a local scale, with the impact
of cattle being much more noticeable on CL (in which the difference between grazed
and grazing-excluded is higher) than on HRA (where sheep, much lighter, will not exert
such an obvious impact).
Erect leafy plants may be the first sign of recovery from grazing. The plant height had
been increasing for more time in HRA than in CL, which can help to understand the
bigger disparity, at treatment and study area levels.
Some of the tested indicators resulted in non-significant or non-coherent trends. Litter
and dead leaves showed an opposing trend in the two study areas. In CL, grazing-
excluded sites presented higher values than grazed one, which are near zero. On the
other hand, in HRA, more litter and dead leaves were found in the grazed areas. This
can be due to cattle consuming most of the plants in CL and the fact that the grazing-
excluded sites have evolved to shrubland, with higher leaves production. In HRA, the
extensive sheep grazing is not enough to deplete the biomass in the same way than in
CL.
Moss only had any relevant presence in the grazing-exclusion areas of HRA. Together
with grazing intensity, the higher slopes could provide more shade and humidity
retention helping moss to establish and grow.

Ecological indicators of grazing effects in cork oak woodlands: an integrated approach
Ecologia e Gestão Ambiental 2012/2013 40
Coprophagous beetles
It is known that coprophagous beetles respond positively to grazing and are a vital part
of the ecosystem in dealing with dung (Hanski and Cambefort, 1991; Nichols et al.,
2008). The fact that statistical difference was only found for a sub-set of coprophagous
beetles could be due to the higher amount of small tunnelers, when compared to the
other tested functional groups of coprophagous beetles.
Number of big tunnelers per trap presented a significant difference in CL but not in
HRA. This could be related to the amount and spatial distribution of dung. In fact, there
is higher amount of dung in CL, where it is also more concentrated in space, because in
HRA sheep roam freely. It is known both that the tunnelers move large quantities of
earth during the nest construction process (Mittal, 1993) and that the larger species
build deeper tunnels and move larger quantities of earth. The process of bioturbation is
helpful to aerate the soil and to create a healthy environment for the development of soil
bacteria. Coprophagous beetles have good dispersion ability. For instance, in a rain
forest, Peck and Forsyth (1982) recovered some Onthophagus at distances of 180 to
700m after two days. That search is more complicated on a location having a stronger
heterogeneity of resources, which is the case in HRA. Moreover, in HRA the herds are
more mobile and produce lesser quantities of dung. Thus, it should be harder for the
insects to immediately find and feed on them.
Isotopic and elemental analysis
Carbon/Nitrogen ratios decrease in the grazed sites on both study areas, although only
significantly in HRA (see Fig. 4.4-h). This increase could reflect the higher availability
of nitrogen in the grazed areas, due to more nitrogen input by dung and urine

Ecological indicators of grazing effects in cork oak woodlands: an integrated approach
Ecologia e Gestão Ambiental 2012/2013 41
deposition. Higher Carbon/Nitrogen can also denote a slower rate of decomposition in
the grazing-excluded sampling sites (Frank et al., 1995). Both δ13C and δ15N did not
show a clear response to grazing, showing inconsistent trends. This should indicate that
the source of variation is beyond the effect of grazing and is rather explained by other
environmental factors.
Leaf δ13C values reflect the variations and relationship among plant carbon and water
relations and can act as integrators of whole plant function (Dawson et al., 2002), being
an useful indicator for the intrinsic water-use efficiency (WUE) (Dawson et al., 2002;
Farquhar and Richards, 1984; Henderson et al., 1998). Among the factors that could
influence δ13C we can find soil moisture (Ehleringer and Cooper, 1988; Ehleringer,
1993; Korol et al., 1999; Stewart et al., 1995), atmospheric humidity (Comstock and
Ehleringer, 1992; Madhavan et al., 1991; Panek and Waring, 1997) and temperature
(Panek and Waring, 1997; Welker et al., 1993) and nitrogen availability (Condon et al.,
1992; Guehl et al., 1995; Högberg et al., 1993). The results suggest that trees in control
sites in CL and HRA are in similar conditions, and become more stress in HRA but less
stressed in CL. The lack of agreement suggests that this result is not related to the
effects of grazing.
As for δ15N, both urine (wet) and dung (dry) deposition are related to an increase in its
values, as demonstrated by Skinner and colleagues (2005). Elevated foliar δ15N can
reflect an increase in soil N availability (Craine et al., 2009). The lack of a statistically
significant difference in CL is probably related to a shorter exclusion period than in
HRA, where, as stated in Methods, the plots have not been grazed for at least 20 years.
It can also be related to the deposition of nitrogen incoming from the nearby grazed
areas. Additionally, the amount of dung excreted by cattle is larger and more
concentrated than sheep’s. So, its permanence in the soil will be more prolonged. The

Ecological indicators of grazing effects in cork oak woodlands: an integrated approach
Ecologia e Gestão Ambiental 2012/2013 42
livestock management regime may have an influence, once the same sampling sites are
visited every year by the sheep in HRA, while some years after the cattle stays on the
same plot, that area is excluded from grazing to recover. In addition, sandy soils have
lower contents of organic matter and total N than soils with heavier textures (Haynes,
1986). Nitrogen content (%) did not show a statistically significant difference in CL,
although it did for HRA. This may be explained by the fact that a rotation system of
grazing and exclusion that may not have given long enough to recover from the grazing
impacts, in the case of the grazing-restricted plots. The difference between the two
study areas / livestock species could be suppressed by the short period of recovery,
since nitrogen stays on the soil for some time and the plot was only closed in 2008.
5.2 Index of Ecological Integrity
The integration of the results of the best indicators originates an index showed a
gradient that classified study areas from the most to the least impacted. This can assist
in future prioritization of restoration efforts, in case of limitation of resources. In
crescent order, starting from the least impacted, there was HRAe. The justification for
this lies in the fact that this space is lacking any disturbance for many years, and among
these sampling sites, the sheep have not been present for more than 20 years, as referred
above. Following HRAe, it was CLe, which is excluded to cattle for c. 5 years (since
2008). Some indicators show (for instance, δ15N and nitrophilic lichens), however, that
the history of this study area may still be playing a relevant role.
Finally, the grazed sampling sites in CL are less impacted than the ones in HRA.
Although the impact by cattle should be higher than by sheep, it should be considered
how the management regimes are different in these two study areas. CL has rotation

Ecological indicators of grazing effects in cork oak woodlands: an integrated approach
Ecologia e Gestão Ambiental 2012/2013 43
system that keeps the cattle in the same place for some time, but it removes it
afterwards, for land recovery. This removal does not happen in HRA: sheep keep
grazing the same space year after year, for many years now, and are only moved after it
appears the resources on that area are too scarce for them to feed properly in the
remainder of the season. This sustained impact on the land is, therefore, visible through
this analysis, bringing to light a less obvious, but relevant aspect. Besides the livestock
species, the climate is also different, having its effects. Being drier and having more
temperature extremes, any stress put on HRA has an increased impact.
In conclusion, an evaluation of both the livestock species and the location of the
grasslands are important to balance and mitigate the impacts, so that a system may
remain stable. As seen here, this is not always easily deduced by common sense, and a
careful analysis, using this Index of Ecological Integrity is advisable.
5.3 Ecosystem functioning
Grazing impacts
For the grazed sampling sites, there is an evident change in quantity and quality of
resources available for plant decomposers, as other research also points out (Castro,
2008; Wardle and Bardgett, 2004). The shrub results are another measurement
supporting that this phenomenon is taking place.
The elimination of soil cover tends to occur with trampling and consumption by
livestock. However, McIvor and others (1995) demonstrated that even a low soil cover
like 30-40% can reduce runoff and soil loss to minimal levels. This source of impact is,
then, a function of intensity, rather than inevitable. Molinillo and colleagues (1997)

Ecological indicators of grazing effects in cork oak woodlands: an integrated approach
Ecologia e Gestão Ambiental 2012/2013 44
suggests that, to minimize grazing effects, patches of dense shrub cover and grazing
meadows is the best method for pasture conservation and forage production. In this
study, this management option is accomplished in both study areas, with more
patchiness (i.e. smaller patches) in HRA, which is adequate considering the nature of
impact of sheep, and the need of cattle to have more forage resources and space.
Trampling may cause soil compaction (Gutierrez et al., 1996), vascular plant
community alteration (Belnap, 1998) and exposure of more erodible soil (Herrick et al.,
2009). Despite being one of the worst impacts, it also stands as one of the biggest
differences among the two livestock species, once trampling by sheep does not appear
to cause a great impact on grasslands (Kahmen, 2004), something that is supported by
this study as well.
Animal waste has also its effects on the soil and atmosphere. Dung and urine generate
Nitrogen imbalances. Dung beetles, one of the groups of this study, may help in
ameliorating the impacts and perhaps to take advantage of them, if we consider how
distributed dung can act as a fertilizer in the soil by increasing the available labile N for
uptake by plants through mineralization (Kazuhira et al., 1991); but also the increase in
species richness of nitrophilic lichens as a consequence of an increase of atmospheric
ammonia production (Ruisi et al., 2005).
Integration of the N-cycle and overall ecosystem state
Of all the activities or alternatives of exploration of the Montado, grazing may be the
most impacting. Therefore, accounting it as the most defining factor of ecosystem
health is adequate. This means the evaluation of the major impacts of grazing would be
a great surrogate for the overall ecosystem state.

Ecological indicators of grazing effects in cork oak woodlands: an integrated approach
Ecologia e Gestão Ambiental 2012/2013 45
The main concern should now be if the set of indicators that was analysed here is
actually enough to capture the variability of all areas with sylvi-pastoral use,
independently of macroclimate, tree species and the intensity of grazing. The four
groups can represent different ways to look at the N cycle, isolating a small part of it
that reflects the function of those groups in breaking or establishing a balance in the
environment in which they inhabit. Lichens reflect the atmospheric nitrogen dynamic.
Leaves N composition and δ15N ratios can be interpreted in order to evaluate the
conditions of the soil from which they get the N, and the condition of the air, in which
different concentrations of NH3 reveal different uses or impacts on the atmosphere.
Coprophagous beetles also play an important role by dispersing or removing dung
turning dung from source of disturbance of the ecosystem (since its accumulation is
problematic), to a well dispersed soil fertilizer. Thus, these indicators picture distinct
compartments of the nitrogen cycle, and because this cycle is important to soil fertility,
resistance to erosion, provision of forage, cork oaks health, air purity, general
biodiversity and much more. This makes it undeniable to attribute core value to an
assessment of the overall ecosystem state.
Of course there are many other good indicators. Some for factors also addressed here,
others for uncovered issues. However, this study provides proof on the width of
spectrum of variability, while still being very easy and cheap to perform. Moreover,
most people could be equipped with the necessary knowledge to perform the
methodologies effectively and efficiently. It is naturally a good decision to implement
the assessment of these groups and integrate them in a system to be put to practice and
demanded regularly by managers and land owners.

Ecological indicators of grazing effects in cork oak woodlands: an integrated approach
Ecologia e Gestão Ambiental 2012/2013 46
5.4 Applications of these indicators and methodologies
5.4.1 Easiness of use
The fieldwork of this study was relatively fast and inexpensive. This should mean that
the logistics is aligned with the best interests in the application of biological indicators.
Over the course of one year, it was possible to sample four different groups on two
different locations. Considering the applied protocol, even more groups could be done,
if the scope of other projects so required. Additionally, once these procedures are
related to trends and yearly variations, their connection to consistent monitoring
demands the reutilization of all the materials, which implies the growing cost-
efficiency, as time goes by. Over the course of this paper, it is discussed how the three
main factors hampering the application of ecological indicators referred by Dale and
Beyeler (2001) were avoided. They are (a) Monitoring programs often depend on a
small number of indicators and fail to consider the full complexity of the ecosystem. (b)
Choice of ecological indicators is confounded in management programs that have vague
long-term goals and objectives. (c) Management and monitoring programs often lack
scientific rigor because of their failure to use a defined protocol for identifying
ecological indicators. For (a), it is unarguable that the broad selection of indicators from
different taxonomical groups present in this work are more than enough to counter this
risk. To guarantee that goals and objectives of the current project (and others that may
be based on this one) are not vague (b), a lot of context is provided from several points-
of-view, ensuring that there is an adaptation of the monitoring to the specific program
that uses these indicators. As for the last point (c), again, the research and analysis
provided here may constitute solid guidance for future works, in order to stop this from
becoming a reality; although it was not the main focus of this project, it is possible to

Ecological indicators of grazing effects in cork oak woodlands: an integrated approach
Ecologia e Gestão Ambiental 2012/2013 47
understand through the successes and failures in the adequacy of each indicator, how the
process of sampling should occur, or be modified in relation to the one applied here.
Further analysis is always presented throughout the paper to avoid a situation like this.
5.4.2 Application at a Small scale - Human impacts management (property managers)
As seen before, it can be very important to consider the abiotic factors of the landscape
to know how it will react to grazing by each livestock species. So the first advice for
Montado management, regarding the pastures, is to study them, ideally the tree leaves
isotopic composition, in order to understand the state of the ecosystem, prior to any
major decision. Additionally, lichens may help in understanding the history of
disturbance of the area, once they reflect change over time. Lichens may be even more
revealing in situations where the land may suffer the effects of atmospheric pollution,
near dirt roads with some traffic or other sources of dust, and in cases in which there
was grazing before (for instance, by a previous land owner). Assessing the dung beetle
populations may be interesting, just to test the added resilience that will provide more
flexibility and mitigation of impacts if there is beetle biodiversity to accommodate the
increase in pressure that grazing will cause. This can be seen as an evaluation on
something that may tranquilize the property owners or land managers, once it decreases
the risk of the investment they are making. Each land has its own plant community.
Knowing that community can lead the manager to predict many things, like the forage
resources the livestock will have, or how the community (and with it, the soil) will
respond to grazing, once the issue is studied and in most cases can be standard.
So, why is it also relevant to keep the regularity and scope of the monitoring procedure,
as was here presented? Investment on Montados can be both expensive and profitable.

Ecological indicators of grazing effects in cork oak woodlands: an integrated approach
Ecologia e Gestão Ambiental 2012/2013 48
Any tendencies evolve slowly and, if carefully studied, can be predicted in time. A new
cork oak tree can take decades to be ready to be harvested and it has to be healthy all
along to produce good quality cork. These two major issues make a close monitoring of
the ecosystem a must, not an option. Protecting the land and its ability to be explored, to
be economically viable, to help feeding people in a very sustainable and healthy way
and to maintain other great values like biodiversity, aesthetics and the leisure activities
it may provide demands this degree of attention.
5.4.3 Large scale - Decision-makers and public interest
Research conducted may provide decision-makers and the general public with new
sources of scientifically-based and easily usable information to support land
management decisions. Through using the proper biological groups and statistical
analysis, governmental or non-governmental organizations can inform the citizens of
the measures and results of the strategies and policies being applied.
Ecological indicators are a relevant component of the larger set of environmental
indicators used to understand man-related changes imposed to ecosystems. Ecological
indicators are however not the only tools. They are now being coupled with social
response indicators to offer a combined view of the transformation of landscapes. In
fact, it is possible to include the indicators used in this work to broader, larger-scale on-
going initiatives (e.g. OECD, USEPA, LTER). It is by understanding how to scale-up
the use of ecological indicators that the ecological theory may be further developed.
Scaling-up can offer support for increasing ecological awareness and understanding of
the general public.
Ecological indicators of grazing effects in cork oak woodlands: an integrated approach
Ecologia e Gestão Ambiental 2012/2013 49
As mentioned, the current project took place in two LTER-Montado sites, and intends to
be a contribution to help boosting the participation of Portugal in LTER-Europe large
network of countries and professionals, working together to gather data at very large
scales. The potential for application of the studied indicators of grazing effects may help
to understand the major trends in a large scale and over a long period of time. That is
one of the most important missions of LTER networks. It is, therefore, of the utmost
importance that strong scientifically-based knowledge is developed to understand land
use trends and impacts, and support decisions on land management.
6. Conclusions
There are three main conclusions standing out from this paper. The first is the
identification of a set of indicators useful to assess grazing effects in Mediterranean
areas. The second refers to the analytical approach, that showed that boxplots and
Mann-Whitney U tests are adequate tools to ilustrate grazing effects in different areas,
and integrative indexes (such as the proposed Index of Ecological Integrity) are useful
for a general understanding of the system condition. The third conclusion, is the
potential of application of such approach both at small and large scales.

Ecological indicators of grazing effects in cork oak woodlands: an integrated approach
Ecologia e Gestão Ambiental 2012/2013 50
7. References
Asta, J., Erhardt, W., Ferretti, M., Fornasier, F., Kirschbaum, U., Nimis, P., Purvis, O.,
Pirintsos, S., Scheidegger, C., Van Haluwyn, C., Wirth, V., 2002. Mapping lichen
diversity as an indicator of environmental quality. Monit. with Lichens - Monit.
Lichens 273–279.
Bai, Y., Wu, J., Clark, C.M., Pan, Q., Zhang, L., Chen, S., Wang, Q., Han, X., 2012.
Grazing alters ecosystem functioning and C:N:P stoichiometry of grasslands along
a regional precipitation gradient. J. Appl. Ecol. 49, 1204–1215.
Baraud, J., 1992. Coléoptères Scarabaeoidea d’Europe. Fédération française des
Sociétés de Sciences naturelles.
Belnap, J., 1998. Choosing Indicators of Natural Resource Condition: A Case Study in
Arches National Park, Utah, USA. Environ. Manage. 22, 635–642 ST – Choosing
Indicators of Natural Resou.
Bernáldez, F.G., 1991. Ecological consequences of the abandonment of traditional land
use systems in central Spain. Options Méditerranéennes 15, 23–29.
Braga, R.F., Korasaki, V., Andresen, E., Louzada, J., 2013. Dung beetle community and
functions along a habitat-disturbance gradient in the Amazon: a rapid assessment
of ecological functions associated to biodiversity. PLoS One 8, e57786.
Cairns, J. 1977. Quantification of biological integrity. In The Integrity of Water, eds R.
K. Ballentine and L. J. Guarraia. US Environmental Protection Agency, Office of
Water and Hazardous Materials, US Government Printing Office, Washington,
DC, pp. 171-198.
CANOCO for Windows,version 4.5. 2002. Microcomputer Power, USA, Scientia,
Hungary .
Castro, H., 2008. Effects of Land Use Change on Plant Composition and Ecosystem
Functioning in an Extensive Agro-pastoral System: Plant Functional Traits and
Ecosystem Processes. Masters Thesis Universidade de Coimbra.
Chapin III, F.S., Matson, P., Pamela, A., 2002. Principles of terrestrial ecosystem
ecology. Springer-Verlag, New York.
Comissão Nacional do Ambiente, 1983. Atlas do Ambiente. Lisboa. Direcção-Geral do
Ambiente, Ministério do Ambiente e dos Recursos Naturais
Comstock, J.P., Ehleringer, J.R., 1992. Correlating genetic variation in carbon isotopic
composition with complex climatic gradients. Proc. Natl. Acad. Sci. 89, 7747–
7751.

Ecological indicators of grazing effects in cork oak woodlands: an integrated approach
Ecologia e Gestão Ambiental 2012/2013 51
Condon, A.G., Richards, R.A., Farquhar, G.D., 1992. The effect of variation in soil
water availability, vapour pressure deficit and nitrogen nutrition on carbon isotope
discrimination in wheat. Crop Pasture Sci. 43, 935–947.
Cook, S.E.K., 1976. Quest for an index of community structure sensitive to water
pollution. Environ. Pollut. 11, 269–288.
Craine, J.M., Elmore, A.J., Aidar, M.P.M., Bustamante, M., Dawson, T.E., Hobbie,
E.A., Kahmen, A., Mack, M.C., McLauchlan, K.K., Michelsen, A., 2009. Global
patterns of foliar nitrogen isotopes and their relationships with climate,
mycorrhizal fungi, foliar nutrient concentrations, and nitrogen availability. New
Phytol. 183, 980–992.
Dale, V.H., Beyeler, S.C., 2001. Challenges in the development and use of ecological
indicators. Ecol. Indic. 1, 3–10 ST – Challenges in the development and use o.
Dawson, T.E., Mambelli, S., Plamboeck, A.H., Templer, P.H., Tu, K.P., 2002. Stable
Isotopes in Plant Ecology. Annu. Rev. Ecol. Syst. 33, 507–559.
De Bello, F., Lepš, J., Sebastià, M.-T., 2005. Predictive value of plant traits to grazing
along a climatic gradient in the Mediterranean. J. Appl. Ecol. 42, 824–833.
Dellacasa, G., Dellacasa, M., 2006. Fauna d’Italia XLI : Coleoptera Aphodiidae
Aphodiinae. Calderini, pp 484.
Ehleringer, J.R., 1993. Variation in leaf carbon isotope discrimination in Encelia
farinosa: implications for growth, competition, and drought survival. Oecologia 95,
340–346.
Ehleringer, J.R., Cooper, T.A., 1988. Correlations between carbon isotope ratio and
microhabitat in desert plants. Oecologia 76, 562–566.
Environmental Systems Research Institute Inc.: ESRI, 2010. Redlands, CA, USA
FAO (Food and Agriculture Organization), 2002. World agriculture: towards
2015/2030: summary report. Food and Agriculture Organization of the United
Nations.
Farquhar, G.D., Richards, R.A., 1984. Isotopic composition of plant carbon correlates
with water-use efficiency of wheat genotypes. Funct. Plant Biol. 11, 539–552.
Frank, A.B., Tanaka, D.L., Hofmann, L., Follett, R.F., 1995. Soil carbon and nitrogen of
Northern Great Plains grasslands as influenced by long-term grazing. J. Range
Manag. 470–474.
Garnier, E., Lavorel, S., Ansquer, P., Castro, H., Cruz, P., Dolezal, J., Eriksson, O.,
Fortunel, C., Freitas, H., Golodets, C., Grigulis, K., Jouany, C., Kazakou, E., Kigel,
J., Kleyer, M., Lehsten, V., Leps, J., Meier, T., Pakeman, R., Papadimitriou, M.,
Papanastasis, V.P., Quested, H., Quétier, F., Robson, M., Roumet, C., Rusch, G.,
Skarpe, C., Sternberg, M., Theau, J.-P., Thébault, A., Vile, D., Zarovali, M.P.,

Ecological indicators of grazing effects in cork oak woodlands: an integrated approach
Ecologia e Gestão Ambiental 2012/2013 52
2007. Assessing the effects of land-use change on plant traits, communities and
ecosystem functioning in grasslands: a standardized methodology and lessons from
an application to 11 European sites. Ann. Bot. 99, 967–85.
Guehl, J., Fort, C., Ferhi, A., 1995. Differential response of leaf conductance, carbon
isotope discrimination and water‐use efficiency to nitrogen deficiency in maritime
pine and pedunculate oak plants. New Phytol. 131, 149–157.
Gutierrez, J., Hernandez, I.I., Narro, A.A., 1996. Runoff and interrill erosion as affected
by grass cover in a semi-arid rangeland of northern Mexico 287–295.
Hammond, A., Adriaanse, A., Rodenburg, E., Bryant, D., Woodward, R., 1995.
Environmental indicators: A systematic approach to measuring and reporting on
environmental policy performance in the context of sustainable development.
World Resources Institute.
Hanski, I., Cambefort, Y., 1991. Dung beetle ecology. Princeton University Press.
Harwell, M.A., Myers, V., Young, T., Bartuska, A., Gassman, N., Gentile, J.H.,
Harwell, C.C., Appelbaum, S., Barko, J., Causey, B., Johnson, C., McLean, A.,
Smola, R., Templet, P., Tosini, S., 1999. A framework for an ecosystem integrity
report card. Bioscience 49, 543–556.
Haskell, B. D., Norton, B. G., Costanza, R. 1992. Introduction: what is ecosystem
health and why should we worry about it? In Ecosystem Health, eds R. Constanza,
B. G. Norton & B. D. Haskell. Island Press, Washington, DC, pp. 3-20.
Haynes, R.J., 1986. The Decomposition Process: Mineralization, Immobilization,
Humus Formation, and Degradation, in: Haynes, R.J. (Ed.), Mineral Nitrogen in
the Plant-Soil System. Academic Press, London, pp. 52–126.
Henderson, S., Von Caemmerer, S., Farquhar, G.D., Wade, L., Hammer, G., 1998.
Correlation between carbon isotope discrimination and transpiration efficiency in
lines of the C4 species Sorghum bicolor in the glasshouse and the field. Funct.
Plant Biol. 25, 111–123.
Herrick, J.E., Zee, J.W. Van, Havstad, K.M., Burkett, L.M., Whitford, W.G., 2009.
Monitoring Manual for Grassland, Shrubland and Savanna Ecosystems (vol. II).
Högberg, P., Johannisson, C., Hällgren, J.-E., 1993. Studies of 13C in the foliage reveal
interactions between nutrients and water in forest fertilization experiments. Plant
Soil 152, 207–214.
Hortal, J., Lobo, J.M., 2005. An ED-based Protocol for Optimal Sampling of
Biodiversity. Biodivers. Conserv. 14, 2913–2947.
Kahmen, S., 2004. Plant trait responses to grassland management and succession. Diss.
Bot.

Ecological indicators of grazing effects in cork oak woodlands: an integrated approach
Ecologia e Gestão Ambiental 2012/2013 53
Kahmen, S., 2004. Plant trait responses to grassland management and succession.
Dissertationes Botanicae 382, pp. 123..
Kazuhira, Y., Hideaki, K., Hirofumi, T., 1991. Paracoprid dung beetles and gaseous loss
of nitrogen from cow dung. Soil Biol. Biochem. 23, 643–647.
Korol, R.L., Kirschbaum, M.U.F., Farquhar, G.D., Jeffreys, M., 1999. Effects of water
status and soil fertility on the C-isotope signature in Pinus radiata. Tree Physiol.
19, 551–562.
Leps, J., Smilauer, P., 2003. Multivariate Analysis of Ecological Data Using CANOCO.
Lobo, J.M., Martín-Piera, F., Veiga, C.M., 1988. Las trampas pitfall con cebo, sus
posibilidades en el estudio de las comunidades coprófagas de Scarabaeoidea (Col.).
I. Características determinantes de su capacidad de captura. Rev. d’Ecologie Biol.
du Sol 25, 77–100.
Madhavan, S., Treichel, I., O’LEARY, M.H., 1991. Effects of relative humidity on
carbon isotope fractionation in plants. Bot. Acta 104, 292–294.
McIvor, J.G., Williams, J., Gardener, C.J., 1995. Pasture management influences runoff
and soil movement in the semi-arid tropics. Anim. Prod. Sci. 35, 55–65.
Microsoft Excel, 2010. Microsoft Office Professional Edition.
Mittal, I.C., 1993. Natural manuring and soil conditioning by dung beetles. Trop. Ecol.
34, 150–159.
Molinillo, M., Lasanta, T., Garcia-Ruiz, J., 1997. Research: Managing Mountainous
Degraded Landscapes After Farmland Abandonment in the Central Spanish
Pyrenees. Environ. Manage. 21, 587–98.
Myers, N., Mittermeier, R.A., Mittermeier, C.G., Da Fonseca, G.A.B., Kent, J., 2000.
Biodiversity hotspots for conservation priorities. Nature 403, 853–858.
Munn, R.E., 1988. The design of integrated monitoring systems to provide early
indications of environmental/ecological changes. Environ. Monit. Assess. 11, 203–
217.
Nichols, E., Spector, S., Louzada, J., Larsen, T., Amezquita, S., Favila, M.E., 2008.
Ecological functions and ecosystem services provided by Scarabaeinae dung
beetles 1.
Niemeijer, D., 2002. Developing indicators for environmental policy: data-driven and
theory-driven approaches examined by example. Environ. Sci. Policy 5, 91–103.
Niemi, G.J., McDonald, M.E., 2004. Application of ecological indicators. Annu. Rev.
Ecol. Evol. Syst. 35, 89–23 ST – Application of ecological indicators.

Ecological indicators of grazing effects in cork oak woodlands: an integrated approach
Ecologia e Gestão Ambiental 2012/2013 54
Nimis, P., Martellos, S. 2008. ITALIC – The Information System on Italian Lichens v.
4.0. Department of Biology, University of Trieste, IN4.0 ⁄ 1. Trieste.
Noss, R.F., 1990. Indicators for Monitoring Biodiversity: A Hierarchical Approach.
Conserv. Biol. 4, 355–364 ST – Indicators for Monitoring Biodiversi.
NRC, 2000. Ecological Indicators for the Nation. National Academies Press.
Öckinger, E., Eriksson, A.K., Smith, H.G., 2006. Effects of grassland abandonment,
restoration and management on butterflies and vascular plants. Biol. Conserv. 133,
291–300.
Panek, J.A., Waring, R.H., 1997. Stable carbon isotopes as indicators of limitations to
forest growth imposed by climate stress. Ecol. Appl. 7, 854–863.
Peck, S.B., Forsyth, A., 1982. Composition, structure, and competitive behaviour in a
guild of Ecuadorian rain forest dung beetles (Coleoptera; Scarabaeidae). Can. J.
Zool. 60, 1624–1634.
Peco, B., Carmona, C.P., de Pablos, I., Azcárate, F.M., 2012. Effects of grazing
abandonment on functional and taxonomic diversity of Mediterranean grasslands.
Agric. Ecosyst. Environ. 152, 27–32.
Pereira, H.M.; Domingos, T.; Vicente, L.; Proença, V. (Eds.) 2009. Ecossistemas e
Bem-Estar Humano – Avaliação para Portugal do Millenium Ecosystem
Assessment. Escolar Editora.
Perevolotsky, A., Seligman, N.G., 1999. Role of Grazing in Mediterranean Rangeland
Ecosystems. Bioscience 48, 11.
Piera, F.M., Colón, J.I.L., 2000. Coleoptera scarabaeoidea I. Consejo Superior de
Investigaciones Científicas, CSIC. Museo Nacional de Ciencias Naturales.
Pinheiro, A.C., Ribeiro, N.A., Surovy, P., Ferreira, A.G., 2008. Economic implications
of different cork oak forest management systems. Int. J. Sustain. Soc. 1, 149–157.
Pinho, P., Bergamini, A., Carvalho, P., Branquinho, C., Stofer, S., Scheidegger, C.,
Maguas, C., 2012. Lichen functional groups as ecological indicators of the effects
of land-use in Mediterranean ecosystems. Ecological Indicators 15, 36-42.
Pinho, P., Dias, T., Cruz, C., Sim Tang, Y., Sutton, M. a., Martins-Loução, M.-A.,
Máguas, C., Branquinho, C., 2011. Using lichen functional diversity to assess the
effects of atmospheric ammonia in Mediterranean woodlands. J. Appl. Ecol. 48,
1107–1116.
Pinto-Correia, T., Ribeiro, N., Sá-Sousa, P., 2011. Introducing the montado, the cork
and holm oak agroforestry system of Southern Portugal. Agrofor. Syst. 82, 99–104.

Ecological indicators of grazing effects in cork oak woodlands: an integrated approach
Ecologia e Gestão Ambiental 2012/2013 55
Preston, T., Owens, N.J.P., 1983. Interfacing an automatic elemental analyser with an
isotope ratio mass sepectrometer: the potential for fully automated total nitrogen
and nitrogen-15 analysis. Analyst 108, 971–977.
Rai, H., Upreti, D.K., Gupta, R.K., 2011. Diversity and distribution of terricolous
lichens as indicator of habitat heterogeneity and grazing induced trampling in a
temperate-alpine shrub and meadow. Biodivers. Conserv. 21, 97–113.
Rapport, D. J., 1989. What constitute ecosystem health?, Persp. Biol.Med. 33, 120–132.
Rapport, D. J., 1992. Evolution of Indicators of Ecosystem Health, in: D. H. McKenzie,
D. E. Hyatt and V. J. McDonald (eds), Ecological Indicators. Elsevier Applied
Science, New York. p. 117–133.
Rapport, D. J., 1995a. Ecosystem health: Exploring the territory, Ecosyst. Health 1, 5–
13.
Rapport, D. J., 1995b. Ecosystem health: More than a metaphor?, Env. Values 4, 287–
309.
Ribeiro, N.A., Dias, S., Surový, P., Gonçalves, A.C., Ferreira, A.G., Oliveira, A.C.,
2004. The importance of crown cover on the sustainability of cork oak stands: a
simulation approach. Adv Geoecol 37, 275–286.
Ribeiro N.A., Surovy, P., Pinheiro, A. 2010. Adaptive manage-ment on sustainability of
cork oak woodlands. In: Manos B, Paparrizos K, Matsatsinis N, Papathanasiou J
(eds) Decision support systems in agriculture, food and the environment: trends,
applications and advances. IGI Global, Hershey, pp 437–449
Ruisi, S., Zucconi, L., Fornasier, F., Paoli, L., Frati, L., Loppi, S., 2005. Mapping
environmental effects of agriculture with epiphytic lichens. Isr. J. Plant Sci. 53,
115–124.
Sampson, R. N., Adams, D. L., Hamilton, S., Mealy, S. F., Steele, R. and Graft van de,
D. 1994. Lookout: assessing forest health in the inland west. Amer. Forests 100,
13-16.
Schaeffer, D.J., Herricks, E.E., Kerster, H.W., 1988. Ecosystem health: I. Measuring
ecosystem health. Environ. Manage. 12, 445–455.
Shackell, N. L., Freedman, B. and Staicer, C. 1993. National environmental monitoring:
a case study of the Atlantic Maritime Region. In Ecological Integrity and the
Manage- ment Of Ecosystems, eds S. Woodley, J. Kay & G. Francis. St Lucie
Press, Delray Beach, FL, pp. 131-153.
Sheehan, P.J., 1984. Effects on community and ecosystem structure and dynamics. In:
Sheehan, P.J., Miller, D.R., Butler, G.C., Boudreau, P. (Eds.), Effects of Pollutants
at the Ecosystem Level. Wiley, New York, pp. 51–99.

Ecological indicators of grazing effects in cork oak woodlands: an integrated approach
Ecologia e Gestão Ambiental 2012/2013 56
Skinner, R., Ineson, P., Hicks, W.K., Jones, H.E., Sleep, D., Leith, I.D., Sheppard, L.J.,
2005. Correlating the spatial distribution of atmospheric ammonia with δ15n
values at an ammonia release site. Water, Air, Soil Pollut. Focus 4, 219–228.
Sluiter, R., de Jong, S.M., 2007. Spatial patterns of Mediterranean land abandonment
and related land cover transitions. Landsc. Ecol. 22, 559–576.
Smeets, E., Weterings, R., 1999. Environmental indicators: Typology and overview.
EEA.
StatSoft, Inc., 2010. Statistica electronic manual. StatSoft, Inc., Tulsa, OK
Stewart, G.R., Turnbull, M.H., Schmidt, S., Erskine, P.D., 1995. 13C natural abundance
in plant communities along a rainfall gradient: a biological integrator of water
availability. Funct. Plant Biol. 22, 51–55.
Stofer, S., Bergamini, A., Aragon, G., Carvalho, P., Coppins, B.J., Davey, S., Dietrich,
M., Farkas, E., Karkkainen, K., Keller, C., Lokos, L., Lommi, S., Maguas, C.,
Mitchell, R., Pinho, P., Rico, V.J., Truscott, A.M., Wolseley, P.A., Watt, A.,
Scheidegger, C., 2006. Species richness of lichen functional groups in relation to
land use intensity. Lichenologist 38, 331-353.
Sutton, M.A., Milford, C., Dragosits, U., Place, C.J., Singles, R.J., Smith, R.I., Pitcairn,
C.E.R., Fowler, D., Hill, J., ApSimon, H.M., Ross, C., Hill, R., Jarvis, S.C., Pain,
B.F., Phillips, V.C., Harrison, R., Moss, D., Webb, J., Espenhahn, S.E., Lee, D.S.,
Hornung, M., Ullyett, J., Bull, K.R., Emmett, B.A., Lowe, J., Wyers, G.P., 1998.
Dispersion, deposition and impacts of atmospheric ammonia: quantifying local
budgets and spatial variability. Environmental Pollution 102, 349-361.
Tasser, E., Walde, J., Tappeiner, U., Teutsch, A., Noggler, W., 2007. Land-use changes
and natural reforestation in the Eastern Central Alps. Agric. Ecosyst. Environ. 118,
115–129.
Teixeira, R.F.M., Domingos, T., Costa, A.P.S.V., Oliveira, R., Farropas, L., Calouro, F.,
Barradas, A.M., Carneiro, J.P.B.G. 2011. Soil organic matter dynamics in
Portuguese natural and sown rainfed grasslands. Ecological Modelling 222, 993-
2001.
Tzanopoulos, J., Mitchley, J., Pantis, J.D., 2007. Vegetation dynamics in abandoned
crop fields on a Mediterranean island: development of succession model and
estimation of disturbance thresholds. Agric. Ecosyst. Environ. 120, 370–376.
Veiga, C.M., 1998. Aphodiinae Ibericos. Masters Thesis Universidade Complutense de
Madrid, Madrid.
Veiga, C.M., Lobo, J.M., Martin-Piera, F., 1989. Las trampas pitfall con cebo, sus
posibilidades en el estudio de las comunidades coprófagas de Scarabaeoidea (Col.).
II. Análisis de efectividad. Rev. Ecol. Biol. Sol 26, 91–109.

Ecological indicators of grazing effects in cork oak woodlands: an integrated approach
Ecologia e Gestão Ambiental 2012/2013 57
Verburg, P.H., van de Steeg, J., Veldkamp, a, Willemen, L., 2009. From land cover
change to land function dynamics: a major challenge to improve land
characterization. J. Environ. Manage. 90, 1327–35.
Vora, R.S., 1997. Developing programs to monitor ecosystem health and effectiveness
of management practices on Lakes States National Forests, USA. Biol. Conserv.
80, 289–302 ST – Developing programs to monitor ecosy.
Wardle, D.A., Bardgett, R.D., 2004. Human-induced changes in large herbivorous
mammal density: the consequences for decomposers. Front. Ecol. Environ. 2, 145–
153.
Welker, J.M., Wookey, P.A., Parsons, A.N., Press, M.C., Callaghan, T. V, Lee, J.A.,
1993. Leaf carbon isotope discrimination and vegetative responses of Dryas
octopetala to temperature and water manipulations in a High Arctic polar semi-
desert, Svalbard. Oecologia 95, 463–469.
Woodley, S. 1993. Monitoring and measuring ecosystem integrity in Canadian National
Parks. In Ecological Integ- rity and the Management of Ecosystems, eds S.
Woodley, J. Kay & G. Francis. St Lucie Press, Delray Beach, FL, pp. 155-176.
Young, T., Sanzone, S., 2002. A Framework for Assessing and Reporting on Ecological
Condition: An SAB Report, EPA Science Advisory Board. USEPA.
Zalasiewicz, J., Williams, M., Steffen, W., Crutzen, P., 2010. The New World of the
Anthropocene. Environmental Science & Technology 44, 2228-2231.

Ecological indicators of grazing effects in cork oak woodlands: an integrated approach
Ecologia e Gestão Ambiental 2012/2013 58

Ecological indicators of grazing effects in cork oak woodlands: an integrated approach
Ecologia e Gestão Ambiental 2012/2013 59

Ecological indicators of grazing effects in cork oak woodlands: an integrated approach
Ecologia e Gestão Ambiental 2012/2013 60
Perspectives and Outreach
In this thesis, an application of various categories of ecological indicators was tested in
two study areas submitted to different grazing regimes. This work went beyond the
traditional comparison of species richness and abundance. The process included the
need for the selection of relevant indicators, the practicalities of the sampling design and
adequate statistical testing. The significance of the results obtained at local scale raise
the question of how broad can be the application of the studied ecological indicators.
In order to fully understand this study potential, we can frame it in ongoing continent-
sized projects. The study-cases include the United States of America, though a report by
the EPA, and Europe, focusing on the OECD environmental strategy and a network of
cooperation between professionals of different countries (LTER).
In the United States, the USEPA Science Advisory Board has provided, in 2002, a good
example on how ecological indicators may be applied at different scales, ranging from
local to national. “A Framework for Assessing and Reporting on Ecological Condition”
(Young and Sanzone, 2002) has the primary purpose of designing a system to guide the
process of assessing the ecological condition at various spatial scales. It focuses on
which ecological attributes to measure and their aggregation as a tool to understand
ecological integrity. The current study shares some aspects with the items in the report.
For instance, the “Biotic Condition” attribute, indirectly, has a strong relationship with
“Landscape Condition”, by using “Landscape Composition” (one of its categories) to
explain the variations on some of its indicators, and with “Chemical and Physical
Characteristics (Water, Air, Soil, Sediment)” once foliar analysis partly reads the
dynamics of “Nutrient Concentrations”, and can be generalized to a larger spectrum of
the ecosystem. As a matter of fact, all the attributes are reflected on the selected
indicators, because they reflect the ecosystem variability.

Ecological indicators of grazing effects in cork oak woodlands: an integrated approach
Ecologia e Gestão Ambiental 2012/2013 61
In Europe, the report “Towards Sustainable Development”, OECD (2001) states that
their environmental indicators are: i) “regularly used in environmental performance
reviews”; ii) “a valuable way to monitor the integration of economic and environmental
decision making, to analyse environmental policies and to gauge the results”; and
further iii) “contribute to follow-up work on the OECD environmental strategy and to
broader objective of reporting on sustainable development”. This is one the best
examples on how indicators can serve a very large-scale purpose on informing about the
environment and to track progress on sectors like, for instance, agriculture, energy and
transport.
For the Long-Term Ecological Research (LTER) Network, ecological indicators to
monitor changes in the ecosystems structure and functioning are a key issue. The
network started in the USA in the 1980’s and was established in Europe in 1993. As of
2011, 22 European countries were involved in LTER Europe, Portugal being one of
those. ILTER (International LTER network) unites and coordinates both European and
American partners, and all the other adherent countries in the world.
LTER is transitioning to LTSER (Long-Term Socio-Ecological Research). Here, work
on human activities and impacts is of extreme relevance to explore human behaviour
and response to change for more ecologically sound alternatives. However, not
regarding social and economic aspects of new management strategies could be a
mistake that would compromise the effectiveness of any programme. To prevent that,
the most convincing way is showing proof of future tendencies and consequences.
Indicators are the ideal manner to bridge an understanding, by being an independent and
unbiased clarification of environmental changes.
Following up this study, it would be a good idea to design a comprehensive procedure
of the application of ecological indicators nationally, for instance for all the Portuguese

Ecological indicators of grazing effects in cork oak woodlands: an integrated approach
Ecologia e Gestão Ambiental 2012/2013 62
LTER sites, with a plan for sampling for the next 5-10 years. The limitations of the
presented work that would be ideally avoided in the new project would be a more
careful analysis of the environmental factors affecting each location and increasing the
sampling effort to make the distinction among treatments more clear. A higher number
of locations should also be sampled. It could also be interesting to subject the same or
another set of ecological indicators to another issue, like fires, restoration programmes,
land change (agriculture to abandoned land, and vice-versa).
Ecological indicators can, therefore be applied to many more situations, in order to
answer to the main environmental issues. Once there is basic knowledge of the groups
that are to be tested, it is possible to derive interesting conclusions about the trends of a
landscape.
References (Perspectives and Outreach)
Young, T., Sanzone, S. 2002. A Framework for Assessing and Reporting on Ecological
Condition: An SAB Report. United States Environmental Protection Agency.
OECD, 2001. OECD Environmental Indicators, Towards Sustainable Development.
(accessed 29.11.13). http://www.oecd.org/site/worldforum/33703867.pdf

Ecological indicators of grazing effects in cork oak woodlands: an integrated approach
Ecologia e Gestão Ambiental 2012/2013 63
Figure Index
Fig. 4.1 – Ordination diagram (CCA) with all lichen species and the study areas separated by treatment as
environmental variables. “e” is for grazing excluded, “g” for grazed. 44.5% and 12.9% variance was
explained by the first and second axis, respectively. ____________________________________ 26
Fig. 4.2 - Ordination diagram (RDA) with the coprophagous beetles species having a representation of
more than 20 captured individuals, divided by (C)losed and (O)pen setting, and the study areas
separated by treatment as environmental variables. “e” is for grazing excluded, “g” for grazed.
47.3% and 3.1% variance was explained by the first and second axis, respectively. (The lines of the
arrows of the species were removed for graphical clarity) ________________________________ 27
Fig. 4.3 - Boxplots for thefrequency of shrubs (a), semi-rosettes (b) and number of small tunnelers per
trap (c). Different letters indicate statistically significant difference (Mann-Whitney’s U test; p
values in Table 1). “e” is for grazing excluded, “g” for grazed. ____________________________ 28
Fig. 4.4 - Boxplots for the frequency of mesotrophic lichens (a), dead tree leaves (b), rocks or gravel (c),
bare soil (d), erect leafy (e), big tunnelers per trap (f), small dwellers per trap (g), C:N ratio (h), and
δ15N (i) . Different letters indicate statistically significant difference (Mann-Whitney’s U test; p
values in Table A, Appendix III). “e” is for grazing excluded, “g” for grazed.. ________________ 31
Fig. 4.5 - Boxplots for the frequency of oligotrophic (a) and nitrophilic lichens (b), vegetation litter (c),
moss cover (d), soil cover (e), δ13 (f), and number of big dwellers per trap (g). Different letters
indicate statistically significant difference (Mann-Whitney’s U test; p values in Table B, Appendix
III). “e” is for grazing excluded, “g” for grazed. _______________________________________ 33
Fig. 4.6 – (a): Two first axis of an RDA with the selected indicators: semi-Rosettes, shrubs and small
tunnelers, considering study areas and treatment as environmental variables. 45.0% and 2.6%
variance was explained by the first and second axis, respectively. (b): partial RDA considering as
covariables tree density, annual potential solar radiation and slope. “e” is for grazing excluded, “g”
for grazed. 40.4% and 1.9% variance was explained by the first and second axis, respectively. (The
lines of the arrows of the species were removed for graphical clarity) _______________________ 34
Fig. 4.7 – Boxplot of the Index of Ecological Integrity for sampling sites. The lowest values were
associated to more impact of grazing, the letters indicate statistically significant difference (Man-
Whitney’s U test; p-values in Table 2, below). “e” is for grazing excluded, “g” for grazed. ______ 35
Table Index
1Table 1 – p-values for the Mann-Whitney’s U test performed for the boxplots in Fig. 4.3. .................... 29
2Table 2 - p-values for the Mann-Whitney’s U test performed for the boxplot in Fig. 4.7. ....................... 35

Ecological indicators of grazing effects in cork oak woodlands: an integrated approach
Ecologia e Gestão Ambiental 2012/2013 64
Appendixes
Appendix I - Study areas, photos taken during the sampling periods. Companhia das
Lezírias: grazed area (a), Herdade da Ribeira Abaixo: grazing-excluded
area (b).
a)
b)

Ecological indicators of grazing effects in cork oak woodlands: an integrated approach
Ecologia e Gestão Ambiental 2012/2013 65
Appendix II - Ordination diagram (RDA) with the coprophagous beetles having a
representation of more than 20 captured individuals and lichens species,
and the study areas separated by treatment as environmental variables.
“e” is for grazing excluded, “g” for grazed. 59.0% and 6.1% of the
species variance were explained by the first and second axis,
respectively.

Ecological indicators of grazing effects in cork oak woodlands: an integrated approach
Ecologia e Gestão Ambiental 2012/2013 66
Appendix III – Tables with p-values from the second (a) and third (b) groups of
indicators (Figs. 4.4 and 4.5)
a)
Indicator CLe/CLg CLe/HRAe CLe/HRAg CLg/HRAe CLg/HRAg HRAe/HRAg
Mesotrophic
lichens 0,022361 0,057460 0,002892 0,604839 0,147374 0,082358
Dead leaves 0,093399 0,353838 0,250999 0,309880 0,507801 0,007077
Rocks and
gravel 0,309880 0,596242 0,077390 0,093399 0,658844 0,013419
Bare soil 0,000574 0,353838 0,859819 0,000412 0,030511 0,507801
Erect leafy 0,057632 0,007077 1,000000 0,000412 0,077390 0,007077
Big tunnelers 0,000003 0,787985 0,401794 0,000002 0,000009 0,261366
Small dwellers 0,000012 0,367217 0,447658 0,000002 0,000005 0,849441
C:N 0,479929 0,111962 0,289316 0,027276 0,596242 0,001998
δ15N 0,216374 0,003569 0,289316 0,000412 0,133321 0,001998
b)
Indicator CLe/CLg CLe/HRAe CLe/HRAg CLg/HRAe CLg/HRAg HRAe/HRAg
Oligotrophic
lichens 0,559231 0,264327 0,103890 0,064596 0,024626 0,477920
Nitrophilic lichens 0,151548 0,000168 0,487139 0,000903 0,923442 0,027087
Vegetation litter 0,077390 0,426777 0,133321 0,001998 0,027276 0,200412
Moss cover 0,658844 0,013419 0,452913 0,063691 0,250999 0,006194
Soil lichens 0,250999 0,723932 0,250999 0,122278 1,000000 0,122278
δ13C 0,021685 0,157705 0,042261 0,111962 0,001479 0,004718
Big dwellers 0,763745 0,007508 0,003793 0,005110 0,003095 0,787985

Ecological indicators of grazing effects in cork oak woodlands: an integrated approach
Ecologia e Gestão Ambiental 2012/2013 67
Appendix IV – Details on the Index of Ecological Integrity construction process
Step 1 – Determining the best indicators.
Boxplots in Fig. 4.3
Step 2 – Ordination analysis (first an RDA,
then a partial-RDA) with these three main
indicators (Fig. 4.4).
Step 3 – Retrieving the “scores”
(coordinates in the graph)
Small Tun -0,808
Shrubs 0,332
S-R -0,739
Step 4 – Using those scores and crossing
them with the original data
Totals Small
Tun
Shrubs S-R
P1S1 32 34 0
P1S2 89 37 1
P1S3 76 26 1
P2S1 119 2 7
P2S2 68 0 0
P2S3 127 4 2
P3S1 60 1 5
P3S2 78 14 2
P3S3 127 8 0
P4S1 169 0 0
P4S2 221 0 4
P4S3 172 0 7
P5S1 195 0 9
P5S2 167 1 11
P5S3 205 0 20
P6S1 141 0 18
P6S2 162 0 11
P6S3 184 0 8
P7S1 195 39 9
P7S2 86 33 2
P7S3 181 40 0
P8S1 68 34 2
P8S2 100 28 0
P8S3 151 23 3
P9S1 65 18 1
P9S2 78 34 2
P9S3 34 30 1
P10S1 139 25 14
P10S2 71 8 12
P10S3 59 0 8
P11S1 140 19 6
P11S2 113 11 6
P11S3 156 0 11
P12S1 115 2 22
P12S2 172 4 19
P12S3 123 3 20
Each value above is multiplied by the
“scores” in step 3, originating the table
below.
Small Tun Shrubs S-R
-0,78352 0,268762 0
-0,72638 0,292476 -0,0176

Ecological indicators of grazing effects in cork oak woodlands: an integrated approach
Ecologia e Gestão Ambiental 2012/2013 68
-0,74888 0,205524 -0,0176
-0,73963 0,01581 -0,12317
-0,77386 0 0
-0,72777 0,031619 -0,03519
-0,808 0,007905 -0,08798
-0,77807 0,110667 -0,03519
-0,73297 0,063238 0
-0,73812 0 0
-0,72003 0 -0,07038
-0,72383 0 -0,12317
-0,71618 0 -0,15836
-0,61897 0,007905 -0,19355
-0,69017 0 -0,3519
-0,70326 0 -0,31671
-0,71139 0 -0,19355
-0,73237 0 -0,14076
-0,79576 0,308286 -0,15836
-0,808 0,260857 -0,03519
-0,808 0,31619 0
-0,78491 0,268762 -0,03519
-0,79216 0,221333 0
-0,80268 0,18181 -0,05279
-0,70027 0,142286 -0,0176
-0,7878 0,268762 -0,03519
-0,78491 0,237143 -0,0176
-0,80223 0,197619 -0,24633
-0,808 0,063238 -0,21114
-0,808 0 -0,14076
-0,808 0,15019 -0,10557
-0,79395 0,086952 -0,10557
-0,77807 0 -0,19355
-0,808 0,01581 -0,3871
-0,78518 0,031619 -0,33431
-0,75291 0,023714 -0,3519
Step 5 – The three values from each line of
the table above are then summed (table
below)
Totals Index
P1S1 -0,51475
P1S2 -0,4515
P1S3 -0,56095
P2S1 -0,84699
P2S2 -0,77386
P2S3 -0,73134
P3S1 -0,88807
P3S2 -0,7026
P3S3 -0,66973
P4S1 -0,73812
P4S2 -0,79041
P4S3 -0,847
P5S1 -0,87454
P5S2 -0,80462
P5S3 -1,04207
P6S1 -1,01997
P6S2 -0,90494
P6S3 -0,87314
P7S1 -0,64583
P7S2 -0,58233
P7S3 -0,49181
P8S1 -0,55134
P8S2 -0,57082
P8S3 -0,67366
P9S1 -0,57558
P9S2 -0,55423
P9S3 -0,56537
P10S1 -0,85094
P10S2 -0,9559
P10S3 -0,94876
P11S1 -0,76338
P11S2 -0,81257

Ecological indicators of grazing effects in cork oak woodlands: an integrated approach
Ecologia e Gestão Ambiental 2012/2013 69
P11S3 -0,97162
P12S1 -1,17929
P12S2 -1,08787
P12S3 -1,0811
Step 6 – The minimum value is summed to
the entire table, so the new minimum is
zero.
Totals Ind
P1S1 0,664532
P1S2 0,727783
P1S3 0,618336
P2S1 0,332298
P2S2 0,405427
P2S3 0,447941
P3S1 0,291214
P3S2 0,476688
P3S3 0,509552
P4S1 0,441167
P4S2 0,388873
P4S3 0,332286
P5S1 0,304747
P5S2 0,37467
P5S3 0,137214
P6S1 0,159312
P6S2 0,274347
P6S3 0,306149
P7S1 0,533457
P7S2 0,596952
P7S3 0,687476
P8S1 0,627943
P8S2 0,608462
P8S3 0,505625
P9S1 0,60371
P9S2 0,625057
P9S3 0,613919
P10S1 0,328343
P10S2 0,223381
P10S3 0,230524
P11S1 0,415905
P11S2 0,366719
P11S3 0,207664
P12S1 0
P12S2 0,09142
P12S3 0,098186
Step 7 – The categories of CLe, CLg,
HRAe, HRAg were assigned and a final
boxplot was designed (Fig. 4.7).

Ecological indicators of grazing effects in cork oak woodlands: an integrated approach
Ecologia e Gestão Ambiental 2012/2013 70
Appendix V – Bibliographic revision tables
The following tables correspond to a bibliographical revision that resulted from the study of the groups included in this project. Most of what is
referenced in these tables was used for the writing of the article, and the ones that were not can be useful for future works, including the same
indicators. Besides being about the groups focused on the thesis, they are also related to grazing or its effects.
a) Lichens
Indicator Environmental Pressure and Reference Environmental Consequence Interpretation
Lichens'
functional groups
Land use gradients; Pinho et al. 2012 Changes in functional groups observed along
the land-use gradient Increased concentration of ammonia is expected even with a small number of animals
Land use response; Brown 1992; Ruisi et al. 2005 Change in composition of lichen floras
Both natural hypertrophication from grazing animals (wind-blown dust from excreta and urine)
and artificial hypertrophication from application of fertilizers lead to nutrient enrichment of neighboring habitats
Land use response; Nash and Gries 1986; McCune et al.
1997; Esseen and Renhorn 1998; Gombert et al. 2004; Frati et al. 2006; Geiser and Neitlich 2007; Ruisi et al.
2005
Lichens are good bioindicators of forest ecosystem health
Being very sensitive to environmental changes
Lichens' species
richness
Woodland management; Van Herk 1999, 2001;
Wolseley et al. 2006; Pinho et al. 2008, 2009; Aragon et
al. 2010
Decrease in lichen richness and also total cover
(intensively managed dehesas) may relate to
the management regimes
Lichens are particularly sensitive to eutrophication of bark by atmospheric deposition, specially inorganic contaminants (ammonia) of agricultural activities and livestock management
Land use gradients; Pinho et al. 2012 Abundance of sensitive species decreased With increasing LUI but without changes in richness
Land use gradients; Pinho et al. 2012 Observed total species richness increase Increase of nitrophytic species while at the same time oligotrophic species richness was
maintained
Less oligotrophic
species Land use gradients; Pinho et al. 2009, 2011, 2012
Decrease in oligotrophic species richness and
abundance until complete disappearance Increasing cattle density
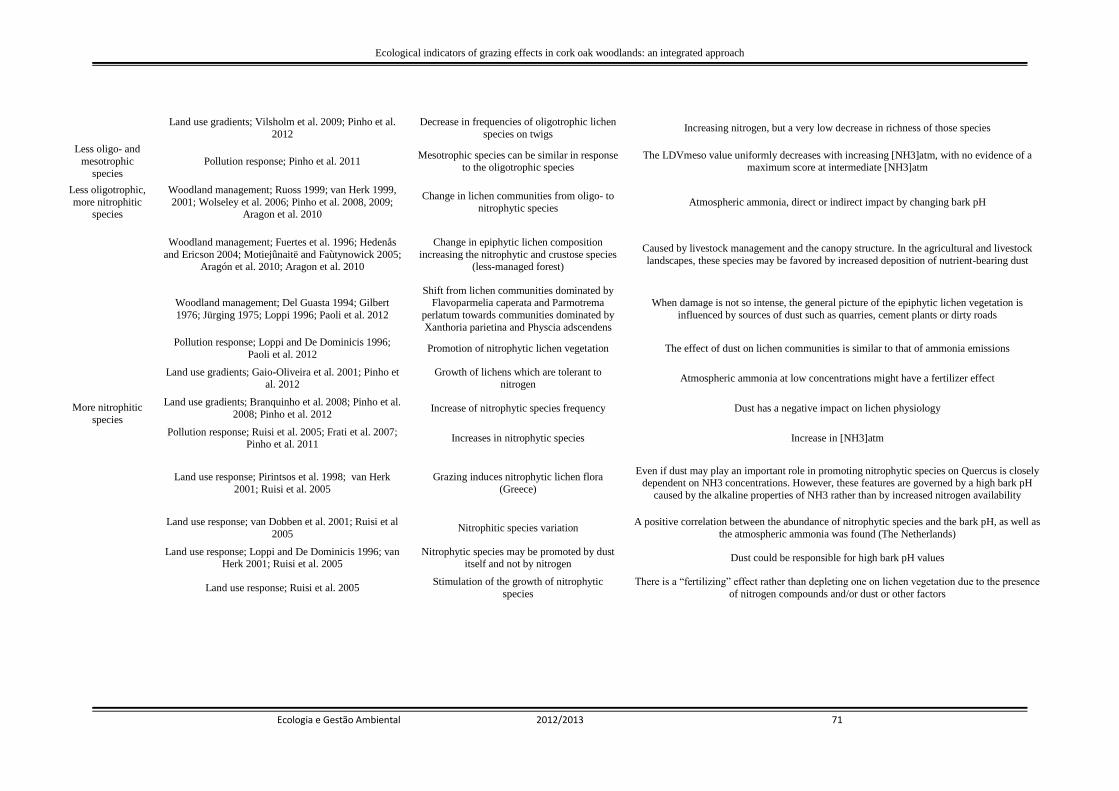
Ecological indicators of grazing effects in cork oak woodlands: an integrated approach
Ecologia e Gestão Ambiental 2012/2013 71
Land use gradients; Vilsholm et al. 2009; Pinho et al.
2012
Decrease in frequencies of oligotrophic lichen
species on twigs Increasing nitrogen, but a very low decrease in richness of those species
Less oligo- and
mesotrophic
species
Pollution response; Pinho et al. 2011 Mesotrophic species can be similar in response
to the oligotrophic species The LDVmeso value uniformly decreases with increasing [NH3]atm, with no evidence of a
maximum score at intermediate [NH3]atm
Less oligotrophic,
more nitrophitic species
Woodland management; Ruoss 1999; van Herk 1999,
2001; Wolseley et al. 2006; Pinho et al. 2008, 2009; Aragon et al. 2010
Change in lichen communities from oligo- to
nitrophytic species Atmospheric ammonia, direct or indirect impact by changing bark pH
More nitrophitic
species
Woodland management; Fuertes et al. 1996; Hedenås
and Ericson 2004; Motiejûnaitë and Faùtynowick 2005; Aragón et al. 2010; Aragon et al. 2010
Change in epiphytic lichen composition
increasing the nitrophytic and crustose species (less-managed forest)
Caused by livestock management and the canopy structure. In the agricultural and livestock
landscapes, these species may be favored by increased deposition of nutrient-bearing dust
Woodland management; Del Guasta 1994; Gilbert
1976; Jürging 1975; Loppi 1996; Paoli et al. 2012
Shift from lichen communities dominated by Flavoparmelia caperata and Parmotrema
perlatum towards communities dominated by
Xanthoria parietina and Physcia adscendens
When damage is not so intense, the general picture of the epiphytic lichen vegetation is
influenced by sources of dust such as quarries, cement plants or dirty roads
Pollution response; Loppi and De Dominicis 1996;
Paoli et al. 2012 Promotion of nitrophytic lichen vegetation The effect of dust on lichen communities is similar to that of ammonia emissions
Land use gradients; Gaio-Oliveira et al. 2001; Pinho et al. 2012
Growth of lichens which are tolerant to nitrogen
Atmospheric ammonia at low concentrations might have a fertilizer effect
Land use gradients; Branquinho et al. 2008; Pinho et al.
2008; Pinho et al. 2012 Increase of nitrophytic species frequency Dust has a negative impact on lichen physiology
Pollution response; Ruisi et al. 2005; Frati et al. 2007; Pinho et al. 2011
Increases in nitrophytic species Increase in [NH3]atm
Land use response; Pirintsos et al. 1998; van Herk
2001; Ruisi et al. 2005
Grazing induces nitrophytic lichen flora
(Greece)
Even if dust may play an important role in promoting nitrophytic species on Quercus is closely dependent on NH3 concentrations. However, these features are governed by a high bark pH
caused by the alkaline properties of NH3 rather than by increased nitrogen availability
Land use response; van Dobben et al. 2001; Ruisi et al
2005 Nitrophitic species variation
A positive correlation between the abundance of nitrophytic species and the bark pH, as well as
the atmospheric ammonia was found (The Netherlands)
Land use response; Loppi and De Dominicis 1996; van Herk 2001; Ruisi et al. 2005
Nitrophytic species may be promoted by dust itself and not by nitrogen
Dust could be responsible for high bark pH values
Land use response; Ruisi et al. 2005 Stimulation of the growth of nitrophytic
species
There is a “fertilizing” effect rather than depleting one on lichen vegetation due to the presence
of nitrogen compounds and/or dust or other factors

Ecological indicators of grazing effects in cork oak woodlands: an integrated approach
Ecologia e Gestão Ambiental 2012/2013 72
b) Vascular plants and soil cover
Indicator Environmental Pressure and Reference Environmental Consequence Interpretation
Grazing Low grazing intensity, Kahmen 2004 Low grazing is more selective Less homogeneity in landscape structure
Growth form
Grazing; Castro et al., 2010; Fernández-Alés et
al., 1993; Hadar et al., 1999; Lavorel et al., 1999; Noy-Meir et al., 1989; Peco et al., 2005;
Sternberg et al., 2000; Peco et al. 2012
Good response to grazing Similar response in Mediterranean areas with history of grazing
Less bare soil
Rainfall; Gutierrez et al. 1996 Above 20% grass cover, there is less soil detachment
and soil transportation Plant cover provides protection for the soil
Rainfall; Gutierrez et al. 1996 Plant cover above 50% did not significantly affect
hydrologic processes No signs of changes in hydrology
Rainfall; Gutierrez et al. 1996 Above 75% plant cover, runoff is slight, while below
this value, runoff increases rapidly. Accentuated difference where there is some bare soil (CL more distinct)
Rainfall; Gutierrez et al. 1996 The greater the percentage of grass cover and thus
above-ground biomass
Greater ability to protect the soil from raindrop impacts and to offer more
resistance for runoff to flow
More bare soil Grazing abandonment; Grime 2001; Peco et al.
2012 Increse after abandonment More competition for light, favouring tall and erect species
Less erect-leafy Grazing abandonment; Noy-Meir et al. 1989;
Peco et al. 2012 More small or prostrate species
Herbivory promotes removal of tall erect plants and survival of small and
prostrate ones
Litter
Rainfall; Gutierrez et al. 1996 Influences runoff and interrill erosion properties By not generating a soil protection layer
Ecological gradients; Herrick et al. 2009 Contributes positively to foliar cover protection of the
soil surface Also reflects reduced grazing frequency or intensity
Rainfall; Eldridge & Rothon 1992; Gutierrez et
al. 1996
Continued use of resources leads to a reduction of
vegetation cover
More grazing means less litter production and an increase of runoff and
interrill erosion
Rocks Rainfall; Wilcox & Wood 1989; Gutierrez et al.
1996 Rock and gravel cover increases Total interrill erosion is positively correlated with rock and gravel
More rosettes Grazing abandonment; Peco et al. 2012 Increse after abandonment Grazing favors rosette morphology
More graminoid or erect
forms
Climate gradient; Dirks et al. 2010; Sardans and
Peñuelas 2013
Better soil protection; higher microbial activity and
availability of nutrients
More water availability corresponds to an increase in plant-production
capacity
More rosettes, less erect
plants High grazing intensity; Kahmen 2004 Rosettes out-compete erect plants With high grazing, taller growth forms get removed more often

Ecological indicators of grazing effects in cork oak woodlands: an integrated approach
Ecologia e Gestão Ambiental 2012/2013 73
Plant cover Ecological gradients; Herrick et al. 2009 Soil hydrology
Effect on the amount of water that is released to surface and groundwater
after water has soaked into the soil; shade the soil; limit evaporation; also
carry water from deep in the soil into the atmosphere
Ecological gradients; Herrick et al. 2009 Wind erosion Where widely spaced, the density of the vegetation is also important
Plants, litter, rocks, lichens, mosses
Ecological gradients; Herrick et al. 2009 Correlated with soil and site stability and hydrologic
function
Protects the soil surface from raindrop impact, limiting detachment of soil
particles and physical crusting of the soil surface; higher cover means
there are more obstructions to water flow
Plants; lichens Ecological gradients; Herrick et al. 2009 Soil erosion Soil erodibility is reduced by soil organic matter; lichens and
photosynthetic cyanobacteria can play an important role in stabilizing soil
Livestock species (sheep) Grassland management; Johansson and Hedin,
1995; Ockinger et al. 2006 Less leaves and young sapling of trees and shrubs Sheep feeding preferences
Trampling (sheep) Grazing; Kahmen 2004 Little effect in temperate grasslands Lack of statistically significan difference in HRA of bare soil can be
explained by this
Trampling
Rainfall; Wilcox & Wood 1989; Bradford et al. 1987; Gutierrez et al. 1996
Less plant cover and more trampling increases soil compaction
strength of the soil surface and thus reduces soil detachment and particle availability
Trampling; Belnap 1998 Trampling leads to soil compaction
Compacted soils result in: (1) less water infiltration for use by vascular
plants, (2) fewer microorganisms and thus slowed plant litter
decomposition and less nutrients available for vascular plants, and (3) less root penetration by vascular plants
Trampling; Belnap 1998 Vascular plant community composition alteration Trampling can change plant community architecture and composition,
resulting in less available wildlife cover and forage
Ecological gradients; Herrick et al. 2009 Soil disturbance The bonds that hold soil particles together break, and the more erodible
soil below is exposed

Ecological indicators of grazing effects in cork oak woodlands: an integrated approach
Ecologia e Gestão Ambiental 2012/2013 74
c) Coprophagous beetles
Indicator Environmental Pressure and Reference Environmental Consequence Interpretation
Community
composition
Grazing pressure; Fincher 1973; Hanski and
Cambefort 1991; Sowig 1995; Doube 1987;
Lumaret and Kirk 1987; Kingston 1977;
Doube 1991, Pinero and Avilla 2004
Differences in community composition and abundance of dung
insects Abiotic and biotic factors such as soil characteristics, vegetation and predation
Grazing pressure; Mares and Rosenzweig
1978; Orians and Paine 1983; Kerleyand
Whitford 1994; Valone et al. 1994; Pinero
and Avilla 2004
Regional divergence in community composition and processes Variation in ecological and historical factors
Landscape effect; Roslin et al. 2001 Aphodiinae community composition At the community level, dissimilar responses to landscape composition in different Aphodius
species will translate into variation, locally
Ecological functions and services;
Andresen and Levey 2004; Andresen 2001,
2002; Slade et al. 2007; Vulinec 2002;
Ponce-Santizo et al. 2006; Nichols et al.
2008
Beetles and seed burial The probability and depth of a seed’s vertical burial by a dung beetle depends on seed size, the
composition of the dung beetle community and both the amount and type of dung
NA; Lumaret et al. 1992; Hanski and
Cambefort 1991
Dung amount (resource availability) seems to determine local
variation in dung beetle diversity
It is known that when the grazing regime changes from sheep to cattle, both composition and
abundance of dung beetles adjust to the new conditions; grazing-pressure history and management
regime also seem to be critical
NA; Hanski and Cambefort 1991 Local variation in dung beetle diversity Number of livestock, grazing history, distance between grazed localities and rate of dung are key
factors
NA; Hanski and Cambefort 1991
Habitat specialisation can act on between-habitat to larger scales,
while the low dispersal capacity can mainly determine the spatial
turnover of species on a within-habitat scale
However, the degree of dependence of the whole geographic range on ecological dispersal capacity
and the latter’s interdependence on habitat specialisation still remains unknown
Landscape gradient; Numa et al. 2012 Small differences in environmental values among sampling localities
can have an effect
In Numa's study, maximum difference in mean temperature: 0.7 ºC; in total precipitation: 155 mm;
in elevation: 160 m were enough for local environmental variables to have a relatively high ability
for explaining variation in dung beetle abundance
Landscape gradient; Koskela and Hanski
1977; Galante et al. 1993; Numa et al. 2012
Micro-thermohygrometric conditions can influence the colonisation
of dung
This climatic factor can also explain dung beetle species movements from open to closed areas
during the hottest months
Landscape gradient; Lumaret and Kirk
1987; Zamora et al. 2007; Romero-Alcaraz
and Ávila, 2000; Numa et al. 2012
The landscape variation in friction values for a forest species type and
the distance to patches of open or closed vegetation are important
variables for explaining local abundances
Studies about habitat preferences in dung beetles in Mediterranean conditions have shown that
closed vegetation characterised by dense scrubland or brushwood cover can impede the movements
of individual dung beetles and the dispersion of odour cues, consequently hindering the
colonisation of dung resources
Landscape gradient; Hanski 1986; Numa et
al. 2012
Local abundances can be influenced by intrinsic population processes,
but also by changes in immigration and emigration rates, which are in
turn conditioned by the landscape structure
Regional variation in Mediterranean dung beetle abundances may be viewed as a consequence of
the impact of vegetation filters on a group of species mainly adapted to the consumption of
herbivorous faeces in open biomes
Landscape gradient; Lande et al. 2003;
Numa et al. 2012 Species abundance variance
Also affected by random or demographically intrinsic effects that are unrelated to environmental
characteristics of their localities and surroundings

Ecological indicators of grazing effects in cork oak woodlands: an integrated approach
Ecologia e Gestão Ambiental 2012/2013 75
Grazing gradient; Lumaret and Kirk 1987;
Galante et al. 1995; Lumaret 1980; Verdú
et al. 2000
In Mediterranean ecosystems, vegetation cover is an important factor
in local distribution of Scarabaeoidea
In brushwood holm-oak ecosystems coprophagous fauna does not show preferences for closed
areas, but rather concentrate in open areas
Landscape gradient; Montalvo et al. 1993;
Montserrat 1991; Villar and Montserrat
1995; Numa et al. 2012
Grazing should not be considered as a disturbance in some
ecosystems with a long history of herbivory
Controlled grazing activity of sheep could certainly favour the historical sustenance of the
biodiversity of the ecosystem. A mosaic of plant communities could be supported at a low cost,
alternating patches with open and dense vegetation
NA; Hancock 1953; Olechowicz 1974;
Hanski 1987 In pastures, availability of dung remains stable
Cattle produce about 12 pats per animal per day, and in one study sheep produced 0.24 dropping
per square meter per day
Ecological
function
Ecological functions and services; Galbiati
et al. 1995; Kabir et al. 1985; Bang et al.
2005; Lastro 2006; Kabir et al. 1985;
Macqueen and Beirne 1975; Bang et al.
2005; Nichols et al. 2008
Dung beetles and plant biomass Dung mixing actions by dung beetles result in significant increases in plant height, above-ground
biomass, grain production, protein levels and nitrogen content
Ecological functions and services; Nichols
et al 2008 Pest control
Control of the abundance of dung-breeding hematophagic and detrivorous flies and dung-dispersed
nematodes and protozoa
Ecological functions and services; Nichols
et al. 2008 Reduce fly infestations
When and where dung beetles and dung flies co-occur, fly survival tends to decline as a
consequence of asymmetrical competition for dung resources, mechanical damage of eggs by
beetles, and fly predation by mites phoretic on dung beetles
Ecological functions and services; Miranda
et al. 2000; Yokoyama et al. 1991; Vulinec
et al. 2007; Nichols et al 2008
Ecosystem services
Soil conditioning and nutrient recycling by dung beetles; isolation and synthesis of the chemical
compounds that suppress pathogenic fungal growth on dung beetle brood balls; Secondary seed
dispersal
Ecological functions and services; Davis et
al. 2004; Nichols et al. 2008 Land management and beetle populations
Natural grasslands modified for livestock pasturing offer altered vegetation density, soil
temperature and moisture support – leading to range expansion for some dung beetles species
Ecological functions and services; Nichols
et al. 2008 Negative effects of dung beetles Dung beetles have also been implicated in increasing seed mortality and dispersing pathogens
NA; Hanski and Cambefort 1991 Grazing area of impact The radius of influence of increased grazing does not seem to exceed 1 km or 2 km
Land use gradient; Slade et al. 2007; Braga
et al 2013
The proportion of seeds removed covaries with the amount of dung
removed But more small seeds were removed than large seeds for a given proportion of dung removed
Functional
groups
Ecological functions and services; Nichols
et al. 2008
The transfer of freshly deposited waste below the soil surface by
tunneler and roller dung beetle species
Physical relocation of nutrient rich organic material and instigation micro-organismal and chemical
changes in the upper soil layers
NA; Hanski and Cambefort 1991 The effect of habitat variety on Aphodiinae and Geotrupinae richness
must be more pronounced than on that of Scarabaeinae.
As the larger areas tend to be environmentally more heterogeneous, and the rate of species increase
with area differs significantly between groups, on a geographical scale
NA; Hanski and Cambefort 1991
Aphodiinae species are less able to disperse between neighbouring
droppings than Scarabaeinae species, on a scale of 10 m (between-
dropping movements)
Group differences in dispersal capacity may lead to: i) a greater contribution to dung pat richness
from the group (Scarabaeinae) with greater between-dropping mobility; and ii) greater species
homogeneity of this group between neighbouring sites
NA; Hanski and Cambefort 1991 Scarabaeinae dominates α-diversity on a between-dropping scale;
Aphodiinae does so on local to larger scales
The richness of communities established in each dung pat depends on the Scarabaeinae species, but
the local and regional pool richness depends on Aphodiinae
Ecological functions and services; Mittal
1993; Edwards and Aschenborn 1987;
Halffter and Edmonds 1982; Lindquist
1933; Nichols et al. 2008
Tunnelers effect on the soil Move large quantities of earth to the soil surface during nesting (bioturbation); the tunnel depth and
amount of soil removed are positively related to beetle body-size
Large beetles Land use gradient; Feer 1999; Braga et al.
2013 Larger dung beetles also bury more seeds than do smaller beetles
Despite the large-beetle assemblage being the major group responsible for ecological functions, the
small-beetle assemblage is also important for the function of dung removal

Ecological indicators of grazing effects in cork oak woodlands: an integrated approach
Ecologia e Gestão Ambiental 2012/2013 76
Land use gradient; Gardner et al. 2008;
Dangles et al. 2012; Slade et al. 2007;
Larsen et al. 2005; Braga et al 2013
Larger-bodied dung beetles are more susceptible to abundance decline
in disturbed systems These species are the most related to function loss
Land use gradient; Braga et al 2013 Species richness of large beetles The variable that may best explain the variation in the amount of dispersal for large seed mimics
and the amoung of soil excavation
Small beetles
Land use gradient; Braga et al 2013 Small beetles collectively can be able to remove large amounts of
dung from the agriculture system
On the other hand, small beetles build smaller tunnels than do large beetles, therefore excavating
less soil
Land use gradient; Slade et al. 2007;
Barragán et al. 2011; Dangles et al. 2012;
Braga et al 2013
The abundance of small beetles may not influence significantly any of
the ecological functions measured
Small beetles have little effect on dung and seed removal. It is likely that higher species richness is
related to a higher diversity of functional groups, an attribute that has been shown to be important
in predicting the amount of ecological functions
Nitrogen
Ecological functions and services; Gillard
1967; Yokoyama et al. 1991; Nichols et al.
2008
Dung beetles prevent the loss of N through ammonia (NH3)
volatilization
By burying dung under the soil surface; also enhance soil fertility by increasing the available labile
N available for uptake by plants through mineralization
Ecological functions and services;
Yokoyama et al. 1991; Nichols et al. 2008 Dung beetles affect the nitrogen cycle
Acceleration of mineralization rates; Nitrogen volatilization and mineralization are bacteria-
mediated processes, and dung beetles alter the microorganism fauna in dung pats and brood balls
during feeding and nesting
Behaviour
and feeding
NA; Papp 1975; Hammer 1941; Hanski
1987 Dung beetle feeding habits
Coprophagous beetle and fly larvae in cow pats consume primarily undercomposed plant parts and
the liquid cementing material, respectively, but coprophagous fly larvae and adult beetles may
procure accessory foodstuffs by digesting microorganims found in large quantities in dung
NA; Hanski and Cambefort 1991 Dwellers behaviour Aphodiinae comprise the bulk of dwellers: they eat their way through the dung, and most species
deposit their eggs in dung pats without constructing any kind of nest or chamber
NA; Hanski and Cambefort 1991 Tunnelers behaviour Many tribes of Scarabaeidae are tunnelers: they dig a more or less vertical tunnel below the dung
pat and transport dung into the bottom or the burrow
NA; Hanski and Cambefort 1991 Rollers behaviour
Many Scarabaeidae have evolved the ultimate dung beetle skill of making a ball of dung, a
transportable resource unit, and rolling it for a shatter or longer distance before burying it into a
suitable spot (rollers)
Livestock
species
NA; Hanski and Cambefort 1991 Sheep dung and beetle distribution
Both species richness and the number of individuals are variables that show a spatial autocorrelated
pattern. On the contrary, the amount of sheep dung in one locality is not spatially autocorrelated,
probably because flocks follow predetermined routes or directions
Lobo et al. 1998; Hanski and Cambefort
1991 Cattle grazing continuity
In localities where cattle grazing are continuous in time and great in numbers, the diversity and
abundance of dung beetles is remarkably higher than in recently grazed localities
NA; Hanski and Cambefort 1991 More sheep grazing As more sheep graze in a smaller area, dung is quickly renovated, favouring larger populations
both in each site and in the surroundings
Landscape gradient; Bokdam and
Gleichman 2000; Verdú and Galante 2004;
Numa et al. 2012
Grazing systems that combine cattle with smaller herbivores such as
sheep, deer or rabbits can suppress scrubland and forest growth more
effectively
An increase in other types of herbivores, such as rabbits, would likely generate more structurally
diversified scrublands, facilitating dung beetle movements and dung colonisation, especially for
species adapted to rabbit dung pellets
Management
strategies
Grazing gradient; Rey-Benayas et al. 2008;
Bugalho et al 2011
Short (e.g. 3–4 years) or long-term cycle rotations (e.g. 15–20 years,
if tree regeneration is also to be favoured) grazing-excluded patches
can be established
They could act as islands of propagule sources of plant and invertebrates species differing from
those species occurring in the grazed matrix
Beetle
decline
Ecological functions and services; Lobo et
al. 2001; Nichols et al. 2008 Threats to beetle populations
There is a beetle decline in the Mediterranean, since the extensive livestock grazing regimes are
being replaced by intensive agriculture and afforestation, and ivermectin is being used in grazing
animals

Ecological indicators of grazing effects in cork oak woodlands: an integrated approach
Ecologia e Gestão Ambiental 2012/2013 77
d) Isotopic and compositional analysis
Indicator Environmental Pressure and Reference Environmental Consequence Interpretation
Carbon and
Nitrogen
Grazing gradient; Bai et al. 2012 Effects of grazing on C : N : P stoichiometry and ecosystem
functioning Vary strongly with precipitation
Nitrogen gradient; Vallano and Sparks 2013 Foliar d13C and %N fluctuations No correlation between foliar d13C and foliar %N with
increasing atmospheric NO2 concentration
Grazing gradient; Bardgett, Wardle and Yeates
1998; Hamilton and Frank 2001; Ritchie, Tilman
and Knops 1998; Bardgett and Wardle 2003; Bai et al. 2012
Plant and soil stoichiometric responses to grazing Stimulatory feedbacks between C-rich root exudates, microbial
activity, and plant available soil nutrients; and shifts in plant
species and functional group composition
Grazing gradient; Bai et al. 2012 Root exudation of C-rich substances stimulated, elevated N
mineralization, enhanced plant N content and reduction in C : N
Grazing under fertile conditions plays a role in element
composition
Grazing gradient; Bai et al. 2012 The C pools of all plant compartments decline significantly; the N
pools in above-ground biomass and litter are also reduced by grazing
Grazing changes the contents and stoichiometry of the plant
community through a cascade of plant–soil feedback
Grazing gradient; Bai et al. 2012 Decrease in C : N ratios Grazing in the meadow and typical steppes
Grazing gradient; Bai et al. 2012 In the typical steppe, C : N ratio changed little in the top 20-cm soil
layer and decreased in soil depths of 20–60 and 60–100 cm
C:N ratio may not vary much with grazing, depending on the
community type
Grazing gradient; Bai et al. 2012
Reduction in C and N pools in above-ground biomass and litter at the grazed sites, grazing increased the N contents (%) of both above-
ground biomass and litter in meadow and typical steppes; increases
in N content in the typical steppe
Justified by a substantial decrease in standing biomass and litter
Carbon
Elemental variability; Virgona and Farquhar1996
(Condon et al. 1987, Ehleringer1990, Ehleringer
et al. 1990, Virgona et al. 1990, Meinzer et al. 1992) (Sparks and Ehleringer 1997, Schulze et al.
1998) (Vitousek et al. 1990, Hultine and
Marshall 2000, Williams and Ehleringer 2000 (DeLucia et al. 1988, Schuster et al. 1992b
(Ehleringer 1993b, Poorter and Farquhar 1994).
Dawson et al 2002
C isotopes can be used to assess traits that co-vary with gas exchange, C gain, and water relations
Including water use efficiency (WUE), photosynthetic capacity,
stomatal conductance, leaf nitrogen content, leaf mass per area,
longevity, and relative growth rate

Ecological indicators of grazing effects in cork oak woodlands: an integrated approach
Ecologia e Gestão Ambiental 2012/2013 78
Elemental variability; Dawson et al 2002 C isotopes can be used as an ecological index of plant function There is a correlation between habitat quality and the
biochemical discrimination against 13C02 during gas exchange
Elemental variability; Ehleringer and Cooper 1988; Ehleringer 1993a, 1993b; Stewart et al.
1995; Korol et al. 1999; Madhavan et al. 1991; Comstock and Ehleringer 1992; Panek and
Waring 1997; Ehleringer et al. 1986; Zimmerman
and Ehleringer 1990; Welker et al. 1993; Panek
and Waring 1995; Condon et al. 1992; Hogberg
et al. 1993; Guehl et al. 1995; Bowman et al.
1989; Sandquist and Ehleringer 1995; Poss et al. 2000; Bettarini et al. 1995; Ehleringer and
Cerling 1995; Williams et al. 2001; Dawson et al
2002
Carbon discrimination variation Soil moisture , low humidity , irradiance , temperature, nitrogen
availability, salinity , and atmospheric CO2 concentration
Elemental variability; Geber and Dawson 1990;
Vitousek et al. 1990; Hanba et al. 1999; Hultine and Marshall 2000; Hultine and Marshall 2000;
Waring and Silvester 1994; Panek and Waring
1995; Panek 1996; Walcroftet al. 1996; Warren and Adams 2000; Yoder et al. 1994; Martinelli
et al. 1998; Dawson et al 2002
Carbon variation in Δ Affected by leaf size and thickness, stomatal density , branch
length, and canopy height
Elemental variability; Farquhar and Richards 1984; Henderson et al. 1998; Virgona and
Farquhar 1996; Condon et al. 1987; Ehleringer
1990; Ehleringer et al. 1990; Virgona et al. 1990; Meinzer et al. 1992; Sparks and Ehleringer 1997;
Schulze et al. 1998; Vitousek et al. 1990;
Hultine and Marshall 2000; Williams and Ehleringer 2000; DeLucia et al. 1988; Schuster et
al. 1992b; Ehleringer 1993b; Poorter and
Farquhar 1994; Dawson et al 2002
Because of the integrative response of Δ to multiple eco-physiological constraints through time, C isotopes can be used to
assess traits that co-vary with gas exchange, C gain, and water
relations
This includes water use efficiency (WUE) , photosynthetic
capacity, stomatal conductance, leaf nitrogen content, leaf mass per area , longevity, and relative growth rate
Grazing gradient; Bardgett, Wardle and Yeates
1998; Hamilton and Frank 2001; Bai et al. 2012
Grazing often increases C-rich root exudates that stimulate microbial
activity and turnover Increase in soil nutrients available to plants
Nitrogen
Grazing gradient; Bai et al. 2012 Accelerated N cycling N limitation reduction, N and P colimitation intensification
Nitrogen gradient; Amundson et al. 2003;
Perakis et al 2011 Isotopic composition of N inputs and losses
Natural abundance d15N isotopes provide an index of the
openness of ecosystem N cycling ecosystem d15N

Ecological indicators of grazing effects in cork oak woodlands: an integrated approach
Ecologia e Gestão Ambiental 2012/2013 79
Nitrogen gradient; Högberg 1997; Houlton and
Bai 2009; Perakis et al 2011 Foliar and soil d15N increase
With soil N availability due to losses of isotopically depleted
nitrate and trace N gases that cause d15N enrichment of soil
Nitrogen gradient; Perakis et al 2011 Influence foliar d15N Shifts in reliance on different soil N forms
Foliar Nitrogen uptake; Vitousek et al. 1997;
Bobbink et al. 2010; Vallano and Sparks 2013 Changes in ecosystem structure, function, and composition
Atmospheric N levels and the resulting N that is subsequently
deposited to plants and soil are often associated with dramatic
Foliar Nitrogen uptake; Handley and Raven
1992; Robinson 2001; Vallano and Sparks 2013 Stable nitrogen isotope ratios (15N/14N)
Useful for understanding spatial patterns of N cycling and identifying uptake pathways of N sources into plant metabolism
because they are integrators of biological processes at the air–
plant–soil continuum
Foliar Nitrogen uptake; Vallano and Sparks 2013 Foliar d15N values that reflect the d15N of distinct N sources
May provide information regarding the causal relationships
between plant uptake, assimilation, and allocation of N from natural and human-derived N sources
Foliar Nitrogen uptake; Vallano and Sparks 2013 Foliar d15N control By soil d15N, foliar N uptake, and mycorrhizae
Foliar Nitrogen uptake; Robinson 2001; Kahmen
et al. 2008; Vallano and Sparks 2013
Soil d15N is the primary factor influencing foliar d15N in most plant
species
Foliar d15N was depleted relative to surface soil d15N, likely
resulting from mineral soil N uptake that is depleted in 15N compared to the sampled soil surface N or soil organic N
Foliar Nitrogen uptake; Gebauer and Schulze 1991;Högberg 1997; Emmett et al. 1998; Pardo
et al. 2002; Templer et al. 2007; Vallano and
Sparks 2013
Decreasing foliar d15N in relation to soil d15N across species may
be potentially linked to lower nitrification rates in the soil N pool
Correlations between foliar d15N and relative rates of soil N
cycling in temperate forests
Elemental variability; Dawson et al 2002 Influences on plant δ15N
The presence of multiple N-sources with distinct isotopic values,
mycorrhizal associations, temporal and spatial variation in N
availability, and changes in plant demand
Elemental variability; Handley et al. 1994, 1997;
Dawson et al 2002 N isotopic fractionation
May be induced by very high external NO3 concentrations,
osmotic stress, or drought
Elemental discrimination
Elemental variability; Pataki et al., in press;
Ometto et al., personal communication; Bowling et al. 2002; Fessenden and Ehleringer 2002;
Buchmann et al. 1997; Dawson et al 2002
Ecosystem Δ is known to exhibit a high degree of variability With factors like precipitation, water availability, vapor pressure deficit, stand age, and species composition as the major drivers
Nutrient cycling Grazing gradient; Ritchie, Tilman and Knops
1998; Bai et al. 2012 Grazing decelerated nutrient cycling
Inhibit the growth of palatable and nutrient-rich species with
high litter quality