trabalhos prÁticos de fisiologia · 2018-02-14 · testes histÓricos de avaliaÇÃo de...
TRANSCRIPT

TRABALHOS PRÁTICOS DE FISIOLOGIA
Designed by Freepik
Catarina Pereira, PhD
Jorge Bravo, PhD
Testes históricos para avaliação de parâmetros fisiológicos do exercício e da atividade física


Ficha Técnica
Título
Trabalhos Práticos de Fisiologia do Esforço - Testes históricos para avaliação de
parâmetros fisiológicos do exercício e da atividade física
Edição
Universidade de Évora
Autores
Catarina Pereira, PhD
Jorge Bravo, PhD
ISBN
978-989-99122-4-3
Évora, Fevereiro de 2018

AGRADECIMENTOS
Os autores desta sebenta agradecem aos seus alunos que, com as
sugestões construtivas, muito contribuíram para a qualidade deste
documento.

ÍNDICE
ÍNDICE DE TABELAS I ...............................................................................................
ÍNDICE DE FIGURAS II .............................................................................................
LISTA DE ABREVIATURAS III ...................................................................................
LISTA DE UNIDADES DO SISTEMA INTERNACIONAL IV ....................................
INTRODUÇÃO IV ................................................................................
PROVAS DE RECUPERAÇÃO CARDÍACA APÓS ESFORÇO 7 ...............PROVA DE SKIPPING DE LIAN (1916) 9 ....................................................
Objetivo 9 .....................................................................................................................
Material 9 .....................................................................................................................
Protocolo 9 ...................................................................................................................
Valores de referência 10 ...............................................................................................PROVA DE FLEXÕES DE PERNAS DE MARTINET (1916) 11 ......................
Objetivo 11 ....................................................................................................................
Material 11 ....................................................................................................................
Protocolo 11 ..................................................................................................................
Valores de referência 12 ...............................................................................................PROVA DE STEP DE HARVARD (Brouha 1943) 13 ....................................
Objetivo 13 ...................................................................................................................
Material 13 ...................................................................................................................
Protocolo 13 ..................................................................................................................
Valores de referência 14 ...............................................................................................TAREFAS PRÁTICAS 16 .............................................................................
Prova de Skipping de Lian (1916) 17 ............................................................................
Prova de Flexões de Pernas de Martinet (1916) 18 .....................................................
Prova de Step de Harvard (Brouha 1943) 20 ..............................................................
Tabela de resumo 22 ....................................................................................................

Análise crítica 22 ..........................................................................................................
Síntese 22 .....................................................................................................................
PROVAS DE ADAPTAÇÃO CARDÍACA AO ESFORÇO 24 ......................TESTE DE DENOLIN NO CICLOERGÓMETRO 26 ......................................
Objetivo 26 ...................................................................................................................
Material 26 ...................................................................................................................
Procedimento 26 ..........................................................................................................
Protocolo 27 .................................................................................................................ADAPTAÇÃO DO TESTE DE DENOLIN À PASSADEIRA 29 ........................
Objetivo 29 ...................................................................................................................
Material 29 ...................................................................................................................
Procedimento 29 ..........................................................................................................
Protocolo – Género masculino 30 ...............................................................................
Protocolo - Género feminino 32 ..................................................................................TAREFAS PRÁTICAS 34 ............................................................................
Teste de Denolin 34 .....................................................................................................
Adaptação do teste de Denolin à passadeira 39 ..........................................................
NOTAS FINAIS 43 ...............................................................................
REFERÊNCIAS 45 ...............................................................................
ANEXOS 47.........................................................................................
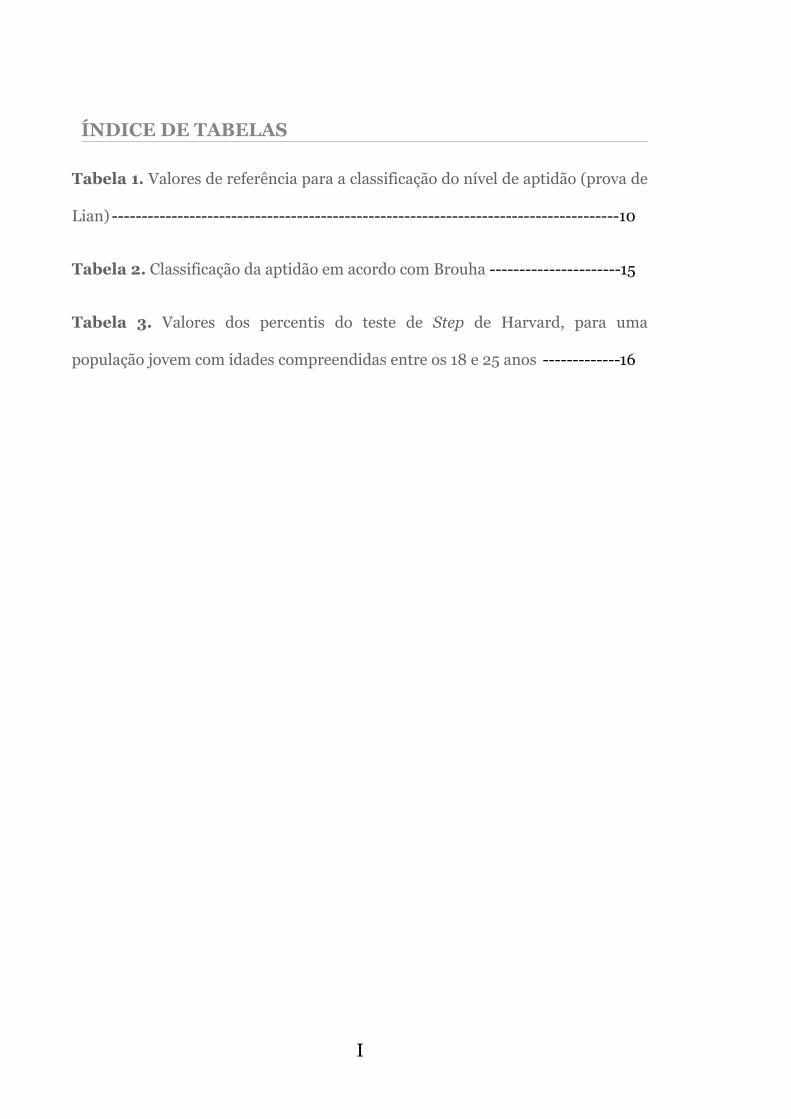
ÍNDICE DE TABELAS
Tabela 1. Valores de referência para a classificação do nível de aptidão (prova de
Lian) 10 -------------------------------------------------------------------------------------
Tabela 2. Classificação da aptidão em acordo com Brouha 15 ----------------------
Tabela 3. Valores dos percentis do teste de Step de Harvard, para uma
população jovem com idades compreendidas entre os 18 e 25 anos 16 -------------
! I

ÍNDICE DE FIGURAS
Figura 1. Gráfico de relação entre a frequência cardíaca e a carga de trabalho
no cicloergómetro para determinação da FC a 170 bpm 36 --------------------------
Figura 2. Gráfico de relação entre a frequência cardíaca e o tempo de prova no
cicloergómetro em diferentes intensidades de esforço 39 ----------------------------
Figura 3. Gráfico de relação entre a frequência cardíaca e a carga de trabalho
na passadeira para determinação da FC a 170 bpm 41 --------------------------------
Figura 4. Gráfico de relação entre a frequência cardíaca e o tempo de prova na
passadeira em diferentes intensidades de esforço 42 ---------------------------------
! II
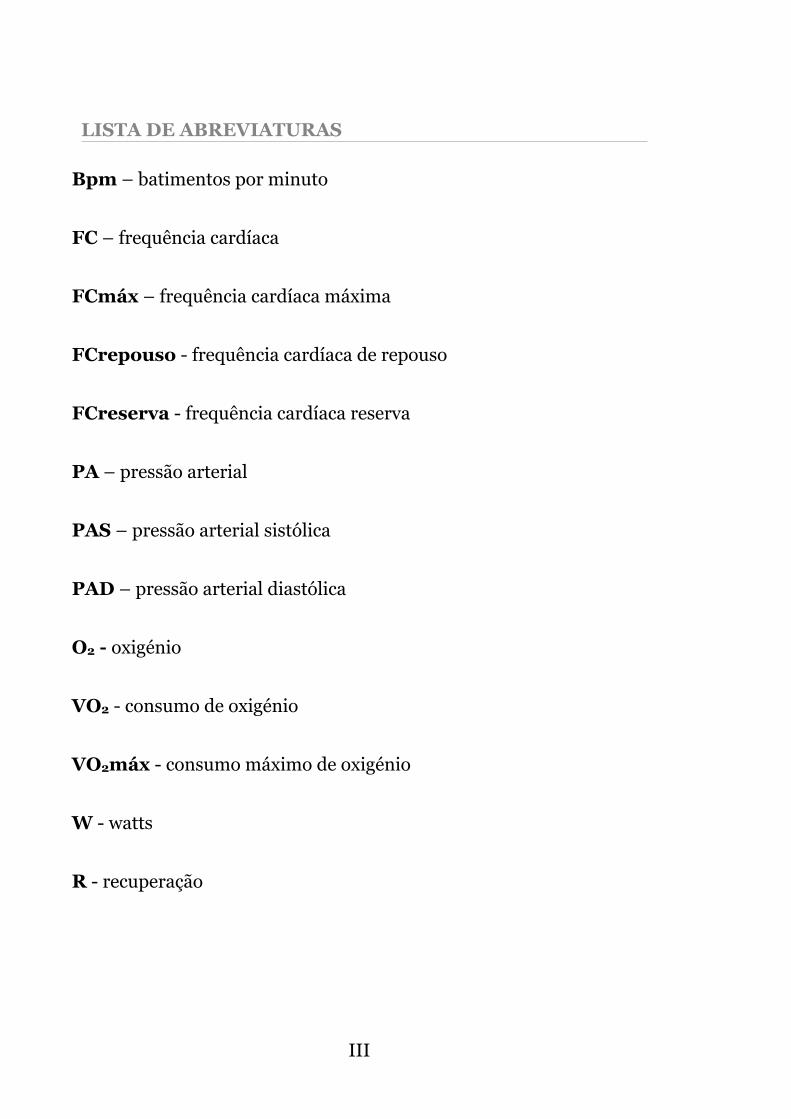
LISTA DE ABREVIATURAS
Bpm – batimentos por minuto
FC – frequência cardíaca
FCmáx – frequência cardíaca máxima
FCrepouso - frequência cardíaca de repouso
FCreserva - frequência cardíaca reserva
PA – pressão arterial
PAS – pressão arterial sistólica
PAD – pressão arterial diastólica
O2 - oxigénio
VO2 - consumo de oxigénio
VO2máx - consumo máximo de oxigénio
W - watts
R - recuperação
! III

LISTA DE UNIDADES DO SISTEMA INTERNACIONAL
! IV
Grandeza Unidade SímboloComprimento metros m
Comprimento centímetros cm
Comprimento milímetros mm
Tempo segundos s
Tempo minutos min
Tempo horas h
Massa quilogramas Kg
Volume litros l
Pressão sanguínea milímetros de mercúrio mmHg
Potência watt W

TESTES HISTÓRICOS DE AVALIAÇÃO DE PARÂMETROS FISIOLÓGICOS
INTRODUÇÃO
Este livro constitui um guião para a realização de trabalhos práticos
de fisiologia do exercício e da atividade física. É o primeiro volume de
três livros dedicados ao tema. Este primeiro volume - “Testes
Históricos de Avaliação de Parâmetros Fisiológicos do Exercício e da
Atividade Física” - procura abordar as bases práticas da fisiologia do
esforço e da atividade física, focando protocolos pioneiros de
avaliação da aptidão cardiorrespiratória dos indivíduos. O segundo
volume – “Testes Laboratoriais para Avaliação do Rendimento” – é
dedicado às provas de esforço de várias intensidades, aplicadas em
contexto de laboratório, permitindo o diagnóstico da aptidão física
dos indivíduos e a consequente programação do treino. O terceiro
volume – “Testes de Terreno para Avaliação do Rendimento” –
procura igualmente o diagnóstico da aptidão física e consequente
programação do treino, embora os procedimentos sejam
exclusivamente de terreno, sendo porventura mais específicos para
algumas modalidades.
A seleção dos testes a incluir neste livro procura desenvolver
competências de utilização de instrumentos e protocolos de medida
de parâmetros fisiológicos simples e conhecimentos básicos sobre
! IV Voltar ao Índice

TESTES HISTÓRICOS DE AVALIAÇÃO DE PARÂMETROS FISIOLÓGICOS
alterações fisiológicas decorrentes da adaptação ao esforço com uma
fundamentação científica.
As adaptações fisiológicas ao esforço variam consoante a aptidão e a
atividade física de cada indivíduo, podendo resultar em adaptações
crónicas, quando surgem ao longo do tempo , ou agudas, quando 1
surgem imediatamente ou pouco tempo após o esforço . Alguns dos 2
parâmetros fisiológicos em que estas adaptações são mais evidentes
são a frequência cardíaca (FC) e o consumo de oxigénio (VO2),
estando estes estreitamente relacionados. O VO2 e a FC variam com a
intensidade de esforço, contudo, um dos fatores que demonstra uma
boa adaptação ao esforço, é a capacidade de estabilizar a FC em
valores relativamente reduzidos para uma intensidade de esforço
elevada.
Um outro método para determinar a aptidão física de um indivíduo é
sujeitá-lo a um determinado esforço, avaliando posteriormente o
comportamento da FC durante a recuperação.
Seguidamente serão apresentados os protocolos históricos
seleccionados para determinação da aptidão cardiorrespiratória dos
semanas, meses, anos1
segundos, minutos, horas2
! V Voltar ao Índice

TESTES HISTÓRICOS DE AVALIAÇÃO DE PARÂMETROS FISIOLÓGICOS
indivíduos, quer através de Provas de Recuperação Cardíaca após
Esforço, quer através de Provas de Adaptação Cardíaca ao Esforço.
Após a descrição dos protocolos são propostas tarefas práticas que
permitem aplicar os conhecimentos teóricos e adquirir competências
na avaliação de parâmetros fisiológicos em humanos.
! VI Voltar ao Índice

PROVAS DE RECUPERAÇÃO CARDÍACA APÓS
ESFORÇO

TESTES HISTÓRICOS DE AVALIAÇÃO DE PARÂMETROS FISIOLÓGICOS
Provas de Recuperação Cardíaca ao Esforço
PROVAS DE RECUPERAÇÃO CARDÍACA APÓS ESFORÇO
A primeira grande evolução nos métodos de avaliação da aptidão
física em humanos, surge entre 1914 e 1918, período da primeira
grande guerra mundial. Durante este período foi levado a cabo o
recrutamento de população masculina para servir os países durante o
conflito, sendo pela primeira vez, executadas provas de aferição da
aptidão física como método de seleção dos mais aptos (1).
As primeiras provas de aptidão física, com a aplicação de métodos
científicos bem definidos, surgiram em 1916 por intermédio de Lian
(2) e Martinet (3).
Desde as primeiras provas, os métodos de avaliação da aptidão física
em humanos têm suscitado o interesse da comunidade científica,
levando a uma evolução de métodos, técnicas e instrumentos.
Contudo, esta evolução tardou mais de vinte anos a ser retomada após
as primeiras provas de 1916, sobretudo pela ocorrência da segunda
guerra mundial (1939-1945), conflito armado que não possibilitou o
avanço dos estudos nesta temática. Próximo do final deste conflito
surgiu uma das provas com maior aplicação nos anos seguintes,
representando um marco na evolução das provas de aptidão física, a
Prova de Step de Harvard (1943) (4, 5).
! 7 Voltar ao Índice

TESTES HISTÓRICOS DE AVALIAÇÃO DE PARÂMETROS FISIOLÓGICOS
Provas de Recuperação Cardíaca ao Esforço
Vários estudos têm destacado a validade prognóstica das provas de
recuperação cardíaca ao esforço e da taxa de diminuição da FC após a
realização de provas de esforço físico (6-8). Embora estudos
fisiológicos anteriores tenham sugerido uma rápida recuperação da
FC ao exercício, reconhecendo ser um indicador de aptidão física,
apenas mais recentemente o seu valor prognóstico foi comprovado,
geralmente em 1 ou 2 min após o exercício físico (6).
Neste capítulo iremos abordar as primeiras provas de recuperação
cardíaca ao esforço, através da Prova de Skipping de Lian (1916), da
Prova de Flexões de Pernas de Martinet (1916) e da Prova de Step de
Harvard (1943).
! 8 Voltar ao Índice

TESTES HISTÓRICOS DE AVALIAÇÃO DE PARÂMETROS FISIOLÓGICOS
Provas de Recuperação Cardíaca ao Esforço
PROVA DE SKIPPING DE LIAN (1916)
A Prova de Skipping de Lian (1916) (2), é uma das primeiras provas
de avaliação da aptidão dos indivíduos.
Objetivo
Determinar o tempo necessário para a recuperação da FC até aos
valores de repouso, após a realização de um exercício estandardizado.
Material
• Metrónomo
• Cronómetro
Protocolo
• Fazer a elevação dos joelhos em exercício de Skipping.
• A frequência do movimento é de 2 elevações por segundo
(metrónomo a 120 bpm).
• A duração da tarefa é de 1 min.
• Fazer a mensuração da FC e do tempo de recuperação,
nomeadamente:
• FC prévia ao exercício.
! 9 Voltar ao Índice
Lian
(191
6)M
artin
et (1
916)
Brou
ha (1
943)
Tare
fas P
rátic
as

TESTES HISTÓRICOS DE AVALIAÇÃO DE PARÂMETROS FISIOLÓGICOS
Provas de Recuperação Cardíaca ao Esforço
• FC no final do exercício.
• Tempo de recuperação da FC (tempo decorrido até a FC
retomar o valor inicial).
• Determinar o incremento da FC (variação: diferença entre a FC
no final e no início do exercício).
A classificação da aptidão física é determinada considerando o
aumento da FC no final do exercício e, também, o tempo necessário
para que ela volte aos valores iniciais de repouso.
Valores de referência
Os valores de referência para classificação da aptidão estão
apresentados na tabela seguinte (1).
Tabela 1. Valores de referência para a classificação do nível de aptidão (prova de
Lian)
! 10 Voltar ao Índice
Lian
(191
6)M
artin
et (1
916)
Brou
ha (1
943)
Tare
fas P
rátic
as
Classificação Variação da FC Duração da Recuperação (R)
I— Excelente FC <30 bpm ≤ 2 minII—Bom FC ≤ 30 bpm 2 min > R > 3 minIII — Médio 30 bpm <FC < 40 bpm 2 min > R > 3 minIV—Mau FC > 40 bpm 4 min > R > 5 minV—Inapto FC > 40 bpm R > 5 min ou mais

TESTES HISTÓRICOS DE AVALIAÇÃO DE PARÂMETROS FISIOLÓGICOS
Provas de Recuperação Cardíaca ao Esforço
PROVA DE FLEXÕES DE PERNAS DE MARTINET (1916)
Este teste recorre à medição do tempo de recuperação da FC após um
exercício estandardizado. Martinet introduziu, também, a medição
das variações da Pressão Arterial (PA),sistólica (PAS) e diastólica
(PAD) (3).
Objetivo
Determinar o tempo necessário para a recuperação da FC até aos
valores de repouso, após a realização de um exercício estandardizado.
Material
• Metrónomo
Protocolo
• Efetuar 20 flexões profundas de joelhos obedecendo à
frequência do movimento.
• Frequência do movimento: 1 flexão/segundo.
• Fazer a mensuração da FC e da PA.
• FC prévia ao exercício.
• PA prévia ao exercício.
• FC no final do exercício.
! 11 Voltar ao Índice
Lian
(191
6)M
artin
et (1
916)
Brou
ha (1
943)
Tare
fas P
rátic
as

TESTES HISTÓRICOS DE AVALIAÇÃO DE PARÂMETROS FISIOLÓGICOS
Provas de Recuperação Cardíaca ao Esforço
• PA no final do exercício.
• Determinar a variação da FC e da PA.
Valores de referência
Os valores para determinação do nível da aptidão consideram o
acréscimo da FC e da PA (diferença entre os valores medidos no final
do exercício e os valores medidos em repouso). Os valores médios de
referência são os seguintes (3):
• Acréscimo da FC:
o 15 a 20 bpm
• Acréscimo da PA:
o sistólica: 1 mmHg
o diastólica: 4 mmHg
A classificação da aptidão diferencia 3 grupos, em função da
aproximação ou distanciamento dos parâmetros medidos, aos valores
de referência.
• Bom - inferiores aos valores de referência.
• Médio - dentro dos valores de referência.
• Mau - superiores dos valores de referência.! 12 Voltar ao Índice
Lian
(191
6)M
artin
et (1
916)
Brou
ha (1
943)
Tare
fas P
rátic
as

TESTES HISTÓRICOS DE AVALIAÇÃO DE PARÂMETROS FISIOLÓGICOS
Provas de Recuperação Cardíaca ao Esforço
PROVA DE STEP DE HARVARD (Brouha 1943)
Este teste recorre à medição do tempo de recuperação da FC após um
exercício estandardizado. O teste estabelece valores de referência
considerando percentis (4, 5).
Objetivo
Determinar o tempo necessário para a recuperação da FC até aos
valores de repouso, após a realização de um exercício estandardizado.
Material
• Metrónomo
• Step de 51 cm para homens e de 46 cm para mulheres
Protocolo
• Subir e descer o step (51 cm para o homem e de 46 cm para a
mulher).
• A frequência do exercício é de 60 apoios por minuto
(metrónomo regulado a 60 bpm).
• A duração máxima aconselhada é de 5 min.
• Após os 5 min de step e durante a recuperação fazer a
mensuração de:
! 13 Voltar ao Índice
Lian
(191
6)M
artin
et (1
916)
Brou
ha (1
943)
Tare
fas P
rátic
as

TESTES HISTÓRICOS DE AVALIAÇÃO DE PARÂMETROS FISIOLÓGICOS
Provas de Recuperação Cardíaca ao Esforço
✓ FC1: FC medida entre 1 e 1 min e 30 seg. de recuperação
✓ FC2: FC medida entre 2 e 2 min e 30 seg. de recuperação
✓ FC3: FC medida entre 3 e 3 min e 30 seg. de recuperação.
• Determinar o índice estabelecido por Brouha (1973) usando as
mensurações na seguinte fórmula (4, 5):
!
T: tempo real do exercício (segundos)
Valores de referência
A classificação do nível de aptidão considera o índice calculado
usando a formula de Brouha (1973) em contraposição com os valores
de referência apresentados na tabela 2 (4, 5).
Tabela 2. Classificação da aptidão em acordo com Brouha
I = T × 1002(FC1 + FC2 + FC3)
! 14 Voltar ao Índice
Lian
(191
6)M
artin
et (1
916)
Brou
ha (1
943)
Tare
fas P
rátic
asClassificação Índice I
I — Inapto < 55
II — Aptidão média 55 - 64
III — Boa aptidão 65 - 79
IV—Muito boa aptidão 80 - 89
V — Excelente condição > 90

TESTES HISTÓRICOS DE AVALIAÇÃO DE PARÂMETROS FISIOLÓGICOS
Provas de Recuperação Cardíaca ao Esforço
Foram também estabelecidos os percentis (tabela 3), considerando a
população Belga, nomeadamente, considerando estudantes de
educação física com idades compreendidas entre os 18 e os 25 anos
(9).
Tabela 3. Valores dos percentis do teste de Step de Harvard, para uma
população jovem com idades compreendidas entre os 18 e 25 anos
Percentis Rapazes Raparigas
P1 44.00 18.00
P5 4400 23.00
P10 51.00 39.00
P20 69.00 38.00
P30 77,00 46.00
P40 84.00 70,00
P50 89.00 73.00
P60 90.00 77.00
P70 91.00 83.00
P80 92.00 84.00
P90 92.00 91.00
P95 99.00 111.00
P99 99.00 111.00
! 15 Voltar ao Índice
Lian
(191
6)M
artin
et (1
916)
Brou
ha (1
943)
Tare
fas P
rátic
as

TESTES HISTÓRICOS DE AVALIAÇÃO DE PARÂMETROS FISIOLÓGICOS
Provas de Recuperação Cardíaca ao Esforço
TAREFAS PRÁTICAS
1. Realizar os testes.
2. Calcular os índices.
3. Construir uma tabela com os resultados de cada teste e a
respetiva classificação.
4. Fazer uma análise crítica dos resultados obtidos.
5. Fazer uma síntese por tópicos dos principais conceitos e
questões chave associados ao tema.
! 16 Voltar ao Índice
Lian
(191
6)M
artin
et (1
916)
Brou
ha (1
943)
Tare
fas P
rátic
as

TESTES HISTÓRICOS DE AVALIAÇÃO DE PARÂMETROS FISIOLÓGICOS
Provas de Recuperação Cardíaca ao Esforço
Prova de Skipping de Lian (1916)
Resultados:
• Indivíduo: ________________________________
• Idade: ___________
• Massa (Kg): ________
• Data: ___/____/________
• Hora: ________
• FC prévia ao exercício (bpm): _______
• FC no final do exercício (bpm): _______
• Variação de FC (bpm): _______
• Tempo de recuperação da FC (s): _______
• Classificação:
____________________________________________
____________________________________________
! 17 Voltar ao Índice
Lian
(191
6)M
artin
et (1
916)
Brou
ha (1
943)
Tare
fas P
rátic
as

TESTES HISTÓRICOS DE AVALIAÇÃO DE PARÂMETROS FISIOLÓGICOS
Provas de Recuperação Cardíaca ao Esforço
Prova de Flexões de Pernas de Martinet (1916)
Resultados:
• Indivíduo: ________________________________
• Idade: ___________
• Massa (Kg): ________
• Data: ___/____/________
• Hora: ________
• FC prévia ao exercício (bpm): _______
• FC no final do exercício (bpm): _______
• PAS prévia ao exercício (mmHg): _______
• PAS no final do exercício (mmHg): _______
• PAD prévia ao exercício (mmHg): _______
• PAD no final do exercício (mmHg): _______
• Variação da FC (bpm): _______
• Variação da PAS (mmHg): _______
• Variação da PAD (mmHg): _______
! 18 Voltar ao Índice
Lian
(191
6)M
artin
et (1
916)
Brou
ha (1
943)
Tare
fas P
rátic
as

TESTES HISTÓRICOS DE AVALIAÇÃO DE PARÂMETROS FISIOLÓGICOS
Provas de Recuperação Cardíaca ao Esforço
• Classificação:
____________________________________________
____________________________________________
! 19 Voltar ao Índice
Lian
(191
6)M
artin
et (1
916)
Brou
ha (1
943)
Tare
fas P
rátic
as

TESTES HISTÓRICOS DE AVALIAÇÃO DE PARÂMETROS FISIOLÓGICOS
Provas de Recuperação Cardíaca ao Esforço
Prova de Step de Harvard (Brouha 1943)
Determinar o resultado do teste usando a medição da FC manual
(como é expresso na descrição do protocolo) e usando a medição da
FC com o cardiofrequencímetro.
Resultados:
• Indivíduo: ________________________________
• Idade: ___________
• Massa (Kg): ________
• Data: ___/____/________
• Hora: ________
• T: tempo do exercício(s): ________
! I = T × 1002(FC1 + FC2 + FC3)
! 20 Voltar ao Índice
Lian
(191
6)M
artin
et (1
916)
Brou
ha (1
943)
Tare
fas P
rátic
asFC manual FC Frequencímetro
FC1: ____________bpm ____________bpm
FC2: ____________bpm ____________bpm
FC3: ____________bpm ____________bpm

TESTES HISTÓRICOS DE AVALIAÇÃO DE PARÂMETROS FISIOLÓGICOS
Provas de Recuperação Cardíaca ao Esforço
• Classificação:
____________________________________________
____________________________________________
! 21
Lian
(191
6)M
artin
et (1
916)
Brou
ha (1
943)
Tare
fas P
rátic
as
Voltar ao Índice

TESTES HISTÓRICOS DE AVALIAÇÃO DE PARÂMETROS FISIOLÓGICOS
Provas de Recuperação Cardíaca ao Esforço
Tabela de resumo
Tabela com os resultados de cada teste e a classificação obtida em
cada um dos mesmos.
Análise crítica
________________________________________________________________________________________________________________________________________________________________________________________________________________________________________________________________________________________________________________________________________________
Síntese
________________________________________________________________________________________________________________________________________________________________________________________________
! 22Voltar ao Índice
Lian
(191
6)M
artin
et (1
916)
Brou
ha (1
943)
Tare
fas P
rátic
as
Prova ClassificaçãoLian (1916)
Martinet (1916)Brouha (1943)

PROVAS DE ADAPTAÇÃO CARDÍACA AO
ESFORÇO

TESTES HISTÓRICOS DE AVALIAÇÃO DE PARÂMETROS FISIOLÓGICOS
Provas de Adaptação Cardíaca ao Esforço
PROVAS DE ADAPTAÇÃO CARDÍACA AO ESFORÇO
As provas de adaptação cardíaca ao esforço aqui apresentadas,
refletem uma evolução do conhecimento científico relativamente às
provas de recuperação cardíaca após o esforço (2-4).
A FC e consumo de oxigénio (VO2) são as variáveis de utilização mais
comum nas provas de adaptação cardíaca ao esforço (10, 11). Estão
bem suportadas as evidências que relatam o aumento conjunto da FC
e do VO2, com o aumento da intensidade do esforço físico,
estabelecendo-se, nesta condição, uma relação linear entre o aumento
do VO2 e da FC (12).
A determinação do VO2 previsto pode ser efetuada através de
extrapolação, pela relação entre a FC máxima (FCmáx) - que pode ser
predita em função de características do indivíduo, como seja a idade -
e o VO2. Surpreendentemente, apesar de ter sido durante muitos anos
a fórmula mais utilizada para a extrapolação da FCmáx, a fórmula
FCmáx = (220–idade) terá resultado de uma estimativa superficial
realizada a partir de um estudo observacional que procurou
relacionar de forma linear dados de atividade física e de doença
cardíaca coronária, em 1971 (13).
! 24 Voltar ao Índice

TESTES HISTÓRICOS DE AVALIAÇÃO DE PARÂMETROS FISIOLÓGICOS
Provas de Adaptação Cardíaca ao Esforço
As provas de esforço envolvem usualmente a medição das respostas
da FC a uma intensidade de esforço padronizada, possibilitando a
determinação direta e indireta da FCmáx e do VO2máx. Contudo,
neste capítulo iremos abordar exclusivamente a adaptação da FC ao
esforço, através da análise do seu comportamento durante a
realização dos testes de Denolin (14), quer no cicloergómetro, quer na
passadeira.
! 25 Voltar ao Índice

TESTES HISTÓRICOS DE AVALIAÇÃO DE PARÂMETROS FISIOLÓGICOS
Provas de Adaptação Cardíaca ao Esforço
TESTE DE DENOLIN NO CICLOERGÓMETRO
Este teste criou procedimentos que permitem determinar a
capacidade de trabalho no cicloergómetro a uma FC determinada.
Objetivo
O teste de Denolin (14), pretende determinar a intensidade do esforço
necessária (valor da carga) para um atleta atingir e estabilizar a sua
FC de trabalho a 170 bpm.
Material
• Cicloergómetro
• Metrónomo
• Cronómetro
• Cardiofrequencímetro
Procedimento
• Previamente ao teste, é aconselhável realizar um pequeno
aquecimento (cerca de 4 min).
• O teste de Denolin decorre no cicloergómetro em três estádios
sucessivos com a duração de 6 min cada. No primeiro estádio a
! 26 Voltar ao Índice
Den
olin
Cic
loer
góm
etro
Den
olin
Pas
sade
ira
Tare
fas P
rátic
as

TESTES HISTÓRICOS DE AVALIAÇÃO DE PARÂMETROS FISIOLÓGICOS
Provas de Adaptação Cardíaca ao Esforço
carga é de 50w (300 kg.m.min-1). Em cada novo estádio
aumenta-se a carga no valor de 50w (300 kg.m.min-1).
• Terminado o teste é recomendada a realização de um período de
repouso ativo (cerca de 2 min).
Protocolo
Medições do protocolo original:
• Registar a FC em repouso.
• Regulação da altura do assento para o indivíduo.
• Regulação do metrónomo fixando a RPM para 60 ciclos por
min.
• Regular a carga para 50 w (300 kg.m.min-1)
• Iniciar o teste.
• Ao 6º min registar a FC e aumentar a carga para 100w (600
kg.m.min-1)
• Ao 12º min registar a FC e aumentar a carga para 150 w (900
kg.m.min-1)
• Terminar o teste ao 18º min e registar a FC.
! 27 Voltar ao Índice
Den
olin
Cic
loer
góm
etro
Den
olin
Pas
sade
ira
Tare
fas P
rátic
as

TESTES HISTÓRICOS DE AVALIAÇÃO DE PARÂMETROS FISIOLÓGICOS
Provas de Adaptação Cardíaca ao Esforço
• Atenção: se necessário - caso a FC não tenha atingido os 170
bpm - efetuar mais um estágio de 6 min aumentando a carga
para 200w (1200 kg.m.min-1).
Medições adicionais:
• Registar a FC no final do min 1 e do min 2 do período de
aquecimento.
• Registar a FC minuto a minuto durante o teste.
• Registar a FC no final de cada minuto do período de repouso
ativo (2 min).
• Registar a FC no final de cada minuto, dos 2 min seguintes
ao período de repouso ativo, correspondendo ao período de
repouso passivo.
! 28 Voltar ao Índice
Den
olin
Cic
loer
góm
etro
Den
olin
Pas
sade
ira
Tare
fas P
rátic
as

TESTES HISTÓRICOS DE AVALIAÇÃO DE PARÂMETROS FISIOLÓGICOS
Provas de Adaptação Cardíaca ao Esforço
ADAPTAÇÃO DO TESTE DE DENOLIN À PASSADEIRA
Este teste criou procedimentos que permitem determinar a
capacidade de trabalho na passadeira a uma FC determinada.
Objetivo
Este teste pretende determinar qual é a intensidade do esforço
necessária (valor da carga definida pela velocidade ou pela inclinação
da passadeira) para o atleta atingir e estabilizar a sua FC de trabalho a
170 bpm.
Material
• Passadeira
• Cronómetro
• Cardiofrequencímetro.
Procedimento
• Previamente ao teste, é aconselhável realizar um pequeno
aquecimento de 4 min (2 min a 5 km/h e 2 min a 6 km/h).
• Terminado o teste é recomendado a realização de um período de
alguns minutos de repouso ativo (cerca de 2 min).
! 29 Voltar ao Índice
Den
olin
Cic
loer
góm
etro
Den
olin
Pas
sade
ira
Tare
fas P
rátic
as

TESTES HISTÓRICOS DE AVALIAÇÃO DE PARÂMETROS FISIOLÓGICOS
Provas de Adaptação Cardíaca ao Esforço
Protocolo – Género masculino
A aplicação do teste Denolin na passadeira decorre em três estádios
sucessivos com a duração de 6 min cada. No primeiro estádio a carga
é de 8 km/h. Em cada novo estádio aumenta-se a carga no valor de 1
km/h.
Medições do protocolo original:
• Registar a FC de repouso
• Regulação da velocidade para 8 km/h durante 6 min.
• Iniciar o teste
• Ao 6º min registar a FC e aumentar a velocidade para 9 km/h.
• Ao 12º min Registar a FC e aumentar a velocidade para 10 km/
h.
• Se a FC não atingir os 170 bpm tem de efetuar mais 6 min com a
velocidade a 11 km/h.
• Terminar o teste ao 18º min e registar a FC.
• Atenção: se necessário - caso a FC não tenha atingido os 170
bpm - efetuar mais um estágio de 6 min aumentando a
velocidade para 12 km/h.
! 30 Voltar ao Índice
Den
olin
Cic
loer
góm
etro
Den
olin
Pas
sade
ira
Tare
fas P
rátic
as

TESTES HISTÓRICOS DE AVALIAÇÃO DE PARÂMETROS FISIOLÓGICOS
Provas de Adaptação Cardíaca ao Esforço
Medições adicionais:
• Registar a FC no final do minuto 1 e do minuto 2 do período
de aquecimento.
• Registar a FC minuto a minuto durante o teste.
• Registar a FC no final de cada minuto do período de repouso
ativo (2 min).
• Registar a FC no final de cada minuto, dos 2 min seguintes
ao período de repouso ativo, correspondendo ao período de
repouso passivo.
! 31 Voltar ao Índice
Den
olin
Cic
loer
góm
etro
Den
olin
Pas
sade
ira
Tare
fas P
rátic
as

TESTES HISTÓRICOS DE AVALIAÇÃO DE PARÂMETROS FISIOLÓGICOS
Provas de Adaptação Cardíaca ao Esforço
Protocolo - Género feminino
A aplicação do teste Denolin na passadeira decorre em três estádios
sucessivos com a duração de 6 min cada. No primeiro estádio a carga
é de 7km/h. Em cada novo estádio aumenta-se a carga no valor de
1km/h.
Medições do protocolo original:
• Registar a FC de repouso
• Regulação da velocidade para 7km/h durante 6min.
• Iniciar o teste
• Ao 6º min registar a FC e aumentar a velocidade para 8km/h.
• Ao 12º min Registar a FC e aumentar a velocidade para 9km/h.
• Se não atingir os 170 bpm tem de efetuar mais 6min com a
velocidade a 10 km/h.
• Terminar o teste ao 18º min e registar a FC.
• Atenção: se necessário - caso a FC não tenha atingido os 170
bpm - efetuar mais um estágio de 6 min aumentando a
velocidade para 11 km/h.
! 32 Voltar ao Índice
Den
olin
Cic
loer
góm
etro
Den
olin
Pas
sade
ira
Tare
fas P
rátic
as

TESTES HISTÓRICOS DE AVALIAÇÃO DE PARÂMETROS FISIOLÓGICOS
Provas de Adaptação Cardíaca ao Esforço
Medições adicionais:
• Registar a FC no final do minuto 1 e do minuto 2 do período de
aquecimento.
• Registar a FC minuto a minuto durante o teste.
• Registar a FC no final de cada minuto do período de repouso
ativo (2 min).
• Registar a FC no final de cada minuto, dos 2 min seguintes ao
período de repouso ativo, correspondendo ao período de
repouso passivo.
! 33 Voltar ao Índice
Den
olin
Cic
loer
góm
etro
Den
olin
Pas
sade
ira
Tare
fas P
rátic
as

TESTES HISTÓRICOS DE AVALIAÇÃO DE PARÂMETROS FISIOLÓGICOS
Provas de Adaptação Cardíaca ao Esforço
TAREFAS PRÁTICAS
1. Tarefa fundamental: aplicar os protocolos e analisar os
resultados.
2. Tarefa adicional: realizar as recolhas complementares durante
os testes e analisar os resultados. Para efetuar a tarefa adicional
necessita de registar a FC minuto a minuto durante o teste e,
também, no aquecimento e na recuperação.
3. Efetuar uma síntese por tópicos, dos principais conceitos e
questões chave associados ao tema de trabalho.
Teste de Denolin
Tarefa fundamental
• Aplicar o protocolo e analisar os resultados
Resultados:
• 6º min FC _____ bpm
• 12º min FC _____ bpm
• 18º min FC _____ bpm
! 34 Voltar ao Índice
Den
olin
Cic
loer
góm
etro
Den
olin
Pas
sade
ira
Tare
fas P
rátic
as
TESTES HISTÓRICOS DE AVALIAÇÃO DE PARÂMETROS FISIOLÓGICOS
Provas de Adaptação Cardíaca ao Esforço
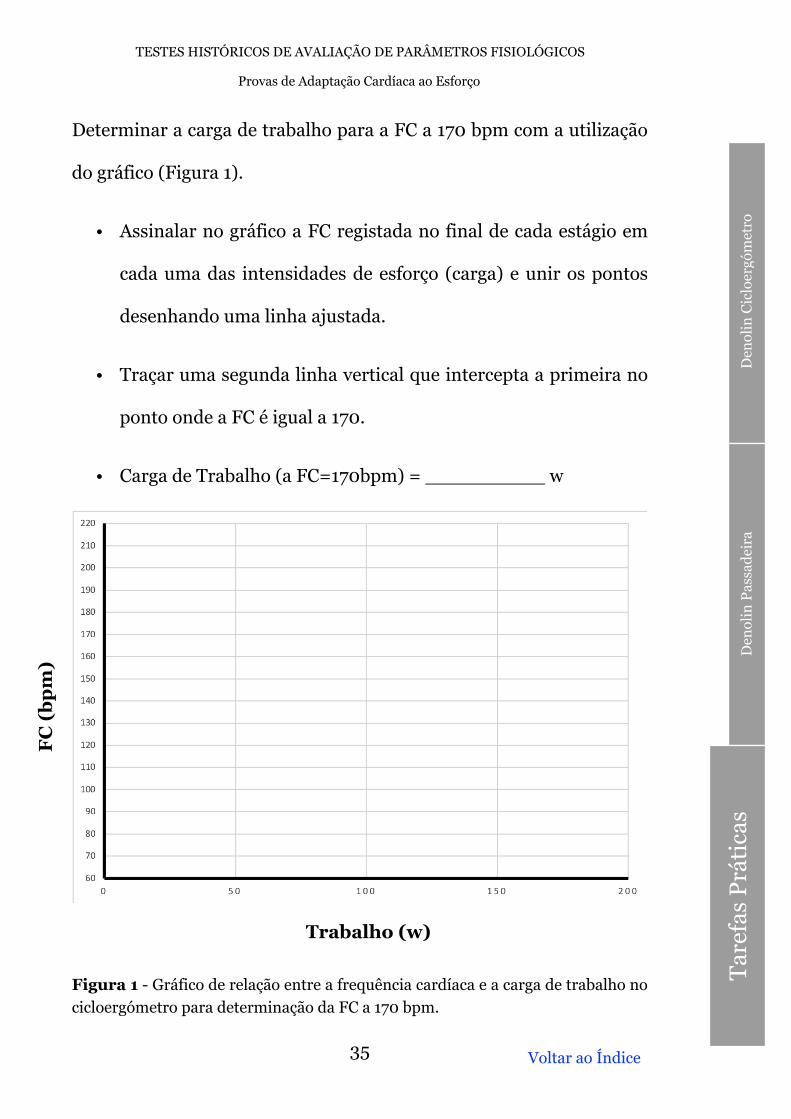
Determinar a carga de trabalho para a FC a 170 bpm com a utilização
do gráfico (Figura 1).
• Assinalar no gráfico a FC registada no final de cada estágio em
cada uma das intensidades de esforço (carga) e unir os pontos
desenhando uma linha ajustada.
• Traçar uma segunda linha vertical que intercepta a primeira no
ponto onde a FC é igual a 170.
• Carga de Trabalho (a FC=170bpm) = __________ w
Figura 1 - Gráfico de relação entre a frequência cardíaca e a carga de trabalho no cicloergómetro para determinação da FC a 170 bpm.
! 35 Voltar ao Índice
Den
olin
Cic
loer
góm
etro
Den
olin
Pas
sade
ira
Tare
fas P
rátic
as
FC (b
pm)
Trabalho (w)

TESTES HISTÓRICOS DE AVALIAÇÃO DE PARÂMETROS FISIOLÓGICOS
Provas de Adaptação Cardíaca ao Esforço
Determinar qual a percentagem da FCmáx e a qual a percentagem da
FCreserva para um esforço realizado com uma FC de 170 bpm e com
carga correspondente no cicloergometro.
• FCmáx. = _______ bpm (consultar o artigo anexo para
determinar a FC máxima)
• FC = 170 bpm ⇔ X% FCmáx: X = ______%
• FCrepouso = _______ bpm
• FCreserva = _______ bpm
• FC = 170 bpm ⇔ X% FCreserva; X = ______%
! 36 Voltar ao Índice
Den
olin
Cic
loer
góm
etro
Den
olin
Pas
sade
ira
Tare
fas P
rátic
as

TESTES HISTÓRICOS DE AVALIAÇÃO DE PARÂMETROS FISIOLÓGICOS
Provas de Adaptação Cardíaca ao Esforço
Tarefa adicional
• Complementarmente, durante o aquecimento, durante o teste e
nos 4 min seguintes ao termino da prova (2 min repouso ativo
mais 2 min repouso passivo), retirar a FC minuto a minuto.
• Fazer o registo das FC no gráfico a cada minuto e assinalar no
gráfico os pontos de aumento da carga.
! 37 Voltar ao Índice
Den
olin
Cic
loer
góm
etro
Den
olin
Pas
sade
ira
Tare
fas P
rátic
as

TESTES HISTÓRICOS DE AVALIAÇÃO DE PARÂMETROS FISIOLÓGICOS
Provas de Adaptação Cardíaca ao Esforço
Figura 2 - Gráfico de relação entre a frequência cardíaca e o tempo de prova no cicloergómetro em diferentes intensidades de esforço.
• Analisar a resposta da da FC:
______________________________________________
______________________________________________
______________________________________________
______________________________________________
______________________________________________
______________________________________________
______________________________________________
! 38 Voltar ao Índice
Den
olin
Cic
loer
góm
etro
Den
olin
Pas
sade
ira
Tare
fas P
rátic
as
FC (b
pm)
Tempo (min)

TESTES HISTÓRICOS DE AVALIAÇÃO DE PARÂMETROS FISIOLÓGICOS
Provas de Adaptação Cardíaca ao Esforço
Adaptação do teste de Denolin à passadeira
Tarefa fundamental
• Aplicar o protocolo e analisar os resultados
Registo de resultados
• 6º min FC _____ bpm
• 12º min FC _____ bpm
• 18º min FC _____ bpm
Determinar a carga de trabalho para a FC a 170 bpm com a utilização
do gráfico.
• Assinalar no gráfico a FC registada no final de cada estágio em
cada uma das intensidades de esforço (carga) e unir os pontos
desenhando uma linha ajustada.
• Traçar uma segunda linha vertical que intercepta a primeira no
ponto onde a FC é igual a 170.
• Carga de Trabalho (a FC=170bpm) = __________ km/hora
! 39 Voltar ao Índice
Den
olin
Cic
loer
góm
etro
Den
olin
Pas
sade
ira
Tare
fas P
rátic
as

TESTES HISTÓRICOS DE AVALIAÇÃO DE PARÂMETROS FISIOLÓGICOS
Provas de Adaptação Cardíaca ao Esforço
Figura 3 - Gráfico de relação entre a frequência cardíaca e a carga de trabalho na passadeira para determinação da FC a 170 bpm.
Determinar qual a percentagem da FCmáx e a qual a percentagem da
FCreserva para um esforço realizado com uma FC de 170 bpm e com
carga correspondente no na passadeira.
• FCmáx = _______ bpm (consultar o artigo anexo para
determinar a FC máxima)
• FC = 170 bpm ⇔ X% FCmáx; X = ______%
• FCrepouso = _______ bpm
• FCreserva = _______ bpm
• FC = 170 bpm ⇔ X% FCreserva; X = ______%
! 40 Voltar ao Índice
Trabalho (Km/h)
FC (b
pm)
Den
olin
Cic
loer
góm
etro
Den
olin
Pas
sade
ira
Tare
fas P
rátic
as

TESTES HISTÓRICOS DE AVALIAÇÃO DE PARÂMETROS FISIOLÓGICOS
Provas de Adaptação Cardíaca ao Esforço
Tarefa adicional
• Complementarmente, durante o aquecimento, durante o teste e
nos 4 min seguintes (2 min repouso ativo mais 2 min repouso
passivo), retirar a FC minuto a minuto.
• Fazer o registo das FC no gráfico a cada minuto e assinalar no
gráfico os pontos de aumento da carga.
Figura 4 - Gráfico de relação entre a frequência cardíaca e o tempo de prova na passadeira em diferentes intensidades de esforço.
! 41Voltar ao Índice
FC (b
pm)
Tempo (min)
Den
olin
Cic
loer
góm
etro
Den
olin
Pas
sade
ira
Tare
fas P
rátic
as

TESTES HISTÓRICOS DE AVALIAÇÃO DE PARÂMETROS FISIOLÓGICOS
Provas de Adaptação Cardíaca ao Esforço
• Analisar a resposta da da FC:
______________________________________________
______________________________________________
______________________________________________
______________________________________________
______________________________________________
______________________________________________
______________________________________________
! 42 Voltar ao Índice
Den
olin
Cic
loer
góm
etro
Den
olin
Pas
sade
ira
Tare
fas P
rátic
as

TESTES HISTÓRICOS DE AVALIAÇÃO DE PARÂMETROS FISIOLÓGICOS
NOTAS FINAIS
As provas de recuperação cardíaca após esforço apresentam-se como
uma opção válida para determinar a aptidão física de um indivíduo,
porém admitindo as seguintes limitações:
• Os resultados dos testes históricos abordados são pouco
precisos.
• Todos os testes fazem referência a uma população que nem é
geral nem específica, apresentando os resultados de forma
qualitativa, através de uma classificação de 3 a 5 categorias.
• As classificações qualitativas, quando analisadas de um ponto
de vista estatístico, não permitem uma comparação entre
indivíduos de uma mesma categoria.
• Todas as técnicas empregues permitem, quanto muito, uma
difícil comparação.
• Os testes permitem determinar os indivíduos inaptos, porém,
não apresentam nenhum critério comum para definir os limites
de inaptidão.
! 43
Voltar ao Índice

• A duração da recuperação da FC ao esforço não apresenta
correlação com a capacidade de realização de um exercício
maximal.
Da mesma forma, as provas de adaptação cardíaca ao esforço, apesar
de apresentarem vantagens relativamente à facilidade de aplicação
dos procedimentos, apresentam as seguintes limitações:
• A margem de erro de determinação da capacidade aeróbia
ronda os 20% (1).
• Quando aplicada a populações mais aptas, torna-se difícil
atingir a FC determinada durante os estágios propostos.
• Os materiais necessários para a aplicação dos protocolos,
concretamente o cicloergómetro e a passadeira, podem
representar um impedimento financeiro para alguns estudos.
Todos os testes abordados neste livro, apesar das diversas limitações,
permitem contrastar os métodos de medição manuais com os
métodos de medição tecnológicos, o que acreditamos ser uma boa
abordagem inicial às bases da fisiologia do exercício e da atividade
física.
! 44 Voltar ao Índice

TESTES HISTÓRICOS DE AVALIAÇÃO DE PARÂMETROS FISIOLÓGICOS
REFERÊNCIAS
1. Vogelaere P, Balaguer N. Aptitud física y técnicas de medición. Apunts
Medicina de l" Esport (Castellano). 1982;19(075):157-67.
2. Lian C. Epreuve d'aptitude Physique á l'effort. Presse Médicale. 1916(24):
563-7.
3. Martinet A. Épreuve fonctionnelle circulatoire. Appréciation de la
puissance de réserve du cœur. Presse médicale. 1916;117:223-45.
4. Brouha L. The step test: A simple method of measuring physical fitness for
muscular work in young men. Research Quarterly American Association for
Health, Physical Education and Recreation. 1943;14(1):31-7.
5. Brouha L, Health C, Graybiel A. Step Test Simple Method of Measuring
Physical Fitness for Hard Muscular Work in Adult Men. Reviews of Canadian
Biology. 1943;2:86.
6. Nishime EO, Cole CR, Blackstone EH, Pashkow FJ, Lauer MS. Heart rate
recovery and treadmill exercise score as predictors of mortality in patients
referred for exercise ECG. Jama. 2000;284(11):1392-8.
7. Cole CR, Blackstone EH, Pashkow FJ, Snader CE, Lauer MS. Heart-rate
recovery immediately after exercise as a predictor of mortality. New England
Journal of Medicine. 1999;341(18):1351-7.
8. Cole CR, Foody JM, Blackstone EH, Lauer MS. Heart rate recovery after
submaximal exercise testing as a predictor of mortality in a cardiovascularly
healthy cohort. Annals of internal medicine. 2000;132(7):552-5.
9. Borms J, Hebbelinck M. Profiles of Physical Education Teachers and
students Lab. of Human Biometry and movement analysis. Vrije Universiteit,
Brussel. 1977.
! 45 Voltar ao Índice

TESTES HISTÓRICOS DE AVALIAÇÃO DE PARÂMETROS FISIOLÓGICOS
10. Montoye HJ, Ayen T, Washburn RA. The Estimation of [Vdot] O2max
from Maximal and Sub-Maximal Measurements in Males, Age 10–39. Research
Quarterly for Exercise and Sport. 1986;57(3):250-3.
11. Wyndham C. Submaximal tests for estimating maximum oxygen intake.
Canadian medical association journal. 1967;96(12):736.
12. Astrand P-O. Experimental studies of physical work capacity in relation to
sex and age. Dissertation. 1952.
13. FOX III S. Physical activity and the prevention of coronary heart disease.
Ann Clin Res. 1971;3:404-32.
14. Degre S, Denolin H. Study of physical fitness by determination of heart
rate during exertion and during the recovery pedriod. Acta cardiologica.
1965;20:17.
! 46
Voltar ao Índice

TESTES HISTÓRICOS DE AVALIAÇÃO DE PARÂMETROS FISIOLÓGICOS
ANEXOS
! 47
Prediction of Maximal Heart Rate
1
JEPonline Journal of Exercise Physiologyonline
Official Journal of The American
Society of Exercise Physiologists (ASEP)
ISSN 1097-9751 An International Electronic Journal
Volume 5 Number 2 May 2002
Commentary
THE SURPRISING HISTORY OF THE “HRmax=220-age” EQUATION
ROBERT A. ROBERGS AND ROBERTO LANDWEHR Exercise Physiology Laboratories, The University of New Mexico, Albuquerque, NM
ABSTRACT THE SURPRISING HISTORY OF THE “HRmax=220-age” EQUATION. Robert A. Robergs, Roberto
Landwehr. JEPonline. 2002;5(2):1-10. The estimation of maximal heart rate (HRmax) has been a feature of exercise physiology and related applied sciences since the late 1930’s. The estimation of HRmax has been largely based on the formula; HRmax=220-age. This equation is often presented in textbooks without explanation or citation to original research. In addition, the formula and related concepts are included in most certification exams within sports medicine, exercise physiology, and fitness. Despite the acceptance of this formula, research spanning more than two decades reveals the large error inherent in the estimation of HRmax (Sxy=7-11 b/min). Ironically, inquiry into the history of this formula reveals that it was not developed from original research, but resulted from observation based on data from approximately 11 references consisting of published research or unpublished scientific compilations. Consequently, the formula HRmax=220-age has no scientific merit for use in exercise physiology and related fields. A brief review of alternate HRmax prediction formula reveals that the majority of age-based univariate prediction equations also have large prediction errors (>10 b/min). Clearly, more research of HRmax needs to be done using a multivariate model, and equations may need to be developed that are population (fitness, health status, age, exercise mode) specific. Key Words: Cardiovascular function, Estimation, Error, Exercise prescription, Fitness. INTRODUCTION This short manuscript has been written to provide insight into the history of the maximal heart rate (HRmax) prediction equation; HRmax=220–age. Surprisingly, there is no published record of research for this equation. As will be explained, the origin of the formula is a superficial estimate, based on observation, of a linear best fit to a series of raw and mean data compiled in 1971 (1). However, evidence of the physiological study of maximal heart rate prediction dates back to at least 1938 from the research of Sid Robinson (2). Research since 1971 has revealed the error in HRmax estimation, and there remains no formula that provides acceptable accuracy of HRmax prediction. We present the majority of the formulae that currently exist to
Voltar às Tarefas Práticas

TESTES HISTÓRICOS DE AVALIAÇÃO DE PARÂMETROS FISIOLÓGICOS
! 48
Prediction of Maximal Heart Rate
2
estimate HRmax, and provide recommendations on which formula to use, and when. We also provide recommendations for research to improve our knowledge of the between subjects variability in HRmax. THE IMPORTANCE OF MAXIMAL HEART RATE
Heart rate is arguably a very easy cardiovascular measurement, especially in comparison to the invasive or noninvasive procedures used to estimate stroke volume and cardiac output. Consequently, measurement of heart rate is routinely used to assess the response of the heart to exercise, or the recovery from exercise, as well as to prescribe exercise intensities (3). Given that the increase in heart rate during incremental exercise mirrors the increase in cardiac output, maximal heart rate is often interpreted as the upper ceiling for an increase in central cardiovascular function. Indeed, research for the last 100 years has demonstrated that heart rate does in fact have a maximal value (4); one that cannot be surpassed despite continued increases in exercise intensity or training adaptations. Perhaps the most important application of the heart rate response to exercise has been the use of submaximal heart rate, in combination with resting and maximal heart rate, to estimate VO2max. In many instances, maximal heart rate estimation is recommended by using the formula HRmax=220-age. Based on this application, heart rate responses to exercise have been used to calculate exercise intensities, such as a percent of maximal heart rate (%HRmax) or a percent of the heart rate reserve (%HRR) (Table 1).
HISTORY OF MAXIMAL HEART RATE
PREDICTION Due to our interest in improving the accuracy of maximal heart rate estimation, we have tried to research the origin of the formula HRmax=220-age (Tables 2 and 3). As far as we could determine from books and research, the first equation to predict maximal heart rate was developed by Robinson in 1938 (2). His data produced the equation HRmax=212-0.77(age), which obviously differs from the widely accepted formula of HRmax=220-age. As we will explain below, there are numerous HRmax prediction equations (Table 3), yet it is the history of the HRmax=220-age equation that is most interesting. The Formula: “HRmax=220-Age”
Within textbooks, failure to cite the original research regarding the formula HRmax=220-age indirectly affirms a connection to Karvonen. This association exists due to the textbook presentation of HRmax prediction with the concept of a heart rate reserve, which was devised by Karvonen (3). Ironically, the study of Karvonen was not of maximal heart rate. To clarify, Dr. Karvonen was contacted in August of 2000 and subsequent discussion indicated that he never published original research of this formula, and he recommended that we research the work of Dr. Åstrand to find the original research. Another citation for the formula is Åstrand (7). Once again, this study was not concerned with HRmax prediction. We were able to discuss this topic with Dr. Åstrand in September 2000 while he was in Albuquerque to receive his Lifetime Achievement Award in Exercise Physiology from the American Society of Exercise Physiologists. Dr. Åstrand stated that he did not publish any data that derived this formula. However,
Table 1: Use of heart rate to estimate
exercise intensities that coincide with
%VO2max. %VO2max % HRmax %HRR*^
40 63 40 50 69 50 60 76 60 70 82 70 80 89 80 90 95 90 *based on Karvonen method (HR=HRrest + ((intended fraction) * (HRmax - HRrest))); ^%HRR equals the intended fraction expressed as % Adapted from Heyward V. (5) and Swain et al. (6)
Voltar às Tarefas Práticas

TESTES HISTÓRICOS DE AVALIAÇÃO DE PARÂMETROS FISIOLÓGICOS
! 49
Prediction of Maximal Heart Rate
3
he did comment that in past presentations he had stated that such a formula appears close to research findings, and would be a convenient method to use. Interestingly, Åstrand published original HRmax data for 225 subjects (115 male, 110 female) for ages 4 to 33 years in one of his earlier texts (8). The data are from either treadmill or cycle ergometer exercise tests to VO2max, with no knowledge of protocol characteristics. This data is presented in Figure 1a and b. When data for ages >10 years are used (Figure 1b), there is a significant correlation (r=0.43), yet considerable error (Sxy=11 b/min). The resulting formula is; HRmax = 216.6–0.84(age). Despite the similarity of the prediction equation to HRmax=220–age, the notable feature of this data set is the large error of prediction. Interestingly, in two other studies, Åstrand found that the average decrease in HRmax for women was 12 beats in 21 years (9) and 19 beats in 33 years (10). For men, the decrease in HRmax was 9 beats in 21 years (9) and ~26 in 33 years (10). If the formula HRmax=220-age is correct, the slope for HR decrement with increasing age would be 1. In addition, Åstrand’s data
Table 2: The research and textbooks, and the citations used or
not used, in crediting the source of the HRmax=220-age
formula. Publication Year Citation
Research
Engels et al. 1998 Fox & Haskell, 1971 O’Toole et al. 1998 ACSM. 1995 Tanaka 2001 Fox & Haskell, 1971 Vandewalle & Havette 1987 Astrand, 1986 Whaley et al. 1992 Froelicher,1987 Textbooks
ACSM 2001 ACSM, 2000 Baechle & Earle 2000 No Citation Baumgartner & Jackson 1995 No Citation Brooks et al. 2000 No Citation Fox et al. 1989 No Citation Garret & Kirkendall 2000 No Citation Heyward 1997 No Citation McArdle, Katch & Katch 1996 Londeree, 1982 McArdle, Katch & Katch 2000 No Citation Nieman 1999 No citation Plowman & Smith 1997 Miller et al. 1993 Powers & Howley 1996 No Citation Robergs & Roberts 1997 Hagberg et al, 1985 Robergs & Roberts 2000 No Citation Roberts et al. 1997 Asmussen, 1959 Rowland 1996 No Citation Wasserman et al. 1994 No Citation Wilmore & Costill 1999 No Citation
a.
2 6 10 14 18 22 26 30 34160
175
190
205
220
235
250
Age (years)
HR
max (
b/m
in)
Figure 1: Data of HRmax for a) 225 subjects, 4 to 33 years, and b) a subset of
the subjects, ages 11 to 33 years, n=196.
Voltar às Tarefas Práticas

TESTES HISTÓRICOS DE AVALIAÇÃO DE PARÂMETROS FISIOLÓGICOS
! 50
Prediction of Maximal Heart Rate
4
indicates that HRmax prediction from such formula should not be used on children 10 years or younger, as HRmax follows a different age associated change for children. In addition, the likelihood that children attain a true HRmax during exercise testing can be questioned. It appears that the correct citation for the origin of HRmax=220-age is Fox et al. (1). However, and as explained by Tanaka et al. (11), Fox did not derive this equation from original research. We evaluated the original manuscript of Fox et al. (1), which was a large review of research pertaining to physical activity and heart disease. In a section subtitled “Intensity”, a figure is presented that
contains the data at question, and consists of approximately 35 data points. No regression analysis was performed on this data, and in the figure legend the authors stated that; “….no single line will adequately represent the
data on the apparent decline of maximal heart
rate with age. The formula maximum heart
rate=220–age in years defines a line not far
from many of the data points..”
We decided to replicate the approach used by Fox et al (1), using the original data presented in their manuscript. As we could not find all manuscripts due to inaccurate citations, we reproduced the data from the figure and presented it in Figure 2. We fit a linear
regression to the data set and derived the following equation; HRmax=215.4 – 0.9147(age), r=0.51, Sxy=21 b/min. Thus, even the original data from which observation established the HRmax=220-age formula does no support this equation. REVIEW OF RESEARCH OF MAXIMAL HEART RATE
We retrieved as much of the research on HRmax as is possible. This was a daunting task, as many of the original research and review studies on this topic did not provide complete references, or citations of the original research of this topic. We collated 43 formulae from different studies, and these are presented in Table 3, along with pertinent statistics when possible. To verify if there was a trend towards the equation HRmax=220-age, we selected 30 equations from the ones presented in Table 3 (excluded equations derived from non-healthy subjects). The equations were used to re-calculate HRmax for ages 20 to 100 years of age, and a new regression equation was calculated from the data (Figure 3). The regression equation yielded a prediction formula; HRmax=208.754-0.734(age), r=0.93 and Sxy=7.2, which is very close to that derived by Tanaka et al. (11) (Table 3).
b.
10 14 18 22 26 30 34160
180
200
220
240
HRmax = (-0.8421*age) + 216.6
r2 = 0.1859 ; Sy.x = 11 b/min
Age (years)H
Rm
ax
(b
/min
)
0 10 20 30 40 50 60 70140
150
160
170
180
190
200
210
220Robinson
Astrand
Astrand2
Bruce
Binkhorst
Anderson
Lester
Kasch
Saltin
Hollman
Unknown
HRmax = 215.4 - (0.9147*Age)
Age (yr)
HR
max (
b/m
in)
Figure 2. A reproduced figure from the data of Fox et al. (1)
which was used to derive the original HRmax=220-age formula.
Blue line represents line of best fit. Red line represents 220-age.
Voltar às Tarefas Práticas

TESTES HISTÓRICOS DE AVALIAÇÃO DE PARÂMETROS FISIOLÓGICOS
! 51
Prediction of Maximal Heart Rate
5
Table 3. The known univariate prediction equations for maximal heart rate. Study N Population Mean Age
(range)
Regression
(HRmax=)
r2 Sxy
Univariate Equations
Astrand, in
Froelicher (2)
100 Healthy Men – cycle ergometer
50 (20 - 69) 211-0.922a N/A N/A
Brick, in Froelicher
(2)
? Women N/A 226-age N/A N/A
Bruce (12) 1295 CHD 52±8 204-1.07a 0.13 22 Bruce (12) 2091 Healthy Men 44±8 210-0.662a 0.19 10 Bruce (12) 1295 Hypertension 52±8 204-1.07a 0.24 16 Bruce (12) 2091 Hypertension + CHD 44±8 210-0.662a 0.10 21 Cooper in
Froelicher (2)
2535 Healthy Men 43(11 - 79) 217-0.845a N/A N/A
Ellestad in
Froelicher (2)
2583 Healthy Men 42(10-60) 197-0.556a N/A N/A
Fernhall (13) 276 Mental Retardation 9-46 189-0.56a 0.09 13.8 Fernhall (13) 296 Healthy W & M N/A 205-0.64a 0.27 9.9 Froelicher (2) 1317 Healthy Men 38.8(28-54) 207-0.64a 0.18 10 Graettinger (14) 114 Healthy Men (19-73) 199-0.63a 0.22 N/A Hammond (15) 156 Heart Disease 53.9 209-age 0.09 19 Hossack (16) 104 Healthy Women (20-70) 206-0.597a 0.21 N/A Hossack (16) 98 Healthy Men (20-73) 227-1.067a 0.40 N/A Inbar (17) 1424 Healthy W & M 46.7(20-70) 205.8-.685a 0.45 6.4 Jones (18) 100 Healthy W & M cycle
ergometer (15 – 71) 202-0.72a 0.52 10.3
Jones N/A ? Healthy W &M 210-0.65a 0.04 N/A Jones (18) 60 Healthy Women (20-49) 201-0.63a N/A Lester (19) 48 W & M Trained 205-0.41a 0.34 N/A Lester (19) 148 W & M Untrained 43(15 – 75) 198-0.41a N/A N/A Londeree (20) ? National Level Athletes N/A 206.3-0.711a 0.72 N/A Miller (21) 89 W & M Obese 42 200-0.48a 0.12 12 Morris, in
Froelicher (2)
1388 Heart Disease 57(21 – 89) 196-0.9a 0.00 N/A
Morris, in
Froelicher (2)
244 Healthy Men 45(20 – 72) 200 -0.72a 0.30 15
Ricard (22) 193 Treadmill W&M 209 -0.587a 0.38 9.5 Ricard (22) 193 W & M - cycle
ergometer 200 -0.687a 0.44 9.5
Robinson 1938 in
Froelicher (2)
92 Healthy Men 30(6 - 76) 212 -0.775a 0.00 N/A
Rodeheffer (23) 61 Healthy Men 25 - 79 214-1.02a 0.45 N/A Schiller 24) 53 Women Hispanic 46(20-75) 213.7-0.75a 0.56 N/A Schiller (24) 93 Women Caucasian 42(20-75) 207 -0.62a 0.44 N/A Sheffield (25) 95 Women 39(19 - 69) 216 -0.88a 0.58 N/A Tanaka (11) ? Sedentary W&M 211 -0.8a 0.81 N/A Tanaka (11) ? Active W&M 207 -0.7a 0.81 N/A Tanaka (11) ? Endurance trained W&M 206 -0.7a 0.81 N/A
Voltar às Tarefas Práticas

TESTES HISTÓRICOS DE AVALIAÇÃO DE PARÂMETROS FISIOLÓGICOS
! 52
Prediction of Maximal Heart Rate
6
Study N Population Mean Age
(range)
Regression
(HRmax=)
r2 Sxy
Univariate Equations
Tanaka (11) Women & Men 208-0.7a 0.81 N/A Whaley (26) 754 Women 41.3(14-77) 209-0.7a 0.37 10.5 Whaley (26) 1256 Men 42.1(14-77) 214-0.8a 0.36 10.7 W=women, M=men Table 4. The known multivariate prediction equations for maximal heart rate.
Study and Equations r2
Londeree (20) PMHR = 196.7+1.986xC2+5.361xE+1.490xF4+3.730xF3+4.036xF2-00006xA
4-0.542xA
2 0.77
PMHRI = 199.1+0.119xAEF4+0.112xAE+6.280xEF3+2.468xC2+3.485xF2-.00006xA4-0.591xA 0.78
PMHRC = 205-3.574xT1+8.316xE-7.624xF5-.00004xA4-0.624xA
2 0.85
PMHRCI = 205-0.116xAEF3-0.223xAF5+0.210xAE+6.876xEF3+2.091xC2-3.310xT1-
0.0005xA4-0.654xA
0.86
PMHR (National Collegiate Athletes) = 202.8-0.533xA-00006xA4 0.73 PMHR=predicted maximal heart rate, C=Cross Sectional, I=interaction; a=A=age; A2=age; A4= (age4)/1000; C#=continent ( if European, then C2=1, otherwise C2=0); E=ergometer (if treadmill, then E=1, if bicycle then E=0); F#=fitness level (if sedentary, F2=1, otherwise F2=0; if active then F3=1, otherwise F3=0, if endurance trained, then F4=1, otherwise F4=0; Type # =type of exercise protocol (if continuous and incremental, then T1=1, otherwise T1=0). Multiple letters interaction terms which should be multiplied together. Interestingly, Londeree (20) developed a multivariate equation using the variables age, age2, age4/1000, ethnicity, mode of exercise, activity levels, and type of protocol used to assess HR (Table 4). However, no statistical results pertaining to significant increases in the explanation of variance in HRmax using a mutivariate model was provided by the authors. The same criticism applies to the study of Tanaka et al. (11). As Zavorsky (27) showed that endurance training lowers HRmax, and others have shown the exercise mode specificity of HRmax (28,29,30), an original study of HRmax using multiple independent variables is long overdue. The data from research of HRmax are clear in showing the large error of HRmax prediction using just a y-intercept and slope when age is the sole independent variable. Furthermore, the results and regression equations need to be recognized as being mode–specific (28,29,30). It is unfortunate that the mode-specificity of HRmax prediction equations is not clearly addressed in textbooks of exercise physiology and exercise prescription. Finally, even a multivariate model of HRmax prediction and variance explanation does not reduce the error of HRmax prediction.
20 30 40 50 60 70 80140
150
160
170
180
190
200
Compiled studies average
220-age
Londeree meta-analysis
Tanaka meta-analysis
Age (yrs)
Maxim
al H
eart
Ra
te(b
/min
)
Regression Lines
Figure 3. Regression lines from data obtained from 220-age,
the mean of 30 studies from Table 3, and the meta analyses
of Londeree (28) and Tanaka (47).
Voltar às Tarefas Práticas

TESTES HISTÓRICOS DE AVALIAÇÃO DE PARÂMETROS FISIOLÓGICOS
! 53
Prediction of Maximal Heart Rate
7
What is an Acceptable Error of HRmax Prediction? Given the precision of HR measurement, the measurement error of HRmax is small and attributable to the exercise protocol and subject motivation. Consequently, HRmax measurement is likely to be accurate to within ±2 b/min, if the subject truly attains maximal exertion. Nevertheless, another factor to consider is the impact of prediction error on the application of HRmax. For the estimation of two exercise intensities (Table 5), HRmax prediction errors (HRmax–predicted=error) of 2, 4, 6 and 8 b/min cause negligible error. For example, a HR of 150 b/min, which lies in the center of the “true” heart rate prescription range, remains within the recommended heart rate ranges for all error examples. However, as revealed in Table 3, errors in HRmax estimation can be in excess of 11 b/min. Consequently, it is likely that current equations used to estimate HRmax are not accurate enough for prescribing exercise training heart rate ranges for a large number of individuals. Table 5. Estimations of error in submaximal exercise intensities and VO2max when using HRmax
estimated with errors of 2, 4, 6, and 8 b/min (underestimated prediction of HRmax).
HR values For Given HRmax Error (True-Estimated, b/min (%))
Intensity True 2 (1) 4 (2.1) 6 (3.1) 8 (4.2) Submaximal exercise intensities 60-80% HRR 135-164 134-162 133-160 132-159 130-157 VO2max
YMCA* (mL/min) 4200 4083 6967 3850 3733 Error (mL/min) 0 117 233 350 467
Error (%) 0 2.8 5.6 8.3 11.11 Calculations are based on assuming a resting heart rate of 50 b/min, for a 25 year old person with a HRmax=192 b/min ; HRR=heart rate reserve ; for YMCA protocol, heart rates and workloads were assumed to be (HR:kgm/min) 90:150, 125:750, 153:1200, respectively. When the prediction of HRmax is used in the estimation of VO2max, as it is in the YMCA method, there can be considerable errors in estimated VO2max (Table 5). For example, when HRmax is underestimated by 6 b/min, there is a resulting error in estimated VO2max of 350 mL/min. This equates to an error of -8.3%, or -4.7 mL/kg/min for a 75 kg person. The data of Table 5 help in selecting a suitable error in HRmax estimation. The error can be larger for purposes of prescribing training heart rate ranges than in the estimation of VO2max. For purposes of prescribing training heart rate ranges, errors ≤8 b/min are likely to be acceptable. However, for VO2max, it can be argued that prediction errors in HRmax need to be <±3 b/min. CONCLUSIONS AND RECOMMENDATIONS
Based on this review of research and application of HRmax prediction, the following recommendations can be made; 1. Currently, there is no acceptable method to estimate HRmax. 2. If HRmax needs to be estimated, then population specific formulae should be used. However, the most accurate general equation is that of Inbar (17) (Table 3); HRmax=205.8-0.685(age). Nevertheless, the error (Sxy=6.4 b/min) is still unacceptably large. 3. An acceptable prediction error for HRmax for application to estimation of VO2max is <±3 b/min. Thus, for a person with a HRmax of 200 b/min, error equals ±1.5%. If this precision is not possible, then there is no justification for using methods of VO2max estimation that rely on HRmax prediction formulae.
Voltar às Tarefas Práticas

TESTES HISTÓRICOS DE AVALIAÇÃO DE PARÂMETROS FISIOLÓGICOS
! 54
Prediction of Maximal Heart Rate
8
4. Additional research needs to be performed that develops multivariate regression equations that improve the accuracy of HRmax prediction for specific populations, and modes of exercise. 5. The use of HRmax is most prevalent in the fitness industry, and the people who work in these facilities mainly have a terminal undergraduate degree in exercise science or related fields. These students/graduates need to be better educated in statistics to recognize and understand the concept of prediction error, and the practical consequences of relying on an equation with a large standard error of estimate (Sxy). 6. Textbooks in exercise physiology and exercise prescription should contain content that is more critical of the HRmax=220-age or similar formulae. Authors need to stress the mode-specificity of HRmax, provide alternate, research substantiated formula, and express all content of items 1-5, above. Similarly, academic coverage of HRmax needs to explain how this error detracts from using HRmax estimation in many field tests of physical fitness and in exercise prescription. Address for correspondence: Robert A. Robergs, Ph.D., FASEP, EPC, Director-Exercise Physiology Laboratories, Exercise Science Program, Department of Physical Performance and Development, Johnson Center, Room B143, The University of New Mexico, Albuquerque, NM 87131-1258, Phone: (505) 277-2658, FAX: (505) 277-9742; Email: [email protected] REFERENCES 1. Fox III, S.M. Naughton, J.P. and Haskell, W.L. Physical activity and the prevention of coronary heart disease. Ann Clin Res 1971;3:404-432. 2. Froelicher, V.F. & Myers, J.N. 2000; Exercise and the heart. 4th ed. Philadelphia: W.B. Saunders Company. 3. Karvonen, M.J., Kentala, E. and Mustala, O. The effects of training on heart rate: a longitudinal study. Ann
Med Exper Fenn 1957;35(3):307-315. 4. Lusk G. 1928; The elements of the science of nutrition. WB Saunders, Philadelphia. 5. Heyward V. H. 1997; Advanced fitness assessment and prescription. 3rd ed. Human Kinetics, Champaign Illinois. 6. Swain, D. P., Abernathy, K.S., Smith, C.S. Lee, S.J. and Bunn, S.A. Target heart rates for the development of cardiorespiratory fitness. Med Sci Sports Exerc 1994;26 (1):112-116. 7. Wandewalle GP and Havette P. Heart rate, maximal heart rate and pedal rate. J Sports Med 1987;27:205-210. 8. Åstrand, P. 1952; Experimental studies of physical working capacity in relation to sex and age. Copenhagen, Musksgaard. 9. Åstrand, I., Åstrand, P.-O., Halback, I and Kilbom. A. Reduction in maximal oxygen uptake with age. J
Appl Physiol 1973;35(5):649 – 654. 10. Åstrand, P.-O., Bergh, U. and Kilbom, A. A 33-yr follow-up of peak oxygen uptake and related variables of former physical education students. J Appl Physiol 1997;82(6):1844-1852. 11. Tanaka , H., Monahan, K.G. and Seals, D.S. Age – predicted maximal heart rate revisited. J Am Coll
Cardiol 2001;37:153-6. 12. Bruce, R.A., Fisher, L.D., Cooper, M.N. and Grey, G.O. Separation of effects of cardiovascular disease and age on ventricular function with maximal exercise. Am J Cardiol 1974;34(7):757-763. 13. Fernhall, B., McCubbin J.A., Pitetti, K.H., Rintala, P, Rimmer, J.H., Millar A.L. and Silva A. Prediction of maximal heart rate in individuals with mental retardation. Med Sci Sport Exerc 2001;33(10):1655-1660. 14. Graettinger W.F., Smith D.H.G., Neutel J.M., Myers J., Froelicher V.F. and Weber, M.(1995). Relationship of left ventricular structure to maximal heart rate during exercise. Chest 107(2):341-345. 15. Hammond, H.K, Kelly, T.L. and Froelicher, V. Radionucleotide imaging correlates of heart rate impairment during maximal exercise testing. J Am Col Cardiol 1983;2(5):826-33.
Voltar às Tarefas Práticas

TESTES HISTÓRICOS DE AVALIAÇÃO DE PARÂMETROS FISIOLÓGICOS
! 55
Prediction of Maximal Heart Rate
9
16. Hossack KF and Bruce RA. Maximal cardiac function in sedentary normal men and women: comparison of age-related changes. J Appl Physiol 1982;53(4):799-804. 17. Inbar, O. Oten, A., Scheinowitz, M., Rotstein, A., Dlin, R. and Casaburi, R. Normal cardiopulmonary responses during incremental exercise in 20-70-yr-old men. Med Sci Sport Exerc 1994;26(5):538-546. 18. Jones, N.L., Makrides, L., Hitchcock, C., Chypchar, T. and McCartney, N. Normal standards for an incremental progressive cycle ergometer test. Am Rev Respir Dis 1985;131:700-708. 19. Lester, M., Sheffield, L.T. Trammel, P. and Reeves, T.J. The effect of age and athletic training on the maximal heart rate during muscular exercise. Am Heart J 1968;76(3):370–376. 20. Londeree, B.R. and Moeschberger, M.L. Effect of age and other factors on maximal heart rate. Res Quarter Exerc Sport 1982;53(4):297-304. 21. Miller, W.C., Wallace, J.P. & Eggert, K.E. Predicting max hr and the HR-VO2 relationship for exercise prescription in obesity. Med Sci Sports Exerc 1993;25(9):1077-1081. 22. Ricard, R.M., Leger, L. and Massicotte, D. Validity of the “220-age formula” to predict maximal heart rate. Med Sci Sports Exerc 1990;22(2):Supplement S96(Abstract 575). 23. Rodeheffer, R.J., Gerstenblith, G., Becker, L.C. Fleg, J.L. Weisfeldt, M.L. and Lakatta, E. Exercise cardiac output is maintained with advancing age in healthy human subjects: cardiac dilatation and increased stroke volume compensate for a diminished heart rate. Circulation 1984;69(2):203 – 213. 24. Schiller, B.C., Casas, Y.G., DeSouza, A. and Seals, D.R. Maximal aerobic capacity across age in healthy Hispanic and Caucasian women. J Appl Physiol 2001;91(3):1048-1054. 25. Sheffield, L.T, Maloof, J.A. Sawyer, J.A. and Roitman, D. Maximal heart rate and treadmill performance of healthy women in relation to age. Circulation 1978;57(1):79-84. 26. Whaley, M.W, Kaminsky, L.A, Dwyer, G.B., Getchell, L.H. and Norton, J.A. Predictors of over - and underachievement of age – predicted maximal heart rate. Med Sci Sports Exerc 1992;24(10):1173-1179. 27. Zavorsky, G.S. Evidence and possible mechanisms of altered maximum heart rate with endurance training and tapering. Sports Med 2000;29(1):13-26. 28. Kravitz L., R.A. Robergs, V.H. Heyward, D.R. Wagner and K. Powers. Exercise mode and gender comparisons of energy expenditure at self-selected intensities. Med Sci Sports Exerc 1997;29(8):1028-1035. 29. Tanaka, H. Fukumoto, S. Osaka, Y., Ogawa. S., Yamaguchi, H. and Miyamoto, H. Distinctive effects of three different modes of exercise on oxygen uptake, heart rate and blood lactate and pyruvate. Int J Sports Med 1991;12:433-438. 30. Cassady, S. and Nielsen, D.H. Cardiorespiratory responses of healthy subjects to calisthenics performed on land versus in water. Physical Therapy 1992;72(7):532-537. 31. Engels, H.J., Zhu, W. and Moffatt, R.J. An empirical evaluation of the prediction of maximal heart-rate. Res
Quart Exerc Sport 1998;69(1):94-98. 32. O’Toole, M.L., Douglas, P.S. and Hiller, W.D.B. Use of heart monitors by endurance athletes: lessons from triathletes. J Sports Med 1998;38:181-187. 33. American College of Sports Medicine 2000; ACSM’s guidelines for exercise testing and prescription. 6th ed. Philadelphia: Lippincott Williams & Wilkins. 34. American College of Sports Medicine. 2001; ACSM’s resource manual: guidelines for exercise testing and prescription. 4th ed. Philadelphia: Lippincott Williams & Wilkins. 35. Baechle, T.R. & Earle, R.W., (editors). 2000; Essentials of strength training and conditioning - NSCA - 2nd ed. Human Kinetics Champaign, Illinois: Human Kinetics. 36. Baumgartner, T.A. & Jackson, A.S. 1995; Measurement for evaluation in physical education and exercise science. 5th ed. Madison, Wisconsin: Wm. C. Brown & Benchmark, Inc. 37. Brooks, G.A., Fahey, T.D., White, T.P. & Baldwin, K.M. 2000; Exercise physiology: human bioenergetics and its applications. 3rd ed. Mountain View, California: Mayfield. 38. Fox, E.L., Bowers, R.W. & Foss, M.L. 1989; The Physiological basis of physical education and athletics, 4th ed. Philadelphia: W.B. Saunders Company.
Voltar às Tarefas Práticas

!