pontifícia universidade católica do rio grande do sul faculdade...
TRANSCRIPT

Pontifícia Universidade Católica do Rio Grande do Sul
Faculdade de Biociências
Programa de pós-Graduação em Biologia Celular e Molecular
Título da Dissertação de Mestrado:
Padrões de variabilidade do gene ASIP (Agouti Signaling Protein) em mamíferos
Dissertação apresentada como requisito para a obtenção do título de Mestre em Biologia Celular e Molecular da Faculdade de Biociências, da Pontifícia Universidade Católica do Rio Grande do Sul.
Autor: Daniela Copetti Santos
Orientador: Eduardo Eizirik
Porto Alegre – RS Outubro – 2007.

2
AGRADECIMENTOS
Dedico meu agradecimento a todos aqueles que de alguma maneira me ajudaram a concluir este trabalho. Especialmente agradeço: À Pontifícia Universidade Católica do Rio Grande do Sul, especialmente à Faculdade de Biociências que me acolheu muito bem durante a minha pós-graduação. Às meninas da secretaria do Programa de Pós Graduação em Biologia Celular e Molecular; Maria Luiza Moreira, Cátia Bonacina e Josilene Martins Rocha que com todo o carinho, paciência e competência me mantiveram sempre bem informada sobre os diversos aspectos do programa. Ao doutor Eduardo Eizirik pela sua dedicação, transmitindo seus conhecimentos e pela sua atenção e presteza ao atendimento as minhas solicitações. Aos demais professores e funcionários da Faculdade de Biociências da PUCRS. A todos os colegas do Centro de Biologia Genômica e Molecular principalmente a Ana Carolina Scobar e Manoel Fontoura Rodrigues pela ajuda essencial no desenvolvimento desta pesquisa. Aos colegas Catiane Cusinatto, Fúria Gargano, Vera, Fernanda Gering, Laura de Oliveira e Faiz Abdalla. Aos meus amigos Valmir Mioso, Zita, Josane Vieira, Tatiana, Alan Landvoigt, Alice Landvoigt agradeço principalmente pela companhia e por estarem ao meu lado nessa empreitada me acompanhando em todas as horas difíceis. As minhas professoras Cléia Baiotto Soares e Anne Nunes, minhas professoras de graduação e especialização pela ajuda e aconselhamento em escolher essa área. Ao meu pai, Gilberto Martins Santos, pelo incentivo e pelo patrocínio ao qual foi fundamental para realização desse curso, agradeço também pela transmissão dos conhecimentos repassados a mim e a meus irmãos desde crianças, sendo esses fundamentais para a construção e dedicação aos nossos estudos. À mulher que mais admiro, minha mãe. Espetacular, que esteve sempre ao meu lado, me segurando pela mão, me oferecendo toda a sua energia, dedicação, incentivo, carinho e amor, agradeço pelo que sou hoje. Não poderia deixar de agradecer também ao cuidado e carinho que teve com a minha filha durante as horas em que eu tive que estar distante. Aos meus irmãos, cunhadas e sobrinhos pela amizade e pelo apoio. A minha boneca, minha filha Nathalia por ter sido tão compreensiva e amiga diante das horas de convívio que lhe foram tiradas, você é minha vida!!!

3
ÍNDICE
1. RESUMO...............................................................................................................2
2. APRESENTAÇÃO DO TEMA.............................................................................3
2.1 Bases genéticas da coloração do pêlo em mamíferos......................................3
2.2 Genes envolvidos na regulação do melanismo................................................4
2.3 Variação genética da cor de pêlos na família Felidae......................................8
3. OBJETIVOS............................................................................................................11
3.1 Objetivos Específicos………..........................................................................11
4. ARTIGO: Patterns of nucleotide variability in the Agouti Signaling Protein
(ASIP) Gene in Mammals………………………………………………………......12
5. Considerações Finais…………………………………………………………….43

4
1. RESUMO O melanismo em mamíferos decorre principalmente da atividade de dois genes:
MC1R (Melanocortin-1 Receptor), cujo produto induz a produção de eumelanina (preto-
marrom); e ASIP (Agouti Signaling Protein), que codifica um peptídeo antagonista que
promove a produção de feomelanina (pigmento claro). A combinação do efeito destes
dois locos faz com que o pêlo cresça escuro com bandas subapicais amarelas. No
presente estudo investigamos a diversidade nucleotídica e os padrões de variabilidade
presentes no gene ASIP, principalmente nas regiões codificadoras dos éxons 2 e 3 e em
regiões não codificadoras dos íntrons 2 e 3 em alguns mamíferos, com ênfase em
felídeos (Mammalia, Carnivora, Felidae). Através do alinhamento entre as espécies
analisadas nesse estudo foi possível construir três bases de dados que foram divididas
em diferentes blocos conforme as regiões de alinhamento. A análise comparativa de
seqüências permitiu a caracterização de diferentes blocos de seqüência conservada,
assim como a identificação de uma inserção SINE presente apenas no gato doméstico,
de uma região repetitiva hipervariável em todos os felídeos analisados, e também de
variantes moleculares (SNPs) em Felis catus e Leopardus geoffroyi. Nenhum dos
polimorfismos identificados nesta espécie estava localizado em regiões exônicas ou
apresentou associação a fenótipos de coloração, indicando que as regiões analisadas não
estão envolvidas na indução do melanismo nesta espécie.
Palavras-chave: melanismo, ASIP, eumelanina, feomelanina, antagonista, felídeos e
mamíferos.

5
2. APRESENTAÇÃO DO TEMA 2.1. Bases genéticas da coloração do pêlo em mamíferos
A diversidade de cores exibidas por mamíferos, e suas bases genéticas, atraíram
ao longo da história a atenção de muitos cientistas (Darwin 1883; Beddard 1895; Fisher
1930; Cott 1940). Variações fenotípicas naturais foram usadas para propor teorias
clássicas sobre a adaptação de mamíferos, e sua relevância comportamental e ecológica
tem sido explorada em vários aspectos (Cott 1940; Ortolani & Caro 1996). Por muito
tempo, variantes de coloração naturais e induzidas foram utilizadas como marcadores
genéticos em modelos animais na era pré-molecular, tendo importância crucial em
esforços iniciais para o mapeamento de genes e a caracterização de processos
genômicos (Silvers 1979). Por exemplo, variantes na cor do pêlo constituíram a
primeira característica de mamíferos analisada com genética Mendeliana (Castle e Allen
1903).
O uso dessas características como marcadores levou ao acúmulo de uma grande
quantidade de conhecimentos sobre a genética, bioquímica, fisiologia e biologia
molecular dos processos envolvidos na determinação da cor dos pêlos em camundongos
(Mus musculus) (Silvers 1979; Jackson 1994; Barsh 1996). Vários genes envolvidos na
produção e distribuição de pigmentos em camundongos foram caracterizados em nível
molecular (Jackson 1994; Barsh 1995, 1996). Demonstrou-se que eles participam de
diversos processos celulares, fisiológicos e do desenvolvimento embriológico, e em
muitos casos estão implicados em doenças como anemia, esterilidade e problemas
neurológicos (Silvers 1979; Fleischman 1993; Jackson 1994). Homólogos humanos de
muitos desses genes foram identificados e caracterizados, e em vários casos estão

6
associados com condições patológicas como hipopigmentação (Fleischman 1993) e
albinismo oculocutâneo (Manga et al. 1997). Seu papel na variação da cor da pele e dos
cabelos em humanos é ainda pouco conhecido, mas as evidências disponíveis indicam
que interações complexas e formas diferentes de seleção envolvendo alguns desses
mesmos genes podem ser responsáveis pela variação fenotípica observada em nossa
espécie (Barsh 1996; Box et al. 1997; Rana et al. 1999; Harding et al. 2000; Rees 2000;
Sturm et al. 2001). Homólogos para esses genes têm sido também identificados e
caracterizados em outras espécies, e relacionados com a cor de pêlos e/ou fenótipos
patológicos semelhantes aos observados em camundongos e humanos (p. ex. Klunglund
et al. 1995; Joerg et al. 1996; Kijas et al. 1998, 2001; Metallinos et al. 1998; Marklund
et al. 1999). Atualmente diversos estudos abordam as bases moleculares dos fenótipos
ligados à coloração dos pêlos em múltiplas espécies, tentando investigar aspectos da sua
história evolutiva e significância adaptativa. Para obter-se um conhecimento mais
detalhado, estão sendo feitos estudos sobre a estrutura, função, regulação e integração
desses genes envolvidos na pigmentação.
2.2. Genes envolvidos na regulação do melanismo
O melanismo é um fenômeno presente em muitas formas de vida e tem sido
amplamente definido como uma situação em que ocorre uma acentuada produção de
melanina escura, gerando uma coloração escurecida no tegumento do organismo
(Majerus 1988). A pigmentação de mamíferos é regulada por mais de 120 genes, os
quais codificam proteínas envolvidas na migração e diferenciação dos melanócitos
(células especializadas localizadas na base da epiderme e nos folículos pilosos) bem
como na regulação de diferentes pontos da rota melanogênica. A melanogênese folicular
envolve seqüencialmente a atividade melanogênica dos melanócitos foliculares, e a
7
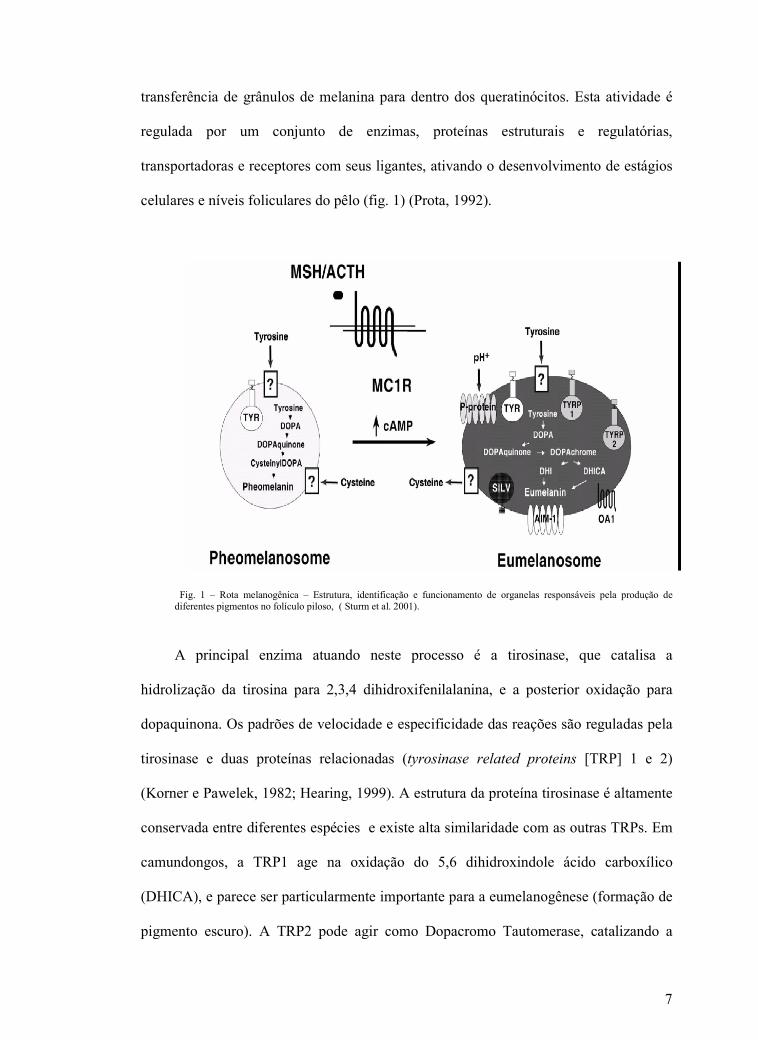
transferência de grânulos de melanina para dentro dos queratinócitos. Esta atividade é
regulada por um conjunto de enzimas, proteínas estruturais e regulatórias,
transportadoras e receptores com seus ligantes, ativando o desenvolvimento de estágios
celulares e níveis foliculares do pêlo (fig. 1) (Prota, 1992).
Fig. 1 – Rota melanogênica – Estrutura, identificação e funcionamento de organelas responsáveis pela produção de diferentes pigmentos no folículo piloso, ( Sturm et al. 2001).
A principal enzima atuando neste processo é a tirosinase, que catalisa a
hidrolização da tirosina para 2,3,4 dihidroxifenilalanina, e a posterior oxidação para
dopaquinona. Os padrões de velocidade e especificidade das reações são reguladas pela
tirosinase e duas proteínas relacionadas (tyrosinase related proteins [TRP] 1 e 2)
(Korner e Pawelek, 1982; Hearing, 1999). A estrutura da proteína tirosinase é altamente
conservada entre diferentes espécies e existe alta similaridade com as outras TRPs. Em
camundongos, a TRP1 age na oxidação do 5,6 dihidroxindole ácido carboxílico
(DHICA), e parece ser particularmente importante para a eumelanogênese (formação de
pigmento escuro). A TRP2 pode agir como Dopacromo Tautomerase, catalizando a

8
transformação da dopacromo para DHICA, e também parece atuar de forma
predominante na síntese do pigmento escuro. Assim sendo, o aumento na expressão e
atividade destas enzimas do grupo TRP parece ser fundamental para a acentuação
preferencial da rota eumelanogênica, podendo culminar na ocorrência do melanismo.
Dos diversos loci envolvidos na pigmentação, dois deles atuam primariamente
na regulação da troca entre eumelanina (escura) e feomelanina (clara), os quais eram
originalmente conhecidos como agouti e extension (quando identificados por estudos
clássicos em camundongos), e hoje são identificados como ASIP e MC1R,
respectivamente. Ambos foram bem caracterizados em nível molecular em
camundongos (Bultman et al. 1992; Mountjoy et al. 1992; Robbins et al. 1993; Perry et
al. 1996). Nesta espécie, a sinalização pelo Hormônio Estimulador de Melanócitos- α
(α-MSH) ou ASIP através do MC1R regula o tipo de melanina produzida, sendo que a
interação do α-MSH com MC1R resulta em produção de eumelanina (fig. 2) (Voisey e
Daal, 2002).
Fig.2 – Esquema demonstrando os dois genes principais – ASIP e MC1R envolvidos na rota melanogênica ( Barsh SG. et al. 2002).

9
O gene agouti (ASIP) em camundongos está localizado no cromossomo 2, e é
descrito como codificador de uma proteína que possui 131 aminoácidos consistindo de
um peptídeo sinal, um domínio central básico e uma região C-terminal rica em cisteína.
A troca entre eumelanogênese e a feomelanogênese envolve efeitos opostos de ASIP e
α-MSH como ligantes para o receptor MC1R (Rouzaud e Hearing 2004). O gene agouti
do camundongo é composto de três éxons codificadores (contendo 170pb, 65pb e
385pb, respectivamente), ocupando uma região genômica de aproximadamente 5Kb,
ficando cerca de 3 a 4 éxons adicionais distantes da região 5’ do sítio de iniciação
(Siracusa1994). A região gênica total consiste de cerca de 110Kb (fig.3) (Bultman et al.
1994).
Fig. 3- Estrutura do gene ASIP em camundongos (modificado a partir de Bultman 1992, 1994).
Em outras espécies já estudadas, o gene ASIP varia quanto ao número de
aminoácidos codificados, porém todos apresentam três éxons codificadores, em uma
estrutura geral semelhante à descrita para o camundongo. No gato doméstico (Felis
catus), este gene está localizado no cromossomo A3, e codifica uma proteína com 135
aminoácidos (Eizirik et al. 2003).
A proteína ASIP regula a pigmentação em folículos pilosos de camundongo
produzindo um pêlo preto com uma banda subapical amarela que pode também ser

10
observado em muitos outros mamíferos incluindo a família de felídeos. Alelos
recessivos na região codificadora do agouti ocasionam pêlo de cor escura e alelos
dominantes, resultam em cor amarela e, no caso de expressão ectópica, fenótipos como
obesidade, diabetes tipo II, aumento somático no crescimento e tumorigênese (Yen et al.
1994).
ASIP foi seqüenciado e estudado em algumas espécies de mamíferos e em vários
casos a identificação de seqüências variantes foi associada a fenótipos envolvidos no
melanismo ou outras características fisiológicas (p. ex. Joerg et al. 1996; Marklund et al.
1996; Vage et al. 1997; Everts et al. 2000; Newton et al. 2000). Variantes do gene ASIP
foram implicadas em fenótipos melânicos em raposas vermelhas (Vage et al. 1997),
ratos (Kuramoto bet al. 2001) e cavalos (Rieder et al. 2001), além das mutações
originalmente descritas em camundongos. A abundância de exemplos de alterações nas
mutações de cor de pêlos fazem destes genes bons candidatos para estudos das bases
genéticas do melanismo em outras linhagens de mamíferos.
2.3. Variação genética da cor de pêlos na família Felidae
Entre os mamíferos, a família Felidae é um grupo de extrema importância para o
estudo da cor de pêlos e sua história evolutiva. Variações marcantes entre espécies e
polimorfismo intra-específico são observados em gatos domésticos e felinos selvagens,
o que serviu de base para hipóteses de adaptação, biogeografia e associações ecológicas
(Beddard 1895; Cott 1940; Weigel 1961; Kitchener 1991; Ortolani & Caro 1996). A
ocorrência de pigmentação polimórfica é comum em gatos domésticos, incluindo
variação na cor de fundo (do branco ao amarelo, cinza, vermelho ou marrom escuro) e
também na presença, forma, coloração e distribuição de manchas (p. ex. pintas, listas,
rosetas ou ocelos). Em várias espécies de felídeos a aparente segregação geográfica de
11
cores polimórficas foi utilizada para descrever diferentes “subespécies” ou populações
locais historicamente distintas. Em vários casos é plausível supor que estas variações
sejam produzidas por adaptação local a ambientes distintos, sendo assim importantes
componentes na história de vida dessas espécies.
Das 37 espécies de felídeos, 12 comprovadamente apresentam melanismo como
uma variante de coloração (Eizirik 2002). Até o momento o gene ASIP foi somente
seqüenciado no gato doméstico (Felis catus) e o MC1R em F. catus, onça pintada
(Panthera onca) e jaguarundi (Puma yagouaroundi), nos quais foram identificadas
variantes moleculares associadas ao melanismo (Eizirik et al. 2003). Entre os animais
observados, o que pode constatar-se é que ocorreu uma deleção de dois nucleotídios no
gene ASIP em Felis catus pretos. No gene MC1R, duas deleções foram identificadas:
uma deleção de 5 códons (sem alteração no quadro de leitura) em Panthera onca
melânicas, as quais podem ser homozigotas ou heterozigotas (o que permitiu verificar
que esse fenótipo apresenta herança dominante); e a segunda em Puma yagouaroundi de
pelagem escura, onde notou-se a deleção de 8 códons (com padrão de herança semi-
dominante).
Estudos semelhantes ainda não foram realizados para outras espécies de
felídeos; para algumas delas, inclusive em casos de ocorrência de melanismo, pode-se
excluir a ocorrência das mutações descritas acima (Eizirik et al. 2003); entretanto a
caracterização completa destes genes candidatos não foi realizada até o momento. Cinco
espécies de felídeos foram o alvo principal deste estudo: o gato-doméstico, o gato-do-
mato-pequeno (Leopardus tigrinus), o gato-do-mato-grande (L. geoffroyi), o gato-
palheiro (L. colocolo) e o leopardo (Panthera pardus). Fenótipos melânicos são
observados em todas estas espécies, e a ocorrência desta variação não pode ser atribuída
às mutações já descritas, exceto no caso do gato doméstico (Eizirik et al. 2003). Assim

12
sendo, é relevante investigar a variabilidade de seqüência nos genes candidatos para este
fenótipo, a fim de buscar possíveis variantes associadas ao mesmo.
Leopardus geoffroyi (www.kedi.ws) Leopardus tigrinus
(procosara.org/images/leopardus_tigrinus)
Leopardus colocolo
(www.kedi.ws)
Panthera pardus Felis catus

13
(http://home.vicnet.net.au/~neils/africa/leopard.htm) (www.sierrabaza.org)
3. OBJETIVOS
O presente estudo teve como finalidade principal a caracterização do gene ASIP
em alguns mamíferos com ênfase em espécies de felídeos, buscando investigar a
diversidade nucleotídica presente neste locus, seus padrões de variabilidade, e testar sua
associação com fenótipos de coloração polimórficos observados nestes organismos.
3.1 OBJETIVOS ESPECÍFICOS
3.1.1. A partir de amostras de DNA genômico, amplificar por PCR e caracterizar em
nível de seqüência os exons 2 e 3, juntamente a segmentos intrônicos associados, do
gene ASIP em um ou mais indivíduos de F. catus, P. pardus, L. tigrinus, L. geoffroyi e
L. colocolo.
3.1.2. Caracterizar a diversidade genética e os padrões de variabilidade presentes neste
locus em algumas espécies de mamíferos, através de comparações evolutivas em
diferentes níveis de profundidade filogenética, utilizando as seqüências de felídeos
geradas nesse estudo em combinação com outras já disponíveis.
3.1.3. Comparar seqüências deste gene entre indivíduos melânicos e não-melânicos de
L. geoffroyi e L. colocolo, buscando testar a ocorrência de polimorfismos associados ao
melanismo.

14
4. ARTIGO

15
Genetics and Molecular Biology
Draft, 28.06.2007
PATTERNS OF NUCLEOTIDE VARIABILITY IN THE AGOUTI
SIGNALING PROTEIN (ASIP) GENE IN MAMMALS
Daniela Copetti Santos1; Manoel L. Fontoura-Rodrigues2; Eduardo Eizirik1,2,3
1 Programa de Pós-Graduação em Biologia Celular e Molecular, Faculdade de
Biociências, PUCRS, Porto Alegre, RS 90619-900, Brazil; 2 Programa de Pós
Graduação em Zoologia, PUCRS, Porto Alegre, RS 90619-900, Brazil; 3Laboratory of
Genomic Diversity, NCI-Frederick, Frederick, MD 21702-1201, USA.
Corresponding author:
Eduardo Eizirik
Faculdade de Biociências, PUCRS
Av. Ipiranga, 6681, prédio 12
Porto Alegre, RS 90619-900, Brazil

16
Abstract
The regulation of coat color in mammals is controlled mainly by the action of
two genes, MC1R (Melanocortin-1 receptor), responsible for inducing the production of
dark pigment (eumelanin), and ASIP (Agouti Signaling Protein), which codes for an
antagonistic peptide whose action promotes the formation of light pigment
(feomelanin). The understanding of the structural characteristics of these loci and of the
evolutionary processes influencing their patterns of conservation is still in its infancy,
with few species analyzed so far, and no broad comparison available. In this paper we
analyzed different regions of the ASIP gene in several mammalian species, with
emphasis on the family Felidae (Mammalia, Carnivora). Our goals were to characterize
patterns of variability and conservation in the surveyed regions of ASIP, and also to
investigate the possibility of molecular variants at this locus being associated with
melanistic phenotypes in the Geoffroy’s cat (Leopardus geoffroyi). Complete sequences
of exons 2 and 3, intron 2, and part of intron 3, were obtained for a total of five different
felid species, in some cases represented by multiple individuals each. These sequences
were compared to each other and to two canid species (Carnivora, Canidae) and one
representative each of the mammalian orders Cetartiodactyla and Perissodactyla. Our
results allow the identification and characterization of several conserved sequence
blocks in intronic regions, which present similar or higher levels of sequence
conservation when compared to coding regions. The boundaries of these conserved
blocks were characterized through comparisons at increasing levels of evolutionary
depth, allowing the identification of core areas maintained over ca. 90 million years of

17
evolution, and possibly involved in regulatory activities. No exonic polymorphism was
observed in L. geoffroyi, including melanistic individuals, indicating that exons 2 and 3
are not involved in this phenotype in this species.
Introduction
Melanism is a phenomenon present in many life forms and has been broadly
defined as a situation where an overabundance of skin pigmentation occurs, generating
a darkened external coloration (Majerus 1998). The pigmentation of mammals is the
result of the action of more than 100 genes that influence the production and
distribution of melanins in the skin, fur and eyes (Girardot et al. 2006). Biosynthesis of
these pigments is a process predominantly controlled by the action of three enzymes of
the tyrosinase family: TYR, TYRP-1 and TYRP-2. These enzymes are directly involved
in the synthesis of dark pigment (eumelanin, with black or brown coloration), although
the former (TYR) also plays a role in the genesis of feomelanin (light pigment: yellow
or reddish). Both types of pigment are complex polymers that are produced and
accumulated in specialized organelles present in melanocytes, known as melanosomes.
Melanin-containing melanosomes are transferred from melanocytes to skin
keratinocytes or to the growing hair shaft. The overall coat color depends mainly on the
relative amount and distribution of eumelanin and pheomelanin in hair shafts
throughout the body.
The synthesis of eumelanin in melanocytes is induced by the α-Melanocyte
Stimulating Hormone (α-MSH), which is an agonistic ligand of the Melanocortin-1
Receptor (MC1R), a G-protein coupled receptor present on the melanocyte surface.
Conversely, the synthesis of feomelanin in the melanocyte is induced by the interaction
between MC1R and the paracrine antagonist peptide “agouti” (also known as ASIP

18
[Agouti Signaling Protein]), secreted by dermal papilla cells (Voisey et al. 2002). This
system was first described in the mouse, in which the agouti peptide was found to
consist of 131 amino acids, and to act as an MC1R antagonist, blocking its activation by
α-MSH (Kwon et al. 1994). It is now well established that the switch between
eumelanogenesis and feomelanogenesis involves opposite effects of ASIP and α-MSH
as ligands of the same receptor (Rouzaud and Hearing 2004). A typical “agouti” hair in
the mouse is black with a subapical yellowish band (the agouti band), which results
from a pulse of expression of the agouti gene during hair growth.
Many other mammals present similar patterns of hair pigmentation, with one or
more “agouti” bands placed on an overall darker hair shaft, suggesting that this
pigmentation mechanism has been conserved throughout the evolution of this group.
Interestingly, mutant alleles of the mouse agouti gene cause darker coat color
(melanism) exhibiting recessive inheritance, while dominant mutant alleles result in
yellow color and in some cases also pleiotropic effects such as obesity, type II diabetes,
increased body size and tumorigenesis (Yen et al. 1994). It is now well understood that
recessive melanism in these cases is due to loss of function of the agouti peptide,
leading to constant eumelanogenesis. Likewise, the yellow coloration of dominant
agouti mutants is due to gain of function leading to constant blocking of eumelanogenic
signaling. Pleiotropic effects of dominant yellow mouse mutants have been found to be
caused by ectopic expression of agouti, leading to interaction with other melanocortin
receptors and thus interfering on other signaling pathways.
The mouse agouti gene (whose homologue is called ASIP in humans and most
other species) is located on chromosome 2 and is composed of three coding exons
(containing 170 bp, 65 bp and 385 bp, respectively) which span a genomic region of
approximately 5 Kb. In addition, there are up to four non-coding exons, located more

19
than 100 kb upstream from the coding region, which are involved in the expression of
alternative transcripts (Siracusa 1994). The total genomic region consists of ca. 110 kb
(Bultman et al. 1994). In other species studied to date, the ASIP gene varies in the exact
number of codons, but is always composed of three coding exons, with a general
structure similar to that described originally for the mouse. In the domestic cat (Felis
catus), this gene is located on chromosome A3, and codes for a protein containing 135
amino acids (Eizirik et al. 2003).
The coding regions of ASIP and MC1R have been characterized in some species
of mammals (and many other vertebrates, in the case of the MC1R), leading to the
identification of molecular variants in one or both genes that were associated to
melanistic or other coat color phenotypes (e.g. Joerg et al. 1996; Marklund et al. 1996;
Väge et al. 1997; Everts et al. 2000; Newton et al. 2000). Variants of MC1R were
associated to melanism in the cow (Kungland et al. 1995), red foxes (Väge et al. 1997),
pigs (Kijas et al. 1998), sheep (Väge et al. 1999) and also in chickens (Takeuchi et al.
1996) and bananaquit birds (Theron et al. 2001). Fewer such studies have addressed
ASIP, as this gene seems to be more difficult to characterize, due to its containing three
coding exons instead of MC1R’s single contiguous Open Reading Frame, and exhibiting
several isoforms composed of different combinations of non-coding exons. In addition
to the pioneering mouse studies (Bultman et al. 1992) that characterized the ASIP
coding region as well as various mutants involving genomic rearrangements and non-
coding elements, only a few species have so far been sequenced for this locus. These
include descriptions of the ASIP coding region in the red fox (Väge et. 1997), rat
(Kuramoto et al. 2001), horse (Rieder et al. 2001) and cow (Girardot et al. 2005).
Among the mammals, the carnivoran family Felidae is an interesting system in
which to study the evolution of coat color variation. The occurrence of polymorphic

20
pigmentation is common in domestic cats, including variation in the background color
(from white to yellow, gray, red, brown or black) and also in the appearance, shape,
coloration and distribution of markings (e.g. spots, stripes, and rosettes). Several other
felids display polymorphic coloration, in some cases showing geographic
discontinuities or gradients that have been used to describe different “subspecies” or
historically distinct local populations (e.g. Pocock 1940; Garcia-Perea 1994). In some
cases it is reasonable to assume that these variations are produced by local adaptation to
distinct environments, thus being important components of these species’ life history.
Of the 37 currently recognized felid species, 12 have been confirmed to exhibit
melanism as a coat color variant (Eizirik 2002). In an effort to understand the evolution
of this trait in the Felidae, the candidate genes ASIP and MC1R genes were mapped,
cloned and sequenced in the domestic cat (Felis catus), providing tools for the direct
investigation of these loci in other felids (Eizirik et al. 2003). That study identified three
distinct mutants associated with melanism in different cat species. Black domestic cats
are homozygous for a deletion of two nucleotides in exon 2 of ASIP, leading to a
frameshift that likely abolishes the function of the coded protein, in agreement with a
recessive inheritance of melanism in this species. Two different MC1R mutants were
observed: melanistic jaguars (Panthera onca) carry a mutant allele bearing a five-codon
deletion, while dark jaguarundis (Puma yagouaroundi) carry another allele lacking eight
full codons (Eizirik et al. 2003). In the two latter cases the inheritance of melanism is
dominant and semi-dominant, respectively, in agreement with a gain-of-function change
in MC1R. The molecular basis of melanistic phenotypes remains to be uncovered the
nine other felid species in which this trait has been observed. An initial step in this
investigation is the characterization of the candidate genes ASIP and MC1R in multiple

21
species of the family, as well as related groups, so as to define regions of evolutionary
conservation that may be particularly involved in gene function.
In this study we sequenced exonic and intronic regions of the ASIP gene in four
felid species (Leopardus geoffroyi, L. tigrinus, L. colocolo and Panthera pardus) which
had not been previously characterized for this locus. We also sequenced additional
domestic cat individuals for the region under study, which were compared to our
original Felis catus ASIP sequence (Eizirik et al. 2003), and used to evaluate intra-
specific patterns of diversity in this genomic segment. In addition, melanistic and non-
melanistic individuals of L. geoffroyi were compared for two exonic regions, in order to
investigate the presence of molecular variants potentially associated to this phenotype in
this species. Finally, we compared the felid sequences generated here to available data
from other placental mammals belonging to the supra-ordinal clade Ferungulata (which
contains the orders Carnivora, Pholidota, Cetartiodactyla and Perissodactyla - Springer
et al. 2007). These comparisons, which span different levels of evolutionary depth,
allowed a characterization of the patterns of sequence variability in this segment in
mammals, contributing to the identification of conserved non-coding blocks potentially
involved in regulatory activities.
Materials and methods
Genomic DNA from one to 13 individuals each of Leopardus geoffroyi, L.
colocolo, L. tigrinus, Felis catus and Panthera pardus (Table 1) were amplified by the
Polymerase Chain Reaction (PCR) using previously designed ASIP primers (Eizirik
2002). In most cases, external primers agoEx2-F2 and agoEx3-R1 (Figure 1, Table 2)
were used for amplification of a single contiguous segment ca. 2 kb long. To investigate
exonic variability in the L. geoffroyi ASIP gene, multiple individuals of this species

22
were analyzed for exon 2 and exon 3 alone (Table 1), using a separate PCR reaction for
each fragment (employing primers agoEx2-F2 and agoEx2-R1 for Exon 2, and agoEx3-
F1 and agoEx3-R1 for exon 3 – see Figure 1). PCR reactions were performed in a total
volume of 20 µL, containing 1µL of empirically diluted DNA, 2 µL of 10X buffer II; 2
mM MgCl2, 0.2 mM dNTP; 1 U AmpliTaq DNA polymerase (Invitrogen) and 0.2 µM
of each primer. The PCR profile consisted of 3’ initial denaturing at 94ºC, followed by
40 cycles of 94ºC for 45’’, 55ºC for 1’, 72ºC for 2’, and a final extension of 72ºC for
10’. PCR fragments were verified through electrophoresis in a 1% agarose gel stained
with ethidium bromide, and purified using either an enzymatic clean-up protocol
(Shrimp alkaline phosphatase and Exonuclease I [Amersham]) or Polyethyleneglycol
(PEG) 8000. Purified fragments were sequenced using either ABI Big Dye chemistry
or the DYEnamic ET Terminator Sequencing Kit (GE/Amersham Biosciences), and
read on an ABI 3700 or a MEGABACE 1000 (GE/Amersham) automated sequencer,
respectively. Fragments were sequenced in both directions using the PCR primers, as
well as multiple internal primers (see Table 2) in the case of long amplicons (flanked by
agoEx2-F2 and agoEx3-R1). Sequence electropherograms were checked and edited
visually using SEQUENCHER (Gene Codes) or MEGA 3.1 (Kumar et al. 2004),
leading to the construction of a final contig for each individual composed of two to 23
separate reads. All sequences generated here were deposited in GenBank (accession
numbers XXXX-XXX).
Orthologous ASIP sequences from additional species were obtained from
GenBank using the BLAST algorithm (Altschul et al. 1990). These included sequences
of two canids (Canis familiaris [NC_006606] and Vulpes vulpes [VVU250364]), and
one representative each of the mammalian orders Cetartiodactyla (Bos taurus [X99691])
and Perissodactyla (Equus caballus [AF288358]). Sequences were aligned using the

23
ClustalW algorithm implemented in MEGA 3.1, and final alignments were produced via
direct checking and editing by hand. Three different data sets were analyzed, whose
variation in evolutionary depth led to differences in alignment reliability: (A) felids
only; (B) Carnivora only (i.e. felids + canids); and (C) Ferungulata (Carnivora +
Cetartiodactyla + Perissodactyla). For each of the data sets, sequence blocks that could
be reliably aligned (i.e. for which homologous nucleotide positions could be
recognized) across the included taxa were identified using MEGA, which was also
utilized for subsequent analyses of these segments. Analyses included phylogenetic
reconstruction of evolutionary relationships using different data partitions, as well as
estimations of nucleotide variability for each block at each level of evolutionary depth.
Results
Two coding regions of the ASIP gene (exon 2 [160 bp] and exon 3 [62bp]) and
two non-coding segments of the same locus (intron 2 [1360bp] and part of intron 3
[154bp]) were characterized in five felid species, and compared to available sequences
of other mammals belonging to the Grandorder Ferungulata. The alignment of these
sequences varied between 2,082 bp and 2,192 bp, depending on the included species.
The comparative analysis of the sequences was carried out using three distinct
data sets (A, B and C), which differed in terms of phylogenetic depth. Data set A
included only felid sequences, spanning the base of the extant diversity in this family
(ca. 11 million years) taking into consideration the comparison between P. pardus and
the remaining species (Johnson et al. 2006). In database B, two canids were included
(Canis familiaris and Vulpes vulpes), allowing the assessment of nucleotide
conservation throughout the evolution of the two main branches (Feliformia and
Caniformia) of the order Carnivora, spanning a divergence of ca. 55 million years

24
(Springer et al. 2003). The third database (C) also included sequences of
representatives of two other mammalian orders related to the carnivores: a horse,
representing the Perissodactyla, and a cow, representing the Cetartiodactyla. The
inclusion of these species allowed a comparative analysis spanning ca. 90 million years
of evolutionary depth (Springer et al. 2003).
The analysis carried out with these three databases allowed the identification and
characterization of different sequence blocks, with distinct properties (Fig. 2). In
database A we observed the existence of six conserved blocks (Table 3), consisting of
the two exons along with four well-aligned and fairly long intronic regions. In addition
to these conserved segments, two distinct regions could be identified within intron 2.
One of them was a SINE element insertion (spanning 240 bp), present only Felis catus,
and the other one was a complex repetitive region (spanning ca. 83 bp) observed in all
felids, and consisting of a series of short tandem repeats dominated by the motifs (TG),
(TTTG), (TTTTG) and (TTTTTG). Another observation was the occurrence of a well-
defined 14-bp deletion (positions 285-298) in intron 2 (Sequence block 2 - see Fig. 2) of
all Felis catus individuals, but not in any of the other species. Within the domestic cat
SINE element insertion, all F. catus individuals were identical except for one Single
Nucleotide Polymorphism (SNP) at position 724 (counting from the start of the
initiation codon in exon 2 – see Fig. 2 and Table 3), in which A/A, T/T and A/T
genotypes were observed. Three other SNPs were identified in intron 2, at positions
281 (A/G), 833 (T/C) and 1599 (T/C). Homozygotes for both alleles were observed in
each of these SNPs, and heterozygotes were recorded for site 833 only. Among the
sampled L. geoffroyi individuals, five SNPs were identified, but none was located in the
surveyed exons, and none exhibited evidence of allelic association with melanistic

25
phenotypes. The two L. colocolo individuals analyzed here (one of which was
melanistic) did not bear any nucleotide difference from each other.
The analyses performed with data set B allowed the identification of seven
conserved blocks, due to the division of block 3 into two sub-blocks (Fig. 2, Table 4).
The available Vulpes vulpes sequence was shorter than the overall data set, so that the
first 134 bp (most of exon 2) and the final 216 bp (intron 3 and part of exon 3) could not
be compared to the other species. Database C consisted of a longer alignment (2,192
bp) relative to A and B, due to several indels inferred to have occurred when more
distantly related mammals were included in the analysis. The available Equus caballus
sequence was also shorter than those of most other species, precluding comparisons
involving the initial 32 bp (beginning of exon 2) and the final 210 bp (intron 3 and part
of exon 3). This alignment allowed the identification of 11 well-defined (i.e. conserved)
sequence blocks, including the two exons (Table 5). The increased number of blocks
resulted from the subdivision of block 3 into 4 sub-blocks (3.1.1, 3.1.2, 3.2.1 and 3.2.2 –
See Table 5 and Fig. 2) and of block 4 into 3 sub-blocks (4.1, 4.2 and 4.3). Other
general observations gleaned from this data set included the presence in Bos taurus of
an extra codon (AAA, positions 1987-1989) in exon 3, and an 11-bp insertion (positions
2052 - 2062) in intron 3, relative to the remaining species.
In order to characterize the evolutionary conservation across this genomic
segment, we analyzed the level of nucleotide variability in each defined block for each
of the data sets. In data set A, the least variable segment was the sampled portion of
intron 3 (block 6), with 3.2% variable sites, while the most variable was exon 2 (5.6%
variable sites). Overall, intronic blocks were found to exhibit similar or lower
variability than the examined exons (Table 3). The inclusion of canid sequences (Data
Set B) allowed a more refined analysis of these blocks (Table 4). At this increased level

26
of evolutionary depth, intronic block 3.1 and exon 3 (block 5) were found to be the most
conserved segments (6.9% and 7.0% variable sites, respectively). Exon 2 remained
quite variable at this level (13.7% variable sites), but was surpassed in diversity by
intronic blocks 2 and 3.2. At the same time, the available portion of intron 3 (block 6)
remained considerably conserved (8% variable sites) (Table 4).
The same approach was then extended to Data Set C, the deepest phylogenetic
level contained in our alignment, so as to identify core areas that represent well-defined
blocks of conserved sequence (Table 5). In this case, the most conserved of all
segments was block 4.3 (5.5% variable sites), a 36 bp-long region of intron 2
immediately adjacent to exon 3. At this level, both of the analyzed exons were found to
be quite variable (23.7% and 15.6% variable sites for exons 2 and 3, respectively).
Variability in alignable areas of introns was even greater (e.g. 50% in block 3.1.1), not
to mention intervening intronic segments in which similarity among taxa could no
longer recognized (i.e. they were not part of the identified blocks). As expected, the
defined blocks became shorter as we analyzed deeper phylogenetic divergences (e.g.
compare block 2 in Tables 3, 4 and 5), even though in some cases the length was
affected in the opposite direction by the larger number of indels in this data set.
On the basis of these initial observations, we performed a more comprehensive
comparative analysis of sequence conservation patterns using the refined blocks
delimited with Data Set C (Table 6). Here the conservation of block 4.3 became really
apparent, with no variable sites among the sampled carnivores, and a single difference
in each of the comparisons between Carnivora and the other two orders. A trend of
increased variability correlating with evolutionary depth could be clearly seen for all
surveyed segments. This standardized comparison showed that exon 2 is consistently
more variable than exon 3, at all phylogenetic levels, in many cases exhibiting a similar

27
amount of variation as the intronic blocks (Table 6). This is especially true when the
more shallow comparisons are considered (Data sets A and B), but intronic segments
become consistently less conserved than exons when inter-ordinal pairs are contrasted.
Interestingly, we observed a trend in which, when separate comparisons were
performed between Carnivora and each of the other two orders, the cow was almost
always more different from the former than the horse. This pattern is reflected in a
phylogeny built with our data set, showing the cow to be relatively accelerated relative
to the horse (Fig. 3), or else to be more distantly related from carnivores than the
perissodactyl included here. When transitions (Ts) and transversions (Tv) were
analyzed separately (Table 6), again we observed that pairwise comparisons involving
Carnivora vs. Perissodactyla exhibited a smaller amount of transversions than
equivalent comparisons involving Cetartiodactyla. Within the Felidae, F. catus tended
to exhibit more mutations in the exonic segments than the other species (Fig. 3),
although this pattern was not apparent in the surveyed intronic regions.
Given the observations of varying levels of variability among intronic segments
(e.g. extreme conservation of block 4.3), we performed another set of analyses dividing
introns into two classes based on location: marginal regions were defined as the 30 bp
immediately adjacent to an exon, hypothesized to contain regulatory motifs important
for appropriate splicing. The remaining intronic segments (considering only defined
blocks) were categorized as internal regions. We surveyed variation in these two
intronic classes at two levels (Data Sets A and B), since the intron 3 segment was not
sampled in the horse sequence. We observed that, within felids, the exons are indeed
quite variable, exhibiting less conservation than even internal regions of the introns
(Table 7). This pattern is reversed when the two major carnivoran branches are
compared by adding canids to the assessment; at that level exons became the most

28
conserved class, followed by marginal intronic regions and leaving internal segments as
the most variable.
Discussion
To investigate the patterns of nucleotide conservation in the mammalian gene
ASIP, a sequential phylogenetic approach was used in this study. The initial divergence
among the extant lineages of placental mammals occurred approximately 106 million
years ago (MYA) (Springer et al. 2003). Within this group, the mammalian orders
analyzed here (Carnivora, Cetartiodactyla and Perissodactyla) belong in the group
Ferungulata of the Magnorder Laurasiatheria, and diverged from each other in a rapid
sequence which is still not fully resolved, ca. 90 MYA (Springer et al. 2007). Within the
order Carnivora, representatives of its two suborders, Feliformia and Caniformia (whose
divergence occurred ca. 55 MYA), were included in this study. Moving further into the
carnivoran tree, we focused on the family Felidae, in which we sampled species
belonging to three different genera: Panthera, Leopardus and Felis. We have recently
achieved a good understanding of the branching sequence among these genera (Johnson
et al. 2006), with Panthera being the first to diverge (ca. 11 MYA) from the remaining
lineages, and the separation between Leopardus and Felis occurring ca. 5 – 6 MYA.
Assessments of patterns of genetic variability may benefit from evolutionary
comparisons at varying phylogenetic depths. The initial divergence between sister-taxa
leads to the accumulation of sporadic differences across the genome, which gradually
increases as evolutionary time elapses. Therefore, many regions that appear conserved
when closely related taxa are compared may eventually become very variable or even

29
unalignable at increased phylogenetic depth, revealing that the broad conservation at
shallow levels was more likely due to evolutionary inertia (lack of sufficient time to
accumulate mutations). Inertia thus obscures patterns of sequence conservation that are
caused by functional constraints, so that only a subset of segments found to be
conserved among taxa are actually subjective to negative selection due to functional
relevance.
In this study, we aimed to characterize the patterns of nucleotide conservation
across intronic and exonic segments of a gene implicated in melanistic phenotypes in
several mammalian groups. Previous observations revealed that this gene is quite
variable, and that its coding regions seem to be subjected to relaxed functional
constraints (Eizirik 2002). In contrast, some intronic blocks appeared quite conserved
when comparisons among felids were performed (Eizirik 2002), prompting the question
of whether they might be involved in regulatory activities. To evaluate the extent of
intronic conservation across a broader taxonomic comparison, and to attempt to define
more precisely intronic blocks that appear to be constrained, we used three levels of
phylogenetic depth, as well as separate comparisons between Carnivora and two of the
mammalian orders most closely related to it. The results indicate that much of the
intronic conservation observed among felids is due to evolutionary inertia, but some of
the conserved blocks are indeed remarkably similar even among mammalian orders that
diverged ca. 90 MYA. This is especially the case of block 4.3, whose conservation
surpasses that of exons in all comparisons performed here (Table 6). The conservation
of this block likely contributes to the pattern observed in Table 7, where marginal
intronic regions appear as substantially conserved, likely due to functional relevance in
splicing regulation. No such extreme conservation was observed in the other two
marginal intronic segments (blocks 2 and 6); however, the levels of variation in these

30
area were also rather low compared to the rest of the surveyed introns (see Table 6). It
is also noteworthy that block 2 was very large, appearing as the longest segment
remaining definable in Data Set C (Table 6 and Fig. 2). The size of the segment leads to
a lower estimate of conservation if it is actually a mosaic of sub-segments varying in
functional constraint. On the other hand, the fact that it remains as a large identifiable
block across three mammalian orders in itself suggests that it contains functionally
relevant motifs. Although alternative isoforms of ASIP are known (e.g. Bultman et al.
1994), so far none has been found to involve different combinations of the three coding
exons (2, 3 and 4), so that splicing in this area of the gene seems to be conserved among
placental mammals. The conserved intronic segments observed here are likely involved
in this regulation, but may also influence other aspects of ASIP expression. Since the
transcriptional regulation of ASIP appears to be complex (pulse-like coupled with hair
growth in the mouse dorsal area – Bultman et al. 1994) and has not been fully
characterized in any species, it is relevant to identify conserved regions among taxa so
as to target these potentially regulatory segments for further scrutiny. In particular,
variations in the deployment of lighter coat areas are rampant among mammals, as well
as cases of multiple agouti bands per hair shaft (implying multiple pulses of ASIP
expression). It is thus clear that additional species must be characterized in terms of
ASIP structure and function to complement the data derived from the mouse, and to
identify patterns that are common across mammals or lineage-specific. The results
provided here point to some intronic areas that deserve further investigation using a
broader taxonomic sample and more sophisticated analytical methods.
Exonic regions of ASIP are remarkably variable (see Tables 3-6), corroborating
the view that functional constraints are relaxed in this locus (Eizirik 2002). This may be
associated to the relatively common involvement of this gene in mammalian coat color

31
variants, as pleiotropic effects of loss-of-function seem to be absent or limited.
Nevertheless, when deeper comparisons are performed, it can be observed that exons do
present higher conservation than most intronic segments, as would be expected if they
were indeed subjected to some level of functional constraint.
Intra-specific polymorphisms in ASIP are also interesting to investigate, as they
provide information for population-based analyses and may be associated with
coloration variants (e.g. Rieder et al. 2001; Eizirik et al. 2003). So far few studies have
addressed this topic, but in every case where intra-specific variation was surveyed (all
restricted to laboratory, domestic or farmed animals) mutants could be identified in this
gene. This is the case of horses, where four mutantions were identified in this region,
including an 11-bp deletion in exon 2 that was associated with black color (Rieder et al.
2001). An indel variant associated with dark coat color was also detected in farmed red
foxes, where all of exon 2 is lost within a 1.2 kb deletion in this genomic region (Vage
et al. 1997). Broader surveys of segregating variants (e.g. SNPs) in this genomic
segments are lacking, and could provide interesting tools for evolutionary studies of this
locus. The SNPs identified here in F. catus and L. geoffroyi, as well as the
microsatellite-like hypervariable segment observed in all felids, may be used in further
studies on the intra-specific patterns of variability in this locus, as well as association
studies with coat color variants.
As for melanism in L. geoffroyi, nothing is currently known regarding the
molecular basis of this phenotype in this species. Given the common involvement of
ASIP in melanism in other mammals, this locus should be considered a plausible
candidate. The results obtained here indicate that ASIP exons 2 and 3 are not implicated
in this characteristic, as no variable sites were identified differentiating melanistic vs.
non-melanistic animals. Intronic SNPs were also not obviously associated with

32
melanism, although increased sample sizes might detect association due to linkage
disequilibrium if this locus is indeed implicated. Further studies aiming to identify
candidate mutations involved in melanism in L. geoffroyi should concentrate their
attention on ASIP exon 4, which was not covered here, as well as interrogate other
genes involved in the regulation of melanogenesis, such as MC1R. An enhanced
understanding of the molecular changes underlying melanistic phenotypes in multiple
felid species should shed light onto the evolutionary processes influencing the recurrent
origin and maintenance of this characteristic.
Acknowledgments
We thank C. R. Sarturi, T. C. Trigo, A. C. G. Escobar and T. Haag for technical
assistance, and S.L. Bonatto, M. R. Bogo and C. A. S. Ferreira for comments and
suggestions.
References: Altschul SF, Gish W, Miller W, Myers EW, Lipman DJ (1990) Basic local alignment search
tool. J. Mol. Biol. 215: 403- 410. Bultman SJ, Michaud EJ, Woychik RP (1992) Molecular characterization of the mouse
agouti locus. Cell 7: 1195- 1204. Bultman SJ, Klebig ML, Michaud EJ, Sweet HO, Davisson MT, Woychik RP (1994)
Molecular analisys of reverse mutations from nonagouti (a) to black-and tan(at) and White-bellied agouti (Aw) reveals alternative forms of agouti trans-cripts.Genes and Dev 8: 481- 490.
Eizirik E (2002) Molecular evolution of melanism in the Felidae (Mammalia) Carnivora.
Ph.D. Thesis. University of Maryland, College Park, MD.
Eizirik E, Yuhki N, Johnson EW, Raymond MM, Hannah SS, O’Brien JS (2003) Molecular
Genetics and Evolution of Melanism in the Cat family. Current Biology 13: 448- 453.

33
Everts RE, Rothuizen J, van Oost BA (2000) Identificacion of a premature stop codon in the melanocyte-stimulating hormone receptor gene (MC1R) in Labrador and Golden retrievers with yellow coat colour. Anim Genet. 31: 194- 199.
Garcia-Perea R. (1994) The pampas cat group (Genus Lynchailurus Secertzov 1858)
(Carnivora: Felidae, A systematic and biogeografic review). Amer Mus. Novit 3096: 1-36.
Girardot M, Martin J, Guibert S, Leveziel H, Julien R, Oulmoulden A. (2005) Widespread
expression of the bovine Agouti gene results from at least three alternative promoters Pig. Cell Res. 18: 34- 41
Girardot M, Guibert S, Gallard Y, Larroque H, Oulmouden A (2006) The insertion of a full-
length Bos taurus LINE element is responsible for a transcriptional deregulation of the Normande Agouti gene Pig Cell Res. 19: 346- 355.
Hearing VJ. Biochemical control of melanogenesis and melanossomal organization. J.
Investig Dermatol Symp Proc. 1999; (4): 24-28. Joerg H., Fries HR, Meijerink E, Stranzinger GF (1996) Red coat color in Holstein cattle is
associated with a deletion in the MSHR gene. Mamm. Genome 7: 317- 318. Johnson WE, Eizirik E, Pecon-Slattery J, Murphy WJ, Antunes A, Teeling E, O’Brien SJ
(2006) The late Miocene radiation of modern Felidae: a genetic assessment Science 311: 73- 77.
Kijas, JMH, Wales R, Törnstein A, Chardon P, Moller M, Andersson L (1998) Melanocortin
receptor 1 (MC1R) mutations and coat color in pigs Genetics 150: 1177- 1185. Klungland H, Väge DI, Gomez-Raya L, Adalsteinsson S, Lien S (1995) The role of
melanocyte-stimulating hormone (MSH) receptor in bovine coat color determination. Mamm Genome 6: 636- 639.
Kumar S, Tamura K, Nei M (2004) MEGA 3: Integrated software for Molecular
Evolutionary Genetics Analysis and sequence alignament. Briefings in Bioinformatics 5: 150- 163.
Kwon HY, Bultman JS, Löffer C, Chen, Furdon JP, Powell GJ, Usala AL, Wilkison W,
Hansmann P (1994) Molecular structure and chrosomal mapping of the human homolog of the agouti geneGenetics 91 pp. 9760- 9764.
Kuramoto T, Nomoto T, Sugimara T, Ushijima T. 2001a. Cloning of the rat agouti gene and
identificacion of the rat nonagouti mutation. Mamm. Genome 12: 469- 471. Majerus MEN 1998. Melanism: Evolution in Action. Oxford Univ. Press, Oxford. Marklund L, Moller MJ, Sandberg K, Andersson K (1996) A missense mutation in the
gene for melanocyte-stimulating hormone receptor (MC1R) is associated with the chestnut coat color in horses Mamm Genome 7: 895- 899.

34
Newton JM, Wilkie AL, He L, Jordan SA, Metallinos DL, Holmes NG, Jackson IJ, Barsh GS (2000). Melanocortin 1 receptor variation in the domestic dog. Mamm. Genome 11: 24-
30. Rieder S, Taourit S, Mariat D, Langlois B, Guerin G (2001) Mutations in the agouti (ASIP),
the extension (MC1R), and the brown (TYRP1) loci and their association to coat color phenotypes in horses (Equus caballus). Mamm. Genome 12: 450- 455.
Rouzaud F,Hearing VJ (2005) Regulatory elements of the melanocortin 1 receptor-
Peptides1858-70 Review. Siracusa LD (1994). The agouti gene: turned on to yellow. Tr. Genet. 10: 423- 428. Springer MS, Murphy WJ, Eizirik E, O’Brien SJ (2003) Placental mammal diversification
and the Cretaceous- Tertiary boundary. Springer MS, Murphy WJ, Eizirik E, Madsen O, Scally M, Douady CJ, Teeling EC,
Stanhope MJ, de Jong WW, O’Brien SJ (2007) A Molecular Classification for the Living Orders of Placental Mammals and the Phylogenetic Placement of Primates. In: Ravosa MJ, Dagosto M (eds). Primate Origins Adaptations and Evolution. University of Chicago Press, Chicago, IL.
Takeuchi S, Suzuki S, Hirose S, Yabuuchi M, Sato C, Yamamoto H, Takahashi S (1996).
Molecular cloning and sequence analysis of the chick melanocortin 1-receptor gene. Biochim. Biophys. Acta 1306: 122- 126.
Takeuchi S, Suzuki H, Yabuuchi M, Takahashi S (1996) A possible involvment of
melanocortin 1-receptor in regulating feather color pigmentation in the chiken. Biochim, Biophys. Acta: 164- 168.
Theron E, Hawkins K, Bermingham E, Ricklefs RE, Mundy NI (2001) The molecular basis
of an avian plumage polymorphism in the wild: a melanocortin-1-receptor point mutation is perfectly associated with the melanic plumage morph of the bananaquit. Coereba flaveola. Curr Biol. 11:550- 557.
Thompson JD, Gibson TJ, Plewniak F., Jeanmougin F., Higgins DG (1997) The Clustal-X
windows interface: flexible strategies for multiple sequence alignment aided by quality analysis tools. Nucleic Acids Res. 25: 4876- 4882.
Väge DI, Lu D, Klungland H, Lien S, Adalsteinsson S, Cone RD (1997) A non-epista-tic interaction of agouti and extension in the fox. Vulpes vulpes. Nat. Genet. 15: 311- 315. Väge DI, Klungland H, Lui D, Cone RD (1999) Molecular and pharmacological
characterization of dominant black coat color in sheep Mamm Genome 10: 39- 43. Voisey J and Daal VA (2002) Agouti: from Mouse to Man, from Skin to Fat. Pig. Cell Res.
15: 10- 18.

35
Yen TT, Gill AM, Frigeri LG, Barsh GS and Wolff GL (1994) Obesity, diabetes, and neoplasia in yellow A(vy)/- mice: ectopic expression of the agouti gene. FASEB J., 8: 479-888.

36
Table 1. Biological samples utilized in this study.
Individual ID Color Geographic Origin/Breed Geoffroy’s cat
(L. geoffroyi) bLge08*
bLge10*
bLge11*
bLge13*
bLge71*
bLge74*
bLge76*
bLge77*
bLge78*
Oge26
bOge4
bOge5
bOge6
Domestic cat
(Felis catus) Fca273
Fca802
Fca934
Fca938
Fca1902
Fca2096
Fca2348
Fca2641
Fca2685
Fca2976
Fca3004
Pampas cat
(L. colocolo) Lco13
Lco30
Oncilla
(L. tigrinus) Lti43
Leopard (Panthera pardus) Ppa281
non-melanistic non-melanistic non-melanistic non-melanistic melanistic melanistic non-melanistic melanistic non-melanistic non-melanistic melanistic melanistic melanistic blotched tabby blotched tabby blotched tabby mackerel tabby abyssinian black silver mackerel tabby black black abyssinian silver spotted non-melanistic melanistic non-melanistic non-melanistic
Cachoeira do Sul, RS, Brazil Cachoeira do Sul, RS, Brazil Cachoeira do Sul, RS, Brazil Eldorado do Sul, RS, Brazil Pelotas, RS, Brazil Pinheiro Machado, RS, Brazil Arroio Grande, RS, Brazil Dom Pedrito, RS, Brazil Rio Grande, RS, Brazil Córdoba, Argentina Cachoeira do Sul, RS, Brasil Cachoeira do Sul, RS, Brasil Cachoeira do Sul, RS, Brasil USA USA USA USA Abyssinian Frederick, MD, USA Scottish Fold Israel Porto Alegre, RS, Brazil Domestic shorthair Egyptian Mau Brazil USA Brazil Thailand
* Sequenced only for exons 2 and 3.

37
Table 2. PCR primers utilized in this study. Primer Sequence (5’-3’) agoF1 agoR1 agoR4 agoR7 agoRH-F1 agoISB-F1 agoISB-R1 agoEx2-F2 agoEx2-R1 agoEx3-F1 agoEx3-R1
GTCATCCGCCTACTCCTGGC TCCGCTTCTTTTCTGCTGATC CATGCTGACAGTACTGCTTG TTCCCTGCTCCTTCCCTGAT GGGCCTGACATTGAACATCT CCGAGAGACCCTGAAGTCAA CTCACTTCCCAGTGCCTAGC TTCTCTCTTCCACTCAGGCC ACTCCGGTCCATGAGAAGG TCCACTCCTCCACTTTACTG CCCTTAGCTCTCTGGGCTTC
Table 3. Sequence blocks identified with Data Set A (Felidae only). Sequence Block
Size (bp)
Genomic Region No. of Variable Sites
1 2 3 4 5 6
160 bp (1-160) 340 bp (161-500) 567 bp (741-1307) 453 bp (1391-1843) 62 bp (1844-1905) 177 bp (1906-2082)
Exon2 Intron2 Intron2 Intron2 Exon3 Intron3
9 (5.6%) 19 (5.5%) 26 (4.5%) 21 (4.6%) 3 (4.8%) 5 (3.2%)
Table 4. Sequence blocks identified with Data Set B (Felidae + Canidae). Sequence Block
Size (positions)
Genomic Region No. of Variable Sites
1 2 3.1 3.2 4 5 6
160 bp (1-160) 288 bp (161-449) 389 bp (743-1132) 140 bp (1171-1310) 303 bp (1575-1877) 62 bp (1878-1939) 177 bp (1940-2116)
Exon2 Intron2 Intron2 Intron2 Intron2 Exon3 Intron3
21 (13.7%) 58 (20.1%) 70 (6.9%) 21 (15%) 38 (12.8%) 4 (7%) 14 (8%)

38
Table 5. Sequence blocks identified with Data Set C (carnivores + cow + horse). Sequence Block
Size (position) Genomic Region
No. of Variable Sites
1 2 3.1.1 3.1.2 3.2.1 3.2.2 4.1 4.2 4.3 5 6
160 bp (1 - 160) 270 bp (161 - 430) 38 bp (719 - 756) 228 bp (757 - 984) 78 bp (1082 -1159) 131 bp (1226-1356) 193 bp (1592-1784) 48 bp (1785-1832) 36 bp (1901-1936) 65 bp (1937-2001) 191 bp (2002-2192)
Exon2 Intron2 Intron2 Intron2 Intron2 Intron2 Intron2 Intron2 Intron2 Exon3 Intron3
38 (23.7%) 102 (37.7%) 19 (50%) 101 (41.2%) 22 (28.2%) 38 (29%) 60 (31%) 15 (31.2%) 2 (5.5%) 10 (15.6%) 48 (24.8%)

39
Table 6 – Number of variable sites (V) and mean pairwise distance (p-distance, expressed as percentage) of ASIP nucleotide sequences compared at different levels of evolutionary depth. Block boundaries were defined based on the analysis of Data Set C.
Bloco de seqüência 1 2 3.1.1 3.1.2 3.2.1 3.2.2 4.1 4.2 4.3 5 6 Felidae V a P-Dist-Ts b
P-Dist-Tv c
Felidae x Canidae V a
P-Dist-Ts b
P-Dist-Tv c
Carnivora x Cetartiodactyla V a
P-Dist-Ts b
P-Dist-Tv c
Carnivora x Perissodactyla V a
P-Dist-Ts b
P-Dist-Tv c
Carnivora, Cetartiodactyla, Perissodactyla
V a
9 (5.6%) 2% 1% 21 (13.7%) 8% 2% 33(20.6%) 9% 6% 27(16.8%) 13% 1% 38 (23.7%)
12 (4.4%) 2% 0% 51 (18.8%) 15% 3% 88 (32.6%) 22% 7% 79 (29.2%) 15% 8% 102 (37.7%)
2 (5.2%) 0% 3% 6 (15.7%) 9% 4% 17(44.7%) 29% 21% 9(23.6%) 4% 18% 19(50%)
13 (5.7%) 2% 1% 45 (19.7%) 9% 5% 83 (36.4%) 19% 16% 69(30.2%) 15% 8% 101(42.4%)
2 (2.5%) 0% 1% 7(8.9%) 4% 4% 19(24.3%) 17% 4% 16(20.5%) 15% 2% 22(28.2%)
4 (3%) 1% 1% 19 (14.5%) 9% 5% 34 (25.6%) 18% 4% 29 (22.1%) 14% 4% 38 (29%)
9 (4.6%) 1% 1% 27 (13.9%) 9% 4% 53 (27.4%) 12% 12% 44 (22.8%) 11% 5% 60 (31.1%)
1 (2.1%) 1% 0% 6 (12.5%) 10% 5% 12 (25%) 16% 8% 11 (23%) 14% 7% 15 (31.2%)
0% 0% 0% 0% 0% 0% 1 (2.8%) 3% 0% 1 (2.8%) 3% 0% 2 (5.6%)
3 (4.6%) 2% 0% 4 (6.1%) 3% 0% 7 (10.7%) 7% 1% 8 (12.3%) 9% 2% 10 (15.6%)
5 (2.6 %) 1% 0% 15 (7.8%) 4% 3% 46 (23.4%) 14% 14% n/c d
n/c d
n/c d
48 (24.8%)
a V = Number of variable sites (% given in parentheses relative to the size of each block). b P-Dist-Ts = Mean pairwise p-distance (transitions only) c P-Dist- Tv = Mean pairwise p-distance (transversions only) d n/c= not calculated due to the lack of this segment in the available Equus caballus sequence.

40
Table 7 - Percentage of variable sites in exonic, marginal intronic (30 bp adjacent to an exon) and internal intronic regions of the ASIP gene in felids and canids. Only core conserved blocks identified in Data Set C were are included in the analysis, with further subdivision of marginal blocks when required to fit the criterion of 30-bp long boundary areas. Exon I Intron
(Marginal Region) Intron (Internal Region)
Felidae Felidae + Canidae
5.3% 10.6%
3.6% 13.2%
4.3% 15.3%

41
Figure Legends Fig. 1. Location of the PCR primers used in this study, relative to exons and introns of the ASIP gene. Fig. 2. Sequence blocks identified in the surveyed region of the ASIP gene, based on comparisons among Felids (Data Set A, top line), felids and canids (Data Set B, middle line), and ferungulates (felids, canids, cow and horse) (Data Set C, bottom line – see text for details). Numbers followed by asterisks indicate the size of each block in base pairs (bp); numbers at the bottom of each line identify the sequence blocks, while numbers on top of line C indicate the starting position of each block (see Tables 3-5 for precise location). Dotted lines connect equivalent points in the genomic segment analyzed here, whose position changed among data sets due to alignment adjustments. Fig. 3. Phylogenetic relationships among ASIP sequences investigated in this study.

42
Fig.1.
agoF1
agoR7 agoR4
agoRHF1 agoEx3-F1 agoEx2-F2
agoISBF1
3
agoEx2-R1 agoISBR1
2
agoR1 agoEx3-R1

43
Fig. 2
A
340*2
240*
SINE
567*3
83*
Repeat region
453*
4
177*
6
160*
1
288*
2
390*3.1
141* 303*4
62*
5
177*
6
C 1 161 719 757 1082 1226 1592 1785 1833 1901 1937 2002
160*
1
270*
2
38* 237* 78* 131* 193* 48* 36* 65*
5
192*
6
62*
5
B
160*
1
3.2
3.1.1 3.1.2 3.2.1 3.2.2 4.1 4.2 4.3

44
a. b. c. Fig.3
45
61
55
72
L. geoffroyi (Oge26)
L. colocolo (Lco13)
L. tigrinus (Lti43)
F. . catus (Fca273)
P. pardus (Ppa281)
V vulpes
C. familiaris
E . caballus
B. . taurus
2
3
3
1
1
1
100
100
100
48
100 99 L. geoffroyi (Oge26)
L. tigrinus (Lti43)
L. colocolo (Lco13)
P. pardus ( Ppa281)
F. catus (Fca273)
V. vulpes
C. familiaris
E. caballus
B. taurus
4
10
13
17
9
54
103
46
1
41
3
7
43
1
100
100
49
100
100
100
L. geoffroyi (Oge26)
L. tigrinus (Lti43)
L. colocolo (Lco13)
P. pardus (Ppa281)
F. catus (Fca273)
V. vulpes
C. familiaris E. caballus
B. taurus
4
12
14
17
9
58
105
47
1
42
3 7
45
1

45
5. CONSIDERAÇÕES FINAIS
O peptídeo “agouti” produzido pelo gene ASIP (Agouti Signaling Protein) regula
a pigmentação no folículo piloso dos mamíferos produzindo um pêlo preto com uma ou
mais bandas subapicais amarelas. Esse efeito na pigmentação é obtido pela
antagonização da ligação do hormônio estimulador do melanócito-α (α-MSH), que leva
à inibição do MC1R (Receptor da melanocortina 1), mudando a síntese da melanina de
eumelanina (preto/marrom) para feomelanina (vermelho/amarelo) (Voisey et al. 2002;
Rouzaud e Hearing 2005; Yen et al. 1994). Em relação ao gene MC1R, poucos estudos
até o momento abordaram a variabilidade genética do gene ASIP em mamíferos,
possivelmente por tratar-se de um gene mais complexo, consistindo de 3 exons
codificadores, apresentando splicing alternativo e exibindo pouca conservação entre
grupos, o que dificulta o desenho de ensaios moleculares para a sua investigação. Entre
as espécies estudadas estão as raposas vermelhas (Vage et al. 1997), ratos (Kuramoto et
al. 2001), cavalos (Rieder et al. 2001), camundongos (Miltenberger et al. 2002; Bultman
et al. 1992; Duhl 1994), bovinos (Klungland et al. 1995), cachorro (Berryere et al. 2004)
e zebrafish (Geldmacher-Voss et al. 2003). Entre os felídeos, alvo principal deste
estudo, até o momento o gene ASIP havia sido seqüenciado somente em Felis catus, o
qual possui uma deleção de dois nucleotídeos no éxon 2 associada ao melanismo
(Eizirik et al. 2003).
No presente estudo, foi possível caracterizar os níveis e padrões espaciais de
variabilidade presentes na porção 5’ da região codificadora do gene ASIP de várias
espécies de mamíferos. Observou-se um relaxamento da seleção natural em regiões
exônicas, levando a uma alta variabilidade, e uma conservação considerável em alguns
blocos intrônicos, possivelmente envolvidos em atividades regulatórias. Não foram
encontrados polimorfismos nas regiões codificadoras analisadas (éxons 2 e 3) em L.

46
geoffroyi ou L. colocolo, incluindo indivíduos melânicos e não-melânicos, indicando
que estes segmentos não estão envolvidos na geração deste fenótipo de pigmentação.
Os resultados deste estudo podem servir como base para futuras investigações sobre a
variabilidade do gene ASIP em mamíferos, tanto no que tange ao estudo do melanismo
em felídeos (focando esforços no exon 4 no caso de L. geofforyi e L. colocolo), como na
caracterização da relevância funcional dos segmentos conservados aqui identificados.
6. REFERÊNCIAS BIBLIOGRÁFICAS
Barsh, GS. Pigmentation, pleiotropy, and genetic pathways in humans and mice. Am J. Hum. Genet. 1995; (57): 743-747.
Barsh, GS. The genetics of pigmentation: from fancy genes to complex traits. Tr. in
Genet. 1996; (12): 299-305. Beddard F.E. Animal Coloration, 2nd ed. Swan Sonnenschein, London; 1895. Berryere TG, Kerns JA, Barsh GS, Schmutz SM. Association of an Agouti allele with
fawn or sable coat color in domestic dogs. Mamm Genome. 2005; (16): 262-72. Box N.F., Wyeth J.R., O’Gorman L.E., Martin N.G., Sturm R.A. Characterization of
Melanocyte stimulating hormone receptor variant alleles in twins with red hair. Hum. Mol. Genet. 1997; (6): 1891-897.
Bultman,S.J., Michaud E.J., Woychik R.P. Molecular characterization of the mouse
agouti locus. Cell 1992: (71): 1195-204. Bultman SJ, Klebig ML, Michaud EJ, Sweet HO, Davisson MT, Woychik RP.
Molecular analisys of reverse mutations from nonagouti (a) to black-and-tan (at) and White-bellied agouti (Aw) reveals alternative forms of agouti transcripts. Genes and Dev. 1994; (8): 481-90.
Castle W.E. & Allen G.M. The heredity of albinism. Proc. Amer. Acad. Arts Sci. 1903; (38): 603-622. Cott H.B. Adaptative Coloration in Animals, Methuen, London; 1940. Darwin C. The Variation of Animals and Plants under Domestication, 2nd ed., re-printed
in 1993 (paperback edition). Johns Hopkins Univ. Press, Baltimore; 1883. Eizirik E, Molecular evolution of melanism in the Felidae (Mammalia) Carnivora.
Ph.D. Thesis. University of Maryland, College Park, MD; 2002.

47
Eizirik E, Yuhki N, Johnson EW, Raymond MM, Hannah SS, O’Brien JS. Molecular Genetics and Evolution of Melanism in the Cat family. Current Biology 2003; (13): 448-53.
Everts RE, Rothuizen J, van Oost B.A. Identificacion of a premature stop codon in the
melanocyte-stimulating hormone receptor gene (MC1R) in Labrador and Golden re-trievers with yellow coat colour. Anim Genet. 2000; (31): 194-99.
Fleischman RA. From white spots to stem cells: the role of the Kit receptor in
mammalian development. Tr. Genet. 1993; (9): 285-290. Geldmacher-Voss B, Reugels AM, Pauls S, Campos-Ortega JA, A 90-degree rotation of
the mitotic spindle changes the orientation of mitoses of zebrafish neuroepithelial cells. Develop. 2003; (16): 3767-80.
Harding RM, Healy E, Ray AJ, Ellis NS, Flanagan N, Todd. Evidence for variable
selective pressures at MC1R. Am. J. Hum. Genet. 2000; (66): 1351-361. Hearing VJ. Biochemical control of melanogenesis and melanossomal organization. J.
Investig Dermatol Symp Proc. 1999; (4): 24-28. Jackson, IJ. Molecular and developmental genetics of mouse coat color. Annu. Rev.
Genet. 1994; (28): 189-217. Joerg H., Fries H.R., Meijerink E., Stranzinger G.F. Red coat color in Holstein cattle is
associated with a deletion in the MSHR gene. Mamm. Genome 1996; (7): 317-318. Kijas, JMH, Wales R, Törnstein A, Chardon P, Moller M, Andersson L. 1998. Mela-
nocortin receptor 1 (MC1R) mutations and coat color in pigs. Genetics 1998; (150): 1177-185.
Kijas JM, Moller M, Plastow G, Andersson L. A frameshift mutation in MC1R and a
high frequency of somatic reversions cause black spotting in pigs. Genetic. 2001; (2): 779-85.
Kitchener A. The natural History of Wilds Cats. Cornell Univ. Press, Ithaca; 1991. Klungland H, Vage DI, Gomez-Rava L, Adalsteinsson S, Lien S, The role of
melanocyte-stimulating hormone (MSH) receptor in bovine coat color determination. Mamm Genome 1995; (9): 636-9.
Klungland H, Roed KH, Nesbo CL, Jakobsen KS, Vage DI. The melanocyte-sti-
mulating hormone receptor (MC1R) gene as a tool in evolutionary studies of artiodacty-les. Hereditas. 1999; (131): 39-46.
Korner A, Pawelek J. Mammalian tyrosinase catalyses three reactions in the
biosynthesis of melanin. Science. 1982; (217): 1163-165. Kuramoto T, Nomoto T, Sugimara T, Ushijima T. Cloning of the rat agouti gene and
identificacion of the rat nonagouti mutation. Mamm. Genome 2001a; (12): 469-71.

48
Kuramoto T., Kitada K., Inui T., Sasaki Y., Ito K., Hase T., Kawagachi S., Ogawa Y.,
Na-kao K., Barsh G.S., Nagao M., Ushijima T., Serikawa T. Attractin/ mahagony/ zitter plays a critical role in myelination of the central nervous system. Proc. Natl. Acad. Sci. USA 2001b; (98): 559-64.
Majerus MEN. Melanism: Evolution in Action. Oxford Univ. Press, Oxford; 1998. Manga, P, Kromberg JGR, Box NF, Sturm RA, Jenkins T, Ramsay M. Rufous
oculocutaneous albinism in southern African blacks is caused by mutations in the Tyrp1 gene. Am. J. Hum. Genet. 1997; (61): 1095-101.
Marklund L, Moller MJ, Sandberg K, Andersson L. A missense mutation in the gene for
melanocyte-stimulating hormone receptor (MC1R) is associated with the chestnut coat color in horses. Mamm Genome. 1996; (12): 895-9.
Marklund S, Moller M, Sandberg K, Andersson L. Close association between sequence
polymorphism in the Kit gene and the roan coat color in horses. Mamm. Genome. 1999; (10): 283-88.
Metallinos DL, Bowling AT, Rine J. A missense mutation in the endothelin-B re-ceptor
gene is associated with Lethal White Foal Syndrome: an equine version of Hirschsprung Disease. Mamm. Genome. 1998; (9): 426-31.
Miltenberger RJ, Wakamatsu K, Ito S, Woychik P, Russel LB, Michaud E, Molecular
and Phenotypic analysis of 25 Recessive, Homozygous- viable alleles at the mouse agouti locus. Genetics. 2002; (160): 659-74.
Mountjoy KG, Robbins LS, Mortrud MT, Cone RD. 1992. The cloning of a family of
genes that encode the melanocortin receptors. Science. 1992; (257): 1248-251. Newton JM, Wilkie AL, He L, Jordan SA, Metallinos DL, Holmes NG. Melanocortin 1
receptor variation in the domestic dog. Mamm. Genome 2000; (11): 24-30. Ortolani A. & Caro TM. The adaptative significance of color patterns in carnivores:
Phylogenetic test of classic hypotheses. Pp. 132-188 in Gittleman J.L. (ed.) Carnivore Behavior, Ecology an Evolution, vol. 2, Cornell Univ. Press, New York; 1996.
Perry WL, Nakamura T, Swing DA, Secrest L, Eagleson B, Hustad CM. et al. Coupled
site-directed mutagenesis/transgenesis identifies important functional domains of the mouse agouti protein. Genetics 1996; (144): 255-64.
Prota G. Melanism and Melanogenesis. ed. Academic Press, United States of America;
1992. Rana BK, Hewett-Emmett D, Jin L, Chang BH-J Sambuughin N, Lin M, e1999. High
polymorphism at the human melanocortin 1 receptor locus. Genetics 1999; (151): 1547-557.

49
Rees JL. The melanocortin 1 receptor (MC1R): more than just red hair. Pigment Cell Res. 2000; (13): 135-140.
Rieder S., Taourit S., Mariat D., Langlois B., Guerin G. 2001 Mutations in the agouti
(ASIP), the extension (MC1R), and the brown (TYRP1) loci and their association to coat color phenotypes in horses (Equus caballus). Mamm. Genome 2001; (12): 450-55.
Rouzaud F, Hearing VJ. Regulatory elements of the melanocortin 1 receptor. Peptides
2005; (10): 1858-70. Robbins LS, Nadeau JH, Johnson KR, Kelly MA, Roselli-Rehfuss L, Baack E. et al.
Pigmentation phenotypes of variant extension locus alleles result from point mutations that alter MSH receptor function. Cell 1993; (72): 827-34.
Silvers WK. The coat Colors of Mice: a Model for Mammalian Gene Action and
Interaction. Springer-Verlag, New York; 1979. Siracusa LD. The agouti gene: turned on to yellow. Tr. Genet. 1994; (10): 423-28. Sturm RA, Teasdale RD, Box NF. Human pigmentation genes: identification, Structure
and consequences of polymorphic variation. Gene 2001; (277): 49-62. Vage DI, Lu D, Klungland H, Lien S, Adalsteinsson S, Cone RD 1997. A non-epista-tic
interaction of agouti and extension in the fox. Vulpes vulpes. Nat. Genet. 1997; (15): 311-15.
Weigel I. Das Fellmuster der wildlebenden Katzenarten und der Hauskatze in vergei-
chender und stammesgeschinchtlicher Hinsicht. Säugetierkdl. Mitt. 1961 (Sonderheft)9: 1-120.
Yen,TT, Gill AM, Frigeri LG, Barsh GS. and Wolff GL. Obesity, diabetes, and
neoplasia in yellow A(vy)/- mice: ectopic expression of the agouti gene. FASEB J. 1994; (8): 479-888.

50