localiza institucional inglês
TRANSCRIPT

Institutional PresentationFebruary, 2017

1. Company overview
2. Main business divisions
Car Rental
Fleet Rental
Seminovos
3. Financials
Appendix: Earnings release 4Q16
Agenda
2

Company: milestones
Phase I – Rise to #1
1973 – Founded in Belo Horizonte/MG
Late 70’s - Acquisitions in the Northeast of Brazil
1981 – Brazilian car rental leader in # of branches
Phase II – Expansion
1984 – Expansion strategy by adjacencies: Franchising
1991 – Expansion strategy by adjacencies: Seminovos
1997 – Expansion strategy by adjacencies: Fleet Rental
1997 – PE firm DL&J enters at a market cap of US$ 150 mm
Phase III – Reaching Scale
2005 – IPO: market cap of US$ 295 mm
2011 – Rated as investment grade by Moody’s, Fitch and S&P in 2012
2012 – ADR level I
12/31/2016 – Market cap of about US$2.2 bi with ADTV of US$11.3 million
1973 1982 1983 2004 2005 2016
3

Company: integrated business platform
Synergies:bargaining powercost reductioncross selling
14,015 cars 158 locations in Brazil 70 locations in South America 33 employees
49.8% sold to final consumer 84 stores 53 cities 1.029 employees
94,156 cars 6.4 million clients 333 locations 4,865 employees
34,948 cars 925 clients 397 employees
Based on the 4Q16 4
Car Rental Fleet Rental
SeminovosFranchising
This integrated business platform gives Localiza flexibility and superior performance.
5
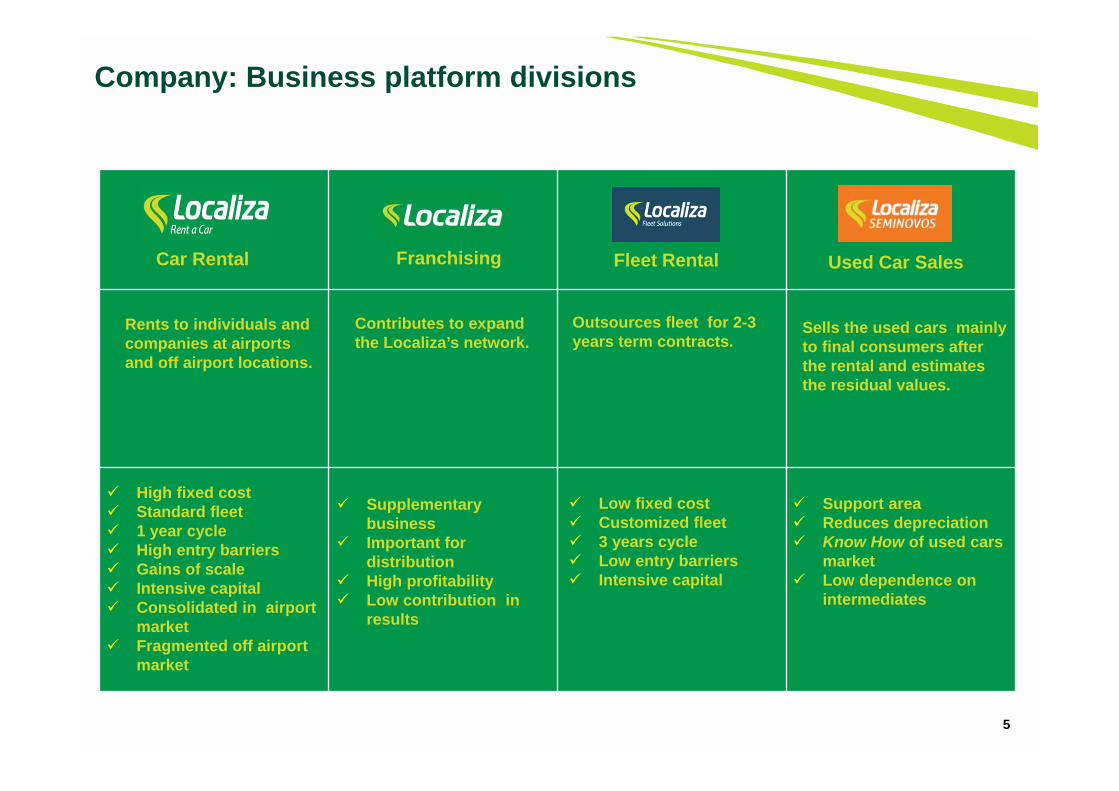
High fixed cost Standard fleet 1 year cycle High entry barriers Gains of scale Intensive capital Consolidated in airport
market Fragmented off airport
market
Support area Reduces depreciation Know How of used cars
market Low dependence on
intermediates
Supplementary business
Important for distribution
High profitability Low contribution in
results
Company: Business platform divisions
Car Rental
Rents to individuals and companies at airports and off airport locations.
Franchising
Contributes to expand the Localiza’s network.
Fleet Rental
Outsources fleet for 2-3 years term contracts.
Used Car Sales
Sells the used cars mainly to final consumers after the rental and estimates the residual values.
Low fixed cost Customized fleet 3 years cycle Low entry barriers Intensive capital

6
Net car salerevenue R$31.61 year cycle
Car Rental Division - 2016 Financial CyclePer car
R$35.2Average car price(past 2 years)
1 2 3 4 5 6 7 8 9 10 11 12Expenses, interest and tax
Revenue
Total1 year
R$ % R$ % R$Net revenues 20.3 100.0% 34.6 100.0% 55.0Costs - fixed and variable (10.1) -49.5% (10.1)SG&A (3.7) -18.1% (3.1) -8.9% (6.8)Net revenues of car sold 31.6 91.1% 31.6Book value of car sold (30.0) -86.6% (30.0)EBITDA 6.6 32.3% 1.6 4.6% 8.2Cars Depreciation (1.3) -3.6% (1.3)Others depreciation (0.3) -1.7% (0.1) -0.4% (0.5)Financial expenses (2.5) -7.2% (2.5)Taxes (1.9) -9.2% 0.7 2.0% (1.2)Net Income (Loss) 4.4 21.5% (1.6) -4.6% 2.8
NOPAT 5.0ROIC 14.2%Cost of debt after taxes 10.2%
Car Rental SeminovosPer car soldPer operating car

7
Net car salerevenue R$29.2
3 year cycle
Fleet Rental Division - 2016 Financial Cycle Per car
1 2 3 4 5 6 31 32 33 34 35 36Expenses, interest and tax
Revenue
R$42.9Average car price(past 2 years)
Total3 years
R$ % Seminovos % R$Net revenues 61.3 100.0% 32.0 100.0% 93.3Costs - fixed and variable (18.2) -29.7% (18.2)SG&A (3.6) -5.8% (2.9) -8.9% (6.4)Net revenues of car sold 29.2 91.1% 29.2Book value of car sold (25.7) -80.4% (25.7)EBITDA 39.5 64.5% 3.4 10.7% 42.9Cars Depreciation (11.1) -34.8% (11.1)Others depreciation (0.3) -0.4% (0.2) -0.5% (0.4)Financial expenses (6.5) -20.2% (6.5)Taxes (11.8) -19.2% 4.3 13.5% (7.5)Net Income (Loss) 27.5 44.8% (10.1) -31.4% 17.4
Net Income (Loss) - per year 9.2 44.8% (3.4) -31.4% 5.8
NOPAT 8.1ROIC 18.9%Cost of debt after taxes 10.2%
Per operating carFleet Rental Seminovos
Per car sold

8
2016 Consolidated breakdownR$ million
R$ 128 13%
R$ 420 41% R$ 468
46% R$ 334 43%
R$ 437 57%
Net RevenuesR$4,439
EBITDAR$1,016
R$ 2,343 53%
R$ 652 15% R$ 1,445
32%
EBIT*R$771
*Seminovos results recorded in the Car Rental and Fleet Rental Divisions
Company’s profitability comes from Car Rental and Fleet Rental Divisions.

Raisingmoney Buying
cars
Renting Cars SellingCars
Cash to renew the fleet or pay debt
$
Profitability comes from rental divisions
Competitive advantages
$
9
43 years of experience in managing assets and generating value.
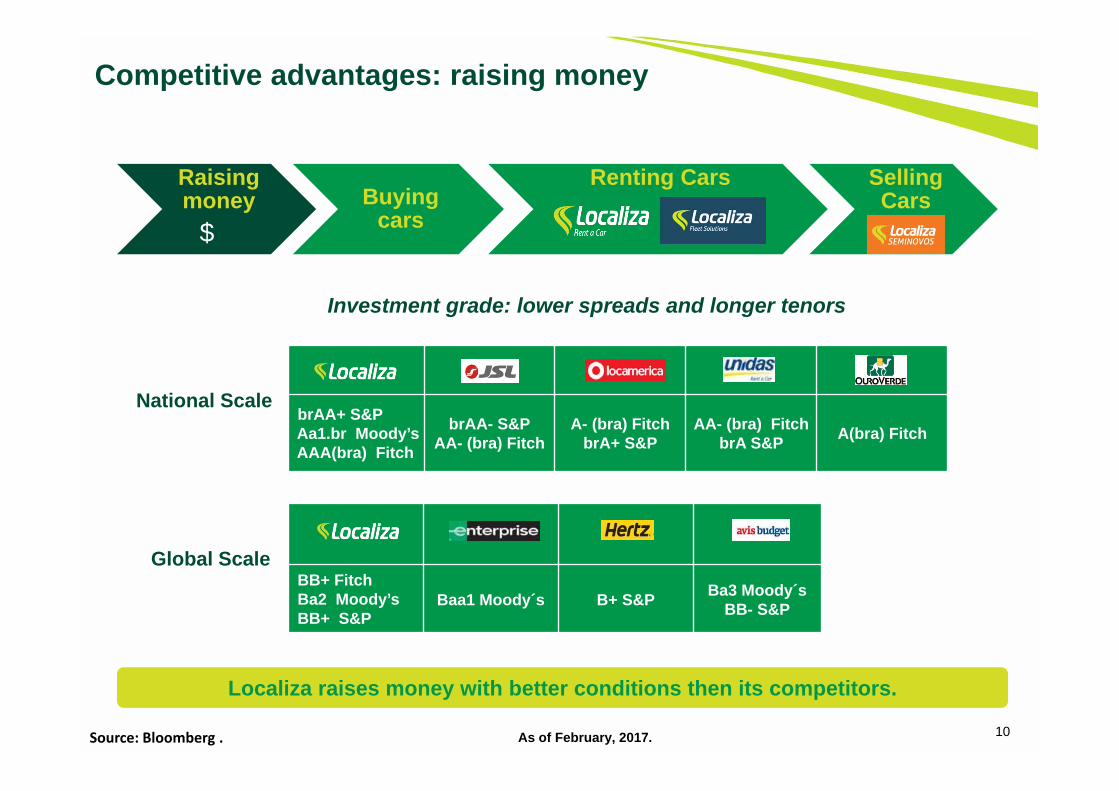
Competitive advantages: raising money
Global Scale
National Scale
As of February, 2017.
BB+ FitchBa2 Moody’sBB+ S&P
Baa1 Moody´s B+ S&P Ba3 Moody´sBB- S&P
brAA+ S&P Aa1.br Moody’sAAA(bra) Fitch
brAA- S&PAA- (bra) Fitch
A- (bra) FitchbrA+ S&P
AA- (bra) FitchbrA S&P A(bra) Fitch
10
Investment grade: lower spreads and longer tenors
Source: Bloomberg .
Raisingmoney Buying
cars
Renting Cars SellingCars
$
Localiza raises money with better conditions then its competitors.

Raisingmoney Buying
cars
Renting Cars SellingCars
11
Competitive advantages: buying cars
Number of cars purchased - 2016
* Includes Franchising.Source: each company website and ANFAVEA
Localiza’s share in the internal salesof the OEMs - 2016
4.7%
$
Localiza buys cars with better conditions due to the volume of purchases.
92,671
45,114 26,709
9,122
Localiza Movida Unidas Locamerica
*

Raisingmoney Buying
cars
Renting Cars SellingCars
12
Competitive advantages: renting cars
BrandBrazilian distribution
# of
bra
nche
s#
of c
ities
Source: Each company website on 01/23/2017, 4Q16 Earnings Release..
$
The Company is present in 180 cities where the other largest networks do not operate.
502
92
227
183
Localiza Competitors
491
360
153
63 96
Localiza Unidas Hertz Movida

Raisingmoney Buying
cars
Renting Cars SellingCars
13
Localiza Fast®Mobile‐based counter bypass:Provides agility and controlover the car rental experience.Customers can pick‐up carbypassing our counter
Localiza Way®New platform to offer value‐added services
Mobile ChecklistMore quality, control and agility in providing cars for rental
Fast CheckoutMore operational productivity and agility in returning the cars after rental
Connected ShuttleOptimization of customer shuttle service at airports
Anti fraudTaylor‐made solution for fraud prevention in car rentals
Competitive advantages: Innovation
$
Constant innovations allow maintenance of the premium service.

14
Integrated technology solution that increases competitive intelligence and leverages productivity gains.
CONNECTED FLEETIntegrated mobile solution tofleet rental services for drivers and contract manager.
MOBILE SOLUTIONRapid diagnosis and friendly vision of the fleet by the customer.
ONLINE FLEET RENTAL
Competitive advantages: Innovation
Raisingmoney Buying
cars
Renting Cars SellingCars
$
Differentiated offer with higher added value to the customer.

Raisingmoney Buying
cars
Renting Cars SellingCars
15
Sales to final consumer
Competitive advantages: selling cars
Buffer: additional fleet during peaks of demand Large database
$
Deep know how of used car market: consumer preference, pricing and residual value
NPS of 70 (survey made 90 days after the purchase)
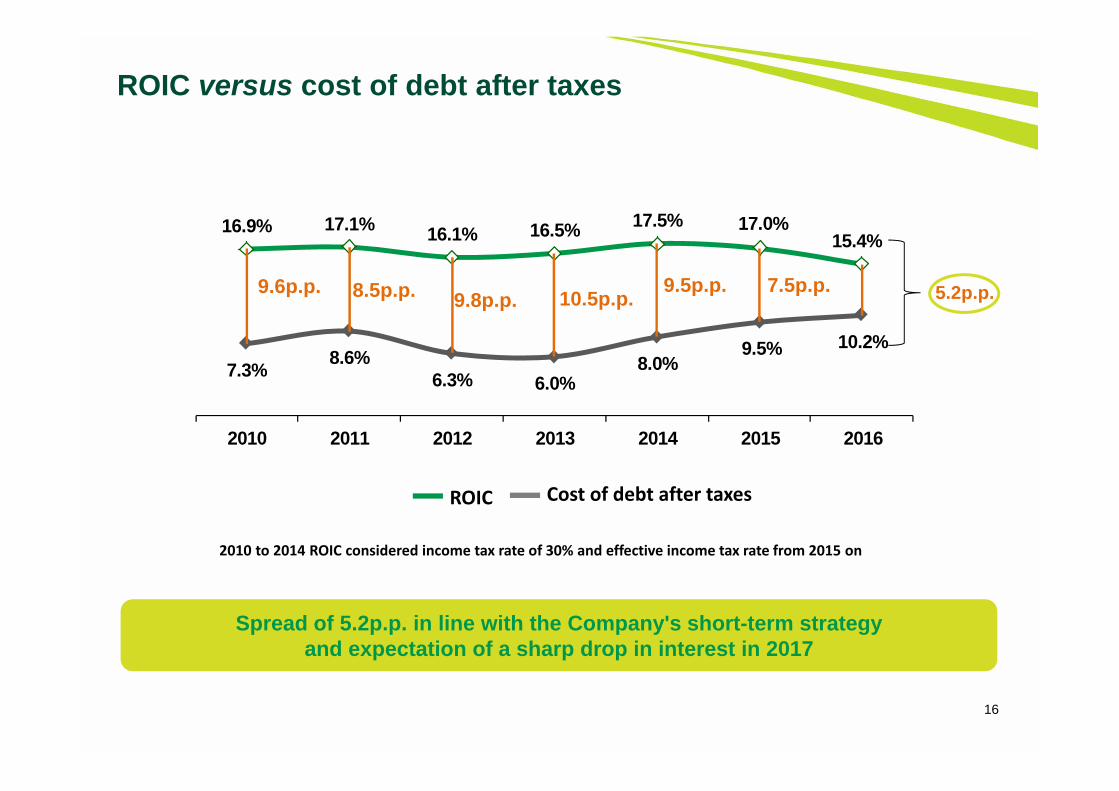
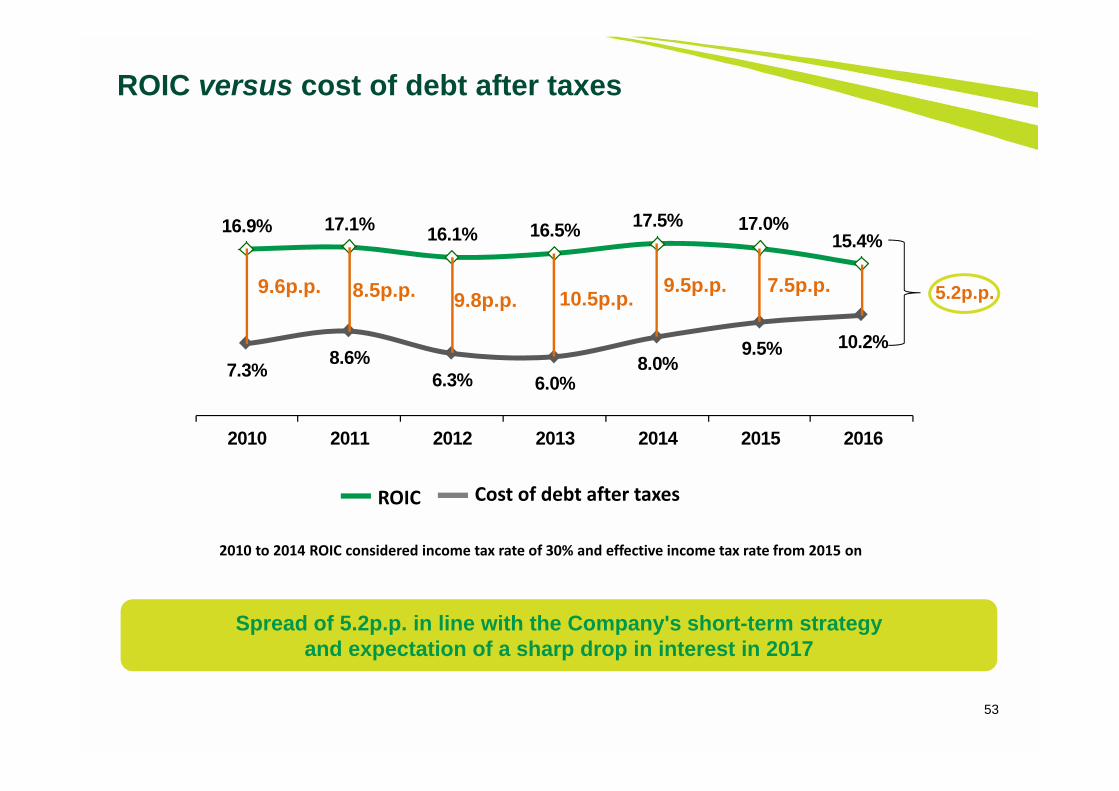
7.3% 8.6%6.3% 6.0%
8.0%9.5% 10.2%
16.9% 17.1% 16.1% 16.5% 17.5% 17.0%15.4%
2010 2011 2012 2013 2014 2015 2016
16
ROIC versus cost of debt after taxes
ROIC Cost of debt after taxes
9.6p.p. 8.5p.p. 9.5p.p.9.8p.p. 10.5p.p. 7.5p.p. 5.2p.p.
2010 to 2014 ROIC considered income tax rate of 30% and effective income tax rate from 2015 on
Spread of 5.2p.p. in line with the Company's short-term strategyand expectation of a sharp drop in interest in 2017
17
1. Company overview
2. Main business divisions
Car Rental
Fleet Rental
Seminovos
3. Financials
Appendix: Earnings release 4Q16
Agenda

18
Car Rental overview
Compact cars 55.9%
Others 44.1%
2016 Fleet composition94,156 cars
Corporate fleet size
65,08670,717 77,573 76,755
94,156
2012 2013 2014 2015 2016
Car rental distribution (Brazil)
474 479 476 494 491
2012 2013 2014 2015 2016
19
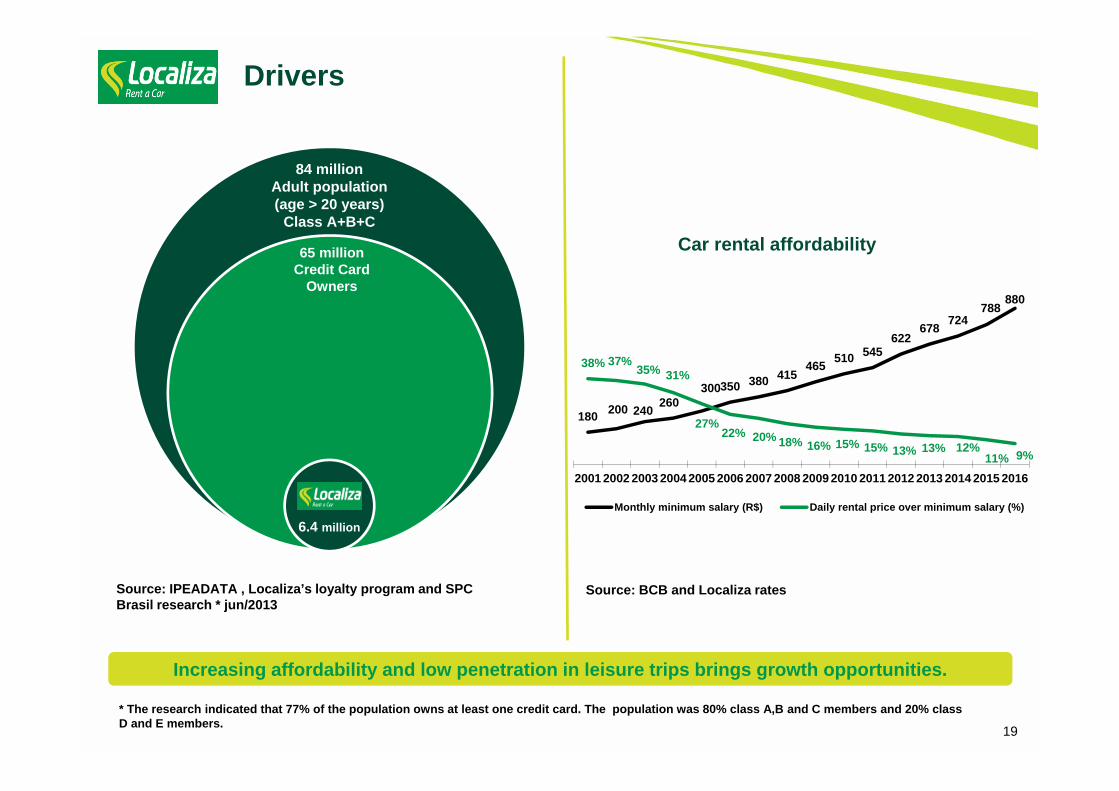
Drivers
Source: BCB and Localiza rates
Car rental affordability
Source: IPEADATA , Localiza’s loyalty program and SPC Brasil research * jun/2013
6.4 million
84 millionAdult population(age > 20 years)
Class A+B+C
65 millionCredit Card
Owners
Increasing affordability and low penetration in leisure trips brings growth opportunities.
180 200 240 260300350 380 415
465 510 545622
678 724788
880
38% 37%35% 31%
27%22% 20% 18% 16% 15% 15% 13% 13% 12%
11% 9%
2001 2002 2003 2004 2005 2006 2007 2008 2009 2010 2011 2012 2013 2014 2015 2016
Monthly minimum salary (R$) Daily rental price over minimum salary (%)
* The research indicated that 77% of the population owns at least one credit card. The population was 80% class A,B and C members and 20% class D and E members.

20
Drivers
# domestic air traffic passengersIn million
Expected investment 2016-2019(in R$ billion)
Source: Sectorial Analysis Committee / BNDES: 2016-2019 , as of February, 2016.
Source: ANAC up to 2016 and IATA-Air Passenger Forecast Global Report, as of February, 2016.
The pipeline of investments tend to benefit the corporate segment.
Expected annual traffic growth of 2.5% from 2017 to 2034 traffic.
70 82 89 90 96 96 89
2010 2011 2012 2013 2014 2015 2016
214.1
142.6
87.1
35.8
32.9
32.5
17.0
15.5
5.8
Energy
Telecoms
Highways
Sanitation
Railways
Urban mobility
Airports
Ports
Solid Residues

21Source: ABLA, each company’s website on 01/23/2017 and Localiza´s 4Q16 Earnings Release
Airport locations Off-airport locations
Car Rental Locations in Brazil
Off‐airport market is still fragmented.

22
Market ShareGross Revenue - Car Rental 2016
Source: ABLA and Companies’ Financial Statements.
Localiza’s market share is higher than the 2nd and 3rd players together.
33.7%
13.5%7.6%
45.2%
Localiza(includes franchising)
Movida
Unidas
Others
Market size:R$5.1 billion

23
1. Company overview
2. Main business divisions
Car Rental
Fleet Rental
Seminovos
3. Financials
Appendix: Earnings release 4Q16
Agenda

24
Number of clients
Fleet Rental overview
Compact cars 33.8%
Others 66.2%
2016 Fleet composition34,960 cars
729 760 798 849 925
2012 2013 2014 2015 2016
End of period fleet
32,104 32,809 34,312 33,948 34,960
2012 2013 2014 2015 2016

25Source: ABLA, Datamonitor and Localiza
Rented fleet penetration
Corporate fleet:4,000,000*
Rented fleet:440,737
34,960
Brazilian Market World
11.0% 8.9%13.3% 16.5%
24.5%
37.4%46.9%
58.3%
Drivers
*Localiza estimates
Low penetration of rented fleet in Brazil.

Market ShareGross Revenue - Fleet Rental 2016
26Source: ABLA, Companies’ Financial Statements.
Fragmented market with low entry barriers.
12.2%
3.8%
6.5%
8.1%
69.3%
Localiza
Movida
UnidasOthers
Locamerica
Market size:R$5.4 billion

27
1. Company overview
2. Main business divisions
Car Rental
Fleet Rental
Seminovos
3. Financials
Appendix: Earnings release 4Q16
Agenda
28
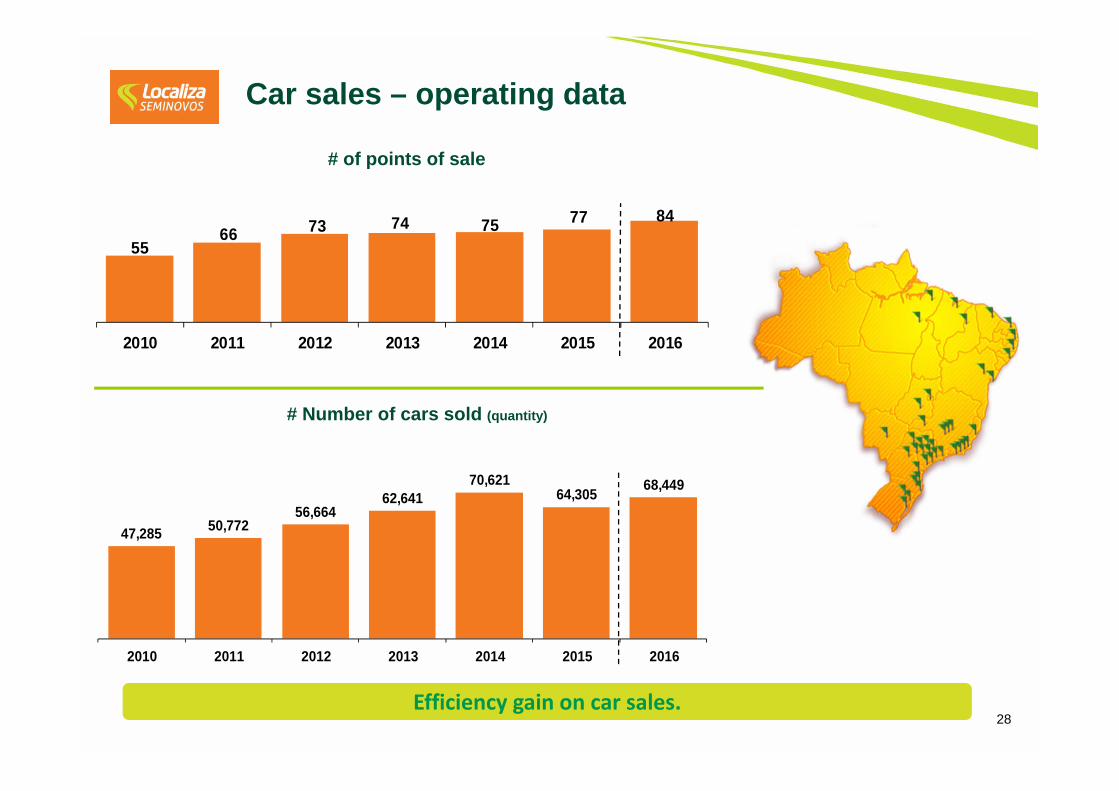
# of points of sale
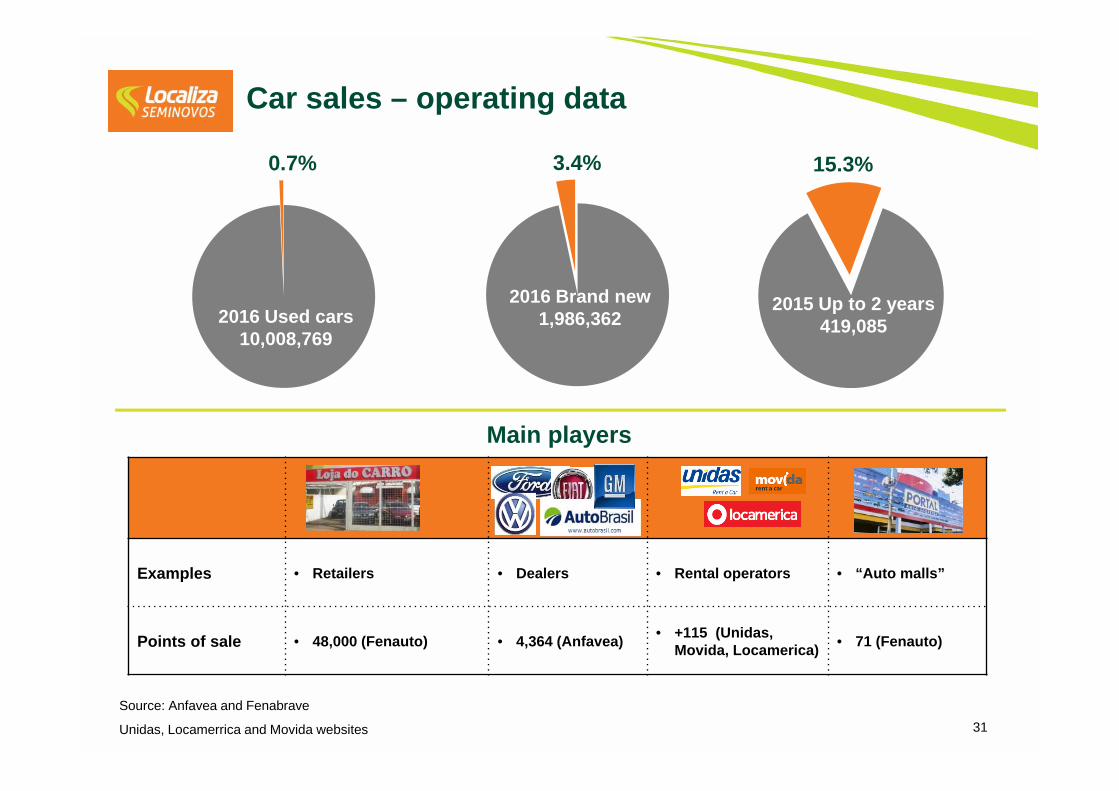
Car sales – operating data
5566 73 74 75 77 84
2010 2011 2012 2013 2014 2015 2016
47,285 50,77256,664
62,64170,621
64,305 68,449
2010 2011 2012 2013 2014 2015 2016
# Number of cars sold (quantity)
Efficiency gain on car sales.
29
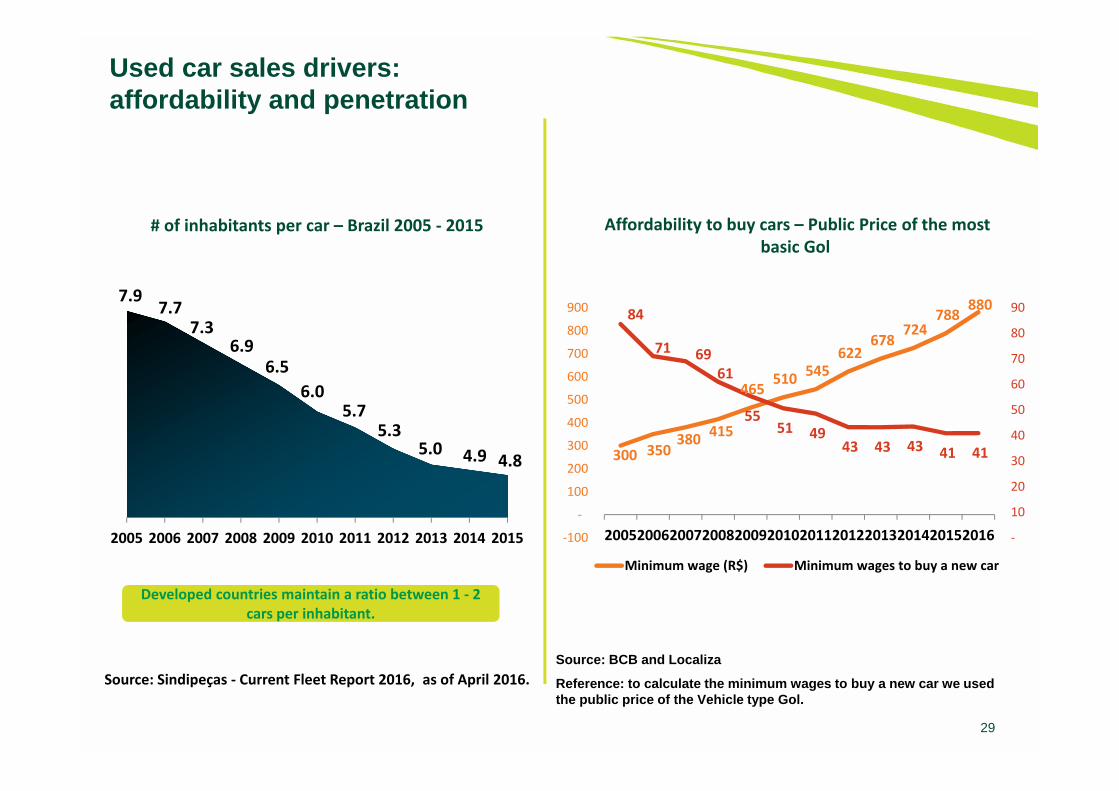
Used car sales drivers: affordability and penetration
Affordability to buy cars – Public Price of the most basic Gol
300 350 380 415
465 510 545
622 678
724 788
880 84
71 69 61
55 51 49
43 43 43 41 41
‐
10
20
30
40
50
60
70
80
90
‐100
‐
100
200
300
400
500
600
700
800
900
200520062007200820092010201120122013201420152016
Minimum wage (R$) Minimum wages to buy a new car
7.97.7
7.36.9
6.56.0
5.75.3
5.0 4.9 4.8
2005 2006 2007 2008 2009 2010 2011 2012 2013 2014 2015
# of inhabitants per car – Brazil 2005 ‐ 2015
Source: Sindipeças ‐ Current Fleet Report 2016, as of April 2016.
Developed countries maintain a ratio between 1 ‐ 2 cars per inhabitant.
Source: BCB and Localiza
Reference: to calculate the minimum wages to buy a new car we used the public price of the Vehicle type Gol.
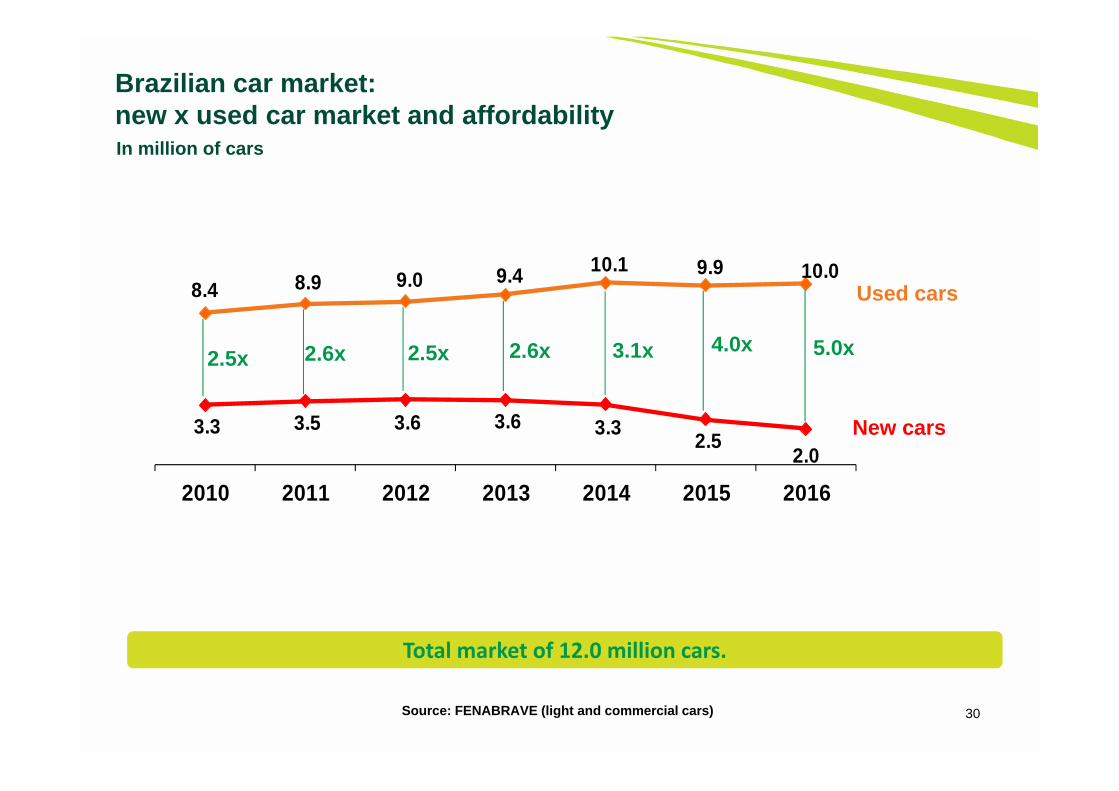
8.4 8.9 9.0 9.4 10.1 9.9 10.0
3.3 3.5 3.6 3.6 3.3 2.52.0
2010 2011 2012 2013 2014 2015 2016
30
Brazilian car market: new x used car market and affordability
New cars
Used cars
Source: FENABRAVE (light and commercial cars)
In million of cars
Total market of 12.0 million cars.
2.5x 2.5x2.6x 2.6x 3.1x 4.0x 5.0x
31
2015 Up to 2 years419,085
2016 Brand new1,986,3622016 Used cars
10,008,769
0.7% 3.4% 15.3%
Car sales – operating data
Source: Anfavea and Fenabrave
Unidas, Locamerrica and Movida websites
Examples • Retailers • Dealers • Rental operators • “Auto malls”
Points of sale • 48,000 (Fenauto) • 4,364 (Anfavea) • +115 (Unidas, Movida, Locamerica) • 71 (Fenauto)
Main players

32
1. Company overview
2. Main business divisions
Car Rental
Fleet Rental
Seminovos
3. Financials
Appendix: Earnings release 4Q16
Agenda

Message from the CEO – highlights Financial discipline and strong balance sheet
Cash position and debt profile to face the tough environmentHigh credit ratings
The only company in the sector to create value for shareholdersFocused on leadership, commercial and operational excellence and on active cost management
Long‐term global strategic alliance agreement with The Hertz CorporationExpand its market share in inbound/outbound reservationsUse the Localiza‐Hertz brand through a co‐brand agreementExchange knowhow, technology and expertise
Indisputable leadership in quality and serviceNet Promoter Score of over 80 in 2016
The most visited site in its category, with more than 7.6 million visitors in 2016195,000 downloads of its mobile appFacebook fan page with more than 515,000 followers and the highest engagement in the category
Protagonist on innovationLocaliza FAST na app that allows clients to open the car door without going through the counter
Brand25ª most valuable brand in Brazil , among other brands across different sectors
Highest standards of ethics and corporate governanceHonored as the best company in Transparency and Ethics at the Revista Exame 2016 ranking
Car rental division with the biggest and most diversified fleet that is renewed yearlyMore than 50 models of cars, from compact to premium brands such as Audi, BMW and Volvo
33Strong ambition towards growth and expanding its market leadership
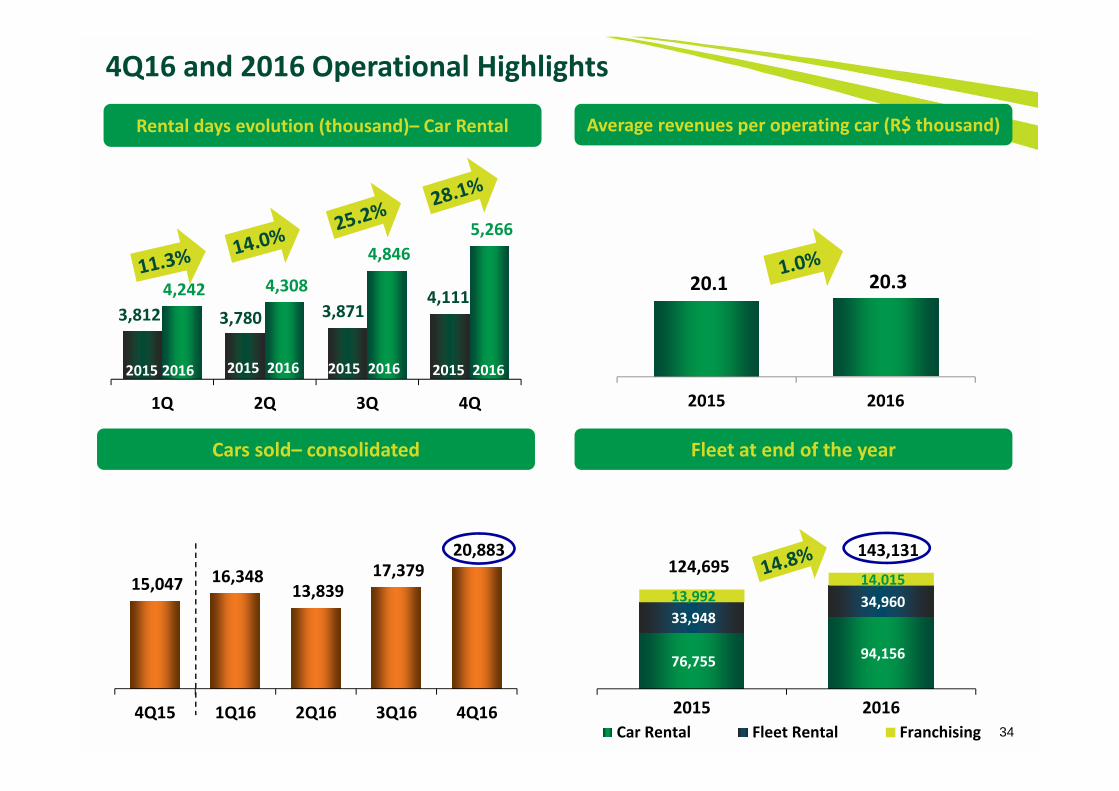
3,812 3,780 3,871 4,111 4,242 4,308
4,846 5,266
1Q 2Q 3Q 4Q
76,755 94,156
33,948 34,960 13,992 14,015
124,695 143,131
2015 2016Car Rental Fleet Rental Franchising 34
4Q16 and 2016 Operational Highlights
15,047 16,348 13,839
17,379 20,883
4Q15 1Q16 2Q16 3Q16 4Q16
Cars sold– consolidated
Rental days evolution (thousand)– Car Rental Average revenues per operating car (R$ thousand)
Fleet at end of the year
20.1 20.3
2015 2016
2015 2016 2015 2016 2015 2016 2015 2016

Net Revenues - (R$ million) EBITDA - (R$ million)
Net Income (R$ million)
402.4 409.3
2015 2016
4Q16 and 2016 Financial Highlights
35
EBIT (R$ milhões)
338.7 402.2 155.6 170.5 499.2
733.3 993.5
1,306.0
4Q15 4Q16
Car Rental Fleet Rental Seminovos
228.0 270.9
4Q15 4Q16
175.0 202.0
4Q15 4Q16

36
Number of Daily Rentals (thousand)
28.1% increase in car rental volume and 19.0% growth in net revenue in 4Q16 versus 4Q15
10,734 12,794 13,749 14,242 15,416 15,566
18,662
4,111 5,266
2010 2011 2012 2013 2014 2015 2016 4Q15 4Q16
Car Rental
802.2 980.7 1,093.7 1,163.5 1,284.4 1,258.0
1,428.0
334.5 398.0
2010 2011 2012 2013 2014 2015 2016 4Q15 4Q16
Net Revenues (R$ million)

69.1% 68.9%70.8%
66.8%69.9% 69.3%
73.4%
2010 2011 2012 2013 2014 2015 2016
37
Utilization Rate Evolution – Car Rental
The increase in the utilization rate offset the drop in the average rate, keeping the average revenue per operating car stable
Car Rental
Average daily rental – In R$
19.5 19.120.4
19.7 20.9
20.1 20.3
2010 2011 2012 2013 2014 2015 2016
78.07 79.68 82.36 84.85 87.71 84.56
79.67
2010 2011 2012 2013 2014 2015 2016
Average annual revenues per operating car (R$ thousand)

Car Rental network evolution
Number of car rental locations (Brazil and abroad)
13 new corporate locations were added to the network
Localiza´s branches - Brazil Franchisees´ branches - Brazil Franchisees´ branches - abroad
234 247 272 286 304 320 333
181 202 202 193 172 174 15861 47 50 63 64 70 70476 496 524 542 540 564 561
2010 2011 2012 2013 2014 2015 2016
+13

39
Fleet Rental
361.1 455.0
535.7 575.9 571.9 608.5 651.8
155.6 170.5
2010 2011 2012 2013 2014 2015 2016 4Q15 4Q16
8,044 9,603 10,601 10,844 10,363 10,901 11,240
2,702 2,922
2010 2011 2012 2013 2014 2015 2016 4Q15 4Q16
Net Revenues (R$ million)
Number of Daily Rentals (thousand)
8.1% growth in daily volume and 9.6% in net revenue in 4Q16 versus 4Q15

Purchases (includes accessories) Used car sales net revenues
Cars purchased Cars sold
40
Net investment Fleet Expansion* (quantity)
Net Investment in Fleet (R$ million)
9,178 2,011 7,10318,649
* It does not consider theft / crashed cars.
9,183
465
(273)
65,934 59,950 58,655 69,744 79,804
64,032
87,833
21,660 27,921
47,285 50,772 56,644 62,641 70,621 64,305 68,449
15,047 20,883
2010 2011 2012 2013 2014 2015 2016 4Q15 4Q16
1,910 1,777 1,6192,026
2,483 2,278
3,290
838 1,0781,322 1,468 1,520 1,7472,018 2,045
2,343
499733
2010 2011 2012 2013 2014 2015 2016 4Q15 4Q16
Strong growth in the fleet to support the Company's growth
309 99588 279 233
6,613
339
19,384
7,038
R$947
345

41
Number of points of sale
New stores will be added to the network to support the renewal of the fleet due to the strong growth of the Car Rental Division
5566 73 74 75 77 84
2010 2011 2012 2013 2014 2015 2016
+7

42
Period-end fleetQuantity
61,445 64,688 65,086 70,717 77,573 76,755 94,156 26,615 31,629 32,104 32,809 34,312 33,948
34,960 10,652 12,958 14,545 14,233 13,339 13,992
14,015 98,712 109,275 111,735 117,759 125,224 124,695
143,131
2010 2011 2012 2013 2014 2015 2016
Car Rental Fleet Rental Franchising
The car rental fleet increased 17,401 cars to meet strong demand, maintaining the utilization rate at a record level of 73.4%
+17,401
+1,012

1,175.3 1,450.0 1,646.7 1,758.9 1,874.0 1,883.1 2,096.8 494.3 572.7
1,321.9 1,468.1 1,520.0 1,747.3 2,018.2 2,044.9 2,342.5
499.2 733.3
2,497.2 2,918.1 3,166.7 3,506.2
3,892.2 3,928.0 4,439.3
993.5 1,306.0
2010 2011 2012 2013 2014 2015 2016 4Q15 4Q16
43
Consolidated net revenuesR$ million
Rental Used car sales
31.5% increase in consolidated revenue in 4Q16 versus 4Q15
The increase of 46.9% in 4Q16 in the revenue of the Seminovos is due to 5,836 cars sold more than in 4Q15, and to the increase of 5.9% in the car prices

44
Consolidated EBITDA R$ million
(*)From 2012 onwards, accessories and freight of new cars have been accounted directly in the cost line, impacting EBITDA but reducing depreciation costs.(**) It considers the new appropriation criteria of the overhead, which is also appropriated to Seminovos.
Divisions 2010* 2011* 2012 2013 2014** 2015 2016 4Q15 4Q16
Car Rental 45.3% 46.9% 40.9% 36.8% 38.7% 31.8% 32.3% 30.2% 31.5%
Fleet Rental 68.0% 68.6% 66.4% 65.5% 60.0% 62.2% 64.5% 64.0% 63.8%
Rental Consolidated 52.3% 53.8% 49.3% 46.5% 45.3% 41.7% 42.3% 40.8% 40.8%
Used Car Sales 2.6% 2.8% 4.2% 5.7% 6.0% 7.3% 5.5% 5.2% 5.0%
Increase of R$42.9 million in EBITDA in 4Q16
649.5821.3 875.6 916.5 969.8 934.8 1,015.6
228.0 270.9
2010 2011 2012 2013 2014 2015 2016 4Q15 4Q16
+ R$42.9
45
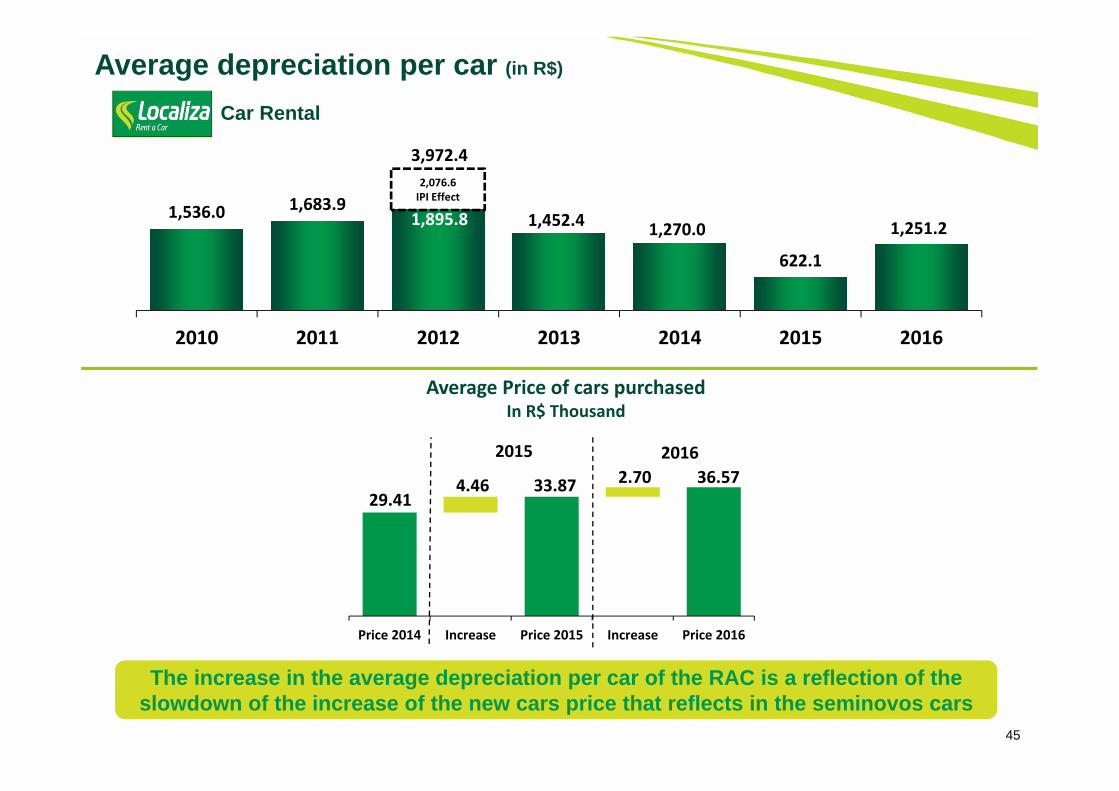
Average depreciation per car (in R$)
Car Rental
1,536.0 1,683.91,895.8 1,452.4 1,270.0
622.1
1,251.2
2010 2011 2012 2013 2014 2015 2016
2,076.6IPI Effect
3,972.4
Average Price of cars purchasedIn R$ Thousand
29.41 33.87 36.57 4.46 2.70
Price 2014 Increase Price 2015 Increase Price 2016
2015 2016
The increase in the average depreciation per car of the RAC is a reflection of the slowdown of the increase of the new cars price that reflects in the seminovos cars

46
Average depreciation per car (in R$)
The drop in depreciation is due to a longer cycleThe depreciation of the cars in this division benefits from the price increase of
new cars that occurs over the life of the car
3,509.74,133.0
4,311.3
4,592.34,202.1 3,935.2 3,714.0
2010 2011 2012 2013 2014 2015 2016
1,096.9IPI Effect
5,408.2
Fleet Rental

47
Consolidated EBIT R$ million
Divisions 2010 2011 2012 2013 2014 2015 2016 4Q15 4Q16
Car Rental 38.5% 38.8% 23.7% 32.8% 36.2% 34.3% 30.2% 28.7% 28.4%
Fleet Rental 46.2% 45.6% 36.9% 45.1% 44.3% 48.9% 51.2% 49.9% 52.4%
Consolidated 41.0% 41.1% 28.3% 37.1% 38.8% 39.1% 36.8% 35.4% 35.3%
Even with increased car depreciation of the Car Rental Division, EBIT Margin remained stable in 4Q16
482.1 595.7
465.8
652.1 726.7 735.5 771.1
175.0 202.0
2010 2011 2012 2013 2014 2015 2016 4Q15 4Q16
144.5IPI Effect
610.3+ R$27.0

48
Consolidated net incomeR$ million
Increase of 1.7% in 2016 profit even with the increase of interest and depreciation
250.5 291.6
240.9
384.3 410.6 402.4 409.3
105.9 104.4
2010 2011 2012 2013 2014 2015 2016 4Q15 4Q16
336.395.4
IPI Effect
Reconciliation EBITDA x Net income 2010 2011 2012 2013 2014 2015 2016 Var. R$ Var. % 4Q15 4Q16 Var. R$ Var. %
Consolidated EBITDA 649.5 821.3 875.6 916.5 969.8 934.8 1,015.6 80.8 8.6% 228.0 270.9 42.9 18.8%
Cars depreciation (146.3) (201.5) (232.4) (229.0) (207.4) (163.6) (206.3) (42.7) 26.1% (44.0) (59.5) (15.5) 35.2%
Cars additional depreciation – IPI effect - - (144.5) - - - - - - - - - -
Other property depreciation and amortization (21.1) (24.1) (32.9) (35.4) (35.7) (35.7) (38.2) (2.5) 7.0% (9.0) (9.4) (0.4) 4.4%
EBIT 482.1 595.7 465.8 652.1 726.7 735.5 771.1 35.6 4.8% 175.0 202.0 27.0 15.4%
Financial expenses, net (130.1) (179.0) (138.7) (110.6) (151.1) (202.7) (243.5) (40.8) 20.1% (43.5) (72.7) (29.2) 67.1%
Income tax and social contribution (101.5) (125.1) (135.3) (157.2) (165.0) (130.4) (118.3) 12.1 -9.3% (25.6) (24.9) 0.7 -2.7%
Income tax and social contribution – IPI effect - - 49.1 - - - - - - - - - -
Net income of the period 250.5 291.6 240.9 384.3 410.6 402.4 409.3 6.9 1.7% 105.9 104.4 (1.5) -1.4%

49
Free cash flow - FCFFree cash flow
Free cash flow - R$ million 2010 2011 2012 2013 2014 2015 2016w
Ope
ratio
ns
EBITDA 649.5 821.3 875.6 916.5 969.8 934.8 1,015.6
Used car sale revenue, net from taxes (1,321.9) (1,468.1) (1,520.0) (1,747.3) (2,018.2) (2,044.9) (2,342.5)
Depreciated cost of cars sold 1,203.2 1,328.6 1,360.2 1,543.8 1,777.0 1,769.1 2,102.5
(-) Income tax and social contribution (57.8) (83.0) (100.9) (108.5) (113.1) (110.7) (93.3)
Change in working capital 54.5 (83.9) 37.1 2.9 (27.1) (30.0) 113.2
Cash generated by rental operations 527.5 514.9 652.0 607.4 588.4 518.3 795.5
Cap
ex -
Ren
ewal
s
Used car sale revenue, net from taxes 1,321.9 1,468.1 1,520.0 1,747.3 2,018.2 2,036.3 2,342.5
Fleet renewal investment (1,370.1) (1,504.5) (1,563.3) (1,819.7) (2,197.7) (2,278.4) (2,563.6)
Net investment for fleet renewal (48.2) (36.4) (43.3) (72.4) (179.5) (242.1) (221.1)
Fleet renewal – quantity 47,285 50,772 56,644 62,641 70,621 64,032 68,449
Investment, other property and intangibles (50.6) (59.9) (77.8) (47.5) (46.3) (29.7) (42.2)
Free cash flow from operations, net of fleet renewal capex 428.7 418.6 530.9 487.5 362.6 246.5 532.2
Cap
ex -
Gro
wth Fleet growth (investment) (540.3) (272.0) (55.5) (209.4) (286.8) 8.6 (726.0)
Change in accounts payable to car suppliers 111.3 32.7 (116.9) 89.7 334.4 (121.2) 190.7
Net investment for fleet growth (429.0) (239.3) (172.4) (119.7) 47.6 (112.6) (535.3)
Fleet increase / (reduction) – quantity 18,649 9,178 2,011 7,103 9,183 (273) 19,384
Free cash flow after growth, and before interest and new HQ (0.3) 179.3 358.5 367.8 410.2 133.9 (3.1)
New headquarters construction (0.5) (3.1) (2.4) (6.5) (148.3) (30.7) (84.4)
Free cash flow before interest (0.8) 176.2 356.1 361.3 261.9 103.2 (87.5)

50
Changes in net debt R$ million
R$288.7 million of cash generation after interest was invested to increase the fleet
532.2
(243.5)
(726.0)
190.7
(84.4)(139.4)
(25.0)(2,084.0)
Net Debt12/31/2016
(1,588.6)
Net Debt12/31/2015
Free cash flow after fleet renewal and
before headquarters
Interest
Fleet Increase of 19,384 cars
Increase in accounts payable to
cars suppliers
New headquarters construction
Dividends
+288.7 (535.3) (248.8)
Treasury Shares

51
Debt maturity profile (principal)R$ million
Strong cash position and comfortable debt profile to take advantage of growth opportunities
As of December 31, 2016
‐
558.4 335.7
620.8 770.0 672.5 750.0
2016 2017 2018 2019 2020 2021 2022
Cash1,692.3
2016
1,514.9
52
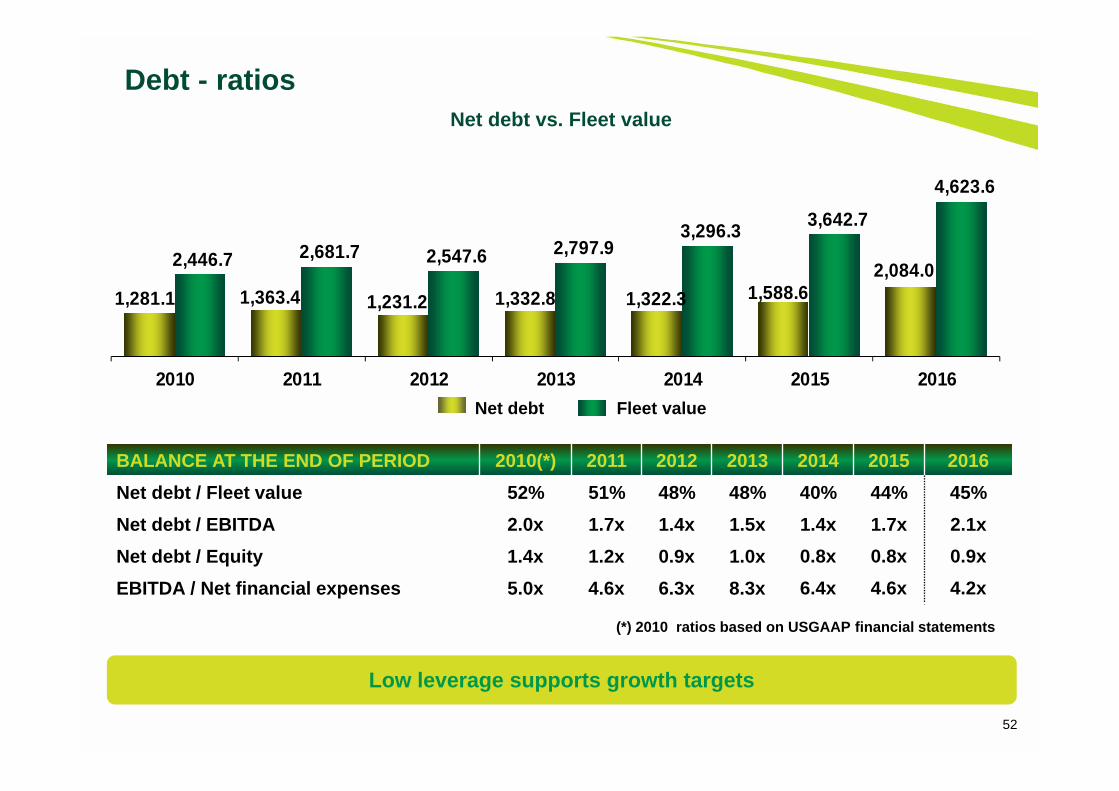
Debt - ratiosNet debt vs. Fleet value
BALANCE AT THE END OF PERIOD 2010(*) 2011 2012 2013 2014 2015 2016Net debt / Fleet value 52% 51% 48% 48% 40% 44% 45%Net debt / EBITDA 2.0x 1.7x 1.4x 1.5x 1.4x 1.7x 2.1xNet debt / Equity 1.4x 1.2x 0.9x 1.0x 0.8x 0.8x 0.9xEBITDA / Net financial expenses 5.0x 4.6x 6.3x 8.3x 6.4x 4.6x 4.2x
(*) 2010 ratios based on USGAAP financial statements
Net debt Fleet value
Low leverage supports growth targets
1,281.1 1,363.4 1,231.2 1,332.8 1,322.3 1,588.6 2,084.0 2,446.7 2,681.7 2,547.6 2,797.9
3,296.3 3,642.7
4,623.6
2010 2011 2012 2013 2014 2015 2016
53
ROIC versus cost of debt after taxes
ROIC Cost of debt after taxes
7.3% 8.6%6.3% 6.0%
8.0%9.5% 10.2%
16.9% 17.1% 16.1% 16.5% 17.5% 17.0%15.4%
2010 2011 2012 2013 2014 2015 2016
9.6p.p. 8.5p.p. 9.5p.p.9.8p.p. 10.5p.p. 7.5p.p. 5.2p.p.
2010 to 2014 ROIC considered income tax rate of 30% and effective income tax rate from 2015 on
Spread of 5.2p.p. in line with the Company's short-term strategyand expectation of a sharp drop in interest in 2017

54
Disclaimer
Website: www.localiza.com/ir E-mail: [email protected] Phone: 55 31 3247-7024
Roberto MendesCFO and IR
Nora LanariHead of IR
Eugênio MattarCEO
The material presented is a presentation of general background information about LOCALIZA as of the date of the presentation. It is information in summaryform and does not purport to be complete. It is not intended to be relied upon as advice to potential investors. No representation or warranty, express orimplied, is made concerning, and no reliance should be placed on, the accuracy, fairness, or completeness of the information presented herein.
This presentation contains statements that are forward-looking within the meaning of Section 27A of the Securities Act of 1933 and Section 21E of theSecurities Exchange Act of 1934. Such forward-looking statements are only projections and are not guarantees of future performance. Investors are cautionedthat any such forward-looking statements are and will be, as the case may be, subject to many risks, uncertainties and factors relating to the operations andbusiness environments of LOCALIZA and its subsidiaries that may cause the actual results of the companies to be materially different from any future resultsexpressed or implied in such forward-looking statements.
Although LOCALIZA believes that the expectations and assumptions reflected in the forward-looking statements are reasonable based on informationcurrently available to LOCALIZA’s management, LOCALIZA cannot guarantee future results or events. LOCALIZA expressly disclaims a duty to update any ofthe forward-looking statement.
Securities may not be offered or sold in the United States unless they are registered or exempt from registration under the Securities Act of 1933.
This presentation does not constitute an offer, invitation or solicitation of an offer to subscribe to or purchase any securities. Neither this presentation nor anythingcontained herein shall form the basis of any contract or commitment whatsoever.
Maria Carolina CostaIR Manager
Mariana CampolinaIR Manager