leandro rodrigues de lemos
TRANSCRIPT

LEANDRO RODRIGUES DE LEMOS
SISTEMAS AQUOSOS BIFÁSICOS: UMA NOVA ABORDAGEM PARA A
DETERMINAÇÃO DE p-AMINOFENOL
VIÇOSA
MINAS GERAIS – BRASIL
2010
Dissertação apresentada à
Universidade Federal de Viçosa,
como parte das exigências do
Programa de Pós-Graduação em
Agroquímica, para obtenção do
título de Magister Scientiae.

Livros Grátis
http://www.livrosgratis.com.br
Milhares de livros grátis para download.

LEANDRO RODRIGUES DE LEMOS
SISTEMAS AQUOSOS BIFÁSICOS: UMA NOVA ABORDAGEM PARA A
DETERMINAÇÃO DE p-AMINOFENOL
APROVADA: 22 de fevereiro de 2010.
Prof. Luis Henrique Mendes da Silva
(Coorientador)
Profa. Jane Sélia dos Reis
Coimbra
(Coorientadora)
Profa. Ann Honor Mounteer Prof. André Fernando de Oliveira
Profa Maria do Carmo Hespanhol da Silva
(Orientadora)
Dissertação apresentada à
Universidade Federal de Viçosa,
como parte das exigências do
Programa de Pós-Graduação em
Agroquímica, para obtenção do título
de Magister Scientiae.

ii
Dedico este trabalho aos meus
pais, Luciano e Nayane.

iii
A ação nem sempre traz felicidade, mas não há felicidade sem ação.
(Benjamin Disraeli)

iv
AGRADECIMENTOS
À Deus pela força e coragem para sempre continuar em frente.
À Universidade Federal de Viçosa e ao Departamento de Química, pela
possibilidade de realização deste trabalho.
Ao Conselho Nacional de Desenvolvimento Científico e Tecnológico, CNPq, e a
Fundação de Amparo a Pesquisa do Estado de Minas Gerais, FAPEMIG pelo apoio
financeiro.
Aos meus pais, Carlinhos e Silvina, pelo incentivo, amor, carinho, educação e
por estarem sempre ao meu lado em todas as situações. Pai e Mãe obrigado por tudo!
Ao meu irmão Luciano, pelo incentivo, apoio, amizade. Lu, sem você eu nunca
conseguiria chegar aqui. Valeu!
À Nayane, pelo amor, paciência, dedicação que foram extremamente
importantes pra essa conquista. Obrigado Amor!
À toda minha família e agregados (vô, vó, tias, tios, primos, Cláudia, Dona Eni),
pela grande torcida e apoio.
À Carminha, mais do que uma orientadora uma amiga, pelo apoio, orientação e
por confiar no meu potencial. Seu exemplo e seus conselhos foram fundamentais, e
estarão sempre comigo na minha vida profissional e pessoal. Muito obrigado mesmo!
Ao Luis, um mestre, no sentido mais amplo dessa palavra; talvez, para ser mais
justo teria que usar o artigo definido, O MESTRE. Outro exemplo que carregarei
sempre comigo. Obrigado Luis!
Aos professores André, Jane e Ann, por aceitarem prontamente participar desta
defesa.

v
Ao grande amigo Guilherme, que eu agradeço não só pela ajuda importantíssima
nesse trabalho, mas também pelos muitos anos de convivência. Valeu Feião, continue
assim que você vai alcançar seus objetivos. Oh Loyola!!!!
À Pamela que me ajudou bastante na condução deste trabalho. Valeu
paminharocha!
À todos os companheiros do grupo QUIVECOM, em especial a Vivianne pela
amizade, almoços e churrascos em Cajuri.
Aos grandes amigos Tonimar e Helisson, pelos bons momentos.
Agradeço a todos que de forma direta ou indireta contribuíram para essa
conquista!
vi
BIOGRAFIA
Leandro Rodrigues de Lemos, filho de Carlos Otávio de Lemos e Silvina
Rodrigues de Lemos, nasceu em 03 de dezembro de 1984, na cidade de Manhumirim,
Minas Gerais.
Em março de 2004 ingressou no curso de Química da Universidade Federal de
Viçosa, diplomando-se com o título de Licenciatura e Bacharelado em julho de 2008.
Em agosto de 2008, iniciou o curso no Programa de Pós-graduação em
Agroquímica, em nível de Mestrado, na Universidade Federal de Viçosa, submetendo-
se à defesa de dissertação em fevereiro de 2010.

vii
SUMÁRIO
LISTA DE SÍMBOLOS E ABREVIATURAS................................................... ix
LISTA DE FIGURAS............................................................................................. xii
LISTA DE TABELAS........................................................................................... xiv
RESUMO................................................................................................................. xvi
ABSTRACT............................................................................................................
xvii
Capítulo 1: Revisão de metodologias analíticas para a determinação de
p-aminofenol....................................................................................... 1
1.1 Introdução ........................................................................................................... 1
1.2. Metodologias analíticas para a determinação de p-aminofenol......................... 4
1.3. Referências Bibliográficas..................................................................................
11
Capítulo 2: Sistemas Aquosos Bifásicos................................................................ 15
2.1 Comportamento de partição de um soluto em um SAB...................................... 18
2.2 Referências bibliográficas...................................................................................
24
Capítulo 3: Aqueous two-phase system: a new approach for the
determination de p-aminofenol in water and
biochemical samples……. …………………………………………
29
Abstract………………………………………….………………………………… 29
1. Introduction…………………………………………………………………….. 31
2. Experimental……………………………………………………………………. 34
2.1. Apparatus……………………………………………………………... 34
2.2. Chemicals…………………………………………………………….. 34
2.3. ATPS composition, solutions and standards…………………………. 34
2.4. Procedure............................................................................................... 36
2.5. Partitioning experiments……………………………………………… 37
2.6. Water samples…………………………………………………..……. 37
2.7. Determination of p-aminofenol in paracetamol formulations………... 38
2.8. Analysis of urine samples…………………………………………….. 38
3. Results and Discussion…………………………………………………………. 39

viii
3.1. Chemical and spectral characterisitics………………………………... 39
3.2. Phase diagrams……….………………………………………………. 41
3.3. Influence of tie-line length (TLL) and electrolyte on the partioning
behavior……………………………………………………………… 41
3.4. Study of the sensitivity of the method……………………….……….. 46
3.5. Analytical features of the developed procedure……………………… 48
3.6. Application to real samples…………………………………………... 49
4. Conclusions…………………………………………………………………….. 51
5. Acknowledgments.............................................................................................. 51
6. References………………………………………………………………………
52

ix
LISTA DE SÍMBOLOS E ABREVIATURAS
ELLT – Extração líquido-líquido tradicional
SAB ou ATPS – sistemas aquosos bifásicos
DNA – Ácido desoxirribonúcleico
% (m/m) – Porcentagem massa/massa
PEO1500 – Poli(óxido de etileno) 1500 g mol-1
LB – Linha binodal
LA –Linha de amarração
FS –Fase superior
FI – Fase inferior
CLA ou TLL –Comprimento de linha de amarração ou tie-line lenght, respectivamente
FS
polC e FI
polC –Concentração de polímero em fase superior e inferior, respectivamente
FS
salC e FI
salC –Concentração de sal em fase superior e inferior, respectivamente
K –Coeficiente de partição
FSa e FIa –Atividade do soluto na fase superior e na fase inferior, respectivamente
FSC e FIC –Concentração do soluto na fase superior e na fase inferior, respectivamente
M –Massa molar
–Número de sítios por unidade de volume
FSn e FIn –Número total de moléculas na fase superior e inferior, respectivamente
VFS e VFI –Volume da fase superior e inferior, respectivamente
Ms –Massa molar do soluto,
R –Constante geral do gases,
T –Temperatura,
FS
i e FI
i – Fração volumétrica do componente i na fase superior e inferior,
respectivamente

x
isw – Energia de formação do par entre o soluto e o componente i
ijw – Energia de formação do par entre os componentes i e j.
CONAMA – Conselho Nacional do Meio Ambiente
4-AAP – 4-aminoantipirina
PAP – p-aminofenol
R – Coeficiente de correlação linear
LOD – Limite de deteção
NPS – Nitroprussiato de sódio
ε – Absortividade molar
HPBI – 2-(2-Hidroxifenil)-1H-benzimidazol
Triton X-100 – Polioxietileno octil fenil éter (C14H22O(C2H4O)n com (n = 9-10))
LOQ – Limite de quantificação
EAM UV/Vis – Espectrometria de absorção molecular no ultravioleta/vísivel
CLAE-UV – Cromatografia líquida de alta eficiência com detector ultravioleta
CLAE-DE – Cromatografia líquida de alta eficiência com detector de elétrons
EC-UV – Eletroforese capilar com detector ultravioleta
EC-DE – Eletroforese capilar com detector de elétrons
FIA-EAM UV/Vis – Análise de injeção em fluxo com detector de Espectrometria de
absorção molecular no ultravioleta/vísivel
HL – Cloreto de hidroxilamina
GC – Gas chromatography
LC – Liquid chromatography
CE – capillary electrophoresis
NMR – Nuclear magnetic resonance
PCP – p-clorofenol
wp – Porcentagem massa/massa de polímero
ws – Porcentagem massa/massa de sal

xi
TA e BA – Absorbância do soluto na fase superior e na fase inferior
WWTP – Estação de tratamento de água residuária
z – Número de sítios vizinhos
ij – Energia potencial do par i–j
CV – Coeficiente de variação

xii
LISTA DE FIGURAS
Capítulo 2 Sistemas aquosos bifásicos
Figura 1. Composições do SAB composto por Poli(óxido de etileno)
1500 g mol-1
(PEO1500) + sulfato de lítio + água á 25 º C
[27].............................................................................................
17
Figura 2. Representação gráfica de um diagrama de fase expresso em
coordenadas retangulares para um SAB formado por polímero
+ sal + água................................................................................
17
Capítulo 3 Aqueous two–phase system: a new approach for the
determination of p-aminophenol in water and biochemical
samples
Fig. 1. Absorption spectra of the [Fe2(CN)10]10–
anion formed by the
reaction system between NPS, HL and (––) PAP, and (···) a blank
assay spectrum in the PEO1500/Li2SO4 aqueous two–phase
system (ATPS) with a tie–line length (TLL) of 41.71 %
(w/w)……………………………………………………………….. 40
Fig. 2.
Partition coefficient ( 10102 ])CN(Fe[
K ) of [Fe2(CN)10]10–
anion water
ATPS as a function of increasing tie–line length (TLL), in ATPS
composed of PEO 1500 + salt + water. (▲) K2HPO4 + KOH; (◊)

xiii
Na2SO4; (■) Li2SO4 and (○) Li2SO4 in the presence of PCP………
42
Fig. 3. Effect of tie-line length (TLL) and electrolytes on the PAP
determination in an aqueous two–phase system (ATPS) composed
of PEO1500, salt and water: (■) Li2SO4, (○) K2HPO4 + KOH and
(▲) Na2SO4....................................................................................... 47

xiv
LISTA DE TABELAS
Capítulo 1 Revisão de metodologias analíticas para a determinação de p-
aminofenol
Tabela 1. Propriedades físico-químicas do p-aminofenol [Adaptada, ref. 10].
3
Tabela 2. Melhores condições experimentais obtidas por Ettinger e et al.
[adapt.19]..........................................................................................
5
Tabela 3. Figuras de mérito e outros parâmetros para o método da 4-AAP
[17]......................................................................................................
6
Tabela 4. Parâmetros analíticos do método desenvolvido por Kang et al. [20].
7
Tabela 5. Limites de detecção e quantificação de diversas técnicas usadas na
determinação de PAP ....................................................................... 10
Capítulo 3 Aqueous two–phase system: a new approach for the
determination of p-aminophenol in water and biochemical
samples
Table 1. Percent composition (w/w) for PEO1500 (wP), salt (wS) and water 36

xv
aqueous two–phase systems (ATPS) at 25.0 °C……………...……
Table 2. Comparison of the analytical figures of merit of the proposed
method (ATPS) with the standard method (4–AAP) [33]………….
49
Table 3. Recoveries (%) of PAP in several water samples (n = 3)………….
50
Table 4. Determination of PAP in pharmaceutical and human urine samples
(n = 3)……………………………………………………………… 50

xvi
RESUMO
de LEMOS, Leandro Rodrigues, M.Sc., Universidade Federal de Viçosa, fevereiro de
2010. Sistemas aquosos bifásicos: Uma nova abordagem para a determinação de p-
aminofenol. Orientadora: Maria do Carmo Hespanhol da Silva. Coorientadores: Luis
Henrique Mendes da Silva e Jane Sélia Coimbra dos Reis
Este trabalho apresenta inicialmente uma breve revisão sobre sistemas aquosos
bifásicos (SAB) e metodologias analíticas para determinação de p-aminofenol (PAP)
com ênfase nas técnicas espectrofotométricas. Um novo método foi desenvolvido para a
determinação de PAP em água, formulações de paracetamol e urina humana. Este
procedimento explora um SAB como técnica de extração líquido-líquido e a reação de
PAP, nitroprussiato de sódio (NPS) e hidrocloreto de hidroxilamina (HL) em meio
alcalino (pH = 12), produzindo um ânion complexo [Fe2(CN)10]10–
que
espontaneamente se transfere para a fase superior do sistema ( 10102 ])CN(Fe[
K = 97.7). O
SAB é formado majoritariamente por água e não utiliza solvente orgânico. Os outros
componentes do SAB são polímero, poli(óxido de etileno), e sais (i.e., Li2SO4, Na2SO4
or K2HPO4 + KOH). O método apresentou uma faixa linear de 5,00 a 500 g kg–1
(R ≥
0,9990; n = 8) com coeficientes de variação de 2,11 % (n = 5), um limite de detecção
(LOD) de 2,40 g kg–1
e um limite de quantificação (LOQ) de 8,00 g kg–1
. O método
SAB exibiu recuperações entre 96,4 e 103 % para a determinação de PAP em amostras
de água e efluentes, em excelente acordo com os resultados do método padrão da 4-
aminoantipirina (4-AAP) para as mesmas amostras. O método proposto também foi
usado para a determinação de PAP em formulações farmacêuticas de paracetamol e
amostras de urina humana com recuperações entre 94,9 e 101 %.

xvii
ABSTRACT
de LEMOS, Leandro Rodrigues, M.Sc., Universidade Federal de Viçosa, february of
2010. Aqueous two–phase system: a new approach for the determination of p-
aminophenol in water and biochemical samples. Adviser: Maria do Carmo
Hespanhol da Silva. Advisers: Luis Henrique Mendes da Silva e Jane Sélia Coimbra dos
Reis
This work initially presents a brief review of aqueous two-phase systems
(ATPS), and analytical methodologies for PAP determination with emphasis in
spectrophotometric techniques. A new method has been developed for the
spectrophotometric determination of p–aminophenol (PAP) in water, formulations of
paracetamol and human urine. The procedure exploits an aqueous two–phase system
(ATPS) liquid–liquid extraction technique and the reaction of PAP, sodium
nitroprusside (NPS) and hydroxylamine hydrochloride (HL) in an alkaline medium (pH
12.0), producing the complex anion [Fe2(CN)10]10–
that spontaneously concentrates in
the top phase of the system ( 10102 ])CN(Fe[
K = 97.7). The ATPS is formed mostly by
water and does not require organic solvent. The other components of the ATPS were
polymer, polyethylene oxide, and salts (i.e., Li2SO4, Na2SO4 or K2HPO4 + KOH). The
linear range was 5.00 to 500 g kg–1
(R ≥ 0.9990; n = 8) with coefficients of variation
of 2.11 % (n = 5). The method exhibited a limit of detection (LOD) of 2.40 g kg–1
and
a limit of quantification (LOQ) of 8.00 g kg–1
. The ATPS method showed recoveries
between 96.4 – 103 % for the determination of PAP in natural water and wastewater
samples, in excellent agreement with the results of the standard 4–aminoantipyrine (4-
AAP) method for the same samples. The proposed method was also used for the
determination of PAP in paracetamol pharmaceutical formulations and human urine
samples with recovery rates between 94.9 – 101 %.

1
Capítulo 1
Revisão de metodologias analíticas para a determinação de
p-aminofenol
1.1 Introdução
Nos últimos anos a preocupação com a poluição ambiental e seus efeitos no
clima, na disponibilidade de recursos hídricos e na fertilidade dos solos entre outros,
tem aumentado muito; haja vista que a população humana tem sido afetada
drasticamente por essas mudanças no seu habitat, como por exemplo, a produção de
alimentos que exige cada vez mais insumos, o tratamento de água para consumo
humano que requer processos mais elaborados, etc. A busca por alternativas para a
diminuição da poluição do planeta tem sido foco de diversos encontros e acordos
internacionais, como o Protocolo de Quioto (Quioto – Japão, outubro de 1988), a ECO-
92 (Rio de Janeiro – Brasil, junho de 1992), e mais recentemente a realização do COP -
15 (Copenhague – Dinamarca, dezembro de 2009). Os corpos de água são os principais
receptores dessa poluição. Todos os dias milhões de metros cúbicos de esgostos
domésticos e efluentes industriais são lançados nos rios, lagos e mares, além dos
poluentes do solo e do ar que são carreados pela chuva. A presença de diversos
poluentes orgânicos, entre eles os compostos fenólicos, metais e etc, acaba
inviabilizando a utilização desse recurso na irrigação e no abastecimento industrial e da
polução humana.
Um dos principais grupos de poluentes, que chegam ao meio ambiente oriundo
de diversas atividades industriais e agrícolas são os fenóis e seus derivados. Eles são
considerados poluentes prioritários, pois, mesmo em baixas concentrações são

2
extremamente tóxicos [1]. As principais fontes desses compostos são as indústrias de
corantes, pesticidas, papel e celulose, petroquímica e siderúrgica [2-6].
Os limites de fenóis totais permitidos em corpos de água é regulamentado pela
resolução do CONAMA no 357 de 17 de março de 2005 [7]. Para as águas doce e
salobra destinadas ao consumo humano, irrigação de hortaliças e de frutas que sejam
consumidas cruas e sem retirada da película, proteção de comunidades aquáticas e para
o lazer com contato primário (Águas Doce Classe 1 e Salobra Classe 1) o limite
permitido de fenóis totais é de 3 µg L-1
. Em águas destinadas ao consumo humano após
tratamento avançado, a pesca amadora, a irrigação de culturas arbóreas, cerealíferas e
forrageiras, e a recreação de contato secundário (Águas Doce Classe 3) é permitido
concentrações de até 10 µg L-1
. Águas salinas usadas em recreação de contato primário,
a preservação de comunidades aquáticas, em atividades de pesca e na aquicultura
(Águas Salinas Classe 1) a concentração máxima permitida é de 60 µg L-1
de fenóis
totais. Essa resolução ainda dispõe sobre o lançamento de efluentes de qualquer fonte
poluidora em corpos de água, sendo que a concentração de fenóis totais é limitada a 0,5
mg L-1
.
Fenóis totais é definido pela regulamentação do CONAMA [7] como
substâncias que reagem com a 4-aminoantipirina (4-AAP). Esses substâncias são o
fenol, o-cresol, p-clorofenol, o-nitrofenol, p-aminofenol (PAP) entre muitas outras [8].
Entre os derivados do fenol, o PAP é um dos compostos mais usados em processos
industriais e farmacêuticos. Desde 1994 a produção mundial de PAP tem crescido em
média 5% ao ano [9], devido a isso tem-se aumentado o volume de efluentes gerados
por essas indústrias.
3
O PAP é aplicado na indústria de tintas e corantes, como revelador fotográfico,
como anticorrosivo em lubrificantes entre outros [11]. e é responsável pela grande parte
da constituição de compostos fenólicos nos efluentes dessas indústrias.
Além disso, o PAP é um composto fundamental para a produção industrial do
paracetamol, que tem efeito analgésico e antipirético, sendo uma das formulações
farmacêuticas mais consumidas no mundo, e ainda, é o principal produto de degradação
hidrolítica desse fármaco [12].
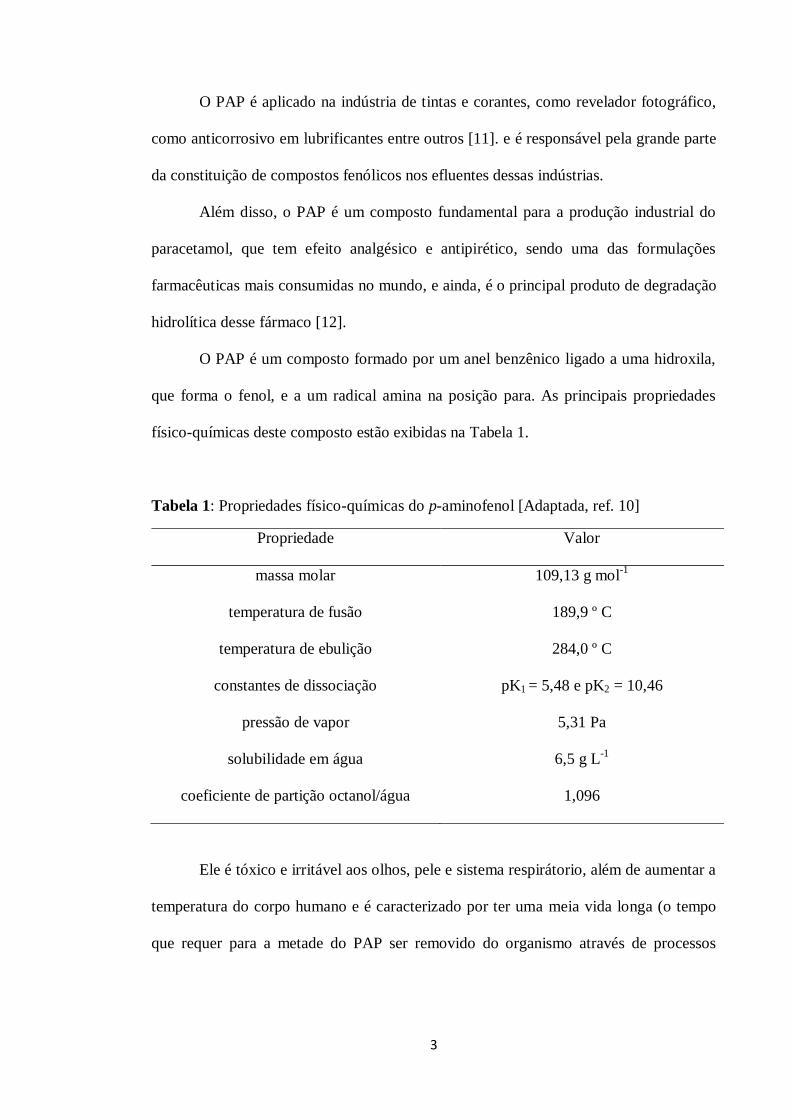
O PAP é um composto formado por um anel benzênico ligado a uma hidroxila,
que forma o fenol, e a um radical amina na posição para. As principais propriedades
físico-químicas deste composto estão exibidas na Tabela 1.
Tabela 1: Propriedades físico-químicas do p-aminofenol [Adaptada, ref. 10]
Propriedade Valor
massa molar 109,13 g mol-1
temperatura de fusão 189,9 º C
temperatura de ebulição 284,0 º C
constantes de dissociação pK1 = 5,48 e pK2 = 10,46
pressão de vapor 5,31 Pa
solubilidade em água 6,5 g L-1
coeficiente de partição octanol/água 1,096
Ele é tóxico e irritável aos olhos, pele e sistema respirátorio, além de aumentar a
temperatura do corpo humano e é caracterizado por ter uma meia vida longa (o tempo
que requer para a metade do PAP ser removido do organismo através de processos

4
biofísicos e bioquímicos) [12-13]. As pharmacopéias européia, britânica e americana
limitam em 50 µg a dosagem máxima de PAP em comprimidos de paracetamol [14-16].
O desenvolvimento de técnicas analíticas para a determinação deste analito é
fundamental para a aplicação das legislações vigentes que limitam o teor máximo de
PAP em águas, águas residuárias e formulações farmaceúticas.
1.2. Metodologias analíticas para a determinação de PAP
Técnicas espectrofotométricas para a determinação de fenóis totais em águas
têm sido bastante relatadas nos últimos 70 anos. Um dos primeiros métodos reportados,
e ainda hoje um dos mais usados é o da 4AAP, que é o método do “Standard Methods
for the Examination of Water and Wastewater” [17] para a determinação de compostos
fenólicos em águas e águas residuárias. Em 1943 Edgar Emerson [18] descreveu a
reação entre o fenol e a 4AAP em meio alcalino e oxidante, conforme a reação geral
para compostos fenólicos representado na Equação 1, formando um composto com
coloração vermelha intensa (λ = 500 nm). Esta reação foi proposta como um método
qualitativo para análise de compostos fenólicos em água. Emerson estudou a
absortividade molar para vários derivados do fenol, inclusive para o PAP.
(1)
N
N
+
O
OHC6H5
CH3
CH3H2NOH-
N
NO
C6H5
CH3
CH3NO
K3[Fe(CN)6]

5
A Tabela 2 mostra as melhores condições experimentais para determinação de
fenol obtidas por Ettinger et al. em 1951 [19]. Este método apresentou um limite de
detecção muito alto (100 mg L–1
), por isso foi proposta uma etapa de extração líquido-
líquido, a fim de promover a pré-concentração do composto formado para uma pequena
fase formada por clorofórmio, melhorando assim a sensitividade da reação.
Tabela 2. Melhores condições experimentais obtidas para a determinação de compostos
fenólicos por Ettinger e et al. [adap.19]
Parâmetro Valor
pH 10,0 ± 0,2
faixa linear (0,04 – 1,0) mg kg-1
[4-AAP] 60 mg kg-1
[K3[Fe(CN)6] 400 mg kg-1
caminho ótico 5 cm
volume de amostra 500 mL
volume de clorofórmio 30 mL
λmáx 500 nm
O método apresentado no “Standard Methods for the Examination of Water and
Wastewater” para a determinação de fenóis totais são semelhantes às propostas por
Ettinger et al. A Tabela 3 mostra as figuras de mérito e alguns parâmetros obtidos para
este método.

6
Tabela 3. Figuras de mérito e outros parâmetros para o método da 4-AAP [17]
Parâmetro Método 4-AAP (sem extração)
faixa linear (1000–5000) g L–1
coeficiente de correlação linear (R) 0,9998
caminho óptico 1,00 cm
limite de deteção (LOD) 100 g L–1
precisão 0,350 %
Como pode ser observado na Tabela 3, o método padrão sem uma etapa de
extração (pré-concentração) exibe um LOD bastante alto, e portanto não atende aos
limites da legislações ambientais e farmacêuticas. Utilizando uma etapa de pré-
concentração e um caminho óptico de 5 cm, esse método atinge um LOD de 1 μg L–1
para o fenol [17]. Como a reação é mais sensível para o fenol do que para o PAP, para
este o LOD deve ser um pouco mais alto. A desvantagem desta etapa é o alto consumo
de amostra (500 mL por análise) e uso de clorofórmio, que é extremamente tóxico ao
homem e ao ambiente [20].
Mais recentemente, Kang et al. [21] desenvolveram um método baseado na
reação descrita por Nagaraj et al. [22] entre o fenol e o nitroprussiato de sódio em meio
básico com cloreto de hidroxilamina, formando o complexo cromóforo,
decacianodiferrato ([Fe2(CN)10]10-
), representado na Equação 2.
(2)
OH
+ OH-
O-
+ H2O
2 [Fe(CN)5NO]2- + 2
O-
+ 6 NH2OH + 6 OH- [Fe2(CN)10]10- + 2
O-
NO
+ 3 N2 + 12 H2O

7
O meio básico promove a desprotonação da hidroxila deixando o anel mais
reativo. A maior densidade eletrôncia do grupo fenolato favorece a ocorrência de uma
reação eletrofílica no anel benzênico. O grupo nitroso do nitroprussiato de sódio (NPS)
ataca o anel, formando o complexo decacianodiferrato que exibe uma coloração azul-
esverdeada, com o comprimento de onda de máxima absorção em 700 nm. Os
parâmetros analíticos obtidos pelos autores estão representados na Tabela 4.
Tabela 4. Parâmetros analítcos do método desenvolvido por Kang et al. [20]
Parâmetro Valores
faixa linear (50 – 5000) g L–1
coeficiente de correlação linear (R) 0,9996
caminho óptico 2,00 cm
limite de deteção (LOD) ≈ 50 g L–1
absortividade molar (ε) 1,38 10-3
L mol-1
cm-1
precisão 2,6 %
O método desenvolvido sofre a interferência de íons como Mg(II), Cu(II),
Fe(II), Fe(III), Al(III), NH4+, PO4
3-, HCO3
-, HSO3
- e S
2- acima de concentrações iguais a
100 mg L-1
desses concomitantes, e além disso o método possui limite de detecção
inadequado para a quantificação de fenol em águas.
Filik e Tavman [23] desenvolveram um método baseado na reação entre o PAP
e o 2-(2-Hidroxifenil)-1H-benzimidazol (HPBI) em meio oxidante produzindo um
composto cromóforo azul, chamado indofenol. O PAP é inicialmente desprotonado e
oxidado com o periodato de potássio, e na sequência ocorre um acoplamento entre este

8
composto formado e o HPBI por uma reação de substituição eletrofílica, de acordo com
a Equação 3.
(3)
A novidade desse método é uma etapa de pré-concentração utilizando a técnica
de ponto nuvem. Essa técnica baseia-se na separação em duas fases de uma solução de
surfatante, após um aumento de temperatura. Inicialmente prepara-se uma solução do
surfatante em uma concentração adequada e ao aquecê-la a uma determinada
temperatura o sistema anteriormente contendo uma fase isotrópica, separa-se em duas
H2N OHKIO4/OH-
HN O
HN O +NH
N
HO
HBPI
NH
NO
N OH
NH
NHO
N O

9
fases. A fase superior é rica em micelas do surfatante e a fase inferior é rica em água
com monômeros do surfatante. Compostos mais apolares particionam preferencialmente
para o interior das micelas na fase superior. As grandes vantagens dessa técnica são o
baixo custo, obtem-se altos índices de pré-concentração e o fato de ser ambientalmente
segura [24]. O surfatante utilizado foi o polioxietileno octil fenil éter
(C14H22O(C2H4O))n com (n = 9-10), também conhecido como Triton X-100 a uma
concentração de 0,4 % (m/m) em uma temperatura de incubação (para a separação de
fase) de 80 º C por 3 min. O método exibe um limite de detecção de 55 μg L–1
que não é
adequado para análises de PAP em corpos de água e em formulações farmacêuticas
[23].
Várias outras técnicas analíticas são aplicadas também a determinação de PAP
em paracetamol e outras matrizes. A Tabela 5 mostra várias destas técnicas e seus
limites de detecção e quantificação. Observando os dados mostrados na Tabela 5
concluí-se que as técnicas cromatográficas são as mais sensíveis, apresentando limites
de detecção de até 1 µg L–1
, porém estas são de custo elevado. As técnicas baratas e
simples, em muitos casos, não atendem as necessidades das legislações, mostrando
assim a importância de desenvolver métodos sensíveis e em acordo com os princípios
da química verde [25].

10
Tabela 5. Limites de detecção e quantificação de diversas técnicas usadas na
determinação de PAP
Técnica Matrizes LOD(g L–1
) LOQ(g L–1
) Referência
EAM UV/Vis (4-AAP) Águas 100 - 17
EAM UV/Vis (NPS) Águas ≈ 50 - 21
EAM UV/Vis (HPBI) Águas 55 - 23
Espectrometria UV Paracetamol 46 - 26
Espectrosmetria UV Paracetamol 41 - 26
CLAE-UV Paracetamol 100 300 27
CLAE-UV Paracetamol 25 - 26
CLAE-UV Paracetamol 50 145 28
CLAE-DE Paracetamol 1,0 3,5 29
CLAE-DE Paracetamol 4,0 - 29
CLAE-DE Paracetamol e
Urina
50 - 30
EC-UV Paracetamol 11 37 31
EC-DE Paracetamol 120 - 32
EC-DE Paracetamol 540 - 33
FIA-EAM UV/Vis Paracetamol - 10 34
EAM UV/Vis = Espectrometria de absorção molecular no ultravioleta/vísivel
UV = Ultravioleta CLAE-UV = Cromatografia líquida de alta eficiência com detector ultravioleta
CLAE-DE = Cromatografia líquida de alta eficiência com detector de elétrons
EC-UV = Eletroforese capilar com detector ultravioleta EC-DE = Eletroforese capilar com detector de elétrons
FIA-EAM UV/Vis = Análise de injeção em fluxo com detector de Espectrometria de absorção
molecular no ultravioleta/vísivel

11
1.3. Referências Bibliográficas
[1]. Gianfreda, L.; Sannino, F.;. Rao, M. A; Bollag; J.-M. Water Research 37 (2003)
3205
[2] Sarnaik, S.; Kanekar, P. J. Appl. Microbiol. 79 (1995) 459.
[3] Simões, N. G.; Cardoso, V. V.; Ferreira, E.; Benoliel, M. J.; Almeida, C. M. M.
Chemosphere 68 (2007) 501.
[4] Barreto-Rodrigues, M.; Aguiar, C. M.; Cunha, M. A. A. J. Hazard. Mater. 164
(2009) 1556.
[5] Steevensz, A.; Al-Ansari, M. M.; Taylor, K. E.; Bewtra, J. K.; Biswas, N. J. Chem.
Technol. Biotechnol. 84 (2009) 761.
[6] Ahmaruzzaman, M.; Sharma, D. K. J. Colloid Interface Sci. 287 (2005) 14
[7] Conselho Nacional do Meio Ambiente. http://www.mma.gov.br/conama, acessada
em Dezembro de 2009
[8] Shaw, J. Anal. Chem. 23 (1951) 1788
[9] Xu, H.; Duan, C.; Zhang, Z.; Chen, J.; Lai, C.; Lian, M.; Liu, L.; Cui, H.; Water
Research 39 (2005) 396

12
[10] Hazardous Substances Data Bank (HSDB) – United States National Library of
Medicine, http://toxnet.nlm.nih.gov, acessada em Dezembro de 2009
[11] Harmon, R. C.; Kiningham, K. K.; Valentovic, M. A.; Toxicol. Appl. Pharm. 2006
(213) 179
[12] Khan, S. A.; Hamayun, M.; Ahmed, S. Enzym. Microb. Tech. 38 (2006) 10
[13] Harmon, R. C.; Kiningham, K. K.; Valentovic, M. A. Toxicol. Appl. Pharm. 213
(2006) 179
[14] European Pharmacopoeia 4th edition, 2002 ISSN 1013-5294
[15] British Pharmacopoeia 2009 Volume I & II, Market Towers London 2009
[16] US Pharmacopeia 2007, ISSN 1068 5456
[17] Clesceri, L. S.; Greenberg, A. E.; Eaton, A. D. Standard Methods for the
Examination of Water and Wastewater, twentieth ed., American Public Health
Association, Washington DC, 1999
[18] Emerson, E. J. Org. Chem. 08 (1943) 417
[19] Ettinger, M.; Ruchhoft, C.; Lishka, R. Anal. Chem. 23 (1951) 1783

13
[20] Constan, A.; Sprankle, C.; Peters, J.; Kedderis, G.; Everitt, J.; Wong, B.; Gonzalez,
F.; Butterworth, B. Toxicol. Appl. Pharmacol 160 (1999) 120
[21] Kang, C.; Wang, Y.; Li, R.; Du, Y.; Li, J.; Zhang, B.; Zhou, L.; Du, Y.;
Microchem. J. 64 (2000) 161
[22] Nagaraj, P.; Bhandari, J. M.; Achar, B .N. Indian J. Chem. 32A (1993) 641
[23] Filik, H.; Tavman, A. J. Anal. Chem. 62 (2007) 530
[24] Bezerra, M. D.; Arruda, M. A. Z.; Ferreira, S. L. C. Appl. Spectroscopy. Rev. 40
(2005) 269
[25] Lenardão, E. J.; Freitag, R. A.; Dabdoub, M. J.; Batista, A. C. F.; Silveira, C. C.
Quim. Nova 26 (2003) 123
[26] Hewala, I. I. Anal. Lett. 27 (1994) 561
[27] Monser, L.; Darghouth, F.; J. Pharm. Biomed. Anal. 27 (2002) 851
[28] Rao, R. N.; Narasaraju, A.; Anal. Sci. 22 (2006) 287
[29] Wyszecka-Kaszuba, E.; Warowna-Grzeskiewics, M.; Fijalek, Z. J. Pharm. Biomed.
Anal. 32 (2003) 1081

14
[30] Liu, Z.; Li, J.; Dong, S.; Wang, E.; Anal. Chem. 68 (1996) 2432
[31] Perez-Ruiz, T.; Martinez-Lozano, C.; Tomas, V.; Galera, R.; J. Pharm. Biomed.
Anal. 38 (2005) 87
[32] Chen, G.; Ye, J.; Bao, H.; Yang, P. J. Pharm. Biomed. Anal. 29 (2002) 843
[33] He, F. Y.; Liu, A. L.; Xia, X. H. Anal. Bioanal. Chem. 379 (2004) 1062
[34] Bloomfield, M. S. Talanta 580 (2002) 1301

15
Capítulo 2
Sistemas aquosos bifásicos
O primeiro pesquisador a relatar a formação de um sistema aquoso bifásico foi
Beijerinck [1,2] no final do século 19. Ele observou que ao misturar soluções aquosas
de amido solúvel com gelatina, ou ágar com gelatina em concentrações adequadas e em
uma determinada temperatura, formava-se uma mistura que apresentava turbidez; que
depois de algum tempo em repouso separava-se espontaneamente em duas fases
límpidas. Ele ainda observou que a água era o principal componente das duas fases do
sistema, com a fase superior rica em gelatina e fase inferior rica em ágar (ou amido).
Ostwald e Herte [3,4] em estudos posteriores observaram que amidos
provenientes de diferentes origens (arroz, milho, trigo etc.), isto é, com diferentes
proporções de amilose e amilopectina produziam diferentes diagramas de fase. Este
comportamento mostrou a grande influência que variações mínimas nas interações
intermoleculares tinham sobre as composições em equilíbrio.
Já no final da década de 40, Dobry e Boyer-Kawenoki [5,6] afim de verificar o
comportamento de separação de fase em sistemas contendo macromoléculas, estudaram
a miscibilidade de diferentes pares de polímeros dissolvidos em solventes orgânicos ou
em água. Eles observaram a generalidade da incompatibilidade entre polímeros, já que
dos 35 pares de macromoléculas estudados, apenas quatro não geravam um sistema
bifásico.
As potencialidades desses sistemas ficaram evidentes apenas na década de 50
com os trabalhos de Albertsson [7], onde a aplicação destes sistemas para
partição/purificação de materiais biológicos, como células e proteínas foi conhecida

16
pela comunidade científica. Como as fases inferior e superior eram formadas
majoritariamente por água, elas ofereceram um ambiente menos drástico para as
biomoléculas do que os solventes orgânicos utilizados nas extrações líquido-líquido
tradicionais (ELLT), evitando assim, que elas perdessem suas conformações
responsáveis por suas atividades biológicas.
Na década de 80 Zvarova et al. [8] estudaram o comportamento de partição de
íons metálicos na presença de extratantes solúveis em água em sistemas aquosos
bifásicos (SAB). A partir de então os SAB têm sido largamente aplicados na separação,
purificação e pré-concentração de diversos tipos de solutos como organelas celulares,
[9,10] proteínas [11], membranas [12], DNA [13], anticorpos [14], nanopartículas [15],
corantes [16-17] e íons [18-22].
Os SAB são formados espontaneamente após a mistura de duas soluções
aquosas de polímeros hidrossolúveis quimicamente diferentes [23], ou após a mistura de
uma solução aquosa de polímero e uma solução de eletrólito [24] ou então a mistura de
duas soluções de sal [25]. A formação do sistema bifásico só ocorre em determinadas
condições termodinâmicas como temperatura, pressão e concentração dos componentes,
condições estas que são específicas para cada SAB [26]. Considerando SAB formados
por mistura de soluções aquosas de polímero e sal nas condições necessárias para a
formação de um sistema heterogêneo, a fase superior será rica em polímero, e a fase
inferior enriquecida com sal [26], como na Figura 1.

17
Figura 1. Composições do SAB composto por Poli(óxido de etileno) 1500 g mol-1
(PEO1500) + sulfato de lítio + água á 25 º C [27]
As composições das fases em equilíbrio termodinâmico são representadas por
um diagrama de fases. Este diagrama pode ser representado graficamente de forma
triangular, onde cada um dos três eixos representa a composição de um componente, ou
retangular como na Figura 2.
Figura 2. Representação gráfica de um diagrama de fase expresso em coordenadas
retangulares para um SAB formado por polímero + sal + água.

18
Nesses diagramas retangulares a concentração de polímero se encontra no eixo
das ordenadas e a concentração de sal no eixo das abscissas, sendo que essas
concentrações são dadas em porcentagem mássica, % (m/m).
Informações importantes são obtidas através da análise de um diagrama. A linha
binodal (LB) delimita as regiões de composição onde o sistema é homogêneo ou
bifásico, ou seja, as composições que estão representadas infinitesimalmente acima da
LB são as concentrações mínimas para se obter um sistema bifásico. A posição da LB
pode variar com a temperatura do sistema, pH, natureza química do sal, pressão, e com
a natureza química e massa molar média do polímero [28]. Existem diferentes métodos
para a obtenção da linha binodal, entretanto o mais utilizado envolve titulação
turbidimétrica e análise das composições das fases [23]. A Figura 2 apresenta também
as linhas de amarração, LA, que determinam a concentração das duas fases em
equilíbrio termodinâmico. Ao longo de uma mesma LA, em qualquer ponto de
composição global utilizado para o preparo de um SAB, todas as propriedades
termodinâmicas intensivas serão iguais, enquanto as propriedades termodinâmicas
extensivas das fases serão diferentes. Por exemplo, os pontos de composição global A,
B e C terão uma mesma composição de fase superior, identificada pelo ponto FS, e uma
mesma composição de fase inferior, dada por FI. Em compensação, os volumes das
fases serão diferentes em cada um destes pontos [27].
Um parâmetro importante no estudo de um SAB é o comprimento de linha de
amarração, CLA. Este é um valor numérico calculado que mede a distância entre os
pontos FS e FI no diagrama de fases, expressando a diferença entre as propriedades
intensivas de ambas as fases. Ou seja, quanto maior o valor de CLA, mais distintas são
estas propriedades entre as duas fases, o que sabidamente eleva o coeficiente de partição
do analito de interesse. Este parâmetro é calculado de acordo com a Equação 2 [24].

19
2 2CLA ( ) ( )FS FI FS FI
pol pol sal salC C C C (1)
Sendo que FS
polC e FI
polC são as concentrações de polímero em fase superior e inferior,
respectivamente, e FS
salC e FI
salC são as concentrações de sal em fase superior e inferior,
respectivamente. O CLA é fundamental quando se deseja comparar o comportamento
de partição de um soluto em diferentes SAB. Neste caso, os CLA dos sistemas
estudados devem ser os mais próximos possíveis [24].
2.1 Comportamento de partição de um soluto em um SAB
A adição de um soluto num determinado SAB resultará numa concentração
preferencial deste soluto em uma das fases, determinada por interações específicas entre
este e os componentes de cada fase. Na ausência dessas interações a força motriz de
partição será a entropia. Esta característica dos SAB torna-os viáveis para a aplicação
em separação, concentração e purificação de várias substâncias.
O parâmetro que caracteriza a distribuição do analito entre as duas fases aquosas
do SAB é o coeficiente de partição, K , que é definido como:
FS FS
FI FI
a CK
a C (2)
onde, FSa e FIa são as atividades do soluto na fase superior e na fase inferior
respectivamente, e FSC e FIC são as concentrações do soluto na fase superior e na fase

20
inferior respectivamente. Em situações em que o soluto está muito diluído os valores da
concentração e atividade tornam-se muito próximos.
O comportamento de partição do soluto é influenciado por diversos fatores
ligados a natureza do soluto e ao SAB utilizado. Em relação a natureza do soluto os
principais fatores são: a presença de carga elétrica, hidrofobicidade, composição e
conformação. Já em relação ao SAB a massa molar e a concentração do polímero, além
da presença de ligantes ao longo da cadeia polimérica influenciam no comportamento
de partição; bem como o pH, a temperatura, e o eletrólito formador do sistema.
A termodinâmica de partição de um soluto no SAB é discutida pelo modelo de
Johansson et al. [29], que é um conjunto de equações analíticas que expressam o
coeficiente de partição em termos das contribuições entrópicas e entálpicas.
A equação para a contribuição entrópica é representada na Equação 3, onde
considera-se inexistente a contribuição entálpica para a variação da energia livre de
Gibbs [29].
Mln
V V
FS FI
FS FI
n nK
(3)
onde, M é a massa molar do soluto particionado, é o número de sítios por unidade de
volume de todo sistema aquoso bifásico, FSn e FIn são os números total de moléculas
na fase superior e inferior respectivamente, VFS e VFI são os volumes da fase superior e
inferior respectivamente.
A Equação 3 mostra que só haverá contribuição entrópica se houver diferença de
densidade numérica entre as duas fases. Caso não exista essa diferença o soluto presente
no SAB terá o mesmo número de possibilidades de distribuir-se espacialmente em

21
ambas as fases. A entropia impulsionará o soluto para a fase com maior número de
moléculas por unidade de volume, já que nesta fase haverá um maior número de
possibilidades de distribuir as moléculas espacialmente, aumentando a contribuição da
entropia configuracional para a minimização da variação da energia livre de mistura. As
moléculas de água estão presentes em maior número na maioria dos SAB conhecidos,
por isso ela é o componente determinante para a densidade numérica das fases. Então a
contribuição entrópica, na ausência de efeitos entálpicos, fará o soluto particionar para a
fase com maior número de moléculas de água [30].
Em um SAB formado por um eletrólito e um polímero [24,26-28], forças de
natureza entrópica farão com que o soluto particione para a fase rica em eletrólito, pois
esta contém uma maior densidade numérica. Neste tipo de SAB então, o soluto irá para
fase polimérica somente se houver forças de natureza entálpicas.
O fator entálpico também é de grande importância em alguns processos de
partição, principalmente quando a diferença de densidade númerica entre as fases é
pequena, e quando há interações fortes entre o soluto e algum componente do SAB. A
Equação 4 representa todas as interações entálpicas que ocorrem dentro do SAB [29].
1
1 1( ) 1( )
Mln
RT
m m mFS FI FS FS FI FIsi i is i j i j ij
i i s i i s j i j s
K w w
(4)
onde, Ms representa a massa molar do soluto, R é a constante geral do gases, T é a
temperatura, FS
i e FI
i são as frações volumétricas do componente i na fase superior e
inferior respectivamente, isw é a energia de formação do par entre o soluto e o
componente i e ijw é a energia resultante da formação do par entre os componentes i e j.

22
Na Equação 4 o primeiro somatório representa as interações entre o soluto com
cada componente formador do SAB, e o valor desse somatório é proporcional a
diferença de composição entre as fases. O componente que interagir mais fortemente
com o soluto, apresentará um valor de isw mais negativo, isto é contribuirá mais para a
minimização da energia livre de Gibbs; portanto o soluto particionará para a fase mais
rica do componente com que ele interaja mais fortemente [30].
O segundo somatório na equação 4 representa as interações entálpicas entre os
componentes do SAB, associado ao processo de transferência de fase do soluto. Este
termo independe da natureza do soluto particionado, e pode ser interpretado como o
conteúdo energético de cada fase. Quando o soluto sofre o processo de transferência de
fase, ele libera um volume na fase que estava, possibilitando assim a interação entre os
componentes desta fase, e ao chegar na outra fase ele formará uma cavidade impedindo,
no volume ocupado, a interação entre os componentes desta fase. O saldo energético
deste processo influenciará na partição deste soluto no SAB.
Baseado nas discussões das Equações 3 e 4, pode-se inferir sobre a influência de
alguns fatores, como por exemplo, o CLA e a massa molar do polímero utilizado no
SAB, no comportamento de partição.
Quanto menor o valor do CLA, mais o coeficiente de partição se aproximará de
1; já que menor é a diferença entre a composição das fases e consequentemente menor é
a diferença entre elas em termos da densidade númerica, da auto energia e da energia de
interação. Com o aumento do CLA a diferença entre as fases com relação a essas
variáveis também aumenta, crescendo também a tendência do soluto por uma das fases.
Portanto, o coeficiente de partição cada vez mais se distancia de 1 a medida que o CLA
aumenta.

23
Em relação á massa molar do polímero, o aumento desta aumentará o grau de
polimerização, como conseqüência haverá uma diminuição da entropia configuracional.
Em geral, uma massa molar maior do polímero em uma fase, na ausência de efeitos
entálpicos, fará com que o soluto particione preferencialmente para a outra fase.

24
2.2. Referências Bibliográficas
[1] Beijerinck, M. W. Ueber eine eigentümlichkeit der iöslichen stärke. Zbl. Bakt. II
Natur. 1896, 627, 697-699.
[2] Beijerinck, M. W. Ueber Emulsionsbildung bei der vermischung wässeriger
lösungen gewisser gelatinierender kolloide. Kolloid Z. Z. Polym. 1910, 7, 16-20.
[3] Ostwald, W.; Hertel, R. H. Kolloidchemische reaktionen zwischen solen von
Eiweißkörpern und polymeren Kohlehydraten. I. Kolloid Z. Z. Polym. 1929, 47, 258-
268.
[4] Ostwald, W.; Hertel, R. H. Kolloidchemische reaktionen zwischen solen von
Eiweißkörpern und polymeren Kohlehydraten. II. Kolloid Z. Z. Polym. 1929, 47, 357-
370.
[5] Dobry, A.; Boyer-Kawenoki, F. J. Phase separation in polymer solution. Polym. Sci.
1947, 2, 90-100.
[6] Dobry, A. Sur lincompatibilite des macromolecules en solution. Bull. Soc. Chim.
Belg. 1948, 57, 280-285
[7] Albertsson, P. A. Chromatography and Partition of Cells and Cell Fragments.
Nature 1956, 177, 771-774.

25
[8] Zvarova, T. I.; Shkinev, V. M.; Vorob'eva, G. A.; Spivakov, B. Ya.; Zolotov, Yu. A.
Liquid-liquid extraction in the absence of usual organic solvents: Application of two-
phase aqueous systems based on a water-soluble polymer. Microchim. Acta 1984, 84,
449-458.
[9] Banik, R. M.; Santhiagu, A.; Kanari, B.; Sabarinath, C.; Upadhyay, S. N.
Technological aspects of extractive fermetation using aqueous two-phase systems.
World J. Microbiol. Biotechnol. 2003, 19, 337-348.
[10] Santesoon, S.; Ramirez, I. B. R.; Viberg, P.; Jergil, B.; Nilsson, S. Affinity two-
phase partitioning in acoustically levitated drops. Anal. Chem. 2004, 76, 303-308.
[11] Haghtalab, A.; Mokhtarani, B.; Maurer, G. Experimental results and
thermodynamic modeling of the partitioning of lysozyme, bovine serum albumin, and
-amylase in aqueous two-phase systems of PEG and (K2HPO4 or Na2SO4). J. Chem.
Eng. Data 2003, 48, 1170-1177.
[12] Everberg, H.; Clough, J.; Henderson, P.; Jergil, B.; Tjerneld, F.; Ramirez, I. B. R.
Isolation of Escherichia coli inner membranes by metal affinity two-phase partitioning.
J. Chromatogr. A 2006, 1118, 244-252.
[13] Frerix, A.; Schonewald, M.; Geilenkirchen, P.; Muller, M.; Kula, M. R.; Hubbuch,
J. Exploitation of the Coil-Globule Plasmid DNA Transition Induced by Small Changes
in Temperature, pH Salt, and Poly(ethylene glycol) Compositions for Directed
Partitioning in Aqueous Two-Phase Systems. Langmuir 2006, 22, 4282-4290.

26
[14] Azevedo, A. M.; Gomes, A. G.; Rosa, P. A. J.; Ferreira, I. F.; Pisco, A. M. M. O.;
Aires-Barros, M. R. Partitioning of human antibodies in polyethylene glycol-sodium
citrate aqueous two-phase systems. Sep. Purif. Technol. 2009, 65, 14-21.
[15] Alejandro, N.; T. C. Ling; Lyddiatt, A. Aqueous two-phase recovery of bio-
nanoparticles: A miniaturization study for the recovery of bacteriophage T4. J.
Chromatogr. B 2007, 854, 13-19.
[16] Akama, Y.; Tong, A.; Ito, M.; Tanka, S. The study of the partitioning mechanism
of methyl orange in an aqueous two–phase system. Talanta 1999, 48, 1133-1137.
[17] Mageste, A. B.; de Lemos, L. R.; Ferreira, G. M. D.; da Silva, M. C. H.; da Silva,
L. H. M.; Bonomo, R. C. F.; Minin, L. A.; Journal Chromat. A, 2009, 1216, 7623-7629
[18] da Silva, L. H. M.; da Silva, M.C.H.; Francisco, K. R.; Cardoso, M. V. C.; Minim,
L. A.; Coimbra, J. S. R. PEO–[M(CN)5NO]x-
(M = Fe, Mn or Cr) Interaction as Driving
Force in the Partitioning of the Pentacyanonitrosylmetallate Anion in ATPS: The Strong
Effect of the Central Atom. J. Phys. Chem. B. 2008, 112, 11669-11678.
[19] da Silva, L. H. M.; da Silva, M. C. H.; de Aquino, R. A. N.; Francisco, K. R.;
Cardoso, M. V. C.; Minim, L. A.; Coimbra, J. S. R. Nitroprusside–PEO enthalpic
interaction as driving force for partitioning of the [Fe(CN)5NO]2-
anion in aqueous two–
phase systems formed by poly(ethylene oxide) and sulfate salts. J. Phys. Chem. B. 2006,
110, 23540-23546.

27
[20] da Silva, L. H. M.; da Silva, M. C. H.; Júnior, J. A.; Martins, J. P.; Coimbra, J. S.
R.; Minim, L. A. Hydrophobic effect on the partitioning of [Fe(CN)5(NO)]2−
and
[Fe(CN)6]3−
anions in aqueous two–phase systems formed by triblock copolymers and
phosphate salts. Sep. Purif. Technol. 2008, 60, 103-112.
[21] Rogers, R. D.; Willauer, H. D.; Griffin, S. T.; Huddleston, J. G. Partitioning of
small organic molecules in aqueous biphasic system. J. Chromatogr. B 1998, 711, 255-
266.
[22] Rodrigues, G. D.; da Silva, M. D. H.; da Silva, L. H. M.; Paggiolli, F. J.; Minim, L.
A.; Coimbra, J. S. R. Liquid-liquid extraction of metal ions without use of organic
solvent. Sep. Purif. Technol. 2008, 62, 687-693.
[23] Zaslavsky, B. Y. Aqueous Two-Phase Partitioning, Physical Chemistry and Bio-
analytical Applications. Marcel Dekker, New York, 1995
[24] de Lemos, L. R.;Santos, I. J. B.; Rodrigues, G. D.; Ferreira, G. M. D.;da Silva, L.
H. M.; da SILVA, M. D. H. ;de Carvalho, R. M. M., Phase Compositions of Aqueous
Two phase Systems Formed by L35 and Salts at Different Temperatures. Journal of
Chemical and Engineering Data, 2009, 54, p. 10.1021/-je900589h,
[25] Bridges, N. J.; Gutowski, K. E.; Rogers, R. D. Investigation of aqueous biphasic
systems formed from solutions of chaotropic salts with kosmotropic salts (salt-salt
ABS). Green Chem. 2007, 9, 177-183.
28
[26] da Silva, M. C. H.; da Silva, L. H. M.; Júnior, J. A.; Guimarães, R. O.; Martins, J.
P. Liquid-Liquid Equilibrium of Aqueous Mixture of Triblock Copolymers L35 and
F68 with Na2SO4, Li2SO4, or MgSO4. J. Chem. Eng. Data 2006, 51, 2260-2264.
[27] Martins, J. P.; Carvalho, P. C.; da Silva, L. H. M., Coimbra, J. S. R., da Silva, M.
C. H.; Rodrigues, G. D.; Minim, L. A. Liquid–liquid equilibria of an aqueous two-phase
system containing poly(ethylene) glycol 1500 and sulfate salts at different temperatures.
J. Chem Eng. Data 2008, 53, 238-241
[28] da Silva, L. H. M.; da Silva, M. C. H.; Mesquita, A. F.; Nascimento, K. S.;
Coimbra, J. S. R.; Minim, L. A. Equilibrium phase behavior of triblock copolymer +
salt + water two-phase systems at different temperatures and pH, J. Chem. Eng. Data
2005, 50, 1457-1461
[29] Johansson, H.; Karlström, G; Tjerneld, F.; Haynes, C. A.; Driving forces for phase
separation and partitioning in aqueous two-phase systems, J. Chromat. B 1998, 711, 3-
17
[30] da Silva, L. H. M.; Loh, W.; Sistemas aquosos bifásicos: Fundamentos e aplicações
para partição/purificação de proteínas. Quimica Nova 2006, 29, 1345-1351
29
Capítulo 3
Aqueous two–phase system: a new approach for the determination of p-
aminophenol in water and biochemical samples
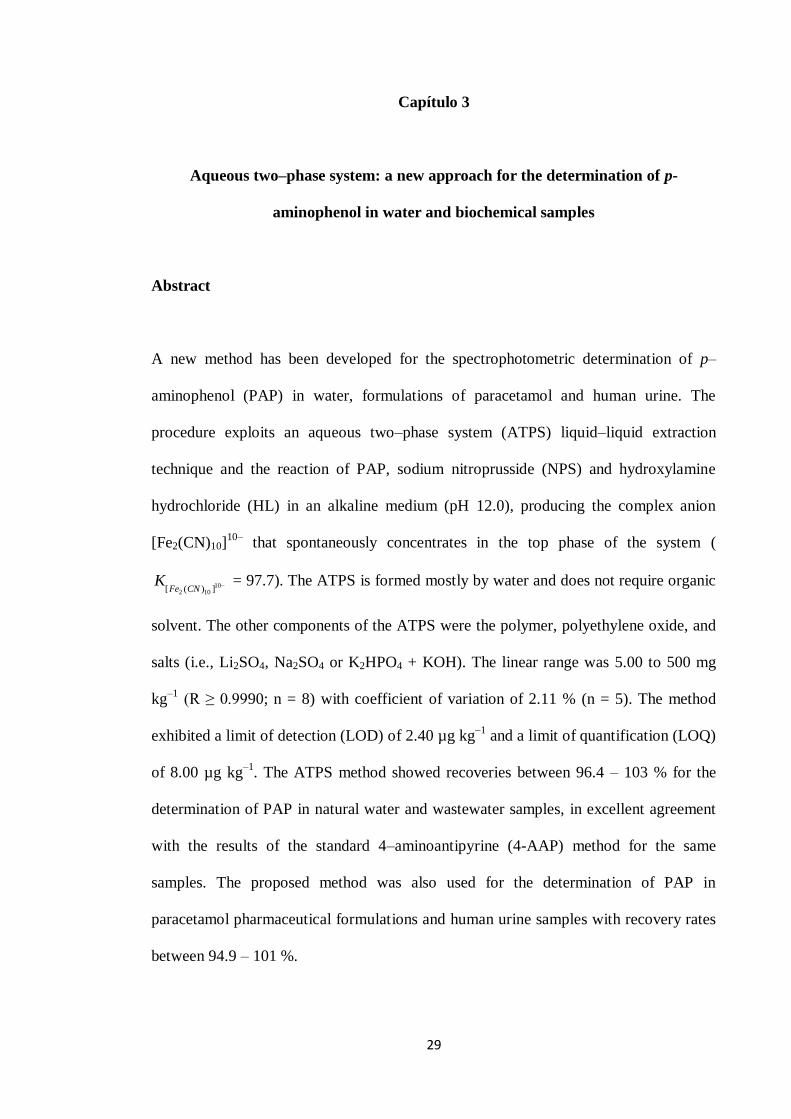
Abstract
A new method has been developed for the spectrophotometric determination of p–
aminophenol (PAP) in water, formulations of paracetamol and human urine. The
procedure exploits an aqueous two–phase system (ATPS) liquid–liquid extraction
technique and the reaction of PAP, sodium nitroprusside (NPS) and hydroxylamine
hydrochloride (HL) in an alkaline medium (pH 12.0), producing the complex anion
[Fe2(CN)10]10–
that spontaneously concentrates in the top phase of the system (
102 10[ ( ) ]Fe CN
K = 97.7). The ATPS is formed mostly by water and does not require organic
solvent. The other components of the ATPS were the polymer, polyethylene oxide, and
salts (i.e., Li2SO4, Na2SO4 or K2HPO4 + KOH). The linear range was 5.00 to 500 mg
kg–1
(R ≥ 0.9990; n = 8) with coefficient of variation of 2.11 % (n = 5). The method
exhibited a limit of detection (LOD) of 2.40 µg kg–1
and a limit of quantification (LOQ)
of 8.00 µg kg–1
. The ATPS method showed recoveries between 96.4 – 103 % for the
determination of PAP in natural water and wastewater samples, in excellent agreement
with the results of the standard 4–aminoantipyrine (4-AAP) method for the same
samples. The proposed method was also used for the determination of PAP in
paracetamol pharmaceutical formulations and human urine samples with recovery rates
between 94.9 – 101 %.

30
Keywords: Aqueous two–phase system; p-aminophenol; water; paracetamol; human
urine.

31
1. Introduction
Public health and environmental safety concerns have grown over the last few
decades. The disposal of toxic pollutants in water sources can be very harmful both to
the environment and human health. Thus, the establishment of simple, fast, low-cost,
greener, sensitive, and selective analytical methods for the determination of pollutants
in water and other strategic matrices is a main line of research in environmental
chemistry.
The determination of phenol and its derivative compounds (such as
aminophenol) is of significant importance, since these species are toxic [1,2] and
involved in many industrial processes [3–5]. For example, according to environmental
legislation, the maximum concentration limits of total phenols in bodies of water are in
the range 3.5–10 µg L–1
[6,7].
The compound p-aminophenol (PAP) is recognized as a serious environmental
pollutant, and has been widely used as a raw chemical material and important
intermediate in various fields, such as medicine, sulfur and azo dyes, rubber, feeding
stuff, petroleum, and photography [8–10]. Moreover, PAP is a parent material for the
production of paracetamol, and can also be formed by the degradation of this analgesic
and its analogs in the human body and during the storage of its medicinal preparations
[11]. In addition, PAP is toxic and irritable to the eyes, skin and respiratory system, and
its target sites are blood and kidney [9,12]. Furthermore, PAP increases the body
temperature of humans and is characterized by a long biological half–life (the time
required for half of the PAP to be removed from the organism by biophysical and
biochemical processes). According to the European Pharmacopoeia [13], 50 µg L-1
is
the specification limit of PAP in paracetamol drug substances. Thus, PAP is both

32
biochemically and environmentally hazardous, so the determination of its trace amounts
in matrices, such as waters, pharmaceutical formulations and human fluids, is
important.
Numerous analytical methods have been developed for the analysis of PAP and
other phenolic compounds, including gas chromatography (GC) [14–16], liquid
chromatography (LC) [17–19], capillary electrophoresis (CE) [20–22], potentiometric
titration [23], nuclear magnetic resonance (NMR) [24], enzyme–based assays [25] and
electrochemical analysis [20,26,27] However, these methods do not allow for in situ
continuous monitoring, require expensive instruments, demand skilled operators and
require derivatization of the analytes. Spectrometric analysis has also been applied in
the determination of phenols, mainly by UV–Visible detection [28–31].
The most commonly used analytical method (described in the Standard Methods
for the Examination of Water and Wastewater [32]) is a spectrophotometric method
based on the oxidative coupling of phenols with 4–aminoantipyrine (4–AAP). However,
this procedure has many disadvantages, including (i) the requirement for large amounts
of reagents, especially chloroform, which is toxic and carcinogenic [33]; (ii) difficulty
in finding suitable buffers, due to the sensitivity of the reaction to pH variations; and
(iii) tedious operations.
An interesting spectrophotometric method for the determination of phenolic
compounds has been reported by Nagaraj et al. [34] and improved by Kang et al. [35].
Based on the reaction between phenol, sodium nitroprusside (NPS) and hydroxylamine
hydrochloride (HL) in an alkaline medium, a blue–colored complex anion
[Fe2(CN)10]10–
is produced. However, this procedure is not yet suitable for the
determination of phenols at concentrations lower than 50.0 µg L–1
nor for analyses in

33
the presence of electrolytes, such as phosphates and sulfates, which introduce errors.
Moreover, a previous distillation step for sample preparation is required [36].
A convenient approach to address these limitations is to promote the complex
formation reaction at the interface between the bottom and top phases of an aqueous
two–phase system (ATPS). This reaction avoids salt interference and the posterior
transfer of the complex to a small volume of the ATPS top phase. Within this context,
ATPS can be a strategic liquid–liquid extraction technique for PAP determination.
Under specific thermodynamic conditions, an ATPS can be formed by mixtures of
aqueous solutions of (i) certain electrolytes and a polymer [37], (ii) two types of water–
soluble polymers [38] or (iii) two types of salts [39]. The resulting systems are two
immiscible liquid phases with a polymer–enriched top phase (or enriched with a salt)
and a salt–enriched bottom phase (or enriched with the second polymer or salt).
Moreover, water is the major component of both phases, thus providing an extraction
technology that eliminates the use of hazardous solvents. Finally, ease of use, low costs,
shorter times for phase splitting and recycling of the system components are the
advantages of the technique [40]. The ATPS methodology has already been applied
successfully by Rodrigues et al. in the determination of phenol and o–cresol in different
water samples [36].
This work aimed to determine PAP in water, formulations of paracetamol and
human urine, using an ATPS composed of polyethylene oxide 1500 (PEO1500) + salt
(Li2SO4, Na2SO4 or K2HPO4 + KOH) + water. The proposed method is based on the
reaction between PAP, NPS and HL in an alkaline medium and spectrophotometric
detection of the reaction product. Specific parameters, such as the nature of the ATPS
electrolyte, ATPS tie–line length (TLL), and partitioning behavior and influence of p-
chlorophenol (PCP) in the analysis, were also investigated.

34
2. Experimental
2.1. Apparatus
Spectrophotometric measurements were performed with a UV–Visible (UV/Vis)
spectrophotometer (Shimadzu, UV–2550) using quartz microcells with a 1.00 cm
optical path length and a total capacity of 450 µL. The slit width was kept at 2.0 nm.
The software used for system control and data acquisition was UVProbe. The pH
measurements were collected with a combined glass electrode using a digital pH meter
(Digicron Analítica Ltda, Digimed model DM-20). An ultrasonic bath (Ultra–Cleaner,
USC 1400) and a centrifuge (Thermo Scientific, Heraeus Megafuge 11R) were used to
prepare the paracetamol formulations.
2.2. Chemicals
All reagents were of analytical-grade quality and used as received without
further purification. Distilled water was used throughout the experiments. The polymer
was polyethylene oxide (Synth, Diadema, São Paulo, Brazil) with an average molar
mass (Mm) of 1500 g mol–1
(denoted as PEO1500). The chemicals in the proposed
method, Li2SO4, Na2SO4, K2HPO4, KOH, NaOH, NPS and HL, were obtained from
Vetec (Duque de Caxias, Rio de Janeiro, Brazil). The reagents for the 4–AAP procedure
[32] were 4–aminoantipyrine, NH4OH, K3[Fe(CN)6] (Merck, Darmstadt, Germany),
K2HPO4 and KH2PO4 (Vetec). p–aminophenol and p–chlorophenol (PCP) were also
purchased from Merck (Darmstadt, Germany).
2.3. ATPS composition, solutions and standards

35
The three ATPS types applied in the development of the procedure were
PEO1500 + Li2SO4 + water; PEO1500 + Na2SO4 + water [37] and PEO1500 +
(K2HPO4 + KOH) + water. For each system, at least three different compositions were
studied to verify the effect of the TLL in the partitioning behavior of the [Fe2(CN)10]10–
complex (Table 1). Moreover, global compositions shown in Table 1 are relative to an
ATPS composed of 2.00 g of the top phase and 10.0 g of the bottom phase, which were
used in most assays.
All solutions were prepared with distilled water. In the ATPS method, the pH of
the water was adjusted to 12.0 with NaOH because this pH is more favorable to the
complete reaction of NPS with PAP. For systems composed of the salts K2HPO4 +
KOH, correction was not necessary because the pH was 12.0. Stock solutions of the top
and bottom phases were prepared in distilled water (pH 12.0). The PEO1500 and salt
concentrations in the phase stock solutions are provided in Table 1. These solutions
were used as solvents to prepare the solutions of NPS and HL. The HL working stock
solutions (259 mg kg–1
) were prepared by weighing the appropriate quantity of
hydroxylamine hydrochloride in the bottom phase using an analytical balance
(Shimadzu, AY 220) with an uncertainty of ±0.0001 g. The NPS working stock
solutions (1.99 g kg–1
) were obtained by dissolving the appropriate amount of salt in the
top phase. Working standard solutions of PAP between 0.125 and 50.0 mg kg–1
were
prepared daily by using water as the solvent and the appropriate dilution of a 1.00 g kg–1
stock solution. In the 4–AAP method, the solutions and standards were prepared as
described in the literature [32].

36
Table 1. Percent composition (w/w) for PEO1500 (wP), salt (wS) and water (wW) in aqueous
two–phase systems (ATPS) at 25.0 °C.
Tie-line
length (TLL)
Global
wP wS wW
PEO1500 + Li2SO4 + water
29.43 11.4 13.83 74.77
34.97 12.0 14.73 73.27
41.71 12.3 16.64 71.06
46.36 12.8 17.62 69.58
51.67 13.5 18.79 67.71
PEO1500 + (K2HPO4 + KOH) + water
24.65 9.38 13.19 77.43
34.45 9.09 16.09 74.82
36.83 8.97 17.71 73.32
46.55 7.00 21.65 71.35
52.30 7.52 24.43 68.05
PEO1500 + Na2SO4 + water
32.51 7.45 13.50 79.05
35.96 7.52 15.17 77.31
40.10 7.87 16.53 75.60
2.4. Procedure
Liquid–liquid equilibrium cells were used for ATPS preparation. Working stock
solutions of 2.00 g of NPS and 5.00 g of HL were weighed. Next, 0.2000 g of a PAP
working standard solution were added to the system. A similar technique was adopted
in the analysis of the samples. A final composition of PAP between 2.50 and 1000 µg
kg–1
in the bottom phase was obtained, and the global concentrations of NPS and HL
were 332 mg kg–1
and 216 mg kg–1
, respectively. The final concentrations of PEO1500
and salt in the ATPS varied depending on the TLL (Table 1). Subsequently, the biphasic
systems were manually stirred for 3 min and allowed to settle for 20 min at (25.0 ± 0.1)

37
°C in a temperature–controlled bath (Microquímica, MQBTC 99-20). Finally, aliquots
of the top phase were collected with a syringe and diluted by a factor of 1.50. The
UV/Vis spectrophotometric measurements were carried out at 720.0 nm.
The afore-mentioned parameters (pH, NPS concentration, HL concentration, sample
stirring time and phase splitting time) were previously investigated and optimized by
Rodrigues et al. [36].
2.5. Partitioning experiments
To determine the [Fe2(CN)10]10
complex partition coefficient ( 10102 ])CN(Fe[
K )
between the two phases, the ATPS was kept for 24 h in a temperature–controlled bath to
reach thermodynamic equilibrium. Subsequently, aliquots of the top and bottom phases
were collected. Therefore, the parameter 10102 ])CN(Fe[
K can be defined as
1010[ ( ) ]
T
Fe CNB
AK
A (1)
where TA and BA are the absorbance (at 720.0 nm) of the [Fe2(CN)10]10-
complex in the
top and bottom phases, respectively.
The influence of the TLLs in the partitioning behavior of the complex anion was
studied by determining 102 10[ ( ) ]Fe CN
K as a function of the TLL for the ATPS composed
by PEO1500 + Li2SO4 + water.
2.6. Water Samples
To determine the applicability of the method in environmental samples, the
recovery rates provided by the proposed method were determined in samples such as

38
natural river water, industrial water, distilled water, tap water and samples from waste
water treatment plants (WWTPs). In these cases, the appropriate amounts of PAP were
added to the samples without the distillation step. The 4–AAP method [32] was also
applied to the same samples for comparison and to check the accuracy of the proposed
method.
2.7. Determination of PAP in paracetamol formulation
Paracetamol formulations were obtained from different manufacturers. Ten
tablets, containing 750 mg of paracetamol per tablet, were finely pulverized,
homogenized and accurately weighed. Each weighed sample was extracted with 25 mL
of ethanol for 15 min in an ultrasonic bath. The suspension was centrifuged for 20 min
at 3000 rpm to obtain a clear supernatant, to which the appropriate amounts of PAP
were added. The experiments were carried out according to the general procedure and
the recovery rates of PAP in the samples were determined. In our previous studies, it
was observed that the addition of ethanol quantities lower than 0.200 g in the system
has no influence in the analytical response.
2.8. Analysis of urine samples
The same assays were used for the analysis of urine samples from healthy
volunteers. Urine samples were collected 5 hours after the administration of a single
750 mg dose of paracetamol and then stored in plastic containers. The samples were
100–fold diluted with distilled water and the appropriate amounts of PAP were added.
The experiments were carried out according to the general procedure and the recovery
rates of PAP in the samples were determined.

39
3. Results and Discussion
3.1. Chemical and spectral characteristics
The proposed method is based on the reaction of PAP, NPS and HL according to
the mechanism studied by Kang et al. [35]. In an alkaline medium, the phenol group is
deprotonated, which makes the benzene ring very reactive. The higher electronic
density in the phenolate enables the eletrophilic reaction to take place more easily. In
the reaction of PAP, the nitroso group (+NO) of the nitroprusside attacks the benzene
ring, preferably, in the ortho–position to yield the green–blue complex anion
[Fe2(CN)10]10–
[36].
Figure 1 shows the absorption spectra of the reaction product [Fe2(CN)10]10–
obtained in the ATPS top phase. The product shows an absorption spectrum with a
maximum at 720.0 nm, a wavelength fortunately with an insignificant blank signal.
According to spectra obtained in aqueous solutions by Kang et al. [35], the product of
the reaction among PAP, NPS and HL exhibits maximum absorbance at 700 nm. The
different environment surrounding the product in the ATPS top phase compared with
the aqueous solution in previous experiments may account for this shift in the
absorption maximum.

40
Fig. 1. Absorption spectra of the [Fe2(CN)10]10–
anion formed by the reaction system
between NPS, HL and (––) PAP, and (···) a blank assay spectrum in the
PEO1500/Li2SO4 aqueous two–phase system (ATPS) with a tie–line length (TLL) of
41.71 % (w/w).
In general, cyan complexes are photosensitive, so the experiments were
performed in the absence of light to avoid complex decomposition. The stability of the
[Fe2(CN)10]10–
anion complex was previously investigated by Rodrigues et al. [36].
Spectral analysis revealed that the signal relative to the maximum absorbance of the
complex remained constant for over 75 hrs.
3.2. Phase diagrams
All of the phase diagrams were previously constructed and are reported in the
literature [37], except for the ATPS composed of PEO1500 + (K2HPO4 + KOH) +
water. After mixing the components, at a specific global composition (Table 1), the
systems spontaneously separated into two isotropic transparent phases, with the top and
bottom phases being enriched in macromolecules and salt, respectively.
600 700 800 9000.0
0.2
0.4
0.6
0.8
Ab
so
rba
nce
Wavelength (nm)

41
The tie–lines were obtained by linear regression of the corresponding set of
overall bottom– and top–phase concentrations. At least four tie–lines were determined
for each system.
3.3. Influence of tie–line length (TLL) and electrolyte on the partitioning behavior
In order to improve the sensibility of the proposed method, it is very important
to determine the partitioning behavior of the [Fe2(CN)10]10–
anion as a function of the
tie-line length (TLL). The increase in the preferential transfer process of the complex
anion in the top phase makes it possible to increase the absorbance signal, decreasing
the limit of detection. The TLL is a thermodynamic parameter in the ATPS that
expresses the difference in intensive thermodynamic functions between the top and
bottom phases at constant pressure and temperature [41]. The TLL is expressed by the
difference between polymer and salt concentrations present in the different phases, and
is commonly used as a variable determining the processes of solute partitioning. The
TLL is calculated by Equation 2:
2 2 1/2[( ) ( ) ]T B T B
P P S STLL C C C C (2)
where T
PC and B
PC are the polymer concentrations in the top and bottom phases,
respectively, and T
SC and B
SC are the corresponding salt concentrations.
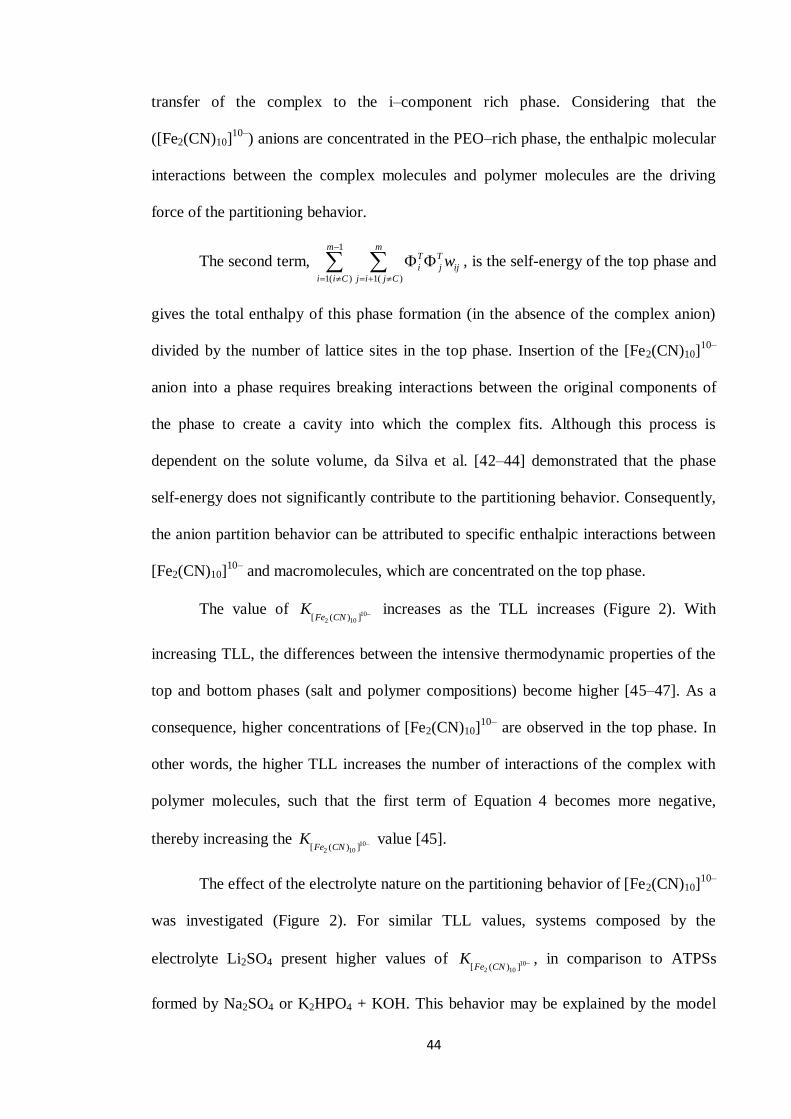
Figure 2 shows the partition coefficient ( 102 10[ ( ) ]Fe CN
K ) of the [Fe2(CN)10]10–
anion plotted against TLL in ATPS composed of PEO1500 + salt (Li2SO4 or K2HPO4 +
KOH or Na2SO4) + water. As shown in Figure 2, the [Fe2(CN)10]10–
complex anion has
a spontaneous concentration in the polymer–rich phase, reaching values of 97.7 for a
TLL of 51.67 % (w/w) in the PEO1500/Li2SO4 ATPS. To explain the [Fe2(CN)10]10–

42
partitioning to the ATPS top phase, the simple Haynes’ model was used, which was
derived from the Flory–Hüggins theory. This model consists of analytical equations that
express the partition coefficient in terms of enthalpic and entropic contributions.
Fig. 2. Partition coefficient ( 10102 ])CN(Fe[
K ) of [Fe2(CN)10]10–
anion water ATPS as a
function of increasing tie–line length (TLL), in ATPS composed of PEO 1500 + salt +
water. (▲) K2HPO4 + KOH; (◊) Na2SO4; (■) Li2SO4 and (○) Li2SO4 in the presence of
PCP.
In Haynes’ model, the entropic contribution to partitioning is described by
Equation (3):
lnT B
CC T B
M n nK
V V
(3)
where CM is the molar mass of the partitioning solute ([Fe2(CN)10]10–
), nT and n
B are
the total number of molecules in the top and bottom phases, respectively, which result
25 30 35 40 45 50 550
20
40
60
80
100
KF
e2(C
N) 1
0
10-
TLL (% (w/w))

43
in a parameter called the phase number density when divided by the phase volume, VT e
VB, and is the number of lattice sites per unit volume.
Based on Equation 3, the complex transferring process leads to a decrease in the
entropy of the system in the absence of enthalpic effects, such that the solute will
partition to the phase with the larger number of molecules per unit volume. Therefore,
the [Fe2(CN)10]10–
anion should partition to the ATPS bottom phase, which has a higher
number density than the polymer-rich phase, mainly due to the larger water content in
the salt-rich phase, as shown in Table 1. However, Figure 2 shows that the complex
concentrates preferably in the top phase, decreasing the entropy of the system,
indicative that the solute partitioning is an enthalpy-driven process.
The Haynes’s model enthalpy contribution to the partition coefficient is given by
Equation 4:
1
1( ) 1( ) 1( )
ln [ ( ) ( ) ]m m m
T B T T B BCC i i iC i j i j ij
i i C i i C j i j C
MK w w
RT
(4)
where T
i and B
i are the volume fractions of the ATPS–forming compounds on the
top and bottom phases, respectively, ijw is the effective pair-wise interchange energy
defined as: [ (1/ 2)( )]ij ij ii jjw z , where z is the number of nearest neighbors and
ij is the potential energy of an i–j pair.
In Equation 4, the enthalpic contribution is described by two terms. The first,
1( )
[ ( ) ]m
T B
i i iC
i i C
w
, is a energetic contribution relative to interactions between the
([Fe2(CN)10]10–
) anion and all of the remaining ATPS components. Stronger i–complex
interactions (ic) lead to more negative iCw values and a more enthalpically favorable
44
transfer of the complex to the i–component rich phase. Considering that the
([Fe2(CN)10]10–
) anions are concentrated in the PEO–rich phase, the enthalpic molecular
interactions between the complex molecules and polymer molecules are the driving
force of the partitioning behavior.
The second term, 1
1( ) 1( )
m mT T
i j ij
i i C j i j C
w
, is the self-energy of the top phase and
gives the total enthalpy of this phase formation (in the absence of the complex anion)
divided by the number of lattice sites in the top phase. Insertion of the [Fe2(CN)10]10–
anion into a phase requires breaking interactions between the original components of
the phase to create a cavity into which the complex fits. Although this process is
dependent on the solute volume, da Silva et al. [42–44] demonstrated that the phase
self-energy does not significantly contribute to the partitioning behavior. Consequently,
the anion partition behavior can be attributed to specific enthalpic interactions between
[Fe2(CN)10]10–
and macromolecules, which are concentrated on the top phase.
The value of 102 10[ ( ) ]Fe CN
K increases as the TLL increases (Figure 2). With
increasing TLL, the differences between the intensive thermodynamic properties of the
top and bottom phases (salt and polymer compositions) become higher [45–47]. As a
consequence, higher concentrations of [Fe2(CN)10]10–
are observed in the top phase. In
other words, the higher TLL increases the number of interactions of the complex with
polymer molecules, such that the first term of Equation 4 becomes more negative,
thereby increasing the 102 10[ ( ) ]Fe CN
K value [45].
The effect of the electrolyte nature on the partitioning behavior of [Fe2(CN)10]10–
was investigated (Figure 2). For similar TLL values, systems composed by the
electrolyte Li2SO4 present higher values of 102 10[ ( ) ]Fe CN
K , in comparison to ATPSs
formed by Na2SO4 or K2HPO4 + KOH. This behavior may be explained by the model

45
proposed by da Silva and Loh [48], who investigated the thermodynamics of ATPS
formation. According to their model, when PEO and salt are mixed, there is an
interaction between the salt cations and the PEO macromolecule, which is driven by an
entropy increase due to the release of some water molecules. The interaction of the
cation–PEO pair is driven by an increase in the system entropy caused by releasing
some water molecules that were solvating the macromolecule and the ions. This process
continues as more salt is added, until the macromolecule becomes saturated with ions
and no further gain in entropy is possible, and therefore phase splitting becomes more
favorable. After splitting phases, the polymer–rich phase contains the PEO
macromolecules solvated with cations of the salt, resulting in a positively charged
polymer surface called a pseudopolycation, which can interact with negatively charged
species. Through calorimetric measurements, da Silva and Loh [48] noted that Li+
cations interact more strongly with the EO segments of the macromolecules than the
other cations, indicating that more Li+ is necessary energetically to saturate the polymer
chain. Consequently, in the ATPS composed of Li2SO4, the macromolecule of PEO is
more positively charged than the systems composed of K2HPO4 + KOH or Na2SO4,
enabling a stronger electrostatic interaction between the pseudopolycation and the
[Fe2(CN)10]10–
complex.
Figure 2 presents the study of the partitioning behavior of [Fe2(CN)10]10–
produced by the reaction among PAP, NPS and HL, in the presence and absence of PCP
in an ATPS composed by PEO1500/Li2SO4. The reactivity is determined by the
electrophilic or electrophobic properties of the substituents in the benzene ring, which
affect the reaction extension and consequently the formation of the [Fe2(CN)10]10–
complex [49]. Due to the position and eletrophilic properties of the chlorinated
substituent, the reaction of the proposed method does not take place with PCP, although

46
its presence does not interfere with the reaction with PAP and the partitioning of the
complex to the top phase of the ATPS. A study on the selectivity of the proposed
method showed that PCP has no interference at concentrations under 7.00 mg kg–1
,
when considering a sample with 1.00 mg kg–1
of PAP. This selectivity of the reaction
allows for the quantification of certain phenolic compounds in the presence of other
nonreactive derivatives.
3.4. Study of the sensitivity of the method
Figure 3 shows the influence of the TLL on the sensitivity of the method for
PAP determination for the three kinds of ATPSs. These data were obtained by plotting
analytical curves for all of the TLLs of the ATPS and then comparing with absorbance
values of the PAP standard (600 µg kg–1
). The ATPS PEO1500/Na2SO4 studies in TLLs
> 40.10 % (w/w) were not practical due to the precipitation of sulfate. The absorbance
increases as the TLL increases, but the signal becomes constant or even decreases at
higher TLL values. Increased TLLs cause increased differences between the intensive
thermodynamic properties of the top and bottom phases [42]. As a consequence, higher
concentrations of [Fe2(CN)10]10–
were observed in the top phase. This partitioning
behavior contributes to the enhanced sensitivity observed for smaller TLL values.
However, the increase in TLL also induces an increase in the ATPS salt concentration
(Table 1), which interferes with the formation of [Fe2(CN)10]10
–, as described by Kang
[35]. This decrease on the [Fe2(CN)10]10–
concentration causes a decreased sensitivity of
the method at higher TLL values. Thus, the sensitivity of the method depends on the
balance between the formation of [Fe2(CN)10]10–
and its concentration in the top phase,
which in turn depends on the TLL. Since the reaction occurs at the interfaces in the
ATPS method, the interference of ions, such as sulfate and phosphate, is insignificant in

47
comparison to reports by Nagaraj et al. [34] and Kang et al. [35], indicating that the
tolerance limit for sulfate and phosphate is lower than 25,000 and 5,000 mg L–1
,
respectively.
Fig. 3. Effect of tie-line length (TLL) and electrolytes on the PAP determination in an
aqueous two–phase system (ATPS) composed of PEO1500, salt and water: (■) Li2SO4,
(○) K2HPO4 + KOH and (▲) Na2SO4
Figure 3 also shows the effect of electrolyte nature on the sensitivity of the
method. A TLL value of 41.71 % (w/w) using the PEO1500/Li2SO4 ATPS presented
the highest response among all of the systems studied, previously explained by its
partitioning behavior, according to the da Silva and Loh model [48]. Therefore, the
PEO1500/Li2SO4 ATPS system is more suitable for applying the proposed method in
the determination of trace concentrations of PAP in industrial and environmental water
samples.
3.5. Analytical features of the developed procedure
15 20 25 30 35 40 45 50
0.10
0.15
0.20
0.25
0.30
0.35
0.40
Ab
so
rba
nce
TLL (% (w/w))

48
Additional experiments were performed under optimal conditions [36] to
establish the analytical features of the proposed method. Due to the higher sensitivity
(Fig. 3), the ATPS composed by PEO1500 + Li2SO4 + water was applied in these
studies. To improve the limits of detection (LOD) and quantification (LOQ), an ATPS
with 1.00 g of the top phase and 23.0 g of the bottom phase was used, offering a higher
concentration factor of [Fe2(CN)10]10–
and consequently a reduction in the range of the
analytical curve.
Table 2 shows the main characteristics of the proposed method compared to the
standard method [32]. The linear response (R = 0.9990, n = 8) was within 5.00 to 500
mg kg–1
of PAP, which is suitable for the determination of phenols in water samples
according to the limits established in American and Brazilian legislation [6,7]. The
method has an LOD of 2.40 µg kg–1
and an LOQ of 8.00 µg kg–1
. These values are
lower than those obtained using the 4–AAP method [32] without extraction. The 4–
AAP method provides a lower LOD when three consecutive extractions with
chloroform are used. However, this procedure produces large amounts of waste
(approximately, 550 mL per determination) and the use of chloroform is harmful to the
environment and human health.
Moreover, the coefficient of variation (CV) was 2.11 %, and the proposed
method offers a significant reduction in the volume of waste compared to the reference
method. Hence, the new procedure is an environmentally friendly alternative to
methods available in the literature that employ hazardous solvents, such as chloroform,
or generate large amounts of waste. Furthermore, these results support the feasibility of
applying the proposed method to the determination of PAP in several strategic samples.

49
Table 2. Comparison of the analytical figures of merit of the proposed method (ATPS) with the
standard method (4–AAP) [32].
Parameter Proposed method 4–AAP method [32]a
Linear Range 5.00–500 (g kg–1
) 1000–5000 (g L–1
)
R (n = 8) 0.9990 0.9998
Cell optical path 1.00 cm 1.00 cm
LOD 2.40 g kg–1
100 g L–1
LOQ 8.00 g kg–1
NA
CV (%) (n = 5) 2.11 0.350
Waste volume (mL)b 24.0 100
a without extraction, b Estimated per determination; NA means not available,
3.6. Application to real samples
Table 3 shows the results of recovery studies on water samples. The ATPS
method was compared with the standard 4–AAP method [32] to check the accuracy and
reliability of the proposed procedures. Studies were carried out using natural river
water, industrial water, tap water, distilled water and samples from WWTPs. Recovery
rates between 96.4 – 103 % were obtained, and the results had excellent agreement with
the standard method [32] at the 95 % confidence level according to a paired t–test [50].
The proposed method was also used for the determination of PAP in
paracetamol pharmaceutical formulations and human urine samples spiked with
approximately 100 μg kg–1
of PAP.

50
Table 3. Recoveries (%) of PAP in several water samples (n = 3).
Water sample ATPS method 4–AAP method
Distilled 99.8 ± 3.4 97.9 ± 0.5
Tap 103 ± 1 96.4 ± 0.6
River 102 ± 3 99.3 ± 0.6
Industrial 98.0 ± 0.5 98.0 ± 0.9
WWTP 1 98.6 ± 4.8 99.8 ± 0.6
WWTP 2 101 ± 4 96.6 ± 0.6
WWTP: wastewater treatment plant.
Table 4 shows the recovery results for two paracetamol formulations and two
urine samples. The method is capable of quantifying 100 μg kg–1
of PAP with recovery
rates between 94.9 – 101 %. Morover, blanks assays were analyzed without added PAP
in the system and no signal relative to the analyte was observed. Therefore, the present
method could be used for the quantitative detection of trace PAP in urine and real
pharmaceutical formulation samples, such as paracetamol tablets, and can be extended
to other systems.
Table 4. Determination of PAP in pharmaceutical and human urine samples (n = 3).
Sample PAP added (g kg–1) PAP found (g kg–1) Recovery (%)
Paracetamol A 98.2 97.9 99.7 ± 0.7
Paracetamol B 97.5 97.3 99.7 ± 3.9
Urine A 102 96.8 94.9 ± 3.7
Urine B 96.2 97.1 101 ± 2
4. Conclusions

51
The above experimental results demonstrated for the first time the capability and
advantages of the proposed ATPS for the determination of PAP in environmental and
industrial water, pharmaceutical formulations and human urine samples. The procedure
exploits the reaction between PAP, NPS and HL, producing the [Fe2(CN)10]10–
anion
complex, which concentrates in the top phase of the ATPS, offering high sensitivity to
the method. The ATPS offers clearly advantageous analytical features in comparison to
the standard method [32], including an enhanced sensitivity and linear range as well as
reduced waste volumes and no organic solvents. Due the reaction takes place at the
interfaces of the ATPS, the interference of ions, such as sulfate and phosphate, is
significantly lower in comparasion to other spectrophotometric methods that employ the
same reaction [34, 35]. Furthemore, since the presence of PCP in the system has no
interference on the reaction among PAP, NPS and HL, the method is suitable to
determination of certain phenolic compounds in the presence of other nonreactive
derivatives. Pre–concentration of analyte in the polymer–rich phase of the system
allows the method to reach LOD and LOQ values that are suitable for determining PAP
in water, pharmaceutical formulations and urine with high accuracy and in compliance
with the regulatory requirements of environmental agencies [6,7] and pharmacopoeia
[13].
5. Acknowledgments
We gratefully acknowledge Fundação de Amparo a Pesquisa do Estado de
Minas Gerais (FAPEMIG) and Conselho Nacional de Desenvolvimento Científico e
Tecnológico (CNPq) for financially supporting this project. G. D. R. and L. R. L. thank
CNPq for research fellowships. P. R. P. thanks FAPEMIG for research fellowship.

52

53
6. References
[1] K.P. Kringtad, E. Lindstrom, Spent liquors from pulp bleaching, Environ. Sci.
Technol. 18 (1984) 236A–248A.
[2] U.S. Environmental Protection Agency. http://www.epa.gov, accessed in February
2010.
[3] Y. Chung, K. Lee, Separation and determination of eleven environmental protection
agency priority phenols by reversed-phase capillary high-performance liquid
chromatography with indirect fluorophotometric detection and solid phase extraction,
Microchem. J. 69 (2001) 45-54.
[4] M. Ahmaruzzaman, D.K. Sharma, Adsorption of phenols from wastewater, J.
Colloid Interface Sci. 287 (2005) 14–24.
[5] M. Barreto–Rodrigues, C.M. Aguiar, M.A.A. Cunha, Biotreatment of an effluent
from a wood laminate industry using Lentinula edodes UEC, 2019 J. Hazard. Mater.
164 (2009) 1556–1560.
[6] J. Švitel, S. Miertuš, Development of tyrosinase-based biosensor and its application
for monitoring of bioremediation of phenol and phenolic compounds, Environ. Sci.
Technol. 32 (1998) 828–832.
[7] Conselho Nacional do Meio Ambiente. http://www.mma.gov.br/conama, accessed
in February 2010 (Portuguese).

54
[8] S. Mitchell, Kirk–Othmer, Encyclopedia of Chemical Technology, vol. II, 4th ed.,
Wiley, New York, USA, 1992.
[9] S.A. Khan, M. Hamayun, S. Ahmed, Degradation of 4-aminophenol by newly
isolated Pseudomonas sp. strain ST-4, Enzyme Microb. Technol. 38 (2006) 10–13.
[10] H. Xu, C.F. Duan, Z.F. Zhang, J.Y. Chen, C.Z. Lai, M. Lian, L.J. Liu, H. Cui, Flow
injection determination of p-aminophenol at trace level using inhibited luminol–
dimethylsulfoxide–NaOH–EDTA chemiluminescence, Water Res. 39 (2005) 396–402.
[11] H. Filik, M. Hayvalı, E. Kılıç, R. Apak, D. Aksu,, Z. Yanaz, T. Çengel,
Development of an optical fibre reflectance sensor for p-aminophenol detection based
on immobilised bis-8-hydroxyquinoline,Talanta 77 (2008) 103–109.
[12] R.C. Harmon, K.K. Kiningham, M.A. Valentovic, Pyruvate reduces 4-aminophenol
in vitro toxicity, Toxicol. Appl. Pharm. 213 (2006) 179–186.
[13] European Pharmacopoeia, 4th ed., Council of Europe, Strasbourg, France, 2002.
[14] S. Vichi, A. Romero, J. Tous, E.L. Tamames, S. Buxaderas, Determination of
volatile phenols in virgin olive oils and their sensory significance, J. Chromatogr. A.
1211 (2008) 1–7.
[15] B.N. Estevinho, I. Martins, N. Ratola, A. Alves, L. Santos, Removal of 2,4-

55
dichlorophenol and pentachlorophenol from waters by sorption using coal fly ash from
a Portuguese thermal power plant, J. Hazard. Mater. 143 (2007) 535–540.
[16] A. Kumar, A. Pamwar, Gas chromatographic separation of isomeric aminophenols,
aniline, phenol, benzoquinone and azobenzene on an HP-1 capillary column,
Microchim. Acta, 111 (1993) 177–182.
[17] M. Lotfi, D. Frida, Simultaneous LC determination of paracetamol and related
compounds in pharmaceutical formulations using a carbon-based column, J. Pharm.
Biomed. Anal. 27 (2002) 851–860.
[18] M. Kartal, LC method for the analysis of paracetamol, caffeine and codeine
phosphate in pharmaceutical preparations, J. Pharm. Biomed. Anal. 26 (2001) 857–864.
[19] H.M. Oliveira, M.A Segundo, J.L.F.C. Lima, V. Cerdà, Multisyringe flow injection
system for solid-phase extraction coupled to liquid chromatography using monolithic
column for screening of phenolic pollutants, Talanta 77 (2009) 1466–1472.
[20] Q. Chu, L. Jiang, X. Tian, J. Ye, Rapid determination of acetaminophen and p-
aminophenol in pharmaceutical formulations using miniaturized capillary
electrophoresis with amperometric detection, Anal. Chim. Acta 606 (2008) 246–251.
[21] S. Zhao, W. Bai, H. Yuan, D. Xiao, Detection of paracetamol by capillary
electrophoresis with chemiluminescence detection, Anal. Chim. Acta, 559 (2006) 195–
199.

56
[22] W. Wei, X.B. Yin, X.W. He, pH-mediated dual-cloud point extraction as a
preconcentration and clean-up technique for capillary electrophoresis determination of
phenol and m-nitrophenol, J. Chromatogr. A. 1202 (2008) 212–215.
[23] J. Barek, A. Berka, H. Skokánková, Oxidation of organic substances by
compounds of trivalent manganese: XXV. Determination of benzene polyhydroxy and
aminohydroxy derivatives with a standard solution of the fluoride complex of trivalent
manganese, Microchem. J. 28 (1983) 308–313.
[24] J. Forshed, F.O. Andersson, S.P. Jacobsson, NMR and Bayesian regularized neural
network regression for impurity determination of 4-aminophenol, J. Pharm. Biomed.
Anal. 29 (2002) 495–505.
[25] E. Valero, P. Carrion, R. Varon, F. Garcia–Carmona, Quantification of
acetaminophen by oxidation with tyrosinase in the presence of Besthorn's hydrazone,
Anal. Biochem. 318 (2003) 187–195.
[26] S.Y. Sheikheldin, T.J. Cardwell, R.W. Cattrall, M.D.L. de Castro, S.D. Kolev,
Determination of phenol in water by pervaporation–flow injection analysis, Anal. Chim.
Acta 419 (2000) 9–16.
[27] M.A. El Mhammedi, M. Achak, M. Bakasse, A. Chtaini, Electrochemical
determination of para-nitrophenol at apatite-modified carbon paste electrode:
Application in river water samples, J. Hazard. Mater. 163 (2009) 323–328.

57
[28] O. Agrawal, V. K. Gupta, Sub-parts-per-million spectrophotometric determination
of phenol and related pesticides using diazotizedp-aminoacetophenone, Microchem. J.
62 (1999) 147–153.
[29] M. S. Nezio, M. F. Pistonesi, W. D. Fragoso, M. J. C. Pontes, H. C. Goicoechea, M
C. U. Araújo, B. S. F. Band, Successive projections algorithm improving the
multivariate simultaneous direct spectrophotometric determination of five phenolic
compounds in sea water, Microchem. J. 85 (2007) 194–200.
[30] M. Manera, M. Miró, J.M. Estela, V. Cerdà, Multi-syringe flow injection solid-
phase extraction system for on-line simultaneous spectrophotometric determination of
nitro-substituted phenol isomers, Anal. Chim. Acta 582 (2007) 41–49.
[31] M. Shaghaghi, J.L. Manzoori, A. Jouyban, Determination of total phenols in tea
infusions, tomato and apple juice by terbium sensitized fluorescence method as an
alternative approach to the Folin–Ciocalteu spectrophotometric method, Food Chem.
108 (2008) 695–701.
[32] L.S. Clesceri, A.E. Greenberg, A.D. Eaton, Standard methods for the examination
of water and wastewater, twentieth ed., American Public Health Association,
Washington DC, 1999.
[33] M.C.H. da Silva, L.H.M. da Silva, F.J. Paggioli, A novel micellar medium using
triblock copolymer for cobalt determination, Anal. Sci. 21 (2005) 933–937.

58
[34] P. Nagaraj, J.M. Bhandari, B.N. Achar, Rapid spectrophotometric determination of
trace amounts of phenol, Indian J. Chem. 32A (1993) 641–643.
[35] C. Kang, Y. Wang, R. Li, Y. Du, J. Li, B. Zhang, L. Zhou, Y. Du, A modified
spectrophotometric method for the determination of trace amounts of phenol in water,
Microchem. J. 64 (2000) 161–171.
[36] G.D. Rodrigues, L.R. de Lemos, L.H.M. da Silva, M.C.H. da Silva, L.A. Minim,
J.S.R. Coimbra, A green and sensitive method to determine phenols in water and
wastewater samples using an aqueous two phase system, Talanta 80 (2010) 1139-1144
[37] J.P. Martins, P.C. Carvalho, L.H.M. da Silva, J.S.R. Coimbra, M.C.H. da Silva,
G.D. Rodrigues, L.A. Minim, Liquid-liquid equilibria of aqueous two-phase system
containing poly(ethylene) glycol 1500 and sulfate salts at different temperatures, J.
Chem. Eng. Data 53 (2008) 238–241.
[38] X. Zeng, K. Osseo-Asare, Partitioning behavior of silica in the PEG/dextran/H2O
aqueous biphasic system, Colloids Surf. A: Physicochem. Eng. Aspects 226 (2003) 45–
54.
[39] N.J. Bridges, K.E. Gutowski, R.D. Rogers, Investigation of aqueous biphasic
systems formed from solutions of chaotropic salts with kosmotropic salts (salt–salt
ABS), Green Chem. 9 (2007) 177–183.

59
[40] G.D. Rodrigues, M.D.H. da Silva, L.H.M. da Silva, F.J. Paggiolli, L.A. Minim,
J.S.R. Coimbra, Liquid liquid extraction of metal ions without use of organic solvent,
Sep. Purif. Technol. 62 (2008) 687–693.
[41] J.P. Martins, A.B. Mageste, M.D.H. da Silva, L.H.M. da Silva, P.R. Patricio, J.S.R.
Coimbra, L.A. Minim, Liquid-liquid equilibria of an aqueous two-phase system formed
by a triblock copolymer and sodium salts at different temperatures, J. Chem. Eng. Data
54 (2009) 2891–2894.
[42] L.H.M. da Silva, M.C.H. da Silva, R.A.N. de Aquino, K.R. Francisco, M.V.C.
Cardoso, L.A. Minim, J.S.R. Coimbra, Nitroprusside-PEO enthalpic interaction as
driving force for partitioning of the [Fe(CN)5NO]2-
anion in aqueous two-phase systems
formed by poly(ethylene oxide) and sulfate salts, J. Phys. Chem. B 110 (2006) 23540–
23546.
[43] L.H.M da Silva, M.D.H. da Silva, J.A. Júnior, J.P. Martins, J.S.R. Coimbra, L.A.
Minim, Hydrophobic effect on the partitioning of [Fe(CN)5(NO)]2-
and [Fe(CN)6]3-
anions in aqueous two-phase systems formed by triblock copolymers and phosphate
salts, Sep. Purif. Technol. 60 (2008) 103–112.
[44] L.H.M da Silva, M.C.H. da Silva, K.R. Francisco, M.V.C. Cardoso, L.A. Minim,
J.S.R. Coimbra, EO-[M(CN)5NO]x-
(M = Fe, Mn or Cr) Interaction as Driving Force in
the Partitioning of the Pentacyanonitrosylmetallate Anion in ATPS: The Strong Effect
of the Central Atom, J. Phys. Chem. B. 112 (2008) 11669–11678.

60
[45] A.B. Mageste, L.R. de Lemos, G.M.D. Ferreira, M.C.H. da Silva, L.H.M. da Silva,
R.C.F. Bonomo, L.A. Minim, Aqueous two-phase systems: an efficient,
environmentally safe and economically viable method for purification of natural dye
carmine, J. Chromatogr. A. 1216 (2009) 7623–7629.
[46] L.H.M. da Silva, M.D.H. da Silva, R.C.S. de Sousa, J.P. Martins, G.D. Rodrigues,
J.S.R Coimbra, L.A. Minim, Surface excess enthalpy of PEO + salt +water and L35 +
salt + water aqueous two-phase systems, J. Chem. Eng. Data 54 (2009) 531.
[47] V.G. Lacerda, A.B. Mageste, I.J.B. Santos, L.H.M. da Silva, M.C.H. da Silva,
Separation of Cd and Ni from Ni-Cd batteries by an environmentally safe methodology
employing aqueous two-phase systems, J. Power Sources 193 (2009) 908–913.
[48] L.H.M Silva, W. Loh, Calorimetric investigation of the formation of aqueous two-
phase systems in ternary mixtures of water, poly(ethylene oxide) and electrolytes (or
dextran), J. Phys. Chem. B 104 (2000) 10069–10073.
[49] C. Terashima, T.N. Rao, B.V. Sarada, D.A. Tryk, A. Fujishima, Electrochemical
Oxidation of Chlorophenols at a Boron-Doped Diamond Electrode and Their
Determination by High-Performance Liquid Chromatography with Amperometric
Detection, Anal. Chem. 74 (2002) 895–902.
[50] J.C. Miller, J.N. Miller, Statistics for Analytical Chemistry, fourth ed., Prentice
Hall, 2000.

61

Livros Grátis( http://www.livrosgratis.com.br )
Milhares de Livros para Download: Baixar livros de AdministraçãoBaixar livros de AgronomiaBaixar livros de ArquiteturaBaixar livros de ArtesBaixar livros de AstronomiaBaixar livros de Biologia GeralBaixar livros de Ciência da ComputaçãoBaixar livros de Ciência da InformaçãoBaixar livros de Ciência PolíticaBaixar livros de Ciências da SaúdeBaixar livros de ComunicaçãoBaixar livros do Conselho Nacional de Educação - CNEBaixar livros de Defesa civilBaixar livros de DireitoBaixar livros de Direitos humanosBaixar livros de EconomiaBaixar livros de Economia DomésticaBaixar livros de EducaçãoBaixar livros de Educação - TrânsitoBaixar livros de Educação FísicaBaixar livros de Engenharia AeroespacialBaixar livros de FarmáciaBaixar livros de FilosofiaBaixar livros de FísicaBaixar livros de GeociênciasBaixar livros de GeografiaBaixar livros de HistóriaBaixar livros de Línguas

Baixar livros de LiteraturaBaixar livros de Literatura de CordelBaixar livros de Literatura InfantilBaixar livros de MatemáticaBaixar livros de MedicinaBaixar livros de Medicina VeterináriaBaixar livros de Meio AmbienteBaixar livros de MeteorologiaBaixar Monografias e TCCBaixar livros MultidisciplinarBaixar livros de MúsicaBaixar livros de PsicologiaBaixar livros de QuímicaBaixar livros de Saúde ColetivaBaixar livros de Serviço SocialBaixar livros de SociologiaBaixar livros de TeologiaBaixar livros de TrabalhoBaixar livros de Turismo