felipe de azevedo lage ferreira an empirical risk analysis
TRANSCRIPT

Felipe de Azevedo Lage Ferreira
An Empirical Risk Analysis of the Brazilian Shipbuilding Industry
Dissertação de Mestrado (Opção profissional)
Thesis presented to the Programa de Pós-Graduação em Engenharia de Produção of the Departamento de Engenharia Industrial, PUC-Rio, as partial fulfillment of the requirements for the degree of Mestre em Engenharia de Produção – opção profissional
Advisor: Prof. Luiz Felipe Roris Rodriguez Scavarda do Carmo Co-advisor: Profª. Adriana Leiras
Rio de Janeiro April 2015

Felipe de Azevedo Lage Ferreira
An Empirical Risk Analysis of the Brazilian Shipbuilding Industry
Thesis presented to the Programa de Pós-Graduação em Engenharia de Produção of the Departamento de Engenharia Industrial do Centro Técnico Cientifico da PUC-Rio, as partial fulfillment of the requirements for the degree of Mestre (professional option)
Prof. Luiz Felipe Roris Rodriguez Scavarda do Carmo Advisor
Departamento de Engenharia Industrial - PUC-Rio
Profa. Adriana Leiras Co-advisor
Departamento de Engenharia Industrial - PUC-Rio
Prof. Fabricio Carlos Pinheiro de Oliveira Departamento de Engenharia Industrial - PUC-Rio
Profa. Paula Santos Ceryno Departamento de Engenharia de Produção - UNIRIO
Prof. José Eugênio Leal Coordenador Setorial do Centro Técnico Científico - PUC-Rio
Rio de Janeiro, April 9, 2015

All rights reserved.
Felipe de Azevedo Lage Ferreira
Graduated in Industrial Engineer at Pontificia
Universidade Catolica do Rio de Janeiro – PUC-Rio in
2011. He worked for Ernst & Young Terco as a Supply
Chain advisor in 2011 and worked for Shipyard STX OSV
in 2012. Since 2013 he works for Gearbulk.
Bibliographic data
CDD: 658.5
Ferreira, Felipe de Azevedo Lage An Empirical Risk Analysis of the Brazilian Shipbuilding Industry / Felipe de Azevedo Lage Ferreira ; advisor: Luiz Felipe Roris Rodriguez Scavarda do Carmo ; co-advisor: Adriana Leiras. – 2015. 81 f. : il. (color.) ; 30 cm Dissertação (mestrado)–Pontifícia Universidade Católica do Rio de Janeiro, Departamento de Engenharia Industrial, 2015. Inclui bibliografia 1. Engenharia Industrial – Teses. 2. Engineer-to-Order. 3. Cadeia de Suprimento. 4. Gestão de Risco. 5. Brasil. I. Carmo, Luiz Felipe Roris Rodriguez Scavarda do. II. Leiras, Adriana. III. Pontifícia Universidade Católica do Rio de Janeiro. Departamento de Engenharia Industrial. IV. Título.

Acknowledgments
First of all, I want to thank my advisor Prof. Luiz Felipe Scavarda for believing in
me to develop this work. I would like to express my gratitude to him and to my
co-advisor Adriana Leiras for their ideas, commitment and valuable time to
support me in this work. Without their guidance and persistent help this
dissertation would not have been possible.
I acknowledge the professors who kindly accepted the invitations to collaborate
with their experience for the evaluation of this study.
I am grateful to PUC’s professors, staff and my colleagues who shared their time
and knowledge with me.
Furthermore I would like to thank my fiancée Elisângela for her encouragement,
support, advice, and understanding.
Last but not least, I am very grateful to my family, for all that they represent in
my life. Especially to my mother and father who taught how valuable education
is.
Abstract
Ferreira, Felipe de Azevedo Lage; Carmo, Luiz Felipe Roris Rodriguez
Scavarda. (Advisor) An Empirical Risk Analysis of the Brazilian
Shipbuilding Industry. Rio de Janeiro, 2015. 81p. MSc. Dissertation
(Opção profissional) - Departamento de Engenharia Industrial, Pontifícia
Universidade Católica do Rio de Janeiro.
Supply Chain Management (SCM) is an area of growing interest by
scholars and practitioners, and companies are increasingly paying attention to the
role of risk in their business, in particular, to the development of Supply Chain
Risk Management (SCRM) techniques. However, a gap in the literature is
observed in regards to empirical studies on SCRM, in special for large projects as
the shipbuilding industry, despite the fact that many characteristics of this industry
- such as long lead times, complex processes, financial intensity and dynamic
organization structures - make it fundamentally vulnerable to risks. For the
Brazilian shipbuilding in particular, empirical evidence also showed to be more
crucial, not only because there is a scarcity of studies for shipbuilding in general,
but also because the Brazilian shipbuilding industry experienced a long period of
stagnation during the 80s and 90s decades. This study attempts to fulfill this gap,
by identifying the main supply chain risks for Brazilian ship builders and offering
an initial risk profile for the industry. The study integrated and implemented
methodologies proposed by other scholars in the field to develop a survey
approach targeted at experts from shipyards in Brazil. The survey asked
participants to: (1) identify the main risks present in the Brazilian shipbuilding
industry; (2) evaluate the likelihood of their occurrence; and (3) recognize main
sources and potential impacts, as well as potential strategies to mitigate them. The
study confirmed the presence of risks identified in the literature and new ones of
particular importance to the Brazilian context. The study also yielded a
preliminary risk profile for the Brazilian shipbuilding industry.
Keywords Engineer-to-Order; Supply Chain; Risk Management; Brazil.

Resumo
Ferreira, Felipe de Azevedo Lage; Carmo, Luiz Felipe Roris Rodriguez
Scavarda. Análise Empírica de Risco da Indústria Naval Brasileira.
Rio de Janeiro, 2015. 81p. Dissertação de Mestrado – Departamento de
Engenharia Industrial, Pontifícia Universidade Católica do Rio de Janeiro.
A Gestão da Cadeia de Suprimento é uma área de crescente interesse na
literatura, e da mesma forma as companhias estão cada vez mais voltando à
atenção, especificamente, para técnicas para Gestão de Risco da Cadeia de
Suprimento. Porém, existe uma carência na literatura para estudos empíricos da
Gestao de Risco, em particular para grandes projetos como a construção naval,
mesmo sendo muitos das características dessa indústria – como longos períodos
de lead time, complexos processos produtivos, alto investimento de capital e
estruturas de organização dinâmica – aumenta a sua exposição a riscos. Existe
um gap na literatura com relação à gestão de risco para estudos empíricos, em
especial para grandes projetos, como a construção naval. No Brasil em
específico, esta carência da indústria se tornou mais evidente devido ao fato da
indústria de construção naval no Brasil ter vivenciado um longo período de
recessão nas décadas de 80 e 90. Este estudo empírico visa preencher essa
lacuna, através da identificação dos principais riscos da cadeia de suprimentos
para os principais estaleiros brasileiros e oferecendo um perfil de risco inicial
para que a indústria. Foi realizada uma coleta de dados com os estaleiros visando
(1) identificar os principais riscos presentes na indústria naval brasileira; (2)
avaliar a probabilidade de ocorrência destes riscos; e (3) reconhecer as fontes
principais e potenciais impactos de riscos, bem como possíveis estratégias para
mitigar os riscos. O estudo confirmou a presença de riscos identificados em
estudos da indústria de construção naval em outros países, e também identificou
novos riscos relevantes no contexto brasileiro. Por fim, for apresentado um perfil
de risco para a indústria naval brasileira.
Palavras-chave Engineer-to-Order; Cadeia de Suprimento; Gestão de Risco; Brasil.

Contents 1. Introduction 11 2. Conceptual Foundation 14
2.1. Supply Chain Management (SCM) 14 2.2. Supply Chain Structures 15 2.3. Engineer-to-order 17
3. Literature Review 21
3.1. Risk and SC Risk Sources 21 3.2. Supply Chain Risk Management (SCRM) 25 3.3. Shipbuilding risks 29
4. Shipbuilding overview 34
4.1. Shipbuilding industry 34 4.2. Shipbuilding main actors 36 4.3. Shipbuilding macro processes 39 4.4. Shipbuilding activity costs 41 4.5. Shipbuilding global market overlook 42
5. Research design and methodology 45 6. Results and discussion 52 7. Conclusion and future research 61 References 64 Appendix I – Survey Rounds 1 and 2 77 Appendix II – Survey Round 3 81
List of figures
Figure 1 – Types of CODP 16
Figure 2 – ETO overlapping processes 19
Figure 3 – Internal or External Risk Sources 25
Figure 4 – SCRM Process 26
Figure 5 – Shipbuilding risks types 31
Figure 6 – Shipbuilding industry links 34
Figure 7 – Shipbuilding macro Supply Chain 36
Figure 8 – Shipbuilding processes overview 39
Figure 9 – Shipbuilding macro expenses 42
Figure 10 – World’s new ship orders 44
Figure 11 – Methodology summary 45
Figure 12 – Risk map/matrix groups and actions remove 50
Figure 13 – Methodology expanded overview 51
Figure 14 – Brazilian shipbuilding risk profile 55
Figure 15 – Brazilian shipbuilding workforce 58
List of tables
Table 1 – Literature definitions and characteristics for ETO 18
Table 2 – Taxonomy for ETO companies 20
Table 3 – Supply Chain risks 22
Table 4 – World’s new ship orders book 43
Table 5 – Main risks in Brazilian shipbuilding industry 53
Table 6 – Risk assessment result 54
Table 7 – Risk exposure levels 56
Table 8 – Risk ranking by risk category 57

List of acronyms
AHP – Analytic Hierarchy Process
ARF – Analytical Risk Framework
ATO – Assemble-to-Order
BTO – Build-to-Order
CPFR – Collaborative Planning, Forecasting, and Replenishment
CODP – Customer Order Decoupling Point
DWT – Deadweight tonnage
ERP – Enterprise Resource Planning
ETA – Event Tree Analysis
ETO – Engineer-to-Order
FMEA – Failure Mode and Effect Analysis
FTA – Failure Tree Analysis
KPI – Key Process Indicator
MAD – Median Absolute Deviation
MTO – Make-to-Order
MTS – Make-to-Stock
OPP – Order Penetration Point
SC – Supply Chain
SCM – Supply Chain Management
SCRM – Supply Chain Risk Management
SD – Standard Deviation
VAR – Value at Risk
VFPE – Value Focused Process Engineering
VMI – Vendor Managed Inventor

1. Introduction
In today’s globalized and highly competitive environment, Supply Chains
(SC) became larger and more complex with globally dispersed components
(Blackhurst et al., 2005; Chapman, 2006). The more complex the SC is, less
predictable is the likelihood and the impact of disruption, which indicate a higher
exposition to SC risks (McGillivray, 2000; Engardio, 2001; Harland et al., 2003;
Christopher and Lee, 2004; Finch, 2004; Jüttner, 2005; Kleindorfer and Saad,
2005; Tummala and Schoenherr, 2011).
Recently, companies have given more attention to disruption or contingency
plans by developing a Supply Chain Risk Management (SCRM) technique, in
order to avoid the identified SC risks, or if not possible, to mitigate or control
them. For that reason, it is necessary that firms understand SC interdependencies
and be able to identify potential risk factors by measuring their likelihood and
consequences. (Norrman and Jansson, 2004; Hendricks and Singhal, 2005;
Pujawan and Geraldin, 2009; Thun and Hoenig, 2009; Tang and Musa, 2011;
Tazelaar and Snijders, 2011; Tummala and Schoenherr, 2011; Ceryno et al.,
2014).
According to Jüttner (2005), SCRM is still a recent subject and a very
specific task to many industries. For Tang (2006) only minorities of companies
have implemented adequate methods for SCRM, although they are quite aware of
the consequences of SC risks.
Recent studies by Tang and Musa (2011) and Sodhi et al. (2012), claim that
there are three gaps in SCRM: (1) there is no clear definition of SCRM, (2) lack of
research on mitigating supply chain risk and (3) clear deficiency of empirical
studies in this area.
The lack of empirical research is even more critical for large projects as for
ship construction (Lu and Tang 2000, Moyst and Das, 2005). Additionally, when
compared to many other industries, shipbuilding, as a typical Engineer-to-order
production (ETO), is more exposed to SC risks due to the unique features of this

12
activity, such as long lead time, complex processes, financial intensity and
dynamic organization structures (Kanerva, 2004; Moyst and Das, 2005; Lee et al.,
2009; Basuki et al., 2010). The uncertainties within an ETO production are
basically from the product specification and design, and demand forecast for the
manufacturing process. These uncertainties have great influence on the
complexity of the production control situation and serious impact on lead-time
duration (Galbraith, 1973). Hence, taking effective SCRM techniques to manage
these variables of ship construction along the SC is important to a successful
delivery of a ship project (Flanagan and Norman, 1993; Akintoye and MacLeod,
1996).
For the Brazilian shipbuilding in particular, empirical evidence also showed
to be crucial, not only because there is a scarcity of studies for shipbuilding in
general, but also because the Brazilian shipbuilding industry experienced a long
period of stagnation, reducing to almost zero the investments and researches in the
area (Lima, 2009). Only in recent years it started again to receive attention of
academics and practitioners, due to the boom generated by the deep-water oil
exploration in Brazil (Lima, 2009; Faverin et al., 2010 a; Queiroz, 2012). During
this strong period of growth, Brazilian shipyards are still dealing with great
challenges in their development, which has not yet reached a level of global
competitiveness (Coutinho, 2006; Faverin et al., 2010 a; Queiroz, 2012).
The uncertainties presented in this industry allow a great opportunity for
research and development for SCRM techniques. Hence, this study purposes to
identify the main risks along the shipbuilding supply chain by probability and
severity of occurrence. In addition, it is proposed the construction of an initial risk
profile for the Brazilian shipbuilding, in order to obtain a better outline of this
industry. Furthermore, this approach contributes to fulfill a gap in the literature for
empirical researches in SCRM and also can help professionals to better
understand the vulnerabilities related to ship construction around the risk concept.
Moreover, the identification of risks can also be viewed as the trigger for SCRM
and could serve as a guide for practitioners to start the SCRM processes (Kern et
al., 2012; Ceryno et al., 2014). The SCRM process helps to access, analyze and
treat areas of vulnerability and risk in supply chains (Nieger et al., 2009; Ceryno

13
et al., 2014). The research goal is achieved based on a survey approach with three
Round of questionnaires. The survey included executives from major shipbuilders
considering their steel processing capacity.
The dissertation is organized into 7 chapters, beginning with this
introduction. Chapter 2 provides a conceptual foundation around SCM and SCM
structures, focusing on ETO production. Next, Chapter 3 outlooks the literature
review for risk and SCRM concept and techniques, followed by Chapter 4 that
presents the main characteristics for the shipbuilding activity and also a global
market overview for this industry. Chapter 5 that presents the research method.
Finally, Chapters 6 and 7 bring the research results and discussion, and propose a
future research for this study.

2. Conceptual Foundation
This chapter presents the main definitions and concepts about SCM and SC
structures, with special attention to ETO, as a typical shipbuilding structure.
2.1. Supply Chain Management (SCM)
Over the past two decades, SCM has come to be seen as a key component of
organizational competitiveness and effectiveness. In this way, the interest in the
concept of SCM increased significantly when companies saw the benefits of
collaborative relationships within and beyond their own organization. Moreover,
continuous advances in communication and transportation technologies have
motivated the evolution of supply chain and to effective managing techniques,
such as Enterprise Resource Planning (ERP) systems, Vendor Managed Inventor
(VMI), Collaborative Planning, Forecasting, and Replenishment (CPFR), and
others (Porter, 1985; Mentzer et al., 2001; Khan and Burnes, 2007; Simchi-Levi et
al., 2008).
While interest in SCM is immense, it is clear that much of the knowledge
about the theme resides in narrow functional fields such as purchasing, logistics,
IT and marketing. By virtue of this, a number of definitions have been proposed
concerning the concept of “the supply chain” and its management (Burgess et al.,
2006).
Scott and Westbrook (1991) and New and Payne (1995) describe supply
chain management as the chain linking each element of the manufacturing and
supply process from raw materials through to the end user.
Lambert and Cooper (2000) state a similar definition for SCM as, “the
integration of key business processes from end-user through original suppliers that
provides products, services, and information that add value for customers and
other stakeholders”. Simchi-Levi et al. (2008) define SCM as a series of activities
concerning the planning, coordinating and controlling movement of materials,
parts, and products from the suppliers to the customer. This includes the
management of material, information and financial flows in the supply chain.

15
However, as Hendricks and Singhal (2005) argue, by developing SCM,
which focus on cost reduction and effectiveness, the organizations have ignored or
played down the risks from a disruption to the entire supply chain. In this way,
companies became more aware that they can no longer effectively compete in
isolation of their suppliers and other entities. Modern SC are in fact dynamics
networks of interconnected firms and industries (Lummus and Vokurka, 1999;
Mentzer et al., 2001).
Many researchers have sought to investigate the relationship between risk
and supply chain management. This is considered as initial step when
understanding the SC risks and a further SCRM method (Kraljic, 1983; Puto et al.,
1985; Eisenhardt, 1989; Pilling and Zhang, 1992; Ragatz et al., 1997; Hallikas et
al., 2000; Zsidisin et al., 2000; Macintosh, 2002; Harland et al., 2003; Karjalainen
et al., 2003).
2.2. Supply Chain Structures
As well as understanding the SCM and its SC risks, it is also important to
observe the characteristics and particularities of production systems, in order to
understand the features and uncertainties and also the relationship between
productive activities (Lustosa et al., 2008), in particular for shipbuilding
production system, as center of this study.
Based on Rudberg and Wikner (2004) and Olhager (2010), there are four
basic types of production systems: Engineer-to-Order (ETO), Make-to-Order
(MTO), Assemble-to-Order (ATO), and Make-to-Stock (MTS), often referred as
‘supply chain structures’.
In terms of the lead time and product customization, these supply chain
structures can be organized around the concept of customer order decoupling
point (CODP) (Gosling and Naim, 2009). CODP is most often defined as the
point in the material flow where the product is tied to a specific order from the
client. In the literature, this point has received different denominations. Some
authors define it only as decoupling point (DP), others as order penetration point
(OPP) (Yang and Burns 2003; Olhager 2003; Olhager 2010).

16
Sharman (1984) also introduces CODP in a logistics context, emphasizing
the product specifications and stock. He defines CODP as the point where
specifications are typically unchanged until demand is known, and the last point at
which the stock is held.
In other words, CODP divides the production cycle in two distinct stages
as shown in Figure 1: prior to decoupling point the product value chain remains
based on forecast activities; whereas after decoupling point it’s driven by the
market demand (Rudberg and Wikner, 2004). Thus, all activities in supply chain
performed after the CODP are customized and targeted at the specific customer
order, while all activities in the supply chain performed before the CODP are
standardized (Yang and Burns, 2004).
Additionally, due to the possible market uncertainties, CODP may act as a
strategic buffer between fluctuating customer order and/or product variety.
Volatile markets require agility in decision making and quick reactions in order to
ensure that customer needs are met in the shortest time and at the lowest cost
(Bertrand and Muntslag, 1993; Naylor et al., 1999).
Figure 1 – Types of CODP
Source: Based on Olhager, 2003; Rudberg and Wikner, 2004
Customer order decoupling points
CODP
CODP
CODP
CODP
Engineer Fabrication Final
assembly Deliver
C u s t o m i z a t i o n
Value-added material flow
Make-to-Stock (MTS)
Assemble-to-Order (ATO)
Make-to-Order (MTO)
Engineer-to-Order (ETO)

17
Hoesktra and Romme (1992), Porter et al. (1999), Amaro et al. (1999), and
Olhager (2003) explored the ways of classifying these logistics structures in
conjunction with distinct decoupling point settings, as follows:
Make-to-Stock (MTS) – Standardized products are produced based on
demand forecasts and any customized product is manufactured. This
structure has the advantage of quick delivery items, but generates high
levels of stock, which is vulnerable to forecast demands more accurately.
In MTS the decoupling point is located at finished goods;
Assemble-to-Order (ATO) – This structure means in principle that all
materials are sourced and all component manufacturing is carried out
without connection to specific customer orders. In this case the decoupling
point is located at sub-assemblies within the assembly process.
Make-to-Order (MTO) – The final product is developed from contacts
with the customer and delivery times are usually long. The decoupling
point is located at purchased goods;
Engineer-to-Order (ETO) – This structure is an extension of MTO
strategy, since the design and engineering of the product is also custom
made (Rocha et al., 2005). But for this production system, the decoupling
point is located at the design stage, so each customer order penetrates at
the design phase of a product.
Shipbuilding, as focus of this study, is a typical ETO industry. This type of
supply chain structure basically starts upon a project sale, which is the point
marked by the CODP. At this stage the contract is signed and the detailed design
and production begin (Walter and Ries, 1996; Gosling and Naim, 2009).
2.3. Engineer-to-order
In the literature, different terms are often used to describe very similar
operation systems as ETO, such as one-of-a-kind (Hameri, 1997) and design-to-
order (Hicks et al., 2000). For that reason, this study searched for main definitions
around the ETO concept in order to build a clear description for this production
system.

18
Table 1 – Literature definitions and characteristics for ETO
Definition Authors
Customized production dimensions with the
decoupling point located at the design stage
Olhager, 2003; Lampel and Mintzberg,
1996; Rudberg and Wikner, 2004
The ETO supply chain is usually associated as large
and complex project environments Gosling and Naim, 2009
ETO supply chains offer customized products where
completely new designs are developed to order
Amaro et al., 1999; Rudberg and
Wikner, 2004;
ETO is a type of manufacturing process for highly
customized products which are required to be designed
and engineered in detail as customer’s orders
specification
Cho and Porter, 1986; Pandit and Y.
Zhu, 2007; Clark et al., 2007
Companies making ETO products are essentially
project (value stream) driven and are typically
involved in several concurrent projects at any one time.
Cameron and Braiden, 2004.
ETO companies are characterized by time-limited
projects related to the supply of complex equipment to
third parties, and this process often includes the
phases: design, manufacturing, installation, and
commissioning
Caron and Fiore, 1995
Offers a standard product range with the availability of
modifications and customizations Galbraith, 1973; Porter el al., 1999
Based on the findings observed in the literature in Table 1, ETO can be
associated to low-volumes, high degrees of customization, long lead times and
project-based process, which are in contrast to high-volume manufacturing. Also,
ETO has a typical large and complex project environments, where often includes
the phases of design, manufacturing, and commissioning.
According to Galbraith (1973) an ETO production is characterized as
project based and very customized, these main factors have a great influence on
19
the complexity of the production control and serious impact on lead-time duration.
Walter and Ries, (1996) and Hicks et al. (2000) states that in ETO industry, it is
common for key procurement and manufacturing activities to be associated with
long lead-time, where these activities take place before the design is finished. As a
result, production planning is constantly under changes during construction phases
causing delays and rework, as well with wrong purchases.
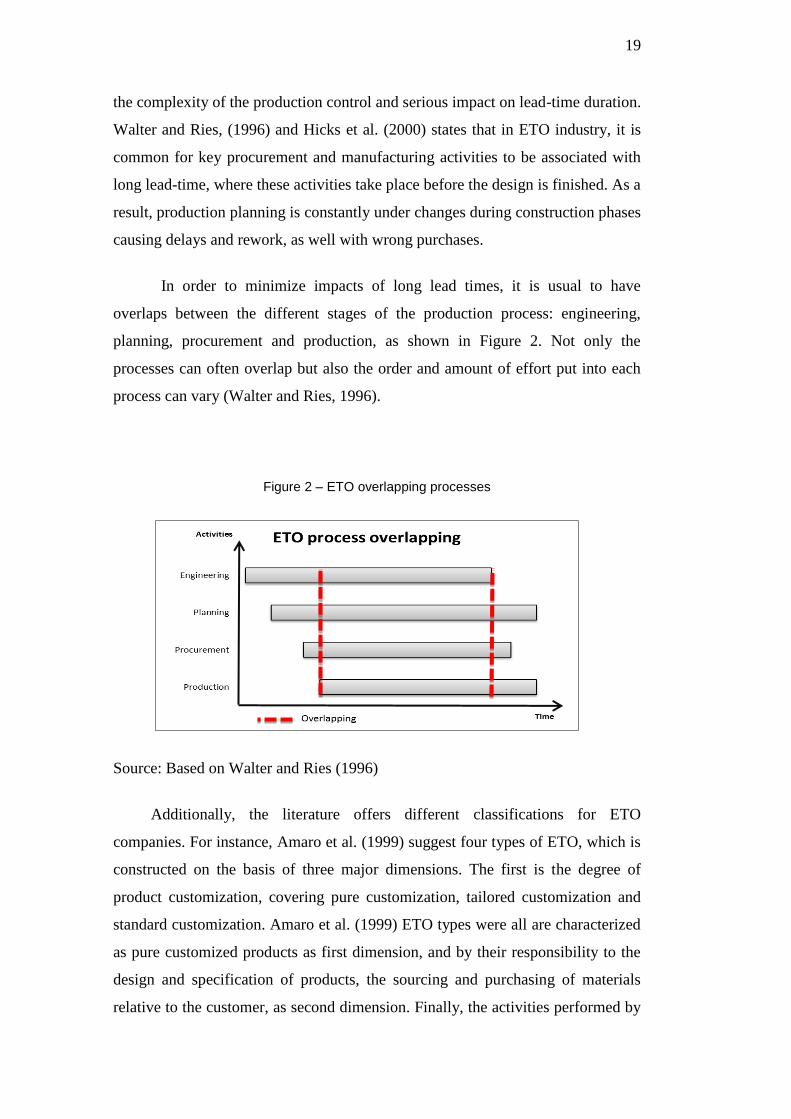
In order to minimize impacts of long lead times, it is usual to have
overlaps between the different stages of the production process: engineering,
planning, procurement and production, as shown in Figure 2. Not only the
processes can often overlap but also the order and amount of effort put into each
process can vary (Walter and Ries, 1996).
Figure 2 – ETO overlapping processes
Source: Based on Walter and Ries (1996)
Additionally, the literature offers different classifications for ETO
companies. For instance, Amaro et al. (1999) suggest four types of ETO, which is
constructed on the basis of three major dimensions. The first is the degree of
product customization, covering pure customization, tailored customization and
standard customization. Amaro et al. (1999) ETO types were all are characterized
as pure customized products as first dimension, and by their responsibility to the
design and specification of products, the sourcing and purchasing of materials
relative to the customer, as second dimension. Finally, the activities performed by

20
the company as assembly, processing (or fabrication), purchasing, specification
and design correspond to the third dimension. These three dimensions compose
the four types of ETO as demonstrated in Table 2.
Table 2 – Taxonomy for ETO companies
Classification ETO 1 ETO 2 ETO 3 ETO 4
Degree of customization:
Pure
Tailored - - - -
Standardized - - - -
None - - - -
Company responsibility for:
Design - - -
Specification - -
Purchasing -
Activities after receipt of order:
Delivery
Assembly
Processing
Purchasing -
Specification - -
Design - - -
Source: Based on Amaro et. Al (1999)
Hicks et al. (2001) also develop a typology of four ETO companies, in order
to explain how production processes are organized and examine the impact of
market changes on the configuration of production processes. His framework has
shown that ETO companies can be classified according to the level of vertical
integration, product complexity and the volume of production.
Hicks et al. (2000) conclude that the project concept and basic and
functional design are the non-physical processes, and considered as the core
capabilities for ETO companies.

3. Literature Review
This chapter offers a brief overview of the literature of SCRM regarding
key definitions for risks and SC risks, as for shipbuilding risks. This chapter also
describes the SCRM process and main techniques used in the literature.
3.1. Risk and SC Risk Sources
The term ‘risk’ is normally associated with uncertainty (Zsidisin, 2003;
Jüttner et al., 2003; Khan and Burnes, 2007). Knight (1921) made a simple
distinction between risk and uncertainty, defining risk as something measurable
and manageable that can be made of the probabilities of the outcomes, while
uncertainty is not quantifiable and the probabilities of the possible outcomes are
not known. According to Manuj and Mentzer (2008), risk can be defined as the
combination of probability of occurrence and the severity of an unwanted event.
However, Yates and Stone (1992) argue that every conception of risk implies that
there must be uncertainty about the prospective outcomes, and if the probability of
those outcomes is known, there is no risk. This research does intend to contribute
on the definition around risk and uncertainties, adopting the concept that risk is
both measurable and manageable.
Depending on the field of research, the term risk is expressed with a variety
of meanings, measurements, and interpretations (Wagner and Bode, 2006). At an
academic level, a growing body of research on risk has emerged from a number of
different fields, such as accounting, finance, economics, marketing, business,
supply chain (Zsidisin, 2003, Jüttner, 2005; Wagner and Bode, 2006). Regardless
of the area of interest, risk is always associated with an undesirable loss created by
an unwanted negative consequence and uncertainty. This study focused on SC
risks.
According to Christopher et al., (2004) Supply Chain risk has been defined
as “any risk to the information, material and product flow from original suppliers
to the delivery of the final product”.

22
Goh et al. (2007) classify SC risks based on their sources, differentiating
risks arising from the internal of the SC network from those created by the
external environments. In a similar definition, Kleindorfer and Saad (2005)
categorized SC risks into operations and disruptions risks. According to Tang
(2006), the operations risks are associated with uncertainties inherent in a SC,
which include demand, supply, and cost uncertainties. Quinn (2006) refers to
disruption risks caused by major natural and man-made disasters such as flood,
earthquake, tsunami, and major economic crisis. Both operations and disruption
risks could seriously disrupt and delay materials, information, and cash flow,
which in the end could damage sales, increase costs, or both (Chopra and Sodhi,
2004).
Zsidisin (2003), Christopher and Peck (2004), Manuj and Mentzer (2008),
suggest four categories of risk as supply, demand, operational, and security.
Similarly, Christopher and Lee (2004) identify process, control, demand, supply,
and environment as risk sources, while Chopra and Sodhi (2004) present nine risk
sources as disruptions, delays, systems, forecast, intellectual property,
procurement, receivables, inventory and capacity. Table 3 presents an illustrative
list of supply chain sources, compiled from the various studies in the literature.
Table 3 – Supply Chain risks
Risk Category Risk Source Reference
Demand Order fulfillment errors
Inaccurate forecasts
Chopra and Sodhi (2004);
Christopher and Peck (2004);
Quinn, (2006); Tummala and
Schoenherr (2011)
Delay
High capacity utilization at
supply source
Inflexibility of supply
source
Transportation breakdowns
Excessive Handling
Custom clearances
Chopra and Sodhi (2004);
Christopher and Lee (2004);
Kleindorfer and Saad, (2005)

23
Disruption
Natural disaster
Labor dispute/strike
Supplier bankruptcy
War and terrorism
Chopra and Sodhi, (2004);
Christopher and Lee (2004);
Christopher and Peck (2004)
Inventory
Rate of product
obsolescence
Inventory holding cost
Demand and supply
uncertainly
Chopra and Sodhi (2004);
Christopher and Lee, 2004;
Schoenherr et al., 2008
Procurement
Exchange rate risk
Percentage of a key
component or raw material
procured from a single
source
Industry wide capacity
utilization
Long-term versus short-
term contracts
Chopra and Sodhi, 2004;
Christopher and Lee, 2004;
Christopher and Peck, 2004;
Schoenherr et al., 2008
Project
Exceeding budget and
schedule plan
Project design versus
manufacturing capability
Jüttner, 2005; Lee et al., 2009
Quality
Product specification
Product standardization
maintaining quality
Zsidisin, 2003; Christopher and
Peck, 2004
Intellectual Property
Vertical integration of
supply chain
Global outsourcing and
markets
Christopher and Peck, 2004;
Manuj and Mentzer 2008
Sovereign
Regional instability
Communication difficulties
Government regulation
Christopher and Peck, 2004;
Manuj and Mentzer 2008

24
System
Information infrastructure
breakdown
System integration or
extensive systems
networking
E-commerce
Zsidisin, 2003; Christopher and
Peck, 2004; Kleindorfer and
Saad, 2005; Quinn, 2006;
Capacity Cost of capacity
Capacity flexibility
Zsidisin, 2003; Chopra and
Sodhi, 2004; Quinn, 2006;
Manuj and Mentzer 2008;
Tummala and Schoenherr 2011
As Goh et al. (2007) and Gilaninia et al. (2013) presented, risk sources can
be also extended to a view of internal or external risks. According to Kleindorfer
and Saad (2005), external supply chain holds environmental factors altering from
political reasons, economic, technological or geographical. In the other hand,
internal supply chain risk, as defined by Rice and Caniato (2003) is caused by
problems in organizational boundaries and internal SC network including
machinery or equipment failure, system breakdown, inventory issues and others.
Following this criteria, risk sources can be divided into internal or external
influences as below Figure 3.

25
Figure 3 – Internal or External Risk Sources
Source: Based on Goh et al. (2007); Gilaninia et al. (2013)
3.2. Supply Chain Risk Management (SCRM)
Risk management is in general described as the identification and analysis
of risks, as well as their monitoring and mitigation (Ceryno et al., 2014). A main
particularity of SCRM, contrary to traditional risk management, is that it is
characterized by a cross-company orientation aiming at the identification and
reduction of risks not only on the company level, but rather focusing on entire
supply chains (Juttner, 2005)
To survive in a risky business environment, it is imperative for companies to
have a proper SCRM. If poorly handled, disruptions in SC could result in costly
delays causing deficient service level and high costs (Hendricks and Singhal,
2003; Blackhurst et al., 2005). As stated by Norrman and Jansson (2004) and

26
Juttner (2005), the focus of SCRM is to understand, and try to avoid, the
devastating effects that disasters or even minor business disruptions can have in a
SC.
In the literature, the SCRM process is described in similar ways, which can
vary from risk identification and/or measurement, risk assessment and/or risk
evaluation to mitigation plans and control and/or monitoring (Hallikas et al.,
2002; Neiger et al., 2003; Jüttner et al. 2005; Kleindorfer and Saad 2005; Tse et
al., 2005; Cucchiella and Gastaldi, 2006; Ritchie and Brindley, 2007; Adhitya et
al., 2008; Knemeyer et al., 2009; Giannakis and Louis, 2011; Tummala and
Schoenherr, 2011; Kern et al., 2012; Ghadge et al., 2013; Ceryno et al., 2014;
Elleuch et al., 2014). Different systems have been put forward but most
approaches for SCRM process tend to follow the generic process shown in Figure
4.
Figure 4 – SCRM Process
Based on White (1995); Neiger et al. (2003); Jüttner et al. (2005); Kleindorfer and
Saad (2005); Knemeyer et al. (2009); Tse et al. (2005); Tummala and Schoenherr
(2011).

27
As seen in Figure 4, the literature essentially presents two main phases for
SCRM: Phase I, which corresponds the risk analysis from Risk Identification,
Risk Assessment, and Risk Evaluation; and Phase II, which involves risk control
from Risk Mitigation and Risk Monitoring.
Beginning with the first point of phase one is the risk identification, which
is considered as fundamental stage of the entire risk management process. This
involves a comprehensive and structured determination of potential SC risks
associated with the given problem. The main focus of supply chain risk
identification is to recognize SC uncertainties in order to enable an efficient risk
management (Hallikas et al., 2000; Norrman and Jansson, 2004; Kleindorfer and
Saad, 2005; Cucchiella and Gastaldi, 2006; Ritchie and Brindley, 2007; Pujawan
and Geraldin, 2009; Blome and Schoenherr, 2011; Kern et al., 2012; Ghadge et
al., 2013; Ceryno et al., 2014).
A large number of techniques exist for Risk Identification, such as
brainstorming and workshops (Harland et al., 2003; Oehnen et al., 2009; Elleuch
et al., 2014), Failure Checklists (Chase et al., 2006; Tummala and Schoenherr,
2011), survey and interviews (Shen et al, 2001; Hallikas et al., 2002; Hallikas et
al., 2004; Lee et al., 2007; Tuncel and Alpan 2010), Delphi groups (Ghadge et al.,
2013), Risk Mapping (Gardner and Cooper, 2003; Norrman and Jansson, 2004;
Pujawan and Geraldin, 2009; Tummala and Schoenherr, 2011), Value-Focused
Process Engineering (VFPE) (Neiger et al., 2007); KPI monitoring (Giannakis and
Louis, 2011) and various diagramming approaches such as Cause-Effect diagrams
(Tummala et al., 1994; Chase et al., 2006), Failure Tree Analysis (FTA) and
Event Tree Analysis (ETA) (Tummala and Schoenherr, 2011), Failure Mode And
Effect Analysis (FMEA) (McDermott et al., 1996; Karim et al., 2008; Tuncel and
Alpan 2010; Tummala and Schoenherr, 2011; Elleuch et al., 2014) and Influence
Diagrams (Chapman, 1997; Hollnagel, 2004).
According to Mojtahedi et al. (2008) there is not a ‘‘best method’’ for risk
identification. Shen et al. (2001), Hallikas et al. (2002), Chapman and Ward
(2003), Harland et al. (2003), Oehnen et al. (2009) suggest the directed-thinking
approach for identifying specific risks, which includes activities such as the

28
interviewing or surveying individuals or groups, brainstorming, and using
checklists.
Risk assessment is the second step for SCRM, which focuses on the
prioritization of the risks that will affect the vulnerability of the SC, as
consequence contributes with the selection process of suitable corrective
management actions for the identified risk in the Risk Identification phase
(Harland et al., 2003; Hallikas et al., 2004; Norrman and Jansson, 2004; Adhitya
et al., 2008; Oehnen et al., 2009; Giannakis and Louis, 2011; Blome and
Schoenherr, 2011; Tummala and Schoenherr, 2011; Elleuch et al., 2014). Many
authors define risk assessment as the determination of the likelihood of occurrence
and severity level for each risk identified (Hallikas et al., 2002; Hallikas et al.,
2002; Harland et al., 2003; Norrman and Jansson, 2004; Kleindorfer and Saad,
2005; Ritchie and Brindley, 2007; Adhitya et al., 2008; Manuj and Mentzer, 2008;
Oehnen et al., 2009; Tuncel and Alpan, 2010; Blome and Schoenherr, 2011;
Giannakis and Louis, 2011; Tummala and Schoenherr, 2011; Kern et al., 2012;
Ghadge et al., 2013).
When dealing with project environments, Ward (1999) suggested that risks
should be prioritized based on an assessment of a probability and severity matrix.
The specific combinations of probability and impact leads to a risk rating of
‘‘high,” ‘‘moderate,” or ‘‘low” and aims at selecting an adequate risk
management process for the rated risks. The results from a risk probability and
severity matrix also contribute for a risk profile picturing.
As noted on risk identification, the literature also offers many tools for risk
assessment. Assessing risks into a probability and severity matrix are largely
adopted, as seen in methods by Deloach (2000), Hallikas et al. (2004), Norrman
and Jansson (2004), Thun and Hoenig (2009) and Dey (2010). These authors also
referred to this method as risk map/matrix assessment.
Last stage for phase I of SCRM process is the Risk Evaluation. According
to Tummala and Schoenherr (2011), Risk Evaluation includes two sub-steps of
risk ranking and risk acceptance. Common definition for risk ranking is the
expression of probability x severity (The Royal Society, 1992; Deloach, 2000;

29
Wittmann, 2000; Shen et al. 2001; Tummala and Mak, 2001; Wang and Liu 2004;
Zhou et al., 2007; Thun and Hoenig, 2009; Dey, 2010; Tummala and Schoenherr,
2011). Risk ranking determine the risk exposure level for each one identified and
assessed (Tummala and Schoenherr, 2011). In order to construct a risk map/matrix
it is preceded a risk ranking process (Deloach, 2000; Wittmann, 2000; Hallikas et
al., 2004; Norrman and Jansson, 2004; Thun and Hoenig, 2009; Dey, 2010). Once
the SC risks are classified, acceptable levels of risk must be established, which is
performed in the risk acceptance step.
Finally, phase II of SCRM process is based on the risk mitigation plan and
control (Figure 8). Tummala and Schoenherr (2011) indicated that risk mitigation
involves the development of risk response action plans to contain and treat risks
(risk planning), while risk control and monitoring consists on examining of the
progress made regarding the implemented risk treatment strategies and corrective
actions that can be taken if deviations occur in achieving the desired SC
performance (Norrman and Jansson, 2004; Oehnen et al., 2009; Tummala and
Schoenherr, 2011; Kern et al., 2012).
3.3. Shipbuilding risks
The literature presents a lack of empirical research in the shipbuilding
industry (Mentzer et al., 2001; Lee et al., 2007; Arica and Alfnes, 2012;
Gunasekaran, and Spalanzani, 2012). However, for risk assessments there are
some studies carried out, englobing mathematical modeling and statistical
approaches to cost and schedule, as well as simulation methods, among others.
As for statistical approach, Both Lee et al. (2009) and Basuki et al. (2010)
identify risks in shipbuilding using a Bayesian network. A Bayesian belief
network, also called a causal network or belief network, is a powerful tool for
knowledge representation and reasoning under conditions of uncertainty (Cheng et
al., 2002), and visually presents the probabilistic relationships among a set of
variables (Heckerman, 1997). Although the Bayesian belief network has many
advantages, one of this method drawback is to require continuous variables to be
discretized (Uusitalo, 2007). In an analysis including continuous variables, the
need to be transformed to discretize variables could bring to information loss.

30
Basuki et al. (2010) used the Bayesian network with the assistance of a
probabilistic Value At Risk (VaR) in order to analyze every node of the model.
Overall, the major risks identified in both studies were design change, raw
material supply and production risks related to hull construction process, as with
highest probability of causing project delays.
Duffey and Van Dorp (1999) analyze risk for the design and contracting
stages of large engineering projects using a Monte Carlo simulation. In this
method, the risk analysis integrate schedule and cost information using activity
networks and simulation iterations with Monte Carlo approach to quantify the
uncertainty in the project as costs. During design stages main risks were
identified, such as: determining firm fixed-price bids, complex make-or-buy
subcontracting decisions, evaluation of different production process design
alternatives, and others. Other related risk issues observed by Duffey and Van
Dorp (1999) are engineering change orders and rework. The Monte Carlo
methodology has some limitation in regards to the activity network used. In this
methodology, the activity network has a deterministic structure, which presumes
that all activities in the network will performed one time only during the project.
This can be more questionable for highly concurrent processes that include both
product and process design innovations.
Floriano et al. (2010) developed a process for identification and analyses
of risks in the Brazilian shipbuilding industry environment through methods of
brainstorming and Delphi. His work included the participation of experts from
various segments of the shipping industry, members of classification societies,
yards, shipowners and scholars from the area of education and research. He
presented an Analytical Risk Framework (ARF) for the project divided into seven
levels: External factors, Funding, Procurement, Planning, Design, Construction
and Marketing. The Construction item was further subdivided into three
sublevels: Technology, Infrastructure and Human resources. In this way, the risks
were classified into these categories and also evaluated according to the
probability of occurrence and the severity of impact on the project schedule and
budget. As a result, each risk was rated according to their level of criticality for
each construction phase. Queiroz (2012) also used the method of Analytical Risk

31
Framework (ARF) in order to identify the risks associated with naval
construction. However, his study is a comparative analysis of project risks
shipbuilding in Brazil, from the point of view of shipowners and as financial
institutions. As a result, it presents a risk rating-yard based on credit rating
evaluation, which is organized hierarchically according to AHP method.
Goldberg et al. (2010) proposed a methodology that qualitatively assesses
the main risks as to the probability and severity, and rank by relevance. These
risks are classified in three classes (demand, country and project), and subclasses,
shown in Figure 5.
Figure 5 – Shipbuilding risks types
Source: Goldberg et al. (2010)
Lee et al (2007) analyzed the critical risks in the Korean shipbuilding industry,
identifying and evaluating them according to their relationships with phases of
construction. He conducted a survey of 248 respondents from 10 major Korean
shipbuilders and presented a list of 26 risks, as follows:
1. Typhoon, flood, earthquake and other uncontrollable events happen.
2. Regulations against shipbuilders tighten or are amended
3. Classification’s rules change and influence shipbuilders.
4. Incendiary fire or burglaries occur.
5. There is difficulty in supply of raw materials.
6. Labor costs rise and cause problems.
7. There is difficulty in meeting labor demands for production.

32
8. There is difficulty in supplying production equipment.
9. Unexpected changes in inflation occur.
10. New taxes or big changes in tax rates occur.
11. Unexpected changes in exchange rates occur.
12. Unexpected changes in interest rates occur.
13. Changes in company credit ratings occur.
14. Refund guarantee, operating costs, and other difficulties in capital
funding.
15. Unexpected difficulties in cash flow occur.
16. There are shortages in design manpower.
17. Changes in design occur.
18. Introduction of new technologies incur new risks.
19. Failures in production equipment occur.
20. Instances arise where specifications of the contract cannot be met.
21. Productivity does not improve.
22. Problems in quality management arise.
23. Problems arise due to strikes at headquarters.
24. Problems arise due to strikes at subcontractors.
25. Time schedule is exceeded and does not go according to plan.
26. Budget is exceeded and does not go according to plan.
Lee et al. (2007) presented each phase of construction with the main risks
associated: At the beginning stage of shipbuilding design and financial risks were
related while during the steel manufacture and block assembly, important risk
factors were management of production equipment, supply of raw materials and
labor, and quality management. During a more advance stage of production, risks
such as changes in design and managerial risks such as exceeding time and budget
limits proved to be important. Finally, according to Lee et al. (2007) at the project
finalization, phase risks were exchange rates, interest rates, timeline, fulfilling
specifications, and natural disasters.
Lee et al. (2007) have an important overview of the risks in shipbuilding,
which study was a result from an extensive survey in the Korean Shipbuilding. As
for the purpose of this study, Lee et al. (2007) 26 listed risks was applied as an

33
initial step to identify and assess the risks in the Brazilian shipbuilding. As will be
reviewed in the methodology section, the 26 risks were first assessed through a
survey approach with main shipbuilders in Brazil.

4. Shipbuilding overview
This section brings an overlook on the shipbuilding from different aspects,
starting with a general introduction to the industry, its main actors, the main
macro process and activity costs, and finally a global market overview. The main
goal is to analyze the relationship of shipbuilding supply chain from its main
actors and processes as well as to understand uncertainties and the behavior of this
activity in a global market scale.
4.1. Shipbuilding industry
The shipbuilding industry is basically surrounded by two types of other
industries: front industries, which include maritime transportation and supply
service, fishery and defense; and backward industries, which include machinery,
electronic parts, steel and other general marine supply, as shown in Figure 6
(Queiroz, 2009; Moura 2008).
Figure 6 – Shipbuilding industry links
Source: Based on Coutinho (2006) and Moura et al. (2007)
Shipbuilding itself is composed of construction, repair and vessel’s
scrapping, which all obtain the primary demand from the Front industry. This
General
Marine parts suppliers
Steel industry
Machinery
Front industry
Backward industry
Electronic
parts

35
study is focused on construction activity only, which corresponds of almost 90%
of the Brazilian shipbuilding activity (Faverin et al., 2009).
On the other hand, the backward industry is there to supply the shipyards
and provide distinctive sorts of materials, from steel plates to small parts such as
nut and bolts, to complex machinery and electrical parts. The backward industry is
intrinsically connected to the success of the shipbuilding business (Moura et al.,
2007).
Based on Olhager (2010), it is also important to investigate the role of the
CODP on different industries around the shipbuilding. As observed in section 2.2,
the CODP has a key role in developing and managing value chain for upstream
and downstream the CODP. For firms where there is only one type of decoupling
situation, it applies a single approach for the value chain. Basically, the steel
industry follows a MTS structure, which maintain a mass production strategy and
keeps an inventory in the distribution system. However, most firms tend to have a
mix of MTO and MTS products, based on demand volume and variability, as
observed in machinery and electronic parts suppliers. Finally, in ATO situations
the two types of approaches need to be applied to different parts of the value chain
for a single product line. This is the case for general marine part suppliers.
The important issue is to fit the approach to the task of each material flow –
both upstream and downstream the CODP. This is seen as a challenge for an ETO
that shares many different production strategies as observed in shipbuilding
industry, and ultimately is focused on flexibility and lead time reduction (Olhager,
2010).
Nevertheless, the stability of both Front and Backward industries directly
affects the shipyards. For example, a disruptive event can take the form of price
increases in material parts and equipment from the suppliers, likewise the fall of
shipbuilding demand that can dramatically reduce new ship orders. In any of these
situations, a serious consequence for the business continuity of the shipyards and
the entire shipbuilding industry is on alert (Moura et al., 2007; Queiroz, 2009).
Therefore, it seems a great concern to observe the economic scenario and potential
risks when studying shipbuilding, further examined in section 4.5.
36
4.2. Shipbuilding main actors
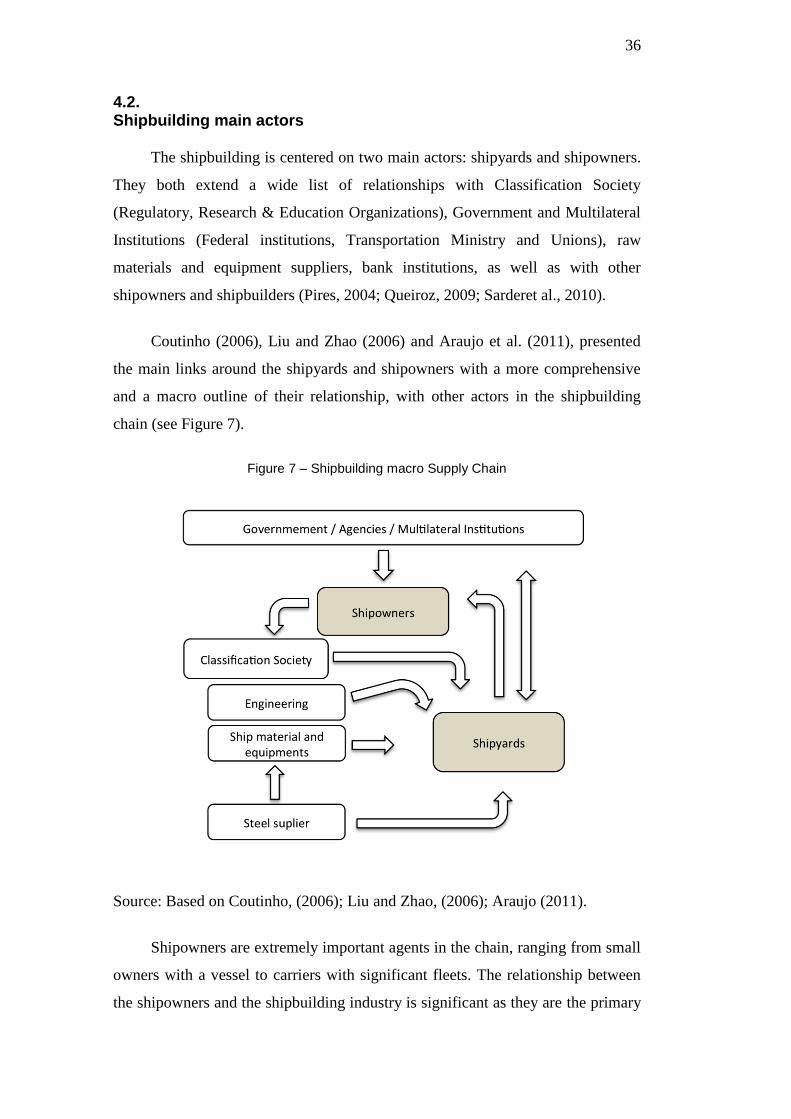
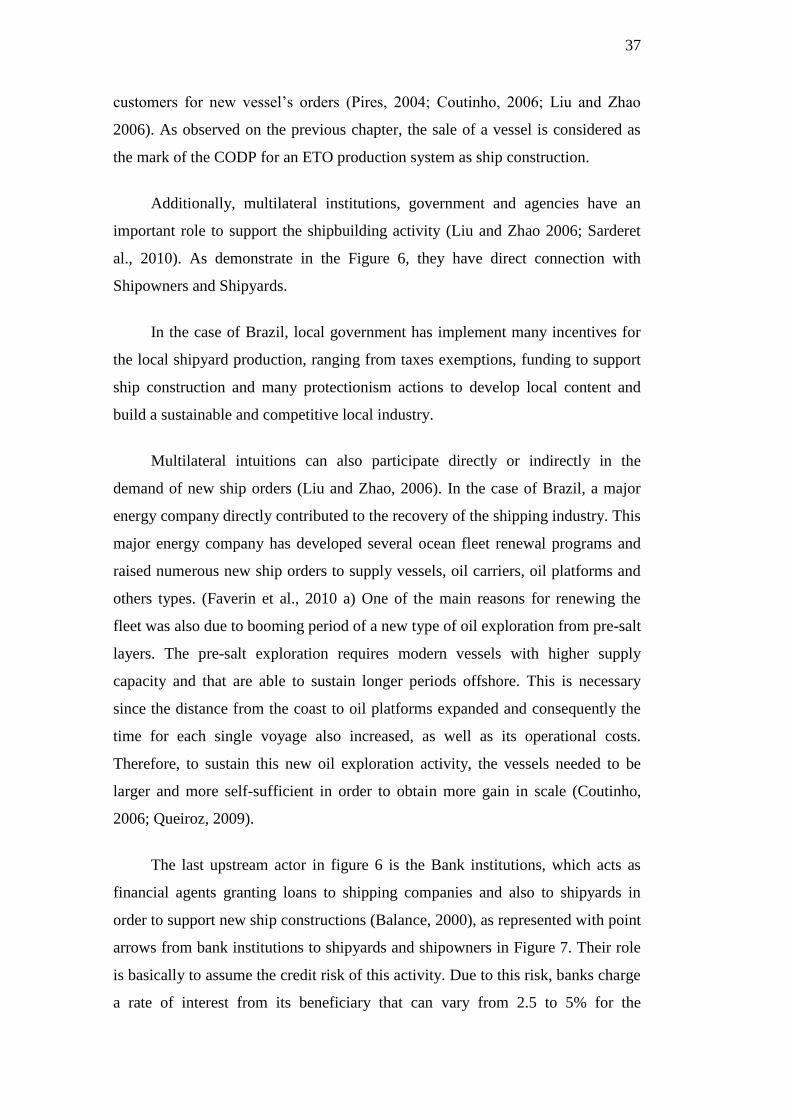
The shipbuilding is centered on two main actors: shipyards and shipowners.
They both extend a wide list of relationships with Classification Society
(Regulatory, Research & Education Organizations), Government and Multilateral
Institutions (Federal institutions, Transportation Ministry and Unions), raw
materials and equipment suppliers, bank institutions, as well as with other
shipowners and shipbuilders (Pires, 2004; Queiroz, 2009; Sarderet al., 2010).
Coutinho (2006), Liu and Zhao (2006) and Araujo et al. (2011), presented
the main links around the shipyards and shipowners with a more comprehensive
and a macro outline of their relationship, with other actors in the shipbuilding
chain (see Figure 7).
Figure 7 – Shipbuilding macro Supply Chain
Source: Based on Coutinho, (2006); Liu and Zhao, (2006); Araujo (2011).
Shipowners are extremely important agents in the chain, ranging from small
owners with a vessel to carriers with significant fleets. The relationship between
the shipowners and the shipbuilding industry is significant as they are the primary
37
customers for new vessel’s orders (Pires, 2004; Coutinho, 2006; Liu and Zhao
2006). As observed on the previous chapter, the sale of a vessel is considered as
the mark of the CODP for an ETO production system as ship construction.
Additionally, multilateral institutions, government and agencies have an
important role to support the shipbuilding activity (Liu and Zhao 2006; Sarderet
al., 2010). As demonstrate in the Figure 6, they have direct connection with
Shipowners and Shipyards.
In the case of Brazil, local government has implement many incentives for
the local shipyard production, ranging from taxes exemptions, funding to support
ship construction and many protectionism actions to develop local content and
build a sustainable and competitive local industry.
Multilateral intuitions can also participate directly or indirectly in the
demand of new ship orders (Liu and Zhao, 2006). In the case of Brazil, a major
energy company directly contributed to the recovery of the shipping industry. This
major energy company has developed several ocean fleet renewal programs and
raised numerous new ship orders to supply vessels, oil carriers, oil platforms and
others types. (Faverin et al., 2010 a) One of the main reasons for renewing the
fleet was also due to booming period of a new type of oil exploration from pre-salt
layers. The pre-salt exploration requires modern vessels with higher supply
capacity and that are able to sustain longer periods offshore. This is necessary
since the distance from the coast to oil platforms expanded and consequently the
time for each single voyage also increased, as well as its operational costs.
Therefore, to sustain this new oil exploration activity, the vessels needed to be
larger and more self-sufficient in order to obtain more gain in scale (Coutinho,
2006; Queiroz, 2009).
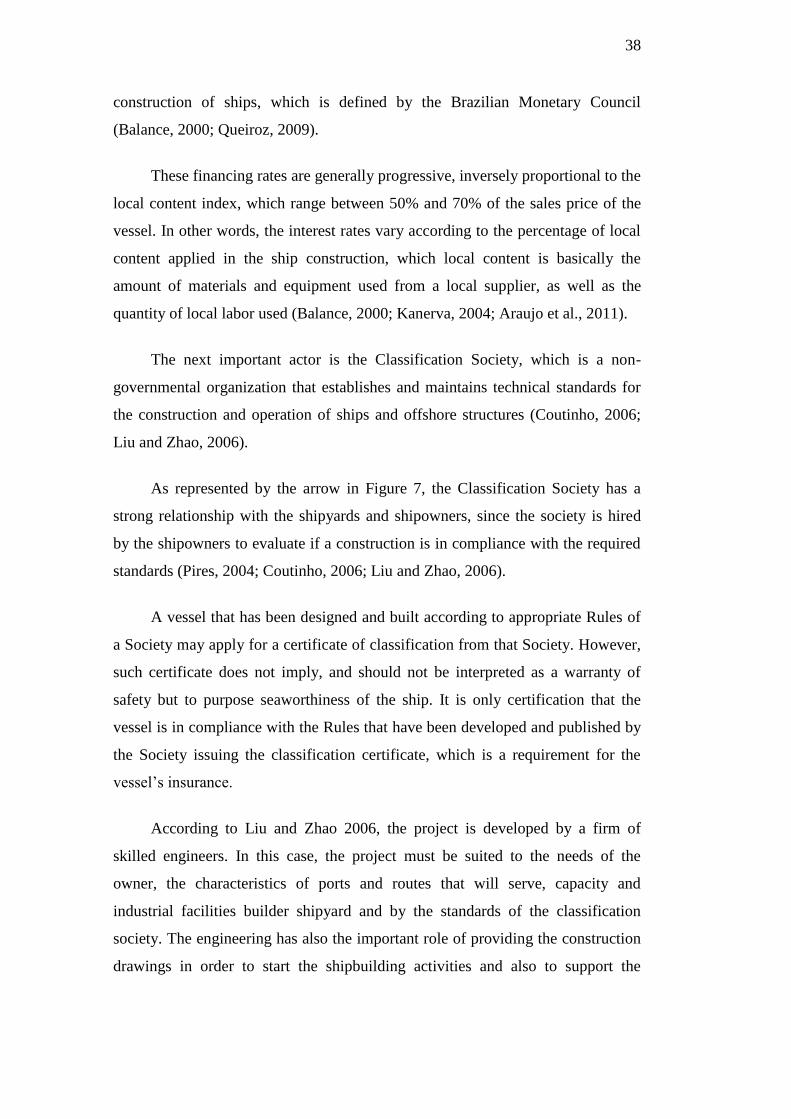
The last upstream actor in figure 6 is the Bank institutions, which acts as
financial agents granting loans to shipping companies and also to shipyards in
order to support new ship constructions (Balance, 2000), as represented with point
arrows from bank institutions to shipyards and shipowners in Figure 7. Their role
is basically to assume the credit risk of this activity. Due to this risk, banks charge
a rate of interest from its beneficiary that can vary from 2.5 to 5% for the
38
construction of ships, which is defined by the Brazilian Monetary Council
(Balance, 2000; Queiroz, 2009).
These financing rates are generally progressive, inversely proportional to the
local content index, which range between 50% and 70% of the sales price of the
vessel. In other words, the interest rates vary according to the percentage of local
content applied in the ship construction, which local content is basically the
amount of materials and equipment used from a local supplier, as well as the
quantity of local labor used (Balance, 2000; Kanerva, 2004; Araujo et al., 2011).
The next important actor is the Classification Society, which is a non-
governmental organization that establishes and maintains technical standards for
the construction and operation of ships and offshore structures (Coutinho, 2006;
Liu and Zhao, 2006).
As represented by the arrow in Figure 7, the Classification Society has a
strong relationship with the shipyards and shipowners, since the society is hired
by the shipowners to evaluate if a construction is in compliance with the required
standards (Pires, 2004; Coutinho, 2006; Liu and Zhao, 2006).
A vessel that has been designed and built according to appropriate Rules of
a Society may apply for a certificate of classification from that Society. However,
such certificate does not imply, and should not be interpreted as a warranty of
safety but to purpose seaworthiness of the ship. It is only certification that the
vessel is in compliance with the Rules that have been developed and published by
the Society issuing the classification certificate, which is a requirement for the
vessel’s insurance.
According to Liu and Zhao 2006, the project is developed by a firm of
skilled engineers. In this case, the project must be suited to the needs of the
owner, the characteristics of ports and routes that will serve, capacity and
industrial facilities builder shipyard and by the standards of the classification
society. The engineering has also the important role of providing the construction
drawings in order to start the shipbuilding activities and also to support the

39
specifications for material and equipment to be purchased, which has to follow the
production schedule.
Furthermore, there is the steel industry at the bottom of Figure 7, directly
supporting the shipyards with steel plates for hull construction, and directly
supporting the backward industry with raw materials for ship parts and equipment.
Noteworthy, the existence of a developed steel industry substantiates important
competitive advantage for a national shipbuilding industry (Pires, 2004; Coutinho,
2006).
As will be explored in the next section, the steel plates used for the hull
constructions are responsible for a significant portion of the costs of building a
ship. In that case, steel producers have great bargain in the supply chain and upon
shipyards (Faverin et al., 2010 a; Queiroz, 2009).
4.3. Shipbuilding macro processes
Shipbuilding can be divided into two macro processes: Design and Hull
Production and Outfitting (Montes, 1993; Lamb, 2003; Favarin, el al., 2010 b;
Tancredi et al., 2012). These macro processes are segmented into sub-processes,
from the concept of development and contract, to commissioning and delivery, as
displayed in Figure 8.
Figure 8 – Shipbuilding processes overview
Source: Montes (1993); Lamb (2003); Favarin et al. (2010 b); Tancredi et al.
(2012)

40
The first phase of the design begins with conceptual development, where the
designers and engineers start defining the shape and dimensions of the vessel, as
well as its specifications. After modeling the theoretical design, the ship model is
tested in a proof tank, being submitted to a variety of conditions that can attest its
seaworthiness. The key objective of the concept development is to ensure the
feasibility of the project (Fleischer et al., 1999).
One of the main products of the concept development is the General
Arrangement that shows, in a determined scale, the drawing showing the inside of
a ship and where the main elements are placed. Also in this stage, a document
describing the specifications of construction (Build Specification) is provided,
which outlines the standards for workmanship and mentions the overall
requirements for the functionality of the vessel. Usually the Build Specification
includes a Maker’s list, and a list of suppliers qualified to provide each type of
equipment to be followed by the contract of construction (Favarin et al., 2010 b).
After the ship concept is approved, the project of construction can be now
ordered to shipyards, and this stage the basic design process initiate. All of the
drawings from the design are subjected to a class approval with a classification
society. The last stage of the design macro process starts now to overlap to other
process.
Commencing now the macro process of Hull production and outfitting, it
begins with the procurement process by purchases of structural steel, marine parts
such as motors, cranes, caps basement, propellers, navigation equipment etc.
Ultimately, this is also when it triggers the start of the detailed engineering.
The hull production takes place by cutting steel plates and assembling vessel
hull blocks. This is also referred as the structural part of the vessel and often
represents the higher production cost of the shipyard, since this process is the
most time consuming, compared to other processes (Tancredi el al., 2012; Eyres,
2007; Lamb, 2003; Favarin et al., 2010 b; Montes 1993).
Defined also as part of the production, the outfitting phase represents the
phase where the vessel is equipped with propulsion, support materials such as

41
plumbing, electrical installations and etc. In some cases, the hull production and
outfitting may also occur simultaneously during the phase of construction (Walter
and Ries, 1996).
Finally, at the end of the production process the vessel is submitted to the
commission step. Through commissioning, the vessel is assured that all systems
and components installed of the vessel are tested according to the construction
specification established on the design stage. After approved by commissioning,
the vessel is now ready for delivery to the shipowners.
4.4. Shipbuilding activity costs
According to Sarderet al. (2010), the start of a ship construction activity is
characterized by being a high capital-intensive activity. As shipyards require
gigantic facilities such as dorks, goliaths, and cranes, as well as workshops and
complex structures for assembling hull part, it is clear that a hefty initial
investment is required. This is also shown by the high amount of capital disbursed
for the early stages of ship construction to cover the purchase for raw materials
(mainly steel plates) and heavy machinery.
The vessel, in general, is considered a product of high value (final price).
Depending on the size of the ship by its deadweight tonnage (DWT), the final
product may have approximately 300,000 pieces of 2,000 different types (Lamb,
2003; Eyres, 2007).
In this way, the procurement cost is the largest part of the total expenses,
which can represent 80% of the total costs. It has a huge direct impact on the cost
and quality of production activities. Therefore, the construction activity expenses
involve mainly man-hour expenses and special production expenses (Balance,
2000; Favarin et al., 2006 b; Coutinho, 2006; Queiroz, 2009).

42
Figure 9 – Shipbuilding macro expenses
Source: Based on Kanerva (2004); Favarin et al. (2010 b)
As displayed on Figure 9 above, the division for the costs of shipbuilding,
are basically: steel, marine parts and workforce (Balance, 2000; Ferraz et al.,
2002; Kanerva, 2004; Coutinho, 2006; Queiroz, 2009; Favarin, 2010 b).
4.5. Shipbuilding global market overlook
As mentioned on previous chapter, shipbuilding industries have a direct
relationship with the Front and Backward industries. Overall, they are affected by
the global demand and economic activity. Basically, whenever the economy is
heated, international trade intensifies and ocean freight rises. This can result in a
positive trend to many industries, as well as to shipbuilding, that can have an
increase in new ship orders in a short time (Stopford, 2005).
However there are many uncertainties that circle around the global market.
For shipbuilding industry in particular, there is a typical lag between the actual
contract and the delivery of the vessel, which can take 2 to 5 years. In this case,
the freight market is absorbed and amplified by the shipbuilding industry, causing
a similar “bull whip effect”, as in reference to the effect observed in Supply
Chains (Liu and Zhao, 2006). Basically, the present demand for a new ship order
Machinery and equipments 55% to 60%
Commodities Steel
15% to 20%
Shipyard production
15%

43
can generate great expectations, in the way that the market will follow the
growing demand for the next few years. Conversely, this can create an
environment of uncertainty and a tendency to overcapacity, meaning that by the
time the order is attended the market may not be as good as expected.
Additionally, large improvements in the productivity of the shipyards, over
investments in addition to many governmental benefices to this industry can also
contribute to this overcapacity by facilitating the ship construction in large scale
(Fleisher et al., 1999; Colin and Pinto 2006; Pires Jr. et al, 2007; Paraschiv and
Albescu, 2008).
Today, the shipbuilding market worldwide is already suffering from a
significant excess capacity. The present ship production shows that Asian
countries such as Japan, South Korea and China, was expanded forcefully before
the economic crisis by the end of 2008 – for instance, in only a few years, China
rose to the largest shipbuilding nation in the world, which account for about 79%
of world production, more than 3,400 vessels in 2014 (as showed in Table 3).
Other countries in Europe have lost its market share for the booming of maritime
industries in the Far Eastern countries, as well as for Brazil, showing a very timid
participation representing only 0.4% of the world ship’s orders (Colin and Pinto
2006; Pires Jr. et al, 2007).
Table 4 – World’s new ship orders book
Year World Brazil Brazil Share USA USA Share Europe Europe Share China Korea Japan Asia Share
1996 1948 10 0.5% 56 2.9% 329 16.9% 172 316 546 62.3%
1997 2113 4 0.2% 66 3.1% 279 13.2% 249 295 636 65.5%
1998 2251 5 0.2% 135 6.0% 265 11.8% 237 302 683 62.5%
1999 2044 5 0.2% 113 5.5% 251 12.3% 205 305 561 60.6%
2000 1885 5 0.3% 74 3.9% 226 12.0% 242 357 524 66.0%
2001 2182 4 0.2% 73 3.3% 238 10.9% 284 513 558 69.1%
2002 2239 13 0.6% 96 4.3% 217 9.7% 340 479 542 67.4%
2003 2342 17 0.7% 105 4.5% 181 7.7% 382 484 642 69.6%
2004 3288 25 0.8% 80 2.4% 201 6.1% 615 785 960 76.0%
2005 4306 23 0.5% 64 1.5% 253 5.9% 938 1014 1127 75.1%
2006 5521 26 0.5% 85 1.5% 336 6.1% 1366 1123 1309 73.5%
2007 7558 35 0.5% 145 1.9% 349 4.6% 2339 1456 1557 74.3%
2008 10557 60 0.6% 174 1.6% 363 3.4% 3847 2211 1834 77.1%
2009 11074 75 0.7% 143 1.3% 339 3.1% 4330 2292 1886 78.7%
2010 9198 74 0.8% 83 0.9% 258 2.8% 3862 1826 1517 79.8%
2011 8447 102 1.2% 69 0.8% 206 2.4% 3825 1543 1324 80.0%
2012 6785 135 2.0% 90 1.3% 194 2.9% 3023 1152 1045 77.8%
2013 5113 162 3.2% 111 2.2% 116 2.3% 2101 839 837 74.8%
2014 5535 148 2.7% 123 2.2% 85 1.5% 2441 926 989 79.4%
Source: Clarkson’s Shipping Intelligence (2014)

44
As demonstrated into Figure 10, the excess of capacity is observed after the
economic crises of 2008, which also dramatically decreased new ship orders. The
Figure 7 shows the described delay on the industry from the time that the
economic crises hit the market and the time that the demand has dropped. It was
only in mid 2009 that ship orders started to plunge. In 2013, four years later, total
ship orders had dramatically fallen to about 5,000, less than half the 2009 total of
about 11,000 ship orders (Faverin et al., 2009; Queiroz, 2009).
Figure 10 – World’s new ship orders
Source: Clarkson’s Shipping Intelligence (2014)
Overall, an imbalance between supply and demand in shipbuilding has also
affected shipping markets since so much new tonnage is entering the market.
Although the demand for shipping services has been growing after the economic
downturn, the fleet oversupply is still overrunning the cargo growth and the future
demand ship’s orders remains uncertain.

5. Research design and methodology
The research method adopted was based on a survey approach. A survey
was conducted in order to identify and examine risks in shipbuilding supply chain,
considering the Brazilian industry. The choice for the Brazilian shipbuilding
industry was motivated by the fact that there are few studies regarding risk
management in literature. The lack of empirical research became even more
crucial since this industry has experienced a long period of stagnation (Kanerva,
2004; Colin and Pinto, 2006; Queiroz, 2012). This necessity of empirical evidence
offers a great opportunity for research in SCRM in shipbuilding as well as a great
interest in risk profile in this industry for both practitioners and academics.
The survey method was based on three Rounds, in order to cover all steps of
the first phase of the SCRM process, which this study is focused on. The last
Round of the survey took place to discuss and analyze the results with the
respondents. These processes are represented in figure 11.
Figure 11 – Methodology summary
In Risk Identification and Assessment step, the Round 1 and 2 consisted on
the identification of (i) the main risks presented in the Brazilian shipbuilding
industry (ii) the likelihood of occurrence (iii) their severity and finally (iv) phase
of construction that is associated. These phases were based on Lee et al. (2007),
where Phase I of construction is described from contract phase until the steel
processing; Phase II of construction is defined by the production period of
assembly steel blocks and blocks building into the slipway area; Phase III of
construction represents the launching phase of the vessel on the water until
advanced outfitting completion; and finally, Phase IV is from commissioning
process until delivery
46
As observed in Chapter 3, assessing risks by their likelihood and severity is a
common method in the literature (The Royal Society, 1992; Deloach, 2000;
Thummala and Mak, 2001; Wand and Liu, 2004; Hallikas et al., 2004; Norrman
and Jansson, 2004). This also initiates the data treatment step for the Risk
Evaluation process. In the first Round, the identification step started from a list
based on the 26 risks offered by Lee et al. (2007), recognized in the South Korean
Shipbuilding industry. The likelihood of their occurrence and their severity were
associated to a three point scale offered in Shen et al. (2001), “highly likely”,
“likely”, “less likely” for likelihood and “high magnitude”, “medium magnitude”
and “low magnitude” for severity. Round 1 also offered a space to include
additional risks that were not included in Lee et al. (2007), but could be
representative to the Brazilian Industry. Additional four risks were obtained as the
scope of Round 2. This new Round aimed to identify the likelihood of occurrence
of these new risks and their severity using the same three point scale from Round
1. Finally, Round 3 consisted in recognizing the main sources and impacts for the
top listed risks, as well for mitigation plan adopted or actions required for
controlling them. The respondents in Round 3 could also state any complementary
opinion or comment for the result presented by Round 1 and 2. Appendix 1
presents the questionnaire used for Round 1, while Appendix 2 presents the one
used for Round 3.
The Brazilian shipbuilding industry counts with 32 shipyards (Sinaval, 2014).
The shipyards in this survey were selected according to their steel processing
capacity per year, a common measurement indicator for this industry. This
research included the major shipbuilders considering their steel processing
capacity. Nineteen shipyards were chosen covering around 91% of the total of
steel processing capacity in Brazil.
Executives from the selected shipyards were then reached directly once a
contact already existed, and indirectly by a common connection, when there were
no direct contact. The executives were asked to appoint one expert in their
shipyard, considered in his point of view, as a good respondent for the survey.
This approach assisted the selection of the appropriate respondent(s) from the
company to take part of the survey. Twenty-two respondents from seventeen

47
shipyards responded to Round 1 of the survey. The survey obtained a valid
response rate of almost 73%, which is very assertive according to Moser and
Kalton (1971). Together, these 17 shipyards covered 85% of the total of steel
processing capacity in Brazil, what results in a representative sample of the
industry for the research.
Based on Shen et al. (2001) Wang and Liu (2004) and Zou et al. (2007) the
three point scale used in Rounds 1 and 2 was associated to numerical values,
where “highly likely” and “high magnitude” corresponded to a value of 1, “likely”
and “medium magnitude” corresponded to 0.5 and “less likely” or low
magnitude” corresponded to 0.1. Following the Risk Evaluation process, the data
gathered was also treated by removing outliers.
There has been much debate in the literature regarding what to do with
extreme or influential data points. Outliers can arise from several different
mechanisms or causes. Anscombe (1960) sorts outliers into two major categories:
those arising from errors in the data, and those arising from the inherent
variability of the data. According to Osborne and Overbay (2004), outliers are
often caused by human error or different assumptions from the rest of the sample
population. Although some authors argue that removal of extreme scores
produces undesirable outcomes, they are in the minority, especially when the
outliers are illegitimate. Orr et al. (1991) states that the dataset are suspected of
being legitimate and more likely to be representative of the population as a whole
if outliers are not removed. Conceptually, there are strong arguments for removal
or alteration of outliers. As Osborne and Overbay (2004) empirically have
demonstrated the benefits of outlier removal, this study have proceeded with this
data treatment.
The most common method is the identification and removal of outlier using
the mean plus or minus three Standard Deviation (SD) (Miller, 1991; Howell,
1998; McClelland, 2000; Leys et al. 2012). However, three problems can be
identified when using Standard Deviation method. First, it assumes that the
distribution is normal (outliers included); Second, standard deviation is strongly
impacted by outliers; and third, this method is very unlikely to detect outliers in
small samples (Miller, 1991; Cousineau and Chartier 2010; Leys et al. 2012). An

48
alternative method, which is totally immune to the sample size, is based on the
absolute deviation from the median, referred as MAD (median absolute
deviation). This method was proposed by Hampel (1974) and popularized as
Hampel’s test, which is considered one of the basic robust statistical techniques.
In this method, the median (M) is, like the mean, a measure of central tendency
but offers the advantage of being very insensitive to the presence of outliers. In
this general form, the central point can be the mean, median mode or the result of
another measure of central tendency (Huber, 1981; Rousseeuw and Croux, 1993;
Leys et al., 2011).
Considering the characteristics of the data set of this study, the method MAD
using the mean as central tendency was selected as a technique to identify and
remove outliers. In this case, the MAD can be calculated by the following
equation (1):
(1)
Where = total number of observations; = ordinal number of the
observation; = is the original n observation; and = is the mean of the
series.
The approach to the MAD method is similar to the SD when calculating the
intervals of the outliers. According to Miller (1991) the values for plus or minus
MAD depends on the research criteria. The values can range from 3 (very
conservative), 2.5 (moderately conservative) or even 2 (less conservative). The
MAD method can be described as below eq (2).
3 MAD method:
2.5 MAD method:
2 MAD method: (2)
Where Central tendency (median, mean or mode)
For this study, the method of 2 MAD was selected due to the small variance of
the data set (3 point scale from 0.1, 0.5 or 1).

49
After removing outliers, a clear recognition of the main risks was obtained by
a risk assessment from data-set obtained in Rounds 1 and 2 of the survey. This
technique supports the constructing of a risk profile for the Brazilian shipbuilding
industry. The risk assessment was done based on the risk map/matrix from
Deloach (2000), Wittmann (2000) Hallikas et al. (2004), Norrman and Jansson
(2004), Thun and Hoenig (2009) and Dey (2010). According to Deloach (2000),
Wittmann (2000) and Dey (2010), the risks in the map/matrix can be also
classified into groups levels of ‘‘probability’’ and ‘‘severity’’ through a risk
ranking method.
According to Dey (2010), the score of the probability versus severity can
derive the risk map/matrix into groups of risk exposure levels. For this matrix, the
x-axis represents probability/likelihood of risk occurrence and the y-axis
represents severity of risk impact (Deloach, 2000; Wittmann, 2000; Dey, 2010).
Dey (2010) divides these axes by 5 points intervals. In the index used from Shen
et al. (2001), where low index is 0.1 and high index is 1, this scale were divided
into 5 points by intervals of 0.25.
Figure 10 shows the groups of risks used in the research from the result score
of axis-x by axis-y scale. As for example the square at the northeast corner
correspond the number 1 as it is the score by likelihood scale 1 versus severity
scale 1. Similarly, the central square is represented as 0.25, from likelihood scale
0.5 versus impact scale 0.5. Based on Deloach (2000), Norrman and Jansson
(2004) and Thun and Hoenig (2009), each group risk requires an action of
mitigation plan, as also demonstrated in Figure 12.

50
Figure 12 – Risk map/matrix groups and actions remove
1 0.10 0.25 0.50 0.75 1.00 RISKLEVEL ACTIONREQUIRED
0.75 0.08 0.19 0.38 0.56 0.75 VERYHIGH
0.5 0.05 0.13 0.25 0.38 0.50 HIGH
0.25 0.03 0.06 0.13 0.19 0.25 MEDIUM
0.1 0.01 0.03 0.05 0.08 0.10 LOW
0.1 0.25 0.5 0.75 1
SEVER
ITY
PROBABILITY
Risk mitigation is required.If the risk is not mitigated monitoring and making a
contingency plan is necessary.
Risk mitigation is optional but a monitoring is required.
No further risk mitigation is required
Once establishing the risk map/matrix and each group interval, the risks were
populated in the matrix according to the average value for their probability and
severity. In order to compare results with another ranking method, the approach of
a risk index proposed by Shen et al. (2001) was also used. In Shen et al. (2001)
method can be calculated through Eq.(2) below:
(3)
Where average score for each risk; significance score assessed by
respondent j for the risk severity ; = ordinal number of risk, ; =
total number of risks; = ordinal number of valid feedback to risk ; n
= total number of valid feedbacks to risk = likelihood occurrence of risk ,
assessed by respondent ; = level of consequence of risk assessed by
respondent . From Shen et al. (2001) method the results are demonstrated with
the risks ordered from the highest risk index to the lowest, as calculated in
Equation 3. As part of the risk evaluation process, based on Lee et al. (2009), risks
are also categorized from areas influence (political, economic, technical,
managerial, legal, social or natural) and also by environment (internal or external).

51
Finally, Round 3 surveyed the respondents (based on Appendix 2) in order to
evaluate the results from Round 1 and 2. At this point, a discussion about
mitigation plans adopted by the shipyards is conducted, as well as further actions
and main causes for the risks identified. Moreover, a comparison is made with the
results obtained by Lee et al. (2007).
As observed in this section, the methodology can be now described into the
following processes as shown on Figure 13.
Figure 13 – Methodology expanded overview

6. Results and discussion
The results obtained in this research outline the potential risks that the
shipbuilding industry is facing and how it can be globally competitive among
major players, such as Asian shipyards. Hence, the results found are also
compared to the results on Lee et al. (2007) from Korean Shipyard.
Table 5 below displays the finding of Rounds 1 and 2 of this research survey,
based on the validation of each risk by 22 respondents and by phase of
construction. This is the first step of the SCRM process, presenting the
identification of potential risks in the Brazilian shipbuilding industry. From a total
of 30 risks, at least 17 risks were validated by the 22 respondents, indicating with
a good percentage of replies that all risks are valid for the Brazilian shipbuilding
industry (at least by 17 respondents).
As defined in this research methodology, each risk was associated in any of
the four phases of construction. In this case, Table 5 shows the quantity of each
risk that according to the respondents is presented into a phases of construction.
Note that a single respondent is able to appoint a risk in more than one phase of
construction and also not all respondents have validated the risks to be relevant for
the industry, likewise to a specific phase.
The risks numbered from 1 to 26 are the risks identified in the literature by
Lee et al. (2007), and subsequently the risks numbered from 27 to 30 are the
additional risks identified by the respondents as relevant to the Brazilian
shipbuilding. The four new risks identified were:
27. Discontinuity of incentive programs by local government
28. Decline in demand for new vessels
29. Bankruptcy of local suppliers
30. Delays in construction due to lack of licenses required.
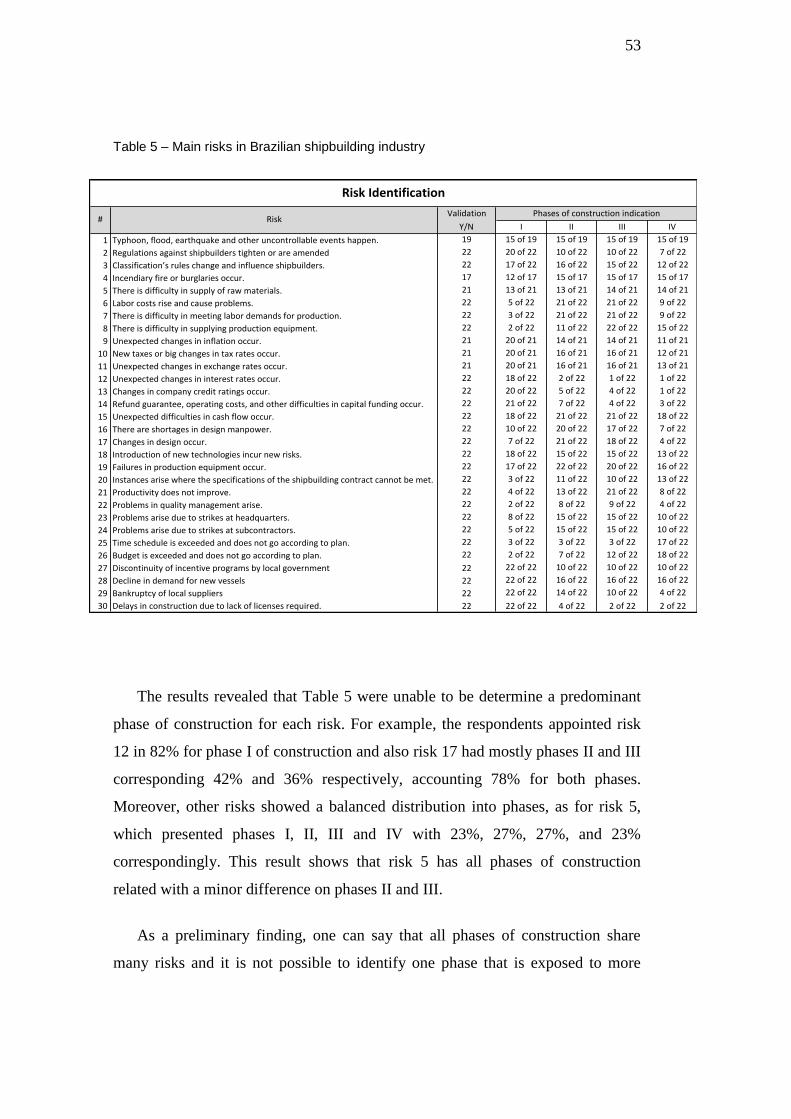
53
Table 5 – Main risks in Brazilian shipbuilding industry
Validation
Y/N I II III IV
1 Typhoon,flood,earthquakeandotheruncontrollableeventshappen. 19 15of19 15of19 15of19 15of19
2 Regulationsagainstshipbuilderstightenorareamended 22 20of22 10of22 10of22 7of22
3 Classification’sruleschangeandinfluenceshipbuilders. 22 17of22 16of22 15of22 12of22
4 Incendiaryfireorburglariesoccur. 17 12of17 15of17 15of17 15of17
5 Thereisdifficultyinsupplyofrawmaterials. 21 13of21 13of21 14of21 14of21
6 Laborcostsriseandcauseproblems. 22 5of22 21of22 21of22 9of22
7 Thereisdifficultyinmeetinglabordemandsforproduction. 22 3of22 21of22 21of22 9of22
8 Thereisdifficultyinsupplyingproductionequipment. 22 2of22 11of22 22of22 15of22
9 Unexpectedchangesininflationoccur. 21 20of21 14of21 14of21 11of21
10 Newtaxesorbigchangesintaxratesoccur. 21 20of21 16of21 16of21 12of21
11 Unexpectedchangesinexchangeratesoccur. 21 20of21 16of21 16of21 13of21
12 Unexpectedchangesininterestratesoccur. 22 18of22 2of22 1of22 1of22
13 Changesincompanycreditratingsoccur. 22 20of22 5of22 4of22 1of22
14 Refundguarantee,operatingcosts,andotherdifficultiesincapitalfundingoccur. 22 21of22 7of22 4of22 3of22
15 Unexpecteddifficultiesincashflowoccur. 22 18of22 21of22 21of22 18of22
16 Thereareshortagesindesignmanpower. 22 10of22 20of22 17of22 7of22
17 Changesindesignoccur. 22 7of22 21of22 18of22 4of22
18 Introductionofnewtechnologiesincurnewrisks. 22 18of22 15of22 15of22 13of22
19 Failuresinproductionequipmentoccur. 22 17of22 22of22 20of22 16of22
20 Instancesarisewherethespecificationsoftheshipbuildingcontractcannotbemet. 22 3of22 11of22 10of22 13of22
21 Productivitydoesnotimprove. 22 4of22 13of22 21of22 8of22
22 Problemsinqualitymanagementarise. 22 2of22 8of22 9of22 4of22
23 Problemsariseduetostrikesatheadquarters. 22 8of22 15of22 15of22 10of22
24 Problemsariseduetostrikesatsubcontractors. 22 5of22 15of22 15of22 10of22
25 Timescheduleisexceededanddoesnotgoaccordingtoplan. 22 3of22 3of22 3of22 17of22
26 Budgetisexceededanddoesnotgoaccordingtoplan. 22 2of22 7of22 12of22 18of22
27 Discontinuityofincentiveprogramsbylocalgovernment 22 22of22 10of22 10of22 10of22
28 Declineindemandfornewvessels 22 22of22 16of22 16of22 16of22
29 Bankruptcyoflocalsuppliers 22 22of22 14of22 10of22 4of22
30 Delaysinconstructionduetolackoflicensesrequired. 22 22of22 4of22 2of22 2of22
RiskIdentification
# RiskPhasesofconstructionindication
The results revealed that Table 5 were unable to be determine a predominant
phase of construction for each risk. For example, the respondents appointed risk
12 in 82% for phase I of construction and also risk 17 had mostly phases II and III
corresponding 42% and 36% respectively, accounting 78% for both phases.
Moreover, other risks showed a balanced distribution into phases, as for risk 5,
which presented phases I, II, III and IV with 23%, 27%, 27%, and 23%
correspondingly. This result shows that risk 5 has all phases of construction
related with a minor difference on phases II and III.
As a preliminary finding, one can say that all phases of construction share
many risks and it is not possible to identify one phase that is exposed to more

54
risks than another. Additionally, some risks in general could not be determined to
be exclusive to just one phase of construction.
Next, risks were assessed according to their probability of occurrence and
severity of the impact, also as part of Rounds 1 and 2 of this research survey.
From the responses received, the outliers were removed based on a MAD (Mean
absolute deviation) method. Table 6 shows the average values for both probability
and severity obtained, as indicated in columns 5 and 9. Additionally, Columns
“Low”, “Med” and “High” indicate the quantity of answers assessed for the
probability and severity of each risk.
Table 6 – Risk assessment result
PHASE 2 - Risk Assessment
Probability Severity
Quantity
Average
Quantity
Average
Low (0.1)
Med (0.5)
High (1)
Low (0.1)
Med (0.5)
High (1) Risk
1 16 3 0 0.124 3 11 5 0.568
2 15 7 0 0.227 1 14 7 0.641
3 7 13 2 0.360 5 12 5 0.500
4 7 9 1 0.325 8 9 0 0.312
5 6 9 5 0.505 0 10 10 0.750
6 1 12 9 0.714 1 9 12 0.786
7 6 13 3 0.374 1 9 12 0.786
8 9 11 2 0.320 0 8 14 0.818
9 12 9 0 0.271 0 12 9 0.714
10 11 10 0 0.290 3 16 2 0.500
11 5 14 2 0.395 4 13 4 0.406
12 12 10 0 0.282 2 7 13 0.825
13 11 11 0 0.300 7 14 1 0.367
14 6 14 2 0.380 4 16 2 0.420
15 5 11 6 0.545 1 10 11 0.762
16 5 13 4 0.389 0 11 11 0.750
17 1 9 12 0.786 5 15 2 0.400
18 12 10 0 0.282 12 10 0 0.282
19 4 15 3 0.500 2 18 2 0.500
20 3 17 2 0.500 0 11 11 0.750
21 1 11 10 0.738 0 10 12 0.773
22 3 17 2 0.500 0 11 11 0.750
23 2 19 1 0.500 0 14 8 0.533
24 12 10 0 0.282 5 17 0 0.409
25 0 10 12 0.773 1 20 1 0.500
26 2 14 6 0.650 0 13 9 0.705
27 17 5 0 0.191 0 10 12 0.773
28 13 9 0 0.264 0 11 11 0.750
29 14 8 0 0.245 1 17 4 0.500 30 17 5 0 0.100 12 10 0 0.282

55
Based on each risk average score of probability and severity, the risks were
populated into the risk map/matrix and separated by each risk level group. The
result offers an initial risk profile for the shipbuilding industry as presented in
Figure14.
Figure 14 – Brazilian shipbuilding risk profile
0.000
0.100
0.200
0.300
0.400
0.500
0.600
0.700
0.800
0.900
1.000
0.000 0.100 0.200 0.300 0.400 0.500 0.600 0.700 0.800 0.900 1.000
10
11
12
13
14
1516
17
18
19
2022
24
29
30
2827
25
21
23
26
3
6
1
2
4
9
87
5
PROBABILITY
SEVER
ITY
1 0.10 0.25 0.50 0.75 1.00 RISKLEVEL ACTIONREQUIRED
0.75 0.08 0.19 0.38 0.56 0.75 VERYHIGH
0.5 0.05 0.13 0.25 0.38 0.50 HIGH
0.25 0.03 0.06 0.13 0.19 0.25 MEDIUM
0.1 0.01 0.03 0.05 0.08 0.10 LOW
0.1 0.25 0.5 0.75 1
SEVER
ITY
PROBABILITY
Risk mitigation is required.If the risk is not mitigated monitoring and making a contingency
plan is necessary.
Risk mitigation is required.If the risk is not mitigated monitoring and making a contingency
plan is necessary.
Risk mitigation is optional but a monitoring is required.
No further risk mitigation is required
Risk number #
Legend

56
The risk profile above demonstrates that the average quantities of risks are
presented in the medium risk exposure level group. In this case, a total of 15 risks
as medium level, accounting 50% of the data set, followed by 9 risks classified as
High and 6 risks classified as low, as exhibited in Table 7. This outcome indicates
that the risks appear to have a clusterization behavior on the medium groups.
Table 7 – Risk exposure levels
Risk numbers Quantity of risks Group
- 0 Very High
6,21,26,17,25,15,5,20 and 22
9 High
23, 19, 7, 16, 3, 14, 11, 8, 12, 28, 9, 2, 29, 10
and 24 15 Medium
27, 13, 4, 18, 1 and 30
6 Low
Furthermore, some risks were observed in the same quadrant of risk
exposure level. For example, risks numbered 7 and 16 can be difficult to assure
which is higher by a risk exposure level. In this case, risk 7 has a higher severity
level whereas risk 16 has a higher probability level and they are the same quadrant
group.
Shen et al. (2001) shows a good method to distinguish these risks into
same quadrant groups, as called Risk Index. Once the risks were ordered, they
were also categorized according to their risk source, based on the literature from
Table 3, and also remarked as internal or external risk based on Lee et al. (2009).
Hence, as shown on Table 8, risks numbered as 21, 6, 26, 25 and 15 are the
highest risks for the shipbuilding industry.
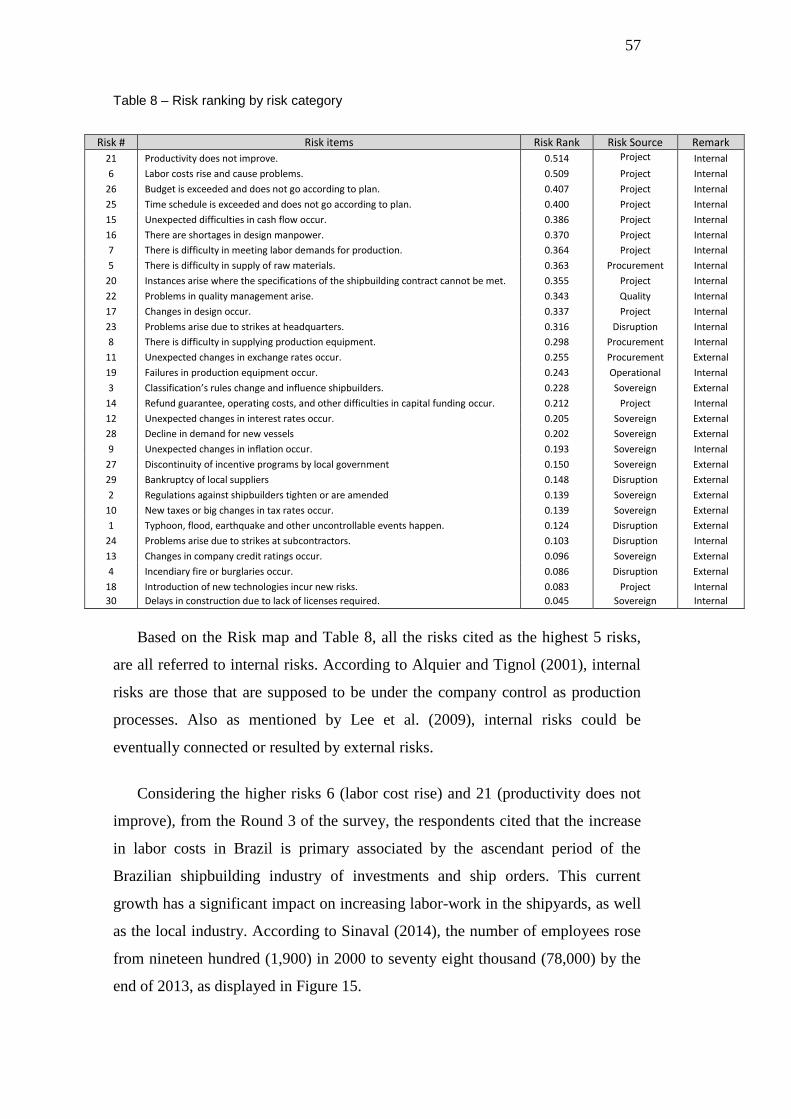
57
Table 8 – Risk ranking by risk category
Risk # Risk items Risk Rank Risk Source Remark
21 Productivity does not improve. 0.514 Project
Internal
6 Labor costs rise and cause problems. 0.509 Project Internal
26 Budget is exceeded and does not go according to plan. 0.407 Project Internal
25 Time schedule is exceeded and does not go according to plan. 0.400 Project Internal
15 Unexpected difficulties in cash flow occur. 0.386 Project Internal
16 There are shortages in design manpower. 0.370 Project Internal
7 There is difficulty in meeting labor demands for production. 0.364 Project Internal
5 There is difficulty in supply of raw materials. 0.363 Procurement Internal
20 Instances arise where the specifications of the shipbuilding contract cannot be met. 0.355 Project Internal
22 Problems in quality management arise. 0.343 Quality Internal
17 Changes in design occur. 0.337 Project Internal
23 Problems arise due to strikes at headquarters. 0.316 Disruption Internal
8 There is difficulty in supplying production equipment. 0.298 Procurement Internal
11 Unexpected changes in exchange rates occur. 0.255 Procurement External
19 Failures in production equipment occur. 0.243 Operational Internal
3 Classification’s rules change and influence shipbuilders. 0.228 Sovereign External
14 Refund guarantee, operating costs, and other difficulties in capital funding occur. 0.212 Project Internal
12 Unexpected changes in interest rates occur. 0.205 Sovereign External
28 Decline in demand for new vessels 0.202 Sovereign External
9 Unexpected changes in inflation occur. 0.193 Sovereign Internal
27 Discontinuity of incentive programs by local government 0.150 Sovereign External
29 Bankruptcy of local suppliers 0.148 Disruption External
2 Regulations against shipbuilders tighten or are amended 0.139 Sovereign External
10 New taxes or big changes in tax rates occur. 0.139 Sovereign External
1 Typhoon, flood, earthquake and other uncontrollable events happen. 0.124 Disruption External
24 Problems arise due to strikes at subcontractors. 0.103 Disruption Internal
13 Changes in company credit ratings occur. 0.096 Sovereign External
4 Incendiary fire or burglaries occur. 0.086 Disruption External
18 Introduction of new technologies incur new risks. 0.083 Project Internal
30 Delays in construction due to lack of licenses required. 0.045 Sovereign Internal
Based on the Risk map and Table 8, all the risks cited as the highest 5 risks,
are all referred to internal risks. According to Alquier and Tignol (2001), internal
risks are those that are supposed to be under the company control as production
processes. Also as mentioned by Lee et al. (2009), internal risks could be
eventually connected or resulted by external risks.
Considering the higher risks 6 (labor cost rise) and 21 (productivity does not
improve), from the Round 3 of the survey, the respondents cited that the increase
in labor costs in Brazil is primary associated by the ascendant period of the
Brazilian shipbuilding industry of investments and ship orders. This current
growth has a significant impact on increasing labor-work in the shipyards, as well
as the local industry. According to Sinaval (2014), the number of employees rose
from nineteen hundred (1,900) in 2000 to seventy eight thousand (78,000) by the
end of 2013, as displayed in Figure 15.

58
Figure 15 – Brazilian shipbuilding workforce
Source: SINAVAL, 2014
Additionally, the respondents consider that the increasing demand on
shipbuilding industry creates a highly competitive market for skilled labor, where
the number of job offers began to be greater than the number of the experienced
professionals available. The cost for skilled labor naturally rises. The outcome
shows that local shipyards face a major challenge in training an unqualified
workforce in order to make them profitable and productive. The respondents also
believe that over the next few years the labor market should stabilize, considering
that have been passed almost 15 years since the big recession in the Brazilian
shipbuilding industry. Nowadays is more likely to be experiencing a moment of
peak. Following this period, a maturation stage should emerge and deflate the
base salaries for qualified professionals.
Few shipyards have a mitigation plan for the raise in labor costs of risk
number 6. According to the answers received, some mention that the construction
contract signed between shipyards and ship-owners have labor adjustment clauses
based on the annual inflation rate or similar, which should be only during the
construction timetable period. The common practice is to have a compact number
of employees at the shipyard and to subcontract extra workforce according to the
production demand. This practice is generally used in large construction projects
as for shipbuilding.

59
Moreover, using the common measure of man/hours, today Brazilian
shipyards spend can spend more than two times man/hours then Asian shipyards.
The unqualified workforce not only impacts the productivity for the shipyards, but
also increases labor expenditure (Floriano et al., 2010; Goldberg et al., 2010).
Another item that is worth highlighting is that every year in Brazil there is a
minimum salary adjustment, based on the annual inflation rate. According to the
OECD Economic Outlook 2014, inflation rate project to Brazil in 2015 is around
6% while Asian countries around 2%. Besides the Brazilian labor being more
expensive to Asian workforce it is also less trained. The outcome is low
productivity levels and higher production costs. Consequently, more risk exposure
for production delays and exceeding project budget. Moreover, The respondents
also mentioned that is not entirely due to unqualified workforce, but also from
lack of interest on improvement in production methods and equipment.
Following next higher risk number 26, as for exceeding the budget plan may
be a result of the factors as some described above. Based on the responses in
Round 3, this can also happen due to a poor budget plan, complexity level of the
ship project or higher quality standard required from the ship owners. Many
respondents opinion that a poor budget plans is a current reality in the shipyards.
Regarding to exceeding time schedule as risk numbered 25, the respondents
appointed that it can occur for many reasons, including problem with labor
(strikes, serious work accident, low productivity), changes in original design,
delays in equipment supply, issue for construction license, natural disaster and
others.
Results from Lee et al. (2007) and Lee et al. (2009) showed a different
behavior between Brazilian and Asian industry, despite the fact that both
industries had a similar rapid growth during the last years. According to Clarkson
Research (2014), Asian shipyards from 2003 to 2010 increased by almost 260%
for ship orders, while at the same period Brazilian shipyards increased by almost
400% for ship orders.

60
Based on Lee et al. (2007), Korean shipyards have a higher risk for exchange
rates and interest rates at delivery phase. Since most of the shipbuilding funding is
prepaid by cash and if it is insufficient has to be filled by loans, which is repaid
after delivery. The exchange rate and interest rate become significant factors for
shipbuilding industry, especially for Asian shipyards, which are characterized as
an export industry and every sale is dealt in US Dollars. For the Brazilian
shipbuilding, the unexpected change in exchange rates listed as risk number 11,
showed to have a lower risk factor. Differently from Lee et al. (2007) result, the
Brazilian shipbuilding could be less impacted since mainly supplies the local
demand. Besides, according to the respondents, most of local shipyards have
foreign investors and in general all income is received in US Dollars while all
production costs are dealt in Brazilian Reais, protecting Brazilian shipyards from
a possible fluctuations in the rate exchange rate to foreign currencies.
Another items that Brazilian and Asian shipbuilders are not much alike is that
Asian shipyards show low risk level for labor strike then the Brazilian shipyards.
As already observed in this chapter, Asian shipyards present a higher productivity
level as and also with higher use of technology process. Additionally, Asian
shipyards have also low level of risk for equipment failure.
Furthermore, Lee et al. (2007) and Lee et al. (2009) showed a critical risk
from ship design capabilities and design manpower, while represented with a less
risk rate for Brazilian shipyards. According to Faverin et al. (2010 b), the
Brazilian shipyards are mainly focused on detailed project design. In some cases,
the main project and ship drawings are sourced by foreign engineering offices
(Queiroz, 2012; Coutinho, 2006). In contrast, the Asian shipyards have the
planning and engineering activities together and also the shipyard designs the
entire project (Iskanius and Helaakoski, 2009). This characterizes a much more
dynamic department, which also requires a more skilled design labor. This
comparison demonstrates why the design manpower shows a less risk in Brazilian
shipyards.

7. Conclusion and future research
This study aimed to fill a gap in the literature regarding the lack of empirical
studies for SCRM, focusing on the Brazilian shipbuilding industry. However, it
was not intended to exhaust all types of SCRM techniques but rather identify
potential risks and develop a risk profile to the Brazilian shipbuilding industry. A
survey approach was adopted with 22 respondents, among executives and
managers, from 17 significant shipbuilders in Brazil. Together these shipyards
cover around 85% of the total of steel processing capacity in Brazil. The number
of the dataset could be considered a study limitation, although it is not believed to
compromise the research findings due to the expertise level of the respondents and
also because of the representativeness of the shipyards in the Brazilian
shipbuilding industry.
As center objective, it was offered an initial risk profile of the Brazilian
shipbuilding industry, which presented the risks by their probability and severity
of occurrence. The risk profile was constructed through a map/matrix exhibiting
four groups of risk exposure. For each group there was a mitigation action
associated, found in the literature.
Essentially, the outcome of the survey was that productivity and rise in labor
costs are the highest risk factors for Brazilian shipyards. These risks also appeared
to have a strong relationship between each other. Comparing to Asian industry,
the Brazilian workforce is more expensive and also less trained. The consequence
is low productivity levels and higher production costs, which also contribute to a
higher risk exposure for production delays and exceeding project budget.
Additionally, the main risks obtained were recognized as project risk source,
which should be expected in such projectized and complex environment that is
shipbuilding. Moreover, the main risks were also observed as an internal
environment, indicating that the internal process could be not under control and
should be revaluated carefully.
This research appointed to an existing gap regarding to risk mitigation plans
and control by local companies. Although the importance of SCRM was

62
recognized in the literature, it is possible to observe by other studies conducted in
different industries (Ceryno et al., 2014) that the deficiency for a mitigation plan
is not exclusive in the shipbuilding industry. Findings from Jüttner (2005), Bloss
et al. (2009) and Gunasekaran and Spalanzani (2012) also corroborate that
different industries and countries lack in terms of identifying risks and
constructing a robust mitigation system. A challenge for SCRM seems to appear
in developing ways for risk control and mitigation plans. In this case, a future
research turns to be valuable by advancing on Phase II and completing the entire
SCRM process. This development would benefit not only the shipbuilding
industry but also many others.
Besides, the results also revealed that it was not possible to determine the risks
by phase of construction. Unfortunately, the information obtained was not
sufficient to affirm, for all cases, if a risk was more presented in a certain stage of
construction. Lee et al. (2007) presented a rule association method that allows this
examination. However, his approach requires an extensive dataset that might be a
challenge for the Brazilian shipbuilding, which could be considered smaller and
less experienced, if compared to Asian shipyards. This allows an opportunity for a
future research to develop ways to identify risks and investigate by phase of
construction. This also can be extended not only to phases but also to any aspect
that is desired to be investigated in an industry, such as different manufacturing
process, supply chain stages and others. In addition, the relationship of internal
and external risks, as well as the type of risk sources could also be explored to
better understand the behavior and connection that risks may have.
Furthermore, the findings of this research can be used as a systematic risk
management tool for strategic planning. They can be helpful for practitioners to
identify and understand risks related to the shipbuilding industry and to recognize
their severity and likelihood. This study is particularly relevant to initiate the
SCRM, since the risk identification phase is the trigger for this process (Ceryno et
al., 2014). Moreover, the adopted methodology can provide guidance in different
industries for the SCRM approach.
Noteworthy, this case evidence is only for a single industry, within a single
country, which should not be generalized, although some aspects could be

63
comparable to other circumstances. All in all, this study took an initial step to
investigate the SCRM techniques, offering a significant contribution for empirical
research in the literature.

References
AITKEN J, CHISTOPHER M and TOWILL, D. Understanding, implementing
and exploiting agility and leanness, International Journal of Logistics: Research
and Applications 5 (1), 59-74, 2002
AKINTOYE, A. S., and MACLEOD, M. J. Risk analysis and management in
construction, International Journal of Project Management, 15(1), 31–38, 1996
ALQUIER, A. M. and TIGNOL, M. H. Project management technique to
estimate and manage risk of innovative projects. In IPMA International
Symposium and NORDNET 2001, Stockholm, Sweden, 2001
AMARO G, HENDRY L and KINGSMAN, B. Competitive advantage,
customization and a new taxonomy for non-make-to-stock companies,
International Journal of Operations & Production Management 19 (4), 349-
371, 1999
ANSCOMBE, F.J. (1960). Rejection of outliers. Technometrics, 2, 123-147
ARAUJO, F. O. DALCOL P. R. T. and LONGO, W. P. E. A diagnosis of
Brazilian shipbuilding industry on the Basis of Methodology for an Analysis
of Sectorial Systems of Innovation, Journal of technology management &
innovation, 6 (4), 21, 2011
ARICA, E. and ALFNES, E. A concept for Order Change Management in ETO
Supply Chains, Dept of Production and Quality Engineering, Norwegian
University of Science and Technology, Abstract 025-1809, 2012
Balance Competitiveness and Benchmarking in the Field of Marine
Equipment, Study for the European Commission Directorate–General III D/5
Maritime Industries ETD/98/502029, Bremen, 2000
BASUKI, M., ARTANA, K.B., NUGROHO, S., DINARIYANA, A.A.B.
Shipbuilding Industry in Indonesia, a Risk Perspective (in Indonesian),
Proceedings of National Seminar of Postgraduate Study 2010, ITS, Surabaya,
2010
BERGER, P.D., GERSTENFELD, A., ZENG, A.Z., How many suppliers are
best? A decision-analysis approach, Omega 32 (1), 9–15, 2004
BERTRAND J.W.M. and MUNTSLAG, D.R. Production control in engineer-
to-order firms, International Journal of Production Economics, 30 (31), 3-22,
1993
BIRMINGHAM, R. MCGREGOR, J. DELAUTRE, S. and ASTRUGUE, J. Risk
evaluation at the preliminary design stage of a high-speed craft, journal of
ship production, 30 (3), 183–187, 2004

65
BLACKHURST, J. CRAIGHEAD, CW. ELKINS, D. HANDFIELD, RB. An
empirically derived agenda of critical research issues for managing supply-
chain disruptions, International Journal of Production Research 43(19), 4067-
4081, 2005
BLOME, C.; SCHOENHERR, T. Supply chain risk management in financial
crises – a multiple case study approach. International Journal of Production
Economics, 134 (1), 43–57, 2011
BLOS, M.F., Quaddus, M., WEE, H.M. and WATANABE, K., Supply chain
risk management (SCRM): a case study on the automotive and electronic
industries in Brazil, Supply Chain Management: An International Journal, 14
(4), 247-52, 2009
BOWERSOX, D. J. and CLOSS, D.J. Logistical Management: The Integrated
Supply Chain Process. New York: McGraw-Hill Companies, 594, 1996
BURGESS, K. SINGH, J.P. and KOROGLU, R. Supply chain management: a
structured literature review and implications for future research,
International Journal of Operations & Production Management, 26 (7), 703-729,
2006
CAMERON, N.S., BRAIDEN, P.M. Using business process re-engineering for
development of production efficiency in companies making engineered to
order products, International Journal of Production Economics 89 (3), 261-273,
2004
CARON, F. and FIORE, A. Engineer-to-order companies: how to integrate
manufacturing and innovative processes, International Journal of Project
Management, 13(5), 313-319, 1995
CERYNO, P. SCAVARDA, L.F. KLINGEBIEL, K. Supply Chain Risk:
Empirical Research in the Automotive Industry, Journal of Risk Research,
ISSN 1366-9877, 2014
CHAPMAN, C. Project risk analysis and management – PRAM the generic
process, International Journal of Project Management, 15(5), 273–281, 1997
CHAPMAN CB, WARD SC. Project risk management: process techniques
and insights. 2nd ed. John Wiley and Sons, UK, 2003
CHAPMAN, R.J. Simple Tools and Techniques of Enterprise Risk
Management, John Wiley and Sons, p. 494, ISBN 13 978-0-470-01466-0, 2006
CHASE, R.B., et, al. Operations Management for Competitive Advantage.
New Delhi: Tata-McGraw-Hill, 11th ed, 2006
CHENG, S.; KAM, H. A conceptual framework for analyzing risk in supply
networks. Journal of Enterprise Information Management, 21 (4), 345 – 360,
2008

66
CHO, D. S. and PORTER, M. E. Changing global industry leadership: the case
of shipbuilding, Massachusetts: Harvard Business School Press, 15-60, 1986
CHOPRA, S. and SODHI, M.S. Managing risk to avoid supply-chain
breakdown, MIT Sloan Management Review, 46 (1), 53-62, 2004
CHRISTOPHER, M. and PECK, H. A building the Resilient Supply Chain,
International Journal of Logistics Management, 15 (2), 1-14, 2004
CHRISTOPHER, M., LEE, H. Mitigating supply chain risk through improved
confidence, International Journal of Physical Distribution and Logistics
Management 34 (5), 388–396, 2004
CLARK, D. L., DONNA M. H. and CHARLIE E. W. Improving Shipbuilding
Practices Project: Efficiency Through Rework Reduction, Naval Postgraduate
School, pg. 1-137, 2007
Clarkson Research Service. Shipping Sector Reports Clarkson Research
Service, London, 2014
COUSINEAU, D. and CHARTIER, S. Outliers detection and treatment: A
review. International Journal of Psychological Research, 3 (1), 58–67, 2010
COUTINHO, Luciano G., SABBATINI, R. E RUAS, J. A. G. Implantação e
consolidação de laboratório de gestão de operações e da cadeia e suprimentos
da indústria de construção naval, Programa Tecnológico da Transpetro - Centro
de Estudos em Gestão Naval, Escola Politécnica, Universidade de São Paulo. São
Paulo, 2006. - Convênio FINEP, 2006
DELOACH, J.W. Enterprise-wide Risk Management. Strategies for Linking
Risk and Opportunities, Financial Times/Prentice-Hall, London, 2000
DEY, P. K. Managing project risk using combined analytic hierarchy process
and risk map. Applied Soft Computing, 10(4), 990-1000, 2010
DUGUAY, C.R., LANDRY, S. and PASIN, F. From mass production to
flexible/agile production, International Journal of Operations & Production
Management, 17 (12), 183-1195, 1997
ELFVING J. Exploration of Opportunities to Reduce Lead Times for
Engineered-to-Order Products, Ph.D. Dissertation, University of California,
Berkeley, 2003
ELLEUCH, H.; HACHICHA, W.; CHABCHOUB, H. A combined approach for
supply chain risk management: description and application to a real hospital
pharmaceutical case study. Journal o Risk Research, 15 (5), 641-663, 2014
ENGARDIO, P. Why the supply chain broke down, Business Week, 3724 (19),
41, 2001

67
EYRES, D. J. Ship Construction, London: Butterworth-Heinemann, Oxford,
2007.
FAVARIN, J., ANDERSON, V. L., AMARANTE, M. R., GALLARDO, P. A.,
and PINTO, de Oliveira. M. M. Desafios para o ressurgimento da cadeia de
fornecedores navais no Brasil, 22º Congresso Nacional de Transporte
Aquaviário, Construção Naval e Offshore, Rio de Janeiro, 2009.
FAVARIN, J. PINTO, de O. M. M., ANDERSON, V. L., BARACAT, M. L.
Competitividade da indústria naval brasileira, 23º Congresso Nacional de
Transporte Aquaviário, Construção Naval e Offshore, Rio de Janeiro, 2010 (a)
FAVARIN, J. REQUENA, C. and SOGGIA, L. Desenvolvimento de
metodologia de projeto de estaleiro, CEGN, Convênio FUSP–FINEP/CT
Aquaviário 01.08.0627.00, 2010 (b)
FINCH, P. Supply chain risk management, Supply Chain Management: An
International Journal, 9 (2), 183-96, 2004.
FLANAGAN, R. and NORMAN G. Risk Management and Construction,
Cambridge, MA: Royal Institution of Chartered Surveyors, Blackwell Science
Ltd, 1993.
FLEISCHER, M. KOHLER R., LAMB, T. BONGIORNI, H. B. and TUPPER, N.
Shipbuilding Supply Chain Integration Project, Ann Arbor: Environmental
Research Institute of Michigan, 1999.
GALBRAITH, J. R. Designing complex organizations, Addison-Wesley Pub.
Co., 1973.
GARDNER, J.T. and COOPER, M.C., Strategic supply chain mapping
approaches, Journal of Business Logistics, 24 (2), 37-64, 2003.
GEBHARDT, L. P. and JARVIS, R. G. Productivity improvement at the
SENESCO shipyard, Journal of Ship Production, 19 (3), 187–193, 2003
GHADGE, A. DANI, S. CHESTER, M.; KALAWSKY, R. A systems approach
for modelling supply chain risks, Supply Chain Management: An International
Journal, 18 (5), 523 – 538, 2013.
GILANINIA, S., GANJINIA, H., MAHDIKHANMAHALEH B., A., Difference
between internal and external supply chain risk on its performance.
Singaporean Journal of business economics, and management studies 8(1), 2013.
GOLDBERG, D. PINTO. DE OLIVEIRA. M. M., CARDOSO, S. J. and
FAVARIN, J. Riscos na construção naval brasileira, 23º Congresso Nacional de
Transporte Aquaviário, Construção Naval e Offshore, Rio de Janeiro, 2010.

68
GOH M, LIM J. Y. S., MENG F., A stochastic model for risk management in
global supply chain networks. European Journal of Operational
Research,182(33), 64–173, 2007.
GOSLING, J. and NAIM, M.M. Engineer-to-Order supply chain management:
A literature review and research agenda, International Journal Production
Economics 122(2), 741-754, 2009.
GOULARTI FILHO, A. Melhoramentos, reaparelhamentos e modernizacao
dos portos brasileiros: A longa e constante espera, Economia e Sociedade, 16
(3),31, 2007.
FLORIANO C. M. P. Jr., LORENA F., G., LUIZ F. A., Marcela F. A. Marcos B
C. N., Mauro Rezende F., Nelson D. F., Rogerio M., C., Silvia C. B. Um sistema
integrado para acompanhamento e controle de projetos de construção naval, 23º Congresso Nacional de Transporte Aquaviário, Construção Naval e Offshore,
2010.
GUNASEKARAN, A. Design and implementation of agile manufacturing
systems, International Journal of Production Economics, 62 (3), 1-6, 1999.
GUNASEKARAN, A. and Spalanzani, A. Sustainable supply management: An
empirical study, International Journal of Production Economics, 140(1), 168-
182, 2012
HALLIKAS, J. VIROLAINEN, V.M. and TUOMINEN, M. “Risk analysis and
assessment in network environment – a dyadic case study”, Preprints of the 11th
International Working Seminar on Production Economics, 255-70, 2000
HALLIKAS, J.; VIROLAINEN, V.; TUOMINEN, M. Risk analysis and
assessment in network environments: A dyadic case study. International
Journal of Production Economics, 78 (1), 45-55, 2002
HALLIKAS, J.; KARVONEN, I.; PULKKINEN, U.; VIROLAINEN, V. M.;
TUOMINEN, M. Risk management processes in supplier networks.
International Journal of Production Economics, 90 (1), 47-58, 2004
HAMERI, A. P. Project management in a long-term and global one-of-a-
kindproject, International Journal of Project Management, 15 (3), 151-157, 1997
HAMPEL, F. R. The influence curve and its role in robust estimation. Journal
of the American Statistical Association, 69 (346), 383–393, 1974
HARLAND, C. Risk in supply networks Journal of Purchasing and Supply
Management, 9 (2), 51-62, 2003
HARLAND, C., Brenchley, R. and WALKER, H. Risk in supply networks,
Journal of Purchasing and Supply Management, 9 (2), 51-62, 2003

69
HENDRICKS, K.B. and SINGHAL, V.R. An empirical analysis of the effect of
supply chain disruptions on long-run stock price performance and equity
risk of the firm, Production and Operations Management, 14 (1), 35-52, 2005
HICKS, C., McGOVERN, T. and EARL, C.F. Supply chain management: A
strategic issue in engineer to order manufacturing, International Journal
Production Economics 65 (1), 179-190, 2000
HICKS, C., MCGOVERN, T. and EARL, C.F. A Typology of UK Engineer-to-
Order Companies, International Journal of Logistics: Research and Applications,
4 (1), 2001
HOESKSTRA, S. and ROMME, J. Integral Logistics Structures: Developing
Customer Oriented Goods Flow, IACCOCA, McGraw-Hill, London, 1992
HOWELL, D. C. Statistical methods in human sciences. New York:
Wadsworth, 1998
ISKANIUS, P. and HELAAKOSKI, H. Agility in a project-oriented supply
chain, International Journal of Management and Enterprise Development. 7 (4),
358-372, 2009
JAIN, J. Dangayach, G. S. AGARWAL, G. and BANERJEE, S. Supply Chain
Management: Literature Review and Some Issues. Journal of Studies on
Manufacturing, 1 (1), 11-25, 2010
JÜTTNER, U., Peck, H. and CHRISTOPHER, M. Supply Chain Risk
Management: outlining an agenda for future research, International Journal of
Logistics Management: Research and Application 6 (4), 197-210, 2003
JÜTTNER, U. Supply Chain Risk Management, International Journal of
Logistics Management 16 (1), 120-141, 2005
KANERVA, M. Modern-competitive ship construction, Relatório Técnico
SOBENA, Rio de Janeiro, 2004.
KARIM, M.A., SMITH, A.J.R. and HALGAMUGE, S., Empirical relationships
between some manufacturing practices and performance, International Journal
of Production Research, 46 (13), 358-613, 2008
KARJALAINEN, J. HAAHTELA, T. MALINEN, P. and SALMINEN, V. Risk
sharing in partnerships embracing new product development. One view, one
world of OM? , paper presented at Euroma – POMS Conference, Lake Como,
Italy, July 16-18, 2003
KERN, D., MOSER, R. HARTMANN, E. MODER, M. Supply risk
management: model development and empirical analysis, International Journal
of Physical Distribution & Logistics Management, 42 (1), 60 – 82, 2012.

70
KHAN, O. and BURNES, B. Risk and supply chain management: creating a
research agenda, The International Journal of Logistics Management, 18 (2),
197-216, 2007
KLEINDORFER, P.R., SAAD, G.H. Managing disruption risks in supply
chains, Production and Operations Management 14 (1), 53-68, 2005
KNIGHT, Frank H. Risk, Uncertainty, and Profit, Hart, Schaffner, and Marx
Prize Essays, no. 31. Boston and New York: Houghton Mifflin, 1921
KOENIG, P. C. Structure and Performance in Heavy Industry: The Case of
Shipbuilding, George Washington University, May, 1999.
KRALJIC, P. Purchasing must become supply management, Harvard Business
Review, 61(5), 109-17, 1983
LAMB, T. Design/production integration, Ch.14 Ship Design and
Construction, (Ed. T.Lamb), SNAME, pp.14.1-14.70, 2003
LAMBERT, D.M. and COOPER, M.C. Issues in supply chain management,
Industrial Marketing Management, 29(1), 65-83, 2000
LAMPEL, J., MINTZBERG, H. Customizing customization, Sloan Management
Review 38 (1), 21-30, 1996.
LEE, E. SHIN, J.G. and PARK, Y. A Statistical Analysis of Engineering
Project Risks in the Korean Shipbuilding Industry, Journal of Ship Production,
23 (4), 223–230, 2007.
LEE, E., PARK, Y., and SHIN, J. Large engineering project risk management
using a Bayesian belief network, Expert Systems with Applications, 36 (3),
5880-5887, 2009.
LEYS, C. LEY, C. KLEIN, O. BERNARD, P. LICATA. L. Detecting outliers:
Do not use standard deviation around the mean, use absolute deviation
around the median. Journal of Experimental Social Psychology, 49 (4), 764-766,
2013.
LIKER, J. and LAMB, T. Lean Manufactures Principles Guide, Maritech ASE
Project, TIA, 2001.
LIMA, G. P. S. O soerguimento da construção naval brasileira nos anos 2000:
uma análise neo-schumpeteriana, Master’s thesis, University of Sao Paulo
(USP), 2009.
LIU J., ZHAO J, Bullwhip Effect and the Value of Information Sharing in
Supply Chain Illustrated by a Shipbuilding Supply Chain, Journal of Harbin
Institute of Technology (Social Science Edition), 3(5), 29-34, 2006.

71
LU, B. Z., and TANG, A. S. T. China shipbuilding management challenges in
the 1980s, Maritime Policy & Management, 27(1), 71–78, 2000.
LUMMUS, R. VOKURKA, R. Defining supply chain management: a
historical perspective and practical guidelines, Industrial Management & Data
Systems, 99 (1), 11-17, 1999.
LUSTOSA, L., MESQUITA, M.A. Quelhas and O. Oliveira, R. Planejamento e
controle da Produção, Editora Elsevier, Rio de Janeiro, 2008
MACINTOSH, G., Perceived risk and outcome differences in multi-level
service relationships, Journal of Services Marketing, 16 (2), 143-57, 2002.
MANUJ, I. and MENTZER, J.T. Global supply chain risk management,
Journal of Business Logistics, 29 (1), 133-55, 2008.
MARTHA, J. and SUBBAKRISHNA, S. Targeting a just-in-case supply chain
for the inevitable next disaster, Supply Chain Management Review, 6 (5), 18-
23, 2002.
MASON-JONES, R. and TOWILL, D.R. Information enrichment: Designing
the supply chain for competitive advantage, Supply Chain Management 2 (4),
137-148, 1997.
MCCLELLAND, G. H. Nasty data: Unruly, ill-mannered observations can
ruin your analysis. In H. T. Reis, & C. M. Judd (Eds.), Handbook of research
methods in social and personality psychology (pp. 393–411). Cambridge:
Cambridge University Press, 2000.
MCDERMOTT, R.E., MIKULAK, R.J. and BEAUREGARD, M.R., The Basics
of FMEA, Productivity Inc, Portland, OR, 1996.
MCGILLIVRAY, G. Commercial risk under JIT, Canadian Underwriter, 67
(1), 26-30, 2000.
MENTZER, J.T., DEWITT, W., KEEBLER, J.S., MIN, S., and Al, E. Defining
supply chain management, Journal of Business Logistics, 22 (2), 1-25, 2001.
MILLER, J. Reaction time analysis with outlier exclusion: Bias varies with
sample size. The Quarterly Journal of Experimental Psychology, 43 (4), 907–912,
1991.
MOHAN, M., S. Sodhi1, Byung-Gak Son1 and Christopher S. Tang Researchers
Perspectives on Supply Chain Risk Management, Production and Operations
Management 21 (1), 1–13, 2012.
MOJTAHEDI, S.M. H. MOUSAVI, S.M., and AMINIAN, A. Fuzzy group
decision making: A case using FTOPSIS in mega project risk identification
and analysis concurrently. International Conference on Industrial Engineering
and Engineering Management, 1 (3), 1769-1773, 2008.

72
MONTES, A. Plant Layout of a Shipyard, Ship Production and Ship
Procurement WEMT, 1993.
MOURA, D. A. Análise dos principais segmentos da indústria marítima
brasileira: estudo das dimensões e fatores críticos de sucesso inerentes à sua
competitividade, Tese de Doutorado Escola Politécnica, Departamento de
Engenharia Naval e Oceânica, Universidade de São Paulo, 2008.
MOYST, H., and DAS, B. Factors affecting ship design and construction lead
time and cost, Journal of Ship Production, 21(3), 186–194, 2005
NAIM, M. NAYLOR, J. BARLOW, J. Developing lean and agile supply chains
in the UK housebuilding industry, Proceedings of the Seventh Annual
Conference of the International Group for Lean Construction IGLC-7, Berkeley,
26(28), 159–170, 1999
NAYLOR, B. NAIM, M.M. and BERRY, D. Leagility: Integrating the lean and
agile manufacturing paradigmsin the total supply chain, Int. J. of Prod. Econ
62 (4), 107-118, 1999.
NEW, S.J., PAYNE, P. Research frameworks in logistics: three models, seven
dinners and a survey, International Journal of Physical Distribution and
Logistics Management 25 (10), 60-77, 1995.
NG, M.F., TUMMALA, V.M.R. and YAM, C.Y., A risk based maintenance
management model for toll road/tunnel operations, Construction Management
and Economics, 21(5), 495-510, 2003.
NIEGER, D. ROTARU, K. and CHURILOV, L. Supply chain risk
identification with value-focused process engineering, Journal of Operations
Management, 27(2), 154–168, 2009.
NORRMAN, A. and JANSSON, U. Ericsson’s proactive supply chain risk
management approach after a serious sub-supplier accident. International
Journal of Physical Distribution & Logistics Management, 34(5), 434-56, 2004.
OSBORNE, J. W. and OVERBAY A. The power of outliers (and why
researchers should always check for them). Practical Assessment, Research and
Evaluation, 9(6), 2004.
OEHMEN, J., ZIEGENBEIN, A., ALARD, R. & SCHÖNSLEBEN, P. System-
oriented Supply Chain Risk Management. Production Planning and Control,
20, 343-361, 2009.
OLHAGER, J. Strategic positioning of the order penetration point.
International Journal of Production Economics, 85(3), 319–329, 2003.
OLHAGER, J. The role of the customer order decoupling point in production
and supply chain management, Computers in Industry, 61(9), 863–868, 2010.

73
PANDIT, A. and ZHU, Y. An ontology-based approach to support decision-
making for the design of ETO (Engineer-to-Order) products, Automation in
Construction 16 (2), 759-770, 2007.
PARASCHIV, D. and ALBESCU, F. Globalization and developments in
shipbuilding industry, 7th International Meeting for Research in Logistics
AVIGNON, 24-26, September, 2008.
PILLING, B.K. and ZHANG, L. Cooperative exchange: rewards and risks,
International Journal of Purchasing & Materials Management, 28(2), 2-9, 1992
PIRES JR., F. C. M., ESTEFEN, S. F. and NASSI, C.D. Benchmarking
internacional para indicadores de desempenho na construção naval - Rio de
Janeiro, COPPE/UFRJ, 2007.
PIRES, S. R. I. Gestão da Cadeia de Suprimentos: conceitos, estratégias,
práticas e casos, Editora Atlas, 2004. 310 p., 2004.
PIRES JR, F. LAMB, T., and SOUZA, C. Shipbuilding performance
benchmarking, International Journal of Business Performance Management, 11
(3), 2009.
PORTER, K., LITTLE, D., PECK, M., ROLLINS, R. Manufacturing
classifications: relationships with production control systems, Integrated
Manufacturing Systems 10 (4), 189-199, 1999.
PORTER, M. Competitive Advantage, The Free Press, New York, NY, 1985.
PUJAWAN, I. N. and GERALDIN, L. H. House of risk: a model for proactive
supply chain risk management. Business Process Management Journal 15(6),
953-967, 2009.
PUTO, C.P., PATTON, W.E. and KING, R.H., Risk handling strategies in
industrial vendor selection decisions, Journal of Marketing, 49, 89-98, 1985.
QUEIROZ, A. A. F. S. L. de. Projeto de Rede de Suprimentos: um modelo
colaborativo para estruturação da rede de navipeças na Indústria de
Construção Naval do Brasil, Tese (Doutorado) – Escola Politécnica da
Universidade de São Paulo, 267 f., 2009.
QUEIROZ, V.J. Análise comparativa de riscos de estaleiros e projetos de
construção naval no brasil, Tese de doutorado – Escola Politécnica da
Universidade de São Paulo, 2012.
QUINN, F. Risky business. Supply Chain Management Review 10 (4), 5, 2006
RAGATZ, G.L., Handfield, R.B. and Scannell, T.V., Success factors for
integrating suppliers into new product development, Journal of Product
Innovation Management, 14(1), 190-202, 1997.

74
RICE, J.B. and CANIATO, F., Building a Secure and Resilient Supply
Network. Supply Chain Management Review, 7(5), 22-30, 2003.
RICHARDSON, R.J. Pesquisa social: métodos e técnicas, Sao Paulo, Atlas,
1989.
RITCHIE, B. and BRINDLEY, C. Supply chain risk management and
performance: a guiding framework for future development, International
Journal of Operations and Production Management, 27(3), 303-322, 2007.
ROUSSEEUW, P. J. and CROUX, C. Alternatives to the median absolute
deviation. Journal of the American Statistical Association, 88(424), 1273–1283,
1993.
RUDBERG, M. and WIKNER, J. Mass customization in terms of the customer
order decoupling point, Production Planning & Control: The Management of
Operations, 15(4),445 – 458, 2004.
ORR, J. M., SACKETT, P. R., and DUBOIS, C. L. Z. (1991). Outlier detection
and treatment in I/O Psychology: A survey of researcher beliefs and an
empirical illustration. Personnel Psychology, 44, 473-486.
SARDER, MD B. Ali A. FERREIRA, S. and RAHMAN, M.A. Managing
Material Flow at the US Shipbuilding Industry, Proceedings of the 2010
International Conference on Industrial Engineering and Operations Management
Dhaka, Bangladesh, January 9 – 10, 2010.
SCHANK, J.F. ET AL. Outsourcing and Outfitting Practices: Implications for
the Ministry of Defence Shipbuilding Programmes, Santa Monica, California:
Rand Europe, Paper prepared for the United Kingdom Ministry of Defense, 2005.
SCHMITT, J. A., SUN, A. S., SNYDER, V. L. SHEN M. Z. M., Centralization
versus decentralization: Risk pooling, risk diversification, and supply chain
disruptions. Omega article in press, 2014.
SCHOENHERR, T. TUMMALA, V.M.R. HARRISON, T.P. Assessing supply
chain risks with the analytic hierarchy process: providing decision support
for the offshoring decision by a US manufacturing company. Journal of
Purchasing & Supply Management, 14, pp. 100–111, 2008.
SCOTT, C., WESTBROOK, R. New strategic tools for supply chain
management. International Journal of Physical Distribution and Logistics 21 (1),
23-33, 1991.
SHARMA, K. Logistic Management: A Competitive Advantage for the New
Millennium. Global India Publications Ltd, First edition, 2009.
SHARMAN, G. The rediscovery of logistics, Harvard Business Review, 62(5),
71–80, 1984.

75
SHEN LY, WU G.W.C. NG C.S.K. Risk assessment for construction joint
ventures in China, J Constr Eng Manage 2001.
SIMCHI-LEVI, D. KAMINSKY, P. SIMCHI-LEVI, E. Designing and
Managing The Supply Chain: Concepts, Strategies and Case Studies, 3rd
Edition. McGraw-Hill Irwin, 2008.
SINAVAL, Cenario 2014. Sindicato Nacional da Industria da Construcao e
Reparacao Naval e Offshore, 2014.
SLACK, N., CHAMBERS, S. and JOHNSTON, R. Operations management,
Financial Times, Prentice Hall 6th edition, 2009.
SODHI, M. SON, B. and TANG, C. Researchers' Perspectives on Supply
Chain Risk Management, Production and Operations Management, 21(1), 1–13,
2012.
STOPFORD, M. World Sea Trade Outlook; Where China fits into the global
picture, Exploring Shipping Business in China Mareforum and Tradewinds
Shangai Conference, 2005.
SUN X. Y, JI P., SUN L.Y. and WANG Y.L. Positioning multiple decoupling
points in a supply network, International Journal of Production Economics, 113
(2), 943-956, 2008.
TANCREDI, P. T., JUNIOR, A. C. P., Issisaki, A.C., Filho, L. R. E. J. Projeto de
um estaleiro para construção em larga escala de navios de apoio marítimo,
24º Congresso Nacional de Transporte Aquaviário, Construção Naval e Offshore,
Rio de Janeiro, 2010.
TANG, C.S. Robust strategies for mitigating supply chain disruptions.
International Journal of Logistics 9 (1), 33–45, 2006.
TANG, O. and MUSA, N S. Identifying risk issues and research advancements
in supply chain risk management, International Journal of Production
Economics 133 (1), 25-34, 2011.
TAZELAAR, F., SNIJDERS, C. Operational risk assessments by supply chain
professionals: Process and performance, Journal of Operations Management 31
(4), 37–51, 2013.
THUN, JH. and HOENIG, D. An empirical analysis of supply chain risk
management in the German automotive industry, International Journal of
Production Economics 131 (1), 242-249, 2009.
TUMMALA, V.M.R., NKASU, M.M. and CHUAH, K.B., A framework for
project risk management, ME Research Bulletin, 2 (1), 145-71, 1994.
76
TUMMALA, R. and SCHOENHERR, T. Assessing and managing risks using
the Supply Chain Risk Management Process (SCRMP), Supply Chain
Management: An International Journal, 16 (6), 474-483, 2011.
TUMMALA, V.M.R. and MAK, C.L., A risk management model for
improving operation and maintenance activities in electricity transmission
networks, Journal of the Operational Research Society, 52 (2), 125-34, 2001.
TUNCEL, G.; ALPAN, G. Risk assessment and management for supply chain
networks: A case study. Computers in Industry, 61 (3), 250-259, 2010.
VAN DONK, D.P. Make to stock or make to order: the decoupling point in
the food processing industries, International Journal Production Economics, 69
(3), 297-306, 2001.
VAN HOEK, R. I., Peelen, E. and COMANDEUR, H. R. Achieving mass
customization through postponement: a study of international changes,
Journal of Market Focused Management, 3 (2), 353-368, 1999.
WAGNER, S. M. BODE C. An empirical investigation into supply chain
vulnerability, Journal of Purchasing and Supply Management, 12 (6), 301- 12,
2006.
WALTER, C and RIES, O. A Automação da Engenharia de Produto em um
Ambiente ETO/OKP, Máquinas e Metais, 132-139, 1996.
WARD, S. Requirements for an effective project risk management process,
Project Management Journal 30 (3), 37–43, 1999.
WANG JY, Liu CL. Risk management for construction projects, Construction
Management and Economics, 22(3), 2004.
YANG, B., BURNS, N.D. and BACKHOUSE, C.J. Postponement: a review and
an integrated framework. International Journal of Operations & Production
Management 24 (5), 468-487, 2004.
YATES, J.F., STONE, E.R., Yates, J.F. (Ed.), The Risk Construct in Risk-
Taking Behavior. Wiley, Chichester, 1-25
ZOU, P. X. W. ZHANG, G. WANG, J. Understanding the key risks in
construction projects in China. International Journal of Project Management, 25
(6), 601-614, 2007.
ZSIDISIN, G.A. and ELLRAM, L.M. An agency theory investigation of supply
risk management, The Journal of Supply Chain Management, 39 (3), 15-27,
2003.

Appendix I – Survey Rounds 1 and 2
Dear (a) participant,
This present questionnaire is one of the data collection instruments for
conducting the master's dissertation research in logistics, developed by the student
Felipe Ferreira of Production Engineering Department of PUC-Rio and advised by
Prof. Luiz Felipe Scavarda and Adriana Piles, and
Your participation is of fundamental importance to assist statistics
development and verification of the proposed questions for the shipbuilding
Industry study in Supply Chain Risk Management. In this way, we would ask the
kindness to individually fill out these forms.
We appreciate your attention and we are at your disposal for any questions
or clarifications.
Kind Regards,
Felipe Azevedo Lage Ferreia,
Master in Logistics
Pontifical Catholic University of Rio de Janeiro

78
First Round
The first round of the questionnaire has two (2) parts:
Part I:
The first part has 30 rows and seven (7) columns. The first column presents
the main risks associated to shipbuilding featured in the academic literature. The
second column associates these risks with the probability of their occurrence and
the third to the size of its impact (severity of the consequences if they occur). The
four columns (4) to seven (7) present the four main phases of construction of this
industry. Please complete this part of the questionnaire in the following steps:
Risk items in shipbuilding project
Risk Assessment Phase of Construction
Probability of
occurrence
(H, M, L)
Severity of
the impact
(H, M, L)
I II IIII IV
#1 Typhoon, flood, earthquake and other uncontrollable events happen. #2 Regulations against shipbuilders tighten or are amended #3 Classification’s rules change and influence shipbuilders #4 Incendiary fire or burglaries occur #5 There is difficulty in supply of raw materials #6 Labor costs rise and cause problems #7 There is difficulty in meeting labor demands for production #8 There is difficulty in supplying production #9 Unexpected changes in exchange rates occur
#10 New taxes or big changes in tax rates occur #11 Unexpected changes in exchange rates occur #12 Unexpected changes in interest rates occur #13 Changes in company credit ratings occur #14 Refund guarantee, operating costs, and other difficulties in capital funding occur #15 Unexpected difficulties in cash flow occur #16 There are shortages in design manpower #17 Changes in design occur #18 Introduction of new technologies incur new risks #19 Failures in production equipment occur #20 Instances arise where the specification of the shipbuilding contract cannot be met #21 Productivity does not improve #22 Problems in quality management arise #23 Problems arise due to strike at headquarters #24 Problems arise due to strike at subcontractors #25 Time schedule is exceed and does not go according to plan #26 Budget is exceeded and does not go according to plan

79
Step 1)
a. Please validate if each listed risk below is presented in the Brazilian
Shipbuilding industry. Please do not fill the columns 2-7 for the
risks it deems not relevant to the Brazilian reality.
b. Please fill in column 2 associating the risk with their probability of
occurrence (low, medium, high)
c. Please fill in column 3 associating the risk to the size of its impact
in case of occurrence (low, medium, high)
d. Please fill in columns 4 to 7 the construction phase in which the
risk is present, which may be present in only one stage or more of
the following phases:
PHASE I - Contract / Steel processing (Column 4)
PHASE II – Keel Laying / Block assembly (Column 5)
PHASE III – Hull launching / Outfitting (Column 6)
PHASE IV - Commissioning / Delivery (column 7)
Step 2)
In your opinion, if any additional risks to the 26 listed in the first column,
the questionnaire offers in lines 27-30 the possibility of adding up to four new
risks (additional risk I, II additional risk, additional risk III, IV additional risk).

80
Please fill in the remaining columns for each additional risk as the previous
procedure and in the "other" specify the name of each.
Second Round
Based on the result from Round 1, four new risks were identified to be present in
the Brazilian shipbuilding Industry, as follows:
27. Discontinuity of incentive programs by local government
28. Decline in demand for new vessels
29. Bankruptcy of local suppliers
30. Delays in construction due to lack of licenses required.
In this case, please repeat sub steps “b”,”c” and “d” from step 1 for the four new
risks listed above.

Appendix II – Survey Round 3
Third Round
From the previous Rounds the survey, the results demonstrated that 5 from 30
listed risks were identified as high risk of exposure, considering their probability
of occurrence and severity of the impact. The 5 risks are:
Rise in labor costs
Changes in design
Productivity rates does not improve
Time schedule is exceeded
Budget is exceeded
Based on the listed 5 risks, please answer the following questions for each
type of risk:
1) What are the main causes for the said risks to occur?
2) What can be done to avoid the listed risks? Is there any mitigation
strategy?
3) Please give examples if the said risks have happened to the shipyard you
work for, and if yes, how was the impact for this risk and what were the
main consequences?