desenvolvimento de metodologia analítica para determinação ... · obrigada meu deus e...
TRANSCRIPT

Emmanuela Prado de Paiva
Desenvolvimento de metodologia analítica para determinação de
folatos em alimentos
Recife 2012

Emmanuela Prado de Paiva
Desenvolvimento de metodologia analítica para determinação de
folatos em alimentos
Orientador Prof. Dr. Jose Almiro da Paixão
Recife 2012
Tese apresentada ao Programa de Pós-Graduação em Nutrição do Centro de Ciências da Saúde da Universidade Federal de Pernambuco, para obtenção do título de Doutora em Nutrição, área de concentração – Ciência dos Alimentos.

Paiva, Emmanuela Prado de
Desenvolvimento de metodologia analítica para determinação de folatos em alimentos / Emmanuela Prado de Paiva. – Recife: O Autor, 2012.
162 folhas: il., fig.; 30 cm.
Orientador: José Almiro da Paixão Tese (doutorado) – Universidade Federal de
Pernambuco. CCS. Nutrição, 2012.
Inclui bibliografia e anexos.
1. Folatos poliglutamatos. 2. Cromatografia líquida. 3. Vitaminas. 4. Micronutrientes. I. Paixão, José Almiro. II. Título.
UFPE 612.399 CDD (22.ed.) CCS2012-050

Emmanuela Prado de Paiva
Título: Desenvolvimento de metodologia analítica para determinação de folatos
em alimentos.
Tese aprovada em: 29 de fevereiro de 2012
Membros da banca examinadora
_____________________________________________________ Profa. Dra.Tânia Lúcia Montenegro Stamford
(Departamento Nutrição, UFPE)
_____________________________________________________ Prof. Dr. Irapuan Oliveira Pinheiro
(Departamento de Ciências Fisiológicas, UPE)
_____________________________________________________ Prof. Dra. Samara Alvachian Cardoso Andrade (Departamento de Engenharia Química, UFPE)
_____________________________________________________________ Prof. Dra. Ana Paula Silveira Paim
(Departamento de Química Fundamental – UFPE)
______________________________________________________ Prof. Dr. José Almiro da Paixão
(Departamento de Nutrição – UFPE)

Com amor dedico a todos que acreditaram neste fruto e em especial
Á minha mãe Djanete A. Prado e meu pai João Paiva de Souza e
a Clayton Anderson de A. Filho que com muito amor e dedicação me acolheu nos momentos mais difíceis.

Agradecimentos Obrigada meu Deus e Meishu-Sama por ter me dado coragem, motivação, conhecimento e
maturidade para viver todas as dificuldades e limitações e por transformar tudo isso em
aprendizado!
Aos meus familiares, em especial a meus irmãos Ana Carolina, Philipe e Luana, ao meu
afilhado Cauã, por entender minhas ausências e acreditar em meu esforço e trabalho;
Os meus padrinhos Bernadete e Pacheco que sabiamente até hoje exercem o verdadeiro papel
de segundos pais em minha vida;
Aos meus primos, Thiago e Carlinhos, por toda alegria e carinho expressos nos momentos em
que somo uma família;
Ao meu sogro Clayton Anderson de Azevedo e sogra Lea Azevedo, por toda atenção,
conselhos e demonstração de carinho.
Aos meus tios e tias com carinho!
Ao meu orientador Jose Almiro da Paixão, pelos ensinamentos, dedicação e paciência ao
longo destes seis anos de convivência e aprendizado.
Aos amigos do Laboratório de Experimentação e Análise de Alimentos em especial a Moises,
Camilo, Artur e Vivaldo, pessoas sempre disposta ajudar e ensinar.
Os colegas da Universidade Federal Rural de Pernambuco em especial a Luciana, Amanda,
Neide, Fátima, Leonardo, Edenilse e Marcus Metri que me motivaram e acreditaram nas
horas de trabalho dedicadas a este trabalho.
A profa. Tânia L. Montenegro Stamford, um exemplo doação e profissionalismo.
Aos prof. Antônio Rodolfo de Faria e Beate Saegesser Santos do Departamento de Ciências
Farmacêuticas e Profa. Fernanda Pimentel do Departamento de Engenharia Química pelas
contribuições técnicas e científicas fundamentais para finalização deste trabalho.
A FACEPE pela concessão da bolsa de Doutorado e pelo projeto aprovado financiado pelo
edital APQ-1302-4.05/08 que permitiu a construção da Central de Caracterização Química de
Alimentos, medicamentos e suplementos nutricionais no Departamento de Nutrição, UFPE .
A todo o Programa de pós-graduação em Nutrição, em especial a Neci e Cecília.
Ao LIKA na pessoa do Rafael Padilha, sempre disposto a garantir minhas liofilizações.
A todos os amigos e alunos que torceram e contribuíram para construção deste trabalho!

“Levantai ao alto os vossos olhos, e vede
quem criou estas coisas, quem produz por conta o seu exercito, quem a todas chama pelos seus nomes; por
causa da grandeza das suas forças, e pela fortaleza do seu poder, nenhuma faltará. O meu caminho está
encoberto ao Senhor e o meu juízo passa de largo pelo meu Deus. Não sabes, não ouviste que o eterno Deus,
o Senhor, o criador dos fins da terra, nem se cansa nem se fatiga? Não há esquadrinhação do teu
entendimento. Dá esforço aos cansados, e multiplica as forças ao que não tem vigor. Os jovens se cansarão e
se fatigarão e os mancebos certamente cairão. Mas os que esperam no Senhor removerão as suas forças,
subirão com asas como águias, correrão, e não se cansarão, caminharão, e não se fatigarão”.
Isaías 26-31.

RESUMO Vitamina B9 é constituída por um grupo de compostos com características químicas similares
denominadas folatos. Sua principal função é atuar como cofatores ou coenzimas na
transferência de unidades de carbono para síntese de ácidos nucleicos. Sua ausência na dieta
humana pode desencadear distúrbios distintos, a exemplo dos distúrbios de formação do tubo
neural. Tendo em vista a gravidade das doenças associadas, tem aumentado à necessidade do
controle dos valores declarados nos rótulos de alimentos e tabelas de composição e,
consequentemente, o desenvolvimento de metodologias analíticas seletivas e apropriadas a
matrizes de diferente composição química. A cromatografia líquida de alta eficiência tem se
destacado como método analítico mais utilizado para este fim, pois apresenta resultados
eficientes para diferentes formas de folatos. Entretanto, a maioria dos protocolos de estudo de
extração de folatos exige o uso de enzimas, soluções extratoras em diferente pH, controle de
temperatura e tempo de exposição na etapa de extração. Essas condições têm gerado
resultados contraditórios, o que motivou este estudo a desenvolver um protocolo analítico
simplificado para as etapas de identificação, extração e quantificação. Com soluções padrão
contendo seis formas de folatos foi possível desenvolver um método cromatográfico em
eluíção isocrática com tempo de eluíção dos padrões de 15 minutos em detector de arranjo de
diodo. Foram testadas três colunas com diferentes dimensões recheadas com octadesilsilano
em mais de dez combinações de fases móveis alcançando-se Rs, α e k compatíveis com um
protocolo capaz de ser executado em matrizes alimentares e explicado através da teoria de
ácido-base Lewis. Este método foi testado em espinafre e utilizado para o estudo do protocolo
de extração, através de estudo piloto isolando fatores, a saber: uso de enzimas, concentração
molar da solução extratora, agentes desproteinizante, antioxidantes, temperatura e tempo de
exposição e o espinafre usado como modelo de estudo fracionado em liquor e fibra. De posse
dos elementos principais foi desenhado um planejamento fatorial 24 objetivando verificar a
melhor condição de extração, e posteriormente o método desenvolvido foi testado em seis
matrizes alimentícias de origem vegetal. Para a etapa de extração, as condições de tempo e
temperatura exercem influência sobre as condições de extração, e as condições mais brandas
de exposição podem garantir uma maior extratibilidade. Ademais o fracionamento da matriz
potencializou a extração do 5-metil-tetraidrofolato na fração liquor.
Palavras-chave: folatos poliglutamatos, cromatografia líquida, vitaminas, micronutrientes.

ABSTRACT
Vitamin B9 is constituted by a group of compounds with similar chemical characteristics
denominated folates. Its primary function is to act as a cofactor or a coenzyme in the transfer
of carbon units for synthesis of nucleic acids. Its absence in human diet can trigger
disturbances in either a lower or a greater degree, such as the neutral tube defects. Given the
severity of the associated diseases, it has been increased the need to control the reliability of
the nutrient values declared on the labels and food composition tables and consequently, the
development of analytical methodologies capable for the recognition of bioactive and
bioavailable forms in matrices of different chemical compositions. HPLC has been
highlighted as the most used analytical method for this purpose because it presents efficient
results for different folate forms. However, most study protocols for the extraction of folate
requires the enzyme use, extraction solutions at different pH and control in temperature and
exposure time. These conditions have generated contradictory results, which motivated this
study to develop a simplified analytical protocol for the steps of identification, extraction and
quantification of folate forms in vegetable foods. With standard solutions containing six
forms of folate, it was possible to develop a chromatographic method with isocratic elution
with time of output patterns of 15 minutes for detection in DAD. It was tested three different
columns with different dimensions filled with ODS-II in over ten combinations of mobile
phases; reaching Rs, α, k compatible with a protocol that can be applied in food matrices and
explained by Lewis acid-base theory. This method was tested in spinach and used for the
extraction study by means of developing a pilot study isolating factors, namely: enzyme use,
molar concentration of the extracting solution, deproteinization agents, antioxidants,
temperature and exposure time; spinach was used as reference matrix split into two fractions,
liquor and fiber. It was build a 24 factorial designer in order to optimize this protocol and
subsequently, the method was tested in six vegetable matrices. It was concluded that the
conditions of time and temperature exert influence on the extraction of folates, and the gentle
conditions of exposure can provide a greater extractability. In addition, fractionation of the
matrix potentiated the extraction of 5-methytetrahydrofolate in fraction liquor.
Keywords: folate polyglutamate, liquid chromatographic, vitamins, micronutrient.

Lista de ilustrações
Artigo1. FOLATE - Analytical properties, bioavailability an d stability in foods.
Figure 01. Figure 01. Structural and chemical characteristics of folates most commonly found
in foods.
Figure 02. Test of solubility of folate standard in two conditions of dilution of stock
solutions. Chromatogram A in 8 mmol.L-1 ammonium acetate, C18 100 mm x 2,0 5µm
column, and chromatogram B in milli-Q water, C18 150 mm x 3,2, 5µm column. 1. THF (rt.
1.67); 2. 5-MTHF (rt.2.47); 3.10-FTHF (rt 3.21); 4. 5-FTHF (rt. 4.93); 5. Folic acid (rt. 7.34);
6.Pteróico acid (rt. 11.17). Isocratic elution performed in 85% of potassium phosphate buffer
pH 2,0 and 15% of MeOH, flow 0,5 ml/min. Stock solutions prepared in one ml NaOH
1mol.L-1 and ammonium acetate pH 6,8. rt - retention time.
Figure 03. Spectral profile of folates commonly found in foods. Register obtained by array
diode detector with scan performed in region maximum and minimum of each peak in
maximum λ. Images made from LC solution software (Shimadzu).
Artigo 2. Proposition for mechanism of separation of folate by Lewis theory acid-base:
a new alternative of improving selectivity in vegetable matrix by HPLC.
Figure 01. Test of solubility of folates standard in two conditions of dilutions of stock
solutions. Black line standard diluted in 8 mmol.L-1 ammonium acetate and dash dot line
standard diluted in phosphate buffer 100 mmol.L-1 pH 2,0. 1.THF (rt. 1.67); 2.5-MTHF (rt.
2.47); 3.10-FTHF (rt. 3.21); 4.5-FTHF (rt. 4.93); 5.Folic acid (rt. 7.34); 6.Pteroic acid (rt.
11.17). Isocratic elution performed in 85% of potassium phosphate buffer pH 2.0 and 15% of
MeOH, C18 150 x 3,2, 5 µm column. rt. retention time.
Figure 02. Chromatographic separation of folates by use of orthophosphoric acid pH 2,1 and
molar concentrations of 33 and 100 mmol.L-1 methanol in C18 150 mm x 3,2, 5µm column. 1.
THF; 2.5-MTHF; 3.10-FTHF; 4.5-FTHF; 5.Folic acid; 6.Pteroic acid.

Figure 03. Chromatographic separation of folates by use of potassium phosphate buffer pH
2,0 and molar concentrations of 50 and 100 mmol.L-1. in C18 150 mm x 3,2, 5µm column. 1.
THF; 2.5-MTHF; 3.10-FTHF; 4. 5-FTHF; 5.Folic acid; 6.Pteroic acid;
Figure 04. Chemical structure of folic acid and derivatives, with indication of radicals and
substituted groups.
Figure 05. Separation of folates depending on stationary phase C18 tested. 100 x 2,0, 5 µm
column, flow 0,5 ml/mim; 150 x 3,2, 5 µm column, flow 0,5 ml/min; 100 x 1,0, 3 µm column,
flow 0,06 ml/mim; 1.THF; 2.5-MTHF; 3.10-FTHF; 4.5-FTHF; 5.Folic acid; 6.Pteroic acid.
Isocratic elution performed in 85% of potassium phosphate buffer pH 2.0 and 15% of MeOH,
Standard diluted in 8 mmol.L-1 ammonium acetate.
Figure 06. Theoretical plate number and capacity factor (k) values to six folate forms
evaluated in three columns. Isocratic elution performed in 85% potassium phosphate buffer
pH 2.0 and 15% of MeOH, Standard dissolved in one mL of NaOH 1 mol.L-1 and ammonium
acetate 8 mmol.L-1.
Artigo 3. Investigation of protocols to extraction and quantification of folates in
vegetables matrices split into liquor and fiber fraction using factorial designer.
Figure 01. Flowchart of the stages of extraction carried out during pilot study. Text boxes in
dashed indicate that the stage was accepted to the pre-validated method.
Figure 02. Chromatogram of spinach in liquor fraction; Extraction performed with
ammonium acetate 50 mmol.L-1 at 40ºC. Figure A. black line extraction performed with 8%
TCA and dash dot line 2% TCA and figure B. Protease. 1- THF, 2- 5-MTHF, 3- 10-FTHF, 4-
5-FTHF,5- Folic acid and 6- Pteroic acid. Isocratic elution performed in 85% of potassium
phosphate buffer pH 2,0, 100 mmol.L-1 and 15% of MeOH. C18 100 x 2,0, 5 µm column, flow
0,5ml/min.
Figure 03. Chromatogram of spinach in liquor fraction; Extraction performed with
ammonium acetate 50 mmol.L-1 at 40ºC. Figure A. control and figure B. antioxidant. 1-THF
(rt 1.78), 2- 5-MTHF (rt 2.67), 3- 10-FTHF (rt. 3.41), 4- 5-FTHF (rt, 4.87), 5-Folic acid (rt.

8.78) and 6- Pteroic acid (Rt. 12.54). Isocratic elution performed in 85% of potassium
phosphate buffer pH 2,0 100 mmol.L-1 and 15% of MeOH. C18 100 x 2,0, 5 µm column, flow
0,5 ml/mim. rt. retention time.
Figure 04. Chromatogram of spinach in liquor fraction; Extraction performed with
ammonium acetate 50 mmol.L-1 at 40ºC. Figure A. folate conjugase and figure B. dienzyme.
1-THF (rt.1.81), 2- 5-MTHF (rt. 2.66), 3- 10-FTHF (rt. 3.38), 4- 5-FTHF (rt. 4.83), 5-Folic
acid (rt. 8.81) and 6- Pteroic acid (rt. 12.49). Isocratic elution in 85% of potassium phosphate
buffer pH 2,0 100 mmol.L-1 and 15% of MeOH. C18 100 x 2,0, 5 µm column, flow 0,5
ml/mim. rt. retention time.
Figure 05. Folate content of spinach in liquor fraction, A. liquor fraction, B. fiber fraction;
Extraction performed with ammonium acetate 50 mmol.L-1 at 40ºC. The assays was
performed in duplicate and showed in mean and standard deviation.

Lista de tabelas
Tabela 01. Variáveis independentes codificadas e decodificadas das condições de extração.
Tabela 02. Variáveis independentes decodificadas para o estudo fatorial das condições de
extração.
Artigo1. FOLATE - Analytical properties, bioavailability an d stability in foods.
Table 01. Extraction conditions of folate conjugase from different sources.
Table 02. Procedure for extraction and cleaning of food matrices for folates analysis.
Table 03. Mobile phases and columns used in HPLC for separation of folates.
Table 04.Usual condition of quantification for folate analysis. Artigo 2. Proposition for mechanism of separation of folate by Lewis theory acid-base:
a new alternative of improving selectivity in vegetable matrix by HPLC.
Table 01. Mobile phases evaluated.
Table 02. Chromatographic performance of binary mobile phases tested. C18 150 mm x 3,2,
5µm column.
Table 03. Chromatographic performance of potassium phosphate buffer pH 2,0 100 mmol.L-1
and MeOH in three columns.
Table 04. Precision and identification parameters for six chemical folate forms.
Table 05. Sensitivity of the HPLC-UV method.
Table 06. Repeatability using identification parameters for six chemical folate forms in
vegetable matrix by DAD.

Artigo 3. Investigation of protocols to extraction and quantification of folates in
vegetables matrices split into liquor and fiber fraction using factorial designer.
Table 01. Independent variable coded for the study of factorial designer of extraction
condition.
Table 02. Effect of extraction of folate obtained from factorial designer in liquor fraction of
vegetable matrix.
Table 03. Effect of extraction of folate obtained from factorial designer in fiber fraction of
vegetable matrix.
Table 04. Decoded independent variable and response of the factorial designer study of
extraction condition.
Table 05. Precision inter-day and identification parameters for six chemical folate forms in
liquor fraction of vegetable matrix.
Table 06. Validation parameters method for determination of folate in vegetables.
Table 07. Folate composition in liquor fraction vegetables.
Table 08. Folate composition in fiber fraction vegetables.

Sumário 1.0 Introdução.................................................................................................... 15
2.0 Objetivos...................................................................................................... 17
2.1 Geral............................................................................................................. 17
2.2 Específicos.................................................................................................... 17
3.0 Revisão de Literatura – Art igo 1............................................................... 18
Artigo 1. FOLATE - Analytical properties, bioavailability and stability in foods…. 19
4.0 Material e Métodos………………………………………………………. 63
4.1 Materiais………………………………………………………………….. 63
4.1.1 Amostras……………………………………………………………….. 63
4.1.2 Padrões e reagentes.................................................................................. 63
4.1.3 Equipamentos........................................................................................... 63
4.1.4 Fases estacionárias e fases móveis........................................................... 64
4.2 Métodos......................................................................................................... 64
4.2.1 Preparo das soluções dos padrões............................................................ 64
4.2.2 Obtenção e preparo de plasma de rato..................................................... 65
4.2.3 Avaliação das condições cromatográficas............................................... 65
4.3 Avaliação das condições de extração de folatos em alimentos vegetais.. 66
4.3.1 Protocolo de preparo das amostras (estudo piloto).................................. 67
4.3.2 Ensaio fatorial para otimização das condições de extração..................... 68
4.4 Parâmetros de validação........................................................................... 70
4.4.1 Identificação e quantificação.................................................................... 70
4.4.2 Precisão intermediária.............................................................................. 70
4.5 Análise estatística.................................................................................... 70
5.0 Resultados e Discussão…………………………………………………… 71
Artigo 2. Proposition for mechanism of separation of folate by Lewis theory acid-
base: a new alternative of improving selectivity in vegetable matrix by HPLC.
72
Artigo 3. Investigation of protocols to extraction and quantification of folates in
vegetables matrices split into liquor and fiber fraction using factorial designer.
98
6.0 Conclusões………………………………………………………………… 128
7.0 Perspectivas………………………………………………………………. 130
8.0 Referências………………………………………………………………... 131
Anexos……………………………………………………………………………… 134

15
1. Introdução
Folato é o termo genérico utilizado para designar as diferentes formas químicas da
vitamina B9, que podem ser encontradas na natureza em vários níveis de oxidação de
monoglutamato a poliglutamato. O ácido fólico é um monoglutamato no estado mais
oxidado, recomendado para a prática de fortificação, enriquecimento de alimentos e na
produção de medicamentos (BALL, 2006).
A ausência dos folatos na dieta pode ocasionar distúrbios, principalmente durante o
período gestacional. Vários estudos ao longo de três décadas têm demonstrado que
adequada ingestão de folatos pode reduzir os riscos no desenvolvimento de anormalidades
do tubo neural, especificamente malformações no cérebro e coluna vertebral (ARCOT &
SHRESTHA, 2005).
Diante da necessidade de ingestão de folatos e das mudanças de comportamento
alimentar (dietas pobres em frutas, legumes e hortaliças), muitos países vêm praticando a
suplementação obrigatória. Entre os países que adotaram esta prática estão China, Canadá,
Austrália, Nova Zelândia, Estados Unidos, Chile e Brasil (EICHHOLZER &
ZIMMERMANN, 2006).
Contudo o controle em relação à confiabilidade dos valores dos nutrientes declarados
nos rótulos dos alimentos enriquecidos e vitaminados tem ressaltado a necessidade de
determinar a composição química dos micronutrientes, ressaltando a importância do
desenvolvimento de metodologias seletivas e apropriadas ao reconhecimento das formas
bioativas e biodisponível em matrizes com diferentes composições químicas (PAIXÃO &
STAMFORD, 2004; PAIXÃO, 2010).
Atualmente o método oficial (n° 992.05) aceito pela Association Official Analytical
Chemistry (AOAC) é o que utiliza o Lactobacillus rhamnosus (ATCC n° 7469). Contudo
os ensaios microbiológicos são considerados laboriosos, por consumir tempo e
requererem grande demanda na execução. Além disso, o microorganismo não é capaz de
distinguir as diferentes formas de folatos (ARCOT & SHRESTHA, 2005; NDAW et al.,
2001). Em adição estudos populacionais de consumo versus hábitos alimentares tem em
geral quantificado esta vitamina na forma de ácido fólico utilizando o método oficial

16
proposto por Soongsongkiat e colaboradores (2010) ou métodos cromatográficos (HEFNI
et al., 2010).
Cromatografia líquida de alta eficiência (CLAE) tem se tornado a técnica de separação
mais utilizada na determinação de folatos, apresentando resultados mais eficientes que os
métodos usualmente empregados, visto que possibilita o estudo de diferentes formas de
folatos, sendo empregada prioritariamente no sistema de fase reversa para ácido fólico, 5-
CH3-H4folato, ácido pteróico, 5-HCO-H4folato, 5,10-HCO-H4folato e 10-HCO-H4folato.
Dentre estes os estados formil são considerados mais difíceis de quantificar devido à
instabilidade das moléculas e a dificuldade de separação (VISHNUMOHAN et al., 2011).
Um dos grandes desafios está em ajustar os parâmetros cromatográficos aos processos
de extração das diferentes formas de folatos nos alimentos. A maioria dos protocolos
sugere o uso de enzimas (conjugase, protease, α-amilase) nesta etapa, contudo o ácido
fólico e os folatos podem sofrer influência destes agentes, o que em muitos casos é fonte
de variação no conteúdo total de folatos encontrados na literatura (PATRING et al., 2005).
Além de haver poucas discussões no que diz respeito à influência do pH dos tampões,
utilizados no processo de extração, sobre a estabilidade dos folatos, gerando muitas vezes,
resultados contraditórios (PATRING et al., 2007).
Deste modo, ressalta-se a necessidade de aprimorar e desenvolver as etapas pré-
cromatográficas e cromatográficas envolvidas na análise de folatos objetivando garantir
resultados mais precisos e reprodutíveis que possam gerar informações para composição
de tabelas nutricionais, orientação e prescrição, visto que ainda permanecem conflitantes
as metodologias recomendadas na avaliação da maioria dos compostos com função
vitamínica nos alimentos, particularmente a classe de folatos.

17
2. Objetivos
2.1 Geral
Identificar, desenvolver e adequar etapas necessárias ao estudo dos folatos em vegetais
por cromatografia líquida de alta eficiência.
2.2 Específicos
• Adequar composição de fase móvel, pH, concentração molar e coluna compatíveis
com a separação de folatos através dos parâmetros cromatográficos;
• Avaliar o desempenho analítico de técnicas de extração para os folatos em vegetais;
• Comparar as condições de identificação e quantificação de folatos em soluções de
padrões e amostras;
• Estudar a precisão e exatidão da proposta analítica desenvolvida;

18
3. Revisão de Literatura – Artigo 1
Artigo 1. FOLATE - Analytical properties, bioavailability and stability in foods.
Submetido a revista: Journal of Food Composition and Analysis.
ISSN: 0889-1575
Fator de impacto (2010): 2,423

19
FOLATE
Analytical properties, bioavailability and stabilit y in foods
aPaiva, E.P.*; bPaixão, J.A
a Departamento de Tecnologia Rural, Universidade Federal Rural de Pernambuco, Rua Dom
Manoel de Medeiros, s/n, Dois Irmãos, 52171-900 – Recife, PE, Brazil. b Departamento de Nutrição, Universidade Federal de Pernambuco, Av. Prof. Moraes Rego,
s/n, Campus Universitário, 50670-901, Recife, PE, Brasil.
* Corresponding author: [email protected] Tel: 55- 0218133206284; Fax: 55-
0218133206281
Abstract
Folate is a term used to designate chemical forms of vitamin B9, it can be found in animal,
vegetable and microbial cells at different oxidation levels from polyglutamates to
monoglutamates. Its absence in diet can lead to disturbances, especially during pregnancy,
which guided mandatory food enrichment. The improvement of analytical methods started in
the 90's, in order to ensure the safety of information present in food composition table and
nutritional guidelines. The analysis of the different chemical forms of folate in food presents
some challenges due to its low concentration, possibility of isomerization in extraction and
quantification steps, presence of interference, especially in complex matrices, in addition to
oxidation potential. This fact raises the need for discussion on the safety analytical of
methodologies available for separation, detection, identification and quantification of folates
in foods. This review has endeavored to point out the characteristics and chemical properties
more relevant to the stability and bioavailability of folate in foods. In addition, spectroscopic
information of trade patterns of six chemical forms in combination with more recent data
were compiled from the literature aiming at guiding the development of simplified analytical
methods.
Keywords: folate, folic acid, stability, methods, extraction, food, vegetables, HPLC

20
1.0 Relevance
Folate is the term designated to all pteroic acid derivatives exhibiting vitamin activity
in humans (Ball, 2006). This water-soluble compound is associated with several activities
such as redox cofactors and/or coenzymes, and exhibiting biological activity in maintaining
the individual´s health (Donald and McCormick, 2001). It can be found in nature at several
oxidation levels ranging from monoglutamates to polyglutamates. Folic acid is the most stable
and less reduced form, presented as monoglutamate, recommended for practice of
fortification, food enrichment and drug production (Brody and Shane, 2001).
The main function and also the oldest one related to folate is being converted to 5-
methyltetrahydrofolate by action of the enzyme methylenetetrahydrofolate reductase, making
it a methyl donor for conversion of homocysteine to S-adenosylmethionine. This molecule is
source of carbon units for the DNA metabolism, including methylation and biochemical
reactions mediated in the nervous system (Phillips et al, 2011).
The addition of chains of glutamic acid in folates is the mechanism by which reserves
are stored in microbial, animal and plant tissue. Tetrahydrofolates and 5-
methyltetrahydrofolates are the main forms in animal tissues; the latter (5-
methyltetrahydrofolate) is the predominant form in plant tissue, which may represent 90% of
its activity (Hanson and Gregory, 2002).
Folate deficiency was primarily recognized by Wills in 1931 through identification of
a pernicious anemia prevalent in Indian women. This disease was proved through experiences
in monkeys fed on a diet restricted to folates. Since its inclusion as factor antianaemic in
1938, similar other molecules were also discovered and grouped under the designation folates
(Eitenmiller and Landen Jr., 2008; Brody and Shane, 2001).
However, folic acid elucidation as cure for megaloblastic anemia occurred in 1945.
Since then, folate deficiency is recognized as one of the most prevalent and common vitamin
deficiencies worldwide. This deficiency results from inadequate intake, defective absorption,
abnormal metabolism, and special conditions such as drug therapy. Marginal deficiency
produces general symptoms including tiredness, irritability, and loss of appetite. Severe
deficiency produces megaloblastic anemia or high amount of immature red blood cells. Other
symptoms include abdominal pain, diarrhea, ulcers in mouth and pharynx, skin changes, hair
loss, and neurological disorders such as dementia and depression (Eitenmiller and Landen Jr.,
2008).

21
Megaloblastic anemia due to insufficient folates intake has long been recognized as a
complication for pregnancy with 3–5% incidence in developed countries and much higher
incidence in Africa, Southeast Asia, and America. The syndrome development is mainly due
to the increased nutritional need resulting from fetus growth (Brody and Shane, 2001).
Absence of such compounds in the diet during pregnancy can lead to severe
disturbances. Relevant studies over three decades have shown that adequate folate intake may
reduce risks of developmental abnormalities from Neural Tube Defects (NTD´s) specifically
in brain and spine (Arcot and Shrestha, 2005; Chang et al., 2011).
NTD´s, including mostly forms of bifid spine - the most common birth defects in
humans - affect 1-14 per 1000 life birthed, although numbers are much higher in some
regions. NTDs are a family of birth defects involving brain or spinal cord. They arise from
incomplete neural tube closure during the fourth week of pregnancy (Chang et al., 2011).
Other diseases also associated with folate deficiency include the cardiovascular,
mediated by elevated homocysteine levels in blood, currently used as indicator of
cardiovascular disease. The maintenance of adequate folate intake reduces homocysteine
levels - thus, the recommendation for folate consumption in the diet or supplementation has
been a key clinical intervention in terms of prevention (Brody and Shane, 2001; Miller et al,
2002; Zappacosta et al., 2011; Fenech, 2011).
The number of benefits associated with maintainance the folate levels in all life stages
and disease prevention, has triggered interest in monitoring these molecules in the 90's
(Tamura 1998). Particularly regarding the need for recognition of the relationship between
chemical species and each type of disease (Arcot and Shrestha, 2005; Eitenmiller and Landen
Jr., 2008; Ball, 2006).
Considering the need for differentiating folate intake and changes in eating habits in
recent years, many countries have endeavored compulsory pratices of vitamin
supplementation - China, Canada, Australia, New Zealand, United States, Chile and Brazil
(Eichholz and Zimmermann, 2006). Currently, it is evident the importance of folic acid and
polyglutamates in order to maintaining good health.
Nutritional recommendations are usually based on the board values of the Institute of
Medicine, Food and Nutrition, which indicates folate intake of 400 mg/day for men and
women of childbearing age, pregnant women to 600 mg/day and lactation period of 500
mg/day. Bioequivalence is 1.0 mg natural folic acid equivalent to 0.6 mg of folic acid in

22
fortified foods and also used for supplementation (Mahan and Escott-stump, 2003). This
vitamin has not bioequivalence established by the International Units of the system proposed
by IUPAC-International Union Pure and Applied Chemistry.
However, control over the reliability of nutrients values in the label of fortified foods
and/or vitamins have stressed the need for determination of micronutrients chemical
composition. Thus, it is important to develop methodologies and appropriate selective
recognition of bioavailable and bioactive forms (Paixão and Stamford, 2004).
Vitamins determination in foods involves some challenges due to their low
concentration (below µg), possibility of isomerization, presence of various interfering in
complex matrices, requiring special care due to the low stability of these micronutrients, total
or partial loss of vitamin at extreme pH conditions, sensitivity to temperature and changes in
values of redox potential. These factors should be taken into account when choosing the
analytical method (Vahteristo et al., 1996; Paixão, 2010).
Currently, the microbiological method using Lactobacillus rhamnosus is considered
official by Association of Official Analytical Chemistry (AOAC) (method 992.05) for folates
determination in various samples, including food (AOAC, 2002).
However, microbiological tests are considered laborious, time consuming and require
a great demand for execution. Moreover, the microorganism is not capable of distinguishing
different forms of folate, and the test result obtained is the total folate content. Other common
failures include: inadequate test organism maintenance, dilution failures in the growth culture
medium, contamination of glassware and reagents, range in time and temperature of
incubation, extraction procedures, among others (Arcot and Shrestha, 2005; Ndaw et al.,
2001; Eitenmiller and Landen Jr., 2008; Ball, 2006).
Nevertheless, the high performance liquid chromatography (HPLC) with ultraviolet-
visible and/or fluorescence detection has been widely used for folates determination, with
more efficient results than other methods usually employed as microbiological assays and
radioimmunoassay (Martin et al, 2010). In addition, most protocols suggest the use of
enzymes (folate conjugase, protease, α-amylase) in the extraction process, and cleaning the
extract by affinity chromatography and separation HPLC by reversed phase (Ndaw et al.,
2001) combined or not with ionic pairing (Vahteristo, et al., 1996).
One of the great difficulties in adjusting chromatographic parameters result from the
extraction process of different folate forms in distinct foods. The extraction has been

23
influenced by the use of folate conjugase, amylase and protease; thus the enzymatic treatment
is considered the main source of variation in the folates content. In addition, there is little
discussion about the buffers’ pH influence on the folate stability, which has contributed to the
large amount of contradictory results in the literature (Finglas et al., 1999; Patring et al.,
2005).
Currently, the recommended methodologies for determination of most compounds
with vitaminic function such as pyridoxine, piridoxalamine, piridoxalphosfate, niacin,
nicotinamide, nicotinic acid and folate (especially) are considered contentious, making
difficult their inclusion in the nutritional composition tables. This condition has raised the
need to develop better pre-chromatographic and chromatographic conditions aiming at
achieving more reliable and reproducible results on the analytical point of view.
2.0 Chemical nomenclature and spectral properties
The term "folate" is usually described as a series of compounds with chemical
structure and nutritional activity similar to the folic acid (pteroil L-glutamic acid, vitamin B9)
(Breithaupt, 2001). This consists of one L-glutamic acid group linked to α-aminobenzoic acid
group, which is turned in, 2-amino-4-hidroxylpteridina (IUPAC-IUB, 1987). More details are
shown in figure 1.
Folic acid standard is a yellow crystal of molecular weight 441,4 Da, other forms
haves varied from 312 Da pteroic acid, until molecules of 445 and 473 Da as tetra-
hydrofolate, formyl-tetra-hydrofolate for monoglutamates (figure 02). Is usually found in
nature at very low quantities, however, due to stability of synthetic form is used for food
fortification and enrichment (Gliszczynska-swiglo, 2007).
Folate has low solubility in water being more soluble in alkaline and saline media
solutions. Low solubility occurs in acidic solutions (pH 2-4) where neutral forms and
monocátions occurs (Arcot and Shrestha, 2005). In a recent study, it was produced a
chromatographic profile separating the six forms of folate prepared in NaOH and diluted with
ammonium acetate 8 mmol/L-1 pH 6.8, where the same patterns were also diluted in water. In
figure 03 can be noted that the low solubility in water results in loss of symmetry and strength
of the analytical signal in HPLC with detection by DAD.

24
Solubility increases with increasing pH especially for folic acid and pteroic acid that
present the highest values of pK. Pteroic acid is less soluble than folic acid over most of the
pH scale. Folic acid solubility is influenced by the polar hydrophilic character of the α-
carboxyl group. Polyglutamyl folates are more anionic than folic acid due to the presence of
additional ionizable α-carboxyl groups. In the low pH, long chains of polyglutamyl folates are
more hydrophobic than shorter chain since the α-carboxyl groups are highly protonated
(Eitenmiller and Landen, 2008).
In United States Pharmacopeial (USP) folic acid is the reference molecule. Structural
variations include changes in oxidation state of the pteridine ring structure, mainly in 5,10
positions, a marked different polyglutamates according to the number of glutamate residues
on the chain is observed in figures 1 and 2. In order to name these molecules, the
International Union of Pure and Applied Chemistry-International Union of Biochemistry
(IUPAC-IUB, 1987) established the main backborn rule summarized below.
1. Pteroic acid conjugated with one or more L-glutamate units are named
pteroylglutamate, pteroyldiglutamate, and so forth. Folate and folic acid are
synonyms for pteroylglutamate and pteroylglutamic acid, respectively;
2. “Folates” may be used to designate any members of the family of pteroylglutamates or
mixtures with various levels of pteridine ring reduction, single-C substitutions, and
according to the numbers of conjugated glutamate residues;
3. Reduced compounds are indicated by prefixes dihydro-, tetrahydro-, and so forth, with
numerals indicating the additional hydrogen’s positions;
4. Tetrahydrofolate is assumed to be replaced in the 5, 6, 7, and 8 positions, and
diidrofolate is assumed to be replaced in the 7 and 8 positions unless otherwise
indicated;
5. Substituent groups are indicated by prefixes combined with locations of the positions
substituted. Substituent prefixes indicate that the substituent replaces one hydrogen
atom in the parent structure in case of formyl, methyl, or two hydrogens in case of
methylene and methenyl;
Folate exhibits the stability specific as important property to the analyst. Eitenmiller and
Lander Jr. (2008) described many factors affecting folate stability in biological systems and
during analysis.

25
a. Loss of biological activity occurs through oxidative cleavage of the C-9 and N-10
bond. p-aminobenzoylglutamate is the major oxidation product at pH´s 4, 7, and 10. The H4
Folate is more susceptible to oxidation than folic acid, reducing agents including ascorbic
acid, 2-mercaptoethanol; dithiothreitol is usually employed in order to stabilize folates.
b. Folic acid is more stable than naturally occurring folates at different temperatures.
Usually, it still has good stability in 100°C when protected from light and submitted to pH
5.0–12.0.
c. 5-Formyltetrahydrofolate is stable at neutral pH. Under acidic conditions with
heating, it is converted to 5,10-methenyltetrahydrofolate.
d. The number of glutamate residues attached to the folate does not influence stability.
e. Folate is cleaved through photochemical and reductive mechanisms. Ultraviolet
radiation cleaves folic acid into p-aminobenzoyl-l-glutamic acid and 6-formyl pterin. The 6-
formyl pterin can be further degraded into pterin-6- carboxylic acid.
f. Folate is the chemical form used for food processing by enrichment; however, losses
are variable in food according to the variations in food matrices, such as oxygen availability,
chemical environment, heating extent, and folate forms. Cooking process involving the
presence of large amounts of water causes leaching of vitamins canning liquid contain a
significant proportion of folate originally present in the raw product.
g. Presence of reducing agents (ascorbic acid) in food can increase folate retention
during thermal processing. However metals (Fe2+) and additives including sodium nitrite used
in some cured products can increase folate loss.
h. As dissolved or headspace oxygen levels trending inverse relationship with folate
stability aiming at retention.
i. Folic acid is quite stable in dry products in the absence of light and oxygen reason
why they are added to cereals and meals. The vitamin is stable in flour during storage and
subject to only small losses during baking. Its stability is greater than that naturally occurring
in most foods. 5-methyltetrahydrofolate is rough stabilized in frozen and freshly vegetables
and fruits.
During analysis, the cleavage of folic acid is influenced by pH, presence of reducing
agents in the buffer, type of buffer used and complexity or nature of the matrix being
analyzed. Many studies have shown that under identical heating conditions (approximately
100ºC), folic acid and 5-formyltetrahydrofolate are fairly stable, while the 5-

26
methyltetrahydrofolate and tetrahydrofolate are extremely labile (Arcot and Shrestha, 2005).
More drastic factors include pH and oxi-redution associated to temperature depending on the
matrices.
To prevent losses by oxidation, as well as in particular biological systems, some of
researchers have tried the use of antioxidants, but their significance was revealed only after
the 60’s. The most commonly used include: ascorbic acid, 2-mercaptoethanol and sodium
ascorbate, seeking to prevent the oxidative processes during stages of extraction and cleaning
(Tamura 1998). Concentrations of antioxidants range from 0.1 to 2%; however, according to
Arcot and Shrestha, (2005) 1% ascorbic acid buffers at pH 6.0 is a good working condition.
.
3.0 Bioavailability and stability
One of the most important information in public health is the availability of nutrients
in foods. Regarding the folate reference values used in Brazil, they are based on the American
Food Composition Table, since the last version of the Brazilian Food Composition Table
(TACO, 2006), - developed at the Center for Studies and Research in Food (Campinas
University -Brazil) - has no values of folates and folic acid to foods analyzed. In this
situation, it can be considered inadequate many of the guidelines and requirements folate
intake in Brazil. In turn, nutritional composition tables should be based on the reality of each
country, considering environmental conditions (soil, climate, rainfall and solar incidence)
which have strong influence on the distribution of micronutrients in foods.
Recently studies using the HPLC analytical method, have outlined folate sources that
naturally retains 50-1250 µg/100g food, some examples include: mushrooms (91 µg/100g),
wheat bran (94 µg/100g); artichoke (51 µg/100g), romaine (136 µg/100g), beets (109
µg/100g), marine algae (Laminaria ochroleuca - 161 µg/100g), bean sprouts (60 µg/100g),
yeast (1250 µg/100g) among others. Lesser amounts (less than 50 µg/100 g) are found in meat
and poultry, some vegetables and certain roots (Jastrebova et al, 2003; Yazynina et al, 2008;
Phillips et al, 2011).
Bioavailability has been described as the efficiency in the intestinal absorption
(Sanderson et al, 2003). It is generally accepted that folate bioavailability is approximately
100% for folic acid supplements taken on empty stomach; 85% for folic acid consumed in
foods (based on the absorption from fortified orange juice) and 50% from others foods. Since

27
85% of folic acid is absorbed when consumed with food and 50% food folate is absorbed,
folic acid taken with food is 1.7 times more available than food folates (Allen, 2008).
Some factors can influence on bioavailability: intrinsic factors such as - age of
individual, health and physical and, extrinsic ones - medium dissolved vitamin, chemical form
of vitamin, antagonists (some pharmaceuticals and alcohol), and composition of diets/food.
The increased polyglutamate chain is generally considered to reduce bioavailability; however,
folates-binding protein from milk may increase folate absorption by protecting dietary folate
from uptake by bacteria in the gut, thus increasing absorption in the small intestine
(Eitenmiller and Landen Jr., 2008).
Actually, the major source of folates is fortified cereals, followed by liver, yeast,
vegetables, bread and its derived products, citrus fruits, juices and meat, poultry and fish
(Brody and Shane, 2001; Phillips et al, 2011). In foods there is significant loss of this vitamin
due to processes such as blanching, cooking under water, steam and microwave that
potentially cause leaching of vitamin. Many studies seek to examine the relationship between
times and cooking temperature on the loss, once it is necessary to consider the folate loss on
the measurement of dietary intake (Stea et al., 2006; Johansson et al., 2008; Melse-boonstra et
al., 2002).
Processing methods used in service systems (boiling and oven baking) and minimal
processing (microwave, vacuum and steam boiling) were evaluated in peas, broccoli and
potatoes and it was observed that all these methods, as higher as the contact with water from
cooking, tend to higher losses, so the vacuum process is the most recommended. (Stea et al.,
2006).
The presence of natural antioxidants in foods has also been investigated as protective
element in the cooking process. The evaluation of 10 different precooked vegetarian ready
meals before and after reheated under three different processes cooking (oven, microwave and
stove) demonstrated the difficulty in establishing a pattern of losses over cooking. The use of
microwaves for most samples was the less aggressive folate loss. What most attracted
attention of researchers was this method associated with foods containing high levels of
antioxidants constituents may be increased up to 10% folates (Johansson et al., 2008).
Freezing and thawing or any high-pressure treatment, both followed by blanching,
may result in total folate losses of more than 55%. However, these processes can generate
conversion of polyglutamates to monoglutamate by activation of endogenous folate conjugase

28
plant tissue, for example leeks, resulted in increases between 65-100% in proportion of
monoglutamates. (Mensel-boonstra et al., 2002; Verlinde et al., 2007).
Evidently, freezing and thawing or high-pressure treatment disrupted plant cell
structure, establishing contact between endogenous conjugase and polyglutamyl folate,
thereby stimulating conversion of polyglutamate to monoglutamate. The blanching, when
conducted main treatment, result in leaching of monoglutamyl folate from the damaged plant
tissues. Blanching before treatments, inactivates one endogenous conjugase preventing the
conversion of polyglutamyl folate into monoglutamate and therofe, can reducing folate loss.
(Ball, 2006; Verlinde et al., 2008).
Different conditions of industrial food processing can lead to significant losses of
micronutrients, particularly for wheat flour refined resulted in substantial losses of vitamin B
complex, which has led to the requirement of fortification and enrichment. In this case, folic
acid is added since it is the most stable form with minimal degradation (5%) in products with
low humidity for long storage periods (Fennema, 2000; Gutzeit, et al., 2008).
Pfeiffer and col. (1997) evaluated wheat flour, rice and pasta fortified and unfortified
with folic acid (marketed in state Florida). The content of folates ranged from 10 to 29
µg/100g with unfortified flour and 84 to 120 µg/100g for fortified samples. This study
demonstrates that fortification is a good alternative for increasing folate availability in food,
since cooking process can result in significant losses in many cases. In addition availability
has usually improved the access to these micronutrients.
4.0 Methods of analysis
The analytical methodology for determination of folate in food usually involves three
steps: 1. release of folate from matrix; 2. deconjugation forms of polyglutamates to mono-and
di-glutamate and 3. Identification and quantification by microbial activity through
turbidimetric response (Soongsongkiat et al., 2010); High performance liquid chromatography
(HPLC) coupled to UV-Vis detection (Quirós et al., 2004), fluorescence (Yazynina et al.,
2008), Mass Spectroscopy (MS) (Vishnumohan et al., 2011) and radioimmunoassay (Martin
et al., 2010). Most studies involving folate analysis has used these three basic steps, so it is
necessary further discussion about this process.

29
4.1 Procedures for extraction (enzyme and others techniques)
During the 90´s a large number of studies were peformed aiming at improving the
process of folates extraction. Eitenmiller and colleagues (Martin et al., 1990) developed a
method considered more efficient than the traditional one. Until then, folates extraction was
performed only with folate conjugase - γ-glutamyl hydrolase (GH, EC 3.4.19.9) and heating at
100 °C of the matrix in a specific buffer. Currently, similar heating combined with the use of
α-amylase, protease and folate conjugase - known as a trienzyme extraction – suppose to
allow complete extraction of folates from the matrix, especially those which are tightly bound
to proteins and carbohydrates (Tamura, 1998).
The heat is used to inactivate enzymes that can catalyze folates degradation or their
interconversion, and combined with the use of amylase and protease allows complete
digestion of carbohydrates and proteins, releasing folates that may be closely linked to the
matrix. The folate conjugase plays the additional role of hydrolyze polyglutamates to
monoglutamate, in this way folate may be used in various methods including quantification
by HPLC (Johnston et al., 2002; Patring et al., 2005; Yazynina et al., 2008).
Recent studies focusing on trienzyme treatment efficiency have identified that fruits
and vegetables do not require the use of enzymes, cereal and flour can be properly treated by
using amylase and folate conjugase while legumes and foods rich in protein may require the
use of three enzymes (Yazynina et al., 2008; Hefnif et al., 2010). Therefore, the characteristic
of each matrix is what decides the sample treatment. Regarding the plants, due to the natural
conversion of polyglutamate into monoglutamate, they can also be dispensed using folate
conjugase (Mensel-boonstra et al., 2002; Stea et al., 2006; Johansson et al., 2008).
Protease and amylase can be obtained commercially. However, folate conugase or
gamma-glutamyl hydrolase (GGH) are usually extracted from different sources such as
chicken pancreas, pig kidney, human plasma and rat plasma, although it is marketed. Despite
the differences in the results obtained in the literature and acquisition costs, it has been carried
researches to reproduce some protocols, which are summarized in Table 01 (Konings, 1999;
Vahteristo et al., 1996; Ginting and Arcot, 2004; Patring et al., 2005; Doherty and Beecher,
2003; Yazynina et al., 2008; Stea et al., 2006; Jastrebova et al., 2003; Quirós et al., 2004;
Finglas et al., 1999; Dang et al., 2000; Ndaw et al., 2001).
The most used source for folate conjugase is the chicken pancreas. The GGH acts
under optimum pH of 7.8 and produces di-glutamate as final product (Arcot and Shrestha,

30
2005). However, Tamura (1998) considered as the most adequate folate conjugase that one
obtained from rat plasma, since it is easy to prepare and endogenous folates can be removed.
The final product is monoglutamate, which is ideal for chromatographic assays.
One of the great difficulties in standardizing extraction methods is the pH influence,
buffer composition and nature, temperature and antioxidants system required by the different
food matrices. In order to complete extraction of folates from human milk, Lim and col.
(1998) have standardized ideal conditions: extraction temperature at 100ºC for 5 minutes in
0.1mol.L-1 potassium phosphate buffer, pH 4.1 enzymes action - protease and amylase and
subsequent treatment with rat plasma conjugase in pH 7.0. Therefore for each matrix it is
necessary optimize the ideal conditions of extraction.
Some studies have targeted the choice of extraction buffer in relation to food pH, for
example for acid food is preferably the use of acetate buffer (pH 4-5). However, due to
increased folate stability in alkaline conditions, it has been practiced using phosphate buffer
(K2HPO4) or combination of buffers CHES (Acid 2 (-N-cyclohexylamine) ethane sulfonic
acid) and HEPES buffers (acid 4-(2-hydroxyethyl)-1-piperazine-ethane-sulfonic acid) both
with pH between 6 to 8 (Tamura, 1998).
In flour samples (high in starch) Pfeiffer et al., (1997) guided solubilization buffer
CHES and HEPES combined with rat plasma folate conjugase treatment followed by protease
for folates extraction. While Osseyi et al., (1998) recommend phosphate buffer without
conjugase treatment, but using amylase. Yazinina et al., (2008) demonstrated that the
combination of temperature (70ºC), phosphate buffer and conjugase would be enough for a
complete release of folates in the matrix.
Since the 60's the use of antioxidants has become essential for analysis, once the high
instability degree of folates, in particular of tetrahydrofolate, has generated conflicting results
in the literature. Thus the use of 1% ascorbic acid has become common practice, combined
with other antioxidant such as 2-mercaptoethanol and 2% sodium ascorbate (Tamura, 1998).
However, few studies have been conducted on the best combination of antioxidants to
ensure the stability of folates; it is little discussed mainly due to the difficulty to associating
the best combination of antioxidants in relation to the buffer extractor. Patring et al., (2005)
evaluated the effectiveness of antioxidants as stabilizing agents of folate in extraction stage.
Four antioxidants: 2-mercaptoethanol, dithiothreitol, 2,3-dimercapto-1-propanol and 2-
thiobarbituric acid (0.1%), in combination with sodium ascorbate 2% were tested in sodium

31
acetate buffer (0.1 mol.L-1, pH 5.0), phosphate buffer (0.1 mol.L-1, pH 6.1) and CHES-
HEPES (0.1 mol.L-1, pH 7.8).
The findings showed that the effectiveness of each antioxidant to protect folate does
not depend significantly on the buffer used, despite some minor variations. However, 2,3-
dimercapto-1-propanol in combination with sodium ascorbate showed the best combination
for protecting of folic acid mainly due to its lower toxicity and more effective (Patring et al.,
2005).
Cleaning and pre-concentration of sample is another step usually employed, since the
efficiency of HPLC studies assumes that the extraction protocol should ideally be efficient in
isolating the target analyte and eliminates the interfering compounds (Papadoyannis, 2009b).
Currently, solid phase extraction (SPE) is the most commonly used method after the
extraction procedure.
The SPE principle involves partitioning, desorption and adsorption of analytes to be
extracted between two phases: solid phase, sorbent, and liquid phase from matrix, which
contains possible interferences. Analytes must have a greater affinity for the solid phase than
for matrix (retention or adsorption stage), and this are subsequently removed by eluting with a
solvent that has a greater affinity for the analytes (elution or desorption stage). The different
mechanisms of retention or elution are result of hydrophilic and hydrophobic interactions and
electrostatic intermolecular forces among three components: analyte, active sites on the
sorbent surface and liquid phase or directly from matrix (Papadoyannis, 2009b).
SPE sorbents can be classified according to the primary interaction of functional
groups of sorbents, mostly non-polar, polar, or ionic. Ionic groups consist of cation exchange
and anion exchange sorbents and contain functional moieties that can act as ion exchangers.
Silica-based sorbents include the following: reversed phase - highly hydrophobic octadecyl
(C18), octyl (C8), ethyl (C2), cyclohexyl, phenyl and -butyl (C4); normal phase—silica
modified by cyano (–CN) and amino (–NH2); diols; adsorption, silica gel, fluorisil, alumina;
and ion exchangers, amino (–NH2), quaternary amine (NH3), carboxylic acid (–COOH), and
aromatic sulfonic acid (ArSO2OH) (Papadoyannis, 2009b).
The most used ligands for folate purification are strong anion exchangers and
materials based on trimethyl-amino-propyl-silica as aminopropyl, phenyl, cyclohexyil and
octadecylsilane, since providing good recovery of different folate forms (Nilsson et al., 2004).
However, it does not allow a pre-concentration of sample, due to its capacity factor and need
32
for a large volume of elution buffer for quantitative folate. In addition to this problem, there is
low selectivity for 5-methyltetrahydrofolate, which generates the co-eluting compounds that
interfere with peaks obtained by the HPLC (Nilsson et al., 2004).
Due to such difficulties Nilsson et al (2004) tested various materials capable of
binding to silica, including the trimethyl-amino-propyl, phenyl and cyclohexyl which aim at
verifying what these systems would provide better recoveries and selectivity.
It was concluded that SPE systems consisting of phenyl cartridges were better than
others, but any cartridge has offered sufficient selectivity in removing compounds that
interfere in the chromatographic peaks.
One of the biggest problems during extraction and cleaning is the instability various
folate forms, due to their redox potential and low levels found in some samples (Rizzolo and
Polesello, 1992). For this reason the inclusion of one more step, such as the use of SPE should
be analyzed and really contribute to the cleanup of the material analyzed.
Therefore, it behooves the analyst to evaluate the benefit of including the solid phase
extraction (SPE) method as an additional alternative to purification. However, the higher the
number of steps the longer the sample and consequently the analyte of interest are exposed to
contamination, degradation, temperature variation among other things, increasing the chances
of analytical error in addition to there being longer time spent in the analysis. (Patring et al.,
2005).
The literature contains numerous protocols for extraction, falling to the analyst to
decide the number stages required for each matrix and its degree of difficulty in accessing
folates (Patring et al., 2005). In table 02 are summarized the main processes of extraction and
cleaning used for the different chemical folate forms found in foods.
4.2 Chromatographic procedures
Currently, HPLC is method the most recommended to identify the different chemical
forms, in particular for evaluating of vitaminers in food and others matrices. This is justified
by the technique’s versatility that can be used for identification of complex matrices or
presence of other substances such as isomers and degradation products (Paixão, 2010).
However, the choice for the best separation performance in HPLC requires knowledge
of the main chemical characteristics of the analyte of interest which include: chemical
structures, molecular mass, chromophoric units, the presence of ionic charge, and solubility

33
index of the compound. These combined with the parameters of separation - capacity factor
(k) in the range 1≤ k≤10, resolution (Rs) optimal value is than 1.5, separation factor (α) value
ideal than 1.5 and symmetry lower than 1.2, taken 10% of peak height, allow the choice of
stationary phase, mobile phase and detector (Snyder et al., 1997).
The stationary system most used in HPLC separation of folate are columns filled with
octadecylsilane (C18) also known as reverse-phase systems. The lengths ranging between 10-
25 cm, 3-4.6 mm in inner diameter and 5 micrometer particle, which produce separation with
mobile phase consisting of solvents with different polarities (Papadoyannis et al., 1997;
Ruggeri et al., 1999; Catharino et al., 2006; Jastrebova et al., 2003; Osseyi et al., 1998;
Breithaupt, 2001; Quirós et al., 2004; Prieto et al., 2006; Vahteristo, et al., 1996; Yazinina et
al., 2008).
Jastrebova et al (2003), analyzing folates in raw and processed beets showed better
separation of some folate forms with packed octilsilano (C8) columns resulting in more
symmetrical peaks.
The mixture of aqueous and organic solvent and other agents to ensure polarity has
allowed good separation in some folate forms, depending on the charge and pK of the
molecule (Rizzoli and Polesell, 1992). Solutions using potassium phosphate and their buffers
are the most commonly used in mobile phase composition, at pH range of 6.8 - 2.1. Other
conditions used included HEPES and CHES buffer pH 7.8, 2% solution of acetic acid and
acetate ammonium pH 6.0 (Ruggeri et al., 1999; Catharino et al., 2006; Jastrebova et al.,
2003; Osseyi et al., 1998; Breithaupt, 2001; Quirós et al., 2004; Prieto et al., 2006; Vahteristo,
et al., 1996; Yazinina et al., 2008).
Due to the ionic character of folate, it may be necessary to add the mobile phase of
ionic additives in order to avoid possible interactions with the repulsive negative charges of
the silanol that can generate inaccessibility of molecule in its anionic form (Jandera, 2009).
Ion pairing agents as triethylammonium can be added to change the pK of the analyte
improving the resolution and separation of the different folate forms (Osseyi et al., 1998;
Breithaupt, 2001).
In the reversed phase liquid chromatography using binary mobile phase - acetonitrile
or methanol in combination with water, the retention time of the analyte can be decreased
with increases in the concentration of organic solvent. This can be accomplished isocratically
or gradient mode. (Jandera, 2009).

34
Folate separation has been used frequently in systems of gradient elution in order to
ensure the study of the main forms, tetra-hydrofolate, 5-methyltetrahydrofolate and folic acid
(Jastrebova et al. 2003). In contrast, this condition implies some disadvantages, such as the
need for re-equilibration the column, which results in variations in the baseline, increased
analysis time and solvents spent (Paixão, 2010).
So far only Patring & Jastrebova (2007) investigated the effects of buffer nature and
mobile phase composition on sensitivity and selectivity in chromatographic separation of
folates by detection mass spectrometry. A ternary mixture in gradient mode of acetonitrile,
methanol and aqueous acetic acid at pH 3.4 combined with gradual addition of methanol up to
8% allowed the separation of two usually overlapped forms -10-HCO-folic acid and 5-HCO-
H4folate, stable baseline and resolution Rs≥1.5 in LC-MS.
This was the first study to investigate the patterns ionization of 5-
methyltetrahydrofolate, tetrahydrofolate, 10-formylfolic acid, 5-formyltetrahydrofolate and
folic acid describing them on basis of its acid-base properties. It was investigated the intensity
of mass spectrometer signal in positive and negative ion mode, and despite considerable
differences in pKa-values, all folate derivatives exhibited similar responses for abundant
positive ions.
More recently, Jastrebova and col. (2011) compared the efficiency of folates analysis
in UPLC and HPLC using columns with similar surface chemistry, however, with particle
sizes 3.5 and 1.7 µm. The use of small sub-2µm particles allowed the reduction of the analysis
time of 45 min to 15 min at 30 °C and 5 min at 60 °C without loss by degradation of ways
investigated. Although, still operating gradient mode.
Table 03 shows the main types of mobile phases, columns and elution mode used in
the analytical resolution for different folate forms.
4.2.1 Identification and quantification techniques
The low concentration of folates (below ng) in most foods limits the applicability of
separation techniques and emphasizes the need for more sensitive detectors. (Arcot and
Shrestha, 2005). The types of detectors vary among non-destructive (UV-Vis, fluorescence,
light scattering and refractive index) and destructive (mass spectrometry and flame ionization)
(Paixão, 2010).

35
To determine folate is use the UV-Vis detector at 280-290 nm wavelength (λ) and
fluorescence in which the wavelength varies with the type of folate (Rizzoli and Polesello,
1992). With the exception of folic acid and pteroic acid all folates forms exhibit fluorescence,
allowing identification and quantification in better sensibility. For example, to
tetrahydrofolate, 5-methyltetrahydrofolate, 5-formyltetrahydrofolate is chosen 290 nm
excitation and 356 nm emission and for 10-formylfolate 360 nm excitation and 460 nm
emission (Hefni et al., 2010; Vahteristo et al., 1996).
UV-Vis detectors are able to distinguishing most of the folate forms and showing a
good correlation with microbiological tests for various foods, although its sensitivity is
decreased in comparison with other detectors (Arcot and Shrestha, 2005). Still, they can
provide excellent results, especially when detectors are capable of operating at more than one
wavelength (λ) by executing an alternative λ program (Paixão, 2010) that can even fitted the
fluorescence detector of λ for different forms of each folates.
Most detectors operating in multi-channel can also provide UV spectrum of the
analytes in elution if properly programmed and measured. With this tool is possible to
determine the homogeneity for the peak obtained from the ratio of the absorbances obtained
from standard and samples, they must be constant throughout the analytical process. The
technique is normalizing for two spectra (or more than) and then the ratio for each should be
constant for homogeneous peaks (Skoog, 1992; Paixão, 2010).
However, it is necessary a relatively large database, capable of confirming the
chemical compounds of different groups. In the case of folic acid and folates, the spectra
obtained will suffer influence of the solvent used for dissolution may be obtaining stronger or
weaker signal intensities depending on the chosen solvent (figure 03).
In Figure 4 are presented the spectral profiles of six folate forms most frequent in
food. Studying of the spectral profile is a useful tool during the process of identification and
confirmation of signals. It is known that these can be modified according to the dissolution
medium; however, the areas of higher absorptivity can be confirmed accurately by DAD
detection and still further evaluations performed on the database able to compare standard and
samples showing similarity and purity indexes.
Chromatography is considered powerful tool in separation technique. However, for
identification of peaks is necessary the use of better resource, combined with detectors.
Among these are included: comparative study of adjusted retention times, obtained by

36
injection of standard and samples in similar conditions; evaluation of peaks of interest for
more than one detector coupled series, for example, fluorescence, electrospray ion detector
(ESI) or chemical ionization by different techniques for ionic and non ionic compounds
(Beismanna et al., 2011; Snyder et al., 1997).
The quantification can be obtained by comparison of areas related to known
concentrations in calibration curves (external or internal standard). In order to quantify the
peaks of folates, it is usually chosen the external standard, which can be performed by the
correlation between the calibration curve equation with the peak of interest area (Jastrebova et
al., 2003; Osseyi et al., 1998; Breithaupt, 2001; Quirós et al., 2004; Prieto et al., 2006;
Vahteristo, et al., 1996; Yazinina et al., 2008).
For internal standardization it should be chosen a chemically similar compound to that
one under study, in the case of folic acid for instance, it can be used methotrexate an
antagonist drug to folic (Alexander et al., 2008); which presented retention time 9.0 min in
isocratic elution in 85% of potassium phosphate buffer pH 2.0 100 mmol.L-1 and 15% of
MeOH (data not published).
The internal standard must be added in concentrations similar to the compound of
interest and should be eluted in unused portion of the chromatogram, being its retention time
close to the peaks under consideration (Paixão, 2010). Among those studies aiming at
quantifying folates external standard is mostly employed as can be observed in table 04.
4.2.2 Procedures for analytical validation
After the method has been developed, involving analytical separation and extraction
performance of classes of folates, it must be validated with respect to different parameters
which aim at assessing. In order to determine the most important parameters to be included in
this process, it can be consulted to the literature, or the guidelines of regulatory agencies such
as ICH - International Conference on Harmonization (Papadoyannis, 2009a). Obviously,
laboratorial experience should be pointed and used through suitability system test accepted as
statistical tool for improving methodologies.
Regardless of the source selected, six parameters must be investigated to validate a
method as follows: 1. accuracy, 2. precision 3. limit of detection; 4. limit of quantification; 5.
specificity; 6. linearity and dynamic range.

37
The method accuracy is a correlation between the difference of concentration
measured in the analyte from a spiked and non-spiked sample, once the analyst will know the
amount of analyte added to the sample. Through this ratio is drawn the recovery rate, given by
the equation: Recovery ratio (concentration in the spiked sample – sample concentration) /
spiked concentration) (Papadoyannis, 2009a).
The method precision is an agreement measure between results of individual tests,
when the procedure is repeatedly applied to multiple samples of different composition. The
accuracy can be divided into three categories: repeatability or precision intra-assay,
intermediate precision or between days and reproducibility or inter laboratories precision
(ICH, 1994).
Sensitivity is the method ability to respond consistently to successive decreases the
analyte amount. Often, the detection limits (LD) and quantification limits (LQ) are used to
measure the method sensitivity. For chromatographic procedures, LD is defined as the lowest
analyte concentration that promotes a signal three times above the noise (variability is higher
than 2%) and LQ is the lowest concentration of analyte which provides a signal ten times
above the noise (variability is less than 2%) (Snyder et al., 1997; Papadoyannis, 2009a).
The linearity of an analytical method is its ability to extract results that are directly, or
by means of well-defined mathematical transformations, proportional to the concentration of
analytes in samples within a give range, this is interval between the lower and upper analyte
concentration for which it has been demonstrated that the analytical procedures haves a
suitable level of accuracy, precision, and linearity. The range is expressed in the same unit as
the analytical method`s results (Papadoyannis, 2009a).
Besides, chemometric tools have been frequently applied to the optimization and
validation of analytical methods. It consists in applying mathematical models to explain the
phenomena and chemical processes involved. The most used model is the central composite
design (CCD), allowing reduction in the number of experiments and therefore, less time
consuming and reagents. Its basic principle consists of isolating the main factors to trigger
responses known and modeling. However, unlike traditional models, CCD allows the
investigation of diverse all factors at the same time (Ferreira et al., 2007).
This has been used to improve the separation methodologies compounds in
pharmaceutical formulations (Hatambeygi et al., 2011), phytochemicals (Song et al., 2009),
acid mixtures (Wang et al., 2006) and isomers (Gonzalez et al., 2007). The CCD may be a

38
useful tool for folate studies since their forms have very similar chemical characteristics such
as homologues series and isomers.
Table 04 presents the main results of the last 10 years with respect to validation of
methodologies for folates quantification. Research has been performed in the steps of
extraction, cleaning, identification and quantification of folates, and in some cases it is
possible to achieve the status of previously validated method. For example, Patring and col.
(2007), using HPLC combined with mass spectrometry electrospray ionization and others
conditions, reached LD and LQ 0.2 to 0.6 ng/mL and the recovery rate of 89-106% for most
folates forms.
5. Perspectives and highlights
Folate, between the water soluble vitamins, is an emerging subject, so it has been
extensively studied in the last thirty years. Many studies have achieved to results that
contribute to ensure establishment of most trusted food composition tables. Brazil has not
accompanied the advance, and opted for food fortification only taking as basis the guidelines
of Food and Agriculture Organization and World Health Organization, since the composition
tables are weak in this regard.
Research with vitamin B9 has opened other fields of discussion, among them
mcontribution of folate intake on homocysteine levels. A better understanding of folate
metabolism through the study of gamma-glutamyl hydrolase, especially with regard to the
metabolism of antagonists drugs such methotrexate used to treat certain types of cancer,
autoimmune diseases and others.
In this respect the development of selective and appropriate methodologies in HPLC
contributed to advances in various areas of knowledge as for example in studies of public
health, biochemical or physiology. In addition when performed in one short space of time,
with security, can speeds up the acquisition of information that contributed to the prevention
and treatment of related disorders to folate deficiency.
6. References
Alexander, J.P., Ryan, J.T., Ballou, D.P., Coward, J.K. (2008) γ-Glutamyl Hydrolase: Kinetic
Characterization of Isopeptide Hydrolysis Using Fluorogenic Substrates. Biochemistry, 47, 4,
1228–1239.

39
Allen, L.H. Causes of vitamin B12 and folate deficiency.(2008) In Food and nutrition
bulletin. International Nutrition foundation, 29, 2, S20-S31.
AOAC (2002) Association Official Analytical Chemists Official Methods of Analysis. (17th
ed). Maryland: Association Official Analytical Chemists.
Arcot, J., Shrestha, A. (2005) Folate: methods of analysis. Trends in Food Science &
Technology, 16, 253–266.
Ball, G.F.M. (2006). Vitamins in foods: analysis, bioavailability, and stability. (1st ed).
United States of America, USA, Taylor & Francis Group: CRC press.
Beismanna S., Buchbergera W., Hertsensb, R., Klampfla, C.W. (2011). High-performance
liquid chromatography coupled to direct analysis in real time mass spectrometry:
Investigations on gradient elution and influence of complex matrices on signal intensities
Journal of Chromatography A , 1218, 5180-5186.
Breithaupt, D. E. (2001). Determination of folic acid by ion-pair RP-HPLC in vitamin-
fortified fruit juices after solid-phase extraction. Food Chemistry, 74, 521–525.
Brody, T., Shane,B. (2001). Folic Acid, in Rucker R.B.; Suttie, J.W.; Mccormik, D. B.;
Machlin, L.J. Handbook of vitamins. (3rd ed) (pp.427-462). New York, NY, USA: Basel.
Catharino, R. R., Godoy, H. T., Lima-pallone, J. A. (2006). Metodologia analítica para
determinação de folatos e ácido fólico em alimentos. Química Nova: 29, 5, 972-976.
Chang, H., Zhang, T., Zhang, Z., Bao, R., Fu, C., Wang, Z., Bao,Y., Li, Y., Wu, L., Zheng,
X., Wu. J. (2011). Tissue-specific distribution of aberrant DNA methylation associated with
maternal low-folate status in human neural tube defects. Journal of Nutritional Biochemistry,
22, 1172-1177.

40
Dang, J., Arcot, J., Shrestha, A. (2008). Folate retention in selected processed legumes. Food
chemistry, 68, 295-298.
David, L. N., Michael, M.C. (2011). Vitamins. In Biochemistry principles of Lehninger. (5th
ed) (pp.254-256).
Doherty, R.F., Beecher, G.R. (2003). A Method for the Analysis of Natural and Synthetic
Folate in Foods. Journal Agricutural and Food Chemistry, 51, 354-361.
Donald B. McCormick (2001). Bioorganic Mechanisms Important to Coenzyme Functions. in
Rucker R.B.; Suttie, J.W.; Mccormik, D. B.; Machlin, L.J. Handbook of vitamins. (3rd ed)
(pp.427-462). New York, NY, USA: Basel.
Drug Bank (2012). Open data drug & drug target database. Retrieved January 10, 2012 from:
http://www. drugbank.ca/drugs/DB00158.
Eichholzer, M., Zimmermann, O.T.R. (2006). Folic acid: a public-health challenge. Lancet,
367, 1352–1361.
Eitenmiller, R.R., Lander Jr., W.O. (2008). Vitamin analysis for the health and food sciences.
(2nd ed) (pp.443-505). United States of America, USA, Taylor & Francis Group.
Fenech, M. (2011). Mutation Research/Fundamental and Molecular Mechanisms of
Mutagenesis, Folate (vitamin B9) and vitamin B12 and their function in the maintenance of
nuclear and mitochondrial genome integrity. Mutation Research, in press.
Fennema, O. R. (2000). Química de los alimentos. (2nd ed) (pp.348–490). Zaragoza, Acribila;
Ferreira, S.L.C., Bruns, R.E., Ferreira, H.S., Matos, G.D., David, J.M., Brandão, G.C., Silva,
E.G.P., Portugal, L.A., Reis, P.S., Souza, A.S., Santos, W.N.L. (2007). Box-Behnken design:

41
An alternative for the optimization of analytical methods. Analytica Chemical Acta, 597, 179–
186.
Finglas, P. M., Wigertz, K., Vahteristo, L., Witthoft, C., Southon, S., Froidmont-Gortz, I.
(1999). Standardization of HPLC techniques for the determination of naturally-occurring
folates in food. Food Chemistry, 64, 245-255.
Ginting,E., Arcot, J. (2004). High-Performance Liquid Chromatographic Determination of
Naturally Occurring Folates during Tempe Preparation. Journal Agricultural Food Chemistry,
52, 26, 7752–7758.
Gliszczynska-swiglo, A. (2007). Folates as antioxidants. Food Chemistry, 101, 1480–1483.
Gonzalez, A., Foster, K.L., Hanrahan, G. (2007). Method development and validation for
optimized separation of benzo[α]pyrene–quinone isomers using liquid chromatography–mass
spectrometry and chemometric response surface methodology. Journal of Chromatography A,
1167, 135–142.
Gutzeit, D., Mönch, S., Jerz, G., Winterhalter, P., Rychlik, M. (2008). Folate content in sea
buckthorn berries and related products (Hippophaë rhamnoides L. ssp. rhamnoides): LC-
MS/MS determination of folate vitamer stability influenced by processing and storage
assessed by stable isotope dilution assay. Anal Bioanal Chem, 391, 211–219.
Hanson, A.D., Gregory J. F. (2002). Synthesis and turnover of folates in plants. Physiology
and metabolism, 5, 244–249.
Hatambeygi, N., Abedi,G., Talebi, M. (2011). Method development and validation for
optimised separation of salicylic, acetyl salicylic and ascorbic acid in pharmaceutical
formulations by hydrophilic interaction chromatography and response surface methodology.
Journal of Chromatography A, 1218, 5995– 6003.

42
Hefni, W., Vohrvik, V., Tabekha, M., Witthoft, C. (2010) Folate content in foods commonly
consumed in Egypt. Food Chemistry, 121, 540–545.
ICH (1994) Validation of analytical procedures: text and methodology Q2 (R1). 4ver., 1-13.
IUPAC-IUB (1987). Nomeclature and symbols for folic and related compounds. 59,6, 833-
836.
Jandera, P. (2009). Isocratic HPLC: System selection. Encyclopedia of Chromatography, 3
ed. United States of America: Taylor & Francis Group, 1,1, 1291-1301.
Jastrebova, J., Witthoft, C., Grahn, A., Svensson, U., Jagerstad, M. (2003). HPLC
determination of folates in raw and processed beetroots. Food Chemistry, 80, 579–588.
Jastrebova J; Strandler, H.S.; Patring, J.; Wiklund, T. Comparison of UPLC and HPLC for
Analysis of Dietary Folates. Chromatographia, 2011, 73, 219–225.
Jing-zheng Songa, J.Z., Chun-feng Qiaoa., Song-lin Li A., Yan Zhoua, ming-tsuen Hsiehb,
Hong-xi Xu. (2009). Rapid optimization of dual-mode gradient high performance
liquidchromatographic separation of Radix et Rhizoma Salviae Miltiorrhizae by response
surface methodology. Journal of Chromatography A, 1216, 7007–7012.
Johansson, M., Furuhagen, C., Frolich, W., Jagerstad, M. (2008). Folate content in frozen
vegetarian ready meals and folate retention after different reheating methods. LWT – Food
Science and Technology, 41, 3, 528-536.
Johnston, K. E., Lofgren, P. A., Tamura, T. (2002). Folate concentrations of fast foods
measured by trienzyme extraction method. Food Research International, 35, 565–569.
Konings, E.J.M. (1999). A validate liquid chromatographic method for determining folates in
vegetables, milk powder, liver and flour. Journal of AOAC International, 82, 1, 119- 127.

43
Lim, H. S., Mackey, A. D., Tamura, T., Wong, S. C., Picciano, M. F. (1999). Measurable
human milk folate is increased by treatment with a-amylase and protease in addition to folate
conjugase. Food Chemistry, 63, 3, 401-407.
Mahan, L. K., Escott-stump, S. (2003). Krause, Alimentos Nutrição e Dietoterapia. (10th ed)
(pp 578-590.). São Paulo, SP: Roca.
Martin, H., Comeskey, D., Simpson, R.M., Laing, W.A., Mcghie, T.K. (2010). Quantification
of folate in fruits and vegetables: A fluorescence-based homogeneous assay. Analytical
Biochemistry, 402, 137–145.
Martin, J.I., Landen, W.O., JR. Soliman., Eitenmiller, R.R. (1990). Application of a tri-
enzyme extraction for total folate determination in foods. Journal. Association Official
Analytical Chemistry, 73, 805-808.
Melse-boonstra, A., Verhoef, P., Konings, E.J.M., Dusseldorp, M.V., Matser, A., Hollman,
P.C.H., Meyboom, S., Kok, F.J., West, C.E. (2002). Influence of Processing on Total,
Monoglutamate and Polyglutamate Folate Contents of Leeks, Cauliflower, and Green Beans.
Journal Agricultural and Food Chemistry, 50, 3473-3478.
Miller, A., Mujamdar, V., Palmer, L., Bower, J.D., Tyagi, S.C. (2002). Reversal of
endocardial endothelial dysfunction by folic acid in homocysteinemic hypertensive rats.
American Journal of Hypertension, 15, 2, 157-163.
Ndaw S., Bergaentzlé, M., Aoudé-werner, D., Lahély, S., Hasselmann, C. (2001).
Determination of folates in foods by high-performance liquid chromatography with
fluorescence detection after precolumn conversion to 5-methyltetrahydrofolates. Journal of
Chromatography A, 928, 77–90.
Nilsson, C., Johansson, M., Yazynina, E., Stralsjo, L., Jastrebova, J. (2004). Solid-phase
extraction for HPLC analysis of dietary folates. Eur Food Res Technol, 219, 199–204.

44
Osseyi, E. S., Wehling, R. L., Albrecht, J. A. (1998). Liquid chromatographic method for
determining added folic acid in fortified cereal products. Journal of Chromatography A, 826,
235–240.
Paixão, J. A., Stamford, T. L. M. (2004). Vitaminas lipossolúveis em alimentos-Uma
abordagem analítica. Quimica Nova, 27, 1, 96-105.
Paixão,J.A. (2010). UV-Visible Detection Including Multiple Wavelengths. In Encyclopedia
of Chromatography, (3rd ed) (pp.2392-2405) United States of America, USA, Taylor &
Francis Group.
Papadoyannins, I.N., Tsioni, G. K., Samanidou, V.F. (1997). Simuntaneous determination of
nine water and fat soluble vitamins after SPE separation and RP-HPLC analysis in
pharmaceutical preparations and biological fluids. J.Liq. Chrom. & Rel. Technol, 20, 19,
3203-3231.
Papadoyannins, I.N., Samanidou, V.F. (2009a). HPLC instrumentation: Validation. In
Encyclopedia of Chromatography, (3rd ed) (pp.1118-1132). United States of America, USA,
Taylor & Francis Group, 1, 1.
Papadoyannins, I.N., Samanidou, V.F. (2009b). Sample preparation for HPLC. Encyclopedia
of Chromatography, (3rd ed) (pp.2090-2105). United States of America, USA, Taylor &
Francis Group, 1, 1.
Patring, J. D. M. & Jastrebova, J. A. (2007). Application of liquid chromatography–
electrospray ionisation mass spectrometry for determination of dietary folates: Effects of
buffer nature and mobile phase composition on sensitivity and selectivity. Journal of
Chromatography A, 1143, 72–82.
Patring, J. D. M., Johansson, M. S., Yazynina, E., Jastrebova, J. A. (2005). Evaluation of
impact of different antioxidants on stability of dietary folates during food sample preparation
and storage of extracts prior to analysis. Analytica Chimica Acta, 553, 36–42.

45
Patring, J., Wandel, M., Jagerstad, M., Frølich, W. (2009). Folate content of Norwegian and
Swedish flours and bread analysed by use of liquid chromatography–mass spectrometry.
Journal of Food Composition and Analysis, 22, 649–656.
Pfeiffer, C. M., Rogers, L. M., Gregory III, J. F. (1997). Determination of Folate in Cereal-
Grain Food Products Using Trienzyme Extraction and Combined Affinity and Reversed-
Phase Liquid Chromatography. J. Agric. Food Chem, 45, 407-413.
Phillips, K.M., Ruggio, M.D., Haytowitz, D.B. (2011). Folate composition of 10 types of
mushrooms determined by liquid chromatography–mass spectrometry Food Chemistry, 129,
630–636.
Prieto, S. P., Grande, B. C., Falcón, S. G., Gándara, J. S. (2006). Screening for folic acid
content in vitamin-fortified beverages. Food Control, 17, 900–904.
Quirós, A. R.B., Ron, C. C., López-hernández, J., Lage-yusty, M.A. (2004). Determination of
folates in seaweeds by high-performance liquid chromatography. Journal of Chromatography
A, 1032, 135–139.
Rizzolo, A., Polesello, S. (1992). Review-Chromatographic determination of vitamins in
food. Journal of Chromatography, 624, 103-152.
Ruggeri, S., Vahteristo L. T., Aguzzi, A., Finglas P., Carnovale E. (1999). Determination of
folate vitamers in food and in Italian reference diet by high-performance liquid
chromatography. Journal of Chromatography A, 855, 237–245.
Sanderson, P., Mcnulty, H., Mastroiacovo, P., Mcdowell, I.F.W., Melse-boonstra, A., Finglas,
P.F., Gregory, J.F. (2003). Folates Bioavailability: UK Food Standard Agency Workshop
report. British Journal of Nutrition, 90, 473 -479.

46
Skoog, D.A.; Leaty, J.J. (1992). Principles of Instrumental Analysis. (4th ed) (pp.490-512).
Saunders College Publishing, NY.
Snyder, L.R., Kirkland, J.J., Glajch, J. L. (1997). Pratical HPLC method development. In
John Wiley & Sons, (2nd ed) (pp.700). New York, NY.
Soongsongkiat, M., Puwastien, P., Jittinandana, S., Dee-uam, A., Sungpuag, P. (2010).
Testing of folate conjugase from chicken pancreas vs. commercial enzyme and studying the
effect of cooking on folate retention in Thai foods. Journal of Food Composition and
Analysis, 23, 681–688.
Stea, T. H., Johansson, M., Jagerstad, M., Frølich, W. (2006). Retention of folates in cooked,
stored and reheated peas, broccoli and potatoes for use in modern large-scale service systems.
Food Chemistry, 101, 1095–110.
TACO - Tabela brasileira de composição de alimentos (2006) Ver II, (2nd ed) (pp.113),
NEPA-UNICAMP Campinas, SP.
Tamura, T. (1998). Determination of food folate. Nutritional Biochemistry, 9, 285-293.
Vahteristo, L., Finglas, P. M., Witthoft C., Wigertq, K., Seale R., Froidmont-gohtz I. (1996).
Third EU MAT intercomparison study on food folate analysis using HPLC procedures. Food
Chemistry, 57, 1, 109- 111.
Vahteristo, L.T., Ollilainen, V., Koivistoinen, P.E., Varo, P. (1996). Improvements in the
Analysis of Reduced Folate Monoglutamates and Folic Acid in Food by High-Performance
Liquid Chromatography. J. Agric. Food Chemistry, 44, 477-482.
Verlinde, P., Oey, I., Hendrickx, M., Loey, A.V. (2008). High-pressure treatments induce
folate polyglutamate profile changes in intact broccoli (Brassica oleraceae L.cv. Italica).
Food Chemistry, 111, 1220-229.

47
Vishnumohan, S., Arcot, J., Pickford, P. (2011). Naturally-occurring folates in foods: Method
development and analysis using liquid chromatography–tandem mass spectrometry (LC–
MS/MS). Food Chemistry, 125, 736–742.
Wang, Y., Harrison, M., Clark, B.J. (2006). Optimising reversed-phase liquid
chromatographic separation of an acidic mixture on a monolithic stationary phase with the aid
of response surface methodology and experimental design. Journal of Chromatography A,
1105, 199–207.
Yazynina, E., Johansson, M., Jägerstad, M., Jastrebova, J. (2008). Low folate content in
gluten-free cereal products and their main ingredients. Food Chemistry, 111, 236–242.
Zappacosta, B., Persichilli, S., Iacoviello, L., Di Castelnuovo, A., Graziano, M., Gervasoni, J.,
Leoncini E., Cimino, G., Mastroiacovo, P. (2011). Folate, vitamin B12 and homocysteine
status in an Italian blood donor population. Nutrition, Metabolism & Cardiovascular
Diseases, in press.

48
Table 01. Extraction conditions of folate conjugase from different sources.
References Source conjugase
enzyme Extraction methodology procedure and stability conditions
Vahteristo et al., 1996
Pig kidney Conjugase kidney pig prepared according to Gregory et al, 1984.
Konings et al., 1999
Fresh rat plasma
Pig kidney
Rat blood was collected with heparin and centrifuged at 3000 g for 15 '. Plasma collected was transferred to 100 ml dialysis buffer - 50 mM CHES buffer and 50 mM HEPES buffer. pH 7.85 dialyzed for 24 h at 4 ° C. The rat plasma dialysate was stored in portions of 0.5 mL for up to 3 months at -80 ° C. The activity of plasma was checked with pte-glu3 in 40 mmol PteGlut3 desconjugado for 20 minutes at 37 ° C. The reaction environment for conjugase was 75 mM K2HPO4 containing 1% ascorbic acid and 0.1% 2-mercaptoethanol, pH 4.5. The method of Lineweaver-Burk was used to calculate the kinetic parameters of yield Km; The material obtained from a slaughterhouse and quickly stored in ice. 800g of kidney tissue were homogenized at 2°C in 2.400 ml of 10 mM 2-mercaptoethanol. The suspension was adjusted to pH 5.0 with 1M acetic acid, and then centrifuged at 10,000 g for 20 minutes at 2 ° C. The supernatant was heated to 50 ° C water bath for two hours with gentle agitation. And then recentrifuged at 10,000 g for 20 minutes at 2 ° C. The resulting supernatant fraction, which was precipitated in ammonium sulfate at a concentration of 50 to 75% and dialyzed overnight with 0.05 M potassium acetate, pH 5.0,containing 10 mM 2-mercaptoentanol 2 ° C. 24 mg protein per mL , was stored in small portions at -35 ° C until used. This preparation was stable for up to 10 months under these storage conditions.
Dang et al., 2000 Fresh human plasma Fresh human plasma used in deconjugation without any pretreatment in aliquots of 10 ml.
Ndaw et al., 2001 Chicken pancreas Rat plasma Pig kidney
Conjugase pancreas of chicken and of rat’s plasma prepared according to Konings, 1999, and pig kidney conjugase prepared fresh kidney as described by Pedersen 1988. Each preparation of conjugase activity was analyzed using PteGlu3 (35 to 80 nmol) as substrate - of rats plasma, 500 ul in 30 ml of 100 mM phosphate buffer pH 7, containing 1% L-ascorbic acid, 2 h at 37 ° C. pig

49
Kidney: 500 ul in 30 mL of 100 mM phosphate buffer pH 4.5, containing L-ascorbic acid, 2 h at 37 ° C. Chicken pancreas: 5 mg in 100 ml of 30 mM phosphate buffer pH 4.5, containing L-ascorbic acid, 1 h at 37 ° C.
Jastrebova et al., 2003
Pig kidney Suspension of pig kidney conjugase was prepared according to Phillips and Wright (1983), by homogenization of 10g of pig kidney acetone powder in 100 ml of L-cysteine hydrochloride (10 mg/ ml, pH 4.6 adjusted with NaOH and incubated for 4 h at 37 ° C and then centrifuged at 40.000 g for 30 '. The supernatant was added 20 ml of a mixture of charcoal and dextrin prepared by adding 1 g of dextrin per 10g of charcoal with a final volume of 100 ml of distilled water. After 30 minutes at room temperature the mixture was centrifuged and the supernatant fraction resuspended with 100 ml of L-cystein hydrochloride and stored at -20 °C. The enzyme was isolated from the resulting supernatant according to Gregory et al, 1984. The activity of each enzyme preparation was checked using PteGlu3 as a substrate in 0.1 M acetate buffer (pH 4.9) containing 1% sodium ascorbate at 37 ° C. PteGlu3 concentrations and folic acid produced were measured by HPLC with UV detection
Doherty and Beecher, 2003.
Rat plasma Human plasma
Rat plasma and lyophilized human plasma obtained from Sigma, reconstituted in 0.1 M potassium phosphate buffer pH 6.0.
Ginting et al., 2004
Fresh human plasma Fresh human plasma without any pretreatment purification was added to extract the food matrix. Before using the activity of human plasma conjugase was evaluated by 0:34 mmol PteGlu3 as substrate at pH 6.0 in 0.05 M CHES-HEPES buffer containing 2% sodium ascorbate and 0.01 ml of 2-mercaptoethanol at 37 ° C for 4h. The mixture was filtered after incubation and denaturation and injected without any purification. The conjugase activity was considered to be adequate when the peak area of folic acid was greater than 90% of the total area of Pteglu3 folic acid.
Patring et al., 2005
Rat plasma 10 ml of rat plasma was dialyzed in three steps of 40 minutes each, using 800 ml of 50 mM phosphate buffer, pH 6.1 containing 0.1% 2-mercaptoethanol at each step. Dialysis was carried out under agitation at 4 ° C. The activity of folate conjugase was checked using Pteglu3 as substrate at 37 ° C as described by Pfeiffer, 1997. Concentrations of PteGlu3 and folic acid produced were measured by UV detection at 290 nm using HPLC methodology. The dialysate of rat plasma was stored at -20 ° C for 1 month. To avoid a possible adverse effect due to freezing and thawing, during storage in a freezer, the serum of rat plasma was stored in small portions (0.5 mL). The enzyme activity was always checked prior to use.
Stea et al, 2006 Rat plasma Rat plasma was prepared according Patring et al, 2005.
Yazynina et al., 2008.
Chicken pancreas Rat plasma
Lyophilized chicken pancreas and of rat plasma were used as a source of folate conjugase. Suspension of chicken pancreas (5mg/ml) was prepared starting from 50 mg of freeze-dried chicken pancreas. Rat’s plasma was dialyzed to remove endogenous folate according Patring et al, 2005, and was stored in portions of 0.5 ml at -20 ° C for up to a month.

50
Table 02. Procedure for extraction and cleaning of food matrices for folates analysis. References Food matrices Extraction condition Enzymatic treatment Cleaning conditions Antioxidant system Vahteristo, et al., 1996.
Vegetables and berries Potassium phosphate buffer (pH 6.0, 4.9 and 7.85), N2 flow, storage at -20 ° C 1 week before analysis.
1-α-amylase for 3 hours, adjust pH 4.9 (for samples rich in starch) 2 - hog kidney conjugase at 37 ° C for 3 - 5 hours
SPE strong anion exchange (SAX)
Was not used
Pfeiffer et al., 1997.
Wheat flour for bread, white bread, white rice, spaghetti, breakfast cereals, brown rice fortified and unfortified
CHES pH 7.85 HEPES buffer (50 mM) of each, mixed for 10 minutes, 100 °C
Treatment 1 - rat plasma conjugase 50 µl (1.2 and 4 h 37 ° C pH 6.2 to 7.5). Treatment 2 - rat plasma conjugase 50µl and α-amylase (1.0 mL) 37 ° C followed by 4h protease 2.0 mL 37 ° C 4h. 5000 g centrifugation 10 minutes.
Affinity column (Affigel 10 - Folate Linked Protein) equilibrated with 0.1 M potassium phosphate buffer (pH 7.0) mobile phase, 0.02 M trifluoroacetic acid and 0.01m dithiothreitol. Flow of 3 mL / min
2% sodium ascorbate and 10 mM 2-mercaptoethanol during extraction and cleanup.
Osseyi et al., 1998.
Fortified breakfast cereals based on corn, wheat and oats.
Phosphate buffer (0.1 M, pH 8 - 9 with antioxidant system, stirring for 1 hour 50 minutes, adjusted pH 6.9, N2 flow to stock up to 3 months.
α-amylase solution (25 mg / mL, 1 mL was used per g of sample to 65 ° C for 1 hour) by 5000 g centrifugation for 15 minutes
SPE strong anion exchange (SAX), conditioned with hexane and methanol. Mobile phase, 0.1 M sodium acetate pH 4.5 (with antioxidant system).
0.05% ascorbic acid (cleaning) and 0.05% sodium ascorbate (extraction).
Ruggeri et al., 1999.
Chickpeas, beans, salami, ham and Italian reference material.
Dried vegetables: CHES and HEPES buffer pH 7.85; samples of animal origin: phosphate buffer (pH 6.0 0.1 M), both - N2, flow 10 minutes at 100 ° C, centrifugation 30 min 13.500 rpm (2.5g sample to 35 ml buffer)
Conjugase pig kidney (pH 4.9, 37 ° C for 3 hours. 1ml to 25 ml sample) + α-amylase (20mg/ml) After 2 hours: protease (2mg/ml) pH 7.0, 37 ° C for 1 hour centrifugation 11,950 g for 15 minutes
Affinity column (Affi Gel 10 - Protein Linked to Folate) low pH mobile phase elution - trifluoroacetic acid at a flow rate <1µg of sample (78-113% recovery)
2% sodium ascorbate, 10 mM 2-mercaptoethanol (vegetable sample), 1% sodium ascorbate and 0.1%2-mercaptoethanol (animal samples)
Ndaw, et al., 2001.
Yeast, spinach, beef, liver, peas, fruit juice, egg yolk, milk powder, wheat flour, apple.
Potassium phosphate buffer (pH 7.0) 100 ° C for 10 minutes centrifugation at 5000 rpm 10 minutes
A - Conjugase chicken pancreas (2 hours at 37 ° C), or rat plasma conjugase (37 ° C for 1h)
Affinity column (Affigel 10 - Protein Folate Linked) pH 7.0. And elution with trifluoroacetic acid and
1% of L - ascorbic acid, the extraction step and 40% L-ascorbic acid in pre-column conversion

51
B - pronase, α-amylase (pH 6.0 / 100 ° C 10 '), adjust pH 7.0 Centrifuge at 5000 rpm for 10 minutes. Conjugase pancreatic chicken (2 h at 37 ° C), or rat plasma conjugase (37 ° C for 1 hour)
dithiothreitol in 3ml/min flow;
of folates to 5-methyltetrahydrofolate.
Breithaupt, 2001.
Apple juice, cherry nectar, nectar and black cherry fruit juices fortified nine.
Was not used Was not used SPE strong anion exchange (SAX) (two cartridges in series) activated with n-hexane, methanol and water. Mobile phase-sodium acetate containing 0.1M sodium chloride 10% (w/v) with the antioxidant system.
1% L-sodium ascorbate (in cleanup step)
Jastrebova et al., 2003.
Beetroot raw and processed and mixed vegetables (reference material)
Phosphate buffer (pH 6.0 with 0.1M antioxidant system and N2 flow at 100 °C 10 minutes, adjust pH: 4.9
Conjugase pig kidney (10 mg / ml - solution of L-cysteine hydrochloride at pH 4.9 at 37 ° C for 3 hours) 27 000 g centrifugation for 15 minutes
SPE strong anion exchange (SAX) - anion exchanger cartridge conditioned with methanol and water mobile phase, 0.1 M sodium acetate containing 10% sodium chloride (w/v) with the antioxidant system.
2% L-sodium ascorbate and 0.1% 2-mercaptoethanol (extraction step) and 1% ascorbic acid and 0.1% 2 - mercaptoethanol (cleanup step).
Doherty and Beecher, 2003.
Orange juice concentrate, enriched refined wheat flour, frozen spinach, nonfat milk powder, infant formula SRM 1846, whole wheat flour BCR 121, BCR 421 milk powder, frozen vegetable mix BCR 485 (reference samples).
0.1 M potassium phosphate, pH 6.0 For orange juice the initial pH of the mixture was adjusted from 4.8 to 6.0. It used 1 mL of amylase incubated at 37 ° C for 1 hour. 1 ml of protease solution for 3 hours incubation at 37 ° C and 0.2 mL of rat plasma was added and incubated at 37 ° C. Heating at 90 ° C water bath for 15 minutes. 4000 g
SPE - silica anion exchanger cartridge (styrene-divinyl-benzene). Conditioned with 0.1 M phosphate, pH 6.0 and 1M sodium chloride containing 250 mL / L acetonitrile.
10 mM mercaptoethanol, 10 mM ascorbic acid and 10 mg L sodium azide

52
centrifugation for 20 minutes. Quirós et al., 2004.
Seaweeds of Spain Phosphate buffer (pH 6.0 with 75 mM antioxidant system and N2 flow) shake 20 seconds, 100 ° C 10 minutes after centrifugation 11,000 g for 20 minutes, adjusting the pH to 4.9.
Conjugase pig kidney (1 mL of conjugase for 3 mL of sample with N2 flow) 3 hours 37 ° C pH 4.9.
SPE - anion exchanger cartridge conditioned with methanol and water. Mobile phase, 0.1 M sodium acetate containing 10% sodium chloride (w/v) with the antioxidant system.
0.1% mercaptoethanol and 2% ascorbic acid (extraction step) 1% ascorbic acid (in cleanup step)
Catharino and Godoy, (2006).
Pig liver, milk powder and mixtures of vegetables (reference material).
Crushed material at 0.05 mol/L-1 ammonium acetate (1 g sample /9 mL solution), ultrasonic bath 10 minutes.
Was not used Purification of the extract with trichloroacetic acid and volume completed with 5µL ammonium acetate.
Was not used
Pietro et al., 2006.
Fortified beverages (milk, fruit nectar, yogurt, sports drinks)
Was not used Was not used SPE - strong anion exchange (SAX) cartridge conditioned with methanol and water. Mobile phase - methanol (3 mL) and sodium acetate (20 mmol/L-1 50:50) pH 4.
Was not used
Yazynina et al., 2008.
Products free of gluten (corn starch, potato starch, rice flour, mix flour, three varieties of bread without the use of gluten and lactose free).
80mL potassium phosphate buffer in 0.1 M, pH 6.2 for each 1 g sample, 1 hour at 75 ° C after 15 minutes centrifugation 27.000 g 4 ° C, the supernatant obtained subsequent to step
Treatment 1: deconjugation extract (5.75 ml) with 144µl of rat plasma dialysate at 37 ° C for 3 hours. Or 750µL of chicken pancreas extract to 30 mL at 37 ° C for 3 hours. Treatment 2: α-amylase solution (40µL) for each 80 mL of extracting at 100 ° C for 10 minutes or 75 ° C for 1 hour. After following a treatment 1. Treatment 3: Use the 2 treatment added 0.8 mL of protease solution at 37 ° C for 1 hour. Centrifugation at 27.000 g
SPE - silica cartridge, using vacuum pressure to the flow. Conditioning with methanol (2 x 2.5 ml) followed by the 0:03 mol/L-1 H3PO4 containing 1% ascorbic acid.
2% (w/v) sodium ascorbate and 0.1% (v/ v) mercaptoethanol

53
for 15 min at 4 ° C. Label: H4 folate - tetrahydrofolate; 5-CH3-H4 folate - 5-methyltetrahydrofolate; 5-HCO-H4- folate - 5-formyltetrahydrofolate; 10-HCO-folate- 10 - formyl folic acid; 5,10-CH2-H4-folate - 5,10-
Methylenetetrahydrofolate; 5,10-CH +-H4-folate - 5.10-meteniltetraidrofolato; 10-HCO- H2-folate - 10-methyl folic acid; 10-CH3-folate - 10-methyl folic acid.

54
Table 03. Mobile phases and columns used in HPLC for separation of folates.
References Stationary phases Mobile phases Standard (time retention min)
Elution conditions
Vahteristo, et al., 1996.
Reverse phase - C18 (5µm, 250 x 4.6 mm) C18 guard column (3µm, 150 x 4.6 mm).
Acetonitrile and potassium phosphate buffer.
H4-folate (20.0), 5-CH3-H4-folate (23.0), 5-HCO-H4 folate (25.4)
Gradient, initially 9% acetonitrile gradually increasing to 25% by 14 minutes, total time of analysis 30 minutes.
Pfeiffer et al., 1997. Reverse-phase C18 (4.6 x 250 mm 5.0 µm)
Acetonitrile and phosphoric acid (33mmol/L-1 pH 2.3)
Folic acid (27.0), 5-HCO-H4 folate (24.7) 5-CH3-H4-folate (21.1), 10-HCO-folate (23.7), 10-HCO-H4-folate (21.9)
Gradient 5% acetonitrile maintained for 8 minutes then increased to 17.5% in 25 minutes, total time of analysis 33 minutes.
Osseyi et al., 1998. Reverse-phase C18 (100 x 4.6 mm, 3µm) and C18 guard column (30 x 2.1 mm, 5µm).
Methanol and potassium phosphate buffer (0.0035 M KH2PO4 and 0.0032 M K2HPO4 pH 6.8) containing 0.005mol/L-1 tetrabutylammonium dihydrogen phosphate
Folic acid (15.0) Isocratic, Methanol (24-26%) and aqueous phosphate buffer (76-74%)
Ruggeri et al., 1999. Reverse phase - C18 column (150x 4.6 mm, 3 µm)
Acetonitrile and phosphate buffer (pH 2.2 30 mmol/L-1)
H4-folate (20.7), 5-CH3-H4-folate (24), 5-HCO-H4-folate (27.3), folic acid (8.28), 10-HCO-folate (5.26) 5,10-CH2-H4-folate; 5,10-CH+-H4-folate, 10-HCO-H4-folate (24.4).
Gradient, starting with 5% acetonitrile maintained for 9 minutes, progressing to reach 17% within 30 minutes, and then finishing the race.
Ndaw, et al., 2001. Reverse-phase - C18 (250 x 5 mm 5 µm) and C18 guard column (4x4 mm 5 µm).
Folate monoglutamate: Acetonitrile and phosphate buffer (pH 2.3) 5-methyltetrahydrofolate: Acetonitrile and phosphate buffer (pH 4.6)
10-formyltetrahydrofolate; 5,10-methenyltetrahydrofolate; 5,10-methylenetetrahydrofolate; folic acid polyglutamates; tetrahydrofolate; 5-methyltetrahydrofolate; 5-formyltetrahydrofolate; 10- quantum yield of some folates present obstacles to 4 Formyltetrahydrofolate
Folate monoglutamate: Gradient, started 8 minutes with 5% acetonitrile reaching 10% in 8 to 10 minutes, and 20% between 10 and 17 minutes. Final composition of the mobile phase 20% acetonitrile maintained for 5 minutes. Return to initial composition in 15 minutes. Gradient 5-

55
5-CH3-H4-folatePteglu1-18 (10-20 min)
methyltetrahydrofolate started 100% phosphate buffer, increasing to 10% acetonitrile in 15 minutes and 20% in 20 minutes. Return to initial composition of 45 minutes.
Breithaupt, 2001. Reverse-phase C18 (250 x 4.6 mm 5.0 µm) guard column C18 (4.0 x 20 mm 5.0 µm)
Solution 5mmol/L-1 tetra-n-butilamonium hydrogen with 25 mmol/L-1 sodium chloride in water(a) and dihydrogen orthophosphate potassium phosphate (1 mmol/L-1 in water) (b) and 65% acetonitrile
Folic acid (16.9) Gradient; Start isocratic 10% B for 10 minutes, B was increased to 36% in 15 minutes, 50% in 35 minutes in 38 minutes turned the initial composition, so it remained for 5 '.
Jastrebova et al., 2003.
Reverse-phase C8 (150 x 4.6 mm, 5 µm) and guard column (12.5 x 4.6 mm, 5 µm)
Potassium phosphate buffer (30 mmol/L-1 pH 2.3) and acetonitrile
H4-folate (15.8), 5-HCO-H4-folate (21.7) 5-CH3-H4-folate (17)
Gradient, started 6% v/ v acetonitrile for 5 min reaching 25% in 20 minutes and remained for 33 minutes.
Doherty and Beecher, 2003.
Reverse phase - C18 column (150 x 4.6 mm, 3 µm)
30 mmol/L-1 potassium phosphate pH 2.2 (mobile phase) with 10 mg/l sodium azide and acetonitrile (mobile phase b)
Folic acid (19.0), 5-CH3-H4-folate (15.6).
5 minutes with 99% mobile phase A and 1% mobile phase B in 20 minutes and then the gradient was adjusted to 80% and 20% B, followed by a step gradient of 60% A for 5 minutes, after return to the initial condition
Quirós et al., 2004. Reverse-phase C18 (5µm, 250 x 4.6 mm) C18 guard column (5µm, 15 x 4.0 mm)
Phosphate buffer 30 mmol/L-1 (pH 2.2) and acetonitrile
5-CH3-H4-folate (5.09) H4-folate (5.04), 5-HCO-H4-folate (8.5), folic acid (9.00).
Gradient: start 4 minutes 10% acetonitrile, 8 minutes 15% acetonitrile and return the original composition.
Catharino and Godoy, 2006.
Reverse-phase - C18 column (5 µm, 250x 4.6 mm) and C18 guard column (5 µm, 10 x 4.6 mm)
2% acetic acid adjusted to pH 2.8 with potassium hydroxide (solution acidified) and acetonitrile
H4-folate (19.12) 5-CH3-H4-folate (20,50), 5-HCO-H4-folate (22.50) 10-HCO-folate (21.52) 10-CH3-folate (27.72), folic acid (26.14).
Gradient, started 100% solution acidified, reaching 76% in 25 ', and kept until the end of the analysis for 31 minutes.
Pietro et al., 2006. Reverse-phase C18 (5µm, 150 x 4.6 mm) guard column C18 (40
Methanol and ammonium acetate (8 mmol/L-1)
Folic acid (5.03) Gradient, started 9% methanol for 6 minutes, 7 minutes in

56
µm, 50 x 4.6 mm) methanol increased to 50% and so continued for 5 minutes, return the initial composition in 5 minutes.
Yazynina et al., 2008.
Reverse-phase - C18 column (150x 4.6 mm, 3 µm) Aquasil, C18 guard column (1 mm)
30 mmol/L-1 potassium phosphate buffer pH 2.3 and acetonitrile
Folic acid (25.3), 5-CH2-H4-folate (); H4-folate (19.7), 5-CH3-H4-folate (21.2), 5-HCO-H4-folate (24.7); 10-HCO-folate (23.7).
Gradient initial 6% (v / v) acetonitrile maintained isocratic for 5 minutes then the acetonitrile was increased to 25% for 20 minutes, total run time was 42 minutes.
Label: H4 folate - tetrahydrofolate; 5-CH3-H4 folate - 5-methyltetrahydrofolate; 5-HCO-H4- folate - 5-formyltetrahydrofolate; 10-HCO-folate- 10 - formyl folic acid; 5,10-CH2-H4-folate - 5,10-
Methylenetetrahydrofolate; 5,10-CH +-H4-folate - 5.10-meteniltetraidrofolato; 10-HCO- H2-folate - 10-methyl folic acid; 10-CH3-folate - 10-methyl folic acid

57
Table 04. Usual condition of quantification for folate analysis.
References Detection system Limit of detection and quantification LOD/LOQ
Recovery rate (%)
Vahteristo, et al., 1996. Fluorescence, excitation 290 nm and emission 356 nm H4-folate, 5-CH3-H4 folate, 5-HCO-H4 folate, folic acid, 360 nm and emission 460 nm fluorescence 10-HCO-AF UV-Vis spectroscopy.
LOD H4-folate 0.003 ng; 5-CH3-H4 folate 0.002 ng; 5-HCO-H4-folate 0.05 ng; folic acid 1.4 ng; 10-HCO-AF 0.04 ng per injection
79-92 5-CH3-H4-folate, 60 – and 50-80 respectively H4- folate and 5-HCO-H4folate 50 and 80, respectively. 60-70- 10-HCO-folic
Pfeiffer et al., 1997. Diode array detector 10-HCO-H2- folate (7 pmol per injection) and 5-CH3-H4-folate, 10-HCO-folate, 10-HCO-H4-folate, folic acid (4.2 pmol per injection)
Folic acid (87.9), 5-HCO-H4-folate (85.3) 5-CH3-H4-folate (94.8), 10-HCO-folate (84.0), 10-HCO-H2- folate (84.8)
Osseyi et al., 1998. UV-Vis spectroscopy LOD 2 ng/20 µl injection of standard 93 - 96 coefficient of variation 3.2-5.6%
Ruggeri et al., 1999. UV-Vis spectroscopy (5-HCO-H4folatos, folic acid, 10-HCO-H2); Fluorescence - excitation 290 and 365 emission for 5-CH3-H4-folate and H4-folate, 360 excitation and 460 emission 10-HCO folic.
LOD H4-folate 0.6 ng, 5-CH3-H4 folate 0.4 ng, 5-HCO-H4 folate 0.6 ng, 0.2 ng folic acid, 10-HCO-folic 0.7 ng, 10-HCO-H2- folate 0.8 ng.
H4-folate 109 ± 13, 5-CH3-H4- folate 86 ± 3, 5-HCO-H4 folate 78, Folic acid: 113 ± 9; 10-HCO-folic 102 ± 10, 10-HCO-H2 folate 106 ± 12.
Ndaw, et al., 2001. Fluorescence excitation 295 nm and emission 356 nm. UV-Vis spectroscopy
LOD: all in pmol per injection - 5-CH3-H4 folate: 2 (UV) and 0.02 (fluorescence); H4folato: 5 (UV) and 0.1 (fluorescence), folate 10-CHO-20 (UV) and 200 (fluorescence ) 5-CHO-H4folato: 2 (UV)
78 - 10-CHO-H4-folate; 98- 5-CHO-H4-folate
Breithaupt, 2001. UV-Vis spectroscopy LOD 0,04; LOQ 0,06 mg/L
In acetate buffer with added standard was 97; For apple juice, 92-93; For cherry nectar 92-93 and 78-79 black cherry.
Jastrebova et al., 2003. Fluorescence spectroscopy excitation 290 nm and 360 nm emission 290 nm UV-Vis spectroscopy
LOQ 5-CH3-H4-folate 0.2 ng/mL; H4-folates 0.3 ng/mL and 5-HCO-H4-folate 4 ng/mL LOD 0.1 ng/mL H4-folate, 5-CH3-H4-folate 0.07 ng/mL, 5-HCO-H4-folate 1.5 ng/mL.
85-90- H4-folate and 95-97- 5-CH3-H4-folate.
Doherty and Beecher, 2003.
Diode array detector, fluorescence detection (290 nm for the excitation spectrum and 355 nm for the emission spectrum).
LOD DAD 1µg/100g UV for 5-HCO-H4-folate and folic acid for 0.5 µg/100g; Fluorescence: > 0.1 µg/100g for 5-HCO-H4-folate and folic acid.
Reference material (BCR 421) 90-95, folic acid and 5-HCO-H4- folate 95 – 105.
Quirós et al., 2004. UV-Vis spectroscopy for folic acid, 290 nm excitation and emission 356 nm fluorescence for 5-CH3-H4-folate;
LOD 5-CH3-H4-folate 1.2 ng / mL; H4-folate 1.7 ng/mL, 5-HCO-H4-folate 2.1 ng/mL;
5-CH3-H4-folate 95.93; 90.8 H4-folate, 5-HCO-H4-folate 94.58; Folic acid 94.78.

58
H4-folate, 5-HCO-H4-folate. folic acid 0.9 ng/mL.
Catharino and Godoy, 2006.
Excitation 290 nm and emission 360 nm fluorescence for 5-CH3-H4 folate, 5-HCO-H4-folate and H4-folate; 360nm emission 445nm excitation fluorescence for 10-HCO-folate and 10-CH3-folate and folic acid DAD at 290 nm
LOD 5 pg/mL 5-CH3-H4-folate; 7 pg/mL folate-H4; 30 pg/mL 5-HCO-H4-folate; 10-HCO-folate; 5 ng/mL for folic acid and 10-CH3 – folate; LOQ 0.05 ng/mL 5-CH3-H4-folate, 0.07 ng/mL H4-folate, 0.3 ng / mL 5-HCO-H4-folate and 10-HCO-folate and 50 ng/mL 10 - CH3-folate
5-CH3-H4-folate 94-108, 96-102 H4-folate, 5-HCO-H4-folate 97-104, 10-HCO-H4 95-104, 97-102 folic acid, 10-CH3-H4-folate 98-103.
Pietro et al., 2006. Diode array detector LOQ folic acid 0.10 mg/L Was not performed
Yazynina et al., 2008. DAD for 10-HCO-H4 folic acid and at wavelengths of 269, 290 and 340 nm, 290 nm excitation and 360 nm emission fluorescence
LOD-0.05, 0.1, 2.0, 4.0, and 1.0 ng / ml for 5-CH3-H4-folate, H4-folate, 5-HCO-H4-folate, 10-HCO-folic acid, and folic acid, respectively.
78% 5-CH3-H4-folate and H4-folate 48-56%
Label: H4 folate - tetrahydrofolate; 5-CH3-H4 folate - 5-methyltetrahydrofolate; 5-HCO-H4- folate - 5-formyltetrahydrofolate; 10-HCO-folate- 10 - formyl folic acid; 5,10-CH2-H4-folate - 5,10-
Methylenetetrahydrofolate; 5,10-CH +-H4-folate - 5.10-meteniltetraidrofolato; 10-HCO- H2-folate - 10-methyl folic acid; 10-CH3-folate - 10-methyl folic acid
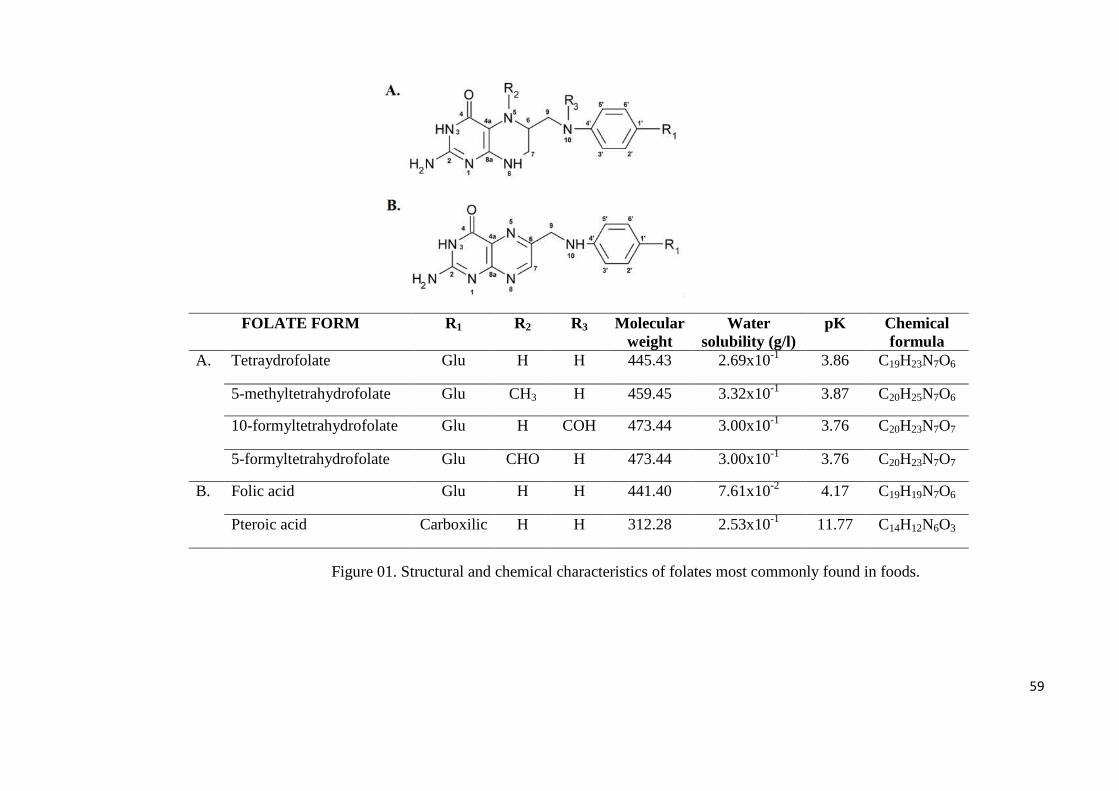
59
Figure 01. Structural and chemical characteristics of folates most commonly found in foods.
FOLATE FORM R 1 R2 R3 Molecular weight
Water solubility (g/l)
pK Chemical formula
A. Tetraydrofolate Glu H H 445.43 2.69x10⁻¹ 3.86 C19H23N7O6
5-methyltetrahydrofolate Glu CH3 H 459.45 3.32x10⁻¹ 3.87 C20H25N7O6
10-formyltetrahydrofolate Glu H COH 473.44 3.00x10⁻¹ 3.76 C20H23N7O7
5-formyltetrahydrofolate Glu CHO H 473.44 3.00x10⁻¹ 3.76 C20H23N7O7
B. Folic acid Glu H H 441.40 7.61x10⁻² 4.17 C19H19N7O6
Pteroic acid Carboxilic H H 312.28 2.53x10⁻¹ 11.77 C14H12N6O3

60
Figure 02. Test of solubility of folates standard in two conditions of dilutions of stock solutions. Chromatogram A in 8 mmol.L-1 ammonium acetate, C18 100 mm x 2.0 5µm column, and chromatogram B in milli-Q water, C18 150 mm x 3.2 5µm column. 1. THF (rt. 1.67); 2. 5-MTHF (rt.2.47); 3.10-FTHF (rt 3.21); 4. 5-FTHF (rt. 4.93); 5. Folic acid (rt. 7.34); 6.Pteróico acid (rt. 11.17). Isocratic elution performed in 85% of potassium phosphate buffer pH 2.0 and 15% of MeOH, flow 0.5 ml/min. Stock solutions prepared in one ml NaOH 1mol.L-1 and ammonium acetate pH 6.8. rt - retention time.
A
B

61
Pteroic acid
200 250 300 nm
50
100
150
200
mAU 11.53/ 1.00
214
253
299
221
225.0 250.0 275.0 300.0 325.0 nm
100
200
300
400
500mAU
7.54/ 1.00
251
286
Folic acid
225.0 250.0 275.0 300.0 325.0 nm
100
200
300
400
mAU 4.96/ 1.00
212
244
288
218
5-formyltetrahydrofolate

62
Figure 04. Spectral profile of folates commonly found in foods. Register obtained by array diode detector with scan performed in region maximum and minimum of each peak in maximum λ. Images made from LC solution software (Shimadzu).
5-methyltetrahydrofolate
250 500 nm
0
100
200
300
mAU 2.50/ 1.00
206
282
243
359
217
197
271
290
419
Tetrahydrofolate
250 500 nm
0.0
2.5
5.0
7.5
mAU 1.70/ 1.00
244
367
195
294
10-formyltetrahydrofolate
250 500 nm
0
10
20
30
40
mAU
3.26/ 1.00
222
251
305
491
195
233
261
333

63
4.0 Materiais e métodos
4.1 Materiais
4.1.1 Amostras
Todos os vegetais utilizados durante o estudo foram adquiridos em comércio local no
período de setembro de 2011 a janeiro de 2012. A escolha dos vegetais para realização
dos ensaios foi orientada com base naqueles contemplados pela Tabela Brasileira de
Composição de Alimentos - TACO (2006).
Foram utilizados os vegetais, a saber: Brócolis Brassica oleracea var. itálica;
Espinafre, Nova Zelândia Tetragonia expansa; Repolho branco Brassica oleracea var.
capitata; Salsa Petroselinum hortense; Vagem Phaseolus vulgaris. A compra dos vegetais
foi realizada no mesmo dia da análise.
4.1.2 Padrões e reagentes
Solventes orgânicos (acetonitrila e metanol - Merck, Brasil) produtos químicos e água
necessários para preparar soluções para a composição da fase móvel foram em grau
HPLC, os demais reagentes em grau analítico.
Foram utilizados padrões em grau de pureza HPLC de ácido fólico, ácido pteróico
(Sigma, Brasil), 5-metil-tetrahidrofolato (5-MTHF), 10-formil-tetrahidrofolato (10-
FTHF), tetrahidrofolato (THF), 5-formil-tetrahidrofolato (5-FTHF) (Merck, Suíça).
A enzimas protease (obtida a partir de Streptomyces griseus) foi adquirida de Sigma e
a folato conjugase extraída a partir de plasma de rato (aprovação do projeto pelo Comitê
de Ética em animais, processo 23076.020176/2010-80).
4.1.3 Equipamentos
Todas as análises por HPLC foram realizadas em cromatógrafo líquido Shimadzu
(Shimadzu, Japão), composto pelos seguintes módulos: sistema controlador modelo CBM-
20A, detector de arranjo de diodos (DAD) modelo SPD-20AV, detector de fluorescência
(RF) modelo RF-20A, bomba quaternária modelo LC - 20 AT, forno para coluna modelo
CTO-20AC, amostrador automático modelo SIL-20AC. Todos os comandos foram

64
realizados utilizando software LC Solution (versão 1,25, Shimadzu, Japão), e as detecções
realizadas em DAD.
Para avaliação da atividade da folato conjugase extraída de plasma de rato foi utilizado
um espectrofotômetro UV- visível (200-400 nm) (Varian Cary 50).
A água utililizada no preparo de soluções e fases móveis foi obtida a partir de um
sistema Milli-Q Integral system 5. Foram utilizados também pHmetro (Mettler toledo),
balança analítica (Tecnal), agitador de bancada (Fisatom), centrífuga refrigerada
(Beckman Coueter Avanti J 25), banho termostatizado (Quimis), os quais durante todo
período de desenvolvimento deste estudo passaram por calibrações diária ou mensais
seguindo as orientações do fabricante.
4.1.4 Fases estacionárias e fases móveis
Foram utilizadas as seguintes colunas cromatográficas disponíveis: Waters Spherisorb
C18 ODS-2 150 x 3,2 mm, 5 µm, fluxo de 0,5ml/min; Spherisorb C18 ODS-2 100 x 2,0
mm, 5µm, fluxo de 0,5 ml/min e Spherisorb C18 ODS-2 100 x 1,0 mm, 3µm, fluxo de 0,06
ml/min. As soluções que entraram na composição das fases móveis testadas foram:
solução de acido acético 2% pH 2.8 e 6% pH 3,4, acetato de amônio 8 mmol.L-1 pH 6,7,
tampão fosfato 35 mmol.L-1 pH 6,7 (misturas equimolares de fosfato de potássio
monobásico e fosfato de potássio dibásico), ácido ortofosfórico 33 e 50 mmol.L-1 pH 2,2 e
2,3, tampão fosfato de potássio 33 e 100 mmol.L-1 pH 2,1 (misturas equimolares de ácido
ortofosfórico e fosfato de potássio monobásico).
Os fluxos de trabalho foram calculados com base na relação de diâmetro interno
utilizando a fórmula da área de uma circunferência para obtenção do volume total da
coluna, e então foi estabelecida a relação de tempo de análise estimado para o
preenchimento de toda a coluna e adequado ao tempo de corrida desejado.
4.2 Métodos
4.2.1 Preparo das soluções dos padrões
Todos os padrões adquiridos foram mantidos a -18ºC durante o desenvolvimento do
estudo. Para os ensaios de adequabilidade de fases móveis foi utilizada a primeira remessa
de padrões durante um período de oito meses. Contudo para construção da curva de
calibração todos os padrões foram abertos no dia da análise. As soluções estoque foram

65
preparadas sob proteção da luz na concentração de 1000 µg.ml-1, usando 1 mL de
0.1mol.L-1 de NaOH e completando o volume com acetato de amônio 8 mmol.L-1 pH 6,7.
4.2.2 Obtenção e preparo de plasma de rato
Sangue de rato (Ratus noverdicus) foi coletado utilizando a técnica de degolamento
antecedido pelo uso de medicamentos anestésicos, cloridrato de xilazina (5 – 10 mg.Kg-1)
e quetamina (50-75 mg.Kg-1) misturados na mesma seringa e aplicado na região
intramuscular abdominal. Para evitar a coagulação do sangue, tubos coletores contendo
heparina foram utilizados. Após a coleta os animais foram sacrificados utilizando a
técnica de deslocamento cervical (CEUA FIOCRUZ-RJ, 2008).
Em volumes de 6 mL, o sangue foi centrifugado a 3000 rpm por 20 minutos para
obtenção do plasma (PFEIFFER et al., 1997). Subsequentemente alíquotas de 1 mL de
plasma foram distribuídas em eppendorf e encaminhados para liofilização no Laboratório
de Imunopatologia Keizo Azami - LIKA. Todo o procedimento de coleta foi realizado no
laboratório de Bioquímica da Nutrição e no Biotério do Departamento de Nutrição –
UFPE.
No momento do uso, o plasma foi ressuspendido em 1 ml de solução de acetato de
amônio 8mmol.L-1 sob agitação e centrifugado a 20.000 rpm por 20 minutos (GREGORY
et al., 1984) para uso como fonte de folato conjugase.
Para avaliação da eficiência na desconjugação, 250 µL de plasma de rato tratados
foram adicionados a uma solução de ácido fólico (20 µg.ml-1) e incubadas a 37ºC por 20
minutos. Para encerrar a atividade enzimática, o material foi colocado em banho de gelo
por 5 minutos. A atividade enzimática foi avaliada através da conversão do ácido fólico
em ácido pteróico analisando por varredura dos comprimentos de onda de 200-400 nm.
4.2.3 Avaliação das condições cromatográficas
Devido à diversidade de composições de fases móveis e colunas presentes na literatura
recomendadas na separação de folatos foi necessário investigar os principais elementos
que poderiam resultar na escolha de uma condição compatível com a etapa de extração. O
pH das fases móveis foi então utilizado como referencial para o desenvolvimento da
metodologia. Assim as fases móveis testadas foram divididas em dois grupos. Grupo I
fases móveis com pH ≤ 5 (KONINGS, 1999; VAHTERISTO et al., 1996; QUIRÓS et al.,

66
2004; JASTREBOVA et al., 2003; STEA et al., 2006; NDAW et al., 2001; PFEIFFER et
al., 1997; CATHARINO e GODOY, 2006; PATRING e JASTREBOVA, 2007;
PATRING et al., 2007); e grupo II fases móveis com pH ≥ 5 (OSSEYI et al., 1999;
PRIETO et al., 2006). Estas foram testadas em modo binário (solvente aquoso em
combinação com metanol ou acetonitrila) ou ternário (solvente aquoso pH ≥ 5
combinação com metanol e acetonitrila)
Os parâmetros cromatográficos como: fator de capacidade (k) que deve estar no
intervalo de 0,5≤ k ≤20, foi calculado usando a seguinte fórmula k= (tr-t0)/t0, onde t0 é o
tempo de retenção de um solvente não retido e tr é o tempo de retenção do analito.
Resolução (Rs) ≥ 1,5, calculado como Rs = (t2-t1)/0,5(w2+w1), onde w é a largura do pico;
e fator de separação (α) ≥1,5, calculado usando a seguinte fórmula k2/k1. Estes parâmetros
foram usados durante a interpretação dos resultados de separação em padrões e amostras a
fim de estabelecer parâmetros de validação intermediária (SNYDER et al., 1997).
Previamente ao uso, todas as fases móveis foram filtradas em filtro (FHLP 04700),
Millipore com tamanho dos poros de 0,22 µm de diâmetro.
Para seleção da melhor coluna a ser utilizada na separação dos folatos, foram
avaliados os seguintes parâmetros: número de pratos teóricos (N), calculado usando a
fórmula N= 5,54(tr/w0,5)2, altura do prato teórico (h), calculado como h= L/N, onde L é
comprimento da coluna. Assimetria (As) foi calculada com a fórmula As= b/a onde a e b
são a meia largura do pico na região frontal e final do pico a 10% da altura.
A varredura inicial das fases móveis foi realizada com a coluna Waters Spherisob C18
ODS-2 150 x 3,2 mm, 5 µm. Contudo para o alcance da completa adequabilidade do
sistema separando seis formas de folatos foi necessário testar mais duas colunas,
Spherisob C18 ODS-2 100 x 2,0 mm, 5µm e Waters Spherisob ODS-2 C18 100 x 1,0 mm,
3µm.
4.3 Avaliação das condições de extração de folatos em alimentos vegetais
Na etapa de extração foi necessário realizar um levantamento dos principais protocolos
existentes na literatura a fim de isolar os fatores que pudessem ser testados em um dia de
trabalho e removessem satisfatoriamente as seis formas de folatos avaliadas neste estudo.
Os principais fatores foram - concentração molar da solução extratora, temperatura de
exposição em banho maria, agentes desproteinizante ou de limpeza e uso de enzimas

67
(protease, e folato conjugase). Esta etapa foi conduzida em um estudo piloto para o
desenvolvimento de um protocolo a ser avaliado em planejamento fatorial. Utilizou-se
espinafre integral e fresco como matriz modelo.
4.3.1 Protocolo de preparo das amostras (estudo piloto)
Espinafre integral e fresco (400g) foi homogeneizado em multiprocessador para
obtenção do liquor e do material fibroso em separado. 1 mL de liquor e 1g da fibra foram
usados nas etapas subsequentes e a cada extrato foi adicionado 20 mL de tampão extrator,
acetato de amônio 50 mmol.L-1, preparado com 1% de ácido ascórbico e 10 mmol.L-1 de
2-mercaptoetanol. O extrato foi agitado em vórtex por 20 segundos.
Cada extrato (liquor e fibra) foi submetido a tratamento em banho termostatizado a
40ºC, por 10 minutos. Logo após, o material fibroso foi filtrado em papel de filtro
qualitativo e de cada extrato (liquor e fibra) foi transferido 5mL para um tubo de ensaio.
Antes da adição das enzimas o pH dos extratos foi mensurado em 6,78 à 6,85, mantendo-
se nestas condições para os tratamentos sem antioxidantes. Quando houve a adição dos
antioxidantes o pH dos extratos caiu para 4,59 à 4,51.
As amostras foram submetidas ao tratamento dienzimático, com o uso de protease e
folato conjugase. Protease (Sigma) foi resuspendida em tampão extrator (2 mg.ml-1), e
adicionado 1 mL ao tubo de ensaio (PFEIFFER et al, 1997). Plasma de rato foi
resuspendido sob agitação com tampão extrator para 1 mL até completa homogeneização
e deste adicionaram-se 250 µL aos tratamentos (PFEIFFER et al, 1997). Antes da adição
das enzimas mediu-se o pH dos extratos. Os tubos foram incubados a temperatura de 37°C
por 1h. Após a reação, procedeu-se a inativação das enzimas à 100°C por 5 min, e em
seguida os tubos foram colocados em banho de gelo para o rápido resfriamento.
Com o objetivo de reduzir o tempo de análise e variações geradas pelo uso de enzimas,
ácido tricloracético (CATHARINO e GODOY, 2006) foi usado como agente
desproteinizante em substituição ao uso de proteases. Nesta etapa as amostras foram
expostas, em diferentes experimentos, às concentrações de 2, 5 e 8% de acido
tricloracético sem o uso de folato conjugase. É importante ressaltar que cada protocolo foi
testado individualmente, contudo todas as etapas foram executadas em um único dia de
análise.

68
Tratamentos controle também foram realizados, e neste protocolo excluiu-se o uso de
antioxidantes no tampão extrator, de enzimas e agentes desproteinizantes.
Ambos os tratamentos (dienzimático, ácido tricloracético e controle) foram
submetidos a centrifugação à 5.000 rpm por 15 minutos à 4°C, e todo material foi filtrado
em membranas de acetato de celulose 0,45µm. Do material filtrado 1 mL de cada
tratamento foi encaminhado para análise por cromatografia líquida de alta eficiência.
Dos resultados deste estudo piloto foram isoladas as variáveis que proporcionaram
melhor extração de folatos e procedeu-se a construção de um modelo fatorial.
4.3.2 Ensaio fatorial para avaliação das condições de extração
Um estudo fatorial foi construído para avaliar os efeitos das principais variáveis que
contribuíram no estudo piloto. Neste ensaio o efeito da razão quantidade de amostra e
solução, temperatura de extração, concentração molar da solução extratora e tempo de
exposição foram organizados em um planejamento fatorial 24, com três repetições no
ponto central totalizando 19 ensaios (tabela 01 e 02). A partir destes resultados obtidos
com espinafre, foram selecionadas as principais condições de extratibilidade de folatos
nos demais vegetais. As variáveis dependentes foram as concentrações extraídas das seis
formas de folatos avaliadas neste estudo, bem como pureza, similaridade e outros
parâmetros cromatográficos.
Tabela 01. Variáveis independentes codificadas e decodificadas das condições de
extração.
Planejamento fatorial
Variáveis Código -1 0 +1
Razão quantidade de amostra e solução X1 1:5 1:12.5 1:20
Temperatura de extração (°C) X2 35 70 105
Concentração molar (mmol/L-1) X3 30 90 150
Tempo de exposição (min) X4 10 50 90

69
Tabela 02. Variáveis independentes decodificadas por ensaio para o estudo do
planejamento fatorial das condições de extração.
Ensaio Condição de ensaio
X1 X2 X3 X4
1 1:5 30 5.0 5.0
2 1:20 30 5.0 5.0
3 1:5 60 5.0 5.0
4 1:20 60 5.0 5.0
5 1:5 30 15.0 5.0
6 1:20 30 15.0 5.0
7 1:5 60 15.0 5.0
8 1:20 60 15.0 5.0
9 1:5 30 5.0 60.0
10 1:20 30 5.0 60.0
11 1:5 60 5.0 60.0
12 1:20 60 5.0 60.0
13 1:5 30 15.0 60.0
14 1:20 30 15.0 60.0
15 1:5 60 15.0 60.0
16 1:20 60 15.0 60.0
17 1:12.5 45 10.0 32.5
18 1:12.5 45 10.0 32.5
19 1:12.5 45 10.0 32.5

70
4.4 Parâmetros de validação
4.4.1 Identificação e quantificação
A quantificação foi realizada por padronização externa. As soluções utilizadas para
traçar curva de calibração foram preparadas em pool por diluição das soluções estoque em
acetato de amônio de cada padrão individual nas concentrações de 0,3, 0,5, 1,0, 10,0, 50,0,
75.0 e 100 µg.ml-1. O limite de quantificação (LQ) foi definido como a menor
concentração do analito que alcançasse um sinal 10 vezes acima da linha de ruído (ICH,
1994), utilizando a fórmula: LQ = (DPa x 10)/ IC. O limite de detecção (LD) foi definido
como a menor concentração do analito que alcançasse uma um sinal 3 vezes acima da
linha de ruído (ICH, 1994), utilizando a fórmula: LD = (DPa x 3)/ IC, onde:
DPa é o desvio padrão do intercepto com o eixo “y” de no mínimo três curvas de
calibração; IC é a inclinação da curva de calibração;
4.4.2 Precisão intermediária
Para avaliação da precisão intermediária foram realizadas varreduras espectrais em
pelo menos três regiões dos picos (início, meio e fim) nos padrões com o objetivo de
confirmar o “λ” máximo por DAD. Nas amostras foram avaliadas pureza e similaridade em λ
máximo correlacionando estas informações com os parâmetros cromatográficos k, α e Rs.
A pureza é a medida em percentual que indica a existência de apenas um pico no
tempo de retenção estudado em um comprimento de onda fixo, e a similaridade (obtida
também em percentual) por comparação do pico em tempo de retenção escolhido com
biblioteca de dados de padrões construída a partir de duas curvas de calibração.
Coeficiente de variação das amostras em dias diferentes foi calculado como parte do
protocolo da validação intermediária em amostras de espinafre. Em adição, foram realizadas
quantificações em outras matrizes vegetais, sendo estas apresentadas em desvio padrão.
4.5 Análise estatística
Além do planejamento fatorial realizado na etapa de extração, a investigação das
diferenças entre os tratamentos aplicados no estudo piloto foi realizada utilizando ANOVA
para comparação de médias e o teste de Tukey quando encontradas diferenças para um valor
de p< 0,05 usando Statistica 7.0.

71
5. Resultados e Discussão
A seguir serão apresentados os artigos originais referentes às observações laboratoriais
obtidas durante o desenvolvimento da metodologia analítica para determinação de folatos.
O primeiro artigo trata das investigações realizadas em conformidade com o primeiro e
segundo objetivos, avaliação das condições de composição de fase móvel, pH, força molar
e colunas compatíveis com a separação de folatos através dos parâmetros cromatográficos,
onde utilizou-se a teoria ácido-base de Lewis para tentar explicar o processo de separação
dos folatos . Estas informações foram corroboradas com o estudo piloto desenvolvido com
espinafre, apresentado como parte do protocolo de validação.
No segundo artigo serão apresentados os resultados da aplicação do método em
diferentes matrizes de origem vegetal (em conformidade com o terceiro e quarto
objetivos) investigando o teor de folatos presente nestes alimentos e traçando parâmetros
de validação utilizando a correlação existente entre as informações espectrais em λ
máximo, como pureza e similaridade, com os parâmetros cromatográficos de separação
das seis formas de folatos estudadas. Ambos foram submetidos à revista internacional,
sendo apresentados em ordem cronológica de elaboração e submissão.
Artigo 2. Proposition for mechanism of separation of folate by Lewis theory acid-
base: a new alternative of improving selectivity in vegetable matrix by HPLC.
Artigo 3. Investigation of protocols to extraction and quantification of folates in
vegetables matrices split into liquor and fiber fraction using factorial designer.
Submetidos ao Journal Chromatography A ISSN 0021-9673
Fator de impacto (2010): 4,101

72
Proposition for mechanism of separation of folate by Lewis theory acid-base: a new
alternative of improving selectivity in vegetables matrix by HPLC
Emmanuela Prado de Paivaa*, Clayton A. de Azevedo Filhob, Lorena Trajano da Silvac, Tânia
Lucia. M. Stamfordc, Jose Almiro da Paixãoc. a Departamento de Tecnologia Rural, Universidade Federal Rural de Pernambuco, Rua Dom
Manoel de Medeiros, s/n, Dois Irmãos, 52171-900 – Recife, PE, Brazil. b Departamento de Farmácia, Universidade Federal de Pernambuco, Av. Prof. Moraes Rego,
s/n, Campus Universitário, 50670-901, Recife, PE, Brasil. c Departamento de Nutrição, Universidade Federal de Pernambuco, Av. Prof. Moraes Rego,
s/n, Campus Universitário, 50670-901, Recife, PE, Brasil. * Corresponding author:
[email protected] Tel: 55- 0218133206284; Fax: 55- 0218133206281
Abstract
A fast and simplified method for the determination of six folate forms in vegetables was
developed. Using chromatography liquid reverse phase, systematic evaluation was performed
in: solubilization of standard, preparation of binary and ternary mobile phases in which it was
evaluated tr, k, α and Rs. Over 15 combinations of aqueous buffer and organic mobile phases
in Spherisob ODS-II column from different dimensions allowed ideal separation of six folate
forms in isocratic mode with a potassium phosphate buffer pH 2,0 100 mmol.L-1 and
methanol in the ratio 85:15 using a 100 x 2,0mm, 5µm column, with a running time of 15
minutes. The elution order of the six folate forms was established by reactivity of nitrogen
from carbon 5 and 10 as an acceptor of protons of the mobile phase, and other mechanisms as
steric impediment and resonance of the pteridine ring. This method was applied to samples of
spinach and evaluated through the chromatographic parameters; in addition, spectral registers
at λ max, similarity and purity index of the peaks of six standard and samples by diode array
detection were performed. In all folate forms it was reached ideal k, α and Rs. In the
evaluation of samples, the chromatographic separation parameters associated with the spectral
registers of spinach extract showed purity index above 90% and similarity index above 75%
except for 10-FTHF, indicating that the method has a good selectivity for complex matrices.
Key words: folate, Lewis acid-base, HPLC, isocratic, chromatographic parameters,
vegetables.

73
1.0 Introduction
Folates are molecules with structural similarity and are composed basically of
glutamic acid, p-aminobenzoic acid and pteridin ring. These, in turn, are chemical compounds
composed of fused pyrimidine and pyrazine rings [1].
It can be found in animal, vegetables and microbian cells, from the monoglutamate to
polyglutamate in differentiated oxidation levels. Nevertheless the designation folic acid is
usually employed to form more oxidized, stable and easily absorbed by the intestinal
recommended for practice of fortification, enrichment food and drug production [2].
The deficiency of this vitamin is associated with diseases such as megaloblastic
anemia, birth defects, trisomy 21, brain and cardiovascular disorders, some cancers and
impaired cognitive functions. There is a general consensus that folic acid supplementation
during the periconceptional period has a role in preventing the risk of neural tube defects such
as anencephaly and spine bifida [3].
However, nutritional needs might not be well established, since analytical fail
methodologies may produce contradictory results. The main reason for this condition comes
from the difficulties to determine the amount of folate in foods, due to diversity, instability
and complexity of matrices [4,5]. Notwithstanding, control over the reliability of nutrient
values of fresh and fortified foods have stressed the need to development of appropriate
methodologies in recognition of bioactive and bioavailable folates forms [6].
The determination of folate in foods has some challenges due to their low
concentration, the possibility of isomerization, presence of various interfering complex
matrices, requiring care, due to low stability, total or partial loss in extreme pH condition,
additional effects of temperature, redox potential. These factors should be taken into account
when choosing the analytical method [7,8,9].
Reverse phase HPLC has been used as a method for determining folates with more
efficient results than other methods commonly employed. It is the most accepted technique
due to its sensitivity to different sample. Efforts have been conducted for study in different
chromatographic conditions [10,4,11], in some situations ionic pairing agents have been
applied in order to stabilize elution time of different forms [12, 13].
One of the greatest difficulties in standardizing the chromatographic parameters for
the study of folate, is an inadequate discussion of the pH of stock solutions and buffers used
in the preparation of mobile phases to ensure its stability and solubility. Since, due to the

74
presence of amine groups along the whole molecule width with a pair of electrons non-ligand,
make folates fit on Lewis acid-base concept [14].
The effect of pH on the composition of the mobile phases on separation of folates was
investigated recently by Patring and Jastrebova [5], which used successfully acid-base
properties of folate to monitor patterns of ionization in electrospray ionization technique.
However, it was found that the intensity of ionization signal suffers influence from: the nature
of buffer solution (pH) and the mechanisms of electrospray ionization used in sample
evaporation.
In addition, the use of gradient mode is presented as the only alternative to elution
these vitamin compounds [15,16,17]. This elution mode has some disadvantages, such as:
change of baseline and need of reconditioning to each new run [18], which raises the need of
investigation of methodologies available in pursuit of simplified conditions such as the
isocratic mode.
Currently, there are still conflicting methodologies for most of vitamins in foods,
particularly folate. Underscoring the need to improve and develop pre-chromatographic and
chromatographic analysis aiming to ensure more accurate and reproducible results that can
generate reliable information to the elaboration of nutritional guidelines.
The main focus of this study was to use the mobile phase chromatographic parameters
(k, α and Rs) and columns (N, h) as the main parameters to reach the best condition for
separation of the six folate forms in reverse phase coupled DAD detection. In addition, it was
used a high complexity matrix to test the selectivity of the method for identification and
quantification of folate.
2.0 Experimental
2.1 Chemicals and Reagents
Tetrahydrofolate (H4-folate), 5-methyltetrahydrofolate (5-CH3-H4-folate), 10-
formyltetrahydrofolate (10-HCO-H4-folate) 5-formyltetrahydrofolate (5-CHO-H4-folate)
HPLC grade were provided from Merck (Switzerland). Folic acid and pteroic acid were
purchased from Sigma-Aldrich (St. Louis, MO, USA). Acetonitrile and methanol were from
Merck in HPLC grade (Darmstadt, Germany). All other reagents were of the highest purity.
Ultrapure water was obtained in Milli-Q integral system 5 (Millipore).
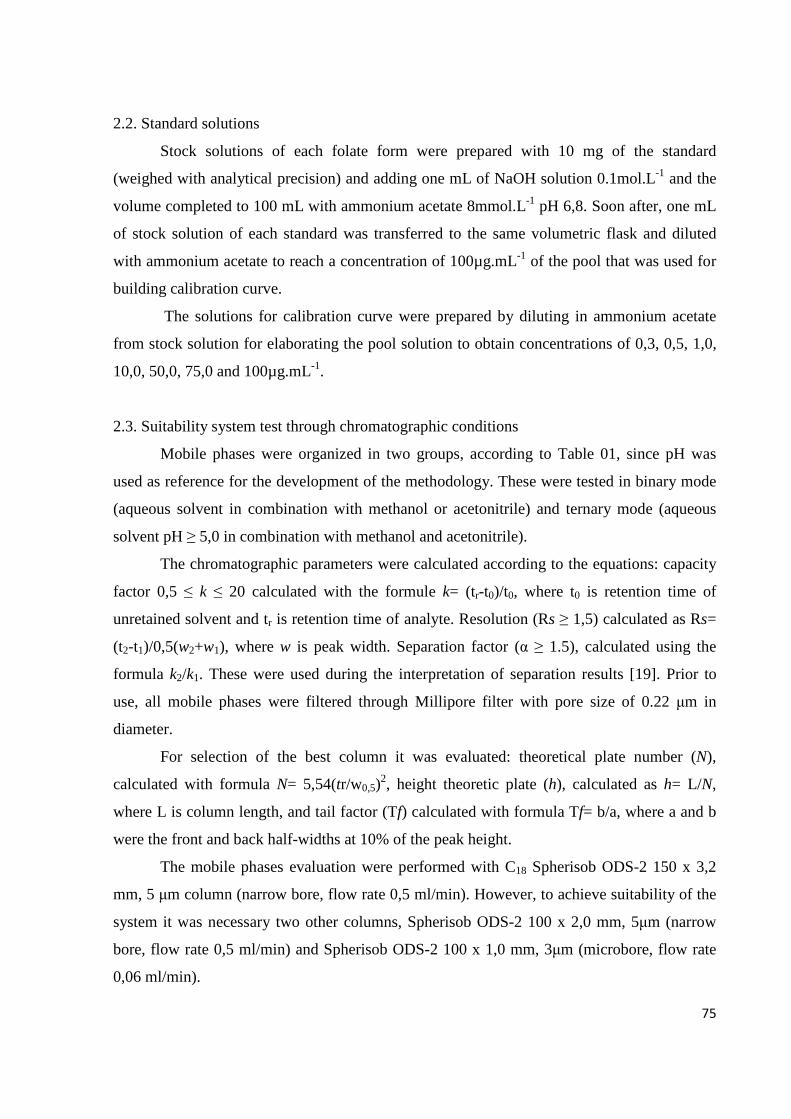
75
2.2. Standard solutions
Stock solutions of each folate form were prepared with 10 mg of the standard
(weighed with analytical precision) and adding one mL of NaOH solution 0.1mol.L-1 and the
volume completed to 100 mL with ammonium acetate 8mmol.L-1 pH 6,8. Soon after, one mL
of stock solution of each standard was transferred to the same volumetric flask and diluted
with ammonium acetate to reach a concentration of 100µg.mL-1 of the pool that was used for
building calibration curve.
The solutions for calibration curve were prepared by diluting in ammonium acetate
from stock solution for elaborating the pool solution to obtain concentrations of 0,3, 0,5, 1,0,
10,0, 50,0, 75,0 and 100µg.mL-1.
2.3. Suitability system test through chromatographic conditions
Mobile phases were organized in two groups, according to Table 01, since pH was
used as reference for the development of the methodology. These were tested in binary mode
(aqueous solvent in combination with methanol or acetonitrile) and ternary mode (aqueous
solvent pH ≥ 5,0 in combination with methanol and acetonitrile).
The chromatographic parameters were calculated according to the equations: capacity
factor 0,5 ≤ k ≤ 20 calculated with the formule k= (tr-t0)/t0, where t0 is retention time of
unretained solvent and tr is retention time of analyte. Resolution (Rs ≥ 1,5) calculated as Rs=
(t2-t1)/0,5(w2+w1), where w is peak width. Separation factor (α ≥ 1.5), calculated using the
formula k2/k1. These were used during the interpretation of separation results [19]. Prior to
use, all mobile phases were filtered through Millipore filter with pore size of 0.22 µm in
diameter.
For selection of the best column it was evaluated: theoretical plate number (N),
calculated with formula N= 5,54(tr/w0,5)2, height theoretic plate (h), calculated as h= L/N,
where L is column length, and tail factor (Tf) calculated with formula Tf= b/a, where a and b
were the front and back half-widths at 10% of the peak height.
The mobile phases evaluation were performed with C18 Spherisob ODS-2 150 x 3,2
mm, 5 µm column (narrow bore, flow rate 0,5 ml/min). However, to achieve suitability of the
system it was necessary two other columns, Spherisob ODS-2 100 x 2,0 mm, 5µm (narrow
bore, flow rate 0,5 ml/min) and Spherisob ODS-2 100 x 1,0 mm, 3µm (microbore, flow rate
0,06 ml/min).
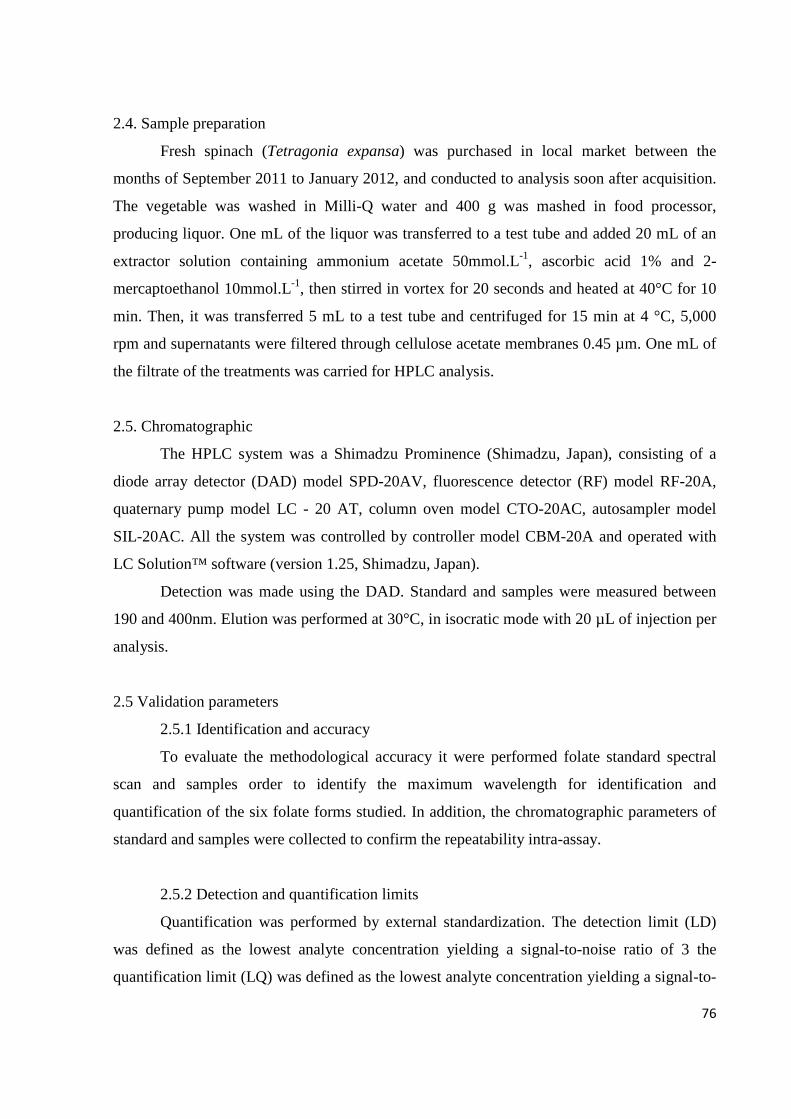
76
2.4. Sample preparation
Fresh spinach (Tetragonia expansa) was purchased in local market between the
months of September 2011 to January 2012, and conducted to analysis soon after acquisition.
The vegetable was washed in Milli-Q water and 400 g was mashed in food processor,
producing liquor. One mL of the liquor was transferred to a test tube and added 20 mL of an
extractor solution containing ammonium acetate 50mmol.L-1, ascorbic acid 1% and 2-
mercaptoethanol 10mmol.L-1, then stirred in vortex for 20 seconds and heated at 40°C for 10
min. Then, it was transferred 5 mL to a test tube and centrifuged for 15 min at 4 °C, 5,000
rpm and supernatants were filtered through cellulose acetate membranes 0.45 µm. One mL of
the filtrate of the treatments was carried for HPLC analysis.
2.5. Chromatographic
The HPLC system was a Shimadzu Prominence (Shimadzu, Japan), consisting of a
diode array detector (DAD) model SPD-20AV, fluorescence detector (RF) model RF-20A,
quaternary pump model LC - 20 AT, column oven model CTO-20AC, autosampler model
SIL-20AC. All the system was controlled by controller model CBM-20A and operated with
LC Solution™ software (version 1.25, Shimadzu, Japan).
Detection was made using the DAD. Standard and samples were measured between
190 and 400nm. Elution was performed at 30°C, in isocratic mode with 20 µL of injection per
analysis.
2.5 Validation parameters
2.5.1 Identification and accuracy
To evaluate the methodological accuracy it were performed folate standard spectral
scan and samples order to identify the maximum wavelength for identification and
quantification of the six folate forms studied. In addition, the chromatographic parameters of
standard and samples were collected to confirm the repeatability intra-assay.
2.5.2 Detection and quantification limits
Quantification was performed by external standardization. The detection limit (LD)
was defined as the lowest analyte concentration yielding a signal-to-noise ratio of 3 the
quantification limit (LQ) was defined as the lowest analyte concentration yielding a signal-to-

77
noise ratio of 10 [20]. Concentration of folates in real samples was expressed as µg folate per
g extract.
3.0 Results and Discussion
3.1Suitability system in order to separation of folates by reverse phase
It was not possible to match the pH of standard stock solutions with the mobile phase,
since the ionic character of the molecule, due to the presence of H+ groups, is neutralized by
the presence of OH- and other present in basic solutions forming a buffer system which
stabilizes the folate forms [21].
The US Pharmacopeia [22] was taken as reference and one ml of NaOH 0.1 mol.L-1
(USP, 2007) has been employed to dissolve folates, and it was filled up to volume of stock
solution with ammonium acetate 8 mmol.L-1 pH 6.8. This condition of preparation of standard
served as stabilizing agent of the six folate forms studied. In spite of no antioxidants use,
standard presented a good repeatability throughout the study of selection of mobile phases.
Figure 01 shows the standard solutions prepared on the same day and diluted in
potassium phosphate buffer 100 mmol.L-1 pH 2.0 and ammonium acetate and 8 mmol.L-1 pH
6.8. It was observed that the low solubility in acid pH generated loss of symmetry of peaks
and low signal intensity mainly in the pteroic acid. However, the standard solutions diluted in
ammonium acetate have shown signal stability and maintenance of some chromatographic
parameters.
Table 02 presents the mobile phases which showed satisfactory results in the
separation of folate in isocratic mode. The mobile phases with pH ≥ 5 (Table 1) did not show
a satisfactory separation performance, even having been tested in binary and ternary mode
with acetonitrile and methanol.
Among the mobile phase pH<5, orthophosphoric acid and potassium phosphate buffer
solution in combination with the methanol were the ones showing best separation
performance in parameters k and α. Orthophosphoric acid in combination with acetonitrile
was the main combination of mobile phase for separation of folate [15,23,4,16,11]. However,
its use doesn't follow a standardized preparing. It has been widely used orthophosphoric acid
solution 33 mmol.L-1 as the pH adjusted in 2.1, 2.2 and 2.3 with sodium hydroxide or
potassium hydroxide, as potassium phosphate buffer solution.
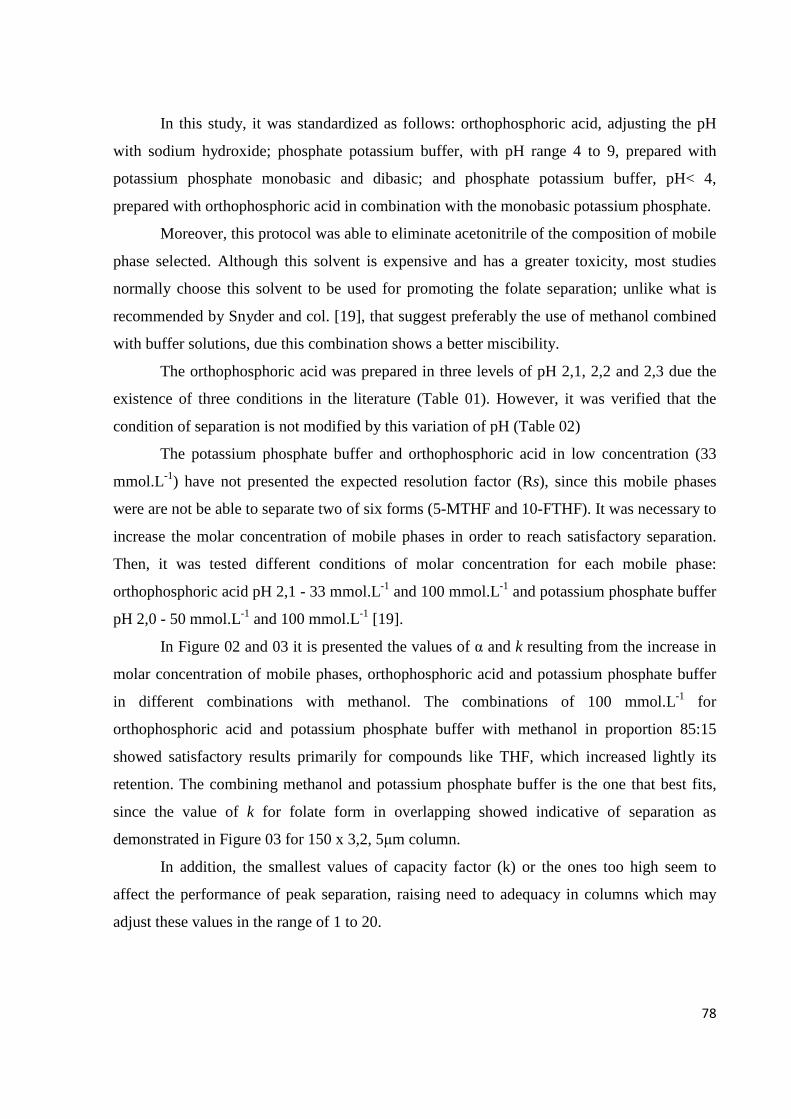
78
In this study, it was standardized as follows: orthophosphoric acid, adjusting the pH
with sodium hydroxide; phosphate potassium buffer, with pH range 4 to 9, prepared with
potassium phosphate monobasic and dibasic; and phosphate potassium buffer, pH< 4,
prepared with orthophosphoric acid in combination with the monobasic potassium phosphate.
Moreover, this protocol was able to eliminate acetonitrile of the composition of mobile
phase selected. Although this solvent is expensive and has a greater toxicity, most studies
normally choose this solvent to be used for promoting the folate separation; unlike what is
recommended by Snyder and col. [19], that suggest preferably the use of methanol combined
with buffer solutions, due this combination shows a better miscibility.
The orthophosphoric acid was prepared in three levels of pH 2,1, 2,2 and 2,3 due the
existence of three conditions in the literature (Table 01). However, it was verified that the
condition of separation is not modified by this variation of pH (Table 02)
The potassium phosphate buffer and orthophosphoric acid in low concentration (33
mmol.L-1) have not presented the expected resolution factor (Rs), since this mobile phases
were are not be able to separate two of six forms (5-MTHF and 10-FTHF). It was necessary to
increase the molar concentration of mobile phases in order to reach satisfactory separation.
Then, it was tested different conditions of molar concentration for each mobile phase:
orthophosphoric acid pH 2,1 - 33 mmol.L-1 and 100 mmol.L-1 and potassium phosphate buffer
pH 2,0 - 50 mmol.L-1 and 100 mmol.L-1 [19].
In Figure 02 and 03 it is presented the values of α and k resulting from the increase in
molar concentration of mobile phases, orthophosphoric acid and potassium phosphate buffer
in different combinations with methanol. The combinations of 100 mmol.L-1 for
orthophosphoric acid and potassium phosphate buffer with methanol in proportion 85:15
showed satisfactory results primarily for compounds like THF, which increased lightly its
retention. The combining methanol and potassium phosphate buffer is the one that best fits,
since the value of k for folate form in overlapping showed indicative of separation as
demonstrated in Figure 03 for 150 x 3,2, 5µm column.
In addition, the smallest values of capacity factor (k) or the ones too high seem to
affect the performance of peak separation, raising need to adequacy in columns which may
adjust these values in the range of 1 to 20.

79
3.2 Mechanism of separation of folate by Lewis theory acid-base
The Figure 04 shows the general structure of the folates whereby it is propose an
explanation to separation of six folate forms according to the concepts of Lewis acid-base
[14]. Due to the use of acid mobile phase, each amine and amide of folate group are a
potential proton binding site.
The structures of the tetrahydrofolate, 5-methyltetrahydrofolate, 10-
formyltetrahydrofolate and 5-formlytetrahydrofolate are very similar, except by the
substituent group in nitrogen on the position 5 and 10. In acid medium all nitrogen groups of
tetrahydrofolate can receive a proton, including that in position 5, making the molecule
soluble in acid mobile phase, causing it to have the lowest retention time.
The second molecule with lower retention time is 5-methyltetrahydrofolate. There is a
great similarity with tetrahydrofolate, except by the methyl group located in nitrogen on
position 5. This group donates electrons inductively that increases the resonance with the
carbonile group beside, resulting in decrease of the basicity of nitrogen. In addition, there is a
steric impediment caused by this alkyl group and both this factors difficult the capture of H+
in mentioned position, making the molecule of 5-methyltetrahydrofolate somewhat less polar
than tetrahydrofolate.
Both the 10-formyltetrahydrofolate and 5-formyltetrahydrofolate show relative smaller
polarity than 5-methyltetrahydrofolate, since formyl group decrease the basicity of the
molecule more strongly than the methyl group.
Thus, the third in elution order is 10-formyltetrahydrofolate, although both present the
same formyl group, its position modifies the polar character of each molecule. This group at
position 10 cause steric effect and reduce the electron density in aromatic systems (deactivator
character). Furthermore, the carboxylic group attached on ring at position 1' exerts influence
in decreasing basicity of amine at position 10.
Nitrogen of sp3 hybridization in amine at position 5 shows similar basicity than
aliphatic secondary amines, and therefore it is more basic than amine from position 10. In
addition, formyl group has a deactivator character of less importance than steric effect at
position 5 reducing the basicity more than position 10.
Folic acid and pteroic acid are different of the other folate forms, among other
characteristics, by the oxidation degree of pyrazine ring. Aromaticity of amines on pteridine
ring is less basic than non-aromatic cyclic amines like the ones found on the other folates.

80
This is explained due the high energy required to formation of ammonium ion on
aromatic ring. The conjugation of a pair of nitrogen electrons functioning with a π set of
linkage stabilize aromatics amines, decreasing energy to level lower than cyclic amines and
aliphatic. Thus, the greater the stability the lower the basicity. Because of this, polarity of
folic and pteroic acid is relatively reduced than others folate forms in acidic medium, and this
explain the highest retention time belonging to these two compounds.
Amide group at position 1’ from glutamic acid and the two carboxilic groups which
are at molecule of folic acid increase its polarity more than pteroic acid and this explain the
retention time of folic acid being lesser than pteroic acid.
3.3 Adequacy the study of columns with different sizes
In Figure 05 the performance is presented through relation between N and k of
columns. It is possible to notice that at the 100x1.0 column the k values distance themselves
from ideal values from Van Deemter equation. However, it was possible to separate the two
folate forms in overlap when used a smaller length column with the same particle size.
In Table 03 it is shown the improvement achieved on the chromatographic resolution
through the theoretical plates number and theoretical plate height of column tested. The
inverse relation between N and h was observed at all columns, being more favorable for 100 x
2.0 mm 5 µm column for the six folate forms.
It was expected that the decrease in the particle size given by 100 x 1.0 mm 3 µm
column, would provide shorter runs, with lower consumption of time and solvents. Thus, the
analysis and column rebalancing time would be faster and the pressures would be compatible
with conventional HPLC systems, [24]. However, there were no improvements in resolution
of 5-metyltetrahydrofolate and 10-formyltetrahydrofolate (Figure 04) with significant increase
in capacity factor of folate form (figure 06). This behavior and also loss of resolution was
observed in other studies [24] suggesting the need for adjustments methodology for a better
performance of this column.
The columns evaluated were non-polar or reverse phase (C18), this presents greater
compatibility for compounds with ionic character [25] being the most widely used in studies
of folate separation [27,28, 6].
The suitability study was able to demonstrate the ionic character of this reverse-phase
system even in the absence of ionic pairing agents, in this case the retention is directly

81
proportional to the solute's polarity, however the order of molecular weight has not followed
the same patterns order as observed in non-ionic systems.
3.3 Intermediate precision for identification and quantification of six folate forms
For each standard of folate it was performed spectral scan for confirmation of λ max in
at least three regions (the beginning, midpoint, and end) for each peak, with the objective of
assessing the purity index of standard and establish correlations with chromatographic
parameters - k, α and Rs for monitoring samples. In Table 04 standard of peaks signals did not
show any impurities which allowed the use of this information for monitoring of folate in
spinach samples.
The sample purity greater than 95 percent highlights of the method (Table 05) displays
good selectivity for the monitoring of the folate forms studied. In addition the limit of
detection and quantification was consistent with other studies that used by DAD detection as
it can be see in the Table 05.
In Table 06 it is shown the repeatability of the six chemical folate forms monitored in
spinach by retention time, purity, similarity index and parameters tr, k, α, Rs, Tf. In samples
the purity has been above of 90 percent and similarity above of 75 percent except for the 10-
formyltetrahydrofolate indicating a good relation between the obtained signal of the standard
and samples, when compared spectral and chromatographic parameters.
In addition, chromatographic parameters are adjusted in similar conditions to the
standard, with coefficients of variation up to 11 %. The Tf presented a good relation between
the width of the peak at 10% height indicating a balance of the forces established between the
mobile phase and the column.
4.0 Conclusion
Lewis acid-base concept is suitable for explaining the behavior of separation of the six
folate forms studied, since in acid medium, nitrogen atoms of amine and amide grouping
(forms containing glutamate) behave as Lewis base and are protonated by ions H+ free mobile
phase.
The best condition of solubility of folate was achieved in one mL of NaOH 0.1 mol.L-1
and ammonium acetate 8mmol.L-1, stabilizing six folate forms without the use of
antioxidants.

82
Separation was optimized and chromatographic parameters (tr, k, α and Rs) used as
chromatographic response monitoring tool. A binary system potassium phosphate buffer pH
2,0 100 mmol.L-1 and methanol in proportion 85:15 on isocratic mode was selected as mobile
phase.
Studies of C18 columns with different dimensions evaluated through the parameters h
and N resulted in separation of the six folate standard in 15 minutes for 100 x 2,0, 5 µm
column.
The set of information allowed characterize this condition as reverse phase ionic. It
was performed a new adequacy in selectivity for determination of folate in vegetable samples,
being able to monitor six folate in DAD, by chromatographic parameters, similarity and
purity index, criteria methodological that should be applied in other food matrices.
Acknowledgments
The author gratefully acknowledges the support technical and scientific given by the Nutrition
Department by Nutrition Doctorate Program; The Center for chemical characterization of
food, drugs and nutritional supplements; Department of Pharmacy – especially Antônio
Rodolfo de Faria; the Laboratory of Immunopathology Keizo Azami for technical support and
CAPES, FACEPE and PROPESQ for financial support.
Literature Cited
[1] Ball, G.F.M. (2006). Vitamins in foods: analysis, bioavailability, and stability. (1st ed).
United States of America, USA, Taylor & Francis Group: CRC press.
[2] Brody, T., Shane,B. (2001). Folic Acid, in Rucker R.B.; Suttie, J.W.; Mccormik, D. B.;
Machlin, L.J. Handbook of vitamins. (3rd ed) (pp.427-462). New York, NY, USA: Basel.
[3] Chang, H., Zhang, T., Zhang, Z., Bao, R., Fu, C., Wang, Z., Bao,Y., Li, Y., Wu, L.,
Zheng, X., Wu. J.(2011). Tissue-specific distribution of aberrant DNA methylation associated
with maternal low-folate status in human neural tube defects. Journal of Nutritional
Biochemistry, 22, 1172-1177.

83
[4] Jastrebova, J., Witthoft, C., Grahn, A., Svensson, U., Jagerstad, M. (2003). HPLC
determination of folates in raw and processed beetroots. Food Chemistry, 80, 579–588.
[5] Patring, J. D. M. & Jastrebova, J. A. (2007). Application of liquid chromatography–
electrospray ionisation mass spectrometry for determination of dietary folates: Effects of
buffer nature and mobile phase composition on sensitivity and selectivity. Journal of
Chromatography A, 1143, 72–82.
[6] Hefni, W., Vohrvik, V., Tabekha, M., Witthoft, C. (2010) Folate content in foods
commonly consumed in Egypt. Food Chemistry, 121, 540–545.
[7] Tamura, T. (1998). Determination of food folate. Nutritional Biochemistry, 9, 285-293.
[8] Paixão, J. A., Stamford, T. L. M. (2004). Vitaminas lipossolúveis em alimentos-Uma
abordagem analítica. Quimica Nova, 27, 1, 96-105.
[9] Arcot, J., Shrestha, A. (2005) Folate: methods of analysis. Trends in Food Science &
Technology, 16, 253–266.
[10] Rizzolo, A., Polesello, S. (1992). Review-Chromatographic determination of vitamins in
food. Journal of Chromatography, 624, 103-152.
[11] Yazynina, E., Johansson, M., Jägerstad, M., Jastrebova, J. (2008). Low folate content in
gluten-free cereal products and their main ingredients. Food Chemistry, 111, 236–242.
[12] Osseyi, E. S., Wehling, R. L., Albrecht, J. A. (1998). Liquid chromatographic method for
determining added folic acid in fortified cereal products. Journal of Chromatography A, 826,
235–240.
[13] Breithaupt, D. E. (2001). Determination of folic acid by ion-pair RP-HPLC in vitamin-
fortified fruit juices after solid-phase extraction. Food Chemistry, 74, 521–525.

84
[14] Jensen, W.B. (1980). The Lewis acid-base concepts: an overview. New York: Wiley.
[15] Pfeiffer, C. M., Rogers, L. M., Gregory III, J. F. (1997). Determination of Folate in
Cereal-Grain Food Products Using Trienzyme Extraction and Combined Affinity and
Reversed-Phase Liquid Chromatography. J. Agric. Food Chem, 45, 407-413.
[16] Quirós, A. R.B., Ron, C. C., López-hernández, J., Lage-yusty, M.A. (2004).
Determination of folates in seaweeds by high-performance liquid chromatography. Journal of
Chromatography A, 1032, 135–139.
[17] Phillips, K.M., Ruggio, M.D., Haytowitz, D.B. (2011). Folate composition of 10 types of
mushrooms determined by liquid chromatography–mass spectrometry Food Chemistry, 129,
630–636.
[18] Jandera, P. (2009). Isocratic HPLC: System selection. Encyclopedia of Chromatography,
3 ed. United States of America: Taylor & Francis Group, 1,1, 1291-1301.
[19] Snyder, L.R., Kirkland, J.J., Glajch, J. L. (1997). Pratical HPLC method development. In
John Wiley & Sons, (2nd ed) (pp.700). New York, NY.
[20] ICH (1994) Validation of analytical procedures: text and methodology Q2 (R1). 4th
version, 1-13.
[21] Eitenmiller, R.R., Lander Jr., W.O. (2008). Vitamin analysis for the health and food
sciences. (2nd ed) (pp.443-505). United States of America, USA, Taylor & Francis Group.
[22] U.S. Pharmacopeia (2007) n°28 National Formulary 23. U.S.Pharmacopeial Convention,
Rockville, Maryland.
[23] Ruggeri, S., Vahteristo L. T., Aguzzi, A., Finglas P., Carnovale E. (1999). Determination
of folate vitamers in food and in Italian reference diet by high-performance liquid
chromatography. Journal of Chromatography A, 855, 237–245.

85
[24] Guillarme, D., Ruta, J., Rudaz.S., Veuthey, J.L.(2006). New trends in fast and high-
resolution liquid chromatography: a critical comparison of existing approaches. Analytical
and Bioanalytical Chemistry, 397, 3, 1069-1082.
[25]Michalski, R. (2009). Ion Chromatography: Modern Stationary Phases. Encyclopedia of
Chromatography, 3tr Ed., 1, 1, 1241-1246.
[27] Vahteristo, L., Finglas, P. M., Witthoft C., Wigertq, K., Seale R., Froidmont-gohtz I.
(1996). Third EU MAT intercomparison study on food folate analysis using HPLC
procedures. Food Chemistry, 57, 1, 109- 111.
[28] Ndaw S., Bergaentzlé, M., Aoudé-werner, D., Lahély, S., Hasselmann, C. (2001).
Determination of folates in foods by high-performance liquid chromatography with
fluorescence detection after precolumn conversion to 5-methyltetrahydrofolates. Journal of
Chromatography A, 928, 77–90.

86
Figure 01. Test of solubility of folate standard in two conditions of dilution of stock solutions. Black line standard diluted in 8 mmol.L-1 ammonium acetate and dash dot line standard diluted in phosphate buffer 100 mmol.L-1 pH 2,0. 1.THF (rt. 1.67); 2.5-MTHF (rt. 2.47); 3.10-FTHF (rt. 3.21); 4.5-FTHF (rt. 4.93); 5.Folic acid (rt. 7.34); 6.Pteroic acid (rt. 11.17). Isocratic elution performed in 85% of potassium phosphate buffer pH 2,0 and 15% of MeOH, C18 150 x 3,2, 5 µm column. rt. retention time.

87
Figure 02. Chromatographic separation of folates by use of orthophosphoric acid pH 2,1 and molar concentrations of 33 and 100 mmol.L1 methanol in C18 150 mm x 3,2, 5µm column. 1. THF; 2.5-MTHF; 3.10-FTHF; 4.5-FTHF; 5.Folic acid; 6.Pteroic acid.

88
Figure 03. Chromatographic separation of folates by use of potassium phosphate buffer pH 2,0 and molar concentrations of 50 and 100 mmol.L-1.
in C18 150 mm x 3,2, 5µm column. 1. THF; 2.5-MTHF; 3.10-FTHF; 4. 5-FTHF; 5.Folic acid; 6.Pteroic acid;

89
Figure 04. Chemical structure of folic acid and derivatives, with indication of radicals and substituted groups.

90
Figure 05. Separation of folates depending on stationary phase C18 tested. 100 x 2,0, 5 µm column, flow 0,5 ml/mim; 150 x 3,2, 5 µm column, flow 0,5 ml/min; 100 x 1,0, 3 µm column, flow 0,06 ml/mim; 1.THF; 2.5-MTHF; 3.10-FTHF; 4.5-FTHF; 5.Folic acid; 6.Pteroic acid. Isocratic elution performed in 85% of potassium phosphate buffer pH 2,0 and 15% of MeOH, Standard diluted in 8 mmol.L-1 ammonium acetate.

91
Figure 06. Theoretical plate number and capacity factor (k) values to six folate forms evaluated in three columns. Isocratic elution performed in 85% potassium phosphate buffer pH 2,0 and 15% of MeOH, Standard dissolved in one mL of NaOH 1 mol.L-1 and ammonium acetate 8 mmol.L-
1.

92
Table 01. Mobile phases evaluated.
Mobile phase composition Reference
Group I pH≥5
Potassium phosphate buffer 35 mmol.L-1 pH 6,8 Osseyi et al., 1999
Ammonium acetate 8 mmol.L-1 pH 6,7 Prieto et al., 2006
Group II pH<5
Solution 2% acetic acid pH 2,8 Catharinos and Godoy, 2006 Solution 6% acetic acid, pH 3,4 Patring and Jastrebova, 2007;
Patring et al., 2007 Potassium phosphate buffer 35 mmol.L-1 pH2,1 Konings, 1999
Ortophosphoric acid 33 mmol.L-1 pH 2,2 Quirós et al., 2004; Ruggeri et al., 1999; Doherty and Beecher, 2003; Vahteristo et al., 1996.
Ortophosphoric acid 33 mmol.L-1 pH 2,3 Pfeiffer et al., 1997; Jastrebova et al., 2003;Yazynina et al., 2008

93
Table 02. Chromatographic performance of binary mobile phases tested. C18 150 mm x 3,2, 5µm column.
Mobile phases Chromatographic parameters k1 k2
α1 k3 α2
k4 α3
k5 α4
k6 α5
Solution of acetic acid 2% pH 2,8: MeOH (90:10)
1.94
0.00 -
0.00 -
2.88 -
0.00 -
0.00 -
Solution of acetic acid 2% pH 2,8: CH3CN (90:10)
0.34
0.65 3.83
0.65 1.00
1.15 1.76
1.86 2.84
3.74 2.01
orthophosphoric acid pH 2,1: MeOH (80:20)
0.36 1.17 3.23
1.29 1.10
2.01 1.56
3.18 1.57
5.93 1.86
orthophosphoric acid pH 2,1: CH3CN (80:20)
0.38 0.38 1.00
0.38 1.00
0.38 1.00
0.38 1.80
0.67 1.02
orthophosphoric acid pH 2,2: MeOH (80:20)
0.40 1.25 3.12
1.25 1.00
2.19 1.69
3.68 2.94
7.07 1.91
orthophosphoric acid pH 2,2: CH3CN (90:10)
0.00 0.00 -
0.00 -
0.00 -
0.00 -
0.00 -
orthophosphoric acid pH 2,3: MeOH (80:20)
0.33 1.22 3.70
1.22 1.00
2.16 1.77
3.77 1.74
7.38 1.95
orthophosphoric acid pH 2,3: CH3CN (80:20)
0.00 0.00 -
0.00 -
0.00 -
0.00 -
0.28 -
Potassium phosphate buffer pH 2,1: MeOH (80:20 )
0.58 1.17 1.81
1.06 1.10
1.98 1.69
3.03 1.53
6.05 1.99
1. THF; 2. 5-MTHF; 3. 10-FTHF; 4. 5-FTHF; 5. Folic acid; 6. Pteroic acid;
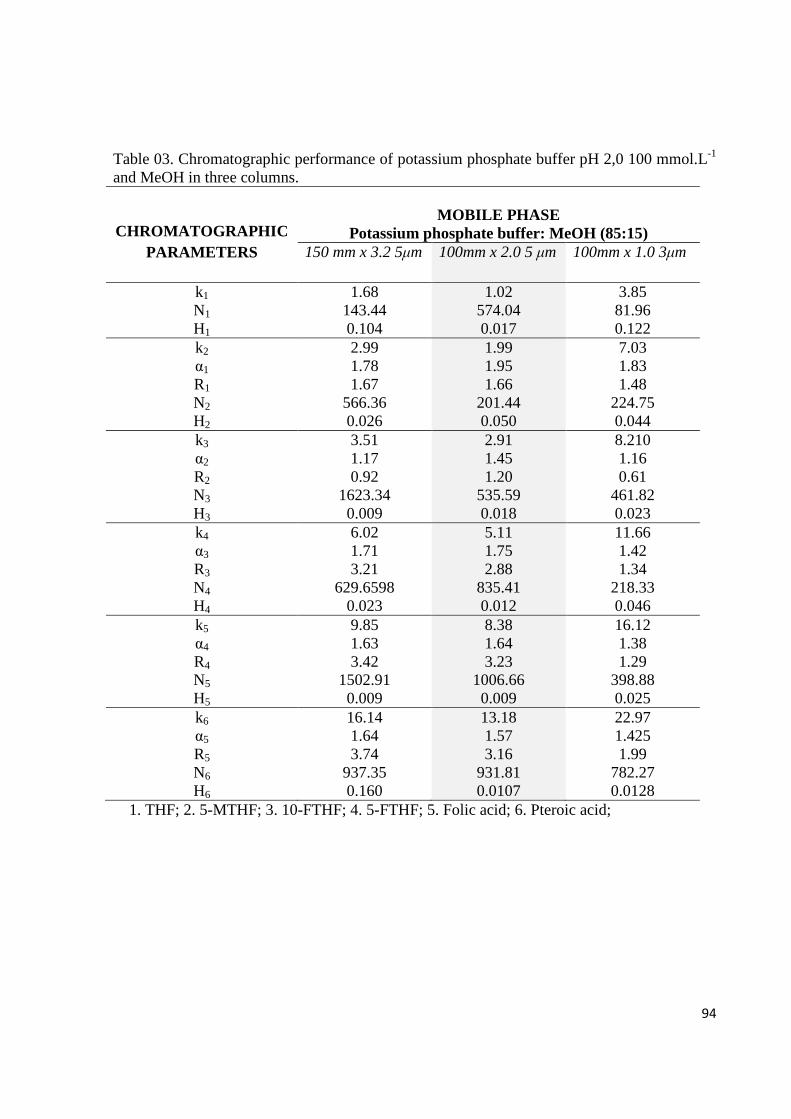
94
Table 03. Chromatographic performance of potassium phosphate buffer pH 2,0 100 mmol.L-1 and MeOH in three columns.
CHROMATOGRAPHIC PARAMETERS
MOBILE PHASE
Potassium phosphate buffer: MeOH (85:15) 150 mm x 3.2 5µm 100mm x 2.0 5 µm 100mm x 1.0 3µm
k1
N1
H1
1.68 143.44 0.104
1.02 574.04 0.017
3.85 81.96 0.122
k2
α1
R1
N2
H2
2.99 1.78 1.67
566.36 0.026
1.99 1.95 1.66
201.44 0.050
7.03 1.83 1.48
224.75 0.044
k3
α2
R2
N3
H3
3.51 1.17 0.92
1623.34 0.009
2.91 1.45 1.20
535.59 0.018
8.210 1.16 0.61
461.82 0.023
k4
α3
R3
N4
H4
6.02 1.71 3.21
629.6598 0.023
5.11 1.75 2.88
835.41 0.012
11.66 1.42 1.34
218.33 0.046
k5
α4
R4
N5 H5
9.85 1.63 3.42
1502.91 0.009
8.38 1.64 3.23
1006.66 0.009
16.12 1.38 1.29
398.88 0.025
k6
α5
R5
N6
H6
16.14 1.64 3.74
937.35 0.160
13.18 1.57 3.16
931.81 0.0107
22.97 1.425 1.99
782.27 0.0128
1. THF; 2. 5-MTHF; 3. 10-FTHF; 4. 5-FTHF; 5. Folic acid; 6. Pteroic acid;

95
Table 04. Precision and identification parameters for six chemical folate forms.
Standard prepared in one ml NaOH 1mol.L-1 and ammonium acetate pH 6,8 and, rt - retention time. (n=4)
Standard
folates
rt λMax.
nm
Impurity K α Rs
THF 1.76 294 n. d. 1.02 - -
5-MTHF 2.61 290 n. d. 1.99 1.95 1.66
10-FTHF 3.40 261 n. d. 2.91 1.45 1.20
5-FTHF 5.31 288 n. d. 5.11 1.75 2.88
Folic acid 8.16 286 n. d. 8.38 1.64 3.23
Pteroic acid 12.34 299 n. d. 13.18 1.57 3.16

96
Table 05. Sensitivity of the HPLC-UV method.
FOLATE FORM
LOD (ng per
injection)
LOQ (ng per
injection) THF 1.33 4.03
5-MTHF 3.47 10.52 10-FTHF 2.53 7.68 5-FTHF 2.35 7.15
Folic acid 0.75 2.26 Pteroic acid 36.2 109.8
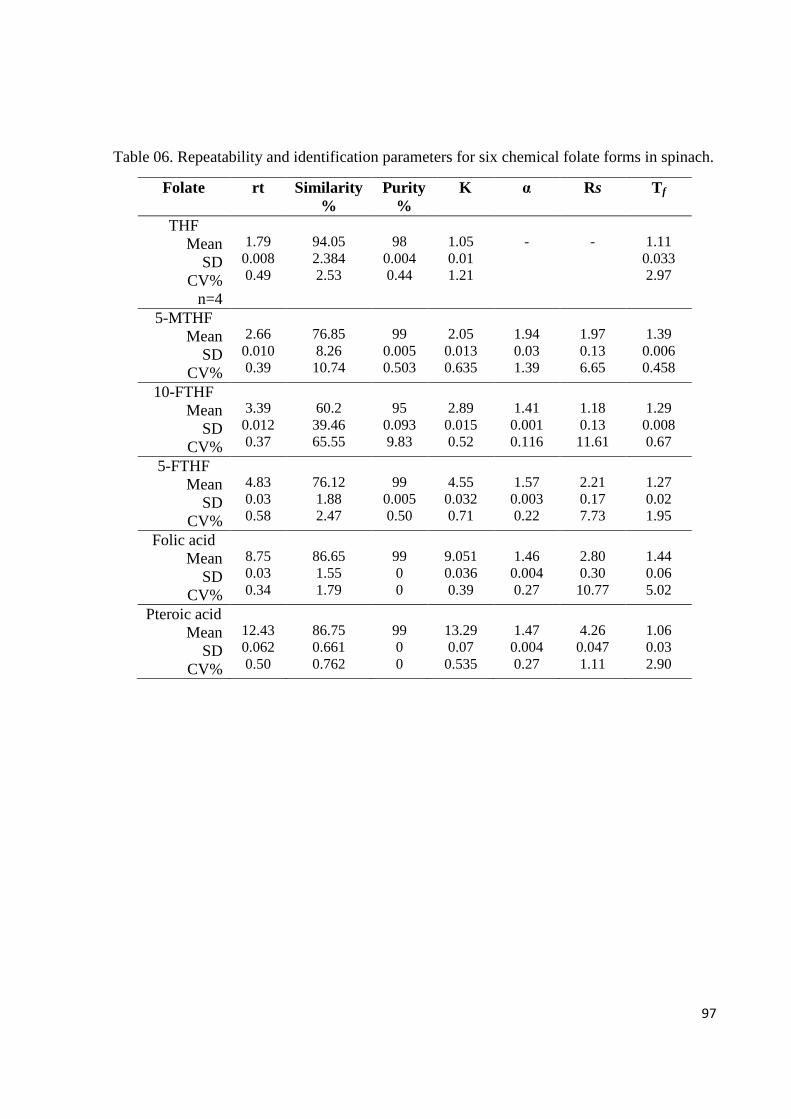
97
Table 06. Repeatability and identification parameters for six chemical folate forms in spinach.
Folate rt Similarity %
Purity %
K α Rs Tf
THF Mean
SD CV%
n=4
1.79 0.008 0.49
94.05 2.384 2.53
98
0.004 0.44
1.05 0.01 1.21
-
-
1.11 0.033 2.97
5-MTHF Mean
SD CV%
2.66 0.010 0.39
76.85 8.26 10.74
99
0.005 0.503
2.05 0.013 0.635
1.94 0.03 1.39
1.97 0.13 6.65
1.39 0.006 0.458
10-FTHF Mean
SD CV%
3.39 0.012 0.37
60.2 39.46 65.55
95
0.093 9.83
2.89 0.015 0.52
1.41 0.001 0.116
1.18 0.13 11.61
1.29 0.008 0.67
5-FTHF Mean
SD CV%
4.83 0.03 0.58
76.12 1.88 2.47
99
0.005 0.50
4.55 0.032 0.71
1.57 0.003 0.22
2.21 0.17 7.73
1.27 0.02 1.95
Folic acid Mean
SD CV%
8.75 0.03 0.34
86.65 1.55 1.79
99 0 0
9.051 0.036 0.39
1.46 0.004 0.27
2.80 0.30 10.77
1.44 0.06 5.02
Pteroic acid Mean
SD CV%
12.43 0.062 0.50
86.75 0.661 0.762
99 0 0
13.29 0.07 0.535
1.47 0.004 0.27
4.26 0.047 1.11
1.06 0.03 2.90

98
Investigation of protocols to extraction and quantification of folates in vegetables
matrices split into liquor and fiber fraction using factorial designer
Emmanuela Prado de Paivaa*, Clayton A. de Azevedo Filhob, Sabrina Gomes Ferreirac, Tânia
Lucia. M. Stamfordc, Jose Almiro da Paixãoc. a Departamento de Tecnologia Rural, Universidade Federal Rural de Pernambuco, Rua Dom
Manoel de Medeiros, s/n, Dois Irmãos, 52171-900 – Recife, PE, Brazil. b Departamento de Farmácia, Universidade Federal de Pernambuco, Av. Prof. Moraes Rego,
s/n, Campus Universitário, 50670-901, Recife, PE, Brasil. c Departamento de Nutrição, Universidade Federal de Pernambuco, Av. Prof. Moraes Rego,
s/n, Campus Universitário, 50670-901, Recife, PE, Brasil.
* Corresponding author: [email protected] Tel: 55- 0218133206284; Fax: 55-
0218133206281.
Abstract
The main protocols of extraction were investigated for the six folate forms in vegetable
matrices, treated in two fractions, liquor and fiber. In a pilot study, it was used ammonium
acetate added of 2-mercaptoetanol and ascorbic acid as extraction solution. The condition of
use of protease and folate conjugase was evaluated, besides alternative treatments without
enzyme use. Based on the results of this stage, it was built the factorial designer 24, with three
replications at the central point, using the following variables: temperature, time for reaction,
molar concentration of the extraction solution and ratio sample/solution as independent
variables and dependent variable, the amount of each folate form extracted as well as spectral
and chromatographic parameters. In the pilot study it was verified that the enzyme use can
cause an increase in the variability of the folate content, which enabled to build the factorial
designer without the enzyme use. The binomial time and temperature showed greatest impact
on the extraction profile, besides high concentrations of ammonium acetate resulting in
bifurcation of some peaks. 5-methyltetrahydrofolate was extracted primordially in the liquor
fraction, indicating that this treatment on the matrix provoked suitable condition extraction
this folate.
Key words: folates, extraction, vegetables, liquor, fiber, factorial designer.

99
1.0 Introduction
The importance of folate as an essential micronutrient for prevention of neural tube defect
was recognized in the 90's, especially the understanding of its role in the synthesis of nucleic
acids and DNA building [1]. The progress of chronic non-communicable diseases in society
has given new emphasis for the importance of folate as mediators for DNA repair. In addition,
control of folate plasma levels has been used in the prevention of coronary disease [2],
neurological disorders and depression [3].
Fruits, peas and others vegetables are good sources of folate, in the polyglutamates form.
5-methyltetrahydrofolate (5-CH3-H4folate), 5-formyltetrahydrofolate (5-HCO-H4folate), 10-
formylfolate (10-HCO-folate), 10-formyldihydrofolate (10-HCO-H2folate), and tetra-
hydrofolate (H4folate) are the main monoglutamates occurring in these foods [4,5,6].
Vegetables and diet mixtures containing vegetables has been widely chosen as a matrix
for the development of methodologies, among them spinach can be considered a good model
for study because of its high availability of different folate forms [7,8, 9, 10]. The distribution
of these forms in vegetables has been reported in studies using high performance liquid
chromatography - HPLC as a method of identification and quantification [5].
Analytical methods for determination of folate in food usually has required three steps:
release of folate matrix; deconjugation of polyglutamates to mono- and di-glutamate,
identification and quantification of microbial activity by turbidimetric response - official
protocol [11], or alternatively, high performance liquid chromatography (HPLC) coupled to
detection UV-Vis [12], fluorescence [6], Mass Spectroscopy -MS [13] and radioimmunoassay
[14].
HPLC is a tough candidate to substitute the official protocol, since it has an
advantageous sensitivity and selectivity for screening the most different folate forms, control
of contaminants, precision and repeatability in routine analysis. In addition, the techniques
that employ detection by UV-Vis and diode array detector (DAD) have more chances of
becoming a routine, especially in developing countries that sophisticated methods such as LC-
MS.
Extraction is considered a critical step in the analytical process of folate study, and the
use of trienzyme treatment (amylase, protease and folate conjugase) has become a souce of
variation in results, also the work with enzymes result in more time spent consuming making
it difficult the inclusion of the method as a routine [15,16,17,6,18,12,19,8, 21].

100
Recent studies focusing on the intrinsic characteristic of each matrix and also on its
chemical composition has guided a better treatment [6,22]. To vegetables, the folate
conjugase use remains polemic, due to spontaneous conversion of the polyglutamates to di
and monoglutamate during extraction [23,10, 24].
Protease and amylase can be obtained commercially. However, folate conjugase is
usually extracted from different sources such as chicken pancreas, pig kidney, human and rat
plasma, which possibly can generate differences in results. Besides, the costs involved in the
extraction steps of enzymes has forced many researchers to reproduce extraction protocols
[25, 7, 26, 27,28,6,10, 9, 12, 29, 30, 21], being difficult to standardize the methodology.
Chemometric tools have been applied as strategy for development of analytical
methods. It consists of applying mathematical or statistical models to explain the phenomena
and chemical processes. Currently the most used models are factorial designer and central
composite designer (CCD), since they reduce the number of experiments and therefore result
in economy of time and reagents [31].
The principle of this technique consists in variation all factors, and found the best
combination, however unlike traditional models; factorial designer allows the investigation of
factors at same time [31]. That model is widely used to improve methodologies in
pharmaceutical formulations [32], acid mixtures [33] and isomers [34].
The purpose of this experiment is to evaluat current treatments employed during folates
extraction in vegetables aiming to identify the main factors that generate conflicting results.
These were arranged in a factorial designer in order to assess them in an interactive mode and
propose strategies for extraction in vegetables matrices.
2.0 Material and methods
2.1 Sample
The vegetables used in this work were purchased in local market between the months of
September 2011 and January 2012, and conducted to analysis soon after acquisition. The
vegetables chosen were those considered by the Brazilian Food Composition Table [35],
namely: Broccoli Brassica oleracea var. itálica, Spinach Tetragonia expansa, Cabbage
Brassica oleracea var. capitata, Sauce Petroselinum hortense, Green beans Phaseolus
vulgaris. Beet Beta vulgaris L.

101
2.2 Folates standard, reagents and enzymes
Tetrahydrofolate (H4-folate), 5-methyltetrahydrofolate (5-CH3-H4-folate), 10-
formyltetrahydrofolate (10-HCO-H4-folate) 5-formyltetrahydrofolate (5-CHO-H4-folate)
HPLC grade were provided by Merck (Switzerland). Folic acid and pteroic acid were
purchased from Sigma-Aldrich (St. Louis, MO, USA). Acetonitrile and methanol were
purchased from Merck in HPLC grade (Darmstadt, Germany). All other reagents were of the
highest purity available. Ultrapure water was obtained in Milli-Q integral system 5
(Millipore).
Protease (Streptomyces griseus) was purchased from Sigma, and folate conjugase was
obtained from rat´s plasma (project approval by Ethics Committee Animal,
23076.020176/2010-80). Rat’s blood (Ratus noverdicus) was collected with heparin tubes and
centrifugated at 3,000 rpm for 20 minutes (Pfeiffer et al., 1997). Each one ml of plasma was
distributed into eppendorfs and lyophilized in order to extend its shelf life. At the time of use,
plasma was resuspended in one ml of ammonium acetate 8mmol.L-1 and centrifuged at 20,000
rpm, according to Gregory and col. [36] in order to use the supernatant as source of folate
conjugase.
2.3 Experimental
After the investigation of the main factors quoted in literature for extraction methods,
it was isolated the main factors in order to establish a protocol capable of being run in a single
day’s work, and yet produce the sufficient extraction of folates. The factors selected were:
molar concentration of the extraction solution, temperature, protein precipitation agent or
cleaning and enzymes (protease and folate conjugase), and conducted in pilot study with fresh
spinach used as matrix model.
2.4 Sample preparation (pilot study)
The whole spinach was washed in Milli-Q water and 400g was mashed in food
processor producing two fractions: liquor and fiber. Separately, one mL of the liquor and one
gram of fiber were transferred to a test tube and each fraction were added 20 mL of extraction
solution (ammonium acetate 50mmol.L-1 containing, ascorbic acid 1% and 2-mercaptoethanol
10 mmol.L-1), then stirred in vortex for 20 seconds and heated at 40°C for 10 min.

102
Afterwards, fiber fraction was filtered through qualitative filter paper and 5 ml of liquor and
fiber fraction were transferred individually to a test tube.
The samples were submitted to dienzyme treatment with protease and folate
conjugase. Protease was re-suspended in extractor solution (2 mg.ml-1) and added one ml to
test tube [37]. Rat´s plasma liofilized was re-suspended in extractor solution and 250 µL were
used to treatments [37]. Before adding the enzyme, pH of the extracts was measured to verify
and standardize the conditions for treatments without antioxidants (around 6,78 to 6,85).
When antioxidants were used, pH ranged 4,51 to 4,59. The tubes were incubated at 37 °C for
1h. The enzymes inactivation was carried out at 100 °C for 5 min, and tubes were placed in
ice bath for cooling.
In order to reduce the analysis time and variations generated by enzymes
trichloroacetic acid [38] was used as deproteinization agent to make a comparison on
proteases use. The concentrations of 2, 5 and 8% tricloracetic acid without the use of folate
conjugase were evaluated in the sample.
Control treatments were performed, in this protocol it was excluded the use of
antioxidants in the extractor solution, enzymes and deproteinization agents (Figure 01).
All treatments (control, antioxidant, tricloracetic acid, folate conjugase, protease and
dienzyme) were centrifuged for 15 min at 4 °C, 5,000 rpm and supernatants were filtered
through cellulose acetate membranes 0.45 µm. One mL of the each filtrate (liquor and fiber)
was retained for injection into the HPLC.
Each protocol was individually tested, and all steps were performed in a single
analysis day, as shown in Figure 01. From the results of this pilot study it was isolated the
main factors that improved folates extraction, in order to building a factorial designer model.
2.5 Factorial designer for optimization of extraction conditions
A factorial designer study was used to investigate the effects of variables that proved
significant results during pilot study. In this suitable system test, the effect of ratio amount
sample and solution, temperature extraction, molar concentration of extraction solution and
time were organized in a 24 factorial designer with three replications at the central point, total
of 19 trials, as shown in Table 01. The result obtained with spinach was selected as the best
condition for folate extraction in the other vegetables and dependent variables were
concentrations and purity index from six folate forms evaluated.

103
2.6 Chromatographic equipment and conditions
The HPLC system was a Shimadzu Prominence (Shimadzu, Japan), consisting of a
diode array detector (DAD) model SPD-20AV, fluorescence detector (RF) model RF-20A,
quaternary pump model LC - 20 AT, column oven model CTO-20AC, autosampler model
SIL-20AC. All the system was controlled by controller model CBM-20A and operated with
LC Solution™ software (version 1.25, Shimadzu, Japan).
Detection was made using the DAD. Standard and test samples were measured
between 190 and 400nm. Elutions of folate were performed on a Spherisorb ODS-2 100 x 2,0
mm 5µm column (Waters). The flow rate was 0,5 ml/min, with 20 µL of injection per
analysis. The mobile phase used was buffer potassium phosphate 100 mmol.L-1 pH 2,0 and
methanol, prepared at 25°C and before using, it was filtered through Millipore filter with pore
size of 0,22 µm in diameter. The elution was performed in isocratic mode, in ratio 85:15 (v/v),
with total run time not superior at 20 minutes.
2.7 Validation parameters
2.7.1 Precision and identification
To evaluate the methodological accuracy, spectral scan to confirm the λ max in DAD
was performed for all standard in at least three regions of the peak (start, midpoint and end)
with the objective of evaluating the similarity and purity index of standard and establish
correlation between spectroscopic and chromatographic parameters k, α and Rs for monitoring
samples. The chromatographic parameters were calculated according to the equations:
capacity factor (k) 0,5 ≤ k ≤ 20 calculated with the formula k= (tr-t0)/t0, where t0 is retention
time of unretained solvent and tr is retention time of analyte; Resolution (Rs) ≥ 1,5 calculated
as Rs= (t2-t1)/0,5(w2+w1), where w is peak width; Separation factor (α) ≥ 1,5, calculated using
the formula k2/k1 [39], and tail factor (Tf) calculated with formula Tf= b/a, where a and b were
the front and back half-widths at 10% of the peak height.
The intra and inter-day precision of the method was estimated through standard
deviation (SDR) for determination of folate in vegetables matrix during different days.

104
2.7.2 Limit of detection and quantification
Quantification was performed using external standardization. Stock solutions of each
folate form was prepared with 10 mg of the standard (weighed with analytical precision) and
adding one mL of NaOH solution 0.1mol.L-1; and the volume completed to 100mL with
ammonium acetate 8mmol.L-1 pH 6,8. Soon after, one mL of stock solution of each standard
was transferred to the same volumetric flask and diluted with ammonium acetate to reach a
concentration of 100µg/mL of the pool that was used for building calibration curve.
The solutions for calibration curve were prepared by diluting in ammonium acetate
from stock solution for elaborating the pool solution to obtain concentrations of 0,3, 0,5, 1,0,
10,0, 50,0, 75,0 and 100µg.mL-1. The limit of detection (LD) was defined as the lowest
analyte concentration yielding a signal-to-noise ratio of 3, the limit of quantification (LQ) was
defined as the lowest analyte concentration yielding a signal-to-noise ratio of 10 [40].
Concentration of folates in real samples was expressed as µg folate per g or mL of extracts
from liquor and fiber.
2.8 Statistics
ANOVA was used for evaluating the means of treatments applied in the pilot study.
Tukey test was used when differences were found for p <0,05. Statistical analyzes including
factorial designer were performed using the Statistica 7.0.
3.0 Results and discussion
3.1 Study of extraction conditions and enzyme treatment
The extraction was performed in liquor and fiber to evaluate the folate form present in
each fraction and maximize the extraction process, and ammonium acetate was chosen as the
extraction solution, because it showed good stability during the preparation of standard
solutions and repeatability of protocol used in pilot study. In this solution it was possible to
solubilize the six folate forms in all combinations employed and exemplified in Figure 01.
Its use is particularly suitable in the range of 8-50 mmo.L-1, and 50 mmo.L-1
concentration was chosen taking as reference the study Pfeiffer and col. (1997).
In this stage, trichloroacetic acid was used as precipitating agent for proteins at
concentrations of 2, 5 and 8%, aiming to reduce steps and enzymes use (protease). The figure
02 shows the chromatograms for the treatment of samples with tricloracetic acid - TCA (A)

105
and protease (B). Trichloroacetic acid was used in order to shorten the number of stages of
analysis, since enzyme use requires time intervals of exposure and inactivation, which causes
great impact on the loss of folate.
However, its use had no impact on the removal of interfering matrix, in addition the
increase of concentration (Figure 02 A), generated chromatograms with loss of signal of some
forms, like the THF, and peak bifurcation on 5-MTHF. Protease produces increase peak of
THF and 5-FTHF with significant differences for p value <0.05.
During the development of the pilot study it was possible to confirm that the use of
antioxidants have no effect on stability of folate signal, since were not significant differences
between the control treatment and antioxidants (p value>0,05). However, to ensure successful
results for a day of analysis and conditions for comparison with other studies it was preferred
to keep the use of antioxidants in factorial designer [41].
The use of protease and folate conjugase cause significant increase in folate level. In
food, folates are linked to more than six glutamic acid chains, needing to be deconjugated. In
addition, complexity of matrix needs to be overcome by the use of proteases and amylases.
Particularly in the case of vegetables matrices which the presence of proteins and peptides
may cause physical restriction of enzyme action.
The use of protease, folate conjugase or both treatments produced significant
differences from control THF (p value 0.0018) 5-MTHF (p value 0.0022), 10-FTHF (p value
0.0055) liquor fraction and fiber fraction 10-FTHF (p value 0.0018) in corroborating the
differences found by chromatographic analysis (figure 04). In addition, treatment of the
matrix into two fractions, liquor and fiber, appears to be a strategy to achieve suitable
extraction of 5-MTHF in liquor fraction of vegetables, as shown in Figure 05.
Since 1990 the tryenzimatic treatment originally proposed by Eitenmiller and col. is
the main alternative in studies of folate extraction [42]. The heat is used to trigger the release
process of folate, especially those tightly bonded to proteins and also for inactivation of
endogenous enzymes.
However, the decision for the enzyme use is strongly dependant on the matrix
composition. For enzymes with a known kinetic behavior and commercially available, such as
protease and amylase the work becomes easier. Notwithstanding, the folate conjugase shows a
non known kinetics and it is still controversial in literature which would be the most
appropriate way to obtainment [25].

106
Insufficient description and characterization of commercialized material (plasma and
acetone powder pig kidney) has discouraged their use. In this study, it was chosen the rat
plasma as an extraction source of folate conjugase. It was monitored in preliminary tests to
achieve ideal conditions of deconjugation. These included pre-purification of plasma by
centrifugation at 20.000 g, use of cleaning agents such as charcoal during centrifugation and
evaluation of the ideal volume of plasma per sample (data not shown).
It was concluded, during these trials, that more plasma activity was noticed for
polyglutamates. Also, the variability inherent to biological materials of some lyophilized
plasma samples showed low repeatability and almost constant necessity of repetition, mainly
when applied to spinach used as reference matrix.
The characteristics: thermolabile, photosensitive and unstable in the presence of
oxygen of folate forms [43] are responsible for the difficulties already discussed and guided
the decision to choose a methodology that employs fewer steps, lower temperature and shorter
incubation time.
3.2 Extraction conditions in factorial designer
The combination of time and temperature is one of the most variable in the literature
for the extraction of folates. The temperature of 100 °C is generally considered the one that
results in a higher release of folates in the matrix [21, 9, 12]. The exposure time is generally
influenced by the enzyme use, there are treatments performed for more than 6h [19, 6].
Thus, in the factorial designer it was investigated the impact of increased temperature
and time together, with combinations of up to 2 hours exposure to heat at 105 °C. In addition,
molar concentration was investigated due to its variability in literature [37, 6, 22] and the
range of stability of folates in ammonium acetate was checked. All combinations of
treatments were applied with the use of antioxidants.
The relationship between sample/solution was investigated since Patring and col. [27].
It has been verified that in samples of yeast, the form THF had a lower extraction and greater
variability in masses above 70mg of yeast.
Tables 02 and 03 presents the results of combined effects of treatments in the liquor
and fiber fraction, respectively. In general, the factors showed significant negative effect on
the extractability of folate, meaning that the lower level for all treatment combinations, for
most forms, is the best condition for methodological optimization.

107
Although the value of r-square for all folate forms are above 0.90, it was found a lack
of adjustment in the model, except for 5-FTHF in both fractions, indicating that it has not yet
reached the optimal extraction region [31].
Table 04 shows the decoded variables and its responses. The first assay - the
combination ratio of 1:5 sample/solution, temperature at 35 ° C in 30 mmol.L-1 ammonium
acetate and 10 minutes - showed to be the best condition for subsequent adjustment and
optimization. This decision was made based on the assessment not only of the effects, but also
using the study of purity in λmax and the similarity according to library of standard for
signals obtained in the treatments.
In extreme conditions of temperature and time (105°C up to 2 hours), signals showed
concentrations upper tha the reported on most works described in literature (Table 04)
[8,9,10], including the signals at the central point studied. The evaluation of the similarity and
purity was less than 60%. However, at low temperature and time, the parameters of similarity
and purity were above 95%. This behavior was observed in both fractions (liquor and fiber).
As in the pilot study at factorial designer planning the 5-MTHF was not quantified in
the fiber fraction, since obtained signal were below the quantification limit. Fractionation of
the matrix appears to be a good strategy to achieve better measurement of 5-MTHF in liquor
since the signs achieved were adjusted to DAD detection.
High concentrations of TCA applied in the pilot study and treatments that have used
high concentrations of ammonium acetate in combination with a temperature of 105 °C in
factorial designer showed peak bifurcation to some folate forms. In addition, folic acid and
acid pteroic though having significant effects for most treatments, were the forms that have
had minor adjustments to the model.
The collection of information compiled by the factorial designer demonstrated the
importance of controlling the time and temperature during the extraction process, in contrast
to some methodologies that perform an excessive number of stage at temperature of 100 °C in
time execution that exceeding 24 hours.
In this study it was possible to achieve an extraction methodology capable of being
executed in a single day’s work with simplified instrumentation common in routine
laboratories all around the world, this factors associated with low cost of analysis, placing it
as promising for the folate study in foods.

108
3.3 Intermediate precision, identification and quantification parameters
Table 05 presented the variability between two random days analysis. The coefficient
of variation reached 12% maximum, possibly due to the conditions for accommodation of the
column. On the second day of analysis, 5-MTHF and 10-FTHF showed purity and similarity
index lower than expected, possibly due to seasonal variation of the matrix. This analysis was
performed four months later, which contributed to the variability found. This data and other
factors have demonstrated the functionality of the method, mainly because it is accomplished
without the use of reference material.
Table 06 shows the intermediate validation parameters of the new method. The
selectivity was compatible to other methodological conditions [28] by DAD detection.
In order to compare the precision methods in other samples, it was analyzed
vegetables in the liquor and fiber fraction shown in Tables 07 and 08. Spinach, as viewed in
pilot study, was distinguished from other samples for presenting all folate forms monitored by
this method. A particularity poorly reported, is the natural occurrence of folic acid in foods, as
observed in all samples, except green beans.
The information contained in Tables 07 and 08 may help in a better understanding of
the bioavailability of folates in vegetables, particularly what forms and quantities are
available, and contribute in studies of nutritional and elaboration of food composition tables.
4.0 Conclusions
Ammonium acetate used with or without antioxidants allowed a good extraction condition
corroborated by statistical analysis in the six chemical folate forms. In addition, split of the
matrix in liquor and fiber provided a suitable condition of extraction for 5-MTHF.
The use of protease, folate conjugase or both treatments produced significant
differences compared to control treatment for THF, 5-MTHF, 10-FTHF liquor fraction and
fiber fraction 10-FTHF.
The lability of folates added the methodological difficulties shown by the enzyme use
directed the choice of a methodology that employs fewer steps and low temperature.
The factorial designer allowed confirms the binomial time and temperature and its impact
on the extraction conditions when temperature up to 105 °C for more than 60 minutes. Thus,
it is recommended the temperature of 40 °C up to 10 minutes for vegetables matrices.

109
The study of precision inter and intra-day of the samples showed variation up to 12 % in
vegetables matrices. Tools similarity and purity were adequate to demonstrate the seasonal
variability of the spinach and the need for methodological adjustments for 5-MTHF and 10-
FTHF;
This methodology appeared to be suitable in order to differentiate six folate forms found
in vegetables using selectively separation parameters for each peak, combined with spectral
parameters and purity index.
Acknowledgments
The author gratefully acknowledges the support technical and scientific given by the Nutrition
Doctorate Program, Department of Pharmacy – especially Beate Saegesser Santos, Chemical
Engineering Department – especially Fernanda Pimentel; Laboratory of Immunopathology
Keizo Azami for technical support and CAPES, FACEPE and PROPESQ for financial
support.
5.0 References
[1] Chang, H., Zhang, T., Zhang, Z., Bao, R., Fu, C., Wang, Z., Bao,Y., Li, Y., Wu, L.,
Zheng, X., Wu. J. (2011). Tissue-specific distribution of aberrant DNA methylation
associated with maternal low-folate status in human neural tube defects. Journal of
Nutritional Biochemistry, 22, 1172-1177.
[2] Miller, A., Mujamdar, V., Palmer, L., Bower, J.D., Tyagi, S.C. (2002). Reversal of
endocardial endothelial dysfunction by folic acid in homocysteinemic hypertensive rats.
American Journal of Hypertension, 15, 2, 157-163.
[3] Eitenmiller, R.R., Lander Jr., W.O. (2008). Vitamin analysis for the health and food
sciences. (2nd ed) (pp.443-505). United States of America, USA, Taylor & Francis Group.
[4] Brody, T., Shane,B. (2001). Folic Acid, in Rucker R.B.; Suttie, J.W.; Mccormik, D. B.;
Machlin, L.J. Handbook of vitamins. (3rd ed) (pp.427-462). New York, NY, USA: Basel.
110
[5] Phillips, K.M., Ruggio, M.D., Haytowitz, D.B. (2011). Folate composition of 10 types of
mushrooms determined by liquid chromatography–mass spectrometry Food Chemistry, 129,
630–636.
[6] Yazynina, E., Johansson, M., Jägerstad, M., Jastrebova, J. (2008). Low folate content in
gluten-free cereal products and their main ingredients. Food Chemistry, 111, 236–242.
[7] Vahteristo, L.T., Ollilainen, V., Koivistoinen, P.E., Varo, P. (1996). Improvements in the
Analysis of Reduced Folate Monoglutamates and Folic Acid in Food by High-Performance
Liquid Chromatography. J. Agric. Food Chemistry, 44, 477-482.
[8] Doherty, R.F., Beecher, G.R. (2003). A Method for the Analysis of Natural and Synthetic
Folate in Foods. Journal Agricutural and Food Chemistry, 51, 354-361.
[9] Jastrebova, J., Witthoft, C., Grahn, A., Svensson, U., Jagerstad, M. (2003). HPLC
determination of folates in raw and processed beetroots. Food Chemistry, 80, 579–588.
[10] Stea, T. H., Johansson, M., Jagerstad, M., Frølich, W. (2006). Retention of folates in
cooked, stored and reheated peas, broccoli and potatoes for use in modern large-scale service
systems. Food Chemistry, 101, 1095–110.
[11] Soongsongkiat, M., Puwastien, P., Jittinandana, S., Dee-uam, A., Sungpuag, P. (2010).
Testing of folate conjugase from chicken pancreas vs. commercial enzyme and studying the
effect of cooking on folate retention in Thai foods. Journal of Food Composition and
Analysis, 23, 681–688.
[12] Quirós, A. R.B., Ron, C. C., López-hernández, J., Lage-yusty, M.A. (2004).
Determination of folates in seaweeds by high-performance liquid chromatography. Journal of
Chromatography A, 1032, 135–139.

111
[13] Vishnumohan, S., Arcot, J., Pickford, P. (2011). Naturally-occurring folates in foods:
Method development and analysis using liquid chromatography–tandem mass spectrometry
(LC–MS/MS). Food Chemistry, 125, 736–742.
[14] Martin, H., Comeskey, D., Simpson, R.M., Laing, W.A., Mcghie, T.K. (2010).
Quantification of folate in fruits and vegetables: A fluorescence-based homogeneous assay.
Analytical Biochemistry, 402, 137–145.
[15] Osseyi, E. S., Wehling, R. L., Albrecht, J. A. (1998). Liquid chromatographic method for
determining added folic acid in fortified cereal products. Journal of Chromatography A, 826,
235–240.
[16] Prieto, S. P., Grande, B. C., Falcón, S. G., Gándara, J. S. (2006). Screening for folic acid
content in vitamin-fortified beverages. Food Control, 17, 900–904.
[17] Breithaupt, D. E. (2001). Determination of folic acid by ion-pair RP-HPLC in vitamin-
fortified fruit juices after solid-phase extraction. Food Chemistry, 74, 521–525.
[18] Patring, J., Wandel, M., Jagerstad, M., Frølich, W. (2009). Folate content of Norwegian
and Swedish flours and bread analysed by use of liquid chromatography–mass spectrometry.
Journal of Food Composition and Analysis, 22, 649–656.
[19] Ruggeri, S., Vahteristo L. T., Aguzzi, A., Finglas P., Carnovale E. (1999). Determination
of folate vitamers in food and in Italian reference diet by high-performance liquid
chromatography. Journal of Chromatography A, 855, 237–245.
[21] Ndaw S., Bergaentzlé, M., Aoudé-werner, D., Lahély, S., Hasselmann, C. (2001).
Determination of folates in foods by high-performance liquid chromatography with
fluorescence detection after precolumn conversion to 5-methyltetrahydrofolates. Journal of
Chromatography A, 928, 77–90.

112
[22] Hefni, W., Vohrvik, V., Tabekha, M., Witthoft, C. (2010) Folate content in foods
commonly consumed in Egypt. Food Chemistry, 121, 540–545.
[23] Melse-boonstra, A., Verhoef, P., Konings, E.J.M., Dusseldorp, M.V., Matser, A.,
Hollman, P.C.H., Meyboom, S., Kok, F.J., West, C.E. (2002). Influence of Processing on
Total, Monoglutamate and Polyglutamate Folate Contents of Leeks, Cauliflower, and Green
Beans. Journal Agricultural and Food Chemistry, 50, 3473-3478.
[24] Johansson, M., Furuhagen, C., Frolich, W., Jagerstad, M. (2008). Folate content in frozen
vegetarian ready meals and folate retention after different reheating methods. LWT- Food
science and Technology, 41, 3, 528-536.
[25] Konings, E.J.M. (1999). A validate liquid chromatographic method for determining
folates in vegetables, milk powder, liver and flour. Journal of AOAC International, 82, 1,
119- 127.
[26] Ginting, E., Arcot, J. (2004). High-Performance Liquid Chromatographic Determination
of Naturally Occurring Folates during Tempe Preparation. Journal Agricultural Food
Chemistry, 52, 26, 7752–7758.
[27] Patring, J.D.M., Jastrebova, J.A., Hjortmo, S.B., Andlid, T.A., Jagerstad, I.M. M.
(2005b). Development of a Simplified Method for the Determination of Folates in Baker’s
Yeast by HPLC with Ultraviolet and Fluorescence Detection Journal Agricultural and Food
Chemistry, 53, 2406-2411.
[28] Doherty, R.F., Beecher, G.R. (2003). A Method for the Analysis of Natural and Synthetic
Folate in Foods. Journal Agricutural and Food Chemistry, 51, 354-361.
[29] Finglas, P. M., Wigertz, K., Vahteristo, L., Witthoft, C., Southon, S., Froidmont-Gortz, I.
(1999). Standardization of HPLC techniques for the determination of naturally-occurring
folates in food. Food Chemistry, 64, 245-255.

113
[30] Dang, J., Arcot, J., Shrestha, A. (2008). Folate retention in selected processed legumes.
Food chemistry, 68, 295-298.
[31] Ferreira, S.L.C., Bruns, R.E., Ferreira, H.S., Matos, G.D., David, J.M., Brandão, G.C.,
Silva, E.G.P., Portugal, L.A., Reis, P.S., Souza, A.S., Santos, W.N.L. (2007). Box-Behnken
design: An alternative for the optimization of analytical methods. Analytica Chemical Acta,
597, 179–186.
[32] Hatambeygi, N., Abedi,G., Talebi, M. (2011). Method development and validation for
optimised separation of salicylic, acetyl salicylic and ascorbic acid in pharmaceutical
formulations by hydrophilic interaction chromatography and response surface methodology.
Journal of Chromatography A, 1218, 5995– 6003.
[33] Wang, Y., Harrison, M., Clark, B.J. (2006). Optimising reversed-phase liquid
chromatographic separation of an acidic mixture on a monolithic stationary phase with the aid
of response surface methodology and experimental design. Journal of Chromatography A,
1105, 199–207.
[34] Gonzalez, A., Foster, K.L., Hanrahan, G. (2007). Method development and validation for
optimized separation of benzo[α]pyrene–quinone isomers using liquid chromatography–mass
spectrometry and chemometric response surface methodology. Journal of Chromatography A,
1167, 135–142.
[35] TACO (2006). Tabela Brasileira de Composição de Alimentos, Ver II, (2sd.ed) (pp.113).
Campinas, SP, NEPA-UNICAMP.
[36] Gregory, J. F., Sartain, D. B., Day, B. P.F. (1984). Fluorometric determination of folacin
in biological materials using high performance liquid chromatography. Journal Nutrition,
114, 341-353.
[37] Pfeiffer, C. M., Rogers, L. M., Gregory III, J. F. (1997). Determination of Folate in
Cereal-Grain Food Products Using Trienzyme Extraction and Combined Affinity and
Reversed-Phase Liquid Chromatography. Journal Agricultural Food Chemistry, 45, 407-413.

114
[38] Catharino, R. R., Godoy, H. T., Lima-pallone, J. A. (2006). Metodologia analítica para
determinação de folatos e ácido fólico em alimentos. Química Nova: 29, 5, 972-976.
[39] Snyder, L.R., Kirkland, J.J., Glajch, J. L. (1997). Pratical HPLC method development. In
John Wiley & Sons, (2nd ed) (pp.700). New York, NY.
[40] ICH (1994) Validation of analytical procedures: text and methodology Q2 (R1). 4ver., 1-
13.
[41] Patring, J. D. M., Johansson, M. S., Yazynina, E., Jastrebova, J. A. (2005a). Evaluation
of impact of different antioxidants on stability of dietary folates during food sample
preparation and storage of extracts prior to analysis. Analytica Chimica Acta, 553, 36–42.
[42] Tamura, T. (1998). Determination of food folate. Nutritional Biochemistry, 9, 285-293.
[43] IUPAC-IUB (1987). Nomeclature and symbols for folic and related compounds. 59,6,
833-836.

115
Critical step study
Figure 01. Flowchart of the stages of extraction carried out during pilot study. Text boxes in dashed indicate that the stage was accepted to the pre-validated method.
400g spinach mashed
1 ml Liquor 1g Fiber 2x
Water bath 40 ° C 10 minutes
20 ml AcNH4 50 mmol.L-1
Vacuum filtration (only fiber)
Tricloracetic acid 2%; 5% 8%
Control
Antioxidant
Folate conjugase
Protease
Dienzyme
Centrifugation 5,000 rpm 4°C
15min
Vacuum filtration supernatant (cellulose
acetate 0,45 µm)
HPLC
Enzyme or
Tricloracetic acid

116
Figure 02. Chromatogram of spinach in liquor fraction; Extraction performed with ammonium acetate 50 mmol.L-1 at 40ºC. Figure A. black line
extraction performed with 8% TCA and dash dot line 2% TCA and figure B. Protease. 1- THF, 2- 5-MTHF, 3- 10-FTHF, 4- 5-FTHF,5- Folic
acid and 6- Pteroic acid. Isocratic elution performed in 85% of potassium phosphate buffer pH 2,0, 100 mmol.L-1 and 15% of MeOH. C18 100 x
2,0, 5 µm column, flow 0,5 ml/min.
A B

117
Figure 03. Chromatogram of spinach in liquor fraction; Extraction performed with ammonium acetate 50 mmol.L-1 at 40ºC. Figure A. control
and figure B. antioxidant. 1-THF (rt 1.78), 2- 5-MTHF (rt 2.67), 3- 10-FTHF (rt. 3.41), 4- 5-FTHF (rt, 4.87), 5-Folic acid (rt. 8.78) and 6- Pteroic
acid (Rt. 12.54). Isocratic elution performed in 85% of potassium phosphate buffer pH 2,0 100 mmol.L-1 and 15% of MeOH. C18 100 x 2,0, 5
µm column, flow 0,5 ml/mim. rt. retention time.
A B

118
Figure 04. Chromatogram of spinach in liquor fraction; Extraction performed with ammonium acetate 50 mmol.L-1 at 40ºC. Figure A. folate
conjugase and figure B. dienzyme. 1-THF (rt.1.81), 2- 5-MTHF (rt. 2.66), 3- 10-FTHF (rt. 3.38), 4- 5-FTHF (rt. 4.83), 5-Folic acid (rt. 8.81) and
6- Pteroic acid (rt. 12.49). Isocratic elution in 85% of potassium phosphate buffer pH 2,0 100 mmol.L-1 and 15% of MeOH. C18 100 x 2,0, 5 µm
column, flow 0,5 ml/mim. rt. retention time.
A B

119
Figure 05. Folate content of spinach in liquor fraction, A. liquor fraction, B. fiber fraction; Extraction performed with ammonium acetate 50
mmol.L-1 at 40ºC. The assays were performed in duplicate and presented in mean and standard deviation.
A B

120
Table 01. Independent variable coded for the study of factorial designer of extraction condition.
Factor Code Leve(-) Level(0) Level(+)
Ratio amount sample and solution x1 1:5 1:12.5 1:20
Extraction temperature (°C) x2 35 70 105
Molar concentration (mmol.L-1) x3 30 90 150
Time (min) x4 10 50 90
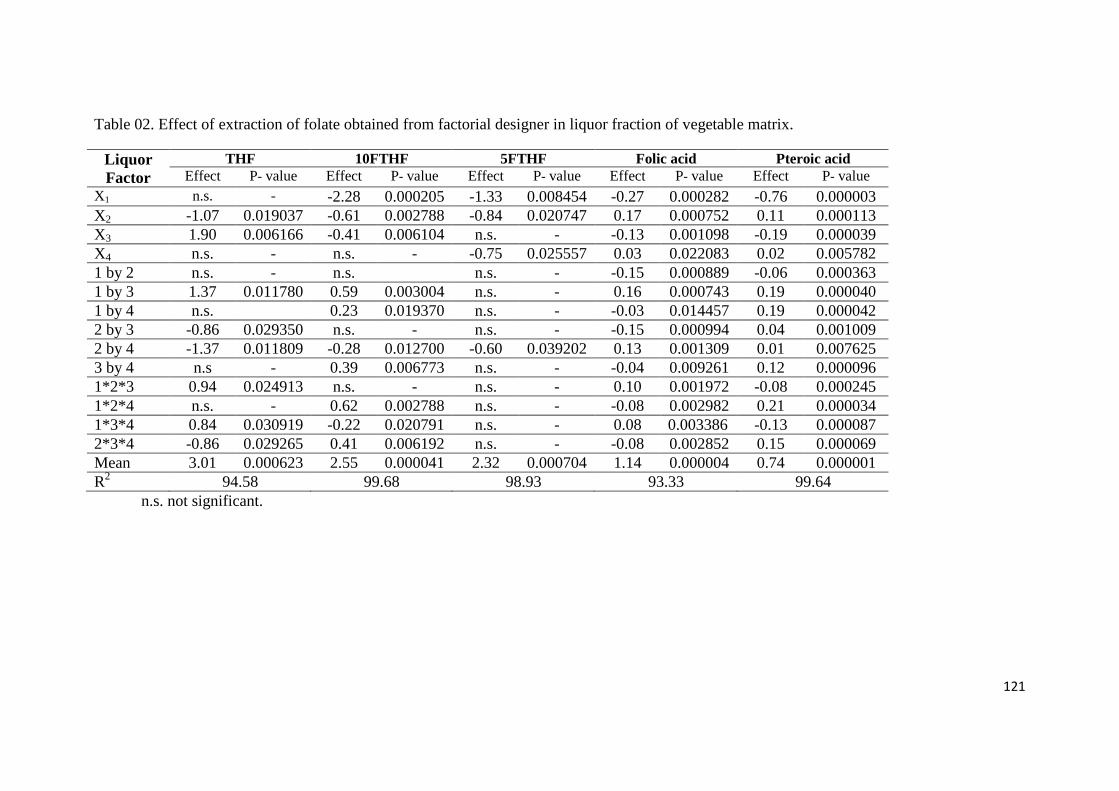
121
Table 02. Effect of extraction of folate obtained from factorial designer in liquor fraction of vegetable matrix.
Liquor Factor
THF 10FTHF 5FTHF Folic acid Pteroic acid Effect P- value Effect P- value Effect P- value Effect P- value Effect P- value
X1 n.s. - -2.28 0.000205 -1.33 0.008454 -0.27 0.000282 -0.76 0.000003 X2 -1.07 0.019037 -0.61 0.002788 -0.84 0.020747 0.17 0.000752 0.11 0.000113 X3 1.90 0.006166 -0.41 0.006104 n.s. - -0.13 0.001098 -0.19 0.000039 X4 n.s. - n.s. - -0.75 0.025557 0.03 0.022083 0.02 0.005782 1 by 2 n.s. - n.s. n.s. - -0.15 0.000889 -0.06 0.000363 1 by 3 1.37 0.011780 0.59 0.003004 n.s. - 0.16 0.000743 0.19 0.000040 1 by 4 n.s. 0.23 0.019370 n.s. - -0.03 0.014457 0.19 0.000042 2 by 3 -0.86 0.029350 n.s. - n.s. - -0.15 0.000994 0.04 0.001009 2 by 4 -1.37 0.011809 -0.28 0.012700 -0.60 0.039202 0.13 0.001309 0.01 0.007625 3 by 4 n.s - 0.39 0.006773 n.s. - -0.04 0.009261 0.12 0.000096 1*2*3 0.94 0.024913 n.s. - n.s. - 0.10 0.001972 -0.08 0.000245 1*2*4 n.s. - 0.62 0.002788 n.s. - -0.08 0.002982 0.21 0.000034 1*3*4 0.84 0.030919 -0.22 0.020791 n.s. - 0.08 0.003386 -0.13 0.000087 2*3*4 -0.86 0.029265 0.41 0.006192 n.s. - -0.08 0.002852 0.15 0.000069 Mean 3.01 0.000623 2.55 0.000041 2.32 0.000704 1.14 0.000004 0.74 0.000001 R2 94.58 99.68 98.93 93.33 99.64
n.s. not significant.
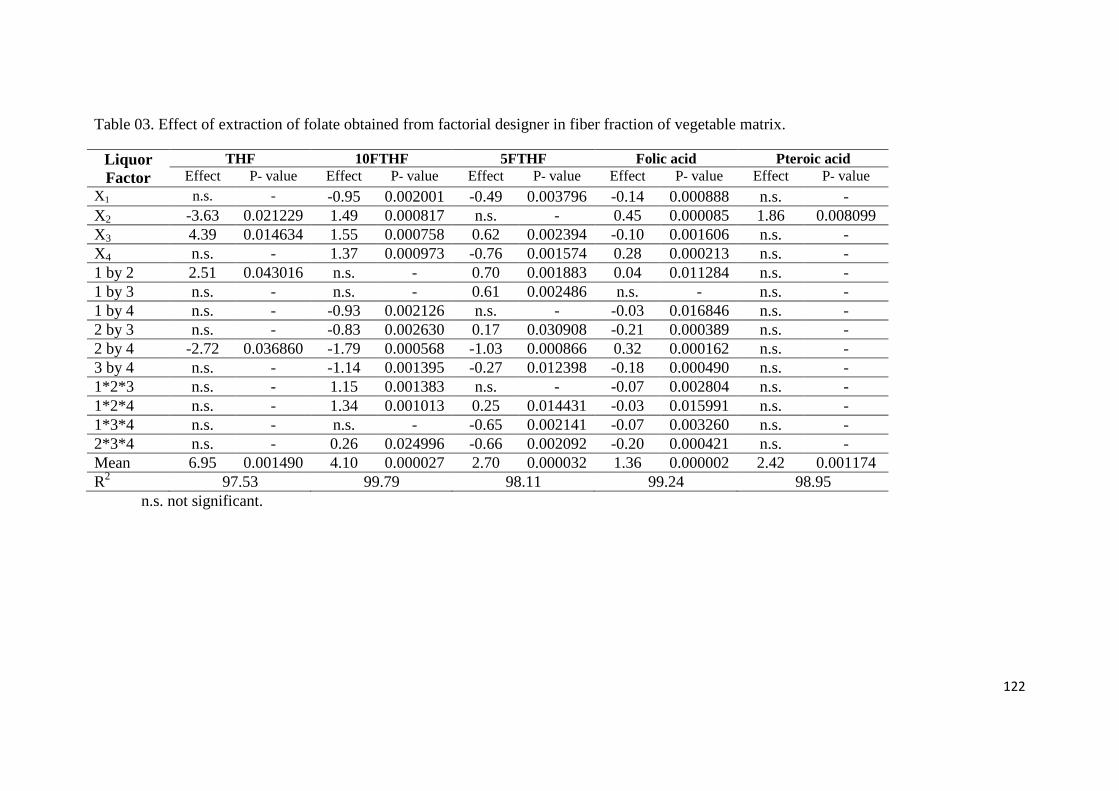
122
Table 03. Effect of extraction of folate obtained from factorial designer in fiber fraction of vegetable matrix.
Liquor Factor
THF 10FTHF 5FTHF Folic acid Pteroic acid Effect P- value Effect P- value Effect P- value Effect P- value Effect P- value
X1 n.s. - -0.95 0.002001 -0.49 0.003796 -0.14 0.000888 n.s. - X2 -3.63 0.021229 1.49 0.000817 n.s. - 0.45 0.000085 1.86 0.008099 X3 4.39 0.014634 1.55 0.000758 0.62 0.002394 -0.10 0.001606 n.s. - X4 n.s. - 1.37 0.000973 -0.76 0.001574 0.28 0.000213 n.s. - 1 by 2 2.51 0.043016 n.s. - 0.70 0.001883 0.04 0.011284 n.s. - 1 by 3 n.s. - n.s. - 0.61 0.002486 n.s. - n.s. - 1 by 4 n.s. - -0.93 0.002126 n.s. - -0.03 0.016846 n.s. - 2 by 3 n.s. - -0.83 0.002630 0.17 0.030908 -0.21 0.000389 n.s. - 2 by 4 -2.72 0.036860 -1.79 0.000568 -1.03 0.000866 0.32 0.000162 n.s. - 3 by 4 n.s. - -1.14 0.001395 -0.27 0.012398 -0.18 0.000490 n.s. - 1*2*3 n.s. - 1.15 0.001383 n.s. - -0.07 0.002804 n.s. - 1*2*4 n.s. - 1.34 0.001013 0.25 0.014431 -0.03 0.015991 n.s. - 1*3*4 n.s. - n.s. - -0.65 0.002141 -0.07 0.003260 n.s. - 2*3*4 n.s. - 0.26 0.024996 -0.66 0.002092 -0.20 0.000421 n.s. - Mean 6.95 0.001490 4.10 0.000027 2.70 0.000032 1.36 0.000002 2.42 0.001174 R2 97.53 99.79 98.11 99.24 98.95
n.s. not significant.

123
Table 04. Decoded independent variables and response for the factorial designer study in extraction condition.
Assay Condition Response Liquor (L) and Fiber (F) (µg.ml-1 of extract)
x1 x2 x3 x4 THF
L F 5-MTHF
L F 10-FTHF L F
5-FTHF
L F Folic acid
L F Pteroic acid
L F 1 1:5 35 30 10 2.14 8.31 2.84 0 4.26 1.32 3.84 3.73 1.26 1.25 1.31 2.86 2 1:20 35 30 10 1.75 4.14 0 0 1.66 1.07 1.78 1.29 0.98 0.98 0.29 0.71 3 1:5 105 30 10 2.94 2.78 3.62 0.37 4.98 5.61 3.75 3.32 1.40 1.30 1.78 3.78 4 1:20 105 30 10 1.53 2.98 0 0 0.93 2.91 1.54 2.21 1.04 1.19 0.25 2.19 5 1:5 35 150 10 2.93 7.26 0 0 3.04 3.67 3.17 2.31 1.11 1.25 0.75 2.08 6 1:20 35 150 10 3.63 9.65 0 0 1.91 3.66 2.47 2.83 1.07 1.16 0.43 2.01 7 1:5 105 150 10 3.75 10.34 0.91 0 2.95 5.76 3.43 3.98 1.19 1.31 1.04 2.79 8 1:20 105 150 10 3.41 9.62 0 0 0.69 5.96 1.58 4.98 0.95 1.34 0.12 4.03 9 1:5 35 30 90 2.63 9.51 0 0 4.88 5.71 3.21 2.89 1.03 1.18 1.25 1.34 10 1:20 35 30 90 2.15 5.73 0 0 1.65 3.19 1.70 1.87 0.94 0.93 0.34 0.99 11 1:5 105 30 90 3.33 0 0 0 2.66 5.48 1.44 1.82 2.03 2.22 0.91 3.68 12 1:20 105 30 90 0 4.60 0 0 1.06 3.95 0.95 1.97 0.99 2.26 0.56 3.32 13 1:5 35 150 90 6.49 12.59 0 0 3.76 7.51 3.57 4.15 1.06 1.23 0.80 1.46 14 1:20 35 150 90 6.69 12.96 0 0 1.73 3.34 2.17 2.31 0.99 1.13 0.28 0.74 15 1:5 105 150 90 0 0 0 0 3.00 4.21 1.46 1.36 1.13 1.73 1.10 3.65 16 1:20 105 150 90 4.85 10.79 0 0 1.68 4.91 1.02 2.14 1.06 1.36 0.61 3.57 17 1:12.5 70 90 50 5.10 10.76 0 0 1.24 3.77 1.47 2.26 1.05 1.23 0.35 2.08 18 1:12.5 70 90 50 5.45 12.90 0 0 1.35 3.71 1.76 2.30 1.04 1.22 0.35 1.72 19 1:12.5 70 90 50 5.69 11.61 0 0 1.35 3.61 1.96 2.18 1.05 1.21 0.34 1.41

124
Table 05. Precision inter-day and identification parameters for six chemical folate forms in liquor fraction of vegetable matrix.
Similarity and purity in %, mean and standard deviation (n=4).
Folate λMax. nm
Day1 ( September 2011) Day2 ( January 2012) rt simil. purity k R s Tf rt simil. purity k R s Tf
THF Mean
Sd. CV
294
1.790 0.008 0.49
94.05 2.38 2.53
98
0.004 0.44
1.05 0.01 1.21
-
1.11 0.033 2.97
1.690 0.002 0.12
80.47 0.033 0.04
99 0 0
0.94 0.003 0.30
-
1.40 0.011 0.70
5-MTHF Mean
Sd. CV
290
2.66 0.010 0.39
76.85 8.26 10.74
99
0.005 0.50
2.05 0.013 0.63
1.97 0.13 6.65
1.39 0.006 0.46
2.42 0.003 0.12
82.55 0.614 0.13
31
0.026 13.26
1.78 0.003 0.23
2.27 0.02 0.98
1.39 0.01 0.79
10-FTHF Mean
Sd. CV
261
3.39 0.012 0.37
60.20 39.46 65.55
95
0.093 9.83
2.89 0.015 0.52
1.18 0.13 11.61
1.29 0.008 0.67
2.97 0.003 0.11
82.86 1.28 1.54
25
0.02 8.26
2.42 0.004 0.16
1.45 0.26 1.79
2.29 0.01 0.52
5-FTHF Mean
Sd. CV
288
4.83 0.03 0.58
76.12 1.88 2.47
99
0.005 0.50
4.55 0.032 0.71
2.21 0.17 7.73
1.27 0.02 1.95
4.95 0.004 0.08
83.99 0.362 0.43
99 0 0
4.69 0.004 0.11
4.27 0.04 0.08
1.60 0.03 1.97
Folic acid Mean
Sd. CV
286
8.75 0.03 0.34
86.65 1.55 1.79
99 0 0
9.051 0.036 0.39
2.80 0.30 10.77
1.44 0.06 5.02
7.49 0.33 4.43
88.67 0.29 0.33
99 0 0
7.42 0.445 5.99
2.98 0.26 8.93
1.25 0.051 4.11
Pteroic acid Mean
Sd. CV
299
12.43 0.062 0.50
86.75 0.661 0.76
99 0 0
13.29 0.07 0.53
4.26 0.05 1.11
1.06 0.03 2.90
10.82 0.024 0.22
88.19 0.310 0.35
99 0 0
11.44 0.024 0.21
3.29 0.19 5.97
1.04 0.019 1.84

125
Table 06. Validation parameters method for determination of folates in vegetables.
THF 5-MTHF 10-FTHF 5-FTHF Folic acid Pteroic acid
LD (µg.mL-1) 0.06 0.17 0.12 0.12 0.03 1.81
LQ (µg.mL-1) 0.2 0.53 0.38 0.35 0.11 5.49
Range (µg.mL-1) 0.06-100 0.1-100 0.1-100 0.1-100 0.03-100 1.81-100
Parameters of calibration lines
Intercept -38220.36 82256.93 29791.94 1947.61 -85517.79 54598.02
Slope 30644.41 25896.97 22535.63 104190.87 99364.37 118176.88
Correln. coeff. R2 0.9966 0.9856 0.9904 0.9999 0.9996 0.9890
It was not evaluated the range above of 100 µg due concentration in the samples were in maximum of 10-15 µg. LD limit of detection, LQ limit of quantification;

126
Table 07. Folate composition in liquor fraction vegetables
n.q. not quantificated; mean of triplicates, variation lower than 10% (n=4)
Food Sample
Folate content (µg/ml) of extract mean ± sd
THF 5-MTHF 10-FTHF 5-FTHF Folic acid Pteroic acid
Sum
Spinach Tetragonia expansa
3.08± 0.05 2.07±0.005 2.44± 0.22 0.38± 0.02 0.96±0.01 0.22±0.004 9.15
Broccoli Brassica oleracea var. itálica
3.86±0.08 n.q. 13.11±0.04 0.25±0.009 1.32±0.004 n.q. 18.54
Cabbage Brassica oleracea var. capitata
n.q. n.q. 4.86±0.12 0.61±0.003 1.21±0.003 nq. 6.68
Sauce Petroselinum hortense
n.q. n.q. 2.19±0.15 n.q. 3.75±0.26 nq. 5.94
Green beans Phaseolus vulgaris
n.q. n.q. 3.57±0.04 n.q. n.q. n.q. 3.57
Beet Beta vulgaris L.
3.88±0.05 n.q. n.q. n.q. 1.00±0.006 n.q. 4.88

127
Table 08. Folate composition in fiber fraction vegetables.
n.q. not quantificated; mean of triplicates, variation lower than 10% (n=4)
Food Sample
Folate content (µg/g) of extract mean ± sd
THF 10-FTHF 5-FTHF Folic acid Pteroic acid Sum Spinach
Tetragonia expansa 4.58±0.05 3.37±0.12 0.27±0.01 1.01±0.01 0.31±0.07 9.54
Broccoli Brassica oleracea var. itálica
5.15±0.33 20.44±1.29 0.76±0.17 1.26±0.04 nq. 27.61
Cabbage Brassica oleracea var. capitata
n.q. 2.51±0.06 0.34±0.04 1.04±0.01 nq. 3.89
Sauce Petroselinum hortense
n.q. 4.39±0.13 nq. 4.96±0.09 nq. 9.35
Green beans Phaseolus vulgaris
n.q. 3.57±0.04 n.q. n.q. n.q. 3.57
Beet Beta vulgaris L.
5.61±0.26 n.q. n.q. 1.03±0.04 n.q. 6.64

128
6. Conclusões
• A teoria ácido-base de Lewis mostrou ser adequada para explicar o
comportamento de separação das seis formas de folatos, uma vez que em meio
ácido, os grupamentos amina e amida (nas formas que contém glutamatos)
presentes comportam-se como base de Lewis e são protonadas pelos íons H+ livres
na fase móvel;
• A melhor condição de solubilização dos folatos foi alcançada em 1 mL de NaOH
0.1 mol.L-1 e acetato de amônio 8 mmol.L-1, estabilizando as seis formas sem o
uso de antioxidantes;
• A separação das seis formas de folatos foi otimizada e os parâmetros
cromatográficos (tr, k, α and Rs) usados como ferramenta de monitoramento da
resposta. Um sistema binário composto por tampão fosfato de potássio pH 2,0 100
mmol.L-1 e metanol na proporção 85:15 no modo isocrático foi utilizado para
separação de cindo as seis formas de folatos estudadas;
• O estudo das colunas C18 com diferentes dimensões resultou na separação das seis
formas de folatos em 15 minutos com a coluna 100 x 2.0, 5 µm;
• O conjunto de informações obtidas permitiu caracterizar este sistema de separação
como fase reversa iônica. Este teve ajustada seletividade para determinação de
vegetais, sendo adequado para seis formas de folatos monitoradas por parâmetros
cromatográficos, similaridade e pureza, obtendo condições metodológicas visando
aplicação em outras matrizes alimentícias;
• Acetato de amônio com ou sem o uso de antioxidantes foi selecionado como
solução extratora, apresentando significantes avanços comparados a outros estudos
para as seis formas químicas de folatos. Em adição, o fracionamento da matriz em
líquor e fibra ofereceu uma adequada condição de extração forma 5-MTHF na
fração liquor;
• O uso de protease, folato conjugase ou ambas resultou em diferenças na extração
quando comparado aos tratamentos controle para THF, 5-MTHF, 10-FTHF na

129
fração liquor e 10-FTHF na fração fibra, corroborando com outros estudos que
demonstram a contribuição das enzimas para o aumento da extração de folatos;
• A labilidade dos folatos somado aos conflitos metodológicos direcionou a escolha
de uma metodologia que empregasse poucas etapas e baixa temperatura;
• O estudo fatorial permitiu avaliação das variáveis tempo e temperatura, e seu
impacto sobre as condições de extração, quando se utilizou temperaturas acima de
100°C por mais que 60 minutos. Assim recomenda-se o uso de temperaturas de
40°C por 10 minutos para matrizes vegetais;
• A metodologia desenvolvida apresentou adequabilidade em diferenciar as seis
formas químicas estudadas em vegetais usando os parâmetros cromatográficos de
separação de forma seletiva em associação aos estudos espectrais em λ max.

130
7. Perspectivas
Este estudo permitiu a abertura de uma nova linha de conhecimento no
campo da Nutrição na UFPE, uma vez que o desenvolvimento de metodologia
analítica para determinação de folatos em alimentos possibilitará a abertura de
ações multidisciplinar as áreas de Saúde Pública e Fisiologia da Nutrição,
estabelecendo novos elementos de discussão sobre decisões de fortificação,
enriquecimento e suplementação.
As informações obtidas com este estudo poderão ser adaptadas em outras
linhas de pesquisa e direcionadas a outras matrizes não somente para alimentos
como também para materiais biológicos como plasma, soro e sangue.
Em adição este projeto contribuiu na capacitação de estudantes de iniciação
científica, alcançando os objetivos almejados pela FACEPE na qualificação
profissional.

131
8. Referências
ARCOT, J.; SHRESTHA, A. Folate: methods of analysis. Trends in Food Science &
Technology 2005; 16: 253–266.
BALL, G.F.M. Vitamins in foods: analysis, bioavailability, and stability . 1°ed.
United States of America: Taylor & Francis Group; 2006. 814p.
CATHARINO, R. R., GODOY, H. T., LIMA-PALLONE, J. A. Metodologia analítica
para determinação de folatos e ácido fólico em alimentos. Química Nova 2006; 29, 5:
972-976.
CEUA FIOCRUZ/RJ, Manual de utilização de animais, 2008. Disponível em:
http://sistemas.cpqam.fiocruz.br/ceua/hiceuaw000.aspx.
EICHHOLZER, M.; ZIMMERMANN, O.T.R. Folic acid: a public-health challenge.
Lancet 2006; 367: 1352–61.
HEFNI, W., VOHRVIK, V., TABEKHA, M., WITTHOFT, C. Folate content in foods
commonly consumed in Egypt. Food Chemistry 2010; 121: 540–545.
ICH - INTERNATIONAL CONFERENCE ON HARMONISATION OF
TECHNICAL REQUIREMENTS FOR REGISTRATION OF
PHARMACEUTICALS FOR HUMAN USE - Validation of analytical procedures:
text and methodology Q2 (R1) 1994.
JASTREBOVA, J.; WITTHOFT, C.; GRAHN, A.; SVENSSON, U.; JAGERSTAD,
M. HPLC determination of folates in raw and processed beetroots. Food Chemistry
2003; 80: 579–588.
KONINGS, E.J.M. A validate liquid chromatographic method for determining folates
in vegetables, milk powder, liver and flour. Journal of AOAC International 1999.
82; 1: 119- 127.
NDAW S.; BERGAENTZLÉ, M.; AOUDÉ-WERNER, D.; LAHÉLY, S.;
HASSELMANN, C. Determination of folates in foods by high-performance liquid
chromatography with fluorescence detection after precolumn conversion to 5-
methyltetrahydrofolates. Journal of Chromatography A 2001; 928: 77–90.

132
OSSEYI, E. S.; WEHLING, R. L.;ALBRECHT, J. A. Liquid chromatographic method
for determining added folic acid in fortified cereal products. Journal of
Chromatography A 1998; 826: 235–240.
PAIXÃO, J. A.; STAMFORD, T. L. M. Vitaminas lipossolúveis em alimentos- Uma
abordagem analítica. Quimica Nova 2004; 27 (1): 96-105.
PAIXÃO, J.A. UV-Visible Detection Including Multiple Wavelengths. In
Encyclopedia of Chromatography 2010; 3° ed. : pp.2392-2405;
PATRING, J. D. M. & JASTREBOVA, J. A. Application of liquid chromatography –
electrospray ionisation mass spectrometry for determination of dietary folates: Effects
of buffer nature and mobile phase composition on sensitivity and selectivity. Journal
of Chromatography A 2007; 1143: 72–82.
PATRING, J.D.M., JASTREBOVA, J.A., HJORTMO, S.B., ANDLID, T.A.,
JAGERSTAD, I.M. M. Development of a Simplified Method for the Determination of
Folates in Baker’s Yeast by HPLC with Ultraviolet and Fluorescence Detection.
Journal Agricultural and Food Chemistry 2005, 53: 2406-2411.
PFEIFFER, C. M.; ROGERS, L. M.; GREGORY III, J. F. Determination of Folate in
Cereal-Grain Food Products Using Trienzyme Extraction and Combined Affinity and
Reversed-Phase Liquid Chromatography. J. Agric. Food Chem 1997; 45: 407-413.
PRIETO, S. P.;GRANDE, B. C.;FALCÓN, S. G.;GÁNDARA, J. S. Screening for
folic acid content in vitamin-fortified beverages. Food Control 2006; 17: 900–904.
QUIRÓS, A. R.B.; RON, C. C.; LÓPEZ-HERNÁNDEZ, J.; LAGE-YUSTY, M.A.;
Determination of folates in seaweeds by high-performance liquid chromatography.
Journal of Chromatography A 2004; 1032: 135–139.
SNYDER, L.R.; KIRKLAND, J.J.; GLAJCH, J. L. Pratical HPLC method
development; John Wiley & Sons, Inc.: 2nd Ed., New York. 1997, 700p.
SOONGSONGKIAT, M., PUWASTIEN, P., JITTINANDANA, S., DEE-UAM, A.,
SUNGPUAG, P. Testing of folate conjugase from chicken pancreas vs. commercial
enzyme and studying the effect of cooking on folate retention in Thai foods. Journal
of Food Composition and Analysis 2010; 23: 681–688.
STEA, T. H., JOHANSSON, M., JAGERSTAD, M., FRØLICH, W. (2006). Retention
of folates in cooked, stored and reheated peas, broccoli and potatoes for use in modern
large-scale service systems. Food Chemistry 2006, 101: 1095–110.

133
VAHTERISTO, L.T., OLLILAINEN, V., KOIVISTOINEN, P.E., VARO, P.
Improvements in the Analysis of Reduced Folate Monoglutamates and Folic Acid in
Food by High-Performance Liquid Chromatography. J. Agric. Food Chemistry 1996,
44: 477-482.
VISHNUMOHAN, S., ARCOT, J., PICKFORD, P. Naturally-occurring folates in
foods: Method development and analysis using liquid chromatography–tandem mass
spectrometry (LC–MS/MS). Food Chemistry 2011, 125: 736–742.

134
ANEXOS

Qual o motivo deste anúncio?Hospedagem Domínio Grátis - www.Hostnet.com.br - Imbatível número de Ferramentas 0800-8881177
Pesquisar pessoas...
Invisível
Você está invisível.Ficar visível
Chamar telefone
Gastronomia Segur
Alinne Araujo Deme
Entrada
Com estrela
Importante
Enviados
Rascunhos (73)
Círculos
Conselho GASTR…
Coordenação GAS…
COSIL
Bate-papo
Emmanuela Paiva
…
…
Journal of Food Composit
Mostrar detalhes
Submission Confirmation Doutorado x
Journal of Food Composition and Analysis [email protected] 11 fev
para mim
Esta mensagem pode não ter sido enviada por:
[email protected] Saiba mais Denunciar phishing
…
Anúncios – Qual o motivo destes anúncios?
Curso de Inglês OnlineFaça Já Um Curso Online de Inglês!Tenha Aulas C/ Professores Nativos.Englishtown.com/Curso_Online_Ingles
Curso de AcessibilidadeO melhor curso sobre acessibilidadeConheça e aplique a NBR 9050www.eduardoronchetti.com.br
Column Heaters and CoolerHPLC Temperature Controllersfor chromatography.www.analytical-sales.com
IDEIA:Mestrado-DoutoradoEduc-Saúde-Admin.-Direito-Agroneg-
Dear Mrs. Paiva,
Thank you for submitting your paper entitled "FOLATE Analytical properties, bioavailability andstability in foods" to the Journal of Food Composition and Analysis
The URL is http://ees.elsevier.com/jfca/. Your Username and Password is:
Your username is: ufrpepaiva
If you need to retrieve password details, please go to:http://ees.elsevier.com/JFCA/automail_query.asp
Your manuscript will be given a reference number once an Editor has been assigned. Allmanuscripts submitted to Journal of Food Composition and Analysis are evaluated before adecision is made concerning whether or not to send to peer review, based on technical criteriaand language.
7 de 10 Gmail
label:doutorado 0 Comp.
+Emmanuela Pesquisar Imagens Mapas Play NOVO YouTube Notícias Gmail Docs Agenda Mais
Gmail - Submission Confirmation - [email protected] https://mail.google.com/mail/?shva=1
1 de 1 3/4/2012 08:45

Qual o motivo deste anúncio?Hospedagem Ilimitada - www.Hostnet.com.br - Imbatível número de Ferramentas 0800-8881177
Pesquisar pessoas...
Invisível
Você está invisível.Ficar visível
Chamar telefone
Gastronomia Segur
Alinne Araujo Deme
Entrada
Com estrela
Importante
Enviados
Rascunhos (73)
Círculos
Conselho GASTR…
Coordenação GAS…
COSIL
Bate-papo
Emmanuela Paiva
…
…
Jan Kastelein
Mostrar detalhes
Journal of Chromatography A: Submission ConfirmationDoutorado x
Journal of Chromatography A [email protected] 21 fev
para mim
Anúncios – Qual o motivo destes anúncios?
Passagem p/ Recife: TAMAproveite e Reserve sua Passagem p/Recife com Agilidade e Segurança!www.TAM.com.br/Passagem-Recife
Formação em CoachingSeja um NeuroCoach com CertificaçãoInternacional. Saiba Mais:www.fellipelli.com.br/coach
Curso de Inglês OnlineCurso C/ Foco Nas SuasNecessidades Estude Quando Quiser- 24h Por Dia!www.Englishtown.com/Curso_Ingles
NanoInk Proteomic Assays
Title: A proposition for a mechanism of folate separation by Lewis acid-base theory: a newalternative for improving selectivity in vegetable foodsCorresponding Author: Mrs. Emmanuela Prado Paiva
Dear Mrs. Paiva,
This is to confirm that the above-mentioned manuscript has been received for consideration inJournal of Chromatography A.
You will be able to check on the progress of your manuscript by logging on to the ElsevierEditorial System for Journal of Chromatography A as an author:
http://ees.elsevier.com/chroma/
Your paper will be given a manuscript number shortly and you will soon receive an e-mail withthis number for your reference.
On behalf of the Editors, thank you for submitting your manuscript to Journal ofChromatography A. Should you have any questions, please feel free to contact our office.
6 de 10 Gmail
label:doutorado 0 Comp.
+Emmanuela Pesquisar Imagens Mapas Play NOVO YouTube Notícias Gmail Docs Agenda Mais
Gmail - Journal of Chromatography A: Submission Confirmation - [email protected] https://mail.google.com/mail/?shva=1
1 de 1 3/4/2012 08:45

Qual o motivo deste anúncio?Hospedagem Domínio Grátis - www.Hostnet.com.br - Imbatível número de Ferramentas 0800-8881177
Pesquisar pessoas...
Invisível
Você está invisível.Ficar visível
Chamar telefone
Gastronomia Segur
Segundo Período
Entrada
Com estrela
Importante
Enviados
Rascunhos (73)
Círculos
Conselho GASTR…
Coordenação GAS…
COSIL
Bate-papo
Emmanuela Paiva
…
Jan Kastelein
Mostrar detalhes
Journal of Chromatography A: Submission ConfirmationDoutorado x
Journal of Chromatography A [email protected] 21 fev
para mim
Anúncios – Qual o motivo destes anúncios?
Passagem p/ Recife: TAMAproveite e Reserve sua Passagem p/Recife com Agilidade e Segurança!www.TAM.com.br/Passagem-Recife
Curso de Inglês OnlineCurso C/ Foco Nas SuasNecessidades Estude Quando Quiser- 24h Por Dia!www.Englishtown.com/Curso_Ingles
Curso de AcessibilidadeO melhor curso sobre acessibilidadeConheça e aplique a NBR 9050www.eduardoronchetti.com.br
Column Heaters and Cooler
Title: Screening of protocols to exhaustive extraction and quantification of folates in liquor andfiber fraction of vegetable matrix using factorial designerCorresponding Author: Mrs. Emmanuela Prado Paiva
Dear Mrs. Paiva,
This is to confirm that the above-mentioned manuscript has been received for consideration inJournal of Chromatography A.
You will be able to check on the progress of your manuscript by logging on to the ElsevierEditorial System for Journal of Chromatography A as an author:
http://ees.elsevier.com/chroma/
Your paper will be given a manuscript number shortly and you will soon receive an e-mail withthis number for your reference.
On behalf of the Editors, thank you for submitting your manuscript to Journal ofChromatography A. Should you have any questions, please feel free to contact our office.
5 de 10 Gmail
label:doutorado 0 Comp.
+Emmanuela Pesquisar Imagens Mapas Play NOVO YouTube Notícias Gmail Docs Agenda Mais
Gmail - Journal of Chromatography A: Submission Confirmation - [email protected] https://mail.google.com/mail/?shva=1
1 de 1 3/4/2012 08:46