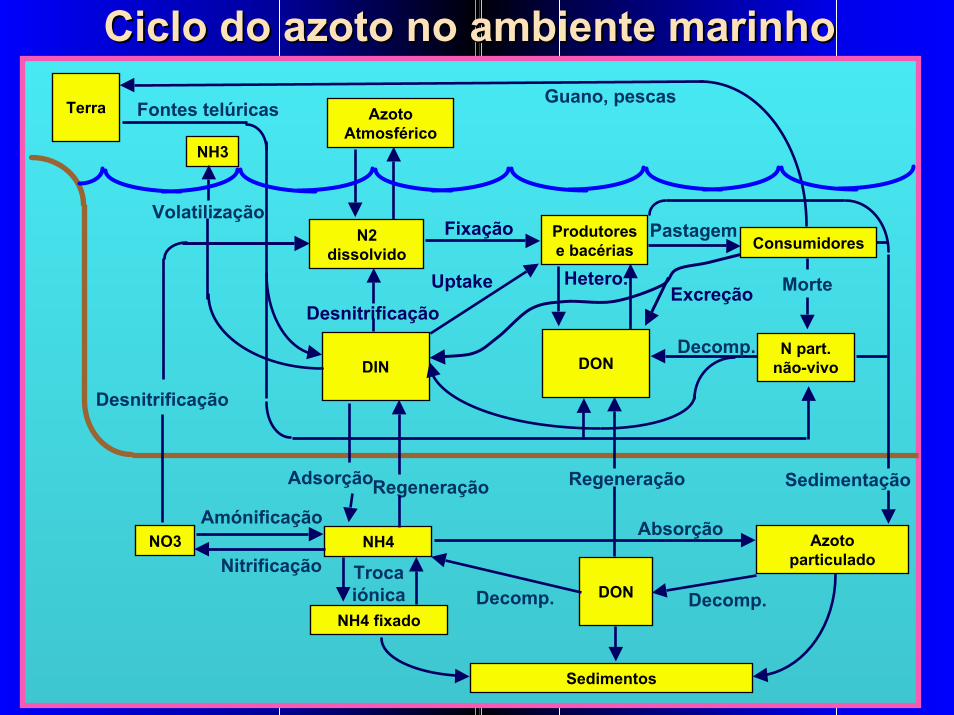
ciclo do azoto no ambiente marinho - ecowin.org · produtores e bacérias n2 dissolvido nh4 din...
TRANSCRIPT
Produtores e bacérias
N2 dissolvido
NH4
DIN
Terra
NH3
Azotoparticulado
Sedimentos
Guano, pescasAzoto
Atmosférico
DON
NO3
NH4 fixado
DON
N part.não-vivo
DesnitrificaçãoMorte
Regeneração
Decomp.
Excreção
RegeneraçãoAdsorção
Trocaiónica
Nitrificação
Amónificação
Desnitrificação
Decomp. Decomp.
Absorção
Uptake
Fixação Pastagem
Sedimentação
Fontes telúricas
Volatilização
Hetero.
Consumidores
Ciclo do azoto no ambiente marinhoCiclo do azoto no ambiente marinho
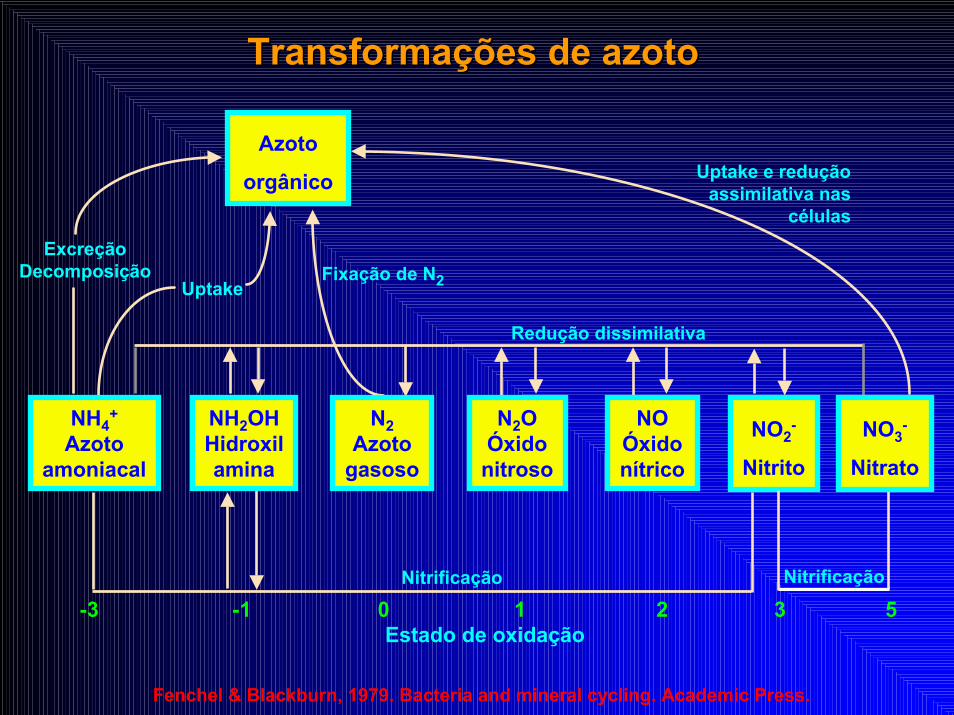
Transformações de azotoTransformações de azoto
Azoto
orgânico Uptake e redução assimilativa nas
células
Redução dissimilativa
Fixação de N2
ExcreçãoDecomposição
Uptake
NitrificaçãoNitrificação
NH4+
Azotoamoniacal
NH2OHHidroxilamina
N2Azoto
gasoso
N2OÓxidonitroso
NOÓxidonítrico
NO2-
Nitrito
NO3-
Nitrato
3 5Estado de oxidação
-3 -1 0 1 2
Fenchel & Blackburn, 1979. Bacteria and mineral cycling. Academic Press.
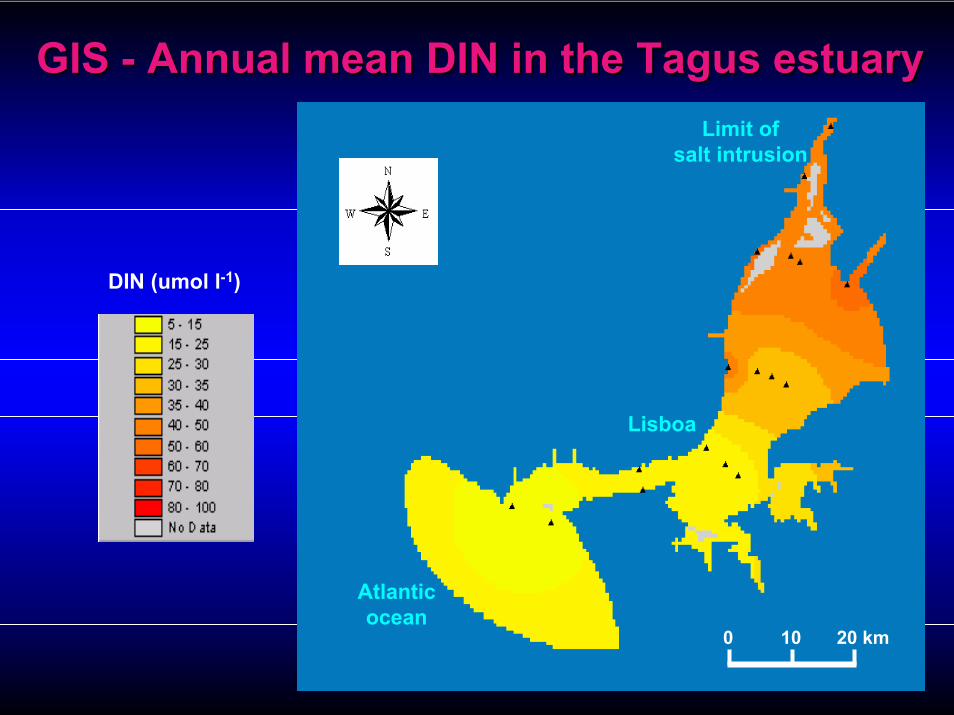
GIS GIS -- Annual mean DIN in the Tagus estuaryAnnual mean DIN in the Tagus estuaryLimit of
salt intrusion
Lisboa
Atlanticocean
0 10 20 km
DIN (umol l-1)
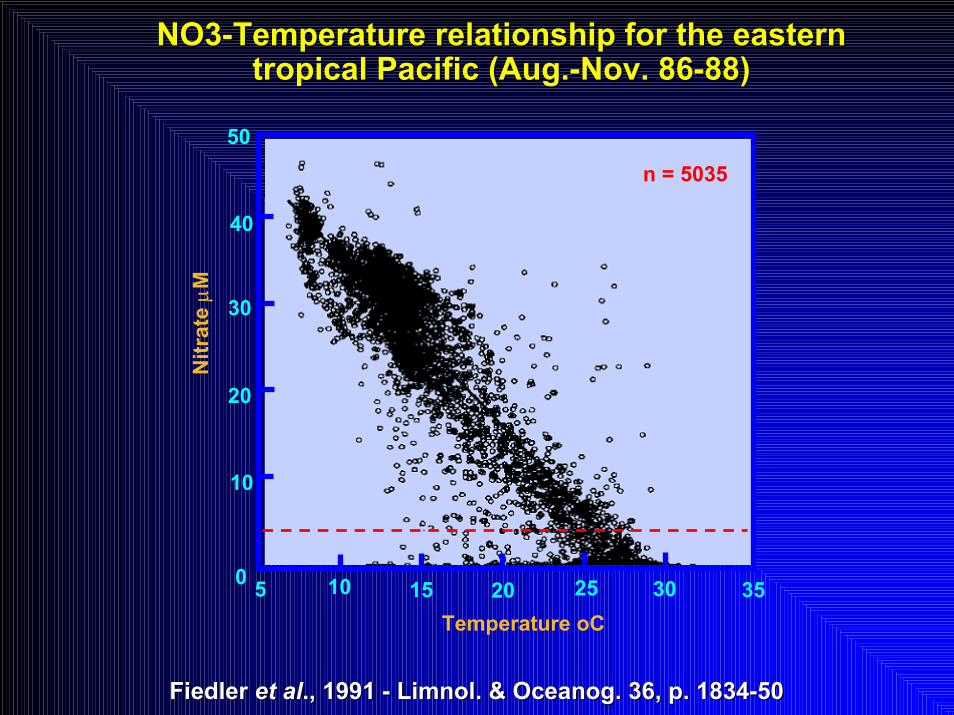
NO3NO3--Temperature relationship for the eastern Temperature relationship for the eastern tropical Pacific (Aug.tropical Pacific (Aug.--Nov. 86Nov. 86--88)88)
n = 503550
40N
itrat
e µ
20
30
M
10
0 10 25 305 15 3520Temperature oC
Fiedler Fiedler et alet al., 1991 ., 1991 -- Limnol. & Oceanog. 36, p. 1834Limnol. & Oceanog. 36, p. 1834--5050
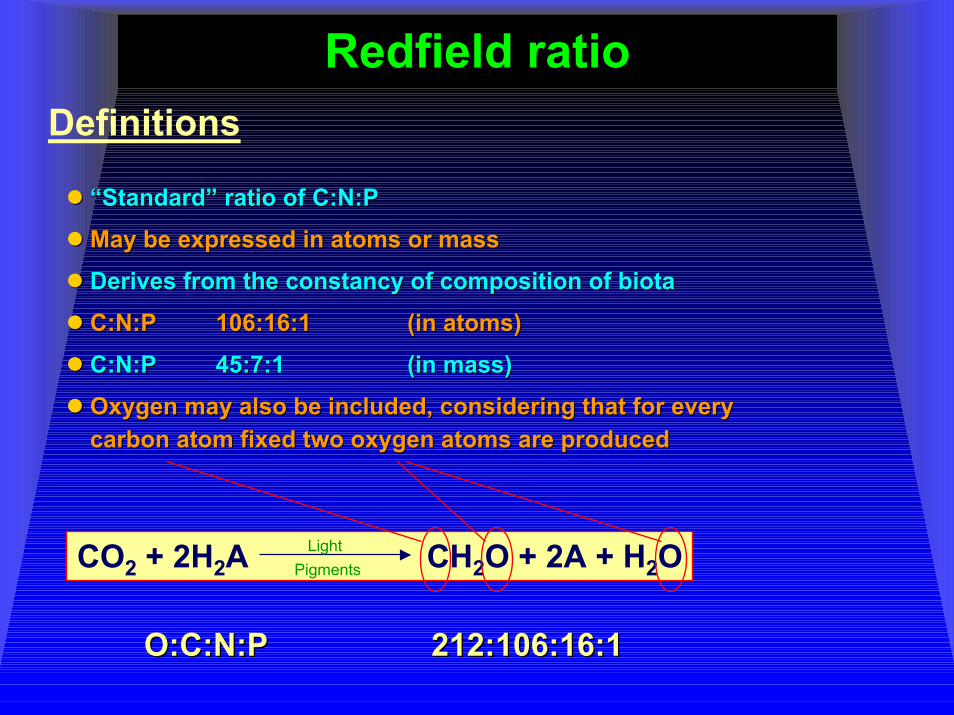
Redfield ratioRedfield ratioDefinitions
“Standard” ratio of C:N:P“Standard” ratio of C:N:P
May be expressed in atoms or massMay be expressed in atoms or mass
Derives from the constancy of composition of biotaDerives from the constancy of composition of biota
C:N:PC:N:P 106:16:1106:16:1 (in atoms)(in atoms)
C:N:PC:N:P 45:7:145:7:1 (in mass)(in mass)
Oxygen may also be included, considering that for every Oxygen may also be included, considering that for every carbon atom fixed two oxygen atoms are producedcarbon atom fixed two oxygen atoms are produced
CO2 + 2H2A CH2O + 2A + H2OLight
Pigments
O:C:N:PO:C:N:P 212:106:16:1212:106:16:1
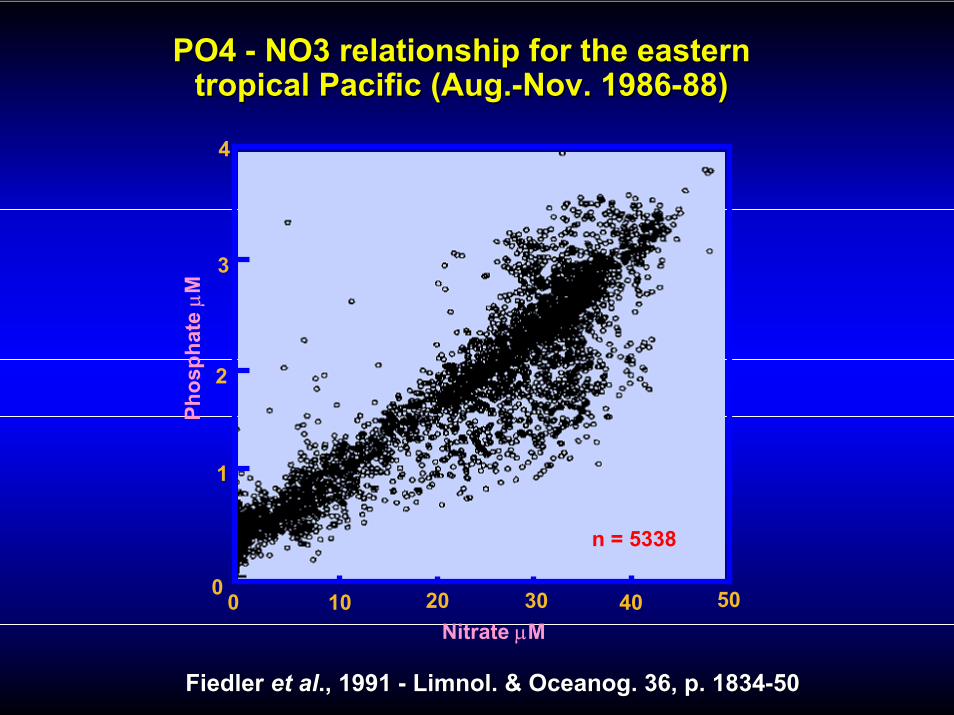
PO4 PO4 -- NO3 relationship for the easternNO3 relationship for the easterntropical Pacific (Aug.tropical Pacific (Aug.--Nov. 1986Nov. 1986--88)88)
Phos
phat
e µM
0
1
2
3
4
0 10 20 30 40Nitrate µM
50
n = 5338
Fiedler Fiedler et alet al., 1991 ., 1991 -- Limnol. & Oceanog. 36, p. 1834Limnol. & Oceanog. 36, p. 1834--5050
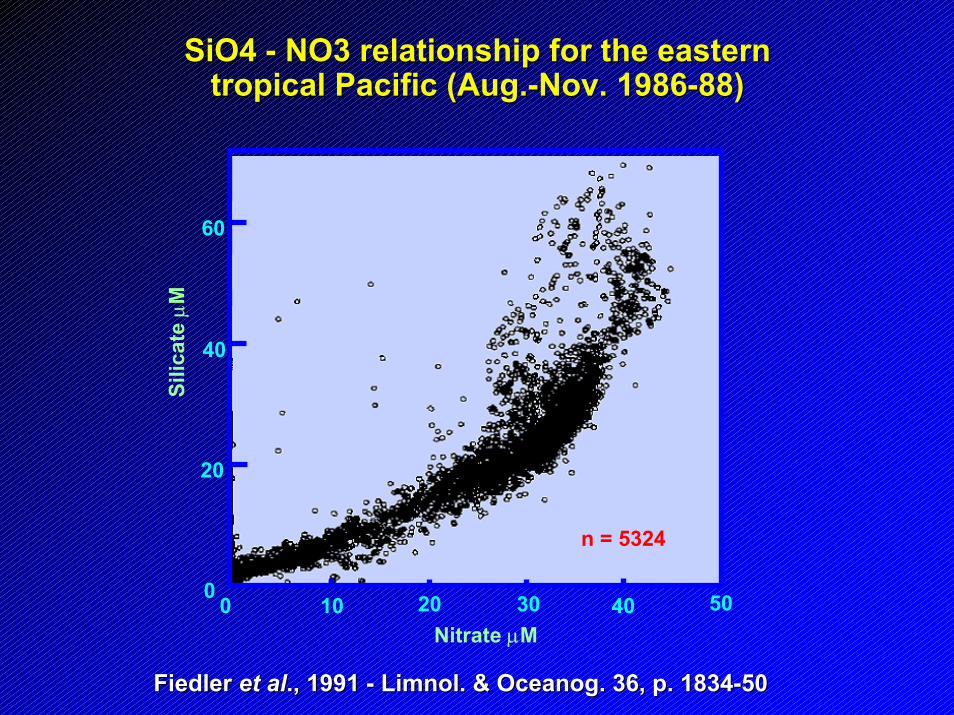
SiO4 SiO4 -- NO3 relationship for the easternNO3 relationship for the easterntropical Pacific (Aug.tropical Pacific (Aug.--Nov. 1986Nov. 1986--88)88)
0
20
40
60
0
Silic
ate µM
10 20 30 40Nitrate µM
50
n = 5324
Fiedler Fiedler et alet al., 1991 ., 1991 -- Limnol. & Oceanog. 36, p. 1834Limnol. & Oceanog. 36, p. 1834--5050
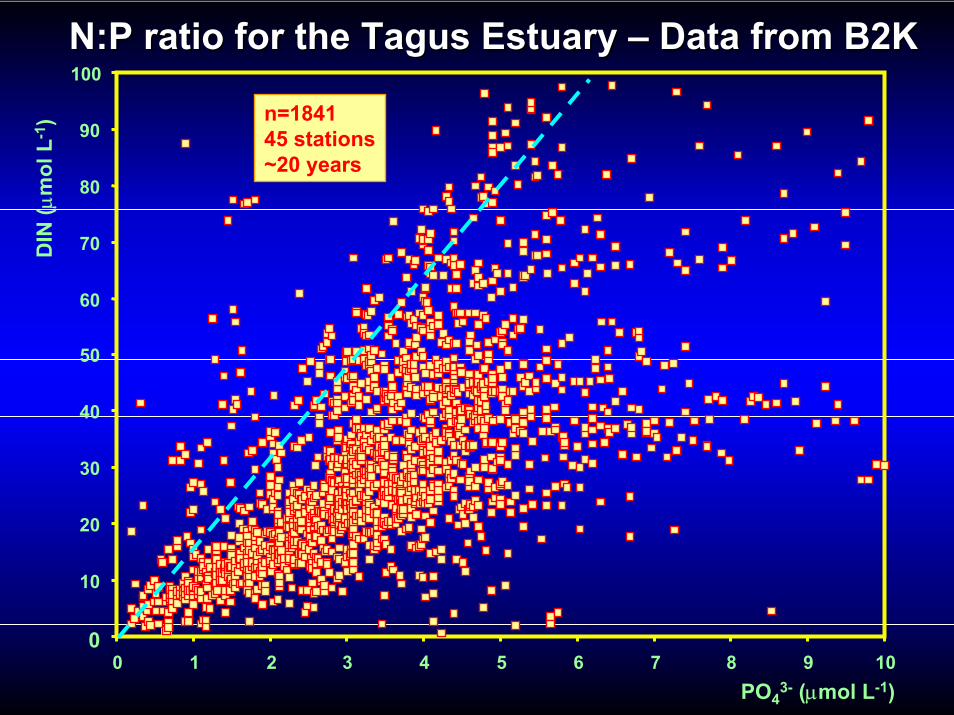
N:P ratio for the Tagus Estuary N:P ratio for the Tagus Estuary –– Data from B2KData from B2K
60
70
80
n=184145 stations~20 years
DIN
(µm
ol L
-1)
100
90
50
40
30
20
10
00 1 2 3 4 5 6 7 8 9 10
PO43- (µmol L-1)
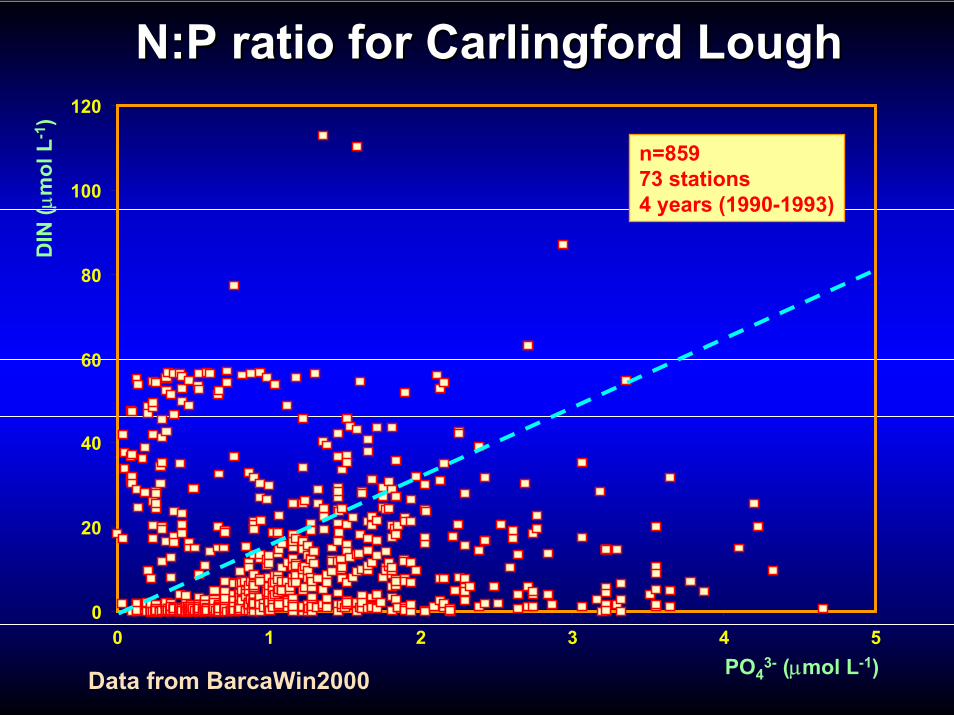
N:P ratio for Carlingford LoughN:P ratio for Carlingford Lough
80
100
n=85973 stations4 years (1990-1993)
DIN
(µm
ol L
-1) 120
60
40
20
00 1 2 3 4 5
PO43- (µmol L-1)Data from BarcaWin2000
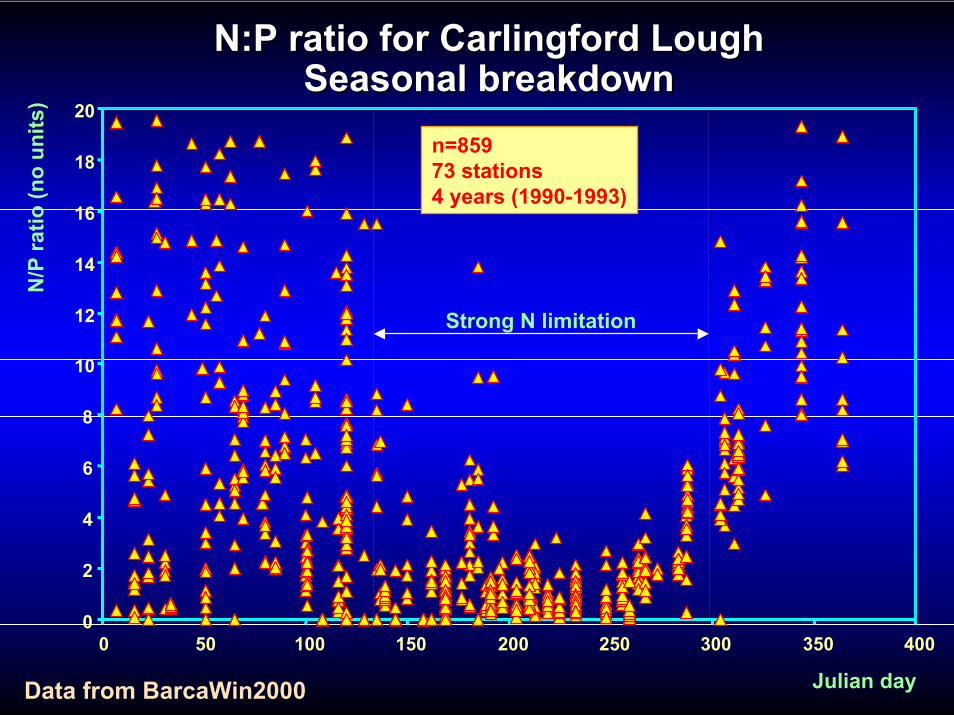
N:P ratio for Carlingford LoughN:P ratio for Carlingford LoughSeasonal breakdownSeasonal breakdown
n=85973 stations4 years (1990-1993)
N/P
ratio
(no
units
)
0
2
4
6
8
10
12
14
16
18
20
0 50 100 150 200 250 300 350 400
Strong N limitation
Julian dayData from BarcaWin2000
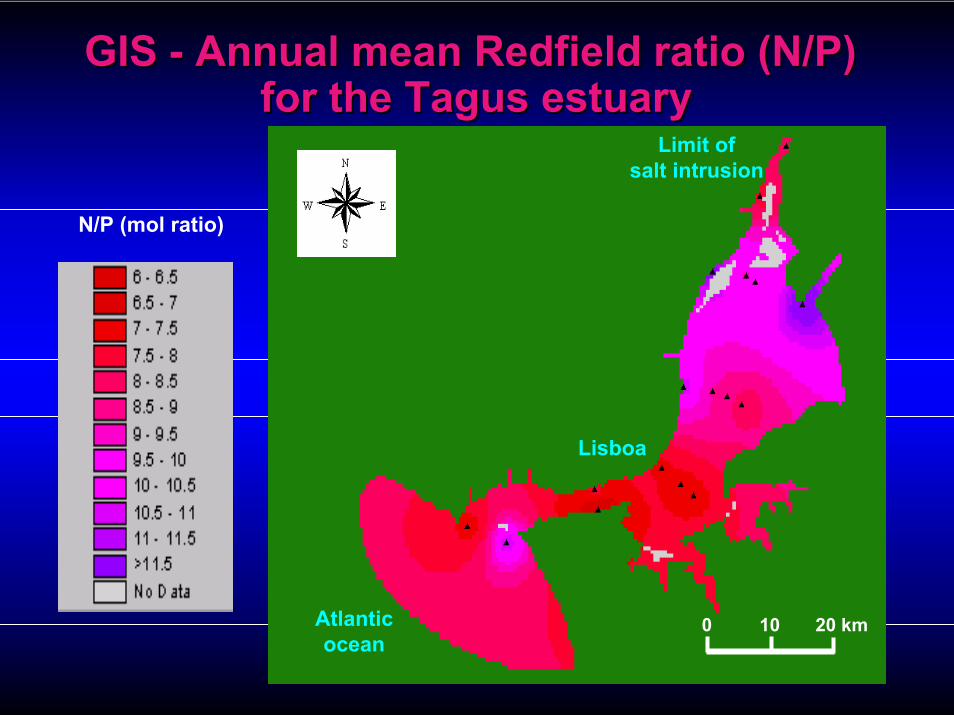
Limit ofsalt intrusion
Lisboa
Atlanticocean
0 10 20 km
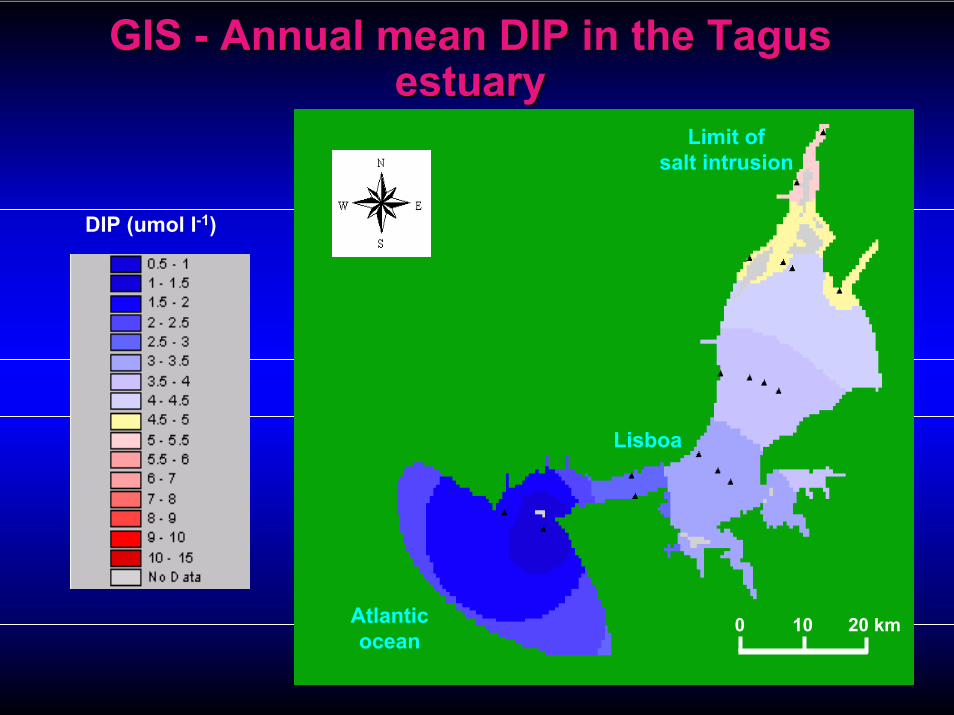
GIS GIS -- Annual mean DIP in the Tagus Annual mean DIP in the Tagus estuaryestuary
DIP (umol l-1)
Limit ofsalt intrusion
Lisboa
Atlanticocean
0 10 20 km
GIS GIS -- Annual mean Redfield ratio (N/P)Annual mean Redfield ratio (N/P)for the Tagus estuaryfor the Tagus estuary
N/P (mol ratio)
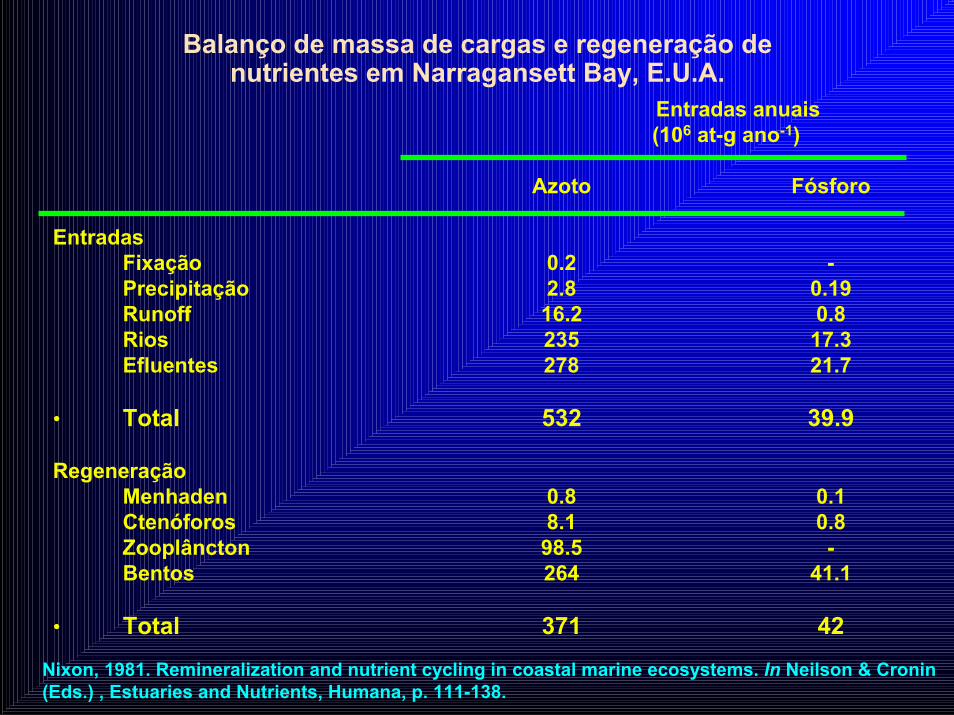
Balanço de massa de cargas e regeneração de nutrientes em Narragansett Bay, E.U.A.
Entradas anuais(106 at-g ano-1)
Azoto Fósforo
EntradasFixação 0.2 -Precipitação 2.8 0.19Runoff 16.2 0.8Rios 235 17.3Efluentes 278 21.7
• Total 532 39.9
RegeneraçãoMenhaden 0.8 0.1Ctenóforos 8.1 0.8Zooplâncton 98.5 -Bentos 264 41.1
• Total 371 42Nixon, 1981. Remineralization and nutrient cycling in coastal marine ecosystems. In Neilson & Cronin (Eds.) , Estuaries and Nutrients, Humana, p. 111-138.
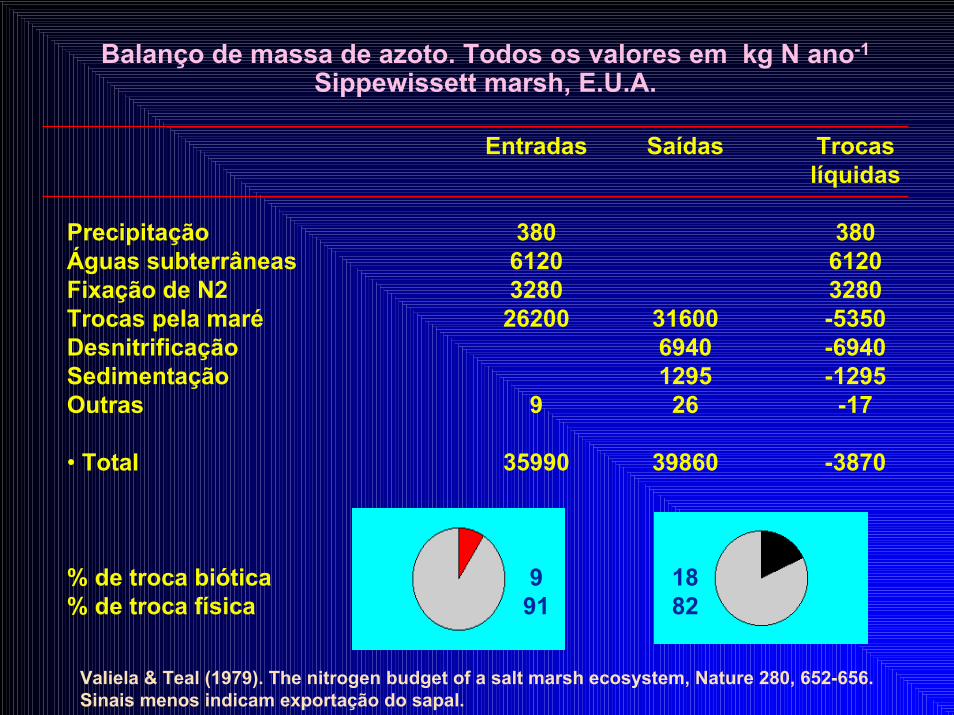
Balanço de massa de azoto. Todos os valores em kg N ano-1
Sippewissett marsh, E.U.A.
Entradas Saídas Trocaslíquidas
Precipitação 380 380Águas subterrâneas 6120 6120Fixação de N2 3280 3280Trocas pela maré 26200 31600 -5350Desnitrificação 6940 -6940Sedimentação 1295 -1295Outras 9 26 -17
• Total 35990 39860 -3870
% de troca biótica 9 18% de troca física 91 82
Valiela & Teal (1979). The nitrogen budget of a salt marsh ecosystem, Nature 280, 652-656.Sinais menos indicam exportação do sapal.
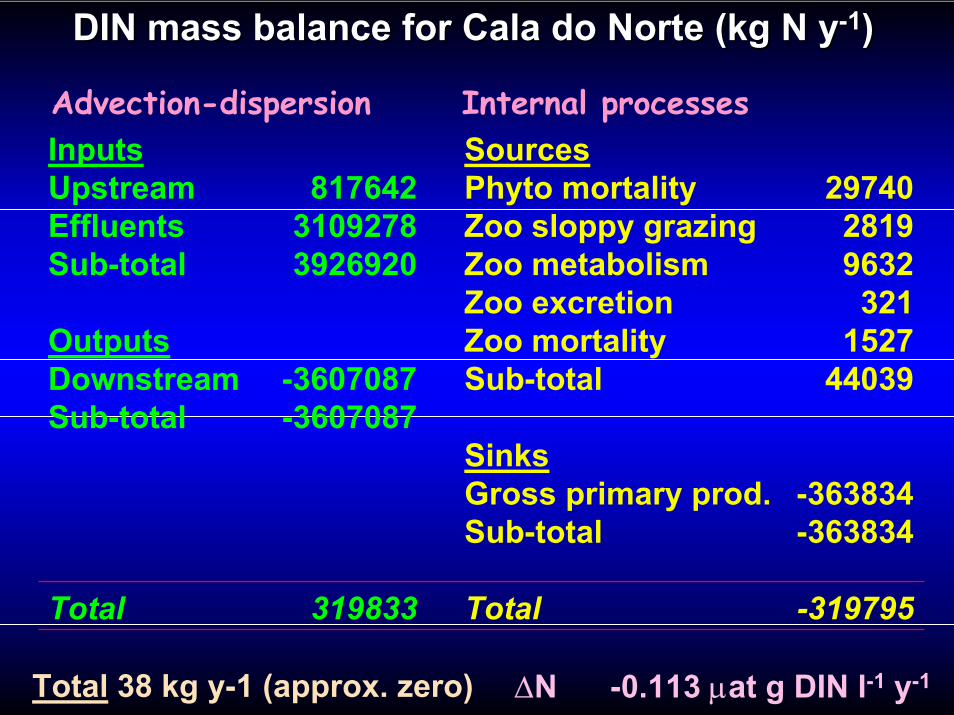
DIN mass balance for Cala do Norte (kg N yDIN mass balance for Cala do Norte (kg N y--11))
Advection-dispersion Internal processesInputsUpstream 817642Effluents 3109278Sub-total 3926920
OutputsDownstream -3607087Sub-total -3607087
Total 319833
SourcesPhyto mortality 29740Zoo sloppy grazing 2819Zoo metabolism 9632Zoo excretion 321Zoo mortality 1527Sub-total 44039
SinksGross primary prod. -363834Sub-total -363834
Total -319795
Total 38 kg y-1 (approx. zero) ∆N -0.113 µat g DIN l-1 y-1
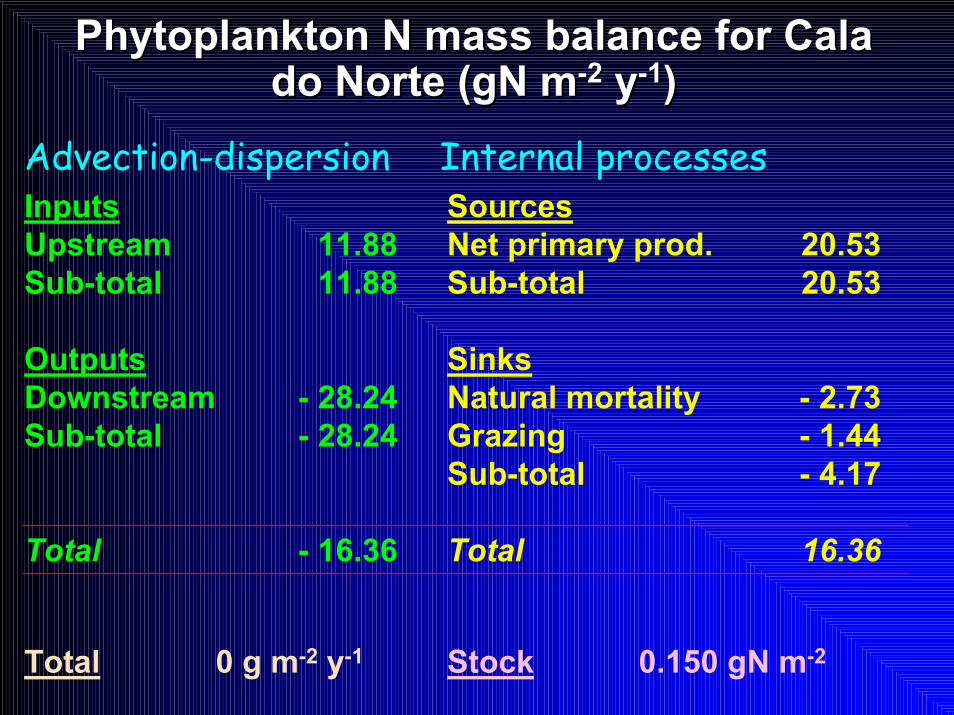
Phytoplankton N mass balance for Cala Phytoplankton N mass balance for Cala do Norte (gN mdo Norte (gN m--22 yy--11))
Advection-dispersion Internal processesSourcesNet primary prod. 20.53Sub-total 20.53
SinksNatural mortality - 2.73Grazing - 1.44Sub-total - 4.17
Total 16.36
InputsUpstream 11.88Sub-total 11.88
OutputsDownstream - 28.24Sub-total - 28.24
Total - 16.36
Total 0 g m-2 y-1 Stock 0.150 gN m-2
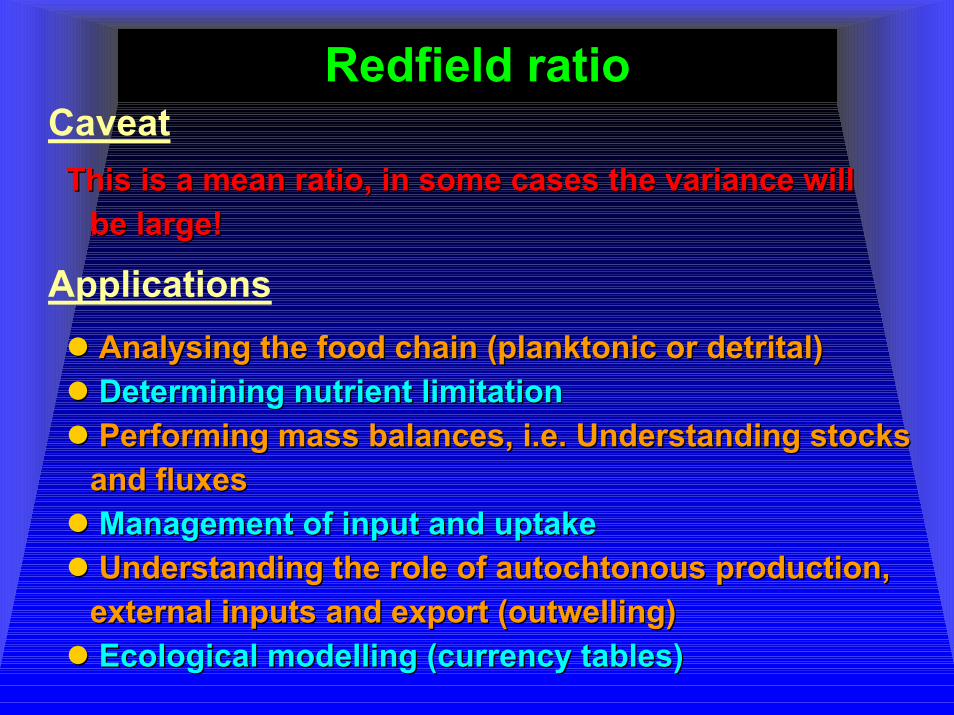
Redfield ratioRedfield ratioCaveat
This is a mean ratio, in some cases the variance will This is a mean ratio, in some cases the variance will be large!be large!
ApplicationsAnalysing the food chain (planktonic or detrital)Analysing the food chain (planktonic or detrital)Determining nutrient limitationDetermining nutrient limitationPerforming mass balances, i.e. Understanding stocks Performing mass balances, i.e. Understanding stocks and fluxesand fluxesManagement of input and uptakeManagement of input and uptakeUnderstanding the role of autochtonous production, Understanding the role of autochtonous production, external inputs and export (outwelling)external inputs and export (outwelling)Ecological modelling (currency tables)Ecological modelling (currency tables)
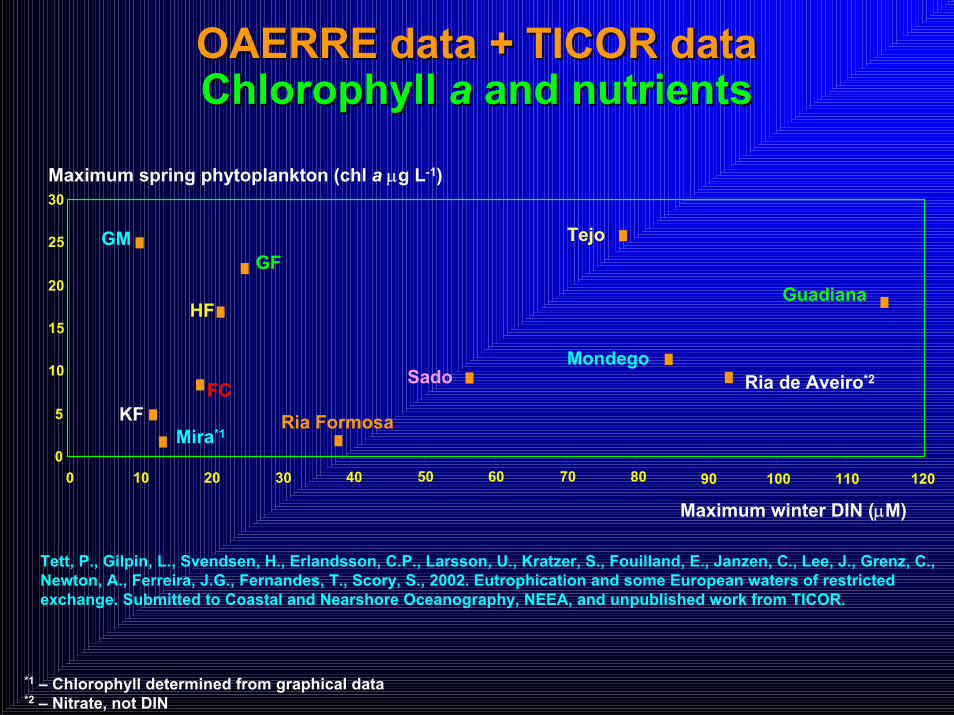
OAERRE data + TICOR dataOAERRE data + TICOR dataChlorophyll Chlorophyll aa and nutrientsand nutrients
Maximum spring phytoplankton (chl a µg L-1)
0
5
10
15
20
25
30
GF
KFFC
Ria Formosa
HF
GM Tejo
SadoMondego
Mira*1
Guadiana
Ria de Aveiro*2
50 60 70 80
Tett, P., Gilpin, L., Svendsen, H., Erlandsson, C.P., Larsson, U., Kratzer, S., Fouilland, E., Janzen, C., Lee, J., Grenz, C., Newton, A., Ferreira, J.G., Fernandes, T., Scory, S., 2002. Eutrophication and some European waters of restricted exchange. Submitted to Coastal and Nearshore Oceanography, NEEA, and unpublished work from TICOR.
Maximum winter DIN (µM)
0 10 20 30 40 90 100 110 120
*1 – Chlorophyll determined from graphical data*2 – Nitrate, not DIN