understanding ion-exchange adsorption mechanism under …§ão... · ix resumo alargado a...
TRANSCRIPT
UNIVERSIDADE DA BEIRA INTERIOR Ciências
Understanding ion-exchange adsorption mechanism under overloaded conditions
Gonçalo Fradique Lopes da Silva
Dissertação para obtenção do Grau de Mestre em
Bioquímica (2º ciclo de estudos)
Orientador: Prof. Doutora Ana Cristina Mendes Dias Cabral
Covilhã, Junho de 2013

ii

iii
Ao João, mãe, avós, tios
e Andreia

iv

v
Acknowledgments
I would to thank to Professor Cristina Cabral for the best supervision and guidance during this
last year. It was because of her efforts that this work went through. She was always available
to help and teach me whenever I needed to.
Filipa, Patrícia, João and Chico created the perfect working environment in our lab. They
were part of this. To Chico, a special thank for all his friendship.
To the rest of the friends and colleagues in the Investigation Centre I thank the support and
the nicest coffee-breaks ever.
To my dear friends and family, who were always there to support me and never stop
believing, I wish all the best.
A very special thank to Herr Egbert Müller because of his kind welcoming in TOSOH
Bioscience. It was because of his prompt availability and help that part of this project went
forward.
Last but not least, to Andreia, for her love and beliefs.

vi
vii
Resumo
A Cromatografia de Troca Iónica (IEC) é uma técnica muito eficaz e bastante usada na
indústria biotecnológica. O maior desafio que qualquer técnica cromatográfica é prever o
mecanismo the adsorção de biomoléculas nas resinas. Com esta investigação tentou-se
examinar a complexidade da adsorção de proteínas em suportes de troca iónica. Os resultados
de microcalorimetria de fluxo (FMC) e as isotérmicas permetiram ilustrar os processos de
adsorção de lisozima em carboximetil celulose (CMC) tanto na ausência como na presença de
sal (NaCl 50mM) a pH 5. Os resultados de FMC mostraram que sob todas as condições
utilizadas a adsorção é, tal como esperado em troca iónica, conduzido entalpicamente. Uma
correlação direta entre estes resultados e as isotérmicas pode ser estabelecida. Em condições
lineares de proteína, a adsorção de lisozima ocorre na mesma extensão independentemente
da concentração de sal. Contudo, quando se atinge o ponto de inclinação da isotérmica, a
reorientação de lisozima na presença de sal parece ser o mecanismo condutor para uma
posterior adsorção. Em condições de sobressaturação, na presença de sal, com o aumento da
concentração de superfície e como uma nova camada de moléculas de proteínas é formada, é
esperado um decréscimo do calor total da interacção, consistente com um equilíbrio
energético a favor da formação dessa nova camada. Foram também realizados estudos em
FMC e isotérmicas de adsorção de Albumina de Soro Bovino (BSA) em Toyopearl® GigaCap Q-
650M. Estes resultados mostraram que o calor global desta interação é altamente exotérmico.
É aparente que a alteração de conformação de BSA leva a uma adsorção secundária à
superfície. Ainda, a altas concentrações de proteína à superfícies, podem ocorrer elevadas
interações repulsivas. Estes resultados confirmam que a FMC é uma técnica eficiente que
permite ilustra os mecanismos de adsorção de proteínas em IEC.
Palavras-chave
Cromatografia de Troca Iónica; Microcalorimetria de fluxo; Isotérmicas; Adsorção;
Carboximetil celulose; GigaCap Q-650M; Lisozima; Albumina de Soro Bovino.

viii
ix
Resumo alargado
A Cromatografia de Troca Iónica (IEC) é uma técnica de purificação bastante popular e muito
usada na indústria biotecnológica. A sua popularidade deve-se às suaves condições de
trabalho usadas que permitem manter a estabilidade e atividade do produto desejado durante
o processo. Esta técnica baseia a separação de biomoléculas na atração eletrostática entre o
suporte cromatográfico carregado eletricamente e o produto com carga oposta. Apesar de
bem descrita, ainda muito há por saber sobre este tipo de cromatografia, nomeadamente
sobre os mecanismos subjacentes à adsorção de proteínas a uma resina de troca iónica.
Essenciais a todos o processo de purificação são os custos associados. Estes podem ser
reduzidos aumentando o rendimento do processo (quantidade de produto obtida por unidade
de tempo). Por estas razões, é imperativo aumentar a quantidade de produto inicial,
trabalhando para isso em condições de sobressaturação.
Também associado a uma purificação mais eficiente está o tipo de suporte utilizado. Quanto
maior for a afinidade do produto desejado para o suporte, maior será a o rendimento final do
processo. Há então vários tipos de resinas disponíveis no mercado. Neste trabalho foram
usadas duas resinas de troca iónica forte (carboximetil celulose (CMC) e Toyopearl GigaCap Q-
650M ) e uma de troca iónica fraca (Toyopearl DEAE-650M), sendo que o GigaCap tem
alterações poliméricas na sua matriz de modo a conseguir uma maior área de contacto com a
proteína.
Esta dissertação tem por objetivo melhorar a compreensão dos mecanismos de adsorção de
proteínas modelo (lisozima e albumina de soro bovino (BSA)) a suportes de troca iónica
comerciais em condições de linearidade e de sobressaturação de proteína considerando o
efeito da força iónica.
A microcalorimetria de fluxo é uma técnica que permite a deteção de pequenas alterações de
calor dentro de um sistema cromatográfico. Ora, como os processos de adsorção em troca
iónica são, à partida, processos exotérmicos, existe uma transferência de energia associada, a
microcalorimetria pode assim ser usada para ajudar a compreender os mecanismos
subjacentes a este tipo de adsorção.
Foi observada uma correlação direta entre os resultados de microcalorimetria e os das
isotérmicas de adsorção, tanto para os testes de troca catiónica (lisozima-CMC) como para os
de troca aniónica (BSA-GigaCap Q-650M).
Para os ensaios com lisozima, foi verificado que em condições lineares de concentração de
equilíbrio de proteína, os processos de calor exotérmico envolvidos dão-se na mesma
extensão tanto na presença como na ausência de sal. Isto parece indicar que pelo facto de o
x
suporte cromatográfico ainda não estar saturado, a adsorção de proteína à superfície dá-se
livremente.
No entanto, na presença de sal, quando a resina começa a ficar saturada, nota-se um
aumento do calor endotérmico, o que pode indicar um aumento de reorientação das
moléculas de lisozima de modo a permitiradsorção de mais moléculas. Isto parece ser
confirmado com a elevada libertação de energia que também ocorre nessas condições de sal e
de concentração de proteína à superfície.
Em condições de sobressaturação, é observado que o aumento da concentração de superfície
leva a uma diminuição do calor envolvido em todo o processo. Isto é expectável, tendo em
conta que a energia que as moléculas necessitam para se reorientarem, é gasta em adsorção,
estabelecendo-se assim um equilíbrio na formação de uma nova camada de moléculas à
superfície. Também a formação de multicamada de moléculas de proteínas a concentrações
de equilíbrio superiores pode ser possível.
Já os ensaios de BSA com a resina oferecida pela TOSOH Bioscience, resultaram em reações
altamente exotérmicas, havendo a presença de três picos desse tipo de calor. A intensidade
do primeiro deles diminui à medida que a concentração de BSA à superfície da resina
aumenta. Como estes testes foram efetuados na ausência de sal, isto pode ser justificado com
o aumento de repulsão entre moléculas adsorvidas que advém do aumento de concentração à
superfície.
A intensidade do segundo pico exotérmico também diminui com o aumento da concentração
de superfície. Ora, como a concentrações baixas as interações proteína-suporte são mais
fortes, isto leva a maiores alterações de conformação de proteína, que permite uma adsorção
secundária.
O último pico que é exotérmico a baixas concentrações, torna-se endotérmico às
concentrações de superfícies mais elevadas, podendo indicar elevada repulsão entre as
moléculas adsorvidas.
Todos estes resultados confirmam que, para uma visão mais consistente do mecanismo de
interação de troca iónica, a utilização da microcalorimetria de fluxo mostra-se de grande
interesse no estudo sistemático dos diferentes suportes comerciais disponíveis.
xi
Abstract
Ion-exchange chromatography (IEC) is a powerful and widely used separation technique in the
biotechnological industry. The greatest challenge of any chromatographic technique is
predicting the adsorptive behaviour of biomolecules onto the chromatography resin. This
investigation attempts to examine the complexity of protein adsorption onto ion-exchangers
and the role of nonspecific effects in the establishment of the adsorptive process. Flow
microcalorimetry (FMC) and adsorption isotherms measurements were used to illustrate
lysozyme adsorption mechanism on carboxymethyl cellulose (CMC) at both absence and
presence of salt (NaCl 50mM) at pH 5. FMC results show that under all the studied conditions
the adsorptive process is, as expected in ion exchange, enthalpy driven. Direct correlation
between microcalorimetry data and isotherm measurements is observed. Under linear protein
concentrations, protein adsorption occurs in the same extension regardless salt
concentration. However, when isotherm levelling point is reached, lysozyme reorientation in
the presence of salt seems to be the leading mechanism to further adsorption. Under
overloaded conditions in the presence of salt, with increasing surface concentration, as a new
layer of protein molecules is formed, an expected decrease in the net heat of adsorption is
observed, consistent with an energetic equilibrium towards the formation of the new layer.
FMC experiments and isotherm measurements were also performed for Bovine Serum Albumin
(BSA) adsorption onto Toyopearl® GigaCap Q-650M. The results showed a high overall
exothermic process. Secondary adsorption of BSA to the surface, resulting from its alteration
of conformation seems to be present. Also, at high protein surface concentrations, high
repulsive interactions may occur. All these results confirm that FMC is a powerful technique
to illustrate protein adsorption mechanisms in ion-exchange.
Work supported by FCT (Portuguese Foundation for Science and Technology), project number
FCOMP-01-0124-FEDER-014750 (Ref. FCT PTDC/EBB-BIO/113576/2009) and NSF (American
National Science Foundation) NSF – 1246932 (award issued by CBET division of NSF)
Keywords
Ion-exchange chromatography; Flow microcalorimetry; Isotherms; Adsorption; Carboxymethyl
cellulose; GigaCap Q-650M; Lysozyme; Bovine Serum Albumin.

xii
xiii
Índice
Chapter 1 – Introduction ...................................................................................... 1
1.1 – Liquid chromatography for biomolecules .................................................... 1
1.2 – Goal of study ...................................................................................... 1
Chapter 2 – Background and research objectives ........................................................ 3
2.1 – Ion-exchange liquid chromatography ......................................................... 3
2.2 - Column characterisation ........................................................................ 5
2.2.1 - Static binding capacity ........................................................................ 5
2.2.2 – Dynamic binding capacity .................................................................... 8
2.3 – Microcalorimetry as a tool to investigate surface phenomena ........................... 9
2.4 – Research objectives ............................................................................ 13
Chapter 3 – Experimental ................................................................................... 15
3.1 – Adsorption isotherms .......................................................................... 15
3.2 – Dyanamic binding capacities ................................................................. 15
3.3 – Flow microcalorimetry ......................................................................... 16
Chapter 4 – Discussion....................................................................................... 19
4.1 – Static binding capacities for lysozyme and BSA adsorption onto ion-exchange resins
at selected pH and different salt conditions ..................................................... 19
4.2 – Dynamic binding capacities for BSA adsorption onto anion exchange resins at
different pH and salt conditions .................................................................... 24
4.3 – Microcalorimetry to investigate the surface phenomena ............................... 26
Chapter V – Conclusions and future work ................................................................ 59
References .................................................................................................... 61

xiv
xv
Lista de Acrónimos
AAI Available Area Isotherm
BSA Bovine Serum Albumin
CMC Carboxymethyl cellulose
DCB Dynamic Binding Capacity
FMC Flow Microcalorimetry
HIC Hydrophobic Interaction Chromatography
IEC Ion-Exchange Chromatography
ITC Isotherm Titration Calorimetry
Lys Lysozyme
NISS Non-ideal Surface Solution
SDM Stoichiometric Displacement Model
SMA Steric Mass Action
ΔG Gibbs free energy variation

xvi
1
Chapter 1 – Introduction
1.1 – Liquid chromatography for biomolecules
Chromatography is a powerful technique that makes part of the downstream process for
separation and purification of biomolecules. This purification technique is based on a
retardation of molecules as the solvent progresses through a stationary phase. The stationary
phase, with certain characteristics, is packed in a column and the mobile phase works as an
eluent that carries the sample to be purified. Biomolecules are purified through a stationary
phase according to a given property, such as size, charge, hydrophobicity or biospecific
interaction [1]
In this work, we intend to understand the adsorption mechanisms in ion exchange
chromatography (IEC) with a special focus on overloaded conditions.
Ion-exchange mechanism for preparative separation has been widely used in the
pharmaceutical industry [2–8]. The popularity of this technique is due to its simple and easy
to use methodology. Also, it is used under mild pH, temperature and salt conditions, allowing
preserving the biological activity of the biomolecules during the process [3–9]. Another
advantage of IEC is the usage of aqueous buffers and hydrophilic surfaces [9].
One efficient way to increase the overall throughput in chromatography is to increase the
dynamic binding capacity of the resins [10]. Ion exchange resins have dynamic binding
capacities higher than those of the other chromatographic modes. In this way, it is the most
chosen method for the capture and concentration step [11].
1.2 – Goal of study
Essential to the overall process are the costs associated with the downstream process, which
can be reduced by increasing the overall throughput (product per time unit) [10]. Due to
these economic reasons, chromatography should be run under overloaded conditions despite
being much more complex to operate than the linear mode [12–14]. Also, running
chromatography under the overloaded mode results in undesirable non-specific interactions.
Unlike analytical operations which have suitable linear equilibrium descriptions, there is still
lacking an appropriate model to describe non-linear equilibrium [13,14]. This region of the
adsorption isotherm is important for overloaded chromatography, however due to associated

2
non-ideal interactions of protein adsorption and desorption, a reliable separation mechanism
could not be predicted yet [2]. Since the free energy contributions of the underlying
processes cannot be properly estimated, the design and optimisation of preparative
chromatography systems has not been possible [15].
3
Chapter 2 – Background and research
objectives
2.1 – Ion-exchange liquid chromatography
Ion-exchange chromatography is based on electrostatic interactions between the product and
the oppositely charged groups of the stationary phase. In first place, there is an adsorption
step, in which the desired product binds to the adsorbent and the rest of the loaded mixture
is washed away as the mobile phase flows through. After that, the mobile phase conditions
are changed (increasing salt concentration or changing the solution pH) and the target
molecule is eluted [1,16].
IEC has to be carried at a pH within a range between the isoelectric point (pI)- pH at which
the protein is uncharged- of the protein and the pKa of the packed resin. Considering this,
this type of chromatography can be either cation- or anion-exchange. In cation exchange
chromatography the desired molecule is positively charged while the adsorbent is negatively
charged, so one has to work at a pH lower than the pI. On the other hand, anion exchangers
bound proteins with negative net charge; therefore the pH should be higher than protein’s
isoelectric point. However, since proteins are relatively unstable, the pH range at which
liquid chromatography should be carried out has to consider protein stability [16].
Furthermore, it should be also taken into account the conditions of adsorption and elution to
minimise non-specific interactions [10].
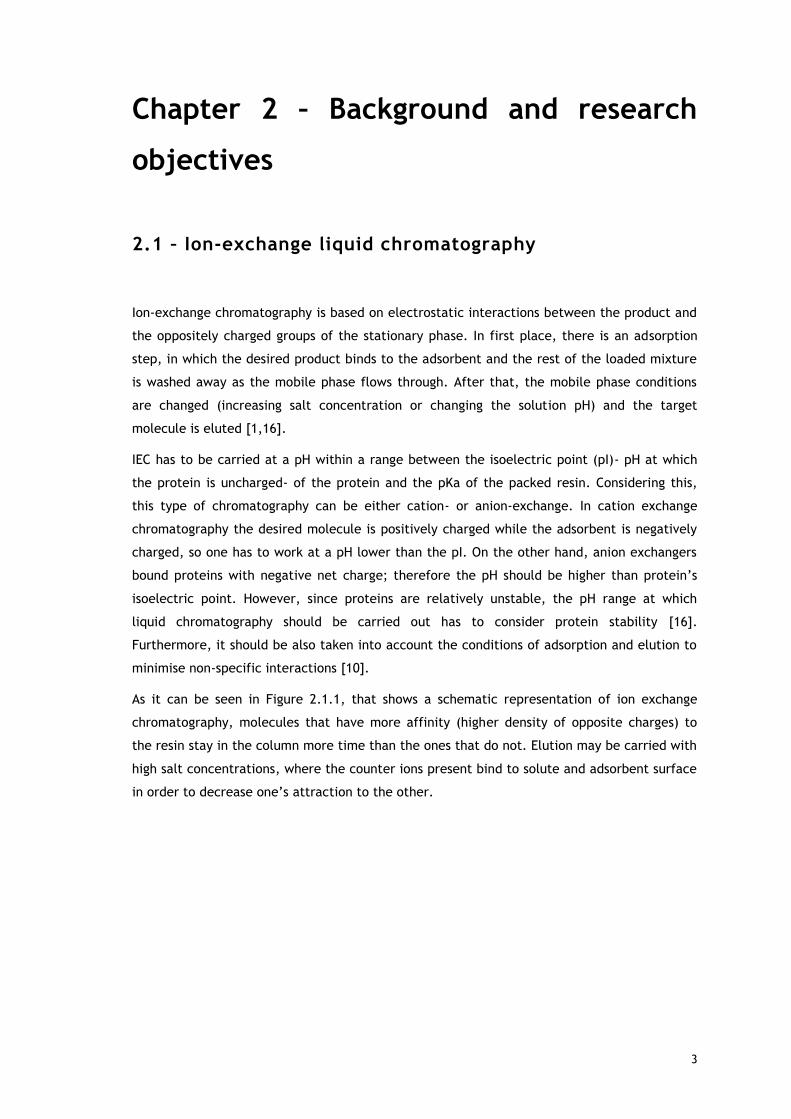
As it can be seen in Figure 2.1.1, that shows a schematic representation of ion exchange
chromatography, molecules that have more affinity (higher density of opposite charges) to
the resin stay in the column more time than the ones that do not. Elution may be carried with
high salt concentrations, where the counter ions present bind to solute and adsorbent surface
in order to decrease one’s attraction to the other.
4
Figure 2.1.1 – Ion exchange chromatography illustrative representation adapted from [17].
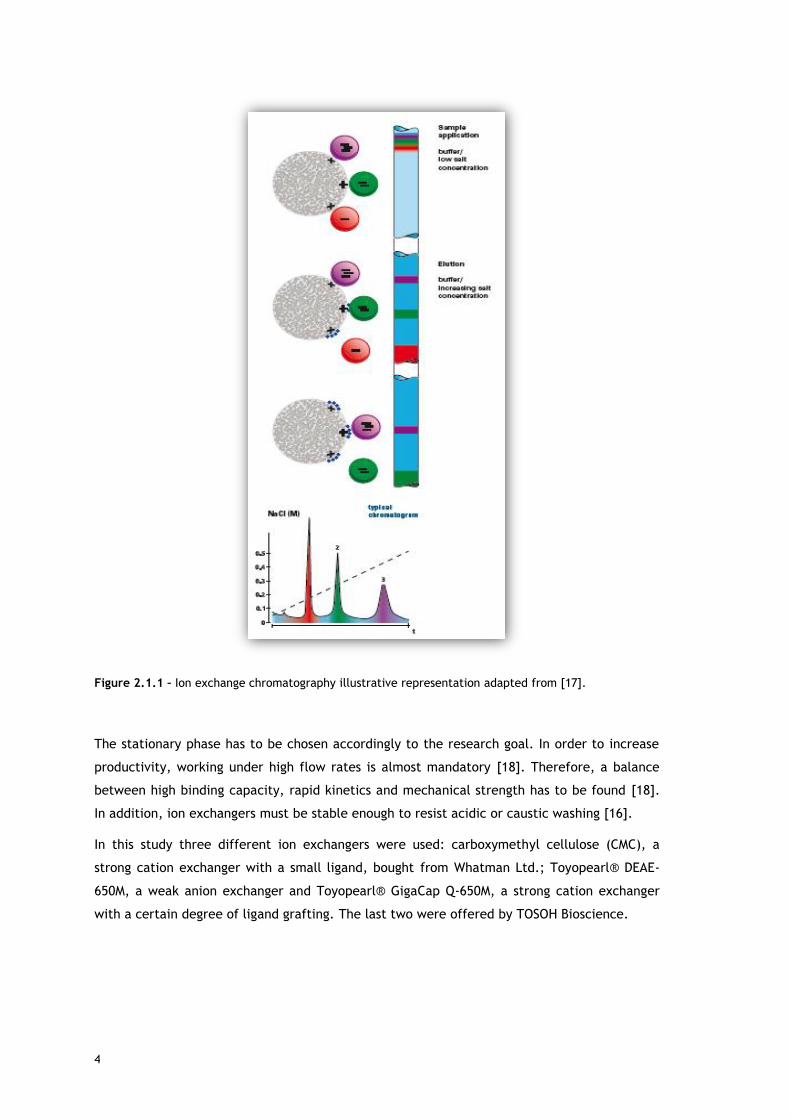
The stationary phase has to be chosen accordingly to the research goal. In order to increase
productivity, working under high flow rates is almost mandatory [18]. Therefore, a balance
between high binding capacity, rapid kinetics and mechanical strength has to be found [18].
In addition, ion exchangers must be stable enough to resist acidic or caustic washing [16].
In this study three different ion exchangers were used: carboxymethyl cellulose (CMC), a
strong cation exchanger with a small ligand, bought from Whatman Ltd.; Toyopearl® DEAE-
650M, a weak anion exchanger and Toyopearl® GigaCap Q-650M, a strong cation exchanger
with a certain degree of ligand grafting. The last two were offered by TOSOH Bioscience.

5
2.2 - Column characterisation
Ion exchange is a chromatographic operation technique in which reversible adsorption
between two oppositely charged surfaces (solute molecules and chromatographic resin) takes
place. The purification of the target molecules depends on the difference in the attraction
strength to the adsorbent between the desired product and other solutes present. Therefore,
every ion exchanger has a specific capacity for a different solute according to its charge and
ionic strength of the media [19,20].
Another factor that affects protein binding capacity by an adsorbent is the mass transfer
associated to the chromatographic process [21]. For this reason, the dynamic binding capacity
(DBC) of a resin to a specific protein is limited, contrary to its ideal and theoretical (static)
binding capacity. Associated with mass transfer of proteins are: pore diffusion, surface
diffusion, film diffusion and interaction kinetics [10,22].
Large-scale preparative chromatography has different critical factors compared with
analytical chromatography, such as capacity, recovery and throughput [23]. One way to
increase the overall throughput is to operate under a high flow rate [23]. However, according
to Van Deemter equation [24] there is an optimum linear velocity (µ) that minimises flow
diffusion (A), particle longitudinal diffusion (B) and mass transfer phenomena (C).
(1)
All things considered, static binding capacities represent an upper bound to the dynamic
ones, which simulate actual chromatography conditions.
2.2.1 - Static binding capacity
Protein adsorption and adsorbent’s capacity are dependent not only on the physical chemistry
properties of both species but also on protein equilibrium concentration [25]. One can say
that binding capacity increases linearly with protein equilibrium concentration until a certain
point. When adsorbent’s binding sites start to become saturated with protein, adsorption of
more molecules is limited [25]. Bellot and Condoret stated that molecules are adsorbed on a
fixed number of well-located sites, which accept only one molecule, and are organised as
monolayers; all sites are energetically equivalent and no interaction between adsorbed
molecules occurs [25]. However, when working with biomolecules, adsorption mechanisms are
6
not that simple. In this way, several empirical and semi-empirical equilibrium models have
been used to try to understand protein adsorption [15].
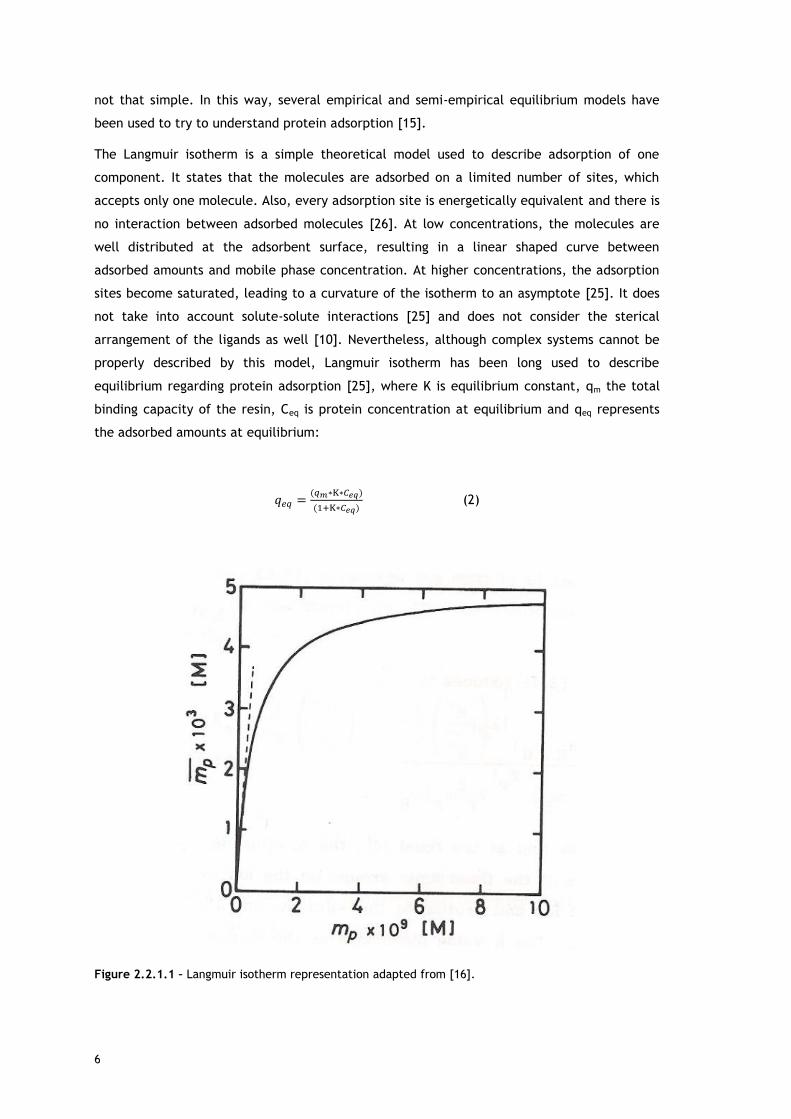
The Langmuir isotherm is a simple theoretical model used to describe adsorption of one
component. It states that the molecules are adsorbed on a limited number of sites, which
accepts only one molecule. Also, every adsorption site is energetically equivalent and there is
no interaction between adsorbed molecules [26]. At low concentrations, the molecules are
well distributed at the adsorbent surface, resulting in a linear shaped curve between
adsorbed amounts and mobile phase concentration. At higher concentrations, the adsorption
sites become saturated, leading to a curvature of the isotherm to an asymptote [25]. It does
not take into account solute-solute interactions [25] and does not consider the sterical
arrangement of the ligands as well [10]. Nevertheless, although complex systems cannot be
properly described by this model, Langmuir isotherm has been long used to describe
equilibrium regarding protein adsorption [25], where K is equilibrium constant, qm the total
binding capacity of the resin, Ceq is protein concentration at equilibrium and qeq represents
the adsorbed amounts at equilibrium:
(2)
Figure 2.2.1.1 – Langmuir isotherm representation adapted from [16].
7
Usually, in order to characterise competitive non-linear chromatographic systems,
multicomponent Langmuir isotherms have been used [27,28]. Despite being reliable to predict
the elution times and band shapes of the different components [25,28] multi-component
isotherms still do not have a proper description of adsorption equilibrium [29,30]
Other models to explain equilibrium have been used. Kopacievicz et al. [31] and then Rounds
and Regnier [32] described the stoichiometric displacement model (SDM). This model
describes protein retention in linear IEC and assumes that ion exchange is the only adsorption
mechanism. Since SDM states that the entire ion exchange capacity is available to protein
adsorption, it is an accurate model for low protein concentrations. Despite not being as
reliable for high protein loadings [13,14], it was later applied and developed for overloaded
conditions [33,34].
Many scientists, for instance Kopacievicz and co-workers [35] and Thrash and Pinto [9] have
also shown that not only electrostatic interactions exist in IEC. They concluded that
haemoglobin was not able to elute from an anion-exchanger at high ionic strength, even
though it could be performed with a non-polar solvent. So, in spite of being a process mainly
based on interactions of opposite charge materials, ion exchange chromatography, it may also
have some hydrophobic and non-specific interactions involved [36].
In order to model non-linear elution of proteins in IEC, Brooks and Cramer proposed in 1992
[37] the Steric Mass Action (SMA) model. This model predicts the salt dependence of protein
adsorption and the steric shielding occurring under overloaded conditions [28]. It proposes
that the steric hindrance is related to the protein surface concentration [13,28]. Gallant and
co-workers have focused on two important effects in preparative chromatography: the salt
dependence of protein binding and the adsorption in non-linear conditions.
These mass-action models for the estimation of protein isotherms describe adsorption as a
stoichiometric exchange of ions between the resin surface and the protein. In this way, such
models do not describe major non-ideal effects associated with protein adsorption, or when
they do is in a thermodynamically inconsistent way [15]. Li and Pinto [38] proposed the non-
ideal surface solution (NISS), which, based on SDM, described non-ideal effects of protein
adsorption in a thermodynamically manner. In the NISS model the adsorbed phase is
characterised as a non-ideal surface solution that is controlled by adsorbed protein
interactions in the neighbourhood. The liquid phase is assumed to be a non-ideal bulk liquid
controlled by the interactions between modulator ions.
In order to check which effects actually limit protein adsorption, Raje and Pinto [13]
combined SMA and NISS. It was concluded that there is still left to understand which of the
two effects (steric hindrance or non-ideal surface interactions) control adsorption under
overloaded conditions. Later, they showed that the heat of adsorption of chloride ions in the
surface of an ion exchanger is independent of the surface coverage, indicating that the
already adsorbed ions do not affect the adsorption of the subsequent ions [14]. However,
8
when it came to protein adsorption, the results showed that there is dependence on the
surface coverage in this phenomenon. The heat of adsorption decreased with the increasing
of surface coverage, suggesting repulsive interactions between adsorbed proteins.
All things considered from all the models mentioned, it can be summarised that: SDM does
not consider non-ideal effects under overloaded conditions; SMA consider non-ideal effects,
but, apart from steric hindrance, assume other negligible; NISS consider non-ideal effects,
such as repulsion between like charge proteins, but neglect steric hindrance.
Another type of protein isotherm model is the colloidal method. Oberholzer and Lenhoff [39]
expanded this method even more and described protein isotherms under overloaded
conditions. They incorporated the average lateral interactions into the isotherm as a
correction to linear adsorption, considering them as a function of surface coverage. Isotherm
prediction depends on the balance between protein-surface attraction and adsorbate-
adsorbate repulsion. It is now known that these two phenomena can be decoupled [39].
Nevertheless, when these repulsion mechanisms are associated with high affinity for the
adsorbent surface, the extent of the adsorption process may be limited.
Another isotherm prediction model developed was the Available Area Isotherm (AAI) [40].
While the previous models were developed for adsorption of small molecules, the AAI,
suggested by Bosma and Wesselingh, accounts for geometrical exclusion due to already
adsorbed proteins. This model fits for protein adsorption both in IEC and HIC. It has a better
thermodynamic foundation since instead of the isotherm being determined by the charge of
the proteins, it is determined by the effect of large size proteins accompanied by geometrical
exclusion.
2.2.2 – Dynamic binding capacity
The dynamic binding capacity of a chromatographic column characterise the performance of a
packed column with a given adsorbent. It is often defined as the amount of protein bound to
the resin under the running conditions when the effluent concentration reaches a specific
breakthrough of the protein feed concentration [41].
The dynamic binding capacity of a chromatography column can be expressed according to the
following equation:
(3)
9
where the Q is the volumetric flow rate of the load, the t10% and the V10% are the
breakthrough time and volume at which the effluent reaches 10% of the feed concentration
(Cf), respectively [41].
The DBC is a characteristic of the ion-exchange support and is depended on the residence
time [41] and, therefore, on the flow through. In addition, the mobile phase conditions, such
as conductivity and pH, affect the binding capacity of the resin [42–44]. It is known that the
capacity of an ion-exchange chromatography support to bind a given protein decreases when
protein net charge decreases and buffer conductivity increases [37].
However, a second mechanism is presented by Harinarayan [43], in this case, the complete
opposite occurs; the binding capacity of a given matrix unexpectedly increases as the
conductivity increases and the protein net charge decreases. This can be explained by an
exclusion mechanism, which predicts protein binding to the outer surface of the resin bead.
In this way, by charge repulsion and steric exclusion, additional protein molecules
transportation through the pore is reduced [44]. So, by lowering the protein charge or raising
the salt concentration (increasing conductivity), the charge repulsion effect between the
protein molecules lowers, allowing higher dynamic binding capacities [43].
Furthermore, the DBC is a function of the resin itself; some of its characteristics, like the
pore size, also have influence on the binding capacity of a column. Theoretically, in a same
sized particle, the smaller the pore size the higher the surface area. Also, as the pore size
increases, the access to the internal surface area also does ([10,11]). The binding capacity of
a protein increases as the pore becomes larger until its maximal access to the internal surface
area. Nevertheless, since the absolute surface area decreases with the pore size
enlargement, there is a point of diminishing return and the protein binding capacity starts to
diminish [11]. The pore size of a given support is influenced by the type of ligand attachment
and architecture. Depending on this, the effective pore size of the resulting resin is smaller
than the one of the initial bead [10,11]. According to Müller [21], both pore size optimisation
and polymeric surface modification are further improvements in order to enhance mass
transfer and therefore the DBC.
2.3 – Microcalorimetry as a tool to investigate surface
phenomena
As it was previously described, working under overloaded conditions originates non-idealities
during adsorption in chromatography [2]. Therefore, reliable and satisfactory isotherm
prediction may not be that easy. Some empirical models, like Langmuir, are often used to fit
experimental isotherm, even though it is a risky approach. Although IEC is commonly used,
the underlying mechanisms that establish equilibrium in adsorption are not yet properly
10
described. The so far proposed models have shown some limitations because non-specific
intermolecular interactions are not fully understood. In this way, considering all these points
and to try to overcome the already mentioned difficulties, researchers have been focusing in
calorimetry.
Equilibrium is dictated by the Gibbs free energy (ΔG), and overall ΔG depends on reaction
enthalpy and entropy [9]. Protein adsorption can generate a small yet measurable thermal
signal, which can help describing the adsorption mechanism [15,45,46], so reaction enthalpy
can be measured with microcalorimetry. Thus, this technique can provide valuable insight
about the underlying mechanisms of adsorption [9,12,47].
Isothermal titration calorimetry (ITC) is a calorimetric method that works under the batch
mode. The measurement of heat exchange represents the energy associated to the whole
adsorption process, including dilution heat, binding heat, energy required for desolvation,
energy change after biomolecule rearrangement… However, information about the desorption
process is not possible to obtain by this technique [48].
On the other hand, flow microcalorimetry (FMC) works under a specific flow rate. Therefore,
heat measurements can be calculated for desorption, so that the level of reversibility can be
determined according to both heat and mass transfer. The whole profile can give an overview
on the kinetics of process adsorption and desorption. Also, by integrating the obtained values,
energy change can be determined in order to the associated mass transfer [12,49,50].
Thermodynamically, adsorption in ion-exchange chromatography is expected to be
exothermic, once there is release of energy when two surfaces with opposite charges
approach each other. However, previous calorimetric studies [2,9,14,15,51,52], have shown
that protein adsorption might be endothermic as well. Therefore, since the Gibbs free energy
has to be negative for a favourable reaction, this process must be entropically driven. There
are several non-specific effects that might be the source of endothermic interactions:
repulsive interactions between adsorbed molecules; repulsive interactions between protein
surface hydrophobic groups and adsorbent surface hydrophilic moieties; repulsive interactions
between like charge groups on the protein surface and on the adsorbent surface; water
release from adsorbent’s and protein’s surface; protein conformational changes; protein
reorientation on the surface [14,52].
For ion-exchange chromatography it was then suggested that when enthalpy change was not
favourable, water release due to hydrophobic interactions was the factor leading to an
increase of entropy, as well as structural rearrangements and changes [53]. However, since
some studies relate endothermic heat to expected sources, other to conformational changes
[14,49,52,54], and some to water release [54,55] it is important to investigate the sources of
endothermic behaviours.
Thrash et al [2] tried to understand the mechanisms underlying IEC under the overloaded
mode. For that, they studied the interaction of Bovine Serum Albumin (BSA) with an anion-
11
exchanger with FMC under both, linear and non-linear loading conditions. The isotherm
results showed a typical Langmuir curve with higher adsorption capacities at lower ionic
strengths. It was also concluded that there is more than electrostatic interactions controlling
this process. Water release seemed to be high enough to overcome unfavourable enthalpy
change at 25oC. However, at 37oC the free energy reduction resulting from water-release-
associated entropy increase was not great enough to overcome unfavourable enthalpic
interactions. Therefore, higher temperatures appear to be associated with structural
rearrangements, contributing to drive adsorption through an entropically way [2]. On another
study [15] concerning the adsorption of BSA and ovalbumin onto an anion-exchange sorbent,
the same authors, demonstrated that electrostatic repulsive interactions between adsorbed
molecules appeared to be a larger contributor to endothermic heats of adsorption than
surface dehydration or solution non-idealities. They also found that the presence of mobile
phase cations can reduce the magnitude of endothermic adsorption heats by screening
repulsive interactions between adsorbed molecules. Although water release was not found to
be a major contributor to endothermic adsorption heats, they considered it a contributor to
the entropic driving force associated with the adsorption of BSA.
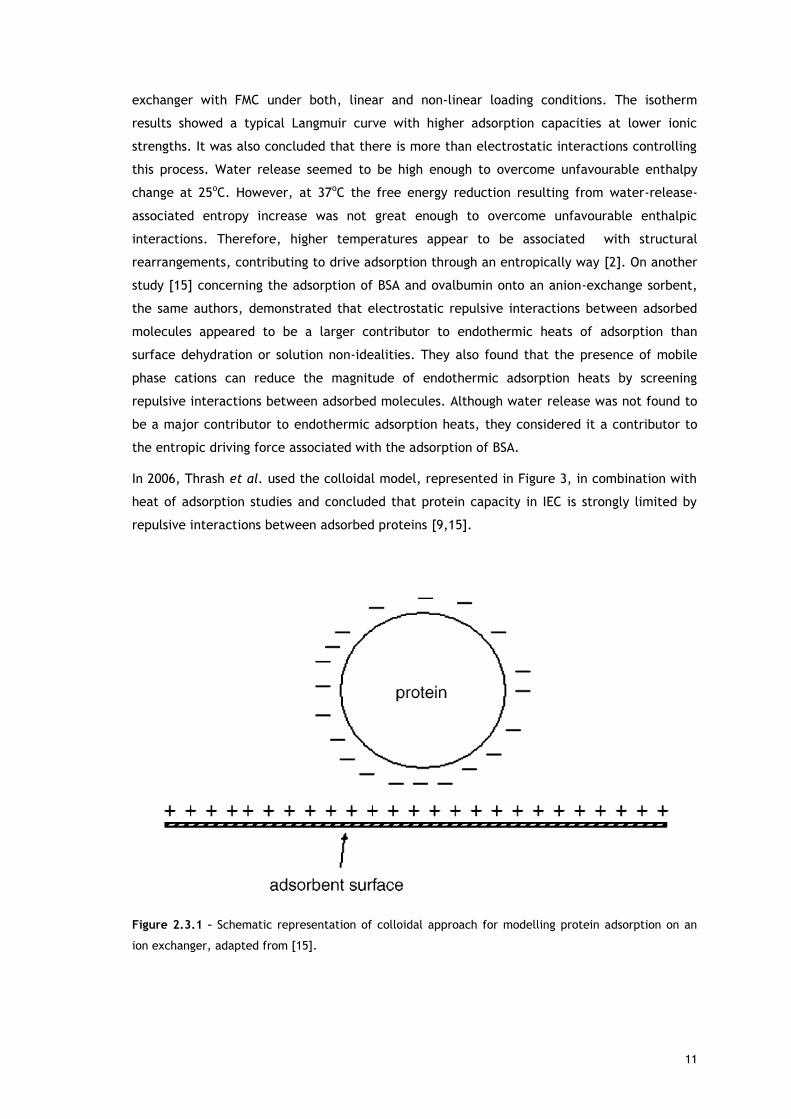
In 2006, Thrash et al. used the colloidal model, represented in Figure 3, in combination with
heat of adsorption studies and concluded that protein capacity in IEC is strongly limited by
repulsive interactions between adsorbed proteins [9,15].
Figure 2.3.1 – Schematic representation of colloidal approach for modelling protein adsorption on an
ion exchanger, adapted from [15].
12
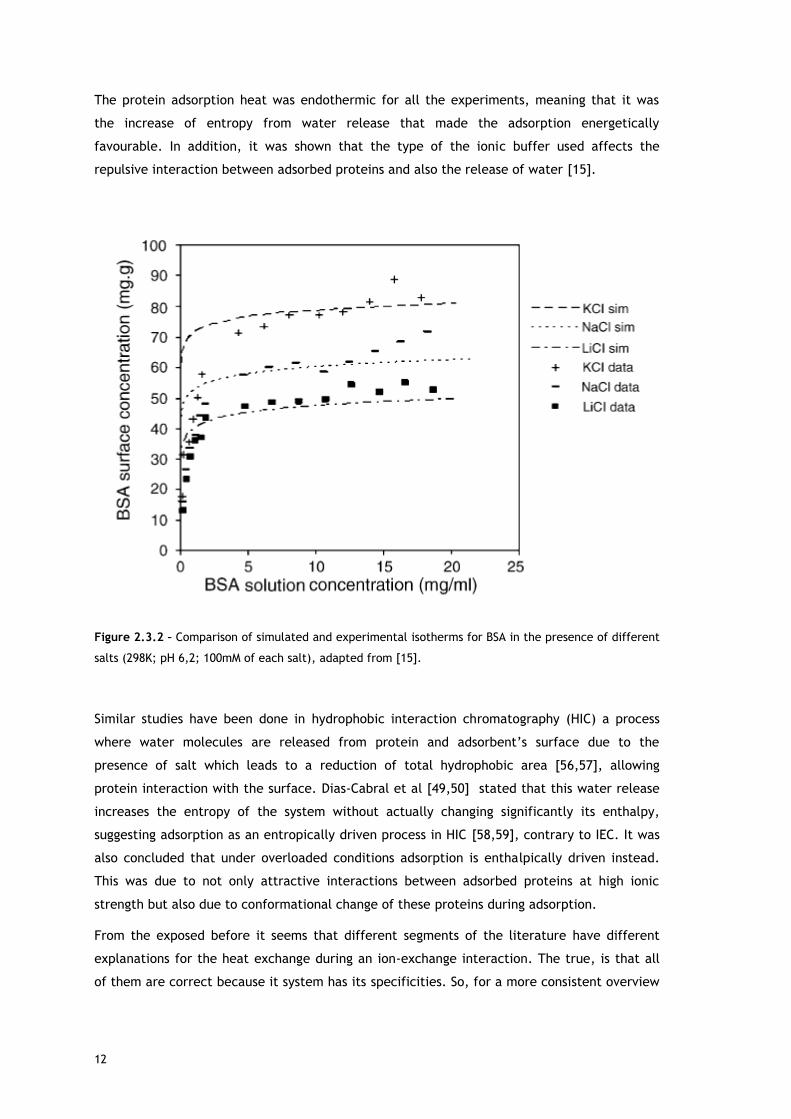
The protein adsorption heat was endothermic for all the experiments, meaning that it was
the increase of entropy from water release that made the adsorption energetically
favourable. In addition, it was shown that the type of the ionic buffer used affects the
repulsive interaction between adsorbed proteins and also the release of water [15].
Figure 2.3.2 – Comparison of simulated and experimental isotherms for BSA in the presence of different
salts (298K; pH 6,2; 100mM of each salt), adapted from [15].
Similar studies have been done in hydrophobic interaction chromatography (HIC) a process
where water molecules are released from protein and adsorbent’s surface due to the
presence of salt which leads to a reduction of total hydrophobic area [56,57], allowing
protein interaction with the surface. Dias-Cabral et al [49,50] stated that this water release
increases the entropy of the system without actually changing significantly its enthalpy,
suggesting adsorption as an entropically driven process in HIC [58,59], contrary to IEC. It was
also concluded that under overloaded conditions adsorption is enthalpically driven instead.
This was due to not only attractive interactions between adsorbed proteins at high ionic
strength but also due to conformational change of these proteins during adsorption.
From the exposed before it seems that different segments of the literature have different
explanations for the heat exchange during an ion-exchange interaction. The true, is that all
of them are correct because it system has its specificities. So, for a more consistent overview
13
of the mechanism of interaction, flow microcalorimetry could be of great help in a systematic
study of ion-exchange chromatography.
2.4 – Research objectives
As mentioned, it is well recognized that ion-exchange chromatography is a powerful
technique for the separation and purification of biomolecules on a large process scale,
resulting from the superimposition of different effects: fluid dynamics, mass transfer
phenomena and equilibrium thermodynamics. It is imperative, for economic reasons, to run
the chromatographic process in the overloaded mode. However, operation in the overloaded
mode is considerably more complex than linear chromatography, and suitable models do not
exist. Consequently, the prediction of separation behavior is generally unreliable. This is a
major impediment in the design and implementation of scaled-up units. There is, therefore,
considerable practical interest in developing a better understanding of the mechanisms
underlying non-linear chromatography of biomolecules. Thus the specific goals for this project
will be the investigation in IEC of the effect of salt and support type on the adsorption
mechanism under linear and overloaded conditions. Two different types of adsorbents (cation
and anion-exchange) will be used.
Flow microcalorimetry will be extensively used to study the non-ideal interactions under
overloaded conditions, as previous studies have underscored the importance of calorimetry as
a means to investigate surface phenomena. Also, adsorption isotherms and dynamic binding
capacity data will be obtained at different operation conditions to characterise IEC
adsorption mechanism under non-linear conditions.
This work will be done partly in Health Sciences Investigation Centre of Universidade da Beira
Interior (CICS-UBI), Covilhã, Portugal (FMC studies and adsorption isotherm measurements)
and in TOSOH Bioscience GmbH, Stuttgart, Germany (DBC studies and adsorption isotherms).

14
15
Chapter 3 – Experimental
3.1 – Adsorption isotherms
Lysozyme (Sigma-Aldrich) solutions were prepared in 20mM of piperazine (Mw = 86g/mol)
buffer at pH 5 both without and with 50mM of sodium chloride (NaCl, Mw = 58,44g/mol).
Carboxymethyl cellulose (CMC), bought to Whatman Company, was weighted into individual
test tubes and then transferred with 1mL of protein solution to a multi-well plate. The plates
were sealed with parafilm and were left to shake for 24h at 230rpm and 21,5°C. After
equilibrium was reached, the slurry was transferred to Eppendorf tubes and left to settle for
30 minutes. The supernatant was then removed with a syringe and the absorbance of every
solution was measured at 280nm with a UV spectrophotometer. In order to know the amount
of protein bound to the adsorbent a mass balance was applied. The isotherm plot was done
with lysozyme surface concentration against protein equilibrium liquid concentration.
The commercial resins kindly offered by TOSOH Bioscience, Toyopearl DEAE-650M and
Toyopearl Gigacap-Q, were suspended in deionised water in a 50/50 mixture. BSA (Sigma-
Aldrich) solutions with different concentrations were prepared in in 20mM of tris-HCl buffer
at different salt conditions (0, 50mM and 100mM NaCl) and different pH (pH 8 for DEAE-
650mM and pH 9 for GigaCap-Q). Protein solutions were then transferred to Falcon tubes
along with the slurry of resin. The ratio of this gel to the total solution volume was 1:100.
Equilibrium was reached after 5 hours of shaking at 50rpm at room temperature. Then, the
resin was left to settle and protein equilibrium concentration was measured with NanoDrop
2000c (Peqlab Biotechnologie GmbH, Erlanger). This part of the study was done in TOSOH
Biosience laboratories, in Stuttgart, Germany.
3.2 – Dynamic binding capacities
The dynamic binding capacities were performed in ÄKTA systems (Purifier and Explorer) (GE-
Healthcare, Uppsala, Sweden). The two anion exchangers, Toyopearl DEAE-650M and
Toyopearl GigaCap-Q, were packed in a 0,63mL column (Ø = 6,6mm; h = 1,85cm) according to
manufacturer instructions [60]. The acetone test was performed in order to check the
packing. For each resin the DBC was determined with different BSA loadings prepared with
tris-HCl buffer at 20mM at different pH (7,2, 8 and 9) and with different ionic strengths (0,
50mM and 100mM NaCl). DBCs were measured under a flow rate of 150cm/h at 10%
breakthrough. In first place, a specific protein concentration is loaded through the bypass to
16
the waste until system saturation. Then, the loading is led to the column until 10% of the
maximum capacity was reached. DCB studies were also done in TOSOH Biosience laboratories.
3.3 – Flow microcalorimetry
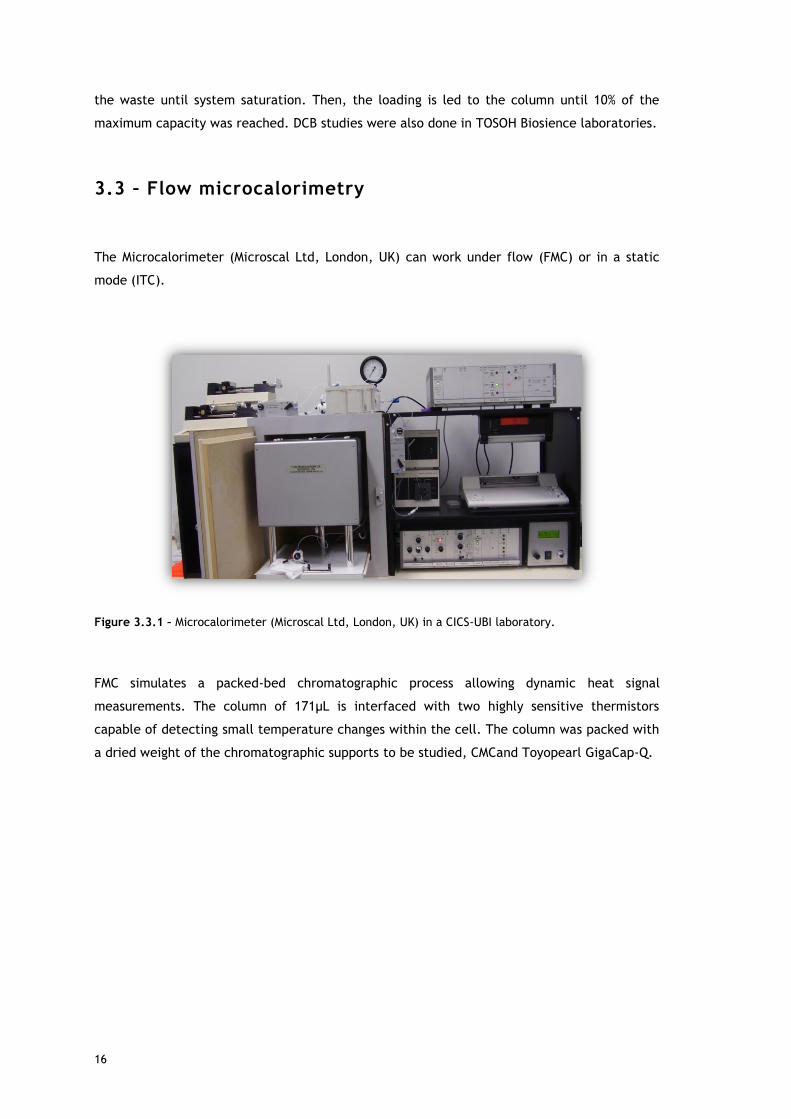
The Microcalorimeter (Microscal Ltd, London, UK) can work under flow (FMC) or in a static
mode (ITC).
Figure 3.3.1 – Microcalorimeter (Microscal Ltd, London, UK) in a CICS-UBI laboratory.
FMC simulates a packed-bed chromatographic process allowing dynamic heat signal
measurements. The column of 171µL is interfaced with two highly sensitive thermistors
capable of detecting small temperature changes within the cell. The column was packed with
a dried weight of the chromatographic supports to be studied, CMCand Toyopearl GigaCap-Q.
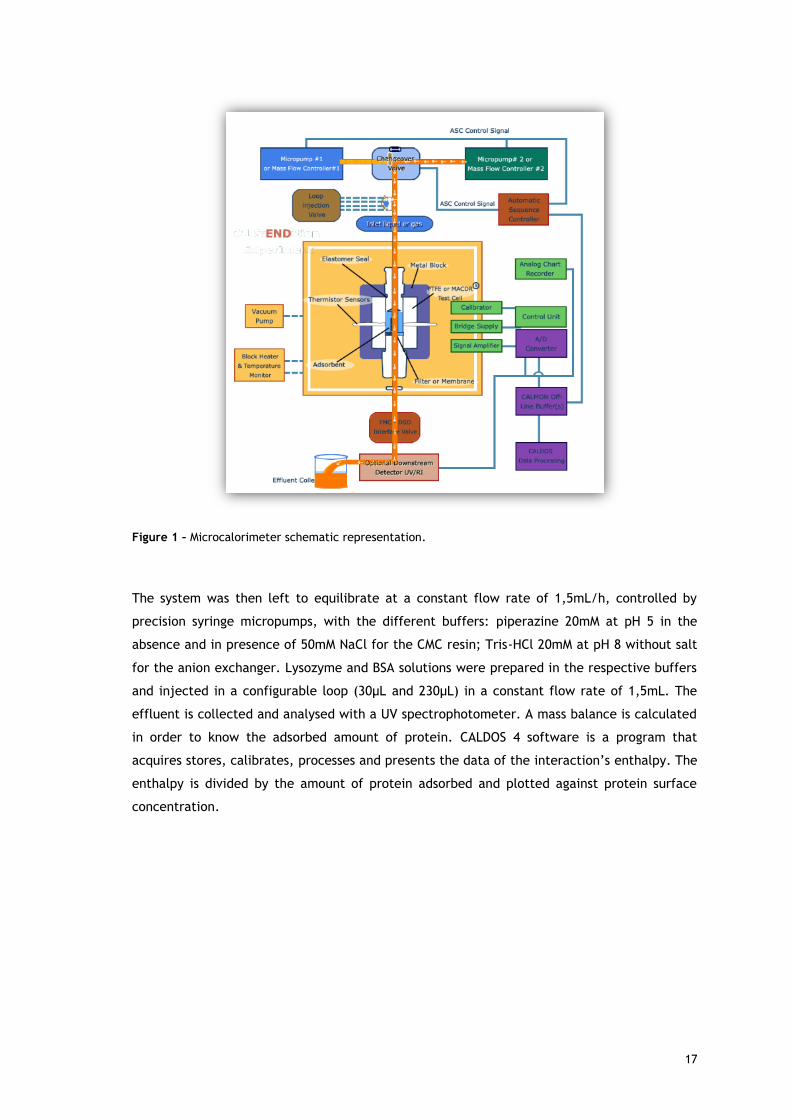
17
Figure 1 – Microcalorimeter schematic representation.
The system was then left to equilibrate at a constant flow rate of 1,5mL/h, controlled by
precision syringe micropumps, with the different buffers: piperazine 20mM at pH 5 in the
absence and in presence of 50mM NaCl for the CMC resin; Tris-HCl 20mM at pH 8 without salt
for the anion exchanger. Lysozyme and BSA solutions were prepared in the respective buffers
and injected in a configurable loop (30µL and 230µL) in a constant flow rate of 1,5mL. The
effluent is collected and analysed with a UV spectrophotometer. A mass balance is calculated
in order to know the adsorbed amount of protein. CALDOS 4 software is a program that
acquires stores, calibrates, processes and presents the data of the interaction’s enthalpy. The
enthalpy is divided by the amount of protein adsorbed and plotted against protein surface
concentration.

18
19
Chapter 4 – Discussion
4.1 – Static binding capacities for lysozyme and BSA
adsorption onto ion-exchange resins at selected pH and
different salt conditions
The study of adsorption isotherms is essential for the purpose of this work (understanding ion
exhange adsorption mechanisms). So, isotherm measurements for lysozyme (Lys) adsorption
onto a strong cation exchanger and bovine serum albumin (BSA) onto a weak and a strong
anion exchanger were performed.
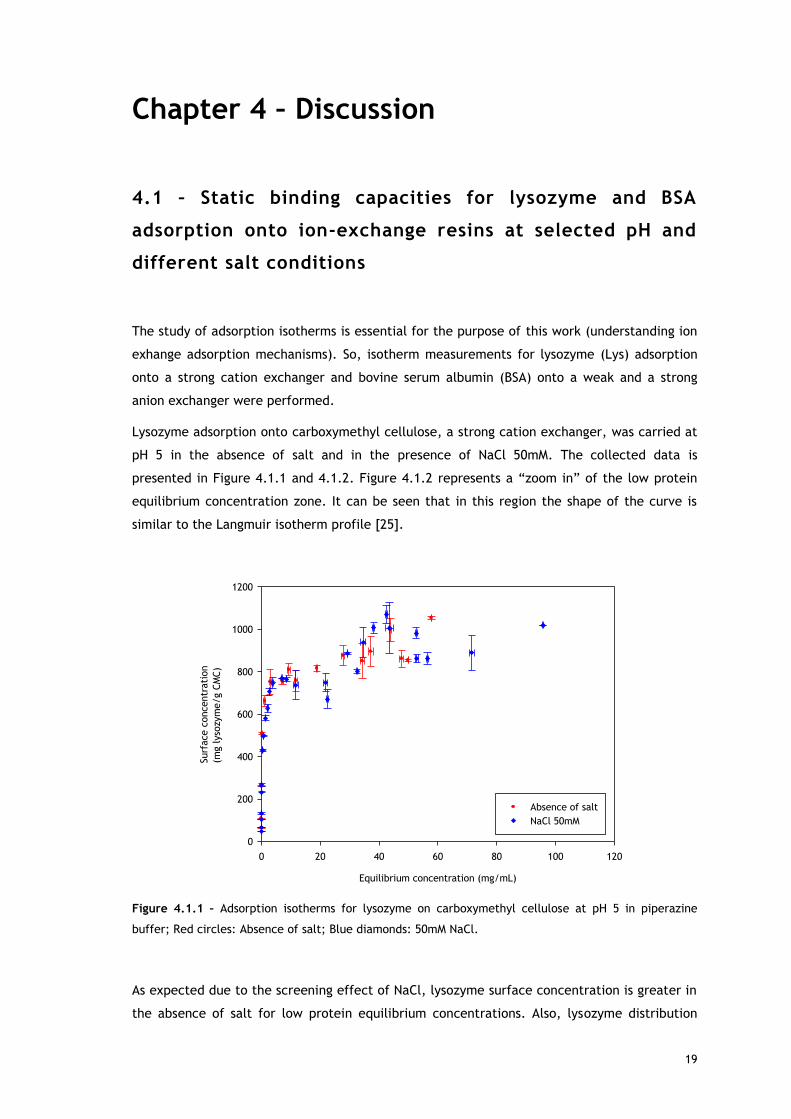
Lysozyme adsorption onto carboxymethyl cellulose, a strong cation exchanger, was carried at
pH 5 in the absence of salt and in the presence of NaCl 50mM. The collected data is
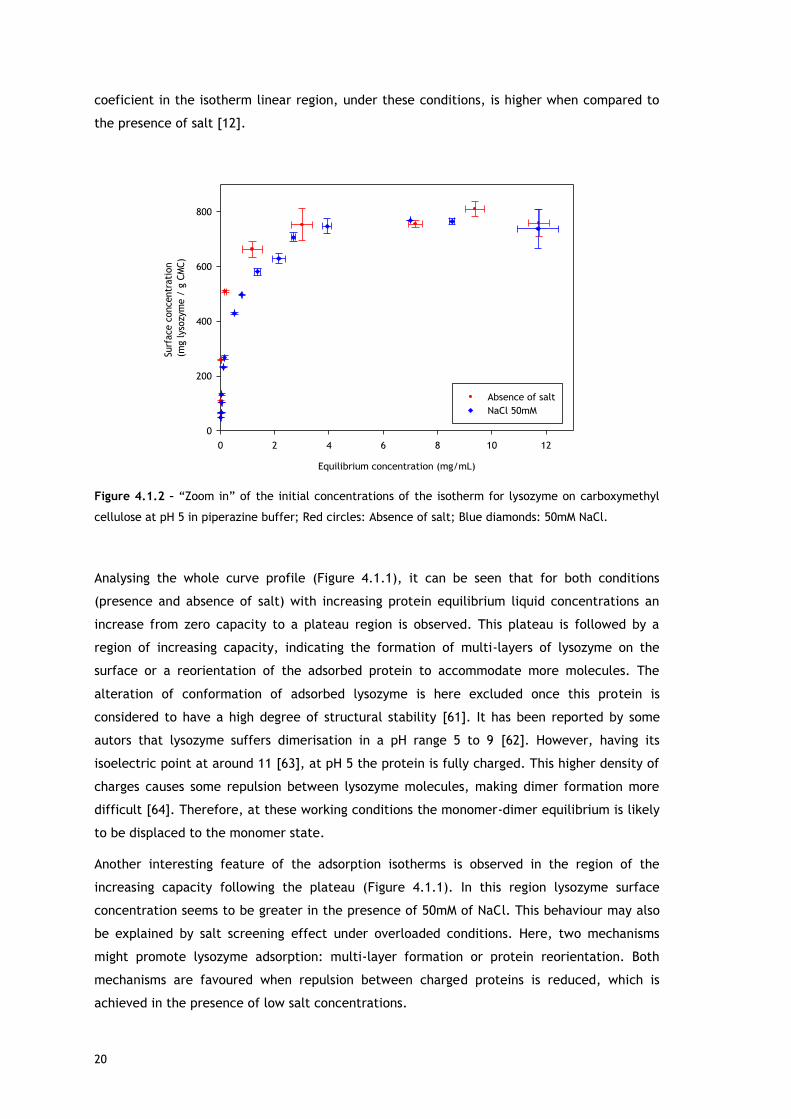
presented in Figure 4.1.1 and 4.1.2. Figure 4.1.2 represents a “zoom in” of the low protein
equilibrium concentration zone. It can be seen that in this region the shape of the curve is
similar to the Langmuir isotherm profile [25].
Equilibrium concentration (mg/mL)
0 20 40 60 80 100 120
Surf
ace c
oncentr
ati
on
(mg lyso
zym
e/g C
MC)
0
200
400
600
800
1000
1200
Absence of salt
NaCl 50mM
Figure 4.1.1 – Adsorption isotherms for lysozyme on carboxymethyl cellulose at pH 5 in piperazine
buffer; Red circles: Absence of salt; Blue diamonds: 50mM NaCl.
As expected due to the screening effect of NaCl, lysozyme surface concentration is greater in
the absence of salt for low protein equilibrium concentrations. Also, lysozyme distribution
20
coeficient in the isotherm linear region, under these conditions, is higher when compared to
the presence of salt [12].
Equilibrium concentration (mg/mL)
0 2 4 6 8 10 12
Surf
ace
conce
ntr
ati
on
(mg lys
ozy
me /
g C
MC)
0
200
400
600
800
Absence of salt
NaCl 50mM
Figure 4.1.2 – “Zoom in” of the initial concentrations of the isotherm for lysozyme on carboxymethyl
cellulose at pH 5 in piperazine buffer; Red circles: Absence of salt; Blue diamonds: 50mM NaCl.
Analysing the whole curve profile (Figure 4.1.1), it can be seen that for both conditions
(presence and absence of salt) with increasing protein equilibrium liquid concentrations an
increase from zero capacity to a plateau region is observed. This plateau is followed by a
region of increasing capacity, indicating the formation of multi-layers of lysozyme on the
surface or a reorientation of the adsorbed protein to accommodate more molecules. The
alteration of conformation of adsorbed lysozyme is here excluded once this protein is
considered to have a high degree of structural stability [61]. It has been reported by some
autors that lysozyme suffers dimerisation in a pH range 5 to 9 [62]. However, having its
isoelectric point at around 11 [63], at pH 5 the protein is fully charged. This higher density of
charges causes some repulsion between lysozyme molecules, making dimer formation more
difficult [64]. Therefore, at these working conditions the monomer-dimer equilibrium is likely
to be displaced to the monomer state.
Another interesting feature of the adsorption isotherms is observed in the region of the
increasing capacity following the plateau (Figure 4.1.1). In this region lysozyme surface
concentration seems to be greater in the presence of 50mM of NaCl. This behaviour may also
be explained by salt screening effect under overloaded conditions. Here, two mechanisms
might promote lysozyme adsorption: multi-layer formation or protein reorientation. Both
mechanisms are favoured when repulsion between charged proteins is reduced, which is
achieved in the presence of low salt concentrations.
21
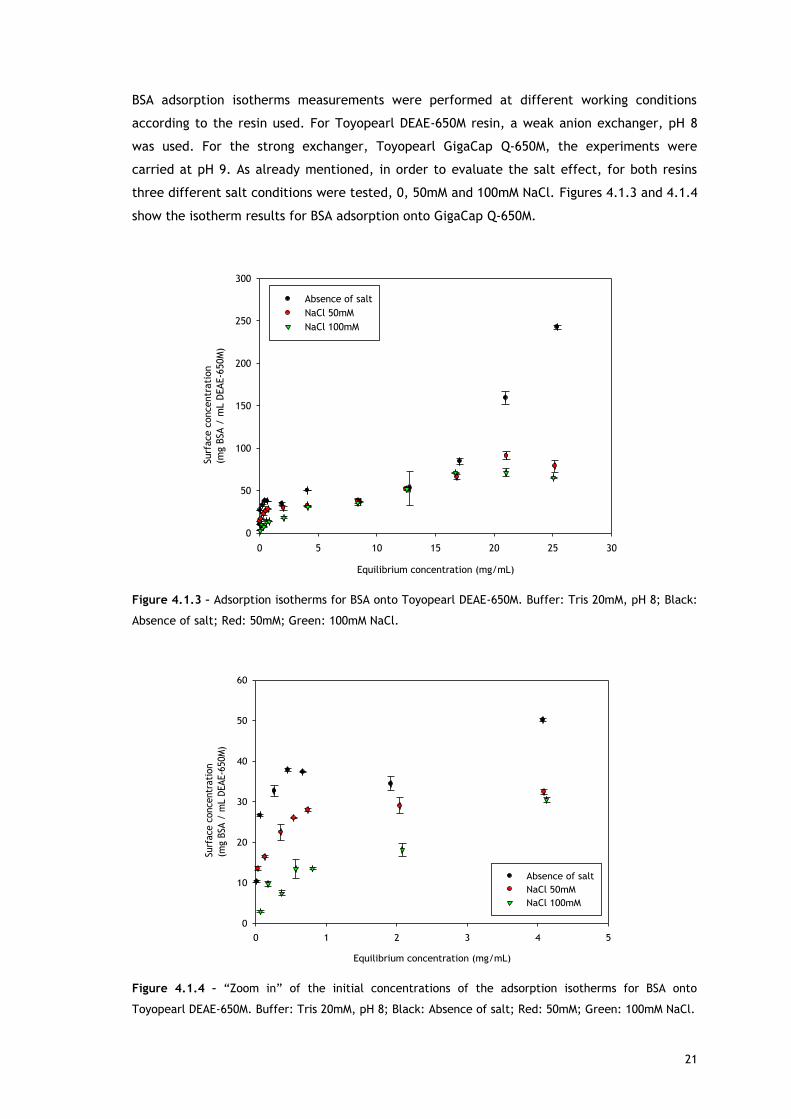
BSA adsorption isotherms measurements were performed at different working conditions
according to the resin used. For Toyopearl DEAE-650M resin, a weak anion exchanger, pH 8
was used. For the strong exchanger, Toyopearl GigaCap Q-650M, the experiments were
carried at pH 9. As already mentioned, in order to evaluate the salt effect, for both resins
three different salt conditions were tested, 0, 50mM and 100mM NaCl. Figures 4.1.3 and 4.1.4
show the isotherm results for BSA adsorption onto GigaCap Q-650M.
Equilibrium concentration (mg/mL)
0 5 10 15 20 25 30
Surf
ace c
oncentr
ati
on
(mg B
SA /
mL D
EAE-6
50M
)
0
50
100
150
200
250
300
Absence of salt
NaCl 50mM
NaCl 100mM
Figure 4.1.3 – Adsorption isotherms for BSA onto Toyopearl DEAE-650M. Buffer: Tris 20mM, pH 8; Black:
Absence of salt; Red: 50mM; Green: 100mM NaCl.
Equilibrium concentration (mg/mL)
0 1 2 3 4 5
Surf
ace
conce
ntr
ati
on
(mg B
SA /
mL D
EAE-6
50M
)
0
10
20
30
40
50
60
Absence of salt
NaCl 50mM
NaCl 100mM
Figure 4.1.4 – “Zoom in” of the initial concentrations of the adsorption isotherms for BSA onto
Toyopearl DEAE-650M. Buffer: Tris 20mM, pH 8; Black: Absence of salt; Red: 50mM; Green: 100mM NaCl.
22
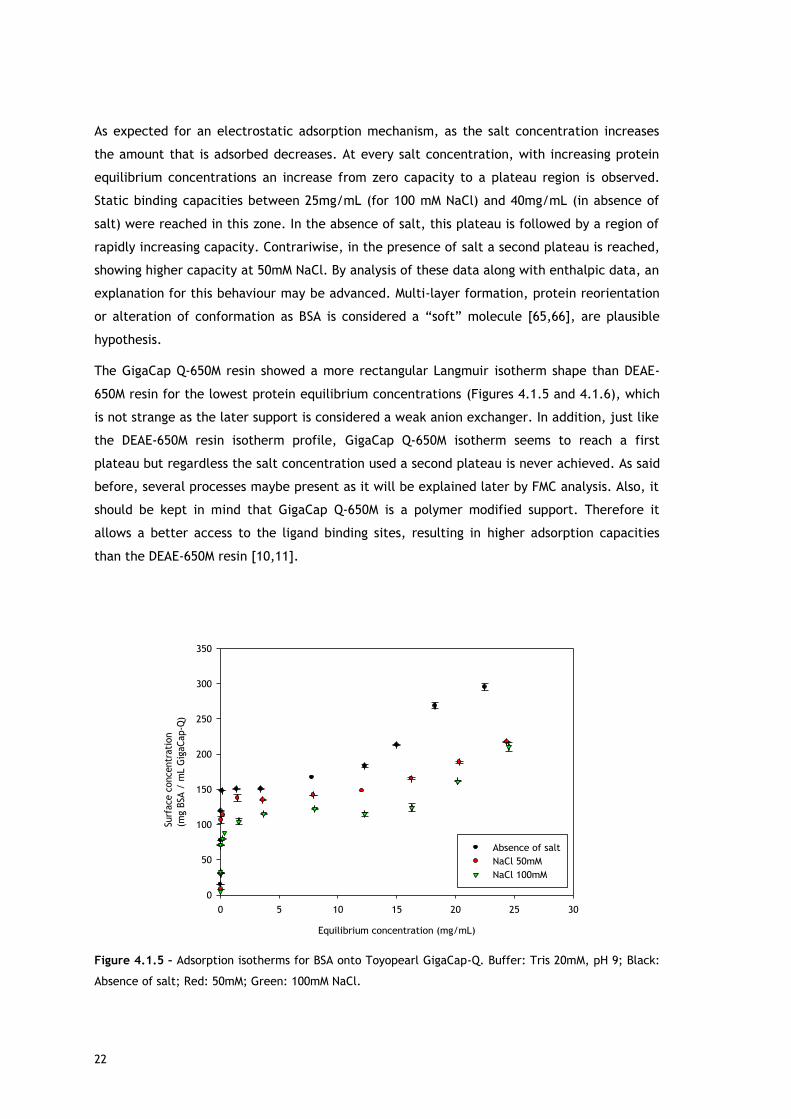
As expected for an electrostatic adsorption mechanism, as the salt concentration increases
the amount that is adsorbed decreases. At every salt concentration, with increasing protein
equilibrium concentrations an increase from zero capacity to a plateau region is observed.
Static binding capacities between 25mg/mL (for 100 mM NaCl) and 40mg/mL (in absence of
salt) were reached in this zone. In the absence of salt, this plateau is followed by a region of
rapidly increasing capacity. Contrariwise, in the presence of salt a second plateau is reached,
showing higher capacity at 50mM NaCl. By analysis of these data along with enthalpic data, an
explanation for this behaviour may be advanced. Multi-layer formation, protein reorientation
or alteration of conformation as BSA is considered a “soft” molecule [65,66], are plausible
hypothesis.
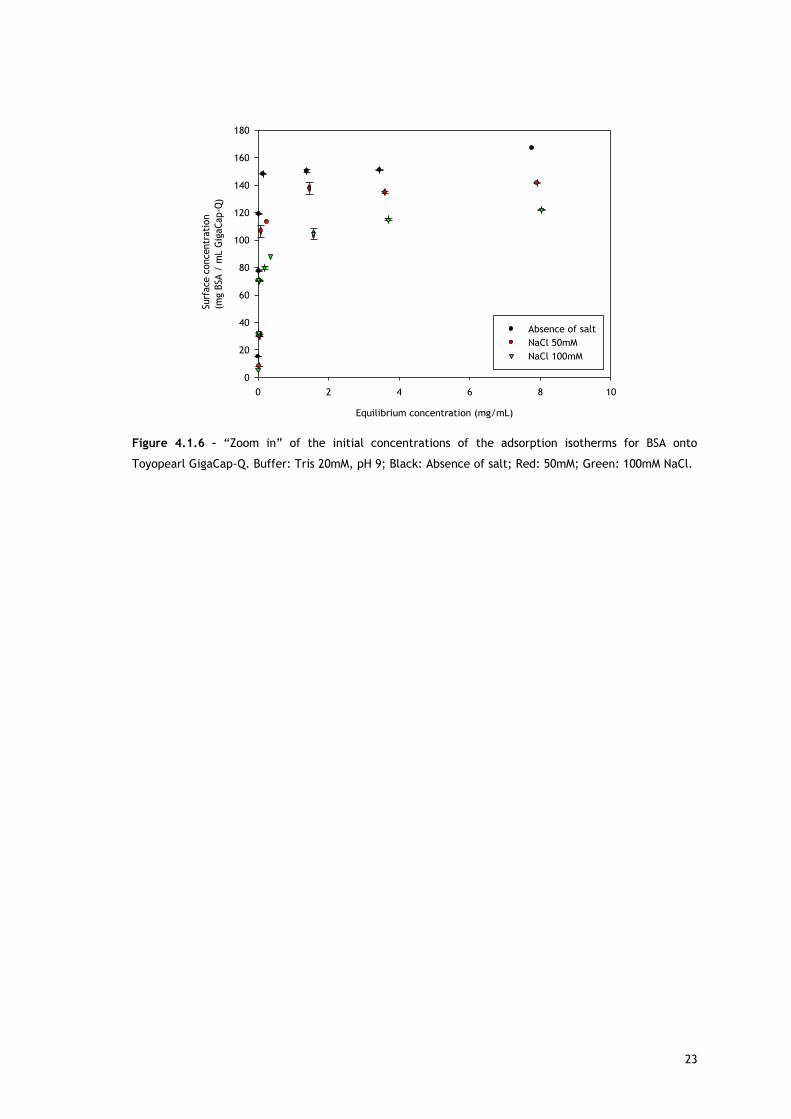
The GigaCap Q-650M resin showed a more rectangular Langmuir isotherm shape than DEAE-
650M resin for the lowest protein equilibrium concentrations (Figures 4.1.5 and 4.1.6), which
is not strange as the later support is considered a weak anion exchanger. In addition, just like
the DEAE-650M resin isotherm profile, GigaCap Q-650M isotherm seems to reach a first
plateau but regardless the salt concentration used a second plateau is never achieved. As said
before, several processes maybe present as it will be explained later by FMC analysis. Also, it
should be kept in mind that GigaCap Q-650M is a polymer modified support. Therefore it
allows a better access to the ligand binding sites, resulting in higher adsorption capacities
than the DEAE-650M resin [10,11].
Equilibrium concentration (mg/mL)
0 5 10 15 20 25 30
Surf
ace
conce
ntr
ati
on
(mg B
SA /
mL G
igaCap-Q
)
0
50
100
150
200
250
300
350
Absence of salt
NaCl 50mM
NaCl 100mM
Figure 4.1.5 – Adsorption isotherms for BSA onto Toyopearl GigaCap-Q. Buffer: Tris 20mM, pH 9; Black:
Absence of salt; Red: 50mM; Green: 100mM NaCl.
23
Equilibrium concentration (mg/mL)
0 2 4 6 8 10
Surf
ace c
oncentr
ati
on
(mg B
SA /
mL G
igaCap-Q
)
0
20
40
60
80
100
120
140
160
180
Absence of salt
NaCl 50mM
NaCl 100mM
Figure 4.1.6 – “Zoom in” of the initial concentrations of the adsorption isotherms for BSA onto
Toyopearl GigaCap-Q. Buffer: Tris 20mM, pH 9; Black: Absence of salt; Red: 50mM; Green: 100mM NaCl.
24
4.2 – Dynamic binding capacities for BSA adsorption onto
anion exchange resins at different pH and salt conditions
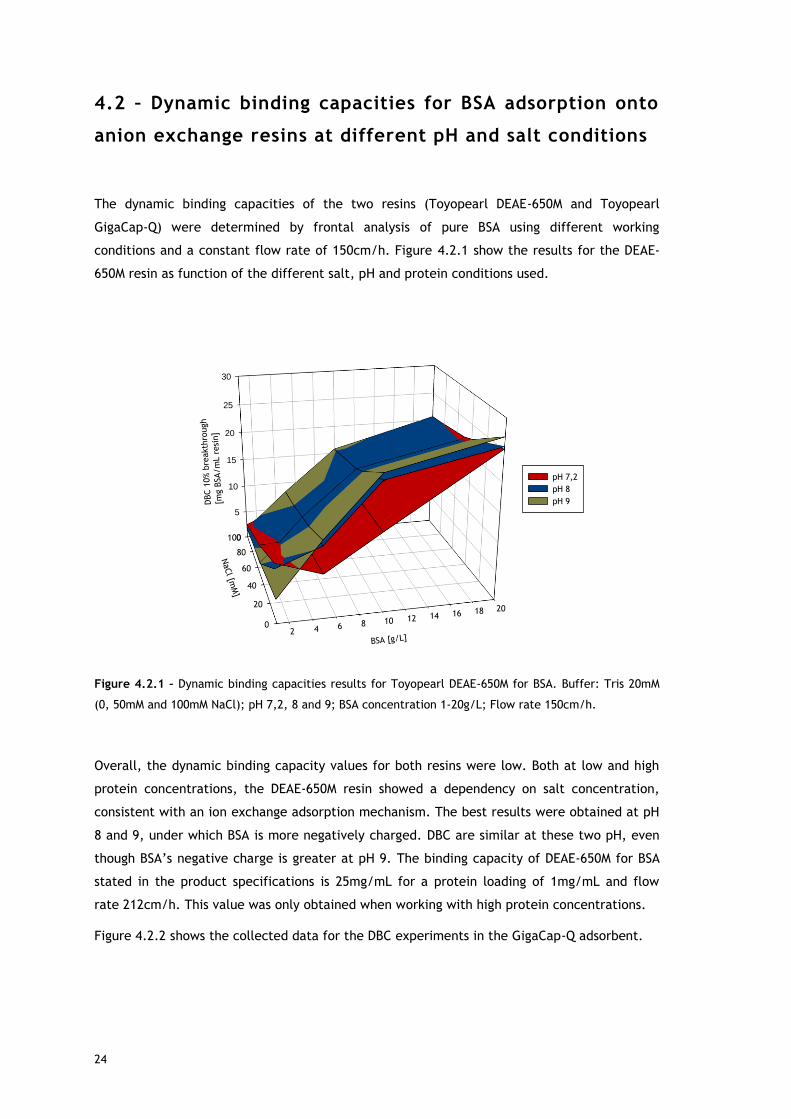
The dynamic binding capacities of the two resins (Toyopearl DEAE-650M and Toyopearl
GigaCap-Q) were determined by frontal analysis of pure BSA using different working
conditions and a constant flow rate of 150cm/h. Figure 4.2.1 show the results for the DEAE-
650M resin as function of the different salt, pH and protein conditions used.
0
5
10
15
20
25
30
2 4 6 8 10 12 14 16 18 20
0
20
40
60
80
100
DBC 1
0% b
reakth
rough
[mg B
SA/m
L r
esi
n]
BSA [g/L]
NaCl [m
M]
pH 7,2
pH 8
pH 9
Figure 4.2.1 – Dynamic binding capacities results for Toyopearl DEAE-650M for BSA. Buffer: Tris 20mM
(0, 50mM and 100mM NaCl); pH 7,2, 8 and 9; BSA concentration 1-20g/L; Flow rate 150cm/h.
Overall, the dynamic binding capacity values for both resins were low. Both at low and high
protein concentrations, the DEAE-650M resin showed a dependency on salt concentration,
consistent with an ion exchange adsorption mechanism. The best results were obtained at pH
8 and 9, under which BSA is more negatively charged. DBC are similar at these two pH, even
though BSA’s negative charge is greater at pH 9. The binding capacity of DEAE-650M for BSA
stated in the product specifications is 25mg/mL for a protein loading of 1mg/mL and flow
rate 212cm/h. This value was only obtained when working with high protein concentrations.
Figure 4.2.2 shows the collected data for the DBC experiments in the GigaCap-Q adsorbent.
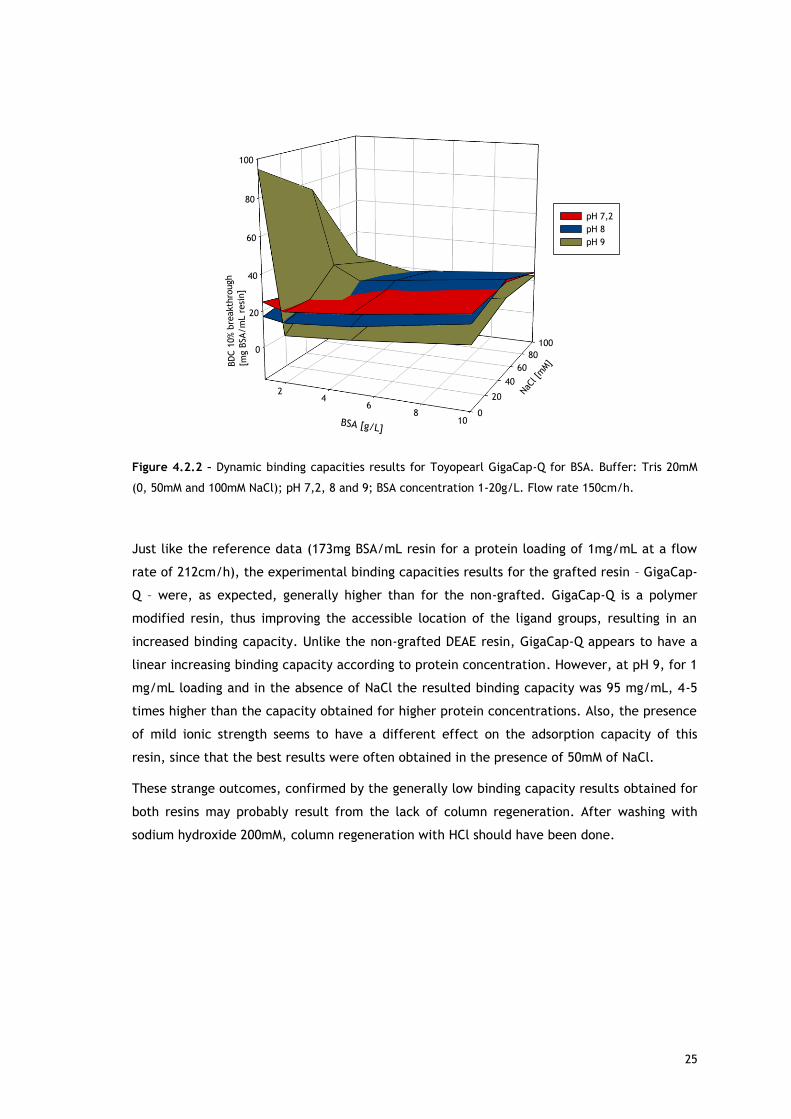
25
0
20
40
60
80
100
24
68
100
20
40
60
80
100
BD
C 1
0% b
reakth
rough
[mg B
SA/m
L r
esi
n]
BSA [g/L]
NaC
l [m
M]
pH 7,2
pH 8
pH 9
Figure 4.2.2 – Dynamic binding capacities results for Toyopearl GigaCap-Q for BSA. Buffer: Tris 20mM
(0, 50mM and 100mM NaCl); pH 7,2, 8 and 9; BSA concentration 1-20g/L. Flow rate 150cm/h.
Just like the reference data (173mg BSA/mL resin for a protein loading of 1mg/mL at a flow
rate of 212cm/h), the experimental binding capacities results for the grafted resin – GigaCap-
Q – were, as expected, generally higher than for the non-grafted. GigaCap-Q is a polymer
modified resin, thus improving the accessible location of the ligand groups, resulting in an
increased binding capacity. Unlike the non-grafted DEAE resin, GigaCap-Q appears to have a
linear increasing binding capacity according to protein concentration. However, at pH 9, for 1
mg/mL loading and in the absence of NaCl the resulted binding capacity was 95 mg/mL, 4-5
times higher than the capacity obtained for higher protein concentrations. Also, the presence
of mild ionic strength seems to have a different effect on the adsorption capacity of this
resin, since that the best results were often obtained in the presence of 50mM of NaCl.
These strange outcomes, confirmed by the generally low binding capacity results obtained for
both resins may probably result from the lack of column regeneration. After washing with
sodium hydroxide 200mM, column regeneration with HCl should have been done.
26
4.3 – Microcalorimetry to investigate the surface
phenomena
As already stated, overall adsorption in ion exchange chromatography is expected to be an
exothermic process [9]. However, the adsorption mechanism of IEC is more complex, since
there are several kinds of interactions that can occur, resulting in endothermic heats.
On one hand, ion exchange chromatography is based on electrostatic interactions between
the stationary phase and the oppositely charged target molecule. This attraction leads to
energy releasing, making IEC adsorption an exothermic interaction. On the other hand,
endothermic phenomena can also occur. Among the sources for endothermic heats there are
repulsive interactions between adsorbed molecules, repulsive interactions between protein
surface hydrophobic groups and adsorbent surface hydrophilic moieties, repulsive interactions
between like charge groups on the protein surface and on the adsorbent surface, water
release from adsorbent’s and protein’s surface, protein conformational changes and protein
reorientation on the surface [2].
This work was performed in order to understand Lys and BSA adsorption onto different ion
exchangers and to check the effect of salt in a specific pH and for a wide range of protein
concentrations; from the linear zone to oversaturation.
Starting with lysozyme adsorption onto CMC, as already described in the Experimental
section, because of the limitations with lysozyme solubility, two different loops (30µL and
230µL) were used in order to reach higher protein surface concentrations. Despite the
difference in the volume of the loop the flow rate was always kept constant at 1,5mL/h,
resulting in differences in the residence time of the molecules in the system. Thus, the
results have to be discussed according to loop used as it will be explained later.
In the experiments performed at pH 5 in piperazine buffer using the 30µL loop, lysozyme
initial concentration varied in the range 20-320mg/mL in the no salted buffer and 30-
350mg/mL in the presence of 50mM of NaCl. Figures 4.3.1 and 4.3.2 show the heat signal
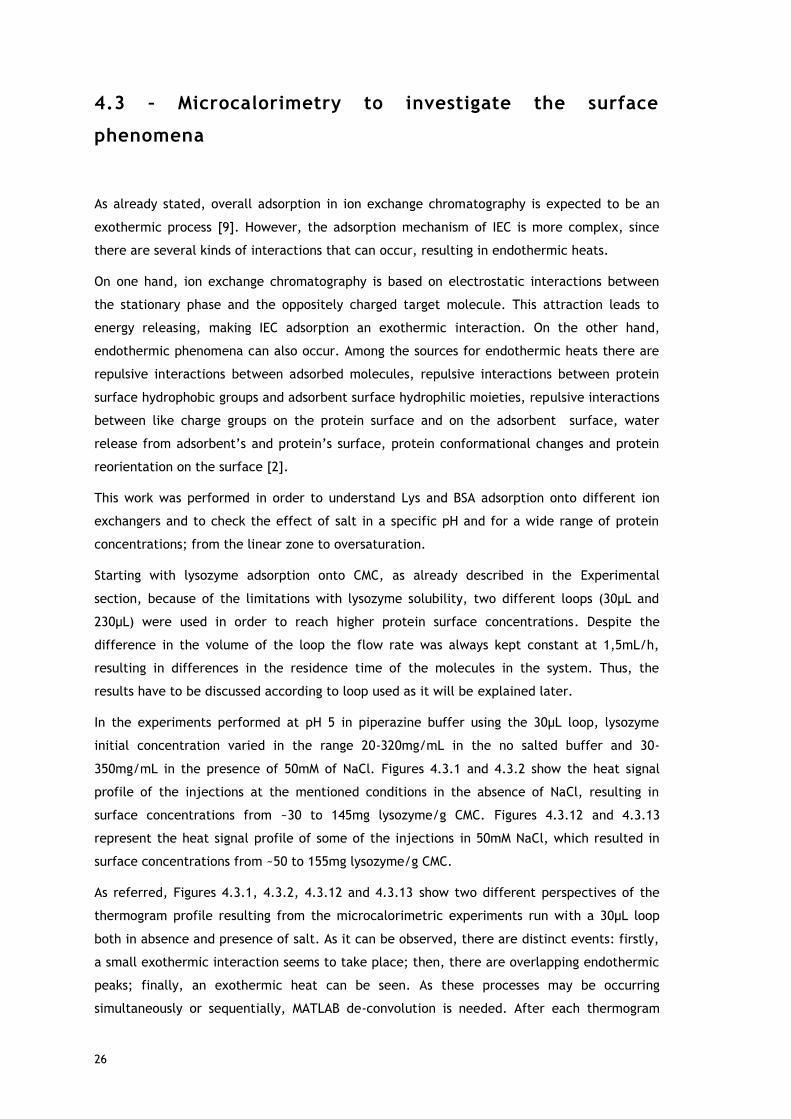
profile of the injections at the mentioned conditions in the absence of NaCl, resulting in
surface concentrations from ~30 to 145mg lysozyme/g CMC. Figures 4.3.12 and 4.3.13
represent the heat signal profile of some of the injections in 50mM NaCl, which resulted in
surface concentrations from ~50 to 155mg lysozyme/g CMC.
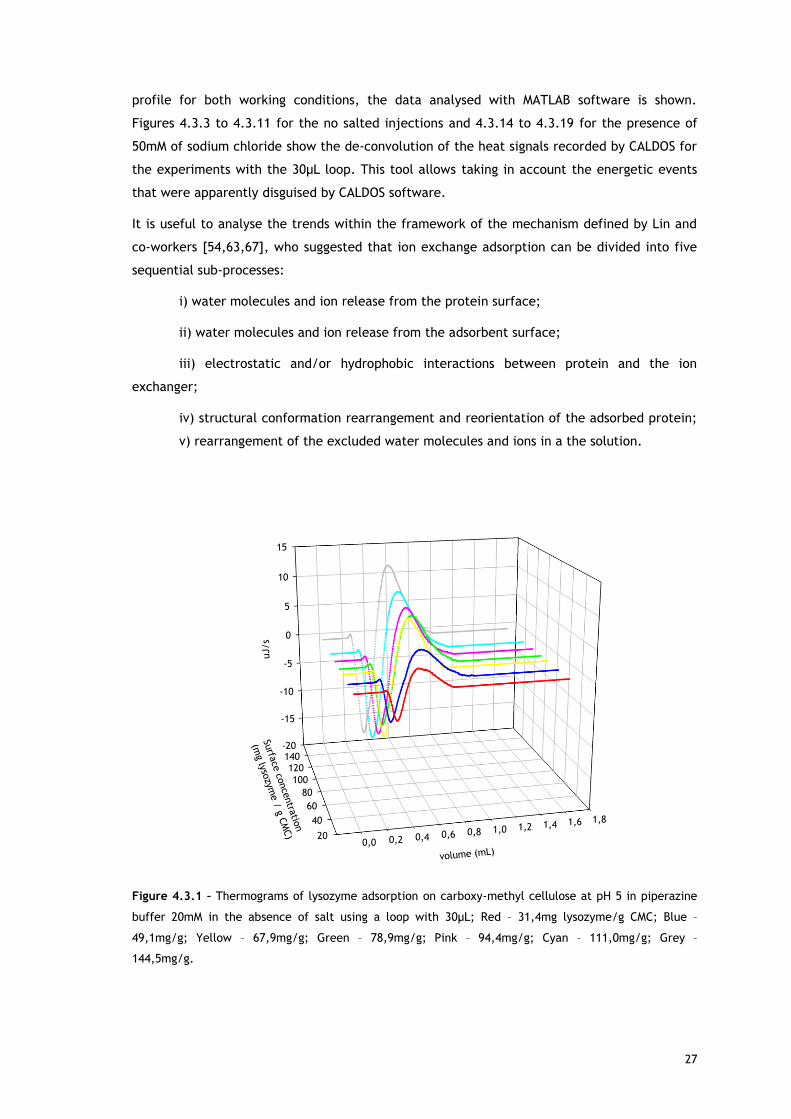
As referred, Figures 4.3.1, 4.3.2, 4.3.12 and 4.3.13 show two different perspectives of the
thermogram profile resulting from the microcalorimetric experiments run with a 30µL loop
both in absence and presence of salt. As it can be observed, there are distinct events: firstly,
a small exothermic interaction seems to take place; then, there are overlapping endothermic
peaks; finally, an exothermic heat can be seen. As these processes may be occurring
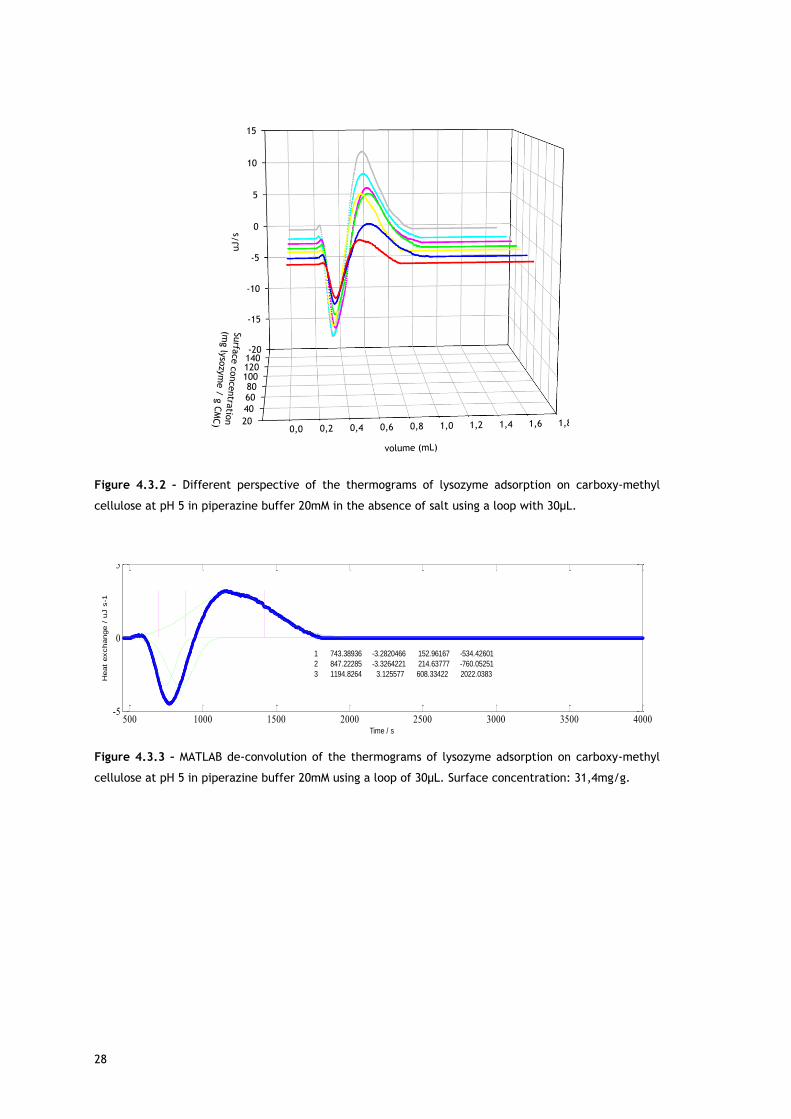
simultaneously or sequentially, MATLAB de-convolution is needed. After each thermogram
27
profile for both working conditions, the data analysed with MATLAB software is shown.
Figures 4.3.3 to 4.3.11 for the no salted injections and 4.3.14 to 4.3.19 for the presence of
50mM of sodium chloride show the de-convolution of the heat signals recorded by CALDOS for
the experiments with the 30µL loop. This tool allows taking in account the energetic events
that were apparently disguised by CALDOS software.
It is useful to analyse the trends within the framework of the mechanism defined by Lin and
co-workers [54,63,67], who suggested that ion exchange adsorption can be divided into five
sequential sub-processes:
i) water molecules and ion release from the protein surface;
ii) water molecules and ion release from the adsorbent surface;
iii) electrostatic and/or hydrophobic interactions between protein and the ion
exchanger;
iv) structural conformation rearrangement and reorientation of the adsorbed protein;
v) rearrangement of the excluded water molecules and ions in a the solution.
-20
-15
-10
-5
0
5
10
15
0,0 0,2 0,4 0,6 0,8 1,0 1,2 1,4 1,6 1,8
20
40
60
80
100
120140
uJ/s
volume (mL)
Surfa
ce co
nce
ntra
tion
(mg lyso
zyme /
g CM
C)
Figure 4.3.1 – Thermograms of lysozyme adsorption on carboxy-methyl cellulose at pH 5 in piperazine
buffer 20mM in the absence of salt using a loop with 30µL; Red – 31,4mg lysozyme/g CMC; Blue –
49,1mg/g; Yellow – 67,9mg/g; Green – 78,9mg/g; Pink – 94,4mg/g; Cyan – 111,0mg/g; Grey –
144,5mg/g.
28
-20
-15
-10
-5
0
5
10
15
0,0 0,2 0,4 0,6 0,8 1,0 1,2 1,4 1,6 1,820
40
6080
100120140
uJ/s
volume (mL)
Surfa
ce c
oncentra
tion
(mg ly
sozy
me /
g C
MC)
Figure 4.3.2 – Different perspective of the thermograms of lysozyme adsorption on carboxy-methyl
cellulose at pH 5 in piperazine buffer 20mM in the absence of salt using a loop with 30µL.
Figure 4.3.3 – MATLAB de-convolution of the thermograms of lysozyme adsorption on carboxy-methyl
cellulose at pH 5 in piperazine buffer 20mM using a loop of 30µL. Surface concentration: 31,4mg/g.
500 1000 1500 2000 2500 3000 3500 4000-5
0
5
Time / s
1 743.38936 -3.2820466 152.96167 -534.42601
2 847.22285 -3.3264221 214.63777 -760.05251
3 1194.8264 3.125577 608.33422 2022.0383
Heat
exchange /
uJ s
-1
Pan Zoom
# Peaks
Shape
Extra
Re-fit
Custom
BG500 1000 1500 2000 2500 3000 3500 4000
-0.2
-0.15
-0.1
-0.05
0
0.05
0.1
0.15
0.2
Extra = 0.5 Peaks = 3 Shape = Gaussian Error = 1.6242%
29
Figure 4.3.4 – MATLAB de-convolution of the thermograms of lysozyme adsorption on carboxy-methyl
cellulose at pH 5 in piperazine buffer 20mM using a loop of 30µL. Surface concentration: 49,1mg/g
Figure 4.3.5 – MATLAB de-convolution of the thermograms of lysozyme adsorption on carboxy-methyl
cellulose at pH 5 in piperazine buffer 20mM using a loop of 30µL. Surface concentration: 67,9mg/g
Figure 4.3.6 – MATLAB de-convolution of the thermograms of lysozyme adsorption on carboxy-methyl
cellulose at pH 5 in piperazine buffer 20mM using a loop of 30µL. Surface concentration: 78,9mg/g
500 1000 1500 2000 2500 3000 3500 4000-8
-6
-4
-2
0
2
4
6
Vertical dotted lines indicate first guess peak positions
1 756.76759 -5.5717277 177.60083 -1053.394
2 920.29348 -4.5611439 315.45993 -1531.4924
3 1296.2229 4.5959015 822.73282 3997.6327
Heat
exchange /
uJ s
-1
Pan Zoom
# Peaks
Shape
Extra
Re-fit
Custom
BG500 1000 1500 2000 2500 3000 3500 4000
-0.2
-0.1
0
0.1
0.2
0.3
0.4
Extra = 0.5 Peaks = 3 Shape = Gaussian Error = 1.7632%
500 1000 1500 2000 2500 3000 3500 4000
-10
-5
0
5
10
Time / s
1 752.12058 -8.7112036 173.23121 -1606.4375
2 883.96537 -7.0478348 -274.44739 -2059.0396
3 1240.8113 7.8285152 678.89377 5646.5268
Heat
exchange /
uJ s
-1
Pan Zoom
# Peaks
Shape
Extra
Re-fit
Custom
BG500 1000 1500 2000 2500 3000 3500 4000
-0.4
-0.2
0
0.2
0.4
Extra = 0.5 Peaks = 3 Shape = Gaussian Error = 1.668%
500 1000 1500 2000 2500 3000 3500 4000-10
-5
0
5
10
Time / s
1 770.83238 -6.7554433 170.13749 -1223.5285
2 934.06262 -9.1551893 317.65199 -3095.7351
3 1338.1909 7.6017612 790.99541 6384.5927Heat
exchange /
uJ s
-1
Pan Zoom
# Peaks
Shape
Extra
Re-fit
Custom
BG500 1000 1500 2000 2500 3000 3500 4000
-0.2
-0.1
0
0.1
0.2
0.3
0.4
Extra = 0.5 Peaks = 3 Shape = Gaussian Error = 1.4296%
30
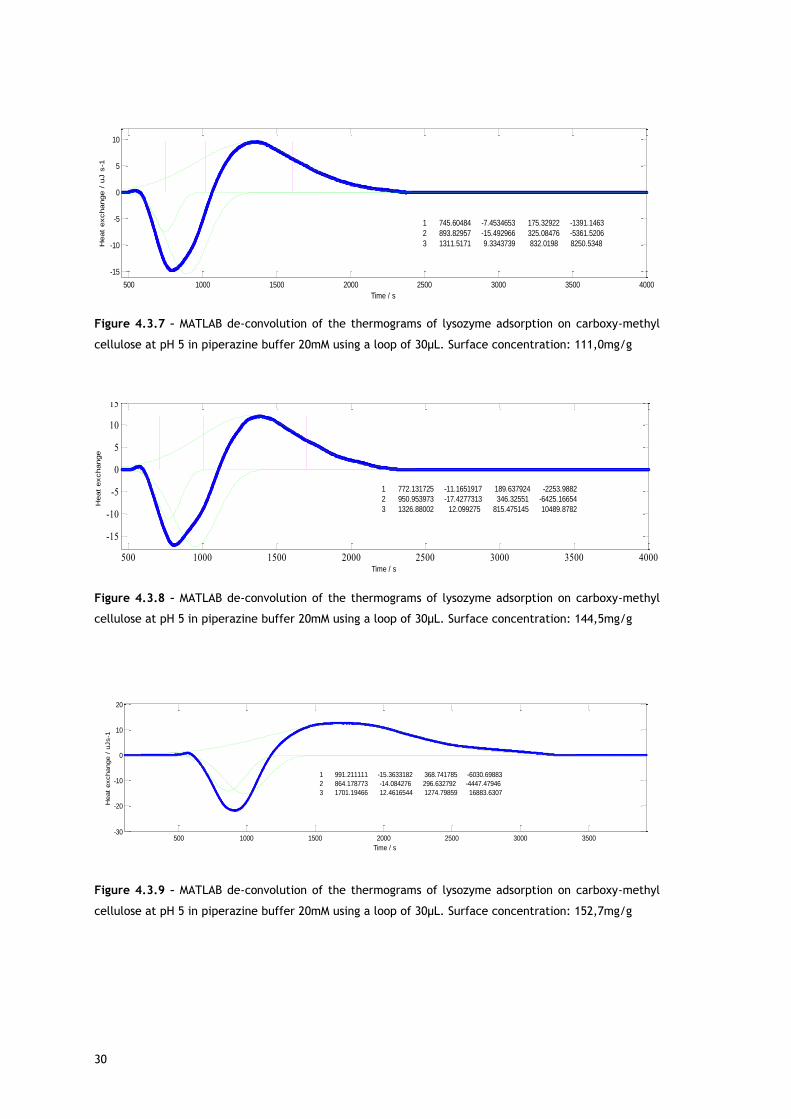
Figure 4.3.7 – MATLAB de-convolution of the thermograms of lysozyme adsorption on carboxy-methyl
cellulose at pH 5 in piperazine buffer 20mM using a loop of 30µL. Surface concentration: 111,0mg/g
Figure 4.3.8 – MATLAB de-convolution of the thermograms of lysozyme adsorption on carboxy-methyl
cellulose at pH 5 in piperazine buffer 20mM using a loop of 30µL. Surface concentration: 144,5mg/g
Figure 4.3.9 – MATLAB de-convolution of the thermograms of lysozyme adsorption on carboxy-methyl
cellulose at pH 5 in piperazine buffer 20mM using a loop of 30µL. Surface concentration: 152,7mg/g
500 1000 1500 2000 2500 3000 3500 4000
-15
-10
-5
0
5
10
Time / s
1 745.60484 -7.4534653 175.32922 -1391.1463
2 893.82957 -15.492966 325.08476 -5361.5206
3 1311.5171 9.3343739 832.0198 8250.5348Heat
exchange /
uJ s
-1
Pan Zoom
# Peaks
Shape
Extra
Re-fit
Custom
BG500 1000 1500 2000 2500 3000 3500 4000-0.4
-0.2
0
0.2
0.4
Extra = 0.5 Peaks = 3 Shape = Gaussian Error = 1.547%
500 1000 1500 2000 2500 3000 3500 4000
-15
-10
-5
0
5
10
15
Time / s
1 772.131725 -11.1651917 189.637924 -2253.9882
2 950.953973 -17.4277313 346.32551 -6425.16654
3 1326.88002 12.099275 815.475145 10489.8782
Heat
exchange
Pan Zoom
# Peaks
Shape
Extra
Re-fit
Custom
BG500 1000 1500 2000 2500 3000 3500 4000
-0.4
-0.2
0
0.2
0.4
0.6
0.8
Extra = 0.5 Peaks = 3 Shape = Gaussian Error = 1.4943%
500 1000 1500 2000 2500 3000 3500-30
-20
-10
0
10
20
Time / s
1 991.211111 -15.3633182 368.741785 -6030.69883
2 864.178773 -14.084276 296.632792 -4447.47946
3 1701.19466 12.4616544 1274.79859 16883.6307
Heat
exchange /
uJs-1
Pan Zoom
# Peaks
Shape
Extra
Re-fit
Custom
BG500 1000 1500 2000 2500 3000 3500
-0.6
-0.4
-0.2
0
0.2
0.4
0.6
0.8
Extra = 0.5 Peaks = 3 Shape = Gaussian Error = 2.7645%
31
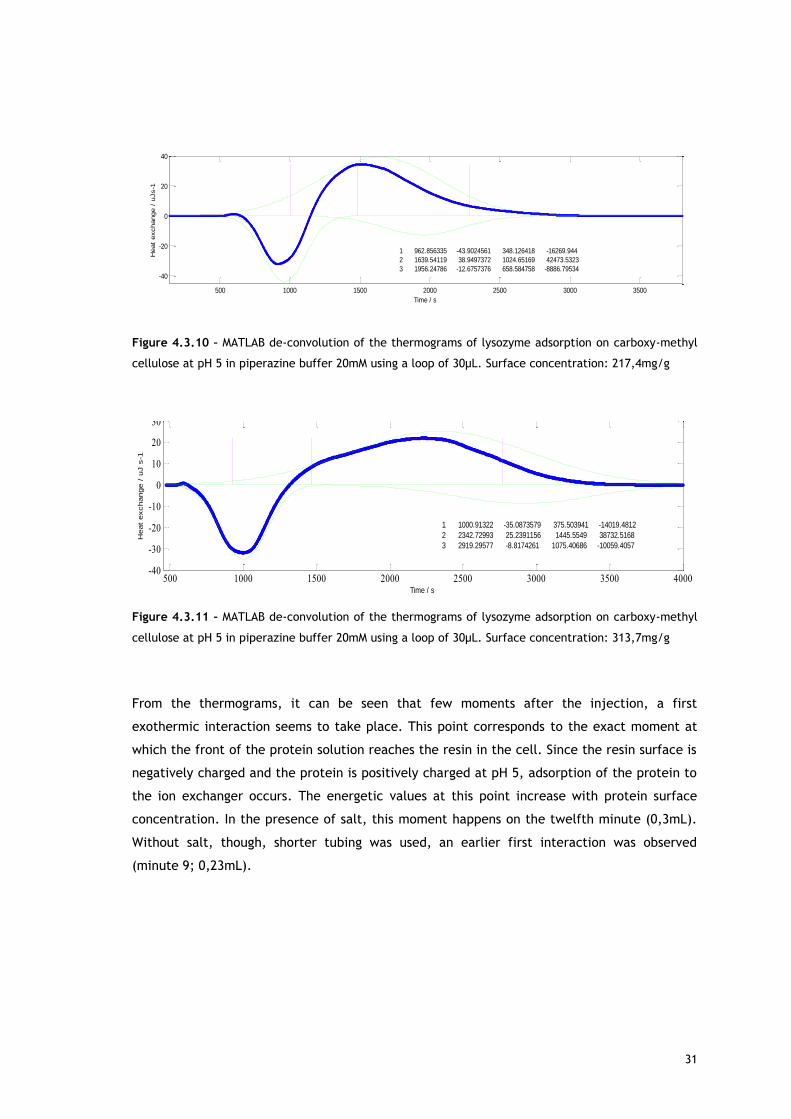
Figure 4.3.10 – MATLAB de-convolution of the thermograms of lysozyme adsorption on carboxy-methyl
cellulose at pH 5 in piperazine buffer 20mM using a loop of 30µL. Surface concentration: 217,4mg/g
Figure 4.3.11 – MATLAB de-convolution of the thermograms of lysozyme adsorption on carboxy-methyl
cellulose at pH 5 in piperazine buffer 20mM using a loop of 30µL. Surface concentration: 313,7mg/g
From the thermograms, it can be seen that few moments after the injection, a first
exothermic interaction seems to take place. This point corresponds to the exact moment at
which the front of the protein solution reaches the resin in the cell. Since the resin surface is
negatively charged and the protein is positively charged at pH 5, adsorption of the protein to
the ion exchanger occurs. The energetic values at this point increase with protein surface
concentration. In the presence of salt, this moment happens on the twelfth minute (0,3mL).
Without salt, though, shorter tubing was used, an earlier first interaction was observed
(minute 9; 0,23mL).
500 1000 1500 2000 2500 3000 3500
-40
-20
0
20
40
Time / s
1 962.856335 -43.9024561 348.126418 -16269.944
2 1639.54119 38.9497372 1024.65169 42473.5323
3 1956.24786 -12.6757376 658.584758 -8886.79534
Heat
exchange /
uJs-1
Pan Zoom
# Peaks
Shape
Extra
Re-fit
Custom
BG500 1000 1500 2000 2500 3000 3500
-1.5
-1
-0.5
0
0.5
1
1.5
Extra = 0.5 Peaks = 3 Shape = Gaussian Error = 1.5955%
500 1000 1500 2000 2500 3000 3500 4000-40
-30
-20
-10
0
10
20
30
Time / s
1 1000.91322 -35.0873579 375.503941 -14019.4812
2 2342.72993 25.2391156 1445.5549 38732.5168
3 2919.29577 -8.8174261 1075.40686 -10059.4057
Heat
exchange /
uJ s
-1
Pan Zoom
# Peaks
Shape
Extra
Re-fit
Custom
BG500 1000 1500 2000 2500 3000 3500 4000
-1.5
-1
-0.5
0
0.5
1
1.5
Extra = 0.5 Peaks = 3 Shape = Gaussian Error = 2.111%
32
-40
-30
-20
-10
0
10
20
30
0,00,5
1,01,5
2,02,5
40
60
80
100
120
140
uJ/s
volume (mL)
Surfa
ce co
nce
ntra
tion
(mg lyso
zyme /
g CM
C)
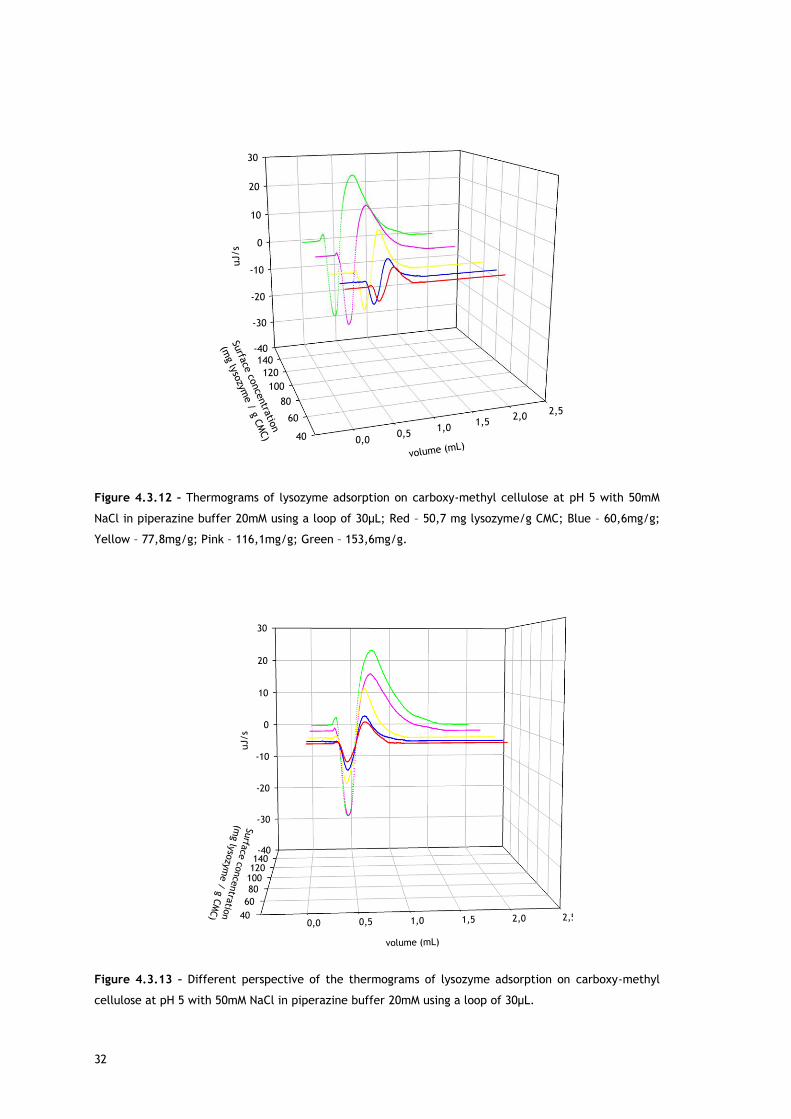
Figure 4.3.12 – Thermograms of lysozyme adsorption on carboxy-methyl cellulose at pH 5 with 50mM
NaCl in piperazine buffer 20mM using a loop of 30µL; Red – 50,7 mg lysozyme/g CMC; Blue – 60,6mg/g;
Yellow – 77,8mg/g; Pink – 116,1mg/g; Green – 153,6mg/g.
-40
-30
-20
-10
0
10
20
30
0,0 0,5 1,0 1,5 2,0 2,540
60
80100120140
uJ/s
volume (mL)
Surfa
ce c
once
ntra
tion
(mg lyso
zyme /
g C
MC)
Figure 4.3.13 – Different perspective of the thermograms of lysozyme adsorption on carboxy-methyl
cellulose at pH 5 with 50mM NaCl in piperazine buffer 20mM using a loop of 30µL.
33
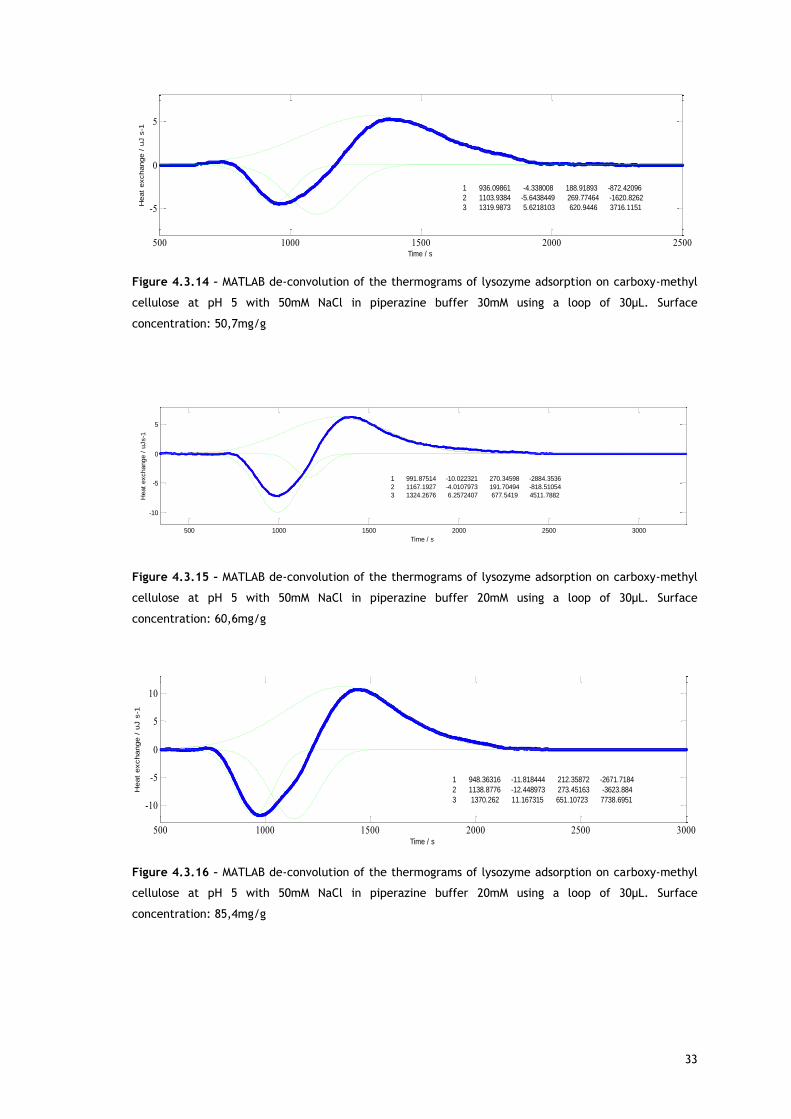
Figure 4.3.14 – MATLAB de-convolution of the thermograms of lysozyme adsorption on carboxy-methyl
cellulose at pH 5 with 50mM NaCl in piperazine buffer 30mM using a loop of 30µL. Surface
concentration: 50,7mg/g
Figure 4.3.15 – MATLAB de-convolution of the thermograms of lysozyme adsorption on carboxy-methyl
cellulose at pH 5 with 50mM NaCl in piperazine buffer 20mM using a loop of 30µL. Surface
concentration: 60,6mg/g
Figure 4.3.16 – MATLAB de-convolution of the thermograms of lysozyme adsorption on carboxy-methyl
cellulose at pH 5 with 50mM NaCl in piperazine buffer 20mM using a loop of 30µL. Surface
concentration: 85,4mg/g
500 1000 1500 2000 2500
-5
0
5
Time / s
1 936.09861 -4.338008 188.91893 -872.42096
2 1103.9384 -5.6438449 269.77464 -1620.8262
3 1319.9873 5.6218103 620.9446 3716.1151Heat
exchange /
uJ s
-1
Pan Zoom
# Peaks
Shape
Extra
Re-fit
Custom
BG0 500 1000 1500 2000 2500
-0.2
-0.1
0
0.1
0.2
Extra = 0.5 Peaks = 3 Shape = Gaussian Error = 1.2971%
500 1000 1500 2000 2500 3000
-10
-5
0
5
Time / s
1 991.87514 -10.022321 270.34598 -2884.3536
2 1167.1927 -4.0107973 191.70494 -818.51054
3 1324.2676 6.2572407 677.5419 4511.7882Heat
exchange /
uJs-1
Pan Zoom
# Peaks
Shape
Extra
Re-fit
Custom
BG500 1000 1500 2000 2500 3000
-0.4
-0.2
0
0.2
0.4
0.6
Extra = 0.5 Peaks = 3 Shape = Gaussian Error = 3.3515%
500 1000 1500 2000 2500 3000
-10
-5
0
5
10
Time / s
1 948.36316 -11.818444 212.35872 -2671.7184
2 1138.8776 -12.448973 273.45163 -3623.884
3 1370.262 11.167315 651.10723 7738.6951
Heat
exchange /
uJ s
-1
Pan Zoom
# Peaks
Shape
Extra
Re-fit
Custom
BG500 1000 1500 2000 2500 3000 3500 4000
-0.4
-0.3
-0.2
-0.1
0
0.1
0.2
0.3
0.4
Extra = 0.5 Peaks = 3 Shape = Gaussian Error = 1.4451%
34
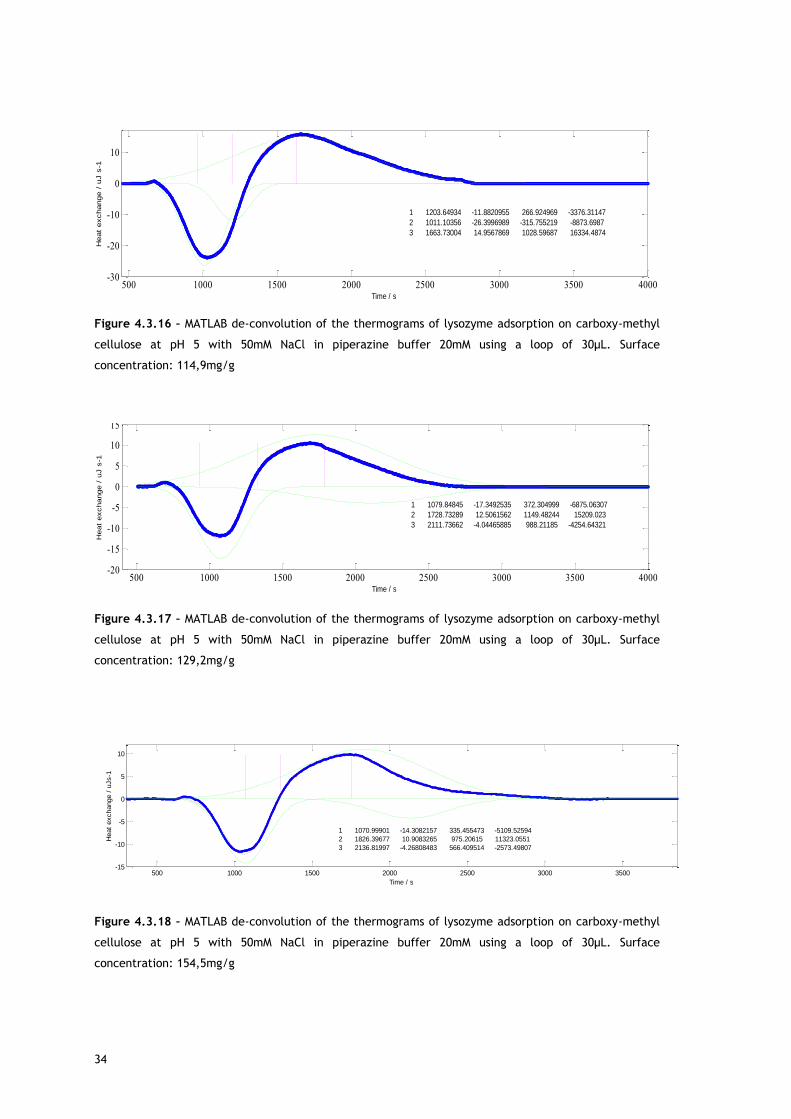
Figure 4.3.16 – MATLAB de-convolution of the thermograms of lysozyme adsorption on carboxy-methyl
cellulose at pH 5 with 50mM NaCl in piperazine buffer 20mM using a loop of 30µL. Surface
concentration: 114,9mg/g
Figure 4.3.17 – MATLAB de-convolution of the thermograms of lysozyme adsorption on carboxy-methyl
cellulose at pH 5 with 50mM NaCl in piperazine buffer 20mM using a loop of 30µL. Surface
concentration: 129,2mg/g
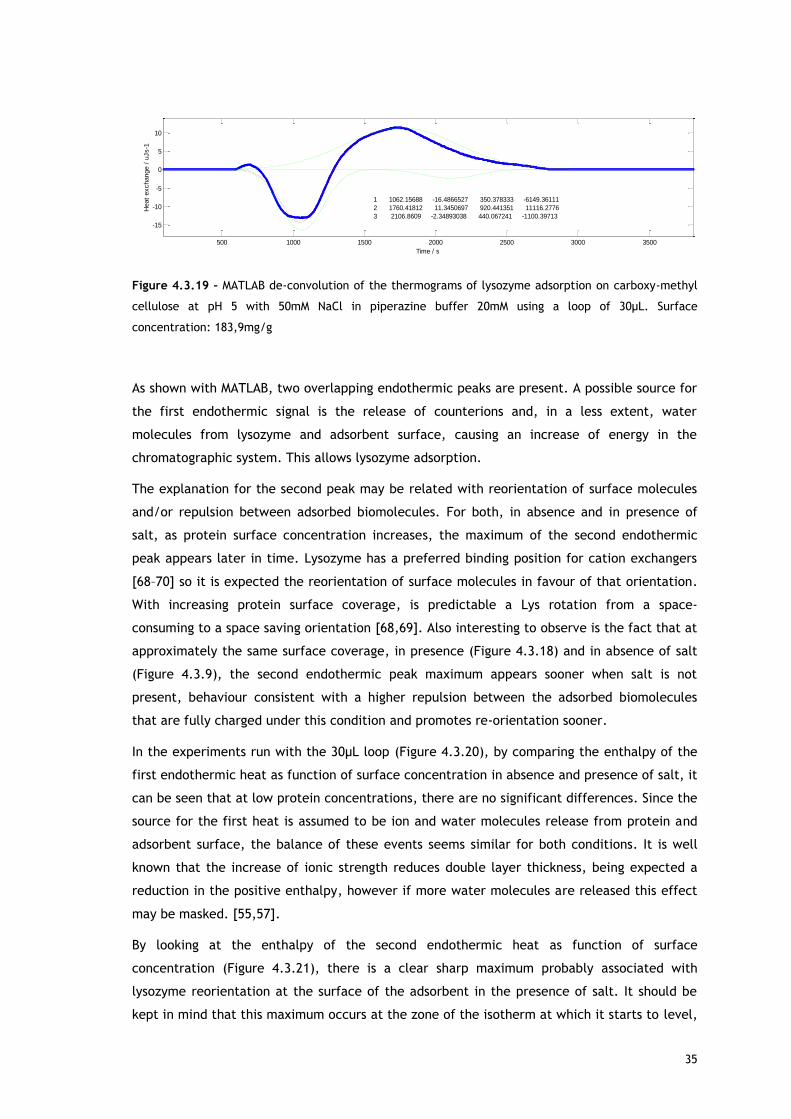
Figure 4.3.18 – MATLAB de-convolution of the thermograms of lysozyme adsorption on carboxy-methyl
cellulose at pH 5 with 50mM NaCl in piperazine buffer 20mM using a loop of 30µL. Surface
concentration: 154,5mg/g
500 1000 1500 2000 2500 3000 3500 4000-30
-20
-10
0
10
Time / s
1 1203.64934 -11.8820955 266.924969 -3376.31147
2 1011.10356 -26.3996989 -315.755219 -8873.6987
3 1663.73004 14.9567869 1028.59687 16334.4874
Heat
exchange /
uJ s
-1
Pan Zoom
# Peaks
Shape
Extra
Re-fit
Custom
BG500 1000 1500 2000 2500 3000 3500 4000-1
-0.5
0
0.5
Extra = 0.5 Peaks = 3 Shape = Gaussian Error = 2.3008%
500 1000 1500 2000 2500 3000 3500 4000-20
-15
-10
-5
0
5
10
15
Time / s
1 1079.84845 -17.3492535 372.304999 -6875.06307
2 1728.73289 12.5061562 1149.48244 15209.023
3 2111.73662 -4.04465885 988.21185 -4254.64321
Heat
exchange /
uJ s
-1
Pan Zoom
# Peaks
Shape
Extra
Re-fit
Custom
BG1000 1500 2000 2500 3000 3500 4000-20
-15
-10
-5
0
Extra = 0.5 Peaks = 3 Shape = Gaussian Error = 2.6328%
500 1000 1500 2000 2500 3000 3500-15
-10
-5
0
5
10
Time / s
1 1070.99901 -14.3082157 335.455473 -5109.52594
2 1826.39677 10.9083265 975.20615 11323.0551
3 2136.81997 -4.26808483 566.409514 -2573.49807
Heat
exchange /
uJs-1
Pan Zoom
# Peaks
Shape
Extra
Re-fit
Custom
BG500 1000 1500 2000 2500 3000 3500-12
-10
-8
-6
-4
-2
0
Extra = 0.5 Peaks = 3 Shape = Gaussian Error = 2.2122%
35
Figure 4.3.19 – MATLAB de-convolution of the thermograms of lysozyme adsorption on carboxy-methyl
cellulose at pH 5 with 50mM NaCl in piperazine buffer 20mM using a loop of 30µL. Surface
concentration: 183,9mg/g
As shown with MATLAB, two overlapping endothermic peaks are present. A possible source for
the first endothermic signal is the release of counterions and, in a less extent, water
molecules from lysozyme and adsorbent surface, causing an increase of energy in the
chromatographic system. This allows lysozyme adsorption.
The explanation for the second peak may be related with reorientation of surface molecules
and/or repulsion between adsorbed biomolecules. For both, in absence and in presence of
salt, as protein surface concentration increases, the maximum of the second endothermic
peak appears later in time. Lysozyme has a preferred binding position for cation exchangers
[68–70] so it is expected the reorientation of surface molecules in favour of that orientation.
With increasing protein surface coverage, is predictable a Lys rotation from a space-
consuming to a space saving orientation [68,69]. Also interesting to observe is the fact that at
approximately the same surface coverage, in presence (Figure 4.3.18) and in absence of salt
(Figure 4.3.9), the second endothermic peak maximum appears sooner when salt is not
present, behaviour consistent with a higher repulsion between the adsorbed biomolecules
that are fully charged under this condition and promotes re-orientation sooner.
In the experiments run with the 30µL loop (Figure 4.3.20), by comparing the enthalpy of the
first endothermic heat as function of surface concentration in absence and presence of salt, it
can be seen that at low protein concentrations, there are no significant differences. Since the
source for the first heat is assumed to be ion and water molecules release from protein and
adsorbent surface, the balance of these events seems similar for both conditions. It is well
known that the increase of ionic strength reduces double layer thickness, being expected a
reduction in the positive enthalpy, however if more water molecules are released this effect
may be masked. [55,57].
By looking at the enthalpy of the second endothermic heat as function of surface
concentration (Figure 4.3.21), there is a clear sharp maximum probably associated with
lysozyme reorientation at the surface of the adsorbent in the presence of salt. It should be
kept in mind that this maximum occurs at the zone of the isotherm at which it starts to level,
500 1000 1500 2000 2500 3000 3500
-15
-10
-5
0
5
10
Time / s
1 1062.15688 -16.4866527 350.378333 -6149.36111
2 1760.41812 11.3450697 920.441351 11116.2776
3 2106.8609 -2.34893038 440.067241 -1100.39713
Heat
exchange /
uJs-1
Pan Zoom
# Peaks
Shape
Extra
Re-fit
Custom
BG500 1000 1500 2000 2500 3000 3500
-1.5
-1
-0.5
0
0.5
1
1.5
Extra = 0.5 Peaks = 3 Shape = Gaussian Error = 3.9841%
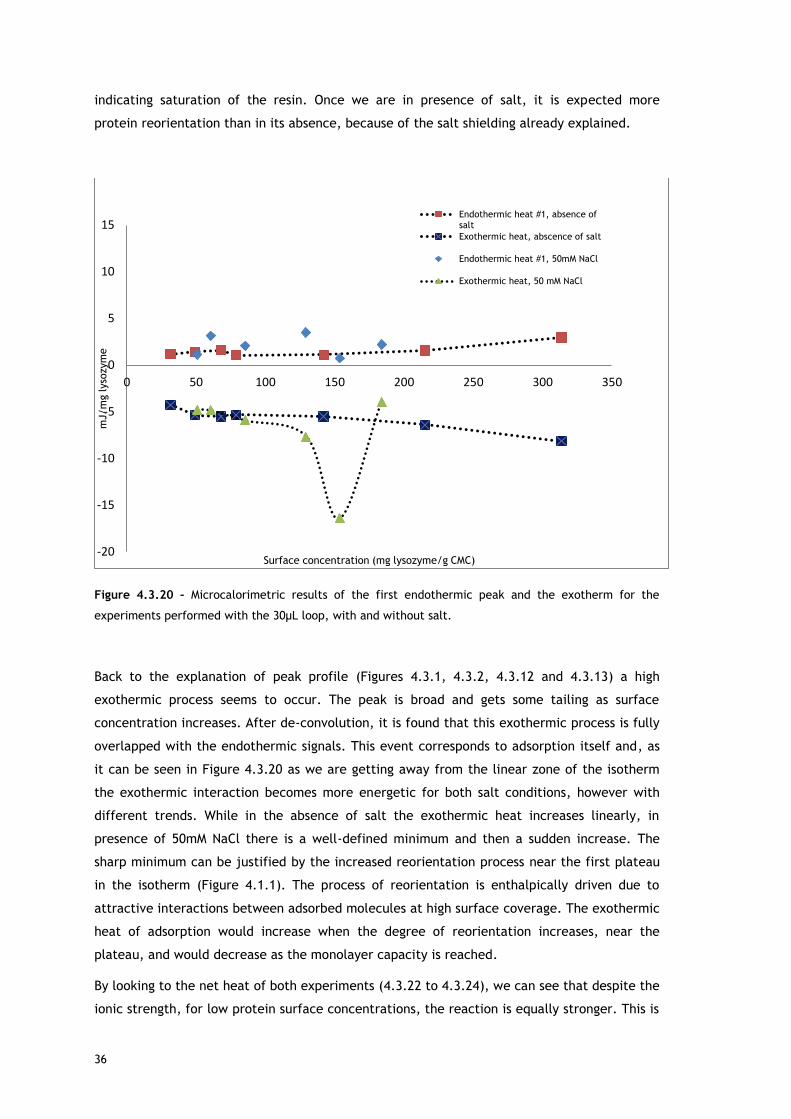
36
indicating saturation of the resin. Once we are in presence of salt, it is expected more
protein reorientation than in its absence, because of the salt shielding already explained.
Figure 4.3.20 – Microcalorimetric results of the first endothermic peak and the exotherm for the
experiments performed with the 30µL loop, with and without salt.
Back to the explanation of peak profile (Figures 4.3.1, 4.3.2, 4.3.12 and 4.3.13) a high
exothermic process seems to occur. The peak is broad and gets some tailing as surface
concentration increases. After de-convolution, it is found that this exothermic process is fully
overlapped with the endothermic signals. This event corresponds to adsorption itself and, as
it can be seen in Figure 4.3.20 as we are getting away from the linear zone of the isotherm
the exothermic interaction becomes more energetic for both salt conditions, however with
different trends. While in the absence of salt the exothermic heat increases linearly, in
presence of 50mM NaCl there is a well-defined minimum and then a sudden increase. The
sharp minimum can be justified by the increased reorientation process near the first plateau
in the isotherm (Figure 4.1.1). The process of reorientation is enthalpically driven due to
attractive interactions between adsorbed molecules at high surface coverage. The exothermic
heat of adsorption would increase when the degree of reorientation increases, near the
plateau, and would decrease as the monolayer capacity is reached.
By looking to the net heat of both experiments (4.3.22 to 4.3.24), we can see that despite the
ionic strength, for low protein surface concentrations, the reaction is equally stronger. This is
-20
-15
-10
-5
0
5
10
15
0 50 100 150 200 250 300 350
mJ/m
g lyso
zym
e
Surface concentration (mg lysozyme/g CMC)
Endothermic heat #1, absence ofsalt
Exothermic heat, abscence of salt
Endothermic heat #1, 50mM NaCl
Exothermic heat, 50 mM NaCl
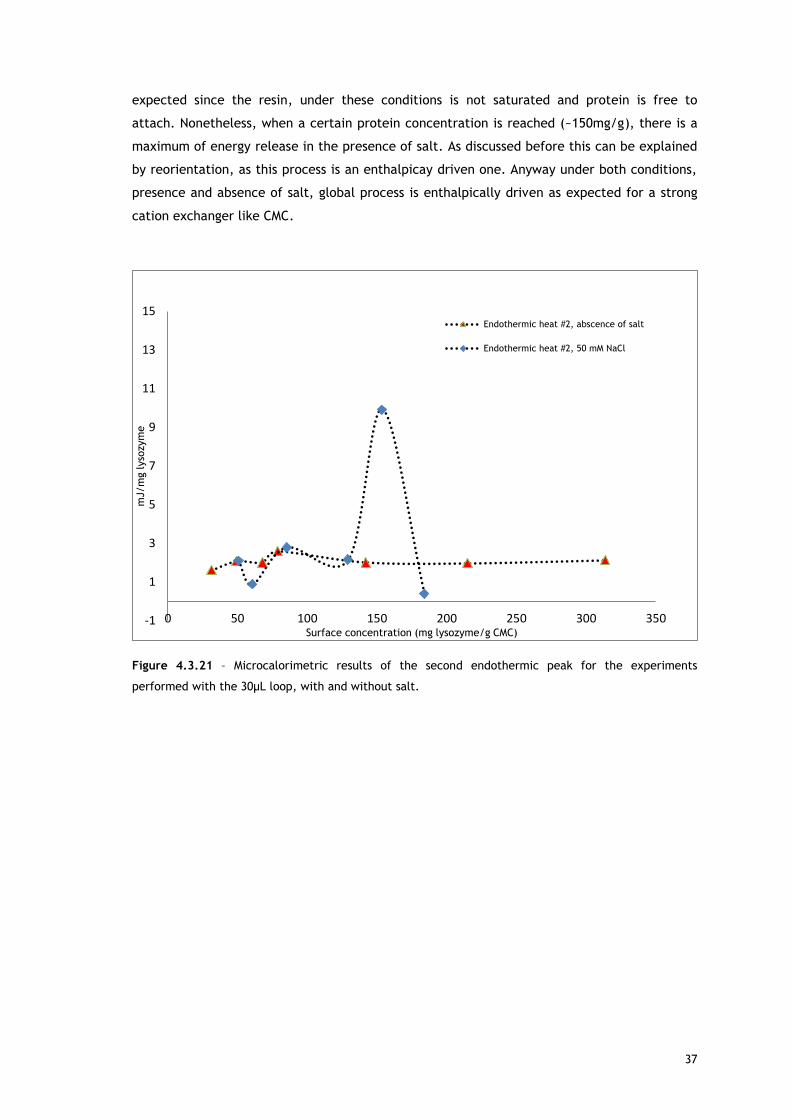
37
expected since the resin, under these conditions is not saturated and protein is free to
attach. Nonetheless, when a certain protein concentration is reached (~150mg/g), there is a
maximum of energy release in the presence of salt. As discussed before this can be explained
by reorientation, as this process is an enthalpicay driven one. Anyway under both conditions,
presence and absence of salt, global process is enthalpically driven as expected for a strong
cation exchanger like CMC.
Figure 4.3.21 – Microcalorimetric results of the second endothermic peak for the experiments
performed with the 30µL loop, with and without salt.
-1
1
3
5
7
9
11
13
15
0 50 100 150 200 250 300 350
mJ/m
g lyso
zym
e
Surface concentration (mg lysozyme/g CMC)
Endothermic heat #2, abscence of salt
Endothermic heat #2, 50 mM NaCl
38
Figure 4.3.22 – Microcalorimetric results of the experimental net heat for the experiments performed
with the 30µL loop, with and without salt.
Figure 4.3.23 - Microcalorimetric results of the overall enthalpy for the experiments performed with
the 30µL loop without salt.
-8
-7
-6
-5
-4
-3
-2
-1
0
0 50 100 150 200 250 300 350
mJ/m
g lyso
zym
e
Surface concentration (mg lysozyme/g CMC)
Net heat (experimental) in absence of salt
Net heat (experimental) in 50 mM NaCl
-10
-8
-6
-4
-2
0
2
4
0 50 100 150 200 250 300 350
mJ/m
g lyso
zym
e
Surface concentration (mg lysozyme/g CMC)
Net heat (experimental)
Endothermic heat #1
Endothermic heat #2
Exothermic heat
39
Figure 4.3.24 – Microcalorimetric results of the second endothermic peak for the experiments
performed with the 30µL loop with 50mM NaCl.
In the experiments performed at pH 5 in piperazine buffer using the 230µL loop, lysozyme
initial concentration varied in the range 40-120mg/mL in the no salted buffer and 20-
350mg/mL in the presence of 50mM of NaCl. Figures 4.3.25 and 4.3.26 show the heat signal
profile of the injections at the mentioned conditions in the absence of NaCl, resulting in
surface concentrations from ~130 to 510mg lysozyme/g CMC. Figure 4.3.29 and 4.3.30
represent the heat signal profile of some of the injections in 50mM NaCl, which resulted in
surface concentrations from ~80 to 1100mg lysozyme/g CMC.
Due to the higher protein loading that the longer loop can accommodate, significant
differences in the thermogram profile are clear. Therefore, peak de-convolution can give
valuable insight about the underlying phenomena in each experiment. The data analysed with
MATLAB software is shown after the thermograms. Figures 4.3.27 and 4.3.28 for the no salted
injections and 4.3.31-4.3.34 for the presence of 50mM of sodium chloride show the heat
signals de-convolution of the experiments with the 230µL.
-20
-15
-10
-5
0
5
10
15
30 80 130 180 230
mJ/m
g lyso
zym
e
Surface concentration (mg lysozyme/g CMC)
Net heat (experimental)
Endothermic heat #1
Endothermic heat #2
Exothermic heat
40
-80
-60
-40
-20
0
20
40
01
23 4 5 6
100
200
300
400
500
uJ/s
volume (mL)
Surface concentration
(mg lysozym
e / g CM
C)
Figure 4.3.25 – Thermograms of lysozyme adsorption on carboxy-methyl cellulose at pH 5 in piperazine
buffer 20mM in the absence of salt using a loop of 230µL; Yellow – 130,7mg lysozyme/g CMC; Blue –
169,4mg/g; Red – 450,2mg/g; Green - 513,6mg/g.
-80
-60
-40
-20
0
20
40
0 1 2 3 4 5 6100
200
300
400
500
uJ/s
volume (mL)
Surfa
ce c
oncentra
tion
(mg ly
sozy
me /
g C
MC)
Figure 4.3.26 – Different perspective of the thermograms of lysozyme adsorption on carboxy-methyl
cellulose at pH 5 in piperazine buffer 20mM in the absence of salt using a loop of 230µL.
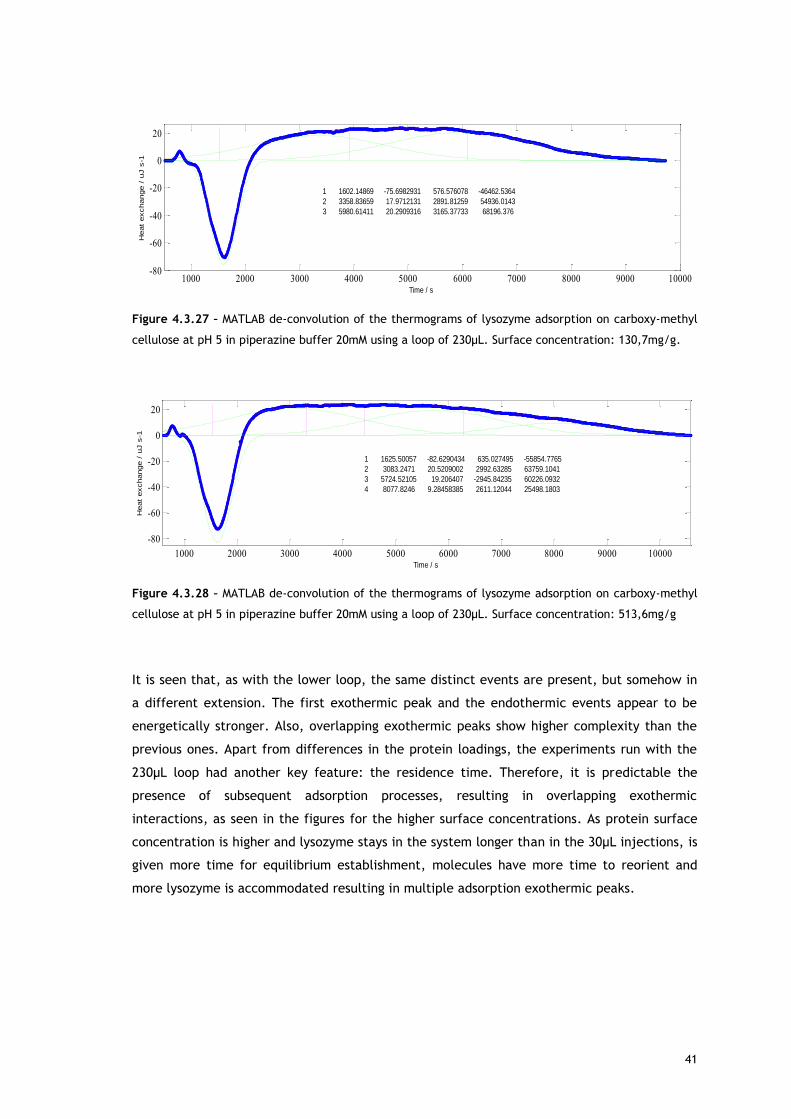
41
Figure 4.3.27 – MATLAB de-convolution of the thermograms of lysozyme adsorption on carboxy-methyl
cellulose at pH 5 in piperazine buffer 20mM using a loop of 230µL. Surface concentration: 130,7mg/g.
Figure 4.3.28 – MATLAB de-convolution of the thermograms of lysozyme adsorption on carboxy-methyl
cellulose at pH 5 in piperazine buffer 20mM using a loop of 230µL. Surface concentration: 513,6mg/g
It is seen that, as with the lower loop, the same distinct events are present, but somehow in
a different extension. The first exothermic peak and the endothermic events appear to be
energetically stronger. Also, overlapping exothermic peaks show higher complexity than the
previous ones. Apart from differences in the protein loadings, the experiments run with the
230µL loop had another key feature: the residence time. Therefore, it is predictable the
presence of subsequent adsorption processes, resulting in overlapping exothermic
interactions, as seen in the figures for the higher surface concentrations. As protein surface
concentration is higher and lysozyme stays in the system longer than in the 30µL injections, is
given more time for equilibrium establishment, molecules have more time to reorient and
more lysozyme is accommodated resulting in multiple adsorption exothermic peaks.
1000 2000 3000 4000 5000 6000 7000 8000 9000 10000-80
-60
-40
-20
0
20
Time / s
1 1602.14869 -75.6982931 576.576078 -46462.5364
2 3358.83659 17.9712131 2891.81259 54936.0143
3 5980.61411 20.2909316 3165.37733 68196.376
Heat
exchange /
uJ s
-1
Pan Zoom
# Peaks
Shape
Extra
Re-fit
Custom
BG1000 2000 3000 4000 5000 6000 7000 8000 9000
-2
-1
0
1
2
3
4
Extra = 0.5 Peaks = 3 Shape = Gaussian Error = 3.2315%
1000 2000 3000 4000 5000 6000 7000 8000 9000 10000
-80
-60
-40
-20
0
20
Time / s
1 1625.50057 -82.6290434 635.027495 -55854.7765
2 3083.2471 20.5209002 2992.63285 63759.1041
3 5724.52105 19.206407 -2945.84235 60226.0932
4 8077.8246 9.28458385 2611.12044 25498.1803
Heat
exchange /
uJ s
-1
Pan Zoom
# Peaks
Shape
Extra
Re-fit
Custom
BG1000 2000 3000 4000 5000 6000 7000 8000 9000 10000
-3
-2
-1
0
1
2
3
Extra = 0.5 Peaks = 4 Shape = Gaussian Error = 3.1088%
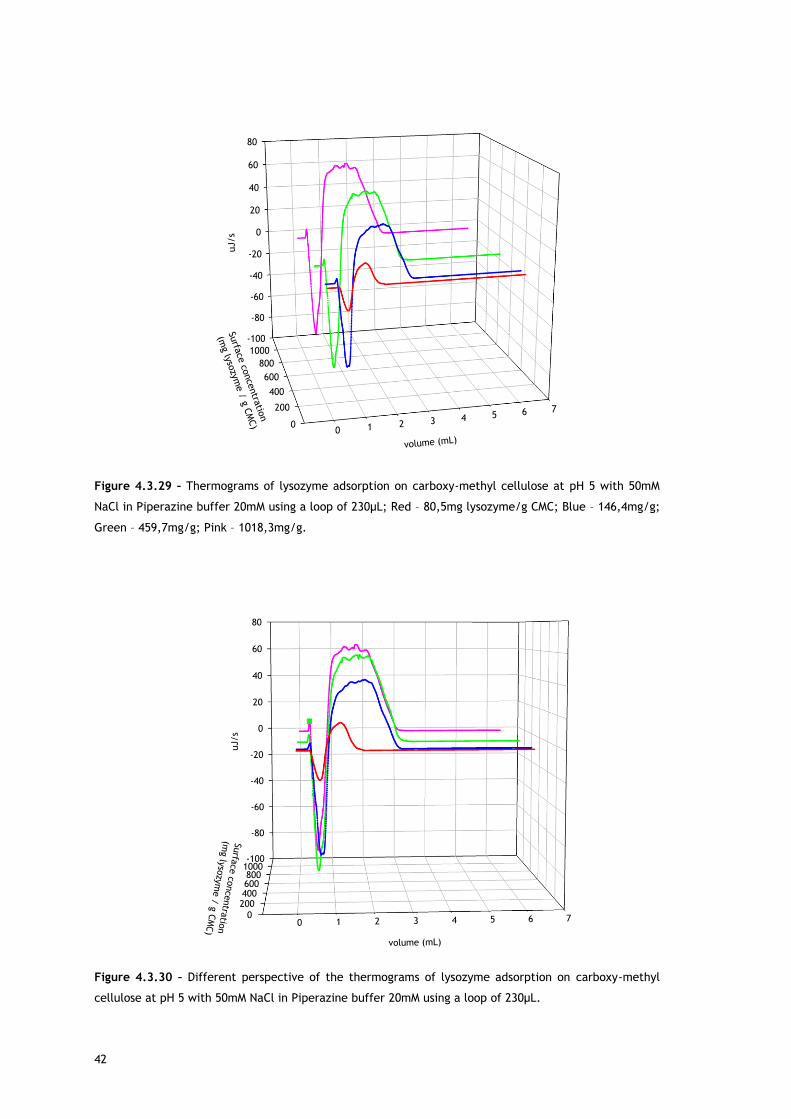
42
-100
-80
-60
-40
-20
0
20
40
60
80
0 1 2 3 4 5 6 7
0
200
400
600
800
1000
uJ/s
volume (mL)
Surfa
ce co
nce
ntra
tion
(mg lyso
zyme /
g C
MC)
Figure 4.3.29 – Thermograms of lysozyme adsorption on carboxy-methyl cellulose at pH 5 with 50mM
NaCl in Piperazine buffer 20mM using a loop of 230µL; Red – 80,5mg lysozyme/g CMC; Blue – 146,4mg/g;
Green – 459,7mg/g; Pink – 1018,3mg/g.
-100
-80
-60
-40
-20
0
20
40
60
80
0 1 2 3 4 5 6 70
200400600800
1000
uJ/s
volume (mL)
Surfa
ce c
oncentra
tion
(mg ly
sozy
me /
g C
MC)
Figure 4.3.30 – Different perspective of the thermograms of lysozyme adsorption on carboxy-methyl
cellulose at pH 5 with 50mM NaCl in Piperazine buffer 20mM using a loop of 230µL.
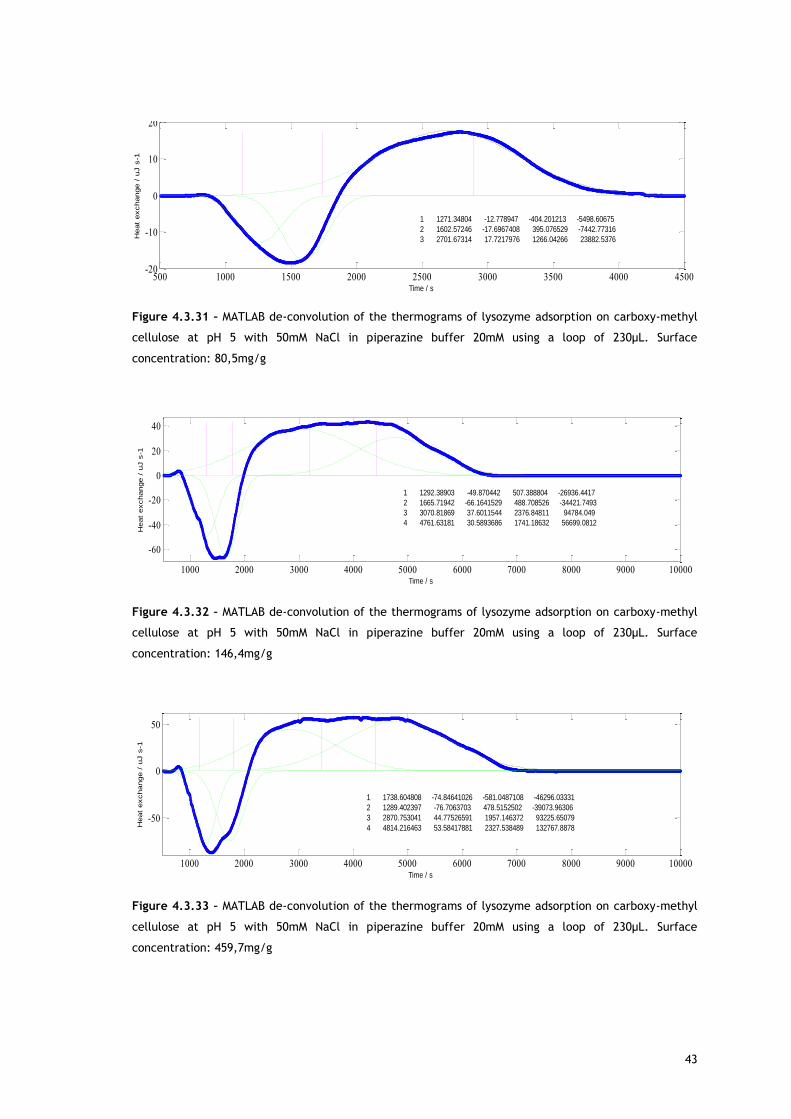
43
Figure 4.3.31 – MATLAB de-convolution of the thermograms of lysozyme adsorption on carboxy-methyl
cellulose at pH 5 with 50mM NaCl in piperazine buffer 20mM using a loop of 230µL. Surface
concentration: 80,5mg/g
Figure 4.3.32 – MATLAB de-convolution of the thermograms of lysozyme adsorption on carboxy-methyl
cellulose at pH 5 with 50mM NaCl in piperazine buffer 20mM using a loop of 230µL. Surface
concentration: 146,4mg/g
Figure 4.3.33 – MATLAB de-convolution of the thermograms of lysozyme adsorption on carboxy-methyl
cellulose at pH 5 with 50mM NaCl in piperazine buffer 20mM using a loop of 230µL. Surface
concentration: 459,7mg/g
500 1000 1500 2000 2500 3000 3500 4000 4500-20
-10
0
10
20
Time / s
1 1271.34804 -12.778947 -404.201213 -5498.60675
2 1602.57246 -17.6967408 395.076529 -7442.77316
3 2701.67314 17.7217976 1266.04266 23882.5376Heat
exchange /
uJ s
-1
Pan Zoom
# Peaks
Shape
Extra
Re-fit
Custom
BG500 1000 1500 2000 2500 3000 3500 4000 4500
-1
-0.5
0
0.5
1
Extra = 0.5 Peaks = 3 Shape = Gaussian Error = 2.6188%
1000 2000 3000 4000 5000 6000 7000 8000 9000 10000
-60
-40
-20
0
20
40
Time / s
1 1292.38903 -49.870442 507.388804 -26936.4417
2 1665.71942 -66.1641529 488.708526 -34421.7493
3 3070.81869 37.6011544 2376.84811 94784.049
4 4761.63181 30.5893686 1741.18632 56699.0812
Heat
exchange /
uJ s
-1
Pan Zoom
# Peaks
Shape
Extra
Re-fit
Custom
BG1000 2000 3000 4000 5000 6000 7000 8000 9000 10000
-3
-2
-1
0
1
2
3
4
Extra = 0.5 Peaks = 4 Shape = Gaussian Error = 2.2241%
1000 2000 3000 4000 5000 6000 7000 8000 9000 10000
-50
0
50
Time / s
1 1738.604808 -74.84641026 -581.0487108 -46296.03331
2 1289.402397 -76.7063703 478.5152502 -39073.96306
3 2870.753041 44.77526591 1957.146372 93225.65079
4 4814.216463 53.58417881 2327.538489 132767.8878Heat
exchange /
uJ s
-1
Pan Zoom
# Peaks
Shape
Extra
Re-fit
Custom
BG1000 2000 3000 4000 5000 6000 7000 8000 9000 10000
-2
0
2
4
6
Extra = 0.5 Peaks = 4 Shape = Gaussian Error = 2.3635%
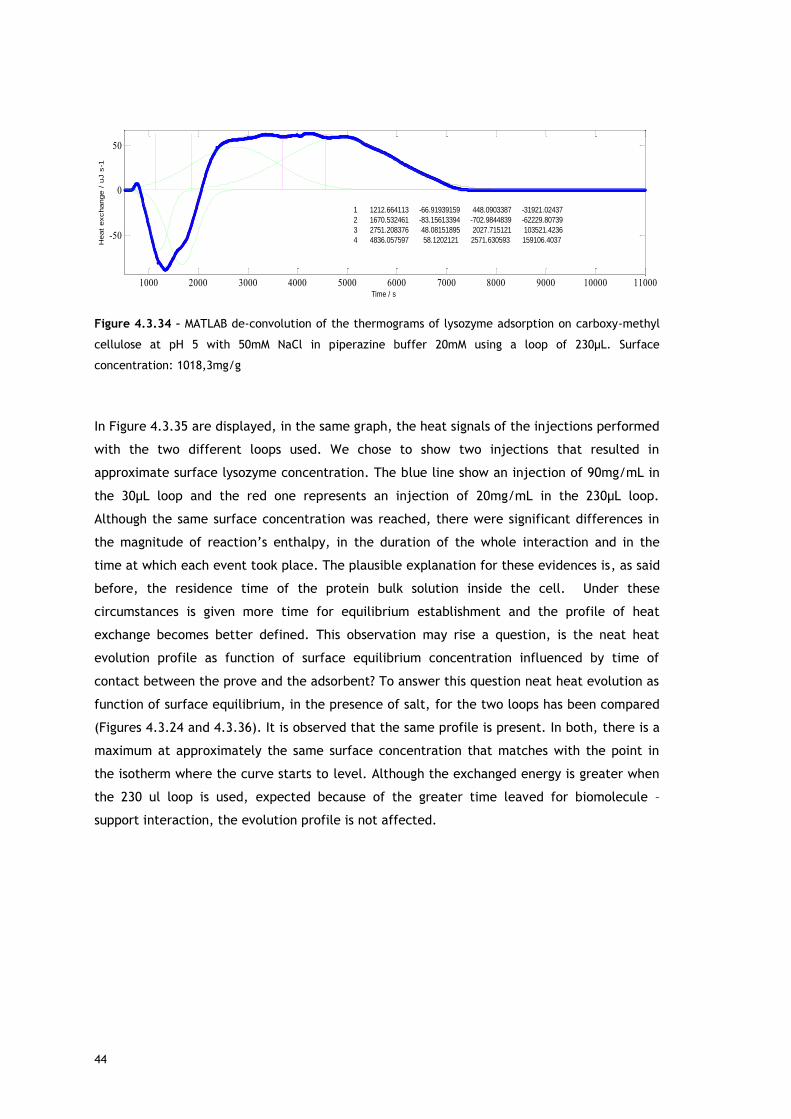
44
Figure 4.3.34 – MATLAB de-convolution of the thermograms of lysozyme adsorption on carboxy-methyl
cellulose at pH 5 with 50mM NaCl in piperazine buffer 20mM using a loop of 230µL. Surface
concentration: 1018,3mg/g
In Figure 4.3.35 are displayed, in the same graph, the heat signals of the injections performed
with the two different loops used. We chose to show two injections that resulted in
approximate surface lysozyme concentration. The blue line show an injection of 90mg/mL in
the 30µL loop and the red one represents an injection of 20mg/mL in the 230µL loop.
Although the same surface concentration was reached, there were significant differences in
the magnitude of reaction’s enthalpy, in the duration of the whole interaction and in the
time at which each event took place. The plausible explanation for these evidences is, as said
before, the residence time of the protein bulk solution inside the cell. Under these
circumstances is given more time for equilibrium establishment and the profile of heat
exchange becomes better defined. This observation may rise a question, is the neat heat
evolution profile as function of surface equilibrium concentration influenced by time of
contact between the prove and the adsorbent? To answer this question neat heat evolution as
function of surface equilibrium, in the presence of salt, for the two loops has been compared
(Figures 4.3.24 and 4.3.36). It is observed that the same profile is present. In both, there is a
maximum at approximately the same surface concentration that matches with the point in
the isotherm where the curve starts to level. Although the exchanged energy is greater when
the 230 ul loop is used, expected because of the greater time leaved for biomolecule –
support interaction, the evolution profile is not affected.
1000 2000 3000 4000 5000 6000 7000 8000 9000 10000 11000
-50
0
50
Time / s
1 1212.664113 -66.91939159 448.0903387 -31921.02437
2 1670.532461 -83.15613394 -702.9844839 -62229.80739
3 2751.208376 48.08151895 2027.715121 103521.4236
4 4836.057597 58.1202121 2571.630593 159106.4037Heat
exchange /
uJ s
-1
Pan Zoom
# Peaks
Shape
Extra
Re-fit
Custom
BG1000 2000 3000 4000 5000 6000 7000 8000 9000 10000 11000-4
-2
0
2
4
6
8
Extra = 0.5 Peaks = 4 Shape = Gaussian Error = 2.5481%
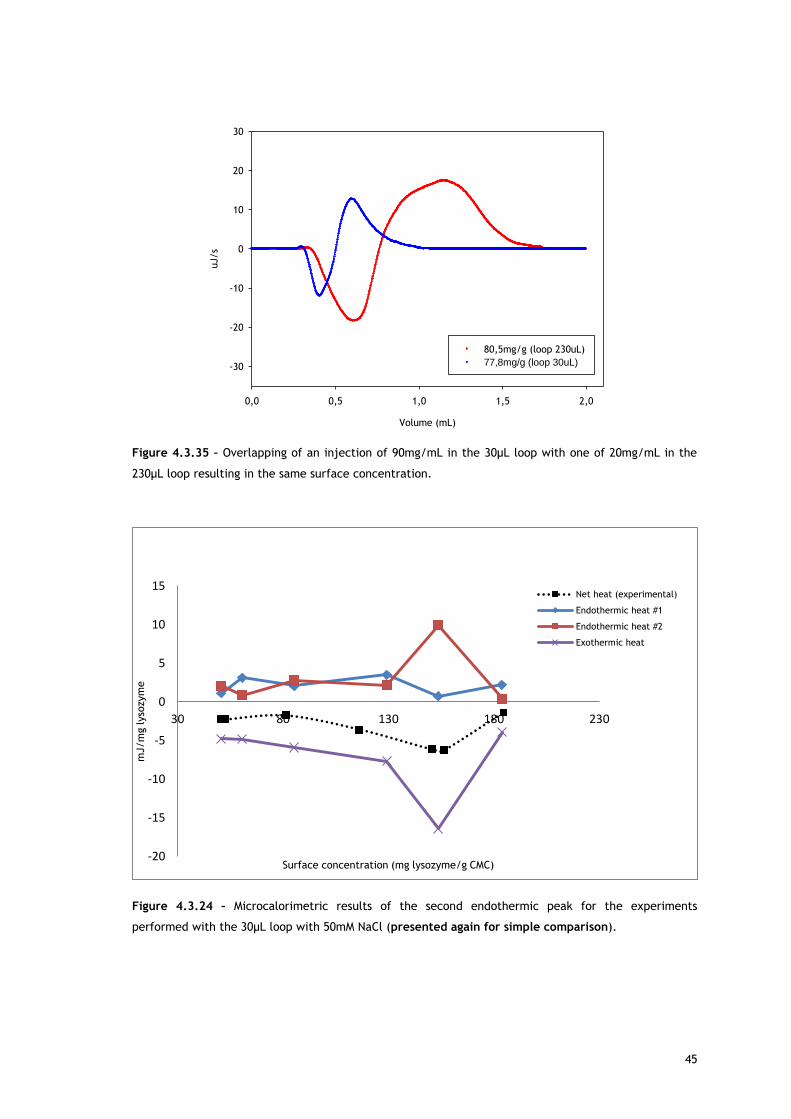
45
Volume (mL)
0,0 0,5 1,0 1,5 2,0
uJ/s
-30
-20
-10
0
10
20
30
80,5mg/g (loop 230uL)
77,8mg/g (loop 30uL)
Figure 4.3.35 – Overlapping of an injection of 90mg/mL in the 30µL loop with one of 20mg/mL in the
230µL loop resulting in the same surface concentration.
Figure 4.3.24 – Microcalorimetric results of the second endothermic peak for the experiments
performed with the 30µL loop with 50mM NaCl (presented again for simple comparison).
-20
-15
-10
-5
0
5
10
15
30 80 130 180 230
mJ/m
g lyso
zym
e
Surface concentration (mg lysozyme/g CMC)
Net heat (experimental)
Endothermic heat #1
Endothermic heat #2
Exothermic heat
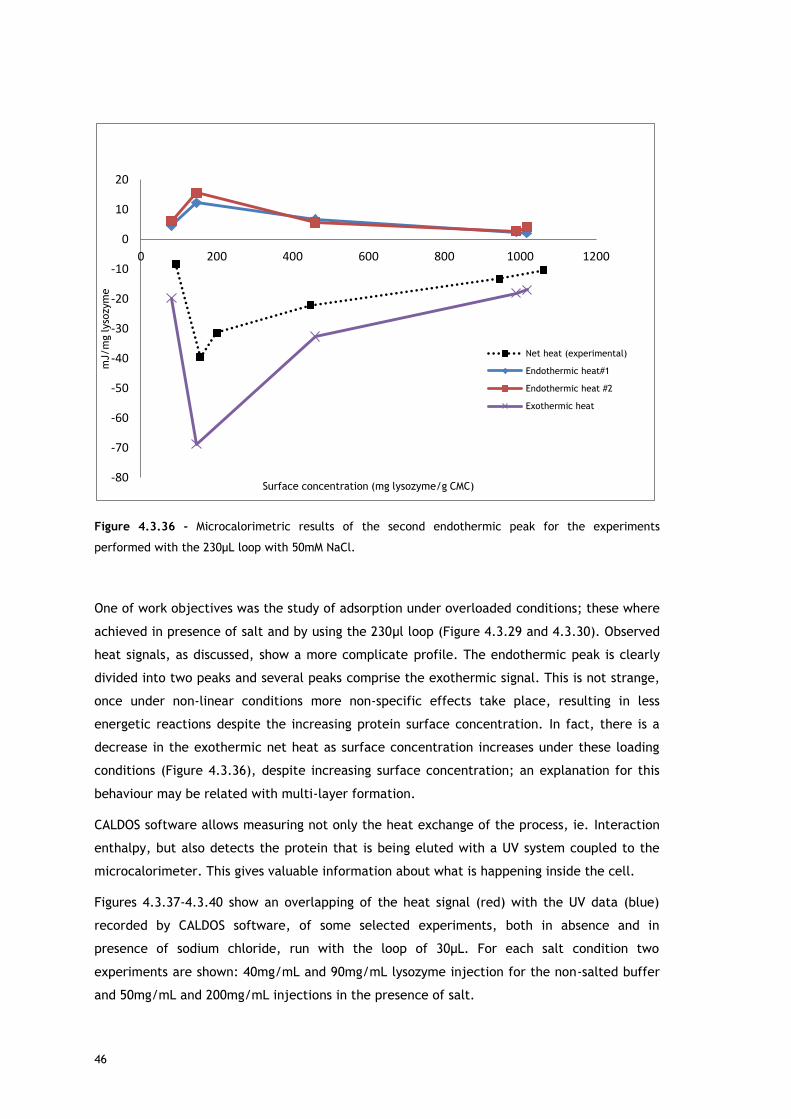
46
Figure 4.3.36 - Microcalorimetric results of the second endothermic peak for the experiments
performed with the 230µL loop with 50mM NaCl.
One of work objectives was the study of adsorption under overloaded conditions; these where
achieved in presence of salt and by using the 230µl loop (Figure 4.3.29 and 4.3.30). Observed
heat signals, as discussed, show a more complicate profile. The endothermic peak is clearly
divided into two peaks and several peaks comprise the exothermic signal. This is not strange,
once under non-linear conditions more non-specific effects take place, resulting in less
energetic reactions despite the increasing protein surface concentration. In fact, there is a
decrease in the exothermic net heat as surface concentration increases under these loading
conditions (Figure 4.3.36), despite increasing surface concentration; an explanation for this
behaviour may be related with multi-layer formation.
CALDOS software allows measuring not only the heat exchange of the process, ie. Interaction
enthalpy, but also detects the protein that is being eluted with a UV system coupled to the
microcalorimeter. This gives valuable information about what is happening inside the cell.
Figures 4.3.37-4.3.40 show an overlapping of the heat signal (red) with the UV data (blue)
recorded by CALDOS software, of some selected experiments, both in absence and in
presence of sodium chloride, run with the loop of 30µL. For each salt condition two
experiments are shown: 40mg/mL and 90mg/mL lysozyme injection for the non-salted buffer
and 50mg/mL and 200mg/mL injections in the presence of salt.
-80
-70
-60
-50
-40
-30
-20
-10
0
10
20
0 200 400 600 800 1000 1200
mJ/m
g lyso
zym
e
Surface concentration (mg lysozyme/g CMC)
Net heat (experimental)
Endothermic heat#1
Endothermic heat #2
Exothermic heat
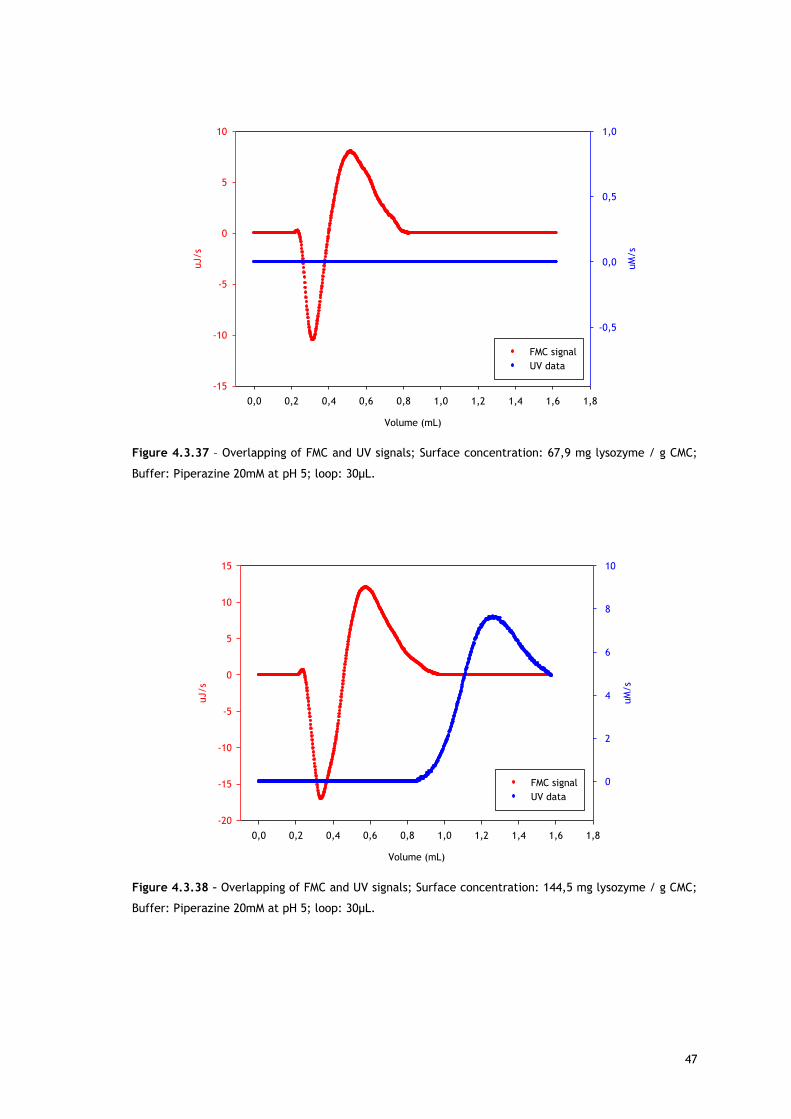
47
Volume (mL)
0,0 0,2 0,4 0,6 0,8 1,0 1,2 1,4 1,6 1,8
uJ/s
-15
-10
-5
0
5
10
uM
/s
-0,5
0,0
0,5
1,0
FMC signal
UV data
Figure 4.3.37 – Overlapping of FMC and UV signals; Surface concentration: 67,9 mg lysozyme / g CMC;
Buffer: Piperazine 20mM at pH 5; loop: 30µL.
Volume (mL)
0,0 0,2 0,4 0,6 0,8 1,0 1,2 1,4 1,6 1,8
uJ/s
-20
-15
-10
-5
0
5
10
15
uM
/s
0
2
4
6
8
10
FMC signal
UV data
Figure 4.3.38 – Overlapping of FMC and UV signals; Surface concentration: 144,5 mg lysozyme / g CMC;
Buffer: Piperazine 20mM at pH 5; loop: 30µL.
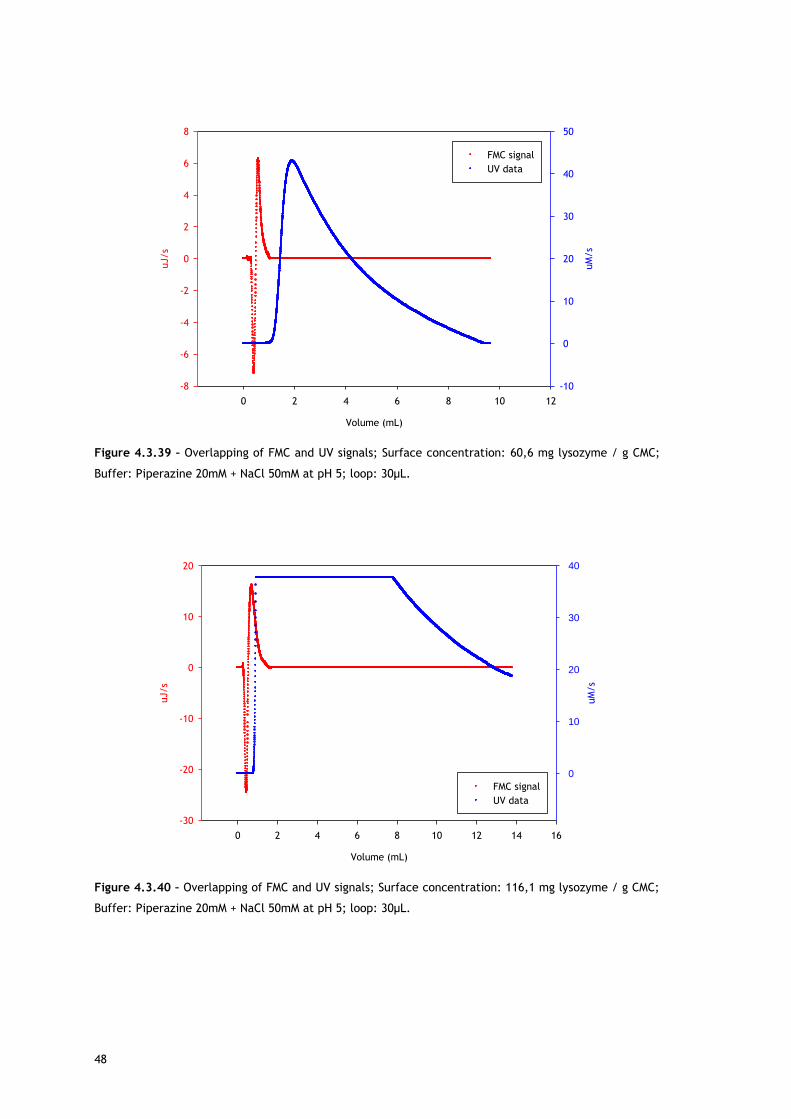
48
Volume (mL)
0 2 4 6 8 10 12
uJ/s
-8
-6
-4
-2
0
2
4
6
8
uM
/s
-10
0
10
20
30
40
50
FMC signal
UV data
Figure 4.3.39 – Overlapping of FMC and UV signals; Surface concentration: 60,6 mg lysozyme / g CMC;
Buffer: Piperazine 20mM + NaCl 50mM at pH 5; loop: 30µL.
Volume (mL)
0 2 4 6 8 10 12 14 16
uJ/s
-30
-20
-10
0
10
20
uM
/s
0
10
20
30
40
FMC signal
UV data
Figure 4.3.40 – Overlapping of FMC and UV signals; Surface concentration: 116,1 mg lysozyme / g CMC;
Buffer: Piperazine 20mM + NaCl 50mM at pH 5; loop: 30µL.
49
In absence of salt, in the experiment of the lowest protein surface concentration, the UV
system did not detect any protein coming out of the FMC system. One can only conclude that
every protein stayed adsorbed in the CMC, being this consistent with an ion exchange
mechanism: strong resin, low protein concentration, no salt, therefore high binding capacity.
In the other experiment with no salt (144,5mg/g) (Figure 4.3.38), some protein elutes from
the system. However, protein elution only occurs after every interaction within the
microcalorimeter had taken place. This has a similar profile to the first graphic for an
injection in the presence of salt (Figure 4.3.39). In the second experiment with salt, the
protein loading was 200mg lys/g, resulting in 116,1mg of lysozyme adsorbed in each gram of
CMC. However, here the protein that does not adsorb starts to be detected where adsorption
is still occurring for some lysozyme molecules. This can be explained with the fact that in this
experiment a higher protein concentration was injected, saturating the resin surface and
pores easily, thus inhibiting other molecules to interact with the adsorbent.
Figures 4.3.41-4.3.44 show the overlapping of the heat signal (red) with the UV data (blue)
recorded by CALDOS software of some selected experiments, both in absence and in presence
of sodium chloride, run with the loop of 230µL. For each salt condition two experiments are
also shown: 40mg/mL and 220mg/mL lysozyme injection for the non-salted buffer and
250mg/mL and 300mg/mL injections in the presence of salt.
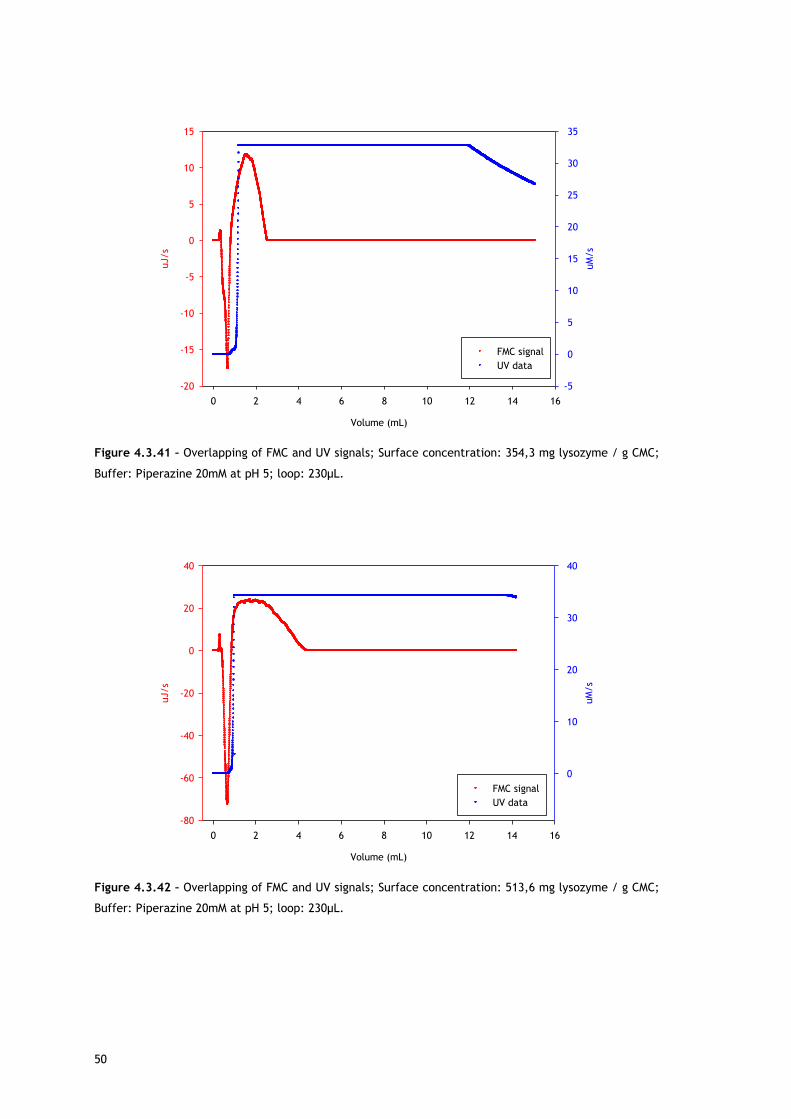
50
Volume (mL)
0 2 4 6 8 10 12 14 16
uJ/s
-20
-15
-10
-5
0
5
10
15
uM
/s
-5
0
5
10
15
20
25
30
35
FMC signal
UV data
Figure 4.3.41 – Overlapping of FMC and UV signals; Surface concentration: 354,3 mg lysozyme / g CMC;
Buffer: Piperazine 20mM at pH 5; loop: 230µL.
Volume (mL)
0 2 4 6 8 10 12 14 16
uJ/s
-80
-60
-40
-20
0
20
40
uM
/s
0
10
20
30
40
FMC signal
UV data
Figure 4.3.42 – Overlapping of FMC and UV signals; Surface concentration: 513,6 mg lysozyme / g CMC;
Buffer: Piperazine 20mM at pH 5; loop: 230µL.
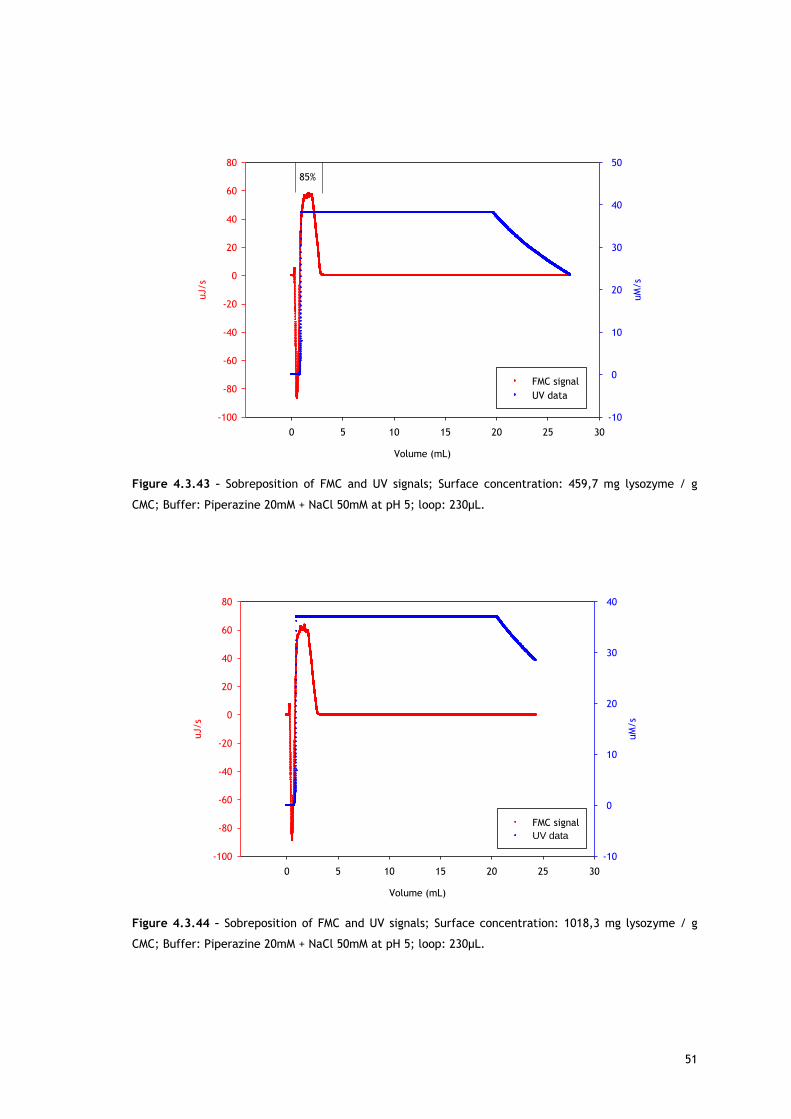
51
Volume (mL)
0 5 10 15 20 25 30
uJ/s
-100
-80
-60
-40
-20
0
20
40
60
80
uM
/s
-10
0
10
20
30
40
50
FMC signal
UV data
85%
Figure 4.3.43 – Sobreposition of FMC and UV signals; Surface concentration: 459,7 mg lysozyme / g
CMC; Buffer: Piperazine 20mM + NaCl 50mM at pH 5; loop: 230µL.
Volume (mL)
0 5 10 15 20 25 30
uJ/s
-100
-80
-60
-40
-20
0
20
40
60
80
uM
/s
-10
0
10
20
30
40
FMC signal
UV data
Figure 4.3.44 – Sobreposition of FMC and UV signals; Surface concentration: 1018,3 mg lysozyme / g
CMC; Buffer: Piperazine 20mM + NaCl 50mM at pH 5; loop: 230µL.
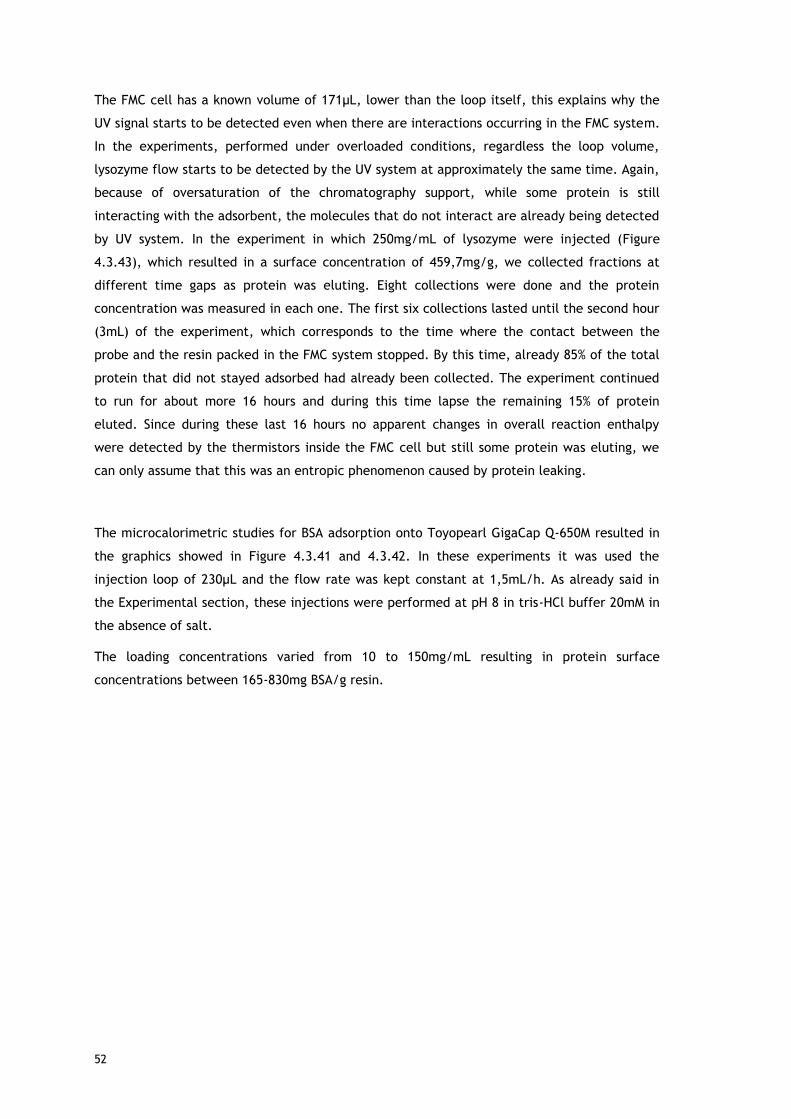
52
The FMC cell has a known volume of 171µL, lower than the loop itself, this explains why the
UV signal starts to be detected even when there are interactions occurring in the FMC system.
In the experiments, performed under overloaded conditions, regardless the loop volume,
lysozyme flow starts to be detected by the UV system at approximately the same time. Again,
because of oversaturation of the chromatography support, while some protein is still
interacting with the adsorbent, the molecules that do not interact are already being detected
by UV system. In the experiment in which 250mg/mL of lysozyme were injected (Figure
4.3.43), which resulted in a surface concentration of 459,7mg/g, we collected fractions at
different time gaps as protein was eluting. Eight collections were done and the protein
concentration was measured in each one. The first six collections lasted until the second hour
(3mL) of the experiment, which corresponds to the time where the contact between the
probe and the resin packed in the FMC system stopped. By this time, already 85% of the total
protein that did not stayed adsorbed had already been collected. The experiment continued
to run for about more 16 hours and during this time lapse the remaining 15% of protein
eluted. Since during these last 16 hours no apparent changes in overall reaction enthalpy
were detected by the thermistors inside the FMC cell but still some protein was eluting, we
can only assume that this was an entropic phenomenon caused by protein leaking.
The microcalorimetric studies for BSA adsorption onto Toyopearl GigaCap Q-650M resulted in
the graphics showed in Figure 4.3.41 and 4.3.42. In these experiments it was used the
injection loop of 230µL and the flow rate was kept constant at 1,5mL/h. As already said in
the Experimental section, these injections were performed at pH 8 in tris-HCl buffer 20mM in
the absence of salt.
The loading concentrations varied from 10 to 150mg/mL resulting in protein surface
concentrations between 165-830mg BSA/g resin.
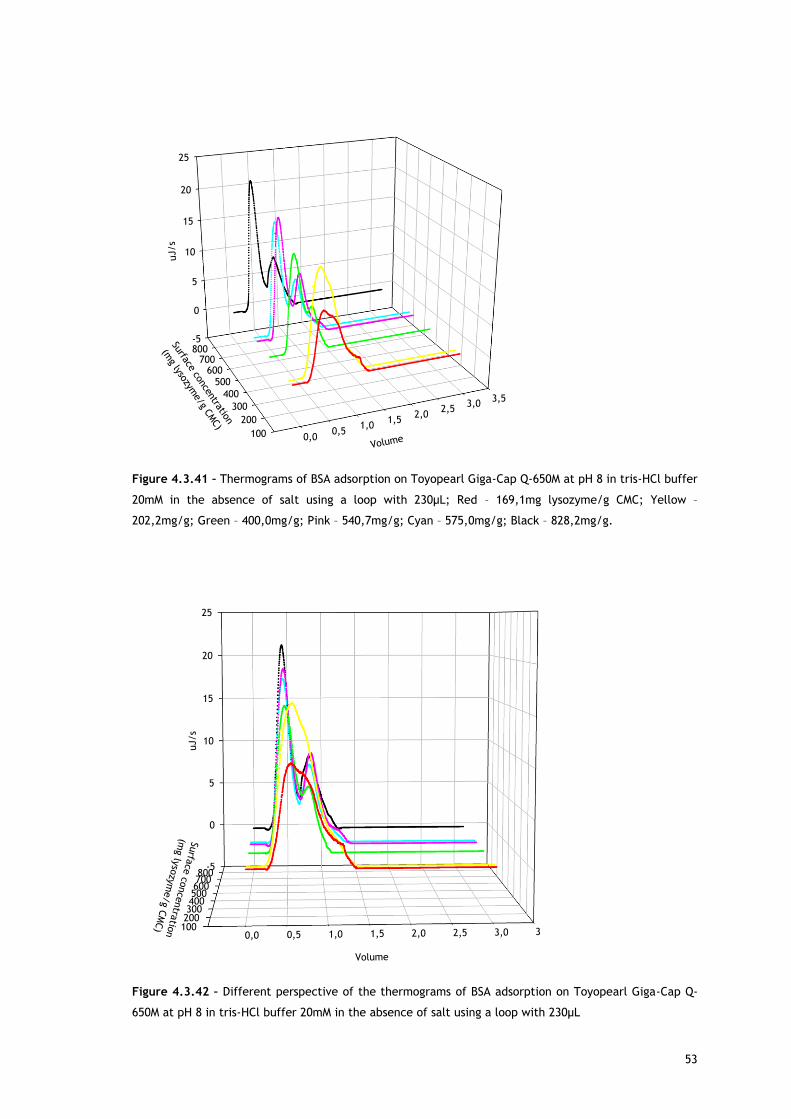
53
-5
0
5
10
15
20
25
0,00,5
1,01,5
2,02,5
3,03,5
100
200
300
400
500600
700800
uJ/s
Volume
Surface concentration
(mg lysozym
e/g CMC)
Figure 4.3.41 – Thermograms of BSA adsorption on Toyopearl Giga-Cap Q-650M at pH 8 in tris-HCl buffer
20mM in the absence of salt using a loop with 230µL; Red – 169,1mg lysozyme/g CMC; Yellow –
202,2mg/g; Green – 400,0mg/g; Pink – 540,7mg/g; Cyan – 575,0mg/g; Black – 828,2mg/g.
-5
0
5
10
15
20
25
0,0 0,5 1,0 1,5 2,0 2,5 3,0 3,5100200300400500600700800
uJ/s
Volume
Surfa
ce c
oncentra
tion
(mg ly
sozy
me/g C
MC)
Figure 4.3.42 – Different perspective of the thermograms of BSA adsorption on Toyopearl Giga-Cap Q-
650M at pH 8 in tris-HCl buffer 20mM in the absence of salt using a loop with 230µL
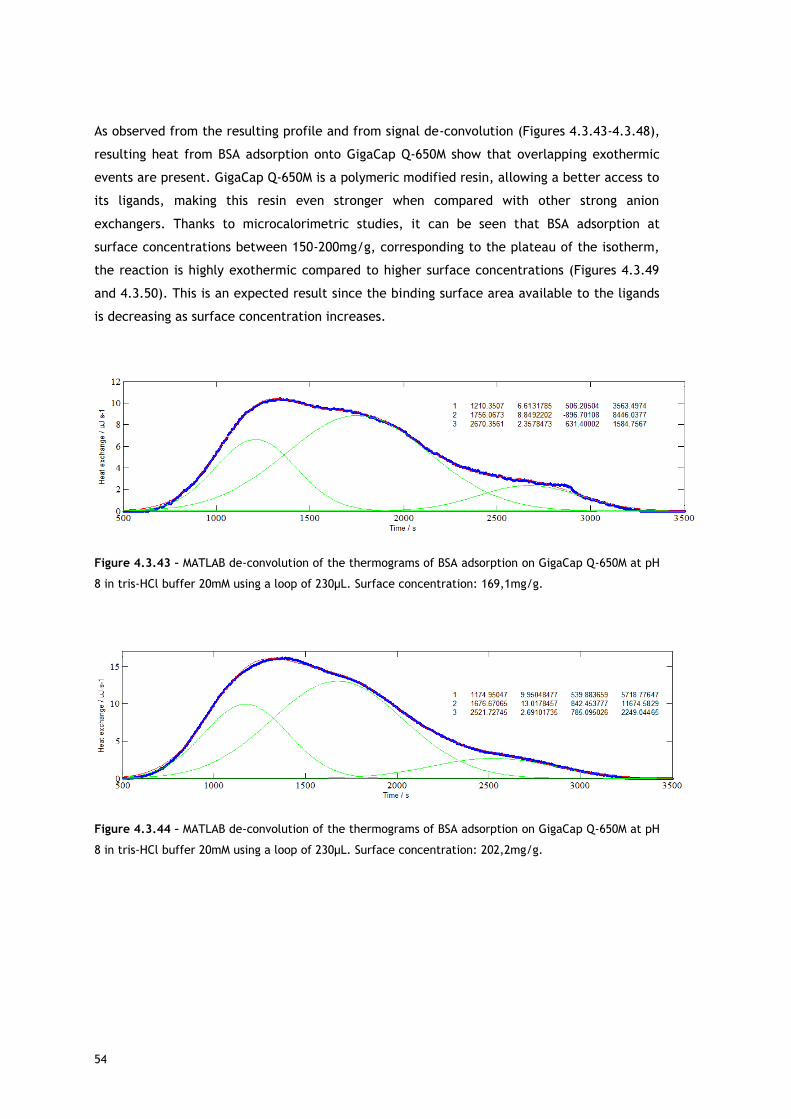
54
As observed from the resulting profile and from signal de-convolution (Figures 4.3.43-4.3.48),
resulting heat from BSA adsorption onto GigaCap Q-650M show that overlapping exothermic
events are present. GigaCap Q-650M is a polymeric modified resin, allowing a better access to
its ligands, making this resin even stronger when compared with other strong anion
exchangers. Thanks to microcalorimetric studies, it can be seen that BSA adsorption at
surface concentrations between 150-200mg/g, corresponding to the plateau of the isotherm,
the reaction is highly exothermic compared to higher surface concentrations (Figures 4.3.49
and 4.3.50). This is an expected result since the binding surface area available to the ligands
is decreasing as surface concentration increases.
Figure 4.3.43 – MATLAB de-convolution of the thermograms of BSA adsorption on GigaCap Q-650M at pH
8 in tris-HCl buffer 20mM using a loop of 230µL. Surface concentration: 169,1mg/g.
Figure 4.3.44 – MATLAB de-convolution of the thermograms of BSA adsorption on GigaCap Q-650M at pH
8 in tris-HCl buffer 20mM using a loop of 230µL. Surface concentration: 202,2mg/g.
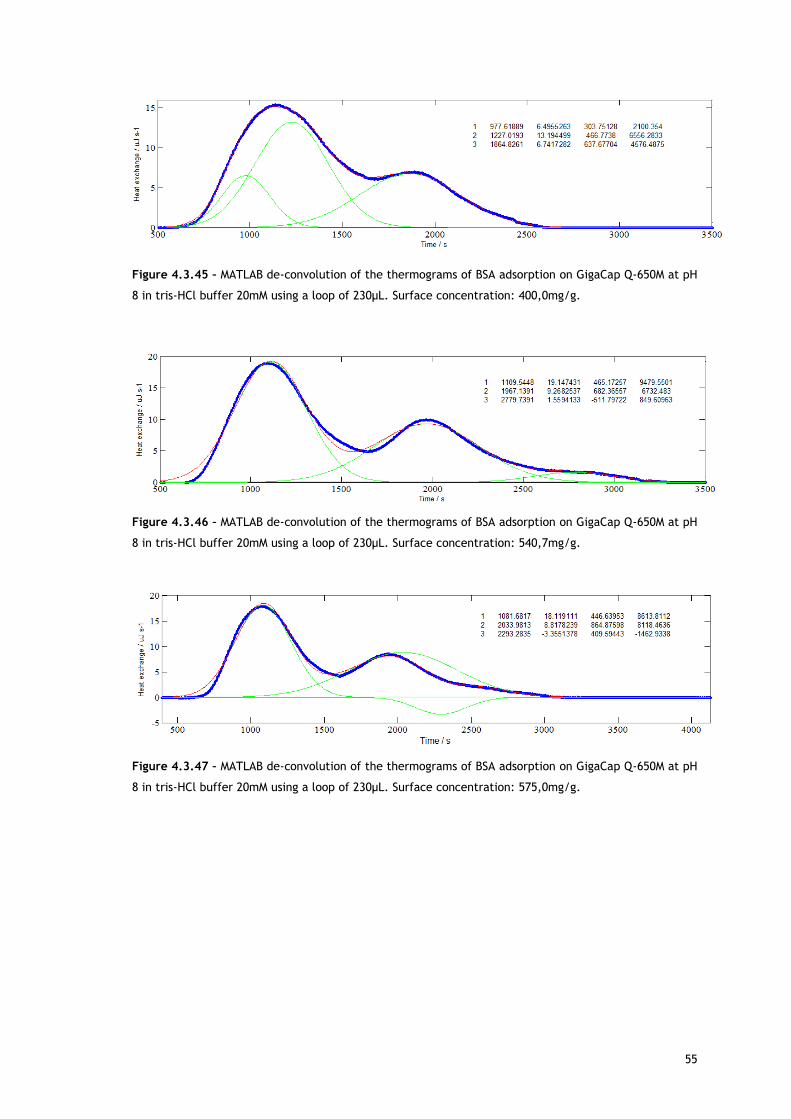
55
Figure 4.3.45 – MATLAB de-convolution of the thermograms of BSA adsorption on GigaCap Q-650M at pH
8 in tris-HCl buffer 20mM using a loop of 230µL. Surface concentration: 400,0mg/g.
Figure 4.3.46 – MATLAB de-convolution of the thermograms of BSA adsorption on GigaCap Q-650M at pH
8 in tris-HCl buffer 20mM using a loop of 230µL. Surface concentration: 540,7mg/g.
Figure 4.3.47 – MATLAB de-convolution of the thermograms of BSA adsorption on GigaCap Q-650M at pH
8 in tris-HCl buffer 20mM using a loop of 230µL. Surface concentration: 575,0mg/g.
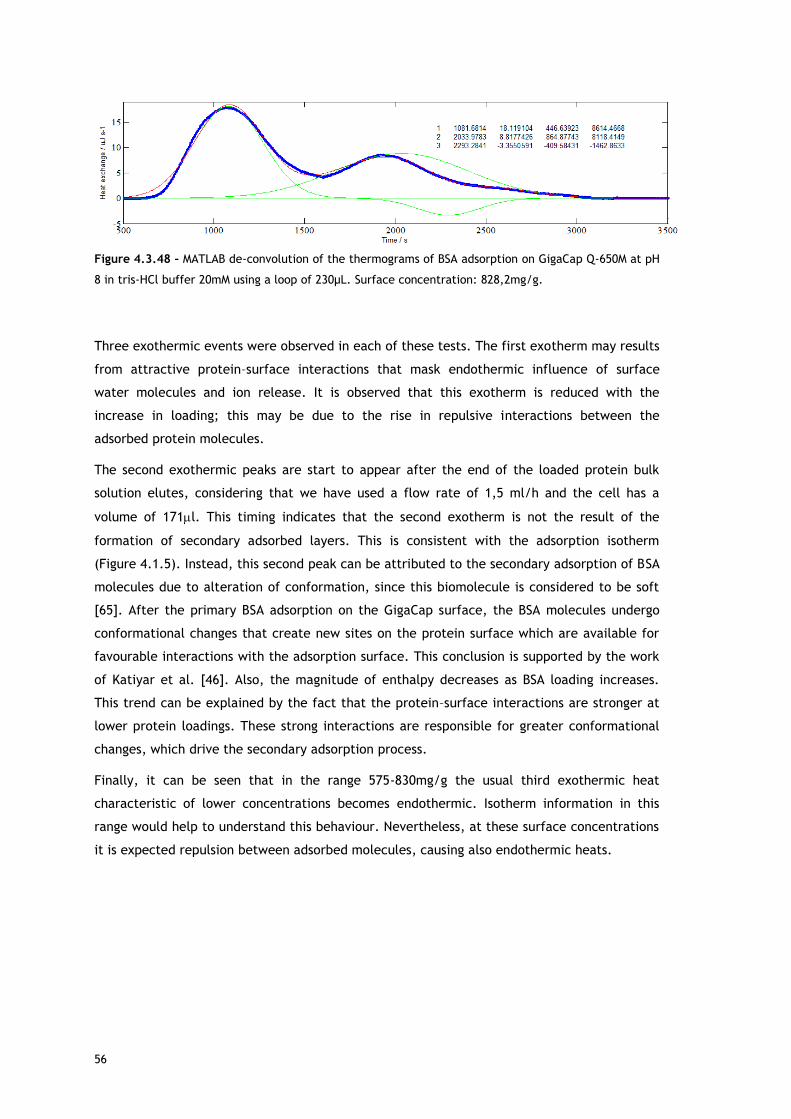
56
Figure 4.3.48 – MATLAB de-convolution of the thermograms of BSA adsorption on GigaCap Q-650M at pH
8 in tris-HCl buffer 20mM using a loop of 230µL. Surface concentration: 828,2mg/g.
Three exothermic events were observed in each of these tests. The first exotherm may results
from attractive protein–surface interactions that mask endothermic influence of surface
water molecules and ion release. It is observed that this exotherm is reduced with the
increase in loading; this may be due to the rise in repulsive interactions between the
adsorbed protein molecules.
The second exothermic peaks are start to appear after the end of the loaded protein bulk
solution elutes, considering that we have used a flow rate of 1,5 ml/h and the cell has a
volume of 171l. This timing indicates that the second exotherm is not the result of the
formation of secondary adsorbed layers. This is consistent with the adsorption isotherm
(Figure 4.1.5). Instead, this second peak can be attributed to the secondary adsorption of BSA
molecules due to alteration of conformation, since this biomolecule is considered to be soft
[65]. After the primary BSA adsorption on the GigaCap surface, the BSA molecules undergo
conformational changes that create new sites on the protein surface which are available for
favourable interactions with the adsorption surface. This conclusion is supported by the work
of Katiyar et al. [46]. Also, the magnitude of enthalpy decreases as BSA loading increases.
This trend can be explained by the fact that the protein–surface interactions are stronger at
lower protein loadings. These strong interactions are responsible for greater conformational
changes, which drive the secondary adsorption process.
Finally, it can be seen that in the range 575-830mg/g the usual third exothermic heat
characteristic of lower concentrations becomes endothermic. Isotherm information in this
range would help to understand this behaviour. Nevertheless, at these surface concentrations
it is expected repulsion between adsorbed molecules, causing also endothermic heats.
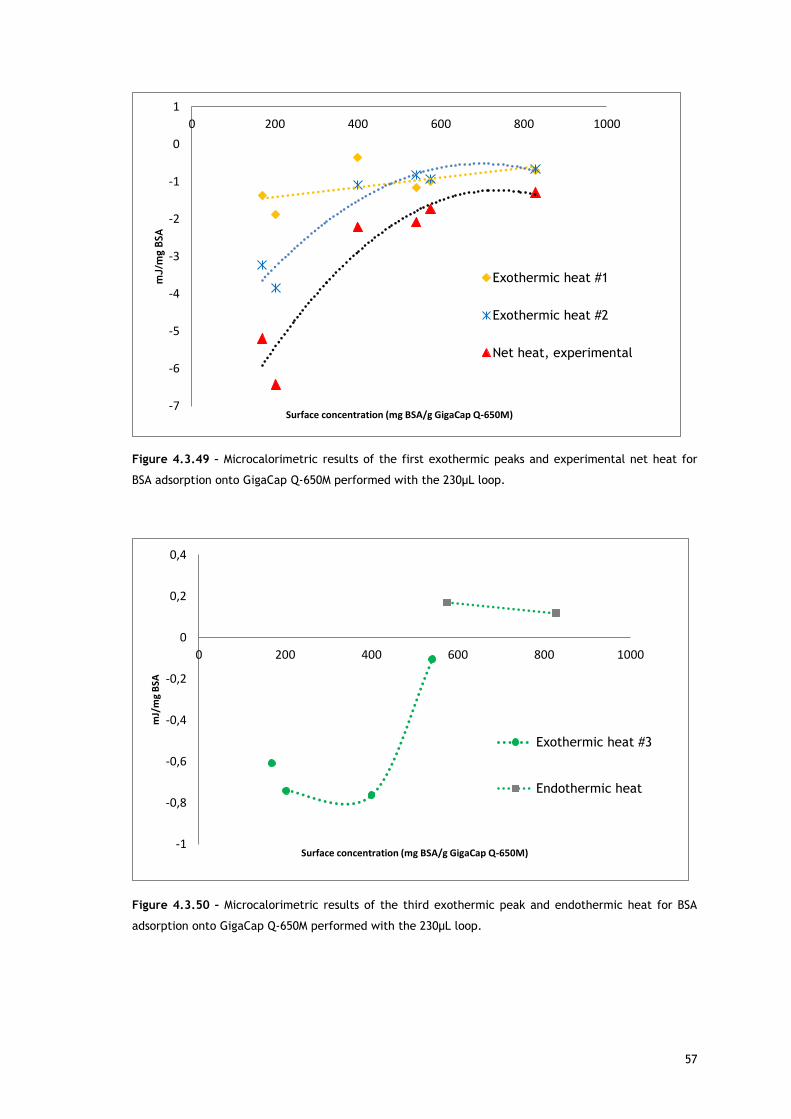
57
Figure 4.3.49 – Microcalorimetric results of the first exothermic peaks and experimental net heat for
BSA adsorption onto GigaCap Q-650M performed with the 230µL loop.
Figure 4.3.50 – Microcalorimetric results of the third exothermic peak and endothermic heat for BSA
adsorption onto GigaCap Q-650M performed with the 230µL loop.
-7
-6
-5
-4
-3
-2
-1
0
1
0 200 400 600 800 1000
mJ/m
g B
SA
Surface concentration (mg BSA/g GigaCap Q-650M)
Exothermic heat #1
Exothermic heat #2
Net heat, experimental
-1
-0,8
-0,6
-0,4
-0,2
0
0,2
0,4
0 200 400 600 800 1000
mJ/
mg
BSA
Surface concentration (mg BSA/g GigaCap Q-650M)
Exothermic heat #3
Endothermic heat

58
59
Chapter V – Conclusions and future work
This dissertation had the objective of studying the adsorption mechanisms underlying ion-
exchange chromatography. Since adsorption is a phenomenon were energy changes are
associated, microcalorimetry was used and gave valuable insight on the overall process.
Firstly, lysozyme adsorption mechanism onto CMC was studied at pH 5 both in absence and in
presence of sodium chloride (50mM). It was seen that under linear protein concentrations the
exothermic net heats are similar for both salt conditions, indicating that when the
chromatographic resin still has empty binding sites lysozyme adsorbs freely regardless salt
concentration. However, when surface concentration reached the point where the isotherm
starts to level, an increase in the endothermic heat is seen in the presence of salt. At these
surface protein concentrations, lysozyme “feels” an extra urge to reorient in order to try to
accommodate more molecules. This reorientation is favoured in the presence of salt because
of the screening effect to the protein charge. Reorientation of lysozyme then leads to a
secondary adsorption, which is consistent with the results that show a high exothermic net
heat at these protein concentrations. Under overloaded conditions in the presence of salt,
with increasing surface concentration, it is seen that there is a decrease in the net heat
signal. This is expected since after reorientation there is an energetic equilibrium towards the
formation of a new layer and multilayer formation may be present.
Anion-exchange studies with BSA and a grafted resin (Toyopearl GigaCap Q-650M) showed
highly exothermic interactions, where three exotherms were present. It was observed that
with increase in protein surface concentration, the first exothermic heat decreases,
consistent with repulsive interactions between adsorbed molecules. The second exothermic
peak seems to be caused by protein secondary adsorption due to alteration of conformation
of BSA. Finally, at low protein concentrations a typical third exothermic heat is present.
However, at higher surface concentrations there is an endothermic peak instead, probably
due to high protein repulsion.
All of these results confirmed that for a more consistent overview of ion-exchange interaction
mechanism, flow microcalorimetry could be of great interest in a systematic study.
The future work perspective is to conclude the investigation of the underlying mechanisms of
lysozyme adsorption onto CMC. It is intended to further extend the research to overloaded
protein concentrations in the absence of salt. Also, doing some experiments under a higher
ionic strength would help to understand better how salt concentration affects protein
adsorption. In addition, protein charge is one of the most important factors in ion-exchange,
so, changing the pH would give valuable insight into the overall process.
60
Last but not least, it is intended to keep reseach by microcalorimetry for Toyopearl® resins
(GigaCap Q-650M and DEAE-650M) in order to understand how the polymeric modification of
the resin particle affects protein binding.
61
References
[1] M. Hedhammar, A.E. Karlström, S. Hober, Chromatographic methods for protein
purification, Royal Institute of Technology, Stockholm, Sweden.
[2] M.E. Thrash Jr, J.M. Phillips, N.G. Pinto, Adsorption. 10 (2005) 299–307.
[3] A. Staby, I.H. Jensen, I. Mollerup, Journal of Chromatography A. 897 (2000) 99–111.
[4] A. Staby, I.H. Jensen, Journal of Chromatography A. 908 (2001) 149–161.
[5] A. Staby, M.-B. Sand, R.G. Hansen, J.H. Jacobsen, L. A. Andersen, M. Gerstenberg, et
al., Journal of Chromatography A. 1034 (2004) 85–97.
[6] A. Staby, M.-B. Sand, R.G. Hansen, J.H. Jacobsen, L. A. Andersen, M. Gerstenberg, et
al., Journal of Chromatography A. 1069 (2005) 65–77.
[7] A. Staby, J.H. Jacobsen, R.G. Hansen, U.K. Bruus, I.H. Jensen, Journal of
Chromatography A. 1118 (2006) 168–79.
[8] A. Staby, R.H. Jensen, M. Bensch, J. Hubbuch, D.L. Dünweber, J. Krarup, et al.,
Journal of Chromatography A. 1164 (2007) 82–94.
[9] M.E. Thrash Jr, N.G. Pinto, Journal of Chromatography A. 944 (2002) 61–68.
[10] E. Müller, Chemical Engineering & Technology. 28 (2005) 1295–1305.
[11] TOSOH Bioscience, Chromatographic Process Media Catalog.
[12] J. Korfhagen, A.C. Dias-Cabral, M.E. Thrash Jr, Separation Science and Technology. 45
(2010) 2039–2050.
[13] P. Raje, N.G. Pinto, Journal of Chromatography A. 760 (1997) 89–103.
[14] P. Raje, N.G. Pinto, Journal of Chromatography A. 796 (1998) 141–56.
[15] M.E. Thrash Jr, N.G. Pinto, Journal of Chromatography A. 1126 (2006) 304–10.
[16] S. Yamamoto, K. Nakanishi, R. Matsuno, Ion Exchange Chromatography of Proteins,
Taylor & Francis, 1988.
[17] TOSOH Bioscience, General Principles of Liquid Chromatography.
[18] A.K. Hunter, G. Carta, Journal of Chromatography A. 897 (2000) 65–80.
[19] F.G. Helfferich, Ion Exchange, Courier Dover Publications, 1962.
[20] J. Ståhlberg, Journal of Chromatography. A. 855 (1999) 3–55.
[21] E. Müller, Journal of Chromatography A. 1006 (2003) 229–240.
[22] L.E. Weaver, G. Carta, Biotechnology Progress. 12 (1996) 342–355.
[23] C. Chang, A.M. Lenhoff, Journal of Chromatography A. 827 (1998) 281–93.
62
[24] J.J. Van Deemter, F.J. Zuiderweg, A. Klinkenber, Chemical Engineering. 5 (1956) 271–
289.
[25] J.C. Bellot, J.S. Condoret, Process Biochemistry. 28 (1993) 365–376.
[26] I. Langmuir, Journal of the American Chemical Society. 40 (1918) 1361–1403.
[27] F.G. Helfferich, P.W. Carr, Journal of Chromatography. 629 (1993) 97–122.
[28] S.R. Gallant, A. Kundu, S.M. Cramer, Journal of Chromatography A. 702 (1995) 125–
142.
[29] P.K. de Bokx, P.C. Baarslag, H.P. Urbach, Journal of Chromatography. 594 (1992) 9–22.
[30] P. Jandera, G. Guiochon, Journal of Chromatography A. 605 (1992) 1–17.
[31] W. Kopaciewicz, M.A. Rounds, J. Fausnaugh, F.E. Regnier, Journal of Chromatography.
266 (1983) 3–20.
[32] M.A. Rounds, F.E. Regnier, Journal of Chromatography. 283 (1984) 37–45.
[33] F.E. Regnier, I. Mazsaroff, Biotechnology Progress. 3 (1987) 22–26.
[34] A. Velayudhan, C. Horvath, Journal of Chromatography. 443 (1988) 13–29.
[35] W. Kopaciewicz, M.A. Rounds, F.E. Regnier, Journal of Chromatography. 318 (1985)
157–172.
[36] W.-Y. Chen, Z.-C. Liu, P.-H. Lin, C.-I. Fang, S. Yamamoto, Separation and Purification
Technology. 54 (2007) 212–219.
[37] C.A. Brooks, S.M. Cramer, AIChE Journal. 38 (1992) 1969–1978.
[38] Y. Li, N.G. Pinto, Journal of Chromatography A. 702 (1995) 113–123.
[39] M.R. Oberholzer, A.M. Lenhoff, Langmuir. 15 (1999) 3905–3914.
[40] J.C. Bosma, J.A. Wesselingh, AIChE Journal. 50 (2004) 848–853.
[41] G. Carta, Biotechnology Journal. 7 (2012) 1216–20.
[42] C.M. Roth, K.K. Ungerb, A.M. Lenhoff, Journal of Chromatography A. 726 (1996) 45–56.
[43] C. Harinarayan, J. Mueller, A. Ljunglo, R. Fahrner, Biotechnology and Bioengineering.
(2006) 775–787.
[44] A.M. Hardin, C. Harinarayan, G. Malmquist, A. Axén, R. van Reis, Journal of
Chromatography A. 1216 (2009) 4366–71.
[45] R.A. Alberty, Journal of the American Chemical Society. 91 (1969) 3899–3903.
[46] A. Katiyar, S.W. Thiel, V. V Guliants, N.G. Pinto, Journal of Chromatography A. 1217
(2010) 1583–8.
[47] M.E. Thrash Jr, N.G. Pinto, Journal of Chromatography A. 908 (2001) 293–299.
63
[48] M. Ornelas, D. Loureiro, M.J. Araújo, E. Marques, C. Dias-Cabral, M. Azenha, et al.,
Journal of Chromatography A. 1297 (2013) 138–45.
[49] M.A. Esquibel-King, A.C. Dias-Cabral, J.A. Queiroz, N.G. Pinto, Journal of
Chromatography A. 865 (1999) 111–122.
[50] A.C. Dias-Cabral, N.G. Pinto, J.A. Queiroz, Separation Science and Technology. 37
(2002) 1505–1520.
[51] D.S. Gill, D.J. Roush, R.C. Willson, Journal of Colloid and Interface Science. 167 (1994)
1–7.
[52] W.R. Bowen, D.T. Hughes, Journal of Colloid and Interface Science. 158 (1993) 395–
402.
[53] J.L.M. McNay, J.P.O. Connell, E.J. Fernandez, Biotechnology and Bioengineering. 76
(2001) 233–240.
[54] F.Y. Lin, W.Y. Chen, R.C. Ruaan, H.M. Huang, Journal of Chromatography A. 872
(2000) 37–47.
[55] W.R. Bowen, L.-C. Pan, Journal of Colloid and Interface Science. 189 (1997) 328–336.
[56] M.P. Deutscher, Guide To Protein Purification, in: Methods in Enzymology (1990) 409–
413.
[57] W. Norde, Advances in Colloid and Interface Science. 25 (1986) 267–340.
[58] T.P. Perkins, D.S. Mak, T.W. Root, E.N. Lightfoot, Journal of Chromatography A. 766
(1997) 1–14.
[59] F. Xia, D. Nagrath, S.M. Cramer, Journal of Chromatography A. 1079 (2005) 229–235.
[60] TOSOH Bioscience, Toyopearl Instruction Manual.
[61] W. Norde, C.I. Anusiem, Colloids and Surfaces. 66 (1992) 73–80.
[62] A.J. Sophianopoulos, C.K. Rhodes, K.E. Van Holde, The Journal of Biological
Chemistry. 237 (1962) 1107–1112.
[63] F.Y. Lin, C.S. Chen, W.Y. Chen, S. Yamamoto, Journal of Chromatography A. 912
(2001) 281–9.
[64] A.J. Sophianopoulos, K.E. Van Holde, The Journal of Biological Chemistry. 239 (1964)
2616–2514.
[65] H. Larsericsdotter, S. Oscarsson, J. Buijs, Journal of Colloid and Interface Science. 289
(2005) 26–35.
[66] A. Kondo, K. Higashitani, Journal of Colloid and Interface Science. 150 (1992) 344–351.
64
[67] H. Huang, F. Lin, W. Chen, R. Ruaan, Journal of Colloid and Interface Science. 229
(2000) 600–606.
[68] F. Dismer, J. Hubbuch, Journal of Chromatography. A. 1149 (2007) 312–20.
[69] W.K. Chung, Y. Hou, A. Freed, M. Holstein, G.I. Makhatadze, S.M. Cramer,
Biotechnology and Bioengineering. 102 (2009) 869–81.
[70] W.K. Chung, S.T. Evans, A.S. Freed, J.J. Keba, Z.C. Baer, K. Rege, et al., Langmuir :
the ACS Journal of Surfaces and Colloids. 26 (2010) 759–68.