thermal regeneration of waste foundry phenolic sand in a
TRANSCRIPT

ISSN 1517-7076 artigo e-11983, 2018
Autor Responsável: Johny Anderson Severo Data de envio: 19/03/2017 Data de aceite: 08/06/2017
10.1590/S1517-707620170001.0319
Regeneração térmica de areia fenólica de fundição em leito fluidizado em escala laboratorial Thermal regeneration of waste foundry phenolic sand in a lab scale fluidized bed
Johny Anderson Severo1, Regina Célia Espinosa Modolo
2,
Carlos Alberto Mendes Moraes3, Flávia Schwarz Franceschini Zinani
1
1 Programa de Graduação em Engenharia Mecânica , Universidade do Vale do Rio dos Sinos /UNISINOS, São Leopoldo,
93022-750, RS, Brasil.
e-mail: [email protected], [email protected]. 2 Programa de Graduação em Engenharia Civil, Universidade do Vale do Rio dos Sinos /UNISINOS, São Leopoldo,
93022-750, RS, Brasil.
e-mail: [email protected]. 3 Programa de Graduação em Engenharia Mecânica e Civil, Universidade do Vale do Rio dos Sinos /UNISINOS, São
Leopoldo, 93022-750, RS, Brasil.
e-mail:[email protected]
RESUMO
A disposição inadequada de areia de processos de moldagem após vazamento do metal fundido aumenta os
custos de logística e impacto ambiental por causa da presença da resina fenólica na sua composição. O pro-
cesso de regeneração de resíduos areia fenólica de fundição (RAFF) objetiva a reciclagem deste material.
Como os métodos de regeneração mecânica não são eficientes para garantir 100% de limpeza dos grãos de
areia e sua utilização novamente no processo de moldagem, este trabalho investigou a eficiência de um mé-
todo de regeneração térmica deste tipo de resíduo que pode operar de forma complementar. Um reator de
leito fluidizado em escala de laboratório foi projetado e construído para regenerar RAFF que foi tratada ante-
riormente por um método mecânico. A metodologia utilizada para projetar e construir o protótipo de leito
fluidizado é descrita, assim como a caracterização do resíduo, da areia limpa padrão e da areia regenerada. Os
resultados da regeneração térmica no leito fluidizado foram muito satisfatórios no que concerne a eficiência
de regeneração. Para as nove condições de processos testadas, os valores de perda ao fogo foram reduzidos
quando comparados a areia limpa padrão. Este estudo apresenta as vantagens de uma combinação de dois
processos, regeneração mecânica e térmica, que permite reduzir o tempo e eventualmente a temperatura de
remoção da resina, devido à remoção parcial da camada de resina ou seu enfraquecimento durante o processo
de regeneração mecânica. Das nove condições de processo testadas, seis tiveram perda em valores de ignição
abaixo da CSS. Desta forma, a regeneração térmica nos resultados do leito fluidizado foi bastante satisfatória
em relação à eficiência de regeneração.
Palavras-chave: regeneração térmica, areia usada de fundição, resina fenólica, reciclagem.
ABSTRACT
Improper disposal of sand used in molding processes after casting increases logistical costs and environmen-
tal impact because of the presence of the phenolic resin in its composition. The regeneration process of waste
foundry phenolic sand (WFPS) aims to recycle this material. As mechanical regeneration methods are not
efficient to guarantee 100% cleaning of the sand grains and their use again in the molding process, this work
investigated the efficiency of a method of thermal regeneration of this type of residue that can be employed
as a complementary procedure. A laboratory-scale fluidized bed reactor was designed and built to regenerate
WFPS that was previously treated by a mechanical method. The methodology used to design and construct
the fluidized bed prototype is described, as well as the characterization of the residual, the standard clean
sand and the regenerated sand. The results of the thermal regeneration in the fluidized bed were very satisfac-
tory with respect to the regeneration efficiency. For the nine process conditions tested, loss on ignition values
were reduced when compared to standard clean sand. This study presents the advantages of a combination of

SEVERO, J.A.; MODOLO, R.C.E.; MORAES, C.A.M.; ZINANI, F.S.F. revista Matéria, v.23, n.1, 2018.
two processes, mechanical and thermal regeneration, which allows to reduce the time and eventual tempera-
ture of resin removal due to the partial removal of the resin layer or its weakening during the mechanical re-
generation process. Of the nine process conditions tested, six had loss on ignition values below the CSS.
Thus, the thermal regeneration in the fluidized bed results was quite satisfactory in relation to the regenera-
tion efficiency.
Keywords: Thermal regeneration, sand, phenolic resin, recycling.
1. INTRODUCTION
Requirements of environmental laws have forced foundries to increase the costs associated with the disposal
of molding sands in specialized landfills. The foundry sector generates several types of wastes, including
foundry sands agglomerated with phenolic resins. Waste foundry phenolic sand (WFPS) consists of uniform-
ly sized, high-quality silica sand or lake sand that is bonded to form molds for ferrous (iron and steel) and
nonferrous (copper, aluminum, brass) metal castings. This silica sand is coated with a thin film of burnt car-
bon, residual binder (bentonite, and sea coal, or organic resins by chemically bonding like in the present
work).
The raw sand is normally of a higher quality than the typical bank run or natural sands used in fill
construction sites. In the casting process, molding sands are recycled and reused multiple times. According to
some authors, eventually the recycled sand degrades to the point that it can no longer be reused in the casting
process [1,2]. Studies about recycling examining the application of foundry wastes have been carried out
worldwide. According to several studies, these wastes can be recycled or reused in different ways, in foundry
manufacturing itself or in other industrial processes as building materials [3-7]. The results thereof are useful
to conceive strategies to avoid disposal costs and reduce raw material costs.
Research has also investigated WFPS as partial replacement of fine aggregate in concrete. These findings
suggest that WFPS may be effectively utilized as a partial replacement of fine aggregates in making concrete
of considerable quality, with no adverse effects in terms of mechanical, environmental, and micro-structural
impacts [8-9]. Laboratory studies that looked into physical, geotechnical, and leaching properties of flowable
fills consisting of WFPS, cement, and fly ash mixed to different water contents were performed by Deng and
Tikalsky (2008) [10]. The authors observed that most of the physical properties data fell within narrow rang-
es, although values of copper/aluminum-based WFPS samples might exceed these ranges. Geotechnical
properties of samples of flowable fills containing WFPS in both fresh and hardened phases were evaluated
and observed to be similar to the features of specified flowable fills. The material leaching analyses indicated
that the toxicity of WFPS flowable fills was below regulated criteria, but it should be emphasized that Brazil-
ian Environmental Regulation Agencies are quite strict concerning WFPS recycling because of the presence
of phenol compounds. Nevertheless, thermomechanical methods to regenerate foundry sands have been in-
vestigated in the effort to mitigate the effects of environmental degradation as much as possible, improve
conservation of sand extraction sites, considering in-house recycling as the best solution for valuation of a
waste according to the cleaner production concepts [11,12]. Park et al. (2012) [13] tested two processes for
the recycling and residue stabilization of waste foundry sands, considering the dry mechanical process for
recycling, and the stabilization process for powdered residue. The results showed that coal refuse and sodium
silicate stabilize heavy metals better than other processes may lead to the development of a cost-effective
solution for stabilizing heavy metals in residues. Joseph et al (2017) [14] explored the possibility of reuse
foundry sand considering the economic involved costs and the sand quality. The results showed that the ma-
jor challenge remains the cost investment required to implement reclamation foundries units, mainly the
small ones.
Following the perspective of thermal regeneration of WFPS, this work was carried out in three stages.
The first was the design and construction of a lab scale fluidized bed. The second was WFPS characterization
in order to define performance parameters of thermal regeneration efficiency. The third included experiment
sand evaluation of regeneration efficiency considering various combinations of operational parameters.
2. METHODOLOGY
2.1 MATERIAL
The WFPS analyzed in this work was a waste from a foundry in Rio Grande do Sul, a state in south Brazil.
Before any analysis, the WFPS (Figure 1) was mechanically treated (treatment by regeneration) by a dry
attrition process in which a pneumatic conveying system thrusts a given mass of sand against a stationary

SEVERO, J.A.; MODOLO, R.C.E.; MORAES, C.A.M.; ZINANI, F.S.F. revista Matéria, v.23, n.1, 2018.
plate, thereby partially separating or at least weakening resin layer bonding to the sand surface. To facilitate
separation of the resin, the equipment is provided with a cyclonic separator and a bag filter.
Conventional siliceous sand was tested as comparative material. It is called clean standard sand (CSS).
According to the Brazilian Standard Legislation for Solid Wastes, sands containing phenolic resins used in
foundry have been classified as hazardous waste [15].
Figure 1: Bag containing mechanically treated phenolic sand (WFPS).
2.2 METHODS
2.2.1 Sand samples characterization
Thermogravimetric analysis (TG-DTA) of the WFPS samples was carried out in a BP RB - 3000 – 20 simul-
taneous analyzer. A sample weighing approximately 20 g was placed in a microbalance and heated at a rate
of 10 ºC/min from the room temperature to a final temperature of 1000 ºC under nitrogen flow. The particle
size distribution and density were evaluated according to specific methods for this type of material. Loss on
ignition was evaluated with maximum temperature at 950 ± 10 °C. The microstructure and sphericity of par-
ticles were analyzed using scanning electronic microscopy (SEM) (Zeiss, model EVO LS 15) and Image-J
software. Mean particle sphericity was obtained by the estimation method proposed by Peçanha and Massa-
rani (1986) [16], according to which roundness is calculated based on a ratio of diameters measured in the
microscopic image and using equation (1), with an error of around 7%.
cp
ip
d
d ( 1)
where
ipd is the particle diameter measured, and
cpd is the limited particle diameter.
2.2.2. Sizing of the fluidized bed chamber
i. Pressure loss calculation in the fluidized bed
To calculate the pressure drop along the fluidized bed filled with settled particles, the classical Ergun
equation was employed:

SEVERO, J.A.; MODOLO, R.C.E.; MORAES, C.A.M.; ZINANI, F.S.F. revista Matéria, v.23, n.1, 2018.
TURBULENT
ps
g
m
m
LAMINAR
psm
m
m
fr
d
u
d
u
L
P
2
0
32
0
3
21
75.11
501
(2)
where
∆Pfr is the pressure drop by friction,
Lm is the height of the packed bed,
εm is the porosity of the packed bed,
μ is the dynamic viscosity of the fluid,
u0 is the fluid surface velocity,
Фs is the mean particle sphericity,
dp is the mean particle diameter based on size distribution and
ρg is the gas density.
ii. Minimum fluidization velocity
The minimum fluidization condition was calculated based on a simple balance of forces, assuming
that the set of particles is fluidized at the moment the friction forces achieve the apparent bed weight, as de-
scribed in Equations 3 and 4 [17].
gLAtAtP gsmfmffr 1 (3)
gL
Pgsmf
mf
fr
1 (4)
where
At is the bed cross-sectional area
Lmf is the minimum height of the bed under fluidization
εmf is the bed porosity under minimum fluidization
ρs is the particle density,
ρg is the gas density
g is the acceleration of gravity.
As observed in Equation 4, it is possible to determine the minimum fluidization velocity (umf) using
Equations 2 to determine the longitudinal pressure drop in Equation 4:
g
d
u
d
ugsmf
ps
mfg
mf
mf
ps
mf
mf
mf
1
175.1
1150
2
323
2
(5.
Equation 5 can be used to determine the minimum fluidization velocity if properties of the gas (vis-
cosity and density), bed particles (spherical shape, average diameter and density), and bed porosity under
minimum fluidization are known. The bed porosity under minimum fluidization is usually determined by
empirical correlations. Yet, in some cases the porosity under minimum fluidization assumes a value slightly
higher than the porosity of the packed bed. Given the small discrepancy between these values, they were con-
sidered equivalent. Table 1 (Table 1 – Bed porosity under minimum fluidization (Kunii and Levenspiel,
1991) [17].) lists some experimental values obtained by Leva (1959) [18] for some sand particles under min-
imum fluidization.

SEVERO, J.A.; MODOLO, R.C.E.; MORAES, C.A.M.; ZINANI, F.S.F. revista Matéria, v.23, n.1, 2018.
Table 1: Bed porosity under minimum fluidization (Kunii and Levenspiel, 1991) [17].
MATERIAL PARTICLE DIAMETER (MM)
0,02 0,05 0,07 0,1 0,2 0,3 0,4
Irregular shape sand (Φ=0,67) - 0,6 0,59 0,58 0,54 0,5 0,49
Round shape sand (Φ=0,86) - 0,56 0,52 0,48 0,44 0,42 -
Sand mixture (several shapes) - - 0,42 0,42 0,41 - -
iii. Terminal velocity
Terminal velocity is reached when the drag force on the particles is greater than the weight force ex-
erted by gravity on them.
For non-spherical particles having sphericity between 0.5 and 1, an experimental correlation intro-
duced by Kunii and Levenspiel (1991) [17] was employed to determine the terminal velocity. This correla-
tion is summarized by Equations 6, 7 and 8.
3
1
2
*)(
gsg
pp
gdd (6.
(7)
3
1
2
*
)(
gs
g
ttg
uu
(8)
2.2.3 Thermal regenerator (lab scale fluidized bed)
The thermal regenerator was designed to be a fluidized bed operating in a bubbling regime. A stainless steel
A240 TP 304 cylindrical tube [19] with 101.6 mm of outer diameter and 1.5 mm of wall thickness was used
as the fluidized bed chamber. The chamber height was of 410 mm. The air distributor plate was manufac-
tured using a stainless steel 75-μm mesh. The distributor was held to the tube by means of two screwed
flanges, as shown in Figure 2(a). A coil made of a copper tube 8 mm in internal diameter was built around
the fluidized bed chamber, as shown in Figure 2(b). Four infrared ceramic plate LPG burners were placed
around the chamber. The power of each burner was 2.6 kW. The test bench is depicted schematically in Fig-
ure 3. It is possible to see that the air flow was measured by a flow meter (FT) and controlled by a flow regu-
lator valve. The air flows around the fluidized bed through the coil where it is preheated and then enters the
fluidized bed through the distributor, fluidizing the material and promoting the combustion of the phenolic
resin around the WFPS grains.
1
21*2*
*
)(
7439.13348.2
)(
18
p
s
p
tdd
u

SEVERO, J.A.; MODOLO, R.C.E.; MORAES, C.A.M.; ZINANI, F.S.F. revista Matéria, v.23, n.1, 2018.
Figure 2: Fluidized bed design (a) and fluidized bed prototype (b) designed and built for the experiment.
Figure 3: Bench apparatus (Thermal regenerator and lab scale fluidized bed).

SEVERO, J.A.; MODOLO, R.C.E.; MORAES, C.A.M.; ZINANI, F.S.F. revista Matéria, v.23, n.1, 2018.
i. Air flow
To adjust the compressed air flow rate, a control valve was employed, with a calorimetric transducer
model SD 6050 with response of 4 to 20 mA, capacity of measuring from 0.2 to 75 m³/h calibrated in accord-
ance with ISO 2533 - Standard Atmosphere (ISO 1975) at standard conditions (101.3 kPa, 15 °C, and relative
humidity of 0%).
ii. Temperature and computer-based data acquisition
Mineral insulation thermocouples (type K - chromium (NiCr) - aluminum (NiAl)) were used to meas-
ure temperature. They were positioned next to distributor plate (T1) and close to the burner ceramic plate
(T2). The maximum uncertainty for temperature range from 0 °C to 1260 °C was of ± 0.75%, according to E
230 - Standard Specification and Temperature - Electromotive Force (EMF) Tables for Standardized Ther-
mocouples [20]. The system was monitored by a microcomputer linked to an Agilent data logger system
model 34970.
iii. Regeneration tests and operating conditions
In order to check the performance of the fluidized bed, some tests were carried out with varying air
flow rate and retention time. Nine operating conditions were tested (Table 2. Samples code submitted to the
thermal regeneration and their respective flow rate and treatment time.). All tests were performed with sam-
ples of 1.5 kg of contaminated sand. The sequence of operations for the test was as follows:
a. Insert the sample in the fluidizer chamber;
b. Air flow adjustment (using flow transducer display);
c. Ignition of the heating system (LPG infrared burners);
d. Startup data acquisition program in interval defined to test;
e. End test;
f. Cooling the sample to equalization system under conditions of temperature and humidity;
g. Sample withdrawal.
Table 2: Samples code submitted to the thermal regeneration and their respective flow rate and treatment time.
SAMPLE (ID) FLOW RATE (m3/h) TREATMENT TIME (MIN)
A1 5 15
A2 5 30
A3 5 45
A4 10 15
A5 10 30
A6 10 45
A7 15 15
A8 15 30
A9 15 45
3. RESULTS AND DISCUSSION
For each sample treated as described in Table 2, the regeneration efficiency was determined. The mass
weight loss after thermal regeneration was compared to a standard. A sample of WFPS was subjected to loss
on ignition analysis, which weight loss was taken as the standard for the sand resin conted. The percentage
weight loss of each sample as compared with the standard was assumed as the thermal regeneration
efficiency of that treatment.
The moisture content of all WFPS samples was less than 1%. Figure 4 shows the results for the
Thermogravimetric analysis of the standard sample. The first noticeable mass loss occurred between 60 ºC
and 200 ºC. In this stage, the mass loss is associated mainly with water evaporation. Because of the low

SEVERO, J.A.; MODOLO, R.C.E.; MORAES, C.A.M.; ZINANI, F.S.F. revista Matéria, v.23, n.1, 2018.
moisture content, the mass loss in this stage was low, about 0.2%. The most important mass loss was record-
ed between 200 ºC and 740 ºC. In this stage, the mass loss was of approximately 1.04%. This fraction sup-
posedly consists of the phenolic compounds that volatilize in this range of temperature. The total mass loss
was approximately 1.45%.
The result of a DTA analysis of the standard WFPS sample is depicted in Figure 5. This result re-
vealed two expressive peaks at 573 °C and at 594 °C. The first peak is characteristic of an endothermic reac-
tion, detected at 573 °C. According to the literature, this reaction is probably the α-β quartz polymorphic
transformation [21]. At 594 °C, an exothermic reaction peak was already expected. According to the litera-
ture, this consists of the phenolic resin volatilization temperature [11, 12]. The DTA results were important in
order to establish a minimum treatment temperature for the WFPS. In this work, the minimum treatment for
thermal regeneration was set as 600 °C.
Figure 4: Thermogravimetric analysis of WFPS.
Figure 5: DTA of WFPS.
Figure 6 shows the result for the granulometric distribution of the WFPS based on the percentage of
retained mass. Here, 99% of WFPS particles were retained between meshes of 0.595 mm and 0.074 mm
openings. The mean particle diameter (Sauter diameter) for the WFPS was calculated as 0.233 mm.
The mass density of the WFPS, determined by picnometry, was of 2514 kg/m3. This is a typical value
-1,4
-1,2
-1
-0,8
-0,6
-0,4
-0,2
0
0,2
-50
0
50
100
150
200
250
0
43
73
117
162
207
252
297
342
386
429
472
514
555
597
638
679
719
759
799
840
880
921
962
Mas
s L
oss
(%
)
δ
δm
Temperature °C
Mass first derivative Mass loss
SEVERO, J.A.; MODOLO, R.C.E.; MORAES, C.A.M.; ZINANI, F.S.F. revista Matéria, v.23, n.1, 2018.
for sand mass density, which was expected since the mass percentage of resin in the phenolic sand is about
1%, as detected in the DTA analysis.
The approximate sphericity of the WFPS used in the present work were determined using Scanning
Electron Microscopy (SEM). The original image of a WFPS sample, as shown in Figure 7(a), was treated
using Image-J software and converted to binary, as shown in Figure 7(b) and Figure 8. The mean particle
sphericity, as defined by Equation 1, was calculated via software. The result for mean sphericity was 0.68.
This value is lightly below the values usually found for round sand, which is about of 0.86 [17].
The theoretical value for porosity under minimum fluidization value adopted for calculating the min-
imum fluidization velocity was determined interpolating experimental values shown in Table 1. Using aver-
age particle diameter and sphericity of 0.233 mm and 0.68, respectively, a porosity under minimum fluidiza-
tion of 0.52 was obtained.
The minimum fluidization velocity was obtained using Equation 5. The properties of atmospheric air
according to ISO standard conditions (15°C, 101.3kPa), porosity under minimum fluidization of 0.52, sphe-
ricity of 0.68, bulk density of the solid particles of 2514 kg/m³, and mean particle diameter of 0.233 mm were
employed. The value of 0.066 m/s was obtained for the minimum fluidization velocity. Using the same val-
ues, the terminal velocity was calculated using Equations 6, 7, and 8. A terminal velocity of 0.3111 m/s was
obtained.
Using these results, it was concluded that the airflow rate range of operation was set to 1.8 m3/h (ve-
locity equal to 0.066 m/s) and 8.6 m3/h (velocity equal to 0.31 m/s). This range comprises air velocities
enough high to keep the system fluidized assuring that there would not be particle elutriation. In further tests,
flow rates of up to 15 m3/h have been employed without expressive particle transport, showing that the theo-
retical terminal velocity was not a definitive value in the prediction of particle carrying by the air flow.
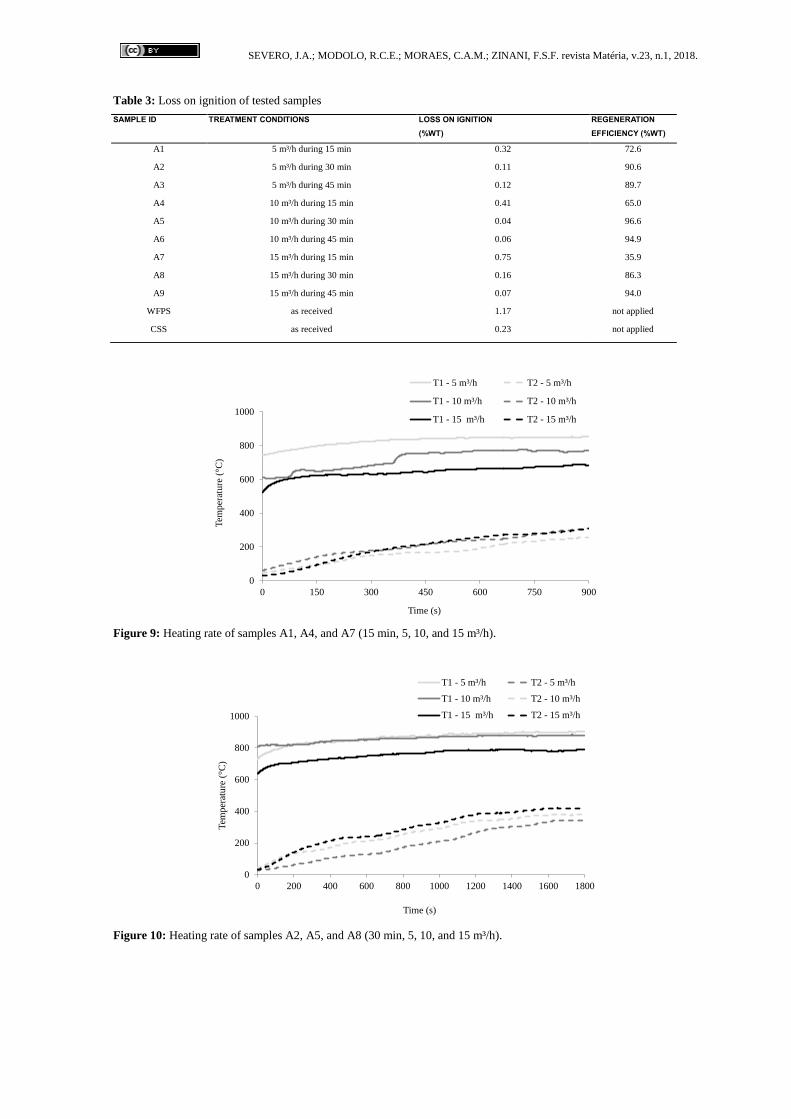
Figures 9, 10 and 11 show how the temperatures on points T1 and T2 changed over time, as measured
by the respective thermocouples. The temperatures were measured at intervals of 1 s. It is possible to see in
Figures 9, 10 and 11 that the temperatures on T1 and T2 stabilized after 30 minutes of test. At this moment,
it may be assumed that the process achieved steady state. Among the treatments employed, as summarized in
Table 2, A1, A4 and A7 lasted 15 minutes, i.e., did not achieve the condition of steady state. For samples A2,
A5 and A8, the treatment time was of 30 minutes, and for samples A3, A6 and A9 a treatment time of 45
minutes was employed, which was longer than the time do achieve steady state.
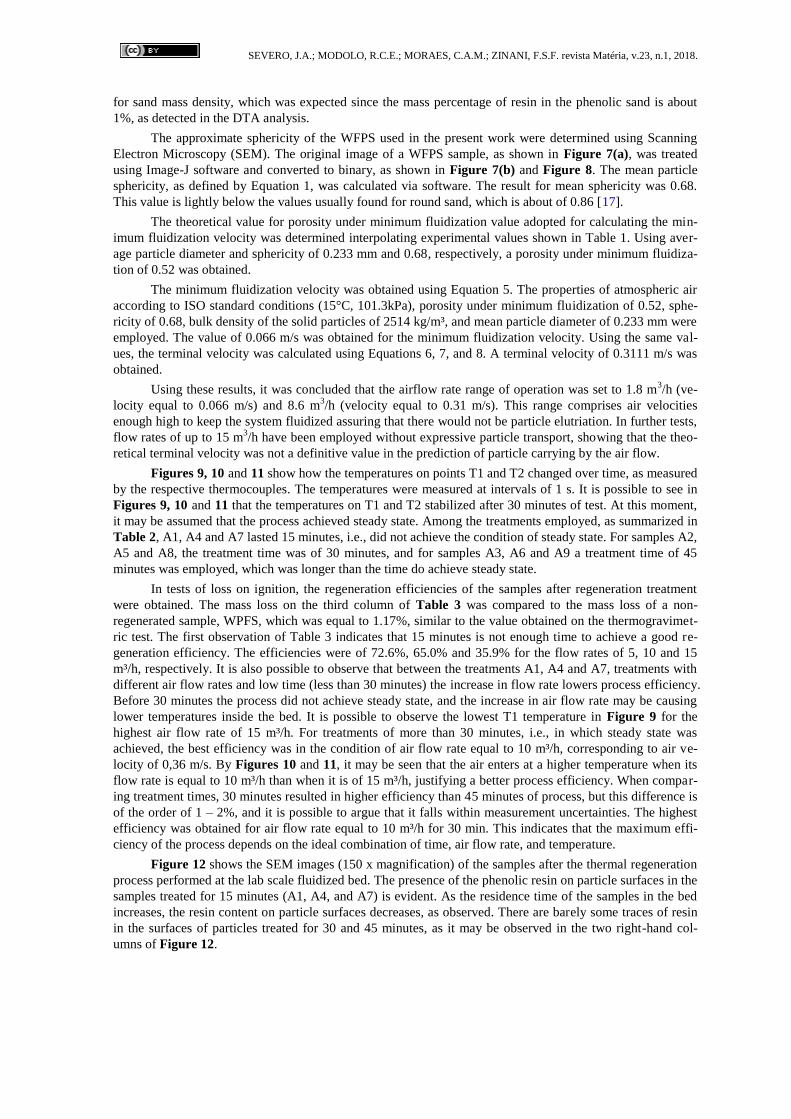
In tests of loss on ignition, the regeneration efficiencies of the samples after regeneration treatment
were obtained. The mass loss on the third column of Table 3 was compared to the mass loss of a non-
regenerated sample, WPFS, which was equal to 1.17%, similar to the value obtained on the thermogravimet-
ric test. The first observation of Table 3 indicates that 15 minutes is not enough time to achieve a good re-
generation efficiency. The efficiencies were of 72.6%, 65.0% and 35.9% for the flow rates of 5, 10 and 15
m³/h, respectively. It is also possible to observe that between the treatments A1, A4 and A7, treatments with
different air flow rates and low time (less than 30 minutes) the increase in flow rate lowers process efficiency.
Before 30 minutes the process did not achieve steady state, and the increase in air flow rate may be causing
lower temperatures inside the bed. It is possible to observe the lowest T1 temperature in Figure 9 for the
highest air flow rate of 15 m³/h. For treatments of more than 30 minutes, i.e., in which steady state was
achieved, the best efficiency was in the condition of air flow rate equal to 10 m³/h, corresponding to air ve-
locity of 0,36 m/s. By Figures 10 and 11, it may be seen that the air enters at a higher temperature when its
flow rate is equal to 10 m³/h than when it is of 15 m³/h, justifying a better process efficiency. When compar-
ing treatment times, 30 minutes resulted in higher efficiency than 45 minutes of process, but this difference is
of the order of 1 – 2%, and it is possible to argue that it falls within measurement uncertainties. The highest
efficiency was obtained for air flow rate equal to 10 m³/h for 30 min. This indicates that the maximum effi-
ciency of the process depends on the ideal combination of time, air flow rate, and temperature.
Figure 12 shows the SEM images (150 x magnification) of the samples after the thermal regeneration
process performed at the lab scale fluidized bed. The presence of the phenolic resin on particle surfaces in the
samples treated for 15 minutes (A1, A4, and A7) is evident. As the residence time of the samples in the bed
increases, the resin content on particle surfaces decreases, as observed. There are barely some traces of resin
in the surfaces of particles treated for 30 and 45 minutes, as it may be observed in the two right-hand col-
umns of Figure 12.

SEVERO, J.A.; MODOLO, R.C.E.; MORAES, C.A.M.; ZINANI, F.S.F. revista Matéria, v.23, n.1, 2018.
Figure 6: WFS particle size distribution.
Figure 7: SEM image of WFPS particles (a) and the WFPS binary image (b).
Figure 8: Particle sphericity analysis.
0
5
10
15
20
25
30
35
40
0,60 0,42 0,30 0,21 0,15 0,11 0,07
Ret
ain
ed m
ass
(%)
Particle size distribution (mm)
a
b
SEVERO, J.A.; MODOLO, R.C.E.; MORAES, C.A.M.; ZINANI, F.S.F. revista Matéria, v.23, n.1, 2018.
Table 3: Loss on ignition of tested samples
SAMPLE ID TREATMENT CONDITIONS LOSS ON IGNITION
(%WT)
REGENERATION
EFFICIENCY (%WT)
A1 5 m³/h during 15 min 0.32 72.6
A2 5 m³/h during 30 min 0.11 90.6
A3 5 m³/h during 45 min 0.12 89.7
A4 10 m³/h during 15 min 0.41 65.0
A5 10 m³/h during 30 min 0.04 96.6
A6 10 m³/h during 45 min 0.06 94.9
A7 15 m³/h during 15 min 0.75 35.9
A8 15 m³/h during 30 min 0.16 86.3
A9 15 m³/h during 45 min 0.07 94.0
WFPS as received 1.17 not applied
CSS as received 0.23 not applied
Figure 9: Heating rate of samples A1, A4, and A7 (15 min, 5, 10, and 15 m³/h).
Figure 10: Heating rate of samples A2, A5, and A8 (30 min, 5, 10, and 15 m³/h).
0
200
400
600
800
1000
0 150 300 450 600 750 900
Tem
per
atu
re (
°C)
Time (s)
T1 - 5 m³/h T2 - 5 m³/h
T1 - 10 m³/h T2 - 10 m³/h
T1 - 15 m³/h T2 - 15 m³/h
0
200
400
600
800
1000
0 200 400 600 800 1000 1200 1400 1600 1800
Tem
per
ature
(°C
)
Time (s)
T1 - 5 m³/h T2 - 5 m³/h
T1 - 10 m³/h T2 - 10 m³/h
T1 - 15 m³/h T2 - 15 m³/h

SEVERO, J.A.; MODOLO, R.C.E.; MORAES, C.A.M.; ZINANI, F.S.F. revista Matéria, v.23, n.1, 2018.
Figure 11: Heating rate of samples A3, A6, and A9 (45 min, 5, 10, and 15 m³/h).
Figure 12: Aspect of WFPS samples after bench tests in the fluidized bed under different conditions (by SEM).
4. CONCLUSIONS
The data obtained in the lab tests using fluidized bed bench scale enable quantifying the increase in efficien-
cy (by 96%) in the regeneration of phenolic sands generated in casting process, when compared to the con-
ventional process of mechanical regeneration.
This methodology will allow not only the valuation of a material considered as a hazardous waste ac-
cording to ABNT NBR 10004/2004 [15] to be recycled in the same process, in which it was generated. This
application will allow the preservation of a non-renewable natural resource, and avoiding its disposal in in-
0
200
400
600
800
1000
0 300 600 900 1200 1500 1800 2100 2400 2700
Tem
per
ature
(°C
)
Time (s)
T1 - 5 m³/h T2 - 5 m³/h
T1 - 10 m³/h T2 - 10 m³/h
T1 - 15 m³/h T2 - 15 m³/h
5 m³/h, 15 minutes (A1) 5 m³/h, 30 minutes (A2) 5 m³/h, 45 minutes (A3)
10 m³/h, 15 minutes (A4) 10 m³/h, 45 minutes (A6)10 m³/h, 30 minutes (A5)
15 m³/h, 45 minutes (A9)15 m³/h, 30 minutes (A8)15 m³/h, 15 minutes (A7)

SEVERO, J.A.; MODOLO, R.C.E.; MORAES, C.A.M.; ZINANI, F.S.F. revista Matéria, v.23, n.1, 2018.
dustrial landfills.
This study also shows the advantages of a combination of two processes, mechanical regeneration and
thermal regeneration, which allows reducing time and eventually temperature of resin removal, because of
the partial removal of the resin layer or its weakening during the mechanical regeneration process.
5. ACKNOWLEDGEMENTS
The authors acknowledge CNPq for the financial support of the research project “Technological Develop-
ment of the Thermomechanical Combined Regeneration of Waste Foundry Phenolic Sand”, during 09/2009,
07/2015 – research call MCT/SETEC/CNPq Nº 67/2008- RHAE - Pesquisador na Empresa, authors grant
holders of CNPq – Brazil, C. Moraes and F. Zinani. Also acknowledge Programa ciência sem fronteiras –
scholarship in the country. Postdoc modality: attracting young talent – BJT -
MEC/MCTI/CAPES/CNPq/FAPs Nº 02/2014, co-author grant holder Regina Célia Espinosa Modolo.
6. BIBLIOGRAPHY
[1] SIDDIQUE, R., KAUR, G., RAJOR, A., “Waste foundry sand and its leachate characteristics”, Re-
sources, Conservation and Recycling, v. 54, n.12, pp. 027-1036, 2010.
[2] SIDDIQUE, R., NOUMOWE, A., “Utilization of spent foundry sand in controlled low-strength materials
and concrete”, Resources, Conservation and Recycling, v. 53, n.1-2, pp. 27-35, 2008.
[3] ZANETTI, M. C., FIORE, S., Foundry processes: the recovery of green moulding sands for core opera-
tions. Resources, Conservation and Recycling, v. 38, pp. 243-254, 2002.
[4] PARK, C-L., KIM, B-G., YU, Y., “The regeneration of waste foundry sand and residue stabilization us-
ing coal refuse”, Journal of Hazardous Materials, v. 203, pp. 176– 182, 2012.
[5] ZANETTI, M.C., GIORDANETTO, L., CLERICI, C., “Recovery of an old landfill: wastes treatment and
recycle”, Proceedings of Seventh International Waste Management and Landfill Symposium Sardinia, pp.
595-600, S. Margherita di Pula, Italy, 1999.
[6] ZANETTI, M.C., CLERICI, C., SANDRIN, D., et al., “Employment of foundry wastes”, Proceedings of
The XXI International Mineral Processing Congress, pp. 9-14, Rome, Italy C12a, 2000.
[7] ŠKVÁRA, F., KAŠTÁNEK, F., PAVELKOVÁ, I., et al., “Solidification of waste steel foundry dust with
Portland cement”, Journal of Hazardous Materials, v. B89, n.1, pp. 67-81, 2002.
[8] SINGH, G., SIDDIQUE, R., “Effect of waste foundry sand (WFS) as partial replacement of sand on the
strength, ultrasonic pulse velocity and permeability of concrete”, Construction and Building Materials, v. 26,
n.1, pp. 416-422, 2012.
[9] BASAR, H.M., AKSOY, N.D., “The effect of waste foundry sand (WFS) as partial replacement of sand
on the mechanical, leaching and micro-structural characteristics of ready-mixed concrete”, Construction and
Building Materials, v. 35, pp. 508-515, 2012.
[10] DENG, A., TIKALSKY, P.J., “Geotechnical and leaching properties of flowable fill incorporating waste
foundry sand”, Waste Management, v. 28, n.11, pp. 2161-2170, 2008.
[11] MOOSHER, L., MORAES, C.A.M., “Regeneração de areia de fundição por método termo-mecânico”,
Proceedings of CONGRESSO ANUAL da ABM 65, Rio de Janeiro. Resumos. Rio de Janeiro, 2010.
[12] GASPAR, R.C., CALHEIRO, D., OLIVEIRA, K.R., et al., “Caracterização de areia de fundição via
tratamento de regeneração termo-mecânico”, FS, Fundição e Serviços, v.30, pp. 80 – 87, 2008. In
Portuguese.
[13] PARK, C.L., KIM, B.G., YU, Y. “The regeneration of waste foundry sand and residue stabilization
using coal refuse”, Journal of Hazardous Materials, v. 203– 204, pp. 176– 182, 2012.
[14] JOSEPH, M.K., BANGANAYI, F., OYOMBO, D. “Moulding sand recycling and reuse in small
foundries”, Procedia Manufacturing, v. 7, pp. 86 – 91, 2017.
[15] BRAZILIAN STANDARD LEGISLATION (ABNT NBR-10004) Solid Wastes – Classification, 2004),
Rio de Janeiro, 71 p, 2004. In Portuguese
[16] PEÇANHA RP, MASSARANI G (1986) Dimensão Característica e Forma de Partículas, In:
Proceedings of the XIV ENEMP, Congresso brasileiro de sistemas particulado 14, pp. 302-312, Rio de
Janeiro.

SEVERO, J.A.; MODOLO, R.C.E.; MORAES, C.A.M.; ZINANI, F.S.F. revista Matéria, v.23, n.1, 2018.
[17] KUNII, D. LEVENSPIEL, O (1991) Fluidization Engineering. Second Edition. Butterworth-
Heinemann.
[18] LEVA, M (1959) Fluidization. Mc-Graw-Hill, New York.
[19] AMERICAN SOCIETY FOR TESTING AND MATERIALS (2004). ASTM A240 / A240M: Standard
Specification for Chromium and Chromium-Nickel Stainless Steel Plate, Sheet, and Strip for Pressure
Vessels and for General Applications. West Conshohocken, 12p.
[20] AMERICAN SOCIETY FOR TESTING AND MATERIALS (2003) ASTM E230: Specification and
Temperature-Electromotive Force (EMF) Tables for Standardized Thermocouples. West Conshohocken,
192p.
[21] MODOLO, R.C.E., TARELHO, L.A.C., TEIXEIRA, E.R., et al., “Treatment and use of bottom bed
waste in biomass fluidized bed combustors”, Fuel Processing Technology, v. 125, pp. 170-181, 2014.