cellulose solutions: dissolution, regeneration, solution
TRANSCRIPT

Luís Carlos Henriques Alves
Tese de doutoramento em Química, ramo de especialização em Química Macromolecular, orientada por
Professor Doutor Björn Lindman e Doutor Filipe Antunes e apresentada à
Faculdade de Ciências e Tecnologia da Universidade de Coimbra
Setembro de 2015
Imagem
Cellulose solutions: Dissolution, regeneration, solution
structure and molecular interactions

Cellulose solutions: Dissolution, regeneration,
solution structure and molecular interactions
Luís Carlos Henriques Alves
Faculdade de Ciências e Tecnologia, Universidade de Coimbra 2015
Tese apresentada à Universidade de Coimbra para apreciação nas provas de Doutoramento em
Química, ramo de Química Macromolecular.


Trabalho desenvolvido no Departamento de Química da Faculdade de
Ciências e Tecnologia da Universidade de Coimbra, sob orientação
científica do Professor Doutor Björn Lindman e
do Doutor Filipe Antunes.


“Education is the most powerful weapon which you can use to change the world.
Education is the great engine of personal development. It is through education that the daughter of a peasant
can become a doctor, that the son of a mineworker can become the head of the mine, that a child of farm
workers can become the president of a great nation.“
Nelson Mandela

Acknowledgments/Agradecimentos
I would like to start by acknowledging Professor Björn Lindman, from Department of
Chemistry of FCTUC and Physical Chemistry 1 of Lund University, for giving me this opportunity
and for sharing his broad scientific knowledge that help me through this work. I would also like to
thank for all the conditions conceded, including the establishment of collaborations, scientific
guidance, design of the work, and for never neglecting the personal part.
I would like to extend my acknowledgments to Dr. Filipe Antunes, from the Department of
Chemistry of FCTUC, for his valuable guidance during this journey and to all the knowledge
transmitted in the polymers field. Thanks for the long friendship, so important to keep the
motivation always in the top.
I also want to express my gratitude to those who gave me the possibility of pursue my research in
collaboration: to Professor Daniel Topgaard from Physical Chemistry 1 of Lund University, for
giving me the opportunity to work in his lab and for sharing his broad scientific knowledge in NMR;
to Professor Ulf Olsson from Physical Chemistry 1 of Lund University for providing me all the
conditions to pursue my work and the kind reception in Lund. Also to Dr. Sanna Gustavsson and Dr.
Göran Carlström (Physical Chemistry 1 of Lund University) for instructing me during the NMR
experiments and to Dr. Manja Behrens Mania (Physical Chemistry 1 of Lund University) for the
kind help during the SAXS investigations.
The work presented was carried out in the Macromolecules, Colloids and Photochemistry group
coordinated by Professor Hugh Burrows, whom I thank for all the conditions provided, and
supported by a grant (SFRH/BD/80556/2011) and a project (PTDC/AGR-TEC/4049/2012) from
Fundação para a Ciência e Tecnologia (FCT, Portugal).
Não poderia deixar de expressar a minha gratidão ao Dr. Bruno Medronho (Universidade do
Algarve) pela inesgotável ajuda a nível científico e pessoal, pelas valorosas discussões científicas e
todos os conselhos que em muito contribuíram para que esta etapa fosse cumprida com sucesso. Este
agradecimento estende-se também ao plano pessoal onde conto com a amizade do Medronho desde
longa data.
Gostaria também de deixar aqui uma palavra de apreço à Professora Maria da Graça Miguel
(departamento de Química da Universidade de Coimbra) pela sua alegria e disponibilidade dada
desde a minha entrada para o grupo de Coloides da Universidade de Coimbra.
O meu agradecimento também ao Professor Artur Valente (departamento de Química da
Universidade de Coimbra) pela ajuda dada no desenvolvimento do trabalho, principalmente na
determinação das constantes de associação entre o catião TBA+ e a β-CD por
1H RMN.
Deixo ainda o meu agradecimento à Dra. Maria Paz e ao Dr. João Ventura (IFIMUP, Universidade
do Porto) por toda a ajuda prestada na obtenção dos espetros de raio-X das diversas amostras de
celulose estudadas.
Ainda dentro da mesma técnica, queria expressar o meu agradecimento ao Professor Vitor
Rodrigues (departamento de Física da Universidade de Coimbra) pela disponibilização do
equipamento de raio-X de pó para o estudo de amostras de celulose.
Deixo também o meu agradecimento ao Dr. Rui Rocha e à Dra. Daniela Silva (CEMUP,
Universidade do Porto) pela ajuda na visualização através de microscopia eletrónica das amostras de
celulose em estado sólido bem como em solução.
Agradeço ainda à Dra. Ermelinda Eusébio (departamento de Química da Universidade de Coimbra)
pela disponibilização do equipamento de FTIR usado no estudo de diferentes amostras de celulose e
nanocristais de celulose.
Gostaria ainda de deixar um agradecimento aos colegas e amigos do Grupo de Coloides da
Universidade de Coimbra (atuais e aqueles que por cá passaram), bem como aos colegas do
departamento de Química da Universidade de Coimbra: Andreia Jorge, Marco Sebastião, Ana
Simões, Carla Varela, Rui Pereira, Rui Cardoso, Carmén Moran, Hélder Tão, Sérgio Silva, Raquel
Teixeira, Tiago Santos, Salomé Santos, Nelson Machado, João Rodrigues, Frederico Baptista, Luís
Magno, Rita Craveiro, Cláudia Duarte, Margarida Trindade, Anabela Simões, Daniel Abegão,
Poonam Singh e Gabriela Martins por muitos bons momentos passados durante os últimos anos. À
Elodie Melro, além de tudo isso agradeço também a ajuda na obtenção dos espetros de FTIR.
Deixo aqui um agradecimento especial à Carolina Costa pelo facto de “não se aproveitar nada”.
Além da alegria contagiante que sempre acompanha a “Karol” a sua inteligência e disponibilidade
muito ajudam todos os dias. Não mudes Karol.
Ao amigo Saul Silva que desde a nossa entrada na Universidade da Beira Interior no longínquo ano
de 2000 tem acompanhado todas as vitórias e derrotas de que se tem composto a minha vida.
Não posso também esquecer os amigos da minha querida terra, os meus amigos de Fafe, destacando
a Amélia e o seu irmão Christophe (ou Cristóvão para os amigos) que desde longa data fazem parte
do meu dia-a-dia.
Um agradecimento muito especial à Solange (a minha Maria) por tudo. Toda a ajuda, paciência,
carinho, todo o apoio dado e também por existir na minha vida. O meu muito obrigado. O finalizar
desta etapa tem muito da tua ajuda.
Finalmente, agradeço àqueles que me acompanham desde o início da minha vida. Os meus pais,
Manuel e Florinda e os meus irmãos, Daniel e Miguel que constituíram e constituem os alicerces de
tudo. Obrigado por sempre me proporcionaram todas as condições para crescer física e
intelectualmente e transmitirem todos os valores essenciais de um ser Humano.

Contents
Abstract .............................................................................................................................................................xv
Resumo ........................................................................................................................................................... xvii
CHAPTER 1 ......................................................................................................................................................1
Introduction .........................................................................................................................................................1
General aspects ...............................................................................................................................................1
Structure and properties of cellulose ...............................................................................................................3
Processing cellulose ........................................................................................................................................5
Solvents for cellulose ......................................................................................................................................5
Mechanisms of dissolution ..............................................................................................................................9
Role of cellulose interactions in dissolution and regeneration: Amphiphilicity and Hydrophobic
Interactions ....................................................................................................................................................12
Motivation and scope ........................................................................................................................................16
CHAPTER 2 ....................................................................................................................................................19
Materials and Methods ......................................................................................................................................19
Materials ........................................................................................................................................................19
Sample preparation........................................................................................................................................20
Experimental techniques ...............................................................................................................................21
Polarized light microscopy .......................................................................................................................21
Scanning Electron Microscopy .................................................................................................................23
X-Ray diffraction ......................................................................................................................................26
Optical transmittance measurements ........................................................................................................29
Rheometry .................................................................................................................................................30
Fourier Transform Infrared spectroscopy (FTIR) .....................................................................................33
Nuclear Magnetic Resonance ...................................................................................................................35
Dynamic Light Scattering .........................................................................................................................38
CHAPTER 3 ....................................................................................................................................................41
Results and discussion .......................................................................................................................................41
3.1 - Cellulose derivatives: Crystallinity and solution state. .........................................................................41

3.2 - Polarization transfer solid-state NMR: A new method for studying cellulose dissolution ...................53
3.3 - Cellulose dissolution in alkali medium .................................................................................................59
Effect of additives on dissolution in cold alkali systems ..........................................................................64
Tuning the solvent quality: role of salt and urea .......................................................................................71
3.4 - Cellulose dissolution in acidic medium ................................................................................................74
3.5 - Stability of cellulose dopes: Role of cyclodextrins and surfactants. .....................................................83
Stability of cellulose solutions: influence of cyclodextrins ......................................................................84
Stability of cellulose solutions: role of surfactants ...................................................................................91
3.6 - Regenerated materials: Solvent effect ..................................................................................................94
Alkaline solvents ......................................................................................................................................95
Acidic solvents ..........................................................................................................................................98
CHAPTER 4 ....................................................................................................................................................103
Conclusions .....................................................................................................................................................103
CHAPTER 5 ....................................................................................................................................................105
References .......................................................................................................................................................105
Abbreviations
AESO – acrylated epoxidized soybean oil
AFM – atomic force microscopy
AGU – anhydroglucopyranose unit
APG – alkyl-polyglucoside
ATR – attenuated total reflectance
CD – cyclodextrin
CMC – carboxymethyl cellulose
CNCs – cellulose nanocrystals
CP – cross polarization
CP/MAS – cross-polarization/magic angle spinning
CrI – crystallinity index
CVM – continuous variation method
DLS – dynamic light scattering
DMAc – N,N-dimethylacetamide
DMF – N,N-dimethylformamide
DMSO – dimethyl sulfoxide
DNA – deoxyribonucleic acid
DP – direct polarization
D.S. – degree of substitution
EDS – energy-dispersive spectrometry
FTIR – fourier transform infrared spectroscopy
HPMC – hydroxypropyl methylcellulose
ILs – ionic liquids
INEPT – insensitive nuclei enhanced by polarization transfer
LOI – lateral order index
MAS - magic angle spinning
MCC – microcrystalline cellulose
MD – molecular dynamics
NaCMC – Carboxymethyl cellulose sodium salt
NMMO – N-methylmorpholine-N-oxide
NMR – nuclear magnetic resonance
PEG – polyethylene glycol
PCS – photon correlation spectroscopy
PLM – polarized light microscopy
PT ssNMR – polarization transfer solid state nuclear magnetic resonance
SEM – scanning electron microscopy
TBAF – tetrabutylammonium fluoride
TBAH – tetrabutylammonium hydroxide
TBA+ – tetrabutylammonium ion
TBPH – tetrabutylphosphonium hydroxide
TCI – total crystallinity index
TEM – transmission electron microscopy
TPPM – two pulse phase modulation
UV/VIS – ultraviolet/visible absorption spectroscopy
XRD – X-ray diffraction

xv
Abstract
Massive amounts of biomass are produced every year, including millions of tons of cellulose.
This almost inexhaustible resource is thus as a stupendous viable alternative for conventional raw
materials to be applied in a wide range of areas. Cellulose finds uses in applications of the major
interest nowadays ranging from fiber production (textiles), to packaging and biofuels. Nevertheless,
in order to produce most of these end products cellulose needs to be dissolved. Dissolution is a very
non-trivial and challenging process; cellulose solvents are of remarkable different nature and thus
the understanding of the delicate balance between the different interactions involved becomes
difficult but essential.
Nowadays there is a discussion going on in literature on the balance between hydrogen bonding and
hydrophobic interactions in controlling the solution behavior of cellulose. The commonly accepted
picture considers hydrogen bonding as the critical factor to understand the insolubility of cellulose.
A recent view rather highlights the role of hydrophobic interactions in cellulose insolubility.
In this treatise new evidences pointing out to the role of hydrophobic interactions on the solubility
and regeneration behavior of cellulose are discussed. Using a set of different techniques and
approaches the effect of selected additives on the rate and performance of dissolution of cellulose
are explored.
It was found that the influence of amphiphilic additives on the thermal stability and gelation of
cellulose dopes in alkali-based solvents are illustrative examples of the amphiphilic character of the
cellulose. Further experimental support comes from the enhancement in cellulose dissolution when
using an amphiphilic cation instead of an inorganic cation. The quality of the amphiphilic solvent
can also be tuned by addition of salts or cyclodextrins. The former is rationalized in terms of
polyelectrolyte effect where salt is suggested to screen cellulose charges in strong alkali based
systems while the later can be understood by specific cyclodextrin-amphiphilic ”host-guest”
interactions.
On the other hand acidic solvents reveal great efficiency to dissolve cellulose but chemical
degradation occurs to some extent. The understanding of the solution state and the molecular
organization is usually complicated. Additionally, the typical extremely low pH in cellulose dopes
containing high acid concentrations limits the use of many techniques. In this respect, new
methodologies were developed such as PT ssNMR, which has shown to be a very capable technique
providing detailed molecular information of cellulose solutions.
xvi
Cellulose is partially a crystalline polymer where the amorphous fraction varies according to the raw
material source, pre-treatments, etc. In a parallel work, the extraction of cellulose nanocrystals
(CNCs) from cellulose derivatives was also evaluated. Surprisingly, the cellulose derivatives were
found to be significantly crystalline as indicated by an unusual extraction of CNCs. However, while
the microcrystalline cellulose (MCC starting material) and the extracted CNCs share the same
crystalline organization (cellulose I polymorph), the cellulose derivatives (starting materials) were
found to be of cellulose II type. Data shows that there are specific parts of cellulose that remain
insoluble during all the modification process.
The influence of different solvents over the level of dissolution of cellulose samples and the
properties of the regenerated materials from these solutions are also discussed. It was found that
solvents using amphiphilic cations are able to dissolve cellulose to a state of molecular dispersed
solutions or close, contrary to inorganic cations, which are not so effective, leading to a colloidal
aggregates solution. This level of dissolution results in a completely different regenerated materials,
with different crystallinity indexes. All together these results support the importance of the
amphiphilic character of cellulose and suggest that an effective dissolution strategy should strongly
consider the role of hydrophobic interactions.
KEYWORDS: Cellulose dissolution, Hydrophobic interactions, Hydrogen bonding, Amphiphilicity,
Solvents, Gelation, PT ss NMR.

xvii
Resumo
Sendo a celulose um recurso praticamente inesgotável, pois são geradas por ano milhares de
toneladas de biomassa, esta apresenta-se como uma estupenda alternativa a matérias-primas
convencionais num vasto número de aplicações. Produção de fibras têxteis, embalagens inovadoras
e biocombustíveis são apenas alguns exemplos de elevado interesse nos dias que correm. Contudo,
para se obterem muitos destes produtos finais é necessária a sua dissolução. Esse passo de
dissolução da celulose é altamente desafiador e nada trivial; os solventes para a celulose são da mais
variada natureza e, deste modo, um bom entendimento sobre o delicado balanço entre as diferentes
interações moleculares envolvidas é complicado mas essencial.
Atualmente existe uma intensa discussão na comunidade científica acerca do balanço entre o efeito
das ligações de hidrogénio e das interações hidrofóbicas no comportamento da celulose em solução.
O conceito de que as ligações de hidrogénio eram o factor fundamental no comportamento da
celulose e eram as principais responsáveis pela sua insolubilidade foi dominante durante um longo
período de tempo. No entanto, esta problemática foi recentemente revista e chamada a atenção para
o papel das interações hidrofóbicas na insolubilidade da celulose.
No presente estudo são descritas algumas evidências que reforçam o papel das interações
hidrofóbicas no comportamento da celulose durante o processo de dissolução e regeneração. A partir
de um conjunto de considerações e técnicas de caracterização reportam-se os efeitos de aditivos
específicos sobre a eficiência e grau de dissolução da celulose.
Verificou-se que a estabilidade térmica das soluções em solventes de base alcalina aumenta na
presença de aditivos de polaridade intermédia e que aditivos anfifílicos previnem a gelificação das
soluções; estes são exemplos ilustrativos do carater anfifílico da celulose. Outras evidências
experimentais que suportam esse argumento provêm do aumento da eficiência de dissolução quando
se usam catiões anfifílicos em vez de catiões inorgânicos no sistema de solvente. Observou-se ainda
que a qualidade dos solventes anfifílicos pode ser alterada por adição de sais ou ciclodextrinas. A
adição de sais pode ser racionalizada em termos de efeito de supressão de cargas dos grupos
ionizados em meio fortemente alcalino, enquanto o efeito das ciclodextrinas pode ser entendido
como a formação de um complexo ciclodextrinas-entidade anfifílica que diminui a disponibilidade
da mesma em solução.
Por outro lado, os solventes ácidos são muito eficazes a dissolver celulose, no entanto a dissolução é
muitas vezes acompanhada por degradação química. O entendimento da organização molecular nas
soluções de celulose é normalmente complicado. Além disso o pH da solução (extremamente baixo),
devido à elevada concentração de ácido em solução, limita a aplicação de um elevado número de
xviii
técnicas. Contudo, a ressonância magnética com transferência de protão em estado sólido (PT
ssNMR) revelou-se uma técnica muito eficaz, revelando importante informação ao nível molecular
das soluções de celulose. Demostrou-se ainda ser uma excelente técnica para detetar, e identificar,
possíveis produtos provenientes da degradação da celulose em solução.
Reporta-se também a extração de nanocristais de celulose (CNCs) a partir de uma fonte pouco
comum. Surpreendentemente os derivados de celulose mostraram-se significativamente cristalinos,
contrariamente ao expectável, possibilitando a extração de CNCs. Porém, enquanto a celulose
microcristalina (material de partida) e os nanocristais extraídos partilham o mesmo tipo de
organização molecular (polimorfo de celulose I), os derivados de celulose (materiais de partida)
apresentam uma organização molecular diferente (polimorfo de celulose II). Os resultados
demonstram que existem áreas específicas das cadeias de celulose que permanecem insolúveis
durante todo o processo de modificação (que envolve um passo de dissolução). Estes resultados
estão de acordo com a ideia de que existe apenas um número muito limitado de solventes capazes de
dissolver a celulose a um nível molecular.
A influência do uso de solventes com diferentes características no grau de dissolução das amostras
terá certamente implicações nas propriedades dos materiais regenerados. Verificou-se que diferentes
níveis de dissolução resultam em materiais regenerados com diferentes morfologias e diferentes
cristalinidades. Catiões anfifílicos levam a morfologias mais suaves e materiais regenerados menos
cristalinos, o que mais uma vez coloca em realce o carater anfifílico da celulose.
Palavras-chave: Dissolução de celulose, interações hidrofóbicas, ligações de hidrogénio,
anfifilicidade, solventes, gelificação, PT ss NMR.
1
CHAPTER 1
Introduction
General aspects
Consumers, industry and governments are increasingly demanding products
from renewable and sustainable resources that are biodegradable, non-petroleum based,
carbon neutral and, at the same time, generating low environmental, animal/human
health and safety risks [1]. In this context, there is almost not any other raw material
that offers such a broad variety of applications such as cellulose, the most biodegradable
and abundant biopolymer on earth with an estimated annual synthesis in nature of ca.
1011
-1012
tons [2]. Cellulose is major component of wood, a widely used construction
material, but it is also used in the form of natural textile fibers, such as cotton or flax, or
in the form of panels and paper. Native cellulose is also a versatile starting material for
subsequent chemical modification for the production of a variety of cellulose
derivatives with applications in several areas such as food, printing, cosmetic,
detergents, enhanced oil recovery, textile, pharmaceutical and domestic life [3, 4], but
also for the production of regenerated cellulose-based threads and films [5]. Cellulose is
a particularly stable polysaccharide; its stability, mainly due to the crystallinity
presented, turns cellulose resistant to hydrolysis by weak acids and bases and also to the
2
hydrolytic action of enzymes because the glycosidic linkages are not readily accessible
from microorganisms and fungi.
Although biopolymers are promising options for many applications, a major concern is
in many cases a limited solubility in water (and cellulose is a clear example of it) which
makes their processing challenging. The solubility of the materials can be to some
extent anticipated just from a structural analysis. However, this not always holds.
Proteins, DNA or polysaccharides are made of small and water soluble blocks; and if
one takes the example of cellulose, it is composed of repeating anhydroglucose units
where each unit contains three hydroxyl groups (see figure 1.1). Despite its notable
global hydrophilic character, cellulose is insoluble in water and in most common
solvents [6-8]; it is relatively consensual that due to the elevated number of hydroxyl
groups present in cellulose it can form a highly ordered network of intermolecular and
intramolecular hydrogen bonds. This hydrogen bonding based mechanism, essentially
represents the established vision on cellulose recalcitrance to dissolution [9]. Hydrogen
bonding is typically pointed to explain cellulose molecular association in other systems,
even in aqueous systems. In literature, the double helix association in DNA is
sometimes suggested to be caused by hydrogen bonding [10]. However, a recent and
more accurate view, of the double helix association shows that its association is mostly
driven by hydrophobic interactions between the neighbouring stacks of base-pairs that,
in general, cause the association and helix formation [11]. Definitely, hydrogen bonds
are expected to occur, but are rather responsible for the structural selectivity of the
associated state, while the driving force for association are the hydrophobic interactions.
A similar thought can be applied to the cellulose case. Cellulose presents a structural
anisotropy (discussed below) and therefore it is unclear why there is a substantial gain
in free energy in moving a molecule with hydrogen bond capabilities such as water (that
can act both as acceptor and donor in hydrogen bonding) from an aqueous medium to a
less polar environment. The idea, that the insolubility of cellulose is only driven by
hydrogen bonding, was recently revisited and it has been argued that hydrophobic
interactions play an important role on cellulose solubility pattern. This alternative but
complementary view is important in order to understand the molecular mechanisms for
association in an aqueous media and develop suitable solvents for dissolution [6, 12,
13].
3
Structure and properties of cellulose
Cellulose is the major component of the cell walls of plants having an
undisputed role among the raw materials to be used in a sustainable future. In the cell
walls it is typically combined with lignin and hemicelluloses and water [14] but
cellulose can also be synthesized by bacteria or tunicates. Cellulose was isolated for the
first time by the French chemist Payen in 1838 [15] who extracted it from green plants
and reported its elemental composition four years later [8].
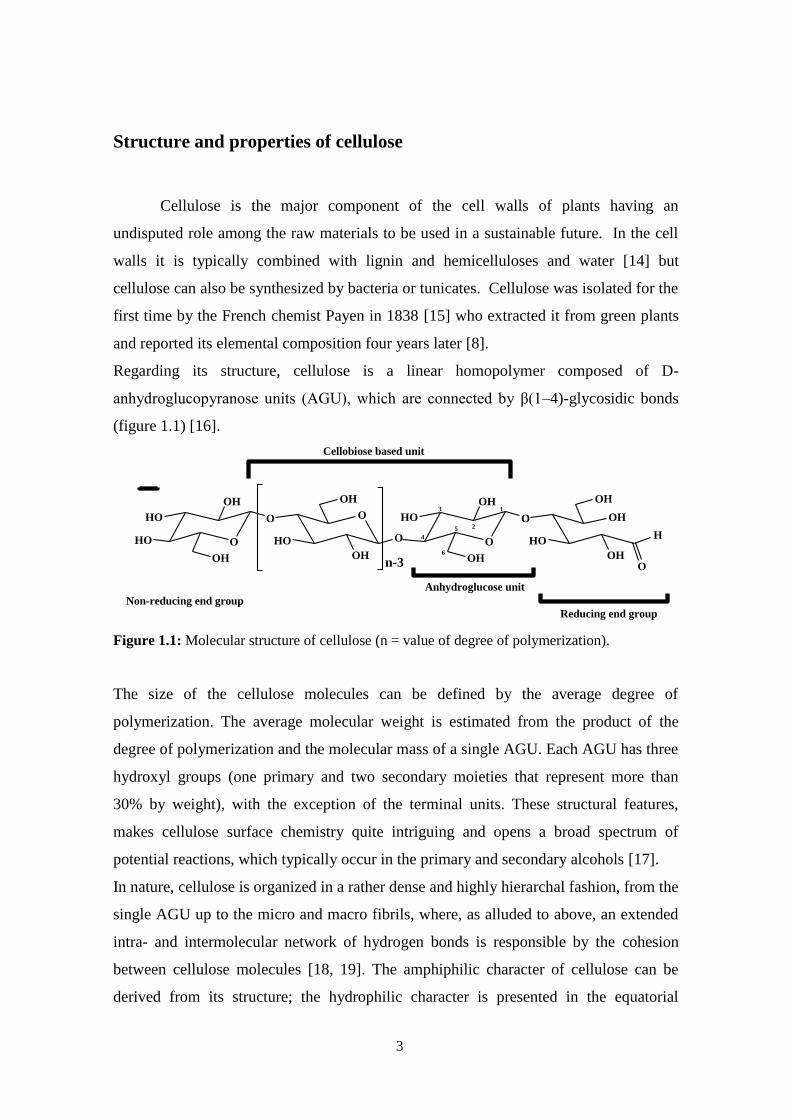
Regarding its structure, cellulose is a linear homopolymer composed of D-
anhydroglucopyranose units (AGU), which are connected by β(1–4)-glycosidic bonds
(figure 1.1) [16].
Figure 1.1: Molecular structure of cellulose (n = value of degree of polymerization).
The size of the cellulose molecules can be defined by the average degree of
polymerization. The average molecular weight is estimated from the product of the
degree of polymerization and the molecular mass of a single AGU. Each AGU has three
hydroxyl groups (one primary and two secondary moieties that represent more than
30% by weight), with the exception of the terminal units. These structural features,
makes cellulose surface chemistry quite intriguing and opens a broad spectrum of
potential reactions, which typically occur in the primary and secondary alcohols [17].
In nature, cellulose is organized in a rather dense and highly hierarchal fashion, from the
single AGU up to the micro and macro fibrils, where, as alluded to above, an extended
intra- and intermolecular network of hydrogen bonds is responsible by the cohesion
between cellulose molecules [18, 19]. The amphiphilic character of cellulose can be
derived from its structure; the hydrophilic character is presented in the equatorial
O
OH
OH
OHOO
OH
OH
OHO
HO
OH
OH
OH
HHOO
OH
OH
OHO
On-3
Cellobiose based unit
Reducing end group
Non-reducing end group
Anhydroglucose unit
1
2
3
4
5
6
4
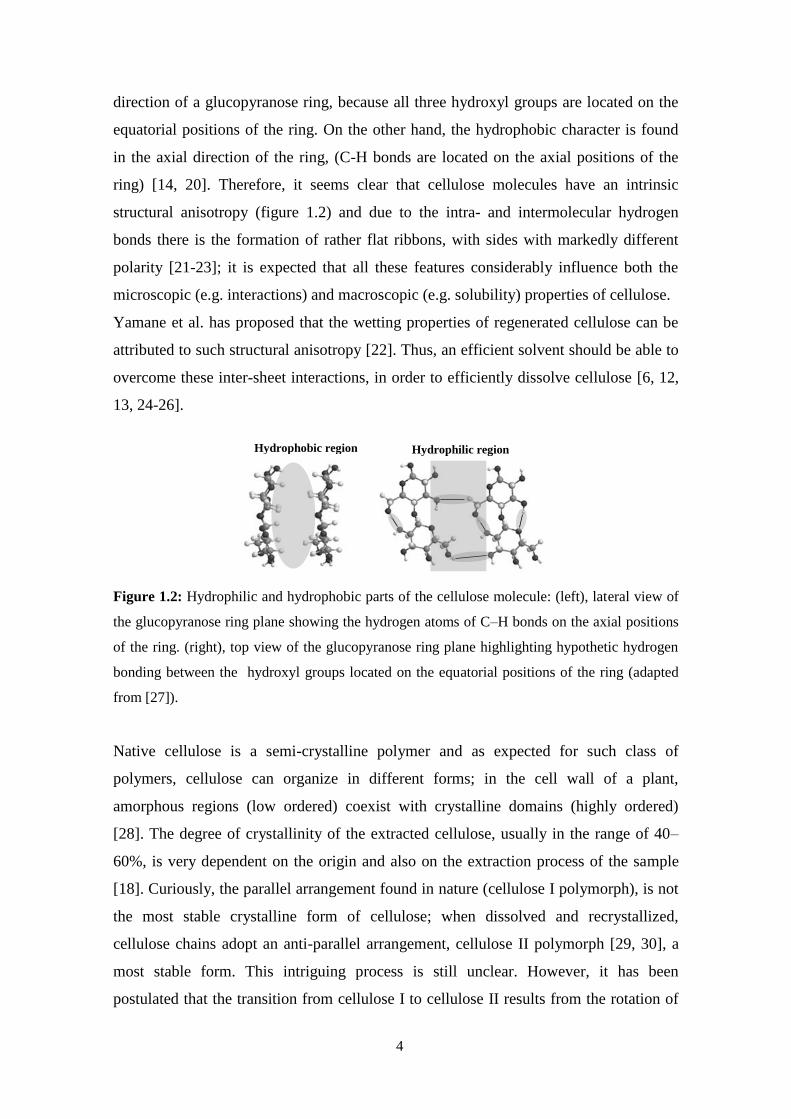
direction of a glucopyranose ring, because all three hydroxyl groups are located on the
equatorial positions of the ring. On the other hand, the hydrophobic character is found
in the axial direction of the ring, (C-H bonds are located on the axial positions of the
ring) [14, 20]. Therefore, it seems clear that cellulose molecules have an intrinsic
structural anisotropy (figure 1.2) and due to the intra- and intermolecular hydrogen
bonds there is the formation of rather flat ribbons, with sides with markedly different
polarity [21-23]; it is expected that all these features considerably influence both the
microscopic (e.g. interactions) and macroscopic (e.g. solubility) properties of cellulose.
Yamane et al. has proposed that the wetting properties of regenerated cellulose can be
attributed to such structural anisotropy [22]. Thus, an efficient solvent should be able to
overcome these inter-sheet interactions, in order to efficiently dissolve cellulose [6, 12,
13, 24-26].
Figure 1.2: Hydrophilic and hydrophobic parts of the cellulose molecule: (left), lateral view of
the glucopyranose ring plane showing the hydrogen atoms of C–H bonds on the axial positions
of the ring. (right), top view of the glucopyranose ring plane highlighting hypothetic hydrogen
bonding between the hydroxyl groups located on the equatorial positions of the ring (adapted
from [27]).
Native cellulose is a semi-crystalline polymer and as expected for such class of
polymers, cellulose can organize in different forms; in the cell wall of a plant,
amorphous regions (low ordered) coexist with crystalline domains (highly ordered)
[28]. The degree of crystallinity of the extracted cellulose, usually in the range of 40–
60%, is very dependent on the origin and also on the extraction process of the sample
[18]. Curiously, the parallel arrangement found in nature (cellulose I polymorph), is not
the most stable crystalline form of cellulose; when dissolved and recrystallized,
cellulose chains adopt an anti-parallel arrangement, cellulose II polymorph [29, 30], a
most stable form. This intriguing process is still unclear. However, it has been
postulated that the transition from cellulose I to cellulose II results from the rotation of
Hydrophobic region Hydrophilic region
5
the chains in the sheets of a microfibril around their axes, leading only to two variations
of the dihedral angle at the glycosidic linkage [28, 31]. This transition can be induced
for example by mercerization of the cellulose in alkali solutions [32].
Processing cellulose
Processing cellulose is usually a challenging step during the productive process.
Cellulose is not a meltable polymer; the degradation temperature is lower than the
melting temperature. Native cellulose, the majority of modified celluloses, as well as
regenerated cellulose are not thermoplastic. Only a few cellulose derivatives display
thermoplastic behaviour such as cellulose ethers (e.g. methyl cellulose, ethyl cellulose,
hydroxyl ethyl cellulose, hydroxylpropyl cellulose, etc.) and cellulose esters such as
cellulose alkanoates. Mixed cellulose esters showed limited thermoplastic processability
[33].
Recent studies show that the degradation process is influenced by the crystallinity of the
cellulose; generally it is initiated in the cellulose amorphous regions and thus, the
smaller the size of the crystalline domains the lower the thermal stability of the sample
[34]. Cellulose from the same origin can have different thermal stabilities depending on
the extraction procedure.
The alternative to melt cellulose is to dissolve it. Although there are many different
solvents for cellulose, dissolution is very challenging step. Most of the solvent systems
known have a limited capacity of dissolution (i.e. only a few percent of cellulose), are
toxic and expensive, thus limiting their industrial uses.
Solvents for cellulose
As mentioned, cellulose is neither meltable nor soluble in usual solvents; water
and typical organic solvents fail in this respect [12, 35]. However, this biopolymer is
soluble in more striking media, several with no apparent common properties [36]. The
huge difficulty in dissolution process can be attributed to the complexity of such a
6
biopolymeric network, the partial crystalline structure and the extended non covalent
interactions among molecules, turning the chemical processing rather difficult.
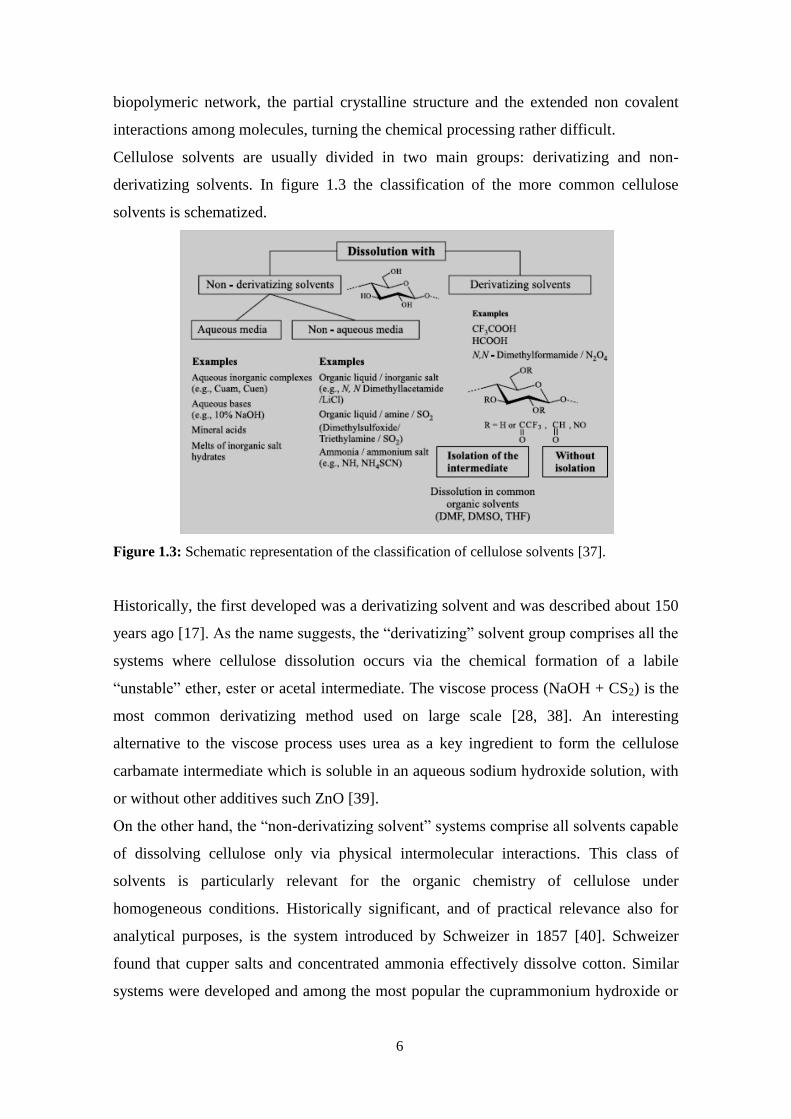
Cellulose solvents are usually divided in two main groups: derivatizing and non-
derivatizing solvents. In figure 1.3 the classification of the more common cellulose
solvents is schematized.
Figure 1.3: Schematic representation of the classification of cellulose solvents [37].
Historically, the first developed was a derivatizing solvent and was described about 150
years ago [17]. As the name suggests, the “derivatizing” solvent group comprises all the
systems where cellulose dissolution occurs via the chemical formation of a labile
“unstable” ether, ester or acetal intermediate. The viscose process (NaOH + CS2) is the
most common derivatizing method used on large scale [28, 38]. An interesting
alternative to the viscose process uses urea as a key ingredient to form the cellulose
carbamate intermediate which is soluble in an aqueous sodium hydroxide solution, with
or without other additives such ZnO [39].
On the other hand, the “non-derivatizing solvent” systems comprise all solvents capable
of dissolving cellulose only via physical intermolecular interactions. This class of
solvents is particularly relevant for the organic chemistry of cellulose under
homogeneous conditions. Historically significant, and of practical relevance also for
analytical purposes, is the system introduced by Schweizer in 1857 [40]. Schweizer
found that cupper salts and concentrated ammonia effectively dissolve cotton. Similar
systems were developed and among the most popular the cuprammonium hydroxide or
7
simply “cuam” is widely used for degree of polymerization estimation by viscosity
determination [41]. In the beginning of 19th century, ethylenediamine was found to be a
good alternative to ammonia and also other complexing solvents were designed, such as
the cadmium hydroxide in aqueous ethylenediamine, “cadoxen”, or nickel oxide in the
same aqueous ethylenediamine, “nioxen” [36, 42, 43]. Similar alternative systems have
been reported using mainly other transition metals (such as zinc or palladium) combined
with an amine or ammonium compound. However, none of these systems have achieved
full commercial success [36].
Sobue et al. introduced a new approach and since this work it is known that cellulose is
soluble in aqueous NaOH below 268 K within a specific concentration range of NaOH
(7–10%) [44]. This system is cheap, potentially non-polluting, uses very common
chemicals and relatively easy to handle. However these aqueous alkali systems do not
completely disrupt the semicrystalline regions of cellulose and the solubility is limited
to cellulose of relatively low degree of polymerization (up to ca. 250). The apparent
solubility also depends on the degree of crystallinity and the crystalline arrangement.
Pre-treatments such as steam explosion of the dissolving pulp have been successfully
used to improve dissolution [45]. Other aqueous systems using bases, such as LiOH
[46], or quaternary ammonium hydroxides are also capable of dissolving cellulose [28,
36, 47]. More lately, the aqueous NaOH solutions were doped with additives such as
polyethylene glycol, PEG [48], urea [49] and thiourea [50] and reported to enhance
dissolution ratio and the stability of the dope.
In 1932 Letters et al. investigated the swelling and dissolution of cellulose in highly
concentrated aqueous zinc chloride solution; dissolution was only observed for salt
concentrations above 63% (w/w) [51]. Several concentrated aqueous salts solutions
were studied, however, only three water/salt systems were described as effective
cellulose solvents: Ca(SCN)2/H2O [52], LiSCN/H2O [17] and ZnCl2/H2O [53]. Then
Ca(SCN)2·3H2O showed the strong swelling and solvent action on cellulose [54].
Mixtures of NaSCN/KSCN with Ca(SCN)2·3H2O or dimethyl sulfoxide (DMSO) were
also found to be able to dissolve cellulose. The molten system LiSCN·2H2O is
described as an efficient cellulose solvent [37]. Recently, Leipner et al. reported that
LiClO4·3H2O is a very effective solvent giving transparent cellulose solutions within a
few minutes without any pre-treatment or activation [55]. In addition, mixtures of
LiClO4·3H2O with Mg(ClO4)2·H2O or MgCl2.6H2O are also promising solvents [56].

8
Also non-aqueous systems are apt to dissolve cellulose. Again, the solvent spectrum is
large and the number of possible combinations is large. The first developed systems are
composed of selected ammonium salts with some simple inorganic compounds, such as
SO2 and NH3, and can indeed be considered as the origin of two large groups of non-
derivatizing non-aqueous solvent systems [36]. The first group generally comprises
mixtures of a polar inorganic liquid, SO2, and an amine (primary, secondary, tertiary
aliphatic or secondary alicyclic) [37]. Otherwise, the sulfur component can be modified
to SOCl2. Appropriate polar liquids employed are for example N,N-dimethylformamide
(DMF), DMSO, N,N-dimethylacetamide (DMAc) or formamide. From the ample
diversity of possible mixtures, DMSO/SO2/diethylamine is one of the most versatile
[57].
Among the polar liquids DMSO gained relevance due to the low toxicity presented;
relevant mixtures of two-component solvents containing DMSO [37] such as
DMSO/methylamine, DMSO/KSCN, DMSO/CaCl2, DMSO/formaldehyde and
DMSO/substituted ammonium fluorides, such as tetrabutylammonium fluoride, TBAF
(recently reported as a powerful solvent system capable of dissolving cellulose of
reasonably high degree of polymerization (650) in a couple of minutes without any pre-
treatment at room temperature [58]) were developed. Systems using lithium salts in
non-aqueous solutions are also very useful for cellulose analysis and for the preparation
of a wide variety of derivatives. In this regard, the DMAc/LiCl mixture, developed by
McCormick, should be highlighted [59].
The Lyocell process, whose commercial potential has been demonstrated and is now
applied in large scale, is based in the use of N-methylmorpholine-N-oxide (NMMO) as
cellulose solvent, which emerged as the best of the amine-oxides in the late 1970's [17].
Solutions with up to 23 wt.% of cellulose can be obtained by dissolving the biopolymer
in NMMO aqueous mixtures, and subsequently removing water under vacuum.
Nevertheless, two main problems are still associated with the NMMO process; the
instability of the solvent which demands major investments in safety technology and the
tendency of the regenerated fiber towards fibrillation [60].
Another group of chemical compounds with high potential to dissolve cellulose are
ionic liquids (ILs). Systems containing ILs were first employed by Graenacher, in the
form of N-alkylpyridinium salts, for the dissolution of cellulose and as media for
homogeneous chemical reactions [68]. Their potential was neglected for almost seventy
years before the work of Swatloski et al. where several low melting ionic liquids (below
9
100 °C) were reported as cellulose solvents [61]. This work open a new and exciting
field in cellulose research and, since then, a huge variety of ILs has been developed. It is
important to note that the number of potential ion combinations available is estimated to
provide around 1012
ILs [62]. Currently, the most efficient ILs for cellulose dissolution
are mainly composed of a salt with halide [63], phosphonate [64], formate [65] or
acetate [66] as anion, and imidazolium [67], pyridinium [68], choline [69], or
phosphonium [70] as cation. An example of a recently synthesized ionic liquid with
huge potential for fiber spinning (i.e. textile applications) is the 1,5-diaza-
bicyclo[4.3.0]non-5-enium acetate ([DBNH][OAc]) which is described as a powerful
direct cellulose solvent [71]. The development of a process designated as Ioncell-F
produces regenerated cellulose fiber with properties comparable (or even superior) to
Lyocell [72].
Mechanisms of dissolution
Due to the wide variety of solvents of different nature becomes unclear the
understanding of the subtle balance between the different interactions acting during the
solubilization process; although numerous and spread opinions, the more consensual
vision among the leaders in the field has been that the key factor to dissolve cellulose
resides in the solvent ability to break the abovementioned hydrogen bond network
(intra- and intermolecular) [50]. The amphiphilic properties of cellulose were recently
suggested to play an important role in cellulose solubility pattern and a careful
examination of the interactions involved suggests that hydrophobic interactions should
not be neglected in the cellulose dissolution process. Actually, hydrophobic interactions
have been verified to clearly contribute to the crystal-like structure of cellulose and its
stability over a hypothetical solution state; looking on the free energy simulations using
oligomers it has been estimated that there is a 2.0 kcal/mol/residue contribution for the
hydrophobic stacking while the estimated hydrogen bonding contribution is about eight
times lower [14].
Thermodynamically the dissolution of a compound in a solvent is, of course, governed
by the free energy of mixing; this law is valid for all mixtures, involving small solutes
or large molecules, such as cellulose [18]. A negative variation of the free energy means

10
that the mixing process will happen spontaneously. However, for the case of polymers,
even when the free energy variation is favourable to dissolution, this could not occur,
because the process may be too slow on the time scale of observation; strategies to
increase the rate of dissolution involves heating and stirring in order to increase the
contact between the polymer and the solvent.
Generally the driving force for dissolution, or miscibility, is the entropy of mixing, and
not as it is sometimes assumed favourable interactions between solvent and solute [12].
This explains the higher solubility of polyelectrolytes in water when compared with
nonionic polymers. Charging up a polymer is always expected to help solubility in
many solvent systems, as result of the huge contribution to the translational entropy of
mixing promoted by the dissociated counterions. Most likely, this is the reason why
cellulose tends to be more soluble/be more penetrated by the aqueous solvent at either
high or low pH. Nevertheless, the pK values of the OH groups are such that rather
extreme conditions are needed for either deprotonation or protonation; a pKa of 13.5 has
been found for the deprotonation of the OH groups of C2 and C3 of AGU units of β-
cyclodextrin [73].
On the other hand, an acceptable solvent for cellulose must be able to balance the low
entropy gain with favourable solvent/polymer interactions. Since cellulose should be
regarded as an amphiphilic molecule a good basis for the development of new solvents
should focus, not only in eliminating hydrogen bonding but also, on
reducing/eliminating hydrophobic interactions among cellulose chains. Both the
amorphous and the crystalline regions can be affected by the solvent. However, the
crystalline domains, characterized by a lower free energy than the amorphous one,
should be more difficult to dissolve due to the reduced accessibility of the solvent
caused by the high stability of the solid state [12]. This is particularly relevant since as
mentioned above crystalline cellulose domains has an amphipathic-like structure;
hydrophobic surfaces consisting of pyranose ring hydrogens and hydrophilic regions
arising from the hydroxyl groups directed towards the sides of the ring [12, 23, 74]. In
fact, this also follows from the earlier discussion on the effect of additives such as PEG,
urea and thiourea on NaOH solutions as these additives are expected to weaken
hydrophobic interactions among cellulose molecules (see discussion in the next
section).
Consequently, different activation processes are routinely applied to mainly transform
the more ordered and less accessible (crystalline) domains of cellulose into disordered
11
and more accessible regions, in order to facilitate dissolution. It is argued that these
alterations of the cellulose structure improve the solvent molecules accessibility to the
cellulose chains [28]. The crystallinity effect in dissolution is still controversial despite
some clear evidences of its effect. For example, it was showed that sisal pulp (e.g. fibers
extracted from the Agave sisalana plant) can be easily dissolved than cotton linters in a
particular solvent system; the enhanced solubility is attributed to the lower crystallinity
index and smaller crystallite size compared to the latter one. After pre-treatment of
cotton linter (e.g. mercerization), dissolution was considerably improved and this
observation was related to the decrease in both the crystallinity index and average
crystal size [75]. Also the high solubility of cellulose derivatives supports the
importance of the crystallinity in the solubility pattern of cellulose.
It is also important note that in the majority of the cases, cellulose is not dissolved down
to the molecular level but rather forms stable colloidal dispersions where ordered
cellulose aggregates of, at least, several hundred chains are present. The structure in
solution has been proposed to consist of aggregates of fringed micelle type
characterized by a highly ordered cylindrical core of aligned chains, which is insoluble
in the solvent, and two spherical coronas surrounding the core ends [76]. Reaching
molecularly dispersed systems has been challenging for nearly all known solvent
systems. Recently, Cohen et al. reported that ionic liquids are able to dissolve cellulose
down to a molecular level [77].
Typically, the cations of ILs are bulky species with amphiphilic properties. Proof of this
is that most literature agrees on the formation of aggregates or micelles of ionic liquids
in water, similar to a surfactant behavior [78]. Such amphiphilicity should be considered
when discussing the mechanism of dissolution of cellulose, as discussed above. Recent
molecular dynamics simulations, carried out on cellulose oligomers and 1-ethyl-3-
methylimidazolium acetate (C2mimOAc), actually suggest that the cations are in close
contact with the cellulose chains via hydrophobic interactions [79]. The same has been
concluded when using urea [80].
12
Role of cellulose interactions in dissolution and regeneration:
Amphiphilicity and Hydrophobic Interactions
As discussed above, the dissolution of a polymer is governed by the free energy
of mixing [81]. Small oligomers of cellulose as glucose, cellobiose and any other with
degree of polymerization slightly higher (<10) are soluble in common solvents, such as
water. As the molecular weight increases, the entropic contribution for dissolution
decreases [82] and the solubility drops dramatically as the chain length increases [83].
The entropy of mixing for polymers is composed by two terms: a translational term
(related with the molecular weight of the polymer) and a second term related to the
conformational freedom [12]. Flexible polymers can easily increase their
conformational freedom on going into solution; on the other hand, stiff polymers cannot
change the conformation and the gain in conformational freedom is very limited.
Flexible polymers are, consequently, more soluble than rigid polymers.
Since cellulose is a fairly rigid polymer, its ability to gain configurational entropy in
solution is limited, lowering the solubility [84]. Also, native cellulose has a high
molecular weight, which inevitably leads to a decrease in the entropic gain in the
dissolution process leading to a very low solubility. In addition, the stiffness of the
structure and the stacked chains by the hydrophobic regions that allow transverse
hydrogen bonds, restrict the entropy of mixing, so that a negative free energy change is
not reached. In these circumstances, favourable/unfavourable interactions between
polymer and solvent are decisive in determining solubility/insolubility of cellulose in a
solvent system.
As alluded to water alone cannot dissolve cellulose, since the pair-wise hydrogen bond
interactions involving water-water, carbohydrate-water, and carbohydrate-carbohydrate
hydrogen bond interactions are about the similar magnitude, about 5 kcal/mol [12].
Therefore, hydrogen bonds might be responsible for keeping the linear cellulose chains
arranged in sheets. On the other hand, as discussed above, the stacking of these sheets
into the three-dimensional crystal structures of the cellulose material involves
hydrophobic interactions. A theoretical work on the mean force calculations for the
separation of cello-oligomers, have suggested that hydrophobic interactions contribute
favorably to stabilizing a crystal-like stacked structure [85]. In fact, the driving force for
13
association is not exclusively van der Waals interactions [86, 87], but rather
hydrophobic association driven by the liberation of structured water molecules [88].
The role of hydrophobic interactions in the cellulose solubility pattern is supported by
some significant examples in literature.
A clear support to this view comes from the work of Isobe et al., which described that
urea even if it does not have direct interaction with cellulose, favours the alkali
penetration into the cellulose crystalline regions by stabilizing the swollen cellulose
molecules, while following the cellulose dissolution in the NaOH/urea based solvent
[89]. The authors concluded that such stabilizing effect may result from the fact that
urea prevents the hydrophobic mutual association of cellulose chains.
Various substances of intermediate polarity such as poly(ethylene glycol), thiourea and
urea can enhance the aqueous solubility of cellulose; also amphiphilic species, such as
surfactants, have a positive impact in dissolution rate of cellulose [6]. Actually, urea is
normally used as agent for protein denaturation and it is rational to assume that the role
of urea in cellulose dissolution is similar to protein denaturation [90]. Concerning
protein denaturation, using urea, it was demonstrated that urea molecules accumulate
around less polar side chains forming an interface between less polar protein surface
and water. The resulting displacement of water molecules from the protein surface into
bulk water is entropically and enthalpically favorable and reduces the hydrophobic
effect, such that unfolding of the protein becomes favorable [91]. Urea is less polar than
water and is well known for its ability to reduce/eliminate hydrophobic association in
water. One other example of this is the increase in critical micelle concentration (cmc)
promoted by the addition of urea to aqueous surfactants systems; this increment in cmc
is driven by the inhibition of hydrophobic association of surfactants [92]. Obviously, the
key point here is the nature of urea which can establish polar and/or apolar interactions
with other molecules; this has been demonstrated using molecular modeling in protein
denaturation process [91], but also the enhancement of its concentration close to model
hydrophobic surfaces [93] and inside hydrophobic nanotubes [94] are examples of it.
The investigation carried out by Xiong et al., using an aqueous NaOH based system, is
another interesting example that supports the importance of hydrophobic interactions in
cellulose behaviour. It was clearly shown that urea can improve the rate of dissolution
by interaction via van der Waals forces with the hydrophobic regions of cellulose to
prevent dissolved molecules from re-gathering [95]. In perfect agreement, the study
carried out by Bergenstrahle-Wohlert et al., combining MD simulations and solid state

14
NMR on cellulose in pure water and in urea aqueous solutions [96] demonstrated that
the local concentration of urea is significantly enhanced at the cellulose/solution
interface. The study also showed that urea has a preferential orientation when binding to
cellulose, having the carbonyl oxygen (“hydrophilic part”), on average, pointing
slightly away from the cellulose backbone and the nitrogen atoms (‘‘hydrophobic
part’’), pointing in the direction of the cellulose backbone.
Ionic liquids (ILs), a very promising group of solvents for cellulose, as discussed in the
previous section, are composed of typically bulky cations with amphiphilic properties
[62, 97, 98]. Even if there is no clear understanding on the role of individual ionic
species in dissolution, it becomes clear that the high asymmetry in the IL species is
fundamental and necessary for an efficient dissolution [6]. Such amphiphilicity is
normally not considered when discussing the mechanism of cellulose dissolution, but is
believed that this is determinant to understand their action in cellulose solubility. The
dissolution of an amphiphilic polymer, such as cellulose, would be facilitated in
solvents with amphiphilic properties and therefore the amphiphilic properties of all
cations in ILs clearly fit this suggestion.
Mostofian et al. presented a notable work supporting this idea, suggesting a synergistic
approach for cellulose dissolution in ILs [99]. The authors performed all-atom MD
simulations of a cellulose fiber in 1-butyl-3-methylimidazolium chloride (BmimCl) in
order to clarify the role of cations and anions during dissolution and the preferential
interactions of the IL ions with cellulose surfaces. The study reveals that while the Cl-
anions predominantly interact with the cellulose surface hydroxyl groups, the Bmim+
cations stack preferentially on the hydrophobic cellulose surfaces, governed by non-
polar interactions with cellulose. It is also suggested that the stacking interaction
between solvent cation rings and cellulose pyranose rings can compensate the
interaction between stacked cellulose layers, thus stabilizing detached cellulose chains.
This work not only reinforces the idea that ILs are a very promising class of solvents for
cellulose, but also provides an essential molecular understanding of how ILs act, and
more notably, highlights the concerted and distinct action of anions and cations on the
hydrophobic and hydrophilic regions of cellulose surfaces, respectively, as the key to an
efficient dissolution of an amphiphilic molecule such as cellulose.
Another interesting study, recently presented by Isobe et al. [100] focused on the
molecular regeneration of cellulose, both using a coagulant media or upon heating, in an
aqueous alkali-urea solvent system, monitored by time resolved synchrotron X-ray
15
radiation. It is suggested that the gelation process is driven by the stack of the
glucopyranose rings (conducted by hydrophobic interactions) to form monomolecular
sheets, which then line up by hydrogen bonding to form Na-cellulose IV, a hydrate form
of cellulose II). This idea has been hypothesized and supported by molecular dynamics
first by Hermans [101] and later by Hayashi [102]. Afterwards, the theoretical work of
Miyamoto et al. [23] simulated the regeneration of cellulose by MD, and supports the
hypothesis of Hermans and Hayashi. However, this work of Isobe et al. constitutes the
first experimental evidence of the development of hydrophobically stacked
monomolecular sheets.
Östlund et al. stated that the properties of the regenerated cellulose material can be
tuned by the proper choice of the experimental conditions such as temperature and
coagulation medium [103]. It is suggested that coagulation media of different polarity
lead to regenerated materials with different morphologies and properties and this can be
used to tune the properties of the end materials. As the polarity of the coagulant is
increased, more ordered (crystalline) materials are obtained, the hydrophobic
interactions between the polymer chains during regeneration being governed by the
increased polarity of the coagulant.
Rein et al. have used cellulose as novel and efficient eco-friendly emulsifying agent to
form stable oil-in-water or water-in-oil dispersions, taking advantage of its
amphiphilicity [104]. The authors interpret the dispersion stability as due to the ability
of the hydrophilic hydroxyl groups to interact with the water while the more
hydrophobic planes of the glucopyranose rings are situated towards the hydrocarbon oil.
These dispersions were found to be stable for large periods of time, mainly the oil-in-
water dispersion with stability of more than one year, where neither flocculation nor
coalescence was observed.
Also Nawaz et al. noticed the amphiphilic properties of cellulose while studying the
mechanism of mediated imidazole-catalysis acylation of cellulose, suggesting that the
sub-sequent decrease in enthalpy during the N-butanoyl- to N-hexanoylimidazole
conversion may be related to favorable hydrophobic interactions between the carbon
chains of the N-acylimidazole and cellulosic surface, whose lipophilicity has increased,
due to its partial acylation [105]. Closely related Hauru et al. found that cellulose
regeneration from IL solutions goes via the hydrophobic association of the less polar
regions of cellulose [106].

16
An additional curious example comes from the deposition of carboxymetylcellulose
(CMC) on polymer surfaces. Kargl et al. suggest that the amphiphilicity of cellulose
surfaces is important for the irreversible deposition of CMC over a polymeric substrate
with appropriate properties, i.e. better results were obtained in substrates not highly
hydrophilic or very hydrophobic [107].
Regarding the composite area, in the cellulose-acrylated epoxidized soybean oil
(AESO) based biocomposite the presence of oil molecules was found in the cellulosic
material, suggesting the lack of covalent or hydrogen bonding between the two
components [108]. The authors proposed that the dispersion of AESO molecules in the
cellulose matrix is held by hydrophobic interactions between hydrocarbon chains of the
AESO and hydrophobic domains of cellulose, playing a crucial role in the composite.
From the facts mentioned above, it is indeed very striking that cellulose is amphiphilic
in nature and hydrophobic interactions play an important role both in dissolution and
regeneration.
Motivation and scope
As pointed out in the first chapter of this thesis, there are different points of view
regarding which are the governing forces involved on the cellulose dissolution and
regeneration processes. Also the level of dissolution, i.e. molecular dispersed cellulose
chains vs. colloidal aggregates, is still a non consensual theme. Using a set of different
techniques, described in chapter 2, in particular rheology, optical and electron
microscopy, light scattering, small and wide angle X-ray scattering and NMR we have
strengthened the molecular understanding of the cellulose dissolution. Part of the work
was also performed in collaboration with the Department of Physical Chemistry at Lund
University, Sweden and the Laboratory of Plant Biotechnology at the University of
Algarve.
The central scope of the thesis is to understand the balance between the interactions
involved in cellulose dissolution and its impact on the degree of dissolution, solution
state (i.e. molecular solutions or colloidal aggregates), and on the resultant regenerated
17
materials. This can contribute to the development of new efficient and environmental
friendly solvents for cellulose.
Until now, only a few solvent systems are described as able to dissolve cellulose into a
molecular level [77] and the same applies for cellulose derivatives. Cellulose
modifications are expected to adversely affect the degree of crystallinity. However,
cellulose derivatives are surprisingly highly crystalline and therefore can be used as
sources for nanocrystalline cellulose. In chapter 3, section 3.1, the extraction and
characterization of cellulose nanocrystals using cellulose derivatives is described and
also there is a discussion on dissolution at a molecular level or the presence of colloidal
aggregates.
In section 3.2, is discussed a new NMR method, polarization transfer solid-state NMR,
as applied to cellulose solutions. The advantage of the technique to provide robust
information on the molecular-level about the dissolved and solid fractions of cellulose
in aqueous dissolution media is demonstrated.
In chapter 3, section 3.3 the dissolution of cellulose in alkali based aqueous solutions
and the influence of additives on the dissolution performance are discussed.
To a better understanding of the dissolution mechanism, a wide range of solvents for
cellulose is used. In chapter 3 the main results are described for basic and acidic
solvents.
The balance between the interactions involved in cellulose dissolution and the stability
of the cellulose solutions are discussed in section 3.5 of chapter 3. The results clearly
indicate the improvement of the thermal and storing stability of the solutions when
amphiphilic additives are in the solution. The thermal gelation is shifted to higher
temperatures when surfactants are added to the solution, which provides support to the
role of the hydrophobic interactions also in cellulose regeneration.
The influence of the different solvent systems on the sample properties, regarding
morphology and crystallinity of the regenerated materials, is discussed in chapter 3,
section 3.6.
In chapter 4 the main conclusions are gathered.

18
19
CHAPTER 2
Materials and Methods
Materials
Microcrystalline cellulose (MCC) (Avicel PH-101, average particles size of 50
µm and degree of polymerization of ca. 260), carboxymethyl cellulose (CMC) (Mw = 7
× 105 Da, degree of substitution of 0.9), zinc oxide (> 99% purity), sulfuric acid (98%
purity ACS reagent), urea (99.5% purity), thiourea (>99% purity), alkyl-polyglucoside
(APG), 50% solution, 1-butyl-3-methylimidazolium chloride (BmimCl) (>98% purity),
4-methylmorpholine N-oxide monohydrate (NMMO) (>95% purity),
tetrabutylphosphonium hydroxide (40% solution in water) and tetrabutylammonium
hydroxide (TBAH) of chromatographic grade (as a 40 wt.% solution in water),
methanesulfonic acid (anhydrous), glycerol (purity >99.5%), an aqueous surfactant
solution (~35% active substance) of a derivative of betaine (N-(Alkyl C10-C16)-N,N-
dimethylglycine betaine), 3-(trimethylsilyl)propionic-2,2,3,3-d4 acid sodium salt and
zinc chloride (reagent grade, purity >98%) were acquired from Sigma Aldrich. High
molecular weight cellulose (Domsjö Pulp, degree of polymerization of ca. 745) was
obtained from Domsjö Fabriker, Sweden. NaOH pellets (>98% purity) and ortho-
phosphoric acid (purity 99%) were obtained from Fluka. Hydroxypropyl
methylcellulose (HPMC, Methocel® K15M Premium), 19–24% methoxyl and 7–12%
hydroxypropyl, Mw = 4.3 × 10⁵ Da, was purchased from Dow Chemical Company.
Dialysis bags (molecular weight cut-off 2000, Cellu Sep H1) were purchased from
20
Orange Scientific. The 1H NMR samples were prepared using D2O (99.8%) supplied by
EURISO-TOP (France)
Sample preparation
Cellulose dissolution was obtained following the adapted standard procedures in
literature [53, 109, 110]. Briefly, a known amount of cellulose was dispersed in a 85
wt.% phosphoric acid pre-cooled at 5 ºC, the solution was stirred for 12 h until complete
dissolution of MCC and achievement of a clear solution [109]. The dissolution of
cellulose in H2SO4/glycerol was obtained by addition of a known amount of MCC in a
solution of 66 wt.% of H2SO4 and 33 wt.% glycerol. The solution was heated at 60 ºC
for 15 min to complete dissolution of cellulose. Dissolution in the highly concentrated
salt system was achieved by dissolving the desired amount of MCC in a 60 wt.%
ZnCl2/H2O solution at 80 ºC for 15 min [53].
Solutions in alkali-based systems were prepared by addition of a known amount of
cellulose in a 8 % NaOH/H2O solution and then allowed to freeze at -20 ºC for 24 h.
This was followed by thawing the solid frozen mass at room temperature under
simultaneous vigorous mixing. The same procedure was followed with amphiphilic
additives in the NaOH based systems but the additives were added before freezing the
samples. On the other hand, for the TBAH based solvent, the dissolution procedure was
simply the mixture of a known amount of cellulose with a 40 wt.% TBAH aqueous
solution at room temperature for 30 min.
The extraction procedure of CNCs was based on a previously reported method [111].
Briefly, 5 g of MCC powder was added to a 100 mL H2SO4 (65 wt.%) aqueous solution.
The hydrolysis was carried out during 30 min at 65 °C and afterwards the reaction was
quenched by the addition of a large excess of deionised water (250 mL) and the mixture
was centrifuged at 3800 rpm for 15 min at room temperature. This centrifugation step
was repeated several times before the suspension was dialyzed against distilled water
for one week to neutralize the pH of solution and remove undesired salts. The resulting
suspension was kept refrigerated for later use. The same procedure was followed for the
extraction of CNCs from cellulose derivatives, HPMC and CMC.
21
Experimental techniques
Polarized light microscopy
Optical microscopy is used in a wide range of applications, in different science
fields such pharmacy, medicine, chemistry, biology and geology [112-115]. This
technique is quite useful for a fast and facile analysis of the particle size and shape in
solid compounds and also to analyze particles in a suspension. The use of polarized
light microscopy (PLM) as a tool for crystallography extends back at least 200 years
[112].
The simplest PLM is essentially a bright field microscope with a rotating stage and
plane-polarizing filters placed below (the polarizer) and above (the analyzer) the
specimen these being generally the main differences from a standard transilluminating
microscope [116].
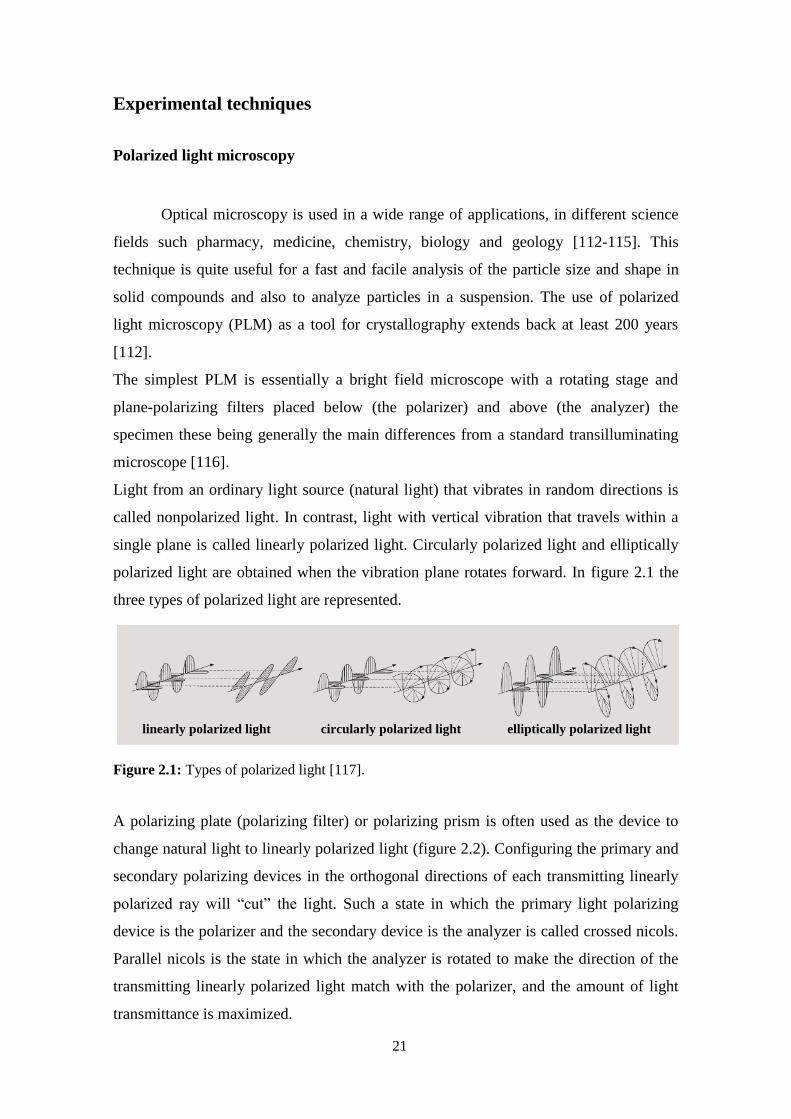
Light from an ordinary light source (natural light) that vibrates in random directions is
called nonpolarized light. In contrast, light with vertical vibration that travels within a
single plane is called linearly polarized light. Circularly polarized light and elliptically
polarized light are obtained when the vibration plane rotates forward. In figure 2.1 the
three types of polarized light are represented.
Figure 2.1: Types of polarized light [117].
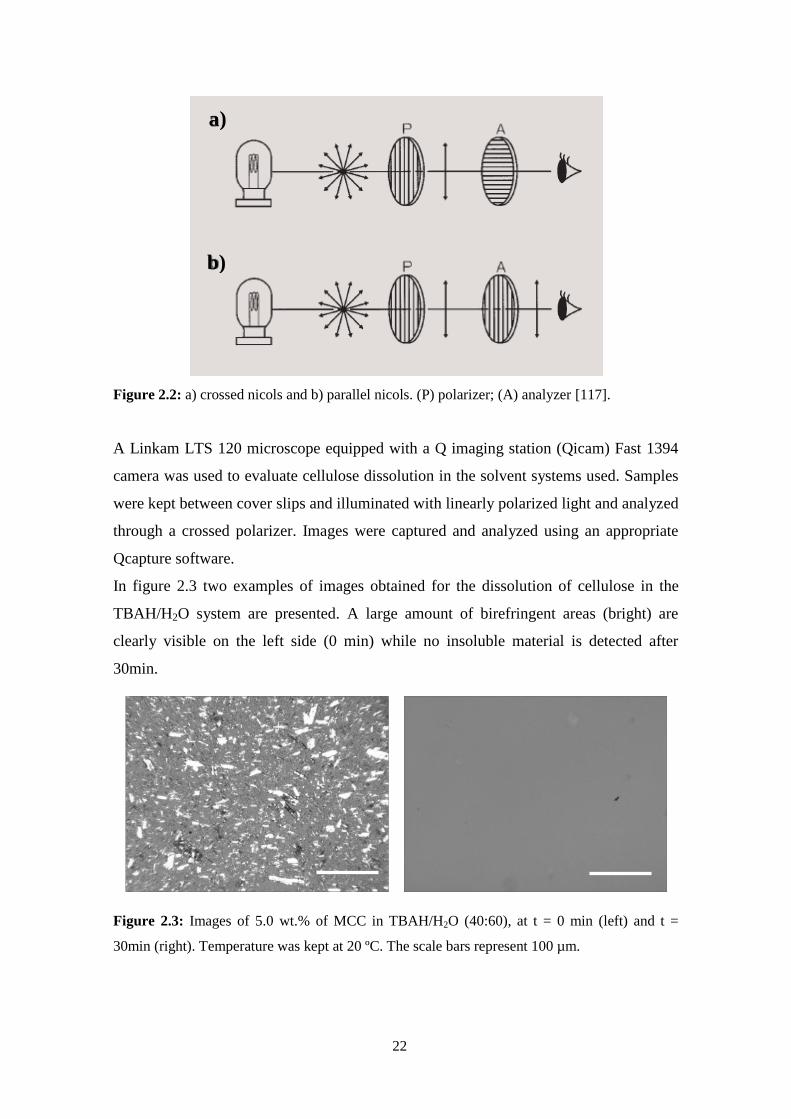
A polarizing plate (polarizing filter) or polarizing prism is often used as the device to
change natural light to linearly polarized light (figure 2.2). Configuring the primary and
secondary polarizing devices in the orthogonal directions of each transmitting linearly
polarized ray will “cut” the light. Such a state in which the primary light polarizing
device is the polarizer and the secondary device is the analyzer is called crossed nicols.
Parallel nicols is the state in which the analyzer is rotated to make the direction of the
transmitting linearly polarized light match with the polarizer, and the amount of light
transmittance is maximized.
linearly polarized light circularly polarized light elliptically polarized light
22
Figure 2.2: a) crossed nicols and b) parallel nicols. (P) polarizer; (A) analyzer [117].
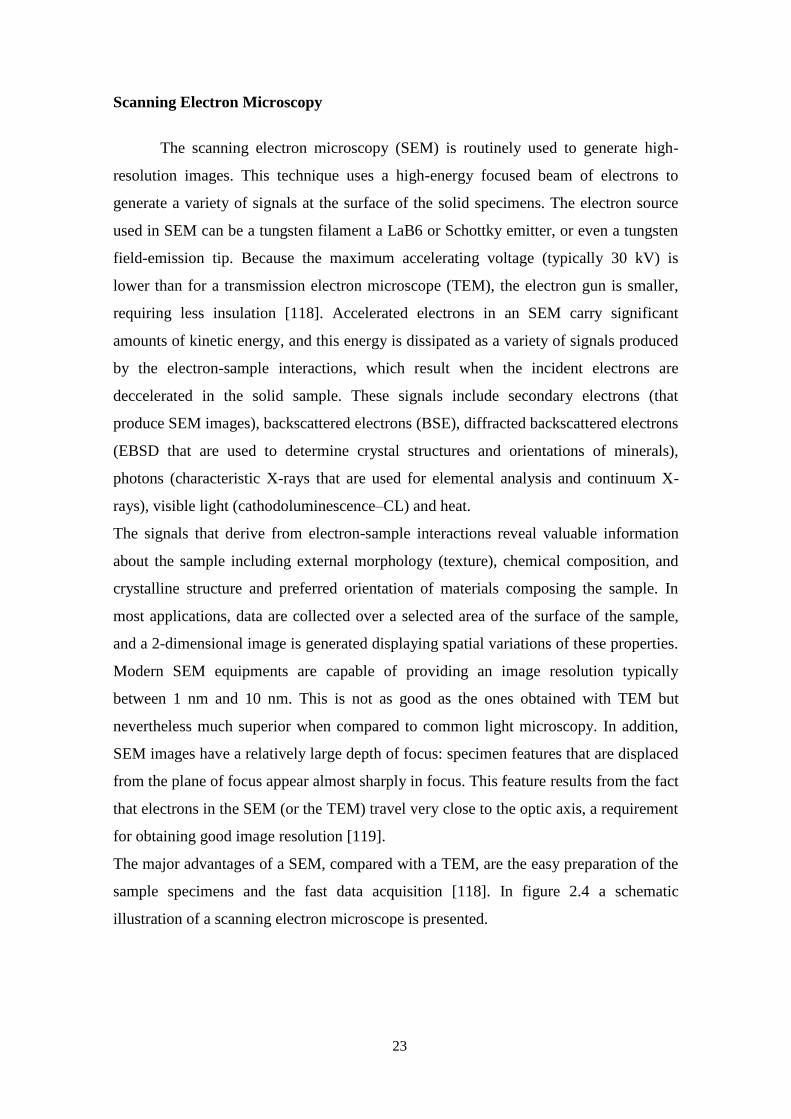
A Linkam LTS 120 microscope equipped with a Q imaging station (Qicam) Fast 1394
camera was used to evaluate cellulose dissolution in the solvent systems used. Samples
were kept between cover slips and illuminated with linearly polarized light and analyzed
through a crossed polarizer. Images were captured and analyzed using an appropriate
Qcapture software.
In figure 2.3 two examples of images obtained for the dissolution of cellulose in the
TBAH/H2O system are presented. A large amount of birefringent areas (bright) are
clearly visible on the left side (0 min) while no insoluble material is detected after
30min.
Figure 2.3: Images of 5.0 wt.% of MCC in TBAH/H2O (40:60), at t = 0 min (left) and t =
30min (right). Temperature was kept at 20 ºC. The scale bars represent 100 µm.
a)
b)
23
Scanning Electron Microscopy
The scanning electron microscopy (SEM) is routinely used to generate high-
resolution images. This technique uses a high-energy focused beam of electrons to
generate a variety of signals at the surface of the solid specimens. The electron source
used in SEM can be a tungsten filament a LaB6 or Schottky emitter, or even a tungsten
field-emission tip. Because the maximum accelerating voltage (typically 30 kV) is
lower than for a transmission electron microscope (TEM), the electron gun is smaller,
requiring less insulation [118]. Accelerated electrons in an SEM carry significant
amounts of kinetic energy, and this energy is dissipated as a variety of signals produced
by the electron-sample interactions, which result when the incident electrons are
deccelerated in the solid sample. These signals include secondary electrons (that
produce SEM images), backscattered electrons (BSE), diffracted backscattered electrons
(EBSD that are used to determine crystal structures and orientations of minerals),
photons (characteristic X-rays that are used for elemental analysis and continuum X-
rays), visible light (cathodoluminescence–CL) and heat.
The signals that derive from electron-sample interactions reveal valuable information
about the sample including external morphology (texture), chemical composition, and
crystalline structure and preferred orientation of materials composing the sample. In
most applications, data are collected over a selected area of the surface of the sample,
and a 2-dimensional image is generated displaying spatial variations of these properties.
Modern SEM equipments are capable of providing an image resolution typically
between 1 nm and 10 nm. This is not as good as the ones obtained with TEM but
nevertheless much superior when compared to common light microscopy. In addition,
SEM images have a relatively large depth of focus: specimen features that are displaced
from the plane of focus appear almost sharply in focus. This feature results from the fact
that electrons in the SEM (or the TEM) travel very close to the optic axis, a requirement
for obtaining good image resolution [119].
The major advantages of a SEM, compared with a TEM, are the easy preparation of the
sample specimens and the fast data acquisition [118]. In figure 2.4 a schematic
illustration of a scanning electron microscope is presented.
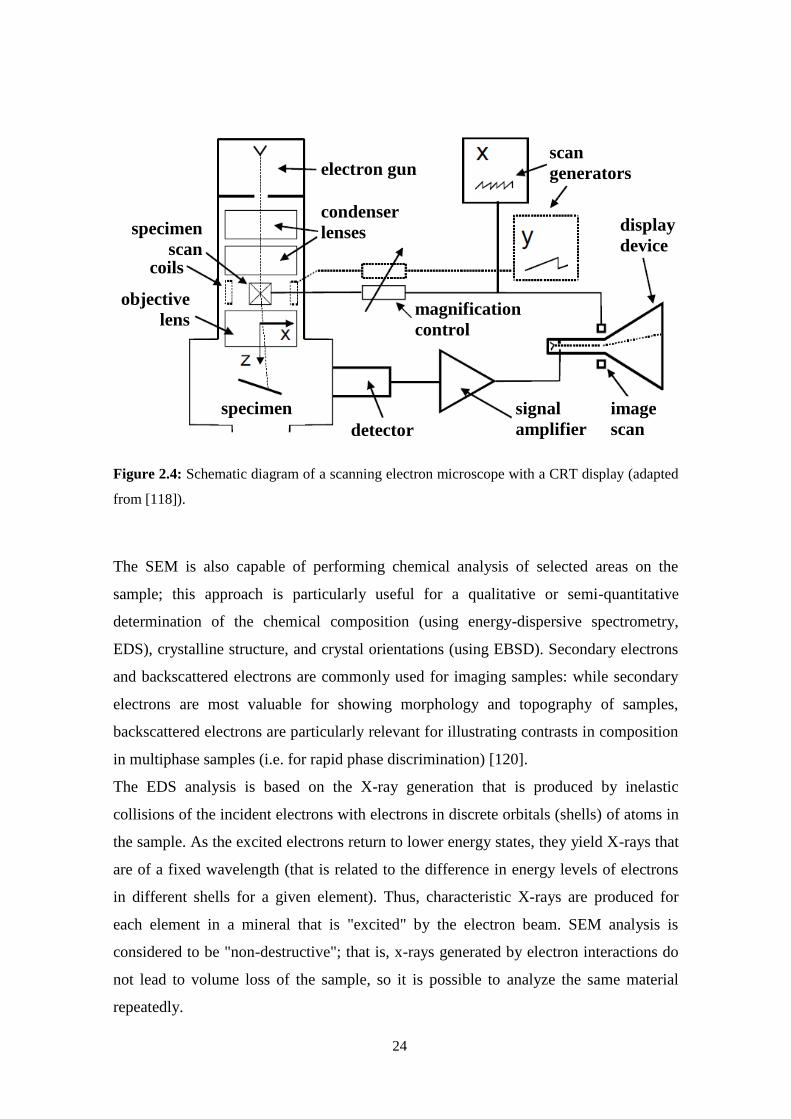
24
Figure 2.4: Schematic diagram of a scanning electron microscope with a CRT display (adapted
from [118]).
The SEM is also capable of performing chemical analysis of selected areas on the
sample; this approach is particularly useful for a qualitative or semi-quantitative
determination of the chemical composition (using energy-dispersive spectrometry,
EDS), crystalline structure, and crystal orientations (using EBSD). Secondary electrons
and backscattered electrons are commonly used for imaging samples: while secondary
electrons are most valuable for showing morphology and topography of samples,
backscattered electrons are particularly relevant for illustrating contrasts in composition
in multiphase samples (i.e. for rapid phase discrimination) [120].
The EDS analysis is based on the X-ray generation that is produced by inelastic
collisions of the incident electrons with electrons in discrete orbitals (shells) of atoms in
the sample. As the excited electrons return to lower energy states, they yield X-rays that
are of a fixed wavelength (that is related to the difference in energy levels of electrons
in different shells for a given element). Thus, characteristic X-rays are produced for
each element in a mineral that is "excited" by the electron beam. SEM analysis is
considered to be "non-destructive"; that is, x-rays generated by electron interactions do
not lead to volume loss of the sample, so it is possible to analyze the same material
repeatedly.
electron gun
condenser
lenses specimen
scan
objective
lens
specimen
detector
signal
amplifier
image
scan
magnification
control
display
device
scan
generators
coils
25
A high resolution (Schottky) Environmental Scanning Electron Microscopy (FEG-
ESEM), equipped with the analytical systems X-ray microanalysis (EDS) and
backscattered electron diffraction pattern analysis (EBSD) was used to observe the
morphology and microstructure of the samples (model Quanta 400FEG ESEM/EDAX
Genesis X4M). Typically, 50 μL of a suspension was dropped onto a clean glass lamella
followed by drying for 24 h in a kiln and then sputtered with an approximately 6 nm
thin Au/Pd film by cathodic pulverization using a SPI Module Sputter Coater before
SEM analysis. The same procedure was followed for the regenerated and starting
materials which, after being dried at room temperature, were also placed onto a glass
lamella using an appropriate support tape and then sputtered as previously described for
the suspension case. The accelerating voltage ranged from 5 to 15 kV. In figure 2.5 an
example of an SEM micrograph obtained for a raw cellulose sample is displayed.
The cryo-scanning electron microscopy (Cryo-SEM) was carried out using a JEOL
JSM-6301F (Tokyo, Japan), an Oxford Instruments INCA Energy 350 (Abingdon, UK),
and a Gatan Alto 2500 (Pleasanton, CA, USA). Cryo preparation techniques for SEM
have become essential for the observation of wet or beam-sensitive specimens to
minimize potential morphological particle changes. The cellulose derivatives
dispersions were dropped on a grid, rapidly cooled in a liquid nitrogen slush (- 210 °C),
and transferred under vacuum to the cold stage of the preparation chamber. Here, the
samples were fractured, sublimated (4 minutes, - 90 °C) to reveal greater detail, and
coated with a gold-palladium alloy. Finally, the specimens were moved under vacuum
into the SEM chamber where they were observed at - 150 °C).

26
Figure 2.5: SEM micrograph of microcrystalline cellulose after dispersion in water. The scale
bar represents 10 µm.
X-Ray diffraction
Since the first X-ray diffraction experiment on a single crystal in 1912,
performed by Max von Laue, X-ray crystallography is recognized to be of major
importance in natural sciences [121]. Max von Laue discovered that crystalline
substances act as three-dimensional diffraction gratings for X-ray wavelengths similar
to the spacing of the planes in a crystal lattice. X-ray diffraction (XRD) is a reasonably
rapid analytical technique primarily used for phase identification of a crystalline
material and can provide information on, for instance, unit cell dimensions. Typically,
the analyzed material is finely ground, homogenized, and the average bulk composition
is determined.
Diffraction effects are observed when electromagnetic radiation impinges on periodic
structures with geometrical variations on the length scale of the wavelength of the
radiation. The interatomic distances in crystals and molecules, ca. 0.15 to 0.4 nm,
correspond to the wavelengths of X-rays, with photon energies between 3 and 8 keV
and wavelengths in a range of 0.1 to 10 Å [121]. Accordingly, phenomena such as
constructive and destructive interference should become observable when crystalline
and molecular structures are exposed to X-rays [122].
27
There are three different types of interaction in the relevant energy range. Two inelastic
processes (photoionization and energy transference) and one elastic, useful for structural
investigations, the Thomson scattering [122]. The wavelength λ of X-rays is conserved
for Thomson scattering in contrast to the two inelastic scattering processes mentioned
earlier.
The high degree of order and periodicity in a crystal can be envisioned by selecting sets
of crystallographic lattice planes that are occupied by the atoms comprising the crystal.
The planes are all parallel to each other and intersect the axes of the crystallographic
unit cell. Any set of lattice planes can be indexed by an integer triple hkl with the
meaning that a/h, a/k and a/l now specify the points of intersection of the lattice planes
with the unit cell edges. This system of geometrical ordering of atoms on
crystallographic planes is known as the Miller indices hkl.
Up to now, what has been known as the “Laue conditions” and the “Bragg equation”
has formed the basis of X-ray diffraction of crystalline materials. The interaction of the
incident X-rays with the sample produces constructive interference (and a diffracted
ray) when conditions satisfy Bragg's Law (nλ=2d sin θ). This law relates the wavelength
of electromagnetic radiation to the diffraction angle and the lattice spacing in a
crystalline sample. These diffracted X-rays are then detected, processed and counted.
By scanning the sample through a range of 2θ angles, all possible diffraction directions
of the lattice should be attained due to the random orientation of the powdered material.
Conversion of the diffraction peaks to d-spacings allows identification, for instance, of a
given mineral because each mineral has a set of unique d-spacings. Typically, this is
achieved by comparison of d-spacings with standard reference patterns [122]. In figure
2.6 a schematic representation of a θ/2θ diffraction in Bragg-Brentano geometry is
represented.
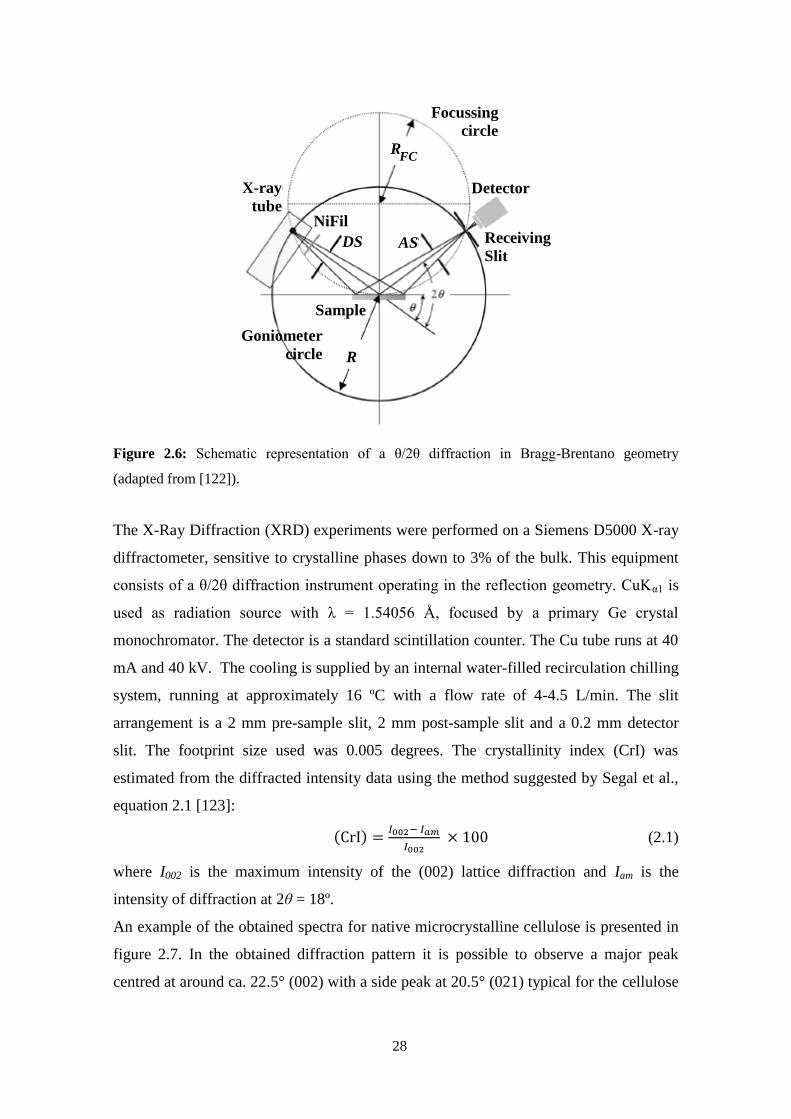
28
Figure 2.6: Schematic representation of a θ/2θ diffraction in Bragg-Brentano geometry
(adapted from [122]).
The X-Ray Diffraction (XRD) experiments were performed on a Siemens D5000 X-ray
diffractometer, sensitive to crystalline phases down to 3% of the bulk. This equipment
consists of a θ/2θ diffraction instrument operating in the reflection geometry. CuKα1 is
used as radiation source with λ = 1.54056 Å, focused by a primary Ge crystal
monochromator. The detector is a standard scintillation counter. The Cu tube runs at 40
mA and 40 kV. The cooling is supplied by an internal water-filled recirculation chilling
system, running at approximately 16 ºC with a flow rate of 4-4.5 L/min. The slit
arrangement is a 2 mm pre-sample slit, 2 mm post-sample slit and a 0.2 mm detector
slit. The footprint size used was 0.005 degrees. The crystallinity index (CrI) was
estimated from the diffracted intensity data using the method suggested by Segal et al.,
equation 2.1 [123]:
(2.1)
where I002 is the maximum intensity of the (002) lattice diffraction and Iam is the
intensity of diffraction at 2θ = 18º.
An example of the obtained spectra for native microcrystalline cellulose is presented in
figure 2.7. In the obtained diffraction pattern it is possible to observe a major peak
centred at around ca. 22.5° (002) with a side peak at 20.5° (021) typical for the cellulose
Receiving
Slit
Focussing
circle
R FC
Detector X-ray
tube NiFil
DS AS
Sample
Goniometer
circle R
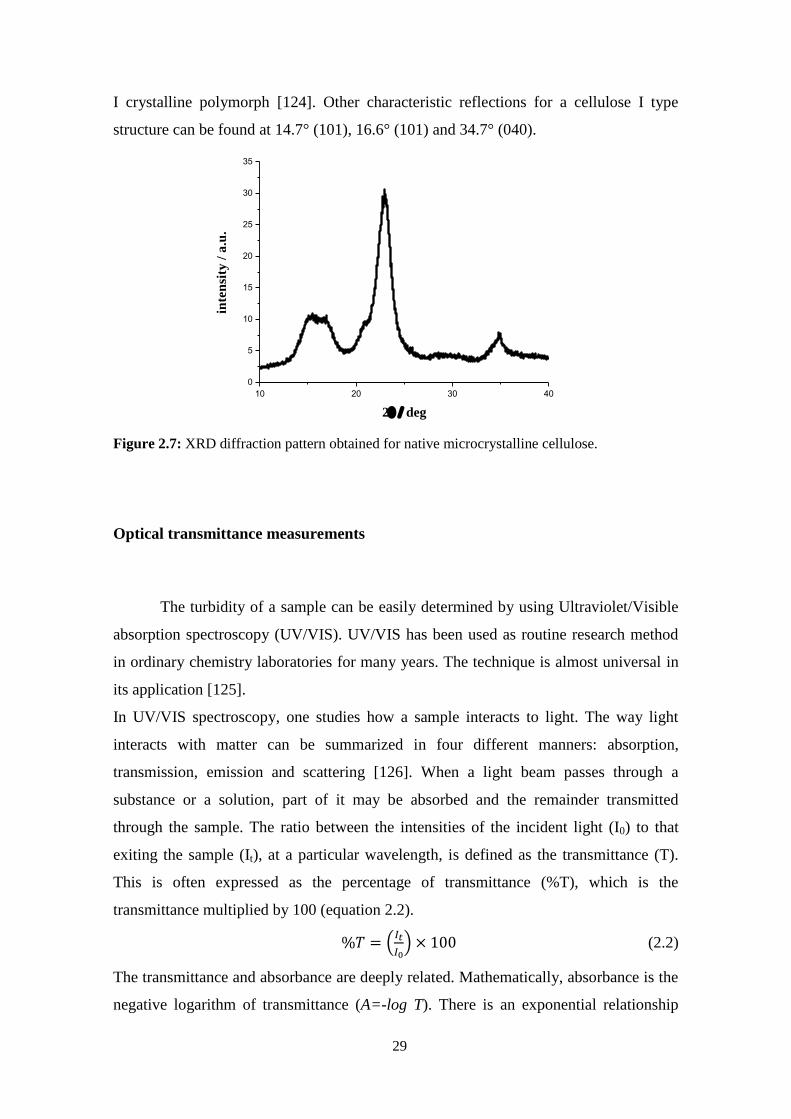
29
I crystalline polymorph [124]. Other characteristic reflections for a cellulose I type
structure can be found at 14.7° (101), 16.6° (101) and 34.7° (040).
Figure 2.7: XRD diffraction pattern obtained for native microcrystalline cellulose.
Optical transmittance measurements
The turbidity of a sample can be easily determined by using Ultraviolet/Visible
absorption spectroscopy (UV/VIS). UV/VIS has been used as routine research method
in ordinary chemistry laboratories for many years. The technique is almost universal in
its application [125].
In UV/VIS spectroscopy, one studies how a sample interacts to light. The way light
interacts with matter can be summarized in four different manners: absorption,
transmission, emission and scattering [126]. When a light beam passes through a
substance or a solution, part of it may be absorbed and the remainder transmitted
through the sample. The ratio between the intensities of the incident light (I0) to that
exiting the sample (It), at a particular wavelength, is defined as the transmittance (T).
This is often expressed as the percentage of transmittance (%T), which is the
transmittance multiplied by 100 (equation 2.2).
(2.2)
The transmittance and absorbance are deeply related. Mathematically, absorbance is the
negative logarithm of transmittance (A=-log T). There is an exponential relationship
10 20 30 40
0
5
10
15
20
25
30
35
inte
nsi
ty /
a.u
.
2deg
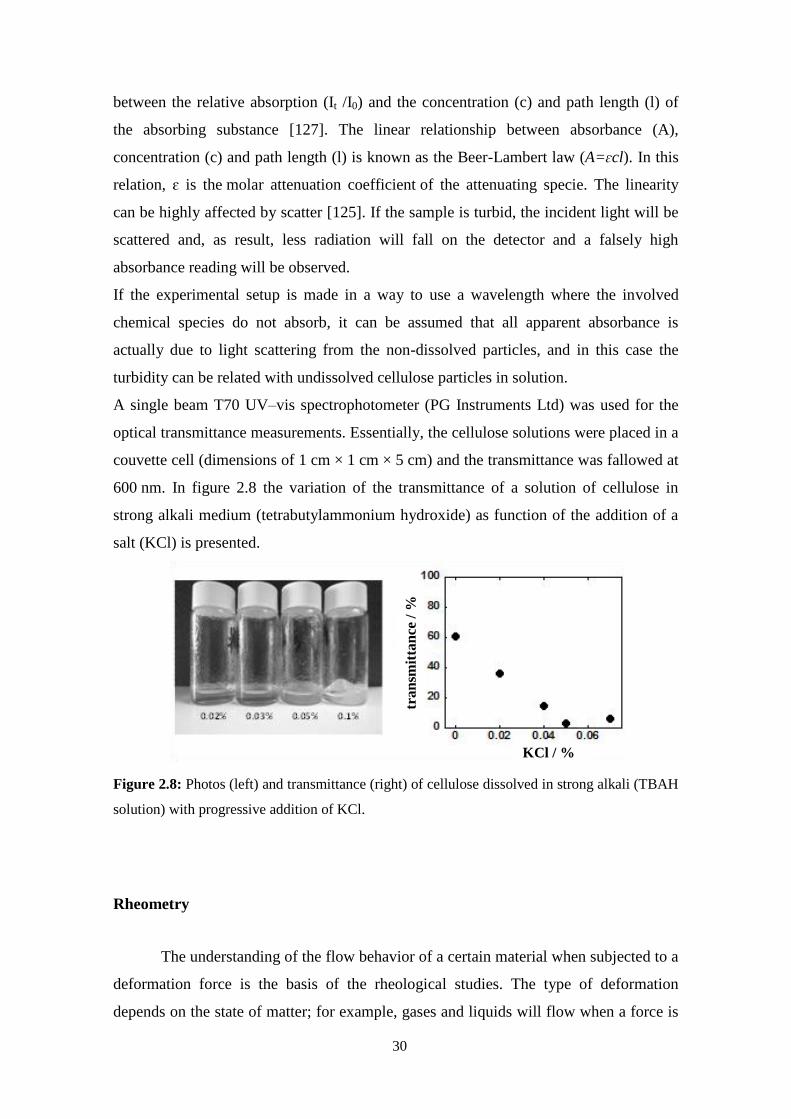
30
between the relative absorption (It /I0) and the concentration (c) and path length (l) of
the absorbing substance [127]. The linear relationship between absorbance (A),
concentration (c) and path length (l) is known as the Beer-Lambert law (A=ɛcl). In this
relation, ɛ is the molar attenuation coefficient of the attenuating specie. The linearity
can be highly affected by scatter [125]. If the sample is turbid, the incident light will be
scattered and, as result, less radiation will fall on the detector and a falsely high
absorbance reading will be observed.
If the experimental setup is made in a way to use a wavelength where the involved
chemical species do not absorb, it can be assumed that all apparent absorbance is
actually due to light scattering from the non-dissolved particles, and in this case the
turbidity can be related with undissolved cellulose particles in solution.
A single beam T70 UV–vis spectrophotometer (PG Instruments Ltd) was used for the
optical transmittance measurements. Essentially, the cellulose solutions were placed in a
couvette cell (dimensions of 1 cm × 1 cm × 5 cm) and the transmittance was fallowed at
600 nm. In figure 2.8 the variation of the transmittance of a solution of cellulose in
strong alkali medium (tetrabutylammonium hydroxide) as function of the addition of a
salt (KCl) is presented.
Figure 2.8: Photos (left) and transmittance (right) of cellulose dissolved in strong alkali (TBAH
solution) with progressive addition of KCl.
Rheometry
The understanding of the flow behavior of a certain material when subjected to a
deformation force is the basis of the rheological studies. The type of deformation
depends on the state of matter; for example, gases and liquids will flow when a force is
tr
an
smit
tan
ce /
%
KCl / %

31
applied, whilst solids will deform and are expected to regain their shape when the force
is removed (pure elastic behaviour). In other words, rheology studies the ‘‘handling
properties of materials’’. The utility of many of the materials we make use every day is
due to their unique rheological behaviour and that is one of the reasons why many
chemists spend a lot of time in developing formulations to have specific textures, flow
properties, etc. [128].
Rheological techniques help to understand the molecular organization and to anticipate
the mechanical properties of materials, thus having applications in a large number of
industrial processes in which, for instance, the viscosity control is required. Two main
groups of rheological tests can be applied: rotational and oscillatory tests. In figure 2.9
the forces applied to a certain sample using a parallel plate geometry are depicted.
Figure 2.9: Parallel plats depiction of shear rate (adapted from [129]).
The height, h, is much smaller when compared with the dimensions of the plates,
usually in the range of µm. The velocity profile can be considered linear and its gradient
is constant. Shear rate ( ) defines how quickly a fluid is induced to flow, and is related
with the applied force (σ) by a constant of proportionality, viscosity ( ), as described in
equation 2.3.
(2.3)
The oscillatory linear viscoelastic experiments measure the response function, or the
complex modulus, G*(ω) = G’(ω) + iG’’(ω). This provides information about the
relaxation of the microstructure of the system as a function of the frequency of
oscillation, ω. The elastic component is described by the rheological variable G’,
storage modulus, and represents the mechanical energy stored and recovered (per period
of oscillation). The viscous component is described by the rheological variable G’’, the
loss modulus, and it measures the mechanical energy lost as heat during the viscous
bottom plate stationary
fluid velocity gradient
top plate moving with velocity v F v
h
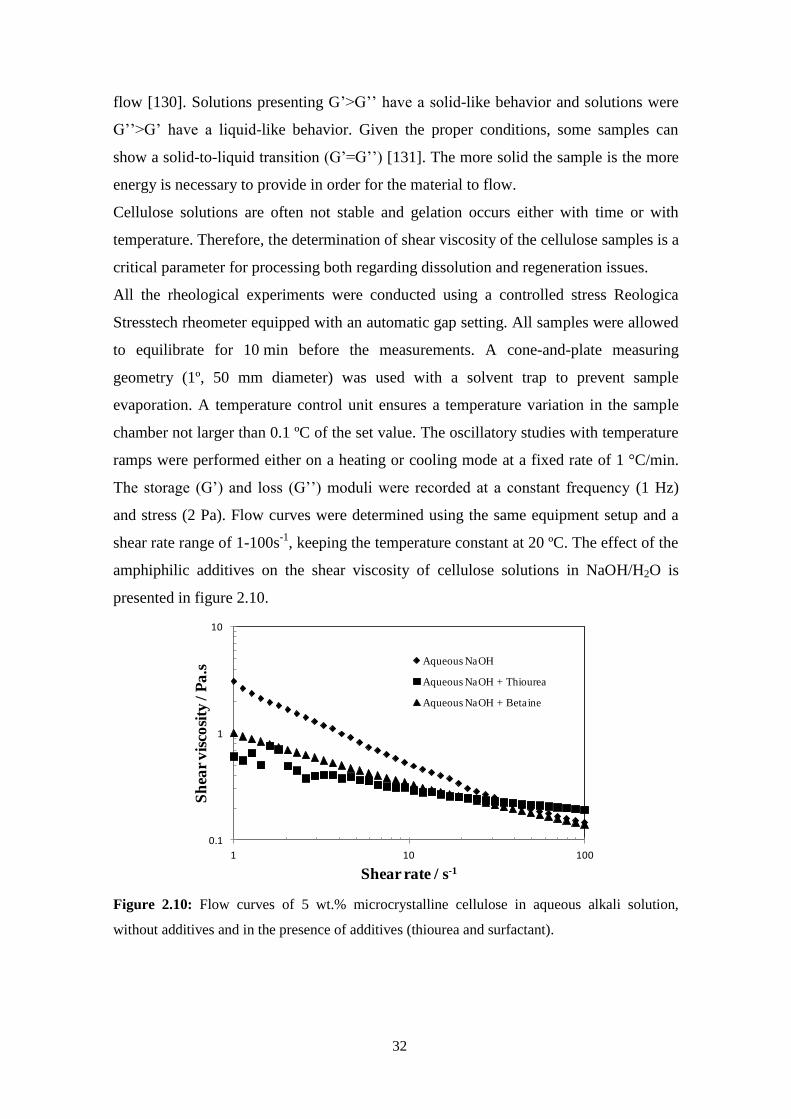
32
flow [130]. Solutions presenting G’>G’’ have a solid-like behavior and solutions were
G’’>G’ have a liquid-like behavior. Given the proper conditions, some samples can
show a solid-to-liquid transition (G’=G’’) [131]. The more solid the sample is the more
energy is necessary to provide in order for the material to flow.
Cellulose solutions are often not stable and gelation occurs either with time or with
temperature. Therefore, the determination of shear viscosity of the cellulose samples is a
critical parameter for processing both regarding dissolution and regeneration issues.
All the rheological experiments were conducted using a controlled stress Reologica
Stresstech rheometer equipped with an automatic gap setting. All samples were allowed
to equilibrate for 10 min before the measurements. A cone-and-plate measuring
geometry (1º, 50 mm diameter) was used with a solvent trap to prevent sample
evaporation. A temperature control unit ensures a temperature variation in the sample
chamber not larger than 0.1 ºC of the set value. The oscillatory studies with temperature
ramps were performed either on a heating or cooling mode at a fixed rate of 1 °C/min.
The storage (G’) and loss (G’’) moduli were recorded at a constant frequency (1 Hz)
and stress (2 Pa). Flow curves were determined using the same equipment setup and a
shear rate range of 1-100s-1
, keeping the temperature constant at 20 ºC. The effect of the
amphiphilic additives on the shear viscosity of cellulose solutions in NaOH/H2O is
presented in figure 2.10.
Figure 2.10: Flow curves of 5 wt.% microcrystalline cellulose in aqueous alkali solution,
without additives and in the presence of additives (thiourea and surfactant).
0.1
1
10
1 10 100
Sh
ear
vis
cosi
ty /
Pa
.s
Shear rate / s-1
Aqueous NaOH
Aqueous NaOH + Thiourea
Aqueous NaOH + Betaine
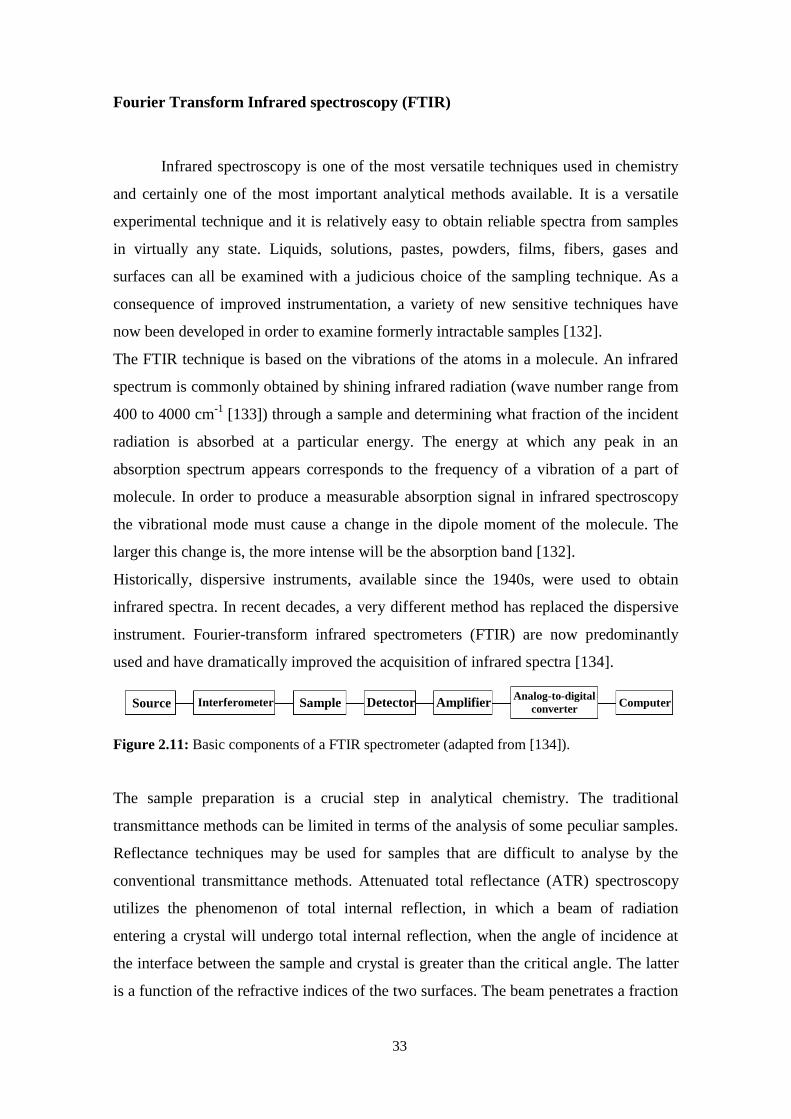
33
Fourier Transform Infrared spectroscopy (FTIR)
Infrared spectroscopy is one of the most versatile techniques used in chemistry
and certainly one of the most important analytical methods available. It is a versatile
experimental technique and it is relatively easy to obtain reliable spectra from samples
in virtually any state. Liquids, solutions, pastes, powders, films, fibers, gases and
surfaces can all be examined with a judicious choice of the sampling technique. As a
consequence of improved instrumentation, a variety of new sensitive techniques have
now been developed in order to examine formerly intractable samples [132].
The FTIR technique is based on the vibrations of the atoms in a molecule. An infrared
spectrum is commonly obtained by shining infrared radiation (wave number range from
400 to 4000 cm-1
[133]) through a sample and determining what fraction of the incident
radiation is absorbed at a particular energy. The energy at which any peak in an
absorption spectrum appears corresponds to the frequency of a vibration of a part of
molecule. In order to produce a measurable absorption signal in infrared spectroscopy
the vibrational mode must cause a change in the dipole moment of the molecule. The
larger this change is, the more intense will be the absorption band [132].
Historically, dispersive instruments, available since the 1940s, were used to obtain
infrared spectra. In recent decades, a very different method has replaced the dispersive
instrument. Fourier-transform infrared spectrometers (FTIR) are now predominantly
used and have dramatically improved the acquisition of infrared spectra [134].
Figure 2.11: Basic components of a FTIR spectrometer (adapted from [134]).
The sample preparation is a crucial step in analytical chemistry. The traditional
transmittance methods can be limited in terms of the analysis of some peculiar samples.
Reflectance techniques may be used for samples that are difficult to analyse by the
conventional transmittance methods. Attenuated total reflectance (ATR) spectroscopy
utilizes the phenomenon of total internal reflection, in which a beam of radiation
entering a crystal will undergo total internal reflection, when the angle of incidence at
the interface between the sample and crystal is greater than the critical angle. The latter
is a function of the refractive indices of the two surfaces. The beam penetrates a fraction
Source Interferometer Sample Detector Amplifier Analog-to-digital
converter Computer
34
of a wavelength beyond the reflecting surface when a material, that selectively absorbs
radiation, is in close contact with the reflecting surface. This technique has several
advantages when compared with transmittance methods, such as the minimal sample
preparation and the capability of the analysis of almost all types of samples. FTIR can
be applied in the cellulose field in order to study the structure and arrangements of the
cellulose molecules, estimate the degree of crystallinity, and also in investigations
involving modifications of cellulose, such as after cellulose oxidation [135].
The segments in the cellulose polymer chain are expected to vibrate differently in well-
ordered crystalline phases in comparison to less ordered amorphous phases and,
therefore, it is possible to assign absorption bands to crystalline and amorphous regions
and estimate a kind of crystallinity index (CrI) from FTIR. This is one of the simplest
methods but one should keep in mind that the extracted values are not absolute.
O'Connor et al. [135] established that the absorption band at around 1430 cm−1
is
characteristic of crystalline areas in the polymer and the absorption band at 890 cm−1
typical of amorphous regions; the ratio of these two bands was established as a
“crystallinity index”, later referred to as the “lateral order index” (LOI). Later, Nelson
and O'Connor [136] defined another crystalline parameter from the ratio of absorption
bands at 1370 cm−1
and 2900 cm−1
, the so called “total crystallinity index” (TCI). The
TCI is said to be proportional to the crystallinity degree of cellulose while LOI is
correlated to the overall degree of order in cellulose [137, 138].
The infrared spectra were recorded at 25 °C with an ATR-FTIR spectrophotometer
Thermo Nicolet, IR300 (USA), using an universal ATR sampling accessory. The FTIR
spectral analysis was performed within the wave number range of 400-4000 cm−1
. A
total of 256 scans run to collect each spectrum at a resolution of 1 cm−1
in the
transmission mode. The CrI (also referred to as “lateral order index” - LOI) was
estimated from the ratio between the absorption band at 1430 cm−1
and the absorption
band at 890 cm−1
[135, 139]. Additionally, the “total crystallinity index” (TCI) was
estimated from the ratio between the bands at 1370 cm−1
and 2900 cm−1
[136]. In figure
2.12 the obtained IR spectrum for microcrystalline cellulose is presented.
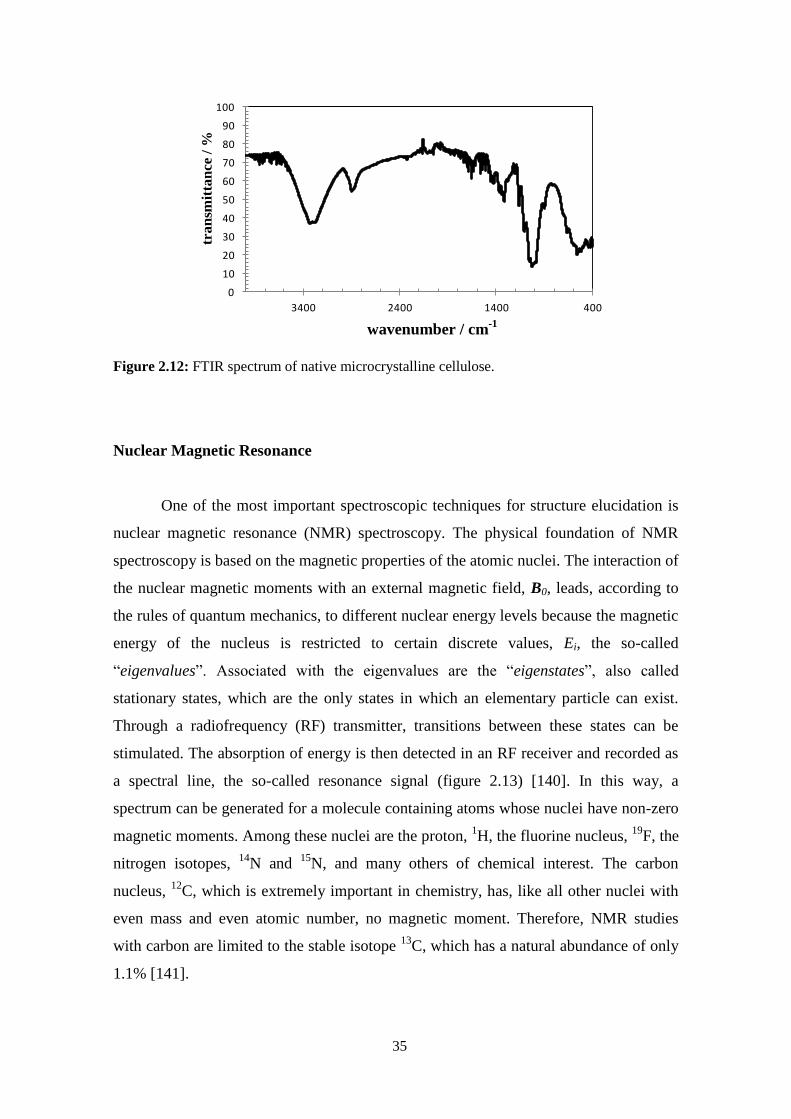
35
Figure 2.12: FTIR spectrum of native microcrystalline cellulose.
Nuclear Magnetic Resonance
One of the most important spectroscopic techniques for structure elucidation is
nuclear magnetic resonance (NMR) spectroscopy. The physical foundation of NMR
spectroscopy is based on the magnetic properties of the atomic nuclei. The interaction of
the nuclear magnetic moments with an external magnetic field, B0, leads, according to
the rules of quantum mechanics, to different nuclear energy levels because the magnetic
energy of the nucleus is restricted to certain discrete values, Ei, the so-called
“eigenvalues”. Associated with the eigenvalues are the “eigenstates”, also called
stationary states, which are the only states in which an elementary particle can exist.
Through a radiofrequency (RF) transmitter, transitions between these states can be
stimulated. The absorption of energy is then detected in an RF receiver and recorded as
a spectral line, the so-called resonance signal (figure 2.13) [140]. In this way, a
spectrum can be generated for a molecule containing atoms whose nuclei have non-zero
magnetic moments. Among these nuclei are the proton, 1H, the fluorine nucleus,
19F, the
nitrogen isotopes, 14
N and 15
N, and many others of chemical interest. The carbon
nucleus, 12
C, which is extremely important in chemistry, has, like all other nuclei with
even mass and even atomic number, no magnetic moment. Therefore, NMR studies
with carbon are limited to the stable isotope 13
C, which has a natural abundance of only
1.1% [141].
0
10
20
30
40
50
60
70
80
90
100
400140024003400
Tran
smit
tan
ce /
%
Wavenumber / cm-1wavenumber / cm
-1
tr
an
smit
tan
ce /
%
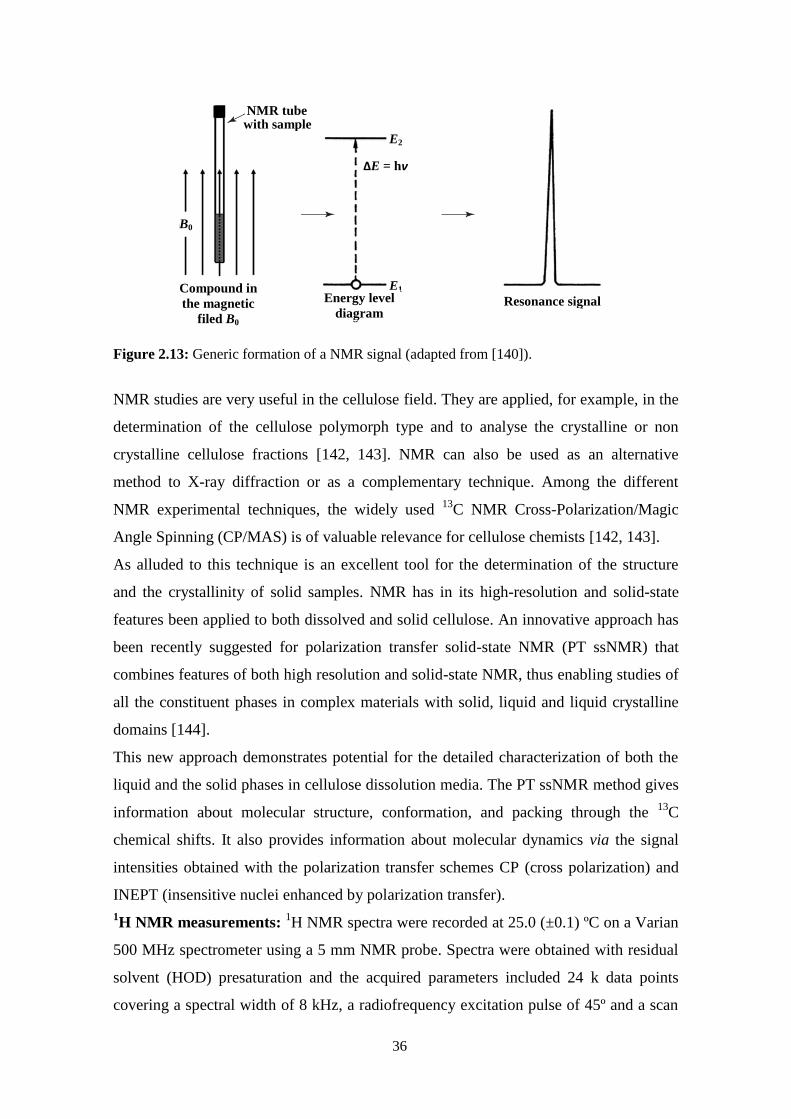
36
Figure 2.13: Generic formation of a NMR signal (adapted from [140]).
NMR studies are very useful in the cellulose field. They are applied, for example, in the
determination of the cellulose polymorph type and to analyse the crystalline or non
crystalline cellulose fractions [142, 143]. NMR can also be used as an alternative
method to X-ray diffraction or as a complementary technique. Among the different
NMR experimental techniques, the widely used 13
C NMR Cross-Polarization/Magic
Angle Spinning (CP/MAS) is of valuable relevance for cellulose chemists [142, 143].
As alluded to this technique is an excellent tool for the determination of the structure
and the crystallinity of solid samples. NMR has in its high-resolution and solid-state
features been applied to both dissolved and solid cellulose. An innovative approach has
been recently suggested for polarization transfer solid-state NMR (PT ssNMR) that
combines features of both high resolution and solid-state NMR, thus enabling studies of
all the constituent phases in complex materials with solid, liquid and liquid crystalline
domains [144].
This new approach demonstrates potential for the detailed characterization of both the
liquid and the solid phases in cellulose dissolution media. The PT ssNMR method gives
information about molecular structure, conformation, and packing through the 13
C
chemical shifts. It also provides information about molecular dynamics via the signal
intensities obtained with the polarization transfer schemes CP (cross polarization) and
INEPT (insensitive nuclei enhanced by polarization transfer).
1H NMR measurements:
1H NMR spectra were recorded at 25.0 (±0.1) ºC on a Varian
500 MHz spectrometer using a 5 mm NMR probe. Spectra were obtained with residual
solvent (HOD) presaturation and the acquired parameters included 24 k data points
covering a spectral width of 8 kHz, a radiofrequency excitation pulse of 45º and a scan
B0
Compound in
the magnetic
filed B0
NMR tube with sample
E2
E1 Energy level
diagram Resonance signal
ΔE = hν

37
repetition time of 15 s to allow for full magnetic relaxation of proton nuclei. The
resonance at 0 ppm due to the Si-(CH3)3 signal, from 3-(trimethylsilyl)propionic-
2,2,3,3-d4 acid sodium salt (TSP) at tracer concentration (below 3 µM), was used as
internal reference.
The method of continuous variation has been used to determine the stoichiometry of the
β-cyclodextrin:tetrabutylammonium hydroxide (β-CD:TBAH) interaction; for that,
samples were prepared by dissolving an amount of the solids in D2O to achieve a
concentration of β-CD and TBAH of 1.01 and 1.02 mM, respectively. The TBAH was
previously lyophilized overnight just before using and the pH of D2O was adjusted to
12.08 with the addition of NaOD, in order to keep the pH of β-CD:TBAH solutions
constant.
The binding constant was computed by using experimental 1H NMR chemical shifts of
TBA+ nuclei for mixed solutions with different [β-CD]/[TBAH] molar ratios, and
keeping the [TBAH] constant and equal to 1.20 mM.
PT ssNMR measurements: The NMR spectra were recorded using a 4 mm HR-MAS
rotor (Bruker, Germany) specifically designed for retaining liquids during magic angle
spinning (MAS). NMR experiments were performed at 25 ºC on a Bruker AVII-500
spectrometer operating at 1H and
13C Larmor frequencies of 500 and 125 MHz,
respectively, with a 4 mm 13
C/31
P/1H E-free probe (Bruker, Germany). PT ssNMR data
was recorded using 5 kHz magic angle spinning (MAS), 88 kHz two pulse phase
modulation (TPPM) decoupling, 20 ms acquisition time, 300 ppm spectral width, and
80 kHz nutation frequency for 90º and 180º pulses. CP was performed with tCP = 1 ms,
80 kHz 13
C nutation frequency, and linear ramp from 72 to 88 kHz 1H nutation
frequency. The time delays for refocused INEPT were τ = 1.8 ms and τ’ = 1.2 ms. Each
spectrum was recorded by accumulating 3072 transients with 5 s recycle delay, giving a
measurement time of 12.5 h per sample. The time-domain data was zero-filled from 755
to 8192 complex points, Fourier transformed with 100 Hz line broadening,
automatically phase corrected, and baseline corrected using customized Matlab scripts
based on matNMR. In figure 2.14 the pulse sequences used are presented and in figure
2.15 the obtained spectrum for microcrystalline cellulose (solid) is depicted.
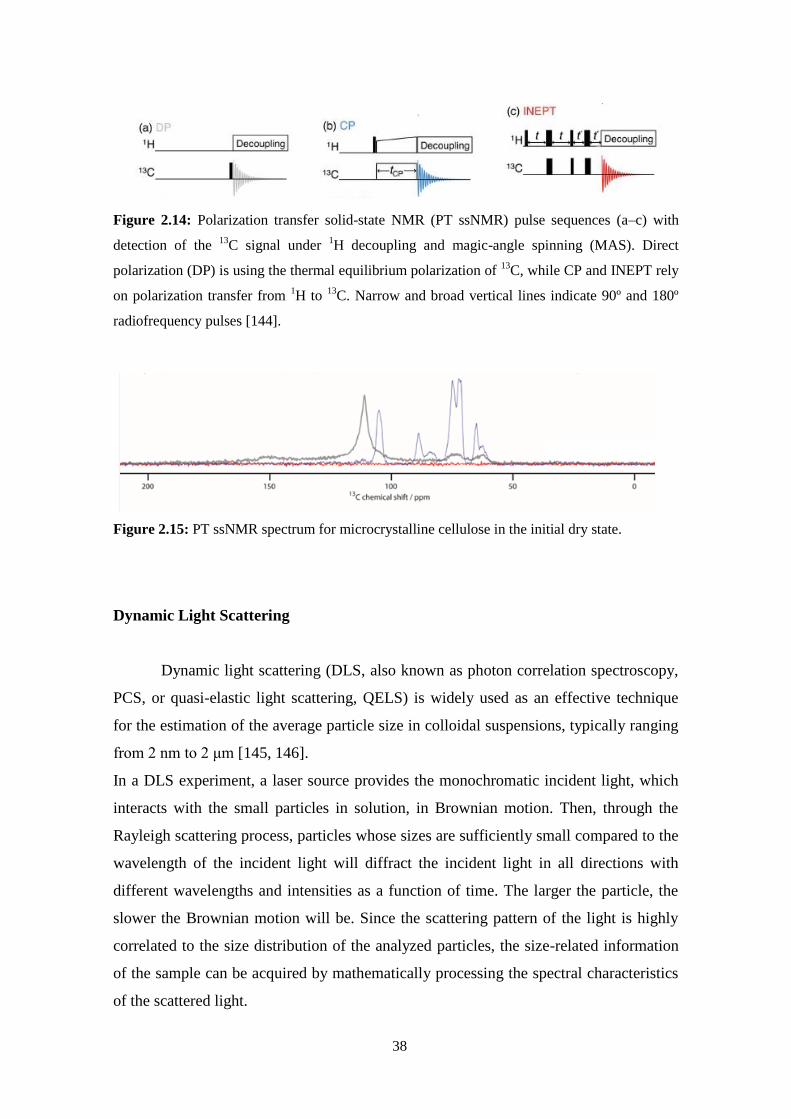
38
Figure 2.14: Polarization transfer solid-state NMR (PT ssNMR) pulse sequences (a–c) with
detection of the 13
C signal under 1H decoupling and magic-angle spinning (MAS). Direct
polarization (DP) is using the thermal equilibrium polarization of 13
C, while CP and INEPT rely
on polarization transfer from 1H to
13C. Narrow and broad vertical lines indicate 90º and 180º
radiofrequency pulses [144].
Figure 2.15: PT ssNMR spectrum for microcrystalline cellulose in the initial dry state.
Dynamic Light Scattering
Dynamic light scattering (DLS, also known as photon correlation spectroscopy,
PCS, or quasi-elastic light scattering, QELS) is widely used as an effective technique
for the estimation of the average particle size in colloidal suspensions, typically ranging
from 2 nm to 2 μm [145, 146].
In a DLS experiment, a laser source provides the monochromatic incident light, which
interacts with the small particles in solution, in Brownian motion. Then, through the
Rayleigh scattering process, particles whose sizes are sufficiently small compared to the
wavelength of the incident light will diffract the incident light in all directions with
different wavelengths and intensities as a function of time. The larger the particle, the
slower the Brownian motion will be. Since the scattering pattern of the light is highly
correlated to the size distribution of the analyzed particles, the size-related information
of the sample can be acquired by mathematically processing the spectral characteristics
of the scattered light.

39
In this method, the diffusion coefficients of the scattering particles are firstly
determined, and the average diameters are then calculated from these coefficients using
the Stokes–Einstein relationship (equation 2.4), where d(H) is the hydrodynamic
diameter, k is the Boltzmann’s constant, T is the absolute temperature, η is the viscosity
and D is translational diffusion coefficient [147].
(2.4)
The relation between the translational diffusion coefficient (or hydrodynamic radius)
and the actual dimensions of non-spherical particles depends on the particle shape.
The size is obtained from the correlation function, which describes the decay of the
intensity of the scattered light as a function of time, and contains the diffusion
coefficient information required in the Stokes-Einstein equation. The diffusion
coefficient is obtained by fitting the correlation function with a suitable algorithm, such
as the cumulants analysis, which determines a mean size and polydispersity index (PI).
In the case of polydisperse samples a different algorithm should be used such as the
non-negatively constrained least squares (NNLS) or CONTIN to deconvolute the
measured intensity autocorrelation function of the sample into a number of intensity
values each associated with a discrete size band [148]. The size distribution can be
extracted from the fluctuations in the data of the scattered light using cumulant
expansion or other methods; the obtained results can be expressed using one of three
kinds of distribution index, usually used in size analysis: number weighted distribution,
volume weighted distribution, and intensity weighted distribution. In figure 2.16 the
correlation function and the size distribution by intensity obtained for a sample of
microcrystalline cellulose are presented.
Figure 2.16: Correlogram and size distribution by intensity obtained for 0.5 wt.%
microcrystalline cellulose in TBAH/H2O system. Temperature was kept at 25 ºC.
a) b)

40
41
CHAPTER 3
Results and discussion
3.1 - Cellulose derivatives: Crystallinity and solution state.
In theory, a successful polymer dissolution completely eliminates the
supramolecular structure resulting in a clear solution where the polymer is molecularly
dispersed. Experience with synthetic polymers reveals that these solutions are typically
mostly fully dispersed down to the molecular level. This has led to the simplified
conclusion that either a polymer is dissolved or not. However, this two-option rule does
not always hold; intermediate stages between swelling and complete solubility exist and
cellulose and its derivatives are clear examples of it [149].
In the majority of the cases, cellulose and its derivatives only rarely form molecularly
dispersed solutions; cellulose is not dissolved down to a molecular level but rather
forms stable colloidal dispersions where ordered cellulose aggregates are present
(aggregation numbers between 10 to 800 have been estimated) [76].
On the other hand, cellulose derivatives are known as being highly soluble. This high
solubility of cellulose derivatives is excellent for applications such as in food,
pharmaceuticals or drug delivery [9]. In general, cellulose derivatives result from the
non-homogeneous substitution of the hydroxyl groups in each anhydroglucose ring by
other functional groups. Cellulose modification occurs first in the amorphous domains
and later in the crystalline regions. Nevertheless, during this process, a large decrease in

42
the crystallinity of the substance is expected to occur [150]; this is one of the arguments
to explain the high solubility of these derivatives. From such high solubility the
formation of molecularly dispersed solutions can be anticipated; Kamide et al. reports
that a cellulose derivative (CMC), with high degree of substitution, forms a gel-like
solution while the residual small crystalline regions act as cross-linking points [150].
Therefore, at a first glance, one could argue that cellulose derivatives are not an obvious
choice as a source of nanocrystals. To our knowledge, cellulose nanocrystals, CNCs,
have never been extracted from cellulose derivatives and therefore we here report the
initial results regarding their extraction and characterization. Scanning electron
microscopy (SEM) and dynamic light scattering (DLS) were used to study the
morphology while FTIR and X-ray diffraction were further used to infer about more
detailed molecular information of the extracted CNCs.
Materials and methods
The materials and methods used are described in chapter 2.
Results
The chemical modification of cellulose includes activation of the polymer by
dissolution in suitable solvents, conversion of the dissolved cellulose with reactive
compounds, and control of the functionalization pattern by using protecting groups
[151]. Suitable solvent systems, such as DMAc/LiCl or ionic liquids typically present a
high cellulose dissolution efficiency, which consequently makes possible to achieve a
high substitution degree, as well as a homogenous distribution of the substitutions. At
the end of the derivatization process the obtained product is usually highly soluble in
water or in other solvents.
The cellulose derivatives (commercial samples) used in the present work form clear
solutions when dispersed in water. Thus, from a macroscopic point of view, cellulose is
completely dissolved. However, looking into these samples using electronic microscopy
(Cryo-SEM) it is possible to observe polymer aggregates, even at very low
concentration, below the estimated overlap concentration (ca. 0.7 wt.% [152]). In figure
3.1 micrographs of cellulose derivatives in water are presented.
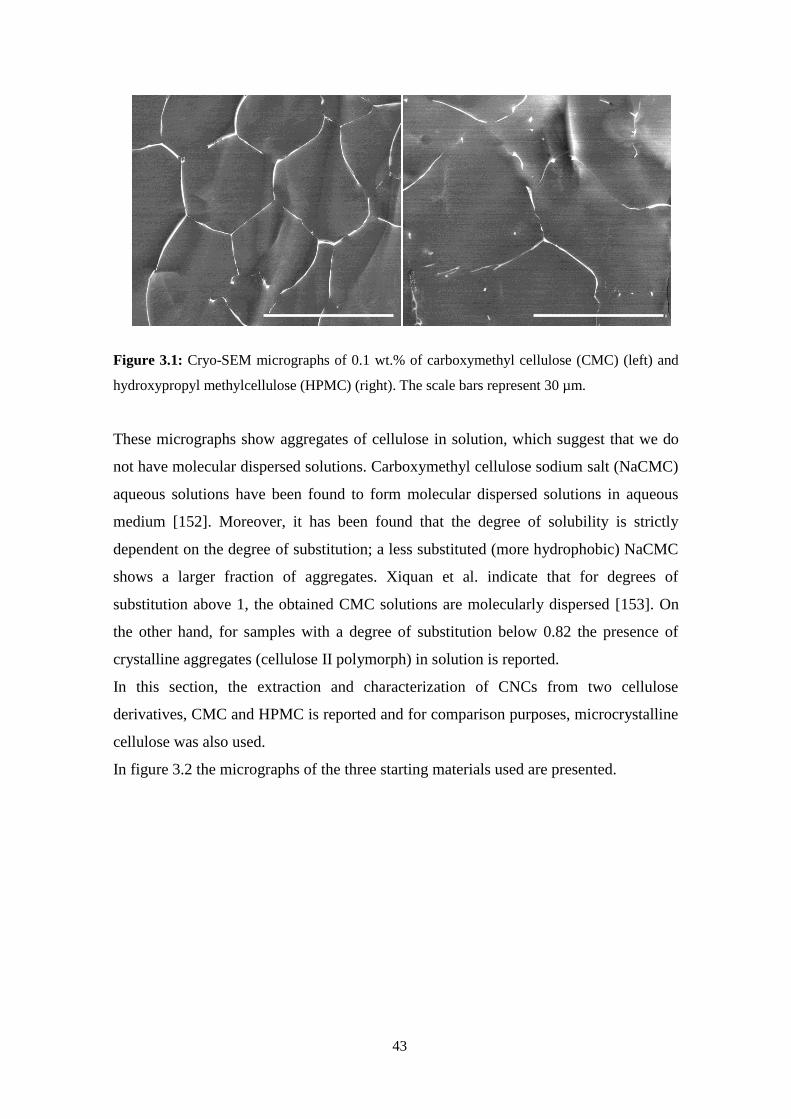
43
Figure 3.1: Cryo-SEM micrographs of 0.1 wt.% of carboxymethyl cellulose (CMC) (left) and
hydroxypropyl methylcellulose (HPMC) (right). The scale bars represent 30 µm.
These micrographs show aggregates of cellulose in solution, which suggest that we do
not have molecular dispersed solutions. Carboxymethyl cellulose sodium salt (NaCMC)
aqueous solutions have been found to form molecular dispersed solutions in aqueous
medium [152]. Moreover, it has been found that the degree of solubility is strictly
dependent on the degree of substitution; a less substituted (more hydrophobic) NaCMC
shows a larger fraction of aggregates. Xiquan et al. indicate that for degrees of
substitution above 1, the obtained CMC solutions are molecularly dispersed [153]. On
the other hand, for samples with a degree of substitution below 0.82 the presence of
crystalline aggregates (cellulose II polymorph) in solution is reported.
In this section, the extraction and characterization of CNCs from two cellulose
derivatives, CMC and HPMC is reported and for comparison purposes, microcrystalline
cellulose was also used.
In figure 3.2 the micrographs of the three starting materials used are presented.
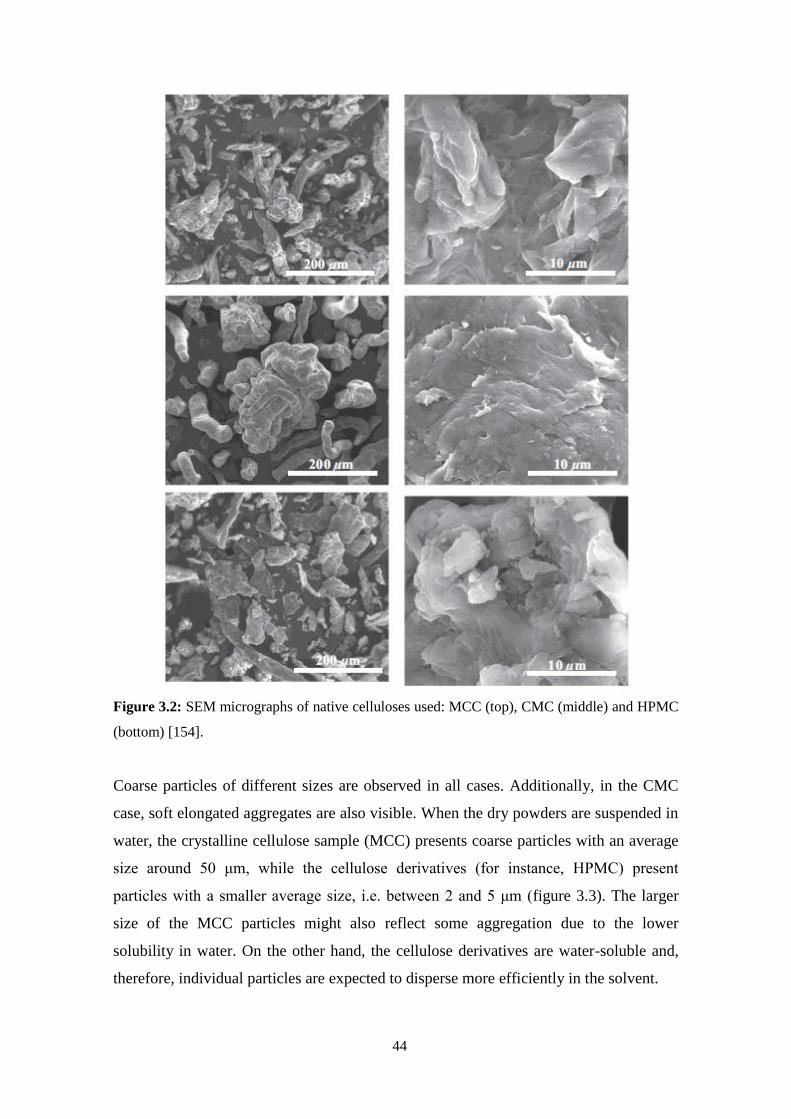
44
Figure 3.2: SEM micrographs of native celluloses used: MCC (top), CMC (middle) and HPMC
(bottom) [154].
Coarse particles of different sizes are observed in all cases. Additionally, in the CMC
case, soft elongated aggregates are also visible. When the dry powders are suspended in
water, the crystalline cellulose sample (MCC) presents coarse particles with an average
size around 50 μm, while the cellulose derivatives (for instance, HPMC) present
particles with a smaller average size, i.e. between 2 and 5 μm (figure 3.3). The larger
size of the MCC particles might also reflect some aggregation due to the lower
solubility in water. On the other hand, the cellulose derivatives are water-soluble and,
therefore, individual particles are expected to disperse more efficiently in the solvent.
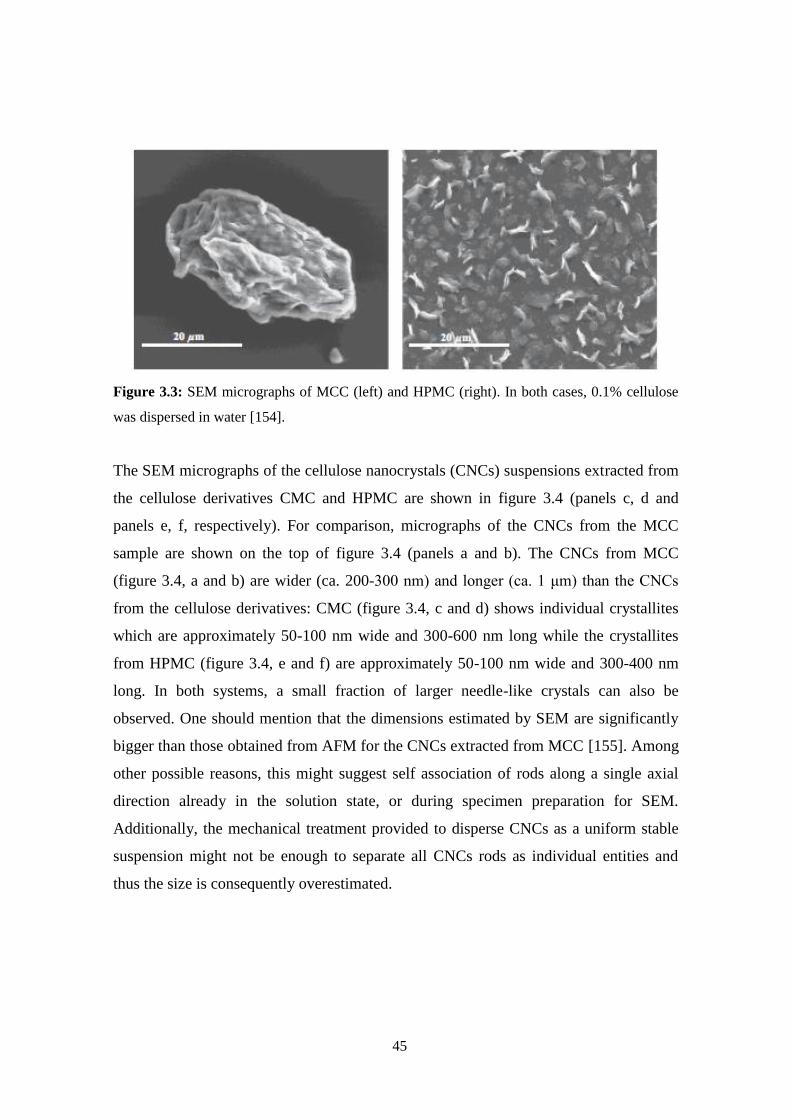
45
Figure 3.3: SEM micrographs of MCC (left) and HPMC (right). In both cases, 0.1% cellulose
was dispersed in water [154].
The SEM micrographs of the cellulose nanocrystals (CNCs) suspensions extracted from
the cellulose derivatives CMC and HPMC are shown in figure 3.4 (panels c, d and
panels e, f, respectively). For comparison, micrographs of the CNCs from the MCC
sample are shown on the top of figure 3.4 (panels a and b). The CNCs from MCC
(figure 3.4, a and b) are wider (ca. 200-300 nm) and longer (ca. 1 μm) than the CNCs
from the cellulose derivatives: CMC (figure 3.4, c and d) shows individual crystallites
which are approximately 50-100 nm wide and 300-600 nm long while the crystallites
from HPMC (figure 3.4, e and f) are approximately 50-100 nm wide and 300-400 nm
long. In both systems, a small fraction of larger needle-like crystals can also be
observed. One should mention that the dimensions estimated by SEM are significantly
bigger than those obtained from AFM for the CNCs extracted from MCC [155]. Among
other possible reasons, this might suggest self association of rods along a single axial
direction already in the solution state, or during specimen preparation for SEM.
Additionally, the mechanical treatment provided to disperse CNCs as a uniform stable
suspension might not be enough to separate all CNCs rods as individual entities and
thus the size is consequently overestimated.

46
Figure 3.4: SEM micrographs of CNCs extracted from MCC (a and b), CMC (c and d) and
HPMC (e and f) [154].
The size of the CNC particles was also estimated from photon correlation spectroscopy
(PCS). Since PCS is a light-scattering method, the measured CNC particle size values
are the z-average (intensity mean) hydrodynamic diameters of equivalent spheres and
do not represent the actual physical dimensions of the rod-like CNC particles. However,
the extracted values are valid for comparison purposes. In table 3.1 some structural
parameters derived from the different techniques used are represented.
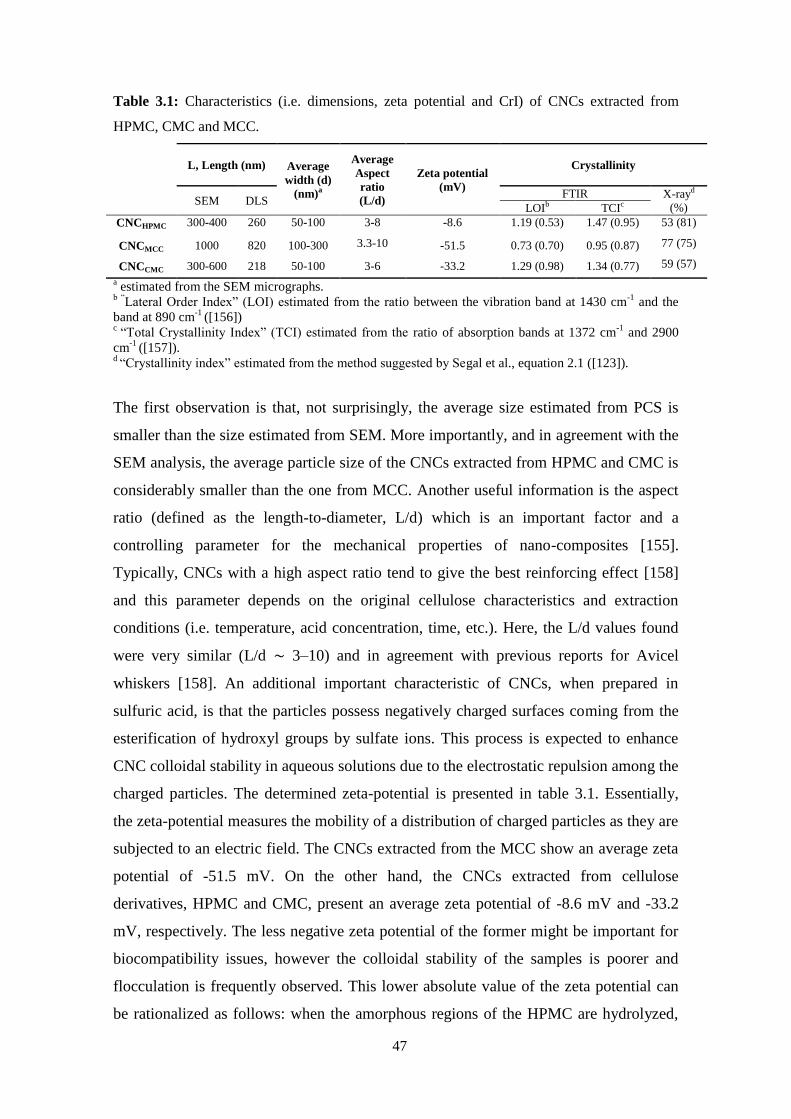
47
Table 3.1: Characteristics (i.e. dimensions, zeta potential and CrI) of CNCs extracted from
HPMC, CMC and MCC.
L, Length (nm) Average
width (d)
(nm)a
Average
Aspect
ratio
(L/d)
Zeta potential
(mV)
Crystallinity
SEM DLS FTIR X-rayd
(%) LOIb TCIc
CNCHPMC 300-400 260 50-100 3-8
3.3-10
-8.6 1.19 (0.53) 1.47 (0.95) 53 (81)
77 (75)
59 (57)
CNCMCC 1000 820 100-300 -51.5 0.73 (0.70) 0.95 (0.87)
CNCCMC 300-600 218 50-100 3-6 -33.2 1.29 (0.98) 1.34 (0.77)
a estimated from the SEM micrographs.
b “Lateral Order Index” (LOI) estimated from the ratio between the vibration band at 1430 cm
-1 and the
band at 890 cm-1
([156]) c
“Total Crystallinity Index” (TCI) estimated from the ratio of absorption bands at 1372 cm-1
and 2900
cm-1
([157]). d “Crystallinity index” estimated from the method suggested by Segal et al., equation 2.1 ([123]).
The first observation is that, not surprisingly, the average size estimated from PCS is
smaller than the size estimated from SEM. More importantly, and in agreement with the
SEM analysis, the average particle size of the CNCs extracted from HPMC and CMC is
considerably smaller than the one from MCC. Another useful information is the aspect
ratio (defined as the length-to-diameter, L/d) which is an important factor and a
controlling parameter for the mechanical properties of nano-composites [155].
Typically, CNCs with a high aspect ratio tend to give the best reinforcing effect [158]
and this parameter depends on the original cellulose characteristics and extraction
conditions (i.e. temperature, acid concentration, time, etc.). Here, the L/d values found
were very similar (L/d ∼ 3–10) and in agreement with previous reports for Avicel
whiskers [158]. An additional important characteristic of CNCs, when prepared in
sulfuric acid, is that the particles possess negatively charged surfaces coming from the
esterification of hydroxyl groups by sulfate ions. This process is expected to enhance
CNC colloidal stability in aqueous solutions due to the electrostatic repulsion among the
charged particles. The determined zeta-potential is presented in table 3.1. Essentially,
the zeta-potential measures the mobility of a distribution of charged particles as they are
subjected to an electric field. The CNCs extracted from the MCC show an average zeta
potential of -51.5 mV. On the other hand, the CNCs extracted from cellulose
derivatives, HPMC and CMC, present an average zeta potential of -8.6 mV and -33.2
mV, respectively. The less negative zeta potential of the former might be important for
biocompatibility issues, however the colloidal stability of the samples is poorer and
flocculation is frequently observed. This lower absolute value of the zeta potential can
be rationalized as follows: when the amorphous regions of the HPMC are hydrolyzed,
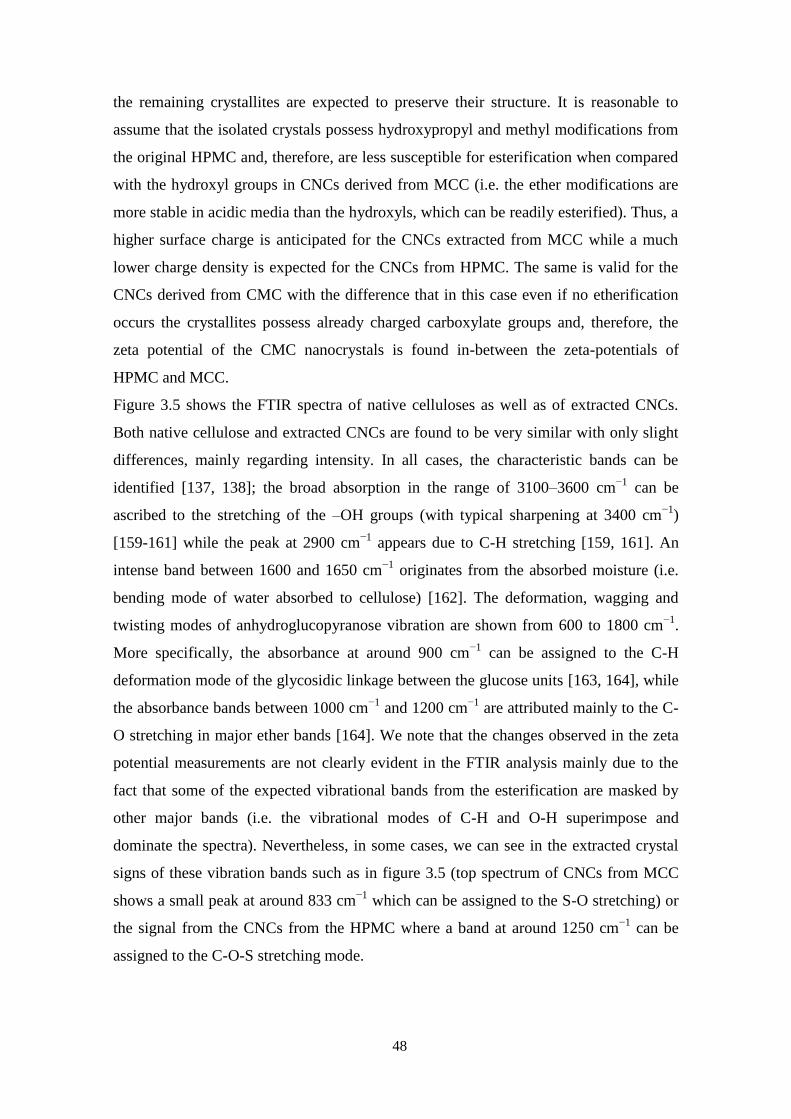
48
the remaining crystallites are expected to preserve their structure. It is reasonable to
assume that the isolated crystals possess hydroxypropyl and methyl modifications from
the original HPMC and, therefore, are less susceptible for esterification when compared
with the hydroxyl groups in CNCs derived from MCC (i.e. the ether modifications are
more stable in acidic media than the hydroxyls, which can be readily esterified). Thus, a
higher surface charge is anticipated for the CNCs extracted from MCC while a much
lower charge density is expected for the CNCs from HPMC. The same is valid for the
CNCs derived from CMC with the difference that in this case even if no etherification
occurs the crystallites possess already charged carboxylate groups and, therefore, the
zeta potential of the CMC nanocrystals is found in-between the zeta-potentials of
HPMC and MCC.
Figure 3.5 shows the FTIR spectra of native celluloses as well as of extracted CNCs.
Both native cellulose and extracted CNCs are found to be very similar with only slight
differences, mainly regarding intensity. In all cases, the characteristic bands can be
identified [137, 138]; the broad absorption in the range of 3100–3600 cm−1
can be
ascribed to the stretching of the –OH groups (with typical sharpening at 3400 cm−1
)
[159-161] while the peak at 2900 cm−1
appears due to C-H stretching [159, 161]. An
intense band between 1600 and 1650 cm−1
originates from the absorbed moisture (i.e.
bending mode of water absorbed to cellulose) [162]. The deformation, wagging and
twisting modes of anhydroglucopyranose vibration are shown from 600 to 1800 cm−1
.
More specifically, the absorbance at around 900 cm−1
can be assigned to the C-H
deformation mode of the glycosidic linkage between the glucose units [163, 164], while
the absorbance bands between 1000 cm−1
and 1200 cm−1
are attributed mainly to the C-
O stretching in major ether bands [164]. We note that the changes observed in the zeta
potential measurements are not clearly evident in the FTIR analysis mainly due to the
fact that some of the expected vibrational bands from the esterification are masked by
other major bands (i.e. the vibrational modes of C-H and O-H superimpose and
dominate the spectra). Nevertheless, in some cases, we can see in the extracted crystal
signs of these vibration bands such as in figure 3.5 (top spectrum of CNCs from MCC
shows a small peak at around 833 cm−1
which can be assigned to the S-O stretching) or
the signal from the CNCs from the HPMC where a band at around 1250 cm−1
can be
assigned to the C-O-S stretching mode.
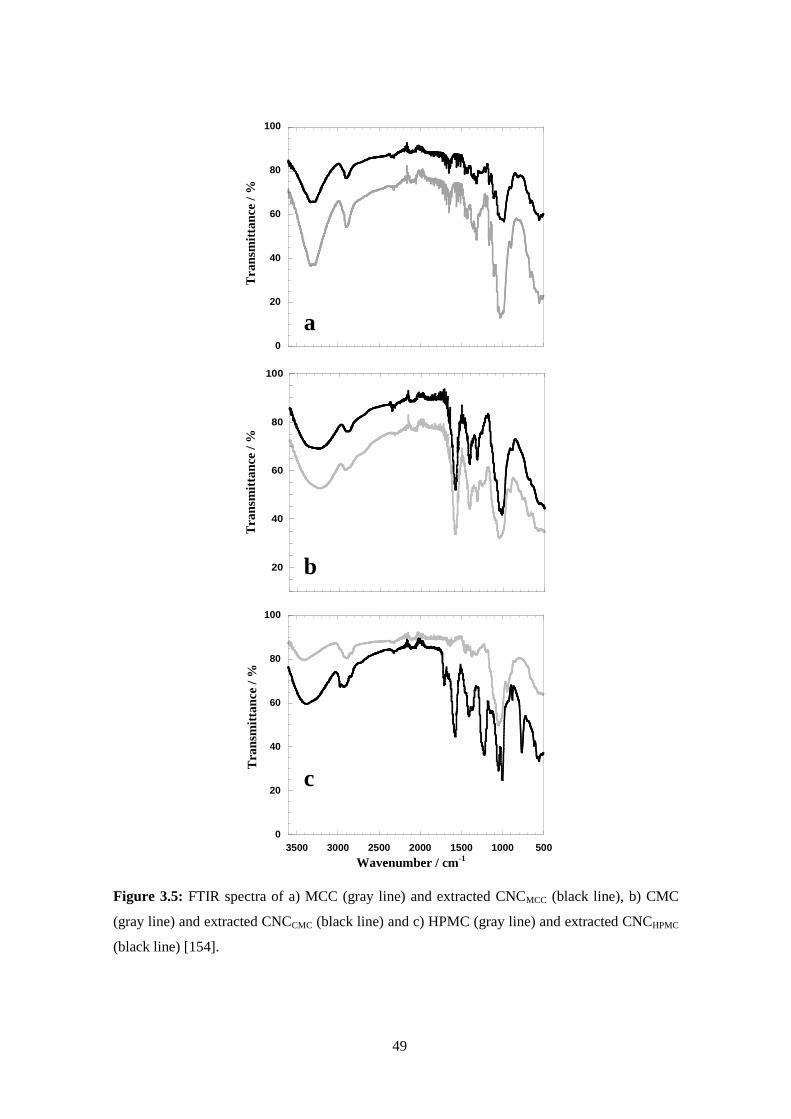
49
Figure 3.5: FTIR spectra of a) MCC (gray line) and extracted CNCMCC (black line), b) CMC
(gray line) and extracted CNCCMC (black line) and c) HPMC (gray line) and extracted CNCHPMC
(black line) [154].
b
0
20
40
60
80
100
Tra
nsm
itan
ce / %
20
40
60
80
100
Tra
nsm
itan
ce / %
0
20
40
60
80
100
500100015002000250030003500
Tra
nsm
itan
ce / %
Wavenumber / cm-1
a
b
c
Wavenumber / cm-1
Tran
smit
tan
ce /
%
Tran
smit
tan
ce /
%
Tran
smit
tan
ce /
%
50
As described in chapter 2, it is possible to estimate a crystallinity index (CrI) from
FTIR. In table 3.1, both TCI and LOI are presented. The numbers inside the parentheses
represent the indices for the initial cellulose (MCC, CMC and HPMC). Regardless of
the method of calculation, the CrI estimated from FTIR always increases for the CNCs.
This is somehow expected since during the extraction and purification procedure the
amorphous areas are likely removed and thus the crystallinity increases. Another
important observation is that the native cellulose derivatives, CMC and HPMC, are
already quite crystalline and the CNCs extracted from them present both TCI and LOI
indices higher than the ones corresponding to the CNCs extracted from MCC.
This high crystallinity of the cellulose derivatives is not trivial to understand.
Modifications are expected to affect adversely the good packing of cellulose chains in
crystals (i.e. decrease the crystallinity and enhance solubility). This is why essentially
any modification done on cellulose tends to make it more soluble in water; apart from
HPMC and CMC, other notable examples are, for instance, methyl cellulose (MC) and
hydroxyethylcellulose (HEC).
The former is highly soluble in water, even if from a polarity point of view it would be
expected to be less soluble. In the latter case, also highly soluble, substitution would not
change the number of hydrogen bonds (typical argument used to explain cellulose
insolubility in water) compared to unmodified cellulose. Therefore, it is somehow
surprising that the (water soluble) cellulose derivatives studied here present such a
significant initial crystallinity. Although relevant, the data suggests that crystallinity is
indeed not the critical parameter for cellulose solubility.
The X-ray diffraction patterns of cellulose starting materials and extracted CNCs are
represented in figure 3.6. In line with the FTIR measurements, the first important
observation is that, despite HPMC and CMC being modified polymers, it is clear that
both are significantly crystalline in nature as can be inferred from the diffraction peaks.
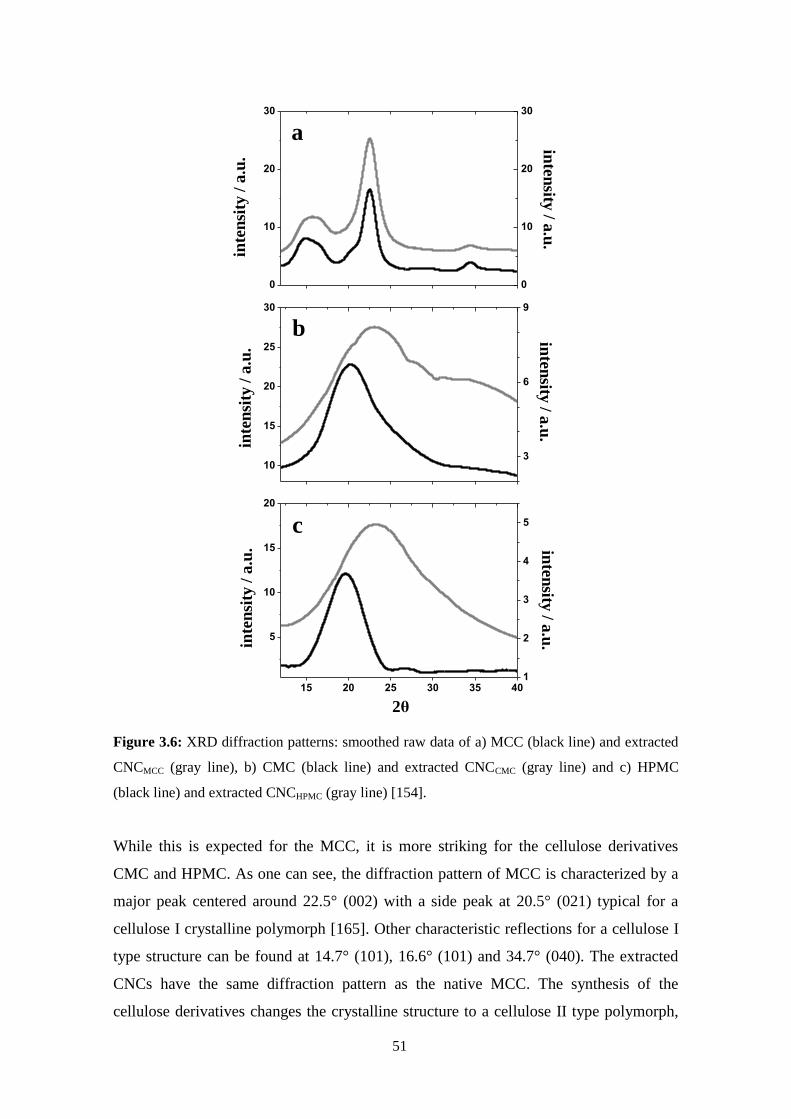
51
Figure 3.6: XRD diffraction patterns: smoothed raw data of a) MCC (black line) and extracted
CNCMCC (gray line), b) CMC (black line) and extracted CNCCMC (gray line) and c) HPMC
(black line) and extracted CNCHPMC (gray line) [154].
While this is expected for the MCC, it is more striking for the cellulose derivatives
CMC and HPMC. As one can see, the diffraction pattern of MCC is characterized by a
major peak centered around 22.5° (002) with a side peak at 20.5° (021) typical for a
cellulose I crystalline polymorph [165]. Other characteristic reflections for a cellulose I
type structure can be found at 14.7° (101), 16.6° (101) and 34.7° (040). The extracted
CNCs have the same diffraction pattern as the native MCC. The synthesis of the
cellulose derivatives changes the crystalline structure to a cellulose II type polymorph,
0
10
20
30
0
10
20
30
inte
ns
ity / a
.u.
inte
ns
ity
/ a
.u.
10
15
20
25
30
inte
ns
ity
/ a
.u.
3
6
9
inte
ns
ity / a
.u.
15 20 25 30 35 40
5
10
15
20
2
inte
ns
ity
/ a
.u.
1
2
3
4
5
inte
ns
ity / a
.u.
a
b
c
2θ
inte
nsi
ty /
a.u
. inten
sity / a
.u.
inte
nsi
ty /
a.u
. in
ten
sity
/ a
.u.
inten
sity / a
.u.
inten
sity / a
.u.
52
where a diffraction pattern with a unique peak centered around 20.1° (101) can be
observed for both CMC and HPMC. On the other hand, the CNCs extracted from the
cellulose derivatives also show a single peak but centered around 22.5° (002) which, as
previously discussed, can be attributed to a crystal structure of cellulose I type. Despite
the fact that in XRD, intensity depends on several instrumental/sample conditions, such
as sample mass/size and sample placement, so that intensity usually cannot be used to
extract direct information through comparisons with other samples, we note that the
diffraction intensities for CNCs from cellulose derivatives are considerably lower when
compared with the native celluloses. This might mean that although the original
material has a preferential cellulose II organization (due to the chemical synthesis), a
small fraction of cellulose I is still present (but masked by the dominating cellulose II
organization) and could be isolated in the CNCs. The degree of crystallinity was
estimated following the method suggest by Segal et al. [123] and included in table 3.1.
In qualitative agreement with the FTIR analysis, one can observe that the native
cellulose derivatives are highly crystalline (the estimated CrI is in all cases above 50%)
and the extracted CNCs, with exception of the HPMC case, show a higher CrI value
than the original cellulose derivatives.
Synopsis
A successful extraction and characterization of CNCs from the cellulose derivatives
CMC and HPMC is reported. Surprisingly, the cellulose derivatives were found to be
significantly crystalline indicating an unusual extraction of CNCs. The average size of
the CNCs extracted from HPMC and CMC was found to be smaller (and with lower
zeta potential) than the ones extracted from microcrystalline cellulose (MCC). The
estimated crystallinity indices show that the extracted material is more crystalline than
the native one. However, while the MCC and CNCs share the same crystalline
organization (cellulose I polymorph), the cellulose derivatives (starting materials) were
found to be of cellulose II type. The extracted CNCs from the cellulose derivatives
show a crystalline organization of cellulose I type, which probably indicates that the
starting material has a small fraction of cellulose I (masked in the diffraction spectra by
the main cellulose II diffraction pattern), which is the one isolated after dissolution in
the acidic media and purification. In literature is described the obtainment of aggregated
crystalline domains by X-ray diffraction in aqueous solution, for NaCMC derivative,
53
with degree of substitution (D.S.) below 1.06. No crystallinity was found for D.S. 1.06
[153]. These aggregates are assumed to be cellulose type II, contrary to the result
obtained in the present work, keeping in mind that once dissolved, cellulose does not
reorganize in a cellulose type I polymorph. Our data suggests that there are specific
parts of cellulose chains that remain insoluble during all the modification process. The
huge challenge of getting molecularly dispersed solutions will be discussed in the next
sections.
3.2 - Polarization transfer solid-state NMR: A new method for
studying cellulose dissolution
Several cellulose end-products such as fibers and films, typically involve pre-
dissolution steps in solvents with toxic components such as carbon disulfide or copper
ions. Therefore dissolution of cellulose in aqueous media is, for economical and
environmental reasons, strongly preferred. Current aqueous dissolution media include
NaOH based systems [166], with or without other additives such urea or thiourea [49,
50], or tetraalkylammonium salts [167].
Not only the mechanisms governing cellulose dissolution are still in debate but also the
characterization of the dissolved state is still lacking. The development of facile and
accurate techniques capable to provide a clear understanding on the level of dissolution
and molecular organization of cellulose is obviously desired.
Solid, dissolved, and regenerated cellulose are usually separately investigated with a
wide range of experimental techniques: infrared spectroscopy [137], fiber and powder
X-ray diffraction [168, 169], transmission and scanning electron microscopy [109, 170],
and neutron fiber diffraction [171] among others. Among the wide spectrum of
techniques applied to cellulose research, mainly cryo-TEM and small angle X-ray
scattering (SAXS) are recently introduced to study cellulose in solution [77]. Although
all the techniques give useful information about particular aspects of the starting
material or the final product, molecular-level information about both the dissolved and
the solid polymer in the dissolution medium is still lacking.
54
High-resolution nuclear magnetic resonance (NMR) [172] and solid-state NMR [173]
have been applied to both dissolved [174, 175] and solid [142, 176] cellulose. Recently
Topgaard et al. suggested an experimental approach based on a new developed NMR
methodology [177] that combines features of both high resolution and solid-state NMR,
thus enabling studies of all the constituent phases in complex materials with solid,
liquid, and liquid crystalline domains. The method has been applied to hydrated
surfactants [177, 178], lipid biomembranes [179], lipid-amyloid fibril aggregates [180],
and intact stratum corneum [181], all of which contain amphiphilic molecules in a wide
range of physical states. In this section the potential of PT ssNMR for detailed
characterization of both the liquid and the solid phases in cellulose dissolution media is
discussed.
The CP and INEPT techniques are traditionally used to boost the signals for solids and
liquids, respectively, in comparison to the 13
C direct polarization (DP). The 13
C signal is
acquired under magic-angle spinning (MAS) and high power 1H decoupling [182],
giving spectra with reasonably high resolution for both liquids and solids.
Materials and methods
The materials and methods used are described in chapter 2.
Results
The preliminary experimental PT ssNMR results obtained for cellulose are displayed in
figure 3.8 and the 13
C chemical shifts of the peaks assigned to cellulose are compiled in
table 3.2. The blue and red colors, attributed to CP and INEPT spectra, respectively, are
shown to give an intuitive visual impression of which peaks originate from segments
with slow (CP) or fast (INEPT) molecular dynamics (see figure 3.7). As a reference, the
DP spectra are shown in gray. The dry cellulose gives intense CP peaks while the
INEPT signal is absent, which is consistent with cellulose being in a solid state.
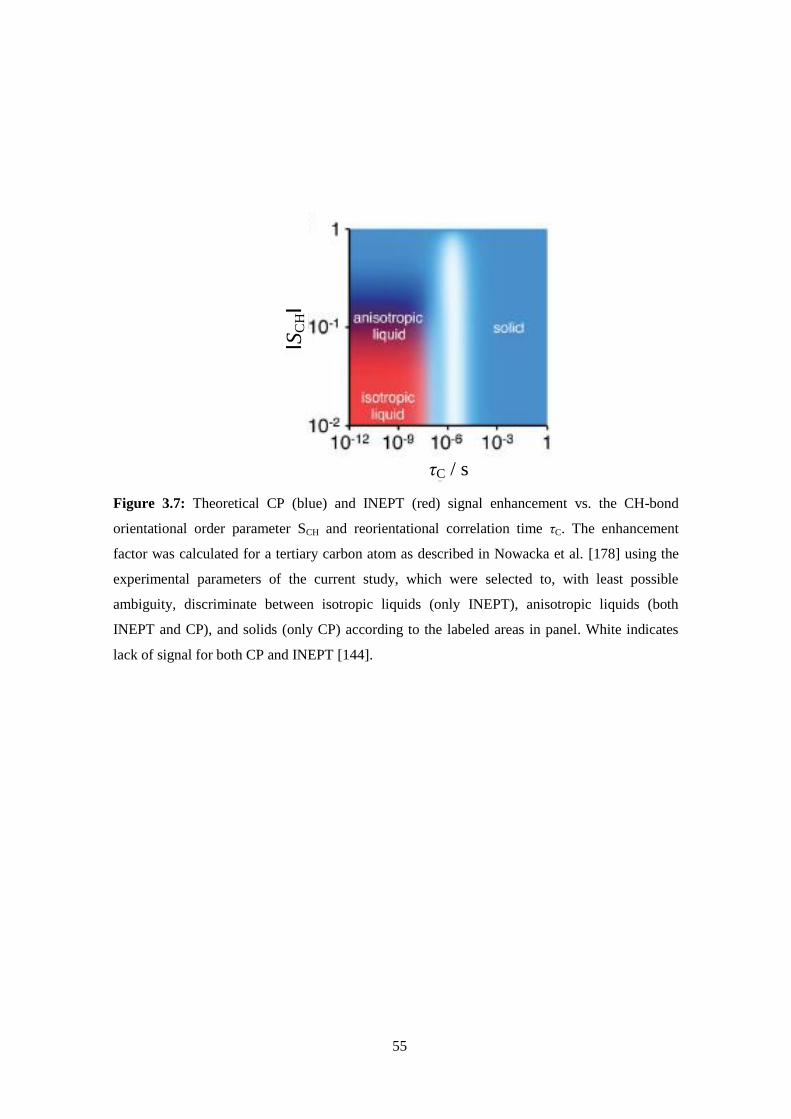
55
Figure 3.7: Theoretical CP (blue) and INEPT (red) signal enhancement vs. the CH-bond
orientational order parameter SCH and reorientational correlation time τC. The enhancement
factor was calculated for a tertiary carbon atom as described in Nowacka et al. [178] using the
experimental parameters of the current study, which were selected to, with least possible
ambiguity, discriminate between isotropic liquids (only INEPT), anisotropic liquids (both
INEPT and CP), and solids (only CP) according to the labeled areas in panel. White indicates
lack of signal for both CP and INEPT [144].
τC / s
ISC
HI
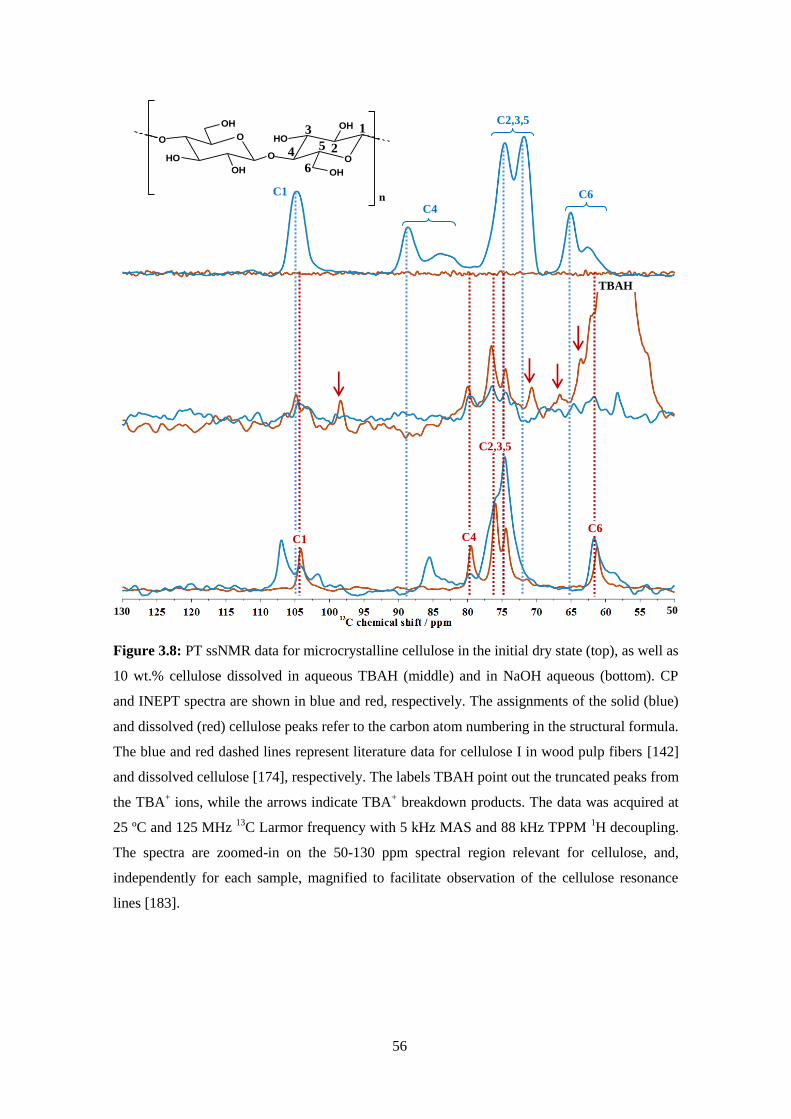
56
Figure 3.8: PT ssNMR data for microcrystalline cellulose in the initial dry state (top), as well as
10 wt.% cellulose dissolved in aqueous TBAH (middle) and in NaOH aqueous (bottom). CP
and INEPT spectra are shown in blue and red, respectively. The assignments of the solid (blue)
and dissolved (red) cellulose peaks refer to the carbon atom numbering in the structural formula.
The blue and red dashed lines represent literature data for cellulose I in wood pulp fibers [142]
and dissolved cellulose [174], respectively. The labels TBAH point out the truncated peaks from
the TBA+ ions, while the arrows indicate TBA
+ breakdown products. The data was acquired at
25 ºC and 125 MHz 13
C Larmor frequency with 5 kHz MAS and 88 kHz TPPM 1H decoupling.
The spectra are zoomed-in on the 50-130 ppm spectral region relevant for cellulose, and,
independently for each sample, magnified to facilitate observation of the cellulose resonance
lines [183].
50 130
O
OH
OH
OHO
O
O
OH
OH
HO
n
1
2
3
45
6
130 50
TBAH
C1
C4
C6
C2,3,5
C1 C4 C6
C2,3,5
57
The obtained spectrum for microcrystalline cellulose (starting material) is in good
agreement with the one reported in literature for cellulose I [184, 185]. The chemical
shift values obtained for dry cellulose (see table 3.2) are very similar to those reported
by Kamide et al. [105.40 (C1), 89.10 (C4), 75.30/72.70 (C2,3,5) and 65.50 (C6)] [142] for
wood pulp. The side peaks at ca. 85.0 ppm and 62.0 ppm can be assigned to the
amorphous residual fraction present in the dry microcrystalline cellulose [186].
Table 3.2: Chemical shifts of partially dissolved cellulosea [183].
Sample Fraction Carbon atom Polymorph
C1 C4 C2,3,5 C6 Dry Solid 105.10 88.80 74.60, 72.10 65.00 Cellulose I
TBAH Solid 105.10 88.70 74.40, 71.50 65.10 Cellulose I
aqueous Dissolved 104.70 79.80 76.40, 74.50 61.70
NaOH
aqueous
Solid 107.10 85.60 75.80, 74.60 61.50 Na-Cell Q
Dissolved 104.30 79.60 76.00, 74.50 61.30
aShifts are given in ppm with α-glycine at 176.03 ppm as external standard. The precision is limited to
±0.2 ppm by the acquisition time.
The sample containing cellulose dissolved in aqueous TBAH gives both CP and INEPT
signals, showing that solid as well as liquid/dissolved material are present in the sample.
The chemical shifts obtained for the solid fraction (CP signal) of the sample in aqueous
TBAH and the initial dry cellulose are very similar, indicating that the residual
undissolved material has an organization characteristic of cellulose I. The INEPT
spectrum comprises a wide number of peaks, mainly from the inequivalent carbons of
the tetrabutylammonium ion. Only one of these peaks is located inside the spectral
window showed in figure 3.8. The remaining peaks can be assigned to dissolved
cellulose, as well to degradation products of TBA+, formed by Hofmann elimination,
namely the tributylamine and 1-butene [187].
The peaks derived from degradation products of TBA+ are indicated by the red arrows.
Comparing the areas of the DP peaks from dissolved cellulose, TBA+, and tributylamine
it is possible to estimate the fraction of TBA+ breakdown (ca. 4.9%), while the molar
ratio between the tributylamine and the glucose units of the dissolved cellulose is
approximately 1:9. The chemical shifts assigned to dissolved cellulose in the TBAH
aqueous solution are very similar to the literature data for ultra-centrifuged samples of
cellulose dissolved in 10 wt.% NaOH in D2O: 104.7 (C1), 79.9 (C4), 76.4/75.0 (C2,3,5),
and 61.9 (C6) ppm [174]. According to the theoretical calculations [144], the presence
of INEPT peaks for cellulose implies that the C-H bonds reorient on a timescale faster
58
than 100 ns, which in turns is a strong indication that the “liquid fraction” of the
cellulose solution is molecularly dissolved.
The NaOH aqueous solution also gives both CP and INEPT signals. While the INEPT
peaks are similar to the ones assigned to dissolved cellulose in the aqueous TBAH
sample, the CP peaks are noticeably different. Their comparison with the chemical
shifts found in literature, [e.g. 106.9/104.2 (C1), 85.5/83.0 (C4) and 61.3 (C6)] suggests
that cellulose is organized in the so called “Na-cellulose Q”, which is a highly swelled
form of cellulose first identified by Sobue et al. [188]. This swelled state of cellulose is
also characterized by a low order, which can be deduced from the chemical shifts of C4,
(85.52 ppm), and C6 (61.65 ppm) [186]. Considering the suggested importance of
hydrophobic interactions in cellulose systems [189], the effects of such unintentional
hydrophobic or amphiphilic co-solutes (TBAH is an example) must be taken into
account in any attempt of rationalizing the observed cellulose solubility.
Even if neither CP nor INEPT yields truly quantitative information, the comparison
between their areas gives, at least, a rough estimative of the ratio solid/dissolved. Thus,
the growth of one peak at the expense of the other is an indication that the ratio is
changing. Additionally, the comparison between the DP, CP, and INEPT intensities
gives qualitative information on the molecular dynamics [178]. Changes in properties
such as molecular conformation and interactions with surrounding molecules and ions
in the solution can be followed through the observation of the chemical shifts. Another
potential of the method is the possibility to detect the presence of minor amounts of
dissolved impurities, in the DP and INEPT spectra. In the case of aqueous TBAH, the
impurities result from the chemical degradation of the major components, and are thus
difficult to avoid.
Synopsis
These preliminary results show that both the solid and the dissolved cellulose
components can be detected with PT ssNMR. This method reveals to be an excellent
tool to study, in one single step, the arrangement of the solid fraction (undissolved
material) as well as the dissolved fraction and the possible interaction of different
additives with cellulose chains. These results are very useful for future studies on the
mechanisms of cellulose dissolution.

59
Based on these promising results, additional studies were performed (using alkali based
and acid based solvent systems). The obtained results for PT ssNMR were
complemented with light and electronic microscopy and presented in sections 3.3 and
3.4.
3.3 - Cellulose dissolution in alkali medium
Since cellulose is not meltable, typically it has to be dissolved first in a suitable
solvent before further processing. However, most of the common solvents usually fail in
this respect. Through the years, several suitable solvents for cellulose dissolution have
been developed and the list provides a wide variety of quite unusual options: from
simple or multi-component mixtures, aqueous and organic media, to inorganic and
organic salts, with peculiar experimental conditions (e.g. high and low temperatures,
high and low pH), etc. [17, 20].
In this section we pay attention to solvent systems with a high hydroxide concentration.
Cellulose dissolution at extreme pHs can be related to the fact that cellulose molecules
acquire net charges either by protonation (low pH) or deprotonation (high pH). This
observation is based on the general finding that polyelectrolytes are more soluble in
water than nonionic polymers, due to the dissociation of counterions and the
concomitant large gain in counterion entropy. Whereas the fact that a high concentration
of hydroxide ions facilitates dissolution is rather trivial, the role and nature of the cation
needs further considerations. Here we are interested in the question whether there are
differences between hydroxides with different cations, particularly between inorganic
and organic cations. Thus, by means of scanning electron microscopy (SEM), polarized
light microscopy (PLM), polarization transfer solid state NMR (PT ssNMR) and
dynamic light scattering (DLS) the effect of distinct solvents, i.e. cold NaOH solutions
and aqueous solution of tetrabutylammonium hydroxide on the degree of dissolution of
cellulose samples was studied. Additionally, the effect of different additives on the cold
NaOH system was evaluated.
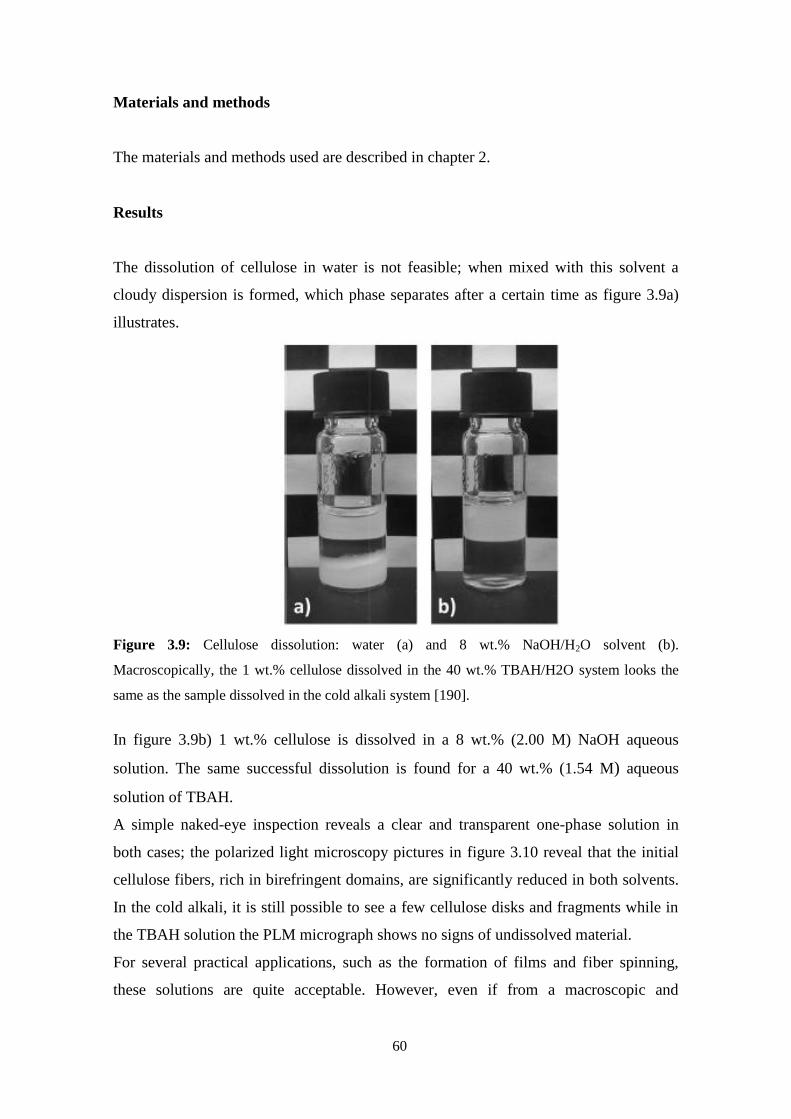
60
Materials and methods
The materials and methods used are described in chapter 2.
Results
The dissolution of cellulose in water is not feasible; when mixed with this solvent a
cloudy dispersion is formed, which phase separates after a certain time as figure 3.9a)
illustrates.
Figure 3.9: Cellulose dissolution: water (a) and 8 wt.% NaOH/H2O solvent (b).
Macroscopically, the 1 wt.% cellulose dissolved in the 40 wt.% TBAH/H2O system looks the
same as the sample dissolved in the cold alkali system [190].
In figure 3.9b) 1 wt.% cellulose is dissolved in a 8 wt.% (2.00 M) NaOH aqueous
solution. The same successful dissolution is found for a 40 wt.% (1.54 M) aqueous
solution of TBAH.
A simple naked-eye inspection reveals a clear and transparent one-phase solution in
both cases; the polarized light microscopy pictures in figure 3.10 reveal that the initial
cellulose fibers, rich in birefringent domains, are significantly reduced in both solvents.
In the cold alkali, it is still possible to see a few cellulose disks and fragments while in
the TBAH solution the PLM micrograph shows no signs of undissolved material.
For several practical applications, such as the formation of films and fiber spinning,
these solutions are quite acceptable. However, even if from a macroscopic and
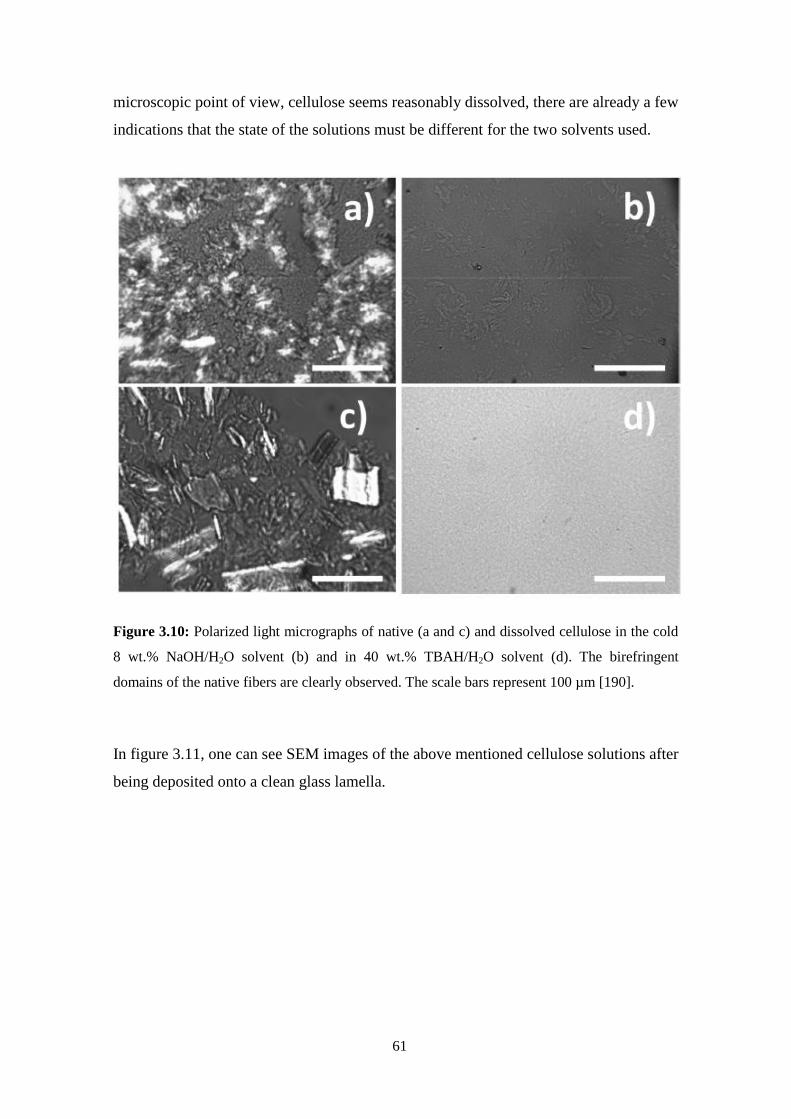
61
microscopic point of view, cellulose seems reasonably dissolved, there are already a few
indications that the state of the solutions must be different for the two solvents used.
Figure 3.10: Polarized light micrographs of native (a and c) and dissolved cellulose in the cold
8 wt.% NaOH/H2O solvent (b) and in 40 wt.% TBAH/H2O solvent (d). The birefringent
domains of the native fibers are clearly observed. The scale bars represent 100 µm [190].
In figure 3.11, one can see SEM images of the above mentioned cellulose solutions after
being deposited onto a clean glass lamella.
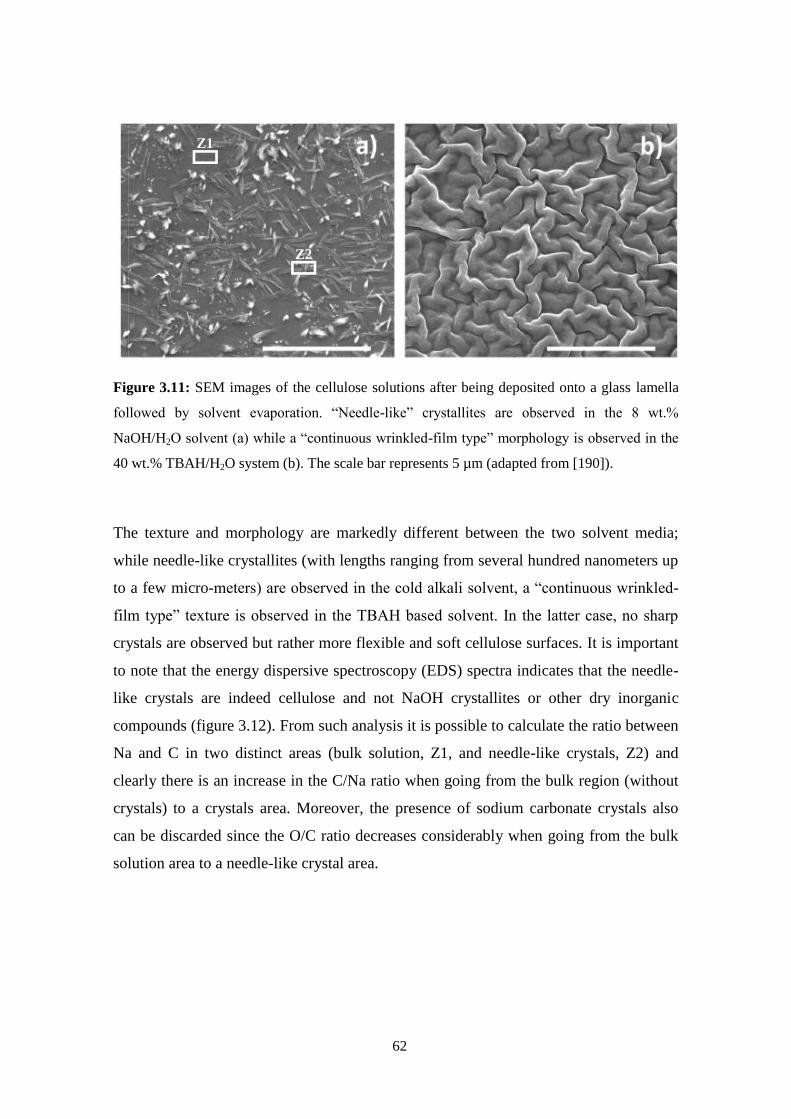
62
Figure 3.11: SEM images of the cellulose solutions after being deposited onto a glass lamella
followed by solvent evaporation. “Needle-like” crystallites are observed in the 8 wt.%
NaOH/H2O solvent (a) while a “continuous wrinkled-film type” morphology is observed in the
40 wt.% TBAH/H2O system (b). The scale bar represents 5 µm (adapted from [190]).
The texture and morphology are markedly different between the two solvent media;
while needle-like crystallites (with lengths ranging from several hundred nanometers up
to a few micro-meters) are observed in the cold alkali solvent, a “continuous wrinkled-
film type” texture is observed in the TBAH based solvent. In the latter case, no sharp
crystals are observed but rather more flexible and soft cellulose surfaces. It is important
to note that the energy dispersive spectroscopy (EDS) spectra indicates that the needle-
like crystals are indeed cellulose and not NaOH crystallites or other dry inorganic
compounds (figure 3.12). From such analysis it is possible to calculate the ratio between
Na and C in two distinct areas (bulk solution, Z1, and needle-like crystals, Z2) and
clearly there is an increase in the C/Na ratio when going from the bulk region (without
crystals) to a crystals area. Moreover, the presence of sodium carbonate crystals also
can be discarded since the O/C ratio decreases considerably when going from the bulk
solution area to a needle-like crystal area.
Z1
Z2
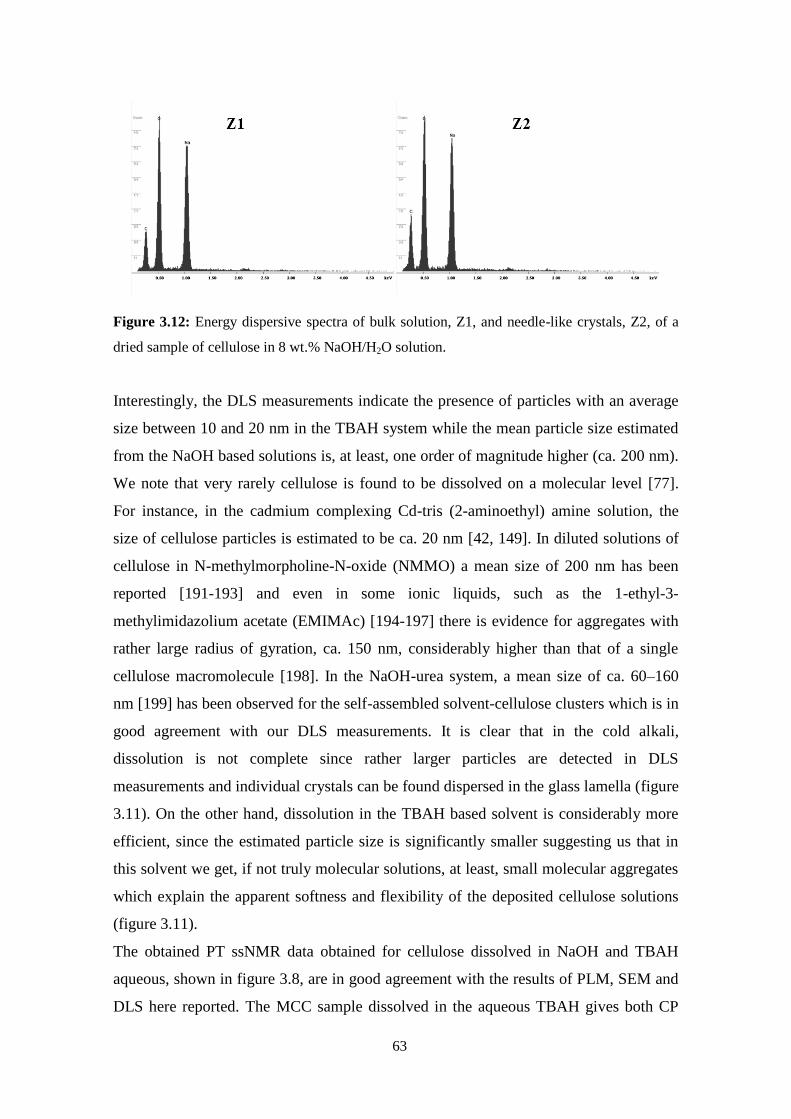
63
Figure 3.12: Energy dispersive spectra of bulk solution, Z1, and needle-like crystals, Z2, of a
dried sample of cellulose in 8 wt.% NaOH/H2O solution.
Interestingly, the DLS measurements indicate the presence of particles with an average
size between 10 and 20 nm in the TBAH system while the mean particle size estimated
from the NaOH based solutions is, at least, one order of magnitude higher (ca. 200 nm).
We note that very rarely cellulose is found to be dissolved on a molecular level [77].
For instance, in the cadmium complexing Cd-tris (2-aminoethyl) amine solution, the
size of cellulose particles is estimated to be ca. 20 nm [42, 149]. In diluted solutions of
cellulose in N-methylmorpholine-N-oxide (NMMO) a mean size of 200 nm has been
reported [191-193] and even in some ionic liquids, such as the 1-ethyl-3-
methylimidazolium acetate (EMIMAc) [194-197] there is evidence for aggregates with
rather large radius of gyration, ca. 150 nm, considerably higher than that of a single
cellulose macromolecule [198]. In the NaOH-urea system, a mean size of ca. 60–160
nm [199] has been observed for the self-assembled solvent-cellulose clusters which is in
good agreement with our DLS measurements. It is clear that in the cold alkali,
dissolution is not complete since rather larger particles are detected in DLS
measurements and individual crystals can be found dispersed in the glass lamella (figure
3.11). On the other hand, dissolution in the TBAH based solvent is considerably more
efficient, since the estimated particle size is significantly smaller suggesting us that in
this solvent we get, if not truly molecular solutions, at least, small molecular aggregates
which explain the apparent softness and flexibility of the deposited cellulose solutions
(figure 3.11).
The obtained PT ssNMR data obtained for cellulose dissolved in NaOH and TBAH
aqueous, shown in figure 3.8, are in good agreement with the results of PLM, SEM and
DLS here reported. The MCC sample dissolved in the aqueous TBAH gives both CP
64
and INEPT signals. However, the weak CP signal indicates a good level of dissolution;
the estimated fraction of undissolved cellulose is below 1 wt.%. Similar results were
obtained for tetrabutylphosphonium hydroxide in aqueous solution. The obtained
chemical shifts for solid and dissolved fraction, as well the polymorph attribution are
discussed in section 3.2.
The MCC sample dissolved in an aqueous NaOH solution gives both CP and INEPT
signals. The discussion about the polymorph of solid fraction and the INEPT spectrum,
based on the chemical shifts obtained, is provided in section 3.2. Additionally, the
NaOH sample presents a well defined CP spectrum (good signal to noise ratio), which is
indicative of a significant amount of undissolved material, in opposition to the CP
spectrum obtained for the TBAH sample, where the signal to noise ratio is poor.
Effect of additives on dissolution in cold alkali systems
The cold alkali based solvent systems are a group of very interesting cellulose solvents
because of the typical associated low cost and low environmental impact issues.
However, the dissolution of cellulose in these systems is quite limited. Several studies
have been carried out in order to improve the dissolution and capacity of cold alkali
systems and also to allow the use of high molecular weight cellulose pulps [200, 201].
Additives such as urea, thiourea, zinc oxide, surfactants and polyethylene glycol (PEG)
demonstrate a good potential to improve the dissolved amount of cellulose in cold alkali
based systems [48, 186, 199-201]. Nevertheless, the majority of these alkali-water based
systems only allow the dissolution of cellulose with a relatively low degree of
polymerization (typically, less than 300). In figure 3.13 PLM micrographs of cellulose
solutions in 8 wt.% NaOH are presented, in the absence of additives and in the presence
of 12 wt.% of urea and thiourea (1.97 M and 1.57 M respectively). The effect of these
additives is remarkable, decreasing the birefringent domains of the native cellulose in
solution when compared with the standard aqueous NaOH system without additives.
Thiourea demonstrates to be a more efficient additive leading to a completely clear
solution, without the presence of undissolved material, in accordance with the work of
Zhang et al. [200].
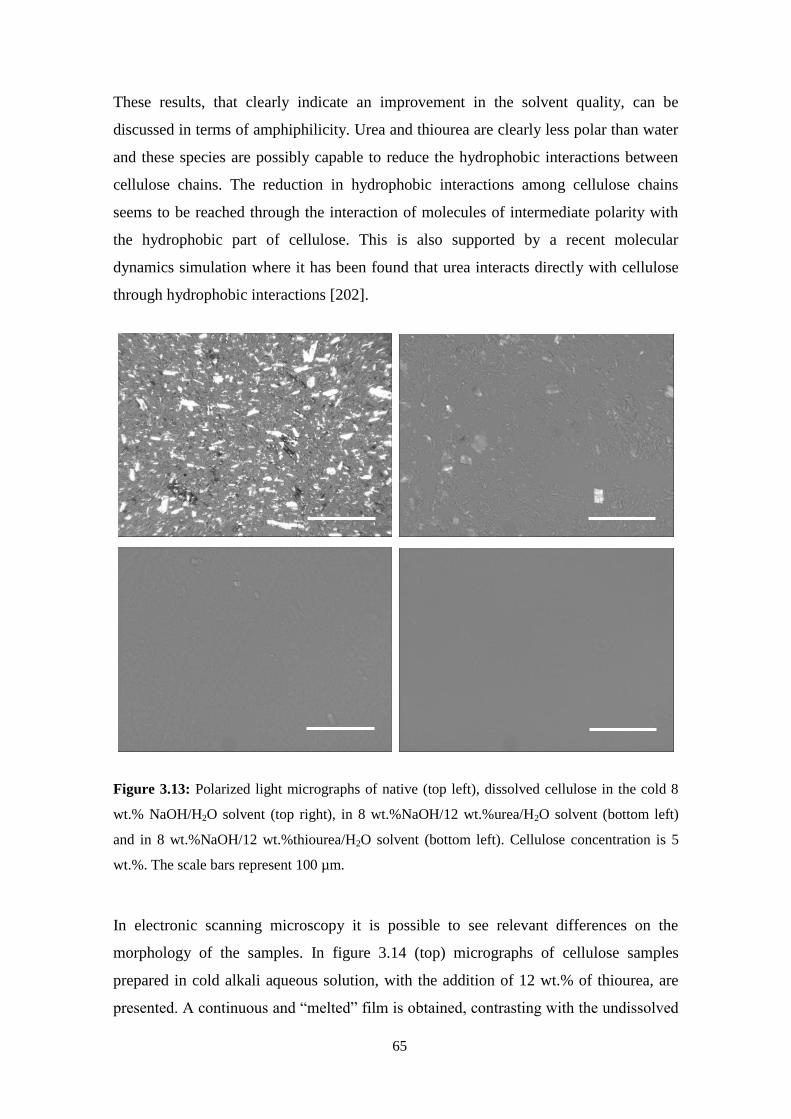
65
These results, that clearly indicate an improvement in the solvent quality, can be
discussed in terms of amphiphilicity. Urea and thiourea are clearly less polar than water
and these species are possibly capable to reduce the hydrophobic interactions between
cellulose chains. The reduction in hydrophobic interactions among cellulose chains
seems to be reached through the interaction of molecules of intermediate polarity with
the hydrophobic part of cellulose. This is also supported by a recent molecular
dynamics simulation where it has been found that urea interacts directly with cellulose
through hydrophobic interactions [202].
Figure 3.13: Polarized light micrographs of native (top left), dissolved cellulose in the cold 8
wt.% NaOH/H2O solvent (top right), in 8 wt.%NaOH/12 wt.%urea/H2O solvent (bottom left)
and in 8 wt.%NaOH/12 wt.%thiourea/H2O solvent (bottom left). Cellulose concentration is 5
wt.%. The scale bars represent 100 µm.
In electronic scanning microscopy it is possible to see relevant differences on the
morphology of the samples. In figure 3.14 (top) micrographs of cellulose samples
prepared in cold alkali aqueous solution, with the addition of 12 wt.% of thiourea, are
presented. A continuous and “melted” film is obtained, contrasting with the undissolved

66
crystals obtained in the case of NaOH aqueous solution (see figure 3.11a). The lack of
crystallites and the film-like morphology reveals an improvement of the dissolution
power of cold alkali system when thiourea is added. Similar results were obtained with
urea (figure 3.14 (bottom)).
Figure 3.14: SEM images of the cellulose solutions in 8 wt.% NaOH/12 wt.% thiourea/H2O
(top) and in 8 wt.% NaOH/12 wt.% urea/H2O (bottom), after being deposited onto a glass
lamella followed by solvent evaporation. The scale bar represents 30 µm and 10 µm
respectively.
In figure 3.15 the CP and the INEPT spectra for MCC dissolved in NaOH/thiourea
aqueous solution are depicted and in table 3.3 the polymorph type of the solid fraction
and main chemical shifts are summarized for several NaOH systems doped with
different additives.

67
Figure 3.15: CP (blue line) and INEPT (red line) spectra for 10 wt.% microcrystalline cellulose
dissolved in aqueous 8 wt.% NaOH/12 wt.% thiourea. The data was acquired at 25 ºC and 125
MHz 13
C Larmor frequency with 5 kHz MAS and 88 kHz TPPM 1H decoupling. The spectra are
zoomed-in on the 50-130 ppm spectral region relevant for cellulose, and, independently for each
sample, magnified to facilitate observation of the cellulose resonance lines [183].
As observed for the NaOH aqueous solvent, clear CP and INEPT signals are also
detected for the cellulose dissolved in the NaOH/thiourea system thus indicating that
dissolution is not complete. However, the ratio between the CP and INEPT peaks is
different. For the NaOH system the CP peaks are slightly more intense than the INEPT
peaks while this relation is inverted for NaOH/thiourea system. This suggests that the
additive improves the dissolution efficiency as manifested by the enhancement in the
INEPT signal. The chemical shifts obtained for the solid fraction of cellulose (CP
signal) in the NaOH/thiourea system, [106.80 (C1), 88.03 (C4), 78.42/77.08 (C2, 3, 5) and
63.85 (C6) ppm], can be assigned to a cellulose II, an anti-parallel arrangement of the
cellulose molecules in the crystal, which is in good agreement with literature [186].
It is worth noting that the INEPT spectrum of cellulose dissolved in the NaOH/thiourea
solvent presents a downfield shifting of ca. 2.0 ppm. This might be a result from a
defective calibration or due to strong thiourea-cellulose interactions, which not only
facilitates dissolution but also influences the carbon chemical shifts of cellulose [80];
presently, additional studies are in progress in order to clarify the origin of the chemical
shift changes. Recent studies tend to support this observation regarding a preferential
additive-cellulose interaction. For instance, Bergenstråhle-Wohlert et al. combining MD
130
13
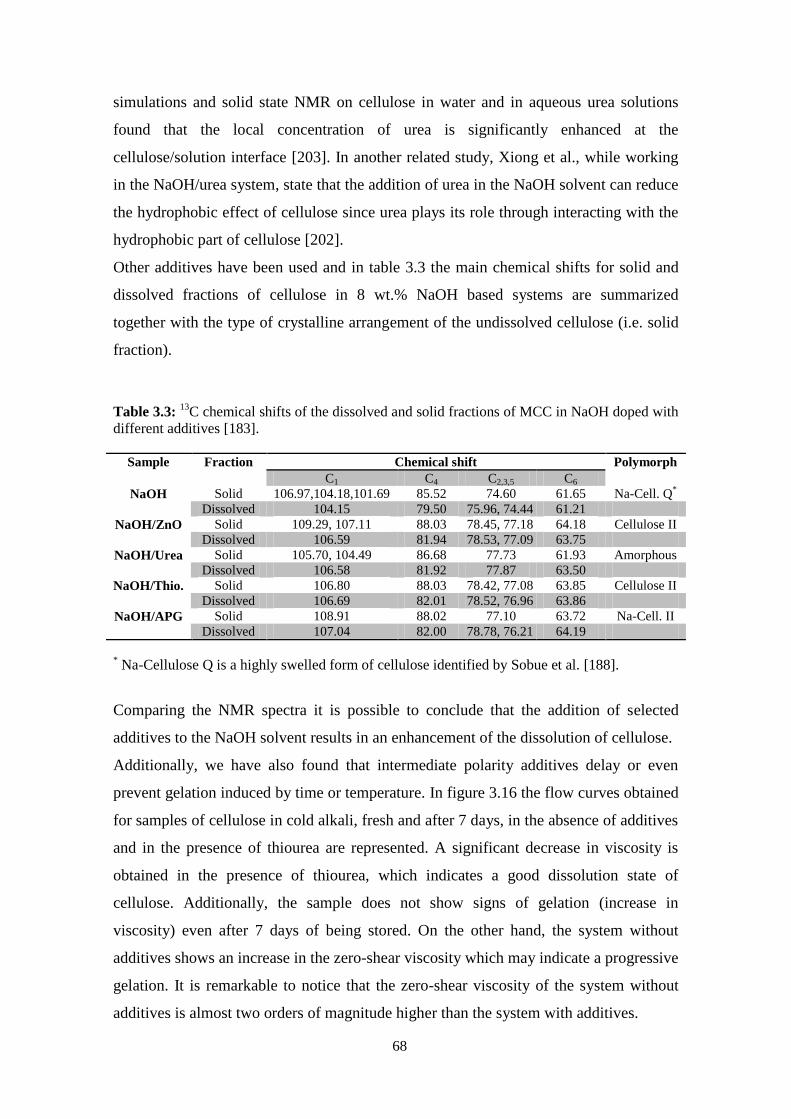
68
simulations and solid state NMR on cellulose in water and in aqueous urea solutions
found that the local concentration of urea is significantly enhanced at the
cellulose/solution interface [203]. In another related study, Xiong et al., while working
in the NaOH/urea system, state that the addition of urea in the NaOH solvent can reduce
the hydrophobic effect of cellulose since urea plays its role through interacting with the
hydrophobic part of cellulose [202].
Other additives have been used and in table 3.3 the main chemical shifts for solid and
dissolved fractions of cellulose in 8 wt.% NaOH based systems are summarized
together with the type of crystalline arrangement of the undissolved cellulose (i.e. solid
fraction).
Table 3.3: 13
C chemical shifts of the dissolved and solid fractions of MCC in NaOH doped with
different additives [183].
Sample Fraction Chemical shift Polymorph
C1 C4 C2,3,5 C6
NaOH Solid 106.97,104.18,101.69 85.52 74.60 61.65 Na-Cell. Q*
Dissolved 104.15 79.50 75.96, 74.44 61.21
NaOH/ZnO Solid 109.29, 107.11 88.03 78.45, 77.18 64.18 Cellulose II
Dissolved 106.59 81.94 78.53, 77.09 63.75
NaOH/Urea Solid 105.70, 104.49 86.68 77.73 61.93 Amorphous
Dissolved 106.58 81.92 77.87 63.50
NaOH/Thio. Solid 106.80 88.03 78.42, 77.08 63.85 Cellulose II
Dissolved 106.69 82.01 78.52, 76.96 63.86
NaOH/APG Solid 108.91 88.02 77.10 63.72 Na-Cell. II
Dissolved 107.04 82.00 78.78, 76.21 64.19
* Na-Cellulose Q is a highly swelled form of cellulose identified by Sobue et al. [188].
Comparing the NMR spectra it is possible to conclude that the addition of selected
additives to the NaOH solvent results in an enhancement of the dissolution of cellulose.
Additionally, we have also found that intermediate polarity additives delay or even
prevent gelation induced by time or temperature. In figure 3.16 the flow curves obtained
for samples of cellulose in cold alkali, fresh and after 7 days, in the absence of additives
and in the presence of thiourea are represented. A significant decrease in viscosity is
obtained in the presence of thiourea, which indicates a good dissolution state of
cellulose. Additionally, the sample does not show signs of gelation (increase in
viscosity) even after 7 days of being stored. On the other hand, the system without
additives shows an increase in the zero-shear viscosity which may indicate a progressive
gelation. It is remarkable to notice that the zero-shear viscosity of the system without
additives is almost two orders of magnitude higher than the system with additives.
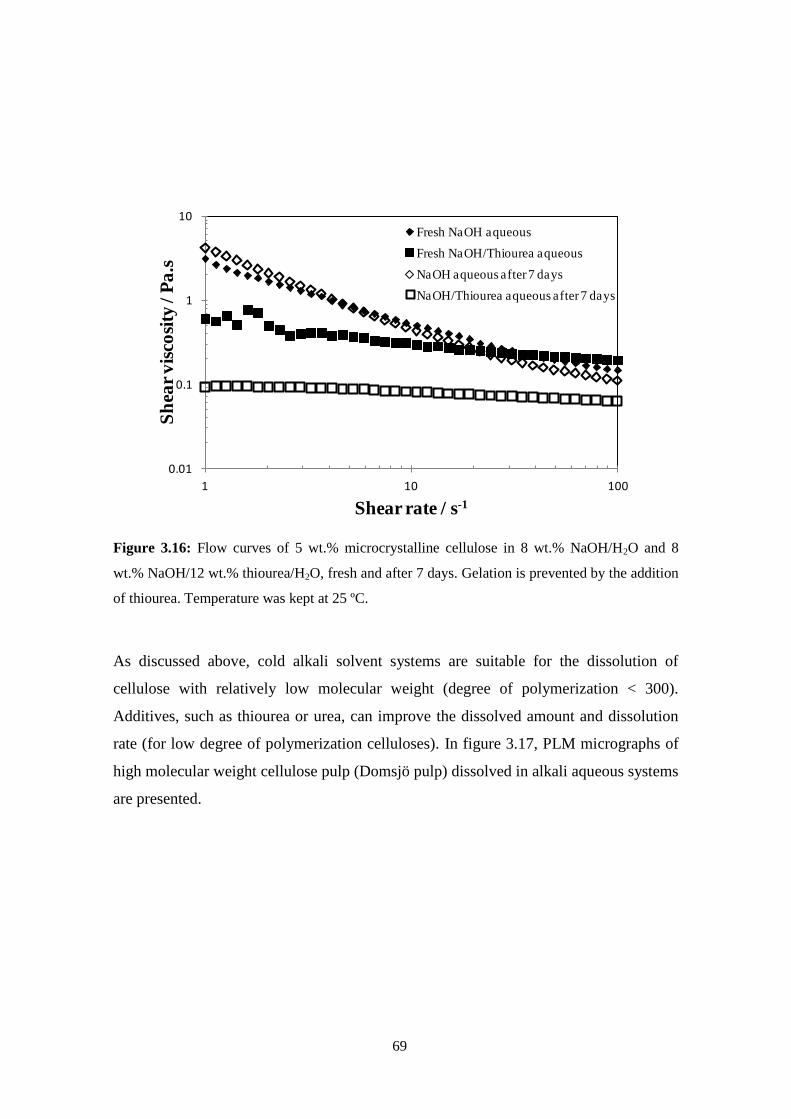
69
Figure 3.16: Flow curves of 5 wt.% microcrystalline cellulose in 8 wt.% NaOH/H2O and 8
wt.% NaOH/12 wt.% thiourea/H2O, fresh and after 7 days. Gelation is prevented by the addition
of thiourea. Temperature was kept at 25 ºC.
As discussed above, cold alkali solvent systems are suitable for the dissolution of
cellulose with relatively low molecular weight (degree of polymerization < 300).
Additives, such as thiourea or urea, can improve the dissolved amount and dissolution
rate (for low degree of polymerization celluloses). In figure 3.17, PLM micrographs of
high molecular weight cellulose pulp (Domsjö pulp) dissolved in alkali aqueous systems
are presented.
0.01
0.1
1
10
1 10 100
Sh
ear
vis
cosi
ty /
Pa
.s
Shear rate / s-1
Fresh NaOH aqueous
Fresh NaOH/Thiourea aqueous
NaOH aqueous after 7 days
NaOH/Thiourea aqueous after 7 days
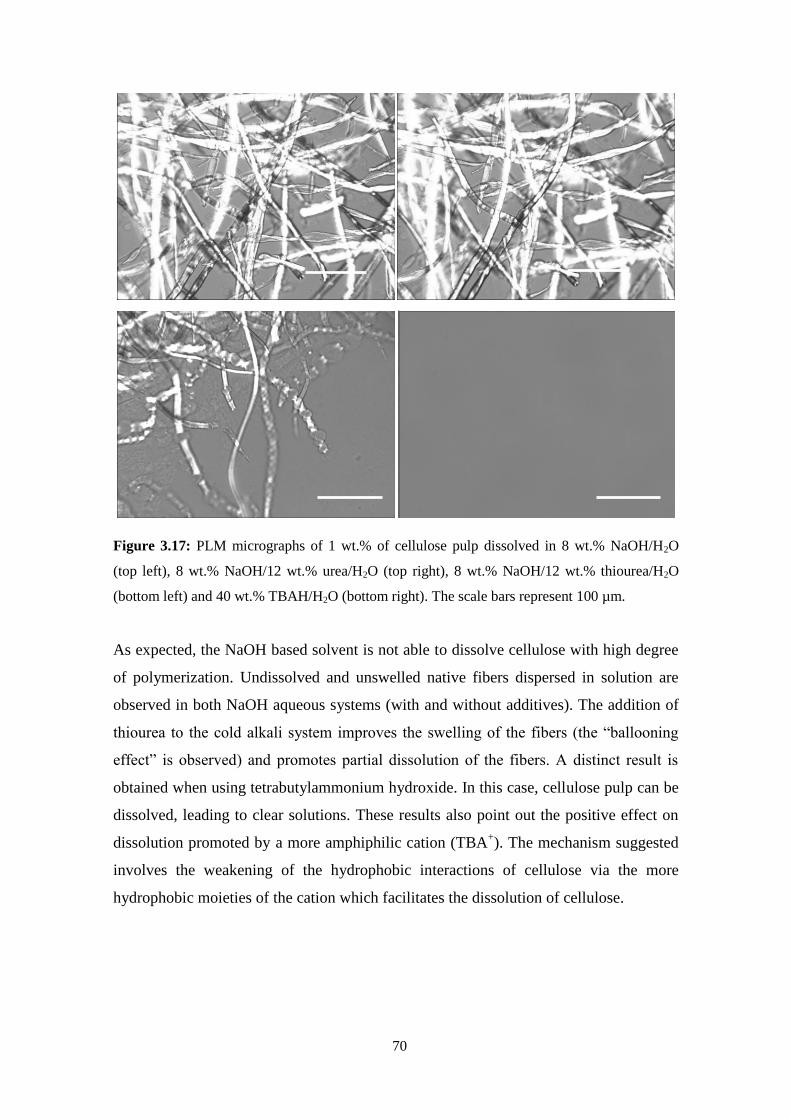
70
Figure 3.17: PLM micrographs of 1 wt.% of cellulose pulp dissolved in 8 wt.% NaOH/H2O
(top left), 8 wt.% NaOH/12 wt.% urea/H2O (top right), 8 wt.% NaOH/12 wt.% thiourea/H2O
(bottom left) and 40 wt.% TBAH/H2O (bottom right). The scale bars represent 100 µm.
As expected, the NaOH based solvent is not able to dissolve cellulose with high degree
of polymerization. Undissolved and unswelled native fibers dispersed in solution are
observed in both NaOH aqueous systems (with and without additives). The addition of
thiourea to the cold alkali system improves the swelling of the fibers (the “ballooning
effect” is observed) and promotes partial dissolution of the fibers. A distinct result is
obtained when using tetrabutylammonium hydroxide. In this case, cellulose pulp can be
dissolved, leading to clear solutions. These results also point out the positive effect on
dissolution promoted by a more amphiphilic cation (TBA+). The mechanism suggested
involves the weakening of the hydrophobic interactions of cellulose via the more
hydrophobic moieties of the cation which facilitates the dissolution of cellulose.
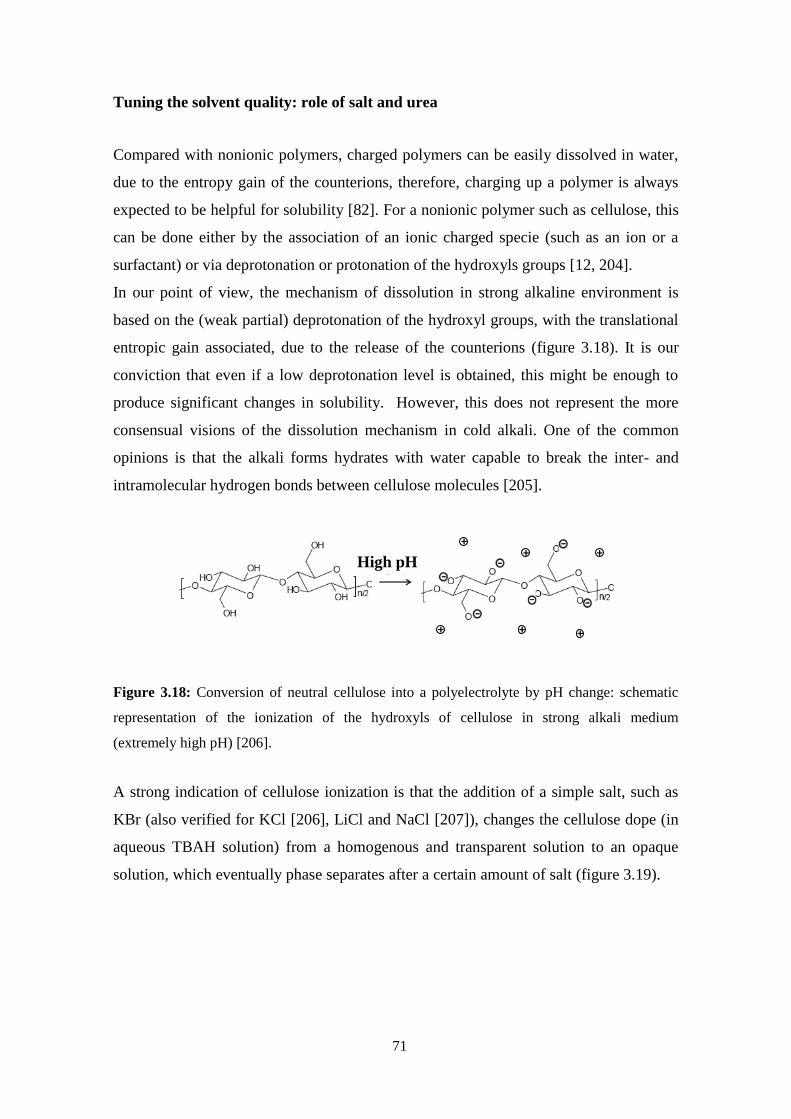
71
Tuning the solvent quality: role of salt and urea
Compared with nonionic polymers, charged polymers can be easily dissolved in water,
due to the entropy gain of the counterions, therefore, charging up a polymer is always
expected to be helpful for solubility [82]. For a nonionic polymer such as cellulose, this
can be done either by the association of an ionic charged specie (such as an ion or a
surfactant) or via deprotonation or protonation of the hydroxyls groups [12, 204].
In our point of view, the mechanism of dissolution in strong alkaline environment is
based on the (weak partial) deprotonation of the hydroxyl groups, with the translational
entropic gain associated, due to the release of the counterions (figure 3.18). It is our
conviction that even if a low deprotonation level is obtained, this might be enough to
produce significant changes in solubility. However, this does not represent the more
consensual visions of the dissolution mechanism in cold alkali. One of the common
opinions is that the alkali forms hydrates with water capable to break the inter- and
intramolecular hydrogen bonds between cellulose molecules [205].
Figure 3.18: Conversion of neutral cellulose into a polyelectrolyte by pH change: schematic
representation of the ionization of the hydroxyls of cellulose in strong alkali medium
(extremely high pH) [206].
A strong indication of cellulose ionization is that the addition of a simple salt, such as
KBr (also verified for KCl [206], LiCl and NaCl [207]), changes the cellulose dope (in
aqueous TBAH solution) from a homogenous and transparent solution to an opaque
solution, which eventually phase separates after a certain amount of salt (figure 3.19).
High pH+
+
+++
+High pH
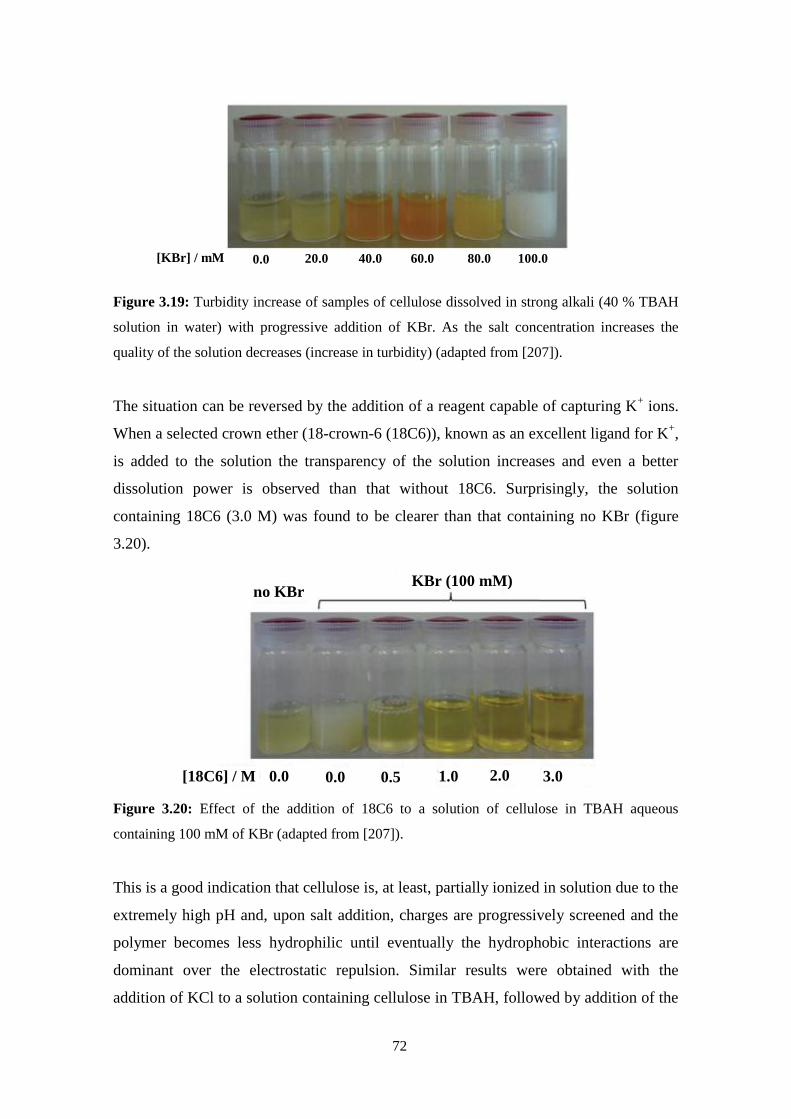
72
Figure 3.19: Turbidity increase of samples of cellulose dissolved in strong alkali (40 % TBAH
solution in water) with progressive addition of KBr. As the salt concentration increases the
quality of the solution decreases (increase in turbidity) (adapted from [207]).
The situation can be reversed by the addition of a reagent capable of capturing K+ ions.
When a selected crown ether (18-crown-6 (18C6)), known as an excellent ligand for K+,
is added to the solution the transparency of the solution increases and even a better
dissolution power is observed than that without 18C6. Surprisingly, the solution
containing 18C6 (3.0 M) was found to be clearer than that containing no KBr (figure
3.20).
Figure 3.20: Effect of the addition of 18C6 to a solution of cellulose in TBAH aqueous
containing 100 mM of KBr (adapted from [207]).
This is a good indication that cellulose is, at least, partially ionized in solution due to the
extremely high pH and, upon salt addition, charges are progressively screened and the
polymer becomes less hydrophilic until eventually the hydrophobic interactions are
dominant over the electrostatic repulsion. Similar results were obtained with the
addition of KCl to a solution containing cellulose in TBAH, followed by addition of the
y phase separates after a certain amount of salt
[KBr] / mM 0.0 20.0 40.0 60.0 80.0 100.0
no KBr KBr (100 mM)
[18C6] / M 0.0 0.0 0.5 1.0 2.0 3.0
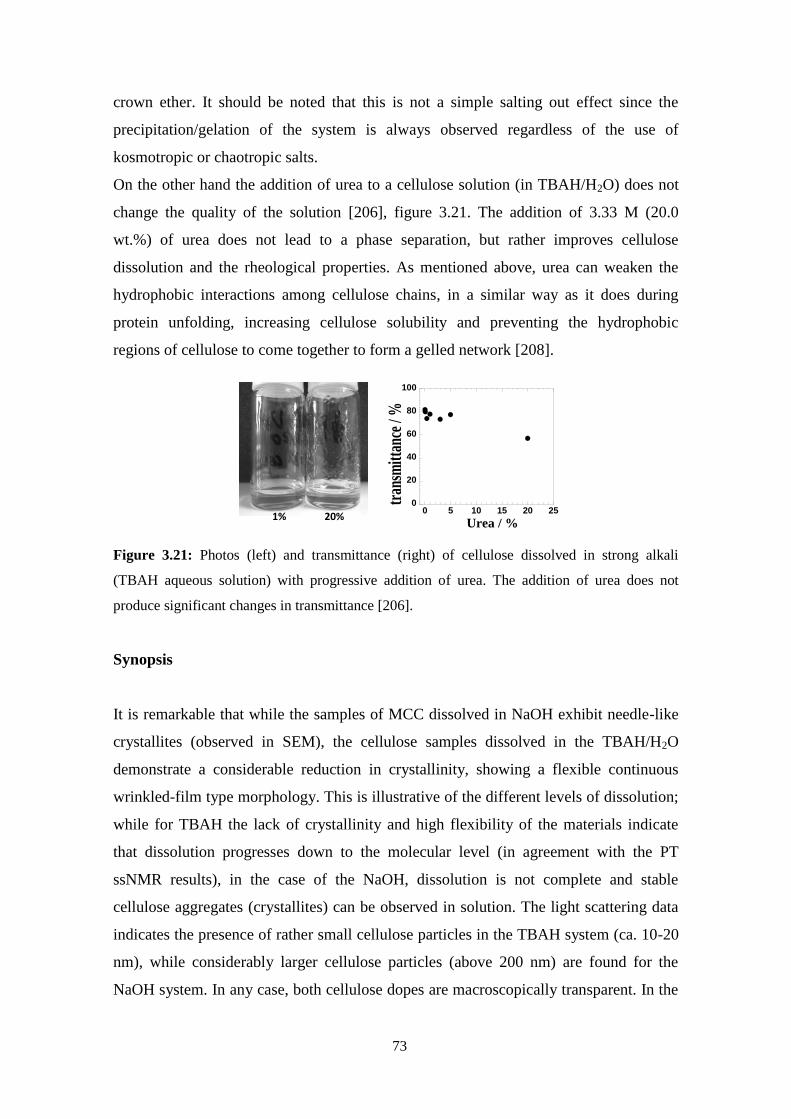
73
crown ether. It should be noted that this is not a simple salting out effect since the
precipitation/gelation of the system is always observed regardless of the use of
kosmotropic or chaotropic salts.
On the other hand the addition of urea to a cellulose solution (in TBAH/H2O) does not
change the quality of the solution [206], figure 3.21. The addition of 3.33 M (20.0
wt.%) of urea does not lead to a phase separation, but rather improves cellulose
dissolution and the rheological properties. As mentioned above, urea can weaken the
hydrophobic interactions among cellulose chains, in a similar way as it does during
protein unfolding, increasing cellulose solubility and preventing the hydrophobic
regions of cellulose to come together to form a gelled network [208].
Figure 3.21: Photos (left) and transmittance (right) of cellulose dissolved in strong alkali
(TBAH aqueous solution) with progressive addition of urea. The addition of urea does not
produce significant changes in transmittance [206].
Synopsis
It is remarkable that while the samples of MCC dissolved in NaOH exhibit needle-like
crystallites (observed in SEM), the cellulose samples dissolved in the TBAH/H2O
demonstrate a considerable reduction in crystallinity, showing a flexible continuous
wrinkled-film type morphology. This is illustrative of the different levels of dissolution;
while for TBAH the lack of crystallinity and high flexibility of the materials indicate
that dissolution progresses down to the molecular level (in agreement with the PT
ssNMR results), in the case of the NaOH, dissolution is not complete and stable
cellulose aggregates (crystallites) can be observed in solution. The light scattering data
indicates the presence of rather small cellulose particles in the TBAH system (ca. 10-20
nm), while considerably larger cellulose particles (above 200 nm) are found for the
NaOH system. In any case, both cellulose dopes are macroscopically transparent. In the
0
20
40
60
80
100
0 2 4 6 8 10 12 14
tran
sm
itta
nce /
%
-CD / %
0
20
40
60
80
100
0 5 10 15 20 25
tran
sm
itta
nce /
%
Urea / %1% 20%
1% 8%
Urea / %
β-CD / %
tran
smitt
ance
/ %
tr
ansm
ittan
ce /
%
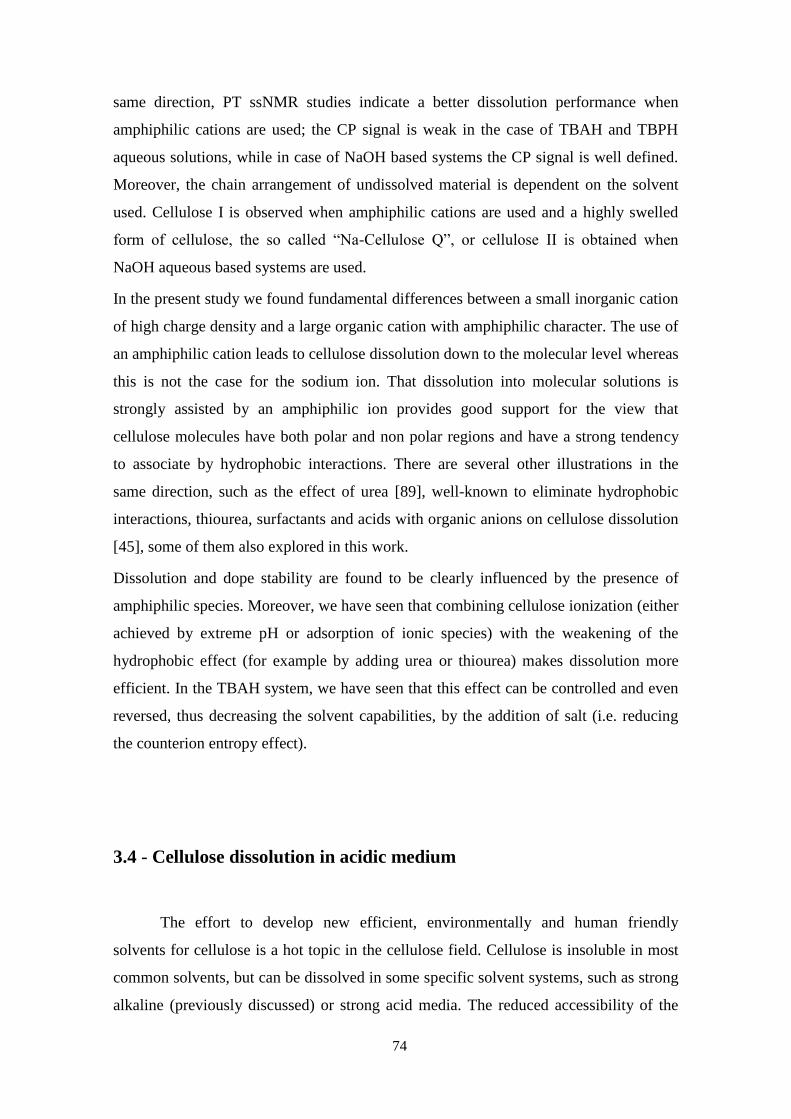
74
same direction, PT ssNMR studies indicate a better dissolution performance when
amphiphilic cations are used; the CP signal is weak in the case of TBAH and TBPH
aqueous solutions, while in case of NaOH based systems the CP signal is well defined.
Moreover, the chain arrangement of undissolved material is dependent on the solvent
used. Cellulose I is observed when amphiphilic cations are used and a highly swelled
form of cellulose, the so called “Na-Cellulose Q”, or cellulose II is obtained when
NaOH aqueous based systems are used.
In the present study we found fundamental differences between a small inorganic cation
of high charge density and a large organic cation with amphiphilic character. The use of
an amphiphilic cation leads to cellulose dissolution down to the molecular level whereas
this is not the case for the sodium ion. That dissolution into molecular solutions is
strongly assisted by an amphiphilic ion provides good support for the view that
cellulose molecules have both polar and non polar regions and have a strong tendency
to associate by hydrophobic interactions. There are several other illustrations in the
same direction, such as the effect of urea [89], well-known to eliminate hydrophobic
interactions, thiourea, surfactants and acids with organic anions on cellulose dissolution
[45], some of them also explored in this work.
Dissolution and dope stability are found to be clearly influenced by the presence of
amphiphilic species. Moreover, we have seen that combining cellulose ionization (either
achieved by extreme pH or adsorption of ionic species) with the weakening of the
hydrophobic effect (for example by adding urea or thiourea) makes dissolution more
efficient. In the TBAH system, we have seen that this effect can be controlled and even
reversed, thus decreasing the solvent capabilities, by the addition of salt (i.e. reducing
the counterion entropy effect).
3.4 - Cellulose dissolution in acidic medium
The effort to develop new efficient, environmentally and human friendly
solvents for cellulose is a hot topic in the cellulose field. Cellulose is insoluble in most
common solvents, but can be dissolved in some specific solvent systems, such as strong
alkaline (previously discussed) or strong acid media. The reduced accessibility of the
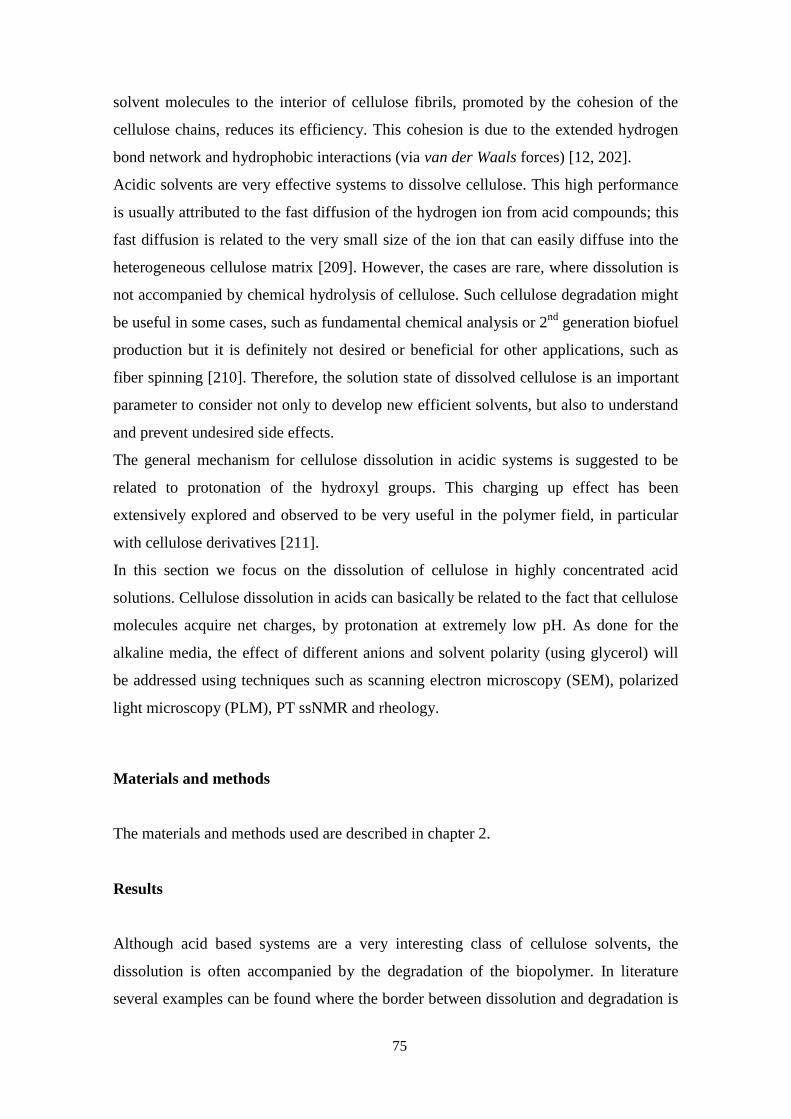
75
solvent molecules to the interior of cellulose fibrils, promoted by the cohesion of the
cellulose chains, reduces its efficiency. This cohesion is due to the extended hydrogen
bond network and hydrophobic interactions (via van der Waals forces) [12, 202].
Acidic solvents are very effective systems to dissolve cellulose. This high performance
is usually attributed to the fast diffusion of the hydrogen ion from acid compounds; this
fast diffusion is related to the very small size of the ion that can easily diffuse into the
heterogeneous cellulose matrix [209]. However, the cases are rare, where dissolution is
not accompanied by chemical hydrolysis of cellulose. Such cellulose degradation might
be useful in some cases, such as fundamental chemical analysis or 2nd
generation biofuel
production but it is definitely not desired or beneficial for other applications, such as
fiber spinning [210]. Therefore, the solution state of dissolved cellulose is an important
parameter to consider not only to develop new efficient solvents, but also to understand
and prevent undesired side effects.
The general mechanism for cellulose dissolution in acidic systems is suggested to be
related to protonation of the hydroxyl groups. This charging up effect has been
extensively explored and observed to be very useful in the polymer field, in particular
with cellulose derivatives [211].
In this section we focus on the dissolution of cellulose in highly concentrated acid
solutions. Cellulose dissolution in acids can basically be related to the fact that cellulose
molecules acquire net charges, by protonation at extremely low pH. As done for the
alkaline media, the effect of different anions and solvent polarity (using glycerol) will
be addressed using techniques such as scanning electron microscopy (SEM), polarized
light microscopy (PLM), PT ssNMR and rheology.
Materials and methods
The materials and methods used are described in chapter 2.
Results
Although acid based systems are a very interesting class of cellulose solvents, the
dissolution is often accompanied by the degradation of the biopolymer. In literature
several examples can be found where the border between dissolution and degradation is
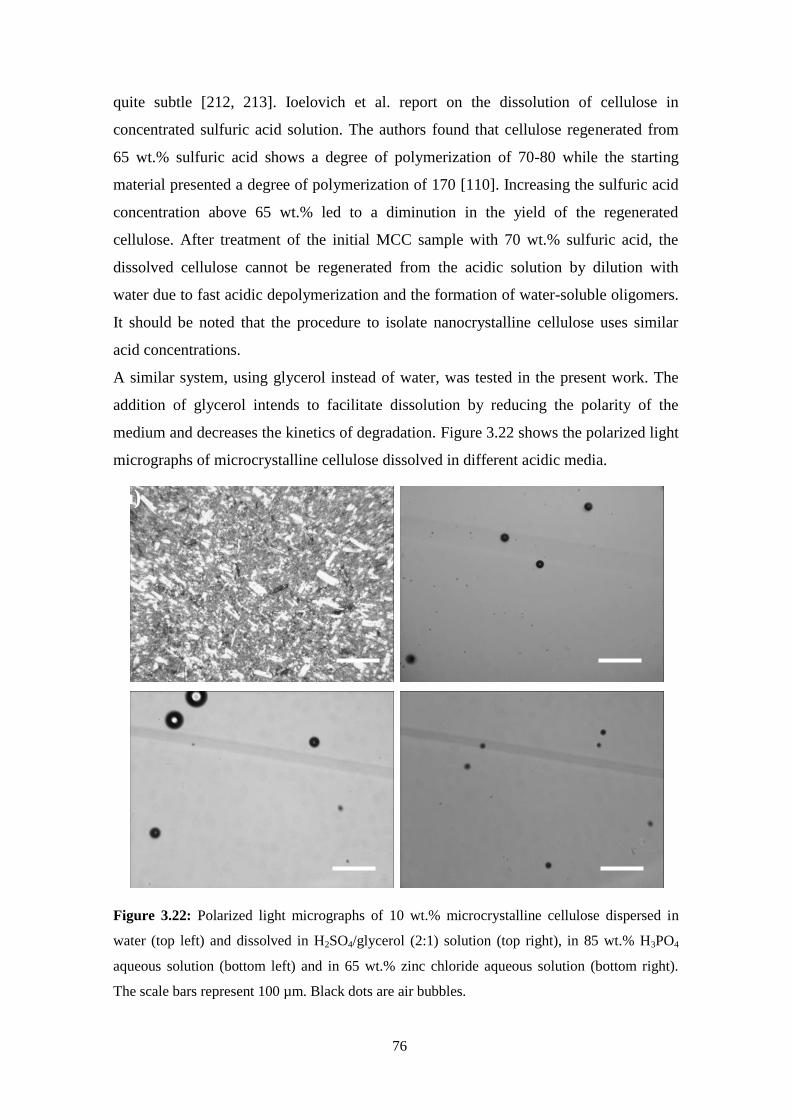
76
quite subtle [212, 213]. Ioelovich et al. report on the dissolution of cellulose in
concentrated sulfuric acid solution. The authors found that cellulose regenerated from
65 wt.% sulfuric acid shows a degree of polymerization of 70-80 while the starting
material presented a degree of polymerization of 170 [110]. Increasing the sulfuric acid
concentration above 65 wt.% led to a diminution in the yield of the regenerated
cellulose. After treatment of the initial MCC sample with 70 wt.% sulfuric acid, the
dissolved cellulose cannot be regenerated from the acidic solution by dilution with
water due to fast acidic depolymerization and the formation of water-soluble oligomers.
It should be noted that the procedure to isolate nanocrystalline cellulose uses similar
acid concentrations.
A similar system, using glycerol instead of water, was tested in the present work. The
addition of glycerol intends to facilitate dissolution by reducing the polarity of the
medium and decreases the kinetics of degradation. Figure 3.22 shows the polarized light
micrographs of microcrystalline cellulose dissolved in different acidic media.
Figure 3.22: Polarized light micrographs of 10 wt.% microcrystalline cellulose dispersed in
water (top left) and dissolved in H2SO4/glycerol (2:1) solution (top right), in 85 wt.% H3PO4
aqueous solution (bottom left) and in 65 wt.% zinc chloride aqueous solution (bottom right).
The scale bars represent 100 µm. Black dots are air bubbles.
a)
77
The samples appear to be quite well dissolved when observed in PLM. The absence of
visible undissolved material is achieved in all cases, which means that if cellulose
aggregates are still present, they have a very small size (sub micron). The presence of
trapped air bubbles is due to the high viscosity of the samples. In fact, the high viscosity
of cellulose dopes in acidic systems is one of the main concerns for a process
implementation on industrial scale.
The observation in electron microscopy of a sample containing cellulose in aqueous
zinc chloride solution, figure 3.23 shows a “melted” morphology, which indicates that
the super-molecular structure of the cellulose is “destroyed” and no signals of
crystallites are observed in the dissolved sample.
Figure 3.23: Scanning electronic micrographs of microcrystalline cellulose; dispersed in water
(left) and dissolved in 65 wt.% zinc chloride aqueous (right).
In order to have a better understanding of the dissolved state of cellulose in the acidic
solvents, NMR techniques were again applied. As discussed in section 3.2, PT ssNMR
is able to give us information not only about the cellulose in solid state, but also about
the dissolved cellulose, in a single experiment.
In figure 3.24 the PT ssNMR spectra of microcrystalline cellulose dissolved in aqueous
phosphoric acid, recorded at 25 ºC and 60 ºC, as well the spectra of the starting material,
are depicted.
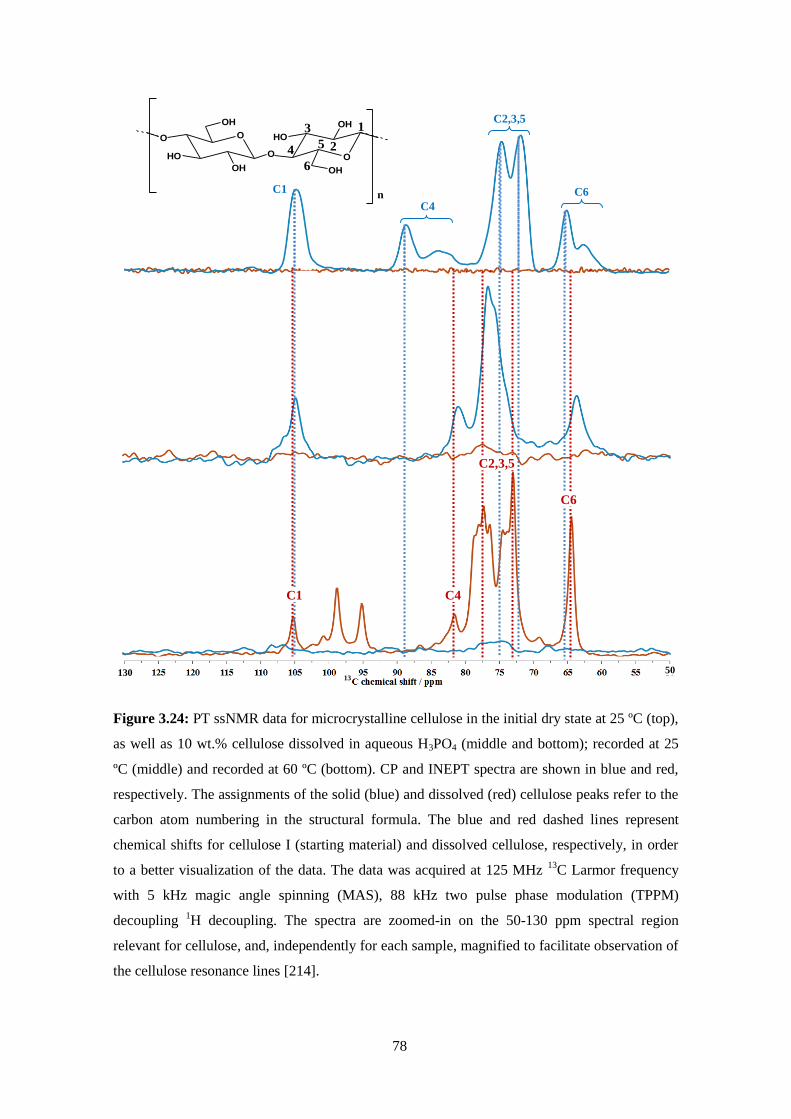
78
Figure 3.24: PT ssNMR data for microcrystalline cellulose in the initial dry state at 25 ºC (top),
as well as 10 wt.% cellulose dissolved in aqueous H3PO4 (middle and bottom); recorded at 25
ºC (middle) and recorded at 60 ºC (bottom). CP and INEPT spectra are shown in blue and red,
respectively. The assignments of the solid (blue) and dissolved (red) cellulose peaks refer to the
carbon atom numbering in the structural formula. The blue and red dashed lines represent
chemical shifts for cellulose I (starting material) and dissolved cellulose, respectively, in order
to a better visualization of the data. The data was acquired at 125 MHz 13
C Larmor frequency
with 5 kHz magic angle spinning (MAS), 88 kHz two pulse phase modulation (TPPM)
decoupling 1H decoupling. The spectra are zoomed-in on the 50-130 ppm spectral region
relevant for cellulose, and, independently for each sample, magnified to facilitate observation of
the cellulose resonance lines [214].
50 130
O
OH
OH
OHO
O
O
OH
OH
HO
n
1
2
3
45
6
130 50
TBAH
C1
C4
C6
C2,3,5
C1 C4 C6
C2,3,5
130
13 50
C1 C4
C6
C2,3,5
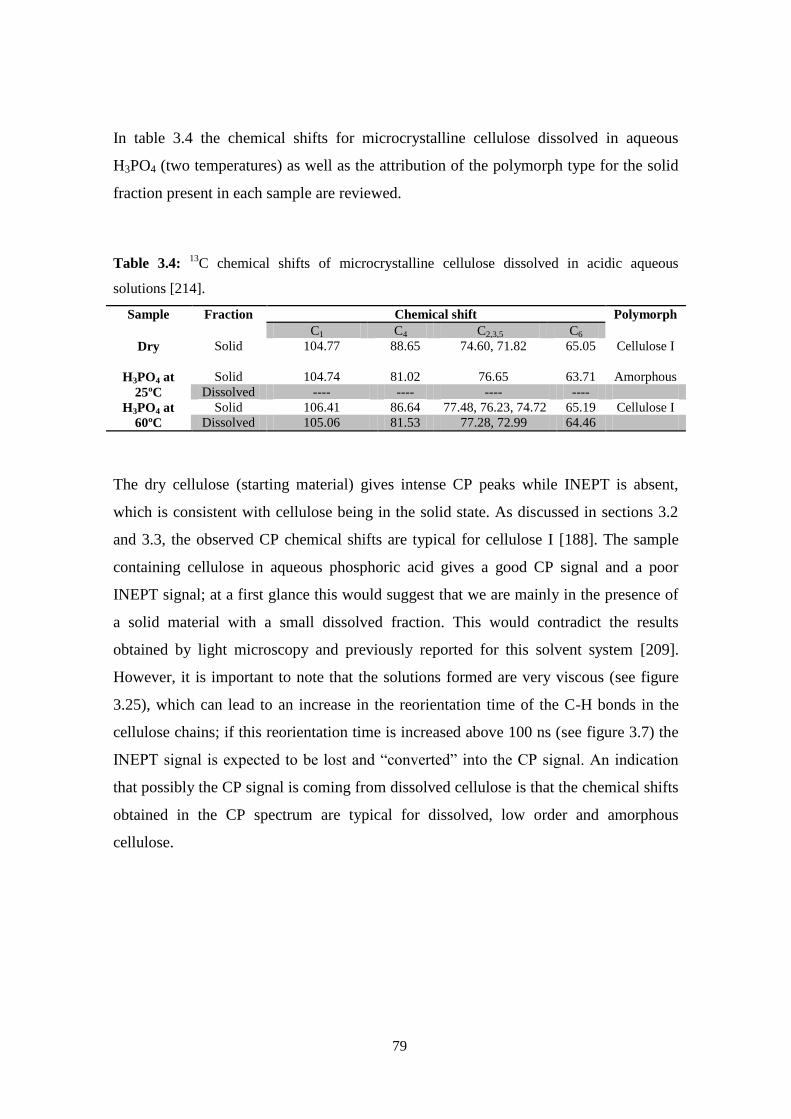
79
In table 3.4 the chemical shifts for microcrystalline cellulose dissolved in aqueous
H3PO4 (two temperatures) as well as the attribution of the polymorph type for the solid
fraction present in each sample are reviewed.
Table 3.4: 13
C chemical shifts of microcrystalline cellulose dissolved in acidic aqueous
solutions [214].
Sample Fraction Chemical shift Polymorph
C1 C4 C2,3,5 C6
Dry Solid 104.77 88.65 74.60, 71.82 65.05 Cellulose I
H3PO4 at
25ºC
Solid 104.74 81.02 76.65 63.71 Amorphous
Dissolved ---- ---- ---- ----
H3PO4 at
60ºC
Solid 106.41 86.64 77.48, 76.23, 74.72 65.19 Cellulose I
Dissolved 105.06 81.53 77.28, 72.99 64.46
The dry cellulose (starting material) gives intense CP peaks while INEPT is absent,
which is consistent with cellulose being in the solid state. As discussed in sections 3.2
and 3.3, the observed CP chemical shifts are typical for cellulose I [188]. The sample
containing cellulose in aqueous phosphoric acid gives a good CP signal and a poor
INEPT signal; at a first glance this would suggest that we are mainly in the presence of
a solid material with a small dissolved fraction. This would contradict the results
obtained by light microscopy and previously reported for this solvent system [209].
However, it is important to note that the solutions formed are very viscous (see figure
3.25), which can lead to an increase in the reorientation time of the C-H bonds in the
cellulose chains; if this reorientation time is increased above 100 ns (see figure 3.7) the
INEPT signal is expected to be lost and “converted” into the CP signal. An indication
that possibly the CP signal is coming from dissolved cellulose is that the chemical shifts
obtained in the CP spectrum are typical for dissolved, low order and amorphous
cellulose.

80
Figure 3.25: Flow curves of 10 wt.% microcrystalline cellulose in aqueous H3PO4 (♦) and in
aqueous ZnCl2 (▲), at 25 ºC (filled symbols) and at 60 ºC (empty symbols).
The acquisition of the spectra was also performed at 60 ºC (figure 3.24, bottom). As one
can observe, the CP signal dramatically decreases and the INEPT signal increases; this
inversion in the signals intensities is most likely due to the considerable decrease in
viscosity induced by the temperature raise. The chemical shifts obtained in the INEPT
spectra [105.06 (C1), 81.53 (C4), 77.28/72.99 (C2,3,5), and 64.46 (C6) ppm] are in good
agreement with the ones reported for dissolved cellulose [174]. Two new peaks
appearing at 98.68 ppm and 95.05 ppm can possibly be attributed to degradation
products of cellulose in the acidic medium [215], most likely small oligomers from
polymer degradation.
The weak CP signal at 60 ºC reveals a good dissolution efficiency of the aqueous H3PO4
solvent (less than 1% of undissolved starting material is estimated to remain in the
sample). Furthermore, the chemical shifts for the solid fraction of cellulose in solution
indicate that we are in the presence of the cellulose I polymorph.
Another interesting system that shows good ability for cellulose dissolution is the
aqueous ZnCl2. This strongly concentrated salt system displays Lewis acid character. In
figure 3.26 (top) the CP and the INEPT spectra for microcrystalline cellulose dissolved
in an aqueous 65 % ZnCl2 solution are represented.
10
100
1000
10000
100000
1000000
10 100
Sh
ear
vis
cosi
ty /
Pa
.s
Shear stress / Pa

81
Figure 3.26: (top): CP (blue line) and INEPT (red line) spectra for 10 wt.% microcrystalline
cellulose dissolved in aqueous ZnCl2 (65%). (bottom): CP spectra of cellulose in H3PO4
aqueous (black line) and in ZnCl2 aqueous (grey line). The data was acquired at 25 ºC and 125
MHz 13
C Larmor frequency with 5 kHz MAS and 88 kHz TPPM 1H decoupling. The spectra are
zoomed-in on the 50-130 ppm spectral region relevant for cellulose, and, independently for each
sample, magnified to facilitate observation of the cellulose resonance lines [214].
As observed for the H3PO4 aqueous system, the cellulose dope in ZnCl2 gives also a
good CP signal and a poor INEPT signal. Due to the high viscosity of the dopes formed
in ZnCl2 we believe that the C-H reorientation time is higher than predicted this being
the main contribution to the CP signal. The reported 13
C spectrum for cellulose in an
aqueous ZnCl2 solution at 65 ºC, is coherent with the suggested hypothesis [51] since a
good signal for dissolved cellulose is obtained at high temperature.
Comparing the CP spectra of cellulose in H3PO4 and in ZnCl2 it is possible to observe
minor differences in the chemical shifts of C1 and C4. In figure 3.26 (bottom), two new
peaks at 106.42 ppm and 84.67 ppm are detected. These differences are suggested to
result from the formation of a complex zinc-cellulose [51, 216]. For the cellulose dope
produced from the ZnCl2 based system, no degradation products are detected. Another
130
13 50
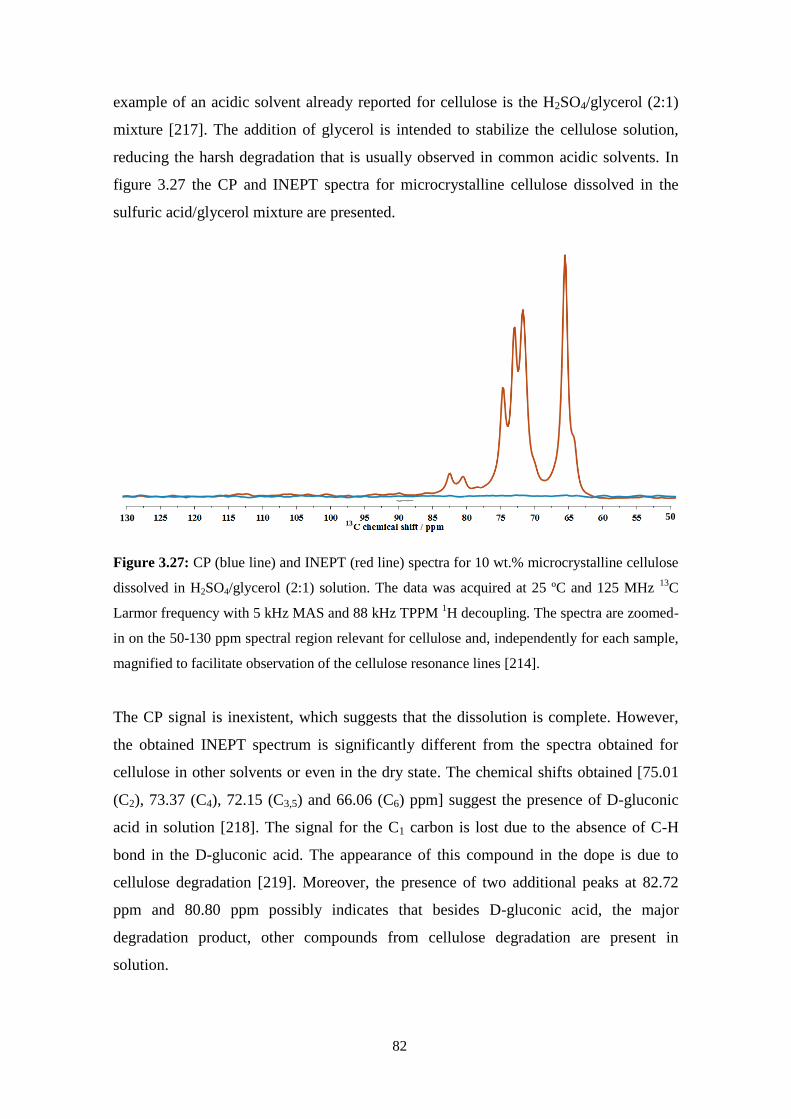
82
example of an acidic solvent already reported for cellulose is the H2SO4/glycerol (2:1)
mixture [217]. The addition of glycerol is intended to stabilize the cellulose solution,
reducing the harsh degradation that is usually observed in common acidic solvents. In
figure 3.27 the CP and INEPT spectra for microcrystalline cellulose dissolved in the
sulfuric acid/glycerol mixture are presented.
Figure 3.27: CP (blue line) and INEPT (red line) spectra for 10 wt.% microcrystalline cellulose
dissolved in H2SO4/glycerol (2:1) solution. The data was acquired at 25 ºC and 125 MHz 13
C
Larmor frequency with 5 kHz MAS and 88 kHz TPPM 1H decoupling. The spectra are zoomed-
in on the 50-130 ppm spectral region relevant for cellulose and, independently for each sample,
magnified to facilitate observation of the cellulose resonance lines [214].
The CP signal is inexistent, which suggests that the dissolution is complete. However,
the obtained INEPT spectrum is significantly different from the spectra obtained for
cellulose in other solvents or even in the dry state. The chemical shifts obtained [75.01
(C2), 73.37 (C4), 72.15 (C3,5) and 66.06 (C6) ppm] suggest the presence of D-gluconic
acid in solution [218]. The signal for the C1 carbon is lost due to the absence of C-H
bond in the D-gluconic acid. The appearance of this compound in the dope is due to
cellulose degradation [219]. Moreover, the presence of two additional peaks at 82.72
ppm and 80.80 ppm possibly indicates that besides D-gluconic acid, the major
degradation product, other compounds from cellulose degradation are present in
solution.
130
13 50
83
The strong cellulose degradation in the H2SO4/glycerol system (and also found in other
acidic systems) reduces the applications of these systems in situations where high
degrees of polymerization are required, such as fiber spinning. However, this solvent
might be very useful for other applications such as biofuel production [219].
Synopsis
Although quite efficient, acidic systems usually lead to unwanted cellulose degradation,
which can be an important drawback for certain applications. Here we have shown by
PLM the absence of large aggregates of undissolved material which is supported by PT
ssNMR (weak CP signal). However, PT ssNMR also demonstrates to be very sensitive
to the viscosity of the system; highly viscous solutions can lead to a long reorientation
time (C-H bond), which results in an enhancement in the CP signal even if the sample is
well dissolved (similar results were also obtained when true gelation of the solutions
occurs, such as the DMSO/H2O/TBAH or TBAF/DMSO/H2O systems [220]). This
might be regarded as a weakness of the technique, which can wrongly induce the less
accurate determination of the solid/liquid fractions. Nevertheless, it seems clear that
even for gelled systems important information can be obtained by PT ssNMR,
especially when combined with other techniques. PT ssNMR is also useful to detect
degradation products; for example, D-gluconic acid is found in the H2SO4/glycerol
system.
3.5 - Stability of cellulose dopes: Role of cyclodextrins and surfactants.
Usually, cellulose dopes are unstable with the self-association of cellulose
chains resulting in gelation of the system. Molecular association of cellulose is many
times explained based on an extended reformation of intra- and intermolecular hydrogen
bonds [174, 221-223]. However, as argued cellulose is an amphiphilic molecule and
thus the stability of the cellulose solutions is also governed by hydrophobic interactions.
During the regeneration process, the hydrophobic interactions are expected to be
responsible for the stacking of the cellulose chains and formation of molecular sheets,
the hydrogen bonds being responsible for the association of these sheets into thin planar
a)
84
crystals [74]. Recently, Isobe et al. reported the first experimental evidence of such
molecular aggregation [100]. The gelation phenomenon of cellulose solutions most
likely is also driven by hydrophobic interactions. In the previous section 3.3, the
enhancement of dissolution performance of NaOH based systems, promoted by the
addition of selected cosolutes such as urea or thiourea, was discussed. In this section the
stability of the dopes is evaluated.
Materials and methods
The materials and methods used are described in chapter 2.
Results
As discussed above the effect of amphiphilic solvents on the efficiency of dissolution of
cellulose samples is remarkable. In alkali based systems, a “simple” change of an
inorganic cation, Na+, by an amphiphilic cation (organic TBA
+) results in a significant
enhancement in performance. Higher concentrations of cellulose with larger degrees of
polymerization can be dissolved in solvents with the amphiphilic TBA+. The
introduction of molecules with intermediate polarity on the NaOH based solvents also
improves not only the dissolution capacity of the solvents but also their stability. As
presented in figure 3.16 the shear viscosity of an alkali based solution doped with
thiourea, is reduced after 7 days of storage. The same sample without the additive
shows an increase in shear viscosity, possibly demonstrating a small aggregation of the
cellulose chains.
Stability of cellulose solutions: influence of cyclodextrins
The cellulose dopes produced in aqueous TBAH or TBPH solutions are stable (no
gelation is observed) during a long period of time (figure 3.28). Such stability is
typically not observed with systems containing inorganic cations. For instance cellulose
solutions produced via the viscose process typically gel after one week, limiting the
time window for processing.
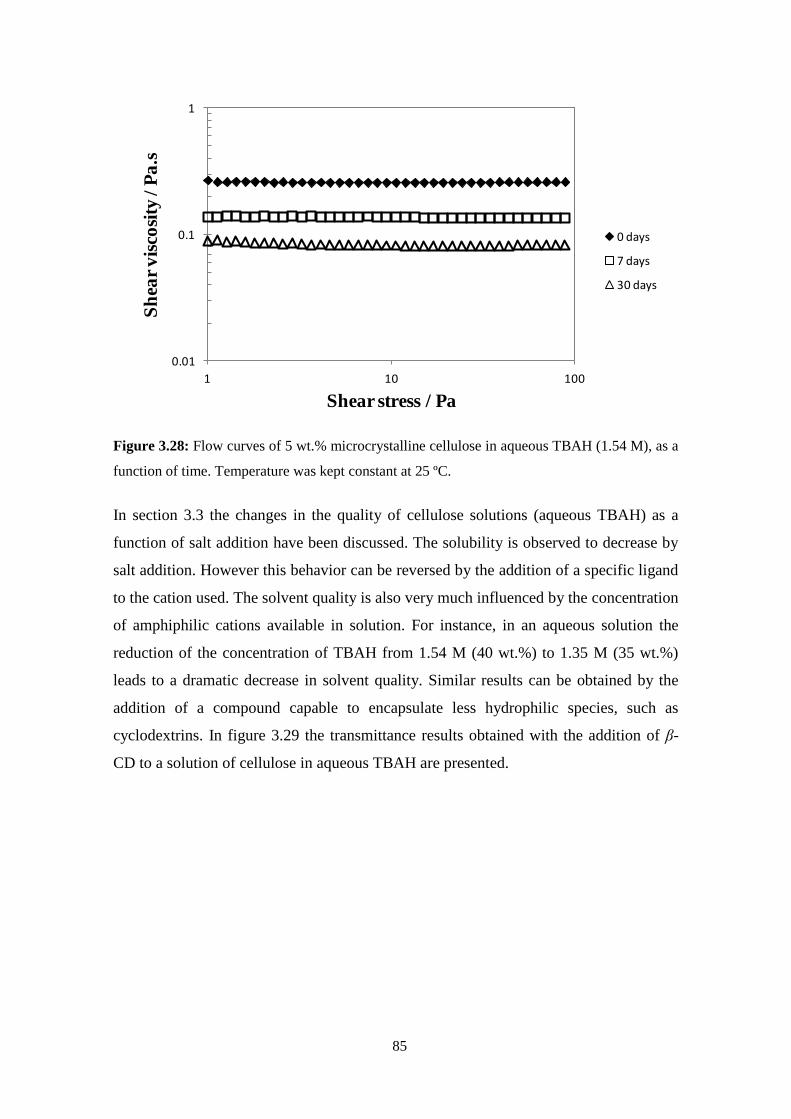
85
Figure 3.28: Flow curves of 5 wt.% microcrystalline cellulose in aqueous TBAH (1.54 M), as a
function of time. Temperature was kept constant at 25 ºC.
In section 3.3 the changes in the quality of cellulose solutions (aqueous TBAH) as a
function of salt addition have been discussed. The solubility is observed to decrease by
salt addition. However this behavior can be reversed by the addition of a specific ligand
to the cation used. The solvent quality is also very much influenced by the concentration
of amphiphilic cations available in solution. For instance, in an aqueous solution the
reduction of the concentration of TBAH from 1.54 M (40 wt.%) to 1.35 M (35 wt.%)
leads to a dramatic decrease in solvent quality. Similar results can be obtained by the
addition of a compound capable to encapsulate less hydrophilic species, such as
cyclodextrins. In figure 3.29 the transmittance results obtained with the addition of β-
CD to a solution of cellulose in aqueous TBAH are presented.
0.01
0.1
1
1 10 100
Sh
ear
vis
cosi
ty /
Pa
.s
Shear stress / Pa
0 days
7 days
30 days
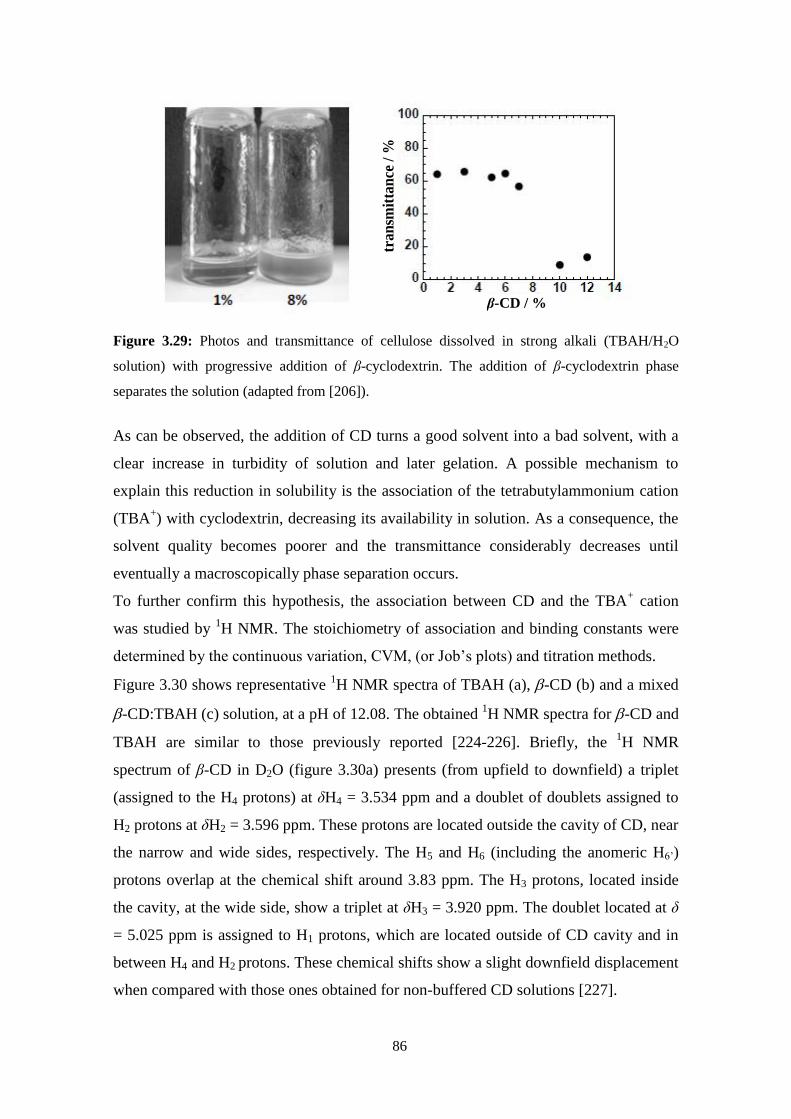
86
Figure 3.29: Photos and transmittance of cellulose dissolved in strong alkali (TBAH/H2O
solution) with progressive addition of β-cyclodextrin. The addition of β-cyclodextrin phase
separates the solution (adapted from [206]).
As can be observed, the addition of CD turns a good solvent into a bad solvent, with a
clear increase in turbidity of solution and later gelation. A possible mechanism to
explain this reduction in solubility is the association of the tetrabutylammonium cation
(TBA+) with cyclodextrin, decreasing its availability in solution. As a consequence, the
solvent quality becomes poorer and the transmittance considerably decreases until
eventually a macroscopically phase separation occurs.
To further confirm this hypothesis, the association between CD and the TBA+ cation
was studied by 1H NMR. The stoichiometry of association and binding constants were
determined by the continuous variation, CVM, (or Job’s plots) and titration methods.
Figure 3.30 shows representative 1H NMR spectra of TBAH (a), -CD (b) and a mixed
-CD:TBAH (c) solution, at a pH of 12.08. The obtained 1H NMR spectra for -CD and
TBAH are similar to those previously reported [224-226]. Briefly, the 1H NMR
spectrum of β-CD in D2O (figure 3.30a) presents (from upfield to downfield) a triplet
(assigned to the H4 protons) at δH4 = 3.534 ppm and a doublet of doublets assigned to
H2 protons at δH2 = 3.596 ppm. These protons are located outside the cavity of CD, near
the narrow and wide sides, respectively. The H5 and H6 (including the anomeric H6’)
protons overlap at the chemical shift around 3.83 ppm. The H3 protons, located inside
the cavity, at the wide side, show a triplet at δH3 = 3.920 ppm. The doublet located at δ
= 5.025 ppm is assigned to H1 protons, which are located outside of CD cavity and in
between H4 and H2 protons. These chemical shifts show a slight downfield displacement
when compared with those ones obtained for non-buffered CD solutions [227].
β-CD / %
tran
smit
tan
ce /
%

87
The 1H NMR spectrum of TBAH (figure 3.30b) shows a triplet assigned to the methyl
group (H) at 0.955 ppm, and the 1H NMR assigned to methylene groups shows
resonances at 1.370, 1.660 and 3.206 ppm for H, H and H, respectively.
The 1H NMR spectrum of a -CD:TBAH mixed solution, with a molar ratio
r=[TBAH]/[-CD]=1.01, and with [-CD]=0.506 mM, is given in figure 3.30c. It can
be seen that resonances of CD and TBAH do not overlap; besides, and as can be seen
below, upfield shifts (=(mixture)-(free)) for tetrabutylammonium protons are
observed, whereas for the case of -CD 1H the presence of TBA
+ leads to downfield
shifts.
Figure 3.30: 1H NMR spectra of solutions of a) TBAH, 1.02 mM; b) β-CD, 1.01 mM; and c)
TBAH and β-CD, xCD = 0.5 [228].
To evaluate the possible interaction between TBA+ and -CD, the stoichiometry and the
corresponding binding constants were determined using the continuous variation, CVM,
(or Job’s plots) and titration methods, respectively [229]. The CVM is based on the
(CH3-CH2-CH2-CH2-)4N+ OH-
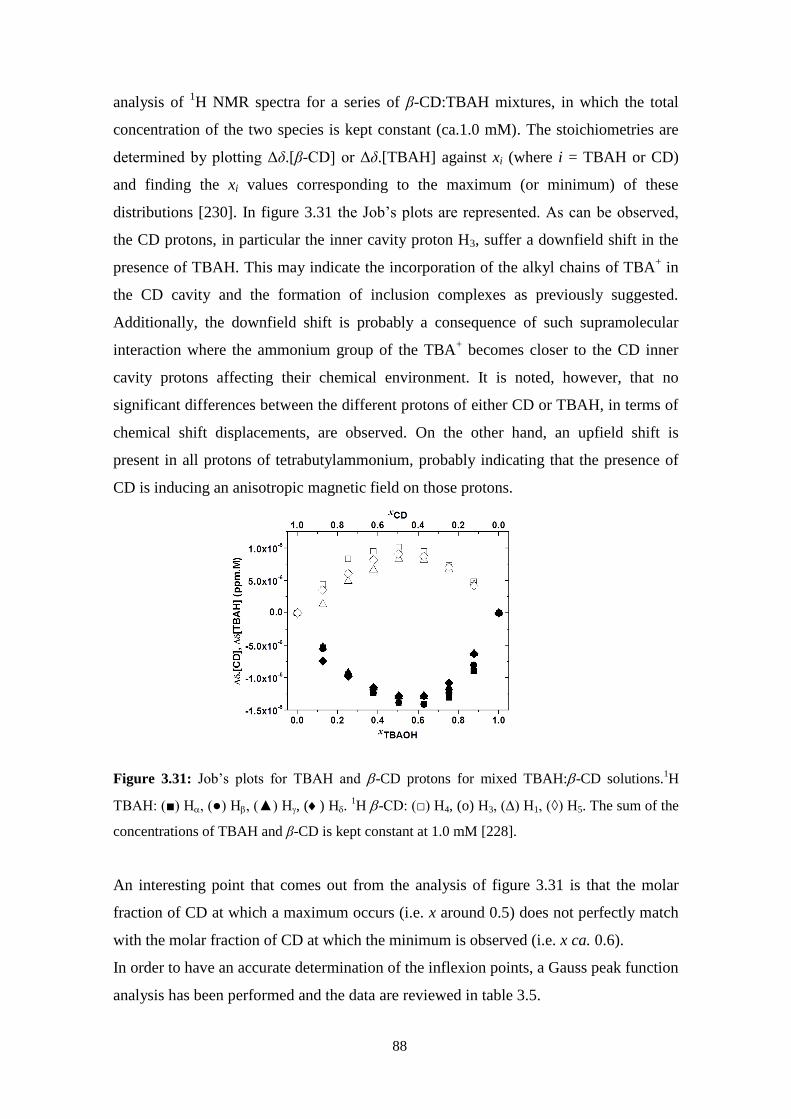
88
analysis of 1H NMR spectra for a series of β-CD:TBAH mixtures, in which the total
concentration of the two species is kept constant (ca.1.0 mM). The stoichiometries are
determined by plotting Δδ.[β-CD] or Δδ.[TBAH] against xi (where i = TBAH or CD)
and finding the xi values corresponding to the maximum (or minimum) of these
distributions [230]. In figure 3.31 the Job’s plots are represented. As can be observed,
the CD protons, in particular the inner cavity proton H3, suffer a downfield shift in the
presence of TBAH. This may indicate the incorporation of the alkyl chains of TBA+ in
the CD cavity and the formation of inclusion complexes as previously suggested.
Additionally, the downfield shift is probably a consequence of such supramolecular
interaction where the ammonium group of the TBA+ becomes closer to the CD inner
cavity protons affecting their chemical environment. It is noted, however, that no
significant differences between the different protons of either CD or TBAH, in terms of
chemical shift displacements, are observed. On the other hand, an upfield shift is
present in all protons of tetrabutylammonium, probably indicating that the presence of
CD is inducing an anisotropic magnetic field on those protons.
Figure 3.31: Job’s plots for TBAH and -CD protons for mixed TBAH:-CD solutions.1H
TBAH: (■) H, (●) H, (▲) H, () H. 1H -CD: (□) H4, (o) H3, (∆) H1, (◊) H5. The sum of the
concentrations of TBAH and β-CD is kept constant at 1.0 mM [228].
An interesting point that comes out from the analysis of figure 3.31 is that the molar
fraction of CD at which a maximum occurs (i.e. x around 0.5) does not perfectly match
with the molar fraction of CD at which the minimum is observed (i.e. x ca. 0.6).
In order to have an accurate determination of the inflexion points, a Gauss peak function
analysis has been performed and the data are reviewed in table 3.5.
89
Table 3.5: Molar fractions and corresponding stoichiometry of association between TBAH (m)
and β-CD (n) obtained from the CVM [228].
H4 H3 H1 H5
xCD 0.499 (0.007) 0.463 (0.004) 0.454 (0.004) 0.463 (0.004)
m:n 1.03 (0.01) 1.16 (0.01) 1.20 (0.01) 1.16 (0.01)
1 H H H H
xTBAH 0.616 (0.006) 0.590 (0.006) 0.607 (0.008) 0.537 (0.006)
m:n 1.61 (0.02) 1.44 (0.01) 1.55 (0.02) 1.16 (0.01)
Some inconsistency is observed when comparing the stoichiometries of association, as
seen by CD or TBAH protons. This may be due to supramolecular interactions not
involving exclusively the formation of inclusion complexes. Alternatively, it may be
hypothesized that the ammonium group is also playing an important role by interacting
electrostatically with hydroxyl groups located in the outside of CD cavity. It should be
emphasized that not only hydrophobic interactions lead to an association between CD
and a guest molecules; for instance, it has been reported that non-associated inorganic
salts can be involved in the formation of “host-guest” complexes although with
moderate association constants [231, 232].
Taking into account the stoichiometry of association found by the CVM, the
equilibrium formation of the complex can be written as:
f f
CD GK
CD G
(3.1)
where [CD]f and [G]f represent the concentration of free (non-complexed) species, β-CD
and TBAH, respectively, and [CD-G] is the concentration of the 1:1 complex.
Considering the corresponding mass balance equations, equation 3.1 can be re-written
as:
1T T
fK
f CD f G
(3.2)
where f is the fraction of TBAH complexed with the β-CD, and [CD]T and [G]T
correspond to total concentrations of -CD and TBAH, respectively.
Assuming fast exchange conditions, the observed chemical shift for a guest species is
expressed as:
exp 1 G CD Gf f (3.3)
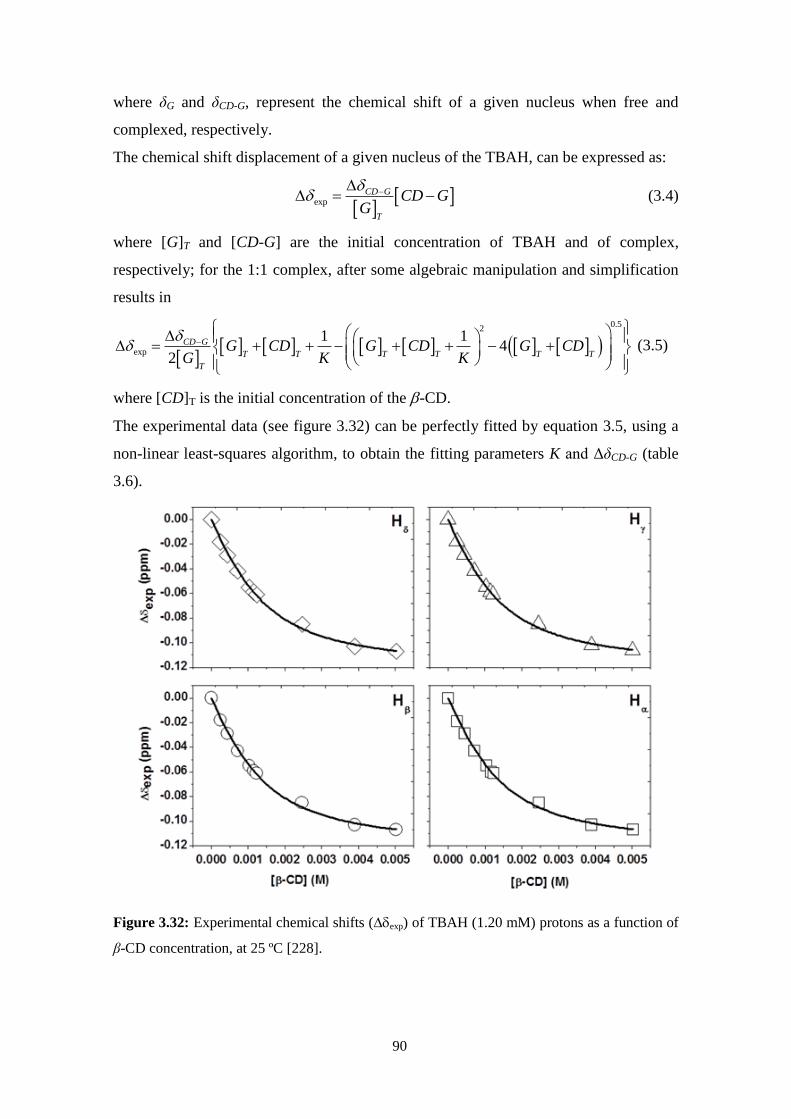
90
where δG and δCD-G, represent the chemical shift of a given nucleus when free and
complexed, respectively.
The chemical shift displacement of a given nucleus of the TBAH, can be expressed as:
exp
CD G
T
CD GG
(3.4)
where [G]T and [CD-G] are the initial concentration of TBAH and of complex,
respectively; for the 1:1 complex, after some algebraic manipulation and simplification
results in
0.52
exp
1 14
2
CD G
T T T T T T
T
G CD G CD G CDG K K
(3.5)
where [CD]T is the initial concentration of the -CD.
The experimental data (see figure 3.32) can be perfectly fitted by equation 3.5, using a
non-linear least-squares algorithm, to obtain the fitting parameters K and ΔδCD-G (table
3.6).
Figure 3.32: Experimental chemical shifts (exp) of TBAH (1.20 mM) protons as a function of
β-CD concentration, at 25 ºC [228].
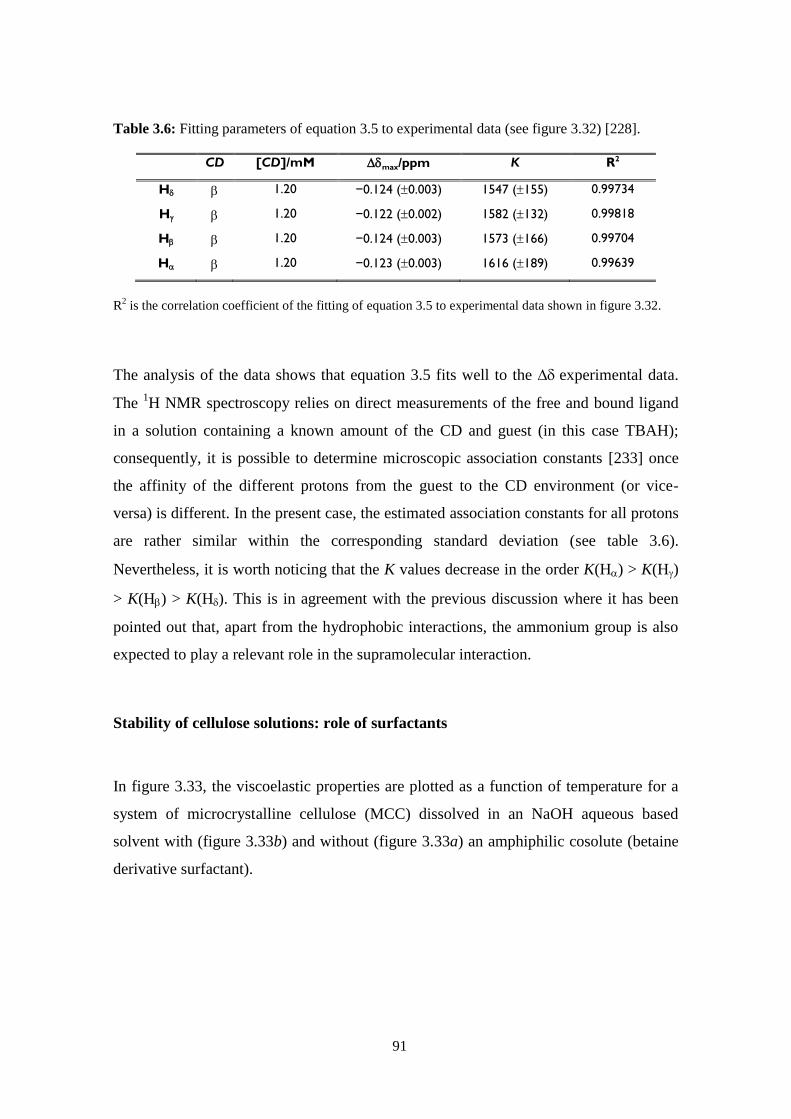
91
Table 3.6: Fitting parameters of equation 3.5 to experimental data (see figure 3.32) [228].
CD [CD]/mM max/ppm K R2
H 1.20 −0.124 (0.003) 1547 (155) 0.99734
H 1.20 −0.122 (0.002) 1582 (132) 0.99818
H 1.20 −0.124 (0.003) 1573 (166) 0.99704
H 1.20 −0.123 (0.003) 1616 (189) 0.99639
R2 is the correlation coefficient of the fitting of equation 3.5 to experimental data shown in figure 3.32.
The analysis of the data shows that equation 3.5 fits well to the experimental data.
The 1H NMR spectroscopy relies on direct measurements of the free and bound ligand
in a solution containing a known amount of the CD and guest (in this case TBAH);
consequently, it is possible to determine microscopic association constants [233] once
the affinity of the different protons from the guest to the CD environment (or vice-
versa) is different. In the present case, the estimated association constants for all protons
are rather similar within the corresponding standard deviation (see table 3.6).
Nevertheless, it is worth noticing that the K values decrease in the order K(H) > K(H)
> K(H) > K(H). This is in agreement with the previous discussion where it has been
pointed out that, apart from the hydrophobic interactions, the ammonium group is also
expected to play a relevant role in the supramolecular interaction.
Stability of cellulose solutions: role of surfactants
In figure 3.33, the viscoelastic properties are plotted as a function of temperature for a
system of microcrystalline cellulose (MCC) dissolved in an NaOH aqueous based
solvent with (figure 3.33b) and without (figure 3.33a) an amphiphilic cosolute (betaine
derivative surfactant).
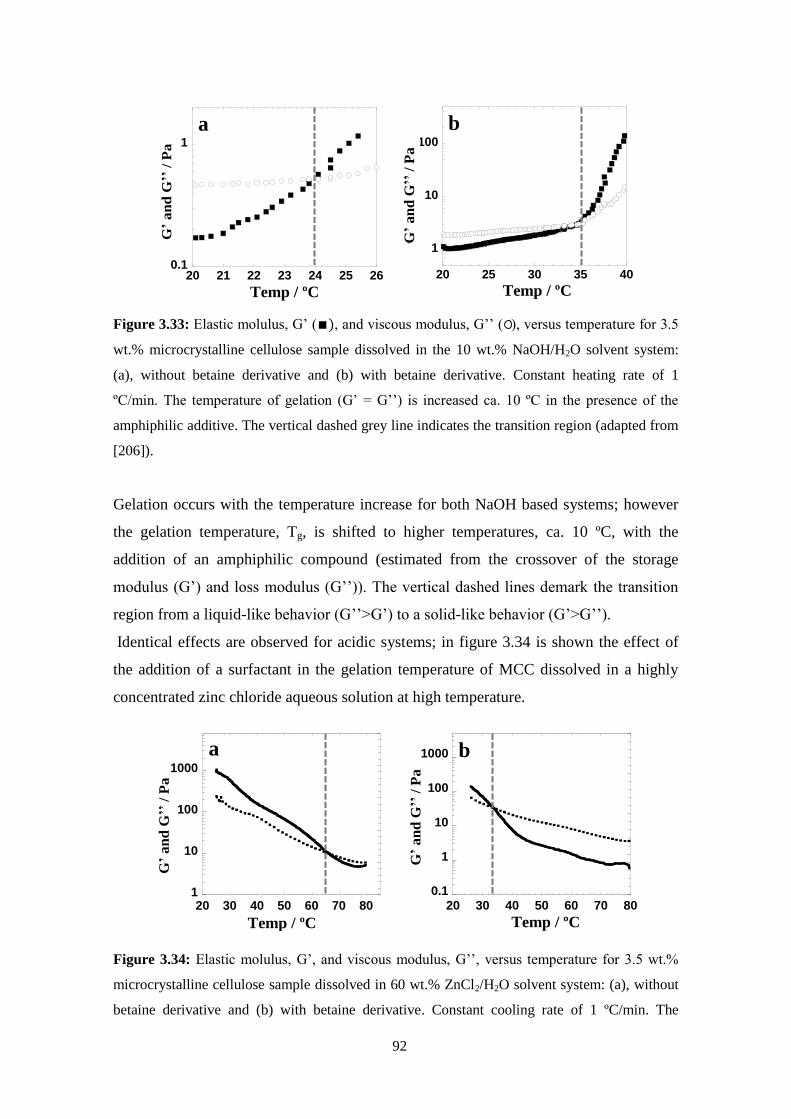
92
Figure 3.33: Elastic molulus, G’ ( , and viscous modulus, G’’ ( ), versus temperature for 3.5
wt.% microcrystalline cellulose sample dissolved in the 10 wt.% NaOH/H2O solvent system:
(a), without betaine derivative and (b) with betaine derivative. Constant heating rate of 1
ºC/min. The temperature of gelation (G’ = G’’) is increased ca. 10 ºC in the presence of the
amphiphilic additive. The vertical dashed grey line indicates the transition region (adapted from
[206]).
Gelation occurs with the temperature increase for both NaOH based systems; however
the gelation temperature, Tg, is shifted to higher temperatures, ca. 10 ºC, with the
addition of an amphiphilic compound (estimated from the crossover of the storage
modulus (G’) and loss modulus (G’’)). The vertical dashed lines demark the transition
region from a liquid-like behavior (G’’>G’) to a solid-like behavior (G’>G’’).
Identical effects are observed for acidic systems; in figure 3.34 is shown the effect of
the addition of a surfactant in the gelation temperature of MCC dissolved in a highly
concentrated zinc chloride aqueous solution at high temperature.
Figure 3.34: Elastic molulus, G’, and viscous modulus, G’’, versus temperature for 3.5 wt.%
microcrystalline cellulose sample dissolved in 60 wt.% ZnCl2/H2O solvent system: (a), without
betaine derivative and (b) with betaine derivative. Constant cooling rate of 1 ºC/min. The
0.1
1
20 21 22 23 24 25 26
G' an
d G
'' /
Pa
Temp / ºC
1
10
100
20 25 30 35 40
G' an
d G
'' /
Pa
Temp / ºC
a b
Temp / ºC Temp / ºC
G’
an
d G
’’ /
Pa
G’
an
d G
’’ /
Pa
0.1
1
20 21 22 23 24 25 26
G' an
d G
'' /
Pa
Temp / ºC
1
10
100
20 25 30 35 40
G' an
d G
'' /
Pa
Temp / ºC
a b
Temp / ºC Temp / ºC
G’
an
d G
’’ /
Pa
G’
an
d G
’’ /
Pa
1
10
100
1000
20 30 40 50 60 70 80
G' an
d G
'' /
Pa
Temp / ºC
0.1
1
10
100
1000
20 30 40 50 60 70 80
G' an
d G
'' /
Pa
Temp / ºC
a b
Temp / ºC Temp / ºC
G’
an
d G
’’ /
Pa
G’
an
d G
’’ /
Pa
93
temperature of gelation, Tg, decreased more than 30 ºC in the presence of the amphiphilic
additive. The vertical dashed grey line indicates the transition region (adapted from [206]).
For this system, gelation is observed at ca. 65 ºC in the absence of the amphiphilic
compound. However, when the amphiphilic additive is present (figure 3.34b), the
cellulose dope kept the liquid behavior (G’’ > G’) for a larger temperature range,
shifting the gelation to temperatures below ca. 35 ºC. Even with the obvious differences
among the different solvent systems presented and different dissolution procedures, it
seems clear that the addition of certain amphiphilic additives leads to similar effects (i.e.
an increase in the thermal stability of the cellulose dopes, allowing the solutions to
preserve their liquid behavior). Gelation is believed to be due to self-aggregation of the
cellulose chains in the solution, with time and/or induced by temperature changes. The
increasing number of hydrophobic junction zones between the cellulose chains in the
solution can be prevented by the presence of the amphiphilic specie. The obtained
results suggest that the amphiphilic cosolute can reduce the hydrophobic interactions,
preventing or delaying cellulose aggregation, resulting in an increased thermal and
temporal stability.
Synopsis
Dope stability is found to be visibly influenced by the presence of amphiphilic or
intermediate polarity species. The results suggest that certain cosolutes can prevent to
some extent the hydrophobic association, here suggested to be the driving force for
gelation of the solutions. As a consequence, the cellulose dopes increase their thermal
and storage stability. For the aqueous TBAH system, a high performance solvent, the
presence of an amphiphilic cation seems to be the key factor for the observed high
dissolution power.
It has been demonstrated that the solvent capabilities can be controlled by adding β-
cyclodextrin, which is suggested to decrease the amount of TBA+ cations available in
solution, thus considerably affecting the solubility of cellulose leading to gelation and
turbidity of the solutions.
The formation of a host-guest complex is supported by the NMR experiments. The data
does suggest the formation of 1:1 β-CD:TBA+ complexes with association constants of
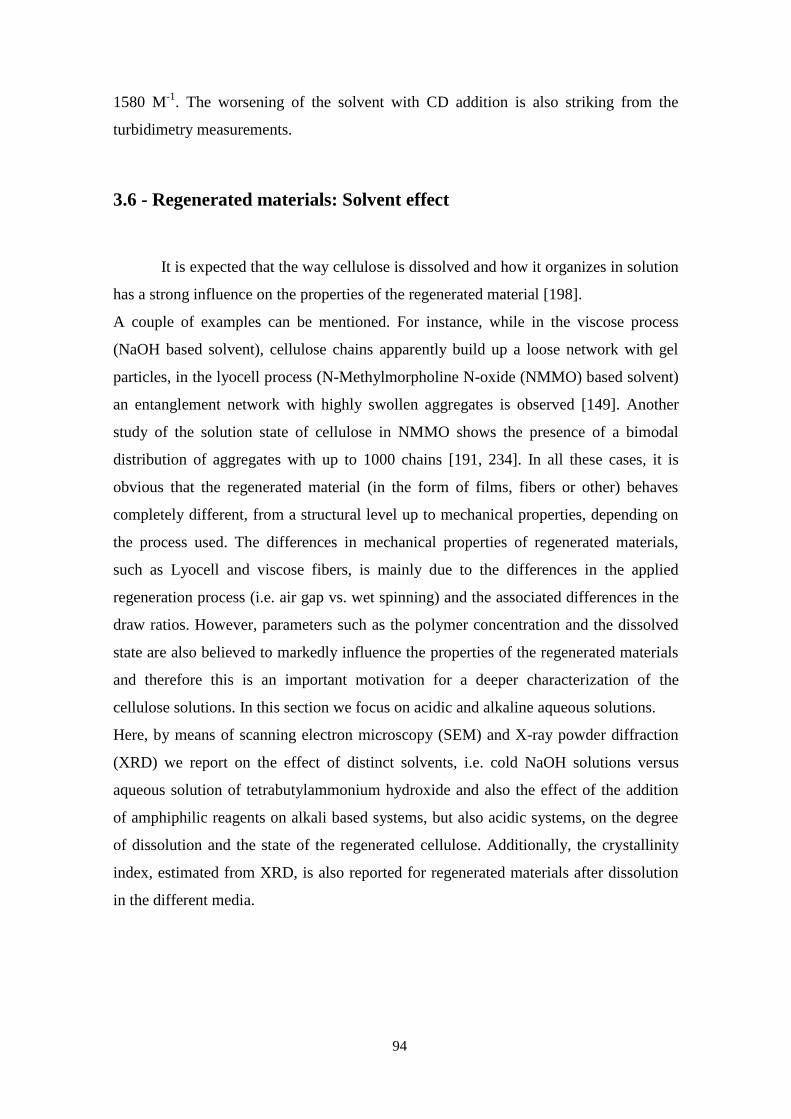
94
1580 M-1
. The worsening of the solvent with CD addition is also striking from the
turbidimetry measurements.
3.6 - Regenerated materials: Solvent effect
It is expected that the way cellulose is dissolved and how it organizes in solution
has a strong influence on the properties of the regenerated material [198].
A couple of examples can be mentioned. For instance, while in the viscose process
(NaOH based solvent), cellulose chains apparently build up a loose network with gel
particles, in the lyocell process (N-Methylmorpholine N-oxide (NMMO) based solvent)
an entanglement network with highly swollen aggregates is observed [149]. Another
study of the solution state of cellulose in NMMO shows the presence of a bimodal
distribution of aggregates with up to 1000 chains [191, 234]. In all these cases, it is
obvious that the regenerated material (in the form of films, fibers or other) behaves
completely different, from a structural level up to mechanical properties, depending on
the process used. The differences in mechanical properties of regenerated materials,
such as Lyocell and viscose fibers, is mainly due to the differences in the applied
regeneration process (i.e. air gap vs. wet spinning) and the associated differences in the
draw ratios. However, parameters such as the polymer concentration and the dissolved
state are also believed to markedly influence the properties of the regenerated materials
and therefore this is an important motivation for a deeper characterization of the
cellulose solutions. In this section we focus on acidic and alkaline aqueous solutions.
Here, by means of scanning electron microscopy (SEM) and X-ray powder diffraction
(XRD) we report on the effect of distinct solvents, i.e. cold NaOH solutions versus
aqueous solution of tetrabutylammonium hydroxide and also the effect of the addition
of amphiphilic reagents on alkali based systems, but also acidic systems, on the degree
of dissolution and the state of the regenerated cellulose. Additionally, the crystallinity
index, estimated from XRD, is also reported for regenerated materials after dissolution
in the different media.

95
Materials and methods
The materials and methods used are described in chapter 2.
Results
The regeneration step in cellulose processing, in order to produce fibers or films, occurs
when dissolved cellulose in solution contacts with a coagulation solution, leading to a
desolvation of the cellulose molecules and aggregation of the chains, in an arrangement
which is influenced by the solution state of cellulose. Molecular aggregation during
regeneration of cellulose typically is attributed to rearrangement of the hydrogen bonds
(i.e. reformation of the intra- and intermolecular hydrogen bonds) [235]. A more recent
view calls the attention to the role of hydrophobic interactions during the regeneration
process; this analysis suggests that when the medium surrounding the cellulose
molecules becomes energetically unfavorable for molecular dispersion, regeneration
starts and the initial process would consist of the stacking of the hydrophobic
glucopyranoside rings (driven by hydrophobic interactions), which then would line up
by hydrogen bonding to form crystallites [100]. In what follows, the effect of the
solvent system and the efficiency of dissolution on the properties of the regenerated
materials are discussed.
Alkaline solvents
In figure 3.35 are presented SEM images of regenerated cellulose after dissolved in
different alkali based solvent systems.
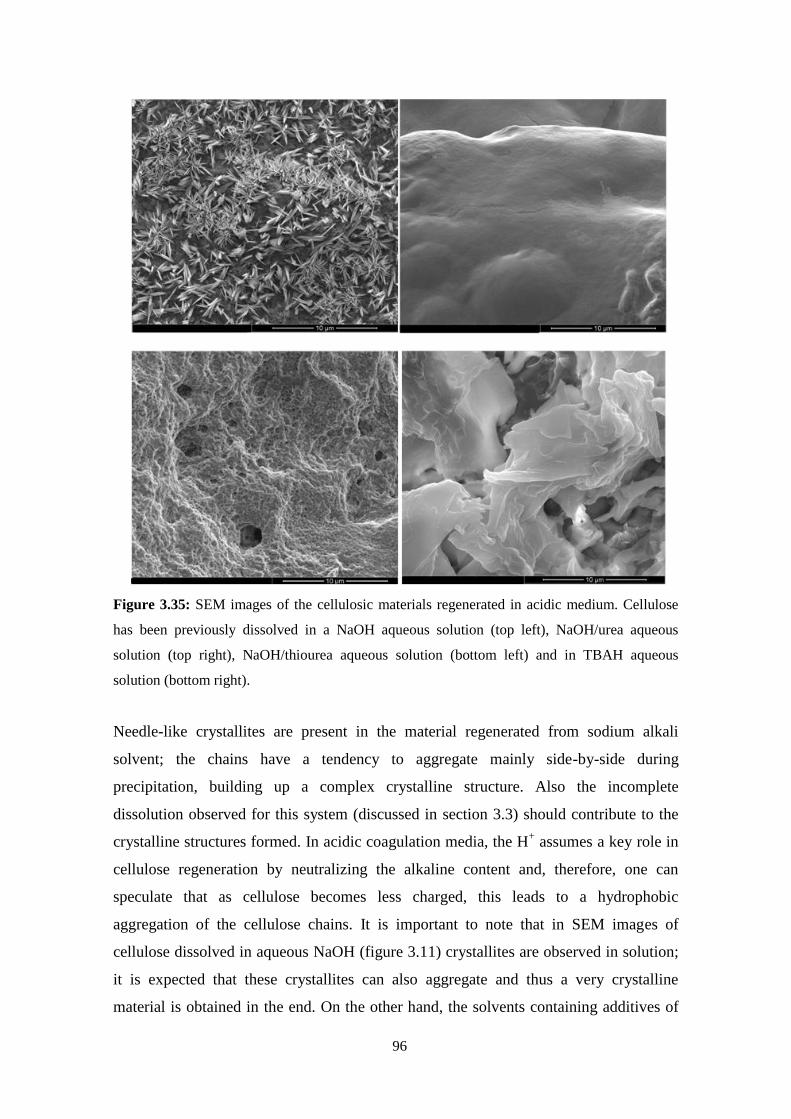
96
Figure 3.35: SEM images of the cellulosic materials regenerated in acidic medium. Cellulose
has been previously dissolved in a NaOH aqueous solution (top left), NaOH/urea aqueous
solution (top right), NaOH/thiourea aqueous solution (bottom left) and in TBAH aqueous
solution (bottom right).
Needle-like crystallites are present in the material regenerated from sodium alkali
solvent; the chains have a tendency to aggregate mainly side-by-side during
precipitation, building up a complex crystalline structure. Also the incomplete
dissolution observed for this system (discussed in section 3.3) should contribute to the
crystalline structures formed. In acidic coagulation media, the H+ assumes a key role in
cellulose regeneration by neutralizing the alkaline content and, therefore, one can
speculate that as cellulose becomes less charged, this leads to a hydrophobic
aggregation of the cellulose chains. It is important to note that in SEM images of
cellulose dissolved in aqueous NaOH (figure 3.11) crystallites are observed in solution;
it is expected that these crystallites can also aggregate and thus a very crystalline
material is obtained in the end. On the other hand, the solvents containing additives of
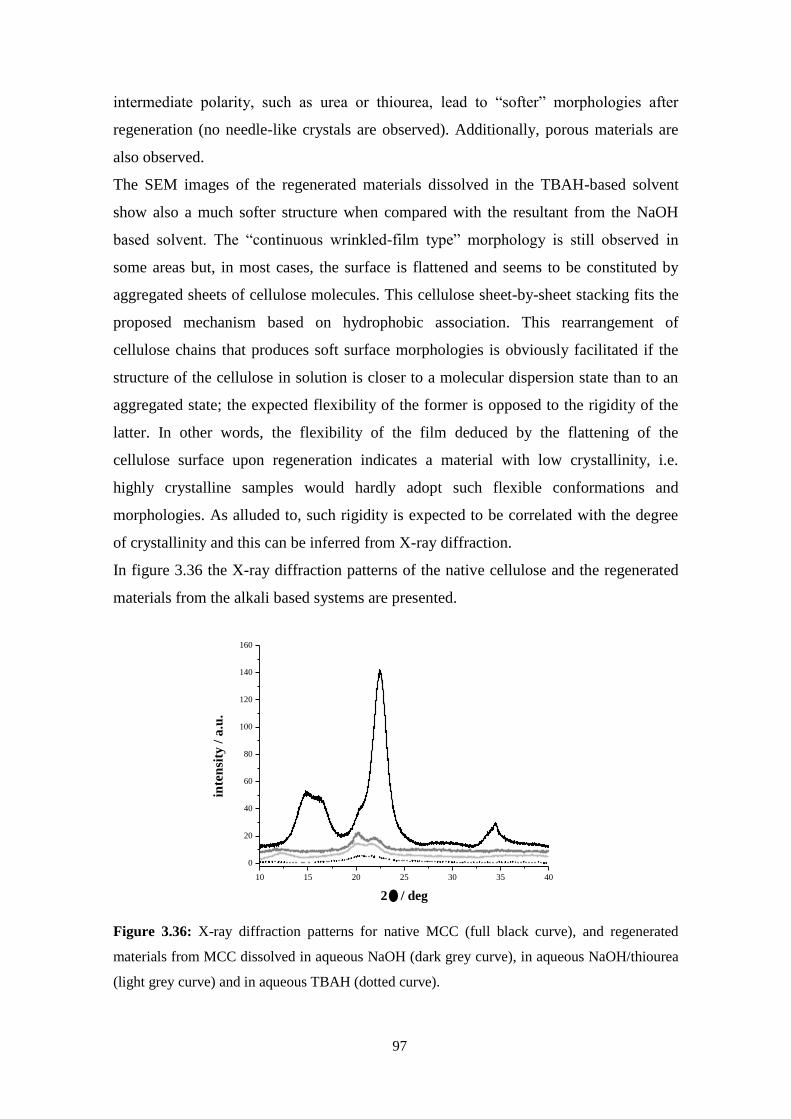
97
intermediate polarity, such as urea or thiourea, lead to “softer” morphologies after
regeneration (no needle-like crystals are observed). Additionally, porous materials are
also observed.
The SEM images of the regenerated materials dissolved in the TBAH-based solvent
show also a much softer structure when compared with the resultant from the NaOH
based solvent. The “continuous wrinkled-film type” morphology is still observed in
some areas but, in most cases, the surface is flattened and seems to be constituted by
aggregated sheets of cellulose molecules. This cellulose sheet-by-sheet stacking fits the
proposed mechanism based on hydrophobic association. This rearrangement of
cellulose chains that produces soft surface morphologies is obviously facilitated if the
structure of the cellulose in solution is closer to a molecular dispersion state than to an
aggregated state; the expected flexibility of the former is opposed to the rigidity of the
latter. In other words, the flexibility of the film deduced by the flattening of the
cellulose surface upon regeneration indicates a material with low crystallinity, i.e.
highly crystalline samples would hardly adopt such flexible conformations and
morphologies. As alluded to, such rigidity is expected to be correlated with the degree
of crystallinity and this can be inferred from X-ray diffraction.
In figure 3.36 the X-ray diffraction patterns of the native cellulose and the regenerated
materials from the alkali based systems are presented.
Figure 3.36: X-ray diffraction patterns for native MCC (full black curve), and regenerated
materials from MCC dissolved in aqueous NaOH (dark grey curve), in aqueous NaOH/thiourea
(light grey curve) and in aqueous TBAH (dotted curve).
10 15 20 25 30 35 40
0
20
40
60
80
100
120
140
160
inte
nsi
ty /
a.u
.
2 / deg
starting material
dissolved in NaOH
dissolved in NaOH + thiourea
dissoved in TBAH
98
The use of additives with amphiphilic properties such as urea, thiourea or alkyl-
polyglucoside surfactant (APG) in the NaOH system or using a solvent with
amphiphilic cations (TBAH) considerably reduces the crystallinity of the native MCC.
Regarding the position of the diffraction peaks, the starting MCC material presents a
major sharp diffraction centered at ca. 22.5º (002) with a side peak at 20.5° (021) typical
for a cellulose I crystalline organization [165]. Other characteristic reflections of the
cellulose I type structure can be found at 14.7º (101), 16.6º (10 ) and 34.7º (040). When
cellulose is dissolved in the NaOH aqueous solution or in the NaOH/thiourea system,
the regenerated structure changes to a cellulose II type arrangement with two main
diffraction peaks centred at 20.1º (10 ) and 21.9º (002). A small bump at ca. 12.3º is
indicative of a 101 lattice plane, also characteristic of a cellulose II crystal organization
[165].
On the other hand, a more amorphous material with no detectable diffraction peaks is
obtained when cellulose is regenerated from the TBAH aqueous system. The X-ray data
are in good agreement with the NMR and SEM data.
The estimated crystallinity index of the materials, using the X-ray diffraction data
(equation 2.1), shows CrI values of 85 and 82% for the native cellulose and that
regenerated from NaOH solution, respectively; on the other hand, it was not possible to
determine the CrI from the TBAH based solutions due to its amorphous nature [190]. It
is important to keep in mind that although these values are not absolute, they provide
good indications and correlate well with the SEM results.
Acidic solvents
Despite the chemical degradation of cellulose in most of the acidic systems studied, it is
still possible to regenerate and precipitate cellulose using a non-solvent such as pure
water or slightly alkaline solutions. In figure 3.37, electron micrographs of the
regenerated cellulose from the acid solutions are presented. In some cases surfactants
have been use to increase not only the dissolution efficiency but also to increase the
stability of the dopes.
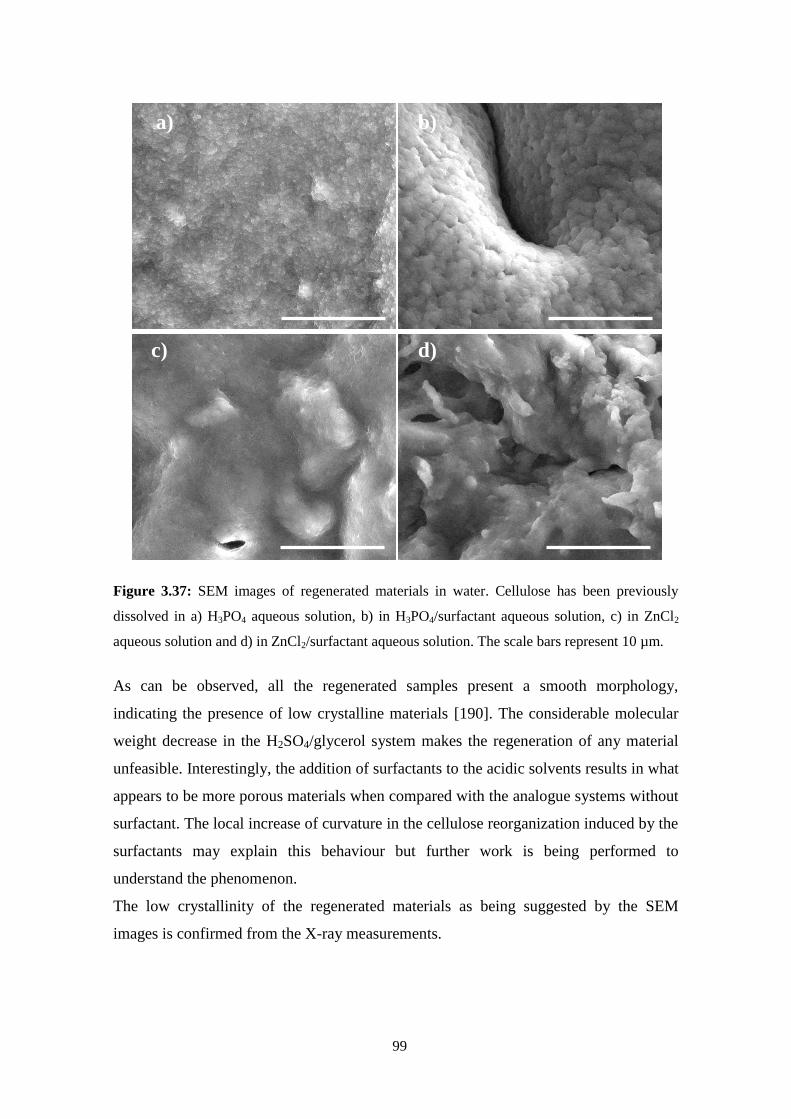
99
Figure 3.37: SEM images of regenerated materials in water. Cellulose has been previously
dissolved in a) H3PO4 aqueous solution, b) in H3PO4/surfactant aqueous solution, c) in ZnCl2
aqueous solution and d) in ZnCl2/surfactant aqueous solution. The scale bars represent 10 µm.
As can be observed, all the regenerated samples present a smooth morphology,
indicating the presence of low crystalline materials [190]. The considerable molecular
weight decrease in the H2SO4/glycerol system makes the regeneration of any material
unfeasible. Interestingly, the addition of surfactants to the acidic solvents results in what
appears to be more porous materials when compared with the analogue systems without
surfactant. The local increase of curvature in the cellulose reorganization induced by the
surfactants may explain this behaviour but further work is being performed to
understand the phenomenon.
The low crystallinity of the regenerated materials as being suggested by the SEM
images is confirmed from the X-ray measurements.
a) b)
c) d)
a) b)
c) d)

100
Figure 3.38: X-ray diffraction patterns for microcrystalline cellulose (black line), and
regenerated materials from a solution of microcrystalline cellulose dissolved in H3PO4 aqueous
(grey line), from a solution of microcrystalline cellulose dissolved in H3PO4/surfactant aqueous
(light grey line) and from ZnCl2 aqueous (dotted line).
Figure 3.38 clearly indicates a reduction in the crystallinity of the regenerated materials
obtained from all the tested acidic solvent systems. Moreover, a change in the cellulose
chain arrangement can be observed; while a typical cellulose I crystalline organization
is obtained for the starting material, a cellulose II polymorph is obtained for the
regenerated materials: for the H3PO4 and ZnCl2 aqueous systems, the Bragg reflections
are found at 12.2º ( ), 19.9º (110) and 22.0º (200) [109, 236]. The addition of a
surfactant to the H3PO4 aqueous system, results in a change of the packing of the
cellulose chains in the regenerated materials with reflections at 20.0 (110) and 21.8º
(200), but without the reflection of the plane ( ) [236]. This might indicate a more
amorphous material in comparison to the analogous surfactant-free system. Overall, the
X-ray data are in good agreement with the SEM and PT ssNMR results.
Synopsis
In this section we have discussed the influence of the solvent system on the properties
of regenerated cellulosic materials. There are significant differences in morphology and
crystallinity of the precipitated materials depending on the solvent used. It is striking
10 15 20 25 30 35 40
0
20
40
60
80
100
120
140
160
inte
nsi
ty /
a.u
.
2 / deg
starting material
dissolved in phosphoric acid
dissolved in phosphoric acid + APG
dissolved in zinc chloride
101
that while the samples dissolved in NaOH exhibit a quite high crystallinity, with needle-
like crystallites observed in SEM and higher CrI estimated from XRD, the cellulose
samples obtained from NaOH/thiourea solution show a decrease in crystallinity while
the materials from the TBAH solution lose considerably their crystallinity, presenting
flexible continuous wrinkled-film type morphology; no CrI can be estimated from the
XRD data. Similarly, materials regenerated from acidic solvents structurally tend to
present smooth morphologies as expected for materials with low crystallinity.
The level of dissolution has implications for the properties of the regenerated materials;
while for TBAH the lack of crystallinity and high flexibility of the regenerated materials
indicate that dissolution progresses close to the molecular level, in the case of the NaOH
dissolution is not complete and stable cellulose aggregates (crystallites) are still present
in solution. The light scattering data indicates the presence of fairly small cellulose
particles in the TBAH system (ca. 10–20 nm) while considerably larger cellulose
particles (above 200 nm) are found for the NaOH system. The reduction in solvent
polarity, obtained by addition of urea or thiourea results also in less crystalline
materials, showing an improvement in solvent quality.
Smooth materials were obtained from solutions made in acidic solvents, which is
indicative of the good dissolution level achieved when these solvents are used. The
good performance of the acidic systems is clear, but the molecular weight decrease
might be problematic for certain applications such as the fiber or film production. In
these cases alternative strategies should be considered to prevent cellulose degradation
such as the reduction of temperature or the addition of different additives or co-solvents.

102
103
CHAPTER 4
Conclusions
A wide range of solvents for cellulose were used during this study. In addition
new methods were implemented to study cellulose in solution such as the polarization
transfer solid state NMR (PT ssNMR). The technique is very useful; both solid and
liquid fractions can be studied in one single experiment. Another interesting utility of
this technique is the capability of detection of cellulose degradation products.
On the other hand, the successful extraction and characterization of CNCs from the
cellulose derivatives (CMC and HPMC), that surprisingly were found to be significantly
crystalline (cellulose II polymorph), allows the extraction of CNCs presenting a
different crystal organization (cellulose I polymorph). This further suggests that there
are specific parts of cellulose chains that remain insoluble during all the modification
process. This is indicative of the major difficulty in obtaining molecular dispersed
cellulose solutions.
During the studies, fundamental differences between the use of a small inorganic cation
of high charge density and a large organic cation with amphiphilic character were
found. Combining microscopic techniques, PT ssNMR and DLS it is possible to
conclude that the use of an amphiphilic cation leads to cellulose dissolution down to the
molecular level (or close to it) whereas this is not the case for the sodium ion.
Furthermore, the addition of certain additives of intermediate polarity to NaOH based
systems improves the dissolution efficiency. That dissolution into molecular solutions
provides good support for the view that cellulose molecules have both polar and
nonpolar regions and have a strong tendency to associate by hydrophobic interactions.
Dissolution and dope stability are found to be clearly influenced by the presence of
amphiphilic species. Moreover, we have seen that combining cellulose ionization (either

104
achieved by extreme pH or adsorption of ionic species) with the weakening of the
hydrophobic effect (for example by adding urea or thiourea) makes dissolution more
efficient. For the TBAH system, a high performance solvent, the presence of an
amphiphilic cation seems to be the key factor for an improved dissolution capacity; the
solvent capabilities can be controlled and even reversed, thus decreasing the solvent
capabilities, by the addition of salt (i.e. reducing the counterion entropy effect).
The dope stability of cellulose in aqueous TBAH can be reduced by adding β-
cyclodextrin (suggested to trap the amphiphilic cations of the solvent) which decreases
the concentration of free TBA+ cations in solution and thus dramatically decreases the
solubility of cellulose.
Acidic systems demonstrate good ability to dissolve cellulose, both in aqueous based
systems and in non-aqueous ones. Although efficient, severe degradation might occur
which can be a serious drawback for certain applications where a high degree of
polymerization is required. In these cases, alternative strategies should be considered to
prevent cellulose degradation such as the reduction of temperature or the addition of
different additives or co-solvents.
Finally we have discussed the influence of the solvent system on the properties of the
regenerated cellulosic materials. There are significant differences in morphology and
crystallinity of the precipitated materials depending on the solvent used. It is striking
that while the samples dissolved in NaOH exhibit a quite high crystallinity, with needle-
like crystallites observed in SEM and higher CrI estimated from XRD, the cellulose
samples obtained from NaOH/thiourea solutions show a decrease in crystallinity while
the materials from the TBAH solution lose considerably their crystallinity, presenting
flexible continuous wrinkled-film type morphology. Similarly, materials regenerated
from acidic solvents structurally tend to present smooth morphologies as expected for
materials with low crystallinity, which is indicative of the good dissolution level
achieved when these solvents are used.
The level of dissolution is expected to have implications on the properties of the
regenerated materials; while for TBAH the lack of crystallinity and high flexibility of
the regenerated materials indicate that dissolution progresses close to the molecular
level, in the case of the NaOH dissolution is not complete and stable cellulose
aggregates (crystallites) are still present in solution.
105
CHAPTER 5
References
[1] R.J. Moon, A. Martini, J. Nairn, J. Simonsen, J. Youngblood, Cellulose
nanomaterials review: structure, properties and nanocomposites, Chemical Society
Reviews, 40 (2011) 3941-3994.
[2] D. Klemm, B. Philipp, T. Heinze, U. Heinze, W. Wagenknecht, in: “Fundamentals
and analytical methods. Comprehensive Cellulose Chemistry (vol 1)”, Wiley - VCH,
Weinheim, (1998).
[3] C. Chang, L. Zhang, Cellulose-based hydrogels: Present status and application
prospects, Carbohydrate Polymers, 84 (2011) 40-53.
[4] X. Qiu, S. Hu, “Smart” Materials Based on Cellulose: A Review of the Preparations,
Properties, and Applications, Materials, 6 (2013) 738.
[5] V.K. Varshney, S. Naithani, Chemical Functionalization of Cellulose Derived from
Nonconventional Sources, in: S. Kalia, B.S. Kaith, I. Kaur (Eds.) Cellulose Fibers: Bio-
and Nano-Polymer Composites, Springer Berlin Heidelberg, 2011, pp. 43-60.
[6] B. Medronho, B. Lindman, Competing forces during cellulose dissolution: From
solvents to mechanisms, Curr. Opin. Colloid Interface Sci., 19 (2014) 32-40.
[7] J.T. Marsh, An introduction to the chemistry of cellulose, 2nd edn. Chapman &
Hall, London, (1942).
[8] H. Krässig, J. Schurz, R.G. Steadman, K. Schliefer, W. Albrecht, M. Mohring, H.
Schlosser, Cellulose, in: Ullmann's Encyclopedia of Industrial Chemistry, Wiley-VCH
Verlag GmbH & Co. KGaA, 2000.
[9] D. Klemm, B. Heublein, H.P. Fink, A. Bohn, Cellulose: Fascinating biopolymer and
sustainable raw material, Angewandte Chemie-International Edition, 44 (2005) 3358-
3393.
106
[10] N.T. Thuong, C. Hélène, Sequence-Specific Recognition and Modification of
Double-Helical DNA by Oligonucleotides, Angewandte Chemie International Edition in
English, 32 (1993) 666-690.
[11] B. Lindman, R.S. Dias, M.G. Miguel, M.C. Morán, D. Costa, Manipulation of
DNA by Surfactants, in: Highlights in Colloid Science, Wiley-VCH Verlag GmbH &
Co. KGaA, 2008, pp. 179-202.
[12] B. Lindman, G. Karlström, L. Stigsson, On the mechanism of dissolution of
cellulose, Journal of Molecular Liquids, 156 (2010) 76-81.
[13] B. Medronho, A. Romano, M.G. Miguel, L. Stigsson, B. Lindman, Rationalizing
cellulose (in)solubility: reviewing basic physicochemical aspects and role of
hydrophobic interactions, Cellulose, 19 (2012) 581-587.
[14] M. Bergenstråhle, J. Wohlert, M.E. Himmel, J.W. Brady, Simulation studies of the
insolubility of cellulose, Carbohydrate Research, 345 (2010) 2060-2066.
[15] A. O'Sullivan, Cellulose: the structure slowly unravels, Cellulose, 4 (1997) 173-
207.
[16] R.A. Festucci-Buselli, W.C. Otoni, C.P. Joshi, Structure, organization, and
functions of cellulose synthase complexes in higher plants, Brazilian Journal of Plant
Physiology, 19 (2007) 1-13.
[17] L. Tim, Cellulose Solvents ? Remarkable History, Bright Future, in: Cellulose
Solvents: For Analysis, Shaping and Chemical Modification, American Chemical
Society, 2010, pp. 3-54.
[18] D. Klemm, B. Heublein, H.-P. Fink, A. Bohn, Cellulose: Fascinating Biopolymer
and Sustainable Raw Material, Angewandte Chemie International Edition, 44 (2005)
3358-3393.
[19] S. Sen, J.D. Martin, D.S. Argyropoulos, Review of Cellulose Non-Derivatizing
Solvent Interactions with Emphasis on Activity in Inorganic Molten Salt Hydrates, ACS
Sustainable Chemistry & Engineering, 1 (2013) 858-870.
[20] B. Medronho, B. Lindman, Competing forces during cellulose dissolution: From
solvents to mechanisms, Current Opinion in Colloid & Interface Science, 19 (2014) 32-
40.
[21] O. Biermann, E. Hädicke, S. Koltzenburg, F. Müller-Plathe, Hydrophilicity and
Lipophilicity of Cellulose Crystal Surfaces, Angewandte Chemie International Edition,
40 (2001) 3822-3825.
107
[22] C. Yamane, T. Aoyagi, M. Ago, K. Sato, K. Okajima, T. Takahashi, Two Different
Surface Properties of Regenerated Cellulose due to Structural Anisotropy, Polym. J, 38
(2006) 819-826.
[23] H. Miyamoto, M. Umemura, T. Aoyagi, C. Yamane, K. Ueda, K. Takahashi,
Structural reorganization of molecular sheets derived from cellulose II by molecular
dynamics simulations, Carbohyd Res, 344 (2009) 1085-1094.
[24] M. Bergenstrahle, K. Mazeau, L.A. Berglund, Molecular modeling of interfaces
between cellulose crystals and surrounding molecules: Effects of caprolactone surface
grafting, Eur Polym J, 44 (2008) 3662-3669.
[25] A.S. Gross, J.W. Chu, On the Molecular Origins of Biomass Recalcitrance: The
Interaction Network and Solvation Structures of Cellulose Microfibrils, J Phys Chem B,
114 (2010) 13333-13341.
[26] H.M. Cho, A.S. Gross, J.-W. Chu, Dissecting Force Interactions in Cellulose
Deconstruction Reveals the Required Solvent Versatility for Overcoming Biomass
Recalcitrance, J Am Chem Soc, 133 (2011) 14033-14041.
[27] B. Medronho, B. Lindman, Brief overview on cellulose dissolution/regeneration
interactions and mechanisms, Advances in Colloid and Interface Science.
[28] D. Klemm, B. Philipp, T. Heinze, U. Heinze, W. Wagenknecht, Fundamentals and
Analytical Methods. Comprehensive Cellulose Chemistry, Wiley-VCH Verlag GmbH
& Co. KGaA, 1998.
[29] F.J. Kolpak, J. Blackwell, The Structure of Regenerated Cellulose,
Macromolecules, 8 (1975) 563-564.
[30] S. Raymond, A. Kvick, H. Chanzy, The Structure of Cellulose II: A Revisit,
Macromolecules, 28 (1995) 8422-8425.
[31] M. Takai, J.R. Colvin, Mechanism of transition between cellulose I and cellulose II
during mercerization, Journal of Polymer Science: Polymer Chemistry Edition, 16
(1978) 1335-1342.
[32] T. Okano, A. Sarko, Mercerization of cellulose. II. Alkali–cellulose intermediates
and a possible mercerization mechanism, Journal of Applied Polymer Science, 30
(1985) 325-332.
[33] S. Bo, T. Vasily, W. James, Biopolymers, Processing, and Biodegradation, in:
Renewable and Sustainable Polymers, American Chemical Society, 2011, pp. 117-132.
[34] M. Poletto, A.J. Zattera, V. Pistor, Structural Characteristics and Thermal
Properties of Native Cellulose, 2013.

108
[35] J.T. Marsh, An Introduction to the Chemistry of Cellulose, 2nd ed., Chapman &
Hall, London, 1942.
[36] S.M. Hudson, J.A. Cuculo, The Solubility of Unmodified Cellulose: A Critique of
the Literature, Journal of Macromolecular Science, Part C, 18 (1980) 1-82.
[37] T. Heinze, A. Koschella, Solvents applied in the field of cellulose chemistry: a
mini review, Polímeros, 15 (2005) 84-90.
[38] T. Huber, J. Müssig, O. Curnow, S. Pang, S. Bickerton, M. Staiger, A critical
review of all-cellulose composites, J Mater Sci, 47 (2012) 1171-1186.
[39] F. Fu, Q. Yang, J. Zhou, H. Hu, B. Jia, L. Zhang, Structure and Properties of
Regenerated Cellulose Filaments Prepared from Cellulose Carbamate–NaOH/ZnO
Aqueous Solution, ACS Sustainable Chemistry & Engineering, 2 (2014) 2604-2612.
[40] E. Schweizer, Das Kupferoxyd-Ammoniak, ein Auflösungsmittel für die
Pflanzenfaser, Journal für Praktische Chemie, 72 (1857) 109-111.
[41] I. ASTM, Standard Test Method for Viscosity of Cellulose by Cuprammonium
Ball Fall, in, 2003, pp. 7 pages.
[42] K. Saalwächter, W. Burchard, P. Klüfers, G. Kettenbach, P. Mayer, D. Klemm, S.
Dugarmaa, Cellulose Solutions in Water Containing Metal Complexes†,
Macromolecules, 33 (2000) 4094-4107.
[43] W.B. Achwal, A.B. Gupta, Studies in a modified cadoxen solvent, Die
Angewandte Makromolekulare Chemie, 2 (1968) 190-203.
[44] K. Kamide, K. Okajima, K. Kowsaka, Dissolution of Natural Cellulose into
Aqueous Alkali Solution: Role of Super-Molecular Structure of Cellulose, Polym J, 24
(1992) 71-86.
[45] T. Yamashiki, T. Matsui, M. Saitoh, K. Okajima, K. Kamide, T. Sawada,
Characterisation of cellulose treated by the steam explosion method. Part 1: Influence of
cellulose resources on changes in morphology, degree of polymerisation, solubility and
solid structure, British Polymer Journal, 22 (1990) 73-83.
[46] T. Yamashiki, K. Kamide, K. Okajima, K. Kowsaka, T. Matsui, H. Fukase, Some
Characteristic Features of Dilute Aqueous Alkali Solutions of Specific Alkali
Concentration (2.5 mol l-1) Which Possess Maximum Solubility Power against
Cellulose, Polym J, 20 (1988) 447-457.
[47] L.H. Bock, Water-Soluble Cellulose Ethers, Industrial & Engineering Chemistry,
29 (1937) 985-987.
109
[48] L. Yan, Z. Gao, Dissolving of cellulose in PEG/NaOH aqueous solution, Cellulose,
15 (2008) 789-796.
[49] J. Cai, L. Zhang, Rapid Dissolution of Cellulose in LiOH/Urea and NaOH/Urea
Aqueous Solutions, Macromolecular Bioscience, 5 (2005) 539-548.
[50] L. Zhang, D. Ruan, S. Gao, Dissolution and regeneration of cellulose in
NaOH/thiourea aqueous solution, Journal of Polymer Science Part B: Polymer Physics,
40 (2002) 1521-1529.
[51] S. Fischer, H. Leipner, K. Thümmler, E. Brendler, J. Peters, Inorganic Molten Salts
as Solvents for Cellulose, Cellulose, 10 (2003) 227-236.
[52] M. Hattori, Y. Shimaya, M. Saito, Solubility and Dissolved Cellulose in Aqueous
Calcium- and Sodium-Thiocyanate Solution, Polym J, 30 (1998) 49-55.
[53] X. Lu, X. Shen, Solubility of bacteria cellulose in zinc chloride aqueous solutions,
Carbohydrate Polymers, 86 (2011) 239-244.
[54] S. Kuga, The porous structure of cellulose gel regenerated from calcium
thiocyanate solution, Journal of Colloid and Interface Science, 77 (1980) 413-417.
[55] H. Leipner, S. Fischer, E. Brendler, W. Voigt, Structural changes of cellulose
dissolved in molten salt hydrates, Macromolecular Chemistry and Physics, 201 (2000)
2041-2049.
[56] O. El Seoud, T. Heinze, Organic Esters of Cellulose: New Perspectives for Old
Polymers, in: T. Heinze (Ed.) Polysaccharides I, Springer Berlin Heidelberg, 2005, pp.
103-149.
[57] A. Isogai, A. Ishizu, J. Nakano, Dissolution mechanism of cellulose in SO2–
amine–dimethylsulfoxide, Journal of Applied Polymer Science, 33 (1987) 1283-1290.
[58] T. Heinze, R. Dicke, A. Koschella, A.H. Kull, E.-A. Klohr, W. Koch, Effective
preparation of cellulose derivatives in a new simple cellulose solvent, Macromolecular
Chemistry and Physics, 201 (2000) 627-631.
[59] C.L. McCormick, D.K. Lichatowich, Homogeneous solution reactions of cellulose,
chitin, and other polysaccharides to produce controlled-activity pesticide systems,
Journal of Polymer Science: Polymer Letters Edition, 17 (1979) 479-484.
[60] K.E. Perepelkin, Lyocell fibres based on direct dissolution of cellulose in N-
methylmorpholine N-oxide: Development and prospects, Fibre Chem, 39 (2007) 163-
172.
[61] R.P. Swatloski, S.K. Spear, J.D. Holbrey, R.D. Rogers, Dissolution of Cellose with
Ionic Liquids, Journal of the American Chemical Society, 124 (2002) 4974-4975.
110
[62] A. Pinkert, K.N. Marsh, S. Pang, M.P. Staiger, Ionic Liquids and Their Interaction
with Cellulose, Chemical Reviews, 109 (2009) 6712-6728.
[63] H. Zhang, J. Wu, J. Zhang, J. He, 1-Allyl-3-methylimidazolium Chloride Room
Temperature Ionic Liquid: A New and Powerful Nonderivatizing Solvent for Cellulose,
Macromolecules, 38 (2005) 8272-8277.
[64] Y. Fukaya, K. Hayashi, M. Wada, H. Ohno, Cellulose dissolution with polar ionic
liquids under mild conditions: required factors for anions, Green Chemistry, 10 (2008)
44-46.
[65] Y. Fukaya, A. Sugimoto, H. Ohno, Superior Solubility of Polysaccharides in Low
Viscosity, Polar, and Halogen-Free 1,3-Dialkylimidazolium Formates,
Biomacromolecules, 7 (2006) 3295-3297.
[66] N. Sun, M. Rahman, Y. Qin, M.L. Maxim, H. Rodriguez, R.D. Rogers, Complete
dissolution and partial delignification of wood in the ionic liquid 1-ethyl-3-
methylimidazolium acetate, Green Chemistry, 11 (2009) 646-655.
[67] D.M. Phillips, L.F. Drummy, D.G. Conrady, D.M. Fox, R.R. Naik, M.O. Stone,
P.C. Trulove, H.C. De Long, R.A. Mantz, Dissolution and Regeneration of Bombyx
mori Silk Fibroin Using Ionic Liquids, Journal of the American Chemical Society, 126
(2004) 14350-14351.
[68] Y. Zhao, X. Liu, J. Wang, S. Zhang, Effects of Cationic Structure on Cellulose
Dissolution in Ionic Liquids: A Molecular Dynamics Study, ChemPhysChem, 13 (2012)
3126-3133.
[69] H. Garcia, R. Ferreira, M. Petkovic, J.L. Ferguson, M.C. Leitao, H.Q.N.
Gunaratne, K.R. Seddon, L.P.N. Rebelo, C. Silva Pereira, Dissolution of cork
biopolymers in biocompatible ionic liquids, Green Chemistry, 12 (2010) 367-369.
[70] F.P. Burns, P.-A. Themens, K. Ghandi, Assessment of phosphonium ionic liquid-
dimethylformamide mixtures for dissolution of cellulose, Composite Interfaces, 21
(2013) 59-73.
[71] H. Sixta, A. Michud, L. Hauru, S. Asaadi, Y. Ma, A.W.T. King, I. Kilpeläinen, M.
Hummel, Ioncell-F: A High-strength regenerated cellulose fibre, Nordic Pulp and Paper
Research Journal, 30 (2015) 43-57.
[72] A. MICHUD, A. King, A. Parviainen, H. Sixta, L. HAURU, M. Hummel, I.
KILPELÄINEN, Process for the production of shaped cellulose articles (WO
2014162062 A1), in, 2014.
111
[73] E. Gaidamauskas, E. Norkus, E. Butkus, D.C. Crans, G. Grincienė, Deprotonation
of β-cyclodextrin in alkaline solutions, Carbohydrate Research, 344 (2009) 250-254.
[74] C. Yamane, H. Miyamoto, D. Hayakawa, K. Ueda, Folded-chain structure of
cellulose II suggested by molecular dynamics simulation, Carbohydrate Research, 379
(2013) 30-37.
[75] D.L. Morgado, E. Frollini, Thermal decomposition of mercerized linter cellulose
and its acetates obtained from a homogeneous reaction, Polímeros, 21 (2011) 111-117.
[76] B. Morgenstern, H.-W. Kammer, On the particulate structure of cellulose solutions,
Polymer, 40 (1999) 1299-1304.
[77] D.M. Rein, R. Khalfin, N. Szekely, Y. Cohen, True molecular solutions of natural
cellulose in the binary ionic liquid-containing solvent mixtures, Carbohydrate Polymers,
112 (2014) 125-133.
[78] K. Le, R. Sescousse, T. Budtova, Influence of water on cellulose-EMIMAc
solution properties: a viscometric study, Cellulose, 19 (2012) 45-54.
[79] H. Liu, K.L. Sale, B.M. Holmes, B.A. Simmons, S. Singh, Understanding the
Interactions of Cellulose with Ionic Liquids: A Molecular Dynamics Study, The Journal
of Physical Chemistry B, 114 (2010) 4293-4301.
[80] E. Wernersson, B. Stenqvist, M. Lund, The mechanism of cellulose solubilization
by urea studied by molecular simulation, Cellulose, (2015) 1-11.
[81] E.A. Grulke, Solubility parameter values. In: Brandrup J, Immergut EH, Grulke
EA,, editors, 4th ed. Polymer handbook, vol. 7. New York, NY: Wiley, (1999).
[82] K. Holmberg, B. Jonsson, B. Kronberg, B. Lindman, Surfactants and polymers in
aqueous solution. Wiley, Hoboken, (2002).
[83] J.B. Taylor, The water solubilities and heats of solution of short chain cellulosic
oligosaccharides, Transactions of the Faraday Society, 53 (1957) 1198-1203.
[84] A. Brandt, J. Grasvik, J.P. Hallett, T. Welton, Deconstruction of lignocellulosic
biomass with ionic liquids, Green Chem, 15 (2013) 550-583.
[85] M. Bergenstrahle, J. Wohlert, M.E. Himmel, J.W. Brady, Simulation studies of the
insolubility of cellulose, Carbohyd Res, 345 (2010) 2060-2066.
[86] A.C. O'Sullivan, Cellulose: the structure slowly unravels, Cellulose, 4 (1997) 173-
208.
[87] R.H. Atalla, D.L. Vanderhart, Native Cellulose - a Composite of 2 Distinct
Crystalline Forms, Science, 223 (1984) 283-285.

112
[88] S.K. Cousins, R.M. Brown, Cellulose-I Microfibril Assembly - Computational
Molecular Mechanics Energy Analysis Favors Bonding by Vanderwaals Forces as the
Initial Step in Crystallization, Polymer, 36 (1995) 3885-3888.
[89] N. Isobe, K. Noguchi, Y. Nishiyama, S. Kimura, M. Wada, S. Kuga, Role of urea
in alkaline dissolution of cellulose, Cellulose, 20 (2013) 97-103.
[90] C. Tanford, Isothermal Unfolding of Globular Proteins in Aqueous Urea Solutions,
J Am Chem Soc, 86 (1964) 2050-&.
[91] M.C. Stumpe, H. Grubmüller, Polar or Apolar—The Role of Polarity for Urea-
Induced Protein Denaturation, PLoS Computational Biology, 4 (2008) e1000221.
[92] H.J.Y. El-Aila, Effect of urea and salt on micelle formation of zwitterionic
surfactants, J Surfact Deterg, 8 (2005) 165-168.
[93] T. Koishi, K. Yasuoka, X.C. Zeng, S. Fujikawa, Molecular dynamics simulations
of urea-water binary droplets on flat and pillared hydrophobic surfaces, Faraday
Discuss, 146 (2010) 185-193.
[94] P. Xiu, Z.X. Yang, B. Zhou, P. Das, H.P. Fang, R.H. Zhou, Urea-Induced Drying
of Hydrophobic Nanotubes: Comparison of Different Urea Models, J Phys Chem B, 115
(2011) 2988-2994.
[95] B. Xiong, P. Zhao, K. Hu, L. Zhang, G. Cheng, Dissolution of cellulose in aqueous
NaOH/urea solution: role of urea, Cellulose, in press. (2014) DOI: 10.1007/s10570-
10014-10221-10577.
[96] M. Bergenstrahle-Wohlert, L.A. Berglund, J.W. Brady, P.T. Larsson, P.O.
Westlund, J. Wohlert, Concentration enrichment of urea at cellulose surfaces: results
from molecular dynamics simulations and NMR spectroscopy, Cellulose, 19 (2012) 1-
12.
[97] A.J. Holding, M. Heikkilä, I. Kilpeläinen, A.W.T. King, Amphiphilic and Phase-
Separable Ionic Liquids for Biomass Processing, ChemSusChem, 7 (2014) 1422-1434.
[98] C.-Z. Liu, F. Wang, A.R. Stiles, C. Guo, Ionic liquids for biofuel production:
Opportunities and challenges, Applied Energy, 92 (2012) 406-414.
[99] B. Mostofian, J.C. Smith, X.L. Cheng, Simulation of a cellulose fiber in ionic
liquid suggests a synergistic approach to dissolution, Cellulose, 21 (2014) 983-997.
[100] N. Isobe, S. Kimura, M. Wada, S. Kuga, Mechanism of cellulose gelation from
aqueous alkali-urea solution, Carbohydrate Polymers, 89 (2012) 1298-1300.
[101] P.H. Hermans, Degree of Lateral Order in Various Rayons as Deduced from X-
Ray Measurements, J Polym Sci, 4 (1949) 145-151.
113
[102] J. Hayashi, S. Masuda, S. Watanabe, Plane Lattice Structure in Amorphous
Region of Cellulose Fibers, Nippon Kagaku Kaishi, (1974) 948-954.
[103] A. Ostlund, A. Idstrom, C. Olsson, P.T. Larsson, L. Nordstierna, Modification of
crystallinity and pore size distribution in coagulated cellulose films, Cellulose, 20
(2013) 1657-1667.
[104] D.M. Rein, R. Khalfin, Y. Cohen, Cellulose as a novel amphiphilic coating for
oil-in-water and water-in-oil dispersions, J Colloid Interf Sci, 386 (2012) 456-463.
[105] H. Nawaz, P.A.R. Pires, O.A. El Seoud, Kinetics and mechanism of imidazole-
catalyzed acylation of cellulose in LiCl/N,N-dimethylacetamide, Carbohyd Polym, 92
(2013) 997-1005.
[106] L.K.J. Hauru, M. Hummel, A.W.T. King, I. Kilpelainen, H. Sixta, Role of Solvent
Parameters in the Regeneration of Cellulose from Ionic Liquid Solutions,
Biomacromolecules, 13 (2012) 2896-2905.
[107] R. Kargl, T. Mohan, M. Bracic, M. Kulterer, A. Doliska, K. Stana-Kleinschek, V.
Ribitsch, Adsorption of Carboxymethyl Cellulose on Polymer Surfaces: Evidence of a
Specific Interaction with Cellulose, Langmuir, 28 (2012) 11440-11447.
[108] J. Narewska, L. Lassila, P. Fardim, Preparation and characterization of new
mouldable cellulose-AESO biocomposites, Cellulose, 21 (2014) 1769-1780.
[109] X. Hao, W. Shen, Z. Chen, J. Zhu, L. Feng, Z. Wu, P. Wang, X. Zeng, T. Wu,
Self-assembled nanostructured cellulose prepared by a dissolution and regeneration
process using phosphoric acid as a solvent, Carbohydrate Polymers, 123 (2015) 297-
304.
[110] M. Ioelovich, Study of Cellulose Interaction with Concentrated Solutions of
Sulfuric Acid, ISRN Chemical Engineering, 2012 (2012) 7.
[111] M. Martins, E. Teixeira, A. Corrêa, M. Ferreira, L.C. Mattoso, Extraction and
characterization of cellulose whiskers from commercial cotton fibers, J Mater Sci, 46
(2011) 7858-7864.
[112] R. Carlton, Polarized Light Microscopy, in: Pharmaceutical Microscopy,
Springer New York, 2011, pp. 7-64.
[113] J.R. Kuhn, Z. Wu, M. Poenie, Modulated polarization microscopy: a promising
new approach to visualizing cytoskeletal dynamics in living cells, Biophysical Journal,
80 (2001) 972-985.
114
[114] R.J. Maude, W. Buapetch, K. Silamut, A Simplified, Low-Cost Method for
Polarized Light Microscopy, The American Journal of Tropical Medicine and Hygiene,
81 (2009) 782-783.
[115] S. Sparenga, The Importance of Polarized Light Microscopy in the Analytical
Setting, Microscopy and Microanalysis, 14 (2008) 1032-1033.
[116] R. Oldenbourg, Polarized Light Microscopy: Principles and Practice, Cold Spring
Harbor Protocols, 2013 (2013) 1023-1036.
[117] Y. Lab, Basics of Polarizing Microscopy, in: Frontiers in Biophysical Imaging,
University of California, Berkeley, 2012.
[118] R. Egerton, The Scanning Electron Microscope, in: Physical Principles of
Electron Microscopy, Springer US, 2005, pp. 125-153.
[119] R. Egerton, An Introduction to Microscopy, in: Physical Principles of Electron
Microscopy, Springer US, 2005, pp. 1-25.
[120] R.J. Beane, Using the Scanning Electron Microscope for Discovery Based
Learning in Undergraduate Courses, Journal of Geoscience Education, 52 (2004) 250-
253.
[121] R.E. Dinnebier, K. Friese, Modern XRD Methods in Mineralogy, in: P. Tropper
(Ed.) Introduction to the Mineralogical Sciences, Eolss Publishers, Oxford, 2003.
[122] M. Birkholz, Principles of X-ray Diffraction, in: Thin Film Analysis by X-Ray
Scattering, Wiley-VCH Verlag GmbH & Co. KGaA, 2006, pp. 1-40.
[123] L. Segal, J.J. Creely, A.E. Martin, C.M. Conrad, An Empirical Method for
Estimating the Degree of Crystallinity of Native Cellulose Using the X-Ray
Diffractometer, Textile Research Journal, 29 (1959) 786-794.
[124] R.T. O'Connor, Instrumental Analysis of Cotton Cellulose and Modified Cotton
Cellulose, Marcel Dekker Incorporated, 1972.
[125] S.L. Upstone, Ultraviolet/Visible Light Absorption Spectrophotometry in Clinical
Chemistry, in: Encyclopedia of Analytical Chemistry, John Wiley & Sons, Ltd, 2006.
[126] J.S.S.d. Melo, J. Pina, F.B. Dias, A.L. Maçanita, Experimental Techniques in
Photochemistry (Characterisation of Singlet and Triplet Excited States), in: P. Douglas,
H.D. Burrows, R. Evans (Eds.) Applied Photochemistry, Springer, London, 2013.
[127] B. Wardle, Principles and Applications of Photochemistry, John Wiley & Sons,
Ltd., Manchester, 2009.
[128] J.W. Goodwin, R.W. Hughes, Chapter 1 Introduction, in: Rheology for Chemists:
An Introduction (2), The Royal Society of Chemistry, 2008, pp. 1-13.
115
[129] A.L. Motyka, An Introduction to Rheology with an Emphasis on Application to
Dispersions. , Journal of Chemical Education, 374-null ( 1996) 73 (74).
[130] K. Miyazaki, H.M. Wyss, D.A. Weitz, D.R. Reichman, Nonlinear viscoelasticity
of metastable complex fluids, EPL (Europhysics Letters), 75 (2006) 915.
[131] H. Winter, M. Mours, Rheology of Polymers Near Liquid-Solid Transitions, in:
Neutron Spin Echo Spectroscopy Viscoelasticity Rheology, Springer Berlin Heidelberg,
1997, pp. 165-234.
[132] B.H. Stuart, Introduction, in: Infrared Spectroscopy: Fundamentals and
Applications, John Wiley & Sons, Ltd, 2005, pp. 1-13.
[133] T.N. Shaikh, S.A. Agrawal, Qualitative and Quantitative Characterization of
Textile Material by Fourier Transform Infra-Red, International Journal of Innovative
Research in Science, Engineering and Technology, 3 (2014) 8496-8502.
[134] B.H. Stuart, Experimental Methods, in: Infrared Spectroscopy: Fundamentals and
Applications, John Wiley & Sons, Ltd, 2005, pp. 15-44.
[135] R.T. O'Connor, E.F. DuPré, D. Mitcham, Applications of Infrared Absorption
Spectroscopy to Investigations of Cotton and Modified Cottons: Part I: Physical and
Crystalline Modifications and Oxidation, Textile Research Journal, 28 (1958) 382-392.
[136] M.L. Nelson, R.T. O'Connor, Relation of certain infrared bands to cellulose
crystallinity and crystal lattice type. Part II. A new infrared ratio for estimation of
crystallinity in celluloses I and II, Journal of Applied Polymer Science, 8 (1964) 1325-
1341.
[137] J. Široký, R. Blackburn, T. Bechtold, J. Taylor, P. White, Attenuated total
reflectance Fourier-transform Infrared spectroscopy analysis of crystallinity changes in
lyocell following continuous treatment with sodium hydroxide, Cellulose, 17 (2010)
103-115.
[138] M. Poletto, V. Pistor, R.M.C. Santana, A.J. Zattera, Materials produced from
plant biomass: part II: evaluation of crystallinity and degradation kinetics of cellulose,
Materials Research, 15 (2012) 421-427.
[139] F.G. Hurtubise, H. Krassig, Classification of Fine Structural Characteristics in
Cellulose by Infared Spectroscopy. Use of Potassium Bromide Pellet Technique,
Analytical Chemistry, 32 (1960) 177-181.
[140] H. Günther, Introduction, in: NMR Spectroscopy: Basic Principles, Concepts,
and Applications in Chemistry, Wiley-VCH Verlag GmbH & Co. KGaA, 2013.
116
[141] C.S. Clendinen, B. Lee-McMullen, C.M. Williams, G.S. Stupp, K. Vandenborne,
D.A. Hahn, G.A. Walter, A.S. Edison, 13C NMR Metabolomics: Applications at
Natural Abundance, Analytical Chemistry, 86 (2014) 9242-9250.
[142] K. Kamide, K. Okajima, K. Kowsaka, T. Matsui, CP/MASS 13C NMR Spectra of
Cellulose Solids: An Explanation by the Intramolecular Hydrogen Bond Concept,
Polym J, 17 (1985) 701-706.
[143] A. Isogai, M. Usuda, T. Kato, T. Uryu, R.H. Atalla, Solid-state CP/MAS carbon-
13 NMR study of cellulose polymorphs, Macromolecules, 22 (1989) 3168-3172.
[144] S. Gustavsson, L. Alves, B. Lindman, D. Topgaard, Polarization transfer solid-
state NMR: a new method for studying cellulose dissolution, RSC Advances, 4 (2014)
31836-31839.
[145] W. Tscharnuter, Photon Correlation Spectroscopy in Particle Sizing, in:
Encyclopedia of Analytical Chemistry, John Wiley & Sons, Ltd, 2006.
[146] B.J. Berne, R. Pecora, Dynamic Light Scattering: With Applications to
Chemistry, Biology, and Physics, John Wiley & Sons, Inc., New York, 2000.
[147] R. Pecora, Dynamic Light Scattering Measurement of Nanometer Particles in
Liquids, J Nanopart Res, 2 (2000) 123-131.
[148] I.O.f. Standardization, ISO 22412:2008 Particle size analysis -- Dynamic light
scattering (DLS), in, 2008.
[149] L. Schulz, B. Seger, W. Burchard, Structures of cellulose in solution,
Macromolecular Chemistry and Physics, 201 (2000) 2008-2022.
[150] K. Kamide, 2 - Characterization of Molecular Structure of Cellulose Derivatives,
in: K. Kamide (Ed.) Cellulose and Cellulose Derivatives, Elsevier, Amsterdam, 2005,
pp. 25-188.
[151] T. Heinze, A. Koschella, T. Liebert, V. Harabagiu, S. Coseri, Cellulose:
Chemistry of Cellulose Derivatization, in: P. Navard (Ed.) The European
Polysaccharide Network of Excellence (EPNOE), Springer Vienna, 2013, pp. 283-327.
[152] C.G. Lopez, S.E. Rogers, R.H. Colby, P. Graham, J.T. Cabral, Structure of
sodium carboxymethyl cellulose aqueous solutions: A SANS and rheology study,
Journal of Polymer Science Part B: Polymer Physics, 53 (2015) 492-501.
[153] L. Xiquan, Q. Tingzhu, Q. Shaoqui, Kinetics of the carboxymethylation of
cellulose in the isopropyl alcohol system, Acta Polymerica, 41 (1990) 220-222.
117
[154] L. Alves, B. Medronho, F.E. Antunes, M.P. Fernández-García, J. Ventura, J.P.
Araújo, A. Romano, B. Lindman, Unusual extraction and characterization of
nanocrystalline cellulose from cellulose derivatives, Journal of Molecular Liquids.
[155] B.L. Peng, N. Dhar, H.L. Liu, K.C. Tam, Chemistry and applications of
nanocrystalline cellulose and its derivatives: A nanotechnology perspective, The
Canadian Journal of Chemical Engineering, 89 (2011) 1191-1206.
[156] J. Araki, S. Kuga, Effect of Trace Electrolyte on Liquid Crystal Type of Cellulose
Microcrystals, Langmuir, 17 (2001) 4493-4496.
[157] V. Favier, H. Chanzy, J.Y. Cavaille, Polymer Nanocomposites Reinforced by
Cellulose Whiskers, Macromolecules, 28 (1995) 6365-6367.
[158] M.A.S. Azizi Samir, F. Alloin, A. Dufresne, Review of Recent Research into
Cellulosic Whiskers, Their Properties and Their Application in Nanocomposite Field,
Biomacromolecules, 6 (2005) 612-626.
[159] M.S. Jahan, A. Saeed, Z. He, Y. Ni, Jute as raw material for the preparation of
microcrystalline cellulose, Cellulose, 18 (2011) 451-459.
[160] F. Peng, J.-L. Ren, F. Xu, J. Bian, P. Peng, R.-C. Sun, Comparative Study of
Hemicelluloses Obtained by Graded Ethanol Precipitation from Sugarcane Bagasse,
Journal of Agricultural and Food Chemistry, 57 (2009) 6305-6317.
[161] R. Sun, X.F. Sun, G.Q. Liu, P. Fowler, J. Tomkinson, Structural and
physicochemical characterization of hemicelluloses isolated by alkaline peroxide from
barley straw, Polymer International, 51 (2002) 117-124.
[162] J.L. Ren, R.C. Sun, C.F. Liu, Z.Y. Chao, W. Luo, Two-step preparation and
thermal characterization of cationic 2-hydroxypropyltrimethylammonium chloride
hemicellulose polymers from sugarcane bagasse, Polymer Degradation and Stability, 91
(2006) 2579-2587.
[163] M. Kačuráková, A. Ebringerová, J. Hirsch, Z. Hromádková, Infrared study of
arabinoxylans, Journal of the Science of Food and Agriculture, 66 (1994) 423-427.
[164] Z. Liu, Y. Ni, P. Fatehi, A. Saeed, Isolation and cationization of hemicelluloses
from pre-hydrolysis liquor of kraft-based dissolving pulp production process, Biomass
and Bioenergy, 35 (2011) 1789-1796.
[165] C.Y. Liang, Instrumental Analysis of Cotton Cellulose and Modified Cotton
Cellulose, in: R.T. O'Connor (Ed.), Marcell Dekker Ink., New York, 1972, pp. 59.
[166] A. Isogai, R.H. Atalla, Dissolution of Cellulose in Aqueous NaOH Solutions,
Cellulose, 5 (1998) 309-319.
118
[167] W. Wei, X. Wei, G. Gou, M. Jiang, X. Xu, Y. Wang, D. Hui, Z. Zhou, Improved
dissolution of cellulose in quaternary ammonium hydroxide by adjusting temperature,
RSC Advances, 5 (2015) 39080-39083.
[168] P. Langan, Y. Nishiyama, H. Chanzy, X-ray Structure of Mercerized Cellulose II
at 1 Å Resolution, Biomacromolecules, 2 (2001) 410-416.
[169] C.J. Garvey, I.H. Parker, G.P. Simon, On the Interpretation of X-Ray Diffraction
Powder Patterns in Terms of the Nanostructure of Cellulose I Fibres, Macromolecular
Chemistry and Physics, 206 (2005) 1568-1575.
[170] N. Luo, Y. Lv, D. Wang, J. Zhang, J. Wu, J. He, J. Zhang, Direct visualization of
solution morphology of cellulose in ionic liquids by conventional TEM at room
temperature, Chemical Communications, 48 (2012) 6283-6285.
[171] M. Wada, Y. Nishiyama, G. Bellesia, T. Forsyth, S. Gnanakaran, P. Langan,
Neutron crystallographic and molecular dynamics studies of the structure of ammonia-
cellulose I: rearrangement of hydrogen bonding during the treatment of cellulose with
ammonia, Cellulose, 18 (2011) 191-206.
[172] J. Keeler, Understanding NMR Spectroscopy, Wiley, 2005.
[173] M.J. Duer, Introduction to Solid-State NMR Spectroscopy, Blackwell Publishing
Ltd, Oxford, 2004.
[174] K. Kamida, K. Okajima, T. Matsui, K. Kowsaka, Study on the Solubility of
Cellulose in Aqueous Alkali Solution by Deuteration IR and 13C NMR, Polym J, 16
(1984) 857-866.
[175] J.C. Gast, R.H. Atalla, R.D. McKelvey, The 13c-n.m.r. spectra of the xylo- and
cello-oligosaccharides, Carbohydrate Research, 84 (1980) 137-146.
[176] W.L. Earl, D.L. VanderHart, Observations by high-resolution carbon-13 nuclear
magnetic resonance of cellulose I related to morphology and crystal structure,
Macromolecules, 14 (1981) 570-574.
[177] A. Nowacka, P.C. Mohr, J. Norrman, R.W. Martin, D. Topgaard, Polarization
Transfer Solid-State NMR for Studying Surfactant Phase Behavior, Langmuir, 26
(2010) 16848-16856.
[178] A. Nowacka, N.A. Bongartz, O.H.S. Ollila, T. Nylander, D. Topgaard, Signal
intensities in 1H–13C CP and INEPT MAS NMR of liquid crystals, Journal of
Magnetic Resonance, 230 (2013) 165-175.
119
[179] A. Nowacka, S. Douezan, L. Wadso, D. Topgaard, E. Sparr, Small polar
molecules like glycerol and urea can preserve the fluidity of lipid bilayers under dry
conditions, Soft Matter, 8 (2012) 1482-1491.
[180] E. Hellstrand, A. Nowacka, D. Topgaard, S. Linse, E. Sparr, Membrane Lipid Co-
Aggregation with α-Synuclein Fibrils, PLoS ONE, 8 (2013) e77235.
[181] S. Björklund, T. Ruzgas, A. Nowacka, I. Dahi, D. Topgaard, E. Sparr, J.
Engblom, Skin Membrane Electrical Impedance Properties under the Influence of a
Varying Water Gradient, Biophysical Journal, 104 (2013) 2639-2650.
[182] J. Schaefer, E.O. Stejskal, R. Buchdahl, High-Resolution Carbon-13 Nuclear
Magnetic Resonance Study of Some Solid, Glassy Polymers, Macromolecules, 8 (1975)
291-296.
[183] L. Alves, B. Medronho, F.E. Antunes, D. Topgaard, B. Lindman, The dissolution
state of cellulose in aqueous based systems. 1. Alkaline solvents in: Manuscript in
preparation, 2015.
[184] D.L. VanderHart, R.H. Atalla, Studies of microstructure in native celluloses using
solid-state carbon-13 NMR, Macromolecules, 17 (1984) 1465-1472.
[185] H. Kono, T. Erata, M. Takai, Determination of the Through-Bond
Carbon−Carbon and Carbon−Proton Connectivities of the Native Celluloses in the Solid
State, Macromolecules, 36 (2003) 5131-5138.
[186] J. Kunze, H.-P. Fink, Structural Changes and Activation of Cellulose by Caustic
Soda Solution with Urea, Macromolecular Symposia, 223 (2005) 175-188.
[187] M.E. Bos, Encyclopedia of Reagents for Organic Synthesis, Wiley, 2004.
[188] F. Porro, O. Bédué, H. Chanzy, L. Heux, Solid-State 13C NMR Study of
Na−Cellulose Complexes, Biomacromolecules, 8 (2007) 2586-2593.
[189] B. Medronho, A. Romano, M. Miguel, L. Stigsson, B. Lindman, Rationalizing
cellulose (in)solubility: reviewing basic physicochemical aspects and role of
hydrophobic interactions, Cellulose, 19 (2012) 581-587.
[190] L. Alves, B.F. Medronho, F.E. Antunes, A. Romano, M.G. Miguel, B. Lindman,
On the role of hydrophobic interactions in cellulose dissolution and regeneration:
colloidal aggregates and molecular solutions, Colloids and Surfaces A: Physicochemical
and Engineering Aspects.
[191] T. Röder, B. Morgenstern, The influence of activation on the solution state of
cellulose dissolved in N-methylmorpholine-N-oxide-monohydrate, Polymer, 40 (1999)
4143-4147.
120
[192] K.-F. Arndt, B. Morgenstern, T. Röder, Scattering function of non-substituted
cellulose dissolved in N-methylmorpholine-N-oxide-monohydrate, Macromolecular
Symposia, 162 (2000) 109-120.
[193] U. Drechsler, S. Radosta, W. Vorwerg, Characterization of cellulose in solvent
mixtures with N-methylmorpholine-N-oxide by static light scattering, Macromolecular
Chemistry and Physics, 201 (2000) 2023-2030.
[194] G. Cheng, P. Varanasi, R. Arora, V. Stavila, B.A. Simmons, M.S. Kent, S. Singh,
Impact of Ionic Liquid Pretreatment Conditions on Cellulose Crystalline Structure
Using 1-Ethyl-3-methylimidazolium Acetate, The Journal of Physical Chemistry B, 116
(2012) 10049-10054.
[195] L. Kyllonen, A. Parviainen, S. Deb, M. Lawoko, M. Gorlov, I. Kilpelainen,
A.W.T. King, On the solubility of wood in non-derivatising ionic liquids, Green
Chemistry, 15 (2013) 2374-2378.
[196] R. Rinaldi, Instantaneous dissolution of cellulose in organic electrolyte solutions,
Chemical Communications, 47 (2011) 511-513.
[197] M. Zavrel, D. Bross, M. Funke, J. Büchs, A.C. Spiess, High-throughput screening
for ionic liquids dissolving (ligno-)cellulose, Bioresource Technology, 100 (2009)
2580-2587.
[198] O. Kuzmina, E. Sashina, D. Wawro, S.Troshenkowa, Dissolved State of Cellulose
in Ionic Liquids - the Impact of Water, FIBRES & TEXTILES in Eastern Europe, 18
(2010) 32-37.
[199] X. Luo, L. Zhang, New solvents and functional materials prepared from cellulose
solutions in alkali/urea aqueous system, Food Research International, 52 (2013) 387-
400.
[200] S. Zhang, W.-C. Wang, F.-X. Li, J.-Y. Yu, Swelling and dissolution of cellulose
in NaOH aqueous solvent systems, Cellulose chemistry and technology, 47 (2013) 671-
679.
[201] M. Kihlman, B.F. Medronho, A.L. Romano, U. GermgÅrd, B. Lindman,
Cellulose dissolution in an alkali based solvent: influence of additives and
pretreatments, Journal of the Brazilian Chemical Society, 24 (2013) 295-303.
[202] B. Xiong, P. Zhao, K. Hu, L. Zhang, G. Cheng, Dissolution of cellulose in
aqueous NaOH/urea solution: role of urea, Cellulose, 21 (2014) 1183-1192.
121
[203] M. Bergenstråhle-Wohlert, L. Berglund, J. Brady, P.T. Larsson, P.-O. Westlund,
J. Wohlert, Concentration enrichment of urea at cellulose surfaces: results from
molecular dynamics simulations and NMR spectroscopy, Cellulose, 19 (2012) 1-12.
[204] A. Pinkert, K.N. Marsh, S. Pang, Reflections on the Solubility of Cellulose,
Industrial & Engineering Chemistry Research, 49 (2010) 11121-11130.
[205] J. Cai, L. Zhang, S.L. Liu, Y.T. Liu, X.J. Xu, X.M. Chen, B. Chu, X.L. Guo, J.
Xu, H. Cheng, C.C. Han, S. Kuga, Dynamic Self-Assembly Induced Rapid Dissolution
of Cellulose at Low Temperatures, Macromolecules, 41 (2008) 9345-9351.
[206] B. Medronho, H. Duarte, L. Alves, F. Antunes, A. Romano, B. Lindman, Probing
cellulose amphiphilicity, Nordic Pulp and Paper Research Journal, 30 (2015) 058-066.
[207] T. Ema, T. Komiyama, S. Sunami, T. Sakai, Synergistic effect of quaternary
ammonium hydroxide and crown ether on the rapid and clear dissolution of cellulose at
room temperature, RSC Advances, 4 (2014) 2523-2525.
[208] R. Zangi, R.H. Zhou, B.J. Berne, Urea's Action on Hydrophobic Interactions, J
Am Chem Soc, 131 (2009) 1535-1541.
[209] Y.H.P. Zhang, J. Cui, L.R. Lynd, L.R. Kuang, A Transition from Cellulose
Swelling to Cellulose Dissolution by o-Phosphoric Acid: Evidence from Enzymatic
Hydrolysis and Supramolecular Structure, Biomacromolecules, 7 (2006) 644-648.
[210] T.F. Libert, T. Heinze, K. Edgar, Cellulose Solvents: For Analysis, Shaping and
Chemical Modification, 1st edition ed., American Chemical Society, 2010.
[211] A. Sannino, C. Demitri, M. Madaghiele, Biodegradable Cellulose-based
Hydrogels: Design and Applications, Materials, 2 (2009) 353-373.
[212] R. Xiong, F. Li, J. Yu, P. Hu, Z. Liu, Y.-L. Hsieh, Investigations on solution of
cellulose in complex phosphoric acid solvent and its stability, Cellulose Chemistry and
Technology, 47 (2013) 153-163.
[213] H. Boerstoel, H. Maatman, J.B. Westerink, B.M. Koenders, Liquid crystalline
solutions of cellulose in phosphoric acid, Polymer, 42 (2001) 7371-7379.
[214] L. Alves, B. Medronho, F.E. Antunes, D. Topgaard, B. Lindman, The dissolution
state of cellulose in aqueous based systems. 2. Acidic solvents in: Manuscript in
preparation, 2015.
[215] J.S. Moulthrop, R.P. Swatloski, G. Moyna, R.D. Rogers, High-resolution 13C
NMR studies of cellulose and cellulose oligomers in ionic liquid solutions, Chemical
Communications, (2005) 1557-1559.
122
[216] N.J. Cao, Q. Xu, L.F. Chen, Acid hydrolysis of cellulose in zinc chloride solution,
Appl Biochem Biotechnol, 51-52 (1995) 21-28.
[217] L. Tim, Cellulose Solvents - Remarkable History, Bright Future, in: Cellulose
Solvents: For Analysis, Shaping and Chemical Modification, American Chemical
Society, 2010, pp. 3-54.
[218] M.L. Ramos, M.M. Caldeira, V.M.S. Gil, NMR spectroscopy study of the
complexation of d-gluconic acid with tungsten(VI) and molybdenum(VI), Carbohydrate
Research, 304 (1997) 97-109.
[219] J. Song, H. Fan, J. Ma, B. Han, Conversion of glucose and cellulose into value-
added products in water and ionic liquids, Green Chemistry, 15 (2013) 2619-2635.
[220] Å. Östlund, D. Lundberg, L. Nordstierna, K. Holmberg, M. Nydén, Dissolution
and Gelation of Cellulose in TBAF/DMSO Solutions: The Roles of Fluoride Ions and
Water, Biomacromolecules, 10 (2009) 2401-2407.
[221] H. Liu, K.L. Sale, B.A. Simmons, S. Singh, Molecular Dynamics Study of
Polysaccharides in Binary Solvent Mixtures of an Ionic Liquid and Water, The Journal
of Physical Chemistry B, 115 (2011) 10251-10258.
[222] R. Li, L. Zhang, M. Xu, Novel regenerated cellulose films prepared by
coagulating with water: Structure and properties, Carbohydrate Polymers, 87 (2012) 95-
100.
[223] S. Zhang, F.-X. Li, J.-Y. Yu, Kinetics of cellulose regeneration from cellulose-
NaOH-NaOH/Thiourea/Urea/H2O System, Cellulose Chem. Technol., 45 (2011) 593-
604.
[224] H.J. Schneider, F. Hacket, V. Rudiger, H. Ikeda, NMR studies of cyclodextrins
and cyclodextrin complexes, Chem Rev, 98 (1998) 1755-1785.
[225] R.A. Carvalho, H.A. Correia, A.J.M. Valente, O. Soderman, M. Nilsson, The
effect of the head-group spacer length of 12-s-12 gemini surfactants in the host-guest
association with beta-cyclodextrin, J Colloid Interf Sci, 354 (2011) 725-732.
[226] X.J. Wang, J. Messman, J.W. Mays, D. Baskaran, Polypeptide Grafted
Hyaluronan: Synthesis and Characterization, Biomacromolecules, 11 (2010) 2313-2320.
[227] B. Medronho, A.J.M. Valente, P. Costa, A. Romano, Inclusion complexes of
rosmarinic acid and cyclodextrins: stoichiometry, association constants, and antioxidant
potential, Colloid Polym Sci, 292 (2014) 885-894.
[228] B. Medronho, H. Duarte, L. Alves, F.E. Antunes, A. Romano, A.J. Valente,
Inclusion Complexes of Cyclodextrins and the Tetrabutylammnonium Cation:
123
Stoichiometry, Association Constants and Effect on Cellulose Dissolution, in:
Manuscript in preparation, 2015.
[229] A.J.M. Valente, O. Soderman, The formation of host-guest complexes between
surfactants and cyclodextrins, Adv Colloid Interfac, 205 (2014) 156-176.
[230] A. Al-Soufi, P.R. Cabrer, A. Jover, R.M. Budal, J.V. Tato, Determination of
second-order association constants by global analysis of H-1 and C-13 NMR chemical
shifts. Application to the complexation of sodium fusidate and potassium helvolate by
beta- and gamma-cyclodextrin, Steroids, 68 (2003) 43-53.
[231] A. Buvari, L. Barcza, Complex-Formation of Inorganic Salts with Beta-
Cyclodextrin, J Inclusion Phenom, 7 (1989) 379-389.
[232] A.C.F. Ribeiro, V.M.M. Lobo, A.J.M. Valente, S.M.N. Simoes, A.J.F.N. Sobral,
M.L. Ramos, H.D. Burrows, Association between ammonium monovanadate and beta-
cyclodextrin as seen by NMR and transport techniques, Polyhedron, 25 (2006) 3581-
3587.
[233] K.A. Connors, D.D. Pendergast, Microscopic Binding Constants in Cyclodextrin
Systems - Complexation of Alpha-Cyclodextrin with Sym-1,4-Disubstituted Benzenes,
J Am Chem Soc, 106 (1984) 7607-7614.
[234] T. Röder, B. Morgenstern, N. Schelosky, O. Glatter, Solutions of cellulose in
N,N-dimethylacetamide/lithium chloride studied by light scattering methods, Polymer,
42 (2001) 6765-6773.
[235] S. Zhang, C.-F. Fu, F. Li, J. Yu, L. Gu, Direct Preparation of a Novel Membrane
from Unsubstituted Cellulose in NaOH Complex Solution, Iranian Polymer Journal, 18
(2009) 767-776.
[236] M. Adsul, S.K. Soni, S.K. Bhargava, V. Bansal, Facile Approach for the
Dispersion of Regenerated Cellulose in Aqueous System in the Form of Nanoparticles,
Biomacromolecules, 13 (2012) 2890-2895.

124