tasa de evapotranspiraciÓn del cultivo de la vid y … · de una plantación de vid (vitis...
TRANSCRIPT
1
Resumen
Una oportuna y adecuada programación del riego en la agri-cultura requiere información correspondiente a la tasa de ET diaria de los cultivos establecidos o por establecer en las di-ferentes regiones agrícolas. Por lo tanto, el objetivo de este estudio fue determinar la tasa diaria de ET actual (ETa) del cultivo de la vid, con la ET de referencia (ETr) obtenida con el método FAO Penman Monteith y su comparación con la ETa del cultivo obtenida con un sistema de covarianza eddy. El es-tudio se realizó en un viñedo de la Vinícola San Lorenzo, Pa-rras, Coahuila, durante el ciclo de producción de la vid (Vitis vinífera cv Shiraz) de abril a septiembre de 2014. Dentro del predio se delimitaron dos secciones de 5.2 ha, y en cada una se instalaron los sensores de un sistema eddy para obtener la tasa diaria de ET actual del cultivo (ETa). Simultáneamente, se midió en forma continua la radiación solar total inciden-te, la temperatura y humedad relativa del aire y la velocidad del viento. Con esta información se obtuvo la tasa diaria de ET de referencia (ETr). La tasa diaria de ETa de una de las secciones del viñedo se comparó contra la ETr, para obtener los coeficientes mensuales de ajuste por desarrollo del cultivo (Kc). Los resultados del estudio mostraron que con base a la prueba de Wilcoxon para poblaciones pareadas (p£0.01), la tasa diaria de ETa medida en el viñedo (con el método de la covarianza eddy) fue igual a la tasa de ETa obtenida desde la ETr (con el procedimiento FAO Penman Monteith) corregida por el factor de relación de cobertura y los coeficientes men-suales (Kc) de desarrollo del cultivo.
Palabras clave: ET de referencia, covarianza eddy, coeficiente de cultivo, Vitis vinífera.
TASA DE EVAPOTRANSPIRACIÓN DEL CULTIVO DE LA VID Y SU RELACIÓN CON LA DE REFERENCIA DEL MÉTODO FAO PENMAN-MONTEITH
EVAPOTRANSPIRATION RATE OF A VINEYARD AND ITS RELATION TO THE REFERENCE OF THE FAO PENMAN-MONTEITH METHOD
Alejandro Zermeño-González1*, A. Isain Melendres-Alvarez1, L. Alberto Fuerte-Mosqueda1, J. Plutarco Munguia-López2, Luis Ibarra-Jiménez2
1Departamento de Riego y Drenaje, Universidad Autónoma Agraria Antonio Narro, 25315. Buenavista, Saltillo, Coahuila. México. ([email protected]). 2Centro de investigación en Química Aplicada, San José de los Cerritos. 25294. Saltillo, Coahuila, México.
* Autor responsable v Author for correspondence.Recibido: enero, 2016. Aprobado: junio, 2016.Publicado como ARTÍCULO en Agrociencia 51: 1-12. 2017.
AbstRAct
Timely and adequate irrigation scheduling in agriculture requires information corresponding to the daily rate of crops ET established or to be established in different agricultural regions. Therefore, the objective of this study was to determine the daily rate of current ET (ETa) of the vine cultivation, from the reference ET (ETr) obtained with the FAO Penman Monteith method and its comparison with the crop ETa obtained with an eddy covariance system. We conducted the study in a vineyard of Vinícola San Lorenzo, Parras, Coahuila, during the production cycle of the vine (Vitis vinifera cv Shiraz) from April to September 2014. Within the vineyard we delimited two sections of 5.2 ha, and on each we installed eddy system sensors to obtain the daily rate of crop ET (ETa). Simultaneously, we continuously measured the total incident solar radiation, temperature and relative humidity and wind speed. With this information, we obtained the daily reference ET rate (ETr). The daily rate (ETa) of one of the sections of the vineyard was compared to the ETr to obtain the monthly adjustment coefficients of crop development (Kc). The study results showed that based on the Wilcoxon test for paired populations (p£0.01), the daily rate of ETa measured in the vineyard (with the eddy covariance method) was equal to the Eta rate obtained from the ETr (with the FAO Penman Monteith procedure) corrected by the plant coverage ratio factor and the monthly coefficients (Kc) of crop development.
Keywords: Reference ET, eddy covariance, crop coefficient, Vitis vinífera.
AGROCIENCIA, 1 de enero - 15 de febrero, 2017
VOLUMEN 51, NÚMERO 12
IntRoduccIón
Para aumentar la eficiencia del uso del agua en la agricultura es necesario determinar la tasa diaria de ET (ET) de los cultivos establecidos
en una región, que permita determinar los volúme-nes de agua por aplicar (Béziat et al., 2013; Lawson y Blatt, 2014). La tasa de ET es el resultado de la evaporación desde la superficie del suelo y la trans-piración por los estomas de las hojas. Estos procesos ocurren simultáneamente y en un ecosistema natural son difícil de separar (Allen et al., 2006; Escrig et al., 2012). Los principales factores ambientales que de-terminan la tasa de ET son la radiación, temperatura del aire, déficit de presión de vapor y velocidad del viento (Allen et al., 2006).
La tasa de ET se puede medir por métodos, como los de enfoque micro meteorológico, uso de lisíme-tros y medición de los cambios de la humedad del suelo (Abtew y Melesse, 2013; Escarabajal-Henarejos et al., 2014). Sin embargo, la implementación de es-tos métodos es muy costosa y de difícil aplicación, por lo cual se debe aplicar métodos que permitan de-terminar la ET de cultivos a partir de la ET de refe-rencia. Hay varios métodos para obtener la ET de re-ferencia en una localidad (Li et al., 2008; Vega y Jara, 2009; Escarabajal-Henarejos et al., 2014). El méto-do más recomendado es el FAO Penman-Monteith (Guevara-Diaz, 2006; Sentelhas et al., 2010), que es el procedimiento estándar. Trezza (2008) aplicó di-cho método para la programación del riego mediante el balance hídrico en el suelo, en un cultivo de caña de azúcar (Saccharum officinarum), mientras que In-trigliolo et al. (2009) lo usaron para determinar la tasa de ET de una plantación de vid (cv Riesling) y en la programación del riego. Moratiel y Martínez-Cob (2012) determinaron la ET de referencia mediante el método FAO Penman-Monteith para calcular la ET de una plantación de vid (Vitis vinífera, cv. Red Glo-be) de un clima semiárido con malla sombra sobre el dosel de las plantas.
La tasa diaria de ET de una plantación de vid es pequeña con relación a la observada en cultivos de cobertura total (maíz, alfalfa, sorgo, caña de azúcar) (Zhang et al., 2008; Álvarez et al., 2013), debido a que la superficie que ocupan las franjas de plantas de vid es menor que la de los pasillos (Chen et al., 2010). Por lo tanto, al aplicar el método FAO Pen-man-Monteith se debe considerar esta relación (Allen et al., 2006; López et al., 2015).
IntRoductIon
To increase the water use efficiency in agriculture, it is necessary to determine the daily rate of ET (ET) of the crops established
in a region in order to determine the volumes of water to apply (Béziat et al, 2013; Lawson and Blatt, 2014). The ET rate is the result of evaporation from the soil surface and transpiration by leaves stomata. These processes occur simultaneously and in a natural ecosystem are difficult to separate (Allen et al., 2006; Escrig et al, 2012.). The main environmental factors that determine the rate of ET are radiation, air temperature, vapor pressure deficit and wind speed (Allen et al., 2006).
The ET rate can be measured by methods such as the micro meteorological approach, use of lysimeters and measurement of changes in soil moisture (Abtew and Melesse, 2013; Escarabajal-Henarejos et al, 2014.). However, the implementation of these methods is very costly and difficult to implement, so it is necessary to apply methods for obtaining crop ET from the reference ET. There are several methods to obtain reference ET in a locality (Li et al, 2008; Vega and Jara, 2009; Escarabajal-Henarejos et al, 2014.). The most recommended method is the FAO Penman-Monteith (Guevara-Diaz, 2006;. Sentelhas et al, 2010), which is the standard procedure. Trezza (2008) applied this method for scheduling irrigation using the water balance in the soil in a sugarcane crop (Saccharum officinarum), whereas Intrigliolo et al. (2009) used it to determine the ET rate of a vine plantation (cv Riesling) and for irrigation scheduling. Moratiel and Martínez-Cob (2012) determined the reference ET using the FAO Penman-Monteith method for calculating ET in a vine plantation (Vitis vinifera cv. Red Globe) of a semiarid climate with mesh shadow over the canopy of the plants.
The daily ET rate of a vine plantation is small in relation to that observed in crops of full coverage (corn, alfalfa, sorghum, sugar cane) (Zhang et al, 2008; Alvarez et al, 2013) since the area occupied by the strips of vine plants is smaller than the corridors (Chen et al., 2010). Therefore, when applying the FAO Penman-Monteith method this relationship must be considered (Allen et al., 2006; Lopez et al, 2015).
Vine cultivation has great economic and social importance, for the work required for management and the growing demand for red wines in the
3ZERMEÑO-GONZÁLEZ et al.
TASA DE EVAPOTRANSPIRACIÓN DEL CULTIVO DE LA VID Y SU RELACIÓN CON LA DE REFERENCIA DEL MÉTODO FAO PENMAN-MONTEITH
El cultivo de vid tiene una gran importancia eco-nómica y social por la mano de obra necesaria para su manejo y por la demanda creciente de vinos tintos en el mundo (Spinelli et al.,2011; Cohen et al., 2015). En México, las plantaciones de vid se localizan prin-cipalmente en la zona norte que corresponde a un clima árido o semiárido, donde el agua es el recurso más limitante para la producción agrícola, por lo cual es importante determinar la ET diaria de los viñedos para una mejor programación de los riegos. En con-secuencia, el objetivo de este estudio fue evaluar la aplicación del método FAO Penman-Monteith, para obtener la tasa de ET diaria de los viñedos a partir de la ET de referencia.
mAteRIAles y métodos
Ubicación y características del sitio de estudio
El estudio se realizó durante el ciclo de producción de abril a septiembre del año 2014, en un viñedo cv Shiraz de siete años de edad, propiedad de la Vinícola San Lorenzo, Parras de la Fuente, Coahuila, México. Estaa localidad está a 25° 30’ N, 102° 11’ O, y 1505 m de altitud y el clima es seco semiárido con temperatura promedio de 14 a 18 °C. La precipitación promedio anual es 366 mm, con vientos dominantes del este durante los meses en los cuales se realizó el estudio (INIFAP, 2015).
En el viñedo se delimitaron dos secciones, cada una de 5.2 ha (204 m en la dirección E-O, por 256 m en dirección N-S). Las líneas de plantas están alineadas en la dirección N-S a 1.5 m de espaciamiento entre plantas y 2.5 m de distancia entre hileras, con una densidad de 2620 plantas ha-1. El agua se aplica 2 h d-1 con un sistema de riego por goteo, el gasto del emisor fue 2.1 L h-1, y el ancho de mojado (0.40 m) fue una lámina de agua de 7 mm. El cultivo recibió el manejo agronómico (poda, fertilización y control fitosanitario) de acuerdo con las normas establecidas por la Vinícola San Lorenzo.
Instrumentación y mediciones
El método de la covarianza eddy se usó para determinar la tasa de ET actual (ETa) diaria (abril a septiembre) de cada sec-ción del viñedo. Para esto se obtuvo el flujo de calor latente (LE) y sensible (H) con las siguientes ecuaciones (Ham y Heilman, 2003):
LE L w wv * ' 'c h (1)
world (Spinelli et al, 2011; Cohen et al, 2015). In Mexico, vine plantations are mainly located in the northern area corresponding to an arid or semi-arid climate, where water is the most limiting factor for agricultural production; therefore, it is important to determine the daily ET of vineyards for a better irrigation scheduling. Consequently, the objective of this study was to evaluate the implementation of the FAO Penman-Monteith method to obtain the daily ET rate of the vineyards from the reference ET.
mAteRIAls And methods
Location and characteristics of the study site
We conducted the study during the production cycle from April to September 2014, in a vineyard cv Shiraz of seven years old, owned by the Vinícola San Lorenzo, Parras de la Fuente, Coahuila, Mexico. This location is 25° 30’ N, 102° 11’ W, and 1505 m altitude and with a dry and semiarid climate with average temperature of 14 to 18 °C. The average annual rainfall is 366 mm, with dominant easterly winds (INIFAP, 2015) during the months in which the study was performed.
In the vineyard, we delimited two sections of 5.2 ha each, (204 m in the E-W direction, and 256 m in direction N-S). Plant lines were aligned in the N-S direction, 1.5 m spacing between plants and 2.5 m between rows, with a density of 2620 plants/ha. Water is applied for 2 h d-1 with a drip irrigation system, for the emitter rate of 2.1 L h-1, and wet width (0.40 m) was a water depth of 7 mm. The crop received the agronomic management (pruning, fertilization and phytosanitary control) in accordance with the standards established by the Vinícola San Lorenzo.
Instrumentation and measurements
The eddy covariance method was used to determine the current daily ET rate (ETa) (April to September) of each section of the vineyard. For this, we estimated the latent heat (LE) and sensitive (H) flux with the following equations (Ham and Heilman, 2003):
LE L w wv * ' 'c h (1)
H C w Ts TaC
LLEa p
a p -
* * ' ' . * **
*a f 0 51 (2)
AGROCIENCIA, 1 de enero - 15 de febrero, 2017
VOLUMEN 51, NÚMERO 14
H C w Ts TaC
LLEa p
a p -
* * ' ' . * **
*a f 0 51 (2)
donde L es el calor de vaporización del agua, w es la velocidad vertical del viento wv es la densidad del vapor de agua en el aire, a, Cp y Ta son la densidad, capacidad calorífica y temperatu-ra del aire, respectivamente; y Ts es la temperatura sónica. Las variables con símbolo de prima significan desviaciones respec-to a la media y la barra horizontal sobre dos variables denota la covarianza entre las variables para un determinado segmento de tiempo (30 min).
La velocidad vertical del viento y la temperatura sónica se mi-dieron con un anemómetro sónico tridimensional (CSI-CSAT3, Campbell, Scientific, Inc., Logan, Utah, EE.UU.); para obtener wv se usó un analizador infrarrojo de bióxido de carbono y vapor de agua de sendero abierto (Open Path CO2/H2O analyzer, LI-7500. LI-COR, Lincon, Nebraska, EE.UU.). La temperatura del aire (Ta) se midió con un sensor de temperatura y humedad rela-tiva (HP45C, Vaisala, Inc., Woburn, MA, EE.UU.). Los sensores se montaron en un poste a 3 m de altura sobre la superficie del suelo (1 m sobre el dosel de las plantas) en el extremo oeste y al punto medio de las hileras de plantas de cada sección.
El anemómetro sónico tridimensional se orientó hacia el este, para que el viento tuviera un mínimo de 200 m de con-tacto con la superficie vegetal en la dirección E-O y 125 m en la dirección N-S, antes del contacto con los sensores. La frecuencia de medición de los sensores fue 10 Hz, los flujos se obtuvieron a promedios de 30 min, y los datos se almacenaron en tarjetas del módulo de memoria de un datalogger CR1000 (Campbell, Cientific, Inc., Logan, Utah, EE.UU.).
Para evaluar la precisión de las mediciones de los flujos de H y LE se determinó el balance de energía sobre la superficie vegetal (Zermeño-González et al., 2010; Shapland et al., 2012) con la siguiente relación:
Rn = H + LE + G (3)
donde Rn es la radiación neta, H es el flujo de calor sensible, LE es el flujo de calor latente, y G es el flujo de calor en la superficie del suelo; las unidades de todas las variables se expresaron en W m-2. La Rn se midió con un radiómetro neto (LITE, Keep and Zonen, Inc., Delft, Holanda) colocado a 1 m sobre el dosel del viñedo de cada sección, El flujo de calor en la superficie del suelo (G) promedio ponderado de cada sección, se obtuvo midiendo G con un transductor de calor (modelo HFT3, Campbell Scien-tific, Inc., Logan, Utah, EE.UU) a 0.08 m bajo la superficie, al punto medio de una de las hieras al centro de dos plantas bajo
where L is the heat of water vaporization, w is the vertical wind speed, wv is the density of water vapor in the air, a, Cp and Ta are the density, heat capacity and air temperature, respectively; and Ts is the sonic temperature. The prime symbol on the variables mean deviations from the mean, and the horizontal bar over two variables denotes the covariance between the variables for a particular time segment (30 min).
We measured the vertical wind speed and sonic temperature with a three-dimensional sonic anemometer (CSI-CSAT3, Campbell Scientific, Inc., Logan, Utah, USA); to obtain wv we used an open path infrared carbon dioxide analyzer (Open Path CO2/H2O analyzer, LI-7500. LI-COR, Lincoln, Nebraska, USA). Air temperature (Ta) was measured with a temperature and relative humidity sensor (HP45C, Vaisala, Inc., Woburn, MA, USA). We mounted the sensors on a pole at 3 m above ground surface (1 m above the plant canopy) in the west end and midpoint of the plant rows of each section.
The three-dimensional sonic anemometer was oriented towards the east, so that the wind had a minimum of 200 m contact with the plants surface in the direction E-W and 125 m in the direction N-S, before contact with the sensors. The measurement frequency of the sensors was 10 Hz, the flows were obtained as averages of 30 min, and the data stored in memory module cards of a CR1000 datalogger (Campbell, Cientific, Inc., Logan, Utah, USA.).
To assess the accuracy of measurements of the H and LE flows, we determined the energy balance over the plant surface (Zermeño-González et al., 2010; Shapland et al., 2012) with the following relationship:
Rn = H + LE + G (3) where Rn is net radiation, H is the sensible heat flux, LE is the latent heat flux, and G is the heat flux at soil surface; units of all variables were expressed in W m-2. The Rn was measured with a net radiometer (LITE, Keep and Zonen, Inc., Delft, Netherlands) placed 1 m above the canopy of the vineyard of each section. We obtained the heat flow in the soil surface (G), weighted average in each section by measuring G with a heat transducer (HFT3 model, Campbell Scientific, Inc., Logan, Utah, USA) at 0.08 m below the soil surface at the midpoint of one of the rows, at the center of two plants beneath the canopy, and another one over the center of a corridor (bare ground). The change in energy accumulated in the soil layer (over the transducer), due to changes of temperature at 0.02 and 0.06 m below the surface, obtained with a thermocouple (chromel-constantan) of 4 rods, was added to the heat flux measured a 0.08 m (Kustas et al., 2000; Payero et al., 2005; Balbontín-Nesvara et al, 2011). The
5ZERMEÑO-GONZÁLEZ et al.
TASA DE EVAPOTRANSPIRACIÓN DEL CULTIVO DE LA VID Y SU RELACIÓN CON LA DE REFERENCIA DEL MÉTODO FAO PENMAN-MONTEITH
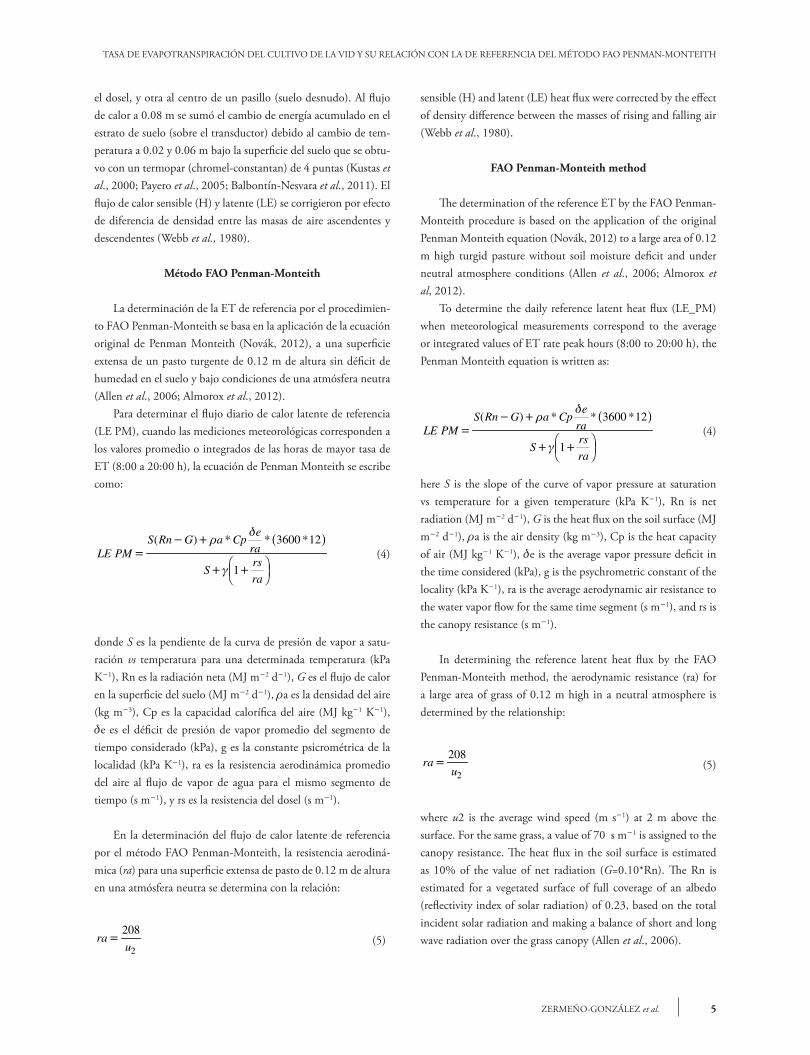
el dosel, y otra al centro de un pasillo (suelo desnudo). Al flujo de calor a 0.08 m se sumó el cambio de energía acumulado en el estrato de suelo (sobre el transductor) debido al cambio de tem-peratura a 0.02 y 0.06 m bajo la superficie del suelo que se obtu-vo con un termopar (chromel-constantan) de 4 puntas (Kustas et al., 2000; Payero et al., 2005; Balbontín-Nesvara et al., 2011). El flujo de calor sensible (H) y latente (LE) se corrigieron por efecto de diferencia de densidad entre las masas de aire ascendentes y descendentes (Webb et al., 1980).
Método FAO Penman-Monteith
La determinación de la ET de referencia por el procedimien-to FAO Penman-Monteith se basa en la aplicación de la ecuación original de Penman Monteith (Novák, 2012), a una superficie extensa de un pasto turgente de 0.12 m de altura sin déficit de humedad en el suelo y bajo condiciones de una atmósfera neutra (Allen et al., 2006; Almorox et al., 2012).
Para determinar el flujo diario de calor latente de referencia (LE PM), cuando las mediciones meteorológicas corresponden a los valores promedio o integrados de las horas de mayor tasa de ET (8:00 a 20:00 h), la ecuación de Penman Monteith se escribe como:
LE PMS Rn G a Cp
e
ra
Srs
ra
-
FHG
IKJ
( ) * * *
3600 12
1
a f
(4)
donde S es la pendiente de la curva de presión de vapor a satu-ración vs temperatura para una determinada temperatura (kPa K-1), Rn es la radiación neta (MJ m-2 d-1), G es el flujo de calor en la superficie del suelo (MJ m-2 d-1), a es la densidad del aire (kg m-3), Cp es la capacidad calorífica del aire (MJ kg-1 K-1), e es el déficit de presión de vapor promedio del segmento de tiempo considerado (kPa), g es la constante psicrométrica de la localidad (kPa K-1), ra es la resistencia aerodinámica promedio del aire al flujo de vapor de agua para el mismo segmento de tiempo (s m-1), y rs es la resistencia del dosel (s m-1).
En la determinación del flujo de calor latente de referencia por el método FAO Penman-Monteith, la resistencia aerodiná-mica (ra) para una superficie extensa de pasto de 0.12 m de altura en una atmósfera neutra se determina con la relación:
rau
208
2 (5)
sensible (H) and latent (LE) heat flux were corrected by the effect of density difference between the masses of rising and falling air (Webb et al., 1980).
FAO Penman-Monteith method
The determination of the reference ET by the FAO Penman-Monteith procedure is based on the application of the original Penman Monteith equation (Novák, 2012) to a large area of 0.12 m high turgid pasture without soil moisture deficit and under neutral atmosphere conditions (Allen et al., 2006; Almorox et al, 2012).
To determine the daily reference latent heat flux (LE_PM) when meteorological measurements correspond to the average or integrated values of ET rate peak hours (8:00 to 20:00 h), the Penman Monteith equation is written as:
LE PMS Rn G a Cp
e
ra
Srs
ra
-
FHG
IKJ
( ) * * *
3600 12
1
a f
(4)
here S is the slope of the curve of vapor pressure at saturation vs temperature for a given temperature (kPa K-1), Rn is net radiation (MJ m-2 d-1), G is the heat flux on the soil surface (MJ m-2 d-1), a is the air density (kg m-3), Cp is the heat capacity of air (MJ kg-1 K-1), e is the average vapor pressure deficit in the time considered (kPa), g is the psychrometric constant of the locality (kPa K-1), ra is the average aerodynamic air resistance to the water vapor flow for the same time segment (s m-1), and rs is the canopy resistance (s m-1).
In determining the reference latent heat flux by the FAO Penman-Monteith method, the aerodynamic resistance (ra) for a large area of grass of 0.12 m high in a neutral atmosphere is determined by the relationship:
rau
208
2 (5)
where u2 is the average wind speed (m s-1) at 2 m above the surface. For the same grass, a value of 70 s m-1 is assigned to the canopy resistance. The heat flux in the soil surface is estimated as 10% of the value of net radiation (G=0.10*Rn). The Rn is estimated for a vegetated surface of full coverage of an albedo (reflectivity index of solar radiation) of 0.23, based on the total incident solar radiation and making a balance of short and long wave radiation over the grass canopy (Allen et al., 2006).
AGROCIENCIA, 1 de enero - 15 de febrero, 2017
VOLUMEN 51, NÚMERO 16
donde u2 es la velocidad del viento promedio (m s-1) a 2 m de altura sobre la superficie. Para el mismo pasto se asigna un valor de 70 s m-1 a la resistencia del dosel. El flujo de calor en la su-perficie del suelo se estima como el 10 % del valor de la radiación neta (G=0.10*Rn). La Rn se estima para una superficie vegetal de cobertura completa de un albedo (índice de reflectividad de la radiación solar) de 0.23, a partir de la radiación solar total inci-dente y realizando un balance de radiación de onda corta y larga sobre el dosel del pasto (Allen et al., 2006).
La velocidad del viento se midió con un anemómetro sónico tridimensional (3-D sonic anemometer, Campbell Sci., Logan, Utah, USA), la radiación solar total incidente con un Sylicon Pyranometer (LI-200X, Lincon, Nebraska, USA). El déficit de presión de vapor (e) se obtuvo a partir de la temperatura y humedad relativa del aire que se midieron con una sonda de temperatura y humedad (HC2S3 (temperature and relative hu-midity probe, Campbell, Sci., Logan, Utah). Las mediciones se realzaron a una frecuencia de 1 s, y los promedios se obtuvieron cada 30 min.
La tasa diaria de ET de referencia (ETr) se obtuvo dividiendo el flujo diario de calor latente de referencia (LE_PM) por el calor de vaporización del agua (L). La medición de ETr con el método FAO Penman-Monteith es para un pasto que cubre toda la su-perficie; por lo tanto para cultivos establecidos en hileras y que no cubren toda la superficie del suelo se debe considerar un fac-tor de relación de cobertura. Para estimar la tasa de ETa a partir de la ETr, se obtuvieron los coeficientes mensuales de ajuste por desarrollo de cultivo (Kc) de acuerdo con la siguiente relación:
ETa = ETr*Kc (6)
Así el valor del Kc mensual (que varía con el desarrollo fe-nológico del cultivo) se obtuvo dividiendo la ETa total del mes correspondiente de una de las secciones del viñedo (medida con el método de la covarianza eddy) por la ETr total del mismo mes, medida con el método FAO Penman Monteith. Esto es para te-ner una mejor estimación de la ETa, ya que el manual FAO 56 solo describe el valor de dos coeficientes Kc, uno para el valor máximo y el otro para el valor final.
Evaluación estadística
La validación del método FAO Penman Monteith, se realizó comparando los datos de ET actual diaria medidos (con el méto-do de la covarianza eddy), contra la estimada con el método FAO Penman-Monteith. Para esto se aplicó la prueba no paramétrica de Wilcoxon para poblaciones pareadas (Wilcoxon, p£0.05).
Wind speed was measured with a three-dimensional sonic anemometer (3-D sonic anemometer, Campbell Sci., Logan, Utah, USA), the total incident solar radiation with a Sylicon Pyranometer (LI-200X, Lincoln, Nebraska, USA). The deficit vapor pressure (e) was obtained from the temperature and relative humidity that were measured with a temperature and humidity probe (HC2S3) (temperature and relative humidity probe, Campbell, Sci., Logan, Utah). Measurements were performed at a frequency of 1 s, and averages were obtained every 30 min.
The daily reference ET rate (ETr) was obtained by dividing the daily latent heat reference flux (LE_PM) by the heat of water vaporization (L). Measurement of ETr by the FAO Penman-Monteith method is for a grass that covers the entire surface; therefore, for crops grown in rows and that do not cover the entire soil surface a cover relationship factor should be considered. To estimate the ETa rate from ETr, monthly adjustment coefficients for crop development (Kc) were obtained according to the following relationship:
ETa = ETr*Kc (6)
So, the value of the monthly Kc (which varies with the phenological development of the crop) was obtained by dividing the total monthly ETa corresponding to one of the sections of the vineyard (measured with the method of the eddy covariance) by the total ETr of the same month, measured with the FAO Penman Monteith method. Here we expect to have a better estimate of ETa, as the FAO 56 manual only describes the value of two Kc coefficients, one for the maximum value and the other for the final value.
Statistical evaluation
We performed the validation of the FAO Penman Monteith method by comparing the current ET data measured daily (with the eddy covariance method), with that estimated with the FAO Penman-Monteith method. For this we applied the non-parametric Wilcoxon test for paired populations (Wilcoxon, p£0.05).
Results And dIscussIon
Energy balance on the vineyard canopy
The energy balance over the plant surface shows that the sum of the flows for turbulence (H+LE) were on average 15% lower than the available energy

7ZERMEÑO-GONZÁLEZ et al.
TASA DE EVAPOTRANSPIRACIÓN DEL CULTIVO DE LA VID Y SU RELACIÓN CON LA DE REFERENCIA DEL MÉTODO FAO PENMAN-MONTEITH
ResultAdos y dIscusIón
Balance de energía sobre el dosel del viñedo
El balance de energía sobre la superficie vegetal muestra que la suma de los flujos por turbulencia (H+LE) fueron en promedio 15 % menor que la energía disponible (Rn-G) (Figura 1). Este peque-ño desbalance está dentro del margen aceptable de diferencia del balance de energía cuando H y LE se miden con el método de la covarianza eddy (Twine et al., 2000; Ham and Heilman, 2003; Foken, 2008). En estudios similares realizados por Tonti et al. (2013) en un cultivo de soya (Glycine max), la suma de H+LE fue en promedio 22 % menor que la ener-gía disponible Rn-G, mientras que para una planta-ción de vid Balbontín-Nesvara et al. (2011) reporta-ron una diferencia de 19 %, en el mismo contexto.
Relación entre la ET medida en el viñedo y la de referencia con el método FAO Penman-Monteith
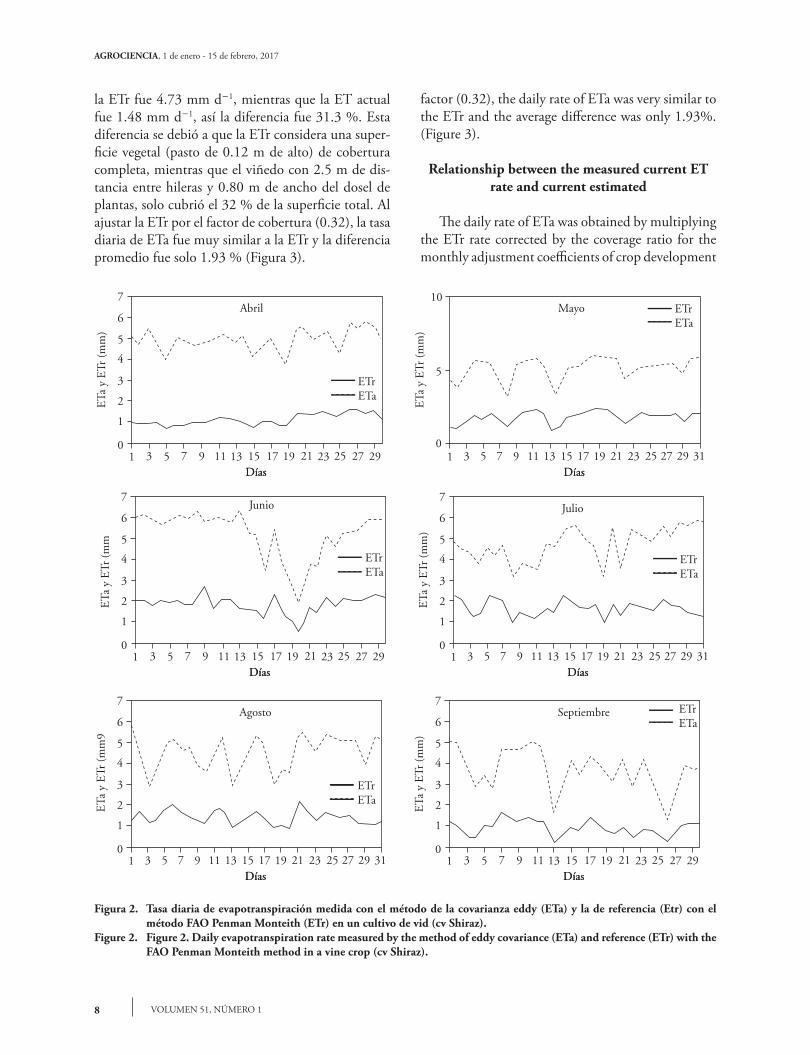
La tasa de ETa medida con el método de la cova-rianza eddy presentó el mismo patrón de variación que la tasa de ETr obtenida con el método FAO Pen-man-Monteith (Figura 2). Nótese que en los meses del ciclo de producción del cultivo, la tasa de ETr fue mayor que la ETa, pero con el mismo patrón de va-riación (por ser afectadas por las mismas condiciones meteorológicas). En promedio, para los meses señalados,
Figura 1. Relación entre la suma de los flujos de la superficie (H+LE) y la energía disponible (Rn-G) (valores promedio de 30 min), sobre el dosel de un viñedo (cv Shiraz).
Figure 1. Relationship between the sum of the surface flows (H + LE) and the available energy (Rn-G) (30 min average values) over the canopy of a vineyard (cv Shiraz).
600
200
300
400
500
100
0 100 500300
(Rn-G) w/m2
(H+L
E)
w/m
2
0400200 600 700
(H+LE)=0.850*(Rn-G)R2=0.875
(Rn-G) (Figure 1). This small imbalance is within the acceptable margin of difference of the energy balance when H and LE are measured with the eddy covariance method (Twine et al., 2000; Ham and Heilman, 2003; Folken, 2008). In similar studies by Tonti et al. (2013) in a soybean crop (Glycine max), the sum of H+LE was on average 22 % less than the Rn-G energy available, whereas for a vine planting Balbontín-Nesvara et al. (2011) reported a 19 % difference in the same context.
Relationship between ET measured in the vineyard and the reference using the FAO
Penman-Monteith method
The ETa rate measured with the method of eddy covariance presented the same pattern of variation than the ETr rate obtained with the FAO Penman-Monteith method (Figure 2). Note that over the months of the crop production cycle, the ETr rate was greater than ETa, but with the same pattern of variation (for being affected by the same weather conditions). On average, in the months mentioned, the ETr was 4.73 mm d-1, whereas the current ET was 1.48 mm d-1, so the difference was 31.3 %. This difference was because the ETr considered a full coverage vegetated surface (grass 0.12 m tall), whereas the vineyard with 2.5 m between rows and 0.80 m wide of the plant canopy only covered 32 % of the total area. By adjusting the ETr by the coverage
AGROCIENCIA, 1 de enero - 15 de febrero, 2017
VOLUMEN 51, NÚMERO 18
la ETr fue 4.73 mm d-1, mientras que la ET actual fue 1.48 mm d-1, así la diferencia fue 31.3 %. Esta diferencia se debió a que la ETr considera una super-ficie vegetal (pasto de 0.12 m de alto) de cobertura completa, mientras que el viñedo con 2.5 m de dis-tancia entre hileras y 0.80 m de ancho del dosel de plantas, solo cubrió el 32 % de la superficie total. Al ajustar la ETr por el factor de cobertura (0.32), la tasa diaria de ETa fue muy similar a la ETr y la diferencia promedio fue solo 1.93 % (Figura 3).
Figura 2. Tasa diaria de evapotranspiración medida con el método de la covarianza eddy (ETa) y la de referencia (Etr) con el método FAO Penman Monteith (ETr) en un cultivo de vid (cv Shiraz).
Figure 2. Figure 2. Daily evapotranspiration rate measured by the method of eddy covariance (ETa) and reference (ETr) with the FAO Penman Monteith method in a vine crop (cv Shiraz).
7
3
4
5
6
2ETa
y E
Tr (
mm
)
0
1
1 3 5 7 9 11 13 15 23211917 292725DíasDías
Abril
ETrETa
10
ETa
y E
Tr (
mm
)
01 3 5 7 9 11 13 15 23211917 292725
DíasDías
Mayo ETrETa
7
3
4
5
6
2ETa
y E
Tr (
mm
0
1
1 3 5 7 9 11 13 15 23211917 292725DíasDías
Junio
ETrETa
7
3
4
5
6
2ETa
y E
Tr (
mm
)
0
1
DíasDías
Julio
ETrETa
7
3
4
5
6
2ETa
y E
Tr (
mm
9
0
1
DíasDías
Agosto
ETrETa
7
3
4
5
6
2ETa
y E
Tr (
mm
)
0
1
1 3 5 7 9 11 13 15 23211917 292725DíasDías
Septiembre ETrETa
5
31
1 3 5 7 9 11 13 15 23211917 292725 31
1 3 5 7 9 11 13 15 23211917 292725 31
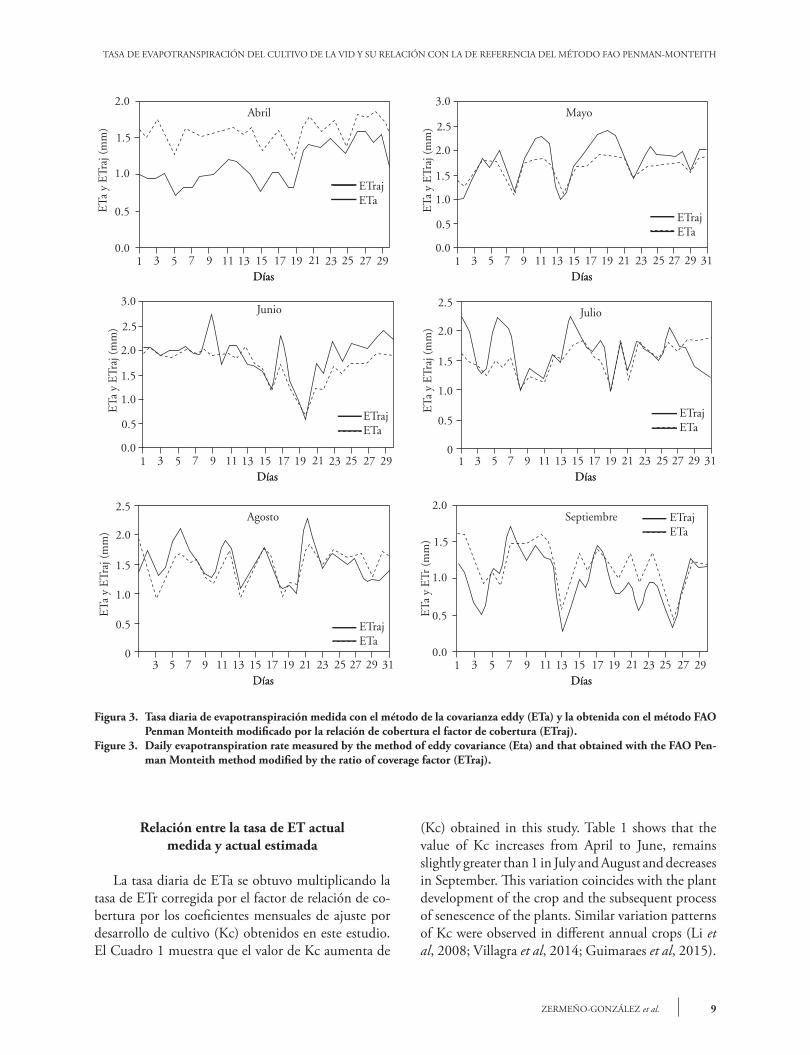
factor (0.32), the daily rate of ETa was very similar to the ETr and the average difference was only 1.93%. (Figure 3).
Relationship between the measured current ET rate and current estimated
The daily rate of ETa was obtained by multiplying the ETr rate corrected by the coverage ratio for the monthly adjustment coefficients of crop development
9ZERMEÑO-GONZÁLEZ et al.
TASA DE EVAPOTRANSPIRACIÓN DEL CULTIVO DE LA VID Y SU RELACIÓN CON LA DE REFERENCIA DEL MÉTODO FAO PENMAN-MONTEITH
Relación entre la tasa de ET actual medida y actual estimada
La tasa diaria de ETa se obtuvo multiplicando la tasa de ETr corregida por el factor de relación de co-bertura por los coeficientes mensuales de ajuste por desarrollo de cultivo (Kc) obtenidos en este estudio. El Cuadro 1 muestra que el valor de Kc aumenta de
(Kc) obtained in this study. Table 1 shows that the value of Kc increases from April to June, remains slightly greater than 1 in July and August and decreases in September. This variation coincides with the plant development of the crop and the subsequent process of senescence of the plants. Similar variation patterns of Kc were observed in different annual crops (Li et al, 2008; Villagra et al, 2014; Guimaraes et al, 2015).
2.0
0.0
0.5
1.0
1.5
ETa
y E
Traj
(m
m)
1 3 5 7 9 11 13 15 23211917 292725DíasDías
Abril
ETrajETa
3.0
ETa
y E
Traj
(m
m)
0.01 3 5 7 9 11 13 15 23211917 292725
DíasDías
Mayo
ETrajETa
ETa
y E
Traj
(m
m)
1 3 5 7 9 11 13 15 23211917 292725DíasDías
Junio
ETrajETa
2.5
0.5
1.0
1.5
2.0
ETa
y E
Traj
(m
m)
0
DíasDías
Julio
ETrajETa
DíasDías
Agosto
ETa
y E
Tr (
mm
)
1 3 5 7 9 11 13 15 23211917 292725DíasDías
Septiembre
1.5
31
1 3 5 7 9 11 13 15 23211917 292725 31
3 5 7 9 11 13 15 23211917 292725 31
2.0
0.0
0.5
1.0
1.5
2.5
2.0
1.0
0.5
3.0
0.0
1.5
2.5
2.0
1.0
0.5
2.5
0.5
1.0
1.5
2.0
ETa
y E
Traj
(m
m)
0
ETrajETa
ETrajETa
Figura 3. Tasa diaria de evapotranspiración medida con el método de la covarianza eddy (ETa) y la obtenida con el método FAO Penman Monteith modificado por la relación de cobertura el factor de cobertura (ETraj).
Figure 3. Daily evapotranspiration rate measured by the method of eddy covariance (Eta) and that obtained with the FAO Pen-man Monteith method modified by the ratio of coverage factor (ETraj).
AGROCIENCIA, 1 de enero - 15 de febrero, 2017
VOLUMEN 51, NÚMERO 110
abril a junio, se mantiene ligeramente mayor a 1 en julio y agosto y decrece en septiembre. Esta variación coincide con el desarrollo vegetativo del cultivo y el proceso posterior de senescencia de las plantas. Pa-trones similares de variación del Kc se observaron en diferentes cultivos de ciclo anual (Li et al., 2008; Vi-llagra et al., 2014; de Guimaraes et al., 2015).
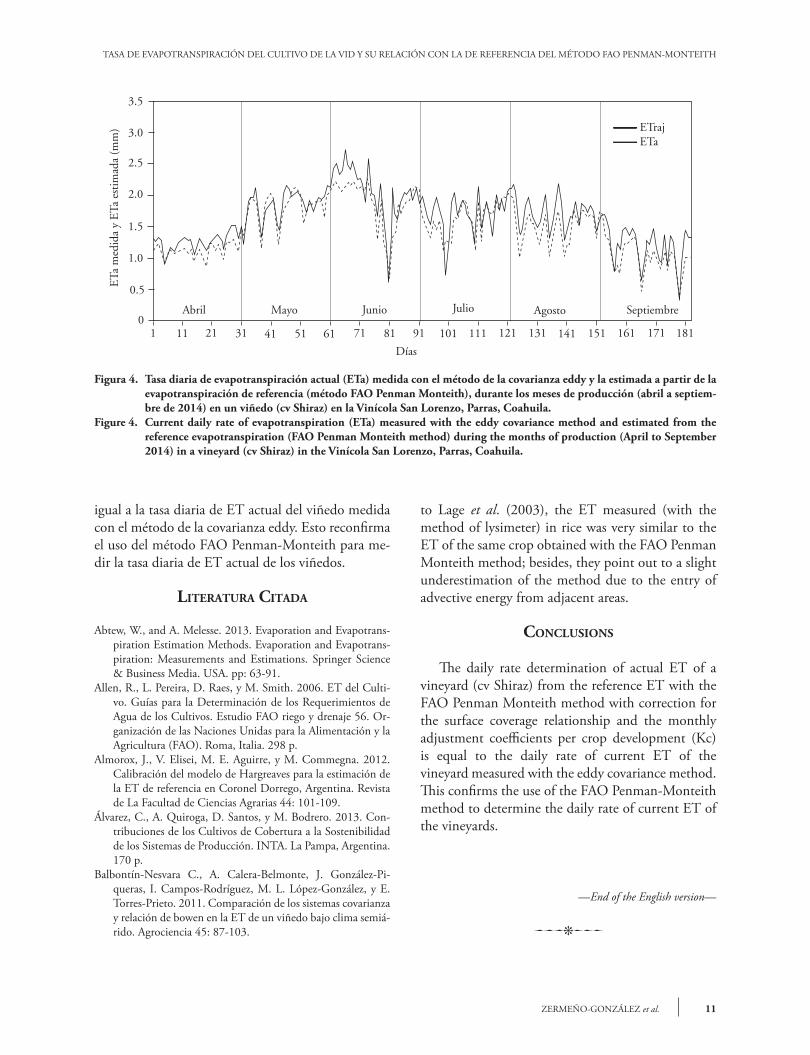
La tasa diaria de ETa medida con el método de la covarianza eddy y la ETa estimada a partir de la ET de referencia (método FAO Penman-Monteith) fue muy similar en los meses del ciclo de producción del viñedo (Figura 4). La prueba de Wilcoxon para po-blaciones pareadas indicó que dichas poblaciones son estadísticamente iguales (p£0.01). Este resultado permite reconfirmar la aplicación del método FAO Penman Monteith para estimar la tasa de ETa del vi-ñedo a partir de la ETr. La información meteorológi-ca requerida por el método FAO Penman-Monteith se puede obtener de las estaciones climatológicas más cercanas a la zona de cultivo; así, su aplicación no tie-ne costo respecto a los métodos que necesitan senso-res para mediciones in situ (como el método de la co-varianza eddy) para medir la tasa diaria de ET. Otros estudios en diferentes cultivos también recomiendan usar este método para determinar la tasa de ET actual en diferentes regiones. Trezza et al. (2008) midieron la ETa de un cultivo de caña de azúcar, a partir de la ET de referencia para una mejor programación de la irrigación y causó un mayor rendimiento del cultivo. Er-Raki et al. (2009) reportan una mejor medición de la ETa de una huerta de árboles de naranja (Citrus sinensis), usando el método FAO Penman-Monteith cuando los valores de Kc se obtuvieron a partir de mediciones de la ET del cultivo con el método de la covarianza eddy. Según Lage et al. (2003), la ET me-dida (con el método del lisímetro) en un cultivo de arroz fue muy similar a la ET del mismo cultivo ob-tenida a partir del método FAO Penman Monteith; además señalan una ligera subestimación del método debido al ingreso de energía advectiva de las zonas adyacentes.
conclusIones
La medición de la tasa diaria de ET actual de un viñedo (cv Shiraz) a partir de la ET de referencia con el método FAO Penman Monteith, con la correc-ción por la relación de cobertura y los coeficientes mensuales de ajuste por desarrollo de cultivo (Kc), es
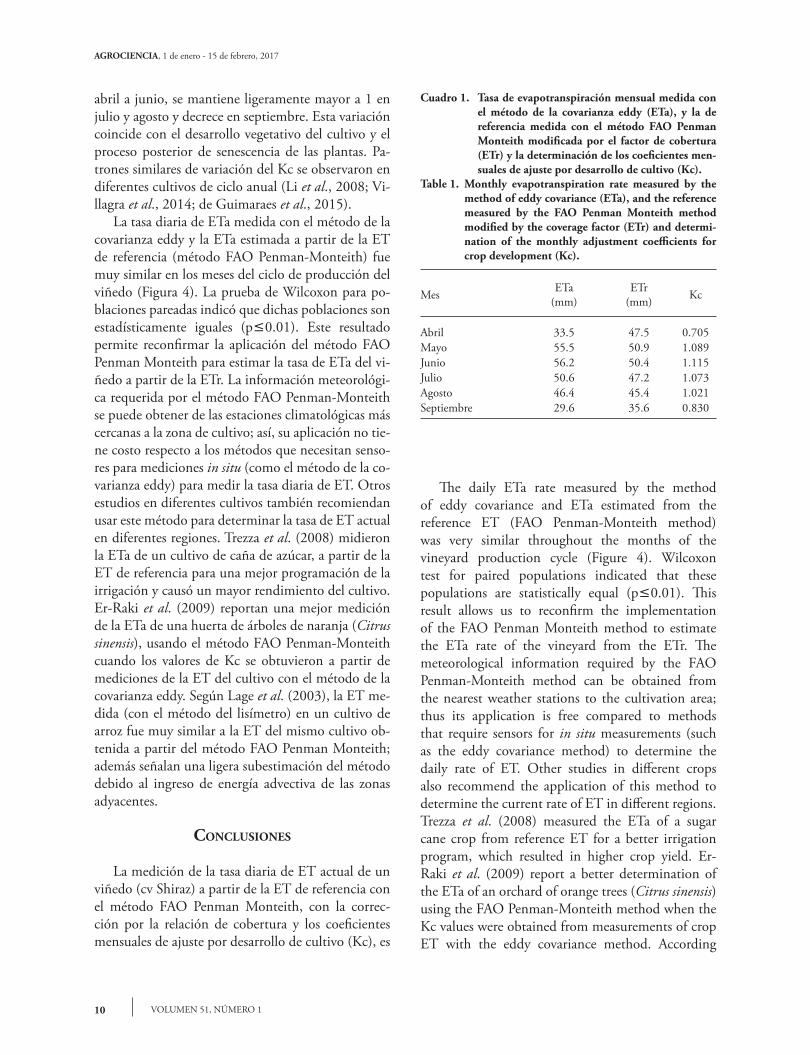
Cuadro 1. Tasa de evapotranspiración mensual medida con el método de la covarianza eddy (ETa), y la de referencia medida con el método FAO Penman Monteith modificada por el factor de cobertura (ETr) y la determinación de los coeficientes men-suales de ajuste por desarrollo de cultivo (Kc).
Table 1. Monthly evapotranspiration rate measured by the method of eddy covariance (ETa), and the reference measured by the FAO Penman Monteith method modified by the coverage factor (ETr) and determi-nation of the monthly adjustment coefficients for crop development (Kc).
Mes ETa (mm)
ETr(mm) Kc
Abril 33.5 47.5 0.705Mayo 55.5 50.9 1.089Junio 56.2 50.4 1.115Julio 50.6 47.2 1.073Agosto 46.4 45.4 1.021Septiembre 29.6 35.6 0.830
The daily ETa rate measured by the method of eddy covariance and ETa estimated from the reference ET (FAO Penman-Monteith method) was very similar throughout the months of the vineyard production cycle (Figure 4). Wilcoxon test for paired populations indicated that these populations are statistically equal (p£0.01). This result allows us to reconfirm the implementation of the FAO Penman Monteith method to estimate the ETa rate of the vineyard from the ETr. The meteorological information required by the FAO Penman-Monteith method can be obtained from the nearest weather stations to the cultivation area; thus its application is free compared to methods that require sensors for in situ measurements (such as the eddy covariance method) to determine the daily rate of ET. Other studies in different crops also recommend the application of this method to determine the current rate of ET in different regions. Trezza et al. (2008) measured the ETa of a sugar cane crop from reference ET for a better irrigation program, which resulted in higher crop yield. Er-Raki et al. (2009) report a better determination of the ETa of an orchard of orange trees (Citrus sinensis) using the FAO Penman-Monteith method when the Kc values were obtained from measurements of crop ET with the eddy covariance method. According
11ZERMEÑO-GONZÁLEZ et al.
TASA DE EVAPOTRANSPIRACIÓN DEL CULTIVO DE LA VID Y SU RELACIÓN CON LA DE REFERENCIA DEL MÉTODO FAO PENMAN-MONTEITH
igual a la tasa diaria de ET actual del viñedo medida con el método de la covarianza eddy. Esto reconfirma el uso del método FAO Penman-Monteith para me-dir la tasa diaria de ET actual de los viñedos.
lIteRAtuRA cItAdA
Abtew, W., and A. Melesse. 2013. Evaporation and Evapotrans-piration Estimation Methods. Evaporation and Evapotrans-piration: Measurements and Estimations. Springer Science & Business Media. USA. pp: 63-91.
Allen, R., L. Pereira, D. Raes, y M. Smith. 2006. ET del Culti-vo. Guías para la Determinación de los Requerimientos de Agua de los Cultivos. Estudio FAO riego y drenaje 56. Or-ganización de las Naciones Unidas para la Alimentación y la Agricultura (FAO). Roma, Italia. 298 p.
Almorox, J., V. Elisei, M. E. Aguirre, y M. Commegna. 2012. Calibración del modelo de Hargreaves para la estimación de la ET de referencia en Coronel Dorrego, Argentina. Revista de La Facultad de Ciencias Agrarias 44: 101-109.
Álvarez, C., A. Quiroga, D. Santos, y M. Bodrero. 2013. Con-tribuciones de los Cultivos de Cobertura a la Sostenibilidad de los Sistemas de Producción. INTA. La Pampa, Argentina. 170 p.
Balbontín-Nesvara C., A. Calera-Belmonte, J. González-Pi-queras, I. Campos-Rodríguez, M. L. López-González, y E. Torres-Prieto. 2011. Comparación de los sistemas covarianza y relación de bowen en la ET de un viñedo bajo clima semiá-rido. Agrociencia 45: 87-103.
Figura 4. Tasa diaria de evapotranspiración actual (ETa) medida con el método de la covarianza eddy y la estimada a partir de la evapotranspiración de referencia (método FAO Penman Monteith), durante los meses de producción (abril a septiem-bre de 2014) en un viñedo (cv Shiraz) en la Vinícola San Lorenzo, Parras, Coahuila.
Figure 4. Current daily rate of evapotranspiration (ETa) measured with the eddy covariance method and estimated from the reference evapotranspiration (FAO Penman Monteith method) during the months of production (April to September 2014) in a vineyard (cv Shiraz) in the Vinícola San Lorenzo, Parras, Coahuila.
Días
Abril
1 11 21 31 41 51 61 101918171 131121111 141
3.5
1.5
2.0
2.5
3.0
ETa
med
ida
y E
Ta e
stim
ada
(mm
)
0
ETrajETa
151 171161 181
1.0
0.5
Mayo Junio Julio Agosto Septiembre
to Lage et al. (2003), the ET measured (with the method of lysimeter) in rice was very similar to the ET of the same crop obtained with the FAO Penman Monteith method; besides, they point out to a slight underestimation of the method due to the entry of advective energy from adjacent areas.
conclusIons
The daily rate determination of actual ET of a vineyard (cv Shiraz) from the reference ET with the FAO Penman Monteith method with correction for the surface coverage relationship and the monthly adjustment coefficients per crop development (Kc) is equal to the daily rate of current ET of the vineyard measured with the eddy covariance method. This confirms the use of the FAO Penman-Monteith method to determine the daily rate of current ET of the vineyards.
—End of the English version—
pppvPPP
AGROCIENCIA, 1 de enero - 15 de febrero, 2017
VOLUMEN 51, NÚMERO 112
Béziat, P., V. Rivalland, T. Tallec, N. Jarosz, G. Boulet, P. Genti-ne, and E. Ceschia. (2013). Evaluation of a simple approach for crop evapotranspiration partitioning and analysis of the water budget distribution for several crop species. Agric. For. Meteorol. 177: 46-56.
Chen, S., X. Zhang, H. Sun, T. Ren, and Y. Wang. 2010. Effects of winter wheat row spacing on evapotranpsiration, grain yield and water use efficiency. Agric. Water Manage. 97: 1126-1132.
Cohen, M., C. Bilodeau, F. Alexandre, M. Godron, J. Andrieu, E. Grésillon, F. Garlatti, and A. Morganti. 2015. What is the plant biodiversity in a cultural landscape? a comparative, multi-scale and interdisciplinary study in olive groves and vineyards (Mediterranean France). Agric. Ecosyst. Environ. 212: 175-186.
de Guimaraes C, G. G., R. C. de Oliveira, M. B. Teixeira, M. S. Dorneles, R. M. O. Domingos, and C. A. Megguer. 2015. Sugar cane crop coefficient by the soil water balance method. African J. Agric. Res. 10: 2407-2414.
Er-Raki, S., A. Chehbouni, N. Guemouria, J. Ezzahar, S. Khab-ba, G. Boulet, and L. Hanich. 2009. Citrus orchard evapo-transpiration: comparison between eddy covariance measu-rements and the FAO-56 approach estimates. Plant Biosyst. - An Int. J. Deal. with all Asp. Plant Biol. 143: 201-208.
Escarabajal-Henarejos, D., D. G. Fernández-Pacheco, and J. M. Molina-Martínez, 2014. Selection of device to determi-ne temperature gradients for estimating evapotranspiration using energy balance method. Agric. Water Manage. 151: 136-147.
Escrig, J., E. Montón, J. Quereda. 2012. Climatología Aeronáu-tica del Aeropuerto de Castellón. Publicacions de la Univer-sitat Jaume I, D. L. Castelló de la Plana. pp: 160-161.
Foken, T. 2008. The energy balance closure problem: An over-view. Ecol. App. 18: 1351-1367.
Guevara-Diaz, J. M. 2006. La fórmula de Penman- Monteith FAO 1998 para determinar la ET de referencia, ETO. Terra 22: 31-72.
Ham, J. M. and J. L. Heilman. 2003. Experimental test of den-sity and energy-balance corrections on carbon dioxide flux as measured using open-path Eddy covariance. Agron. J. 95: 1393-1403.
Inifap (Instituto Nacional de Investigaciones Forestales, Agríco-las y Pecuarias). 2015. http://clima.inifap.gob.mx/redinifap/est.aspx?est=26796 (Consulta: Septiembre 2015).
Intrigliolo, D. S., A. N. Lakso, and R. M. Piccioni. 2009. Gra-pevine cv. “Riesling” water use in the northeastern United States. Irrig. Sci. 27: 253-262.
Kustas, W. P., J. H. Prueger, J. L. Hatfield, K. Ramalingam, and L. E. Hipps. 2000. Variability in soil heat flux from a mes-quite dune site. Agric. For. Meteorol. 103: 249-264.
Lage, M., A. Bamouh, M. Karrou, and M. El Mourid, 2003. Estimation of rice evapotranspiration using a microlysime-ter technique and comparison with FAO Penman-Monteith and Pan evaporation methods under Moroccan conditions. Agronomie 23: 625-631.
Lawson, T., and M. R. Blatt. 2014. Stomatal size, speed and res-ponsiveness impact on photosynthesis and water use efficien-cy. Plant Physiol. 164: 1556-1570.
Li, S., S. Kang, F. Li, and L. Zhang. 2008. Evapotranspiration and crop coefficient of spring maize with plastic mulch using eddy covariance in northwest China. Agric. Water Manage. 95: 1214-1222.
López A., J. E., T. Díaz, C. Watts, J. C. Rodríguez, A. E. Caste-llanos, L. Partida, y T. de. J. Velázquez. 2015. ET y coeficien-tes de cultivo de chile bell en el valle de Culiacán, México. Rev. Terra Latinoam. 33: 209-219.
Moratiel, R., and A. Martínez-Cob. 2012. Evapotranspiration of grapevine trained to a gable trellis system under netting and black plastic mulching. Irrig. Sci. 30: 167-178.
Novák, V. 2012. Methods of Evapotranspiration Estimation. Evapotranspiration in the Soil-Plant-Atmosphere System. Springer Science & Business Media. Slovakia. pp:165-212.
Payero, J. O., C. M. U. Neale, and J. L. Wright. 2005. Estima-ting soil heat flux for alfalfa and clipped tall fescue grass. Appl. Eng. Agric. 21: 401-409.
Sentelhas, P. C., T. J. Gillespie, and E. A. Santos, 2010. Evalua-tion of FAO Penman-Monteith and alternative methods for estimating reference evapotranspiration with missing data in Southern Ontario, Canada. Agric. Water Manage. 97: 635-644.
Shapland, T. M., R. L. Snyder, D. R. Smart, and L. E. Williams. 2012. Estimation of actual evapotranspiration in winegrape vineyards located on hillside terrain using surface renewal analysis. Irrig. Sci. 30: 471-484.
Spinelli, R., C. Nati, L. Pari, E. Mescalchin, and N. Magagnotti. 2011. Production and quality of biomass fuels from mecha-nized collection and processing of vineyard pruning residues. Appl. Energy 89: 374-379.
Tonti, N., M. Gassmann, M. Covi, C. Pérez, y S. Righetti. 2013. Balance de energía sobre un cultivo de soja. Ciência e Natura 6: 305-307.
Trezza, R., Y. Pacheco, Y. Suárez, A. Nuñez, y I. Umbría. 2008. Programación del riego en caña de azúcar en una zona semiá-rida del estado Lara, Venezuela, utilizando la metodología FAO-56. Bioagro 20: 21-27.
Twine, T. E., W. P. Kustas, J. M. Norman, D. R. Cook, P. R. Houser, T. P. Meyers, J. H. Prueger, P. J. Starks, and M. L. Wesely. 2000. Correcting eddy-covariance flux underestima-tes over a grassland. Agric. For. Meteorol. 103: 279-300.
Vega, E. C., y J. C. Jara. 2009. Estimación de la ET de referen-cia para dos zonas (costa y región andina) del ecuador. Eng. Agric Jaboticabal 29: 390-403.
Villagra, P., V. García de Cortázar, R. Ferreyra, C. Aspillaga, C. Zuñiga, S. Ortega-Farias, and G. Selles. 2014. Estimation of water requirements and Kc values of Thompson Seedless table grapes grown in the overhead trellis system, using the Eddy covariance method. Chilean. J. Agric. Res. 74: 213-218.
Webb, E. K., G. I. Pearman, and R. Leuning. 1980. Correction of flux measurements for density effects due to heat and water vapor transfer. Quart. J. Roy. Meteorol. Soc. 106: 85-100.
Zermeño-González, A., J. Flores-Guerrero, J. P. Munguía-López, J. Gil-Marín, R. Rodríguez-García, E. A. Catalán-Valencia, L. Ibarra-Jiménez, y H. Zermeño-González. 2010. ET y su relación con la ET a equilibrio de una huerta de nogal peca-nero (Carya illinoinensis) del norte de México. Agrociencia. 44: 885-893.
Zhang, B., S. Kang, F. Li, and L. Zhang. 2008. Comparison of three evapotranspiration models to Bowen ratio-energy ba-lance method for a vineyard in an arid desert region of nor-thwest China. Agric. For. Meteorol. 148: 1629-1640.