ricardo agostinho miranda mota - universidade do...
TRANSCRIPT

Janeiro de 2013
Universidade do MinhoEscola de Engenharia
Ricardo Agostinho Miranda Mota
Techniques For Place Aware Advertising
UM
inho
|201
3 R
icar
do A
gost
inho
Mira
nda
Mot
a Te
chn
iqu
es
Fo
r P
lace
Aw
are
Ad
vert
isin
g

Dissertação de MestradoMestrado em Engenharia Informática
Trabalho realizado sob a orientação doProfessor Doutor António Nestor Ribeiroe co-orientação do
Rui José Professor Doutor
Janeiro de 2013
Universidade do MinhoEscola de Engenharia
Ricardo Agostinho Miranda Mota
Techniques For Place Aware Advertising

É AUTORIZADA A REPRODUÇÃO INTEGRAL DESTA DISSERTAÇÃO APENAS PARA EFEITOS DE INVESTIGAÇÃO, MEDIANTE DECLARAÇÃO ESCRITA DO INTERESSADO, QUE A TAL SECOMPROMETE;
Universidade do Minho, ___/___/______
Assinatura: ________________________________________________

ii

iii
Abstract
Nowadays, the high percentage of mobile devices equipped with GPS and Bluetooth, as well as
the growing number of public Wi-Fi networks, makes the public environment surrounding us immensely
rich in information. The advertising industry sees this as an opportunity to transform the way
advertising is done in public by adopting increasingly pervasive and intelligent digital signage screen
systems.
The objective of this work is to develop an ad serving solution for a digital signage network that
explores user profile information, as well as, audience screen activities to deliver targeted ads.
The architecture of an ad server was conceptualized and developed with its own recommender
system, offering a solution covering all different aspects of the ad serving process, including a web
platform for campaign managing.

iv

v
Resumo
Hoje em dia, a elevada percentagem de equipamentos móveis equipados com GPS e
Bluetooth, bem como o aumento de de redes Wi-Fi, torna o ambiente que nos rodeia extremamente
rico em informação. A industria de publicidade vê isto como uma oportunidade para inovar a maneira
como a publicidade em espaços públicos é feita, adoptando sistemas de ecrâs publicos cada vez mais
pervasivos. É neste contexto que surge o projecto Instant Places.
O objectivo deste trabalho é o desenvolvimento de uma solução que permita servir anuncios
na rede de ecrãs deste projeto, usando a informação disponibilizada por esta rede, sobre os seus
utilizadores e ambiente em torno dos ecrãs, para direcionar os anuncios servidos à audiencia correta,
com vista a obter um aumento na taxa de sucesso das campanhas de anúncios servidos pela rede.

vi

vii
Contents
Abstract .................................................................................................................... iii
Resumo ..................................................................................................................... v
List of Figures ........................................................................................................... ix
List of Equations ....................................................................................................... xi
List of Tables ........................................................................................................... xiii
1. Introduction.....................................................................................................1
1.1. The Evolution of Digital Signage .................................................................. 1
1.2. Digital Signage Stakeholders ....................................................................... 3
1.3. Instant Places ............................................................................................. 4
1.4. Motivation .................................................................................................. 4
1.5. Objectives .................................................................................................. 5
1.6. Document Structure ................................................................................... 6
2. Related Work ...................................................................................................7
2.1. Display Networks ........................................................................................ 7
2.2. Hardware ................................................................................................. 11
2.3. Software ................................................................................................... 14
2.4. Audience Measurement Techniques .......................................................... 16
2.5. Situated Digital Interaction Systems .......................................................... 18
2.6. Other Work on Advertising in Ubiquitous Environments .............................. 20
3. Advertising Content Manager Software .......................................................... 25
3.1. Criteria Assessment .................................................................................. 27
3.2. First Stage Study ...................................................................................... 28
3.3. Ad Engines for Instant Places .................................................................... 32
3.4. Study Remarks ......................................................................................... 33

viii
4. Requirements and Architecture ..................................................................... 35
4.1. Differences between Online and Digital Signage Ad Serving ....................... 35
4.1.1. The Audience ..................................................................................... 35
4.1.2. Session Control and Ads Life Time ..................................................... 36
4.1.3. Scheduler .......................................................................................... 36
4.1.4. Network ............................................................................................. 37
4.2. The Digital Signage Network of Instant Places ........................................... 37
4.3. Ad Server for Instant Places ...................................................................... 39
4.4. Ad Server Architecture Overview ............................................................... 43
5. Implementing the Ad Server ......................................................................... 49
5.1. Campaign ................................................................................................ 49
5.2. Content Management System ................................................................... 53
5.2.1. OpenX ............................................................................................... 56
5.3. Display Manager System .......................................................................... 60
5.4. Update Module ......................................................................................... 65
5.5. Activity Stream ......................................................................................... 67
5.6. Data Mining Module ................................................................................. 70
6. Conclusions and Future Work ....................................................................... 75
6.1. Lessons Learned ...................................................................................... 75
6.2. Goals Achieved ......................................................................................... 77
Bibliography ........................................................................................................... 81

ix
List of Figures
Figure 1: A man looking down the peephole in an open kinetoscope ....................................... 2
Figure 2: MyLOC station in the Library of Congress. ............................................................... 8
Figure 3: Digital Signage Network Agents ............................................................................. 26
Figure 4: Ad Server in Instant Places Network ...................................................................... 40
Figure 5: A click on an ad in the Ad Server for Instant Places ................................................ 42
Figure 6: Instant Places Ad Server Architecture .................................................................... 44
Figure 7: Ad Server Website Use-Case Diagram .................................................................... 45
Figure 8: Message types between the display app and the ad server ..................................... 48
Figure 9: Campaign Setup Interface (First Step) ................................................................... 50
Figure 10: Campaign Setup Interface (Second Step) ............................................................. 51
Figure 11: Campaign Setup Interface (Third Step - 1st Form.) ................................................ 51
Figure 12: Campaign Setup Interface (Third Step – 2nd Form.) .............................................. 52
Figure 13: Display app requesting a set of ads ..................................................................... 55
Figure 14: OpenX Concepts Relationships ............................................................................ 57
Figure 15: OpenX in the Ad Server Architecture .................................................................... 59
Figure 16: Sequence diagram describing the ad serving process .......................................... 64
Figure 17: Sequence diagram showing the ad delivery process ............................................. 65
Figure 18: Sequence diagram of the click recording ............................................................. 69
Figure 19: CARS Architecture ............................................................................................... 71
Figure 20: Difference between areas .................................................................................... 73

x

xi
List of Equations
Equation 1: Recommendation Formula ................................................................................ 60
Equation 2: Ad Bid Formula ................................................................................................. 61
Equation 3: Click Through Rate Formula .............................................................................. 62
Equation 4: Place Relevance Formula .................................................................................. 62
Equation 5: NGD Algorithm .................................................................................................. 67
Equation 6: Distance between keyword sets A and B ............................................................ 67
Equation 7: Ad Relevancy Formula ....................................................................................... 74

xii

xiii
List of Tables
Table 1: Resume of the study of Ad Engines ......................................................................... 32
Table 2: Bid increments ....................................................................................................... 61
Table 3: Item model example ............................................................................................... 72
Table 4: User model matrix example .................................................................................... 72

xiv
1
1. Introduction
This dissertation will focus on the study, conceptualization and development of an ad delivery
solution for a digital signage network, the Instant Places. An innovative digital signage network that
conciliates the content delivery method used by digital signage networks with the one used by websites
on the internet. We will present how the ad delivery was designed and implemented, including our
advert recommendation method.
Before we dwell into the details of the problem at hand we need to have a work, Digital
Signage. An exact definition of what digital signage “is” is not a trivial matter. The term has been widely
abused and replaced by different industries, as consequence, it is common to find many different
terms for “digital signage”[1].
A suitable definition for this term, in the context of this work, was given by Lars-Ingemar
Lundstrom[2] and states the following: “Digital signage provides dynamic real-time, near-real-time, or
non-real-time information that may be individually adapted to the location, time, situation, and who is
actually watching the screen. Using simultaneous screen elements such as regions, layers and tickers
(or “crawlers”), several messages, originating from different sources (and places), may be combined
on one single screen. Though providing information in a fully automated way, the medium also allows
for interaction with the viewer, using touch screens or other means of user control.”
1.1. The Evolution of Digital Signage
Digital signage is a visual medium used to disseminate information still relatively new. Humans
have used images to communicate as early as prehistoric times, at that time the cave men drew on the
walls pictures passing information to others that would encounter them. In ancient Egypt, they used
tablets as a visual medium. These were placed in areas with high people affluence like town centers
[3][4]. Until the 15th century, billposting was the only mean to pass visual messages to a large
audience[4].
A common way to pass visual information for advertising purposes, the poster as we know,
only came with the invention of lithography in 1796 by Alois Senefelder[5]. The poster mass production
only arrived almost half a century later when lithography was perfected, according to the historian Max
Gallo “for over two hundred years, posters have been displayed in public places all over the world.
Visually striking, they have been designed to attract the attention of passers-by, making us aware of a
political viewpoint, enticing us to attend specific events, or encouraging us to purchase a particular

2
product or service”[6]. Soon, after the mass distribution of posters, there was a breakthrough on visual
message dissemination, the kinetoscope (Figure 1) was invented. It was the first screen with moving
pictures, after just a few decades of its invention it was already used to pass on informational
propaganda and commercial adverts. Only half a century after that it was when the first digital screen,
the well knew television, entered the people’s lives, for the first time the visual messages could reach
the inside of people’s households. In the early 90’s, the advent of the internet changed the way
information visual was delivered, for the first time the viewers could choose on demand the information
they want to see. Now with the evolution of the mobile devices in the last decade made possible for
every person to access the information they want anywhere and anytime.
Figure 1: A man looking down the peephole in an open kinetoscope
Each one of the aforementioned visual mediums (posters, tvs, computers and mobile devices)
provides a medium through which people can communicate with each other. They reach a lot of people
in different ways and places, but still there are a lot of opportunities to be explored in the field of visual
information dissemination, specially the places with a large public affluence.
In the past, the predominant visual medium in these places was the traditional paper poster,
unfortunately, this medium only presents a static message (or a static set of messages in the case of
rolling billboards) and usually a fairly limited set of information can be passed in each poster.
Otherwise, the posters would require a fair amount of attention from its viewers in order to pass the
message, and viewer attention is something not easily achievable in nowadays world.
With the introduction of new technologies, we are witnessing a growing new visual medium in
relatively crowded areas, namely the digital signage screen. Now, we can find digital signage screens in
a myriad of locations, in different shapes and sizes. They vary from a small screen inside a super-
market promoting nearby products to a giant screen on the side of a highway delivering the right ads at
the right time.
3
1.2. Digital Signage Stakeholders
In a digital signage network there are different key players involved. These can be summed up
in the following groups: audience, advertisers and the location owners. Each one of them has different
interests and motivations.
The audience is represented by the screens’ viewers. They are the engine that makes the
whole network running. Not reaching the audience or failure to captivate its attention leads to the
demise of any digital signage network. To avoid that, knowing how to characterize an audience is
crucial to the network. Learning to answer questions like: “Where the audience is?”, “What time is it?”,
“Why the audience is there?”, or “What the audience is doing?”, will help to choose the right message
to be transmitted by the digital signage network and considerably increase the odds of capturing the
audience attention.
The advertisers are responsible for delivering contents to the network. Usually they work with
advertising agencies that create the ads on their behalf. The advertisers are responsible for creating
messages made to reach the audience. If an advert is too simple or bland may not catch the audience
eyes, or if it is too elaborate or confusing may not pass the message in the intended way. It is
incumbent to the advertisers to create suitable content that attracts the viewers and obey the networks
restrictions and respective country laws.
The investors in digital signage vary from shop owners, restaurateurs, chain retailers, banks,
airports and train-stations all with different objectives for the digital signage to comply. Retailers owners
are mostly interested in increase their immediate sales, banks and financial institutions usually use
their digital signage network to promote their own products and services in an educational way. Airports
use digital signage mostly for viewer information instead of promoting their own services. Restaurateurs
are relying in digital signage as a form of entertainment to enhance their costumers’ experience.
Besides the previous mentioned digital signage intervenient, there are a lot of people with
different jobs working on this business. Some of the most common are hardware suppliers that sell or
rent their flat screens, the network operators that do maintenance operations on the digital signage
network, the network providers, the software suppliers, and even integrators that sell a complete
solution (hardware and software) to a digital signage network.
4
1.3. Instant Places
The Instant Places is a pervasive digital signage network designed for social interaction. This
network allows interaction between place owners, viewers, content creators and advertisers.
In the Instant Places network, the concept of place corresponds to a real location equipped
with one of the pervasive displays of the network. The place owner can create and manage a place,
making the Instant Place content customized to the preferences of its owner, leaving up to the owner to
choose the applications that run on the screen. The content of a screen is made-up of applications.
These applications are developed by content creators and made available in a market. The viewers can
then go to an Instant Place area and interact with the screen contents explicitly through an application
on a mobile device and implicitly through the use of pervasive screen sensing technology (Bluetooth
scanner) that detects the local passersby. The information collected of the viewers’ interaction and the
area surrounding the screen (e.g. stores, streets, weather) is also available to be used by applications,
allowing them to generate personalized content to be displayed on the screen.
While having similarities to a traditional signage network, Instant Places also has an online
component that opens the doors to explore some of the online ad delivery techniques on a digital
signage network. We will focus on bringing to the Instant Places network, audience targeting and
environment contextualization. Techniques used by online ad serving networks to increase the success
of their ad campaigns.
1.4. Motivation
Nowadays, the online advertising business is in an all-time high[7], at the same time the rise of
the social network phenomenon, made arise the opportunity to reconcile the potential of online
advertising with the dynamic of a social network, in public or semipublic spaces. The work developed in
this thesis aims to bring contextual and behavioral advertising to a digital signage network emulating
the audience targeting abilities found in the internet advertising environment. Using as a test bed digital
signage network the Instant Places project we aim to find a solution for networks with similar traits.
The project Instant Places covers different areas of computing and social science. It is
distributed software which interface allows an opportunity for social interaction outdoors. Instant Places
has a strong social component rich in exploitable information. In the scope of this work, it is
investigated the use of a customized advertising engine able to explore the information of the Instant
Places users, the information about advertisers campaigns and the context in which the displays are
inserted.

5
This problem arose from the need of creating a self-sustained or profitable digital signage
network that would enhance the areas covered by it. These networks were developed to create a
positive impact in public and semi-public waiting areas, expecting to make audience wait time more
tolerable. Also, ideally, they would create a positive experience so people would be compelled to revisit
the space.
1.5. Objectives
The main objective we pretend to achieve with this work is to find a solution to deliver
contextual and targeted advertising to a digital signage network, the Instant Places. The objective of this
work is not only to deploy a working ad engine for Instant Places, but also the following:
The investigation of the advertising engines available and their capacity to adapt to a digital
signage network’s contextualized message serving system. Learning if or how contextualized
messages are served in another networks’ ad engines.
To explore the different audience information sources in the Instant Places digital signage
network. Knowing the audience and contextualizing the environment are the stepping stones of
an efficient message delivery system.
To conceptualize an ad server architecture suitable for the Instant Places network, integrating
all aspects related with the delivery of ads on the network screens, from the campaign creation
and managing to the delivery of the ads on the screens and in the user’s mobile devices.
To implement a flexible pricing mechanism allowing both screen impressions and the clicks
made through mobile devices, to be tracked and managed, following a current set of
established guidelines from the Internet Advertising Bureau (IAB) for tracking clicks.
Allow the network to manage and define different aspects of the ad delivery including the
relevance of the campaign bid prices, the relevance of the ad to the user and the relevance of
the place context when delivering the ad. Defining and changing how much these aspects
affect the ads delivered on the screens allows the network administrator(s) to control over how
they want to run their network. Deciding if they favor the immediate gain or instead if they
would want to bet on the future.
To develop a recommender system that delivers ads using audience targeting and environment
contextualization, emulating online advertising in a digital signage environment that operates
both online and offline.

6
With the results attained, we pretend to contribute to a better social environment in areas
covered by digital signage networks by presenting relevant and customized messages to the audience.
This is to avoid saturating the audience with repetitive irrelevant messages which in time would lead to
the degradation of the experience offered by these networks.
Finally, it should be noted also that our main goal with this work is not to find an optimized
solution or to create an advanced recommender system, but to explore the data and new scenarios
provided by the Instant Places network. The ad engine for Instant Places is aimed to offer itself as a
platform for different recommender systems to be experimented on the network. The recommender
system developed for our ad engine should be taken only as an example of how the information can be
explored and what information would be of importance to it.
1.6. Document Structure
The first chapter introduces and contextualizes the theme of this document. The motivations
that lead to this work and the goals aimed by it are also detailed in this chapter.
In the second chapter, we describe the study done on the current state of art on advertising on
digital signage networks. We describe the different network types and how their goals differ, noting that
it directly affects the way the network serves its ads and even may impose some restrictions to the ad
message contents. We finalize this chapter by focusing on the previous work done in recommending
ads on systems that share some of the Instant Places digital signage network characteristics.
In the third chapter, we present a survey on current online ad serving platforms, where we
analyze the feasibility of their use as the foundation of the ad serving solution for Instant Places.
The fourth chapter focuses on establishing the differences and parallels that the ad serving
solution in this work has with both online and digital signage traditional advertising. Also, a conceptual
architecture of this solution is presented in this chapter.
In the fifth chapter we detail the ad serving solution architecture and its implementation. We
finalize our study with some remarks about the shortcomings of this concept and ideas for future work
that can be built on top of the solution developed on the sixth chapter.
7
2. Related Work
In this chapter, we will describe and give examples of the different types of digital signage
networks and their goals. We will survey the work done in the different areas related to the delivery of
contextualized and targeted metrics, by covering previous works that explore user interaction to achieve
audience targeting and contextualization or even alternative audience metrics. We start by analyzing the
different types of networks, exemplifying when deemed relevant with previous network applications of
said type.
2.1. Display Networks
The network type directly affects its contents, and also the way they are presented, making us
focus our study on networks similar to Instant Places. The same can be said on the message purpose.
To study an advertising solution for the Instant Places network, we need to identify several aspects
about the network, namely, the goal of the message delivered by the network, its type, the technology
of its screens and the network organization.
The screens are just a part of the digital signage network architecture. A network is composed
by a set of screens connected through a network being controlled and managed by a piece of software.
The screen can be just a digital billboard capable of showing a text message, a large high
definition flat screen (LCD, LED, and Plasma), a cylindrical screen[8], a projection or even a hologram.
The network communication can be done by cable, or wireless through antennas or even
satellite[9].
The software that manages and controls the content of the digital signage network can be
installed on a central server, a set of distributed servers interconnected or not, or even each screen can
have their own instance of the software.
All these different aspects have a direct impact on the way viewers perceive the messages sent
by the digital signage network, and are inherently linked with the digital signage network’s purpose. For
instance, a network promoting sales, events or information in a shopping mall may not need a large
screen, and a local area network would be enough to cover the whole building. While a network of
screens placed near a highway across all country is quite different. It requires large screens, so drivers
can see the message from afar and a large network to cover a vast area if needed.

8
The different types of digital signage networks can be classified through their message
purpose. They can be commercial, informational, behavioral and educational or even be used as a
collaborative work tool[10].
Commercially linked digital signage usually tends to promote the sales of a product or service,
or to create and enhance brand image.
Informational digital signage is often found in places usually frequented by non-native persons
like airports or train stations showing the schedule of arrivals and departures, or tourist interest points
showing information about trails, bus schedules or weather.
Behavioral screens are common in waiting rooms their objective is to help to entertain the
people waiting, reducing their perceived wait time. These screens often offer entertainment to its
viewers in various forms e.g. games, videos, social networking, or can also be used to persuade the
viewers to use others services, or products as is usual in waiting rooms in banks promoting the use of
internet banking or paying bills online.
Educational digital signage screens are usually found inside museums and places alike.
Through viewer interaction, these screens usually answer visitors’ questions and test their knowledge
with quiz like programs. An example of these screens would be the MyLOC stations (Figure 2)
developed by SecondStory.
Figure 2: MyLOC station in the Library of Congress.
Instant Places falls into the entertainment type networks, its goal it is to contribute to the
enrichment of the place where its screens are inserted diminishing perceived wait times and also,
hopefully, to engage passersby drawing public interest to the place.
9
Previously we classified the digital signage networks according with their message purpose, but
they can also be classified accordingly to their place. The type of place directly affects the way the
digital signage economic model works, and also the way the digital signage message content is
delivered. There are three main types of digital signage networks: POS (Point of Sale), POT (Point of
Transit) and POW (Point of Wait)[11].
The screens of a Point of Sale network are found immediately near a product or service for
sale. The viewers of these networks are buyers on the verge of making a purchase. The content served
by POS networks focus on promoting a brand, product or service to guide the shopper in making an
instant purchase.
The return on investment (ROI) in these networks is given by the number of sales made,
directly determining the success or failure of the network.
The POS networks are usually owned by a brand. The screens of this network type are
commonly found on the top of a shelf in a commercial surface. When the network is brand owned,
independent of a retailer, the focus of the network is to steer away the consumers from the competition
by providing product promotions and alike. Detailed information about the local competition, time of
day, sales objectives are essential to these networks in order to determine the messages passed by
their screens. When a POS network is controlled by a retailer, the main goal is to focus on the retailer’s
objectives (stock clearance, the sale of complementary services or others).
The Point of Transit networks screens are usually found in digital billboards, transit hubs and
shop’s vitrines. Their viewers are passersby who have a short amount of time to look at the screen.
This changes considerably the way the content is displayed in these screens. The screens serve short
messages (with a short word limit, or short videos) and quickly alternate between them. Their main
objective is often to build brand image and value but is also common to find these screens promoting a
nearby service offered by a retail center, hotel, gas station, or casino. The success of this type of
network is measured by the number of eyes that the message presented reached.
The contents displayed by POT networks are shaped by the place where the screens sit. Digital
billboards near a road usually cannot have animations due to security risks imposed to the drivers, so
often are showed in these screens short messages and simple images that are direct and clearly
standout. In another hand, a screen inside a transit hub like an airport has more time to present a
message. In this and similar cases, the digital signage networks explore the viewer’s interest in seeking
10
information about their travels like schedules, or the weather and time. These screens often display
commercial messages alongside with that information, creating a business opportunity.
The screens of a POW network are found mostly in waiting rooms, inside elevators, bars and
restaurants, health and fitness centers. The viewers of these networks usually have a large dwell time
and actively seek forms of reducing their wait time. The ROI on these types of networks is measured by
a combination of eyes reached, behavioral change in the viewer and even direct sales. This is the
network type classification that better describes the Instant Places network.
Health care, bank, post office waiting rooms, fitness centers or restaurants and coffee shops
usually are the public areas where people have the most time to spare attention. Digital signage
screens in those areas show their messages in an almost opposite way of a POT network. Its viewers
tend to be looking at the screen for a considerable amount of time, and if a screen is constantly
changing its contents people tend to lose interest in it. So instead of short messages, more elaborate
and medium to long messages are common in these networks. As in the case of Zoom Media [12], that
has the largest fitness network in USA. They have many types of screen installations. One of them
consists in deploying an interactive screen in a cardio exercise machine. These screens are highly
personalized. The user has the opportunity to pick and choose between screen contents, including tv
channels or even series on demand. In exchange the network serves a few commercials among the
contents. This is an example of how a digital signage screen can help increase viewer comfort and help
the place owner to increase business.
The same type of network and screen message contents appears in restaurants and bars
covered by a POW network, like TouchTunes[13] or Jukola[14], both offering a digital jukebox service.
These types of screens like many other POW networks have as an objective not (only) to make money
from commercials but to offer a better experience and service to its users.
All these network types may vary considerably in terms of technology and objectives. While the
ROI in some is not immediate and or cannot be easily determined, the digital signage offers the
opportunity to overcome limitations imposed by its most direct substitute, the poster and pamphlets.
While the investment is bigger it does offer a lot of others advantages that should be taken into
account, besides energy costs and some hardware maintenance, no other resources are needed to
distribute messages by the network. While its paper counterparts have printing, transportation and
distribution costs every time they update their message. A digital signage network can do things simply
a paper medium cannot do, like showing multiple messages in the same area or live content updating.
11
Also, the impact made by a screen in its viewer is bigger than the one made by a paper, giving a bigger
chance to pass on the message to the viewer.
2.2. Hardware
There is a clear characteristic that stands out in a digital signage network, and that is the
network screens. The size of the screen varies a lot, screens used outdoors tend to be a lot bigger
than the ones found indoors, and this is because they are intended to be looked at by the audience at a
great distance. Outdoor screens are, usually, low resolution because they are cheaper and also, the
majorities of outdoor digital screens that are in point of transit networks serve simple messages, meant
to be seen from afar, not requiring high definition at all. The display of video or animation is not
suitable in POT networks due to low dwell time of the viewers and, in some cases, laws forbid video
display in certain areas.
In indoors areas medium to small screens with higher resolution are used. Being the smaller
ones usually found on shelves in retail stores.
The hardware and software used by a digital signage network varies considerably between
network type (POT, POS or POW), on top of that a lot different experimental digital networks are trying
to bring new technologies to digital signage. A screen can be a regular display screen, a touch-screen,
a projection, even a holographic projection[15] or, possibly, in the near future touchable
holography[16]. Other hardware equipment varies depending on the technologies used and perceived
goals. We can find a large number of purposed technology alternatives used by digital signage screens
in the environment surrounding us. Bluetooth scanners, RFID readers, RFM radio scanners, movement
sensors, Wi-Fi sniffers and video cameras are some of the most used technologies used for screen
context analysis.
Both radio scanners and movement sensors can be deployed in roadsides to count audience.
Some radio scanner digital signage systems can customize the displayed ads to the radio content that
is being listened to by the passersby[17].
The Bluetooth scanners and RFID readers present similar capabilities, both being able of
individual identification given that viewers explicitly agree to do so and carry active Bluetooth devices or
RFID tags.
Individual recognition can also be achieved implicitly, without the awareness of the viewers,
through the use of face recognition software and a camera. Other pertinent data can be inferred
12
through individual recognition, most notably, is the construction of an individual history with the places
the viewer visited and the ads seen.
Wi-Fi sniffers are also used for this purpose, and complementarily, the study presented on [18]
shows that Wi-Fi networks can be used to pinpoint the location of a person. The information about a
person location near a screen would certainly impact the way audience targeting could be done in a
digital signage network. This information could be used to identify the members of the audience that
are more likely to be watching the screen, optimizing audience targeting. Also, inferring how much time
each audience member spent near a screen is valuable information. The network can use this
information to target its audience, in a similar way to the online environment where the time spent by a
user in previous webpages is used, among other information, to create online recommendations.
Unfortunately, a lot of this technology is not commonly used due to the costs associated with
them and laws regarding privacy rights. The screens using these technologies are called pervasive
screens.
A digital signage network can also be classified by the use (or no) of technologies that allow
pervasive audience data collection. The pervasive screens, unlike the non-pervasive counterpart, gather
information about their audience in an implicit way, for this a myriad of different technologies, like the
ones previously mentioned, are used to achieve different effects. Pervasive systems opened the doors
to a new way of making outdoor advertising, turning it increasingly similar to web advertising. The
screens of these digital signage systems can use hardware to sense and count the audience
surrounding them[19], precisely identifying the areas with the biggest people influx, and opening the
opportunity to establish a bidding competition over the best areas between the advertisers.
Some digital networks systems explore pervasive technology even further, and besides to
measuring the audience, they can identify and interpret the emotions expressed by individuals in the
audience[20], or even estimate the social status of an individual through the clothes he or she is
wearing through the use of video cameras. Other systems explore senses besides the vision, as a mean
to enhance the message transmitted by the network, particularly the sense of smell was successfully
used and tested capable of stimulating emotions on the audience[21], in an attempt to get public
attention. There are limits to practical applications some of these technologies, in many places and
countries there are laws forbidding the recording of video or audio.
Non-pervasive screens rely in the audience will to explicitly share their information with them
not using motion sensing, cameras, microphones or any other means to capture information from the
13
audience surrounding them. Instead in these digital signage networks, the audience exposes its data
through a registered profile in a website that later is associated with a mobile number, Bluetooth id or
even a RF-Id tag, being the individuals of the audience the ones who decide if they want to
communicate with the screen or not.
The screen does not need to be fixed in one place, neither the scope of the ad network needs
to be limited to the delivery of the ads on their screens, like Instant Places, other networks aim to
expand their reach by using the users mobile devices as an interaction proxy and an alternative to
deliver the network contents. This approach to digital signage ad serving removes a lot of the costs and
implications carried by the deployment of the technology needed to recognize viewers and the support
of interaction directly on the screen. The downside is that users must be persuaded to allow the upload
of the contents to their mobile devices.
The interactive screens are mostly found in POW networks where the audience has some of
their limited time to spare in front of the screen. The interaction is done through the use of actionables,
these are messages or interactive features with the purpose of turning the audience members in users
of the digital signage network[22].
The interactions can be divided on two big types of interaction: active and passive. Active
interactions are done in a direct manner, in which the viewer interacts directly with the screen
contents. Most commonly, through touch, the audience can cast votes about a subject, answer quiz or
play games. This is done with the intent of either allowing the system to gather more detailed
information about the user[23] or just as a pure form of entertainment for the audience. Besides touch
screens, there are active interaction screens that offer others alternatives for user interaction, like
motion tracking hardware capturing the movements of the user allowing interaction with the screen
without the user having the need to touch it physically. In others networks, theirs screens contents may
function like a webpage which the audience through the use of a mobile device app or simply a web
site that can access the screen contents and interact with it.
Passive interaction happens when the action is done outside the screen, usually in a user
mobile device. This interaction type requires the screen to be able to detect the audience mobile
devices, through the use of different communication technologies like Bluetooth, RFID, Wi-Fi, and
upload to them network messages. This makes the messages served by the network to the audience a
lot more personalized and targeted because each audience member is getting its own message. The
downside, in most cases, is that the audience individuals must allow uploads to their mobile device.
14
This may present security risks to their data privacy and also big inconveniences like having their
batteries drained faster by turning on Wi-Fi or Bluetooth. Another displeasing side is the bandwidth
consumption that is often limited by mobile networks.
Interactive digital signage networks do more than just get public attention they interactively
engage it, shifting the digital signage systems from an economy of attention to an economy of
engagement[24].
Using the different classifications presented so far we can define the network type, for which
we intend to develop a software solution for ad delivering, as an interactive POW network. Furthermore,
in respect to the interaction method used we can describe it as a network offering passive interaction
through the use of mobile devices.
2.3. Software
The software that runs a digital signage network can be divided in two parts, the display
software and the content manager software. The display software is in charge of running the messages
on the screens. It is common for this software to display multiple messages in different areas of the
screen. The content manager software is responsible for the delivery of the contents to the screen
dealing directly with the aspect of the contents (e.g. format, size and location in the screen).
An ad engine is another name for the content manager software of a digital signage network
that is focused on the delivery of commercial adverts to the digital signage network. To understand
what an ad engine is and what it does, we are going to give a description of the elements and concepts
related to an ad engine for a pervasive public screen network that serves advertisements on screens in
public areas.
In the ad engine point of view, a public screen network is a network that represents many
screens. The network sells its ad serving services to marketers, advertisers or advertising companies.
The ads are supplied by individuals that required the ad serving services of the network.
Usually the ads are also referred to as creatives. Depending on the network they may have restrictions
on their format and contents. Usually the digital signage networks impose some limitations such as
fixed sizes, file formats, forbidden content, or even abiding laws related to the nature of the contents
displayed.
Ad engines can enhance the success of their ad campaigns by using behavioral targeting. Its
goal is to decide which ads are most relevant to be presented to a user based on the previous recorded
15
behavior of that user. In an online environment, there are numerous data that can be collected about a
user. The previously visited pages, time spent in each page, clicked links in the page, items bought,
items viewed and searches made. It is from this data that a profile model about an individual is drawn,
aiding the ad engine to decide the best ads to show to each individual. In OOH digital signage systems
not all of this information is accessible, the data that can be collected refers to the data explicit by the
viewer and past interactions (both active and passive) with the own digital signage system. A proposed
solution to this limitation in digital signage systems is the use of social network data mining. It is a
solution that has been studied[25] with Social Networking Services and explored by ad serving
solutions on the web.
In an online contextual advertising system, the ads are served to the viewers based on the
content of the current page. This technology is used by many companies. An example is Google
AdWords, an ad serving service that is capable of inferring the theme, contents, link structure and page
structure of a web site in the form of keywords using them for the selection of the ads with more
relevance to each page. In digital signage systems this area is a lot broader, the context is extended to
outside the screen and to the environment surrounding the screen display. Information about what is
surrounding the screen like stores, restaurants, roads, weather conditions, the estimated number of
passersby, and other data are used to contextualize the ads to that environment. This type of targeting
is commonly used in indoor digital systems, especially inside stores, where a screen announcing a
product promotion in its vicinity has been demonstrated to be very persuasive according by the studies:
Arbitron Retail Study and JC Decaux/TescoTv Study [1, pp. 32,33]. In the case of mobile digital
signage, the screen is usually the one of a mobile device owned by the viewer. In this case, the digital
signage system must be able to pinpoint the viewer’s location in order to identify the most contextual
relevant locations, e.g. closest restaurants, stores, etc.
An event in contextual advertising can be defined as the moment when the software system
collects all available information (time, audience and environment around the screen) in order to use it
to show the next ad. This happens in networks that serve targeted and contextualized ads in real time
to the audience. The triggers of events can be time scheduled, but there are other ways like as pointed
out in[26] where is presented a design space for advertising in Digital Signage based on the concept of
digital footprints. The digital footprints are abstractions for traces that people left behind when
interacting implicitly or explicitly with Digital Signage. Some digital footprints can be used to trigger the
events, more precisely through audience detection or both implicit and explicit interactions
(actionables).
16
All the parameters: targeting, contextualization, budget, limitations or creative content, are
defined by the setup of the advertising campaign. Not every network has the same charging
mechanisms or offers the same targeting and contextualization services. These campaigns are
established online usually through a website page in both, digital signage and online advertising. The
campaigns are then validated and added to the content management system of the ad server. The
software to establish campaigns is not uniform. Depending on the network, it can either be a website
page or a network owned application that is given to advertisers and other agents that want to create
campaigns to be delivered by the network. Some digital signage networks do not offer these solutions
instead the campaign is established by contacting the network staff which in turn creates the
campaigns.
2.4. Audience Measurement Techniques
In Digital Signage, the most used budget consumption metrics defined on a campaign are
based solely on the number of audience impressions, or in lack of better measure, exposition time. The
networks nowadays are becoming more standardized. Following the Audience Measure Unit,
recommended by OVAB, to determine the number of audience impressions.
Through the use of actionables in a digital signage network screen, we aim to bring others
metrics present in online advertising. There is a resume of possible compensation methods that can be
established in Digital Signage through the use of actionables:
CPC or PPC: Cost-Per-Click or Pay-Per-Click, the advertiser pays when the ad is clicked, this
can be achieved in Digital Signage system with technology that support actionables. The click can
either be done directly on the screen or in the mobile device of the viewer.
CPV: Cost-Per-View, the advertiser only pays for each person that sees the ads. This payment
method is very uncommon in Digital Signage because it requires a camera and eye-tracking technology
capable of identifying if a person is looking at the screen.
CPA: Cost-Per-Action, the advertiser only pays if an action occurs. Usually an action is a sale or
the filling of a form. Like CPC this can be achieved through actionables or with a use of a system like
coupon redeeming, in which an exclusive coupon code is given to the viewers.
The advertisers can also personalize the target of their campaigns explicitly by specifying the
location, demographics and context of the viewers, like age groups, gender, day time, date and
geographic location, for example.
17
The digital signage world has not yet adopted a complete standard of audience measure
system. This happens due to the great heterogeneity between the different networks and also the
advertisers’ objectives. Some advertisers are more interested in their message to reach the maximum
possible number of people, others are only interested in knowing in which persons the message took
effect. POT networks are all about the number of eyeballs reached the same does not happen in POS
networks while advertising a product in a shelf of a retail store, in this case, the number of people that
passed through the aisle is not very relevant. They measure the success of the digital signage network
product advertising in the number of product sales.
On the internet, the audience measure is done through the use of different metrics like the
cost-per-impression and cost-per-click. These metrics are relatively easy to keep track of due to the
browser environment in which internet ads are served. When the web page loads an impression is
counted on, and/or a click if the viewer clicks on the message served. In digital signage, these metrics
are not so easy to implement. If the screen does not offer any interaction support, a click metric could
never be used. Counting the number of impressions in digital signage is not an answer to the number
of people reached by the message on the screen, because unlike in the internet, where audience is in a
private browsing environment, a screen in a digital signage network is in a public space. An impression
on a digital screen often reaches a large amount of people.
These metrics need to be able to present proof of the delivery of contents to the audience.
Content delivery proof usually is accomplished through the use of system logs as is the case of most of
the digital signage software, these logs store data like the screens, the location, the time and date and
the ad or message played. While it is easy to prove that the content was delivered, it would be very
difficult to establish a harmonized audience measure system in all the different networks. But, to
establish a common audience metric system through a set of quality methods is feasible, and DPAA
(Digital Place-Based Advertising Association) at the time known as OVAB (Out-of-Home Video
Advertising Bureau), established some standard audience metric guidelines[27] that have become the
standard for measuring digital signage audience by media buyers.
The OVAB proposed the Audience Unit Measure and defined it as “the number and type of
people exposed to the media vehicle with an opportunity to see a unit of time equal to the typical
advertising unit”. Before those guidelines being established, it was common to use the raw measure of
venue traffic as the audience metric. Unfortunately, this is not a good audience measure because not
every person that goes through a venue with a screen is going to see it, or even go near it. The
18
Audience Unit Measure takes into account the total venue traffic, but it also adds others dimensions to
this measure like the number of people that go through the venue, of those, the distance of them to the
screens and even the place where the screen is installed. Besides the total venue traffic, it is also
measured the number of people that watch or had the opportunity to watch the screen. For this, the
distance between the viewers and the screen is taken into account when measuring the estimated
audience dwell time. The people dwell time can be defined as the time spent when they were on the
vicinity of the screen. This measure is crucial for advertisers because usually messages are passed in
loops, and the time of a loop must be in accordance with the dwell time of the viewers. A loop too short
will repeat the same messages over and over, making the audience lose interest on the screen, on the
other hand if the loop is too big the audience may not have the opportunity to see the messages in the
loop. Also, a message play time should never exceed the dwell time of viewers for this reason. The
Audience Measure Unit needs to account for the proximity of the viewers to the screen (referred as
presence in vehicle zone, the vehicle being the screen), the dwell time (the average time the audience
is in that zone), and either a total of the people who watched the screen or a percentage rate of the
audience that actually looked at the screen. The combination of these values them translate in the
number of audience impressions. This number is now being used by some networks to estimate the
cost of an ad placement.
A lot others networks are instead interested in engaging the viewer through interactive features.
In these cases, the screens are a portal through which sales can be made, making the number of sales
made through the digital signage network the best ROI measure. Some tests were made in networks of
this type using ideas like coupon redeeming[28][29][30], where a coupon would be uploaded from the
screens of the network to the viewers’ mobile devices, later the viewers could aggregate those coupons
and get discounts in local stores. Alternatively, another network could upload the messages passed on
the screen to the mobile device of the viewers. This would allow the network to measure the click-
through rate of the ads served to the audience mobile devices, much like in the e-commerce
advertisements.
This work falls on the latter type of networks, using viewer’s direct interaction with the contents
(clicks) as a measure of ROI. We aim to follow a current set of guidelines for tracking ad clicks.
2.5. Situated Digital Interaction Systems
As previously mentioned, the interaction between viewers and a public screen can be done in
various different ways and to achieve different objectives. Some are used to promote work cooperation,

19
others to simply encourage social engagement. So we can better understand how different these types
of networks can be, we will present a small survey of some digital signage systems made for POW
areas alongside their main objectives.
eyeCanvas(FXPAL): It is an interactive community board. It is a large touch screen installed
in a cafe and also at the art gallery, in San Francisco. The viewers could share drawings made
with their finger. The system registers the users email in order to distribute newsletters[31].
The major objective of the screens is to enrich the place working as an attraction.
Jukola (Appliance Studio): It is a music jukebox where a list of songs is displayed in a
screen and the viewers can democratically vote through their mobile devices which song in the
list they want to hear. This system was installed in a Bristol cafe bar[14].
CowCam (Intel): A system used to share photos of a scenario with figurines in a cafe. It is
composed by a webcam, some figurines and a display. This system was installed in the Urban
Grind cafe, in the city of Portland, Oregon[32]. This digital signage system shares the same
goal as many others systems to provide a form of entertainment and attraction to the place.
Notification Collage (University of Calgary): A system used to share videos, sticky notes,
photos to promote awareness in informal environments. It is composed by desktop displays
and public displays[33].
Plasma Poster (FXPAL): Developed by FX Palo Alto Laboratory (FXPAL) the Plasma Poster is
an interactive bulletin board where users can input personal content and share messages with
other viewers[34].
BlueBoard (IBM Almaden): Is a large interactive display that offers fast access to personal
information with tools for collaboration. It is indicated to be used for small groups of people
working side-by-side[35].
MERBoard (NASA): It is a system based on BlueBoard extending its design to support the
collaboration requirements for viewing, annotating, linking and distributing information for the
science and engineering teams of the Mars Exploration Rover mission (MER)[35].
CityWall (HIIT): It was developed by the Ubiquitous Interaction group at the Helsinki Institute
for Information Technology and Multitouch. It consisted in the installation of a big multi-touch
screen in Helsinki. Through this screen people could share their photos or videos locally, and
remotely using Flickr or YouTube as a source for content. This installation was an experiment
that lasted 8 days its main objective was to analyze the dynamics of social interaction around a
large multi touch screen[36].
20
Opinionizer (Sussex): It was developed in the University of Sussex, UK. The system is
composed by a public screen built to encourage socialization in public spaces. It provides a
virtual space in which people can add their opinions in some subjects, forming over time a
collective trace of social commentary. The screen input is made through a laptop[37].
Dynamo (Nottingham and Sussex): It was created by Nottingham and Sussex University in
UK. Dynamo is a public multi-user interactive surface that supports the cooperative sharing
and exchange of a wide range of media[38].
AgentSalon (ATR): Developed by ATR Media Integration & Communications, this system
elms to introduce agents participating in a human face-to-face conversation. The agent would
function as a third person in the conversation monitoring it and automatically suggesting
relevant topics. The interaction is done through personal mobile devices like PDAs belonging to
each person in the conversation and a screen where the agent is displayed[39].
TwiterSpace(Indiana University): Developed in Indiana University. It is an ambient display
that displays twitter posts from the community to encourage enhanced community awareness
and engagement. It functions as a tool mostly for posting activities and general awareness
about community members like birthdays and tracking which members are going to what
events. It has very similar goal to Notification Collage, but it uses the twitter social network as a
mean to introduce interaction and personalized content to the screen.[40]
These and a lot more digital signage systems were made for POW areas, the above examples
were handpicked to underline the heterogeneity found in digital signage networks, it is fairly clear from
the above examples the way of how interaction is done and even the aimed goal differs a lot from
system to system. While some aimed to contribute to the enrichment of the area by providing a mean
of social interaction and entertainment, others are used as work tools. Some make use of touch
screens and others do not. This makes it very difficult to establish a standard audience measure
system.
2.6. Other Work on Advertising in Ubiquitous Environments
Delivering contextual and targeted advertising messages on digital signage screens is a
problem that has been previously studied. The work of Ranganathan & Campbell[41] in the matter is of
great importance it was a pioneer on the establishment a solid set of requirements for effective
advertising.
21
Various studies about the challenges in ubiquitous media environments are summed up and
detailed on [42], where also the suggested solutions and other related studies are detailed.
The impacts on the society made by the technology needed to delivered targeted ads are
discussed on [43], where themes like audience privacy and other legal and ethical matters are
presented.
Many of the digital signage network, and others ubiquitous systems are presented in [44]. A
survey of these networks is provided in [45]. We made another complementary survey of our own on
chapter 2.5. Recently, a comparative survey and analysis of some of these networks was done by
Patrick Soares when presenting is work in [46]. The work developed by Patrick Soares is similar to
ours. It is focused on delivering ads sensitive to the context on a digital signage network. The ads are
both served on the network screens and in the audience mobile devices. Similarly, the interaction with
the screen contents is done through the audience mobile devices using both clicks and impressions as
metrics. His recommendation system to deliver ads is only based on the audience previous clicks.
Using the categories of the ads clicked to determine the categories with major interest and ranking
them according to their respective category.
There are numerous large scale industrial experimental projects investigating the use of RFID
tags and wireless communications, not only for outdoors advertising purposes, but also as a mean to
provide users with new services. Tokyo Ubiquitous Network project[47] at Ginza area in Tokyo is one of
them. The project foresees the equipment of that area with RFID tags, infrared and other wireless
transmitters to create a pervasive environment. This is to promote the shoppers interaction by
advertising various offers, accessing local maps among other things, at the current time this project is
still in development.
Another large scale project is the MINI Motorby[48], created by Mini USA. It consists on the
deployment of giant digital billboards across several towns that react to mini cars drivers, greeting them
with a personalized message determined by several factors like their age, gender, position, current
time, direction and others. The billboards have a RFID scanner and the driver’s key has an RFID
transmitter allowing the users to be identified up to 150 meters. It is a distinctive POT network with the
ability to personalize its messages to the audience in real time. Unfortunately, due to the costs and
technical problems the project ended up being cancelled after the experiment.
We aim to measure the audience through clicks on our ad server solution. Each click is paid by
the advertiser depending on an auction type bids promoting competition between advertisers, much
22
like the BluScreen[49] on digital signage field and the Google AdSense1 and others in online
environments. This implicates interaction between the screen and the audience. Digital signage screen
interaction is the focus of various studies. Rui Jose’s work[50] on interaction through Bluetooth made
possible for the audience members to have their own personalized screen representation. An audience
member would use tags on his Bluetooth device name, which the system would use to retrieve Flickr
photos to be set next to user’s representation on the screen. Later, an enhanced version would
implement a recommendation system based on tags. The system would store a historic of tags that
were retrieved from the message contents of the users that interacted with the screen, to generate
content that would likely reflect the interests of the viewers that would pass in front of the screen. A
similar work was done in [51], but the device names were used as a mechanism to interact with
applications that would facilitate interactive maps and answer to web queries.
The B-MAD system[52] and BlueMall[53] both also use Bluetooth as an interaction channel,
but instead the previous works described, this one pushes messages into the audience devices. The
results of its field trial showed that this behavior was disapproved by some users, especially when they
received ads on their devices very frequently.
Fujitsu’s UBWALL[28] is one of the most popular projects that explore the digital signage
network ability to identify its audience through RFID technology. A method for advertisement in
UBWALL is described in[54]. The UBWALL and MobiDiC[55] both use coupon redeeming as the basis
to calculate the success and impact of its adverts. The coupons redeemed by a user give the network
information that can be used to estimate user tastes. It is a strategy commonly found in numerous
ubiquitous systems [29][53].
An alternative to the coupons is the Pay-Per-Click model. This model has been previously
suggested on [56], where the clicks are estimated through the scanning of Bluetooth devices and time
spent in front of the screens.
The heart of a targeted and contextualized ad serving solution is its recommendation system.
There are three major types of recommendation systems the collaborative, the content-based and the
hybrid that mixes both. These recommendation types are discussed in detail in [57] and [58]. Various
recommendation systems were developed for advertising in ubiquitous environments like one of a
pervasive digital signage network. The MyAds[59] and Bluescreen[60] are both very similar projects to
the one we intend to achieve in this work. They both use auction-based allocation systems for
1 http://adsense.google.com
23
advertising in public displays. Bluescreen exploits the information of past audience transit by applying
a probabilistic model to predict future ones. MyAds uses behavioral advertising, using the provision of
statistical audience information on a real-time and continuous basis. But these projects focus on
targeting single individuals, alternatively, an audience can be target as a whole like in the
GroupCast[61] project. The later intends to develop a physical space that can sense people on its
vicinity, having knowledge of their interests to determine information related to mutual interests.
The Ubicomp[62] has been researching technologies on this field, focusing on behavioral
targeting, aiming to go beyond contextual and place sensitive advertising by analyzing behavioral
patterns to predict the audience interests.
Other ubiquitous systems rely on the use of tags. Those are retrieved from the available
audience information, to build their ad recommendation systems, like Tag Match Advertising[63] or the
SMMART framework[64].
The work developed on point of sales network is aimed to increase the sales of a store’s
product by promoting sales. This problem is very close to our problem in regard to the objective of
targeting the right products to the right shoppers. The work in this area already has some maturity in
the market. It is not unusual to come across small screens near an isle on a groceries shop promoting
products nowadays. A specially relevant work in this area is the MUCS: A model for ubiquitous
commerce support[65], this model matches the buyers offers with the buyers desires ranking them
accordingly several factors including user location, user profile, the product category and the purchaser
history. This model is very close to the one we aim for Instant Places, being that the location and user
context are important aspects for determining the best message to deliver to the audience.
The offline behavior of our ad server solution is based on the behavior of the Adnostic[66] and
Privad[67] advertising systems for online browsers, like them the ads are downloaded previously to the
client application that also is incumbent of the decision to choose the ads to show at the appropriate
time.
One of the projects most similar to ours is Digifieds[68]. It is a digital public notice area derived
from digital classifieds. During the test trial people could use Digifieds screens to share their own
classifieds messages, the system is composed of four components a central server back-end for the
data management, a web-based display client for visualizing information, a mobile phone client as an
alternative interface for interaction with the display, and a public web client. Digifieds’ users are also
the content providers. The screens are used as a social ad sharing platform. Our work differs in this

24
aspect, in our project the content providers are advertisers that purchase the network ad serving
services.
Recently Intel has designed an Intelligent Advertising Framework(IAF)[69] that offers a real time
targeted advertising solution to Digital Signage networks, applying data mining techniques to target the
audience and measuring the impact of its campaigns through AVA (Anonymous Viewer Analytics).
Besides audience mobile devices’ Bluetooth and RFID tags, other technological applications for
interaction have been explored by previous works, like the use of scent[21] or even analysis and
interpretation of the user’s facial expression and visual focus[70][20] to evaluate the impact of the
visualized ads or to interact with them with our gaze[71]. In our work, we use the audience mobile
devices as a mean of interaction with the screens. This has been the interaction mean that the
researchers have focused on[72]. But alternative uses of mobile devices have been proposed, Ballagas
et al.[73] investigated the interaction with screens where a cursor is moved through the use of a mobile
phone camera. Sahami et al. [74] used the device’s flashlight to interact instead. Findings on these
works underline how important it is to the interaction to be an easy to learn and execute process, being
directly related to the user usability and acceptance. This translates to the development of an ad
serving solution where the ads interaction with the user needs to be an easy, short and intuitive
process from the user point of view.
25
3. Advertising Content Manager Software
The analysis of current free and open source ad engines is described in this section. Firstly, a
description of an ad engine is given. After, the study methodology is presented, followed by the criteria
assessment. We finalize with the results of this analysis.
An advertising ad engine is a content manager software system whose mission is directly
connected to the advertising network type that runs it. Nowadays, a content manager software able to
deliver ads efficiently to all different digital signage networks does not exist.
A POT network’ ad engine main goal is to construct the ad loops being served. The loops
construction may vary greatly between different ad engine software. The simplest ones function by
allocating the ads, in a way making them all fit in the ad loop time span. The ad loop time span varies
from screen to screen because it is calculated through the estimated audience dwell time. When
allocating ads several parameters are taken into account, like the time of the day (some ads may be
more suitable for morning periods, like breakfast promotions, or even the weather and temperature,
but for the most part the number of requested impressions/screen time paid by the advertiser will
determine an ad priority over others.
This type of ad engine software is more suitable for simple POT networks. In the later network
type, usually, the ad engine does not have to use or gather information about the audience in real time.
The objective of this network is not to reach a specific demographic, but the largest number of viewers
possible.
However, in POW or POS networks, this type of ad engine is not very suitable. The focus in
these networks is not to pass the message to the biggest possible number of people, but more so in
passing the right message to the right people, making sure the messaged was passed on to the
audience. An ad engine for targeted audiences is a computational solution that deals simultaneously
with the audience, advertisers and environment information, in order to show the right ads, at the right
person at the right time. Figure 3 shows through a simplistic view the dynamics of an ad engine. The
actors of the engine are the viewers who view or receive the ads, interacting, or not, with them and the
advertisers who establish ad campaigns. During the campaign creation, the advertisers provide their
ads, describe the target audience of each ad, and define the campaign budget and plan the campaign
budget consumption. The ad engine is the responsible for the targeting and contextualization of the ads
for the current audience.
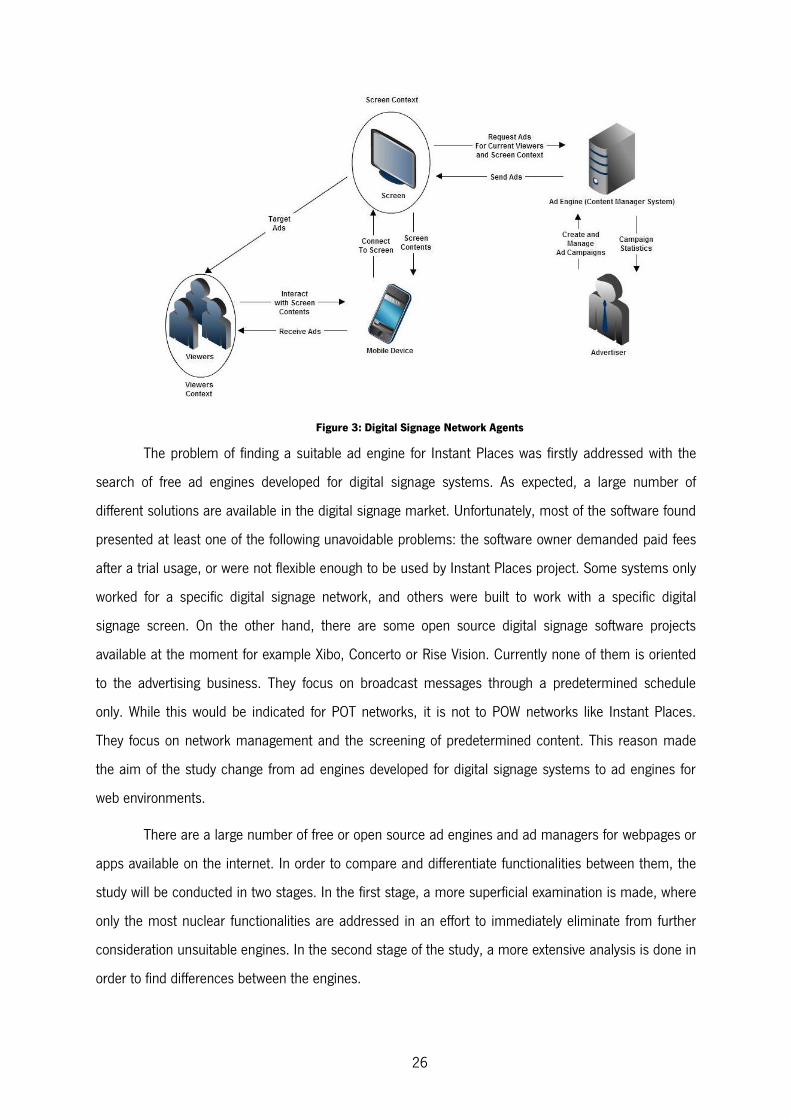
26
Figure 3: Digital Signage Network Agents
The problem of finding a suitable ad engine for Instant Places was firstly addressed with the
search of free ad engines developed for digital signage systems. As expected, a large number of
different solutions are available in the digital signage market. Unfortunately, most of the software found
presented at least one of the following unavoidable problems: the software owner demanded paid fees
after a trial usage, or were not flexible enough to be used by Instant Places project. Some systems only
worked for a specific digital signage network, and others were built to work with a specific digital
signage screen. On the other hand, there are some open source digital signage software projects
available at the moment for example Xibo, Concerto or Rise Vision. Currently none of them is oriented
to the advertising business. They focus on broadcast messages through a predetermined schedule
only. While this would be indicated for POT networks, it is not to POW networks like Instant Places.
They focus on network management and the screening of predetermined content. This reason made
the aim of the study change from ad engines developed for digital signage systems to ad engines for
web environments.
There are a large number of free or open source ad engines and ad managers for webpages or
apps available on the internet. In order to compare and differentiate functionalities between them, the
study will be conducted in two stages. In the first stage, a more superficial examination is made, where
only the most nuclear functionalities are addressed in an effort to immediately eliminate from further
consideration unsuitable engines. In the second stage of the study, a more extensive analysis is done in
order to find differences between the engines.

27
3.1. Criteria Assessment
The engines are evaluated by their adaptability and response to the demands of Instant Places
and not to establish a qualitative comparison between them. Since there are a large number of
engines, each with many different characteristics, instead of considering them all in the study, it only
will be considered the most fundamental and adequate to the Instant Places project. It will be
considered in the first stage of the study the following criteria:
1) Community
2) Development and Maintenance
3) Open Source Availability
4) Campaign Manager
5) Ad Targeting
6) Bidding Optimization
The criteria enumerated above were preferred over others for different reasons. The
community, development and maintenance and open source were picked, because the engines under
analysis were not developed to be used on digital signage systems, therefore, stands to reason that
some software code will be altered or added. Having an active community assists the development
process, because it often offers answers to questions related to the existing software and provides
direct feedback about the existing software quality, assisting in the exclusion of faulty software.
Software with an active development and maintenance team is preferred in order to maintain the
functionalities present in the software bug free and to further extend them in the future. Other criteria
related to code support and development could be established, e.g. documentation quality or even the
quality of the code, but those would require more time to examine which would turn the analysis of the
current state of art not practicable due to the large number of existing software. The other three criteria
are related to the implementation of an ideal ad engine for Instant Places. The engine should allow
advertisers to establish and personalize their campaigns, support some ad targeting and apply a
bidding optimization algorithm to weight the number of ad showings in order to maximize the publisher
(Instant Places) profit. These functionalities are valuable because they provide a starting point to the
adaptation of an engine to Instant Places.
The reasoning behind the selection of the previously mentioned criteria and their definition is
described as follows.

28
Community: The engine must have an active user community dedicated to it. This is a very
important aspect to the Instant Places project. The community allows direct feedback from other users
about their experience with the engine and gives an information background about potential issues and
solutions, also a user community that has been active for many years shows evidence that the engine
is an attractive solution for some users.
Open Source Availability: Having the ability to change the code of the application is crucial
since the engines were not created to be used with the Instant Places screen system. This criterion can
only be overlooked if the engine is flexible enough to cover all the needs of the Instant Places.
Development and Maintenance: An active development is desirable and an active
maintenance is very important. An engine with no active maintenance may present unresolved
compatibility issues with new software updates.
Campaign Manager: The engine must allow the definition of how the campaigns will be
made. It should allow the definition of what will be displayed (text, image, video, etc.) and the campaign
budget including the compensation methods. Preferably, the engine should be able to define the
number of impressions/views as compensation method in order to better fit the needs of Instant
Places. An engine without the ability to be flexible in the definition of the campaign by the advertisers is
limited and may not be compatible to the business model needs of Instant Places.
Ad Targeting: The ability of targeting the audience is important to the Instant Places. The
engine should be able to associate the ads with their target audience in order to maximize audience
impact and consequently the profits of advertisers.
Bidding Optimization: To choose the most profitable ad in order to show it, at any given
moment, to maximize the profit is essential to maintain the business model sustainable and profitable.
Maximization should not be immediate, taking into account the diverse factors the weight in the
relevance of the ad given by audience targeting and environment contextualization.
3.2. First Stage Study
The ability to upload customized ads and retrieval of reports with campaign results are
mandatory to an application be considered an ad engine and be part of this study. In the second stage
of the study will be analyzed the characteristics offered by the engines and how can they be adapted to
Instant Places.
29
For every engine covered, it will be presented information (when available) about their name,
version, creators, owners, creation date, technology, compatibility, hardware and software system
requirements and a description of their objectives, capabilities and shortcomings and the evaluation
conclusion.
The ad engines applications that have a closed source and require a paid license were left out.
Because, to customize an application it is needed access to the source code and have the license to
change it. Free ad engines which required paid platforms to be deployed and ran were also left out.
In the study were considered the following ad servers:
ADMP: ADMP is a PHP script owned by Geekhelps. The current version is 1.3, released in
October 2011. The objective of this software is to generate an ad code to insert in webpages. It
was designed to work with only one website, does not offer a campaign manager, targeting
system or bidding optimization. The script license does not allow changes in the code and
support is only given for a fee, so the evaluation leads to conclude that the software is
unsuitable for Instant Places.
ASB MyAds: AdServerBeans MyAds is an open source ad server project owned by
AdServerSoft Ltd. The most current version is 0.6 released in February 2011. It is written in
Java and Adobe Flex and requires a web server like Tomcat to be deployed. The ASB MyAds
allows the managing of campaigns, and it is capable of ad targeting based only on the user IP
address. This software does not offer bid optimization, but offers a customization system that
allows the definition of priority and frequency of each add. The campaign manager is very basic
not allowing the establishment of a pricing mechanism for each campaign. It has an active
development team that offers support for the installation and upgrade of the product, but does
not have an active and dedicated community. The conclusion is that a further study of the
software capabilities is not recommended. It lacks a campaign manager and the required
functionalities to support customer billing, and it is oriented to a single user, not allowing the
publishers to keep track of their campaigns.
Banner Bar 125: Created by Ian J. Gough, the version 1.3.2 was released in June 2011.
The application uses PHP, MySQL and has a share-alike license (SA). It has the same objective
and offers the same capabilities of the previously described manager ADMP, but it has less
flexibility in the definition of the customized ads. The ads can only be placed at the bottom of
the page and are displayed randomly. It does not have a dedicated community, and its support

30
is given only for the installation of the software for a fee. The software also does not support
campaign management, or ad targeting or bidding optimization. It is concluded that further
study of this software should not be conducted.
CellarWebAds: The CellarWebAds is a freeware ad management tool for websites. The
current version 1.06 was released in March 2011, and it is owned by CellarWeb.com. It is
designed to be used with PHP pages and requires a MySQL database. This software allows the
site owner to create and manage banner zones, keep track of ad impressions and clicks,
define campaigns and bill the site advertisers. The application only deals with one site. The ads
are randomly displayed, and it does not support any kind of public targeting or bidding
optimization. It also does not have an active and dedicated community and development
support is not offered. It is concluded that this software does not fulfill most of the criteria in
order to pass to the next stage.
OASIS: Open Source Ad Serving and Inventory System (OASIS) is an open source ad server.
The current version, 2.3 was released in August 2007. This software requires a web server
with LAMP (Linux, Apache, MySQL and PHP). OASIS offers a web site banner managing
solution. It gives the advertisers the ability to set their own campaigns and check their current
campaigns status. It offers a simple target system based on IP geotargeting. On the other
hand, it was designed to be used with only one website, does not offer a system of bidding
optimization, its community has not been active in the latest years and currently is being
supported for a fee by Ad Delivery Solutions Inc. as an optional advert serving solution. The
Instant Places is a multiple screen system, in order to emulate a different web site in each one
of them is expected from the ad engine the management of multiple sites, so this web server is
considered unsuitable to advance to the second stage of the study.
OpenX Source: OpenX Source is an open source ad server. The current stable version is
2.8.8, released in September 2010. This ad server has changed owners and adopted different
names (phpAdsNew and OpenAds) through the years. It requires a web server configured with
LAMP in order to be deployed. Maintenance support to the open source version of OpenX is
not offered by the developers, but it has a dedicated community of users, who give support. It
is a very active project, and its bugs are actively corrected by its developers. This software has
the ability to target ads, manage campaigns, and has a bid optimization algorithm, making it a
viable candidate to the second stage of the study.

31
Orbit Open Ad Server: Orbit Open Ad Server is an open source freeware ad server. It is
owned by OrbitScripts, LLC and has a GNU/GPLv2 license. The Orbit Open Ad Server only
requires the placement of java script code on a website page for its ads. The server runs on
Linux and requires MySQL and PHP. This software was built for two different user types, the
administrator and the advertiser. It allows the advertiser to define a campaign, make payments
and check campaign statistics. The administrator can manage campaigns, websites and
payments, also, can create statistics reports about websites performance and advertisers
revenue. It is an active project which support for bug correction is given by the developers and
has a small community of users. It has a very basic ad targeting mechanism based on
geolocation and does not implement bidding optimization, besides the latest negative aspects it
is concluded that this ad server should be further analyzed and tested in the second stage in
order to determine if the possible future customization to the Instant Places project is viable.
Paradox Interactive Advertise Manager 1.0: It was created by G. Papaioannou, released
in September 2011. This software is written in PHP/AJAX and uses MySQL to store data. This
application has the objective of complementing a web site with a banner manager. This
software is open source, and supports tracking of clicks and impressions, also supports
customized banners, and third party ads. It does not offer any mechanism of campaign
manager, ad targeting or bidding optimization. The software is very recent, lacks from an
established community and is not offered any support from the developers. This software fails
to meet almost all of the criteria requisites to pass to the second stage of the study.
phpLedAds and perlLedAds: The phpLedAds is a freeware PHP script owned by Jon Coulter
- LedScripts, the current version, 2.2, was released in 2003. This software was designed to use
with one website with the objective of inserting customized banners in it, and tracking their
impressions and clicks. It does not support the concept of campaign management, or ad
targeting, or bidding optimization. It is not expected further development, or maintenance of
the project because it is considered obsolete. These aspects lead to conclude that the software
does not have the fundamental capabilities to be used by the Instant Places project.
perlLedAds is the Perl version of the same software with minor tweaks not relevant to Instant
Places.
The results of the first stage study are resumed in Table 1. The table shows the criteria met for
each engine covered and the engines considered fit to pass to the next stage.

32
Table 1: Resume of the study of Ad Engines
3.3. Ad Engines for Instant Places
In this section, the second stage of the study, a more detailed analysis of the engines that
showed more promise to fulfill the Instant Places needs will be presented. Firstly, for every engine it will
be described their installation (if needed) and test conditions, after, an analysis of the engines strong
suites and shortcomings will be conducted considering the Instant Places project environment context.
To finalize one of the engines is chosen.
Some engines were considered more suitable to be adapted to the Instant Places than others,
and those are OpenX Source and Orbit Open Ad Server.
For the first one, a third party installation wizard plugin was used to deploy this software. It is
by far the one that has more features of the analyzed, presenting a large number of functionalities that
can be summed up in the following: user account manager, site manager, campaign manager also
others like the support to a large number of ad formats including video. The most distinguishable
characteristic of this engine to all others is that it offers an algorithm to optimize campaigns results.
Complementarily, it offers a mechanism of dynamic variable targeting. It consists in associating
an ad with a list of keywords about the public to which it is meant to be showed. After when serving
ads, the ad will be considered valid only if some of those keywords are present in the viewer's browser.
This targeting mechanism, while very simple, offers a solution that can easily be implemented to target
ads in the pervasive Instant Places system. The screens only would need to generate keywords about
the public surrounding it.
The test the Orbit Open Ad Server we used its live demo. This software is directed to two
different users, ad publishers and the administrators. The strong points of this software are mostly in
its ability to manage campaigns and websites. It shows many features in the definition of websites and
their zones for ad placement. This can be adapted to Instant Places, in which, each display screen of
the system can be considered a website, and some of their screen space could be sold to advertising.
33
It also allows the organization of the websites in categories. In Instant Places, those categories could be
used to differentiate the screens geographic locations or even differentiate the screens by most relevant
demographic if a previous study of the target public in each of the screen locations is made. The major
downsides of this software are that it does not support any targeting mechanism that is not based on IP
or client browser. Unlike OpenX, this software does not have implemented an integrated bidding
optimization mechanism, because of this we considered that the Orbit Open Ad Server does not give a
very solid platform to the development of a solution for our project in the Instant Places network.
Considering all the covered software in this study, the choice of the most recommended ad
engine for Instant Places is the OpenX because it offers campaign optimization and has a targeting
solution that can be implemented in Instant Places without any changes in its source code.
3.4. Study Remarks
A research about the state of the art of current free and open source ad engines was made. Its
objective was to find a viable ad engine for Instant Places. A large number of software products were
covered, but only a few met the minimum criteria established and even fewer showed adaptability to
the use of pervasive computing data. Unfortunately, an open source ad engine for pervasive digital
signage was not found, so the research had to be redirected into ad engines developed for web
environment. Nevertheless the research was successful. It leads to conclude that the OpenX ad engine
showed more promise in its adaptation capabilities to Instant Places than the others. This study paved
the way for the following step, which covers the adaptation of OpenX to the needs of Instant Places.

34

35
4. Requirements and Architecture
In this chapter, we start by contrasting the differences between online and digital signage ad
serving. These differences affect the way the network needs to be organized. Making this contrast
between environments is a crucial stepping stone in the development of digital signage network
architecture.
We analyze the existing Instant Places network architecture and how this network display
contents on its screens, other aspect like user interaction are also taken into account. The objective of
this analysis is to know how the present network may affect the way how adverts can be served on the
network’s screens. The contribution of the OpenX in our solution architecture is described first with an
overall view of the architecture and then the detail of each and every architecture component goal, and
how these components communicate and complement each other.
4.1. Differences between Online and Digital Signage Ad Serving
Before we dwell into our architecture for the ad engine, we will first draw the biggest contrasts
between ad engines for online web networks and digital signage networks. By contrasting the nature of
these, we intend to show how it directly affects the whole system from the ad provider to the viewer.
4.1.1. The Audience
The first aspect we draw the differences between these networks is the audience. In a
traditional ad engine in the internet the audience refers to only a user in front a computer, usually
viewing contents through a web browser. When it comes to target the contents to the user
demographic, the ad engine only has to take into account the data gathered from a single user. In
digital signage, the audience is composed by a group of individuals each one with their own interests
and tastes leading to the need to strike a balance by figuring out what are the most common traits in
the audience.
This major difference already translates in a change how in the other end point of the
architecture, the ad provider (advertiser), establishes the target audience demographics.
For instance, to establish ads targeted to only one type of gender in the audience. Doing this in
online advertising is very efficient because the ad engine deals with serving ads to single individuals. In
digital signage, a restriction of this type would be very inefficient in terms of covering the best way

36
possible the target audience. Because, odds are that the audience will be composed by individuals with
different genders and other demographics traits.
4.1.2. Session Control and Ads Life Time
The session control in an online environment is on the hands of the audience. If the audience
dislikes the ad that it is seeing then it can always opt to navigate away from the page. The ads requests
are made by the audience, and the volume of ads served is variable.
In digital signage the audience is served the ads the ads determined by the ad engine to be
served on the screen. The audience doesn’t have the power to interrupt the ad being shown if it
displeases them. As a result, if an ad is not captivating to the viewers in digital signage it deteriorates
the user experience with the network more than in an online environment.
Another difference between online advertising and advertising on digital signage is the lifetime
of the ads. An online ad may not be able to playback during its intended full length, and it even may not
ended up being seen in the audience browsers window. The online ad engines are more focused on the
place where the ads are served on the viewer’s webpage, than the time they will be showed. In online
ad serving, usually, an ad impression counts even if it only lasts a moment of a second. Also, the place
and size (screen area) of the advert are paramount when establishing the price of the advert.
In digital signage, this is all very different, the requests can be planned and made by the
display software on the screen (triggered by actionables or scheduled updates) or by the ad engine
initiative itself (scheduled updates). The volume of ads served is limited to the number of screens and
the screen time available. The user has no control over the contents played and cannot directly request
a new advert on the screen. This caps the ads to a limit in the number of ads that can be served during
a day by the network.
4.1.3. Scheduler
It makes little sense to organize the display of the ads in a schedule for online advertising,
because the exact number ad requests is not known. Even less probable, is the prediction of the exact
audience by the engine before the requests are made, at most, some ads have associated with them
preferences about an hour or time of day.
In traditional digital signage, the scheduler is commonly used. The ads are allocated in it by the
content manager, or in some cases a person that works for the network is incumbent of programing
the scheduler. We aim for a content manager system that does not work with a schedule, like in online

37
advertising, it should allocate on real time or near real time, the ads for display depending on the
audience present and the environment context of each screen.
4.1.4. Network
Another contrast between these two environments is the network communication, in online
advertising when the ad display software (the browser) makes a request of an advert, during the page
load, and the content manager software system is offline or the network is down, invariably results on
an error being shown on the browsers window instead of an advert. This is because the ads are
requested to and served by the content manager in real time. In our digital signage scenario, the
screens are fault tolerant in case of digital signage network is offline, so the display manager has to be
able to display ads when working autonomously from the ad engine. As a consequence, at some
extent, the logic needed to serve ads needs to be placed on the display manager software so each
screen can work autonomously. The display manager (client) also has the task of updating the content
manager system (server) of the changes occurred during the downtime, like number of ad impressions
and budget spent.
A common trait between online advertising and digital signage is the centralized server side of
the content manager system. Nonetheless, there are some differences how they operate on each
environment. The server in online environments works in real time by receiving ad requests and
delivery them treating each one as a different request. In digital signage, the software would allocate
the ads in loops on a schedule and upload that information to a display, leaving to the display software
to conform to that schedule displaying each ad in the order intended. Changes on the display of the
ads would be delivery as a temporal update on the schedule through the network. Our approach aims
to be similar to the online one. Instead of a predetermined loop, the display manager asks for the next
set of adverts suitable for that screen in real time or near real time, leaving to the display software the
crucial task of ranking and choose the best ones for the time available.
4.2. The Digital Signage Network of Instant Places
We will first introduce the Instant Places network by identifying the principal agents on the
process of displaying screen content, and then we will describe the process of how the users interact
with the content.
First in the core of the network is a central server that controls and manages the screen nodes,
this server offers a channel through which information about the network can be sent and retrieved. It
is also used for network managing and maintenance.

38
The screen nodes are the end nodes of the network. Each screen node is running an instance
of the display software. The display software runs a set of display applications. Each display app has its
own purpose, content and presentation. The display software is responsible for determining
autonomously what app to run, managing the transition between apps running in the background
(being not displayed) on the screen, or in the foreground (being displayed). The display software keeps
updated an activity stream with each new event that took place on the screen. Each screen node runs
asynchronously from the server, being autonomous enough so it can display contents even during
network failures.
The viewers can interact with the screen by checking in through a mobile app. This app
connects the user’s mobile device to the screen so the viewer can interact with it, either by posting new
contents or simply consult previous events on the screen’s activity stream. The viewers can download
this mobile app through the network website. The website allows place owners to apply to have a
screen on their space, and also future advertisers can contact the network to create their own ad
campaigns through it.
There are many different ways to serve ads in a Digital Signage network like Instant Places,
depending on how the network is designed and on what is expected of it in different scenarios. The
more straightforward solutions for ad servers are the ones that serve the ads at random or through
predetermined lists in a loop. The upside of these solutions is the fast and simplified ad serving
process. The major downside is that the ad is not targeted to the viewer interests and context. Other
types of ad serving focus on contextualizing an ad and targeting it to an audience, or even an individual,
which substantially increases the chances to perform better in revenue than a randomly showed ad.
In advertising the revenue is measured mostly through registered user attention (views and
interactions). The more an ad matches the users interests the more chances it has to capture their
attention. Opting for the later type of ad serving in a Digital Signage Network may seem at first the most
promising and viable way to go, but contextual, targeted or behavioral advertising in a network of public
screens, implicates the gathering and storage of data from passersby in an explicit way, e.g. viewers
become users of the system by filling out a form with personal information, or in an implicit way, e.g.
data gathered from the use of pervasive technologies like video cameras and motion sensors. The use
of pervasive of screens leads to a more expensive infra-structure and dealing with this type of
information brings to the table many issues related to privacy rights. We will not offer a universal

39
solution for both network types. We focused on the Instant Places network and explored the already
existent infrastructure to deliver our own ad server solution.
4.3. Ad Server for Instant Places
We propose an ad server that explores the audience tastes to deliver targeted ads in the
interactive digital screen network Instant Places. The ad server can be split in two different parts of
software, the content manager software (server) and the player software (screens). In the digital
signage ad serving context, the content manager software runs on a centralized server, and its main
function is to manage the ads that are served on the screens, this server has a webpage front face
through which the advertisers can manage their ad campaigns and the network administrator can
configure the server.
The other part of the software is the display manager player that runs on each screen. We
explore the user’s interaction through the activity stream, by making our own ad display application
write on the activity stream references to the ads that were served on the screen. These references
then can lead the viewer to the advertiser’s specified target that can either be a webpage, an image, a
video or even a purchase checkout. Our ad server measures the viewer’s interests by recording the
number of references followed by the viewers (clicks on activity stream descriptions). This allows for the
construction of user profiles based on previous interactions opening the doors to the establishment of
targeted adverts in the network.
This ad server merges itself with the present Instant Places network in the way that can be
seen on Figure 4. The instant places website leads the advertisers to a webpage where they can
establish their own campaigns on the Instant Places network. The campaigns are then stored on the ad
server running on a centralized server that has communication with all the network nodes (screens).
The ad server then can send the ads of those campaigns to each screen running the display
application made to display ads. This display application is over sighted by the Instant Places own
display manager that controls what application is running on the foreground at any given time. The
display application stores on the activity stream a reference to each ad displayed. Then the audience
can consult the activity stream and click on the ads. To do this the audience only needs to have the
Instant Places application on their mobile device and connect to the screen through it.
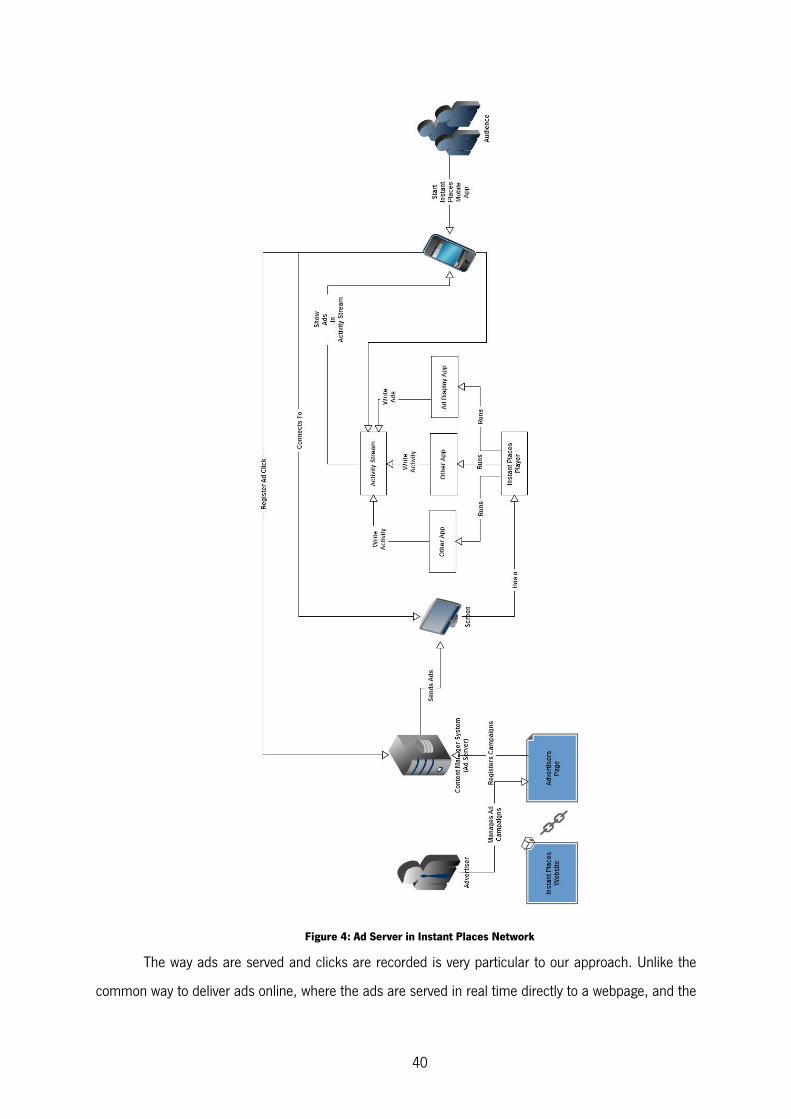
40
Figure 4: Ad Server in Instant Places Network
The way ads are served and clicks are recorded is very particular to our approach. Unlike the
common way to deliver ads online, where the ads are served in real time directly to a webpage, and the

41
user can see a myriad of different contents and choose to click on the ad if it pleases them. In our
approach, the way clicks on ads are established is quite different.
One major difference is that the clicks aren’t made directly on the ads that are served on the
screen. Instead if the viewer wants to know more about the advert by clicking on it, he will have to
check in on the screen where he is watching the ad, consult the screen activity stream and then click
on the ad that he saw. This requires from the user some extra steps to concretize a click, making the
clicks on ads in this ad serving method harder to achieve than in an online environment.
The other big difference is that while the impressions on the screens can be targeted to the
current audience, the clicks on the activity stream aren’t targeted to the current viewer. This is due to
the way that the activity stream is used by the Instant Places network. The stream shows an historic of
the recent past of a screen. A viewer that wasn’t near the screen at the time the ads were shown will
consult the ads targeted to a past audience, instead of the ads targeted to him. In online advertising
this situation doesn’t occur because the ads are served to each individual at real time, so they can
always be targeted to the right individual.
The diagram on Figure 5 shows how a click is done in the ad served by the ad server on the
Instant Places network. First the ad server sends the ad to the display app, and then it displays the ad,
recording the event on the activity stream. Later, when the viewer checks in on the screen through the
Instant Places application on his mobile device, he can consult the activity stream and click on the ad.
The click will be recorded on the ad server that in time will redirect the viewer to the advertiser’s
specified destination for the ad (an online web address).

42
Figure 5: A click on an ad in the Ad Server for Instant Places
To support an ad serving solution behavior as previously described, we focused on researching
and creating our own ad server. An ad server that could be compatible to the way the Instant Places
infrastructure supports the delivery of content to the screens, and explore the user’s ad clicks to deliver
a contextualized and targeted message. Our ad server has three different components, the website for
the advertisers to manage campaigns and for the network administration to manage the ad server, the
ad server and the display application on the screens.
We intend to target the ads to the Instant Places users’ profile. The following architecture was
developed with the intention of creating the users profiles based on their explicit profile registered when
user joins the Instant Places network. These profiles are then complemented with the users’ implicit
interest that is estimated based on their clicks in previous ads. We use this information to target the
ads served on the screens accordingly to each user profile present in the audience.
In this ad server the users explicitly choose the ad they want to see served in their mobile
device, instead of pushing the screen contents to be rendered in the application on theirs mobile
device. Pushing unwanted ads to the user’s personal mobile device would deteriorate the user
experience with the digital signage network, as this was expressed in past experiments with a pervasive
digital signage network[52]. The ads served by a screen are recorded on its own activity stream that
can be later accessed by the users. On this activity stream, the user can check what happened recently
on the screen, and that includes the links to the ads. With this approach, the user only gets served the

43
ads on is mobile device that he personally requests. For this, we developed our own ad server
architecture based on the one proposed in [75].
4.4. Ad Server Architecture Overview
The Figure 6 reflects the architecture of the ad server developed. The website serves as an
interface for advertisers to establish the ad campaigns on the ad server content management system.
The website also offers to the network administrators an interface to configure and manage the ad
server.
The ad server’ content management system is responsible for storing and managing this
information. The changes made in the network (new screens and users) are tracked by the update
module, that from time to time checks if there are new records or new updates on the network.
Each time a screen requests the next set of ads (for a specific period of time), the ad server
answers with the possible adverts that can be shown in the place that made the request during the
time frame for which the request was made. Other relevant information is also sent along with these
adverts that we later on will specify in detail. After the display manager software (the ad display app)
receives an answer to this request, it can then select from the list of ads received the most suitable ads
for the current environment (audience and current topics discussed in the place). To achieve this, the
display manager needs to be able to know the audience interests. This is done by identifying the
current audience that is interacting with the screen (member in the audience that are users of the
system and are currently logged in on the screen) this is known by requesting this information to the
Instant Places API server. Then with the help of the data mining module, which estimates from the click
history of each audience member the amount of relevancy that each ad has to that person, the
selection of the suitable ads to be shown is made. This choice is made by both balancing the relevance
of the ads to the audience group and the immediate monetary gain won with the ads impressions, in
order to strike a balance between what the audience most wants to see with most profitable immediate
gain to the network.
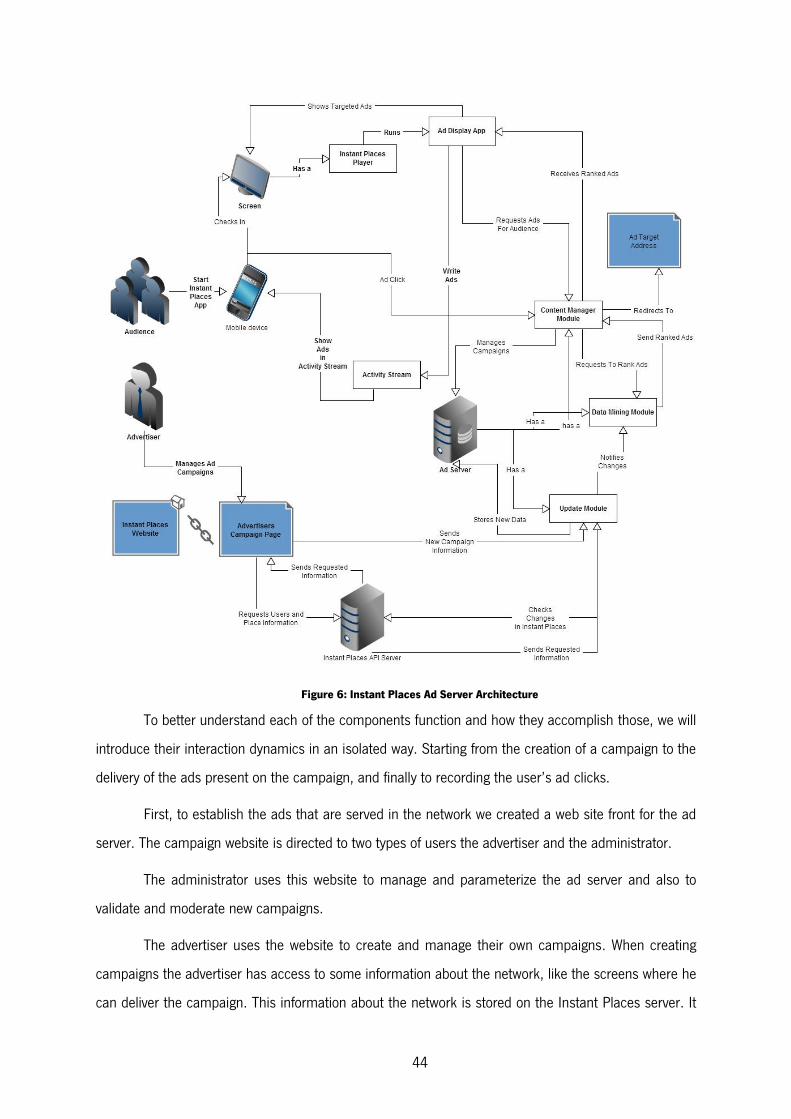
44
Figure 6: Instant Places Ad Server Architecture
To better understand each of the components function and how they accomplish those, we will
introduce their interaction dynamics in an isolated way. Starting from the creation of a campaign to the
delivery of the ads present on the campaign, and finally to recording the user’s ad clicks.
First, to establish the ads that are served in the network we created a web site front for the ad
server. The campaign website is directed to two types of users the advertiser and the administrator.
The administrator uses this website to manage and parameterize the ad server and also to
validate and moderate new campaigns.
The advertiser uses the website to create and manage their own campaigns. When creating
campaigns the advertiser has access to some information about the network, like the screens where he
can deliver the campaign. This information about the network is stored on the Instant Places server. It
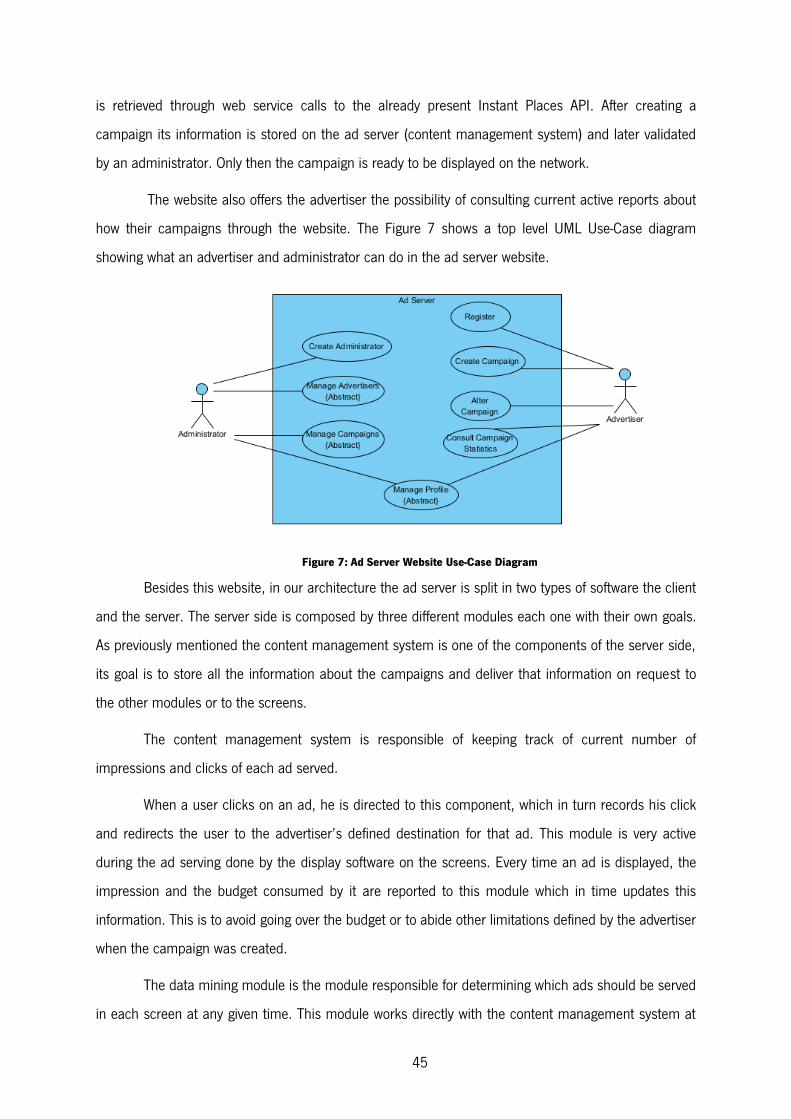
45
is retrieved through web service calls to the already present Instant Places API. After creating a
campaign its information is stored on the ad server (content management system) and later validated
by an administrator. Only then the campaign is ready to be displayed on the network.
The website also offers the advertiser the possibility of consulting current active reports about
how their campaigns through the website. The Figure 7 shows a top level UML Use-Case diagram
showing what an advertiser and administrator can do in the ad server website.
Figure 7: Ad Server Website Use-Case Diagram
Besides this website, in our architecture the ad server is split in two types of software the client
and the server. The server side is composed by three different modules each one with their own goals.
As previously mentioned the content management system is one of the components of the server side,
its goal is to store all the information about the campaigns and deliver that information on request to
the other modules or to the screens.
The content management system is responsible of keeping track of current number of
impressions and clicks of each ad served.
When a user clicks on an ad, he is directed to this component, which in turn records his click
and redirects the user to the advertiser’s defined destination for that ad. This module is very active
during the ad serving done by the display software on the screens. Every time an ad is displayed, the
impression and the budget consumed by it are reported to this module which in time updates this
information. This is to avoid going over the budget or to abide other limitations defined by the advertiser
when the campaign was created.
The data mining module is the module responsible for determining which ads should be served
in each screen at any given time. This module works directly with the content management system at

46
the display software request. Every time the display software requests the content management system
for a new batch of ads to be showed on the screen during the following ad display time window, the
display software passes to the content management system the information about the present
audience. Then, the content management system sends this information to the data mining module
that computes for that audience and context a ranking of relevancy for all available ads. In turn, the
content management system gets the ads ranked to the present audience from the data mining
module and answers the display manager system by sending a list with the ads best ranked. It should
be noted that the process to rank the ads is not deterministic, and there are numerous different
approaches to rank ads accordingly to the data available on the time of display in the Instant Places
network. We will present a possible implementation of this module with our own ranking method.
The final module that composes the ad server is the update module. Like its name indicates, it
is responsible to keep the ad server updated. More precisely this module keeps track with the changes
that happened to the user profiles and the campaigns and, from time to time, updates the content
management system and the data mining module with the changes that happened.
The content management system is updated by this module with the new changes to
campaigns. This changes may turn some campaigns to inactive status (budget, duration reduced or
termination by the advertiser), or for the opposite reasons, turn some previous inactive campaigns in
active campaigns.
The data mining module is updated with changes to the user’s profile, being notified with an
updated click history for each user and explicit changes made by the user to his profile in Instant
Places. The update module keeps track of the changes by querying the Instant Places API in
predetermined time intervals.
The client software developed for the ad server has the goal to display ads. In this architecture,
this application is over sighted by the Instant Places display player.
Every time the player is about to bring this application to be displayed, this application makes a
request to the ad server (content management system) for the next batch of ads to be displayed. As
previously mentioned, this request is made by passing parameters containing information about
current audience and context information. The context manager system answers this request with an
ordered list of ranked ads, for each ad on the list, the display application, checks if it already has the
image/video stored on the screen local memory (hard drive), if not, it requests the corresponding

47
image/video to the content management system and stores it. This request is summarized on Figure
8, described as request number 1.
Every time an ad is about to be displayed by this application is brought from the local memory
of the Instant Places’ screen node, to the Instant Places’ player cache memory where it waits to be
displayed. In case the data stream (image or video) of an ad scheduled to be displayed is missing from
local memory, the display app makes the request described as number 2 on Figure 8. In exceptional
cases where the network connection is unavailable, the display app, will display ads in a different
manner. First it will only display the ads that are stored in its memory from previous showings. Also,
since it can no longer use the content management system to get a list of ranked ads targeted to the
audience, it will iterate over the ads available based on the immediate monetary gain to the network,
or, in other words, it will show the ads of the campaigns that were established with the biggest base bid
per impression.
After serving an ad, the display software communicates with the content management system
indicating each ad played and the budget consumed by each impression. In case of network failure, the
number of impressions and budget consumed will be stored locally until the network connection is
established. With this solution, some limits imposed by the advertisers when establishing a campaign
may be violated, due to the lack of synchronization of the number of impressions and remaining
budget, during the time each screen is displaying its own set of ads. This type of message is
represented by the request type number 3 on Figure 8. This figure shows the interface used by the
display app to communicate with the content manager system. Each of the requests represents a
different procedure call.
The components described in this chapter and their interactions compose our ad server for the
Instant Places network, in the following chapter we will proceed by detailing our implementation of
every of the above components.
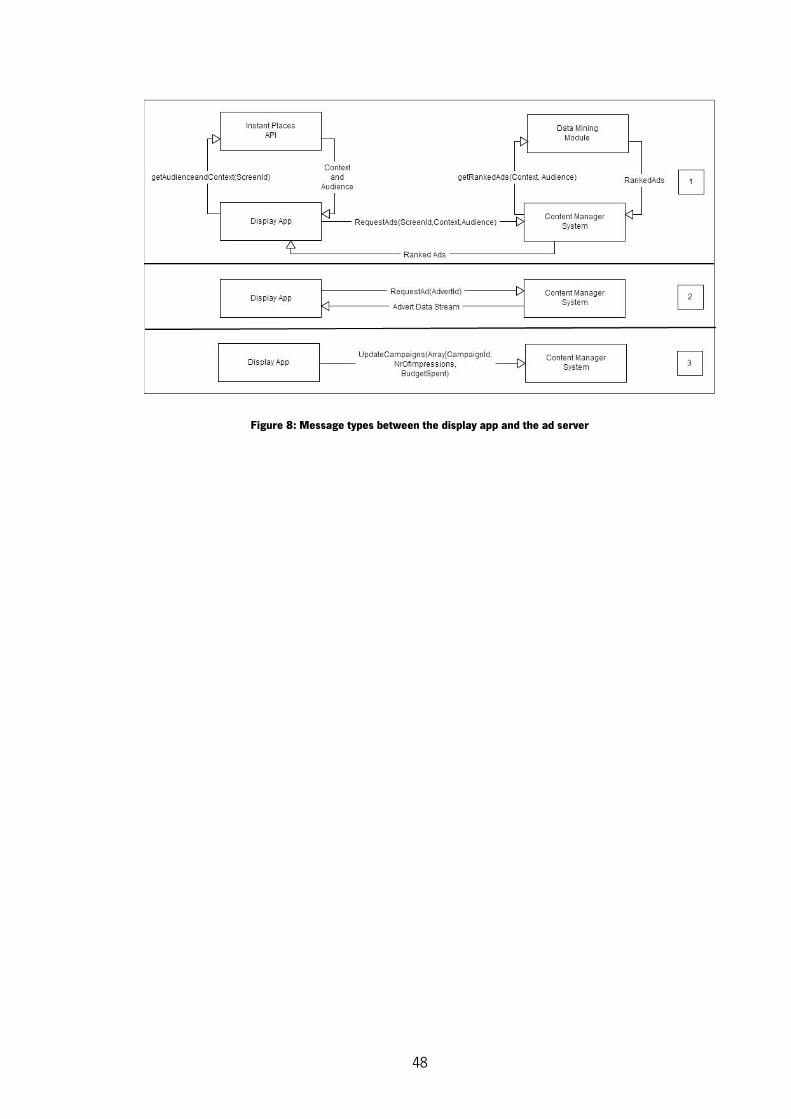
48
Figure 8: Message types between the display app and the ad server
49
5. Implementing the Ad Server
In the previous chapter, we introduced the components of our architecture and described their
function on the ad server, in this section we will now discuss the implementation details of said
components, explaining in detail how the ad delivery is done in our ad engine for Instant Places. We will
detail each parameter specified by the advertisers when establishing their campaigns, and how those
parameters affect the way the ads are served and ranked.
We will leave out of this description technical detail concerned to the technologies used to
implement our ad server.
Our ad server was developed in the JAVA language. The communication between the client
application and ad server is made with JAX-RS. Both ad server and the website were developed using
Hibernate for persistency mapping, EJBeans for the business layer and the Primefaces Framework for
the development of the interface. The website runs on the Glassfish Application Server and the
database is stored in the MySQL InnoDb storage engine. The screen application was created in
JavaScript and tested using a web browser to interpret it. The same was made to simulate the mobile
device application.
5.1. Campaign
The campaigns are set up by the advertisers. They can access a webpage where they can
register themselves, after a register validation the advertisers can then create their own campaigns.
The campaign creation was divided on three steps2.
In the first step (Figure 9) are specified the most broad aspects of the campaign: the name, the
time span (start and end date), the campaign category, local associated (if applicable), the budget
available for that campaign and the budget caps (maximum amount spent in a daily basis, maximum
number of clicks and maximum number of impressions that the advertiser is willing to pay). By default
if a limit is not imposed by the advertiser to the way the budget can be spent, it will be considered
unlimited. A campaign may also run out of money before the end date specified if an advertiser doesn’t
setup his campaign properly. In this step, the advertiser has to take a decision about the way the
budget is spent. By either choosing, to spend the budget only on impressions made on the screens. Or,
to spent the budget both on impressions made on the screens and clicks done by the network users.
2 The campaign creation interface can be accessed on http://193.137.8.61/advertising
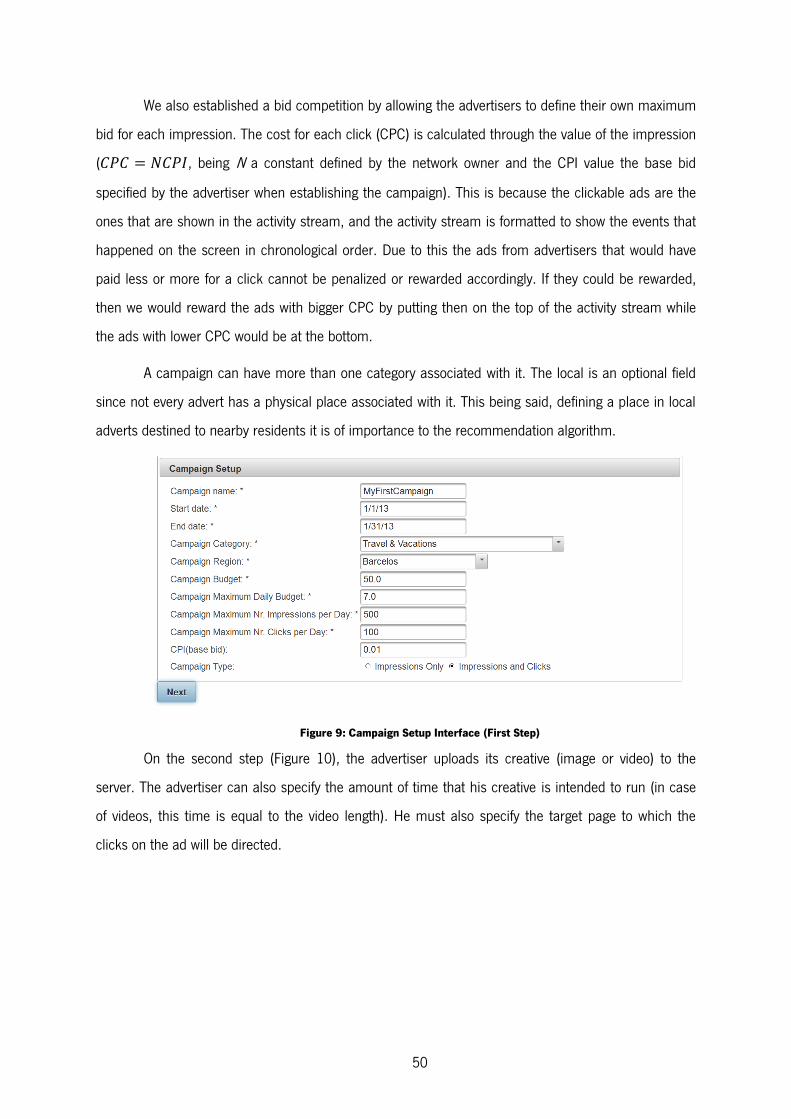
50
We also established a bid competition by allowing the advertisers to define their own maximum
bid for each impression. The cost for each click (CPC) is calculated through the value of the impression
( , being N a constant defined by the network owner and the CPI value the base bid
specified by the advertiser when establishing the campaign). This is because the clickable ads are the
ones that are shown in the activity stream, and the activity stream is formatted to show the events that
happened on the screen in chronological order. Due to this the ads from advertisers that would have
paid less or more for a click cannot be penalized or rewarded accordingly. If they could be rewarded,
then we would reward the ads with bigger CPC by putting then on the top of the activity stream while
the ads with lower CPC would be at the bottom.
A campaign can have more than one category associated with it. The local is an optional field
since not every advert has a physical place associated with it. This being said, defining a place in local
adverts destined to nearby residents it is of importance to the recommendation algorithm.
Figure 9: Campaign Setup Interface (First Step)
On the second step (Figure 10), the advertiser uploads its creative (image or video) to the
server. The advertiser can also specify the amount of time that his creative is intended to run (in case
of videos, this time is equal to the video length). He must also specify the target page to which the
clicks on the ad will be directed.

51
Figure 10: Campaign Setup Interface (Second Step)
On the third step (Figure 11), the advertiser is presented with the various targeting options,
being able to create its own personalized targeting rules, and specify its own bids for those rules. In this
step, the advertiser can create rules to target or exclude the demographics of the audience (gender,
age group and hometown). A set of keywords can be added to the rule. These keywords are used to
match the contents of the advert with the audience. The advertisers can also specify which screens of
the network they want to apply the targeting rule specified.
Figure 11: Campaign Setup Interface (Third Step - 1st Form.)
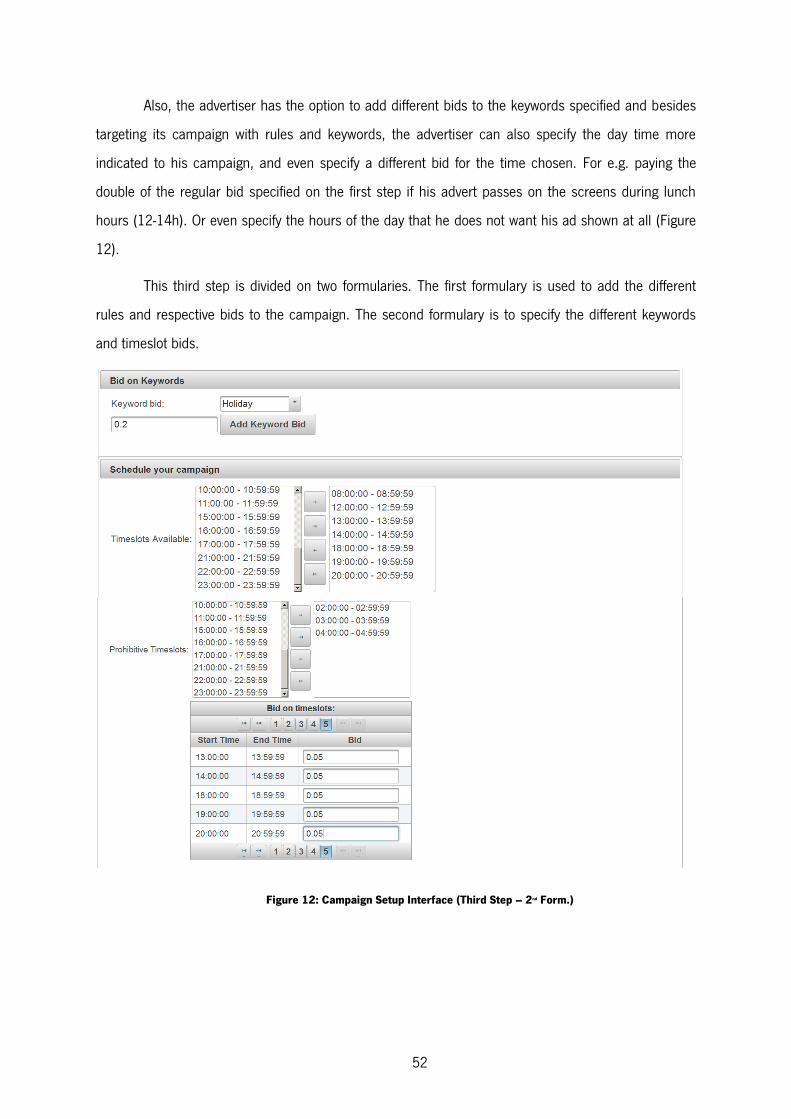
52
Also, the advertiser has the option to add different bids to the keywords specified and besides
targeting its campaign with rules and keywords, the advertiser can also specify the day time more
indicated to his campaign, and even specify a different bid for the time chosen. For e.g. paying the
double of the regular bid specified on the first step if his advert passes on the screens during lunch
hours (12-14h). Or even specify the hours of the day that he does not want his ad shown at all (Figure
12).
This third step is divided on two formularies. The first formulary is used to add the different
rules and respective bids to the campaign. The second formulary is to specify the different keywords
and timeslot bids.
Figure 12: Campaign Setup Interface (Third Step – 2nd Form.)

53
5.2. Content Management System
The digital signage software is divided on two types, the player software that is responsible for
controlling what is displayed on the screen and the content manager software that is responsible for
delivering the messages to the screens.
The content manager software is in charge of keeping track of the clicks done by the users, the
number of ad impressions. It is also responsible for managing the campaigns status.
These functions are done by interchanging data with the display software. As previously
mentioned these components interchange different types of requests and responses. One type of
message is the request of a new set of ads to be shown during a certain time span. This message is
made by the display software to the content manager system. To answer this request, the content
manager checks for the current valid campaigns (a current valid campaign is a campaign that is active
during the time for which the request is made and has not expired its current budget caps). Then, it
creates a list of all the campaigns that are suitable for the screen from which the request originated,
leaving out campaigns with targeting rules excluding the screen that made the request. This response
does not include big data objects like images or videos instead the information sent is composed by a
reference to the advert. Besides that reference, is sent to the display software the following information
about each advert:
The advert identifier;
The base bid for an impression;
The demographic targeting rules considered valid for the current audience and their bids;
The preferential hours of the day and its bids on hours of the day;
The set of keywords and its bids;
The budget spending type (CPI only or CPI and CPC);
The timespan of the advert;
The localization of the ad (if applicable);
The categories of the ad;
The total number of clicks and impressions left of the ad;
A table that contains the distance of the ad’s keyword set to each user profile set of keywords;
All these values were specified by the advertiser when establishing the campaign besides the
last one, the table with the keyword set distances. This table is created and maintained by the update
module. Besides asking for only a new set of ads for a specific date, alternatively, the display software

54
screen can detect current hot topics being discussed by its users offering screen context information to
the request being made, allowing us to implement contextual advertising. These hot topics are given by
the existent Instant Places API. Upon request, the Instant Places software creates a keyword tag cloud
that can be used by our screen application. That sends along this information with the request made to
the content management system. If that is the case, the answer to the request with this information,
besides all the previous described information, will include a table that contains the measure of the
distance of the set of keywords received in the request to the ads keyword set. This distance is
calculated the same way the distance between keywords set associated with the users and the
keywords sets associated with the ads, a process described in detail on chapter 5.4.
The Figure 13 shows an example of the information traded between display app and content
manager when the display app requests a new set of ads.
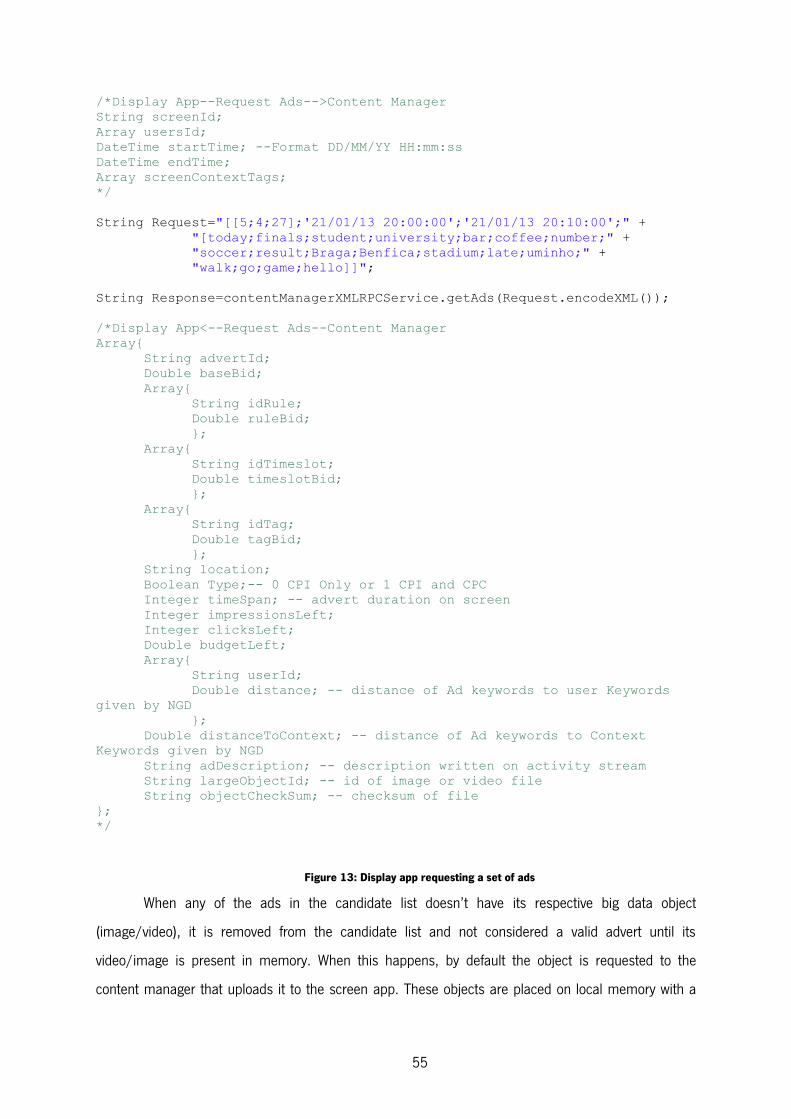
55
/*Display App--Request Ads-->Content Manager 1 String screenId; 2 Array usersId; 3 DateTime startTime; --Format DD/MM/YY HH:mm:ss 4 DateTime endTime; 5 Array screenContextTags; 6 */ 7 8 String Request="[[5;4;27];'21/01/13 20:00:00';'21/01/13 20:10:00';" + 9 "[today;finals;student;university;bar;coffee;number;" + 10 "soccer;result;Braga;Benfica;stadium;late;uminho;" + 11 "walk;go;game;hello]]"; 12 13 String Response=contentManagerXMLRPCService.getAds(Request.encodeXML()); 14 15 /*Display App<--Request Ads--Content Manager 16 Array{ 17 String advertId; 18 Double baseBid; 19 Array{ 20 String idRule; 21 Double ruleBid; 22 }; 23 Array{ 24 String idTimeslot; 25 Double timeslotBid; 26 }; 27 Array{ 28 String idTag; 29 Double tagBid; 30 }; 31 String location; 32 Boolean Type;-- 0 CPI Only or 1 CPI and CPC 33 Integer timeSpan; -- advert duration on screen 34 Integer impressionsLeft; 35 Integer clicksLeft; 36 Double budgetLeft; 37 Array{ 38 String userId; 39 Double distance; -- distance of Ad keywords to user Keywords 40 given by NGD 41 }; 42 Double distanceToContext; -- distance of Ad keywords to Context 43 Keywords given by NGD 44 String adDescription; -- description written on activity stream 45 String largeObjectId; -- id of image or video file 46 String objectCheckSum; -- checksum of file 47 }; 48 */ 49
Figure 13: Display app requesting a set of ads
When any of the ads in the candidate list doesn’t have its respective big data object
(image/video), it is removed from the candidate list and not considered a valid advert until its
video/image is present in memory. When this happens, by default the object is requested to the
content manager that uploads it to the screen app. These objects are placed on local memory with a

56
time to live of a day. After that they are considered expired. Every time one of those objects is
considered expired, instead of right away discarding it and asking for a new one to be uploaded to the
screen, a checksum match is requested by the screen app to the content manager. If the object
checksum in the screen memory matches the one in the server, the object gets is time to live renewed.
If not it is discarded and uploaded a new one instead.
The Content Management System has also the function to keep track of the clicks made by
every single user, associating to each click the user that made it and the ad it corresponds. For our
implementation of this behavior, we used an already existent online ad server. We explored its click
tracking support in our own architecture by integrating part of its functionality. We had to adapt some
concepts used in online advertising to the digital signage environment so the online ad server used,
OpenX, could deliver what we wanted. To describe what adaptations we have done and why we have
done them, we will first introduce how the OpenX works on an online environment and then we will
describe what changes we made to it.
5.2.1. OpenX
The OpenX ad server in an online environment can serve ads to different websites. A website
belongs to a publisher that allows the ad serving in his site from OpenX in return of a paid fee (usually
determined by the number of impressed ads or clicks).
In order for a publisher to serve the ads of OpenX he needs to specify a channel through which
the ads are served. This channel is called zone in OpenX terminology. A zone refers directly to an area
of a web site page. A web site can have various zones, but each zone belongs only to a website. A zone
works as a channel through ads are broadcasted. The zone is used to specify various different type of
information, like the adequate banner type for the zone (image or text or video), the size or the theme
of the ad (e.g. sport, music) and others. The zone can display an unlimited number of different banners
as long as they are compatible with it.
OpenX offers support for ad managing by allowing the creation of ad campaigns by the
advertisers. An advertiser can have multiple campaigns at any given moment. A campaign aggregates
all the banners of an advertiser dedicated to a specific theme and does not have a limit of banners.
The OpenX ad server is also responsible for keeping track of the number of impressions, clicks
and other type of interactions (e.g. purchases) done by the users for each banner, zone and campaign.
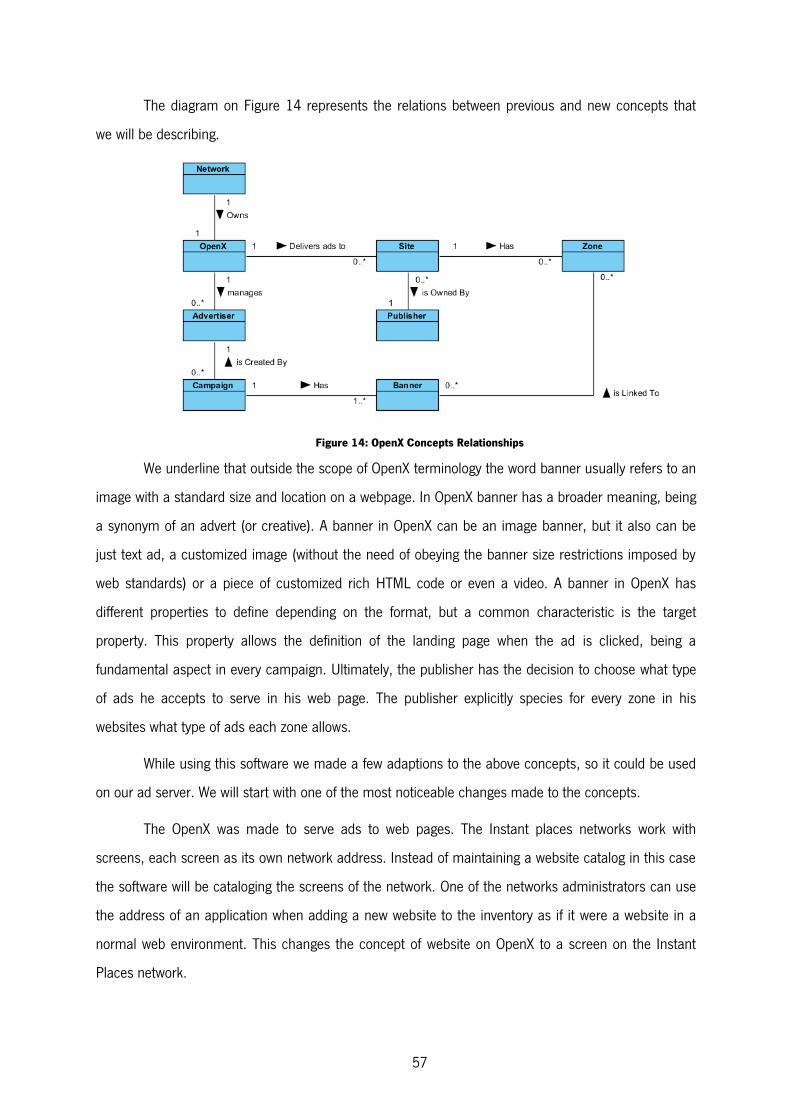
57
The diagram on Figure 14 represents the relations between previous and new concepts that
we will be describing.
Figure 14: OpenX Concepts Relationships
We underline that outside the scope of OpenX terminology the word banner usually refers to an
image with a standard size and location on a webpage. In OpenX banner has a broader meaning, being
a synonym of an advert (or creative). A banner in OpenX can be an image banner, but it also can be
just text ad, a customized image (without the need of obeying the banner size restrictions imposed by
web standards) or a piece of customized rich HTML code or even a video. A banner in OpenX has
different properties to define depending on the format, but a common characteristic is the target
property. This property allows the definition of the landing page when the ad is clicked, being a
fundamental aspect in every campaign. Ultimately, the publisher has the decision to choose what type
of ads he accepts to serve in his web page. The publisher explicitly species for every zone in his
websites what type of ads each zone allows.
While using this software we made a few adaptions to the above concepts, so it could be used
on our ad server. We will start with one of the most noticeable changes made to the concepts.
The OpenX was made to serve ads to web pages. The Instant places networks work with
screens, each screen as its own network address. Instead of maintaining a website catalog in this case
the software will be cataloging the screens of the network. One of the networks administrators can use
the address of an application when adding a new website to the inventory as if it were a website in a
normal web environment. This changes the concept of website on OpenX to a screen on the Instant
Places network.

58
We further felt the need to adapt other concepts because we could not without this adaptation
retrieve information about the clicks, more precisely the user who made the click. For this, we had the
need to change the concept of zone on OpenX. The OpenX server is prepared to identify the zones from
where each click was made. OpenX uses and defines zones in the websites to serve ads through them.
A website can have various different zones and each zone has its type. The zone type specifies the ad
format (Banner, Button, Text, Video) supported by the zone. The OpenX server generates a JavaScript
zone code that is to be deployed on a webpage. This zone code allows the OpenX to deliver ads
through it. This code is used by being added to the corresponding publisher’s website page source
code. In case of video everything is done in the same except that the code is not generated by OpenX,
instead the video player plugin configuration needs to be set up so it references the right zone that was
set up in OpenX. When a user then clicks on the ad delivered by the code generated for a zone, it is
recorded on the ad server the zone from which the click originated.
We propose to change this concept of zone. Instead of representing an area on a website, a
zone would be directly connected to a user, and each user has his zone.
In our ad server for Instant Places, we had previously adapted the concept of a website to a
screen, now we propose to adapt the concept of zone to become the users to each the ads are
delivered. This allows the OpenX to identify the user that made the clicks and the screen from which
the ad that was clicked came from. This adaptation meant only to alter the way how the zone code was
used instead of altering the way it was generated. By associating each user identifier with a zone
identifier, the code generated can be parameterized to pass information about the user that made the
click, allowing us to associate a click with a user.
The concepts on campaign and banner remain unchanged. The way that the ads are delivery
also remains very similar, the only change is that the code generated for ad delivery by OpenX is now
stored on the screen.
When a user connects to the screen, that code is sent to the user mobile device parameterized
to his zone, so every click he makes can be associated to him.
This adaptation of concepts allowed us to use the OpenX ad server to show clickable ads on
the users mobile devices. The Figure 15 shows how OpenX complements our architecture by
achieving that.
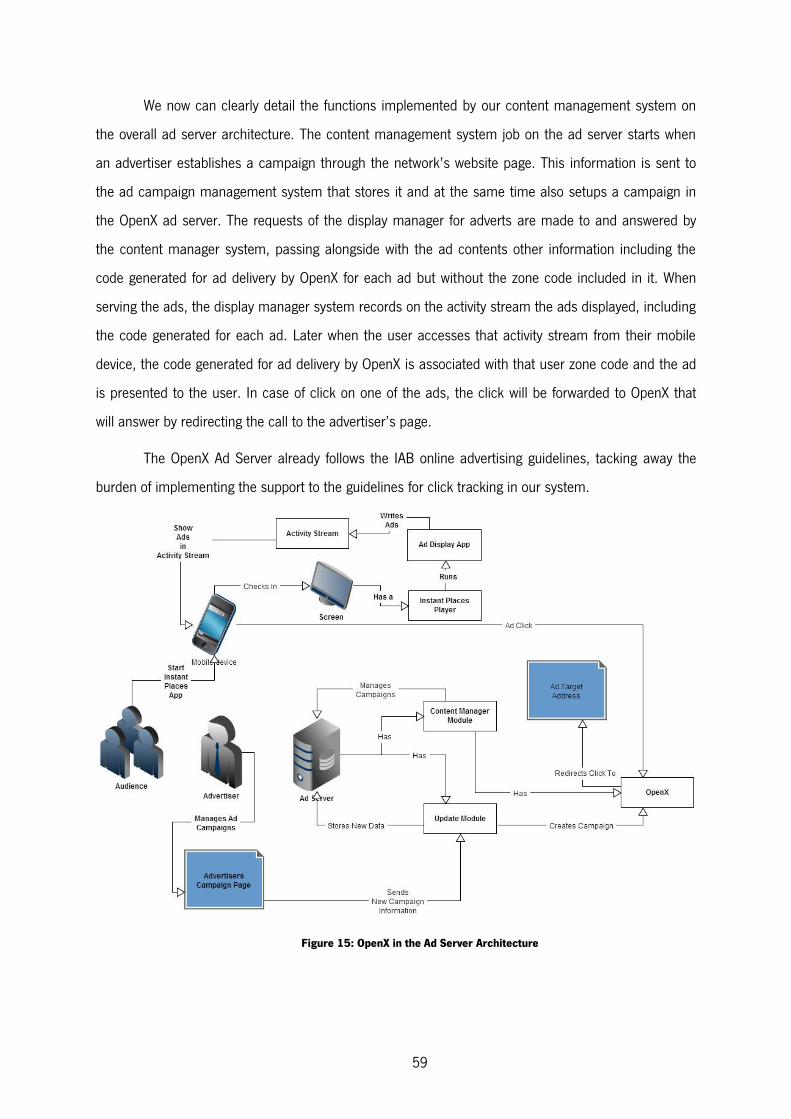
59
We now can clearly detail the functions implemented by our content management system on
the overall ad server architecture. The content management system job on the ad server starts when
an advertiser establishes a campaign through the network’s website page. This information is sent to
the ad campaign management system that stores it and at the same time also setups a campaign in
the OpenX ad server. The requests of the display manager for adverts are made to and answered by
the content manager system, passing alongside with the ad contents other information including the
code generated for ad delivery by OpenX for each ad but without the zone code included in it. When
serving the ads, the display manager system records on the activity stream the ads displayed, including
the code generated for each ad. Later when the user accesses that activity stream from their mobile
device, the code generated for ad delivery by OpenX is associated with that user zone code and the ad
is presented to the user. In case of click on one of the ads, the click will be forwarded to OpenX that
will answer by redirecting the call to the advertiser’s page.
The OpenX Ad Server already follows the IAB online advertising guidelines, tacking away the
burden of implementing the support to the guidelines for click tracking in our system.
Figure 15: OpenX in the Ad Server Architecture

60
5.3. Display Manager System
The display manager system is an application that runs on the screen alongside other Instant
Places applications. This application is brought to the foreground (shown in the screen) by the Instant
Places’ own display manager system. Just before this application is brought to the foreground, it sends
a message to the display manager system requesting the most up to date set of ads for a specific
timeframe (e.g. for the next 30 minutes). Alongside with this request also sends a keyword tag cloud
with the most current updated words gathered from recent activities on the screen made by the users
(new posted contents and messages). This keyword tag cloud is retrieved from the Instant Places API,
in case the API server is offline the tag cloud is not sent with the request. The display manager gets as
a response from the content manager system a list of ad candidates. Each ad candidate has a set of
attributes and statistics attached to them (those were previous detailed on 5.2).
This list is sent to the data mining module, which calculates the rank of each advert by giving
them a percentage grade ranking. The ad with the highest grade is the most recommendable advert to
the audience. The audience considered represents only the viewers that are currently logged in on the
screen running the display software. This information is given by the Instant Places API, each user has
associated with him a profile (age, hometown and gender), a set of keywords that are taken from the
users explicit interests detailed in theirs profile, and their previous activities in the digital signage
network (previous posts of personalized content). This information is accessible to the display software
every time it is running on the screen by querying the Instant Places API.
For each ad present in the candidate list, the restrictive targeting rules are checked one by
one. If any restrictive rule is applicable to the audience present in the moment, the respective ad is
removed from the list of candidates.
In order to maximize profit by choosing the best ads the following equation is applied to each
advert on the candidate list the following formula:
( ) ( ) ( ) ( )
Equation 1: Recommendation Formula
The equation gives the recommendation value (%) for serving an advert ( ) at the moment (t).
In this equation represents the weight given to the ad targeting, refers to the weight given to the
expected profit by serving the ad and is the weight of the context surrounding the screen at time t.
Both represent the total weight ( ) and are constants that are defined by the network
administrator, who has the responsibility to define what best suits the network. The administrator can
61
choose to give more emphasis on maximizing in short term the income of the network ( ), or to bet on
long term in the success of the campaigns served on the screens ( ). This way independently
of how the recommendation algorithm operates the network administrator has the final word on how
the network should run.
The adverts with the biggest recommendation are shown first and in order (from biggest to
lowest) by the value given by the Recommendation function.
The ( ) value is given by the data mining module. How we achieved this value, is detailed
on chapter 5.6.
The ( ) value is the maximum bid established by the advertiser in the case of the current
scenario, this value is calculated by the content display software and it is obtained through the following
equation:
( ) ( ( ) ( ) ( ) ( )) ( )
( )
Equation 2: Ad Bid Formula
Where ( ) value is calculated through the list of candidates maximum base bid, each ad in
that list is compared to all others to determine if there is another advert with the same bid or superior
bid. If found one, then the base bid for the ad is the maximum base bid detailed on the candidate
list. Exceptionally, if an advert base bid exceeds the remainder of the budget available for the respective
campaign, the remainder of the budget is used as base bid instead. If there isn’t another advert on the
candidate list that pays more than , then the base bid value is given by the second best base bid on
the candidate list plus a bid increment. A bid increment is predetermined by the following table:
Current Price Bid Increment
0.01 - 0.49 0.01
0.50 - 0.99 0.05
1.00 - 4.99 0.25
5.00 - 24.99 0.50
Table 2: Bid increments

62
The bid increments are all related to the minimal currency unit defined by the network
administrator when setting up the ad server. A 0.05 increment means that a new bid must be made
with an increment of at least 5 times the minimal price unit. This allows for flexibility on defining the
currency units used by the systems (dollars, euros, pounds) and also the minimal currency unit can be
a fraction of a cent of said currency.
The ( ) value is calculated through the bids on targeting rules of the advert . Only the
rules applicable to the current audience are considered, the targeting rule with the biggest bid is
chosen if there are more than one applicable rule. A rule is applicable to the audience if the current
viewers that are checked in on the screen have a profile that meets the rule criteria (age, gender,
hometown and keywords associated with their profiles). The ( ) value corresponds to the
maximum bid specified for a time slot (t). The maximum bid is defined by comparing it with the rest of
the adverts on the candidate list that also have bids for timeslot t. The ( ) value is defined by the
keyword with the biggest bid that the advertiser targeted the audience with. There will only be keyword
bids if one user is present in the audience, at least, with a profile that has the same keyword
associated with the bid. The ( ) represents the expected gain from clicks based on the click
through rate of the ad its value is given by the equation:
( ) ( )
( ) ( )
Equation 3: Click Through Rate Formula
The ( ) represents the value charged per each click on advert .
The ( ) value is the time duration of ad . The value is given by the ad with the biggest
ratio between duration and the value of maximum valid bid plus the expected gain from clicks. So the
advert with the Br ratio will always have a Mb value of 100.
The ( ) value of the ( ) equation is defined by the distance
between the current keywords that are trending on the screen to each advert keyword set. This is a
relative value to the biggest distance and smallest distance between keywords. This is because the
Distance function values vary between 0 to infinity.
( ) ( ( ( ) ( )))
Equation 4: Place Relevance Formula
The ( ) represents the current set of keywords that are trending on the screen at time t.

63
The ( ) represents the keyword set associated with advert .
The Distance value between the keywords sets are calculated by the content management
system upon receiving the request for a set of ads from the display manager (see chapter 5.4 for the
definition of the Distance function).
B is the value of the distance between the keyword set of the ad in the candidate list with the
biggest distance to the current set of keywords trending on the screen. L is the value of the shortest
distance between these sets.
After ranking the candidates with the above algorithm in an ordered list, the application iterates
over that list and puts on the screen memory cache the very first ads. This is done because each ad on
the list of candidates has a reference to the advert creative (a data stream) stored on the content
manager system database, requesting one by one, and leaving to the Instant Places Display Software
to store in cache memory the data streams received.
The decision of running the selection algorithm on the screen application, instead of running
on the ad content manager system, is in consequence of the need to serve the ads in communication
failure scenarios. If the ad server is unreachable, the ads served by the screen application are chosen
based on the last data received by the ad server in response to the last request. In this case, the
recommendation is done the same way but the audience targeting factor is 0. This is because the
screen app can no longer identify the current audience members.
The sequence diagram on Figure 17 shows the ad delivery process, starting when the Instant
Places Display manager notifies the display app that it is going to run during a predetermined
timespan. This notification is given every time after an ad display cycle is finished.
After serving an ad, information about it is stored on the screen activity stream (the ad
description and the OpenX code). Later the users through their mobile devices using the Instant Places
app can consult the screen activity stream and click on the ads. After all ads are showed, the number
of impressions and budget consumed is notified to the content management system. This action is
resumed by the sequence diagram in Figure 16.
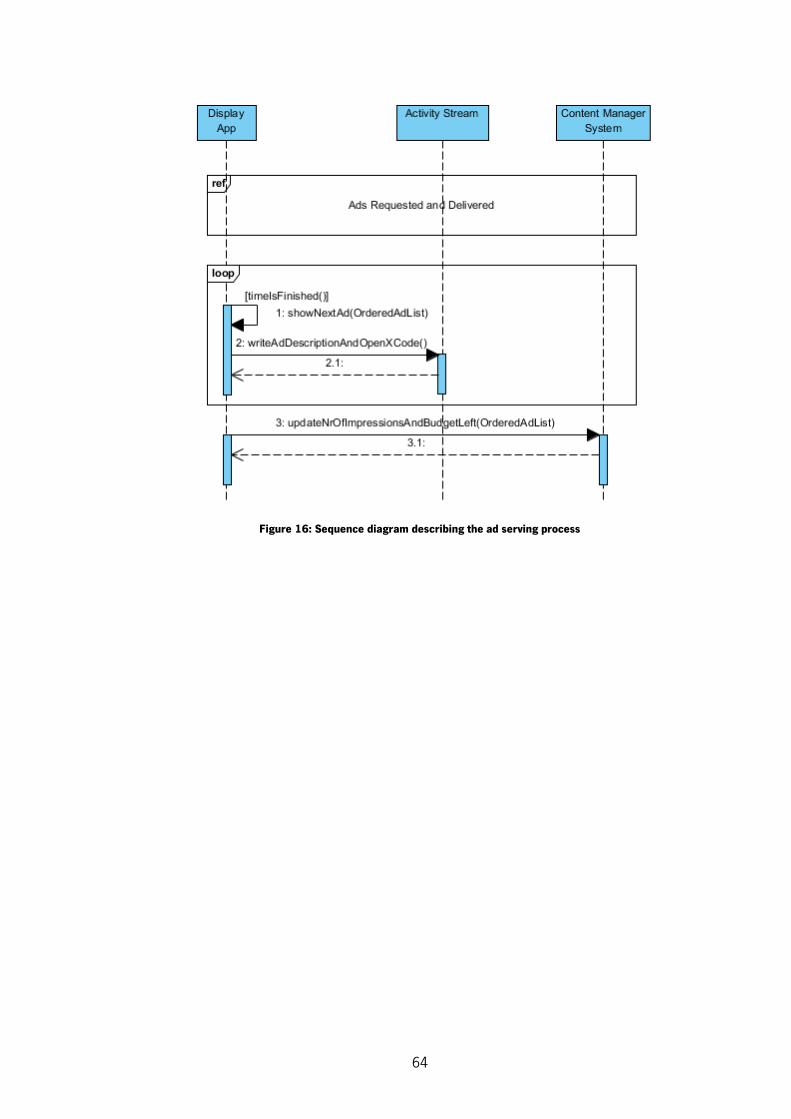
64
Figure 16: Sequence diagram describing the ad serving process
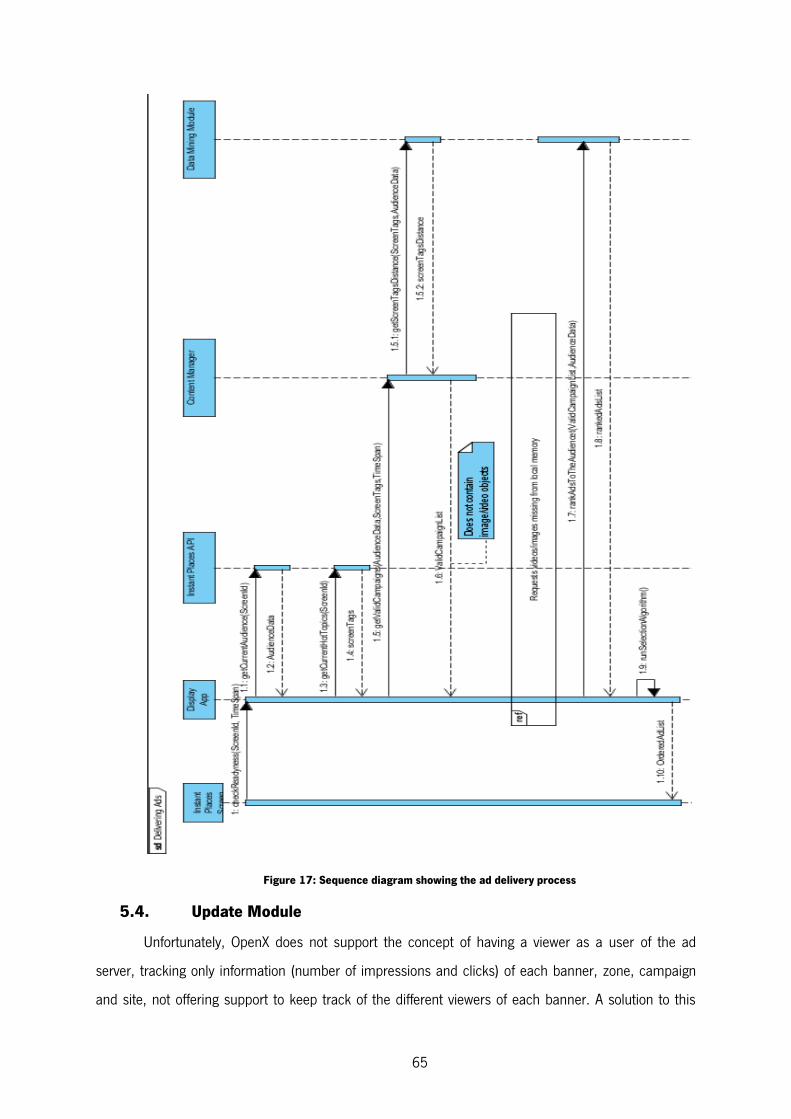
65
Figure 17: Sequence diagram showing the ad delivery process
5.4. Update Module
Unfortunately, OpenX does not support the concept of having a viewer as a user of the ad
server, tracking only information (number of impressions and clicks) of each banner, zone, campaign
and site, not offering support to keep track of the different viewers of each banner. A solution to this
66
problem is to treat every single viewer as a different zone. This is done in order to allow tracking of
information about past actions of every single user of Instant Places through the use of zones. To
achieve this effect the following process is triggered when the update module checks for new users in
the network:
It is checked if the user already exists in others screens. If he already exists nothing is done if
not, then it is created a new zone with the user identifier explicit in its name. This is to
associate Instant Places users with zones in OpenX.
All the active banners that are compatible with the new zone restrictions (e.g. type, size, and
theme) are linked to the zone so they can be served in the zone.
The JavaScript code of the zone is generated by the web server for the new zone and stored on
the database for future use. Since our zones are all of the same type, we simplified this
process by just storing the id number associated with the zone. This is because the id number
is the only element that differs on the code generated from zone to zone.
After checking in at a screen, a user can consult a history of the contents (activity stream) that
passed on the screen, including the ads served by Instant Places. The activity stream has been written
with the JavaScript code for the zones for each ad. This code, later when interpreted by the mobile app
in the users’ mobile device, sends a message to the OpenX server recording an impression.
Besides checking if new users were added to the system, the update module also checks the
availability of the screens and adds new screens additions to the content management system.
Another task of this module is to maintain up to date a table that stores the value of the
distance of the keywords associated to the users profile with the keywords of the current active
campaigns. There are numerous different types of algorithms to measure this through semantic
similarity, topological similarity, statistical similarity, groupwise algorithms and others. We first tried to
use a semantic similarity algorithm by using a tool known as WordNet[76], but due to the lack of
support in the native language we proceeded to use instead a statistical similarity approach, by
implementing the Normalized Google Distance algorithm (NGD)[77].
The objective of this work is not to find the best algorithm possible for the network, but a
platform that would be flexible enough so different algorithms could be latter easily tested on the
network. Changing and adding new algorithms to the system can be done by simply changing or
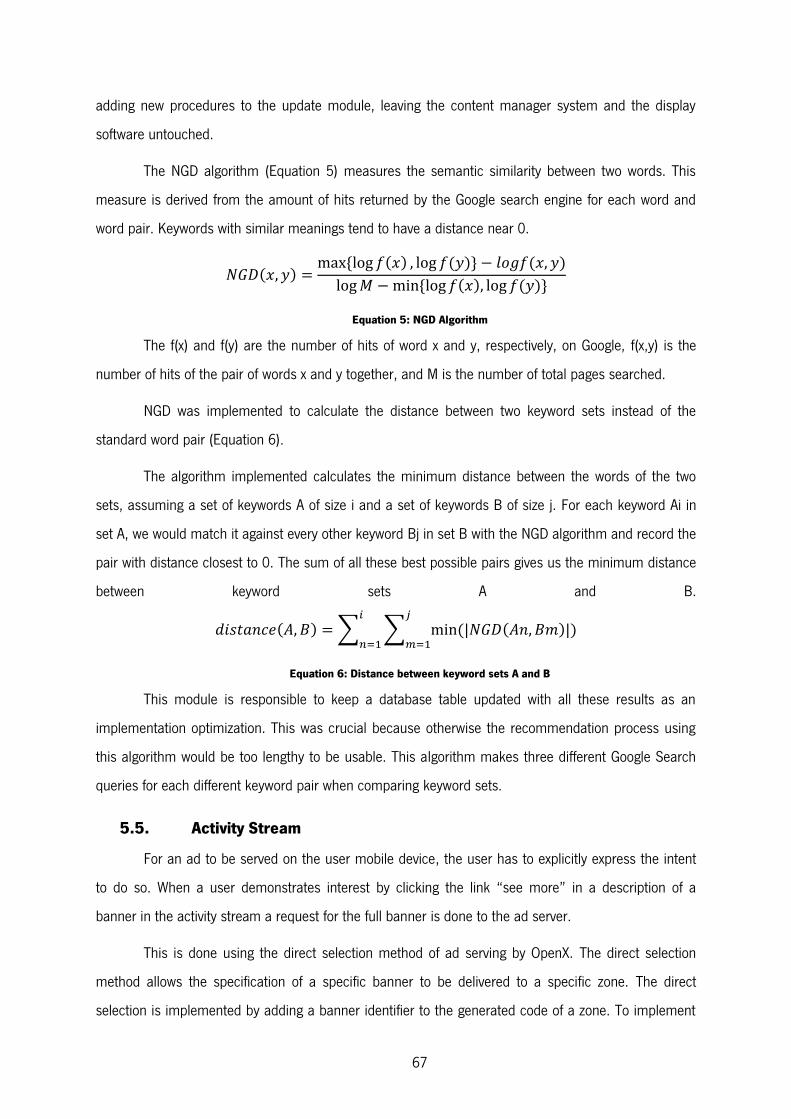
67
adding new procedures to the update module, leaving the content manager system and the display
software untouched.
The NGD algorithm (Equation 5) measures the semantic similarity between two words. This
measure is derived from the amount of hits returned by the Google search engine for each word and
word pair. Keywords with similar meanings tend to have a distance near 0.
( ) ( ) ( ) ( )
( ) ( )
Equation 5: NGD Algorithm
The f(x) and f(y) are the number of hits of word x and y, respectively, on Google, f(x,y) is the
number of hits of the pair of words x and y together, and M is the number of total pages searched.
NGD was implemented to calculate the distance between two keyword sets instead of the
standard word pair (Equation 6).
The algorithm implemented calculates the minimum distance between the words of the two
sets, assuming a set of keywords A of size i and a set of keywords B of size j. For each keyword Ai in
set A, we would match it against every other keyword Bj in set B with the NGD algorithm and record the
pair with distance closest to 0. The sum of all these best possible pairs gives us the minimum distance
between keyword sets A and B.
( ) ∑ ∑ ( ( ) )
Equation 6: Distance between keyword sets A and B
This module is responsible to keep a database table updated with all these results as an
implementation optimization. This was crucial because otherwise the recommendation process using
this algorithm would be too lengthy to be usable. This algorithm makes three different Google Search
queries for each different keyword pair when comparing keyword sets.
5.5. Activity Stream
For an ad to be served on the user mobile device, the user has to explicitly express the intent
to do so. When a user demonstrates interest by clicking the link “see more” in a description of a
banner in the activity stream a request for the full banner is done to the ad server.
This is done using the direct selection method of ad serving by OpenX. The direct selection
method allows the specification of a specific banner to be delivered to a specific zone. The direct
selection is implemented by adding a banner identifier to the generated code of a zone. To implement

68
direct selection normally a website administrator would have had to manually change the generated
code. In our case this is done on the fly by the Instant Places application. The generated code for the
zone of the user is only interpreted by the application of Instant Places on the user’s mobile device
when a banner is requested by him. When reading the Activity Stream contents the application
retrieves the code of the zone of every ad in it. Then adds to the zone codes the identifier of each
respective zone and the id of the advert (banner) in which the user demonstrated interest. This process
of customizing the code for direct selection is done locally, every time an user makes a request to know
more about a specific advert. The “know more” action is a procedure that ends up redirecting the click
to the OpenX server on the content management system. The OpenX records the click information and
immediately answers the incoming message with the respective target address. The sequence diagram
on Figure 18 describes this interaction done with the activity stream.
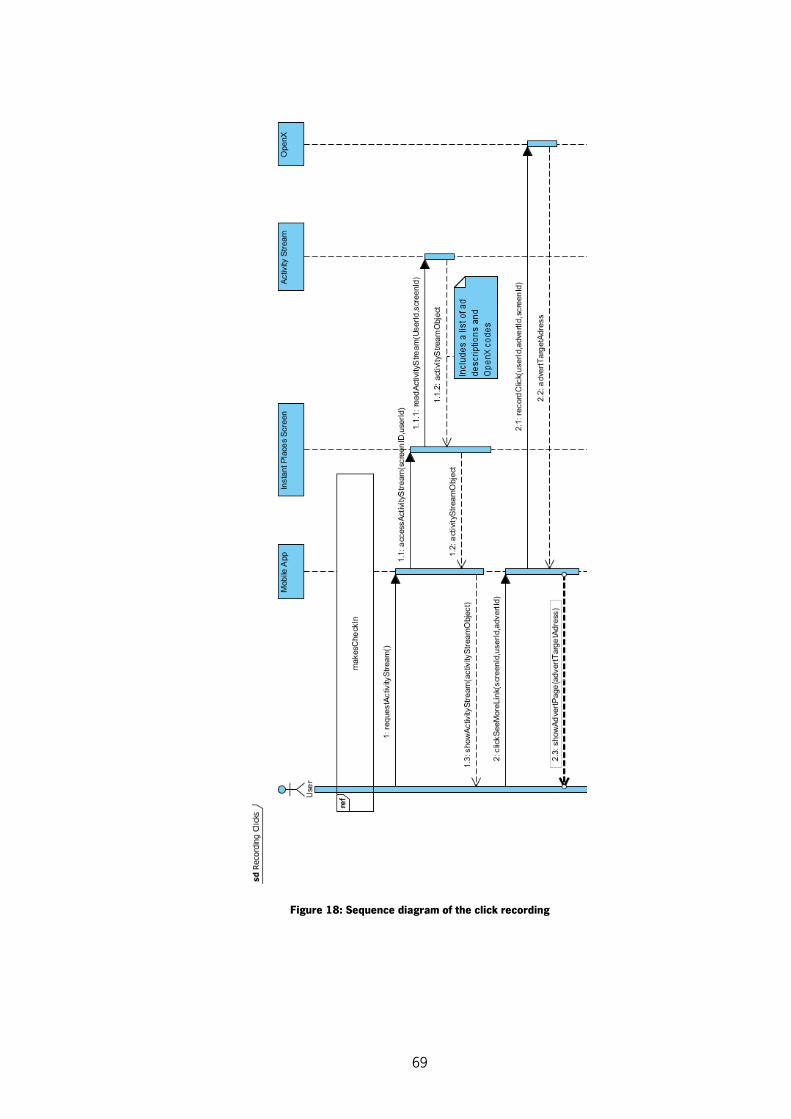
69
Figure 18: Sequence diagram of the click recording

70
5.6. Data Mining Module
This module runs in parallel with the content manager system. Its function is to gather
information about the network users clicks and use it to calculate each advert relevancy to each user.
The software that has this function is named a recommender system.
The Context Aware Recommendation Systems (CARS) [75][78] are computational solutions
that are capable of using data from users, items (in this case all items are adverts) and other
information deemed relevant, and then process this information outputting an estimated list of target
items recommendations.
The recommendations can be done in many different ways. We use a content based approach
where we explore the number of clicks done by a user in ads and try to find relationships between the
ads clicked. Our approach comprises in a two-step process to determine a weighted ranking for each
advert based on the click number.
In the work “Exploiting Contextual Information in Recommender Systems”[75] the architecture
on Figure 19 was suggested for a context aware recommender system. The rectangular boxes on the
image represent the recommender system components and each arrow indicates information flow. In
the CARS system, the Context Provider is responsible for tracking changes in contextual variables. This
information is then later used by the context manager, that checks which attributes of the user or items
are relevant, filling the gaps of missing information with estimations. The user and item models
represent their information on the system, depending on the type of recommender system algorithm
their representation may vary. An item model, in the case of an ad engine recommender system, refers
to an advert which is represented with a set of attributes. The model adapter is responsible for
integrating the user/item model data with context variables. The prediction engine takes this enhanced
model and generates a list of predictions that can be served for the users. Alongside with all this
process is the explanation engine which records the decisions made by the system that lead to the
recommendation list.

71
Figure 19: CARS Architecture[75]
Our data mining module developed for Instant Places was developed based on this architecture
but with some key differences:
The Audience model: Instead of a vector representing a user, we use aggregate of
users that are at that moment around a screen since we intend to target a group of
individuals instead of a single user.
The Item model: Our item model is a simplification of the one used originally by the
CARS architecture. In our case, the classified items will all be adverts. All ads have the
same attributes. Those are the category of the ad, the local associated with it and its
keywords.
Other big difference is that we will rely on the click through rate (CTR) of the
advertisements to determine the user tastes. While this does not show that the viewer
disliked or not the ad, at least, shows the viewer was somewhat curious about it.
The implementation of this instance of the data mining module considered the premise that if
a user clicked on a type of ads then in the future will click on similar ads.
In our architecture developed for Instant Places, the context manager function is not part of the
content manager module. It is used independently on request by the display application when it sends
a request to rank a determined set of ads for a group of individuals to the content management
system. The display application gathers information about the trending keywords tags on the screen
and the individuals that compose the audience. The items (adverts) are represented by a weighted
vector. The attributes of the item model are grouped in Category (Sport, Cinema, Music...), Local
(Lisbon, London…), Keywords (Car, Lawyer, Insurance…). Each attribute in one vector has with it
associated a binary value. The binary value represents if the attribute value is present on the advert.
The Table 3 shows an example of the representation of the item model of an advert.
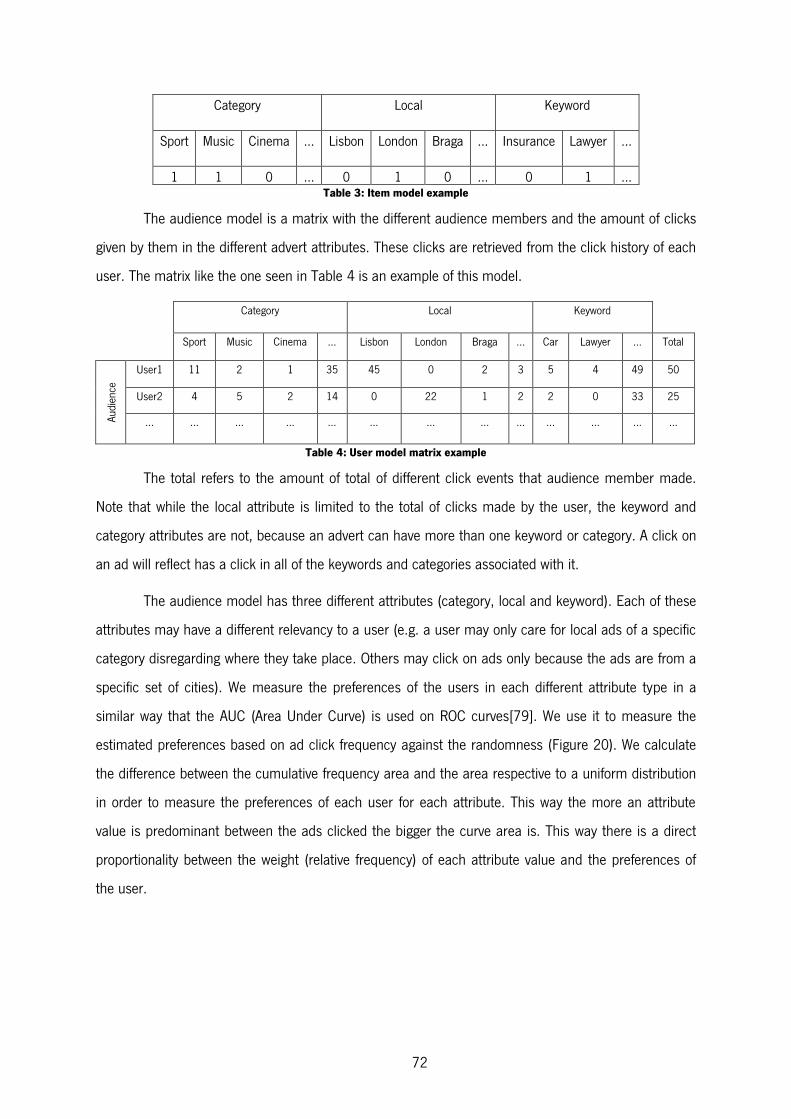
72
Category Local Keyword
Sport Music Cinema … Lisbon London Braga … Insurance Lawyer …
1 1 0 … 0 1 0 … 0 1 … Table 3: Item model example
The audience model is a matrix with the different audience members and the amount of clicks
given by them in the different advert attributes. These clicks are retrieved from the click history of each
user. The matrix like the one seen in Table 4 is an example of this model.
Category Local Keyword
Sport Music Cinema … Lisbon London Braga … Car Lawyer … Total
Audi
ence
User1 11 2 1 35 45 0 2 3 5 4 49 50
User2 4 5 2 14 0 22 1 2 2 0 33 25
… … … … … … … … … … … … …
Table 4: User model matrix example
The total refers to the amount of total of different click events that audience member made.
Note that while the local attribute is limited to the total of clicks made by the user, the keyword and
category attributes are not, because an advert can have more than one keyword or category. A click on
an ad will reflect has a click in all of the keywords and categories associated with it.
The audience model has three different attributes (category, local and keyword). Each of these
attributes may have a different relevancy to a user (e.g. a user may only care for local ads of a specific
category disregarding where they take place. Others may click on ads only because the ads are from a
specific set of cities). We measure the preferences of the users in each different attribute type in a
similar way that the AUC (Area Under Curve) is used on ROC curves[79]. We use it to measure the
estimated preferences based on ad click frequency against the randomness (Figure 20). We calculate
the difference between the cumulative frequency area and the area respective to a uniform distribution
in order to measure the preferences of each user for each attribute. This way the more an attribute
value is predominant between the ads clicked the bigger the curve area is. This way there is a direct
proportionality between the weight (relative frequency) of each attribute value and the preferences of
the user.
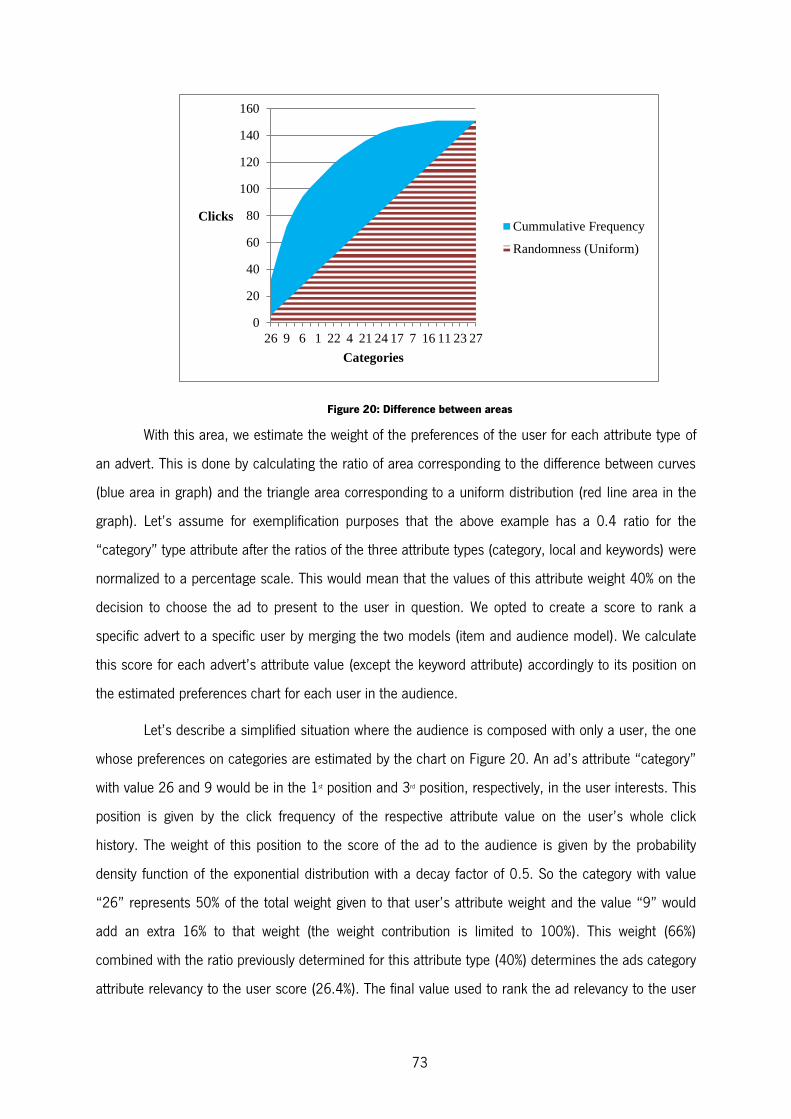
73
Figure 20: Difference between areas
With this area, we estimate the weight of the preferences of the user for each attribute type of
an advert. This is done by calculating the ratio of area corresponding to the difference between curves
(blue area in graph) and the triangle area corresponding to a uniform distribution (red line area in the
graph). Let’s assume for exemplification purposes that the above example has a 0.4 ratio for the
“category” type attribute after the ratios of the three attribute types (category, local and keywords) were
normalized to a percentage scale. This would mean that the values of this attribute weight 40% on the
decision to choose the ad to present to the user in question. We opted to create a score to rank a
specific advert to a specific user by merging the two models (item and audience model). We calculate
this score for each advert’s attribute value (except the keyword attribute) accordingly to its position on
the estimated preferences chart for each user in the audience.
Let’s describe a simplified situation where the audience is composed with only a user, the one
whose preferences on categories are estimated by the chart on Figure 20. An ad’s attribute “category”
with value 26 and 9 would be in the 1st position and 3rd position, respectively, in the user interests. This
position is given by the click frequency of the respective attribute value on the user’s whole click
history. The weight of this position to the score of the ad to the audience is given by the probability
density function of the exponential distribution with a decay factor of 0.5. So the category with value
“26” represents 50% of the total weight given to that user’s attribute weight and the value “9” would
add an extra 16% to that weight (the weight contribution is limited to 100%). This weight (66%)
combined with the ratio previously determined for this attribute type (40%) determines the ads category
attribute relevancy to the user score (26.4%). The final value used to rank the ad relevancy to the user
0
20
40
60
80
100
120
140
160
26 9 6 1 22 4 21 24 17 7 16 11 23 27
Clicks
Categories
Cummulative Frequency
Randomness (Uniform)

74
when compared to others is determined by the sum of all three scores (each score associated with an
attribute type).
The ad keyword attribute’ values weight on the score when measuring the relevancy of the ad
to a user is given by the NGD algorithm. This algorithm is used to calculate the distance between the
keywords present in the advert and the keywords associated with the user profile previous click history.
The keywords, present in the ad, are the ones established by the advertiser when creating the ad
campaign, while the keywords associated with a user are keywords that belonged to previous ads that
the user clicked (only the ones that appear on the ads the most are considered). We opted to use this
method to compute the ranking instead of relying only on the frequency of each keyword, due to the
size of the keywords sets making very improbable a direct match between keywords present in an
advert and the user’s click history. It is also to be expected that each different keyword value will have a
very low relative frequency. This is due to the big number of different attribute values. Using the NGD
algorithm allows us to also identify relations between keywords that otherwise, we could not by using
only direct match between keywords. The NGD varies between 0 to infinity. We use an upper limit,
which is the biggest recorded difference between keyword sets, to derive the weight contribution of the
keyword values to the ad relevancy.
The ranks are then weighted and averaged with the estimated preferences of all three
attributes. The final ranking of the ad is determined by the data mining module through an average
between all weighted ranks estimated for each user in the audience, at the time a request to get the
new set of ads is made. It is of note that none of the audience members has more influence than
others when determining the ads that are shown on the screen. The total relevancy of an ad to the
audience A is then given by the following equation:
( ) ∑ ( )
Equation 7: Ad Relevancy Formula
Where, N is the number of users in the audience. The audience is represented by A, and is
the ith member of the audience. ( ) is the value of the average of the weighted ranking
estimated for advert and the ith member of the audience A.
With this process finalized, the data mining module outputs a ranked list. The operations done
and the values that led to those results are recorded in a log file during the recommendation process.
75
6. Conclusions and Future Work
We conclude this thesis with some remarks about the lessons learned when developing the ad
server, underlining some limitations found in our approach. We also discuss the goals achieved with
this work, finalizing with a brief consideration about possible future work.
6.1. Lessons Learned
The ad serving solution was implemented on a simulated local environment where the screen
application (simulated by a browser webpage) requests the ad server for ads based on a generated
data set.
Not allowing us to arrive at any definitive conclusion about the real efficiency of the ad serving
solution in gauging with success the interests of the audience, we used this test environment to solve
some technical aspects of this implementation and to validate if our concept is applicable to the
network.
We focused on the efficiency of the recommendation algorithm. Our ad relevancy algorithm
was reduced to a linear complexity by implementing a materialized view in the database, keeping the
number of clicks associated with each ad attribute value for each user. The calculus of the distance
between keyword sets between user profiles was moved to the update module. When a new user or a
new campaign is added to the system, the update module calculates the distance between each user
keyword set with each ad keyword set. The complexity of the algorithm does not have a constant
growth, because the ad relevancy algorithm uses context keywords and associates them with the users
when requesting the ads to be served. An increase on the number of new keyword pairs that are not
recorded on the database leads to a linear growth on the recommendation execution time.
In Instant Places, the viewers have very few attributes associated to themselves and on top of
that they can choose not to share their details with a screen even when they are connected to it. This
particular situation makes audience targeting nearly impossible. The case is aggravated when users
also do not have an historic of preferences (never clicked on anything), in these situations the
prediction engine will always choose the most immediately profitable ad impression for the network, in
other words the advert with the highest bid on CPI (Cost-Per-Impression).
The Instant Places screen offers few information about the contents that are being served by
the screen. The ads placed around a webpage are contextualized with the page contents. Google
76
recently applied the same principle to its Gmail where the ads placed in around the web page are
contextualized with the emails message contents. In the case of Instant Places, this is not a problem
because the ad serving application will be running in full screen, not leaving space for others messages
to be present on screen. This approach leads to two big disadvantages: the message of the adverts will
not be exploring the dynamic content information served by the other apps running on the at the time,
second the multi views allowed in the Instant Places screen will not be explored by the network,
stealing running time from other apps. The strong point of this approach it is the increase in the
visibility of the ads served in the screen, not giving the opportunity to the viewer to ignore the adverts by
focusing in others screen contents.
When the network is in offline status, it may lead to some issues dealing with the budget of
each campaign. When the network is offline there is no way to the screen to know the current overall
number of times that an ad has been served in other screens, and the respective ad campaign
remaining budget. This may cause adverts to go over the budget, making the network loose income.
Also, audience targeting is not possible because the screen cannot identify the current audience
members because it cannot retrieve this information from the Instant Places API. Alternatively the use
of Bluetooth or NFC (Near Field Communication) would help overcome this problem.
The use of the Activity Stream to establish interaction with the audience members brought to
the table the problem of not being able to promote the ads that best pay for clicks. The Activity Stream
follows a chronological order, so, independently how much the advertiser paid for each click, the ads
will show in the order they were shown in the screen. This led us to establish a fixed pricing on clicks (a
multiple of the maximum bid for a regular impression). Giving the advertisers the option to be charged
only on impressions or both clicks and impressions. The advertisers that choose only the impressions
only have their ad description on the activity stream without the option to the user to click on it.
One of the most complex aspects on our approach, it is the decision of when to make the
notification alerting the display app that is going to run during a determined timespan. In case this
notification is made too soon the audience data collected for ad targeting may get outdated. This may
happen because, in the meantime, the audience members may change. A outdated audience
information leads the ads to be targeted to an audience that is not there, compromising the whole
effort of the ad server to deliver targeted ads. On the other hand, when the request is made too late,
depending on the network communication, the screen may not have time to receive the ordered and

77
ranked list of ad candidates of the ad server. The network is then unable to deliver targeted ads and
behaves like in the case of offline network.
During our tests, it was clear that it was important to strike a balance and compromising in a
solution for this problem. Previously we had defined that after a cycle of ad serving on the screen our
app would make immediately a new request, but this was shown to be too soon especially when the
intervals between cycles of ad serving were of several minutes.
We opted instead to divide the application logic in two different behaviors depending on the
notification made by the Instant Places player. If the screen application receives a pre-processing
notification it collects the present screen contextual data (audience members and hot topics) and
requests the list of ad candidates. After receiving that list, filters it considering only the ads with their
images/videos already in local memory, requesting the video/images of the missing ones. Then this
filtered list is sent to the content management system alongside with the screen contextual data to
retrieve an ordered list of ads ranked by their relevance. This list is then used to establish the final
order by the display app selection algorithm. The second notification type makes the screen app to run
in the foreground iterating over the ads in the last received ordered list. We established an interval time
between notifications of 15 seconds. In other words, the ads are always targeted to an audience that
was present in front of the screen of fifteen seconds ago. This makes our solution not suitable for
screens in places with an audience with an average dwell time inferior to this value.
6.2. Goals Achieved
We initially defined a set of objectives for this thesis, the main goal, to deploy an ad delivery
solution able of audience targeting and context awareness to the Instant Places screen is still during
tests phase, but, the remaining goals that we aimed to achieve were concluded.
We started by analyzing currently available ad servers for digital signage that we could use to
deliver ads in our own ad serving network. We did not find one for digital signage that was flexible
enough to be used as is, leading us to research alternatives in online ad servers. We found OpenX to be
the most suitable for our needs. We note that our answer to this objective is subject to future updates,
due to the upcoming digital signage ad servers on the market. Also, we in no way affirm that this is the
best solution for every case and scenario, or if it will still be preferred one for Instant Places in the years
to come.

78
We aimed to explore the information given by the Instant Places network about its users and
screens to deliver contextualized ads. We were able to develop a recommendation algorithm that used
the screen hot tags to contextualize the ads delivered in it. The audience profile and past actions in the
network were also used as a source of information to target the ads served by our server. Arguably this
recommendation system could be improved by applying different algorithms that explore this
information in a different manner arriving to different conclusions. Our approach to match user
interests was based on tag matching only.
We developed an architecture for a complete solution able to deliver contextualized and
targeted adverts to screens and user’s mobile devices. We created an online platform offering the
advertisers the opportunity to create and manage their campaigns allowing them to target their ads to
specific individuals, places and time. We even promoted a competition between advertisers for the
most attractive timeslots and demographic groups. We implemented a flexible rule definition system
that allows advertisers to define precisely which audience they want to reach, and even the opportunity
for them to do the opposite. Instead of defining their favorite demographic groups they can define the
groups they do not want to cover. This is done by defining these same rules in a restrictive manner.
Also, our ad solution offers the opportunity to the advertisers to target specific contexts by associating
keywords with their ads, for which we also establish a bidding competition.
Our architecture is able to deliver ads to the user’s mobile devices with the use of OpenX’s ad
delivery direct selection method. Using the OpenX online ad server in our architecture, allows us to
track the ad impressions and abide to the IAB online ad serving guidelines for click tracking.
The use of OpenX for click tracking also answered to another of our goals. We aimed to
implement a flexible pricing mechanism for the advertisers, differentiating us from traditional digital
signage advertising where the impressions are the main metric. We offer support to both impressions
and click budget consumption.
We purposed to develop a solution where the control over the network goals is in the network
owners/administrator hands. Our solution allows them to control how the network is run independently
of how the relevance of each of these aspects is calculated. Letting them define the weight of the three
key factors taken into account when delivering ads in this architecture: the relevance of current bids,
the relevance of audience targeting and the relevance ad contextualization. This was done by allowing
them to parameterize the main recommendation function live, through the ad server web interface.

79
We aimed to achieve audience targeting and environment contextualization tolerable to
occasions where the network is offline. Unfortunately, when this happens we cannot deliver targeted
ads due to the inability to identify the current audience present in the screen. Nevertheless, we shifted
the logic of ad selection in our architecture to the screen display app. This allowed the screen to still
deliver ad impressions offline.
In the future, we intend to implement different data mining modules with different
recommendation algorithms. After all, it was one of the major goals that lead to this work. Also, we
suggest improving the existent data mining module that overlooks the information we have about the
audience. E.g. it could be improved by mining the audience data for the most significant demographic
traits present at the current time. Targeting the ads accordingly to the clicks given by users with those
traits, and not only the current audience history like is done currently. This may be interesting allowing
us to test the premise that similar users have similar tastes.

80
81
Bibliography
[1] J. Schaeffler, Digital Signage: Software, Networks, Advertising, And Displays: A Primer For Understanding The Business. Amsterdam; Boston,: Elsevier Science & Technology, Focal Press, 2008, p. 25.
[2] Digital signage broadcasting : content management and distribution techniques A e a ; Bo o : NAB - Focal Press, 2008.
[3] H. E. Agnew, Outdoor Advertising. New York,: Garland, 1985.
[4] A. of National Advertisers. Outdoor Advertising Committee., Essentials of outdoor advertising. New York,: Association of National Advertisers, Inc., 1952.
[5] P. B. Meggs, A History of Graphic Design. Chichester,: John Wiley & Sons Inc., 1998, p. 146.
[6] M. Gallo, The Poster in History. New York,: W. W. Norton, 2001.
[7] U S Pwc “IAB I e e A ve i i g Reve e Repo - F ll Yea 2011 ” o Ap il 2012
[8] G. Beyer “O he I pac of No -fla Sc ee o he I e ac io wi h P blic Di play ” Workshop Proceedings of the ACM International Conference on Human Factors in Computing Systems CHI11 Large Displays in Urban Life From Exhibition Halls to Media Facades, pp. 1–4, 2011.
[9] I Ci co Sy e “Digi al Sig age Di ib io Me ho ologie Ove view ” Oc -2007.
[10] D M R ell C D ew a A S e “Social A pec of U i g a ge P blic I e ac ive Di play fo Collabo a io ” UbiComp 2002 Ubiquitous Computing, vol. 2498, pp. 229–236, 2002.
[11] K. Kelsen, Types of Digital Signage Networks, 1st ed. Amsterdam Boston,: Focal Press, 2010, pp. 3–5.
[12] Zoo Me ia & Ma ke i g “Fi e Digi al ” 2012 [O li e] Available: http://us.zoommedia.com/en-us/Products/FitnessDigital.aspx. [Accessed: 25-Jun-2012].
[13] To chT e M ic Co po a io “Abo U - To chT e ” 2012 [O li e] Available: http://touchtunes.com/en/about-us. [Accessed: 25-Jun-2012].
[14] K. O. Hara, M. Lipson, M. Jansen, A. Unger, H. Jeffries, P. Macer, an P Row “J kola : De oc a ic M ic Choice i a P blic Space ” i In Proc of DIS2004, 2004, pp. 145–154.
[15] activ8-3D “Holog aphic Vi eo A ve i i g ” 2009 [O li e] Available: h p://www ac iv8-3d.co.uk/hologram-advertising/. [Accessed: 25-Jun-2012].
[16] T Ho hi M Takaha hi K Naka a a H Shi o a “To chable holog aphy ” ACM SIGGRAPH 2009 Emerging Technologies on - SIGGRAPH ’09, pp. 1–1, 2009.
82
[17] M Rich ell “New Billboa Sa ple Ra io a Ca Go By The A j ” New York Times, 27-Dec-2002.
[18] M Ficco R Pie a o o a S R o “S ppo i g biq i o loca io i fo a io i i e wo ki g 3G a wi ele e wo k ” Communications of the ACM, vol. 53, no. 11, p. 116, Nov. 2010.
[19] B Wally A Fe cha a M e ge “P e e ce Se i g Billboa ” i Proceedings of the Workshop PerAd2, 2009, pp. 112–126.
[20] J Exele a M B zeck “eMi : Digi al Sig ha eac o A ie ce E o io ” Proceedings of the Workshop PerAd2, pp. 38–44, 2009.
[21] B E e h be “Sce Ma ke i g: S bli i al A ve i i g Me age ” Proceedings of the 2nd International Workshop on Pervasive AdvertisingLbeck Germany, pp. 28–37, 2009.
[22] J Mülle O Paczkow ki a A K üge “Si a e P blic New a Re i e Di play ” i Ambient Intelligence, 2007, vol. 4794/2007, no. Ambient Intelligence, pp. 248–265.
[23] Vo Ah a Dabbi h “De ig i g ga e wi h a p po e ” Communications of the ACM, vol. 51, no. 8, p. 57, 2008.
[24] D Micheli a H Se “E gagi g Pa sers-by with Interactive Screens–A Marketing Pe pec ive ” i 2nd Workshop on Pervasive Advertising Lubeck Germany, 2009, pp. 2–8.
[25] S Ho io H K kka M J T Ojala a J Riekki “E ha ci g i e ac ive p blic i play with social networking service ” Proceedings of the 9th International Conference on Mobile and Ubiquitous Multimedia - MUM ’10, pp. 1–9, 2010.
[26] R Jo e a J C S Ca o o “Oppo i ie a Challe ge of I e ac ive P blic Di play a a A ve i i g Me i ” i Pervasive Advertising, J. Mueller, F. Alt, and D. E. Michelis, Eds. Springer, 2011, pp. 139–157.
[27] J Spae h S Si gee a M Ho eych k “DPAA A ie ce Me ic G i eli e ” A g-2008. [Online]. Available: http://www.dp-aa.org/media/DPAA Audience Metrics Guidelines.pdf. [Accessed: 27-Jun-2012].
[28] M Sekig chi H Nai o A Ue a T Ozaki a M Ya a awa “‘ UBWA ’ biq i o wall cha ge a o i a y wall i o he a a bie ce ” o oc obe pp 7–10, 2005.
[29] A Fe cha W Swobo a a C Wi be ge “E pa a Co po Collec io ” i Proceedings of the Workshop PerAd2, 2009, pp. 45–59.
[30] J Mülle A Schlo a a A K üge “Self-op i izi g Digi al Sig age A ve i i g ” Learning, 2007.
[31] E Repo a R D S Ap il “Café ife i he Digi al Age : A g e i g I fo a io Flow i a café-work-e e ai e Space Ab ac ” pp 123–128, 2006.
[32] J W She y R Beckwi h W Ma ch T Salva o a S Ba ile “The life of he place: ech ology a co i ie ” i Methods, 2005.
83
[33] S. Greenbe g M Ro i g a C T “The No ifica io Collage : Po i g I fo a io o P blic a Pe o al Di play ” o 3 pp 514–521, 2001.
[34] E F Ch chill Nel o De o e a A Gi ge oh “The Pla a Po e Ne wo k : Po i g Multimedia Content i P blic Place ” o Sep e be 2003
[35] D M R ell a J T i ble “Two pa h f o he a e place : Ta k ive a h a - ce e e evol io of a g o p i fo a io face 2 Bl eBoa : O igi al Goal ” i Make IT Easy Conference, 2002.
[36] P. Peltonen, E. Kurvinen, A. Salovaara, G. Jacucci, T. Ilmonen, J. Evans, A. Oulasvirta, and P. Saa ikko “I ’ Mi e Do ' To ch!: i e ac io a a la ge l i- o ch i play i a ci y ce e ” in Computing, 2008, vol. 16, pp. 1285–1294.
[37] Y. Rogers and H. B ig ll “S b le ice-b eaki g : e co agi g ocializi g a i e ac io a o a la ge p blic i play ” i CSCW 2002 Workshop: Public, Community and Situated Displays, 2002.
[38] S Iza i H B ig ll T Ro e Y Roge a M U e woo “Dy a o: A public interactive face ppo i g he coope a ive ha i g a excha ge of e ia ” UIST 03 Proceedings of the 16th annual ACM symposium on User interface software and technology, vol. 5, no. 2, pp. 159–168, 2003.
[39] Y S i a K Ma e “Age Salo : facilitating face-to-face knowledge exchange through co ve a io a o g pe o al age ” i Proceedings of the fifth international conference on Autonomous agents AGENTS 01, 2001, pp. 393–400.
[40] E S ee a W R Hazlewoo “Twi e pace : A Co-develope Di play i g Twi e o ” pp 233–236, 2008.
[41] A Ra ga a ha a R H Ca pbell “A ve i i g i a Pe va ive Co p i g E vi o e ” 2000.
[42] C I E ik o a M Åke o “Ubiq i o A ve i i g Challe ge ” 2008 7th International Conference on Mobile Business, pp. 9–18, Jul. 2008.
[43] M F ie ewal a O Raabe “Ubiq i o co p i g: A ove view of ech ology i pac ” Telematics and Informatics, vol. 28, no. 2, pp. 55–65, May 2011.
[44] K O’Ha a M Pe y E Ch chill a D R el Public and situated displays: social and interactional aspects of shared display technologies, 1 Edition. Dordrecht: Kluwer Academic Publishers, 2003, p. 456.
[45] D M R ell a A E S e “Sec e o S cce a Fa al Flaw : The De ig of ” pp 37–45, 2006.
[46] P P o Sa o “Ec ã público e ívei ao co ex o pa a po e p blici á io ” 2012
[47] M Fi zpa ick “Taggi g Tokyo’ ee wi h o a e ” The Guardian, no. 10 May, 2007.
[48] B Fe e “Billboa Tha K ow Yo by Na e ” New York Times, no. 29 January, Jan. 2007.
84
[49] T Pay e E Davi N R Je i g a M Sha ifi “A c io Mecha i fo Efficie A ve i e e Selec io o P blic Di play ” i Proceedings of the 2006 conference on ECAI 2006: 17th European Conference on Artificial Intelligence August 29 -- September 1, 2006, Riva del Garda, Italy, Amsterdam, The Netherlands, The Netherlands: IOS Press, 2006, pp. 285–289.
[50] R. Jose, N. Otero, S. Izadi, and R. Harper, Instant Places: Using Bluetooth for Situated Interaction in Public Displays, vol. 7, no. 4. IEEE Computer Society, 2008, pp. 52–57.
[51] N Davie A F i ay P New a S R li ge a O S o z “U i g Bl e oo h Device Na e o S ppo I e ac io i S a E vi o e Ca ego ie a S bjec De c ip o ” in MobiSys’09, 2009, pp. 151–164.
[52] Aal o N G hli J Ko ho e a T Ojala “Bl e oo h a WAP p h ba e loca io -awa e obile a ve i i g y e ” Proceedings of the 2nd international conference on Mobile systems, applications, and services - MobiSYS ’04, p. 49, 2004.
[53] J Sá chez J Ca o C T Calafa e a P Ma zo i “Bl eMall : A Bl e oo h-based A ve i e e Sy e fo Co e cial A ea ” pp 17–22, 2008.
[54] N Ka oh a K Taka i “A Me ho of A ve i e e Selec io i M l iple RFID-Tags Sensor Network for a Ubiquitous Wide-A ea A ve i i g Se vice ” 2008 Second International Conference on Sensor Technologies and Applications (sensorcomm 2008), pp. 519–524, 2008.
[55] J Mülle a A K üge “MobiDiC: Co ex A ap ive Digi al Sig age wi h Co po ” i Ambient Intelligence, vol. 5859, M. Tscheligi, B. De Ruyter, P. Markopoulus, R. Wichert, T. Mirlacher, A. Meschterjakov, and W. Reitberger, Eds. Springer, 2009, pp. 24–33.
[56] A Sch i F Al a P Hollei “C ea i g og File and Click Streams for Advertisements in Phy ical Space ” i Adjunct Proceedings of Ubicomp 2008, 2008, pp. 28–29.
[57] F. Ricci, L. Rokach, B. Shapira, and P. B. Kantor, Recommender Systems Handbook, 1st Print. New York, New York, USA: Springer, 2010.
[58] D. Jannach, M. Zanker, A. Felfernig, and G. Friedrich, Recommender Systems: An Introduction, Hardcover. New York, New York, USA: Cambridge University Press, 2011.
[59] A Di Fe i a o A Ro i R e A Ma zali i a F Za bo elli “MyA : A y e for a ap ive pe va ive a ve i e e ” Pervasive and Mobile Computing, vol. 5, no. 5, pp. 385–401, Oct. 2009.
[60] A Roge E Davi T R Pay e a N R Je i g “A A va ce Bi i g Age fo A ve i e e Selec io o P blic Di play ” vol 5 pp 251–258, 2007.
[61] J F Mcca hy T J Co a a E S io go a i “U iCa O Ca & G o pCa : Th ee S ep Towa Ubiq i o Pe iphe al Di play ” pp 1–15, 2001.
[62] J K “Ubiq i o A ve i i g: The Kille Applica io fo he 21 Ce y ” pp 66–73, 2011.
85
[63] K J ee a J J “Tag Ma ch A ve i i g B i e Mo el i Mobile RFID E vi o e ” 2008 Third International Conference on Convergence and Hybrid Information Technology, pp. 837–841, Nov. 2008.
[64] S. Kurkovsky and K. Hariha “U i g biq i o co p i g i i e ac ive obile a ke i g ” Personal and Ubiquitous Computing, vol. 10, no. 4, pp. 227–240, Sep. 2005.
[65] K F a co J H Ro a J V Ba bo a C a Co a a A C Ya i “MUCS: A o el fo biq i o co e ce ppo ” Electronic Commerce Research and Applications, vol. 10, no. 2, pp. 237–246, Mar. 2011.
[66] V. Toubiana, D. Boneh, H. Nissenbaum, and S Ba oca “A o ic : P ivacy P e e vi g Targeted Advertising ∗,” 2009.
[67] S G ha B Che g a P F a ci “P iva : P ac ical P ivacy i O li e A ve i i g ” 2010
[68] F. Alt, T. Kubitza, D. Bial, F. Zaidan, B. Zurmaar, T. Lewen, A. S. Shirazi, and A. Schmidt, “Digifie : I igh i o Deployi g Digi al P blic No ice A ea i he Wil ” 2011
[69] P Tia A V Sa jay S Malik K Chi a jeevi a S Pha i “Realizi g Ta ge e A ve i i g i Digi al Sig age wi h AVA a Da a Mi i g ” i Proceedings of the International MultiConference of Engineers and Computer Scientists, 2012, vol. I.
[70] K. Smith, S. O. Ba, D. Gatica-pe ez J O obez a F Poly ech iq e “T acki g he M l i Pe o Wa e i g Vi al Foc of A e io ” pp 265–272, 2006.
[71] T Nawaz M Mia a H Habib “I fo ai e evice co ol by eye gaze a ge e ecog i io f io ” IEEE Transactions on Consumer Electronics, vol. 54, no. 2, pp. 277–282, May 2008.
[72] D Sch i F Chehi i E R kzio a H Gelle e “Pho eTo ch : A Tech iq e fo Di ec Pho e I e ac io o S face ” 2010
[73] R Ballaga a J G She i a “Sweep a Poi & Shoo : Pho eca -Ba e ” i CHI’05 extended abstracts on Human factors in computing systems, 2005, pp. 1200–1203.
[74] A. S. Shi azi C Wi kle a A Sch i “Fla hligh I e ac io : A S y o Mobile Pho e I e ac io Tech iq e wi h a ge Di play ” 2009
[75] Bal a “Exploi i g co ex al i fo a io i eco e e y e ” Proceedings of the 2008 ACM conference on Recommender systems - RecSys ’08, p. 295, 2008.
[76] G a Mille “Wo Ne : a lexical a aba e fo E gli h ” Communications of the ACM, vol. 38, no. 11, pp. 39–41, Nov. 1995.
[77] R Cilib a i a P M B Vi a “The Google Si ila i y Di a ce ” vol 19, no. 3, pp. 370–383, 2007.
[78] G A o avici a A T zhili “Co ex -awa e eco e e y e ” Proceedings of the 2008 ACM conference on Recommender systems - RecSys ’08, p. 335, 2008.

86
[79] J. A. Swets, Signal detection theory and ROC analysis in psychology and diagnostics : collected papers. Lawrence Erlbaum Associates, 1996, p. Chp 11.