relatÓrio de pesquisa - portal.if.usp.br · relatório de pesquisa if ... (2012), saedi et al. ......
TRANSCRIPT

1
RELATÓRIO DE PESQUISA
Estudo das Propriedades Ópticas em Alexandrita
(BeAl2O4:Cr3+) comparado com Crisoberilos (BeAl2O4)
Fevereiro/2017
Relatório de Pesquisa do Prof. Dr. Neilo Marcos Trindade (IFSP) apresentado para pós doutoramento sob a orientação da Profa. Dra. Elisabeth M. Youshimura junto ao Departamento de Física Nuclear do Instituto de Física da Universidade de São Paulo. Período: 01/Mar/2016 à 28/Fev/2017.

2
Sumário
1. REALIZAÇÕES NO PERIODO ...................................................................................................... 4
2. ANEXOS ....................................................................................................................................... 5
3. PLANO DE ATIVIDADES .............................................................................................................. 6
4. CONSIDERAÇÕES FINAIS ............................................................................................................ 7

3
RESUMO
Alexandrita é um mineral da variedade crisoberilo que contém cromo em sua
estrutura, possuindo a seguinte composição química: BeAl2O4:Cr3+. O Brasil é
considerado atualmente o maior produtor mundial de alexandrita; porém, ainda
é uma gema pouco conhecida quanto as suas propriedades físicas. Além de
apresentar um efeito de mudança de cor dependendo da fonte de luz a qual
esta exposta, esse material também tem sido importante tecnologicamente
como laser em aplicações médicas, principalmente na área de dermatologia e
tratamento de câncer, com propriedades superiores aos seus principais
concorrentes, lasers de rubi e Nd:YAG. Nesse trabalho a composição química
das amostras serão obtidas pela técnica de fluorescência de raios X e a
qualidade das amostras será verificada por meio de absorção óptica na região
do visível. O objetivo da pesquisa é investigar os efeitos de radiação ionizante
(raios X, beta e gama) e da luz UV em propriedades ópticas de alexandrita
utilizando técnicas de Termoluminescência (TL) e Luminescência Opticamente
Estimulada (OSL). O projeto tem também como objetivo correlacionar e
ampliar os conhecimentos sobre esse material, principalmente quanto a
resposta luminescente - TL e OSL - e o estudo da viabilidade de uso em
dosimetria de radiações. Estudos preliminares mostram que alexandrita exibe
picos TL de baixa intensidade em 110, 160 e 280˚C e um pico dominante em
350˚C e resultados inéditos de OSL mostram um sinal intenso no espectro
mesmo com doses baixas de radiação. Acredita-se que as impurezas,
principalmente o Cr3+ e Fe3+, têm um papel importante nessas características.

Relatório de Pesquisa IF - USP
4
1. REALIZAÇÕES NO PERIODO
O Brasil é considerado atualmente o maior produtor mundial de
alexandrita (BeAl2O4:Cr3+). O objetivo da pesquisa é investigar os efeitos de
radiação ionizante (raios X, beta e gama) e da luz UV em propriedades ópticas
de alexandrita utilizando técnicas de TL e OSL, e o estudo da viabilidade de
uso em dosimetria de radiações. A investigação da potencialidade da
alexandrita como material dosimétrico é relevante por alguns aspectos; mapear
o material quanto a determinação dos picos TL e a curva resposta com a dose;
há uma escassa literatura sobre a técnica TL aplicada a esse material, e não
consta publicações de OSL para o mesmo material; e o fato de que a matriz
contém 19,8 wt% de BeO e 80.2 wt% de Al2O3, ambos muito utilizado na área
de dosimetria TL e OSL.
O grupo possui uma grande quantidade de amostras naturais oriundas
do estado da Bahia e de Minas Gerais, Brasil. Para efeito de comparação, será
utilizado uma amostra sintética, crescida por H. P. Jenssen and R. Morris
(Allied Signal Inc, U.S.A.), pelo método Czochralski. As análises químicas são
realizadas através de medidas de fluorescência de raios X (XRF), utilizando um
espectrômetro MINI-X (modelo Amptek XR-100SDD). As medidas de absorção
óptica são realizadas na faixa de 400 a 700 nm, utilizando um
espectrofotômetro Cary 1G de Varian. As medições de OSL e TL são
realizadas utilizando um leitor comercial de TL/OSL automatizado produzido
pelo Laboratório Nacional Risø (modelo DA-20).
Na primeira fase desse pós-doutoramento o candidato publicou o
seguinte artigo com o grupo:

Relatório de Pesquisa IF - USP
5
Trindade, N.M., Blak, A.R., Yoshimura, E.M., de Andrade Scalvi, L.V. and
Scalvi, R.M.F. (2016) Photo-Induced Thermally Stimulated Depolarization
Current (TSDC) in Natural and Synthetic Alexandrite (BeAl2O4:Cr3+). Materials
Sciences and Applications, 7, 881-894. http://dx.doi.org/10.4236/msa.2016.712067.
Também iniciou os estudos de TL e OSL em alexandrita. Estudos
preliminares mostram que o mineral exibe picos TL de baixa intensidade em
110, 160 e 280˚C e um pico dominante em 350˚C e resultados inéditos de OSL
mostram um sinal intenso no espectro mesmo com doses baixas de radiação.
No momento o candidato está produzindo um artigo referente a esses
resultados que será submetido em breve:
Trindade, N.M., Yoshimura, E.M. (2017) TL and OSL preliminar studies on
BeAl2O4:Cr3+ natural Brazilian mineral. Minerals Engineering.
Esses resultados foram divulgados em eventos científicos nacionais,
como Encontro de Física 2016, Brazilian Materials Research Society Meeting,
Congresso Brasileiro de Engenharia e Ciência dos Materiais, Brazilian Meeting
on Inorganic Chemistry; e serão divulgados em eventos internacionais como
Process Mineralogy 17, financiado pela FAPESP processo 2016/22984-0, a ser
realizado em março na África do Sul.
2. ANEXOS
Trindade, N.M., Yoshimura, E.M. (2017) TL and OSL preliminar studies
on BeAl2O4:Cr3+ natural Brazilian mineral. Minerals Engineering (artigo a
ser submetido em março);
Trindade, N.M., Blak, A.R., Yoshimura, E.M., de Andrade Scalvi, L.V.
and Scalvi, R.M.F. (2016) Photo-Induced Thermally Stimulated
Depolarization Current (TSDC) in Natural and Synthetic Alexandrite

Relatório de Pesquisa IF - USP
6
(BeAl2O4:Cr3+). Materials Sciences and Applications, 7, 881-894.
http://dx.doi.org/10.4236/msa.2016.712067;
Certificado de participação no Encontro Nacional de Física 2016;
Certificado de participação no Brazilian Materials Research Society
Meeting;
Certificado de participação no Congresso Brasileiro de Engenharia e
Ciência dos Materiais;
Certificado de participação no Brazilian Meeting on Inorganic Chemistry;
3. PLANO DE ATIVIDADES
A continuidade deste projeto está prevista para 1 ano. A seguir,
encontra-se o quadro de distribuição bimestral das atividades que serão
desenvolvidas no decorrer do projeto. Nele, as linhas verticais indicam os
semestres e as horizontais significam:
A – Revisão Bibliográfica;
B – Medidas de Termoluminescência (TL);
C – Medidas de Luminescência Opticamente Estimulada (OSL);
D – Paralelamente às medidas de TL e OSL, realização de medidas de
Absorção Ótica na região espectral do ultravioleta e visível;
E – Microanálises das amostras naturais através de FRX;
F – Interpretação e submissão dos resultados para revistas cientificas da
área.

Relatório de Pesquisa IF - USP
7
1˚/
2017 2˚/
2017
A
B
C
D
E
F
4. CONSIDERAÇÕES FINAIS
Espera-se ter demonstrado o mérito do relatório e que a
continuidade da pesquisa é muito salutar para que o mesmo possa
evoluir na linha de pesquisa escolhida e estabelecer novas parcerias,
além de divulgar seu trabalho na comunidade internacional e também ter
a oportunidade de publicar.

1
TL and OSL preliminary studies on BeAl2O4: Cr3+
natural Brazilian 1
mineral 2
Neilo Marcos Trindade*a,b
and Elisabeth Mateus Yoshimurab. 3
a São Paulo Federal Institute - IFSP, Rua Pedro Vicente, 625, 01109010, São Paulo, SP, Brazil 4 e-mail: [email protected]
5
b University of São Paulo - USP, Institute of Physics, Rua do Matão, 1371, 05508090, São Paulo, SP, Brazil 6 e-mail: [email protected] 7 * corresponding author: +5515997776800. Rua Paulo Varchavtchik 581, 18087190, CS C7, Sorocaba, SP, Brazil. 8
ABSTRACT 9
The investigation of luminescent properties in alexandrite (BeAl2O4:Cr3+
) in natural 10
form is presented in this paper. Alexandrite is a rare and precious mineral that changes 11
color according to the light incident on it. Moreover, in the synthetic form it is used 12
technologically as active medium for laser, especially to its applications in the medical 13
field, with properties superior to its main competitors, ruby and Nd:YAG. Sample 14
composition is obtained through X-ray fluorescence measurements and, we present 15
results of optical absorption. The work proposes to examine the behavior of 16
thermoluminescence (TL) and Optically stimulated luminescence (OSL) signals, as well 17
as their correlations. Initial measurements show that alexandrite sample exhibits low 18
intensity TL peaks at 110, 160 and 280˚C and a dominant peak at 350˚C. For the first 19
time an OSL study of the material is performed, showing an intense signal. In addition, 20
probably Fe and Cr ions have an important part in the process TL and OSL. 21
Keywords: Alexandrite, Crysoberyl, TL, OSL, XRF, Optical absorption. 22
23
24
25
26
27
28

2
1. INTRODUTION 29
Thermoluminescence (TL) is the light emitted by some crystals that were exposed to 30
ionizing radiation, when heated. It is a thermally stimulated emission originating from 31
an energy that was previously stored in the crystal during the irradiation (Yukihara, 32
2001). Therefore, the exposure of material to ionizing radiation leads to the population 33
of the available trap levels, while heating leads to the release of traps (Jacobsohn et al., 34
2013). This light emission after heating is caused by the release of charges trapped in 35
defects in insulating or semiconducting materials (Mckeever, 1985) and their 36
recombination with opposite charges in other defects called recombination centers. 37
Optically stimulated luminescence (OSL) allows complementing the TL 38
characterization through optical stimuli of the irradiated material. The interesting thing 39
about this technique is that the luminescence can be monitored at room temperature, 40
without heating the material, a fact that is used for applications in dating and dosimetry 41
(Yukihara, 2001). OSL is observed during illumination of crystalline insulating 42
materials or crystalline semiconductors that have been previously excited, typically by 43
ionizing radiation (Yukihara & Mckeever, 2011). When the OSL signal is proportional 44
to the absorbed dose, the material in question can be used as a dosimeter. OSL has been 45
observed since the 19th century, but has only been used for dating and personal 46
dosimetry since the mid-20th century (Mckeever, 2001; Mckeever, 2011). Although it is 47
a well-founded knowledge, a wider use of OSL for dosimetry is hampered due to the 48
limited number of dosimetric materials available. The objective of this work is to study 49
the feasibility of a new material, alexandrite mineral, for OSL dosimetry. 50
Alexandrite, chemical composition: BeAl2O4: Cr3+
, is well known in the medical field 51
in synthetic form as an active laser medium, first reported by Bukin et al. (1978), with 52
superior characteristics when compared to other types of media with emission in the 53
range between 700 and 800 nm (Torezan & Osório, 1990; Scalvi et al., 2005). 54
Comprehensive works about applications of the alexandrite laser in medicine can found 55
in papers by Toosi et al. (2010), Ibrahimi et al. (2011), Nilforoushzadeh (2011), Li et al. 56
(2012), Saedi et al. (2012), Wang et al. (2012) and Kim et al. (2014). Another 57
interesting fact about this mineral is its color change according to light incident on it. 58
This property, well known in the literature as alexandrite effect (Gubelin et al., 1976), 59
results in popularity and high market value of alexandrite as a gem (Collins et al., 60
1997),. However, despite belonging to families of gems of high economic and 61

3
technological interest (Ollier et al., 2015), being Brazil one of the largest producers of 62
this mineral there are few studies of the physical properties of natural alexandrite. 63
The alexandrite structure is of chrysoberyl type with the incorporation of chrome in its 64
lattice (Rossi et al., 2014). Chrysoberyl (BeAl2O4) has orthorhombic symmetry (Pmnb) 65
that corresponds to dense hexagonal packing, influencing the oxygen atom positions, 66
which are slightly distorted by the presence of aluminum atoms. These distortions give 67
rise to two sites of different symmetries: a site, Al1, set in an inversion center (Ci 68
symmetry) and a site, Al2, located in a reflection plane (Cs symmetry) (Rabadanov & 69
Dudka, 1997; Ivanov et al., 2005; Scalvi et al., 2007). The larger site, Al2, is preferably 70
occupied in alexandrite by Cr3+
ions which are responsible for the optical properties of 71
alexandrite as laser emission (Shepler, 1984; Scalvi et al., 2002, Weber et al., 2007). 72
In the literature, although there are many papers related to optical properties in 73
alexandrite, as mentioned before, we found, in our bibliographic search, only one study 74
the ionizing radiation effects in synthetic alexandrite (by Yarovoi et al., 1991), and 75
another paper about thermoluminescence studies on natural alexandrite and crysoberyl 76
(by Ferraz et al., 2002). Further motivation for this work is the fact that crysoberyl 77
contains 19.8 wt % BeO and 80.2 wt % Al2O3 (Ivanov et al., 2005). BeO as a good 78
material for TL and OSL dosimetry,with high sensivity to ioniziation radiation, linear 79
dose response and an effective atomic number (Zeff = 7,2) near that of human soft 80
tissue (Zeff ~7,6) (Groppo & Caldas, 2014). By the other hand, Al2O3 is a sensitive TLD 81
and OSL material, well established in luminescence dosimetry (Yukihara & Mckeever, 82
2011), but studies are still being done to improve TL/OSL properties in these materials 83
using different dopants (Salah et al., 2011; Liu et al., 2013). For example, the Al2O3:C 84
is a unique synthetic material in use today as an OSL dosimeter and has applications as 85
in medical, personnel and environmental dosimetry (Yoshimura & Yukihara, 2006); 86
single crystals of Al2O3: Fe, Mg, Cr have also shown interesting results (Yoshimura, 87
2007), and Cr doped Al2O3 system has been studied and proposed as a UV and an 88
ionizing radiation dosimeter (Pokorny & Ibarra, 1993). These detectors are used in 89
applications like solar irradiation monitoring, chemical analysis or medical sensing as in 90
phototherapy (Escobar-Alarcón et al., 2003). Salah et al. (2011) also propose 91
nanoparticles of Al2O3: Cr with easy method of preparation, good sensitivity, simple 92
glow curve structure and useful TL response over a wide range of doses, being a 93
candidate for high dose dosimetry for food and seed irradiation. Moreover, Liu et al. 94
(2013) managed to produce Cr:α-Al2O3 transparent ceramics and showed that with 95

4
increasing Cr2O3 content the intensities of TL peaks increased and could improve the 96
stability and sensitivity of its OSL signal. 97
In this paper, we will present a series of experimental results of TL and OSL of 98
Brazilian alexandrite, relating the observations with the material impurities, to explain 99
the mechanism of the luminescence and the effects of ionizing radiation in this crystal. 100
2. MATERIALS AND METHODS 101
Our sample is a stone of alexandrite originated from Bahia state, Brazil, with a dark 102
green color. Two 1.0 mm thickness slides with perfectly parallel faces were cut from 103
this stone, mass around 0.050 g, and denominated as Ale G and Ale H. Before the first 104
use and between subsequent uses of the same sample in an experiment, the sample was 105
heated at 20ºC/min up to 700ºC and kept at this temperature for 1h, in a muffle furnace, 106
to empty the traps and erase the TL and OSL signals. 107
Chemical analyses were performed through X-ray fluorescence (XRF) measurements, 108
using a MINI-X spectrometer (Amptek XR-100SDD model). The fluorescence 109
intensities of the characteristic X-rays (Kα lines) were measured with a Si Drift detector 110
(25 mm2
x 500 μm/0.5 mil) with Be window (1.5”). Optical absorption measurements 111
were carried out in the range 400 to 700nm, using a spectrophotometer Cary 1G of 112
Varian. 113
OSL and TL measurements were carried out using a commercial automated TL/OSL 114
reader produced by Risø National Laboratory (model DA-20). Luminescence was 115
stimulated using blue light emitting diodes (470 nm, FWHM = 20 nm) delivering 80 116
mW/cm2 at the sample position in CW mode. Each OSL measurement was carried out 117
during 60 s of LED stimulation with 90% of the maximum power of. The TL/OSL 118
signals were detected with a bialkali photomultiplier tube (PMT) behind an UV 119
transmitting broad-band glass filter (Hoya U-340, 7.5 mm thick and 45 mm diameter) to 120
block the stimulation light while transmitting part of the OSL signal from the samples. 121
Irradiations were performed at room temperature using the built-in 90
Sr/90
Y beta source 122
of the TL/ OSL reader (dose rate of 10 mGy/s) at a dose range from 10 Gy to 50 Gy. 123
TL glow curves were obtained using a heating rate of 5ºC/s. 124
125
126

5
3. RESULTS AND DISCUSSION 127
Figure 1 shows the results of XRF technique used to obtain mainly the concentration of 128
iron, aluminum and chromium contained on the two samples. The technique does not 129
detect Be element due to its low atomic number. 130
131
132
Figure 1: X-ray fluorescence analysis results of Ale G and Ale H samples of natural 133
alexandrite. The inset shows compounds relation of Fe/Cr for samples. 134
135
It is possible to observe by the compositional analysis, that differenty Fe and Cr 136
concentration are present in the two samples. Results like this are expected since natural 137
materials, as the environment, the temperature and other important parameters of the 138
mineral forming process may influence the incorporation in different parts of the stone. 139
Is verified here Si, P, Ca, Ti, Mn, Cu, and a high concentration of Ca is found in sample 140
Ale H. Moreover, as seen in the inset of Figure 1, the presence of Fe in these natural 141
samples is substantially large compared to Cr. The Fe presence is very relevant in 142
alexandrite samples, because a high amount of this impurity may mask the identification 143
of optical absorption bands attributed to Cr3+
in the host matrix (Trindade et al., 2010), 144
and may influence the results of electrical properties of this mineral (Trindade et al., 145
2016). Iron may also play an important role in TL results. 146
The optical absorption spectrum for natural alexandrite is shown in Figure 2, measured 147
at room temperature. 148

6
149 150
Figure 2: Optical absorption spectra of Ale G and Ale H samples of natural alexandrite. 151
In the case of alexandrite, the spectrum is expected to present two wide absorption 152
bands (A and B), and two lines (the R lines). Band A, centered at 590nm represents the 153
overlapping of two absorption bands of Cr3+
ions in two distinct sites Al1 and Al2, 154
associated with the transition from ground state 4A2g to excited states
4T2g. Band B, 155
centered at 420nm represents Cr3+
and Fe3+
also incorporated at different sites, with the 156
transition from ground state 4A2g to excited states
4T1g. The R lines correspond to
4A2g 157
2Eg transition (Ollier et al., 2015), and show up around 680nm are attributed to Cr
3+ 158
located at Al2 sites on a reflection plane, and responsible by optical properties of 159
alexandrite. As experimentally verified and presented in the literature (Powell et al., 160
1985; Suchocki, 1987), R1 and R2 lines (not defined in Figure 2 due to limitation of the 161
experimental apparatus) appear precisely at the same wavelengths (680.4 nm and 678.5, 162
respectively), in both absorption and emission spectra, at room temperature. They are 163
7
associated with transitions from the ground state to the 2E level. The narrow lines that 164
appear at 655.7, 649.3 and 645.2 nm positions in the optical absorption and are 165
associated with Cr3+
ions lines in Al1. The result is in accordance with previously 166
published measurements for both natural and synthetic sample (Trindade et al., 2010), 167
therefore, this outcome is consistent with the known presence of Cr3+
in this sample. 168
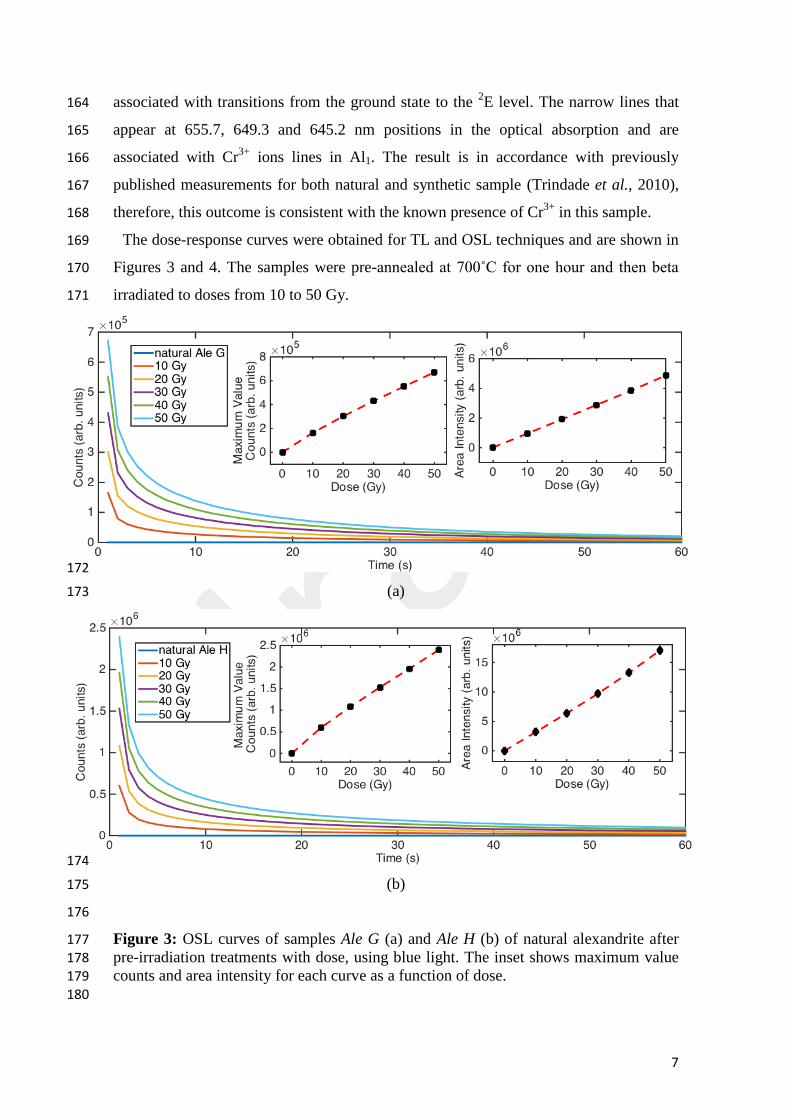
The dose-response curves were obtained for TL and OSL techniques and are shown in 169
Figures 3 and 4. The samples were pre-annealed at 700˚C for one hour and then beta 170
irradiated to doses from 10 to 50 Gy. 171
172
(a) 173
174
(b) 175
176
Figure 3: OSL curves of samples Ale G (a) and Ale H (b) of natural alexandrite after 177 pre-irradiation treatments with dose, using blue light. The inset shows maximum value 178 counts and area intensity for each curve as a function of dose. 179 180

8
In the OSL curves we can observe that the sample Ale H emits more light for the same 181
absorbed dose than the sample Ale G. Correlating with the results of XRF this can be 182
related to the amount of Cr and Fe trapping centers that are more quantitative for sample 183
H than the G. The decay of the counts in the OSL measurement for both samples is 184
similar, starting the curve with intense value and decreasing exponentially to values 185
close to zero after 1 min of the blue light. We also observed that there is linearity in the 186
data when we analyze the plot of area intensity versus dose. 187
Figure 4 shows the residual TL glow curves obtained. 188
189
190
(a) 191
192
(b) 193
Figure 4: TL curves of samples Ale G and Ale H of natural alexandrite after several pre-194
irradiation treatments with dose, using a 5˚C/s heating rate. The inset shows area 195 intensity for each curve as a function of dose. 196
197

9
Both alexandrite samples show light emission over a very wide temperature range with 198
small peaks at 110, 160 and 280˚C and a dominant peak at 350˚C, the width suggests 199
that the glow curve represents the superposition of several peaks. In inset figure, it is 200
observed that material exhibits a linear growth of TL area intensity with dose 201
Yoshimura (2007) investigated the emission in aluminum oxide single crystal doped 202
with Cr, Mg and Fe and results show a TL glow curve with at four peaks (110, 160, 225 203
and 270˚C) and that the trapping center responsible for the 160˚C peak is related to 204
intrinsic defects, and that the other TL glow peak positions are impurity dependent. 205
Villarreal-Barajas et al. (2002) show the presence of the temperature peak at 162˚C, 206
glow curve obtained for the beta irradiation in aluminum oxide thin films, with good 207
stability and suggest that this peak can be used as a dosimetric peak. Mittani et al. 208
(2002) also observed peak at 165˚C in all the glow curves with different doses for 209
natural beryl exposed gamma irradiation, and this process involves Fe3+
ions. 210
Ferraz et al. (2002) suggest that the pre-annealing at temperatures higher than 600˚C 211
induces the Fe2+
Fe3+
conversion in natural sample and that an increase in the Fe3+
212
ions improves TL emission at 320˚C, this is because these ions are able to capture 213
electrons during irradiation. Pokorny & Ibarra (1994) in their paper report that the 214
presence of the peak at 330˚C in G and H samples is related to the emission of holes or 215
electrons related to the presence of Cr4+
ions, but reference other works in which this 216
peak can appear for Al2O3 doped with other impurities or even appears for Al2O3 doped 217
with Cr. Finally, they conclude that the peak is related to the F centers and their 218
recombination with Cr4+
ions. It is still possible to perceive a band around 275 to 219
295˚C, Lapraz et al. (1991) in their study comment that this peak is attributed by them 220
to a conversion of the Cr2+
(or Cr4+
) centers for Cr3+
. 221
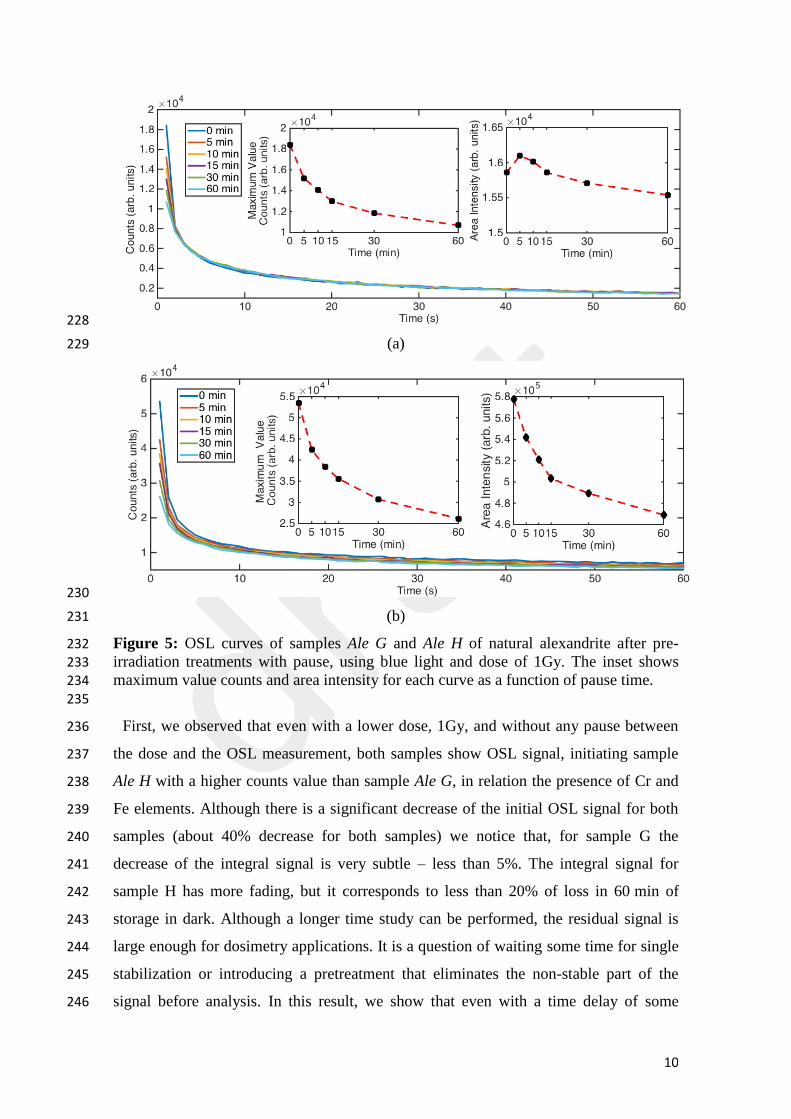
Figure 5 shows the OSL glow curves of alexandrite pre-annealed at 700˚C for one 222
hour and then beta irradiated to a dose of 1 Gy and kept in the dark before readout for 223
various times (from 5 to 60 min). This study is intended to verify the stability of the 224
OSL signal of both samples and detect if they present fading of the OSL signal. 225
226
227
10
228
(a) 229
230
(b) 231
Figure 5: OSL curves of samples Ale G and Ale H of natural alexandrite after pre-232 irradiation treatments with pause, using blue light and dose of 1Gy. The inset shows 233
maximum value counts and area intensity for each curve as a function of pause time. 234
235
First, we observed that even with a lower dose, 1Gy, and without any pause between 236
the dose and the OSL measurement, both samples show OSL signal, initiating sample 237
Ale H with a higher counts value than sample Ale G, in relation the presence of Cr and 238
Fe elements. Although there is a significant decrease of the initial OSL signal for both 239
samples (about 40% decrease for both samples) we notice that, for sample G the 240
decrease of the integral signal is very subtle – less than 5%. The integral signal for 241
sample H has more fading, but it corresponds to less than 20% of loss in 60 min of 242
storage in dark. Although a longer time study can be performed, the residual signal is 243
large enough for dosimetry applications. It is a question of waiting some time for single 244
stabilization or introducing a pretreatment that eliminates the non-stable part of the 245
signal before analysis. In this result, we show that even with a time delay of some 246

11
minutes before the OSL reading of the sample it is possible to generate a stable and 247
reproducible OSL signal, but with an intensity reduced in the maximum value of counts 248
and area intensity. It is important to note that Ale G sample, when dealing with the 249
reduction in area intensity with time delay, remained more stable than Ale H sample. In 250
addition, sample G showed complete emptying (close to zero) with the time delay, 251
while sample H presented a higher background value, possibly requiring more time for 252
total emptying to occur. 253
Figure 6 shows the TL glow curves obtained after of the fading study. 254
255
256
(a) 257
258
(b) 259
Figure 6: TL curves of samples Ale G and Ale H natural alexandrite after several pre-260 irradiation treatments with pause, using 5˚C/s heating rate and dose 1Gy. The inset 261 shows area intensity for each curve as a function of pause time. 262 263 264

12
To assist in the interpretation of the previous results, especially the peak at 110˚C, 265
Figure 7 presents the TL analysis with and without blue light (OSL) for one of the 266 samples. 267
268
Figure 7: TL curves of samples Ale H of natural alexandrite after several pre-irradiation 269 treatments with dose, using a 5˚C/s heating rate, with and without exposure to blue light 270
(OSL). 271
272
The first peak at 110˚C is unstable at room temperature. It is possible to observe the 273
differences between the measurements with and without exposure to blue light of OSL. 274
Comparing samples, this peak is more evident in Ale H than Ale G and we observed that 275
by XRF analysis Ale H presents an expressive amount of calcium, therefore, we try to 276
correlate with Rocha et al. (2003) that investigated calcium aluminate glass samples to 277
describe the intrinsic defects that are formed in UV irradiated glasses. In our 278
measurement, it is observed that 1 h after irradiation at room temperature there is a 279
drastic reduction of intensity only of that peak, which is evident in the inserted graph of 280
the area intensity with the pause time. If we separate this peak, we observe qualitatively 281
that the area remains constant because the other peaks do not have significant changes 282
in the intensity of the curves. Rocha et al. (2003) observed TL glow curves present a 283
broad band centered at 120 ˚C, and just like our case, when the time interval between 284
the sample irradiation and the TL measurement increase, the peak moves towards higher 285
temperatures, emptying of the TL band and indicating the presence of a continues 286
distribution of activation energies. 287
288

13
289
290
4. CONCLUSIONS 291
The X-ray fluorescence analysis revealed elements as Al, Si, P, Ca, Ti, Mn and Cu, 292
particularly Fe and Cr, expected by the chemical composition of alexandrite and being a 293
natural sample. It was possible to observe that alexandrite shows potential for use in TL 294
and OSL dosimetry, and our investigation strongly support the position that Fe and Cr 295
ions interfere in the obtained results, generating TL broad bands that suggests the 296
superposition of several peaks. More work is in progress to correlate the Cr and Fe 297
concentration and to determine the charge carrier responsible for the TL bands. Also, 298
we can conclude that the content of other impurities play an important role in this 299
process, as the case of Ca that may be related to the defect responsible for low 300
temperature TL peak. A study of alexandrite OSL curves was performed for the first 301
time and more studies are being developed to reach a better understanding of the OSL 302
process. A more detailed characterization of a larger number of samples and different 303
regions of Brazil is being investigated. 304
ACKNOWLEDGMENTS 305
Funding for this work was provided by Brazilian agencies São Paulo Research 306
Foundation (FAPESP), grants #2010/16437-0, and National Council for Scientific and 307
Technological Development (CNPq). The authors are grateful Ph.D. Roseli F. Gennari 308
(USP) for use of the OA technique and Ph.D. Marcia Rizzuto for use of the XRF 309
technique. 310
311
312
313
314
315
316

14
317
318
REFERENCES 319
Bukin, G.V., Volkov, S.Y. and Matrosov, V.N. 1978. Optical generation in alexandrite 320 (BeAl2O4:Cr
3+). Kvant Tovaya Electronika, 5, 1168 – 1169. 321
Collins, S.C., Wilkerson, T.D., Wilckwar, V.B., Rees, D., Walling, J.C. and Heller, D.F. 322 1997. The alexandrite ring laser: A spectrally narrow lidar light source for atmospheric 323 fluorescence and absorption observations. Advances in Atmospheric Remote Sensing 324
with Lidar. Berlin: Springer Verlag, 577-580. http://dx.doi.org/10.1007/978-3-642-325 60612-0_140. 326
Escobar-Alarcón, E., Villagrán, E., Camps, E., Romero, S., Villarreal-Barajas, J.E., 327
Gonzáles, P.R. 2003. Thermoluminescence of aluminum oxide thin films subject to 328 ultraviolet irradiation. Thin Solid Films, 433, 126-130. 329
Ferraz, G.M., Watanabe, S., Souza, S.O., Scalvi, R.M.F. 2002. TL, EPR and Optical 330
Absorption studies on natural alexandrite compared to natural chrysoberyl. Radiation 331 Protection Dosimetry, 100, 471-474. 332
Groppo, D.P., Caldas, L.V.E. 2014. Luminescent response from BeO exposed to alpha, 333
beta and X radiations. Radiation Measurements, 71, 81-85. 334 http://dx.doi.org/10.1016/j.radmeas.2014.07.009. 335
Gubelin, E. 1976. Alexandrite from Lake Manyara, Tanzania. Gems&Gemology, 15, 336 203-209. 337
Ibrahimi, O.A., Avram, M.M., Hankes, C.W., Kilmer, S.L. and Anderson, R.R. (2011) 338
Laser hair removal. Dermatologic Therapy, 24, 94-107. 339
http://dx.doi.org/10.1111/j.1529-8019.2010.01382.x. 340
Jacobsohn, L. G.; Roy, A. L.; Mcpherson, C. L.; Kucera, C. J.; Oliveira, L. C.; 341 Yukihara, E. G.; Ballato, J. 2013. Rare earth-doped nanocrystalline MgF2: Synthesis, 342
luminescence and thermoluminescence. Optical Materials, 35, 2461-2464. 343
Kim, Y.K., Kim, D.-Y., Lee, S.J., Chung, W.S. and Cho, S.B. 2014. Therapeutic 344
efficacy of long-pulsed 755-nm alexandrite laser for seborrheic keratoses. Journal of the 345 European Academy of Dermatology and Venereology, 28, 1007-1011. 346 http://dx.doi.org/10.1111/jdv.12231. 347
Lapraz, D., Iacconi, P., Daviller, D., Guilhot, B. 1991. Thermostimulated luminescence 348 and fluorescence of α-Al2O3: Cr
3+ samples (ruby). Physica Status Solidi (a), 126, 521-349
531. 350
Li, Y., Tong, X., Yang, J., Yang, L., Tao, J. and Tu, Y. 2012. Q-switched alexandrite 351
laser treatment of facial and labial lentigines associated with Peutz-Jeghers syndrome. 352 Photodermatology, Photoimmunology & Photomedicine, 28, 196-199. 353 http://dx.doi.org/10.1111/j.1600-0781.2012.00672.x. 354
Liu, Q., Yang, Q.H., Zhao, G.G., Lu, S.Z., Zhang, H.J. 2013. The thermoluminescence 355 and optically stimulated luminescence properties of Cr-doped alpha alumina transparent 356
ceramics. Journal of Alloys and Compounds, 579, 259-262. 357 http://dx.doi.org/10.1016/j.jallcom.2013.06.070. 358
15
Mckeever, S.W.S. 1985. Thermoluminescence os Solids, Cambridge, England, 359
Cambridge University Press. 360
Mckeever, S.W.S. 2001. Optically stimulated luminescence dosimetry. Nuclear 361 Instruments and Methods in Physics Research B, 184, 29-54. 362
Mckeever, S.W.S. 2011. Optically stimulated luminescence: A brief overview. 363 Radiation Measurements, 46, 1336-1341. 364
Mittani, J.C.R., Watanabe, S., Chubaci, J.F.D., Matsuoka, M., Baptista, D.L., Zawislak, 365 F.C. 2002. Nuclear Instruments and Methods in Physics Research B, 191, 281-284. 366
Nilforoushzadeh, M.A., Naieni, F.F., Siadat, A.H. and Rad, L. 2011. Comparation 367
between sequentional treatment with diode and alexandrite lasers versus alexandrite 368 laser alone in the treatment of hirsutism. Journal of Drugs in Dermatology, 10, 1255-369 1259. 370
Ollier, N., Fuchs, Y., Olivier, C., Horn, A.H. and Rossano, S. 2015. Influence of 371
impurities on Cr3+
luminescence properties in Brazilian esmerald and alexandrite. 372 European Journal of Mineralogy, 27, 783-792. 373 http://dx.doi.org/10.1127/ejm/2015/0027-2484. 374
Pokorny, P., Ibarra, A. 1993. On the origin of the thermoluminescence of Al2O3: Cr, Ni. 375 Journal of Physics: Condensed Matter, 5, 7387-7396. 376
Pokorny, P., Ibarra, A. 1994. Impurity effects on the thermoluminescence of Al2O3. 377 Journal of Applied Physics, 75 (2), 1088-1092. 378
Powell, R.C., Xi, L., Gang, X., Quarles, G.J. and Walling, J.C. 1985. Spectroscopy 379 properties of alexandrite crystals. Physical Review B, 32, 2788 – 2797. 380
Rabadanov, M.K. and Dudka, A.P. 1997. Comparative structural study of Al2BeO4 and 381
Al2BeO4:Cr3+
. Inorganic Materials, 33, 48 – 51. 382
Rocha, M.S.F., Pontuschka, W.M., Verzini, R., Blak, A.R. 2003. Radiation-induced 383 defects in calcium aluminate glasses. Radiation Effects & Defects in Solids, 158, 363-384 368. http://dx.doi.org/10.1080/104015021000052999. 385
Rossi, M., Dell´Aglio, M., Giacomo, A., Gaudiuso, R., Senesi, G.S., Pascale, O., 386 Capitelli, F., Nestola, F. and Ghiara, M.R. 2014. Multi-methodological investigation of 387
kunzite, hiddenite, alexandrite, elbaite and topaz, based on laser-induced breakdown 388 spectroscopy and conventional analytical techniques for supporting mineralogical 389 characterization. Physics and Chemistry of Minerals, 41, 127–140. 390
http://dx.doi.org/10.1007/s00269-013-0631-3. 391
Saedi, N., Metelitsa, A., Petrell, K., Arndt, K.A. and Dover, J.S. 2012. Treatment of 392
tattoos with a picosecond alexandrite laser. Arch Dermalogy, 148, 1360-1363. 393 http://dx.doi.org/10.1001/archdermatol.2012.2894. 394
Salah, N., Khan, Z.H., Habib, S.S. 2011. Nanoparticles of Al2O3: Cr as a sensitive 395
thermoluminescent material for high exposures of gamma rays irradiations. Nuclear 396 Instruments and Methods in Physics Research B, 269, 401-404. 397 http://dx.doi.org/10.1016/j.nimb.2010.12.054. 398
Scalvi, R.M.F., Ruggiero, L.O. and Siu Li, M. 2002. Influence of annealing on X-ray 399
diffraction of natural alexandrite. Powder Diffraction, 17, 135-138. 400 http://dx.doi.org/10.1154/1.1428284. 401

16
Scalvi, R.M.F., Siu Li, M. and Scalvi, L.V.A. 2005. Thermal annealing-induced electric 402
dipole relaxation in natural alexandrite. Physical and Chemistry of Minerals, 31, 733-403 737. http://dx.doi.org/10.1007/s00269-004-0442-7. 404
Suchocki, A.B., Gilliland, G.D., Powell, R.C., Bowen, J.M. and Walling, J.C. 1987 405
Spectroscopy properties of alexandrite crystals II. Journal of Luminescence, 37, 29-37. 406 http://dx.doi.org/0.1016/0022-2313(87)90179-7. 407
Toosi, S., Ehsani, A.H., Noormohammadpoor, P., Esmaili, N., Mirshams-Shahshahani 408 and Moineddin, F. 2010. Journal of the European Academy of Dermatology and 409 Venereology, 24, 470-473. http://dx.doi.org/10.1111/j.1468-3083.2009.03448.x. 410
Torezan, L.A.R. and Osório, N. 1990. Laser em Dermatologia: princípios físicos, tipos e 411 indicações. Brazilian Annals of Dermatology, 74, 13 – 20. 412
Trindade, N.M., Blak, A.R., Yoshimura, E.M., de Andrade Scalvi, L.V. and Scalvi, 413 R.M.F. 2016. Photo-Induced Thermally Stimulated Depolarization Current (TSDC) in 414
Natural and Synthetic Alexandrite (BeAl2O4:Cr3+
). Materials Sciences and Applications, 415 7, 881-894. http://dx.doi.org/10.4236/msa.2016.712067. 416
Trindade, N.M., Scalvi, R.M.F. and Scalvi, L.V.A. 2010. Cr3+
distribuiton in Al1 and 417
Al2 sites of alexandrite (BeAl2O4:Cr3+
) induced by annealing, investigated by optical 418 spectroscopy. Energy and Power Engineering, 2010, 18-24. 419
http://dx.doi.org/10.4236/epe.2010.21004. 420
Villarreal-Barajas, J.E. Escobar-Alarcón, L., González, P.R., Camps, E., Barboza-421
Flores, M. 2002. Thermoluminescence properties of aluminum oxide thin films obtained 422 by pulsed laser deposition. Radiation Measurements, 35, 355-359. 423
Wang, Y., Qian, H. and Lu, Z. 2012. Treatment of café au lait macules in Chinese 424
patients with a Q-switched 755-nm alexandrite laser. Journal of Dermatological 425 Treatment, 23, 431-436. http://dx.doi.org/10.3109/09546634.2011.590790. 426
Weber, S.U., Grodzicki, M., Lottermoser, W., Redhammer, G.J., Tippelt, G., Ponahlo, 427 J. and Amthauer, G. 2007.
57Fe Mossbauer spectroscopy, X-ray single-crystal 428
diffractometry, and electronic structure calculations on natural alexandrite. Physics and 429 Chemistry of Minerals, 34, 507-515. http://dx.doi.org/10.1007/s00269-007-0166-6. 430
Yarovoi, P.N., Medvedev, V.Ya., Bukin, G. V., Ivanova, L. A., Mikhalenko, A. A. 431 1991. Radiative Creation of Color Centers in Alexandrite Crystals. Opt. Spectrosc. 432 (USSR) 71(5), 447–449. 433
Yoshimura, E.M. 2007. Correlation of optically stimulated luminescence and 434 thermoluminescence of Al2O3: Fe, Mg, Cr crystals. Nuclear Instruments and Methods in 435
Physics Research A, 580, 606-609. http://dx.doi.org/10.1016/j.nima.2007.05.021. 436
Yoshimura, E.M., Yukihara, E.G. 2006. Optically stimulated luminescence: searching 437 for nex dosimetric materials. Nuclear Instruments and Methods in Physics Research B, 438
250, 337-341. http://dx.doi.org/10.1016/j.nimb.2006.04.134. 439
Yukihara, E. G.; Mckeever, S. W. S. 2011. Optically Stimulated Luminescence: 440 Fundamentals and Applications. West Sussex, UK: John Wiley and Sons, Ltd. 441
Yukihara, E.G. 2001. Desvendando a Cor e Termoluminescência do Topázio: Um 442
Estudo dos Defeitos e Processos Termicamente e Opticamente Estimulados no Cristal 443 Natural (portuguese). Thesis, USP, São Paulo. 444
445

Materials Sciences and Applications, 2016, 7, 881-894 http://www.scirp.org/journal/msa
ISSN Online: 2153-1188 ISSN Print: 2153-117X
DOI: 10.4236/msa.2016.712067 December 14, 2016
Photo-Induced Thermally Stimulated Depolarization Current (TSDC) in Natural and Synthetic Alexandrite (BeAl2O4:Cr3+)
Neilo Marcos Trindade1,2, Ana Regina Blak1, Elisabeth Mateus Yoshimura1, Luis Vicente de Andrade Scalvi3, Rosa Maria Fernandes Scalvi3
1São Paulo Federal Institute, São Paulo, Brazil 2Institute of Physics, University of São Paulo, São Paulo, Brazil 3Department of Physics, São Paulo State University, Bauru, Brazil
Abstract The investigation of electrical properties in alexandrite (BeAl2O4:Cr3+) in synthetic and natural forms is presented in this paper. Alexandrite is a rare and precious min-eral that changes color according to the light incident on it. In the synthetic form, it is used technologically as an active laser medium. The electrical characterization was obtained using the Thermally Stimulated Depolarization Current (TSDC) technique, an interesting tool to study the behavior of impurities in insulators. Alexandrite pre-sented the electric dipole relaxation phenomenon, both in natural and in synthetic samples. It was possible to observe TSDC bands for the synthetic sample at around 170 K, and at around 175 K for the natural sample. Besides, photo-induced TSDC measurements were performed through the excitement of the samples by using a continuous wave argon laser. In addition, photoluminescence measurements were performed to verify in advance whether the laser light would be absorbed by the sample, and in order to complement the photo-induced TSDC measurements analy-sis. The results of photo-induced TSDC experiments have contributed to the under-standing of the TSDC bands behavior: the results obtained with the technique sug-gest that there is an effective participation of Cr3+ ions in the formation of TSDC bands because they were more intense when the sample was exposed to the argon la-ser beam.
Keywords Alexandrite, Chrysoberyl, Thermally Stimulated Depolarization Current (TSDC), Photoluminescence, Photo-Induced
How to cite this paper: Trindade, N.M., Blak, A.R., Yoshimura, E.M., de Andrade Scalvi, L.V. and Scalvi, R.M.F. (2016) Pho-to-Induced Thermally Stimulated Depolari-zation Current (TSDC) in Natural and Syn-thetic Alexandrite (BeAl2O4:Cr3+). Materials Sciences and Applications, 7, 881-894. http://dx.doi.org/10.4236/msa.2016.712067 Received: November 16, 2016 Accepted: December 11, 2016 Published: December 14, 2016 Copyright © 2016 by authors and Scientific Research Publishing Inc. This work is licensed under the Creative Commons Attribution International License (CC BY 4.0). http://creativecommons.org/licenses/by/4.0/
Open Access

N. M. Trindade et al.
882
1. Introduction
Alexandrite is a variety of chrysoberyl crystal that contains chromium in its structure and presents the following chemical composition: BeAl2O4:Cr3+ [1] [2]. Brazil is one of the largest producers of natural alexandrite [2]; it belongs to families of gems of high economical and technological interest [3].
The technological importance of alexandrite has increased after 1974, when it was possible to use it in synthetic form as an active laser medium, with superior characteris-tics when compared to other types of media, with emission in the range between 700 and 800 nm [4]. The first scientists who suggested the possibility of application of syn-thetic alexandrite as laser crystals were Farrel in 1963 [5], but they were not successful in obtaining it in practice [6]. Bukin et al. first reported the alexandrite laser in 1978 [7]. The Q-switched alexandrite laser operates in the range of 755 nm, near infrared emission spectrum. Its pulse lasts about 100 ns, and its long wavelength allows deep penetration into the skin [8], so it is widely used in dermatology, as well as other popu-lar lasers such as the Q-switched ruby (QSR) (694 nm) and Q-switched Nd:YAG laser (1064 nm and 532). There are many recent works showing applications of the alexan-drite laser in medicine as in the treatment of facial and labial lentigines associated with Peutz-Jeghers syndrome [9], café au lait macules [10], seborrheic keratoses [11], hirsut-ism [12], trichostasis spinulosa [13] and other applications such as hair removal [14] and tattoos removal [15].
An important property is its color change according to light incident on it. If exposed to incandescent light, rich in red wavelengths, alexandrite has a red color. Exposing alexandrite to natural light, with a smaller portion in the red region of the spectrum, it generates shades of dominant blue-green color. This phenomenon is referred in the li-terature as alexandrite effect [16] [17]. The color change results in popularity and high market value of alexandrite as a gem. Furthermore, the alexandrite crystal is mechani-cally rigid and provides good thermal conductivity [18].
Figure 1 shows chrysoberyl structure. In chrysoberyl the unit cell contains four mo-lecules with eight Al3+ ions (ionic radius 0.535 Å) occupying distorted octahedral sites, and four Be2+ ions (0.47 Å) occupying distorted tetrahedral sites formed with oxygen ions located in planes perpendicular to the c-axis [19]. Due to the small ionic radius of
Figure 1. Chrysoberyl structure [4] [18].
O3
Al Be
Al
O2
O1
Al1
Al2
Be
a
c b

N. M. Trindade et al.
883
Be2+, the crystal structure of chrysoberyl has a lower symmetry than the spinel mineral group with similar chemical formulas [20]. Such ionic radius also results in a bond length in the Be-O of 1.637 Å [17]. Two of the three oxygen positions are located in a reflection plane and the third oxygen occupies a general position [20]. The chrysoberyl crystallization has an orthorhombic structure that corresponds to dense hexagonal packing, influencing the oxygen atom (atomic radius 2.7 Å) positions, which are slightly distorted by the presence of aluminum atoms. These distortions caused by alu-minum give rise to two sites of different symmetries: a site, Al1, set in an inversion cen-ter (Ci symmetry) and a site, Al2, located in a reflection plane (Cs symmetry) [22] [23].
In two sites of different symmetries the Al3+ ions are replaced by Cr3+ (0.615 Å) ge-nerating alexandrite. The larger site, named Al2, is preferably occupied by Cr3+ ions [18]. The octahedron containing Al2 sites, is regarded as larger than the Al1 octahedron, because the Al-O bond length (1.938 Å) is wider at that site than at Al1 (1.890 Å), re-sulting in a larger volume polyhedron [17]. According to literature, Cr3+ ions located in Al2 sites are responsible for the optical properties of alexandrite, including laser emis-sion [24].
The electrical properties studied here can contribute to the understanding of the optical properties observed in alexandrite, such as the impurities aggregated in this crystal having diverse charge states.
2. Materials and Methods
The synthetic sample has been grown by H. P. Jenssen and R. Morris (from Allied Sig-nal Inc., USA), by the Czochralski method [25]. Iridium crucibles, zirconia ceramic furnaces and 2 2N O− atmospheres were used, obtaining the following result: [001] oriented blades measuring about 1 cm × 2 cm with Cr3+ substitutions of up to 0.3% atm (of A13+ sites) [26]. The sample faces were perfectly paralleled, with thickness of 2.33 mm. Alexandrite rock pieces come from Minas Gerais state, Brazil, and show a dark green color. Samples have been cut in small pieces with thickness of 1.5 mm.
The optical studies and electrical characterization of alexandrite can significantly contribute to the technological application of the material. The Thermally Stimulated Depolarization Currents (TSDC) technique successfully allows the understanding of the electric dipole relaxation mechanisms present in minerals [4] [27] [28] [29] [30] [31]. In addition, the TSDC technique can also be used in a modified manner, when the sample is photo-excited along with the electric field and then the effects on the material are analyzed.
Through one single measurement, the TSDC technique represents a very sensitive and accurate method for the determination of physical parameters such as relaxation time (τ), activation energy (Ea) and dipole moment strength (p) associated with defects with dipolar characteristics. Electric dipole characteristics are one of the requirements to detect the behavior of defects in solids using this technique [32]. The TSDC method consists of four basic steps: the sample is first polarized in an electric field Ep for a time tp, at temperature Tp. This temperature should be such that the dipoles can still be sta-

N. M. Trindade et al.
884
tistically oriented with the electric field applied in a certain time t1, and should not be so high that heavy space charge contributes to the signal. To ensure good polarization, dipoles must be polarized by a time tp τ (Tp). Then, in the second step, the temper-ature of the sample is reduced to To Tp so that the dipole relaxation time is long enough to prevent movements at low temperatures. At this stage, it can be said that the dipoles are “frozen” and statistically aligned with the applied field. After reaching To (the liquid nitrogen temperature, in our experiment) the field is removed and an elec-trometer is connected to the sample (third step). After the initial capacitive discharge in the sample, it is heated at a constant rate b = dT/dt, and the current is recorded as a function of temperature in the final step of TSDC. The relaxation times become short and a current depolarization i (T) is detected when the dipoles lose their preferential polarization orientation. During the time in which this process occurs, the current first increases exponentially, and continues increasing until a maximum value is reached; and then falls rapidly as Figure 2 illustrates. The physical process of TSDC measure-ment and behavior of dipoles presented in each step of the technique are also in Figure 2.
Previous to the measurement, the faces of the samples in contact with the electrodes are painted with silver paint to improve electrical contact for the application of electric field. The sample is polarized initially at room temperature and, after a first step to identify the TSDC peaks, the polarization is made near the peak of TSDC and an elec-tric field is applied for a predetermined period of time in order to reduce the lattice contributions. After that time, the cryostat walls are put in contact with liquid nitrogen to produce a rapid temperature decrease. When the sample reaches a temperature of approximately 77 K, the electric field is turned off. The same terminal is connected to an electrometer that will measure the depolarization current. When the current is stabi-lized, the sample is heated at 6 K/min, up to 300 K. The polarization electric field is about 1.4 kV/mm value that considers the thickness of the sample.
Figure 2. Physical process of TSDC measurements and behavior of dipoles.

N. M. Trindade et al.
885
In measurements of photo-induced TSDC, the process is quite similar to the TSDC one. The scheme and steps of this method are shown in Figure 3. We have used two different methodologies to illuminate the sample, as explained next.
In the first process (i), in Figure 3, after the application of the electric field at a given polarization temperature (2), the temperature is decreased rapidly to a temperature close to 77 K (3). After removing the applied electric field, a laser beam is shined on the sample for a given time (4). The laser beam is removed and the temperature is in-creased at a constant rate, as usual. In this case, it is considered that the dipoles are al-ready oriented and “frozen” when the laser is applied –we investigate the possible effect in this polarization direction with the incidence of laser beam in the material. In the second case (ii), in Figure 3, when the sample reaches a temperature close to 77 K (2), the electric field is applied together with the laser beam, but for different intervals (3) and (4). After removing the laser beam, the temperature is increased at a constant rate. In this case, it is considered that the dipoles are randomly oriented because they had not yet been “frozen” without the application of a previously bias field. This way, we seek to investigate the effect on these dipoles and if their orientation in these same con-ditions is possible with the absorption of photons of the laser beam.
The TSDC equipment makes use of a Janis Research VPF-100 model cryostat pro-vided with transparent windows, high voltage source Keithley 248 High Voltage Supply model, a Lakeshore 321 temperature controller model, an electrometer Keithley 6517A model and a turbomolecular pump system Boc Edwards GI, 70H/E2M1.5/Ticcart mod-el. The measurements were made using an automatic acquisition system data, the USB-6008 board 12-bit, 10 kS/s Multifunction I/O and NI-DAQmx software. To carry out the photo-induced TSDC measurements, an argon laser was used with beam di-
Figure 3. Scheme of photo-induced TSDC measurements, indicating the methods used: process i and process ii.

N. M. Trindade et al.
886
rected to the sample by means of lenses and mirrors. Chemical analyses were per-formed using Scanning Electronic Microscopy (SEM), the Energy Dispersive (EDS) and Spectroscopy Wavelength Dispersive (WDS) techniques. The Argon laser emissions (Spectra 2017 model), with energy hν = 2.51 eV, were used in the photoluminescence excitation and TSDC measurements. The light emitted by the sample is sent to the spectrometer and then to a detector due to the energy region where the measurement was made. The entire system is connected to a computer that controls the spectrometer and processes the data.
3. Results and Discussion 3.1. Chemical Analysis
Table 1 shows the results of two techniques (EDS and WDS) used to obtain the con-centration of iron, aluminum and chromium contained in the sample. Both the tech-niques do not detect Be element due to its atomic number (smaller than 8).
The environment, the temperature and other important parameters of the natural materials forming process also influence the various types of impurities which may be incorporated in bulk rock, such as K, Si and Ca. The Table 1 results show that iron concentration is substantially larger compared to chromium. Moreover, iron can also be related to the color of alexandrite [17]. It is of great importance to highlight the presence of Fe, which is verified due to the presence of inclusions in natural alexan-drite. According to Weber et al. [17], based on chemical and geometric arguments, it is assumed that, in alexandrite originated from Russia, the Fe3+ ion replaces Al in octahe-dral sites in the structure once the tetrahedron Be site is too small for such replacement. It can also occur the replacement of Al3+ to Fe2+ with the locally distorted octahedral coordination and expanded in accordance with the large ionic radius of Fe2+ (0.750 Å) compared with Al3+ (0.535 Å). Thus, the charge is compensated by the presence of Ti tetravalent in the alexandrite. Both bivalent and trivalent iron in different Al positions has a certain preference for the wider site, Al2. Furthermore, a refinement of the struc-ture shows that most of the iron is trivalent, but a small amount of bivalent iron is also detected, and that the incorporation of iron occurs in Al sites. In the TSDC measure-ments, Fe bands are observed only in natural samples.
The Cr3+ ions in Al2 are responsible for the laser property and characterize the high probability of electric dipole transitions. The transitions in the magnetic dipole type Cr3+ ions in Al1 do not significantly contribute to the photoluminescence of the material and, furthermore, are excluded from the laser process, as well as reinforcing the non- Table 1. Composition of natural alexandrite obtained through EDS and WDS analysis.
Element EDS (%WT) WDS (%WT)
Al 76.45 -
Cr 0.09 0.13
Fe 0.44 0.61
N. M. Trindade et al.
887
radiative processes, degrading the efficiency of the laser [6] [33]. For the photo-induced electrical characterization it is necessary to verify that the material shows luminescence in the same temperatures that occur polarization.
3.2. Photoluminescence
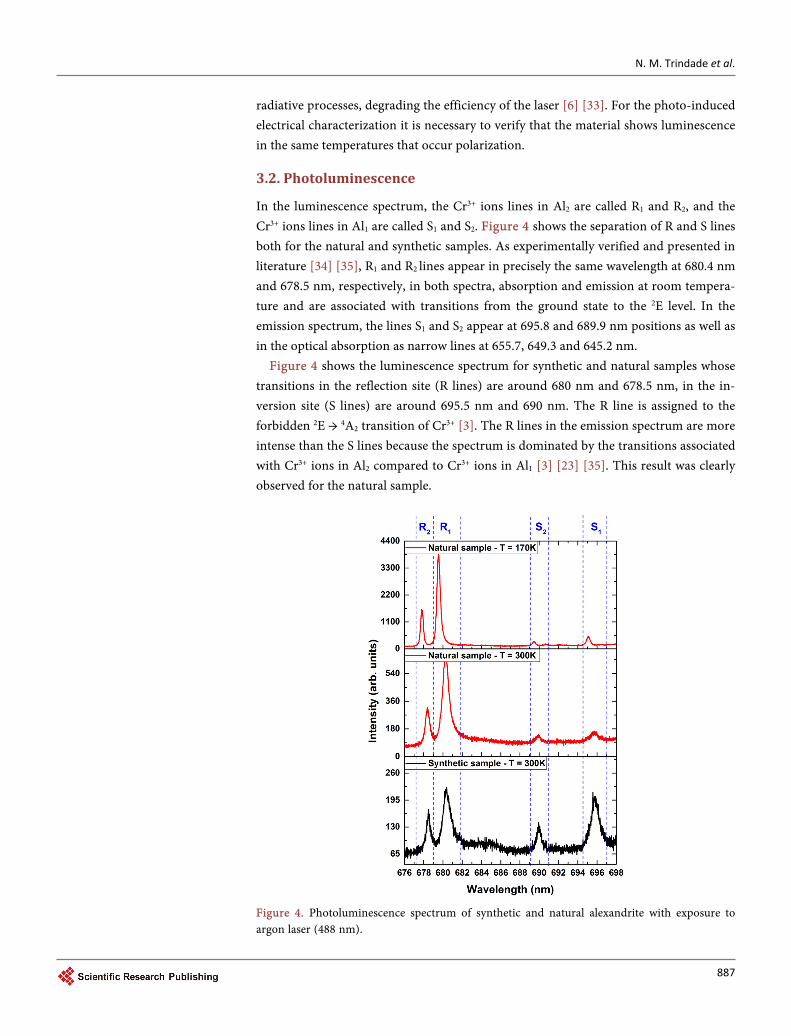
In the luminescence spectrum, the Cr3+ ions lines in Al2 are called R1 and R2, and the Cr3+ ions lines in Al1 are called S1 and S2. Figure 4 shows the separation of R and S lines both for the natural and synthetic samples. As experimentally verified and presented in literature [34] [35], R1 and R2 lines appear in precisely the same wavelength at 680.4 nm and 678.5 nm, respectively, in both spectra, absorption and emission at room tempera-ture and are associated with transitions from the ground state to the 2E level. In the emission spectrum, the lines S1 and S2 appear at 695.8 and 689.9 nm positions as well as in the optical absorption as narrow lines at 655.7, 649.3 and 645.2 nm.
Figure 4 shows the luminescence spectrum for synthetic and natural samples whose transitions in the reflection site (R lines) are around 680 nm and 678.5 nm, in the in-version site (S lines) are around 695.5 nm and 690 nm. The R line is assigned to the forbidden 2E → 4A2 transition of Cr3+ [3]. The R lines in the emission spectrum are more intense than the S lines because the spectrum is dominated by the transitions associated with Cr3+ ions in Al2 compared to Cr3+ ions in Al1 [3] [23] [35]. This result was clearly observed for the natural sample.
Figure 4. Photoluminescence spectrum of synthetic and natural alexandrite with exposure to argon laser (488 nm).

N. M. Trindade et al.
888
3.3. Photo-Induced Thermally Stimulated Depolarization Current
Assuming that the source of the dipole is essentially the participation of Cr3+ ions, it is interesting to analyze the results of photo-induced TSDC measurements because these ions are responsible for emission lines in the photoluminescence spectra, and thus, we seek to investigate a photo-excited influence on the bands of TSDC. Regarding to elec-trical properties, according to the literature [4], the possible formation of dipoles in alexandrite is related to its crystalline structure. The structure has the Al1 and Al2 linked sites, each one with six oxygen atoms, three of which are independent and symmetri-cally designated O1, O2 and O3. The simple aforementioned replacement of Cr3+ to Al3+
in the structure would be able to cause the formation of dipoles. Nevertheless, the dif-ference between the ionic radius Al3+ (0.535 Å) and Cr3+ (0.615 Å) in alexandrite can trigger the dipoles. It is also likely that the presence of oxygen vacancies leads to the presence of dipoles of impurity-vacancy type caused by different distances between Cr3+ and vacancy. One last possibility is the presence of other structure intrinsic defects, es-pecially in the case of natural samples. The TSDC measurements were taken with a synthetic and a natural sample.
In photo-induced TSDC we used a high quality synthetic sample. The sample had al-ready been polished and its faces parallel to each other, through which the electric field is applied. The sample was polarized for 7 minutes at room temperature with a 3300 V. We chose to carry out the process (i), photo-induced TSDC. The measurement was re-peated twice with exposure to argon laser, for equal periods of time, but with different powers, as shown in Figure 5.
In Figure 5, TSDC curve for synthetic sample shows a broad band with maximum intensity around 170 K. We believe that above 230 K the results are not related to the effects of dipolar relaxation. It is likely that bands at these temperatures are due to a
Figure 5. TSDC and photo-induced TSDC data for a synthetic sample, with exposure to argon laser (488 nm), in process i.

N. M. Trindade et al.
889
contact effect. It can be concluded from Figure 5 that the increase in the laser power, leads to the process of “destruction” of dipoles, as be the main band has a decreased area, which is the quantity related to the number of oriented dipoles. To that extent, it is also clear that the dipolar relaxation can occur by photo-excitation, and not only by a thermal process, which is also a process dependent on the power of the laser used.
In the case of a natural sample, it is important to determine the dependence of the relaxation dipolar process with the electric field the TSDC measurement. It was per-formed for four different values, 800 V, 1000 V, 1200 V and 1400 V, shown in Figure 6.
In Figure 6, for natural sample, it can be seen that the area under the TSDC curve is proportional to the applied field, according to the picture inserted. The graph is consis-tent with the dipolar relaxation theory, with increasing voltage applied, there are an in-creased number of dipole relaxations, and, in turn, curves become more defined and the maximum intensity of current increases.
As for the synthetic sample, polarization was carried out similarly in natural samples, including the length of polarization time. Nevertheless, a 1400 V voltage value was ap-plied in accordance with its thickness. In addition to analyze the consequences of pho-to-excitation, the photo-induced TSDC, process i and ii were performed. Figure 7 shows obtained result.
The photo-induced TSDC results, for same natural sample, it can be seen in Figure 7. In process i (Figure 3), an intense band with its maximum at around 175 K is observed.
Figure 6. TSDC data for a natural sample, with application of four different voltages. The inset shows the linear dependence of TSDC maximum peak intensities with applied voltage.

N. M. Trindade et al.
890
Figure 7. TSDC and photo-induced TSDC data for a natural sample, with exposure to argon la-ser (488 nm), in processes i and ii. A comparison can be drawn between the power required to destroy the TSDC band in a natural and in a synthetic sample. The natural sample band at around 175 K disappears even with lower laser power (200 mW), whereas, the synthetic sample requires a larger power to do so. The process ii (Figure 3) was carried out using the same conditions, it is observed that this method promotes TSDC band for this sample with an intense band around 230 K. We are convinced that this orientation of dipoles in low temperature (77 K) by the laser light is possible, because of the synergism of the photon energies of the laser beams together with the applied electric field. Interestingly, it can be seen in these results that TSDC bands for natural samples are better defined and more intense at the maximum temperature than for synthetic samples. To understand these results, one should consider that in the natural samples there is presence of Fe3+ ions observed in optical absorption measurements in the spectral region of ultraviolet, and other addi-tions such as OH and SiO4 can be seen in optical absorption measurements in the spec-tral infrared region [2]. These inclusions may lead to dipolar relaxation in the same temperature region, which is a Cr3+ and vacancy characteristic. Consequently, the TSDC band for these natural samples can be observed as a superposition of other bands of TSDC.
Regarding photo-induced measurements, it was observed that the process of destruc-tion of TSDC bands in natural sample occurs more noticeably than in the synthetic one, which has dependence on the power of the applied laser. This result is in agreement

N. M. Trindade et al.
891
with previous work [36] when it done to synthetic samples, and should contribute to the interpretation of results in natural samples presented in the literature. Also accord-ing to these authors, it is suggested that this process of destruction of TSDC bands does not occur for natural samples for they have irregular faces causing scattering of the light incident on it. Nonetheless, this work presents unprecedented results of destruction of bands in such samples. A small band around 280 K was also observed, which apparently is not influenced by laser presence and may be associated with contact effect.
4. Conclusions
The present work demonstrates that the material presents electric dipole relaxation phenomenon, both in natural and in synthetic samples. In this study, it was assumed that Cr3+ ions form dipole defects in the material. Chemical analysis of natural samples showed a large concentration of Fe in the material, predicted to be present in the Al2 site, which can interfere in the obtained results.
It was possible to observe TSDC bands for synthetic sample, around 170 K, and around 175 K in natural sample. The TSDC experiment was performed with modifica-tion using an argon laser source, method called photo-induced TSDC. It was observed in the results that when the (i) process is carried out, the destruction of the TSDC band occurs in synthetic and natural samples. That way, you can disorient the dipoles at low temperature (77 K) and, consequently, most likely destroy TSDC bands at the temper-ature they occur, and to the synthetic sample it was found that there is a laser power dependence on the effective destruction of these bands. The result of the (ii) process shows that the incidence of the laser beam provides a more effective orientation of di-poles and, consequently, an increase in the intensity of TSDC band if compared to the situation without laser beam in natural samples.
These results of photo-induced TSDC suggest that there is an effective participation of Cr3+ ions in the formation of TSDC bands. This statement comes from the correla-tion between the measurements of electrical characterization and optical characteriza-tion of alexandrite. This is possible because the photoluminescence measurements con-firmed the presence of Cr3+ emission lines with the incidence of the same laser used in photo-induced measurements. Another interesting fact was that the TSDC bands were more intense when the sample was exposed to the laser beam, thus promoting greater orientation of dipoles related to the presence of oxygen vacancies associated with Cr3+, and change local load due to substitution of Al3+ sites by Cr3+ ions.
Future efforts will be directed to thermoluminescence (TL) investigations of natural alexandrite. Thermoluminescence is the thermally stimulated emission originated from energy that was previously stored in the crystal during exposition to ionizing radiation. Initial measurements show that the alexandrite sample exhibits the TL peaks and it is likely that Cr3+ ions have an important part in this process.
Acknowledgements
Funding for this work was provided by Brazilian agencies FAPESP, CNPq and CAPES.

N. M. Trindade et al.
892
The authors are grateful to Prof. Dr. Américo S. Tabata for use of the PL technique fa-cilities and Mr. Luciano B. Ramos for language review.
References [1] Rossi, M., Dell’Aglio, M., Giacomo, A., Gaudiuso, R., Senesi, G.S., Pascale, O., Capitelli, F.,
Nestola, F. and Ghiara, M.R. (2014) Multi-methodological Investigation of Kunzite, Hidde-nite, Alexandrite, Elbaite and Topaz, Based on Laser-Induced Breakdown Spectroscopy and Conventional Analytical Techniques for Supporting Mineralogical Characterization. Phys-ics and Chemistry of Minerals, 41, 127-140. https://doi.org/10.1007/s00269-013-0631-3
[2] Trindade, N.M., Scalvi, R.M.F. and Scalvi, L.V.A. (2010) Cr3+ Distribution in Al1 and Al2 Sites of Alexandrite (BeAl2O4:Cr3+) Induced by Annealing, Investigated by Optical Spec-troscopy. Energy and Power Engineering, 2010, 18-24. https://doi.org/10.4236/epe.2010.21004
[3] Ollier, N., Fuchs, Y., Olivier, C., Horn, A.H. and Rossano, S. (2015) Influence of Impurities on Cr3+ Luminescence Properties in Brazilian Esmerald and Alexandrite. European Journal of Mineralogy, 27, 783-792. https://doi.org/10.1127/ejm/2015/0027-2484
[4] Scalvi, R.M.F., Siu Li, M. and Scalvi, L.V.A (2005) Thermal Annealing-Induced Electric Dipole Relaxation in Natural Alexandrite. Physical and Chemistry of Minerals, 31, 733-737. https://doi.org/10.1007/s00269-004-0442-7
[5] Farrel, E.F., Fang, J.H. and Newham, H.P. (1963) Refinement of the Chrysoberyl Structure. American Mineralogist, 48, 804-810.
[6] Sevest’yanov, B.K. (2003) Excited-State Absorption Spectroscopy of Crystals Doped with Cr3+, Ti3+, and Nd3+ Ions—Review. Crystallography Reports, 48, 989-1011. https://doi.org/10.1134/1.1627442
[7] Bukin, G.V., Volkov, S.Y. and Matrosov, V.N. (1978) Optical Generation in Alexandrite (BeAl2O4:Cr3+). Kvanttovaya Electronika, 5, 1168-1169.
[8] Torezan, L.A.R. and Osório, N. (1990) Laser in Dermatology: Physical Principles, Types and Indications. Brazilian Annals of Dermatology, 74, 13-20.
[9] Li, Y., Tong, X., Yang, J., Yang, L., Tao, J. and Tu, Y. (2012) Q-Switched Alexandrite Laser Treatment of Facial and Labial Lentigines Associated with Peutz-Jeghers Syndrome. Pho-todermatology, Photoimmunology & Photomedicine, 28, 196-199. https://doi.org/10.1111/j.1600-0781.2012.00672.x
[10] Wang, Y., Qian, H. and Lu, Z. (2012) Treatment of Café Au Lait Macules in Chinese Pa-tients with a Q-Switched 755-nm Alexandrite Laser. Journal of Dermatological Treatment, 23, 431-436. https://doi.org/10.3109/09546634.2011.590790
[11] Kim, Y.K., Kim, D.-Y., Lee, S.J., Chung, W.S. and Cho, S.B. (2014) Therapeutic Efficacy of Long-Pulsed 755-nm Alexandrite Laser for Seborrheic Keratoses. Journal of the European Academy of Dermatology and Venereology, 28, 1007-1011. https://doi.org/10.1111/jdv.12231
[12] Nilforoushzadeh, M.A., Naieni, F.F., Siadat, A.H. and Rad, L. (2011) Comparation between Sequentional Treatment with Diode and Alexandrite Lasers versus Alexandrite Laser Alone in the Treatment of Hirsutism. Journal of Drugs in Dermatology, 10, 1255-1259.
[13] Toosi, S., Ehsani, A.H., Noormohammadpoor, P., Esmaili, N., Mirshams-Shahshahani, M. and Moineddin, F. (2010) Treatment of Trichostasis Spinulosa with a 755-nm Long-Pulsed Alexandrite Laser. Journal of the European Academy of Dermatology and Venereology, 24, 470-473. https://doi.org/10.1111/j.1468-3083.2009.03448.x

N. M. Trindade et al.
893
[14] Ibrahimi, O.A., Avram, M.M., Hankes, C.W., Kilmer, S.L. and Anderson, R.R. (2011) Laser Hair Removal. Dermatologic Therapy, 24, 94-107. https://doi.org/10.1111/j.1529-8019.2010.01382.x
[15] Saedi, N., Metelitsa, A., Petrell, K., Arndt, K.A. and Dover, J.S. (2012) Treatment of Tattoos with a Picosecond Alexandrite Laser. Archives of Dermatology, 148, 1360-1363. https://doi.org/10.1001/archdermatol.2012.2894
[16] Gubelin, E. (1976) Alexandrite from Lake Manyara, Tanzania. Gems & Gemology, 15, 203- 209.
[17] Weber, S.U., et al. (2007) 57Fe Mossbauer Spectroscopy, X-Ray Single-Crystal Diffractome-try, and Electronic Structure Calculations on Natural Alexandrite. Physics and Chemistry of Minerals, 34, 507-515. https://doi.org/10.1007/s00269-007-0166-6
[18] Collins, S.C., Wilkerson, T.D., Wilckwar, V.B., Rees, D., Walling, J.C. and Heller, D.F. (1997) The Alexandrite Ring Laser: A Spectrally Narrow Lidar Light Source for Atmos-pheric Fluorescence and Absorption Observations. In: Ansmann, A., Neuber, R., Rairoux, P. and Wandinger, U., Eds., Advances in Atmospheric Remote Sensing with Lidar, Springer Verlag, Berlin, 577-580. https://doi.org/10.1007/978-3-642-60612-0_140
[19] Scalvi, R.M.F., Ruggiero, L.O. and Li, M.S. (2002) Influence of Annealing on X-Ray Diffrac-tion of Natural Alexandrite. Powder Diffraction, 17, 135-138. https://doi.org/10.1154/1.1428284
[20] Ivanov, V.Y., Pustovarov, V.A., Shlygin, E.S., Korotaev, A.V. and Kruzhalov, A.V. (2005) Electronic Excitations in BeAl2O4, Be2SiO4, and Be3Al2Si6O18 Crystals. Physics of the Solid State, 47, 466-473. https://doi.org/10.1134/1.1884706
[21] Bauerhansl, P. and Beran, P. (1997) Trace Hydrogen in the Olivine-Type Minerals Chryso-beryl, Al2BeO4 and Sinhalite, MgAlBO4—A Polarized FTIR Spectroscopic Study. Schweize-rische Mineralogische und Petrographische Mitteilungen, 77, 131-136.
[22] Rabadanov, M.K. and Dudka, A.P. (1997) Comparative Structural Study of Al2BeO4 and Al2BeO4:Cr3+. Inorganic Materials, 33, 48-51.
[23] Trindade, N.M., Tabata, A., Scalvi, R.M.F. and Scalvi, L.V.A. (2011) Temperature Depen-dence Luminescence Spectra of Synthetic and Natural Alexandrite (BeAl2O4:Cr3+). Materials Science and Applications, 2, 284-287. https://doi.org/10.4236/msa.2011.24037
[24] Shepler, K.L. (1984) Fluorescence of Inversion Site Cr3+ Ions in Alexandrite. Journal of Ap-plied Physics, 56, 1314-1318. https://doi.org/10.1063/1.334119
[25] Guo, X., et al. (1987) Czochralski Growth of Alexandrite Crystals and Investigation of Their Defects. Journal of Crystal Growth, 83, 311-318. https://doi.org/10.1016/0022-0248(87)90292-2
[26] Walling, J.C., Peterson, O.G., Jenssen, H.P., Morris, R.C. and O’Dell, E.W. (1980) Tunable Alexandrite Lasers. IEEE Journal of Quantum Electronics, 16, 1302-1315. https://doi.org/10.1109/JQE.1980.1070430
[27] Cortezão, S.U. and Blak, A.R. (1998) Optical Absorption (OA) and Thermally Stimulated Depolarization Currents (TSDC) in Brazilian Amethyst. Radiation Effects and Defects in Solids, 147, 1-10. https://doi.org/10.1080/10420159808226381
[28] Cortezão, S.U. and Blak, A.R. (2000) Thermally Stimulated Depolarization Currents in Bra-zilian Amethysts. Brazilian Journal of Vacuum Applications, 19, 43-45.
[29] Cortezão, S.U., Pontuschka, W.M., Rocha, M.S.F. and Blak, A.R. (2003) Depolarisation Currents (TSDC) and Paramagnetic Resonance (EPR) of Iron Amethyst. Journal of Physics and Chemistry Solids, 64, 1151-1155. https://doi.org/10.1016/S0022-3697(03)00043-X
[30] Vismara, M.V.G., Trindade, N.M., Ruggiero, L.O. and Scalvi, R.M.F. (2008) Investigation of
N. M. Trindade et al.
894
the Phenomenon of Electric Dipolar Relaxation in Brazilian Amethysts. Brazilian Journal of Vacuum Applications, 27, 43-49.
[31] Russo, F.T., Scalvi, R.M.F., Scalvi, L.V.A. and Vismara, M.V.G. (2012) Photo-Induced Di-pole Relaxation Current in Natural Amethyst. Materials Research, 15, 461-466. https://doi.org/10.1590/S1516-14392012005000052
[32] Chen, R. and Mckeever, S.W.S. (1997) Theory of Thermoluminescence and Related Phe-nomena. World Scientific, Singapore. https://doi.org/10.1142/2781
[33] Torizuka, K., Yamashita, M. and Yabiku, T. (1994) Thermal Effect in a Lamp-Pumped Continuous-Wave Alexandrite Laser. Journal of Applied Physics, 33, 1899-1904. https://doi.org/10.1143/JJAP.33.1899
[34] Powell, R.C., Xi, L., Gang, X., Quarles, G.J. and Walling, J.C. (1985) Spectroscopy Proper-ties of Alexandrite Crystals. Physical Review B, 32, 2788-2797. https://doi.org/10.1103/PhysRevB.32.2788
[35] Suchocki, A.B., Gilliland, G.D., Powell, R.C., Bowen, J.M. and Walling, J.C. (1987) Spec-troscopy Properties of Alexandrite Crystals II. Journal of Luminescence, 37, 29-37. https://doi.org/10.1016/0022-2313(87)90179-7
[36] Scalvi, R.M.F. (2000) Electric Dipolar Relaxation in Natural and Synthetic Alexandrite. PhD Thesis, University of São Paulo, São Carlos.
Submit or recommend next manuscript to SCIRP and we will provide best service for you:
Accepting pre-submission inquiries through Email, Facebook, LinkedIn, Twitter, etc. A wide selection of journals (inclusive of 9 subjects, more than 200 journals) Providing 24-hour high-quality service User-friendly online submission system Fair and swift peer-review system Efficient typesetting and proofreading procedure Display of the result of downloads and visits, as well as the number of cited articles Maximum dissemination of your research work
Submit your manuscript at: http://papersubmission.scirp.org/ Or contact [email protected]


Certificate of Presentation
We certified that the work entitled Photoluminescence and Thermoluminescence of Alexandrite (BeAl2 O4:Cr 3+), by TRNDADE, N. M.; SCALVI, L. V. A.; SCALVI,
R. M. F.; BLAK, A. R.; YOSHIMURA, E. M. was presented as a Poster at the XVIII BMIC - Brazilian Meeting on Inorganic Chemistry and 7th Brazilian
Meeting on Rare Earths, held at Hotel Colina Verde, São Pedro – SP, Brazil, from September, 25-30th, 2016.
Sidney J.L. Ribeiro
(Chair)


15/02/2017 SAGe Sistema de Apoio a Gestão
http://internet.caph.fapesp.br/SAGe_WEB/printDispatchExternal.do?method=prePrintDispatch&org.apache.struts.taglib.html.TOKEN=19b5dc3e398d93e95c… 1/3
VISUALIZAÇÃO DE DESPACHO
Processo 2016/229840 Linha de Fomento Programas Regulares / Auxílios a Pesquisa / Participação em Reunião Científica ou
Tecnológica / Reunião no Exterior Fluxo ContínuoSituação Em ExecuçãoVigência 20/03/2017 a 22/03/2017Beneficiário Neilo Marcos TrindadeResponsável Neilo Marcos TrindadeVínculoInstitucional doProcesso
Instituto de Física/IF/USP
Folha de Despacho para Reconsideração 002 Reunião no Exterior
Resultado
Concedido
Datas do Despacho
Emitido em : 03/02/2017
Orçamento Consolidado
BenefíciosSolicitado Despacho
Valor (R$) Valor (US$) Valor (R$) Valor (US$)Custeio
Despesas de Transporte 2.217,89 0,00 2.217,89 0,00
Diárias 0,00 750,00 0,00 750,00
Seguro Saúde 46,50 0,00 46,50 0,00
Taxas de Inscrição 0,00 592,28 0,00 613,83
Total 2.264,39 1.342,28 2.264,39 1.363,83Total Geral 2.264,39 1.342,28 2.264,39 1.363,83
Dados de Execução
Data Início 20/03/2017
Duração 3 dia(s)
Data Término 22/03/2017
Área de alocação de recursos Física
Relatório Científico (Quantidade) 1
Relatório Científico (Datas) 30/04/2017
Prestação de Contas (Quantidade) 1
Prestação de Contas (Datas) 30/04/2017
Observações / Transcrições / Frases
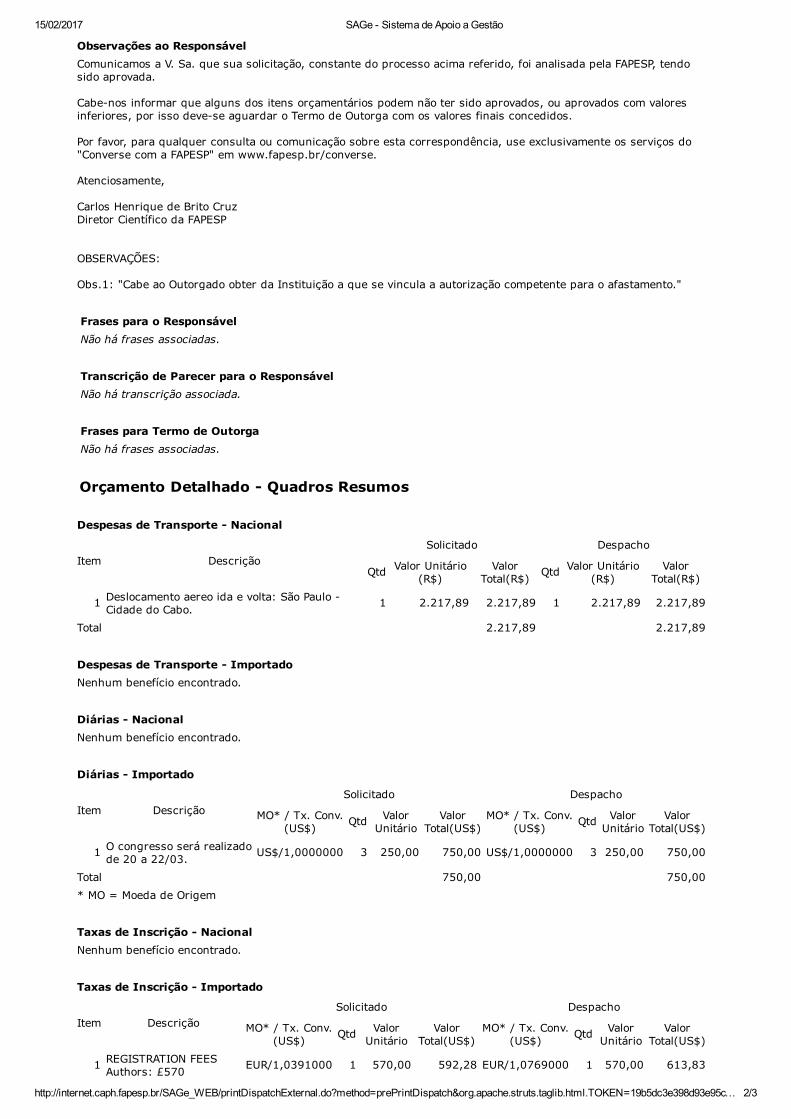
15/02/2017 SAGe Sistema de Apoio a Gestão
http://internet.caph.fapesp.br/SAGe_WEB/printDispatchExternal.do?method=prePrintDispatch&org.apache.struts.taglib.html.TOKEN=19b5dc3e398d93e95c… 2/3
Observações ao ResponsávelComunicamos a V. Sa. que sua solicitação, constante do processo acima referido, foi analisada pela FAPESP, tendo sido aprovada. Cabenos informar que alguns dos itens orçamentários podem não ter sido aprovados, ou aprovados com valores inferiores, por isso devese aguardar o Termo de Outorga com os valores finais concedidos. Por favor, para qualquer consulta ou comunicação sobre esta correspondência, use exclusivamente os serviços do "Converse com a FAPESP" em www.fapesp.br/converse. Atenciosamente, Carlos Henrique de Brito Cruz Diretor Científico da FAPESP OBSERVAÇÕES: Obs.1: "Cabe ao Outorgado obter da Instituição a que se vincula a autorização competente para o afastamento."
Frases para o ResponsávelNão há frases associadas.
Transcrição de Parecer para o ResponsávelNão há transcrição associada.
Frases para Termo de OutorgaNão há frases associadas.
Orçamento Detalhado Quadros Resumos
Despesas de Transporte Nacional
Item DescriçãoSolicitado Despacho
Qtd Valor Unitário(R$)
ValorTotal(R$) Qtd Valor Unitário
(R$)Valor
Total(R$)
1 Deslocamento aereo ida e volta: São Paulo Cidade do Cabo. 1 2.217,89 2.217,89 1 2.217,89 2.217,89
Total 2.217,89 2.217,89
Despesas de Transporte ImportadoNenhum benefício encontrado.
Diárias NacionalNenhum benefício encontrado.
Diárias Importado
Item DescriçãoSolicitado Despacho
MO* / Tx. Conv.(US$) Qtd Valor
UnitárioValor
Total(US$)MO* / Tx. Conv.
(US$) Qtd ValorUnitário
ValorTotal(US$)
1 O congresso será realizadode 20 a 22/03. US$/1,0000000 3 250,00 750,00 US$/1,0000000 3 250,00 750,00
Total 750,00 750,00* MO = Moeda de Origem
Taxas de Inscrição NacionalNenhum benefício encontrado.
Taxas de Inscrição Importado
Item DescriçãoSolicitado Despacho
MO* / Tx. Conv.(US$) Qtd Valor
UnitárioValor
Total(US$)MO* / Tx. Conv.
(US$) Qtd ValorUnitário
ValorTotal(US$)
1 REGISTRATION FEESAuthors: £570 EUR/1,0391000 1 570,00 592,28 EUR/1,0769000 1 570,00 613,83

15/02/2017 SAGe Sistema de Apoio a Gestão
http://internet.caph.fapesp.br/SAGe_WEB/printDispatchExternal.do?method=prePrintDispatch&org.apache.struts.taglib.html.TOKEN=19b5dc3e398d93e95c… 3/3
Total 592,28 613,83* MO = Moeda de Origem
Seguro SaúdeMoeda R$Justificativa
Valor TotalSolicitado Despacho46,50 46,50
Orçamento Detalhado Itens de despesa
Despesas de Transporte Nacional
Origem BrasilQuantidade 1Descrição Deslocamento aereo ida e volta: São Paulo Cidade do Cabo.Valor Unitário 2.217,89Valor Total 2.217,89Justificativa Anexo pre_plano_aereo em Outros Documentos.
Diárias Importado
Quantidade 3Descrição O congresso será realizado de 20 a 22/03.Local ExteriorMoeda US$Valor Unitário 250,00Valor Total 750,00
JustificativaO congresso será realizado de 20 a 22/03, porém em virtude do tempo dedeslocamento (passagens promocioniais) é necessário viajar com 2 dias deantecedência.
Taxas de Inscrição Importado
Origem ExteriorQuantidade 1Descrição REGISTRATION FEES Authors: £570Moeda de Origem EURValor Unitário 570,00Taxa de Câmbio (US$) 1,0769000Valor Total 613,83Justificativa
Seguro Saúde
Moeda R$Valor Total 46,50Justificativa