luna, francisco vidal & klein, herbert s. slaves and...
TRANSCRIPT

LUNA, Francisco Vidal & KLEIN, Herbert S. Slaves and Masters in Early Nineteenth -Century Brazil: São Paulo, Journal of Interdisciplinary History, XXI, 4 (Spring 1991), 549-573. Também pub licado como: Escravos e Senhores no Brasil no Início do Século XIX: São Paulo em 1829, Estudos Econô micos, São Paulo, 20 (3): 349-379, set/dez. 1990.
2
Journal of Interdisciplinary History , XXI : 4 ( Spring 1991 ) , 549 – 573. Francisco Vidal Luna and Herbert S. Klein Slaves and Masters in Early Nineteenth-Century Brazil : São Paulo
The slave regime of Brazil has become the object of major research efforts in the last ten years. The traditional model of a plantation-dominated society presented in Freyre´s seminal work is no longer accepted as the norm, and the complexities and regional variations of the slave system are being systematically explored for the first time.1 In this context, recent work on the late eighteenth and nineteenth-century slave states of Minas Gerais and São Paulo has been particularly important.2 Most of this research has been based on detailed analysis of manuscript census materials. Through an analysis of these as yet unexamined nominal listings, we explore in more detail several of the new findings as they relate to slaves and their owners in central and southern Brazil. Our study is based on data from a representative set of towns in the early part of the nineteenth century in the pivotal state of São Paulo.
Although São Paulo was one of the three largest slave and coffee-producing provinces of the Brazilian empire on the eve of abolition in 1888, it achieved its dominant position relatively late. Throughout most of the nineteenth century, its slave population was comparatively small. Fed by a constant stream of imported African slaves and by the natural growth of its native-born slave population, it had grown steadily but slowly. Most of the state was lightly settled, and it was only the slow expansion of coffee production down the Paraíba Valley – which spanned most of the province of Rio de Janeiro and terminated in the northwestern end of the São Paulo province – which finally brought coffee production to what until then had been a minor sugar-production zone with mixed farming
1 Gilberto Freyre (trans. Samuel Putnam), The Masters and the Slaves: A Study in the Development of
Brazilian Civilization (Berkeley, 1986; rev. 2nd Eng. Ed.). The economic and demographic reanalysis began with Robert W. Slenes, “The Demography and Economics of Brazilian Slavery: 1850-1888”, unpub. Ph.D. diss. (Stanford Univ., 1976); Pedro Carvalho de Mello, “The Economics of Labor in Brazilian Coffee Plantations, 1871 – 1888”, unpub. Ph.D. diss. (Chicago Univ., 1977); Roberto B. Martins, “Growing in Silence: The Slave Economy of Nineteenth Century Minas Gerais, Brasil”, unpub. Ph.D. diss. (Vanderbilt Univ., 1980). These scholars further elaborated their work in a series of articles which include Mello, “Aspectos economicos da organização do trabalho da economia cafeeira do Rio de Janeiro, 1850 – 1888”, Revista Brasileira de Economia, XXXII (1978), 19-67; idem, “Estimativa da longevidade de escravos no Brasil na segunda metade do século XIX, “Estudos Economicos, XIII (1983), 151-179 Amilcar Martins Filho and Martins “Slavery in a Nonexport Economy: Minas Gerais Revisited”. “Hispanic American Historical Review, LXIII (1983), 537-568. To these works on Minas Gerais, São Paulo, and Rio de Janeiro should be added Schwartz’s fundamental economic and social study of the north-eastern slave regime. Stuart B. Schwartz, Sugar Plantations in the Formation of Brazilian Society, Bahia, 1550-1835 (Cambridge, 1985). Finally, much of the new research on non-economic aspects of the slave regime are to be found in Katia M. de Queirós Mattoso, To Be a Slave in Brazil, 1550- 1888 (New Brunswick, N.J., 1986).
2 Detailed studies based on unpublished manuscript census materials dealing with questions of slavery were carried out by a group of economists at the University of São Paulo. These works include, among others, Luna, Minas Gerais: Escravos e senhores (São Paulo, 1981); idem and Iraci del Nero da Costa, Minas colonial: economia e sociedade (São Paulo, 1982); Costa, Minas Gerais: Estruturas populacionais típicas (São Paulo, 1982); idem , VilaRica: População (1719-1826) (São Paulo, 1979); idem and Horacio Gutiérrez, Paraná: Mapas de habitantes, 1798-1830 (São Paulo,1985); Gutiérrez, “ Demografia escrava numa economia, não-exportadora: Paraná, “Estudos Econômicos, XVII (1987), 297-314; idem “Crioulos e Africanos no Paraná, 1798-1830”, Revista Brasileira de História, VIII (1988), 161 –188; José Flávio Motta, “A família escrava e a penetração do café em Bananal (1801-1829), “Revista Brasileira de Estudos Populacionais, V (1988), 71-101. There is also a major research group working at CEDEPLAR (Belo Horizonte) and the Federal University of Minas Gerais on the early nineteenth-century Minas Gerais manuscript census. See, for example, Clotilde Andrade Paiva, “Minas Gerais no século XIX: aspectos demográficos de alguns núcleos populacionais, “in Costa (ed.), Brasil: História Econômica e Demográfia (São Paulo; 1988).
3
activities.3 Although coffee invaded the province in the first years of the nineteenth century, it was only in the mid-1840s that coffee plantations finally reached the central highlands of the state. During the last half of the century, that area became the primary coffee zone of Brazil.4
Unfortunately for historians, the demographic materials available for the study of the Paulista plantation economy and its slave population are limited. Aside from the first national census of 1872 and special published slave censuses undertaken in the late 1870s and the mid-1880s - the original manuscript schedules of which have long since been lost – the only available nominal census lists come from early in the nineteenth century. In 1829 the government of São Paulo undertook the last of its province-wide censuses based on the colonial model. Almost every municipality was registered in that year, using the format which had been the norm since the last eighteenth century, and the original manuscript listings are extant for almost all of the localities included in this census.5 Although a province-wide census was attempted in 1836, and sporadic local censuses were taken at the municipal level in the following decades, no province-wide manuscript materials are available after the 1829 registration. Thus our best source for data on the age, sex, origin, distribution, occupation, and residence of the slave population for this crucial province of the Brazilian empire is from a period relatively early in its evolution as a slave society.
In 1829, São Paulo was still very much a secondary province within the new empire. In an 1823 estimate of the imperial population, São Paulo had 21,000 slaves, or 2 percent of the total of 1.1 million slaves, and its 259,000 free persons represented 9 percent of Brazil´s total free population. The 1823 figure for slaves was probably 10,000 too low. But even at 31,000 slaves, the relative ratio still would be less than 3 percent of the imperial total. Nor did these ratios change dramatically in the years preceding the national census of 1872. In the 1867 empire-wide estimate, the province´s slave population rose to 75,000, which still represented a modest 5 percent of the imperial slave labor force, and its 825,000 free persons were 8 percent of the nation´s free population. By the census of 1872, however, the full impact of coffee production was being felt : the 157,000 slaves in São Paulo represented 10 percent of Brazil´s slave labor force. That increase was especially impressive because the province´s free population remained at 8 percent.6
But in 1829, the coffee plantation system was only just gaining a foothold in the province, and São Paulo was still primarily a producer of sugar, food crops, and cattle. Although coffee was beginning to be gown in the northeastern section of the state, which incorporated the southwestern end of the Paraíba Valley, as yet the major slave plantation
3 The classic study on coffee production in this valley region-of the part within the province of Rio de
Janeiro-is Stanley J. Stein, Vassouras, A Brazilian Coffee County, 1850-1890 (New York, 1970, 2nd ed.). 4 Warren Dean, Rio Claro: A Brazilian Plantation System, 1820-1920 (Stanford, 1976), 31. 5 The term municipality is used as the translation of município, and the two words are used interchangeably
in this article. 6 Instituto Brasileiro de Geografia e Estatística (IBGE), Estatísticas Históricas do Brasil: Séries
econômicas, demográficas e sociais (Rio de Janeiro, 1987) table 1.4, 30. The estimated population for São Paulo given in the compilation gathered by Paiva in this volume differs substantially for the slave population of São Paulo given by Francisco Camargo in his major survey of the paulista population (ibid., 29-30). He estimated a slave population for 1836 at 78,013 and for 1854 at 117,731. José Francisco de Camargo, Crescimento da população no Estado de São Paulo e seus aspectos econômicos (São Paulo, 1981; 2nd ed.), vols. II-III, table II, 18. Our owpartial calculations from the original nominal lists of population in 1829 indicate that the Camargo figures are the correct ones. Even adjusting for these highter rates, the relative importance of the Paulista slave population in the two precensus years does not change significantly. For the 1850, the ratio rises to only about 8% of the imperial total; and, assuming that the 1829 figure was possibly as high as 40,000, the ratio would be only 3,5% of the total Brazilian slave population in the 1820s.
4
crop was sugar. São Paulo, however, was an important but not a dominant producer on the national sugar market.
On the eve of its massive expansion into coffee production, São Paulo had a mixed slave labor system and was just starting to develop a major plantation economy. In this article, we describe the slave labor force and its owners on the eve of the coffee boom through a detailed analysis of three representative communities and their associated farming regions. Mogi das Cruzes, with 2,138 slaves, is located at the southern end of the Paraíba Valley, and represented a traditional farming region. It had a relatively stable labor force and produced mixed foodstuffs as well as some aguardente ( cane alcohol ). Itu, in the central zone of the province, had 4,173 slaves, and was one of the two leading sugar producers ( along with Campinas ) and one of the most important plantation agricultural zones in the province.7 The 3,139 slaves in the city of São Paulo and its environs included a small but important urban labor force engaged in both unskilled and small-scale artisanal activity, as well as an agricultural labor force involved in small-scale farming.8 Together these three communities, with their 9,450 slaves, contained just under one third of the province´s total slave population.9
Economically, these three municípios were typical of São Paulo in 1829, especially in regard to their use and control of slave labor.10 Mogi was a traditional foodstuffs farming region, still little affected by the fazenda ( plantation ) economy which would someday dominate its agriculture. São Paulo represented a mixed urban-rural environment, and Itu eventually served as the model for the type of fazenda economy that prevailed throughout the province in the second half of the nineteenth century.
Given the small size of its slave population, its relatively slow growth, and the incipient nature of much of its plantation economy in the first half of the nineteenth century, it is surprising to find that the ratio of São Paulo´s African-born slaves was close to the norm for Brazil. Slightly over half of the slaves were of foreign birth.11 However, the African
7 In the 1820s Itu had some 100 engenhos (or sugar mills) producing approximately 100,000 arrobas
(1.500 metric tons) of refined sugar a year. Moreover, although Campinas temporarily surpassed Itu as the province’s leading sugar plantation zone in the 1820s and 1830s, by the middle decades of the century, Itu, with its steady growth of sugar production, once again became the premier sugar zone, as it had been in the late colonial period. Maria Thereza Schorer Petrone, A lavoura canavieira em São Paulo (São Paulo, 1968), 41-44.
8 Two districts are missing from the 1829 census for São Paulo. Given the small population in these two districts (872 persons), the number of missing slaves is not significant. Assuming that these districts had approximately the same ratio of slaves as the rest of the municipality, the total of 3.139 which we have obtained from the surviving “mappas” would be increased by 307 slaves. The data on the individual slaves come from the nominal lists (or “mappas”) found in the Arquivo do Estado de São Paulo (hereafter AESP), “População”, Ordem 79 (Itú); Ordem 113 (Mogi); Ordem 37 (São Paulo).
9 Our “total provincial” figure is only about 80% of the actual total provincial slave population. It is based on a compilation of thirteen of the twenty or so communities in the entire province in 1829 (which also consisted of the southern towns of Paraná which were still part of the province of São Paulo at this time). We have mostly excluded the municipalities of the littoral-because they are being analyzed by other scholars in long term research projects. But these later communities were zones of relatively ligtht slave population density.
10 The three municípios included both the small urban populations and the entire surrounding rural distripts up to the borders of the next municipality. They should be considered regions instead of towns. This geographical arrangement was typical in nineteenth-century Latin America.
11 There were 11.464 African-born slaves, and 13.414 known native born slaves in the thirteen principal municípios in the state. They represented 54% of the slaves whose origin is known and 41% of the total of 32.695 slaves in these communities. Luna, “Observações sobre casamentos de escravos em São Paulo (1829)” Anais, VI Encontro Nacional de Estudos Populacionais (Olinda, 1988), III, 217, 221. In the rest of Brazil, in areas which were directly linked to the trade, the figures ran from 50% to 60% African among the slaves. In the city of Rio de Janeiro in the census of 1849, for example, 60% of the some 110,000 slaves were African. The province of Rio de Janeiro itself in 1856 had only 40% Africans among its 184,000 slaves. Joaquim Norberto de Souza e Silva, Investigações sobre os recenseamentos da população geral do Império [1870] (São Paulo, 1986; 2nd ed.), 95,104. In a small sample of plantation

5
slave population was not evenly spread among all three of the municipalities (see Table 1). Itu, the model of the fazenda economy, had the highest ratio of African-born slaves. In this community, where half of the total population consisted of slaves, nearly half of the slaves were from Africa. The other two communities had minority slave populations ( 20 percent of the total population in Mogi and 35 percent in São Paulo ), and less than one fifth of them were African. Although the ratio of native-born slaves in Itu was similar to the rest of the province, the ratios in the municipalities of Mogi and São Paulo were above the norm.
Table 1 Origin and Sex of the Slave Population o f the Municipalities of Itu, São Paulo, and
Mogi in 1829.
Itu Mogi São Paulo Males Females Total Males Females Total Males Females Total
Africans 1450 559 2009 190 96 286 324 269 593 Native-Born 802 801 1603 286 309 595 650 612 1262 Unknown 355 205 560 656 601 1257 662 622 1284 Total Slaves 2607 1565 4172 1132 1006 2138 1636 1503 3139 Total households 1061 1964 1745 Total Population 8184 10550 8887
Note: The three slaves of unknown sex (one in Itu and two in Mogi das Cruzes) have been eliminaded
from this table. Source: Arquivo do Estado de São Paulo (hereinafter AESP), “População”, Ordem 113 (Mogi); Ordem 37
(São Paulo).
Since the economy of Itu was based on the plantation model, the sexual division and age structure of its slave labor force differed significantly from that of the other two communities. Because the Atlantic slave trade brought in mostly adult males, the African slaves were older on average than those who were native-born.12 Thus the high concentration of Africans in Itu explains why the ratio of male slaves was higher there than in the two other areas. Of the 2,888 slaves known to have been born in Africa in these three communities, only 924 were female, and the sex ratio was an extremely high 213 males per 100 females. By contrast, the balance between males and females was virtually even for the 3,460 slaves known to have been born in Brazil.
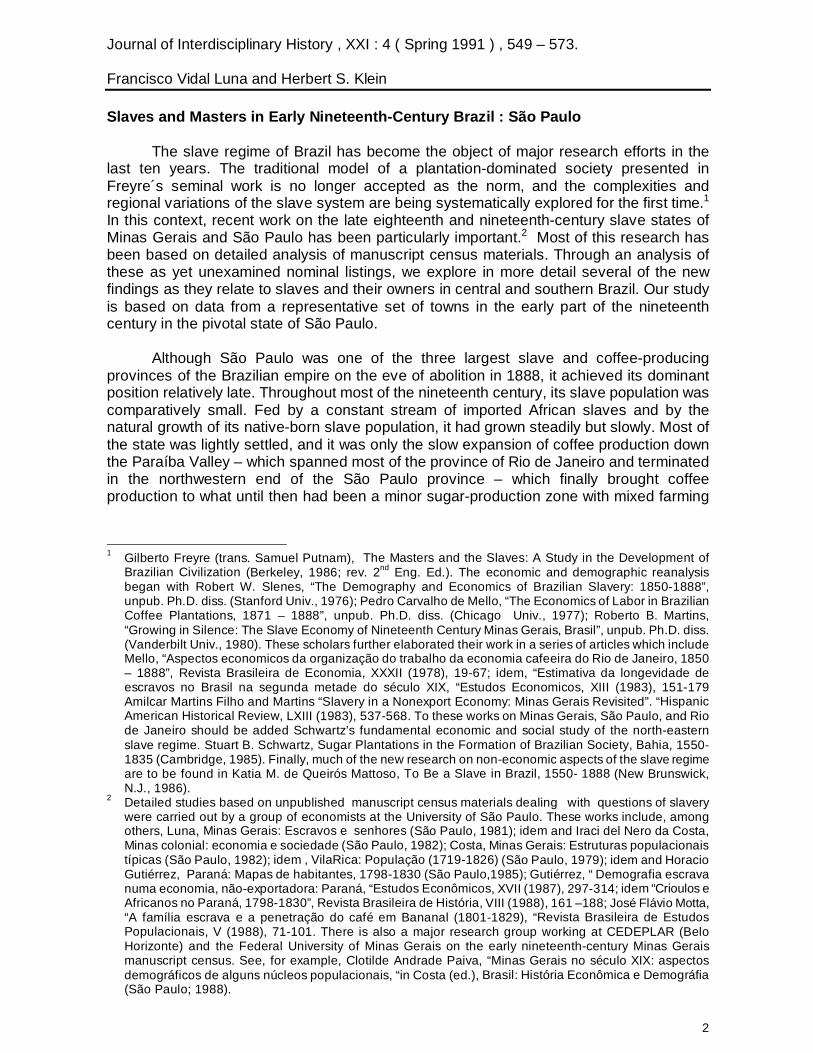
Because Africans were much older as a group than the native-born slaves, the age profile of Itu is significantly weighted toward the older ages, compared to the other two communities ( see Figure 1 ). The age bias among the Africans is plainly evident when the African population of these three communities is considered as a group ( see Figure 2 ). Thus the median age for the foreign-born slaves is 25-29, whereas the median age for those clearly designated as native-born is 15-19 years.
Given the more normal age and sexual divisions of the native-born population, it can be assumed that this population was able to reproduce itself. In fact, studies from Minas Gerais and Paraná support this assumption.13 Unfortunately, in the Brazilian
slaves in Bahia in the first decades of nineteenth century, Africans were averaging 60% of the population . Schwartz, Sugar Plantations, 474 .
12 See Klein, “Demografia do tráfico Atlântico de escravos para o Brasil”, Estudos Econômicos, XVII (1987), 129-150.
13 See Douglas Cole Libby and Márcia Grimaldi, “Equilíbrio e estabilidade: Economia e comportamento demográfico num regime escravista, Minas Gerais no século XIX”, Anais: VI Encontro Nacional de Estudos Populacionais (ABEP) (Olinda, 1988), III, 413-442; Gutiérrez, “Crioulos e Africanos no Paraná”,
6
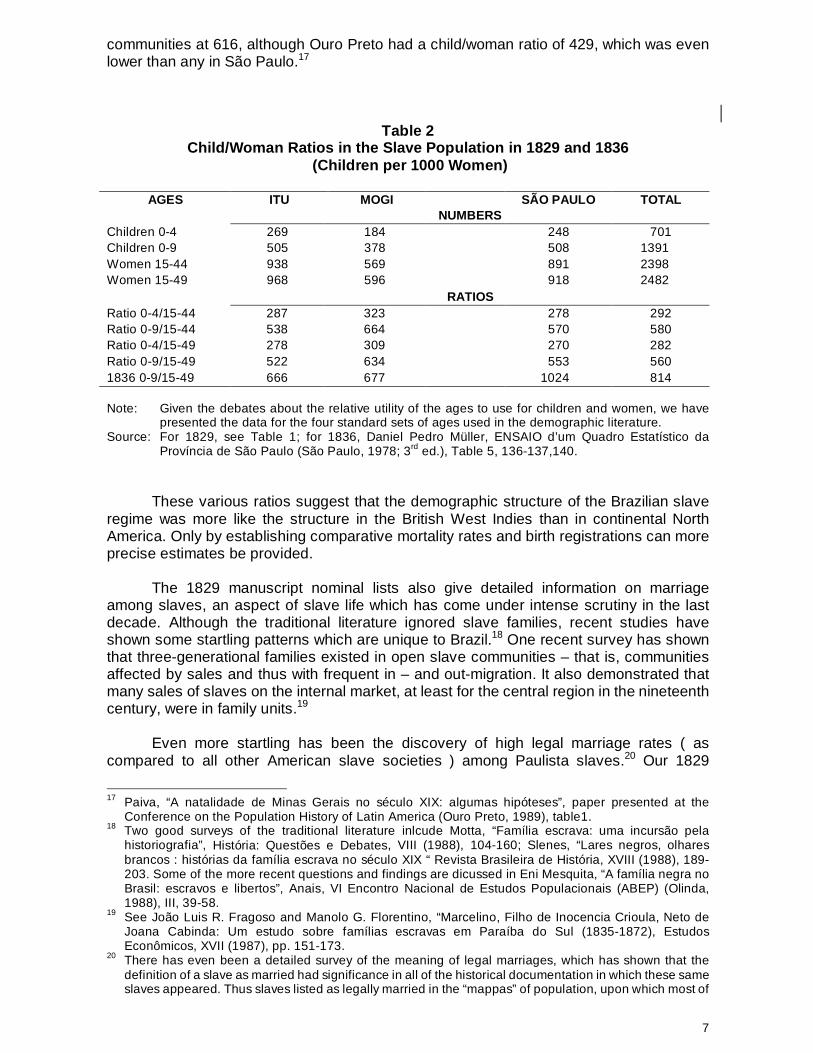
demographic statistics, all children born in Brazil are listed as native-born, even if their parents are African-born. It is thus impossible from the census materials to distinguish between the reproductive potential of the two groups. When the two groups are combined, the child-to-woman ratio suggest rates which would not have enabled the total slave population to reproduce itself ( see Table 2 ). Although controlling for differential mortality patterns – which we cannot as yet establish – would modify these results, it is evident that the slave population of the province of São Paulo – as seen in this representative sample – could not have reproduced itself.
The potential for population growth may have existed among the native-born slaves, but the steady arrival of adult Africans – to meet the needs of coffee planters – masked this potential growth and produced a negative rate overall. The child / woman ratios for the three municipalities are on average less than half of the ratio for the growing slave population of the Unites States in 1830, which was the highest in the Americas in the nineteenth century.14 More in line with São Paulo´s low child/woman ratios is that of Jamaica in 1817, which also had a negative growth rate because of the major presence of Africans in its slave population.15 But even so, the São Paulo ratios seem too low, probably because of the underreporting of children in the 1829 census.
Other sources support this supposition. For example, the official census of 1836, as reported by Müller, gives ratios for the three municípios that are somewhat higher than that for Jamaica.16 In addition, a recent analysis of the unpublished manuscript census of 1831 for Minas Gerais reports the child/woman ratio ( 0-9 / 15-49 ) for 21,301 slaves in three
1798-1830”, Revista Brasileira de História, VIII (1988), 161-187; idem, “Demografia escrava numa economia não exportadora”, 297-314.
14 The ratio of children under 10 years of age per 1,000 women aged 15-49 in the United States in 1829 was 1.484. See Richard H. Steckel, “The Fertility of American Slaves”, Research in Economic History, VII (1982), 241.
15 The ratio for Jamaica, the largest of the British West Indian slave populations, was on the order of 399 for children 0-4 per 1,000 women aged 15-44. See Barry W. Higman, Slave Populations of the British Caribbean, 1807-1834 (Baltimore, 1984), 356. These São Paulo ratios were also considerably below the figures in Trinidad in 1813, where the ratio of slave children 0-4 to slave women 15-49 was 434. A. Meredith John, The Plantation Slaves of Trinidad, 1783-1816 (Cambridge,1988), 128.
16 Daniel Pedro Müller,Ensaio d’um quadro estatístico da província de São Paulo (São Paulo, 1978; 3rd ed.) table 5, 132-173.
7
communities at 616, although Ouro Preto had a child/woman ratio of 429, which was even lower than any in São Paulo.17
Table 2 Child/Woman Ratios in the Slave Population in 1829 and 1836
(Children per 1000 Women)
AGES ITU MOGI SÃO PAULO TOTAL NUMBERS Children 0-4 269 184 248 701 Children 0-9 505 378 508 1391 Women 15-44 938 569 891 2398 Women 15-49 968 596 918 2482 RATIOS Ratio 0-4/15-44 287 323 278 292 Ratio 0-9/15-44 538 664 570 580 Ratio 0-4/15-49 278 309 270 282 Ratio 0-9/15-49 522 634 553 560 1836 0-9/15-49 666 677 1024 814 Note: Given the debates about the relative utility of the ages to use for children and women, we have
presented the data for the four standard sets of ages used in the demographic literature. Source: For 1829, see Table 1; for 1836, Daniel Pedro Müller, ENSAIO d’um Quadro Estatístico da
Província de São Paulo (São Paulo, 1978; 3rd ed.), Table 5, 136-137,140.
These various ratios suggest that the demographic structure of the Brazilian slave regime was more like the structure in the British West Indies than in continental North America. Only by establishing comparative mortality rates and birth registrations can more precise estimates be provided.
The 1829 manuscript nominal lists also give detailed information on marriage among slaves, an aspect of slave life which has come under intense scrutiny in the last decade. Although the traditional literature ignored slave families, recent studies have shown some startling patterns which are unique to Brazil.18 One recent survey has shown that three-generational families existed in open slave communities – that is, communities affected by sales and thus with frequent in – and out-migration. It also demonstrated that many sales of slaves on the internal market, at least for the central region in the nineteenth century, were in family units.19
Even more startling has been the discovery of high legal marriage rates ( as compared to all other American slave societies ) among Paulista slaves.20 Our 1829
17 Paiva, “A natalidade de Minas Gerais no século XIX: algumas hipóteses”, paper presented at the
Conference on the Population History of Latin America (Ouro Preto, 1989), table1. 18 Two good surveys of the traditional literature inlcude Motta, “Família escrava: uma incursão pela
historiografia”, História: Questões e Debates, VIII (1988), 104-160; Slenes, “Lares negros, olhares brancos : histórias da família escrava no século XIX “ Revista Brasileira de História, XVIII (1988), 189-203. Some of the more recent questions and findings are dicussed in Eni Mesquita, “A família negra no Brasil: escravos e libertos”, Anais, VI Encontro Nacional de Estudos Populacionais (ABEP) (Olinda, 1988), III, 39-58.
19 See João Luis R. Fragoso and Manolo G. Florentino, “Marcelino, Filho de Inocencia Crioula, Neto de Joana Cabinda: Um estudo sobre famílias escravas em Paraíba do Sul (1835-1872), Estudos Econômicos, XVII (1987), pp. 151-173.
20 There has even been a detailed survey of the meaning of legal marriages, which has shown that the definition of a slave as married had significance in all of the historical documentation in which these same slaves appeared. Thus slaves listed as legally married in the “mappas” of population, upon which most of
8
census data for the three São Paulo communities give rates of marriage that are similar to those of later periods. Thus the censuses of 1872 and 1887 show that 29.1 percent and 22.8 percent of the adult slaves respectively were married in the province of São Paulo, figures close to those for a half century earlier. Equally, the marriage patterns and sex distribution found in the three communities were typical of the province as a whole in 1829.21 Rather surprisingly, the marriage rates for adult slaves did not differ significantly from those for the free population in São Paulo, either white or colored. Common law unions were the norm for all groups in São Paulo, and only 28.7 percent of all free adults were married in 1872.22
The marriage rates for early nineteenth-century São Paulo are comparable to those for other provinces of the region. According to the census of 1831, the neighboring state of Minas Gerais, for example, exhibited similar rates of slave marriage - approximately one third of the adults. But in this instance, over half of the free adults were married.23 Finally, according to the censuses of São Paulo in the mid-nineteenth century, the newer coffee plantation areas experienced the highest incidence of legally married slaves in all of Brazil, and probably in all of America.24 In comparison, the marriage rates for slaves in the northeast were low, as were those in the city of Rio de Janeiro.25 Whether Church officials in Minas Gerais and São Paulo were more committed to the institution of marriage, or local planters less concerned with its implications for their slaves, is difficult to determine. What is clear, however, is that throughout the nineteenth century, and in many different types of documents, this same pattern emerges.
the studies of marriage have been based, were in fact married by the Church. See Alida C. Metcalf, “The Slave Family in Colonial Brazil: A Case Study of São Paulo, “paper presented at the Conference on the Population History of Latin America (Ouro Preto, 1989). See also idem, “Vida familiar dos escravos em São Paulo no século dezoito. O caso de Santana do Parnaíba, “ Estudos Econômicos, XVII (1987), 229-243.
21 Slenes, “Demography and Economics”, 447, table 9-8. The three selected communities had rates not only common to the thirteen communities of 1829 for which census data exist, but rates also similar to these communities in earther censuses. See Luna, “Observações sobre casamentos de escravos em treze localidades de São Paulo (1776,1804 e 1829)”, paper presented at the Conference on the Population History of Latin America (Ouro Preto, 1989). They also were close to the rates for the communities in the southern region of Paraná. See Costa and Gutiérrez, “Nota sobre casamentos de escravos em São Paulo e no Paraná, “História: Questões e Debates, V (1984), 313-321. The rate of 20-24% of adult slaves listed as married by Costa and Gutiérrez was half of that for free persons. But in the breakdown by color, there was no difference between black or mulatto slaves-although the colored free persons were usually in the mid-40% range for married adults, compared to whites in the lower 50% category.
22 Slenes “Demography and Economics”, 456. The figure for white adults was only 29,3%, for free mulattos 26,7%, and for free blacks 25,5%. São Paulo was unusual in this parity of marriage rates. More typical was the finding in the census of 1831 for two rich municipalities in the southwestern part of Minas Gerais, which contained some 40,000 free persons and 15,000 slaves. There about one third of the adult slaves (persons 12 years of age and older) married, compared to two thirds of the free adults. Gilberto Guerzoni Filho and Luiz Roberto Netto, “minas Gerais: índices de casamento da população livre e escrava na comarca do Rio das Mortes”, Estudos Econômicos, XVIII (1988), 499-501.
23 Ibid.,501. A special case was the Jesuit Fazenda Santa Cruz in the state of Rio de Janeiro, which had 1,347 slaves in 1791. There the rates of slave marriage were an extraordinarily high 68% for both adult men and adult women. The special nature of the owners can be the only factor which accounts for this unique rate. Richard Graham, “Slave Families on a Rural Estate in Colonial Brazil”, Journal of Social History, IX (1976), 382-385.
24 This finding was originally developed by Slenes in 1976 and has held up remarkably well in recent years. See “Demography and Economics”, 412-483. In a detailed study of the plantations in Campinas in 1872, he found that the rates were even higther than those found in 1829. Thus for 76 owners with 1,975 slaves, the total of adult slaves who were married was 41% (30% of the adult men were married and 62% of the women). Slenes, “Escravidão e família: padrões de casamento e estabilidade familiar numa comunidade escrava (Campinas, século XIX)”, Estudos Econômicos, XVII (1987), 225.
25 For the rates in the northeast, see the discussion in Schwartz, Sugar Plantations, 382-394. For Rio de Janeiro, see Mary C. Karasch, Slave Life in Rio de Janeiro, 1808-1850 (Princeton, 1987), 289. In 1839 only 1.5 marriages per 1,000 slaves were recorded, compared to 9.4 marriages per 1,000 for free persons. Given the higher mean age of the predominantly African slaves, these figures are even more negative for slaves if just the adult populations are considered.

9
Also consistent with later São Paulo census data is the finding that slave marriage rates are correlated with size of slave holdings. The larger the number of slaves owned by an individual master, the more likely were the adult slaves to be married.26 Given the distortions in the balance of the sexes, it is not surprising that a larger proportion of the women were married than the men (see Table 3).27 The correlation between size of holding and marriage rates suggests that the slaves generally married within their own units and that the larger the size of the slave holdings of their masters, the more likely they were to find marriage partners on the same estate.
A limited data set of 413 slave marriages for the Unites States ( based on Civil War
pension requests from ex-slaves who were wives ) suggests that the smaller the holding, the more likely married slaves are to have different masters. This would seem obvious in light of the problems related to the availability of eligible male slaves in smaller units. Yet larger surveys of probate and plantation records surprisingly show a negative correlation between size of holding and fertility ( unfortunately, with no large-scale information on slave marriages ). This negative correlation does not seem to be due to lack of available male partners.
Although marriage rates correlate positively with size of holdings, child/woman ratios in our 1829 data set from São Paulo show no significant relationship. This finding suggests that marital fertility for the larger plantations was lower than for the smaller holdings, a result which points in the same direction as the United States data.
Interpretation is difficult, given the current data. However, Steckel suggests the possibility that the larger plantations were older and more stable – with fewer sales off the estate. As a result, there were greater problems of incest taboos, which led to lower marriage rates and child/woman ratios. Unfortunately, there is no firm evidence available to confirm such suppositions.28
In contrast, a survey of early eighteenth-century marriages and consensual unions on the British West Indian slave plantations found a correlation between the ratio of adults in family units and the size of holding, just as we have found for São Paulo in 1829. As in the Unites States, there was also a fairly large percentage of so-called “ broad “ marriages, or husbands and wives owned by different masters. In the case of Barbados in the 1820s, for example, some 30 percent of unions involved broad marriages. However, it is unclear from the data if there is any correlation between the incidence of such marriages and the size of the holdings. The British West Indian data of the 1810s and 1820s – unlike our findings for São Paulo in 1829 – show that African-born slaves had far less access to marriage than did native-born slaves.29
26 This pattern was also the finding for Campinas in 1872 and for the Paulista municipality of Lorena in
1801. See Slenes, “Escravidão e família”, 217-227; Costa, idem, and Schwartz, “A família escrava em Lorena (1801)”, Estudos Econômicos, XVII (1987), 252.
27 This same differential rate of marriage by sex among slaves was also found in the 15,000 slaves in southwestern Minas Gerais in the census of 1831. Whereas 28% of the adult males (12 years of age and older) were married, 47% of the adult slave women were to be found in this category. Guerzoni Filho and Netto, “Minas Gerais: índices de casamento”, 502.
28 Steckel, “Fertility of American Slaves”, 270, table 12, 257-273. In his seminal work on the subject, Gutman suggests that allowing slaves to marry outside the unit was primarily related to the nonavailability of males on the smaller units. Herbert G. Gutman, The Black Family in Slavery and Freedom, 1750-1925 (New York, 1976), 131. On the larger units such exogenous marriages were not the norm. He also stresses prenuptial intercourse-or what others have labeled as trial marriage-as the norm for an important minority of female slaves. Ibid, 60-143.
29 Higman, Slave Populations, 369-371.

10
The few record-linkage studies which provide evidence on slave marriages in Brazil show low rates of legal unions among slaves of different owners.30 One reason for this low “broad“ marriage rate may be the greater concern of Brazilian planters with the legal ramifications of separating formally married couples. Planters may have opposed legal marriage ties between the slaves of two unrelated masters since the forced breakup of such families was more likely.31 Stable family unions, if not legal marriages, however, must have occurred in smaller holdings in Brazil for the same reasons as suggested by the North American evidence. It also appears that the correlation between size and marriage is closely related to the increasing availability of potential male partners. Finally, the few data available from recent Brazilian studies suggest that there was little difference between marriage rates of African and native-born slaves.32
30 One of the few such studies is that done on the Paulista municipality of Santana do Parnaíba, not far from
the present-day city of São Paulo. Of the 569 slave marriages occurring between 1726 and 1820, some 93% were between slaves of the same master. Although 30% of the slave marriages occurred between slaves and free persons, even in these cases, it was usually to free persons who worked for the same person who owned the slaves. Finally, in the small number of cross marriages (or so called “broad marriages”, as the term is used in United States historiography), the different masters were often related. Metcalf, “Slave Family”, 5-6. This same conclusion was reached by Slenes in his study of a sample of plantations from Campinas in the census of 1872. See “Escravidão e família”,220.
31 Although no Brazilian studies currently exist dealing with the causes for the breakup of legal marriages, some significant evidence suggests that many slave families in Brazil in fact were treated as a unit in times of sales, thus respecting the laws dealing with this phenomenon (see Fragoso and Florentino, “Marcelino, Filho de Inocencia Crioula, Neto de Joana Cabinda”, 151-173). In the United States, it is estimated that death and forced sales were the two principal causes for the breakup of marriages among slaves, with force accounting for one third of such dissolutions. Moreover, the forced breakup of families affected both long-term, and multiple-children unions, as well as newly joined ones. Jo Ann Manfra and Robert B. Dykstra, “Serial Marriage and the Origins of the Black Stepfamily: The Rowanty Evidence”, Journal of American History, LXXII (1985), 34.
32 In fact, in the three-municipality sample, 32% of the adult African slaves were married, compared to 27% of those adult slaves who were known to have been born in Brazil.

11
T
able
3
Mar
riag
e R
ates
am
ong
Adu
lt S
lave
s (1
5 Y
ears
Old
or
Old
er)
in S
ão P
aulo
in
1829
(i
n p
erce
nta
ges
)

12
IT
U
%
M
OG
I %
SÃ
O P
AU
LO
%
3 M
UN
ICÍP
IOS
%
13
M
UN
ICÍP
IOS
Siz
e of
H
oldi
ng
Men
W
omen
T
otal
M
en
Wom
en
Tot
al
Men
W
omen
T
otal
M
en
Wom
en
Tot
al
Tot
al
1-5
17%
18
%
18%
18
%
20%
19
%
9%
10%
10
%
14%
15
%
14%
17
%
6-10
17
22
19
23
33
27
14
17
15
17
23
20
26
11
-15
20
45
28
26
38
31
19
20
19
21
33
26
30
16-2
0 25
38
29
37
37
37
23
19
21
26
32
28
21-4
0 28
59
38
34
52
41
23
32
27
28
51
36
36
41
+ 34
73
47
25
37
30
28
23
25
33
60
43
34
Tot
al
26%
48
%
34%
24
%
30%
27
%
16%
16
%
16%
23
%
32%
27
%
28%
(n)²
20
65
1085
31
50
805
672
1477
11
49
1058
22
07
4019
28
15
6834
22
887
2 A
ll ad
ults
15
year
s ol
d or
old
er.
Not
e:
Thi
s ta
ble
incl
udes
sla
ves
liste
d as
“m
arri
ed”
or “
wid
owed
”.

13
Sou
rces
: S
ee T
able
1.
For
the
ana
lyse
s of
thi
rtee
n co
mm
uniti
es,
see
Luna
. “O
bser
vaçõ
es s
obre
cas
amen
tos
de e
scra
vos
em t
reze
loca
lidad
es d
e S
ão P
aulo
(17
76,
1804
e 1
829)
, “p
aper
pre
sent
ed a
t the
Con
fere
nce
on t
he P
opul
atio
n H
isto
ry o
f La
tin A
mer
ica
(Our
o P
rêto
, 19
89),
Tab
le 3
.
14
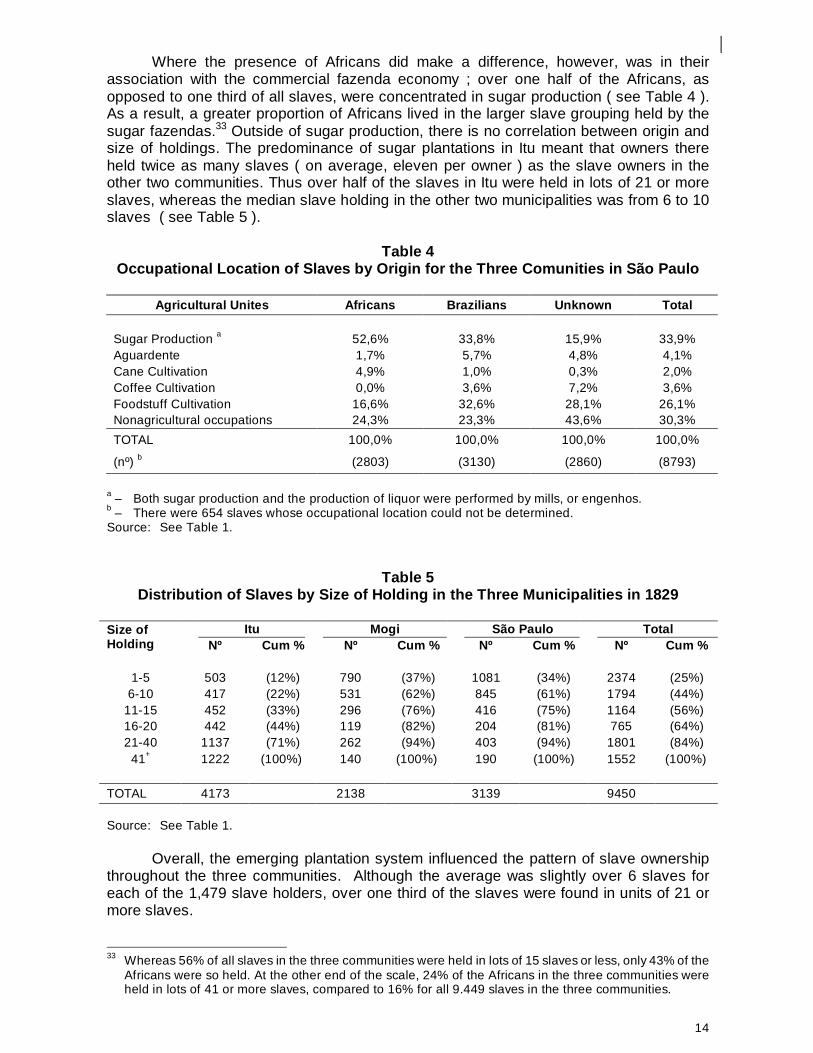
Where the presence of Africans did make a difference, however, was in their
association with the commercial fazenda economy ; over one half of the Africans, as opposed to one third of all slaves, were concentrated in sugar production ( see Table 4 ). As a result, a greater proportion of Africans lived in the larger slave grouping held by the sugar fazendas.33 Outside of sugar production, there is no correlation between origin and size of holdings. The predominance of sugar plantations in Itu meant that owners there held twice as many slaves ( on average, eleven per owner ) as the slave owners in the other two communities. Thus over half of the slaves in Itu were held in lots of 21 or more slaves, whereas the median slave holding in the other two municipalities was from 6 to 10 slaves ( see Table 5 ).
Table 4 Occupational Location of Slaves by Origin for the Three Comunities in São Paulo
Agricultural Unites Africans Brazili ans Unknown Total
Sugar Production a 52,6% 33,8% 15,9% 33,9% Aguardente 1,7% 5,7% 4,8% 4,1% Cane Cultivation 4,9% 1,0% 0,3% 2,0% Coffee Cultivation 0,0% 3,6% 7,2% 3,6% Foodstuff Cultivation 16,6% 32,6% 28,1% 26,1% Nonagricultural occupations 24,3% 23,3% 43,6% 30,3%
TOTAL 100,0% 100,0% 100,0% 100,0%
(nº) b (2803) (3130) (2860) (8793)
a – Both sugar production and the production of liquor were performed by mills, or engenhos. b – There were 654 slaves whose occupational location could not be determined. Source: See Table 1.
Table 5 Distribution o f Slaves by Size of Holding in the Three Municipali ties in 1829
Itu Mogi São Paulo Total Size of
Holding Nº Cum % Nº Cum % Nº Cum % Nº Cum %
1-5 503 (12%) 790 (37%) 1081 (34%) 2374 (25%) 6-10 417 (22%) 531 (62%) 845 (61%) 1794 (44%)
11-15 452 (33%) 296 (76%) 416 (75%) 1164 (56%) 16-20 442 (44%) 119 (82%) 204 (81%) 765 (64%) 21-40 1137 (71%) 262 (94%) 403 (94%) 1801 (84%)
41+ 1222 (100%) 140 (100%) 190 (100%) 1552 (100%)
TOTAL 4173 2138 3139 9450 Source: See Table 1.
Overall, the emerging plantation system influenced the pattern of slave ownership throughout the three communities. Although the average was slightly over 6 slaves for each of the 1,479 slave holders, over one third of the slaves were found in units of 21 or more slaves. 33 Whereas 56% of all slaves in the three communities were held in lots of 15 slaves or less, only 43% of the
Africans were so held. At the other end of the scale, 24% of the Africans in the three communities were held in lots of 41 or more slaves, compared to 16% for all 9.449 slaves in the three communities.
15
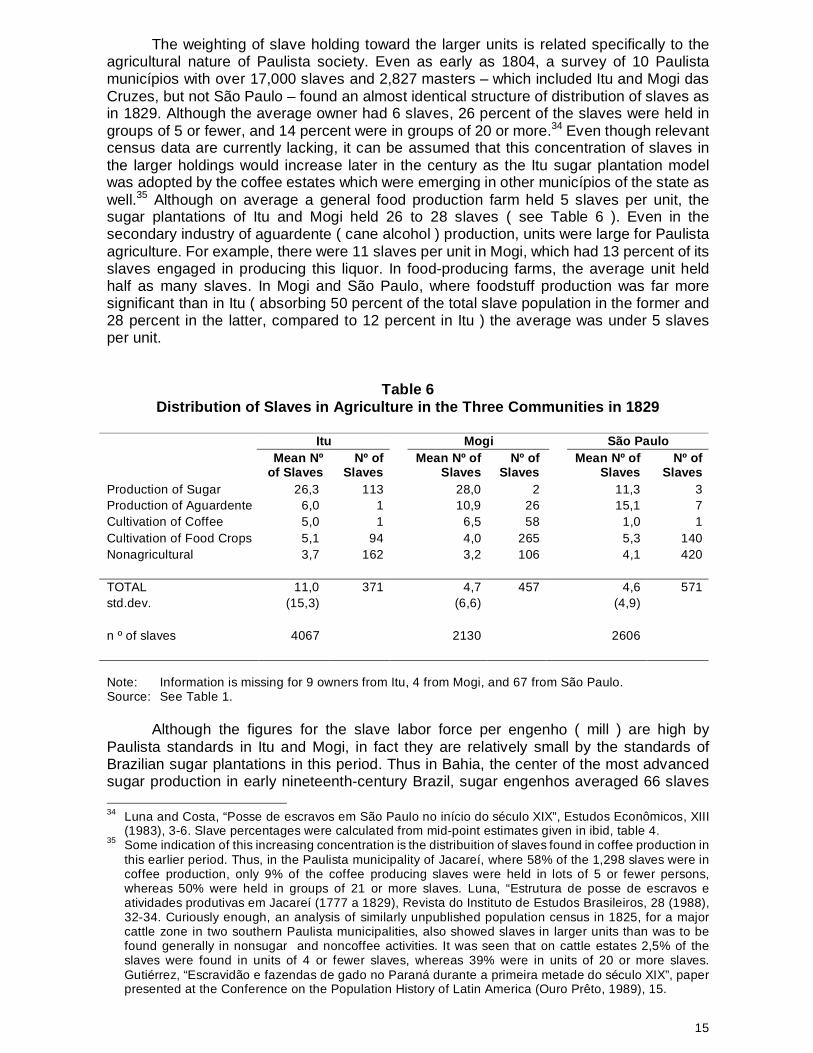
The weighting of slave holding toward the larger units is related specifically to the agricultural nature of Paulista society. Even as early as 1804, a survey of 10 Paulista municípios with over 17,000 slaves and 2,827 masters – which included Itu and Mogi das Cruzes, but not São Paulo – found an almost identical structure of distribution of slaves as in 1829. Although the average owner had 6 slaves, 26 percent of the slaves were held in groups of 5 or fewer, and 14 percent were in groups of 20 or more.34 Even though relevant census data are currently lacking, it can be assumed that this concentration of slaves in the larger holdings would increase later in the century as the Itu sugar plantation model was adopted by the coffee estates which were emerging in other municípios of the state as well.35 Although on average a general food production farm held 5 slaves per unit, the sugar plantations of Itu and Mogi held 26 to 28 slaves ( see Table 6 ). Even in the secondary industry of aguardente ( cane alcohol ) production, units were large for Paulista agriculture. For example, there were 11 slaves per unit in Mogi, which had 13 percent of its slaves engaged in producing this liquor. In food-producing farms, the average unit held half as many slaves. In Mogi and São Paulo, where foodstuff production was far more significant than in Itu ( absorbing 50 percent of the total slave population in the former and 28 percent in the latter, compared to 12 percent in Itu ) the average was under 5 slaves per unit.
Table 6 Distribution o f Slaves in Agriculture in the Three Communities in 1829
Itu Mogi São Paulo
Mean Nº of Slaves
Nº of Slaves
Mean Nº of Slaves
Nº of Slaves
Mean Nº of Slaves
Nº of Slaves
Production of Sugar 26,3 113 28,0 2 11,3 3 Production of Aguardente 6,0 1 10,9 26 15,1 7 Cultivation of Coffee 5,0 1 6,5 58 1,0 1 Cultivation of Food Crops 5,1 94 4,0 265 5,3 140 Nonagricultural 3,7 162 3,2 106 4,1 420
TOTAL 11,0 371 4,7 457 4,6 571 std.dev. (15,3) (6,6) (4,9)
n º of slaves 4067 2130 2606
Note: Information is missing for 9 owners from Itu, 4 from Mogi, and 67 from São Paulo. Source: See Table 1.
Although the figures for the slave labor force per engenho ( mill ) are high by Paulista standards in Itu and Mogi, in fact they are relatively small by the standards of Brazilian sugar plantations in this period. Thus in Bahia, the center of the most advanced sugar production in early nineteenth-century Brazil, sugar engenhos averaged 66 slaves 34 Luna and Costa, “Posse de escravos em São Paulo no início do século XIX”, Estudos Econômicos, XIII
(1983), 3-6. Slave percentages were calculated from mid-point estimates given in ibid, table 4. 35 Some indication of this increasing concentration is the distribuition of slaves found in coffee production in
this earlier period. Thus, in the Paulista municipality of Jacareí, where 58% of the 1,298 slaves were in coffee production, only 9% of the coffee producing slaves were held in lots of 5 or fewer persons, whereas 50% were held in groups of 21 or more slaves. Luna, “Estrutura de posse de escravos e atividades produtivas em Jacareí (1777 a 1829), Revista do Instituto de Estudos Brasileiros, 28 (1988), 32-34. Curiously enough, an analysis of similarly unpublished population census in 1825, for a major cattle zone in two southern Paulista municipalities, also showed slaves in larger units than was to be found generally in nonsugar and noncoffee activities. It was seen that on cattle estates 2,5% of the slaves were found in units of 4 or fewer slaves, whereas 39% were in units of 20 or more slaves. Gutiérrez, “Escravidão e fazendas de gado no Paraná durante a primeira metade do século XIX”, paper presented at the Conference on the Population History of Latin America (Ouro Prêto, 1989), 15.

16
per estate in 1816 – 1817, and in Rio de Janeiro in the late eighteenth century, the average was 36 slaves per estate.36
Slaves in commercial plantation agriculture were generally held in larger units than slaves in other branches of economic activity. Thus slave owners engaged in commerce in these three communities averaged 5 slaves per unit, whereas among artisan slave owners, the range was 2 to 3 slaves per unit (see Table 7). For the few owners involved in transport ( mainly muleteers ), the average holding was 6 to 7 slaves. Unfortunately, the listing of owners as members of the military, clergy, liberal professions, and government does not permit us to make a serious analysis of their actual use of slaves, since it is unclear if they were used as domestics in urban households, or as artisans or even agricultural workers. When two occupations were given for owners, we have listed the one which was most directly related to production. But, in any case, these urban occupational categories are relatively minor ( 5 percent of the slaves in Itu and 3 percent in Mogi were distributed among these persons ), except in the capital of São Paulo, where they absorbed a significant 28 percent of the slaves whose owner´s occupation was known.
Table 7 Mean Number of Slaves per Owner by Owner´s Occupation
Itú Mogi São Paulo
Mean Nº of Slaves
Nº of Owners
Mean Nº of Slaves
Nº of Owners
Mean Nº of Slaves
Nº of Owners
Agriculture 16,3 214 5,0 352 5,8 154 Artisan 1,8 41 2,2 38 2,5 90 Clerical 2,4 11 3,4 9 4,0 25 Government Employee 3,0 2 2,5 4 5,0 22 Military Official 1,5 2 - 5,2 61 Liberal Profession 3,9 9 3,0 1 3,3 19 Capitalist 4,8 31 3,5 2 6,6 24 Commerce 4,5 41 4,6 41 4,9 108 Transport 6,4 11 1,0 1 8,2 5 Services in General - - 2,0 1 Day Laborer - 1,3 3 4,5 2 Not Classified 2,4 9 1,7 6 2,4 60 TOTAL 11,0 371 4,7 457 4,7 571 Nº of slaves 4067 2130 2606 Note: Information on occupation is missing for 9 owners from Itu, 4 from Mogi, and 2 from São Paulo. Source: See Table 1.
The census also revealed trends concerning the slave owners themselves. To begin with, only about one third of all free persons in each of the communities were slave owners. Males owned between two thirds and four fifths of the slaves in any community, having 73 percent of the total slaves in the three communities combined ( see Table 8 ). Women were a minority of the slave owners, and held fewer slaves than their relative weight among owners would predict. They owned only 21 percent of the slaves in the three communities even though they comprised 26 percent of the owners. They differed profoundly from male owners in terms of their relative dispersion into nonagricultural occupations and from other business women in regard to their economic independence. 36 Costa, “Nota sobre a posse de escravos nos engenhos e engenhocas Fluminenses (1778), “Revista do
Instituto de Estudos Brasileiros, 28 (1988), 113; Schwartz, Sugar Plantations, 446.

17
Table 8 Number of Slaves Owned by Sex or Condition o f Owner in the Three Municípios in
1829, with Number of Owners in Parentheses
Itu Mogi São Paulo Total Males 3107 (267) 1657 (369) 2130 (439) 6894 (1075) Females 862 (106) 363 (90) 780 (193) 2005 (389) Inheritors (multiple owners)
25 (1) - - - - 25 (1)
Religious Orders 42 (2) 118 (02) - - 160 (4) Juridical Persons 137 (4) - - - - 137 (4) Not Given - - - - 229 (6) 229 (6)
Total 4173 (380) 2138 461 3139 (638) 9450 (1479) Mean slaves per owner 11,0 4,6 4,9 6,4
St.dev. 15,3 6,6 7,3 10,2 Gini coefficent for slave distribution among slaveowning households
0,610 0,524 0,513 0,583
Total House-Holds 1061 1964 1745 4770 % of slaveowning households
36% 23% 37% 31%
Gini coefficent for slave distribution among all house-holds
0,860 0,888 0,822 0,871
Source: See Table 1.
Slave ownership was also profoundly affected by the area of production in which the slaves worked. It is evident that the special importance of sugar production in Itu had an impact on the relative shares of slaves by owner. For example, although there were twice as many owners in São Paulo, Itu had 1,000 more slaves. Given that the average holding in Itu was double that of São Paulo, it is no surprise that the Gini coefficient of distribution in Itu is considerably higher – and, therefore, shows more biased distribution of slaves – than that in the latter community.37 Mogi, which was dominated by food crop farming, and São Paulo, with its more urban slave structure, produced approximately the same Gini coefficients of distribution of slaves.
These relative differences among the three communities decline when all of the non-slave-owning free households are included in these distributional measures. In all three of the communities, the minority nature of slave holding causes the inequality index to rise to high levels, suggesting that slave owning in and of itself was a relatively elite characteristic. However, even at these high levels, there is some differentiation. São Paulo stands out as a less hierarchical area ; surprisingly, Itu, because of its relatively small number of households, has a lower Gini than does Mogi.
Several factors specific to slave owners distinguish them from the population as a whole. To begin with, their average age is considerably higher than the median age of any 37 This same pattern of higher inequality of ownership was also noted for the census of 1829 in the newly
emerging coffee município of Bananal-one of the first of the Paulist coffee zones. There the 195 slave owners had an average of 11.7 slaves, and the GINI was 0,657-on a par with Itu. Motta, “Estrutura de posse de escravos em Bananal (1801-1829), “ paper presented at the Conference on the Population History of Latin America (Ouro Prêto, 1989), 2-5.

18
other group in this population, including the African slaves. The median age of owners, both male and female, was in the mid 40s. 38This finding is not unexpected given the fact that slave ownership was expensive. Slaves were clearly an asset that could be accumulated only over a lifetime, and, although inheritance was an important source of slaves for some owners, even inheritors did not assume ownership of their assets until rather late in their lives. These three communities differ from others in Brazil during this period in that there is no significant correlation between increasing age and the number of slaves owned ; a cumulative effect over time does not show up in the 1829 census.39
The data provide some interesting information on female owners. The vast majority of the women were widowed or single ( over 90 percent ), whereas most of the men were married ( about 73 percent ) ( see Table 9 ). Although male and female owners are similar in age, the difference in terms of their marital status suggests that women were more likely than man to inherit slaves, and that they did not act as independent economic agents. There is, however, the unusual case of female artisans ( almost exclusively seamstresses and weavers ) who were usually single and who held slaves who worked as journeymen or as assistants. This group was to be found in all three of the communities, but was especially important to São Paulo and Mogi.
Table 9 Civil Status of Slave Owners in Three Communities in 1829, with Number of Slaves
Owned in Parentheses
Itu Mogi São Paulo Owners (Slaves) Owners (Slaves) Owners (Slaves)
All Men 267 (3107) 369 (1657) 439 (2130) Married 217 (2731) 306 (1415) 258 (1317) Single 28 (124) 39 (140) 137 (541) Widowed 21 (215) 24 (102) 40 (196) Unknown 1 (37) - (0) 4 (76) All Women 106 (862) 90 (363) 193 (780) Married 7 (19) 9 (19) 6 (17) Single 37 (116) 12 (40) 75 (202) Widowed 62 (727) 69 (304) 108 (537) Unknown - (0) - (0) 4 (24)
Total 373 (3969) 459 (2020) 632 (2910) Source: See Table 1
Over one fourth of the women slave owners in the municipality of São Paulo were seamstresses ( 50 ) or weavers ( 3 ), with each on average holding 2.4 slaves. Of these women, 30 were single, 20 were widowed and 3 married. Although women also dominated these trades in Mogi das Cruzes, the pattern in this more rural area was for widows to dominate, with 21 of the 26 women slave owners in these artisanal activities, being
38 In the three communities, the male slave owners were usually slightly younger (45 to 47 years of age)
than the female owners (48 to 52 years of age). 39 Costa and Nelson Hideiki Nozoe, “Elementos da estrutura de posse de escravos em Lorena no alvorecer
do século XIX”, paper presented at the Conference on the Population History of Latin America (Ouro Prêto), 1989), 16-17. The authors found a relationship between the median number of slaves held by age category of owners, if one excludes owners of large holdings-that is, those with 25 slaves or more-on the grounds that they were probably inherited rather than purchased. Even excluding slaves being held in lots of 25 or more, the correlation for age of owners and size of holding in Itu was still insignificant (-.0189). Nor is it significant in any of the three communities, even when women are excluded. But their finding of an average age for slave owners of 49,3 years is similar to our figures for 1829(ibid.,2).

19
widowed ( 16 ) or married ( 5 ). Itu had 11 women in these two activities, with 8 being single. Although these numbers are relatively small, they suggest that women in the artisanal trades were independent artisans who owned slaves in their own right, as opposed to the dominant pattern in the rural landowning class, where women slave owners were overwhelmingly widows, and probably inherited their slaves from their husbands or were serving as guardians for their male children.
How do these patterns of slave demography and slave ownership compare to those in other zones of Brazil in the late eighteenth and early nineteenth century. The sugar estates in São Paulo had fewer slaves than those in the more dynamic centers of sugar production in the country. Nevertheless, overall size of holdings per community in these São Paulo municipalities was well within the norm for the rest of the country, as was the relative distribution of slaves among slave owners ( see Table 10 ). Even in Bahia, overall holdings were 7 slaves per owner, once the non-sugar estate owners are included. In this context, Itu, with its very high concentration of slave owners and sugar estates, stands out from the general norm with its average of 11 slaves per unit.
Table 10 Comparative Indices of Slave Ownership in Selected Brazilian Communities
Community / Year Average Size Of Holding
Gini Coefficient Of Slave Distribution Among Slave Owners
Lorena (SP) 1804 5.8 0.56
Sorocaba (SP) 1804 5.0 0.54 Bahia 1816/17 7.2 0.59
Vila Rica (MG) 1804 3.7 0.50 Congonhas de Sabará (MG) 1790 4.5 0.54
São Caetano (MG) 1804 6.5 0.57 Curitiba (SP/Paraná) 1824 5.6 0.53
Note: SP = São Paulo; MG = Minas Gerais. Source: Modified from Table 2 in Costa and Nozoe, “Elementos da estrutura de posse de escravos em
Lorena no alvorecer do século XIX”, paper presented to the Conference on the Population History of Latin America (Ouro Preto, 1989), II; Luna, Minas Gerais: Escravos e Senhores (São Paulo, 1981) 127.
Our analysis of Itu, Mogi das Cruzes, and São Paulo in 1829 and of other early nineteenth-century Brazilian communities suggests that the pattern of slave holding in central Brazil at that time shared much in common with the United States. From one fourth to one third of the free households held slaves, and the average holding per slave owner was small. In this respect the two continental zones differed sharply from the British West Indian plantation systems. Although the increasing importance of coffee raised the mean size of plantations to much higher figures, these new units were comparable in size to the old northeastern sugar plantations and the North American cotton plantations, but not the West Indian sugar estates. The importance of non-slave-holding free farmers, many of whom were people of color in Brazil, was one of the distinguishing characteristics of the Brazilian as well as the North American slave systems.
It was in the composition of its slave class that São Paulo shared more in common with the West Indies than with the United States. The dominance of native-born slaves in North America, as opposed to their far less important position in Brazil, had a dramatic impact on mean ages, sex ratios, and, above all, reproductive rates. In this case, São Paulo stands out as an especially unbalanced zone, and its slave population probably
20
became even more male dominated, older, and less reproductive after 1829. Moreover, in this respect São Paulo differed sharply from its neighboring states of Paraná and Minas Gerais, and from many parts of the province of Rio de Janeiro as well. In these regions, the arrival of fewer African immigrants mean earlier achievement of positive growth rates for their resident slave populations.
São Paulo is an unusual case, even by Brazilian standards, in terms of its pattern of formalized and legally recognized marriages among slaves. In no other American slave regime were so many slaves legally married, and in few provinces of Brazil were the ratios so high. Moreover, the correlations between size of holding and marriage rates suggest a high rate of endogamous marriages. The limited evidence from the United States suggests that marriages were more likely to be across holdings. Why these differing patterns should exist when the size of slave holdings was similar is difficult to understand. At this stage of current research, the findings on size and marriage rates in São Paulo can best be explained as depending on the availaibility of relevant marriage partners, a factor suggested by the higher rates of marriage among women.
As this preliminary survey of the 1829 census suggests, the slave system operating in south-central Brazil was a complex one. It shared many formal features with other systems in the Americas, but had many factors unique to its own pattern of development, even in the context of Brazilian slavery.