i fundaÇÃo getulio vargas escola de administraÇÃo de
TRANSCRIPT

i
FUNDAÇÃO GETULIO VARGAS
ESCOLA DE ADMINISTRAÇÃO DE EMPRESAS DE SÃO PAULO
DOUTORADO EM ADMINISTRAÇÃO DE EMPRESAS
JANAINA SIEGLER MARQUES BATISTA
SUPPLY CHAIN TURBULENCE: THE IMPACT OF A MID-RANGE EVENT IN
MULTI-TIER, MULTI-DIMENSION SUPPLY CHAINS
SÃO PAULO
2015

ii
FUNDAÇÃO GETULIO VARGAS
ESCOLA DE ADMINISTRAÇÃO DE EMPRESAS DE SÃO PAULO
DOUTORADO EM ADMINISTRAÇÃO DE EMPRESAS
JANAINA SIEGLER MARQUES BATISTA
SUPPLY CHAIN TURBULENCE: THE IMPACT OF A MID-RANGE EVENT IN
MULTI-TIER, MULTI-DIMENSION SUPPLY CHAINS
Tese apresentada à Escola de Administração de
Empresas de São Paulo da Fundação Getulio
Vargas, como parte dos requisites para otenção
do título de Doutor em Administração de
Empresas.
Campo do conhecimento: Gestão de Operações
e Competitividade
Orientador: Prof. Dr. Luiz Artur Ledur Brito
Coorientadora: Prof. Barbara B. Flynn
SÃO PAULO
2015

iii
SIEGLER, Janaina M.B. Supply Chain Turbulence: The Impact of a Mid-Range Event in Multi-Tier, Multi-Dimension Supply Chains / Janaina Siegler Marques Batista. - 2015. 306 f. Orientador: Luiz Artur Ledur Brito
Coorientadora: Barbara B. Flynn Tese (doutorado) - Escola de Administração de Empresas de São Paulo. 1. Cadeia de suprimentos. 2. Cosméticos - Indústria - Estudo de casos. 3. Redes sociais. I. Brito, Luiz A.L.. II. Tese (doutorado) - Escola de Administração de Empresas de São Paulo. III. Título.
CDU 658.86/.87

iv
JANAINA SIEGLER MARQUES BATISTA
SUPPLY CHAIN TURBULENCE: THE IMPACT OF A MID-RANGE EVENT IN
MULTI-TIER, MULTI-DIMENSION SUPPLY CHAINS
Tese apresentada à Escola de Administração de
Empresas de São Paulo da Fundação Getulio
Vargas, como parte dos requisites para otenção
do título de Doutor em Administração de
Empresas.
Campo do conhecimento: Gestão de
Operações e Competitividade
Data de aprovaçãoo: 20/07/2015
Banca Examinadora:
Prof. Dr. Luiz Artur Ledur Brito (orientador)
FGV-EAESP
Profª. DBA Barbara B. Flynn
Kelley School of Business Indianapolis, USA
Prof. Dr. Mohan Tatikonda
Kelley School of Business Indianapolis, USA
Profa. Dra. Susana Carla Farias Pereira
FGV-EAESP
Prof. Dr. Tomas de Aquino Guimarães
UNB

v
To my parents Regina and Ireneu, my
husband Marco Aurélio, my loved children
Yara and Stéfano, and my special sister
Marcele and her special family, who have
always showed support and a lot of love.

vi
AGRADECIMENTOS
Apesar de parecer que escrever uma tese seja um trabalho solitário, tenho que dizer que na
verdade não é. Claro, que muito sour e lágrimas são derramados quando estamos sozinhos, mas
o trabalho total da tese, é na verdade um trabalho de equipe. Quero aqui oferecer meus
agradecimentos para pessoas muito especiais que me ajudaram e me apoiaram muito durante
estes últimos anos de minha vida.
Um agradecimento super especial para meus orientadores, que foram quem diretamente
impactaram este trabalho, em especial a Professora Barbara Flynn. Eu não consigo mensurar
quantos dias e noites ela dispendeu lendo, corrigindo e me ajudando com minha tese.
Muitíssimo obrigada Barb! Do fundo do meu coração, você me ensinou muito mais que
habilidades profissionais, técnicas ou acadêmicas; você é um modelo de mulher, mãe, esposa
e claro, profissional para mim. Muito obrigada pela oportunide de trabalhar tão próxima a você,
que é para mim uma pessoa tão especial e tão querida. Muitíssimo obrigada por todo seu
carinho e do Jim comigo e minha família. Obrigada por nor permitir compartilhar com vocês
tantas ocasiões especiais. Obrigada por tudo! Me sinto muito honrada por ser digna de sua
confiança, respeito, tempo e amizade. Muito obrigada mesmo!!!
Um agradecimento especial também ao Professor Mohan Tatikonda, que sempre me inspirou
e me encorajou grandemente. Suas palavras e tendência de ver a “big picture” foram
extremamente importantes para mim nos momentos mais desafiadores deste trabalho. Muito
obrigada por encorajar minhas ideias às vezes malucas! Me sinto muito honrada e grata pela
oportunidade de trabalhar com você, obrigada!
Professor Brito, muitíssimo obrigada por tantas oportunidades. Obrigada por ter confiado em
mim e também me encorajado e desafiado. Ainda me lembro dos primeiros e-mails, conversas
e do processo seletivo. Muito obrigada por ter me permitido esta oportunidade de começar esta
jornada, por ter me ajudado e apoiado em tantos momentos e de formas tão diferentes. Obrigada
pelo apoio para este final feliz. Muito obrigada!
Também quero oferecer meus agradecimentos para vários professores que foram tão
importantes nesta jornada: João Mario Csillag, Ely Paiva, Susana Pereira, Luiz Carlos di Serio,
Renato Orsato, Laredo, Rafael Alcadipani, and Prof. Thomas Choi, que além de inúmeras
habilidades acadêmicas importantes, me ensinou que um artigo deve ter “alma”. Levei esta
orientação muito a sério tá! Obrigada! =)
Um agradecimento especial para amigos muito queridos e especiais. Poucas pessoas
compreendem o desafio de viver este periodo numa caverna (piada interna =): Marcia Scarpin
e Cris Biazzin (olha rimou, rsrss), muitíssimo obrigada. Vocês são muito mais que especiais
em minha vida! Ao meu querido amigo Zé Carlos, quem esteve sempre presente em vários
momentos especiais desta jornada. Obrigada a Liny, Michele, Jalba, Ronaldo, Priscilla, Jorge
Scarpin, Tescari, Chen, Veronica, Luciano, Guilherme e Ricardo Martins, Guto, Macau e

vii
incontáveis outros amigos nerds especiais! Obrigada meus amigos e companheiros da
Gakkai no Brasil e Estados Unidos (PS: Cris, você percebeu que faz parte de vários
nichos e é amiga especial em todos?) <3
Obrigada a pessoas maravilhosas na FGV-SP, em especial a Marica Ostorero. Olha, vou tentar
não falar muito alto, mas esta escola não seria tão boa se não tivesse pessoas e profissionais tão
maravilhosos como você! Ah, não posso deixar de mencionar a Bê, que alegra e perfuma nossas
vidas todos os dias neste departamento também! As meninas maravilhosas da secreteria da pós
na GV e, nos últimos meses, uma pessoa extremamente competente e prestativa: Pamela Tonsa,
muitíssimo obrigada por todo o apoio!
Obrigada também a pessoas maravilhosas na Kelley School of Business. Especialmente Lorna
Griffin, Prof. Ken Carow, Prof. Peggy Lee, e tantas outras pessoas especiais no Office of
International Affairs, que sempre me apoiaram e ajudaram nesta minha jornada internacional
de tantas maneiras differentes.
Um agradecimento mais que especial para meus entrevistados, de todas as empresas. Obrigada
do fundo do meu coração por seu tempo e atenção durante minha fase de coleta de dados.
Gostaria de citar o nome de cada um, mas até por questões de confidencialidade eu não posso
aqui, mas por favor recebam meu carinho especial e eternal gratidão. Tive a oportunidade de
conversas com tantas pessoas maravilhosas que vou ser grata para sempre! Sempre! Obrigada!
Agradecimento especial ao pessoal da Associação Brasileira da Indústria de Higiene Pessoal,
Perfumaria e Cosméticos (ABIHPEC), Associação Brasileira de Cosmetologia (ABC) e da
Euromonitor em Chicago, cujos contatos foram extremamente valiosos. Obrigada!
Finalmente, um agradecimento àquelas pessoas mais especiais em minha vida: meu marido e
meus filhos. Marco, Stéfano e Yara, obrigada por terem aceito viver na caverna comigo por
tanto tempo! Amo muito vocês! =) Obrigada mãe, pai e minha querida irmã, cunhado e
sobrinhos. Amo muito vocês também! Obrigada meus sogros, cunhadas, cunhados e sobrinhos.
Vocês são muito especiais em minha vida! Obrigada por tudo e sinto saudades de todos!
Nota: A autora agradece à Fundação de Amparo à Pesquisa do Estado de São Paulo
(FAPESP) pela concessão de bolsa de estudos para o desenvolvimento deste projeto de
pesquisa.
viii
ACKNOWLEDGMENTS
Really, writing a dissertation may look like a lonely job, but it is indeed a teamwork process. I
want to offer gratitude and appreciation to wonderful special people who helped and supported
me during these last years of my life.
A special thank you to my board of advisors who directly impacted in this work, especially
Barb Flynn. I cannot say how many days and nights she spent reading and helping me with my
work. Thank you so much Barb! From the bottom of my heart, you have taught me much more
that professional and academic skills, you are a role model of person, mother, wife, and of
course, a professional role for me. Thank you so much for the opportunity to work so close to
you, and to be such a special person and dear friend. Thank you for taking such good care of
my family and me, for allowing us to join your family in so many important occasions, thank
you so much for everything, I feel very special and fortunate for having your trust, time, and
friendship. Thank you Jim Flynn, too! =)
A special thank you to Mohan Tatikonda, who had always inspired and encouraged me. Your
words and ‘big picture’ view were extremely important to me in many challenging moments
of this work. Thank you for encouraging my crazy thoughts! I feel very fortunate to have the
opportunity to work together with you, thank you.
Prof. Luiz Brito, thank you very much for all the opportunities. Thank you for had trusted,
encouraged, and challenged me. I can still remember the first e-mails, conversation, and
selection process. Thank you for giving me the opportunity to start this journey, to helped and
supported me in so many different moments, and to supporting this happy end. Thank you!
I want to acknowledge my gratitude for all my professors in this journey: João Mario Csillag,
Ely Paiva, Susana Pereira, Luiz Carlos di Serio, Renato Orsato, Laredo, Rafael Alcadipani, and
Prof. Thomas Choi, who among several other important academic skills, taught me that a paper
needs a ‘soul’. I took that advice very seriously! =)
Special thank you to my dear and super special friends. Few people can understand the
challenges of what live in a cave mean (internal joke =): Marcia Scarpin and Cris Biazzin. Love

ix
you a lot! =) To my dear friend Zé Carlos, who have always been present in many special
moments of this journey. To Liny, Michele, Jalba, Ronaldo, Priscilla, Jorge Scarpin, Tescari,
Chen, Veronica, Luciano, Guilherme and uncountable other special geek friends! =) Thank you
my Soka Gakkai International (SGI) friends in Brazil and USA.
Thank you to wonderful people at FGV-SP, in special Marcia Ostorero. I will try to not make
it public, but this is school would not be as great as it is without this wonderful person and
professional! Thank you! Bê, you are very special, too! <3
Thank you to wonderful people at Kelley School of Business too. Specially Lorna Griffin, Prof.
Ken Carow, Prof. Peggy Lee, and so many great people at the Office of International Affairs,
who helped and supported me in so many different ways.
A very special thank you to my interviewees. Thank you so much for your time and attention
during my data collection process. I had opportunity to talk to so many wonderful people that
I will be grateful forever! Thank you! Special thank you to very special people on ABIHPEC
and ABC, the cosmetics associations, whose contacts were extremely valuable on my research
journey.
Thank you for all love and patience from my family, especially my husband, Marco, and my
kids, Stefano and Yara, who had to live in a cave with me for so long! Thank you mom, Regina,
and dad, Ireneu, my dear sister Marcele, Chris, and my beloved Dani and Cedric. Love you so
much!!! <3 Thank you to my in-laws and extended family for always showing support and
encouragement.

x
“A great human revolution in just a single
individual will help achieve a change in the
destiny of a nation, and, further, will enable a
change in the destiny of all humankind.”
Daisaku Ikeda

xi
ABSTRACT
This dissertation aims at understanding complex multi-tier, multi-dimension supply chains,
investigating why and how an event in a focal firm affects members of its own and other supply
chains. To fulfill this goal, two approaches were used, a theoretical and an empirical approach. For
the theoretical study, we developed a novel way to look at dissemination of the impact of an event
over a supply chain through metaphorical transfer. We built upon the physics of stone skipping,
analyzing the correspondence between elements from physics and supply chains at the levels of
ontology, analogy, and identity. The main contributions of the theoretical study were the
development of six propositions and a model of dissemination of the impact of an event over a
supply chain. Second, we applied the propositions using a set of qualitative data collected in the
cosmetics industry in Brazil. We conducted 131 semi-structured in-depth interviews and 22 site
visits, in addition to observation and analysis of documents. The multiple case studies were based
on six complex, multi-tier, multi-dimension supply chains encompassing up to seven tiers each.
Within and cross-case analysis were conducted. The results of the empirical study are presented in
two parts. First, we analyzed the six supply chains in detail and identified six mid-range events that
had impacts beyond the source firm. Second, we tested the propositions from the theoretical part
of this study and their application to the identified mid-range events. Our results indicated that,
differently from the current literature, supply chains are not linear. In multi-tier, multi-dimension
supply chains, the same firm can play different roles according to the supply chain it is part of
different times. Thus, supply chains are better portrayed as a set of interlocking networks. Our
findings also support viewing a supply chain as a chain of individual relationships. Several
elements impact the dissemination of the impact of an event over a supply chain. Among them,
power of the source firm and the personal social influence of the individuals in the source firm play
a significant role. In addition, because individuals make decisions and implement events, it is
important to consider that personal heuristics, biases, and locus of control will be manifested by
the individuals in all contexts, both internal (focal firm), and external (supply chin links), and that
those human irrationalities will impact the perception of the event and influence the continuity and
extent of its impact in the supply chain. Our findings also support the notion that the impact of an
event is disseminated over a supply chain through its members’ weak ties.
Key words: Multi-tier Supply Chains; Metaphorical Transfer; Multiple Case Studies, Behavioral
Operations, Social Network Theory.

xii
RESUMO
Esta tese objetivou compreender cadeias de suprimento multi niveis e multi dimensionais, investigando
como e porque um evento em uma empresa focal afeta membros de sua propria cadeia de suprimentos
e outras cadeias. Para atender este objetivo, duas abordagens foram utilizadas: uma teórica e uma
empírica. Para o estudo teórico, desenvolvemos uma nova forma de olhar a disseminação do impacto
de um evento na cadeia de suprimentos utilizando transferência metafórica. Nos baseamos na física de
pedras que saltam na água, analisando a correspondência dentre os elementos da física e das cadeias de
suprimentos nos niveis de ontologia, analogia e identidade. A principal contribuição do estudo teórico
reside no desenvolvimento de seis proposições e um modelo para a disseminação do impacto de um
evento na cadeia de suprimentos. Em seguida, nós aplicamos tais proposições numa base de dados
coletada no setor de cosméticos no Brasil. Foram conduzidas 131 entrevistas em profundidade e 22
visitas à fábricas e unidades de negócio por todo o país. Complementarmente também foram conduzidas
observações e análise de documentos secundários. Estudos de casos múltiplos individuais e
comparativos foram desenvolvidos baseados em seis cadeias de suprimentos complexas, multi-niveis e
multi-dimensionais, que englobaram de cinco a sete niveis cada uma. Os resultados foram apresentados
em duas partes. No primeiro, anlisamos as seis cadeias de suprimentos em detalhes e identificamos seis
eventos de médio porte que tiveram impactos em suas cadeias de suprimentos além da empresa focal
onde foi iniciado. Em seguida, aplicamos as proposições do estudo teórico nos eventos de médio porte
identificados. Nosso resultados indicaram que, diferentemente da literatura, cadeias de suprimentos não
são lineares. Em condicões reais, a mesma empresa pode representar diferentes papéis de acordo com
a cadeia de suprimento que ela é parte em diferentes momentos. Assim, cadeias de suprimentos são
melhor representadas como um conjunto de redes interligadas. Nossos achados também suportam a
visão de cadeias de suprimentos como uma rede de relações individuais. Vários diferentes elementos
influenciam na disseminação do impacto de um evento em uma cadeia de suprimentos, dentre eles, o
poder da empresa e a habilidade de influência social dos indivíduos que fazem parte daquela empresa
têm papel relevante. Também é importante considerar que irracionalidades pessoais como heurísitcas,
vieses, e locus de controle serão manifestados por indivíduos em todos os contextos, interno (empresa
focal) e externo (cadeia de suprimentos), e que tais irracionalidades impactam a percepção do evento,
a continuidade e extensão de seus impactos na cadeia de suprimentos. Nossos achados ainda suportam
a noção de que o impacto de um evento é disseminado na cadeia de suprimentos por meio dos laços
fracos construídos pelos membros das organizações.
PALAVRAS-CHAVE: Cadeia de Suprimentos Multi-níveis; Tranferência Metafórica; Estudos de
Caso Múltiplos; Operações Comportamentais; Teoria de Redes Sociais.

xiii
ILLUSTRATIONS
TABLES
Table 1: Dissertation Goals ................................................................................................. 32
Table 2: Heuristics and main biases ..................................................................................... 54
Table 3: Ontology ............................................................................................................... 63
Table 4: Analogy................................................................................................................. 65
Table 5: Analogy for the stone ............................................................................................ 71
Table 6: Analogy for throw ................................................................................................. 76
Table 7: Analogy for collision ............................................................................................. 82
Table 8: Analogy for reaction force formula ........................................................................ 87
Table 9: Analogy for bounces.............................................................................................. 92
Table 10: Analogy for sink .................................................................................................. 94
Table 11: Propositions ....................................................................................................... 100
Table 12: Contact generation for snowball sampling ......................................................... 107
Table 13: Interview protocol ............................................................................................. 114
Table 14: Characteristics of the focal firms ....................................................................... 120
Table 15: Firms by supply chain position .......................................................................... 121
Table 16: Firms by type of product or service .................................................................... 123
Table 17: Firms by region (ABIHPEC, 2014) .................................................................... 123
Table 18: Firms by size and comprehensiveness. ............................................................... 124
Table 19: Overview numbers of interviews and informants ............................................... 126
Table 20: Within-case analysis: one-page overview........................................................... 133
Table 21: Data accounting log ........................................................................................... 141
Table 22: “Golden Sheet” structure of information about the firm ..................................... 143
Table 23: “Golden Sheet” structure of information about the interview ............................. 143
Table 24: “Golden Sheet” structure information about the person ...................................... 144
Table 25: “Golden Sheet” structure of the contact information .......................................... 144
Table 26: Chain of evidence .............................................................................................. 147
Table 27: Main differences between cosmetics and dermocosmetics ................................. 154
Table 28: Focal firms’ channels of distribution .................................................................. 158

xiv
Table 29: Meaning of the shapes in the supply network representations............................. 159
Table 30: Meaning of the colors in the supply network representations ............................. 160
Table 31: Identified mid-range events ............................................................................... 198
Table 32: Tiers impacted by each mid-range event analyzed in this section ....................... 200
Table 33: Informants and firms impacted by D1’s acquisition ........................................... 204
Table 34: Pity-Pat Effect for D1’s acquisition ................................................................... 207
Table 35: Informants and firms impacted by D1’s event in marketing and sales director ... 211
Table 36: Pity-Pat Effect of D1’s new marketing and sales director ................................... 213
Table 37: Informants and firms impacted by the commercial disagreement ....................... 232
Table 38: Pity-Pat Effect for B1’s commercial disagreement with PRO ............................. 236
Table 39: Mid-range events investigated and related propositions ..................................... 250
Table 40: Similarities and differences between the supply base evaluation of B3 and B4... 256
xv
FIGURES
Figure 1: Mediation of individual characteristics in the decisions made ............................... 24
Figure 2: DaVinci sketch of turbulent flow .......................................................................... 25
Figure 3: Events as results of decisions ............................................................................... 27
Figure 4: Behavioral operations papers by year ................................................................... 28
Figure 5: Relationships between individuals and firms ........................................................ 29
Figure 6: Growth of the cosmetics industry in Brazil ........................................................... 35
Figure 7: Top 15 countries in cosmetics consumption.......................................................... 36
Figure 8: Dissertation structure............................................................................................ 37
Figure 9: Illustration of a supply chain. ............................................................................... 39
Figure 10: Supply chain network ......................................................................................... 40
Figure 11: Risk categorization scheme ................................................................................ 43
Figure 12: Levels of supply chain ........................................................................................ 45
Figure 13: Types of buyer and supplier relationships ........................................................... 48
Figure 14: Skipping of a round bottom shaped stone (left=simulation, right=experiment) .... 67
Figure 15: Skipping of a flat bottom shaped stone (left=simulation, right=experiment) ....... 67
Figure 16: Throw of a stone representation .......................................................................... 72
Figure 17: Analysis of stone skipping. ................................................................................. 78
Figure 18: Collision process of a flat stone encountering a water surface ............................. 81
Figure 19: Schematic view of the collision pre-bouncing process ........................................ 83
Figure 20: Ripples formed by stone collisions with the water .............................................. 85
Figure 21: Snapshot of a stone-water collision..................................................................... 86
Figure 22: Snapshots of a stone skipping simulation ............................................................ 87
Figure 23: Pity-Pat effect .................................................................................................... 90
Figure 24: Forces acting on a stone ..................................................................................... 93
Figure 25: Graphical representation of propositions........................................................... 101
Figure 26: The physics of stone skipping ........................................................................... 102
Figure 27: Model of the dissemination of the impact of an event in a supply chain ............ 103
Figure 28: Embedded case design...................................................................................... 106
Figure 29: Snowball contact generation ............................................................................. 108
Figure 30: Examples of beauty products and dermocosmetics products ............................. 110
Figure 31: Comparison of researched vs. total cosmetics firms .......................................... 124

xvi
Figure 32: Main job titles interviewed ............................................................................... 127
Figure 33: Informants by perspective ................................................................................ 128
Figure 34: Final chart of the process to start analyzing the results of the collected data...... 135
Figure 35: Network representation of researched supply chains ......................................... 159
Figure 36: Position of D1 and D2 ...................................................................................... 161
Figure 37: Interlocking relationships in dermocosmetics supply chains ............................ 162
Figure 38: Number of informants in each tier for D1’s supply chain .................................. 164
Figure 39: Network representation of D1 supply chain ...................................................... 165
Figure 40: Upstream network illustration for D1’s supply chain ........................................ 166
Figure 41: Downstream network illustration of D1’s supply chain ..................................... 168
Figure 42: Number of informants in each tier of D2’s supply chain ................................... 169
Figure 43: Network representation of D2’s supply chain ................................................... 170
Figure 44: Upstream network illustration of D2’s supply chain ......................................... 171
Figure 45: Downstream network illustration of D2’s supply chain ..................................... 173
Figure 46: Beauty products firms highlighted in the researched supply chains ................... 174
Figure 47: Network representation of beauty products supply chain .................................. 177
Figure 48: Number of informants in each tier of B1’s supply chain ................................... 178
Figure 49: Network representation of B1’s supply chain.................................................... 178
Figure 50: Brazilian biomass areas .................................................................................... 180
Figure 51: Upstream network illustration of B1’s supply chain.......................................... 181
Figure 52: Downstream network illustration of B1’s supply chain ..................................... 182
Figure 53: Number of informants in each tier of B2’s supply chain ................................... 183
Figure 54: Network representation for B2 supply chain ..................................................... 184
Figure 55: Upstream network illustration of B2’s supply chain.......................................... 185
Figure 56: Downstream network illustration of B2’s supply chain ..................................... 186
Figure 57: Number of informants in each tier of B3’s supply chain ................................... 188
Figure 58: Network representation of B3 supply chain ...................................................... 189
Figure 59: Upstream network illustration of B3’s supply chain.......................................... 190
Figure 60: Downstream network illustration of B3’s supply chain ..................................... 192
Figure 61: Number of informants in each tier of B4’s supply chain ................................... 193
Figure 62: Network representation of B4’s supply chain.................................................... 194
Figure 63: Upstream network representation of B4’s supply chain .................................... 196
Figure 64: Downstream network representation of B4’s supply chain ................................ 198
Figure 65: Ripples Effect illustration for D1’s acquisition ................................................. 205

xvii
Figure 66: Pity-Pat Effect illustration for D1’s acquisition ................................................ 207
Figure 67: Ripples Effect illustration for D1’s change of marketing and sales director....... 210
Figure 68: Pity-Pat Effect for D1’s new marketing and sales director ................................ 213
Figure 69: The Ripples Effect illustration of D1’s new sales model ................................... 222
Figure 70: Kinetic Energy principle illustration for D1’s new direct sales model ............... 225
Figure 71: Illustration of the exclusivity of the event ......................................................... 227
Figure 72: Timeline for imported chemical products ......................................................... 230
Figure 73: The ripples effect for B1 and PRO’s commercial disagreement ........................ 234
Figure 74: Pity-Pat Effect illustration for B1’s commercial disagreement with PRO .......... 236
Figure 75: Tiers impacted by PM 2186/2001 ..................................................................... 244
Figure 76: Kinetic energy principle illustration for PM 2186/2001 .................................... 247
Figure 77: Influence of the types of buyer and supplier relationships in competitive
advantage .......................................................................................................................... 257
Figure 78: A supply chain as a network of individual relationships.................................... 258
Figure 79: Practical model of dissemination of the impact of an event in a supply chain .... 268
Figure 80: Illustration of the events in D1’s supply chain that were discussed. .................. 272
xviii
TABLE OF CONTENTS
1 INTRODUCTION............................................................................................................ 21
1.1 RESEARCH QUESTION AND GOALS ............................................................................. 29 1.2 MOTIVATIONS ............................................................................................................ 33
1.3 INDUSTRY .................................................................................................................. 34 1.4 DISSERTATION STRUCTURE ......................................................................................... 36
2 THEORETICAL FOUNDATIONS .................................................................................. 38
2.1 SUPPLY CHAIN MANAGEMENT RESEARCH ................................................................... 39
2.2 THEORETICAL FOUNDATIONS ...................................................................................... 44 2.2.1 Macro Level ....................................................................................................... 44
2.2.1.1 Social Network Theory ................................................................................ 44 2.2.2 Micro Level ........................................................................................................ 48
2.2.2.1 Heuristics and Biases ................................................................................... 50 2.2.2.2 Locus of Control .......................................................................................... 55
2.3 THEORETICAL DEVELOPMENT ..................................................................................... 56 2.3.1 Stone-Skipping in Physics................................................................................... 60
2.4 METAPHORICAL TRANSFER ......................................................................................... 62 2.4.1 Ontology ............................................................................................................. 62
2.4.2 Analogy .............................................................................................................. 63 2.4.2.1 Stone ............................................................................................................ 66
2.4.2.2 Throw .......................................................................................................... 71 2.4.2.3 Collision ...................................................................................................... 76
2.4.2.4 Bounces ....................................................................................................... 82 2.4.2.5 Sink ............................................................................................................. 93
2.4.3 Identity ............................................................................................................... 95 2.4.3.1 Propositions ................................................................................................. 95
2.4.3.2 Models ....................................................................................................... 101
3 METHODS .................................................................................................................... 104
3.1. EMBEDDED CASE DESIGN ........................................................................................ 104
3.1.2 Sampling .......................................................................................................... 106 3.1.3 Sub-Sectors....................................................................................................... 109
3.2 INSTRUMENTS .......................................................................................................... 111 3.2.1 Interview Protocol ............................................................................................ 111
3.2.2 Pre-Test ............................................................................................................ 115 3.2.3 Procedures ........................................................................................................ 116
3.2.4 Transcription and Translation ........................................................................... 116 3.2.5 Triangulation .................................................................................................... 117
3.3 INDUSTRY ................................................................................................................ 118 3.3.1 Focal Firms ....................................................................................................... 118
3.3.2 Supply Chains................................................................................................... 121

xix
3.3.3 Buyer and Supplier Relationships ..................................................................... 125 3.3.4 Individuals ........................................................................................................ 125
3.4 DATA ANALYSIS ....................................................................................................... 129 3.4.1 Within-Cases .................................................................................................... 129
3.4.1.1 Coding ....................................................................................................... 129 3.4.1.2 One-Page Overview ................................................................................... 132
3.4.1.3 Detailed Narrative ...................................................................................... 134 3.4.2 Cross Case Analysis ......................................................................................... 134
3.4.2.1 Social Network Analysis ............................................................................ 135 3.4.2.2 Master Table .............................................................................................. 136
3.4.2.3 Pattern Matching ........................................................................................ 136 3.5 ETHICAL ISSUES ....................................................................................................... 137
3.6 RELIABILITY AND VALIDITY ..................................................................................... 139 3.6.1 Reliability ......................................................................................................... 139
3.6.1.1 Stability ..................................................................................................... 139 3.6.1.2 Replicability............................................................................................... 142
3.6.1.3 Accuracy .................................................................................................... 145 3.6.2 Validity............................................................................................................. 145
3.6.2.1 Construct Validity ...................................................................................... 146 3.6.2.2 Internal Validity ......................................................................................... 148
3.6.2.3 External Validity ........................................................................................ 148 3.7 DATA MANAGEMENT................................................................................................ 149
4. RESULTS AND DISCUSSION ................................................................................ 151
4.1 WITHIN CASE ANALYSIS ........................................................................................... 152
4.1.1 Network Representation of the Supply Chains .................................................. 158 4.1.2 DERMOCOSMETICS SUPPLY CHAINS ....................................................................... 161
4.1.2.1 Case One: Dermocosmetics 1 (D1) ................................................................ 164 4.1.2.2 Case Two: Dermocosmetics 2 (D2) ................................................................ 169
4.1.3 BEAUTY PRODUCTS SUPPLY CHAINS ...................................................................... 174 4.1.3.1 Case Three: Beauty 1 (B1) ............................................................................. 177
4.1.3.2 Case Four: Beauty 2 (B2) ............................................................................... 183 4.1.3.3 Case Five: Beauty 3 (B3) ............................................................................... 187
4.1.3.4 Case Six: Beauty 4 (B4) ................................................................................. 192 4.1.4 Identified Mid-Range Events ............................................................................ 198
4.2 CROSS-CASE ANALYSIS: DISSEMINATION OF THE IMPACT OF EVENTS IN MULTI-TIER,
MULTI-DIMENSION SUPPLY CHAINS ............................................................................... 199
4.2.1 Events in D1’s Supply Chain ............................................................................ 201 4.2.1.1 D1 Acquisition by an Investment Group..................................................... 202
4.2.1.2 D1´s New Marketing and Sales Director .................................................... 208 4.2.1.3 D1’s New Sales Model ............................................................................... 216
4.2.1.4 Other Events in D1’s Supply Chain: No Impact Perceived ......................... 226 4.2.2 Events in B1’s and Adjacent Supply Chains ..................................................... 228
4.2.2.1 B1: Commercial Disagreement................................................................... 231 4.2.2.2 B4: New Projects Allocation to PRO .......................................................... 237
4.2.3 Legislation Event .............................................................................................. 240 4.2.3.1 Legislation Event: PM 2186/2001 .............................................................. 241
5. CONCLUSIONS ........................................................................................................... 251

xx
5.1 GOAL FULFILLMENT ................................................................................................. 251 5.2 RESEARCH QUESTION ............................................................................................... 252
5.3 KEY FINDINGS .......................................................................................................... 253 5.4 UNEXPECTED FINDINGS ............................................................................................ 261
5.5 ACADEMIC CONTRIBUTIONS ..................................................................................... 265 5.6 PRACTICAL CONTRIBUTIONS ..................................................................................... 267
5.7 FUTURE STUDIES ...................................................................................................... 268 5.6 LIMITATIONS ............................................................................................................ 271
REFERENCES ................................................................................................................. 274
APPENDIX A: INTERVIEW PROTOCOL .............................................................................. 285
APPENDIX B: IRB APPROVAL ......................................................................................... 287 APPENDIX C: INFORMED CONSENT ................................................................................. 290
Informed Consent In Portuguese ................................................................................ 293 APPENDIX D: GOLDEN SHEET BASIC DATA FOR RESEARCHED FIRMS............................... 296
APPENDIX E: GOLDEN SHEET BASIC DATA FOR RESEARCHED INFORMANTS .................... 300 APPENDIX F: LIST OF FINED COMPANIES IN “OPERATION NEW DIRECTION II” BY IBAMA305
APPENDIX G: MAIN BIASES AND HEURISTICS PERCEIVED IN EACH EVENT.......................... 306
21
1 INTRODUCTION
“There is nothing so practical as a good theory”
Kurt Lewin
In this dissertation, we explore the theme of complex multi-tier, and multi-dimension supply
chains. We investigate why and how the impact of some events made in a firm are disseminated
through its supply chain and others are not. We considered the supply chains in both micro,
macro, and integrated levels. As micro level, we considered the individuals within the firms
with their complexities and irrationalities. It was important to take that in consideration,
because although the relationships in any supply chain are between firms, the decisions are
made by individuals. The macro level refers to supply chains with their multiple tiers and
connections among them. The integrated level refers to understanding how the micro and
macro level are connected and influence each other. To understand this phenomenon, we
conducted an in-depth qualitative study, which comprised 131 in-depth interviews, 22 site
visits, observations and document analysis. We investigated dissemination of the impact of
mid-range events over six multi-tier, multi-dimension supply chains in the cosmetics industry
in Brazil, which was selected due to its variety of firms and complexity of buyer and supplier
relationships, it is an industry with unusual characteristics (Singhal and Singhal, 2012).
Although most research in OM/SCM studies supply chains as linear, real supply chains are
embedded in complex networks (Kim, Choi, Yan, and Dooley, 2011). A supply chain is not
just a set of firms, individuals, or a relationship between two or three firms. Nor is it a linear
flow of resources and goods. Real supply chains are complex, multi-tier, and multi-
dimensional. They are multi-tier because to have a product or service delivered to a final
customer, it must go through several tiers of suppliers and buyers. Consider the trivial example
of buying a peach body lotion for a friend for her birthday. The tiers in that supply chain
22
include: the farmer who planted and harvested the peaches (raw material suppliers), the
chemical firm responsible for the R&D to come up with an ingredient to make the raw materials
usable in a cosmetic formula (raw material converters), the firm which develops a formula, a
brand, and everything else needed to meet the customer’s need (focal firm). The focal
organization will either buy from the raw material converter directly or through a middleman
in some cases. Also, that formula needs to go into a particular type of packaging. The raw
material suppliers in the packaging industry are usually large multinational firms, which sell
the raw material to a plastic firm, for example, which will make the packaging in the size and
shape the focal firm wants for its peach lotion. That packaging can come with the label printed
directly on the original packaging from the packaging supplier, or the focal firm can buy blank
packaging and hire a service from a printing firm to make the label, or it can even buy labels
as adhesives and put them on the packaging within its plant, adding another step to its
production process. Sometimes, the product will need to be put in a box or other secondary
packaging, which may add more suppliers and more steps in the process. Once the product is
ready to go to the customer, it will need logistics providers. They can either go to wholesalers
and then to retailers, or through other different sales channels, depending upon the focal firm´s
strategy. Then it comes to a customer decision in buying the peach lotion for her friend. She
may even want the opinion of a specialist, such as beautician or dermatologist. Thus, this supply
chain has multiple tiers.
In addition to multiple tiers, (the horizontal length of a supply chain), real supply chains are
also multiple dimensional, when there is an interlocking (vertical) relationship between supply
chains caused by shared elements. Firms in the same industry often have many suppliers in
common, such as the raw material suppliers, converters and some of the packaging suppliers.
The same firm might play different roles, depending upon which supply chain it is functioning
23
as part of at a specific time. For example, a large multinational chemical firm might be a first
tier supplier for another large firm and, at the same time, be a second or third tier supplier for
a smaller firm, which buys from wholesalers or middlemen. The same firm might also act as a
buyer or as a supplier. It is buyer if we consider the upstream direction of its supply chain and
a supplier if we consider the downstream direction of its supply chain. As suppliers deal with
different buyers in different firms, that same supplier may play a different role in different
supply chains. Thus, supply chains are also multi-dimension in addition to multi-tier.
Adding to these multi-tier and multi-dimension complexities of supply chains, we also need to
consider that within each and every firm there are individuals making and implementing
decisions. Bowman and Ambrosini (2000) understand that value perception applies to all
purchases, not just those of final consumers. “The same type of judgment, a subjective
judgment, is made by a manager when procuring inputs like machines and components, as by
an individual when buying a fridge or a car” (p. 3). Ito et al (2012) understand that unconscious
aspects as memory, perception, the creative and hidden side of the person influence in the
selection, use, evaluation, reflection and representation of person-product interaction ex-ante,
during and ex-post consumption, despite the fact that each product has its objective and
technical side, it still has the subjective, ludic, imaginative and fragmented side that influences
moods, feelings and emotions of consumers (p. 303) and can influence the WTP for it. In line
with the authors, Kahneman (2003) suggests that some choices are not directed related to
variations of quantity and cost, and that some heuristics or biases can mediate the way people
perceive objective issues, such as cost, quality, and delivery just to name a few. Several times
it could occur any psychological influence in how people evaluate and make decision,
especially related to individual cognitive aspects and Kahneman & Frederick (2002) showed
that judgment and preferences are not based primarily on information that was explicit

24
presented. Thaler (1985) suggest that people appear to respond more to perceived changes than
to absolute levels. Figure 1 represents the idea of individual characteristics mediating the
perception of competitive priorities and their impacts on the decisions made and implemented.
Figure 1: Mediation of individual characteristics in the decisions made
Because firms are connected to a larger network in a supply chain (Choi and Kim, 2008), it is
expected that an event initiated in a focal firm will impact other firms in that supply chain. That
impact may cause other impacts and other events causing turbulence in those supply chains, as
well. Turbulence was first documented by Leonardo DaVinci, about 500 years ago
(McDonough, 2004) and is illustrated in Figure 2. Turbulence is defined as a flow process with
a chaotic property change in the environment after an encounter or initiation (Falkovich and
Sreenivasan, 2006). Nobel Laureate Richard Feynman described turbulence as “the most
important unsolved problem of classical physics, stretching roughly from Archimedes to
Einstein” (Vergano, 2006).
Decisions

25
Figure 2: DaVinci sketch of turbulent flow
Source: McDonough, 2004
A phenomenon analogous to turbulence happens in a supply chain after the initiation of an
event in a focal firm. The impact of this event may be spread to its supply chain and beyond.
Many different kinds and sizes of events can occur in a firm. Some events are high frequency
and low impact events, like small changes and continuous improvement that must be made
continuously over the time to allow operational and financial improvements. On the other hand,
there are large low probability and high impact events, often in response to disasters (Hora and
Klassen, 2013). The latter type of event is the domain of special fields of studies like
humanitarian operations and crisis management.
We investigated the dissemination of the impact of an event over a supply chain, thus the high
probability and low impact events are not in the scope of this research. On the other hand,
although the low probability and high impact events are very important, the greater amount of
events a firm will need to manage are events of medium-probability and medium impact, which
we are calling mid-range events. We define a mid-range event as any that is not a high

26
probability, low impact event or a low probability, high impact event. Examples include a
change in the director or key person in a buyer-supplier relationship, a merger or acquisition of
another firm, the implementation of a new process or technology (e.g.: RFID or EDI), new
legislation, or a new internal purchasing policy.
In the OM/SCM research, there is extensive literature on high probability and low impact
events (Anand, Ward, Tatikonda, and Schilling, 2009). There is also an increasing amount of
research that has been done on low probability and high impact events (Hora and Klassen,
2013). However, there is not much published about mid-range events, with moderate
probabilities and moderate impacts.
As no firm exists in isolation in a supply chain, it is important to consider that an event in one
firm may be the impetus for events in other firms as well. Thus, we investigated the way that
an event in one firm leads to an impact over its supply chain. An event is the result of a
decision. It is important to note that some decisions will not have any impact over a supply
chain. Suppose that a firm analyzes its current situation and decides to make a change to its
purchasing policies. Until the new policy is implemented, it will have no impact on its supply
chain. Only after the new policy has been implemented in a firm, will we see impacts on its
supply chain or even in other ones1.
Figure 3 illustrates an event as a result of decisions and its impact in influencing other
decisions, which may generate other events and other impacts as well.
1 The impacts of an event in a purchasing policy in one of the researched focal firms is further explored in
Section 4.3.2

27
Figure 3: Events as results of decisions
It is also important to consider that an event which happens in one firm might not be perceived
in the same way by different individuals, both within that firm and across the other firms it
interacts with. Thus, in addition to understanding the macro level of the supply chains, it is also
important to understand the micro level, which is made up of the individuals and small groups.
Although the relationships in a supply chain are among firms, people, who are not fully rational
all the time, make decisions and implement events. As stated by Boyer and Pronovost (2010)
“we also publish thousands of mathematically based articles that make limiting assumptions
about ‘rational individuals’. I would like to meet some of these rational individuals, because I
don’t think I know any” (p. 370). Thus, understanding some of buyers’ and suppliers’
irrationalities that may influence them is important in understanding the dissemination of the
impact of an event over a supply chain.
The micro level focuses on human behavior in OM/SCM. Despite the importance of human
behavior for the development and performance of all firms, the fields of OM/SCM and Human
Resources Management have a long history of independent development (Boudreau, Hopp,
McClain, and Thomas, 2003). OM/SCM tends to make the assumption that individuals within
the operations systems are “fully rational or at least can be induced to behave rationally” (Gino
and Pisano, 2008). Bendoly et al (2006), believes that many different reasons could exist for

28
this gap, “but most have to do either a lack of awareness on the part of the OM decision maker
or a lack of applicability of the tools themselves”. The importance of including human behavior
in OM field of research is not recent; researchers such as Cummings (1977), Powell & Johnson
(1980) and Powell (1995) have called for this perspective as long as 35 years ago. Hopp´s
(2004) article on the 50th anniversary of Management Science journal and Boudreau et al.
(2003) issued similar calls. Since then, we have seen an increased attention to behavioral issues
in OM/SCM, especially in the last decade. Figure 4 indicates the increasing rate of behavioral
operations papers published among the core OM journals.
Figure 4: Behavioral operations papers by year
Source: ISI Web of Knowledge
On the flip side, even considering the uniqueness of each individual, each firm has its policies,
rules, and contractual relationships, which all the individuals within it are subject. Thus, the
relationship between firms and individuals is based on a constant interaction and mutual
impact, as illustrated in Figure 5.
24 5
16
23
1990 - 1995 1996 - 2000 2001 - 2005 2006 - 2010 2011 - 2013
Behavioral Operations Papers by Year
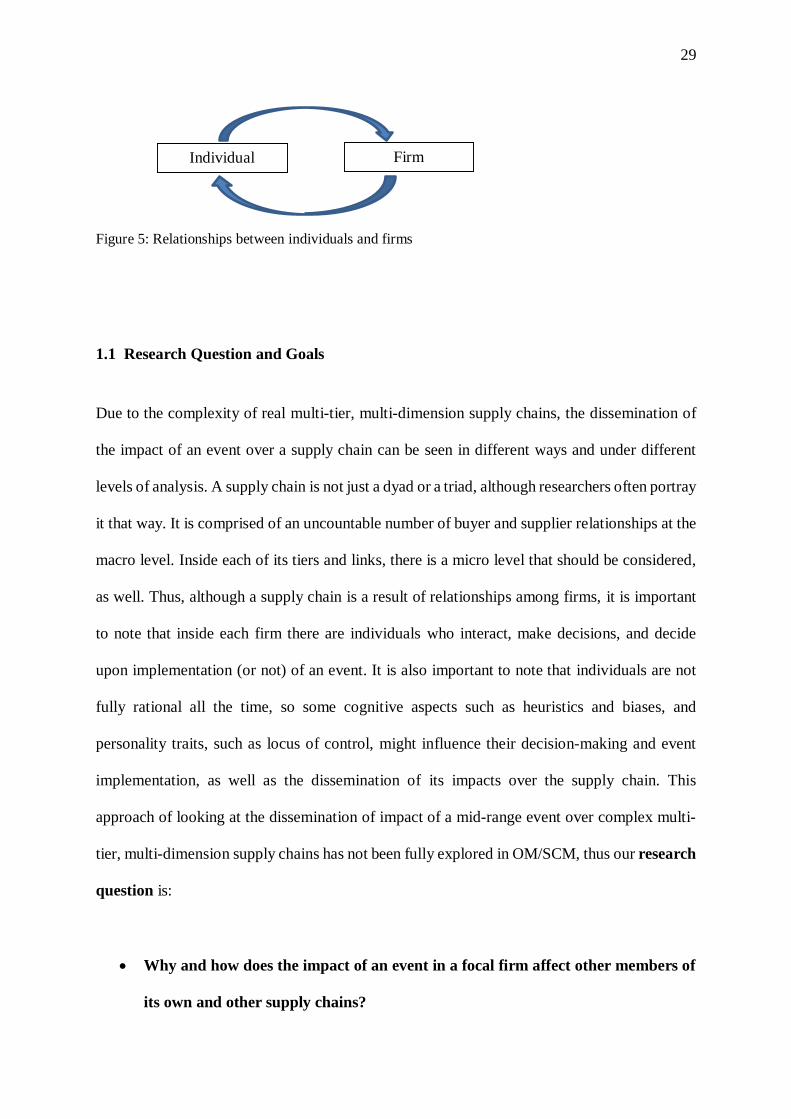
29
Figure 5: Relationships between individuals and firms
1.1 Research Question and Goals
Due to the complexity of real multi-tier, multi-dimension supply chains, the dissemination of
the impact of an event over a supply chain can be seen in different ways and under different
levels of analysis. A supply chain is not just a dyad or a triad, although researchers often portray
it that way. It is comprised of an uncountable number of buyer and supplier relationships at the
macro level. Inside each of its tiers and links, there is a micro level that should be considered,
as well. Thus, although a supply chain is a result of relationships among firms, it is important
to note that inside each firm there are individuals who interact, make decisions, and decide
upon implementation (or not) of an event. It is also important to note that individuals are not
fully rational all the time, so some cognitive aspects such as heuristics and biases, and
personality traits, such as locus of control, might influence their decision-making and event
implementation, as well as the dissemination of its impacts over the supply chain. This
approach of looking at the dissemination of impact of a mid-range event over complex multi-
tier, multi-dimension supply chains has not been fully explored in OM/SCM, thus our research
question is:
Why and how does the impact of an event in a focal firm affect other members of
its own and other supply chains?
Firm Individual
30
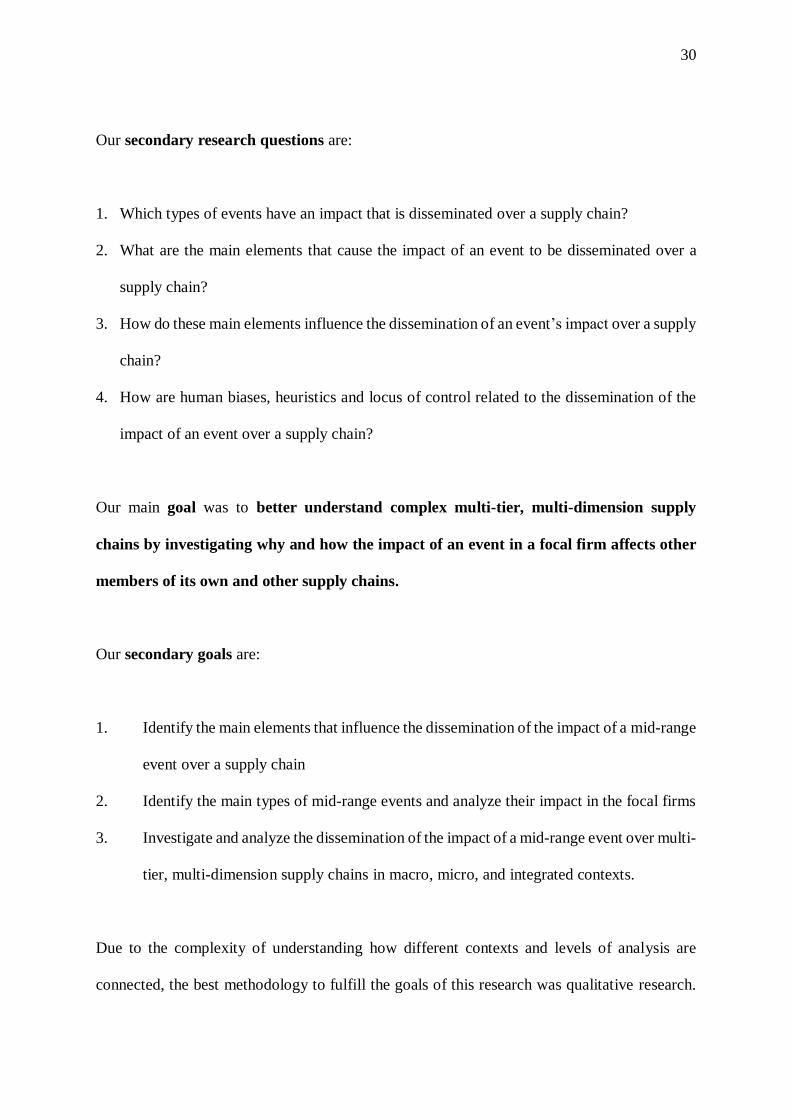
Our secondary research questions are:
1. Which types of events have an impact that is disseminated over a supply chain?
2. What are the main elements that cause the impact of an event to be disseminated over a
supply chain?
3. How do these main elements influence the dissemination of an event’s impact over a supply
chain?
4. How are human biases, heuristics and locus of control related to the dissemination of the
impact of an event over a supply chain?
Our main goal was to better understand complex multi-tier, multi-dimension supply
chains by investigating why and how the impact of an event in a focal firm affects other
members of its own and other supply chains.
Our secondary goals are:
1. Identify the main elements that influence the dissemination of the impact of a mid-range
event over a supply chain
2. Identify the main types of mid-range events and analyze their impact in the focal firms
3. Investigate and analyze the dissemination of the impact of a mid-range event over multi-
tier, multi-dimension supply chains in macro, micro, and integrated contexts.
Due to the complexity of understanding how different contexts and levels of analysis are
connected, the best methodology to fulfill the goals of this research was qualitative research.

31
We conducted 131 in-depth interviews (a total of 5,662 minutes), which were recorded and
then transcribed for analysis. In addition, 22 visits to manufacturing plants in the cosmetics
industry in Brazil were conducted. Further detail about reasons why we selected the cosmetics
industry is provided in Section 1.5.
In order to fulfill these secondary goals, we used several different methods and approaches.
To fulfill the first goal, we used a theoretical approach. We synthesized the literature review
and proposed the initial development of a new theoretical approach for understanding
dissemination of impact of an event over a supply chain. It was developed using metaphorical
transfer to generate ontology, analogy, and identity. We built upon the physics of a stone
skipping on the water to develop models and propositions (Section 2.4), which were further
tested, as described in Section 4.2.
To fulfill the second and third goals, we conducted empirical research, collecting data through
in-depth interviews, observations, site visits, and analysis of documents. In the Section 4.1 we
present multiple case studies of six multi-tier, multi-dimension supply chains, identifying the
main mid-range events that occurred in them. In Section 4.2, we investigate the impacts of
those events over the supply chains and test the propositions presented in Section 2.3.
Table 1 provides a summary of the research question and secondary goals. The strategies used
to fulfill each one of the goals, as well as their approaches and outcomes, are also presented.

32
Research Question: Why and how does the impact of an event in a focal firm affect other members of its own and other supply chains?
Secondary Goals Study
Approach Techniques Method Outcome Section
1 Identify the main elements that influence the dissemination
of the impact of a mid-range event over a supply chain Theoretical Literature Review
Metaphorical
Transfer
Models and
Propositions 2.4
2 Identify the main types of mid-range events and analyze their
impact in the focal firms Empirical
In-depth interviews,
observation, visits,
document analysis
Multiple Case
Studies
Descriptive
Case Analysis 4.1
3
Investigate and analyze the dissemination of the impact of a
mid-range event over multi-tier, multi-dimension supply
chains in micro, macro, and integrated contexts
Empirical
In-depth interviews,
observation, visits,
document analysis
Network
Analysis and
Multiple Case
Studies
Test of
propositions 4.2
Table 1: Dissertation Goals

33
1.2 Motivations
This study has several different motivations. As a practical motivation, it is important to
understand that mid-range events happen frequently in all types of firms. Thus, developing a
framework of the basic elements to be considered during the initiation of an event and being
able to understand and predict its supply chain impact will be valuable to managers in different
industries. This study also integrates the micro level (individuals) and the macro level (supply
chain) perspectives. Specifically, we examine the way that a mid-range event affects buyer-
supplier relationships and how its impact spreads over a supply chain. We consider
psychological influences, including heuristics and biases, as well as personality traits, such as
locus of control, and how they influence the dissemination of the impact of a mid-range event
over a supply chain.
As a theoretical motivation, this research responds to the call for the development of more
theory that is specific to the context of OM/SCM. The physics of stone skipping provides the
foundation for development of research propositions that will add theoretical insights to the
research on buyer-supplier relationships. Our theoretical approach is supported by several
theoretical perspectives, including social network theory, cognitive heuristics and biases, and
attribution theory in order to understand the role of buyers and suppliers in the dissemination
of the impact of a mid-range event over a supply chain.
As a methodological motivation, this paper uses a combined methodology. Multi-methods
analysis is important in developing and understanding “why” and “how” research questions.
Metaphorical transfer is used to align the physics of stone skipping with the dissemination of

34
the impact of a mid-range event over a supply chain. We follow Chen et al.’s (2013) approach
for development and transfer of a metaphor. This approach builds “through the invocation of
theory-constitutive metaphors and to ensure the proper borrowing and testing of theories from
outside OM/SCM” (Chen et al., 2013, p.580). We develop a theory-constitutive metaphor by
showing the ontological, analogical, and identity correspondence between stone skipping and
supply chain relationships. A set of six propositions and a model is developed.
Next, we use multiple case studies, combined with social network analysis, as suggested by
Kim, Choi, Yan, and Dooley (2011), to understand the relationships between firms, buyers,
and suppliers in supply chains. The social network analysis allows us to understand how the
data was organized and the interlocking relationships that emerged among the firms and
respondents. Finally, we use multiple case studies and social network analysis for testing the
propositions generated using the metaphorical transfer.
1.3 Industry
We studied the cosmetics industry in Brazil. This choice was based on the diversity and
complexity of its supply chains and buyer-supplier relationships, which offer unique
opportunities for the development of research in OM/SCM (Singhal and Singhal, 2012). The
use of a single industry allowed us to develop a deep understanding of it. The sample was
selected from firms within the cosmetics industry in Brazil, representing a variety of products
and services, operations complexity, relevance and location.

35
The Brazilian cosmetics industry has seen vigorous growth in the past decades, despite the
Brazilian economy’s slow growth. It has had a 10% average growth per year (over the past 17
years), comprising 3% per year of Brazil´s total GDP and 2.2% of manufacturing. Billing "ex-
factory", net of sales tax, increased from US$ 4.7 billion in 1996 to US$ 43 billion in 2013,
with a forecast of about US$ 51.7 billion for 2015 (ABIHPEC, 2014). Figure 6 shows the
growth of the cosmetics industry in Brazil, from 2000 to 2013, plus two years of forecasts (for
2014 and 2015).
Figure 6: Growth of the cosmetics industry in Brazil
* Forecast
Relative to the global cosmetics industry, Brazil occupies third place, just behind China and
the U.S. (Euromonitor, 2013). It is the largest market in the world in perfumes and deodorants,
second largest in hair products, men’s, children’s, bath products, depilatories and solar
protection, third largest in makeup and products for oral hygiene, and fifth in skin care. Brazil

36
represents 9% of the global cosmetics consumption. Figure 7 shows the top 15 countries in
cosmetics consumption, with values presented in US billion dollars.
Figure 7: Top 15 countries in cosmetics consumption
Source: Euromonitor (2013) and ABHIPEC (2014)
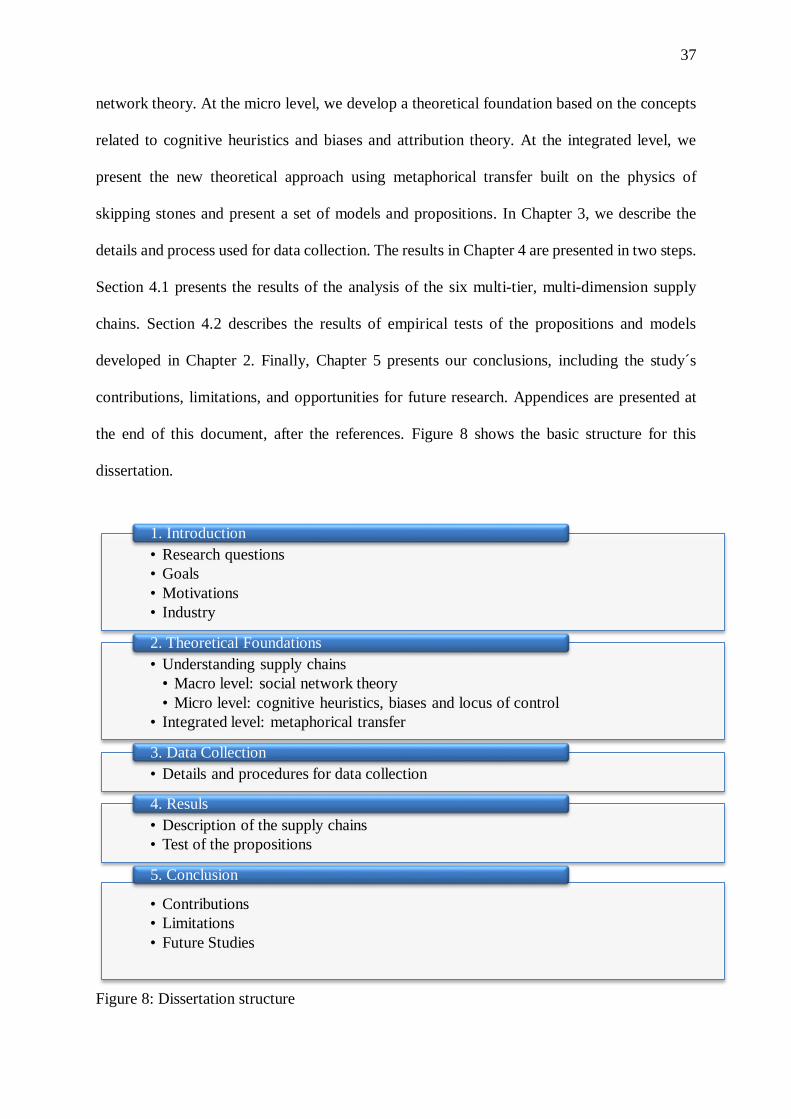
1.4 Dissertation Structure
This dissertation is divided in five main chapters. Chapter 1, which is this introduction, presents
the research questions, goals, and motivation for this research. Chapter 2 presents the
theoretical foundations, at the macro, micro level, and integrated level. At the macro level, we
present theoretical concepts related to supply chain management and their relationship to social
6.3
9.2
9.3
9.8
9.8
10.8
12.2
14.2
16.8
16.9
19.1
39.1
43
44.2
73.3
Australia
Canada
Spain
South Corea
India
Mexico
Italy
Russian
France
United Kingdom
Germany
Japan
Brazil
China
USA Deodorants
Fragrances 1st
Sunscreen
Children
Men’s
Hair Care
Bath
Depilatories
2nd
Oral Hygiene
Makeup 3rd
Skin Care 5th
Brazil represents
9% of the entire
world’s cosmetics
consumption
Billion dollars
37
network theory. At the micro level, we develop a theoretical foundation based on the concepts
related to cognitive heuristics and biases and attribution theory. At the integrated level, we
present the new theoretical approach using metaphorical transfer built on the physics of
skipping stones and present a set of models and propositions. In Chapter 3, we describe the
details and process used for data collection. The results in Chapter 4 are presented in two steps.
Section 4.1 presents the results of the analysis of the six multi-tier, multi-dimension supply
chains. Section 4.2 describes the results of empirical tests of the propositions and models
developed in Chapter 2. Finally, Chapter 5 presents our conclusions, including the study´s
contributions, limitations, and opportunities for future research. Appendices are presented at
the end of this document, after the references. Figure 8 shows the basic structure for this
dissertation.
Figure 8: Dissertation structure
• Research questions
• Goals
• Motivations
• Industry
1. Introduction
• Understanding supply chains
• Macro level: social network theory
• Micro level: cognitive heuristics, biases and locus of control
• Integrated level: metaphorical transfer
2. Theoretical Foundations
• Details and procedures for data collection
3. Data Collection
• Description of the supply chains
• Test of the propositions
4. Resuls
• Contributions
• Limitations
• Future Studies
5. Conclusion

38
2 THEORETICAL FOUNDATIONS
(…) “Middle range theories are a necessity if the process is to be kept
manageable, and representations such as metaphors are inevitable,
given the complexity of the subject matter”.
Karl E. Weick, 1989
This study has three main theoretical foundations, which help fulfill our goal of understanding
complex supply chains, investigating why and how an event in a focal firm affects other
members of its own and other supply chains. The first two goals are related to the spread of the
impact of a mid-range event through complex supply chains. We initially develop the
theoretical foundation for understanding the impact of a mid-range event in a supply chain, at
the macro, micro, and integrated level. At the macro level, which is the supply chain, we look
through the lens of social network theory. The initiation of a mid-range event is at the micro
level, the individuals, which we analyze through the lens of personal heuristics, biases, and
locus of control. At the integrated level, we built on the physics principles involved in stone
skipping, which we propose as a metaphor for the initial development of a theoretical approach
for understanding the impact of a mid-range event over a supply chain.

39
2.1 Supply Chain Management Research
A supply chain is a set of buyer and supplier relationships within and across firms. The term
supply chain management gained increased attention from a research point of view in the late
1990’s (Cooper, Lambert, and Pagh, 1997), and became very popular in OM/SCM publications
over the last decade (Burgess, Singh, and Koroglu, 2006). Increasing competitiveness,
globalized sourcing and multiple channels of sales have forced firms to become be better
integrated with their supply chain and help improve the performance of their suppliers and
buyers, reinforcing the premise that the success or lack of success of a firm is not just a matter
of how well it does in isolation. “One of the most significant paradigm shifts of modern
business management is that individual businesses no longer compete as solely autonomous
entities, but rather as supply chains” (Lambert and Cooper, 2000, p. 65). We follow Chen and
Paulraj´s (2004) definition of a supply chain as a network of materials, information, and
services processing links with the characteristics of supply, transformation, and demand (p.
119), as illustrated in Figure 9.
Upstream Downstream
Figure 9: Illustration of a supply chain.
Source: Chen and Paulraj (2004)

40
A supply chain is a complex phenomenon that involves the relationship among several firms
acting as buyers and suppliers at different moments of their relationship. A supply chain is
composed of a focal firm and a series of different tiers of upstream suppliers until the initial
raw material supplier, and a series of different tiers of upstream buyers until the final customer,
as illustrated in Figure 10.
Figure 10: Supply chain network
Source: Lambert and Cooper (1998)
In our research, we considered that supply chains are not just multi-tier, but that they are multi-
dimension as well. For example, in Figure 10, consider the focal firm. It is supplied by different
suppliers in its first tier (1,2,3,…n). At the same time, each of its suppliers has its own suppliers
as well. However, the same first tier supplier might play a different role in another supply chain,
depending upon several factors, such as the industry and the size of the focal firm. Although
the concept of a supply chain network has been used for almost two decades (Lambert and

41
Cooper, 1998), most research in OM/SCM refers to a supply chain as a linear relationship
between buyers and suppliers, focusing on a simplified conception of supply chains as dyads,
in order to isolate important relationships, with a few studies of triads starting to emerge (Choi
and Wu, 2009). Even in studies that consider a supply chain as an embedded network, the focus
tends to be either upstream or downstream. For example, Kim (2014) conducted research on
supplier network embeddedness using the social network perspective, targeting buyers as
prospective respondents.
In our study, we address this gap. In order to really understand a supply chain, it needs to be
analyzed as a multi-tier, multi-dimension entity, containing individuals who function as both
buyers and suppliers. We analyze multiple perspectives of buyer and supplier relationships
within and across supply chains. We analyze multiple tiers in the same supply chain and also
analyze the role of the same firm in different supply chains, adding interlocking relationships
between supply chains to supply chain research. We begin by looking at the mid-range events
at the micro level, and then how their impact is disseminated over a supply chain on a macro
level.
Because supply chains pass materials, other resources, and information forward and backward
(Mentzer, Keebler, Nix, Smith, and Zacharia, 2001) many firms are ultimately involved in the
delivery of a product to its final customer. From a focal firm’s perspective, upstream and
downstream links range from raw material and component producers to the final users, as the
product passes through assemblers, wholesalers, retailers, and transportation firms (La Londe
and Monster, 1994). There has been a substantial amount of research involving dyads between
buyers and suppliers from different firms, in different industries, and using different
methodological approaches (i.e. Karuppan and Ganster, 2004; Narayanan, Jayaraman, Luo, and

42
Swaminathan, 2011; Villena, Revilla, and Choi, 2011; Wu and Choi, 2005). A dyad consists
of two firms connected to each other (two nodes and a link). However, a supply chain involves
at least a set of three or more entities which are directly involved in the upstream and
downstream flow of resources, from a source to a customer (Mentzer et al., 2001). Thus,
considering this definition, at least a triad (three nodes, and at least two links) needs to exist in
a supply chain. Choi and Wu (2009) encouraged research on triads as the building blocks that
capture the essence of a supply network. However, the perspective that we use better represents
the complexity of a multi-tier, multi-dimension supply chain.
OM research has extensively studied the impact of small and continuous improvements in a
supply chain (Anand et al., 2009), which fall in the category of high probability and low impact
events. The understanding of these kinds of events is focused on studies on the development
of operational capabilities and maintenance of the competitiveness of firms (Peng, Schroeder,
and Shah, 2008).
At the other extreme, the impact of very significant events in a supply chain has also gained
increased attention (Hora and Klassen, 2013). These kind of events, which include catastrophic
events, can cause serious supply chains disruptions (Knemeyer, Zinn, and Eroglu, 2009) and
can be caused by intentional or unintentional causes. Most of the unintentional causes are
related to natural accidents, such as hurricanes, tornadoes and floods. There can also be
intentional disruptions, which may include theft, contamination/sabotage, or a terrorist attack
(Speier, Whipple, Closs, and Voss, 2011). Such low probability, high impact event pose
significant risk of disruptions in a supply chain.

43
The majority of the impact that a supply chain is subject to, however, is related to moderate
probability events and with a moderate impact, as illustrated in Figure 11. Examples of
moderate probability, moderate impact event, which we are calling mid-range events, include
a manufacturing firm moving from a traditional assembly line to a team-based cellular
manufacturing process, implementation of new software, or hiring a new CEO (Ford and
Foster-Fishman, 2012; Hannan and Freeman, 1984; Porras and Silvers, 1991). As no firm exists
in isolation, the dissemination of the impact of a mid-range event through a supply chain is
necessarily a complex phenomenon. All firms are related to their micro and macro
environments and to other firms, as well. Thus, it is important to consider that an event in a
firm, even a mid-range event, may have impact beyond its boundaries.
Figure 11: Risk categorization scheme
Source: The authors, based on Brindley (2004) and Knemeyer et al. (2009)
Conti
nuous
Impro
vem
ent
Impact in a Supply Chain
44
2.2 Theoretical Foundations
Supply chains can be examined from the macro and micro levels. The macro level refers to a
network of firms playing different roles in their supply chain channels. The micro level refers
to the individuals or small groups inside the firms that comprise the network. Our theoretical
background is based on both macro and micro levels. In addition, we included an integrated
level where we propose an integrated theoretical approach, using metaphorical transfer.
2.2.1 Macro Level
As the macro level we focus on multi-tier, multi-dimension supply chains. We build upon
social network theory as the basis for our analysis.
2.2.1.1 Social Network Theory
The concept of a supply chain as a network of interconnected firms was first highlighted more
than a decade ago (Lambert and Cooper, 2000). At the macro level, we use social network
theory constructs and follow Kim’s (2014) definition of a network as a “broad set of firms that
are motivated to accumulate tangible and intangible resources” (p.220). Social network theory
is built upon two fundamentals units: nodes and links. A node refers to actors or individuals
within the network. A link (or tie) is a connection between nodes.
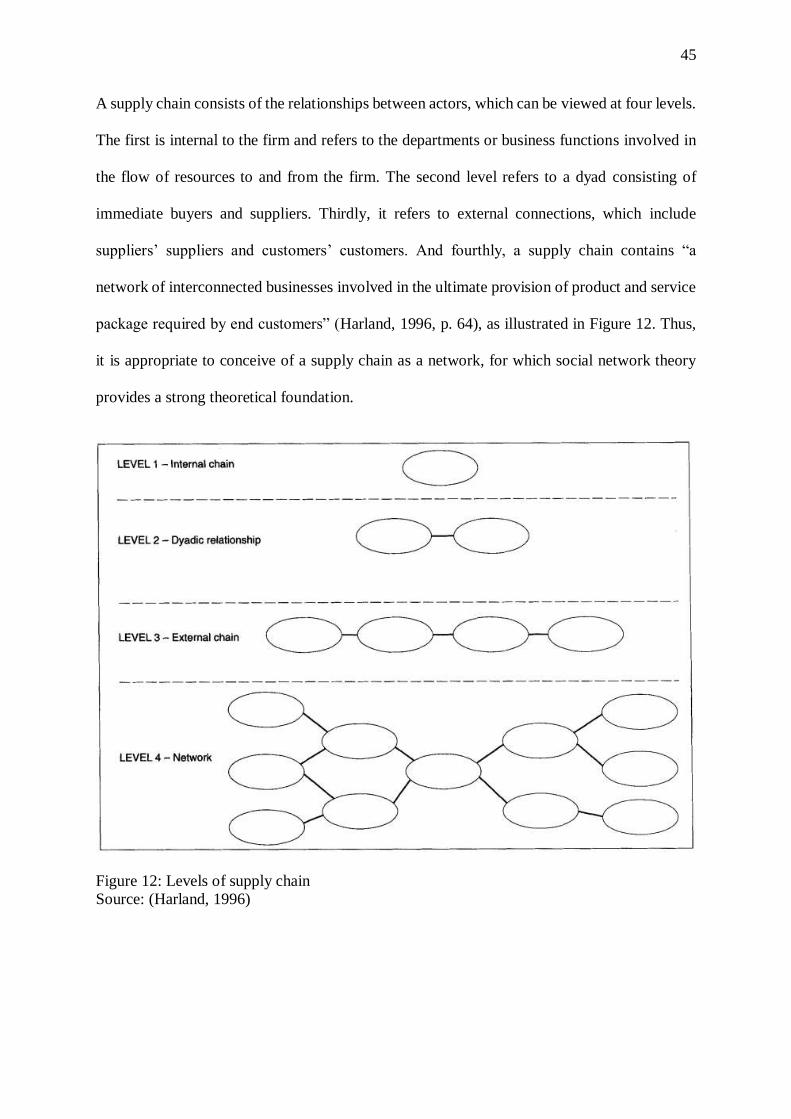
45
A supply chain consists of the relationships between actors, which can be viewed at four levels.
The first is internal to the firm and refers to the departments or business functions involved in
the flow of resources to and from the firm. The second level refers to a dyad consisting of
immediate buyers and suppliers. Thirdly, it refers to external connections, which include
suppliers’ suppliers and customers’ customers. And fourthly, a supply chain contains “a
network of interconnected businesses involved in the ultimate provision of product and service
package required by end customers” (Harland, 1996, p. 64), as illustrated in Figure 12. Thus,
it is appropriate to conceive of a supply chain as a network, for which social network theory
provides a strong theoretical foundation.
Figure 12: Levels of supply chain
Source: (Harland, 1996)

46
Social network theory focuses on the type of ties developed between the actors. Ties differ in
terms of interaction and strength of the relationship between entities. Interaction can be passive
or active. Passive interactions are relationships, which are obligatory in nature, without ongoing
social exchange between individuals (Marsiglio and Scanzoni, 1995). Active ties are
interactions where there is frequent communication.
The social network construct of strong ties and weak ties (Granovetter, 1973; Granovetter,
1983; Krackhardt, 1992) provides a suitable theoretical lens for understanding buyer and
supplier relationships. Strong ties are direct ties between individuals, when a close relationship
is developed. Strong ties between buyers and suppliers facilitate cooperation, collaboration,
and the development of new processes, products, and innovation (Bellamy, Ghosh, and Hora,
2014). However, strong ties may have a dark side as well, negatively impacting a buyer’s ability
to make effective decisions, as well as potentially increasing the supplier’s opportunistic
behavior (Villena et al., 2011).
Weak ties refer to the relationship between acquaintances or acquaintances’ acquaintances
(Granovetter, 1973). Thus, in a supply chain, a firm would have weak ties with its suppliers’
suppliers and with its buyers’ buyers. The “strength of weak ties” refers to the fact that “weak
ties are far more likely to be bridges than are strong ties” (Granovetter, 1983, p.208), providing
the firm with access to external information that it might not otherwise have. The challenge to
a firm relies, however, on its ability to properly manage its buyers and suppliers, building smart
strong ties, and facilitating the development of strategic weak ties.

47
The structure of the network is also an important construct in supply chain. As a way to increase
the understanding of supply chains at a broader level, social network theory and its importance
in understanding the structure and position of the firms in a supply chain has been gaining more
attention in the OM/SCM field recently (Kim, 2014; Schoenherr and Swink, 2012; Tsai, Raghu,
and Shao, 2013). Structural position refers to the position that a firm assumes in its supply
chain. A supplier’s position in a network is emerging as one of the most important aspects to
be considered in understanding a supply chain network and the performance of the buying firms
in that network (Kim, 2014). A central position of a firm allows it to have access to different
information through its upstream and downstream supply chain and the associated strong and
weak ties. It also plays an important role in connecting different directions of a supply chain or
even connecting different supply chains, acting like bridges. Structural embeddedness
addresses the importance of understanding the role of buyers and suppliers as embedded in a
larger supply network, rather than as existing in isolation (Choi and Kim, 2008; Kim et al.,
2011). For example, Bellamy, Ghosh, and Hora (2014) studied the structural characteristics of
supply networks and their relationship to innovation output.
Social network theory describes how social ties are developed and their impact on economic
outcomes (Granovetter, 1973; Granovetter, 1983; Krackhardt, 1992). The different types of ties
in a network also influence the type of relationships developed between buyers and suppliers.
A collaborative buyer and supplier relationship is strong and active, since it involves frequent
communication and interaction. Examples include joint product or process development or
improvement. Contractual buyer and supplier relationships are strong and passive, since they
involve constant exchange of resources, even though occur essentially by obligation between
the parties. Weak and passive ties may occur between the firm and its competitors, as well as

48
Inte
ract
ion A
ctiv
e
Pas
siv
e
with its customers’ customers and its suppliers’ suppliers. Weak ties and active relationships
may be exemplified by the arms-length buyer and supplier relationships, as illustrated in Figure
13.
Figure 13: Types of buyer and supplier relationships
In addition to looking at buyer supplier relations with a supply network (Harland, Lamming,
and Cousins , 1999), it is also important to examine relationships at the micro level, which
refers to the individuals within each firm. Thus, we included the micro level as part of our
research.
2.2.2 Micro Level
Individuals and small groups within a firm comprise the micro level for this research. Behind
every decision, which is made in a firm, there are individuals. Taking that in consideration, we
Arms-Length Collaborative
Competitive Contractual
Strong Weak
Strength

49
used buyers and suppliers as our research subjects and their decisions as one of the units of
analysis. These individuals’ behaviors will directly or indirectly impact the relationship among
the firms they represent. Therefore, like skipping stones in the water, the impact of an event
begins at the individual level, but spreads out to a firm and can subsequently have an impact
across its supply chain and even on other supply chains.
In analyzing the basic assumptions of decision making and its impacts, we use draw upon
behavioral operations research, which investigates the human behavior and cognition of
individuals and small groups and its impact on operating systems and processes (Bendoly,
Croson, Goncalves, and Schultz, 2010; Gino and Pisano, 2008). Over the last decade a body of
researchers studying human behavior in Operations Management field has grown fast. It is
called Behavioral Operations and is intrinsically linked to the influence of psychological
research in economics field (Behavioral Economics), which main works started with Herbert
Simon and its “bounded rationality” (Simon, 1955, 1956, 1957) questioning the “rational actor”
and then wide by many different experiments run by Daniel Kanhneman and Amos Tzversky
since late 1960’s and 1970’s until present days (Kahneman & Frederick, 2002a; Kahneman,
Knetsch, & Thaler, 1991; Kahneman & Tversky, 1972, 1979; Kahneman, 2003, 2011; Tversky
& Kahneman, 1974, 1986). The importance of their works regards on the fact that “Kahneman
and Tversky were convinced that the process of intuitive judgment were not merely simpler
than rational models demanded, but were categorically different in kind” (Kahneman &
Frederick, 2002a, p. 3).
Bendoly et al. (2010) suggest that the most appropriate theoretical foundation for Behavioral
Operations is cognitive psychology. Its main contribution is to offer more realism to research
findings, by taking into account emotional aspects, heuristics and cognitive biases in judgment
50
and decision making. Some of the most important researches in heuristics and biases was
conducted by Kahneman and Tversky, in the early 1970’s. They introduced psychological
issues into economic models, demonstrating their findings about how individuals make
decisions, in order to incorporate them into the traditional economic view. They explored
heuristics that individuals use and the biases they are prone to in different tasks related to
judgment under uncertainty, including making predictions and evaluation of evidence
(Kahneman, Slovic, and Tversky, 1982; Kahneman and Tversky, 1972, 1973; Tversky and
Kahneman, 1974). Their work and the work of others (Camerer, 1999; Loewenstein and Thaler,
1989; Thaler, 1981) was critical to the establishment of the behavioral economics field, whose
researchers investigate how and why individuals make decisions, rather than how they should
make them, and provides a theoretical and methodological basis for behavioral operations
research.
2.2.2.1 Heuristics and Biases
“The core idea of the heuristics and biases program is that judgment under
uncertainty is often based on a limited number of simplifying heuristics
rather than more formal and extensive algorithmic processing” (Gilovich, Griffin, and Kahneman, 2002, p. xv)
Heuristics are “rules of thumb” or cognitive shortcuts that individuals use in making decisions
when time and processing capacity are limited (Bingham and Eisenhardt, 2011; Gino and
Pisano, 2008; Newell and Simon, 1972; Tversky and Kahneman, 1974). Gino and Pisano
(2008) described the most useful heuristics and biases in the OM field. Carter et al. (2007)
identified 76 heuristics and biases and using cluster qualitative analysis, organized them into
nine categories.

51
Although these researchers and many others use the term “heuristics” and “biases” as though
they mean the same thing, heuristics and biases are not synonymous, and their categories
should not be used interchangeably (Kahneman and Tversky, 1979; Tversky and Kahneman,
1974). Heuristics simply come to mind, they are part of intuitive and automatic thinking
(Kahneman & Frederick, 2002; Kahneman et al., 1982). Tversky and Kahneman (1974) tied
heuristics to the “natural assessment” elicited by the task at hand that can influence judgment,
without being used deliberately or strategically. “Heuristics processes are not exceptional
responses to problems of excessive complexity or an overload of information, but normal
intuitive responses to even the simplest questions about likelihood, frequency, and prediction”
(Kahneman and Frederick, 2002; Tversky and Kahneman, 1983). They are part of intuitive and
automatic thinking (Kahneman and Frederick, 2002; Kahneman et al., 1982), and can be very
useful, fast and frugal. The main heuristics that are relevant to this research are: i) availability,
ii) representativeness, iii) anchoring and adjustment, and iv) loss aversion (Bar-Hillel, 1984;
Kahneman and Frederick, 2002; Kahneman, Slovic, and Tversky, 1982; Kahneman and
Tversky, 1979; Tversky and Kahneman, 1974), described in Table 2.
Although they can be very useful, heuristics also can lead to systematic and repeated errors,
known as biases (Tversky and Kahneman, 1974; Kahneman and Frederick, 2002). Each
heuristic can induce several different biases. For instance, the representativeness heuristic,
which is the tendency to assume commonality between objects of similar appearance, may
induce the tendency to believe that two variables co-vary when they do not (the illusory
correlation bias). For the availability heuristic, one common bias is imaginability. Imaginability
relates to the fact that, if an event can be easily imagined, it may be judged to have a higher

52
probability of occurrence than an event which is difficult to imagine. Overconfidence and
wishful thinking are related to this bias. Loss aversion may induce several biases, including the
status quo bias, which refers to the tendency to remain where they are, because the
“disadvantages of leaving the reference point seems larger than advantages” (Kahneman,
Knetsch, and Thaler, 1991). In a supply chain, for example, the status quo bias is illustrated by
a buyer’s difficulty in switching suppliers and the corresponding tendency to keep buying the
same products, services, and quantities from the same supplier.

53
Heuristic Biases References
Representativeness
Tendency to
assume
commonality
between objects
of similar
appearance
Base Rate Frequency
Tendency to stereotype, regardless
of the prior probabilities of the
categories
(Gilovich et al., 2002; Kahneman
et al., 1982; Tversky &
Kahneman, 1974)
Sample Size Intensity Judgment of a sample statistic
independent of sample size
(Kahneman & Frederick, 2002a;
Tversky & Kahneman, 1974)
Law of Small Numbers
Tendency to consider a small
sample as representative of the
population
Gino and Pisano, 2008;
Kahneman and Frederick, 2002a;
Tversky and Kahneman, 1974
Insensitivity to
Predictability
Tendency to ignore or underutilize
the range of predictions
Gilovich et al., 2002; Gino and
Pisano, 2008; Kahneman et al.,
1982; Tversky and Kahneman,
1974
Illusory Correlation Tendency to believe that two
variables covary, when they do not
Carter et al., 2007; Gino ans
Pisano, 2008; Tversky and
Kahneman, 1974
Misconceptions of
Regression
Tendency to make predictions
expecting exceptional results to
continue as if they were average
Tversky and Kahneman, 1974
Availability
Tendency to
judge an event is
likely or frequent,
depending on the
ease of recalling
or imagining it
Salient Information Tendency to weigh more vivid
information more heavily
(Gino & Pisano, 2008; Tversky &
Kahneman, 1974), Camerer, C., &
Loewenstein, G. (2004)
Confirmation Bias
Tendency to seek information
consistent with their views or
hypotheses
Imaginability
Overconfi
dence
Tendency to be more confident in
their own opinions than they ought
to be
Carter et al., 2007; Gino &
Pisano, 2008; Tversky &
Kahneman, 1974
Wishful
thinking
Tendency to assume that because
one wishes something to be true or
false, then it actually is

54
Heuristic Biases References
Anchoring and
Adjustment
Tendency to rely
too heavily, or
“anchor”, on one
trait or piece of
information when
making decisions
Insufficient Adjustment
Different start points yield
different estimates, which are
biased toward initial values.
Gino and Pisano, 2008; Tversky
and Kahneman, 1974, Ariely et
al, 2000
Evaluation of
conjunctive
and
disjunctive
events
Inconsistency Tendency to underestimate task-
completion times.
Gino and Pisano, 2008; Tversky
and Kahneman, 1974
Planning
fallacy
Inability to use a consistent
judgment strategy across a
repetitive set of cases or events.
Assessment
of Subjective
Probabilities
Distributions
Illusion of
control
Tendency to believe that one can
control, or at least influence,
outcomes that they demonstrably
have no influence over.
Loss Aversion
Tendency to
value more a loss
compared to a
symmetric gain
Endowment
Effect
Tendency to suffer more with the loss of specific
benefit compared to the value of a new situation
Kahneman and Tversky, 1979
Mental
Account
Tendency to differentiate money sources and
expenditures
Kahneman and Tversky, 1979;
Thaler, 1981, 1985; Thaler and
Sunstein, 2009
Hyperbolic
Discount
Tendency to react strongly to salient and
immediate events than to events in the future
Loewenstein and Thaler, 1989
Status Quo
Bias Tendency to remain where one is
Kahneman and Tversky, 1979;
Gino and Pisano, 2008
Framing
Effects
Tendency to judge a problem according to the
way is framed
Table 2: Heuristics and main biases

55
2.2.2.2 Locus of Control
The locus of control construct is a key element of attribution theory, which study the process
by which individuals explain the causes of behavior and events (Kelley and Michela, 1980). It
reflects whether individuals attribute the cause of an event to themselves or to their external
environment (Rotter, 1966). Individuals deal differently with events, depending on whether
their locus of control is internal or external. Those that have an internal locus of control take
more precautions and respond more rapidly to problems when they appear, because they
believe that most results rely on their own actions. Those who have an external locus of control
do not take as many precautions, provide late responses and blame others when a problem
occurs. For example, Simons and Baumann (1972, 2012) applied the locus of control concept
to explain why more people have died in tornados in Alabama than in Illinois (United States).
Their surveys of residents of four counties each in Alabama and Illinois indicated that Illinois
residents demonstrated an internal locus of control, which translated into taking more
precautions and being more prepared for a tornado. Alabama residents, on the other hand, who
were external in their locus of control, took fewer precautions for potential tornadoes, incurring
more deaths compared to Illinois (Simons and Baumann, 1972, 2012). The importance of locus
of control research has been addressed by authors in several fields (Judge and Bono, 2001; Ng,
Sorensen, and Eby, 2006). In OM/SCM research, Davis and Heineke (1994) considered the
customer’s locus of control and its impact on queue management and the customer’s intention
to return. Tranfield and Smith (2002) studied the impact of employees’ locus of control on
teamwork in manufacturing firms. Hong, Pearson, and Carr (2009) proposed a typology for
coordination of strategies for product development processes involving multiple suppliers,
based on locus of control. However, Harvey, Madison, Martinko, Crook, and Crook (2014)
argue that, although attribution theory (locus of control) has a high explanatory potential, it has
56
been underutilized by organizational scholars in general. Building upon this, we note that the
application of locus of control to supply chain management research has been rare.
2.3 Theoretical Development
The absence of theories specific to OM and SCM and inadequate attention to building theories
in these fields has been described for a long time (Flynn, Sakakibara, Schroeder, Bates, and
Flynn, 1990; Meredith, 1998). “Although recognized as vital to the prospects of any firm,
operations management suffers in at least some quarters because there is no recognized theory
on which it rests or for which it is famous” (Schmenner and Swink, 1998, p. 97). This is still
true today (Chen et al., 2013). Thus, the need and importance of more theorizing efforts aiming
at producing better and new theories that was initiated more than 25 years ago (Meredith, 1998)
remains a current problem (Carter, 2011).
A theory relates specific concepts, definitions, unique vocabulary, models, and testable
propositions (Kerlinger, 1986). Although the borrowing of theories from other disciplines,
especially from organizational behavior and economics, is common in OM/SCM (Ketchen and
Hult, 2007), simply applying theories from other fields to OM/SCM phenomena is not the same
as developing a theory that is unique to the OM/SCM context. As stated by Lewin (1951) and
reiterated by Van De Ven (1989), a good theory can be very valuable for both researchers and
practitioners. For researchers, a good theory can help the field to move “toward a more
57
systematic set of findings across studies”. For practitioners, a good theory offers rich
managerial findings and implications.
Carter (2011) points out three main reasons why OM/SCM has not probably generated a
substantial amount of its own theories so far. First, empirical research in OM/SCM is in an
earlier stage of development when compared to more mature counterpart fields, such as
management, economics, or marketing. Second, many doctoral programs in OM/SCM usually
focus on empirical research using “hard data” (p. 3) instead of qualitative and exploratory
studies using inductive data analysis. The third reason is related to second one, since most
associate editors who evaluate papers submitted to OM/SCM journals have not been trained to
do theory building research. Our research was based on theory building through an extended
qualitative study with inductive data analysis. We proposed what Kerlinger (1986) defines as
theory, “a set of interrelated constructs (concepts), definitions, and propositions that present a
systematic view of phenomena by specifying relationships between variables with the purpose
of explaining and predicting phenomena” (p. 9).
We highlight the importance of having unique theories developed for OM/SCM field because,
although very important to practice, OM/SCM as a research field still lacks unique theories
(Carter, 2011). This study addresses this deficit, using metaphorical transfer (Chen et al. 2013)
to develop a theoretical approach to understanding supply chain relationships. It is a response
to Schroeder (2008) that the “OM field has been weak on theory development that is
subsequently tested” (p. 354).
58
One useful way to develop theory is through the invocation of a metaphor. Weick (1989) points
out that metaphors are particularly useful in the development of middle range theories.
Compared to large or unified theories, middle range theories keep the process manageable, and
the use of representations and metaphors is informative. The use of metaphors to suggest or
make a link to the development of theory is widely used in many domains. For example,
consider the law of gravity. Isaac Newton described how he made the connection to the law of
gravity using the example of an apple falling on his head, while studying under an apple tree.
While the math behind the law of gravity is complicated, the trivial example of an apple – or
any other object falling on someone’s head - is very real and easy to understand. Stephen
Hawking developed his black hole theory and advanced the big bang theory about the
beginning of the universe through connecting very complicated physics principles about how
the universe has been expanding to the simple metaphor of mixing a coffee latte in one direction
and then in the opposite2 (Marsh, 2014).
A metaphor transfers understanding from a better-known “source” to a lesser-known “target”.
Another way to say this is that the “source” becomes a mental model used to understand the
“target.” Ortony (1993) describes three important characteristics of a useful metaphor: i)
compactness, ii) vividness, iii) ability to convey otherwise inexplicable or unnamable qualities.
Compactness is “transferring larger chunks of understanding in fewer words”. Vividness is
when “the source domain comes, as a whole, from direct sensory experience, it can be more
colorful, vibrant and dramatic, capturing one’s attention more so than a concept or abstraction
built up from recombined discrete events”. The ability to convey otherwise inexplicable or
unnamable quality is the idea that, “since the ‘real’ or literal qualities or inner workings of a
2 The described scenes can be visualized in the movie “The Theory of Everything”, which tells the story of the
physics Stephen Hawking. He held the same position as Isaac Newton in the Cambridge University and is
considered one of the most brilliant minds of the 20th century along with Albert Einstein.
59
subject may not be knowable to the speaker or listener (due to mutual lack of experience or the
lack of relevant words in their language), a metaphor provides description and explanation that
would be otherwise unattainable”. Examples include Juliet as the sun, atoms as mini-solar
systems, debates as war, time as money, and religion as the “opium of the individuals” (Steen,
2008, p. 213). Examples of metaphors used in the OM/SCM context include the rocks in the
river for exposed problems due to JIT’s reduced inventory levels, icebergs as cost management,
and a bullwhip as a metaphor for the effect of a customer order upstream in a supply chain.
These are all examples of what Chen, et al. (2013) refer to as casually invoked metaphors.
Although the use of a casually-invoked metaphor can be useful as a teaching strategy,
simplifying and illustrating a phenomenon, they are less useful in developing theory.
The use of metaphors has also been used to develop theories about firms (Morgan, 1980, 1983,
1997). The formal process of metaphorical transfer provides a basis for rigorously transforming
a casually invoked metaphor into a set of theoretical propositions to guide research. Thus, the
development of theory-constitutive metaphors provides a useful guide for borrowing and
testing of theories from outside OM/SCM. Properly developed metaphors can be very effective
for illustrating and translating complex analogies in organizational phenomena (Tsoukas, 1991;
Weick, 1989). We follow Chen, et al.’s (2013) guidelines for the use of metaphorical transfer
to develop operations and supply chain management (OM/SCM) theory. We propose the
physics of stone skipping as a basis for developing theory about understanding the
dissemination of impact of an event over a complex multi-tier, multi-dimension supply chain.
We propose the development of a new theoretical approach for understanding supply chain
turbulence, based on the dissemination of the impact of an event through a supply chain, using
metaphorical transfer. We selected physics as the science on which to base our metaphorical

60
transfer. Physics deals with the structure of matter and its motion through space and time. It is
concerned with all aspects of nature, on both the macroscopic and submicroscopic levels, along
with related concepts such as energy and force. Both managers and academic researchers deal
with the “structure of matter” and their “motion through space and time”. Managers’ concerns
refer to aspects of “[firms and supply chains’] nature” on both the macro (supply chain) and
micro (individual behavior) levels, along with related concepts, such as energy and force. Thus,
we use a physics phenomenon as a metaphor for developing propositions related to the
dissemination of the impact of an event in a supply chain.
2.3.1 Stone-Skipping in Physics
“There is still [a lot] to be learned from science for stone skipping... Back to your stones!”
With this statement, Clanet, Hersen, and Boucquet (2004, p.8) finish their paper which
scientifically investigated the physics phenomena behind the ancient art of skipping stones
across the water. We agree with Clanet et al. (2004) that there is still a lot be learned about the
science behind stone skipping, but not just in terms of physics. If we consider events that
happen in a firm and how their impact disseminates through its supply chain, we can relate
them to stone skipping. We use the physics of stone skipping as a theory constitutive metaphor
to develop theory for operations and supply chain management research.
Stone skipping is an appropriate metaphor for the dissemination of the impact of an event in a
supply chain, for several reasons. Stone skipping is compact because it is a relatively simple to
envision. It is vivid because it is colorful and easy to remember, as an adult remembers his or
her childhood experiences, and it explains otherwise inexplicable or unnamable qualities

61
because it exemplifies the dissemination of the impact of a stone through a set of visible points
in the water, serving as a reference for the dissemination of the impact of an event over a supply
a chain.
Although the art of skipping stones in the water has existed since ancient times, scientific
studies behind it are very recent. Boucquet (2003) made some basic assumptions about the best
throws, such as the best kind, form, and size of stone. In addition, he proposed a description of
the bouncing of the stone on the water in order to estimate the maximum number of bounces
achieved by the stone, though the estimation of its velocity, Reynolds number, lift force,
friction, and mass. He carefully studied the collisional process of a circular stone with the water
surface and stated the importance of its spin velocity in the estimation of the maximum number
of bounces. Clanet, Hersen, and Bocquet, (2004) performed a series of experiments on the
stone’s collision with the water, finding that there was what they called a “magic angle” of
about 20o that allowed the stone to perform the maximum number of bounces. Other studies of
stone skipping (Clanet, Hersen, and Boucquet, 2004; Humble, 2007; Rosellini, Hersen, Clanet,
and Bocquet, 2005; Xiao, 2010), illustrate the basic assumptions of its processes and phases.

62
2.4 Metaphorical Transfer
“The ancient art of stone-skipping may therefore benefit from modern scientific insight” (Clanet, Hersen, & Boucquet, 2004)
In this section, we fulfill the first secondary goal of this research, which was to identify the
main elements that influence the dissemination of the impact of a mid-range event over a supply
chain. A metaphorical transfer should “formally demonstrate conceptual similarity or
equivalence between the constituent elements of the metaphor and the target (phenomenon)”
(Chen, et al, 2013, p. 580). In order to do this, we developed the ontological, analogical, and
identity correspondence between stone skipping and dissemination of the impact of an event
through a supply chain. These provided the foundation for the development of research
propositions.
2.4.1 Ontology
Ontology is the logical correspondence between the constituent elements of the source and the
target phenomenon (the “whats”). In developing our ontology, we describe the basic elements
of stone skipping and how they correspond to the dissemination of the impact of an event
through a supply chain.
We developed ontology for the equivalence between the elements of stone skipping and the
dissemination of the impact of a mid-range event in a supply chain, shown in Table 3. The

63
basic elements of stone skipping are the stone itself, the throw, its collision with the water, the
bounces, and the sink. Similarly, the dissemination of the impact of a mid-range event in a
supply chain involves the event itself, the firm where it was initiated, the initial impact within
the firm, subsequent impact in the supply chain, and the end of its impact.
Stone skipping causes turbulence in the water. After the first and all subsequent impacts of the
stone, the property of the water surface changes. A similar phenomenon happens in a supply
chain after the initiation of an event whose impact goes beyond the source firm.
Stone Skipping Supply Chain
Element Definition Element Definition
Stone Object thrown into the water Event The original implemented decision in
a firm
Throw The act of releasing the stone Initiation The initiation of the event in the
source firm.
Collision Moment when the stone
touches the water Initial Impact Effect of the event in the source firm
Bounces Subsequent collisions Subsequent
Impacts
New events in other tiers of a supply
chain
Sink Moment when the stone
dives into the water Termination
Moment when the impact of the event
ceases
Table 3: Ontology
2.4.2 Analogy
Analogy is “the level where the “hows” and “whys” of the interrelationships among the
“whats” (elements) of the metaphor are verified as being equivalent to those of the target”
(Chen et al, 2013). Analogy is performed through establishing detailed equivalence between
elements of both phenomena.

64
To illustrate how stone skipping is related to dissemination of the impact of an event in a supply
chain, we use the example of an event in a firm’s top management team. This is based on a
case that we observed during our qualitative data collection. The firm hired a new marketing
and sales director, who implemented a number of new policies and procedural changes. For
each ontology element presented in Table 3, we developed a detailed equivalence between it
and the elements of the dissemination of the impact of a mid-range event in a supply chain,
which is shown in Table 4.

65
Stone Skipping Supply Chain
Element Characteristic Measure Element Characteristic Measure
Stone
Shape Round and flat
Event
Type Strategic
Size Radius (R) Scope
Mid-range (intermediate
probability, intermediate
impact)
Thickness Height (h) Importance High
Weight Mass (m) Urgency High
Throw
Translational velocity Linear velocity (U)
Initiation
Source firms power Medium to high
Rotational velocity (kick) Spin velocity (W) Person’s personal social
influence High
Collision
Impact angle Angle (ø)
Initial impact
Personal heuristics and
biases High
Personal locus of control Internal
Gyroscopic effect Torque (t) Buyer-supplier relationship Strong
Water surface/ Friction (f) Mass density Context Incentives and/or obstacles
Bounces
Lift force (Flift) Number of bounces (∑)
Subsequent
impacts
Contagion Number of tiers impacted
Reaction force F = f (Flift, V, Ffriction) Impact Impact = f (contagion, source
firm power, context)
Slowdown Decreasing time
between bounces Dissipation
Decreasing time between
impacts
Sink Drag force Point where stone sinks
(xf) Termination End Time when impact ceases
Table 4: Analogy
66
2.4.2.1 Stone
The shape, size, thickness, and weight of the stone play an important role in the success of
stone skipping. We propose that this corresponds to the role of the type, scope, importance,
and urgency of an event, as its impact is disseminated through a supply chain
Shape
Boucquet (2003) analyzed the throw of both square and circular stones and found that the best
stones for skipping are flat and rather circular. Less flat stones make the force more specific to
a few points on a stone compared to a flat one, where the gravity force is spread across the
stone’s entire face, allowing it more reaction force3 to bound. Figure 14 and Figure 15
summarize Yabe et al. (2002)’s experiments comparing the effect of different shapes of stones,
which revealed that a greater number of bounces was associated with a flat-bottomed stone
shape.
3 Reaction force is further discussed in Section 2.4.4

67
Figure 14: Skipping of a round bottom shaped stone (left=simulation, right=experiment)
Source: Yabe et al (2002)
Figure 15: Skipping of a flat bottom shaped stone (left=simulation, right=experiment)
Source: Yabe et al (2002)

68
The shape of the stone is equivalent to the type of event. A strategic event requires time,
attention, and focus on the decision making process. The impact of this type of event is likely
to be disseminated through a supply chain because it relates to long-term goals and the way to
achieve them.
In our example, the replacement of the director of marketing and sales was a strategic event,
based on a decision that was made by the top management team. It had significant implications
for the firm and its supply chain because of the influence that is implicit in this position.
Size
Size is another important element in stone skipping. A stone that is too big or too small will
negatively impact the angular dependence and lift force coefficient, which are two very
important characteristics for a stone to bounce (Clanet, Hersen, and Boucquet, 2004; Rosellini
et al., 2005). In general, a good radius (R) for a stone to achieve a greater number of bounces
is around R ~ 2.5 cm.
The size of the stone is equivalent to the scope of the event. The scope of the events we are
considering is mid-range, because they are not high probability, low impact events, nor are
they low probability, high impact events. For example, hiring a new director of marketing and
sales is not a routine day-to-day event. It required time, effort, and planning for the sourcing
and selection processes. It also required a period of acclimation for both the new director and
those who were already in the firm. Hiring a new director was not a low probability event,
because turnover is not unusual at this level. This was a job title that already existed in the firm;
it just had to use time, effort, and resources in order to bring in another person to the position.

69
The impact of this kind of event is also of moderate impact, since it led to other events and
impacts as well, which are further discussed in section 4.2.2.
Thickness
Rosellini et al. (2005) performed a series of experiments that demonstrated that the thickness
of the stone had an impact on several elements that impact stone skipping, including the lift
force coefficient and the gravity of the stone. Thickness helps to distribute the stone’s weight
through a more uniform mass (Nagahiro and Hayakawa, 2005; Rosellini et al., 2005). They
found that a thickness of ~ 2.75 cm was the most conducive to stone skipping, because the
stone thick enough to float, while thin enough to maintain stability.
The thickness of the stone is equivalent to the importance of an event to supply chain members.
The impact of an event that is considered important will be disseminated from the focal firm
through its supply chain. A more salient event remains in a supply chain member’s thoughts
and the degree to which they give priority (Michel, et al. 1997) to its implementation.
For example, hiring a new director of marketing and sales was of high importance to the focal
firm, first tier suppliers, and first tier buyers, because it was a decision related to changing the
sales model. This culminated in the redesign of packaging and labels for more than 300
products, selection of new suppliers, and re-adaptation of the first tier buyers and franchisees.
It was of medium importance to the second and third tier buyers because it impacted them, but
not substantially. It was more impactful for the middlemen (who were actually primarily
women), because they were the intended new sales channel, and for the third tier buyers, the

70
final users, because they were able to find more attractive products at more different sales
points.
Weight
Weight is also a very important element in stone skipping. Because acceleration is inversely
proportional to mass (Newton’s second law), the stone cannot be too heavy. If it is too light,
on the other hand, this will reduce the gravity of the stone, which is the mass density of the
object divided by the mass density of the fluid (Nagahiro and Hayakawa, 2005), causing it to
sink. Experimental studies have found that a weight of ~ 60 g (the approximate weight of a
tennis ball) is ideal for stone skipping.
The weight of the stone is equivalent to the urgency of an event. Urgency in a supply chain
relates to time, which is a multi-level and complex construct. We propose that more urgent
impact of an event is more likely to be disseminated over a supply chain. If it does not need to
be implemented soon, its impact will not be disseminated over as many supply chain tiers. An
example is legislation that was passed by the government and prescribes tasks that will need to
be implemented soon.
In our example, the top management team was urgently in need of a new director of marketing
and sales because it believed that it would help them to regain their market sooner. When the
new director started in the firm, she also needed to make several decisions very quickly. She
worked to implement her plans as quickly as possible, trying to make each member of her firm
aware of the time urgency. Table 5 summarizes the analogy between skipping stones literature
and its correspondents in a supply chain.

71
Stone Skipping Supply Chain
The best stones are flat and rather
circular; one has to throw them
rather fast and with a small angle
with the water surface; a small kick
is given with a finger to give the
stone a spin and allow bounces.
The best events are strategic rather than operational;
one has to implement them with good amount of
source firm power and with personal heuristics,
biases and locus of control in the context; a(n)
[even] small amount of personal social influence is
necessary for an event to have subsequent impacts.
Table 5: Analogy for the stone
2.4.2.2 Throw
The throw plays a very important role in stone skipping. No matter how ideal the stone’s
characteristics are, if the stone was not appropriately thrown, it will sink. A good throw of a
stone involves substantial speed and a little rotation (World Record, 2013). There are two
important critical values of throw velocity: translational and rotational velocity. The number
of bounces in stone skipping is proportional to large initial velocities, both translational and
rotational (Rosellini et al, 2005).
Analogous to stone skipping, the dissemination of an event in a supply chain relies heavily on
the power of the source of the initial event (see Figure 16). Translational velocity is equivalent
to source firm power and rotational velocity is equivalent to the personal social influence of
the source.

72
Figure 16: Throw of a stone representation
Translational velocity
Translational (or linear) velocity is measured in terms of linear velocity, which is the motion
of the stone from one point in space to another. It is measured in meters per second and is based
on mass [of the stone] and acceleration. Linear velocity is the velocity of the stone travelling
in a straight line. Experimental studies found that a good velocity for stone skipping is ~ 3.5 m
s-1 (Boucquet, 2003; Clanet, Hersen, and Boucquet, 2004).
In a supply chain, translational velocity is equivalent to source firm power. We build on the
research of Astley and Sachdeva (1984) on sources of intra-source firm power, which they
describe as a multifaceted and multidimensional phenomenon. Intra-source firm power results
from a combination of three sources: hierarchical authority, resource control, and network
centrality. Hierarchical authority is related to hierarchical position of a firm in a supply chain.
Resource control refers to the firm’s capacity for obtaining resources from its environment, as
well as the control of supply or distribution of these resources. Network centrality is the
position of the firm within the workflow linkages (Astley and Sachdeva, 1984). We expect that
Linear velocity + spin velocity = Source firm power + personal social influence

73
the dissemination of the effect of an event in a supply chain will be associated with the source
having strong hierarchical authority, high resource control, and a central position in its supply
network.
In the example of hiring a new marketing and sales director, source firm hierarchical authority
was high, since the hiring decision was made by the firm president. Resource control was high,
since the marketing and sales director had the power to implement several other mid-range
events, including hiring or firing mid-level management team members and implementing a
new sales model. Network centrality was also medium to high, since the new director had the
ability to make changes in product and services characteristics that would influence not only
the focal firm itself, but some of its immediate suppliers and customers. In sum, for the impact
of an event to be disseminated in its supply chain, its source should be a firm, department, or
person with a substantial amount of source firm power (hierarchical authority, resource control,
and network centrality).
Rotational velocity
Rotational (or angular) velocity relates to the angular speed of an object and the axis about
which it is rotating (Resnick et al, 1966). It is measured in terms of spin velocity, which refers
to an object moving on a circular path. High spin velocity is necessary for the stone’s
stabilization and to allow a greater number of bounces (Rosellini et al, 2005; Clanet et al, 2004;
Boucquet 2002). A good spin velocity for stone skipping is ~65 rot s-1.

74
In supply chain, rotational velocity is equivalent to the personal social influence of the source.
In the same way that spin velocity is necessary to stabilize a stone, a substantial amount of
personal social influence is necessary to stabilize the dissemination of the impact of an event
over a supply chain. Personal social influence was the subject of substantial research in the
1950’s (Asch, 1956; Freedman and Fraser, 1966; Milgram, 1974) and is still of interest to
researchers (Cialdini and Goldstein, 2004). It is the capacity or ability that a person possesses
to influence other individuals’ opinions in a direction toward their (the influencer’s) own
beliefs (Katz and Lazarsfeld, 1955). It is an “attempt to influence a person's beliefs, attitudes,
intentions, motivations, or behaviors” (Seiter and Gass, 2010, p.33). We build on Cialdini et
al.’s studies, which found that personal social influence is much more related to personal
relationships than to source firm power, itself (Cialdini, 1984, 2001a, 2001b; Cialdini,
Wosinska, Barrett, Butner, and Gornik-Durose, 1999; Cialdini and Goldstein, 2004; Goldstein,
Martin, Cialdini, and Schuster, 2008; Nolan, Schultz, Cialdini, Goldstein, and Griskevicius,
2008). Thus, personal social influence and source firm power are separate constructs.
There are three elements of personal social influence: to be accurate, to affiliate, and to
maintain a positive self-concept (Cialdini and Trost, 1998; Cialdini and Goldstein, 2004;
Wood, 2000) They are expressed in terms of reciprocity, commitment and consistency, social
proof, authority, liking, and scarcity. Reciprocity is the tendency to return a favor. It is a very
strong and pervasive social force that transcends countries and organizational cultures
(Gouldner, 1960). Consistency and commitment refer to the principle that individuals4 tend to
be consistent with a commitment that they made orally or in writing and keep to that decision
4 Individuals in our research might represent either those ones from the source firm or the target firm, depending
on whom we are referring, since we have individuals making and being influenced by decisions made in all the links in a supply chain. This is clarified when we give the examples.

75
for an extended period of time. Social proof refers to the notion that individuals tend to engage
in the behavior they see others engaging in. Authority relates to perceived personal social
power and the individual’s tendency to follow authority figures, sometimes even in
questionable situations (see Milgram, 1960’s experiments). Liking states the principle that the
more the target likes and approves of the source, the more likely it will be to behave in a way
to keep that relationship. Finally, scarcity relates to the idea that individuals tend to value more
what they have less of. It has been shown to increase and or generate demand (Cialdini and
Goldstein, 2004; Cialdini 2004). Scarcity is also related to loss aversion, which is one of the
heuristics studied by Kahneman and Tversky (1974).
In the example, the new marketing and sales director launched a new sales model, which greatly
impacted the source firm internally, as well as its first tier suppliers and buyers. The new
director demonstrated reciprocity by urging its first tier buyers (franchisees) to adopt the new
sales model as quickly as possible, stressing that the franchisees should work hard and make it
happen with their customers. Consistency and commitment were triggered in different ways.
First, a new contract was made and the signature of each one of the franchise owners was
requested (commitment). Second, since most of the franchisees had been with the source firm
for a decade or more, they were asked to reiterate their support to the firm’s decisions and
strategies. Social proof was perceived when already successful franchisees were invited to
come to training sessions and group meetings to tell their peers about the success they had
experienced using the new sales model. Authority was reinforced by the fact that every time
the franchisees talked about the new director, they would cite her credentials and previous
experience, stressing that if she had done so much before, what she was proposing must be a
good thing for them, too. Liking was achieved on a one-to-one basis, as many franchisees

76
followed and agreed with the opinions (about the new sales model) of their closest peers.
Finally, scarcity was triggered by the suggestion that, if franchisees did not take the opportunity
and start working hard quickly, they could lose a great opportunity for their business and lose
money and market share. Table 6 shows the analogy between the elements of the throw for
skipping stones and their equivalents in a supply chain.
Stone Skipping Supply Chain
Spin motion induces a stabilizing
torque.
Personal social influence induces a stabilizing effect
on buyer-supplier relationships.
The initial "kick" that puts a stone
in rotational motion is a key factor
for a good throw.
Personal social influence is a key factor for good
dissemination of the impact of an event over a
supply chain
Table 6: Analogy for throw
2.4.2.3 Collision
The collision is a crucial part of stone skipping. By experimentally monitoring the moment of
collision of a stone with a water surface, several authors have demonstrated the crucial
parameters for successful stone skipping, which are the impact angle, the gyroscopic effect
caused by the torque, and friction (Boucquet, 2003; Clanet, Hersen, and Boucquet, 2004;
Rosellini et al., 2005).
Impact Angle
The angle with which a stone collides with the water is one of the most important parameters
in stone skipping. No rebound is possible when the impact angle is larger than 45o (Clanet et

77
al. 2004), rather, the stone will sink. Researchers have shown that the greatest numbers of
bounces are generally performed when there is a small angle, θ. (Clanet et al., 2004; Nagahiro
and Haykawa, 2005). “One unexpected result which emerges from the measurements is the
presence of a minimum in the stone-water collision time for a given “magic” angle θ ∼ 20◦. It
is then easy to show that this angle does also maximize the number of bounces” (Clanet et al.,
2004, p.8). Changes in linear speed and rotation did not change this relationship, “The
dependence of Nmax [number of maximum rebounds] on U0 [initial velocity] is much weaker
than the one predicted from the more naive approach” (Clanet et al., 2004, p.8). “The ‘magic’
angle about ~ 20o is accordingly expected to maximize the number of bounces because the
amount of energy dissipated during a collision is directly proportional to the collision time”
(Clanet 2004; Bouquet 2001).
Figure 17 shows snapshots of a stone skipping experiments performed by Clanet et al (2004),
establishing the “magic angle”. It presents chrono-photography of a skipping stone, obtained
with an aluminum disc of radius R = 2.5 cm, thickness h = 2.75 mm, translation velocity U =
3.5 m.s−1, angular velocity W = 65 rot.s−1, attack angle α = 20◦, trajectory angle β = 20◦5
.
Time increases from left to right and from top to bottom, with the time increment ∆t = 6.5 ms.
5 The physics literature measures two different angles in skipping stone: attack angle (α) and trajectory angle
(β). Both angles are essentially the same, so, for order of simplification, we refer to them as the angle (θ).
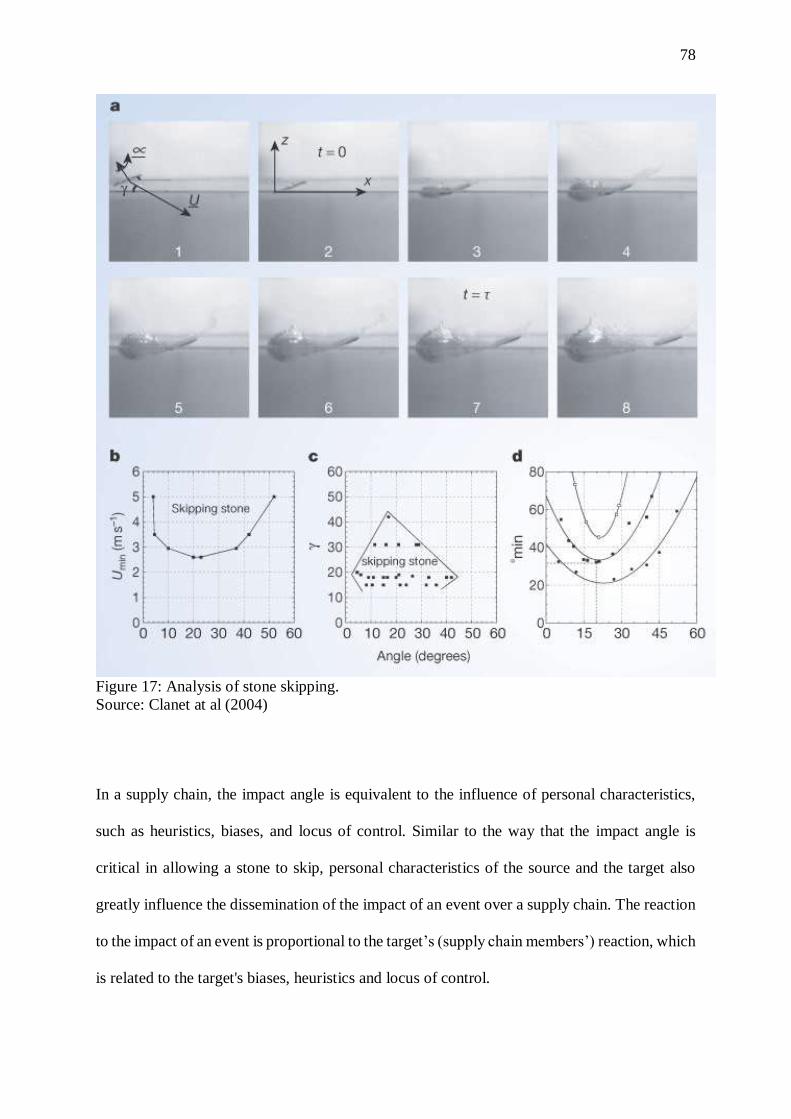
78
Figure 17: Analysis of stone skipping.
Source: Clanet at al (2004)
In a supply chain, the impact angle is equivalent to the influence of personal characteristics,
such as heuristics, biases, and locus of control. Similar to the way that the impact angle is
critical in allowing a stone to skip, personal characteristics of the source and the target also
greatly influence the dissemination of the impact of an event over a supply chain. The reaction
to the impact of an event is proportional to the target’s (supply chain members’) reaction, which
is related to the target's biases, heuristics and locus of control.
79
In the illustrative example, the initial impact of the event involved individual characteristics
and relationships between buyers and suppliers. During the first weeks that followed the hiring
of the new director, several biases were exhibited by supply chain members, such as the sales
manager, as well as those that were indirectly involved, such as a packaging supplier. These
included overconfidence, wishful thinking, hyperbolic discount, framing effects, and intuition.
Both internal and external locus of control were also identified, and their implications will be
further discussed in detail in Chapter Four.
Gyroscopic Effect
The gyroscopic effect is crucial in stabilizing the stone and allowing it to make more rebounds
(Boucquet, 2003; Clanet, Hersen, and Boucquet, 2004). For example, in an experiment that
used Russell Byars, a stone skipping champion and world record holder between 2007 and
2013, a slow motion camera found that the stone made 23 spins between each bounce6 on the
water. Torque, which is the tendency of a force to rotate an object about an axis, together with
spin velocity, are responsible for generating the gyroscopic effect during a stone’s throw.
The gyroscopic effect is equivalent to the strength of the buyer and supplier relationship in a
supply chain. As the gyroscopic effect in stone skipping is a function of spin velocity and
torque, buyer and supplier relationships are a function of personal social influence (Cialdini,
1994) and the strength of the ties between buyers and suppliers.
6 For more details about the stone skipping in slow motion, check the link: goo.gl/cFUxlq

80
Buyers and suppliers can be embedded in their relationship with each other (Choi and Kim,
2008; Kim et al 2011) to varying degrees. The concept of structural embeddedness helps to
understand that a firm’s performance is intrinsically related to its own location on its supply
chain. The position which a firm assumes in different supply chains can allow different
opportunities and access to other firms’ capabilities (Kim, 2014), thus it can facilitate the
development of weak ties (Choi and Kim, 2008; Kim et al 2011). As a skipping stone can only
be partially immersed in the water, in order to have the greatest impact, the impact of a supply
chain event cannot be exclusively related to its source. Strong ties (Krackardt, 1992; Nelson,
1989) are evident in this example, based on time and interaction. The new director’s new sales
model involved interaction among many different individuals, across a substantial period of
time. A multidisciplinary team in the source firm, with members ranging from designers to
purchasing managers, was involved in the packaging redesign for more than 300 products. This
illustrates the strong ties between the source firm and its supply chain members. Agreement
effects and trust were strengthened because of their close interaction. Thus, strong ties indicate
a strong buyer-supplier relationship.
Friction
Friction is the resistance between the stone and the water surface. It is related to the water
surface’s characteristics. Even with ideal throw velocities (linear and spin), if a perfect stone
encountered a water surface full of waves on a windy day, the chances of the stone bouncing
would be greatly reduced (Boucquet, 2003). Gravity (g) is the specific gravity of the stone,
which is its mass density (p’) divided by the mass density of the fluid (p) p’/p. Gravity force is
illustrated in Figure 18, which shows a schematic view of the collisional process of the oblique

81
water entry of a stone, where incident angle = θ, initial velocity = V0, radius = R, thickness =
h, angle between the disk and water plane = ø, and n = perpendicular direction.
Figure 18: Collision process of a flat stone encountering a water surface
Source: Based on Boucquet (2003) and Nagahiro and Hayakawa (2005)
Friction on the water surface is equivalent to a supply chain context, including the obstacles
and incentives for event that might emerge in both macro (supply chain and industry) and micro
(firm) environments. In our example, there were several sources of pressure that functioned as
incentives for the dissemination of the impact of the event. For example, an incentive was
provided by the anticipated increase in firm sales, due to the sales model that was implemented
by the new director (the source firm did actually increase its sales by more than 300% in 18
months). However, there were obstacles, as well. Operationally, due to the changes in process
and products initiated by the new director, manufacturing plant employees experienced
substantial stress and uncertainty. They felt overwhelmed with their work overload,
certification of new suppliers, approval initiative for new processes, time and budget
constraints. Table 7 shows the analogy between the collision and its correspondents in a supply
chain.
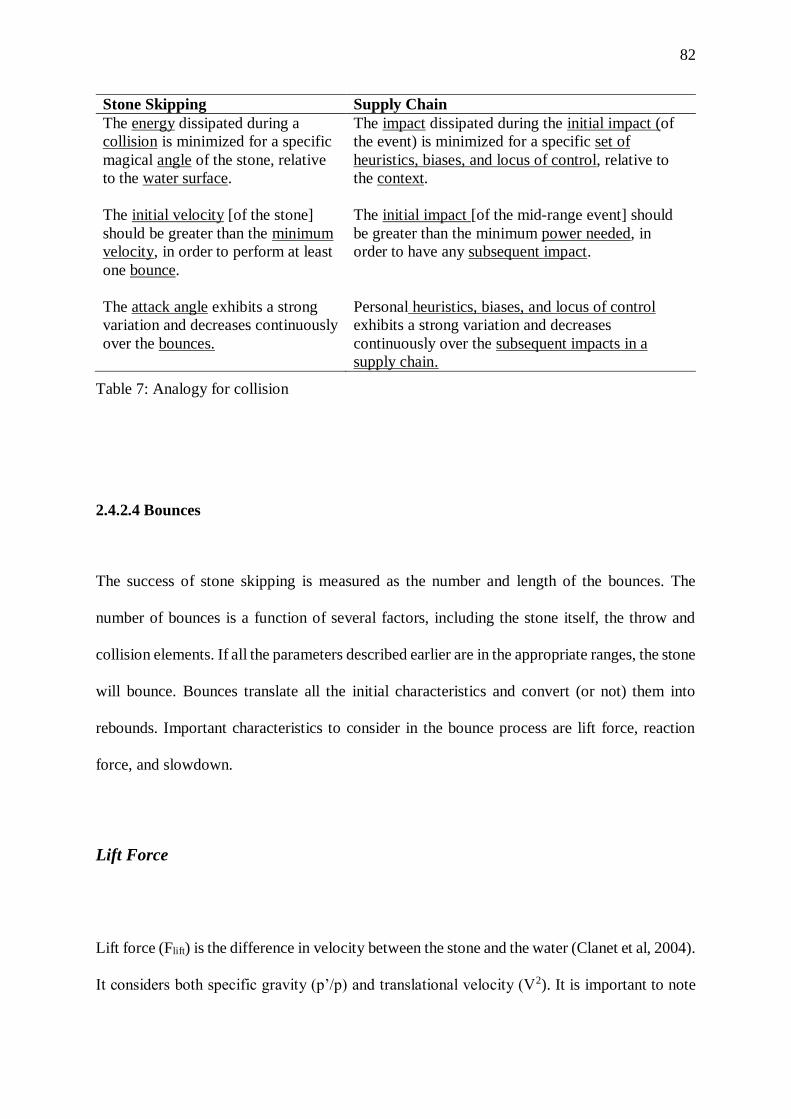
82
Stone Skipping Supply Chain
The energy dissipated during a
collision is minimized for a specific
magical angle of the stone, relative
to the water surface.
The impact dissipated during the initial impact (of
the event) is minimized for a specific set of
heuristics, biases, and locus of control, relative to
the context.
The initial velocity [of the stone]
should be greater than the minimum
velocity, in order to perform at least
one bounce.
The initial impact [of the mid-range event] should
be greater than the minimum power needed, in
order to have any subsequent impact.
The attack angle exhibits a strong
variation and decreases continuously
over the bounces.
Personal heuristics, biases, and locus of control
exhibits a strong variation and decreases
continuously over the subsequent impacts in a
supply chain.
Table 7: Analogy for collision
2.4.2.4 Bounces
The success of stone skipping is measured as the number and length of the bounces. The
number of bounces is a function of several factors, including the stone itself, the throw and
collision elements. If all the parameters described earlier are in the appropriate ranges, the stone
will bounce. Bounces translate all the initial characteristics and convert (or not) them into
rebounds. Important characteristics to consider in the bounce process are lift force, reaction
force, and slowdown.
Lift Force
Lift force (Flift) is the difference in velocity between the stone and the water (Clanet et al, 2004).
It considers both specific gravity (p’/p) and translational velocity (V2). It is important to note

83
that the mass density of the stone changes during the process of skipping it. This happens as
the stone is partially immersed in the water, since the density of a wet stone (Swet) is different
from that of a dry one. A stone rebounds only if it is partially immersed during the collision
(Boucquet, 2003). Lift is the component of fluid force that is perpendicular to the direction of
movement of the stone moving through water. It requires motion and contact between the stone
and the water. The lift force along n is illustrated in Figure 19.
Figure 19: Schematic view of the collision pre-bouncing process
Source: Based on Boucquet, 2003
In a supply chain, lift force is equivalent to the contagion of the impact of an event. As in stone
skipping, where a stone only rebounds if it stays partially immersed during the collision, an
event will only impact other firms if its impact is not exclusive to the source firm. In other
words, if the mid-range event only is important for the source firm, its impact will not be
disseminated over the supply chain. However, if the event has the potential to influence other
firms, its impact will travel through the supply chain. It may also travel to other supply chains,
through interlocking supply chain relationships, building on Granovetter’s (1983) strength of
Water
84
weak ties. As such, the contagion of an event’s impact to other firms must travel through
“bridges” between firms inside and across supply chains.
In the example, the hiring of the new sales and marketing director had an impact on other firms
because of the existence of weak ties between the source firm and non-adjacent links in its
supply chain. Weak ties existed between the source firm and relationships that its franchise
owners, suppliers, and middlemen had with other firms. The impact of this mid-range event
was disseminated through different links, downstream, upstream, and perpendicular, as will be
discussed as part of the next topic, the reaction force. The dissemination to these tiers was
possible due to existence of weak ties. Examples are related to the selection of new packaging
suppliers, the influence of one franchisee on another in the adoption of the new sales model,
and the fact that one of the source firm’s main competitors knew that it was making those
moves, and decided to make its own similar moves.
Reaction Force
Reaction force is an expression of Newton’s third law of motion (Bartlett, 2007), which states
that, if an object exerts a force on another object, then the second object exerts an equal and
opposite reaction force on the first: “For every action [force] there is an equal and opposite
reaction” (Taylor, 2005). In stone skipping, the reaction force on the stone results from a
combination of lift and friction forces and the quadratic of the translational velocity. It is also
based on both the mass density of the stone and the water (Hall, 2006). Because the stone
becomes only partially immersed in water, the reaction is proportional to the immersed surface
of the stone (Boucquet, 2003). Reaction force produces kinetic energy, which is the energy that

85
an object possesses due to its motion. The kinetic energy of a thrown stone is proportional to
its mass and velocity, Ke = ½ m.v2. Particularly relevant to the dissemination of the impact of
an event in a supply chain is the fact that some energy is dissipated during each collision of the
stone with the water, due to the combined effect of all the forces. The flow around the area
where the stone collides forms a series of ripples, due to the dissipation of energy. These ripples
change the water surface, causing some turbulence, which will remain altered for a while, even
after the stone has already moved on to its next collision. They increase their radius in time and
space until they disappear after some time. Figure 20 illustrates the ripples formed around the
point where a stone had previously collided.
Figure 20: Ripples formed by stone collisions with the water
Source: http://goo.gl/Sogsi2
It is important to note that a stone does not just touch the water and go on to the next rebound.
When a stone collides with the water, it “scoops” or surfs the water a little bit before leaving
for the next point, which creates the ripples.
Figure 21 illustrates the moment of a stone-water collision.

86
Figure 21: Snapshot of a stone-water collision
Source: goo.gl/cFUxlq
The surfing of a stone and reconfiguration of the water around the collision (ripples) were
studied by Nagahiro and Hayakawa (2005), as illustrated in Figure 22, which illustrates a
simulation of a stone-water collision and the turbulence that the collision causes on the water.
It shows three different moments of a collision: immediately before the collision (Figure 22a),
partial immersion of the stone in the water (Figure 22b), and departure from the initial point
and going to the next collision (Figure 22c). This demonstrates that the place, point, and time
are different, even for the same bounce. It is important to note that the impact angle (ø) remains
basically the same during the entire process.

87
Figure 22: Snapshots of a stone skipping simulation
Source: Based on Nagahiro and Hayakawa, 2005
In order to develop further analogies between bounces in stone skipping and the dissemination
of the impact of an event in a supply chain, we build upon the reaction force formula, where Cl
= lift coefficient, Cf = friction coefficient, ρω = mass density of water, Sim = area of the immersed
surface, n = lift force, and t = force along the direction of the throw (Boucquet, 2003). Table 8
presents the supply chain analogy for the reaction force formula.
F = 1
2 Cl ρω 𝑉2 Sim n +
1
2 Cf ρω 𝑉2 Sim t
Stone Skipping Supply Chain
Lift coefficient (Cl) Contagion
Friction coefficient (Cf) Context
Mass density of water (ρω) Incentives and obstacles
Translational velocity (V2) Source firm power
Immersed area of a stone (Sim) Exclusivity of the event to the source firm
Normal vector Lift (n) Contagion
Direction of the throw (t) Downstream, upstream direction
Table 8: Analogy for reaction force formula
a) t=2.8
c) t=0
b) t=7.8

88
The rough equivalent for a supply chain is the “translated” formula for the dissemination of the
impact of a mid-range event is presented below:
Impact= ((1
2 Contagion) x Context x Source Firm Power2 x Source x Perpendicular direction)
+
( (1
2 Contagion) x Context x Source Firm Power2 x Source x Up/downstream direction)
The formula illustrates that the impact of an event goes simultaneously in different directions
related to the source, including upstream (suppliers), downstream (buyers), and perpendicular
(competitors). Rather than moving on a linear fashion from left to right (the traditional
depiction of a supply chain), the impact is disseminated in all directions through a supply
network, analogous to the ripples that form when a stone collides with the water. Because of
the ripples effect of the impact, contagion due to dissipation of energy is spread across
directions, which is why it appears as 1
2 in each direction (upstream and downstream). The
context is the obstacles and incentives that exist in each supply chain link. Because source firm
power plays an important role in the dissemination of the impact of an event, it is quadratic in
the formula, stressing the role of the source firm’s hierarchical authority, resource control, and
network centrality. This is consistent with Kim’s (2014) work on the strategic role played by
different positions in a network (supply chain) in accessing information and developing of
strategies and policies.
In a supply chain, the dissemination of the impact of an event is equal to the combination of
contagion (lift force), context (friction force), and source firm power (translational velocity).
This is illustrated by the intensity, number of links impacted and direction of the impact. The

89
intensity of the impact continues, due to the time and effort that supply chain members have
dedicated to the implementation of the necessary changes. The number of links impacted is the
number of other firms, beyond the source, that were impacted by the event. The direction of
impact (upstream, downstream, and perpendicular) is analogous to the ripples formed as a stone
skips.
Like turbulence on the water surface, the event in our example clearly impacted other links in
its own supply chain and in others, disseminating in upstream, downstream, and perpendicular
directions. The impact of the change in the director was greater downstream (sales and
consumers), especially with the first tier buyers, who had hire new employees with a different
profile from what they were used to and purchase several product items different from their
traditional mix. The franchisees had to change their approach and relationship with their
customers, who acted as middlemen between the franchisee and the final customers. Thus, the
second tier buyers were impacted, as well. Even final customers were impacted by the new
product design and packaging, since they had more appealing products in higher variety
available in the stores for them to choose from. Upstream, the first tier suppliers were impacted,
with the greatest impact on the packaging solutions suppliers, due to the substantial redesign
required for more than 300 items. Some chemical suppliers were impacted, as well, but the
primary impact was on the first tier suppliers. Perpendicular initial impacts were also observed.
One of the focal firm’s main competitors mentioned that it was “kind of concerned” about the
source firm’s new strategy because it had observed that some of its own customers had
decreased the amount of their purchases, as discussed further in Chapter Four.
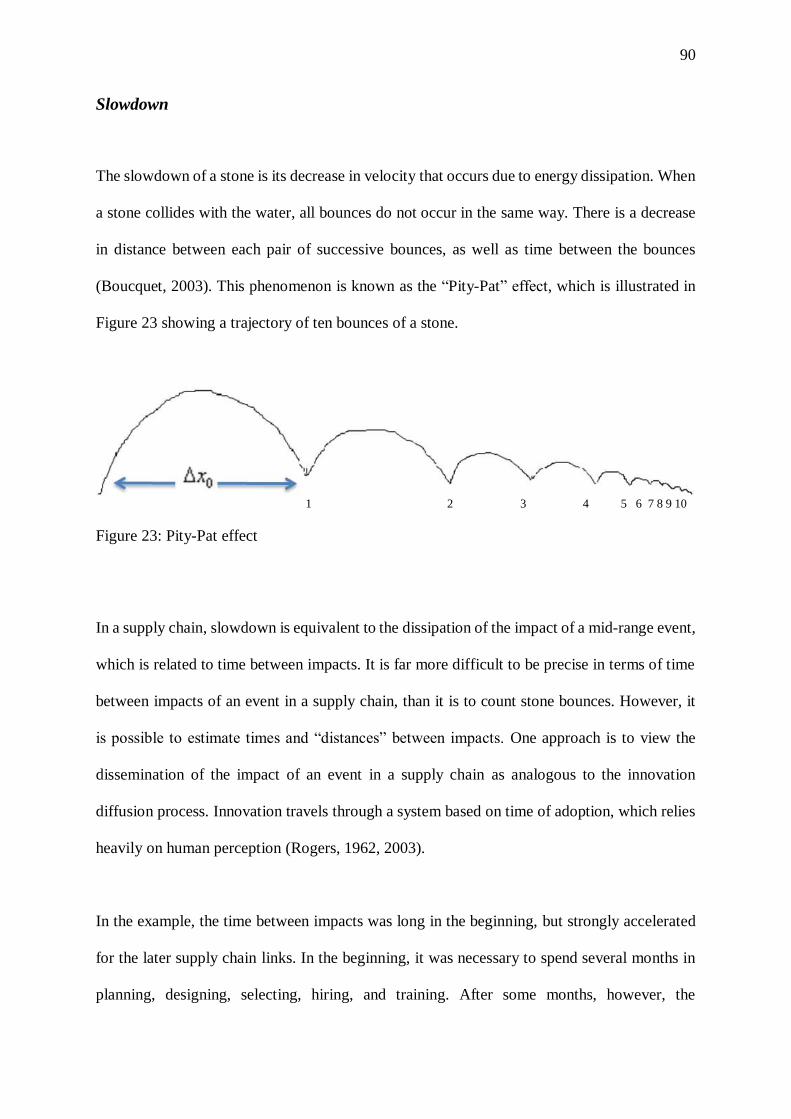
90
Slowdown
The slowdown of a stone is its decrease in velocity that occurs due to energy dissipation. When
a stone collides with the water, all bounces do not occur in the same way. There is a decrease
in distance between each pair of successive bounces, as well as time between the bounces
(Boucquet, 2003). This phenomenon is known as the “Pity-Pat” effect, which is illustrated in
Figure 23 showing a trajectory of ten bounces of a stone.
1 2 3 4 5 6 7 8 9 10
Figure 23: Pity-Pat effect
In a supply chain, slowdown is equivalent to the dissipation of the impact of a mid-range event,
which is related to time between impacts. It is far more difficult to be precise in terms of time
between impacts of an event in a supply chain, than it is to count stone bounces. However, it
is possible to estimate times and “distances” between impacts. One approach is to view the
dissemination of the impact of an event in a supply chain as analogous to the innovation
diffusion process. Innovation travels through a system based on time of adoption, which relies
heavily on human perception (Rogers, 1962, 2003).
In the example, the time between impacts was long in the beginning, but strongly accelerated
for the later supply chain links. In the beginning, it was necessary to spend several months in
planning, designing, selecting, hiring, and training. After some months, however, the

91
implementation was much faster than in the initial months and the impact of the change in
director was disseminated more quickly through the supply chain. Table 9 contains a summary
of the analogy between stone skipping and its correspondents in a supply chain.

92
Stone Skipping Supply Chain
The reaction force due to the water is proportional to lift force and friction. The impact in other firms is proportional to contagion and context.
The lift force is expected to be proportional to the apparent surface of the stone (thickness) and the mass density of the water.
The contagion is expected to be proportional to the importance of the mid-range event and the context.
The lift force is maximum when the stone is only partially immersed. The contagion is maximum when the mid-range event is only partially related to the
source.
The lift force has to balance the weight of the stone, in order for it to bounce. The contagion has to balance the urgency of the mid-range event, in order for it to have subsequent impacts.
In the absence of spin motion, the torque due to the lift force will induce
instability.
In the absence of personal social influence, the buyer-supplier relationship due to
contagion will induce instability.
Rotation stabilizes the stone, due to the gyroscopic effect. Personal social influence stabilizes the mid-range event, due to the strength of buyer and supplier relationships.
A certain spin velocity is necessary, to stabilize the stone. A certain amount of personal social influence is necessary, to stabilize the
dissemination of the impact of a mid-range event.
A finite angle is helpful in increasing the number of bounces. Specific heuristics, biases, and locus of control are helpful in increasing the number of subsequent impacts.
The water surface exhibits a lift force on the stone, allowing it to rebound. The context exhibits contagion on the mid-range event, allowing it to have
subsequent impacts.
Some energy (reaction force) is dissipated during each bounce, due to the friction component of the force.
Some impact is dissipated during each subsequent impact, due to the obstacles in the context of (each) supply chain link.
The reaction force will decrease the velocity of the stone; after a few
bounces, the initial kinetic energy of the stone is fully dissipated and it sinks.
The extent to which a mid-range event is dissipated to the next link will decrease its
supply chain impact; after a few subsequent impacts, its initial impact is fully dissipated and it will have no further impact.
The decrease in the distance between two successive bounces is at first rather
slow, but strongly accelerates for the last collisions (the Pity-Pat effect).
The decrease in the distance between two successive subsequent impact is at first
rather slow, but strongly accelerates for the last links (Pity-Pat effect).
The maximum number of bounces results from the combination of slow down and angular destabilization.
The maximum number of subsequent impacts results from the combination of dissipation and personal heuristics, biases, and locus of control.
Under conditions of large spin velocity, the attack angle remains constant
during the entire impact process.
Under conditions of large personal social influence, the heuristics, biases, and locus
of control remain constant during the entire impact process.
The attack angle exhibits a strong variation and decreases continuously over the collision (bounces).
Personal heuristics, biases, and locus of control exhibit a strong variation and decrease continuously over the subsequent impacts.
In general, both Cl (lift coefficient) and Cf (friction coefficient) are functions
of the tilt angle θ and incidence angle β. (…) ricochets (bounces) are
generally performed with a small tilt angle, θ, and a small incidence angle, β
In general contagion and context are function of personal heuristics, biases, and
locus of control (…) Subsequent impact generally require a lower level of
heuristics, biases, and locus of control.
Table 9: Analogy for bounces

93
2.4.2.5 Sink
Even under perfect conditions, every stone, even those that had almost uncountable bounces7
will eventually stop and sink. The sink results from the combination of two previous
mechanisms: slowdown and angular destabilization (Boucquet, 2003). Both the slowdown and
angular destabilization are influenced by drag force. Drag is a mechanical force generated by
a solid object travelling through a fluid that exerts a force in the direction opposite to the
direction in which the object is moving (Bartlett, 2007). The combination of drag force and
gravity cause slowdown and angular destabilization, causing the stone to sink.
Figure 24 shows the forces acting on a stone just after the collision, where N = normal lift
force, V = translational velocity, g = gravity force, and Fdrag = drag force.
Figure 24: Forces acting on a stone
Source: http://goo.gl/O3bvhM
7 The current world record according to the Guinness Book of Records is 88 skips by Kurt "Mountain Man" Steiner. The cast was achieved on September 06, 2013 at Red Bridge in the Allegheny National Forest,
Pennsylvania. (http://www.guinnessworldrecords.com/world-records/1/most-skips-of-a-skimming-stone)
N
V
g
Fdrag

94
In a supply chain, drag force is equivalent to the end of the dissemination of the effect of an
event. No matter how important or powerful the impact of the event has been, there will be a
moment when its impact ceases.
In the example, the end of the dissemination of the impact of the mid-range event occurred
about 30 months after the beginning of the new director at the source firm, when she left the
firm. However, this did not prevent other events nor the continuity of its impact (like ripples in
the water), which are natural and expected in a complex environment, like a supply chain.
Examples of the continued impact include the fact that the new staff adopted some of her
previous ideas, and implemented some of the projects she had initiated. Table 10 presents the
analogy between the sink and its correspondents in a supply chain.
Stone Skipping Supply Chain
If the stone reaches a depth where it
becomes completely immersed, the lift
force is greatly diminished and will
probably not be able to sustain the
weight of the stone any longer.
If the dissemination of the impact of the mid-
range event reaches the point where it is only
related to a specific source, contagion is greatly
diminished and it will not be able to sustain its
urgency any longer
Even if the initial velocity of the stone
is very large, the stone will be stopped
by angular destabilization, after a
certain number of bounces.
Even if the initial source firm power associated
with the mid-range event is very large, its impact
will be stopped by the effect of personal
heuristics, biases, and locus of control, after a
certain number of subsequent impacts.
The collision sequence [bounces] is
repeated until parameters at the impact
(angles and velocity) prevent the stone
from escaping the water and force it to
sink.
The subsequent impacts are repeated until
parameters at the impact (personal heuristics,
biases, and locus of control, source firm power,
and personal social influence) prevent the impact
of mid-range event from escaping the context and
force it to end.
Low spinning stone does not bounce
but dives.
The impact of mid-range events associated with
low personal social influence do not have any
subsequent impact and end.
Table 10: Analogy for sink

95
2.4.3 Identity
In this section, identity is established. Identity in metaphorical transfer is the generalizable
insights that apply to both the metaphor and the target phenomenon (Chen et al, 2013). To
show identity, several propositions about dissemination of the impact of an event in a supply
chain were developed, based on key stone skipping principles.
2.4.3.1 Propositions
Proposition 1 (“Pity-Pat” Effect Principle). The closer tiers in a supply chain will experience
a stronger impact of a mid-range event, which decreases for the farther tiers.
In stone skipping, a stone does not bounce with the same velocity or distance between all
collisions. The first bounces occur less frequently and increase in velocity for the later ones.
The first bounces have greater distances between them, while the later bounces are closer
together. This phenomenon is known as the Pity-Pat effect (Boucquet, 2003; Clanet et al.,
2004) and is in accordance to Newton’s law of gravity which predicts that the farther apart the
bodies are, the smaller the force will be (Hawking, 1996).
Similarly, a mid-range event in a source firm will have an impact on other firms in its supply
chain with different frequencies and at different times. We operationalized the impact of a mid-
range event in terms of the number of different tiers that were affected. The Pity-Pat effect

96
implies that a mid-range event in a focal firm will have a greater impact in the first tier buyers
and suppliers, which strongly decreases for the later tiers.
Proposition 2 (“Gyroscopic Effect” Principle). A combination of personal social influence
and strength of buyer and supplier relationships will significantly contribute to the extent of
the impact of a mid-range event over a supply chain.
The gyroscopic effect occurs due to spin velocity of the throw and is a function of both the spin
velocity and torque. The gyroscopic effect is crucial in stabilizing the stone, to allow it to make
more rebounds (Boucquet, 2003; Clanet, Hersen, and Boucquet, 2004).
In a buyer and supplier relationship in a supply chain, this principle illustrates the effect of
personal social influence (not necessarily related to job title) plus the strength of the buyer and
supplier relationship. Analogous to stone skipping, the combination of these factors will
significantly contribute to the continuance of the extent of the dissemination of the impact of
an event through a supply chain.
Proposition 3 (“Magic Angle” principle): Even a low level of personal heuristics, biases, and
locus of control will influence the impact of an event over supply chain.
In a supply chain, the magic angle is equivalent to personal heuristics, biases, and locus of
control. Even a low level of them will increase the extent of the impact that an event has over
the supply chain links. Thus, the heuristics, biases, and locus of control of buyers and suppliers
play a crucial role in the dissemination of the impact of a mid-range in a supply chain.
97
Proposition 4: (“Lift Force Principle”): The impact of a mid-range event is proportional to
its impact on individuals in the supply chain links.
In stone skipping, a reaction against the stone is exerted by the water surface, which allows it
to rebound due to the lift force, which is maximum when the stone is only partially immersed
on the water. In a supply chain, the impact of a mid-range event (either good or bad) is related
to characteristics of buyers and suppliers as well as obstacles and or incentives they might
influence. Obstacles include different kind of difficulties the target might show in adapting to
a change. Examples can be found in the adoption of a new sales model, which include the fact
that the franchisees did not want to hire employees to visit the beauticians and estheticians
because of the related costs. Incentives, on another hand, refer to things that encourage making
a change. Both obstacles and incentives are subject to buyers and supplier’s perceptions as
well.
Proposition 5 (“Kinetic Energy Principle”): The impact of a mid-range event may create its
own power and keep impacting other supply chain links beyond the source, even if the initiators
try to stop it.
After a stone is thrown on the water, it keeps bouncing due to the kinetic energy it created,
which is proportional to its mass, velocity, and gravity. Another example of the kinetic energy
of an object is the idea of pushing a big rock down a steep hill8. Initially, the rock does not
move by itself; it requires the effort of people to push it down. However, once it starts rolling
8 See https://www.youtube.com/watch?v=w5rKDNJHjRc
98
down, it creates its own kinetic energy. Even if those who pushed it tried to stop it, they will
not be able to do so.
Similar phenomena happen in supply chains. Some mid-range events, after being initiated, take
on a life of their own. In a supply chain context, we view kinetic energy as related to the
perceived importance and urgency of the event, itself, by supply chain members. Some mid-
range events may not be perceived as being as important as others, especially when they only
affect the source of the event. Other events, however, are perceived as very important by many
different links in a supply chain. For example, legislative changes related to tracking the
producer of a product may impact several supply chain links. Another example is the bullwhip
effect, which relates to variances in demand distortion as it moves upstream through a supply
chain (Lee et al., 1997, Mackelprang and Malhotra, 2015).
Proposition 6 (Ripples Effect Principle): An event in a focal firm may impact other links in
the same supply chain and in other supply chains (perpendicular direction).
Probably one of the first images that come to mind when thinking about stone skipping are the
ripples that are formed and remain for a while after each rebound. Ripples are formed due to
the impact and the cavity in the water created by the stone. They are the outcome of the energy
dissipation in each collision (Boucquet, 2003; Nagahiro & Hayakawa, 2005).
In a supply chain, the ripples are equivalent to the fact that a mid-range will continue to impact
a context even when it is not “physically” present in that place or time any more. A
manifestation of the ripples principle is seen in the example used for the analogy. Although the

99
new sales and marketing director left the firm, the impact of her decisions continued to
influence the new team in the source firm and other links as well, particularly, the first tier
buyers. Table 11 presents a summary of the propositions, and Figure 25 illustrates them in a
stone-skipping context.

100
Propositions Stone Skipping Supply Chain Propositions
P1 Pity-Pat Effect
Principle
The energy dissipation strongly decreases the
distance and time between each bounce for the
later skips.
The closer tiers in a supply chain will experience a stronger
impact of a mid-range event, which decreases for the farther
tiers.
P2 Gyroscopic Effect
Principle
A gyroscopic effect is a function of spin
velocity and torque. It is crucial in stabilizing
the stone and contributing to rebounds.
A combination of personal social influence and strength of
buyer and supplier relationships will significantly contribute
to the continuance of the impact of a mid-range event over a
supply chain.
P3 Magic Angle Principle
Ricochets are generally performed with a small
tilt angle, θ, and a small incidence angle, β.
Even a low level of personal heuristics, biases, and locus of
control will influence the impact of an event over supply
chain.
P4 Lift Force Principle Lift force is the reaction against the stone
exerted by the water surface that allows the
stone to bounce.
The impact of a mid-range event is proportional to its
impact on individuals in the supply chain links.
P5 Kinetic Energy
Principle
Kinetic energy is the energy that an object
possesses due to its motion.
The impact of a mid-range event may create its own power
and keep impacting other supply chain links beyond the
source, even if the initiators try to stop it.
P6 Ripples Effect Principle
A series of ripples are formed on the water, due
to the flow around the stone during the stone-
water contact. The ripples remain and increase
their radius, even after the stone has already
gone onto its next collision.
An event in a focal firm may impact other tiers in the same
supply chain and in other supply chains (perpendicular
direction).
Table 11: Propositions

101
Figure 25: Graphical representation of propositions
2.4.3.2 Models
The intention of this metaphorical transfer was not go through all the science behind the stone
skipping, but rather to highlight the main facets of this interesting body of research and make
the relevant metaphorical transfer to a supply chain environment in order to lay the foundation
for the development of theory. Nagahiro and Hayakawa (2005) stated that a “projectile [only]
ricochets off the water surface if some conditions are fulfilled” and, the conditions are the
impact velocity (translational velocity plus spin velocity), the angle of impact velocity relative
to water surface, and the specific gravity of the object, which is the mass density of the object
divided by the mass density of the fluid. Figure 26 represents Nagahiro and Hayakawa (2005)’s
statement.
External context – supply chain links

102
Figure 26: The physics of stone skipping
Source: based on Nagahiro and Hayakawa (2005)
Similarly, many different things can impact the dissemination of the impact of a mid-range
event over a set of supply chain links. Although not treated exhaustively, we present a model
of the most important features that impact the dissemination of the impact of a mid-range event
over a supply chain, through the lens of skipping stones theory. Analogous to model presented
in Figure 26, we depicted the most important influences on the extent of the impact. The model
considers the importance of aspects of the throw and collision phases, in addition to the
U=Linear
velocity
W = Spin
velocity
V0= Initial
Impact Velocity
α = "attack"
angle
β = impact
angle
Angle of impact
velocity (ø)
ρ'= mass density
of the object
Specific gravity
of the object (g)
Stone Skipping
(number and distance of
bounces)
The Collision
ρ = mass density
of the fluid

103
importance of the context in understanding the possible dissemination of the impact of a mid-
range event on a supply chain (the bounces). The six propositions stated in the section 2.4 also
provide a foundation for Figure 27.
Figure 27: Model of the dissemination of the impact of an event in a supply chain
Source firm
power
Personal
personal social
influence
Importance of
the source of
the event
Heuristics and
Biases
Locus of
Control
Perception of
the event’s
importance
Elements of the
event itself Impact of the
event on the
supply chain
Extent of the impacts in the
supply chain
Organizational Aspects
Individual Aspects
Event’s Aspects
The Collision
Local obstacles
Personal
Social
Influence

104
3 METHODS
In this section we present the main elements used to develop this dissertation. It discuss the
design of the study, the process to collect and analyze the data as well.
3.1. Embedded Case Design
Our research focused on the cosmetics industry in Brazil. Data was collected using structured
interviews in six supply chains. We followed the field-based data collection methods described
by Eisenhardt (1989), Pagell (2004), and others, whose goals are to “not only identify
constructs, but also develop an understanding of why identified constructs might be important”
(Pagell, 2004, p.464). Suggestions from Krippendorff (2013); Miles, Huberman, and Saldaña
(2014); and Yin (2013) were also taken into consideration in building and analyzing the case
studies.
This research was developed using an embedded case design. We used different units of
analysis for different phases of the research. We conducted our data collection from top to
bottom. Initially, we tried to understand: i) the selected industry itself (cosmetics industry); ii)
two sub-sectors within this industry (dermocosmetics and beauty products); iii) some supply
chains within it, identifying mid-range events; iv) the role of the focal firms in these supply
chains; v) the relationship between a buyer and a supplier, after a mid-range event, which could
be a relationship within the firm itself (between individuals and departments) or across firms;
and finally, vi) we analyzed the individual and his or her personal, heuristics, biases and locus
of control. We compared six supply chains, including six focal firms plus four to six links in

105
each (2-3 tiers of suppliers and 2-3 tiers of buyers). We followed the hypothesis-generating
process described by Eisenhardt (1989) and Glasser and Strauss (1967). A logical model was
developed and a cross-case synthesis applied.
We investigated six levels in the embedded case analysis. An embedded case study involves
more than one unit of analysis (Yin, 2013). Our study investigated the data through multiple
levels of analysis in order to understand the data and fulfill the research goals. We began by
the industry level by understanding the Brazilian cosmetics industry. In doing that, we found
that two sub-sectors emerged, which were beauty products and dermocosmetics. Next, at the
supply chain level, we identified and researched focal firms. We then identified their venture
partners in their upstream and downstream supply chains, which were their buyers and/or
suppliers. Next, we interviewed individuals, in order to understand their roles in the supply
chain and relationships after a mid-range event in one of their firms, building the sixth level of
analysis. Thus, the embedded case design involved individuals embedded in buyer and supplier
relationships, embedded in focal firms, embedded in supply chains, embedded in sub-sectors,
embedded in industries. Figure 28 illustrates the embedded case design.

106
Figure 28: Embedded case design
3.1.2 Sampling
Many of the contacts were obtained through referral sampling, also known as snowball
sampling. There were three kinds of initial contacts: i) contacts who did not fit the profile to be
an informant but indicated some other individuals who could be interviewed; ii) previous
contacts in the target industry who fit in the profile of the target informants and were
interviewed; and iii) contacts who were selected due to their importance within the firm or the
supply chain they were part of.
Each time a contact indicated another potential informant, we called it a contact generation.
For the first type of contact, six individuals indicated seven other contacts who were
interviewed (2nd contact generation). From these individuals, two of them indicated three other
informants (3rd contact generation). From these three, two indicated three more individuals (4th
contact generation) and the last one indicated one more (5th contact generation). In total, 14
Industry
Sub-Sectors
Supply Chains
Focal Companies
Buyer and Supplier Relationships After a Mid-range Event
Individual

107
individuals who had not been initially identified were interviewed through snowball sampling
of contacts. For the second type of contact, five initial contacts resulted in 42 informants. For
the third type of contact, ten new contacts were established and resulted in 49 informants. Thus,
we interviewed a total of 105 individuals.
Table 12 shows the number of individuals interviewed in each phase of the snowball sampling.
Table 12: Contact generation for snowball sampling
Informants on the buyer side of a firm typically indicated some of their suppliers as potential
interviewees. Informants on the sales side of a firm typically indicated some of their clients as
potential interviewees.
Figure 29 summarizes the snowball contact generation per interviewed person in our research.
Each number corresponds to the code for a person who was interviewed, and this number is
related to that person in a separate spreadsheet. Each color represents a link in a supply chain.
Who
contacted
directly
Askeded for
indication
but was not
interviewed
1st Contact
Generation
2nd Contact
Generation
3rd Contact
Gen.
4th
Contact
Gen.
5th
Contact
Gen.
6th
Contact
Gen.
7th
Contact
Gen.
Total
Previous
contacts, but
not
interviewed
6 6 7 2 3 2 3 1 1 14
Previous
contacts5 3 16 3 12 1 2 2 4 2 2 1 1 42
New
contacts10 4 14 5 10 4 10 3 5 49
15 37 25 15 10 2 1 105
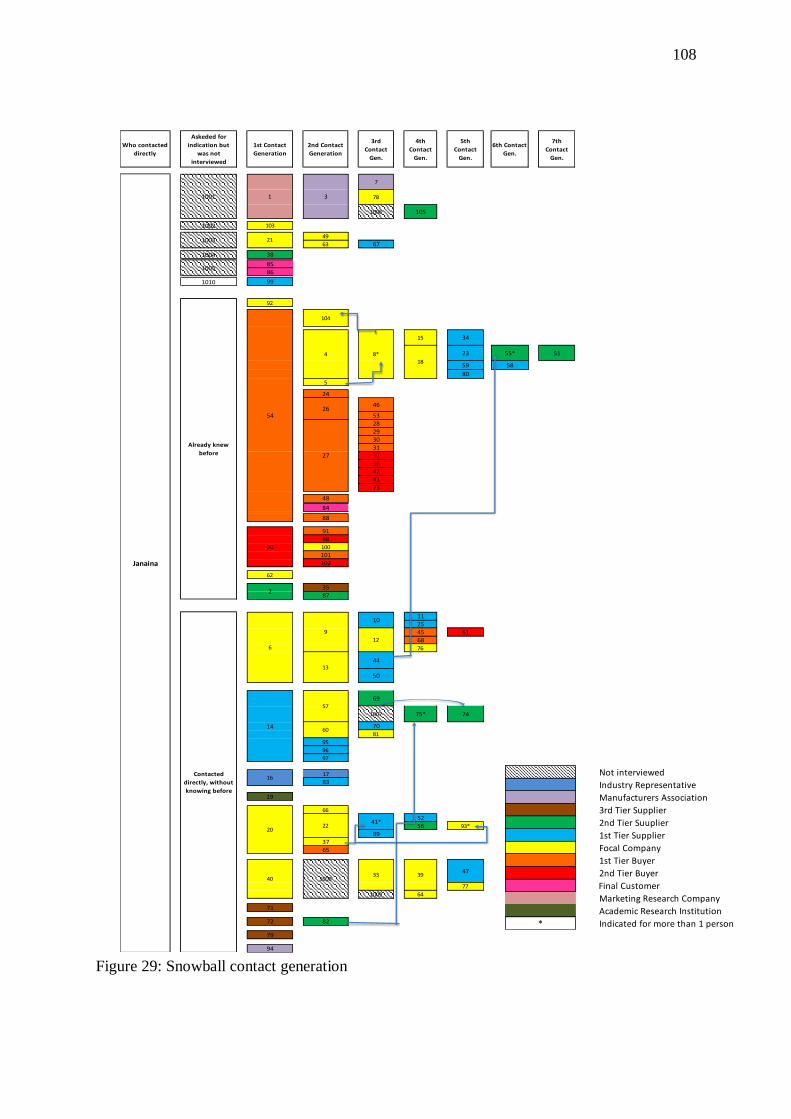
108
Who contacted
directly
Askeded for
indication but
was not
interviewed
1st Contact
Generation
2nd Contact
Generation
3rd
Contact
Gen.
4th
Contact
Gen.
5th
Contact
Gen.
6th Contact
Gen.
7th
Contact
Gen.
7
78
1006 105
1002 103
49
63 67
1004 38
8586
1010 99
92
104
15 34
23 55* 51
59 58
80
5
24
46
53282930
313236
424373
48
84
88
9198100
101102
62
3587
1125
45 616876
44
50
69
1007 75* 74
7081
95
96
97
17
83
19
66
52
56 93*
8937
65
47
77
1009 64
71
72 82
79
94
39
Already knew
before
2022
41*
40 100833
Contacted
directly, without
knowing before
6
9
10
12
13
14
8*
18
26
27
90
1005
54
4
Janaina
1001 1 3
1003 21
57
60
16
2
Figure 29: Snowball contact generation
Not interviewed
Industry Representative
Manufacturers Association
3rd Tier Supplier
2nd Tier Suuplier
1st Tier Supplier
Focal Company
1st Tier Buyer
2nd Tier Buyer
Final Customer
Marketing Research Company
Academic Research Institution
* Indicated for more than 1 person

109
3.1.3 Sub-Sectors
Although considered under the same “umbrella”, the variety of firms and the products and
services in the cosmetics industry is very diverse. After developing an initial understanding of
the cosmetics industry, we realized that, in order to be able to really deepen our understanding,
we would need to divide it into sub-sectors. We divided the industry based on production
complexity, including not only the production process itself, but also research and development
complexity, marketing complexity, and the complexity of the legislation that the sub-sector
was subject to.
Although there were some “gray” categories, two sub-sectors became very clear: beauty
products and dermocosmetics. There are many differences between them, but the biggest are
related to the regulatory requirements demanded by the Brazilian National Health Surveillance
Agency (Anvisa), which is responsible for the regulation and registration of toiletries,
cosmetics, and perfumes. Cosmetics are divided into two different categories, based on their
inherent risk. Risk I cosmetics are those with basic or elementary properties, and that do not
need any detailed information about its way to use, such as a basic moisturizing cream. For this
kind of product, a simple notification in Anvisa’s website following an online procedure (with
pro forma approval) is sufficient. Usually, within 48 hours of submission, a Risk I product can
be launched in the market. On the other hand, the Risk II cosmetics’ approval process is much
longer and much more complicated. Risk II cosmetics, such as sunscreens, eye-area creams, or
any other cosmetics with treatment properties (i.e. anti-aging, anti-acne, whiteners, anti-
cellulitis, etc.) are subject to what are called “registration” processes”, which require proof of
efficacy and safety. Risk II products have to be submitted and approved by Anvisa before

110
Deodorants
Fragrances 1st
Sunscreen
Children
Men’s
Hair Care
Bath
Depilatories
2nd
Oral Hygiene
Makeup 3rd
Skin Care 5th
marketing. “It usually takes around 60 days before the first manifestation from a local Agency
is heard” (Mano, 2014). Risk I and Risk II products correspond to what we are referring to as
the beauty products and dermocosmetics sub-sectors, respectively.
Due to the regulatory complexity for dermocosmetics products, many cosmetics firms have
decided to work only with beauty products. Those firms that work with dermocosmetics
products have to invest substantially more resources into their R&D production processes.
Some examples of beauty products and dermocosmetics products within the ABIHPEC
personal care products categories are shown in Figure 30.
Figure 30: Examples of beauty products and dermocosmetics products
Dermocosmetics
Beauty Products
Beauty Products
Dermocosmetics
111
3.2 Instruments
We followed Eisenhardt's (1989) and Yin's (2013) suggestions for developing semi-structured
interview protocols. We used open-ended questions, in order to allow us to learn about causal
linkages and key transition points in buyer-supplier relationships (McCracken 1988; Zaltman
1997). Since the most of the interviews were conducted in Brazil, the instruments were
developed in both Portuguese and in English. The interview protocol differed by respondent
function and also by whether the intended respondent was on the buyer side or the supplier
side.
3.2.1 Interview Protocol
We collected multi-level data to allow us to develop a better the understanding of the supply
chains that were studied. As a result, our interview protocol included questions about the
industrial sector we are investigating, the mid-range events that impact the firms within this
industrial sector, and the buyer-supplier relationships themselves. The questions on the
interview fell into broad categories: 1) Understanding the industrial sector (firm rules,
procedures, main goals, etc. for purchasing); 2) Identifying the mid-range events; and 3)
Understanding the buyer-supplier relationship (nature of the buyer-supplier relationship before
the mid-range event, how the event was perceived by the buyers and how it impacted the
relationship with suppliers, what were the main responses to the event, and what were the
outcomes).

112
Appendix A contains the interview protocol. As themes emerged during the interviews, the
protocol were modified to include them and allow further probing of key emergent issues. The
interview protocol differentiated in focus according to the target and the function of the
informant, although several questions were essentially the same for most of them. In order to
help the interviewer follow the process, we also listed some prompts to ensure the data
collection was going in the expected direction. Table 13 presents the main questions, as they
were presented to each interviewee, and also their prompts.

113
Question Buyer
Side
Supplier
Side
Industrial
Sector
Representative
Prompts
1.Please tell me about
your firm*.
* sector
* History, market position
* Main challenges, main products/services offered, and main suppliers (kind
of supplying – generally)
2. How do you classify
your suppliers?
* Service or goods
* Commodities or specific
* Importance level (critical or non-critical); amount of money a. How do you classify
your
clients/customers?
b. How do you see the
_____ (name of the
specific) sector?
* Who are the main players?
* How is the sector evolving over the past few years?
* What are the expectations for the next few years?
3. What do you purchase
the most?
* Which item(s)
* Portion of the total budget
* Frequency of purchase
* Number (and representativeness) of suppliers/customers/clients
* Number of individuals involved with this purchase/selling
a. What do you sell the
most?
4. How has the
relationship with these
suppliers* been
influenced over the
last couple years?
*
Customers/
Buyers
* the relationship
among buyers and
suppliers within the
industrial sector
* How complex is the supply chain?
* What are the technological challenges?
* What are the legal/governmental/sustainability challenges?
* What are the geographical challenges?
* Were there any (mid-range) event that impacted the relationship in any
way?

114
Question Buyer
Side
Supplier
Side
Industrial
Sector
Representative
Prompts
5.Please tell me about
those events and their
impacts.
* What happened, when it happened, what led to it?
* What were the impacts and outcomes?
* Was there any impact on purchase policies?
* Did you keep the same suppliers/customers? Did you event
suppliers/customers?
* Did you keep the same kind of purchase/selling (goods or services)?
* Was there any impact on the financial costs?
* Any other impact?
6. Please tell me about
the outcomes and the
processes that you
went through to arrive
at these outcomes.
* Good or bad outcomes?
* Was it possible to just follow the firm’s purchasing policies and rules?
* How do you think the firm saw the outcomes?
* What do YOU think about the outcomes (positive or negative and why)?
* Did you have plenty of time to make the needed decisions?
* Was there anything that was needed to be done differently? What, tell me
about it?
* What was the role of the individuals directly involved in the decision
making?
* What do you think about their success or failure?
* What do you think about your role in the processes and outcomes?
* Is there anything you think that should have been done differently? Why?
7. Anything else you
would like to share
with me?
Table 13: Interview protocol
115
3.2.2 Pre-Test
In order to refine the key constructs and the interview protocol, a pre-test was run. The pre-test
provided a good background to improve our research questions, model, open-ended interview
questions, and prompts. Twelve interviews were conducted in the period between October 30,
2013 and December 16, 2013. To select informants for the pre-test, we drew upon acquaintances
who had prior purchasing experience, taking in consideration the individual’s familiarity with a
buyer-supplier relationship.
We pre-tested our instruments with informants on the buyer side, the supplier side, and industrial
sector firms. The interviews were conducted using Skype software or by telephone. They were
recorded, transcribed, and those that were conducted in Portuguese were translated into English
by the author. The time of the interviews ranged from 30 minutes to 2.5 hours. Some of the
interviews were divided into two days, according to the person’s availability. In total 12 interviews
were conducted during the pre-test phase.
We kept the same basic interview questions structure used in the pre-test for the actual data
collection. The main difference was the familiarity of the researcher with the protocol, which we
were able to build upon the initial interviews. For the actual data collection, though, we kept the
same structure, we allowed the interviewees to talk more openly about the topics and we added
questions in order to fulfill our goals as opportunities arose during the time of the interview. In
doing this, we were able to conduct the interviews in a more friendly and informal way, allowing
the informants to feel more comfortable talking about the topics we were discussing.
116
3.2.3 Procedures
The following procedures were followed for each interview. First, we identified the possible firms
and contacts within the firm. Once we had obtained their contact information (e-mail address or
phone number), we proceeded in the following manner: 1) send an e-mail, briefly introducing
ourselves and the goals of the research; 2) if they indicated possible willingness to participate, we
sent another email with more detailed information ; 3) decide the way the interview would be
conducted (in person, phone, or Skype) and schedule it; 4) conduct and record the interview; 5)
transcribe the interview; and 6) analyze the interviews.
3.2.4 Transcription and Translation
As soon as an interview was completed we transcribed its content from the recording. A third party
hired for this specific purpose did most of the transcriptions. To maintain the fidelity of the
transcription, we developed clear procedures for transcription. For example, the transcription
recorded the exact words used. If the respondent made a long pause before an answer, we
transcribed it as an ellipsis “(…)”. Some body language was also incorporated in brackets “[ ]”
for personal or Skype interviews, since the non-verbal language can be important in data analysis.
If the transcriptionist had any questions during a transcription, the researcher listened or watched
the recorded interview again.
The decision about which language to use (English or Portuguese) depended upon the decision of
the person who was being interviewed. Most of our interviews were conducted in Portuguese.
117
After transcription, some parts of the interviews were translated into English to allow information
triangulation. However, the majority of the transcripts remained in Portuguese, in order to capture
the nuances of the language used by the interviewees.
3.2.5 Triangulation
We used three types of triangulation: data triangulation, investigators triangulation, and theory
triangulation. Each is described below.
For data triangulation, we used multiple sources of evidence, including interviews, secondary data,
observations, and site visits. Sources of secondary data varied by availability for each firm, but
included annual reports, supplier guides, presentations, internal brochures, internal news, news in
open media sources and legal documents.
For investigators triangulation, we had different specialists evaluating the data that was collected
and transcribed, including the main researcher and a board of advisors. This helped to mitigate any
potential biases in analyzing the data.
For theory triangulation, we applied several different theoretical perspectives to the same data set,
both in developing the interview protocol and analyzing the data. These included social network
theory, attribution theory, and behavioral biases and heuristics theories.

118
3.3 Industry
We started by working with organizations that represented the cosmetics industry as a whole. We
selected some international organizations that do market research for this industry, in order to
understand who the main players in Brazil were. Following that, we worked with the Brazilian
associations that represents the cosmetics, toiletries and fragrances sectors nationally and
internationally, known as ABIHPEC. It coordinates various programs, in order to promote
Brazilian cosmetics exports. We also worked with another industry association, the Brazilian
Association of Cosmetology (ABC), a cosmetics industry manufacturers. The associations plus the
marketing research firm provided important assistance generating firm names and contacts.
3.3.1 Focal Firms
When selecting the focal firms, we followed the guidance provided by Eisenhardt (1989) and Yin
(2014). Our sample was intentionally selected to be representative in terms of: i) market share in
each sub-sector; ii) size of the firm; iii) products manufactured; and iv) length of its existence. The
focal firms functioned as both buyers and suppliers. They were buyer firms when they were, for
instance, buying chemical ingredients, raw materials, or packaging solutions from their suppliers.
They were considered supplier firms when they were dealing with their customers, which could
be distributors, franchise stores, or even final customers. We selected two focal firms in the
dermocosmetics sub-sector and four firms in the beauty products sub-sector.
119
We tried to select the focal firms in a way that they could be compared on several criteria. We
searched for firms that were comparable in terms of their size, market share, core products
manufactured, target main customers, and length of existence. In addition, we grouped the focal
firms in pairs to allow deeper analysis. Pair number one includes the two dermocosmetics firms.
Pair number two is comprised of two spin-off firms, which sell to a specific niche of final
customers. Pair number three contains the two biggest beauty products firms in Brazil, which
compete in different sales channels.
Table 14 shows some of the main characteristics of the selected focal firms. The names of the
firms were disguised, in order to ensure confidentiality.

120
Pair Focal
Firm Sub-Sector Market Share # Employees Core Products Target Customers
Firm’s
age
1
D1 Dermocosmetics Among the top 3 in
dermocosmetics 51-200 Body and facial treatment Esthetic professionals 20+
D2 Dermocosmetics Among the top 3 in
dermocosmetics 51-200
Body and facial treatment,
sunscreens
Esthetic professionals,
dermatologists 20+
2
B1 Beauty Products Niche 51-200 Makeup, fragrances,
moisturizing lotions Consumers < 5
B2 Beauty Products Niche 51-200 Makeup, fragrances,
moisturizing lotions Consumers < 5
3
B3 Beauty Products Among the top 3 in
beauty products 1000+
Makeup, fragrances,
moisturizing lotions Consumers 20+
B4 Beauty Products Among the top 3 in
beauty products 1000+
Makeup, fragrances,
moisturizing lotions Consumers 20+
Table 14: Characteristics of the focal firms
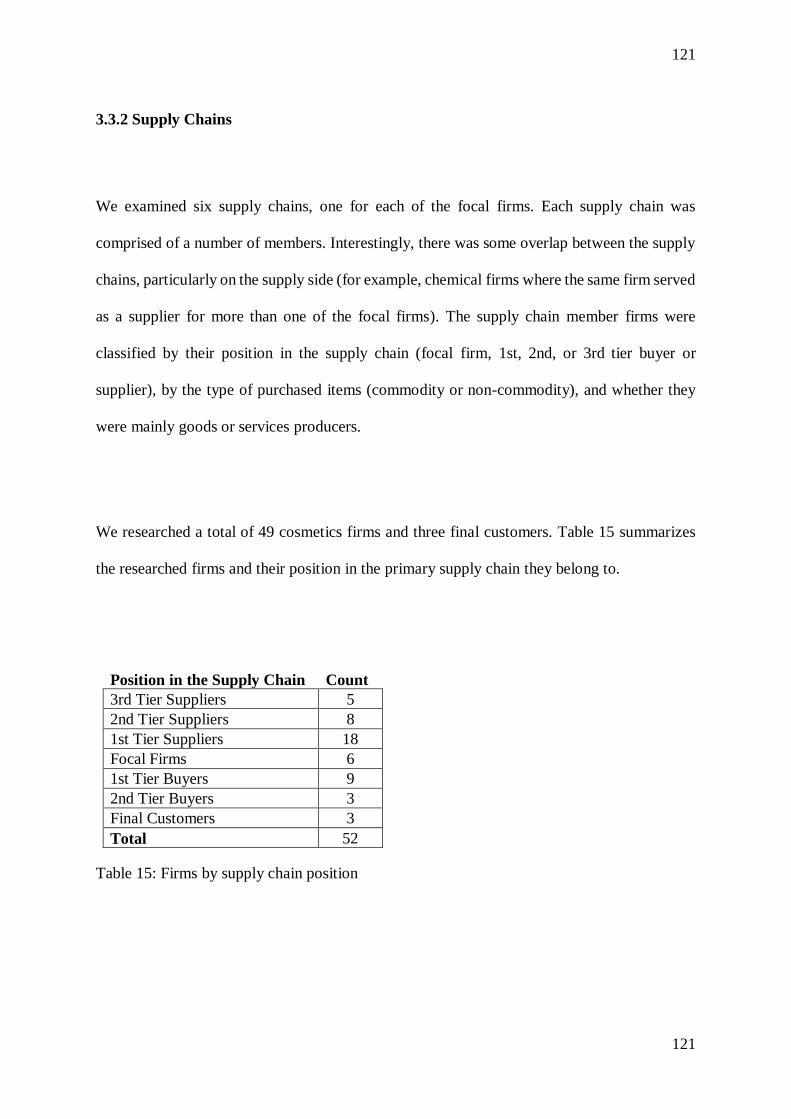
121
121
3.3.2 Supply Chains
We examined six supply chains, one for each of the focal firms. Each supply chain was
comprised of a number of members. Interestingly, there was some overlap between the supply
chains, particularly on the supply side (for example, chemical firms where the same firm served
as a supplier for more than one of the focal firms). The supply chain member firms were
classified by their position in the supply chain (focal firm, 1st, 2nd, or 3rd tier buyer or
supplier), by the type of purchased items (commodity or non-commodity), and whether they
were mainly goods or services producers.
We researched a total of 49 cosmetics firms and three final customers. Table 15 summarizes
the researched firms and their position in the primary supply chain they belong to.
Position in the Supply Chain Count
3rd Tier Suppliers 5
2nd Tier Suppliers 8
1st Tier Suppliers 18
Focal Firms 6
1st Tier Buyers 9
2nd Tier Buyers 3
Final Customers 3
Total 52
Table 15: Firms by supply chain position

122
122
Of the 499 researched firms, 37 were related to product manufacturing and 12 were some kind
of service provider. We categorized all of the firms that were related to a delivery of a tangible
good as products buyers, suppliers, or manufacturers. Examples of product firms included
manufacturers, chemical ingredients manufacturers or distributors, raw-material suppliers,
raw-material converters, various sorts of packaging firms, and franchise stores, among others.
The service providers were comprised of those firms that mainly exchange non-tangible goods.
Examples included industry representative and manufacturers associations, market research
firms, third partner logistics providers, outsourced manufacturers firms, some kinds of
packaging solutions firms (printing firms), beauty clinics or salons, etc.
Related to the complexity of the products or services, 32 of the firms were related to non-
commodities services or goods and 17 were commodities providers. The non-commodities
firms produced goods or services which fit in one or both of the following categories: i) they
were not easily found and offered by many suppliers, and ii) they would be used as part as the
aggregated value of the final product or service. Within chemical ingredients, as an example,
the non-commodities firms were those that classified themselves as “specific components”
firms or those that were considered as “specific components” suppliers by their buyers.
Examples of non-commodities firms include dermocosmetics manufacturers, some chemical
ingredients suppliers, and outsourcing manufacturers, among others. The commodities firms
were classified as commodities firms when their products or services were generic, did not
involve a lot of innovation, customization, or they could be easily provided by another supplier.
Examples include cosmetics manufacturers and their franchise stores, some chemical
ingredients, etc. Table 16 shows the number of firms by industrial sector and types of supply.
Products Services
9 The three final customers were dropped from the total number (52-3=49).
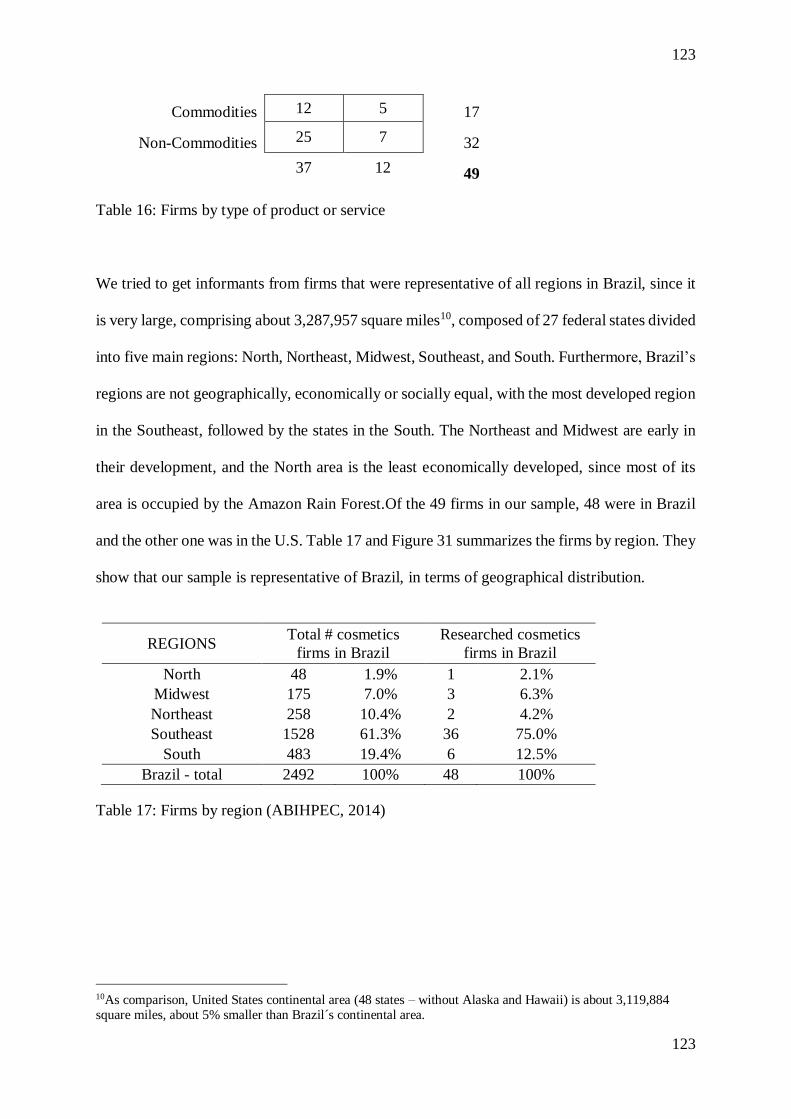
123
123
Commodities 12 5 17
Non-Commodities 25 7 32
37 12 49
Table 16: Firms by type of product or service
We tried to get informants from firms that were representative of all regions in Brazil, since it
is very large, comprising about 3,287,957 square miles10, composed of 27 federal states divided
into five main regions: North, Northeast, Midwest, Southeast, and South. Furthermore, Brazil’s
regions are not geographically, economically or socially equal, with the most developed region
in the Southeast, followed by the states in the South. The Northeast and Midwest are early in
their development, and the North area is the least economically developed, since most of its
area is occupied by the Amazon Rain Forest.Of the 49 firms in our sample, 48 were in Brazil
and the other one was in the U.S. Table 17 and Figure 31 summarizes the firms by region. They
show that our sample is representative of Brazil, in terms of geographical distribution.
REGIONS Total # cosmetics
firms in Brazil
Researched cosmetics
firms in Brazil
North 48 1.9% 1 2.1%
Midwest 175 7.0% 3 6.3%
Northeast 258 10.4% 2 4.2%
Southeast 1528 61.3% 36 75.0%
South 483 19.4% 6 12.5%
Brazil - total 2492 100% 48 100%
Table 17: Firms by region (ABIHPEC, 2014)
10As comparison, United States continental area (48 states – without Alaska and Hawaii) is about 3,119,884 square miles, about 5% smaller than Brazil´s continental area.
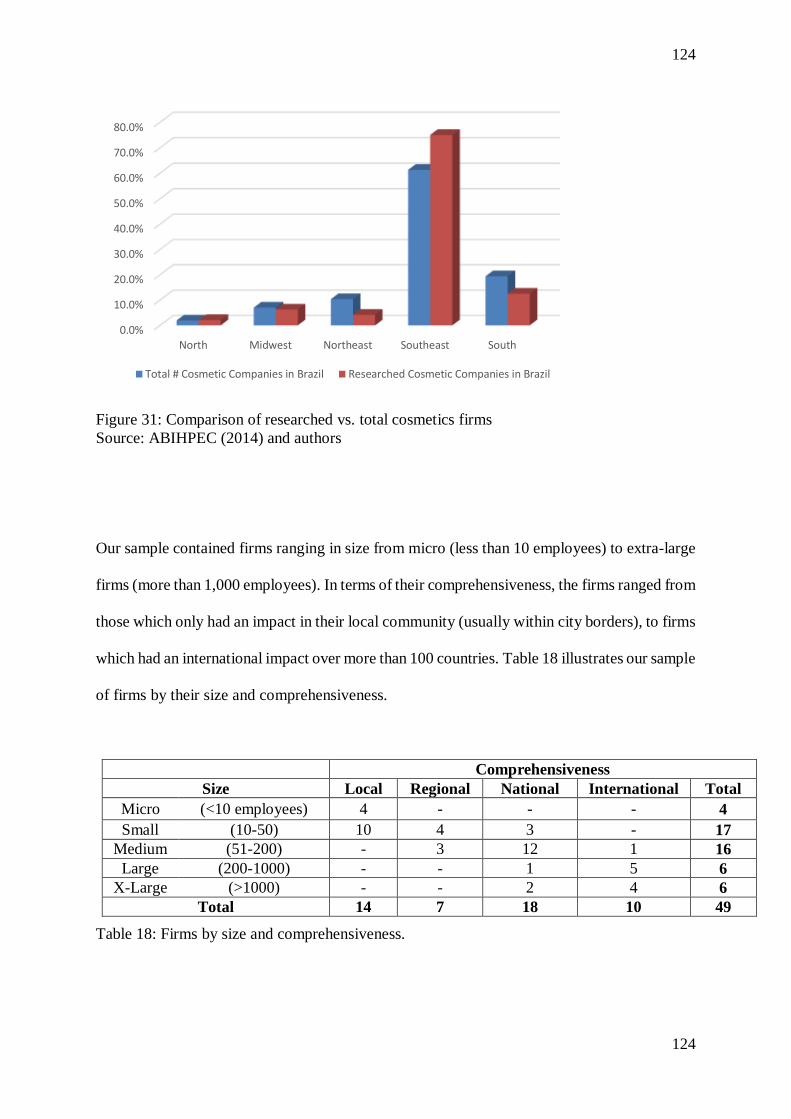
124
124
Figure 31: Comparison of researched vs. total cosmetics firms
Source: ABIHPEC (2014) and authors
Our sample contained firms ranging in size from micro (less than 10 employees) to extra-large
firms (more than 1,000 employees). In terms of their comprehensiveness, the firms ranged from
those which only had an impact in their local community (usually within city borders), to firms
which had an international impact over more than 100 countries. Table 18 illustrates our sample
of firms by their size and comprehensiveness.
Comprehensiveness
Size Local Regional National International Total
Micro (<10 employees) 4 - - - 4
Small (10-50) 10 4 3 - 17
Medium (51-200) - 3 12 1 16
Large (200-1000) - - 1 5 6
X-Large (>1000) - - 2 4 6
Total 14 7 18 10 49
Table 18: Firms by size and comprehensiveness.
0.0%
10.0%
20.0%
30.0%
40.0%
50.0%
60.0%
70.0%
80.0%
North Midwest Northeast Southeast South
Total # Cosmetic Companies in Brazil Researched Cosmetic Companies in Brazil
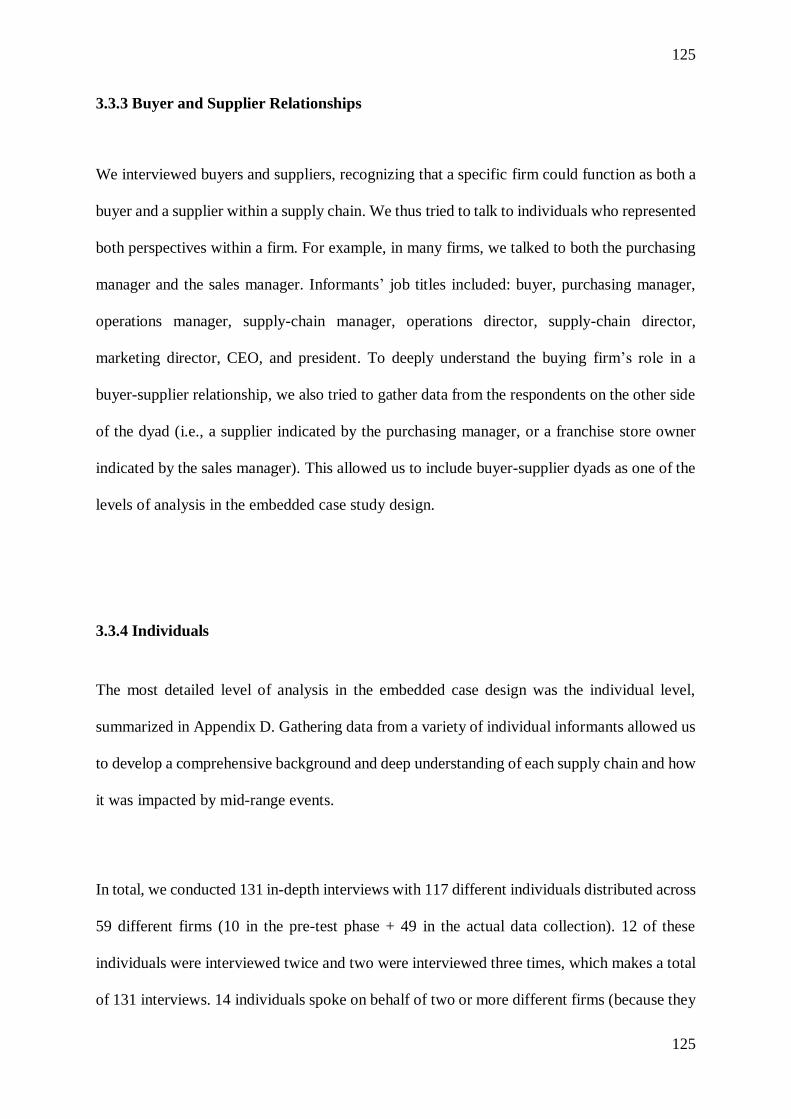
125
125
3.3.3 Buyer and Supplier Relationships
We interviewed buyers and suppliers, recognizing that a specific firm could function as both a
buyer and a supplier within a supply chain. We thus tried to talk to individuals who represented
both perspectives within a firm. For example, in many firms, we talked to both the purchasing
manager and the sales manager. Informants’ job titles included: buyer, purchasing manager,
operations manager, supply-chain manager, operations director, supply-chain director,
marketing director, CEO, and president. To deeply understand the buying firm’s role in a
buyer-supplier relationship, we also tried to gather data from the respondents on the other side
of the dyad (i.e., a supplier indicated by the purchasing manager, or a franchise store owner
indicated by the sales manager). This allowed us to include buyer-supplier dyads as one of the
levels of analysis in the embedded case study design.
3.3.4 Individuals
The most detailed level of analysis in the embedded case design was the individual level,
summarized in Appendix D. Gathering data from a variety of individual informants allowed us
to develop a comprehensive background and deep understanding of each supply chain and how
it was impacted by mid-range events.
In total, we conducted 131 in-depth interviews with 117 different individuals distributed across
59 different firms (10 in the pre-test phase + 49 in the actual data collection). 12 of these
individuals were interviewed twice and two were interviewed three times, which makes a total
of 131 interviews. 14 individuals spoke on behalf of two or more different firms (because they
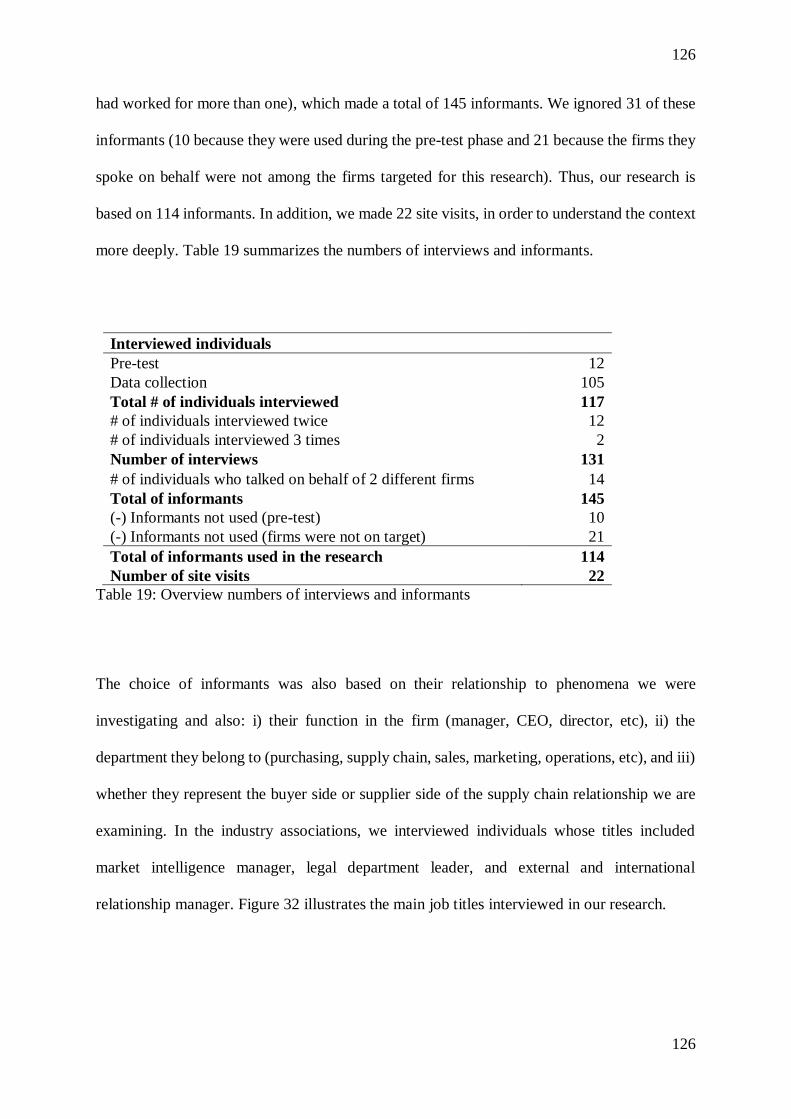
126
126
had worked for more than one), which made a total of 145 informants. We ignored 31 of these
informants (10 because they were used during the pre-test phase and 21 because the firms they
spoke on behalf were not among the firms targeted for this research). Thus, our research is
based on 114 informants. In addition, we made 22 site visits, in order to understand the context
more deeply. Table 19 summarizes the numbers of interviews and informants.
Interviewed individuals
Pre-test 12
Data collection 105
Total # of individuals interviewed 117
# of individuals interviewed twice 12
# of individuals interviewed 3 times 2
Number of interviews 131
# of individuals who talked on behalf of 2 different firms 14
Total of informants 145
(-) Informants not used (pre-test) 10
(-) Informants not used (firms were not on target) 21
Total of informants used in the research 114
Number of site visits 22
Table 19: Overview numbers of interviews and informants
The choice of informants was also based on their relationship to phenomena we were
investigating and also: i) their function in the firm (manager, CEO, director, etc), ii) the
department they belong to (purchasing, supply chain, sales, marketing, operations, etc), and iii)
whether they represent the buyer side or supplier side of the supply chain relationship we are
examining. In the industry associations, we interviewed individuals whose titles included
market intelligence manager, legal department leader, and external and international
relationship manager. Figure 32 illustrates the main job titles interviewed in our research.

127
127
1st, 2nd, and 3rd Tier Suppliers
* Sales Executive
* Operations Manager
* Supply-Chain Manager
Focal Company
* Buyer
* Purchasing Manager
* Operations Director
*R&D Manager
* CEO
* Sales Manager
* Marketing Manager
1st, 2nd, and 3rd Tier Buyers
* Franchise Owner
* Salespeople
* Purchasing Manager
* Final Customer
Figure 32: Main job titles interviewed
We interviewed individuals representing different perspectives in each firm. When we talked
to a purchasing manager, we considered this as the perspective of the buyer side. On the other
hand, if we talked to a sales manager, we considered this as the perspective of the supplier side.
On the administrative side, we included informants who did not have much contact with either
Industrial Sector Associations:
* Market Intelligence Manager
* Legal Department Leader
* External and International Relationship Manager
Buyer and Supplier
Relationships
Individual

128
128
suppliers or customers. In addition, we also interviewed some individuals who were very
familiar with both sides, from their perspectives as buyers and as suppliers. We called this the
strategic perspective. Figure 33 illustrates the percentage of informants from each perspective.
Figure 33: Informants by perspective
45%
46%
3% 6%
Buyer perspective
Supplier perspective
Administrativeperspective
Strategy perspective

129
129
3.4 Data Analysis
We analyzed the data in three main different stages: within-case analysis, cross-case analysis
and interpretation of the findings through different theoretical lenses, including the proposed
stone skipping theory. In order to search for patterns, we will follow Eisenhardt’s (1989),
Rosenthal and Tatikonda’s (1993), Yin’s (2013), and Miles et al.’s (2014) suggestions for data
analysis.
3.4.1 Within-Cases
Within-case analysis was conducted for supply chain. We began the analysis by coding the
transcripts of the interviews. We also coded the secondary data sources, when possible. We
developed a one-page overview of each supply chain, which was followed by a comprehensive
narrative for each researched supply chain, as described on Section 4.1 that integrated the data
from all investigated sources.
3.4.1.1 Coding
To code the collected transcripts, we searched for speech patterns that indicate biases or
heuristics, based on Krippendorff (2013)’s framework. Codes are labels that give specific
meanings to descriptive or inferential information compiled during the study. Codes are

130
130
intrinsically related to inferences in analysis (Miles et al, 2014). Codes were attributed to a
specific piece of information after careful reading and reflection on its core content meaning.
We used both, software assisted and manual coding. We began the data analysis using N-vivo
software, to help with initial categorization and data analysis. This attached prior key words
and tags to segments of texts, which allowed later retrieval and further refinement. We then
used manual coding; searching for new and refined patterns, further developing the initial
labeling of the data. The codes were developed by the main researcher. As a way to ensure
validity, some portions of analysis were triangulated by the board of advisors, as well as the
researcher. In case of disagreement about a code, a meeting was held to discuss the criteria and
arrive at a consensus about the label to be used. This final code was placed on the coded
transcripts. This process was iterative. Example of set of codes, based on Table 2 is shown
below, based on one of the interviews run during the pre-test phase and how some codes were
attributed to it. In that interview we talked to a supply-chain manager in a very large worldwide
manufacturing company. The intention is to illustrate the process we used to code the data
collected.
Transcript A: “Usually for indirect components, the total amount is not so
important. The most important thing is that I know that supplier for such a long
time that I know he will do a good job. This way I can pay attention in other more
important purchases. Sometimes I don’t even try another possibilities, don’t even
check any other prices or possibilities.”
The interviewee above talks about indirect components. In that case, indirect
components mean “commodities products or services”. The combination of the statements: “I
know that supplier for such a long time”, “I know he will do a good job”, and “Sometimes I
don’t even try another possibilities, don’t even check any other prices or possibilities” were
indicators of the presence of the status quo bias.
131
131
In another interview, this time with a general supply manager of a major manufacturing
base industry in Brazil, we could identify another biases. That interviewee talked about the
way they deal differently with each supplier. As an example he uses specific and non-specific
supplying (commodities or non-commodities). A portion of the interview is transcribed bellow.
Transcription B: “It’s not official, but I think that we put our suppliers in a kind
of layers… If he supplies stuff that I have easily availability of a bunch of other
options in the market, I’ll squeeze11 him until I can…” –“If he is a strategic
supplier, then it’s different… We try to have a personal relationship…”
At this time, another heuristic and bias can be perceived though this interviewee’s
words. The statements analyzed were: (…) “I think that we put our suppliers in a kind of
layers”, and “If he supplies stuff that I have easily availability of a bunch of other options in
the market, I’ll squeeze him until I can…” –“If he is a strategic supplier, then it’s different…
We try to have a personal relationship with them…”. These words can be understood as a
reflection of opportunism. But also it can be a reflection of the loss aversion heuristic. Loss
aversion states that people are risk averse in terms of gains, although they are at the same time
risk loving in terms of losses.
To codify locus of control, we will used as a reference the scale of locus of control developed
by (Rotter, 1966). Although we did not apply the scale itself, we used its questions as reference
to identify internal or external locus of control pattern expressed by the interviewees. Examples
could be found in expressions, such as “I cannot do a lot, at the end of the day, even if I do my
best, my manger is the one who decides everything here in this company”. This example
together with other expressions was used as indicators of external locus of control.
11 The interviewee at this moment made the movement illustrating a squeeze of something with his hands.

132
132
3.4.1.2 One-Page Overview
For data reduction and summary, we developed a one-page overview of each direct buyer-
supplier relationship identified in the researched supply chains. It was used a form that
summarized main findings, just highlighting the identified information. The main goal of the
one-page overview was concentrate the most important information regarded to each case in a
visually practical and useful manner. This sheet helped the identification of the patterns, both
within and across the cases. An example of the one-page overview form is presented in Table
20.

133
133
Main Case: Within Case
Relationship:
People: Person 1 (name/company) Person 2 (name/company)
Function Executive Manager Director CEO
President Founder ______
Executive Manager Director CEO
President Founder __________
Area Purchasing / Sales / R&D / Strategy
/ Operations / SCM
Purchasing / Sales / R&D / Strategy /
Operations / SCM
Position in the Supply
Chain
1st 2nd 3rd
Buyer / Supplier / Focal Company
1st 2nd 3rd
Buyer / Supplier / Focal Company
Relationship Length Long (5+ years) / Intermediate (1-5 years) / Short (>1 year)
Relationship supercedes
companies? Yes / No Obs:
Relationship Strength Strong / Medium / Weak Obs:
Characteristics: Good Service
Commodity Non-commodity
Mid-range change:
Impact on purchasing
policies: High / Medium / Low Obs:
Outcome: Positive / Negative / Non-identified Obs:
Possible to identify
subjective perception? Yes / No Ex:
Locus of Control (1) Internal / External (2) Internal / External
Heuristics: Related Biases:
Representativeness
Base Rate Frequency Intensity to
Sample Size Law of Small Numbers
Insensitivity to predictability Illusory
correlation
Misconceptions of
regression
Availability
Salient Information Confirmation Bias
Imaginability ==> Overconfidence
and/or Wishful thinking
Adjustment and
Anchoring
Insufficient Adjustment
Evaluation of Conjunctive and
Disjunctive Events ==>
Inconsistency
and/or Planning fallacy
Assessment of Subjective
Probability distributions ==> Illusion of control
Heuristic Attribution Procrastination
Affect Heuristic Information avoidance
Loss Aversion Endowment Effect Mental Account Hyperbolic Discount
Status Quo Bias Framing Effects
Two-Systems
Reasoning Intuition
Table 20: Within-case analysis: one-page overview

134
134
3.4.1.3 Detailed Narrative
A detailed narrative of each supply chain was written, integrating the information from the
interviews and other sources of information. In this detailed narrative, we wrote about the six
multi-tiers, multi-dimension supply chains. In addition, we described the industry, sub-sector,
and the focal firm in that supply chain. We understood that this way we were able to
demonstrate through words the main challenges and outcomes of that supply chain, identifying
the events which impact had travelled beyond the source firm itself, allowing us to proceed in
the analysis of the impacts searching for possible patterns that emerged, and leading us to
understand the why and how the impact of some events in a focal firm affect other members
of its own and other supply chains.
3.4.2 Cross Case Analysis
Miles et al. (2014) describes cross-case analysis as increasing “the generalizability or the
transferability to other contexts” (p. 101), in order to deepen understanding and explanation.
Cross-case case analysis was conducted after most of the data collection and within cases
analysis were very in an advanced point, allowing preliminary themes to be further assessed,
during the later data collection. The use of cross-case analysis within multiple cases allowed
us to find patterns, similarities and differences among the data to generate and/or strengthen
our theory (Eisenhardt, 1989). We used several approaches to search for patterns across the
cases, related to decisions that have been made and implemented, causing the events and the
individuals biases and heuristics that influence them.

135
135
3.4.2.1 Social Network Analysis
In order to illustrate the characteristics of the supply chains, and to analyze the relationships
among the informants and firms, we used social network analysis to allow initial findings to
emerge. Sticky notes were used to manually portray the firms and relationships between them.
It became evident that the complexity was not just limited to multiple tiers in multiple supply
chains; the same tiers could play different roles in different supply chains. The same firm that
was a first tier supplier in one supply chain could represent a second, third, or even fourth tier
supplier in another supply chain. Thus, the same firm might be found in different positions as
we describe the six supply chains.
Figure 35 represents the final chart manually built as the qualitative representation of the supply
chains.
Figure 34: Final chart of the process to start analyzing the results of the collected data

136
136
The large number of possible relationships was also considered in the decision to use social
network analysis. Taking just one focal firm as an example, six individuals were interviewed
from D1. There were 15 possible relationships among the six interviewees, just within D1.
Assuming that the relationship between A and B is the same that the relationship between B
and A, there are C62 combinations of 6, 2 by 2 = 6!/4! . 2! - Thus, the six supply chains contain
6,441 possible reciprocal relationships (B1142). Thus, in addition to the qualitative analysis,
social network analysis was used, employing Ucinet 6.0 to gain better understanding of the
collected data. The strength of the relationship between the nodes was evaluated using the
following qualitative scale: zero = no relationship (no line), one = occasional, two = often, and
three = frequent relationship between the firms, which will make the line thicker.
Figure 35 in Section 4.1.1 provides the illustration of the researched supply chains built using
Ucinet 6.0
3.4.2.2 Master Table
A master table was developed, based on the data in the one-page case summary sheets. This
provided the foundation for developing a series of tables that could let us arrange and group
the data in different ways, in order to allow the themes to emerge. Example of the master table
created in provided in Section 3.5.1.2 through Table 22, Table 24, Table 23, and Table 25
3.4.2.3 Pattern Matching
137
137
To address the possible patterns among the cases, the master table was sorted and grouped
arranging the findings in different ways. As an example, we identified similarities and
differences among the cases when sorted by locus of control, and differences between those
with internal vs. internal locus of control. Following, searching for similarities in the cases,
where an internal (or external) locus of control was identified. Some of the matching patterns
were provided through the tables and charts presented earlier in this chapter. Examples include
Table 16, Table 17, Table 18, and Figure 31.
3.5 Ethical Issues
In order to address all the needed steps to assure confidentiality and other ethical issues
involving the informants, we submitted this proposal, as well as all our research protocols, to
the Indiana University Institutional Research Board (IU-IRB) and received its approval, as
shown in Appendix B.
To address any potential ethical issues, we followed the Ethical Principles and Guidelines for
the Protection of Human Subjects of Research addressed in the Belmont Report: Ethical
principles and guidelines for the protection of human subjects of research (The Belmont Report,
1978) which are: respect for persons, beneficence, and justice. According to the Belmont
Report, "respect for persons requires that subjects, to the degree that they are capable, be given
the opportunity to choose what shall or shall not happen to them. This opportunity is provided
when adequate standards for informed consent are satisfied" (National Commission, 1978). To
fulfill this principle, we developed an informed consent document that stressed the
voluntariness of the research for the targeted respondents and their understanding of the
138
138
research goals, using simple language. We assured their autonomy and freedom to volunteer
for research without coercion or undue influence from others. We explained the informed
consent document to them, checked if they had any questions, answered their questions, and
then asked for their signature. The informed consent document was presented in both languages
in which the study was conducted (Portuguese and English), as shown in Appendix C.
Even though the Belmont Report does not address privacy directly, respect for persons also
involves “respecting an individual’s right to privacy, the right to control access to one's self
and information, and protecting the confidentiality of private, identifiable information about
individuals”. In our study, we assured privacy by not using the names of any of the informants.
In order to keep the confidentiality of the firms, we developed “labels” for each firm, based on
their characteristics. A master list of actual firm names and their labels, as well as their
individual informants, was maintained by the researchers, but neither was it revealed in this
thesis nor will it be in any reports or research papers.
Beneficence in Belmont Report is defined as “human subjects should not be harmed and the
research should maximize possible benefits and minimize possible harms”. This study does not
involve any kind of physical, mental or psychological danger or hazards to the informants. The
informants participated in interviews, meetings, and site visits. However, we stressed their
autonomy in the informed consent document. We re-emphasized their right to not answer a
specific question if they did not feel comfortable, to stop the interview at any time, or to quit
the study if they preferred to.
Justice is described in the Belmont Report as “the benefits and risks of research must be
distributed fairly.” The expected benefits from our study are related to the understanding of

139
139
how buyer and supplier relationships evolve after a mid-range event. We told the respondents
that their interviews provide evidence about how the way buyers and suppliers deal with “mid-
range events” impacts buyer-supplier relationships, value creation and appropriation, the
buyer’s competitive advantage, and even the entire industry. We also stressed that the results
of this research may help firms understand how to develop better relationships and better
performance. An executive summary report was sent to each of the respondents, containing the
main findings of this research.
3.6 Reliability and Validity
According to Yin (2013), the quality of a case study is ensured by demonstration of its construct
validity, internal validity, external validity and reliability. In the following sections, we discuss
their definitions and how validity and reliability were addressed in this research.
3.6.1 Reliability
Reliability refers to the consistency and stability of a measure (Muchinsky, 1996). It is the
extent to which a later researcher following the same procedures will come to the same
conclusions, minimizing error and bias in the study. Krippendorff (2013) suggests that the way
that the data is obtained plays an important role in its reliability. He describes three types of
reliability: stability, replicability, and accuracy. We followed Krippendorff’s (2013), Yin
(2013) and Miles et al. (2014) suggestions in addressing reliability.
3.6.1.1 Stability
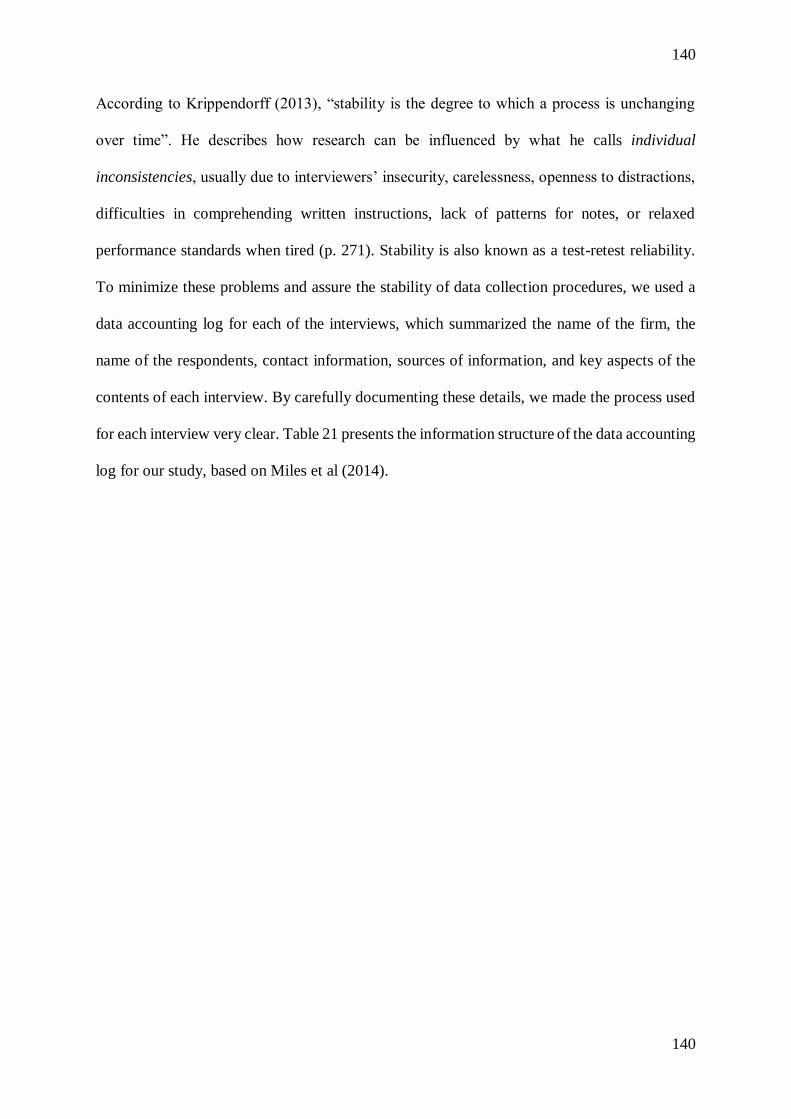
140
140
According to Krippendorff (2013), “stability is the degree to which a process is unchanging
over time”. He describes how research can be influenced by what he calls individual
inconsistencies, usually due to interviewers’ insecurity, carelessness, openness to distractions,
difficulties in comprehending written instructions, lack of patterns for notes, or relaxed
performance standards when tired (p. 271). Stability is also known as a test-retest reliability.
To minimize these problems and assure the stability of data collection procedures, we used a
data accounting log for each of the interviews, which summarized the name of the firm, the
name of the respondents, contact information, sources of information, and key aspects of the
contents of each interview. By carefully documenting these details, we made the process used
for each interview very clear. Table 21 presents the information structure of the data accounting
log for our study, based on Miles et al (2014).

141
141
Name of the
interviewee
Firm:
Country: Brazil United States
Sub-Sector: Cosmetics Dermocosmetics
Position in the
Supply-Chain
Focal firm
Buyer side or supplier
side?
___ Buyer
___ Purchasing manager
___ Operations manager
___ Supply chain
manager
___ Supply chain
Director
___ Other (please write)
Supplier (1st, 2nd, or 3rd
tier)
___ Seller
___ Operations manager
___ Supply chain
manager
___ Supply chain
director
___ Other (please write)
Industrial Sector Representative
____ Market intelligence manager
____ Legal department leader
____ External and international
____ Relationship manager
____ Other (please write)
Contact
information Source of the contact:
Indication? ___ yes ___
no
From whom?
__________
Indicated someone else?
___ yes ___ No
Who?
First contact
___ e-mail ___ Phone
___ Linkedin
___ Personal
___ Other (cite)
1st contact: ____/____/_____
Response back: _____ days
2nd contact: ____/_____/_____
Response back: _____ days
Agreed to be interviewed?
___ Yes ___ No
Interview ___/____/______ Time: ____ minutes
Interviewer:
___________
___/____/______ Time: ____ minutes
Interviewer:
___________
Source:
____ Face-to-face
____ Skype
____ Phone
____
Place:
Interviewer:__________
Informant:____________
Transcription:
____/_____/_______
Responsible:
____________________
Translation:
_____/______/_________
Responsible:
____________________
Secondary Data Internal
_______ Annual reports
_______ Supplier guides
_______ Presentations
_______ Internal brochures
_______ Legal sources
_______ Others (please write)
Public:
______ Public source of information
______ News on open media sources
______ News on social media source
______ Legal sources
______ Others (please write)
Site Visit ___/____/______ Time: ____ minutes
City, State: ___________________, _______
Others:
Generated
Case(s)
Number(s):
Given name(s):
Table 21: Data accounting log

142
142
3.6.1.2 Replicability
Replicability is a measure of the degree to which a process could be reproduced by different
researchers, and in different locations and conditions, and still arrive at the same results. To
assure replicability of our study, we systematically organized the data collected for each
informant in a comprehensive spreadsheet, which we called the “golden sheet”.
The golden sheet contained all the main basic information for the entire project. It was
composed of 106 rows and 28 columns, for a total of 2,720 cells, which allowed us to sort our
research data in several different ways. This kind of data organization allows its replicability
and enhances reliability. Appendix D and E contain the data for the firms and informants,
respectively. Table 22, Table 24, Table 23, and Table 25 show the basic structure of the “golden
sheet”.
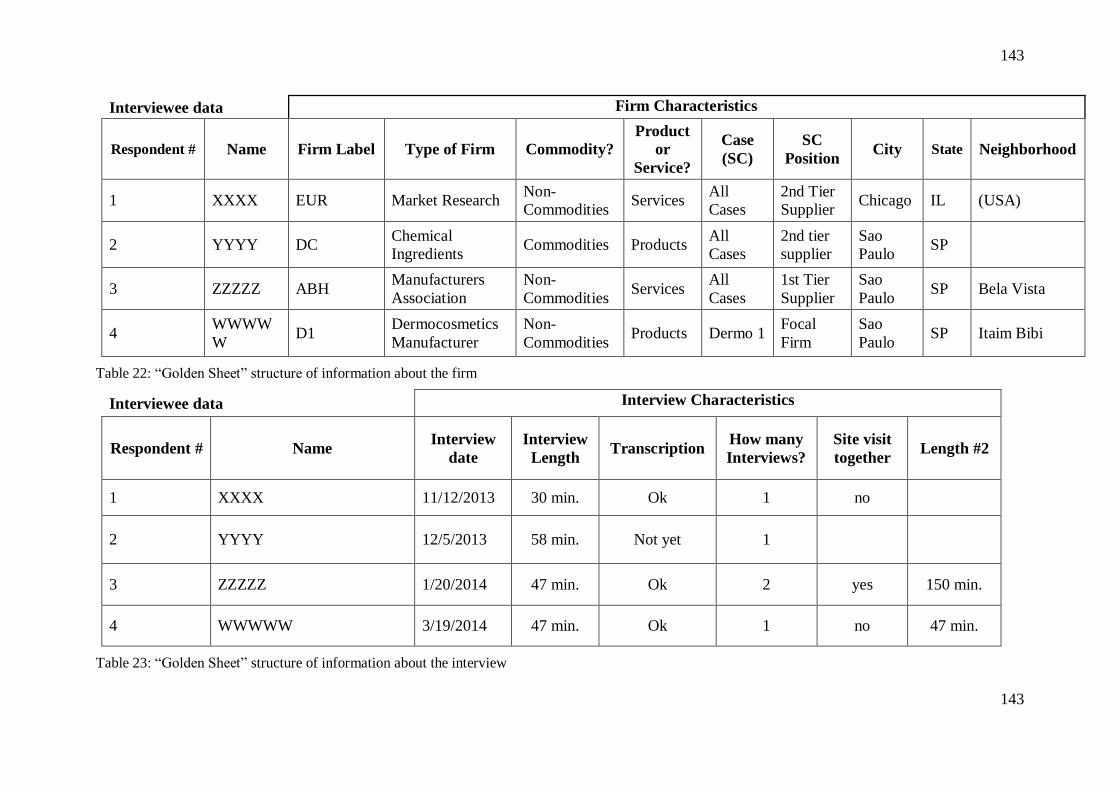
143
143
Interviewee data Firm Characteristics
Respondent # Name Firm Label Type of Firm Commodity?
Product
or
Service?
Case
(SC)
SC
Position City State Neighborhood
1 XXXX EUR Market Research Non-
Commodities Services
All
Cases
2nd Tier
Supplier Chicago IL (USA)
2 YYYY DC Chemical
Ingredients Commodities Products
All
Cases
2nd tier
supplier
Sao
Paulo SP
3 ZZZZZ ABH Manufacturers
Association
Non-
Commodities Services
All
Cases
1st Tier
Supplier
Sao
Paulo SP Bela Vista
4 WWWW
W D1
Dermocosmetics
Manufacturer
Non-
Commodities Products Dermo 1
Focal
Firm
Sao
Paulo SP Itaim Bibi
Table 22: “Golden Sheet” structure of information about the firm
Interviewee data Interview Characteristics
Respondent # Name Interview
date
Interview
Length Transcription
How many
Interviews?
Site visit
together Length #2
1 XXXX 11/12/2013 30 min. Ok 1 no
2 YYYY 12/5/2013 58 min. Not yet 1
3 ZZZZZ 1/20/2014 47 min. Ok 2 yes 150 min.
4 WWWWW 3/19/2014 47 min. Ok 1 no 47 min.
Table 23: “Golden Sheet” structure of information about the interview

144
144
Interviewee´s data Respondent Characteristics
# Name Gender
Spokeon
behalf of
different
firms?
Job Title
Approx.
Years of
experience
Position in
the Firm
Indicated
by
Whom?
Still in the
firm in the
end of
research?
Suggested
Respondents
1 XXXX Female N Senior Manager,
Client Consulting 7
Supplier
Side 101 yes
FulaoBeltrano
(EUR)
2 YYYY Female N
Supply Chain
Operations |
EH&S Team Leader
6 Buyer Side 1 yes Jose (PAN),
Maria (DC)
3 ZZZZZ Male N
Marketing
Intelligence
Manager
6 Supplier
Side 2 Yes
R. + Mary
(ABH), V.A.
(B3)
4 WWWWW Female Y
Sales and
Marketing
Director
8 Supplier
side 49 No Peter
Table 24: “Golden Sheet” structure information about the person
Interviewee data Contacts
Respondent # Name e-mail Phone # / Skype OBS
1 XXXX [email protected] + 1 (XXX) XXX- Interviewed during the pre-test phase
2 YYYY [email protected] + 55 (XX) XXXX-XX My former student
3 ZZZZZ [email protected] + 55 (XX) XXXX-
4 WWWWW [email protected] + 55 (XX) XXXX- Foi desligada da empresa +- em Julho/2014.
Table 25: “Golden Sheet” structure of the contact information

145
145
3.6.1.3 Accuracy
Accuracy is the third and most important component of reliability (Krippendorff, 2013). To
assure our study’s accuracy, we triangulated the data coding and analysis done by different
researchers. We also sought to fine any errors by comparing the work of the coder in training
(main researcher) against standards that had been established by the panels of experienced
content analysts. This test was conducted using the split-half technique. We divided a sample
of our transcribed (and translated) interviews into two approximately equal parts and had them
coded (one half at a time) by: 1) the main researcher (coder in training), and 2) one of the
members of the research board of advisors, who were all specialists and experienced
researchers. Then we compared the frequency distributions obtained for the two parts. If the
difference between the distributions was statistically insignificant, the data would be
considered reliable (Krippendorff, 2014, p. 272). The comparison of the code revealed
similarity of the analysis between the analysts indicating accuracy of the analyzed data.
3.6.2 Validity
Validity refers to precision. Validity addresses the quality of the research results and whether
these results can be understood as true. A measuring instrument is considered valid if “it
measures what it is claimed to measure” (Muchinsky, 1996; Krippendorff, 2013). Dimensions
of validity include construct validity, internal validity, and external validity.

146
146
3.6.2.1 Construct Validity
Construct validity relates to acknowledgement of what is really being measured. Krippendorff
(2013) states that construct validity is particularly important when a construct is “abstract and
not able to be observed directly” (p. 331). We used multiple types of evidence to address
construct validity, including documents, archival records, interviews, and physical artifacts, as
well as direct observation, triangulating the information from different sources to verify its
construct validity.
Construct validity was also addressed by the establishment of a chain of evidence. A chain of
evidence uses tables to help organize large amounts of data and avoid what Pettigrew (1988)
and Eisenhardt (1989) call “death by data asphyxiation”. The chain of evidence traces the flow
of information forward and backward. In the chain of evidence document prepared at the
beginning of this research, we started by stating a set of “hypothetical conclusions” that might
emerge from it. We then identified specific data or evidence that could support these
hypothetical conclusions. The interview questions that would lead to the collection of the target
evidence were then written, and the research question that would lead to the design of these
interview questions was stated.
In addition, each draft case study report was reviewed at least by three knowledgeable
researchers in the OM field. Any inconsistencies between them were resolved by discussion
and consensus. Table 26 presents the chain of evidence used for this research.
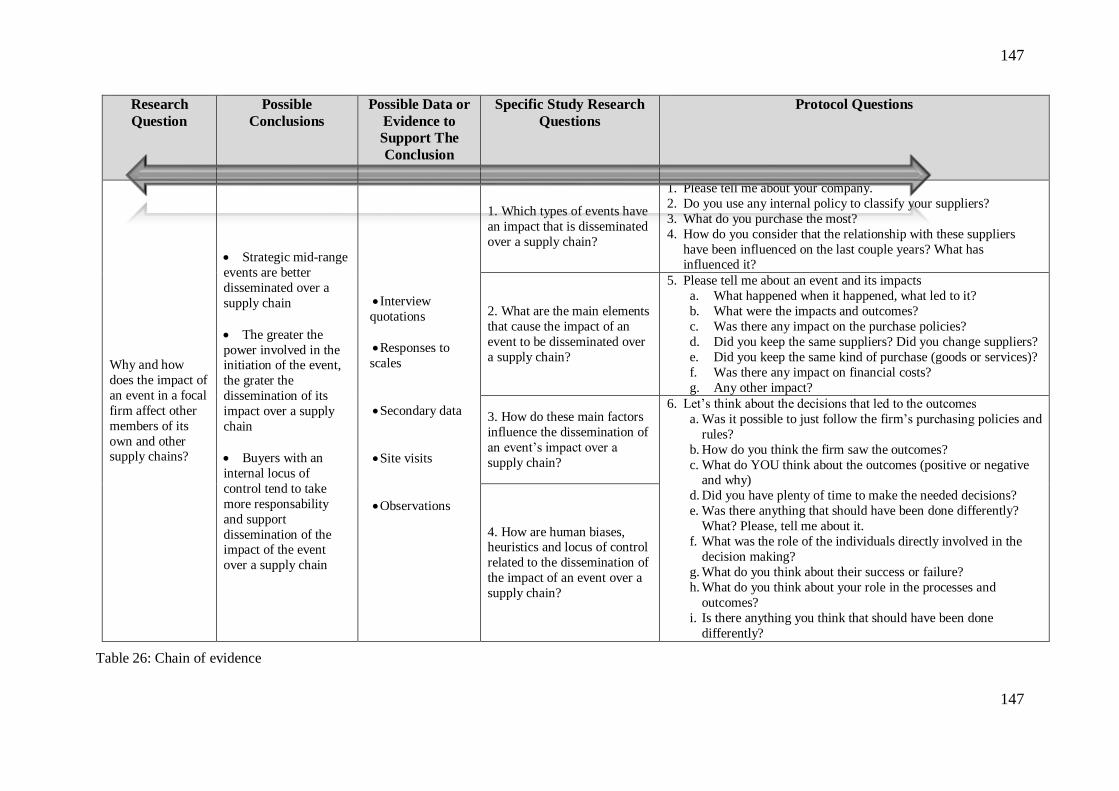
147
147
Research
Question
Possible
Conclusions
Possible Data or
Evidence to
Support The
Conclusion
Specific Study Research
Questions
Protocol Questions
Why and how
does the impact of
an event in a focal
firm affect other
members of its
own and other supply chains?
Strategic mid-range
events are better
disseminated over a
supply chain
The greater the
power involved in the initiation of the event,
the grater the
dissemination of its
impact over a supply
chain
Buyers with an
internal locus of
control tend to take
more responsability
and support
dissemination of the impact of the event
over a supply chain
Interview
quotations
Responses to
scales
Secondary data
Site visits
Observations
1. Which types of events have
an impact that is disseminated
over a supply chain?
1. Please tell me about your company.
2. Do you use any internal policy to classify your suppliers?
3. What do you purchase the most?
4. How do you consider that the relationship with these suppliers
have been influenced on the last couple years? What has influenced it?
2. What are the main elements
that cause the impact of an
event to be disseminated over
a supply chain?
5. Please tell me about an event and its impacts
a. What happened when it happened, what led to it?
b. What were the impacts and outcomes?
c. Was there any impact on the purchase policies?
d. Did you keep the same suppliers? Did you change suppliers?
e. Did you keep the same kind of purchase (goods or services)?
f. Was there any impact on financial costs?
g. Any other impact?
3. How do these main factors
influence the dissemination of
an event’s impact over a
supply chain?
6. Let’s think about the decisions that led to the outcomes
a. Was it possible to just follow the firm’s purchasing policies and
rules?
b. How do you think the firm saw the outcomes?
c. What do YOU think about the outcomes (positive or negative and why)
d. Did you have plenty of time to make the needed decisions?
e. Was there anything that should have been done differently?
What? Please, tell me about it.
f. What was the role of the individuals directly involved in the
decision making?
g. What do you think about their success or failure?
h. What do you think about your role in the processes and
outcomes?
i. Is there anything you think that should have been done
differently?
4. How are human biases, heuristics and locus of control
related to the dissemination of
the impact of an event over a
supply chain?
Table 26: Chain of evidence

148
3.6.2.2 Internal Validity
Internal validity deals with the interpretability of the data and is considered a sine qua non
condition (Campbell, Stanley, and Gage, 1963). As our study was exploratory, we followed the
hypothesis-generating process used by Eisenhardt (1989) and Glaser and Strauss (1967) for
establishing internal validity. In doing so, we paid special attention to what Yin (2013) and
Miles et. al. (2014) described as a crucial concern of internal validity for case studies, which is
the broader problem of making inferences. Internal validity was ensured through data coding,
generation of rival explanations, use of multiple data sources and triangulation.
We generated rival hypotheses to help ensure internal validity, analyzing the data outcomes
from different perspectives. This allowed us to address the possibility that the findings might
be influenced by the interviews or some other factors. For example, in addition to buyers’
individual characteristics, such as their heuristics, biases, and locus of control, we also
considered other aspects that could lead to the same results, such as rules, procedures, and firm
characteristics. We used multiple data sources to ensure internal validity and followed standard
procedures to collect, transcribe, translate and code the data.
3.6.2.3 External Validity
External validity deals with concerns about whether the findings can be generalized beyond the
specific study. We addressed external validity by analyzing the implications of our findings
through different theoretical lenses. Thus, we used rival theories to explain the same findings.

149
We used two different theoretical lenses to provide alternative perspectives. They were
considered rival explanations because they dealt with different aspects of buyers’
characteristics: cognitive limitations and attribution theory. The perspective of biases and
heuristics deals with buyer’s cognitive limitations, while attribution theory is related to
characteristics of buyer’s personality, such as locus of control.
The way the research question is presented is a also an external validity concern (Yin ,2013;
Miles et al., 2014). The form of the research question can “help or hinder the preference for
seeking generalizations - that is, striving for external validity” (Yin, 2013, p. 48). Additionally,
the techniques used to code and group the data also play an important role in establishing
external validity. They were coded and analyzed in different forms, as stated in Section 3.4,
due to the different units of analysis in the embedded case analysis design.
3.7 Data Management
Due to the amount of data collected for this research, data management was critically important.
We addressed data management through different actions, ranging from protocol development
to the archiving or disposal of our research materials. For data protection, we established limits
and security policies about who was able to access the research data and under what conditions.
There were two different types of data to deal with: physical data and digital data. Information
protection consists of three core elements: confidentiality, integrity, and availability. We
addressed data confidentiality by limiting information access and disclosure. We developed a
table relating the real identity of the interviewee to the label used in the data analysis. This
table was developed by the main researcher and kept confidential, in order to preserve the
personal data about the interviewees and their firms. An electronic version was kept on the
150
main researcher’s personal computer and also on a Dropbox cloud storage website. This
prevented the digital file from being lost due to any physical damage in the computer. The
access to these files was safeguarded by a username and a password. A physical copy was kept
in the main researcher’s archive at Indiana University.
Availability refers to when and how authorized individuals can have access to the data. The
authorized personnel, in our case, are the main researcher herself and her advisory board, which
is composed of a Brazilian professor at Getulio Vargas Foundation in Sao Paulo, Brazil and
two professors at Indiana University in Indianapolis, Indiana, United States. They had access
to the digital data through a shared folder kept on the Dropbox website and protected by a
password.
Integrity refers to the trustworthiness of information, assuring that the data was not
inappropriately modified after it was recorded. One way that we guaranteed the integrity of our
data was by following the file path modifications on the Dropbox website, which was set up to
allow modifications to the editable files, recording who had made any modification and when.
In case of any problems, we will be able to recover previous versions of the files. After the
work has been completed, we planned to keep copies of our data for three years, and then
destroy them.

151
4. RESULTS AND DISCUSSION
Our results are organized into two sections in order to fulfill the two secondary goals presented
in the introduction to this dissertation (see Table 1). In Section 4.1, the goal is identify the main
types of mid-range events and analyze their impact in the focal firms. In achieving this goal,
we described our cases, which were composed of six supply chains. In Section 4.2, we discuss
empirical applications of the propositions stated in Section 2.4, aiming to fulfill the goal of
investigating and analyzing the dissemination of the impact of a mid-range event over multi-
tier, multi-dimension supply chains in macro, micro, and integrated contexts.

152
4.1 Within Case Analysis
In this section, we report the results of the analysis of the six main supply chains that were
studied. The six supply chains were based on two dermocosmetics and four beauty products
focal firms. In addition to the reasons for dividing the industry this way that were provided in
Section 3.1.3, we can also examine the differences between the sub-sectors was in terms of
product characteristics. “Beauty products are essentially commodities, while dermocosmetics
are non-commodities” (Informant #4). The dermocosmetics supply chains are different from
beauty products supply chains for several reasons. Dermocosmetics products are much more
complex to develop and to sell, when compared to beauty products. However, the customers
of dermocosmetics products tend to be very loyal when they find a product that they like and
can perceive an improvement in whatever they were treating (acne, aging, cellulitis, etc.). Thus,
the dermocosmetics products tend to have a longer product life cycle, which might increase the
revenues for the sellers in both the short and long term (ABIHPEC, 201412). There is still a
very substantial potential market for dermocosmetics to be explored in Brazil. Although Brazil
is ahead of Japan in cosmetics products annual sales, the mix of sales between the two sub-
sectors is balanced in Japan, with about 50% in beauty products and 50% in dermocosmetics.
In Brazil, on the other hand, the mix is 96% beauty products and just 4% dermocosmetics
(ABIHPEC, 2014). Table 27 summarizes the differences between the beauty products and
dermocosmetics sub-sectors in Brazil, which we took in consideration when analyzing their
respective supply chains.
12 Information is also based on primary and secondary sources of the data collected for this research.

153
Criterion Beauty Products Dermocosmetics
1. Products
Popular vs. Specialized Product Popular and specialized Specialized
R&D Intensity Low High
Main Products
Makeup, body and face moisturizers,
hair products, nail products, body and
face wax products, etc.
Body treatment (cellulitis, stretch marks, localized
fat body); facial treatments (wrinkles, shades,
acne); sun care and sunscreen products
Life Cycle Short Long
2. Market
Annual Sales Very high Very low, compared to beauty products
Relationship with Customers Direct relationships Indirect relationships, usually through specialist
advice (for instance, an esthetician or a
dermatologist)
B2B or B2C B2C B2B
Most Influential
Channels
TV, popular events, popular artists,
celebrities
Specialists, such as esthetic professionals, physical
therapists, estheticians, massage therapists;
physicians - dermatologists, teachers and tutors in
professional esthetic schools.
Target Customers Final customers Esthetic professionals, physical therapists,
estheticians, massage therapists; physicians –
dermatologists
Segment General Niche
Customer Loyalty Low Medium to high
Level of Competitiveness Wide and high Narrow and high
Direct Competitors Global, national and local firms International brands, national firms, compounding
pharmacies, and some medications
Investment in Advertising High Low
Frequency of Portfolio Renewal High Low
Customer Relationships Short term Long term

154
Customer purchasing driven Appearance and fragrance Service benefit expectations
Aggregation of Service for sales Low High
Criterion Beauty Products Dermocosmetics
3. Supply Chain
Need for Prior-Purchase
Training
Low High
Responsibility for Customer
Training
Nobody, (a friend, a sales person,
beautician, hairdresser, other).
Specialists, such as esthetic professionals, physical
therapists, estheticians, massage therapists,
physicians - dermatologists, teachers and tutors in
professional esthetic schools
Sales Channels Big retail stores, grocery stores, drug
stores, direct sales through catalogs,
TV sales, internet
Franchisee stores, specialized stores,
“manipulation” or compounding pharmacies
Number of Suppliers High High
Need for Innovation Related to fashion market and styles Related to R&D and new active ingredients
Regulatory and Legal
Requirements
Simple Complex
4. Buyer and
Supplier
Relationships
Supplier Risk Low High
5. Main Players
Geographical Competition Specific brands of global players and
specific national players
Specific brands of global players and specific
national players
Examples of Global Firms Avon, L’oreal, Nivea, Mary Kay,
Maybelline
La Roc (Johnson& Johnson), Roche (Loreal)
Examples of National and Local
Firms
Natura, O Boticario, L’occitane,
Jequiti
Valmari, Adcos, Vitaderm
Table 27: Main differences between cosmetics and dermocosmetics

155
Each supply chain is composed of a focal firm plus two or three tiers in each direction, upstream
and downstream. Upstream, we organized the suppliers not just in terms of tiers, but also in
terms of the kind of supply, which were information, packaging, and chemicals. Downstream,
we organized the buyers in terms of tiers and characteristics, such as franchise stores, retailers,
or final customers.
The information suppliers were comprised of national and international cosmetics industry
associations and firms. They are responsible for bringing data related to the market and
opportunities to the focal firms. They support the focal firms and their suppliers, when needed,
and provide opportunities for interchange of information, such as conferences, seminars, and
marketing research. Government agencies, like Anvisa and Cegen, were also considered as
information suppliers.
Cosmetics packaging suppliers differ in terms of type of packaging: primary packaging,
secondary packaging, tertiary packaging, and printing service providers. Primary packaging
suppliers supply the packages that are in contact with the product formulation, itself. Examples
include tubes and jars of different sizes. The basic concerns regarding this kind of packaging
are related to the fact that it will directly interact with the chemical products of the formulation
during the entire life cycle of that product, thus “design and usability are important, but quality
is crucial” (Informant#13). The most used materials were plastic and glass.
Secondary packaging refers to the external packaging that contains the primary packaging and
helps in the visual appeal of the product. “At first, a customer will pay attention to a [cosmetics
or dermocosmetics] product, if it attracts their attention; only after then, will that customer pay
any attention to that product’s other characteristics [formulation, price, etc.]” (Informant #40).

156
The secondary packaging also plays an important role in preventing damage to primary
packaging and the product itself during transport and storage (Informant #33). The most used
materials were paper cartons.
Tertiary packaging refers to the bags and boxes in which the cosmetics are carried when bought
by a customer. Although they do not interact with any product’s characteristics themselves,
they are important part of the visual appeal and extended perceived quality of the products. “I
love B3’s products, not just because they are good [in terms of quality] and smell very nice,
but also, because I think it is a lot of fun to just hang out with my friends in the mall carrying
those beautiful and colorful bags” (Informant #85).
The last cosmetics packaging category is printing service providers. These firms are
responsible for printing specific information about the focal firm and the specific product on
blank tubes or jars. They are important suppliers, especially for small and medium sized beauty
and dermocosmetics firms, since they can allow better cost per unit on the final product.
Chemical suppliers, especially the third or second tier suppliers, are usually multinational
firms. First tier supplier are usually the middlemen for those large multinational firms, or in a
few cases, some medium sized local firms. Some of the multinational firms have plant
manufacturing units in Brazil, and many of them have distributors or middlemen there.
Depending on the purchased volume, a focal firm can buy directly from a chemical supplier’s
multinational unit in Brazil or abroad, or if smaller volumes are needed, they can be bought
from the middlemen or chemical substitutes can be obtained from the medium sized local firms.
The same chemical supplier can function as a first tier supplier selling for large firms, such as
B3 or B4; or as second or even third tier supplier when selling to smaller firms, such as D1.

157
Chemical suppliers play an important role regarding to the innovation within the cosmetics
industry. Most of the focal firms attributed their product development to a close partnership
with their suppliers, which was responsible for bringing the most innovative products from
Europe or the U.S., “We try to keep a very close relationship with our [chemical] suppliers,
because through them we can have access to the best that exists, in terms of active chemical
ingredients, in the world” (Informant #18). This illustrates the strength and importance of
building strategic weak ties (Granovetter, 1983). One important thing to note is that, due to
regulatory reasons, every Brazilian cosmetics product is required to have on its label the name
and contact of the chemical engineer who is legally responsible for that product in case of
allergies or any other problem. Thus, a close relationship between the focal firm and its
chemical supplier is not just strategic, it is almost mandatory, since the focal firm relies heavily
on its suppliers to support its product development and chemical safety.
Downstream, the supply chains are organized through different sales channels. The two
dermocosmetics firms work through the franchise channel. One of them, D2, in addition to the
franchisees, also uses traditional sales channels through specialized drugstores and distributors.
D1 and D2 do not target the final customer directly; they use their sales channel to target
professional estheticians, beauticians, or dermatologists, and then, through them, target the
final customers indirectly. The beauty products supply chains also differ among themselves.
B1 uses a mix of franchisees and traditional channel distribution, while B2 and B3 mostly use
the franchise channel to reach out to the final customers. B4 uses a direct sales model, where
there are individual representatives, the “B4 ladies”, who sell B4 products to final customers,
usually through personal and close relationships. Table 28 shows the primary focus of the
distribution channels. The darker the cell, the more that distribution channel is used.
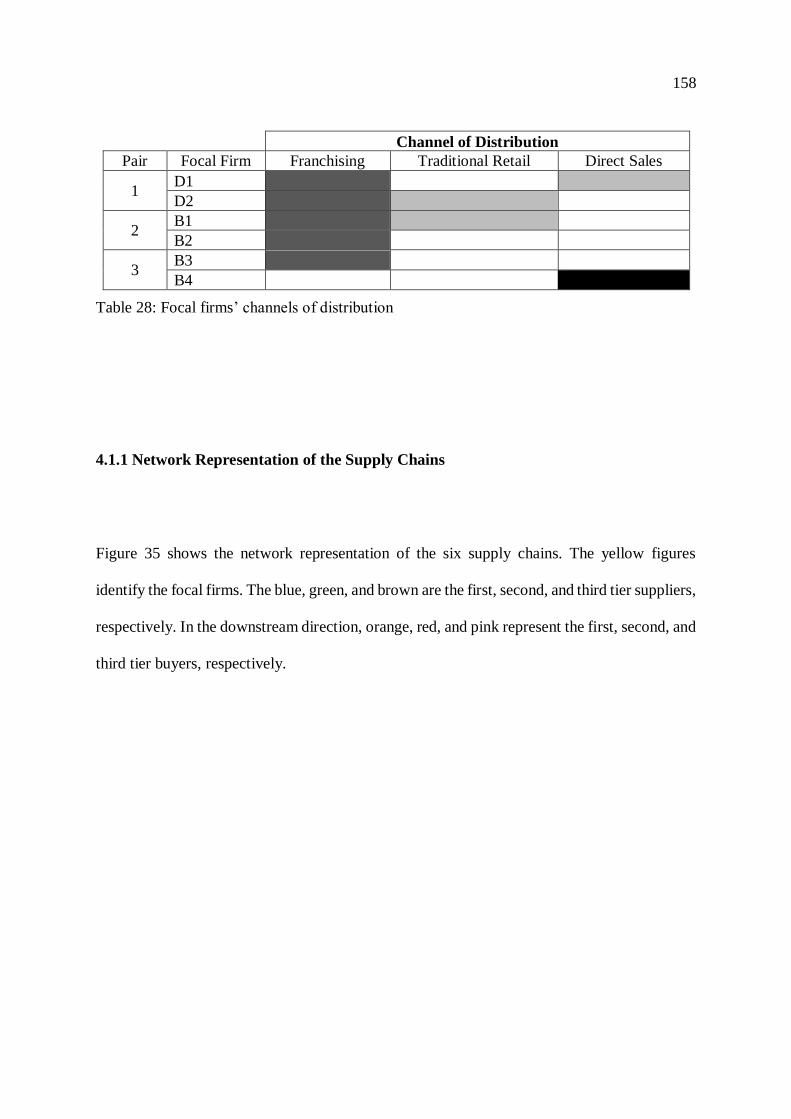
158
Channel of Distribution
Pair Focal Firm Franchising Traditional Retail Direct Sales
1 D1
D2
2 B1
B2
3 B3
B4
Table 28: Focal firms’ channels of distribution
4.1.1 Network Representation of the Supply Chains
Figure 35 shows the network representation of the six supply chains. The yellow figures
identify the focal firms. The blue, green, and brown are the first, second, and third tier suppliers,
respectively. In the downstream direction, orange, red, and pink represent the first, second, and
third tier buyers, respectively.

159
Figure 35: Network representation of researched supply chains
The properties of the nodes and lines were also incorporated into the supply network
representation. The nodes represent the tiers, which are the firms. The size of each node
represents the size of the firm, which ranged from micro to small, medium, large, and extra-
large, as described in Chapter 3. Table 29 and Table 30 describe the meaning of the shapes and
colors, respectively, in the supply network representations. Shapes were related to the local
comprehensiveness and colors to the firm’s position in its main supply chain.
Local Comprehensiveness (shapes)
Diamond Local
Triangle Regional
Square
National
Circle
Multinational
Table 29: Meaning of the shapes in the supply network representations
Upstream Downstream

160
Position in the Supply Chain (colors)
Brown 3rd Tier Supplier
Green 2nd Tier Supplier
Blue 1st Tier Supplier
Yellow Focal Firm
Orange 1st Tier Buyer
Red 2nd Tier Buyer
Pink 3rd Tier Buyer
Table 30: Meaning of the colors in the supply network representations
The lines represent the relationship between the firms. A line connecting two firms indicates
that those firms are related to each other, in other words, they have a buyer and supplier
relationship. The relationships in
Figure 35 range from dyads and triads to much more complex relationships, where one firm
might represent a different tier in different supply chains. The strength of the relationship is
illustrated by the thickness of the line. The thicker the line, the stronger the relationship is.

161
4.1.2 Dermocosmetics Supply Chains
The dermocosmetics supply chains are associated with Dermo 1 and Dermo 2. These supply
chains have some unique characteristics, which will be further discussed Sections 4.1.2.1 and
4.1.2.2. Several characteristics that are common to both D1 and D2 supply chains will be
presented here. The D1 and D2 supply chains are highlighted in Figure 36.
Figure 36: Position of D1 and D2
In Figure 37, we show the dermocosmetics supply chains (D1 and D2) and their respective
tiers and relationships. Some firms, such as AQ, BSF, and DC, play different roles in the
dermocosmetics supply chains than they do in the general representation of all the researched
supply chains. For example, in the basic representation (
Figure 35), DC and BSF are second tier suppliers (green), however in the dermocosmetics
supply chain (
Figure 35) these firms are third tier suppliers (brown).

162
Figure 37: Interlocking relationships in dermocosmetics supply chains
The volume of purchases from suppliers is another big difference in buyer and supplier
relationships between dermocosmetics and beauty products supply chains. Beauty products and
dermocosmetics firms have very different needs for chemical ingredients or packaging
materials. “For the same chemical ingredient that a firm such as D1 or D2 buys 1kg of per
month; for large firms such as B3 or B4, we usually sell 1,000 kg per month” (Informant # 80).
For packaging, the differences are not just in terms of volume of the units negotiated in a period
of time, it also includes the size of the packaging and labels. “For some beauty products, we
have medium or large packaging, such as one or two pounds, however, for dermocosmetics,
the packaging is usually smaller (Informant #14)”. One exception is the dermocosmetics that
are sold to beauticians and estheticians to use with their clients. In that case, the packaging is
sometimes larger, but it is never large for the final customers’ use (Informant #8). In regard to
labels, “When I used to work for X (aa very large beauty products firm in Brazil), we usually
bought five to six million labels a month, now, working for D1, we buy five to six thousand
labels per month” (Informant #8).
In terms of market positioning, packaging for dermocosmetics products is more challenging,
compared to beauty products. “When buying a dermocosmetics product, a (final) customer gets

163
a product, but expects a service” (Informant #4a). For example, when a customer buys a face
cream, he or she is buying a product; however, they are expecting, for example, that their
wrinkles will be softened (service). This makes the packaging design for dermocosmetics very
challenging. It cannot be as attractive as in cosmetics, otherwise it would not be valued as an
“almost medication” product. However, it cannot be as simple or as “ugly”, like the packaging
for dermocosmetics from compound pharmacies; otherwise it would not translate all the value
of the R&D behind the formulation inside the jar.
The chemical formulation needs to be taken very seriously by a dermocosmetics firm. Because
of the fact that a customer buys a product, but expects a service, the formulation plays a crucial
role in dermocosmetics. In this subsector, the chemical suppliers, usually large multinational
firms, drive innovation and bring it to the focal firms. Also, because of the regulatory
requirements for dermocosmetics, a close partnership between buyers and suppliers is required.
This is in part due to the fact that dermocosmetics are Risk II cosmetics and require a
government agency (Anvisa)’s approval, which lasts for five years. “During this five years, we
[dermo focal firms] cannot change anything in the product formulation, neither an active
ingredient, nor a preservative” (Informants #18 and #13).
In the next paragraphs we will describe each of the studied dermocosmetics supply chains and
some of their unique characteristics.

164
4.1.2.1 Case One: Dermocosmetics 1 (D1)
We will start describing the D1supply chain by its focal firm. Dermo 1 is a medium size
Brazilian national dermocosmetics firm founded in 1980. It started as a compound pharmacy
in Sao Paulo, Brazil, and evolved to a franchise sales model. As its sales increased, it built a
plant to manufacture its products in a suburban area of Sao Paulo. During the next two decades,
D1 developed both its products and sales based on its products formulations that its franchisees
were responsible for selling to beauticians and estheticians. D1 was the leader, for more than
two decades, of its market until about 2002, when another brand targeting the same customers
(beauticians and estheticians) started to grow13. To understand more about D1’s supply chain,
we interviewed 46 informants in different tiers of its supply chain (see Figure 38).
Figure 38: Number of informants in each tier for D1’s supply chain
After years of financial struggles and crises in the relationship with several of its franchisees,
D1 was bought by an investment group in 2010. Since then, it has implemented several changes
in order to regain its position as the dermocosmetics leader firm in Brazil. Three of these events
will be discussed in Section 4.2.
13 We are referring to D2 and it will be further discussed in Section 4.1.2.2.
3rd tier
• 2
2nd Tier
• 5
1st Tier
• 12
Focal
•6
1st Tier
•16
2nd Tier
•4
3rd Tier
•2
Upstream Downstream

165
In D1’s supply chain, we investigated seven tiers, which included the focal firm plus three
levels of buyers and three levels of suppliers.
Figure 39 illustrates the network relationships representation of the firms in D1’s supply chain
and will be used as a reference to present characteristics related to both directions in D1’s
supply chain.
Figure 39: Network representation of D1 supply chain
Upstream, for both packaging and chemical suppliers, D1 believes (Informants #8, 14, 18, and
34) that personal contact is very important, “What I see is that, in this industry, great part of
the success of the focal firms relies on the quality of the personal relationship that we [R&D
personnel] develop with the individuals from our suppliers who work with us” (Informant #18).
According to the interviewees, D1’s relationship with its suppliers tends to be very strong,
especially with its chemical suppliers, which is an example of the strong ties concept from
social network theory. Due to the fact that D1 is a small size firm, when compared to some
very large firms in this industry, most of its innovation is driven by its suppliers. The chemical
suppliers are comprised of very large multinational firms. It is through a close and strong

166
2nd Tier suppliers
(chemical)
3rd Tier suppliers
(chemical and packaging)
relationship with its middlemen that D1 receives news and becomes informed about global
innovation. This fact supports the importance of the weak ties to build bridges, which in the
case of dermocosmetics is essential for innovation. “Our suppliers are a very important channel
of learning and knowledge for us” (Informant #18). Figure 40 illustrates the upstream firms,
which are part of D1’s supply chain.
Figure 40: Upstream network illustration for D1’s supply chain
According to D1 informants, the buyer and supplier relationships between D1 and its chemical
suppliers have always been very close and strong, since D1’s beginning. However, a substantial
difference was noted in the last few years, after the investment group bought D1. The ties
between them remained strong, but the difference refers to what informant #15 called
professionalism.
“I remember few years ago, when we were in the middle of one of our greatest financial crises, and we did not have enough money to pay our suppliers. Sometimes, I would
Focal firm
1st Tier suppliers
(packaging)
2nd and 3rd Tier
suppliers (services)
1st Tier suppliers
(chemical)

167
personally call a long time manager, director, or even the CEO at a specific supplier
and ask for a favor, such as sending us raw materials, even when we have not paid a previous bill(s). And it happened, they supplied us because of the personal relationship
they had with D1’s founders. It does not happen anymore. First, we make sure that our
bills with our suppliers are always paid on time, and secondly, we still have close
relationships with our supplier, but they are not personal anymore. If we pay them, they serve us. Otherwise, there is no deal” (Informant # 15).
Packaging was not a big concern for D1 in its early days. “Our products’ packaging was really
ugly” (Informant #5). D1 always considered that its customers, especially beauticians and
estheticians, bought its products “due to what they had inside (chemical ingredients and
formulations), not because what they would look like (packaging)” (Informant #5). So, D1,
which had begun as a compound pharmacy, kept its very basic packaging, not caring much
about its design or materials. Changing its packaging and designs materials was one of the first
events that was implemented after D1 was bought by the investment group. Nowadays, D1
keeps a much closer relationship with its packaging suppliers. Its re-design of more than 300
products will be further discussed in Chapter 4.2.3
Downstream, D1 has about 80 franchisees, many of whom are long term franchisees. Some of
them were established at the same time as D1, in the early 1980’s; and some of the franchisees
are in the second, or even third generation of the same family owners. The franchisees are used
to having very close relationships with D1’s founders. It is not uncommon to see personal
relationships among them, such as attending special family parties and weddings.
The strong ties illustrated by these close long-term buyer and supplier relationships have had
both good and bad impacts. The franchisees deeply understand D1’s products and organization,
working as a “big family”. The close relationships have extended further on downstream, as
the franchisees keep good, close personal relationships (strong ties) with their customers, who
are beauticians and estheticians, as do the beauticians and estheticians with their customers.
There is even a saying that having “good friends and good beauticians save you good money
from your psychiatrist”. However, another old saying is that “every family has an uncle or a
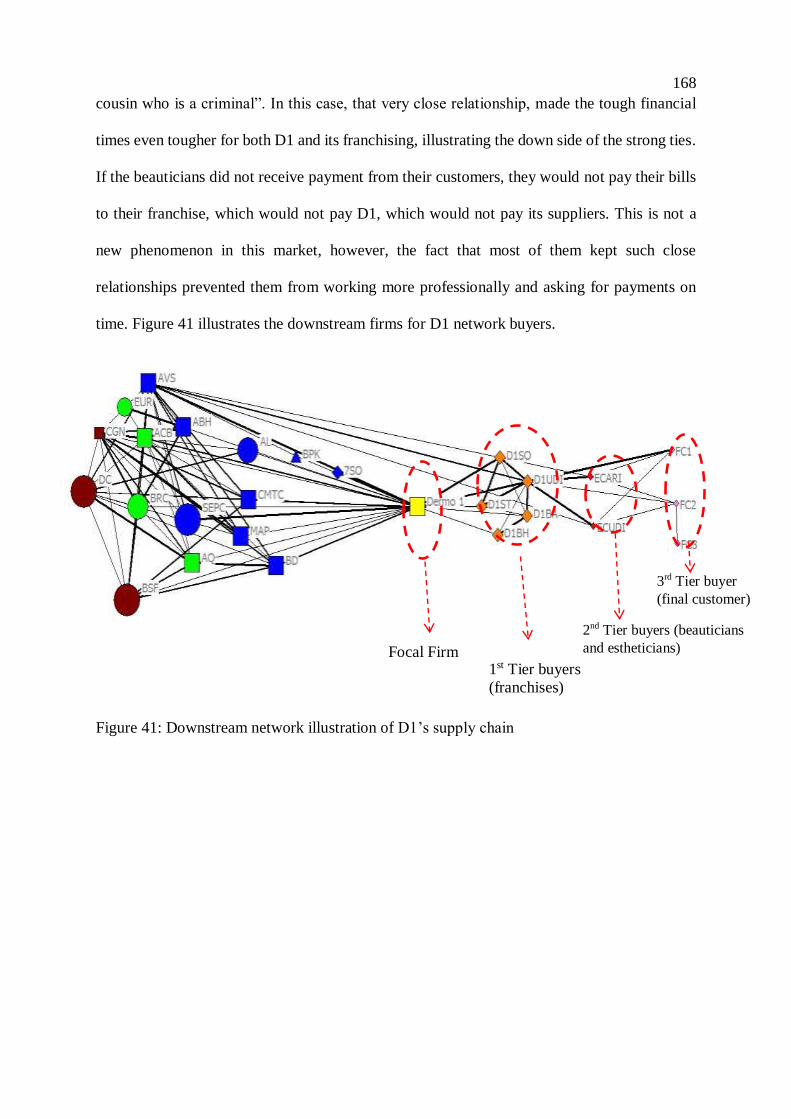
168
2nd Tier buyers (beauticians
and estheticians)
cousin who is a criminal”. In this case, that very close relationship, made the tough financial
times even tougher for both D1 and its franchising, illustrating the down side of the strong ties.
If the beauticians did not receive payment from their customers, they would not pay their bills
to their franchise, which would not pay D1, which would not pay its suppliers. This is not a
new phenomenon in this market, however, the fact that most of them kept such close
relationships prevented them from working more professionally and asking for payments on
time. Figure 41 illustrates the downstream firms for D1 network buyers.
Figure 41: Downstream network illustration of D1’s supply chain
3rd Tier buyer
(final customer)
Focal Firm 1st Tier buyers
(franchises)

169
4.1.2.2 Case Two: Dermocosmetics 2 (D2)
Dermo 2 is a medium size Brazilian dermocosmetics firm founded in 1983. Like D1, it also
started as a compound pharmacy, in the city of Vitoria, Espirito Santo, Brazil, when its founder
arrived from a graduate course in France. Ten years later, it opened its first manufacturing
plant. It opened its first store in 1999. By 2006, it had about 40 distributors and is now evolving
to a franchise model, which it started in 2012. “Many of our old distributors migrated to this
new model and several new franchisees already started in this model. We currently have 93
stores in 20 different Brazilian states. We intend to have about 300 stores opened by 2020”
(Informant #6).
To understand more about D2’s supply chain, we interviewed 32 informants in different tiers
of its supply chain. In total, we investigated seven tiers of D2’s supply chain, which included
D2 plus three levels of buyers and three levels of suppliers (see Figure 42). 14 interviewees
talked about their perspective as buyers (buyer side), 17 were on the supplier side, and one had
a strategic view.
Figure 42: Number of informants in each tier of D2’s supply chain
3rd tier
• 2
2nd Tier
• 7
1st Tier
• 12
Focal
•5
1st Tier
•2
2nd Tier
•1
3rd Tier
•3
Upstream Downstream
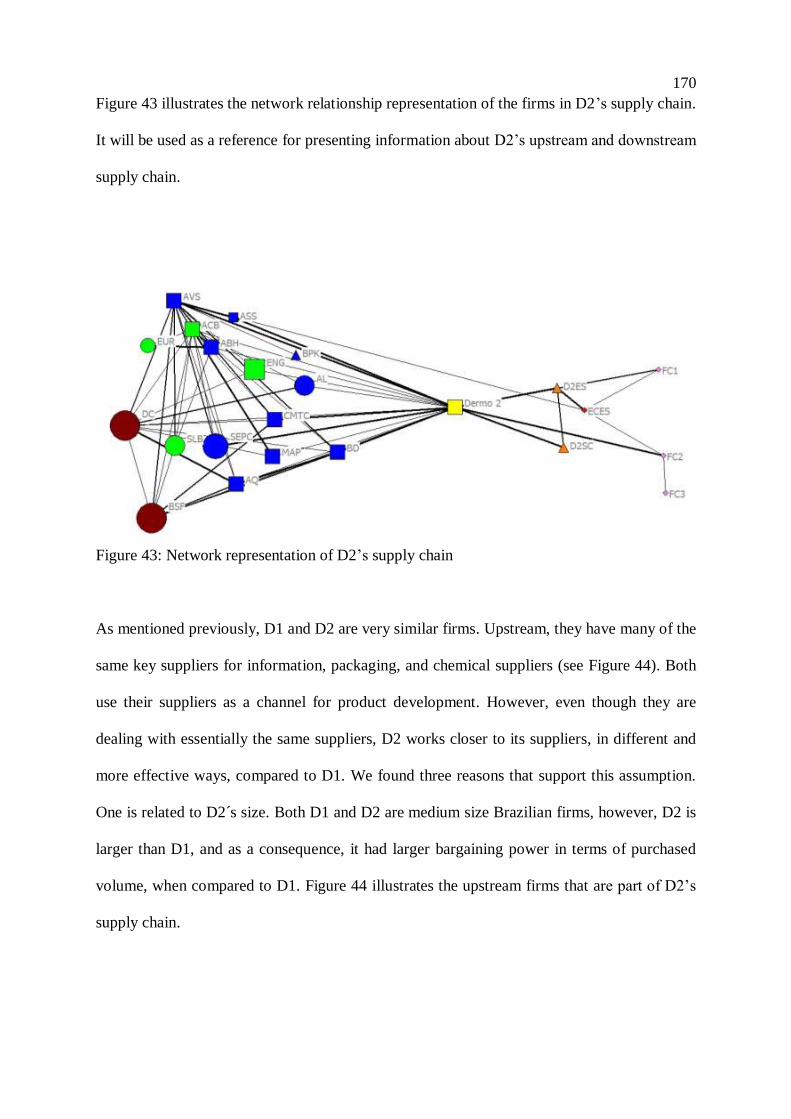
170
Figure 43 illustrates the network relationship representation of the firms in D2’s supply chain.
It will be used as a reference for presenting information about D2’s upstream and downstream
supply chain.
Figure 43: Network representation of D2’s supply chain
As mentioned previously, D1 and D2 are very similar firms. Upstream, they have many of the
same key suppliers for information, packaging, and chemical suppliers (see Figure 44). Both
use their suppliers as a channel for product development. However, even though they are
dealing with essentially the same suppliers, D2 works closer to its suppliers, in different and
more effective ways, compared to D1. We found three reasons that support this assumption.
One is related to D2´s size. Both D1 and D2 are medium size Brazilian firms, however, D2 is
larger than D1, and as a consequence, it had larger bargaining power in terms of purchased
volume, when compared to D1. Figure 44 illustrates the upstream firms that are part of D2’s
supply chain.

171
3rd Tier suppliers
(chemical and
packaging)
Figure 44: Upstream network illustration of D2’s supply chain
Another possible explanation is related to the personal social influence exerted by D2’s
founder. She was a professional, who is well respected for her education and entrepreneurship
by D2’s first tier buyers and suppliers. She received several awards from D2’s suppliers and is
admired by her clients, beauticians and estheticians, who see her as a role model of success.
Finally, it is important to note an important process we perceived in D2, which is the high
quality relationship among the D2’s employees. Good communication, joint planning and joint
decision making are some of the practices that they used effectively on a daily basis. “We
recently developed, approved, and launched a product in less than a week”, said informant #
1st Tier suppliers
(chemical)
Focal firm
1st and 2nd tier
suppliers (packaging)
1st and 2nd tier
suppliers (services)
2nd and 3rd tier
suppliers (chemical)

172
6_2. “We had some raw materials which were close to the expiration date, we had to either use
them, or lose them. So, R&D, quality, marketing, and OM individuals worked together and
came up with a very suitable solution, which was a sales success!” (Informant #6). Another
example of the quality of the relationships between D2 and its employees is the fact that the
same person has worked as R&D manager since the opening of D2, more than two decades
ago.
Downstream, since its inception, D2 has worked in three different distribution channels. The
first is through esthetic professionals (beauticians and estheticians), with whom it started and
has been working ever since. Esthetics professionals are important because they use D2’s
products in their treatments and also recommend dermocosmetics products for their clients to
use at home. The next distribution channel is through physicians, especially dermatologists.
The use of this channel differentiates D2 from its competitors. Since dermocosmetics is a kind
of “two for the price of one” as we described in section 4.1.2 (a product with service
characteristics), the dermatologists’ endorsement and recommendations make D2 products
much more attractive. “With a good partnership with physicians, D2 grew a lot and became a
very respected brand by both the esthetics professionals, and final users as well” (Respondent
#6).
D2’s third distribution channel is composed of sales units, which can be franchisees,
specialized drugstores, or e-commerce. The focus on these channels is related to the fact that
D2 wants to make its products available for purchase through different channels. “We try to
make our products available for our final users when they want to buy a D2 product, which
was probably prescribed or used on them by an esthetic professional or a dermatologist”
(Informant #12). D2 believes that the fact it that works with three different sales channels is

173
2nd Tier buyers (beauticians,
estheticians, and physicians)
primarily responsible for its competitive advantage (Informant #6). This is supported by the
fact that D2 has grown at a rate of at least 20% a year for the last five years, and has been
positioned as the leader in dermocosmetics market for several years (Copernico, 2012).
D2 showed the ability to build strong relationships with its tier buyers as well. Since the first
tier buyers are the ones who will be directly in contact with the esthetic professionals,
physicians, and sometimes even the final users, D2 builds close relationships with them.
Examples include using its first tier buyers in the process of product development and
empowering its franchisees to act as wholesalers when allowed to sell, for example, to
drugstores. Figure 45 illustrates the downstream firms for D2 network buyers.
Figure 45: Downstream network illustration of D2’s supply chain
3rd Tier buyer
(final customer) Focal Firm
1st Tier buyers
(franchisees)

174
4.1.3 Beauty Products Supply Chains
The beauty products supply chains are the Beauty 1, Beauty 2, Beauty 3, and Beauty 4 focal
firms’ supply chains. These supply chains have some unique characteristics, which will be
further discussed in sections 4.1.3.1 to 4.1.3.4. However, several characteristics that are
common to all beauty products supply chains will be presented here. The beauty products
supply chains are highlighted in Figure 46.
Figure 46: Beauty products firms highlighted in the researched supply chains
Beauty products play an important role in specific target marketing in Brazil as products to use
as gifts or presents on special occasions. It is not uncommon to walk into a big mall in the main
cities and towns in Brazil and see huge lines in front of the door of some national beauty brand
stores during the days before Mother’s Day or Christmas.

175
There are some interesting packaging characteristics of beauty products that we considered in
our research. Packaging suppliers are an important part of the costs related to the final price of
both cosmetics and dermocosmetics. However, for beauty products in general (make-up,
lotions, perfumes, etc), packaging can cost up to 90% of the product’s final cost (Miguel, 2014).
Our data shows that there are four main reasons for the high cost of packaging of beauty
products. First, beauty products are often purchased as a gift, thus they need to be beautiful and
attractive. Second, different from dermocosmetics, where the customers are expecting a long
term service from the product they are buying, the purchase of beauty products is more
impulsive, so the appearance of packaging is crucial (Informants #4, #33, and #81). Third,
beauty products follow the fashion industry and are seasonal, thus they need to be always
changing to keep up to date. Finally, a beauty product may be related to status and attached to
its brand appearance value. All these reasons are related to packaging design, innovation, and
the use of different materials, which costs much more money for the focal firm. Informant #33
credits this to the fact that the interaction of the final user with the product packaging lasts for
its entire life cycle. “Different from a bottle of water, where you drink the water and throw the
bottle out in just a few minutes, a cosmetic will remain on your bathroom shelf or dresser for
weeks, sometimes months, or even years”, thus packaging is very important.
Chemical formulation is also important in beauty products. Although many times the
purchasing is by impulse – since nobody will die if not purchasing the new nail polish color -
after it is purchased, performance plays an important role in customers’ satisfaction and
intention to repurchase the same product or another one from the same brand (Informant # 33,
#38, and #40).

176
A very important characteristic of beauty products’ chemical formulation is their fragrance.
Like packaging, the fragrance of a beauty product, such as a lotion or perfume, plays a very
important role in the purchasing decision by a customer. Fragrances are similar to packaging,
both downstream in their relationship with the customers, and upstream. Consider, for example,
a perfume. Probably the first image that comes to mind is the bottle. To develop a specific
bottle, a very close relationship between the focal firm and a packaging supplier is developed.
The bottle is supposed to embody the “soul of the perfume, and the soul of the perfume is its
fragrance” (Informant 14). In developing such a complex concept, the focal firm’s product
development staff needs to work closely with the suppliers, especially the packaging and
fragrance suppliers. The fragrance is unique, and once a fragrance supplier develops it, only
that specific supplier will be the one to negotiate with. The same happens with the bottle. A
packaging supplier will need to develop and/or adapt several of its processes and resources to
manufacture that specific bottle to that specific product of that specific focal firm. This involves
lots of resources, including time, materials, and equipment. Once that bottle design has been
established with a supplier, “it will be a very long term relationship” (Informant #33).
In Figure 47, we show the beauty products supply chains (B1, B2, B3, and B4) and their
respective tiers and relationships. Beauty products supply chains do not differ much from the
dermocosmetics supply chains in terms of the main players. The greatest differences between
dermocosmetics and beauty products supply chains are in the strength of the relationship
between buyers and suppliers. Usually, the relationships with packaging and some chemical
suppliers, such as fragrance suppliers, are much closer and stronger for beauty products firms,
due to both the volume purchased and the length of the relationship.

177
Figure 47: Network representation of beauty products supply chain
In the next paragraphs, we will describe each of the beauty products supply chains and unique
characteristics.
4.1.3.1 Case Three: Beauty 1 (B1)
Beauty 1 is a spin-off of a French firm headquartered in Southern France. The firm was
established in 1976 and started its operations in Brazil in 1995. At first, it launched the same
products that were sold worldwide. By 2009, there were about 45 B1 stores in Brazil, and in
2013 about 100 stores, both wholly owned stores and franchises. In 2013, B1 also launched a
local brand made entirely with ingredients inspired by Brazil’s rich biodiversity and focusing
on the Brazilian market. For this research, we are only focusing on the B1’s Brazilian brand.
We investigated five tiers of its supply chain, which included B1 plus three levels of suppliers
and one level of buyer. There is not a second tier buyer in B1’s supply chain structure. To
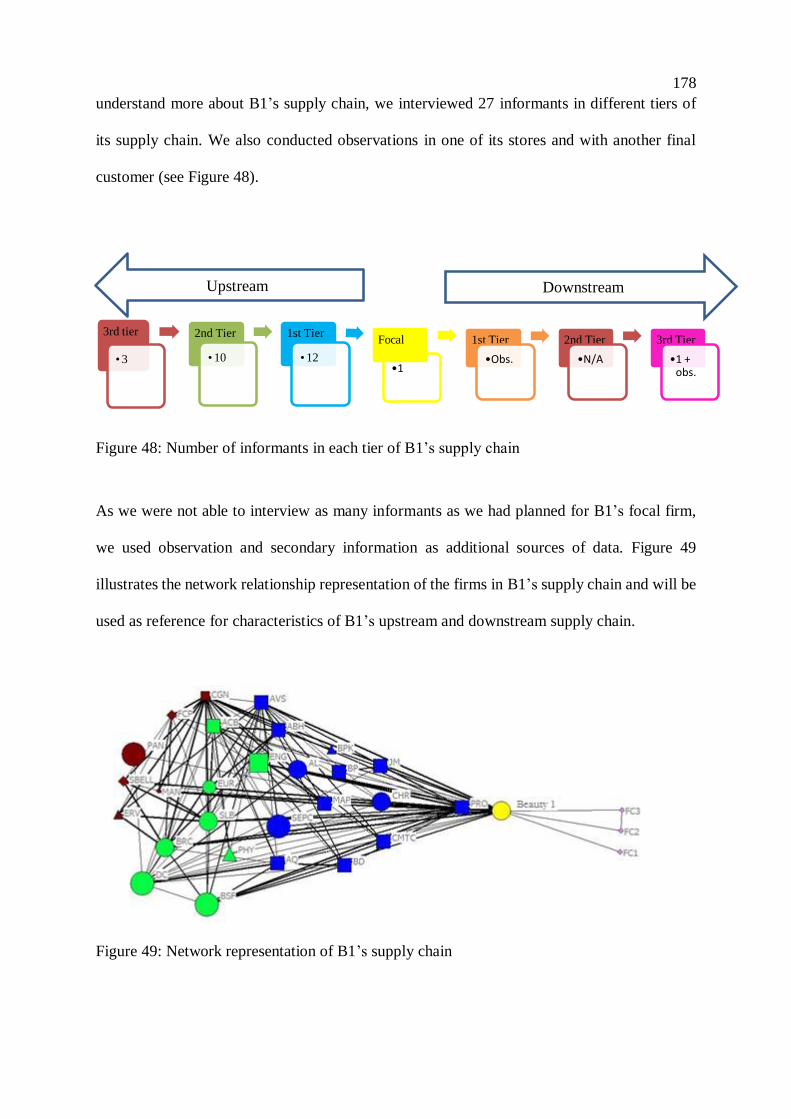
178
understand more about B1’s supply chain, we interviewed 27 informants in different tiers of
its supply chain. We also conducted observations in one of its stores and with another final
customer (see Figure 48).
Figure 48: Number of informants in each tier of B1’s supply chain
As we were not able to interview as many informants as we had planned for B1’s focal firm,
we used observation and secondary information as additional sources of data. Figure 49
illustrates the network relationship representation of the firms in B1’s supply chain and will be
used as reference for characteristics of B1’s upstream and downstream supply chain.
Figure 49: Network representation of B1’s supply chain
3rd tier
• 3
2nd Tier
• 10
1st Tier
• 12
Focal
•1
1st Tier
•Obs.
2nd Tier
•N/A
3rd Tier
•1 + obs.
Upstream Downstream

179
B1 refers to its Brazilian market as “exciting and dynamic, but also complex because it is very
closed and competitive” (Milet and Gallon, 2014). B1 experienced a growth rate of 20% in
2013, which was B1’s fastest-growing market globally. “Brazil is currently the 6th or 7th market
for B1, and we aim to make it the first. Therefore, the next step will be the opening of a research
and development laboratory in Brazil” (Milet and Gallon, 2014).
Upstream, developing and selecting a supplier that are able to manufacture B1’s products was
one of its biggest challenges. In beginning to produce a Brazilian brand, B1 realized that Brazil
was a very particular country and, if it wanted to sell its products in Brazil, it would need to
produce there. B1 began its journey by deciding to outsource its production. B1 spent several
years researching and investigating, in order to better understand the Brazilian cosmetics
market to determine how to better sell (its products in the Brazilian market) and buy (materials
and services) there.
B1’s supply chain is intrinsically connected through a manufacturing plant that is locally
contracted in Brazil to manufacture B1’s products. Further details regarding the contract and
negotiation process between B1 and one of its main manufacturing plant are provided in section
4.2.2.1.
One of the main characteristics of B1’s supply chain is its attention and care in the development
of suppliers that can translate the Brazilian history B1 was trying to develop and value. It
invested in searching for and developing several new raw materials procured from small farms
and native Indian communities from great distances, such as the Amazon rain forest. Due to
legal constraints, B1 had to go through a very complex, time-consuming and costly process to
develop each of its raw materials. The B1 Brazilian brand has products to represent each of the

180
Brazilian biomass areas, which are the Amazon rain forest, coast areas, Caatinga, Cerrado,
Pantanal, and Atlantic forest, as illustrated in Figure 50.
Figure 50: Brazilian biomass areas
Each of these areas in Brazil is very unique in its characteristics and raw material richness, as
well as challenges. As an example, personally contacting some communities in the Amazon,
requires a four hour flight from Sao Paulo to Manaus, in the Amazon, and from Manaus, a trip
on a boat that could last up to three days until reaching a specific native Indian community
which has the desired raw material. At the other extreme, Caatinga is a desert-like area. The
plants used there are very challenging, as is dealing with the micro farmers. Another challenge
B1 has to deal with is the low level of education of the micro farmers in these areas. “Preparing
and a signing any kind of contract is very challenging” (Informant #74). However, dealing with
all of these challenges of establishing partnerships in with several tiers in its supply chain was
crucial for the success of B1 in Brazil. To have the right raw materials requires visiting the raw
material direct producers, negotiating with them, usually together with individuals from the
firm which will be the raw material converter, the chemical manufacturer.

181
2nd tier suppliers
(chemical and packaging)
Challenges also included packaging partnerships at all levels. The buyer and supplier
relationship between B1 and its packaging suppliers is very close. B1 tries to use its packaging
to tell the story of its ingredients by hiring local artists to design its primary and secondary
packaging.
B1 and its first and second tier suppliers also have to deal with political challenges at the federal
level. The most challenging is related to government agency called Cegen and will be further
discussed in Section 4.2.3. Figure 51 illustrates the upstream firms of B1’s suppliers.
Figure 51: Upstream network illustration of B1’s supply chain
Downstream, B1’s supply chain focuses on the sales channel through retail stores, mostly
franchises. In the summer of 2014, B1 had about 30 stores for its Brazilian brand and was
2nd and 3rd tier
suppliers (services)
1st tier suppliers
(chemical)
Focal firm
3rd tier suppliers
(raw materials)
1st tier supplier (outsourced
manufacturing plant)
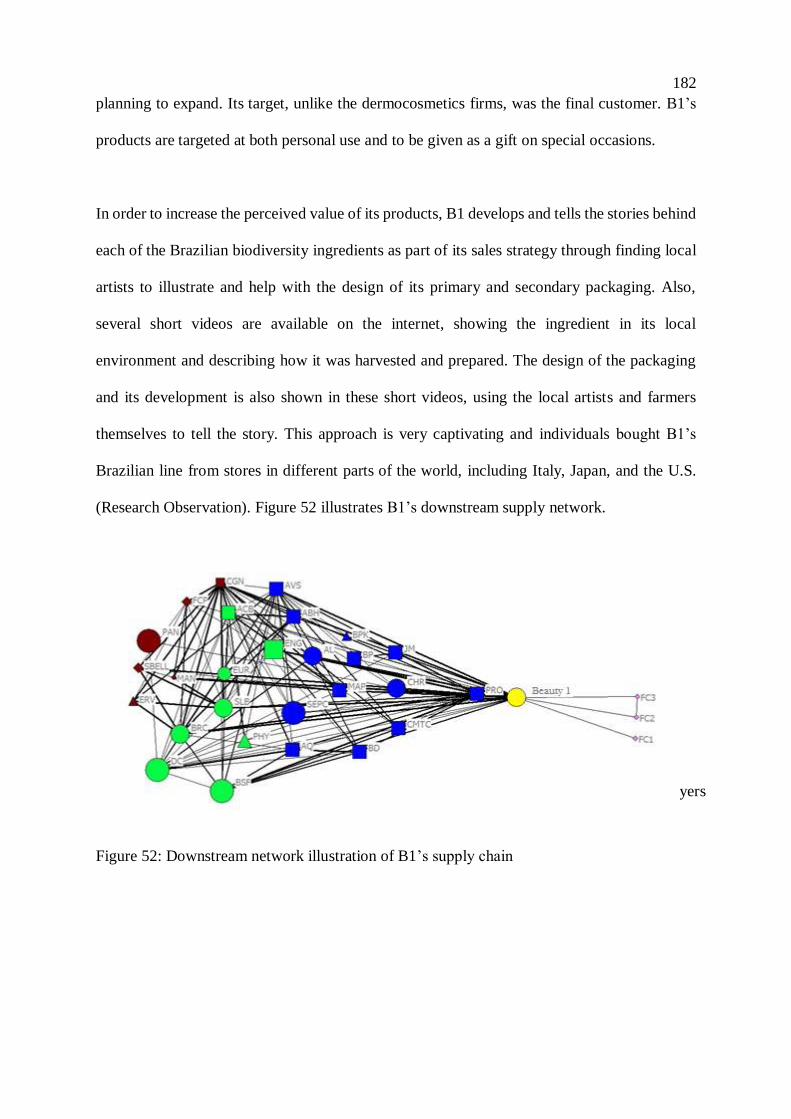
182
planning to expand. Its target, unlike the dermocosmetics firms, was the final customer. B1’s
products are targeted at both personal use and to be given as a gift on special occasions.
In order to increase the perceived value of its products, B1 develops and tells the stories behind
each of the Brazilian biodiversity ingredients as part of its sales strategy through finding local
artists to illustrate and help with the design of its primary and secondary packaging. Also,
several short videos are available on the internet, showing the ingredient in its local
environment and describing how it was harvested and prepared. The design of the packaging
and its development is also shown in these short videos, using the local artists and farmers
themselves to tell the story. This approach is very captivating and individuals bought B1’s
Brazilian line from stores in different parts of the world, including Italy, Japan, and the U.S.
(Research Observation). Figure 52 illustrates B1’s downstream supply network.
Figure 52: Downstream network illustration of B1’s supply chain
Stores
Focal firm
3rd tier buyers

183
4.1.3.2 Case Four: Beauty 2 (B2)
Beauty 2 is a spin-off of a Brazilian business group headquartered in the Mideast of Brazil. The
group was formed by 14 firms, the biggest and most important of which is STRT, a household
cleaning firm established in 1987. STRT was considered among the ten most important
household cleaning products manufacturers in Brazil. Ten years after the beginning of STRT
and the group, its cosmetics business started, which we are calling B2. In total, in B2’s supply
chain we investigated six tiers, which included B2 plus three levels of suppliers and two levels
of buyers. The second tier buyer designation is not applicable in B2’s supply chain structure.
To understand more about B2’s supply chain, we interviewed 27 informants in different tiers
of its supply chain (see Figure 53).
Figure 53: Number of informants in each tier of B2’s supply chain
B2’s brand and product concepts were inspired after the founders of STRT and B2 travelled to
France, more specifically to the Southern part of France. In contrast to B1, which was a French
firm producing in Brazil and inspired by the Brazilian biodiversity, B2 was a Brazilian firm,
inspired by the Southern France’s beauty and story. B2 developed several products and product
lines, bringing French concepts and fragrances to the Brazilian customers. “Tradit ionally, we
3rd tier
• 1
2nd Tier
• 6
1st Tier
• 11
Focal
•6
1st Tier
•2
2nd Tier
•N/A
3rd Tier
•1
Upstream Downstream
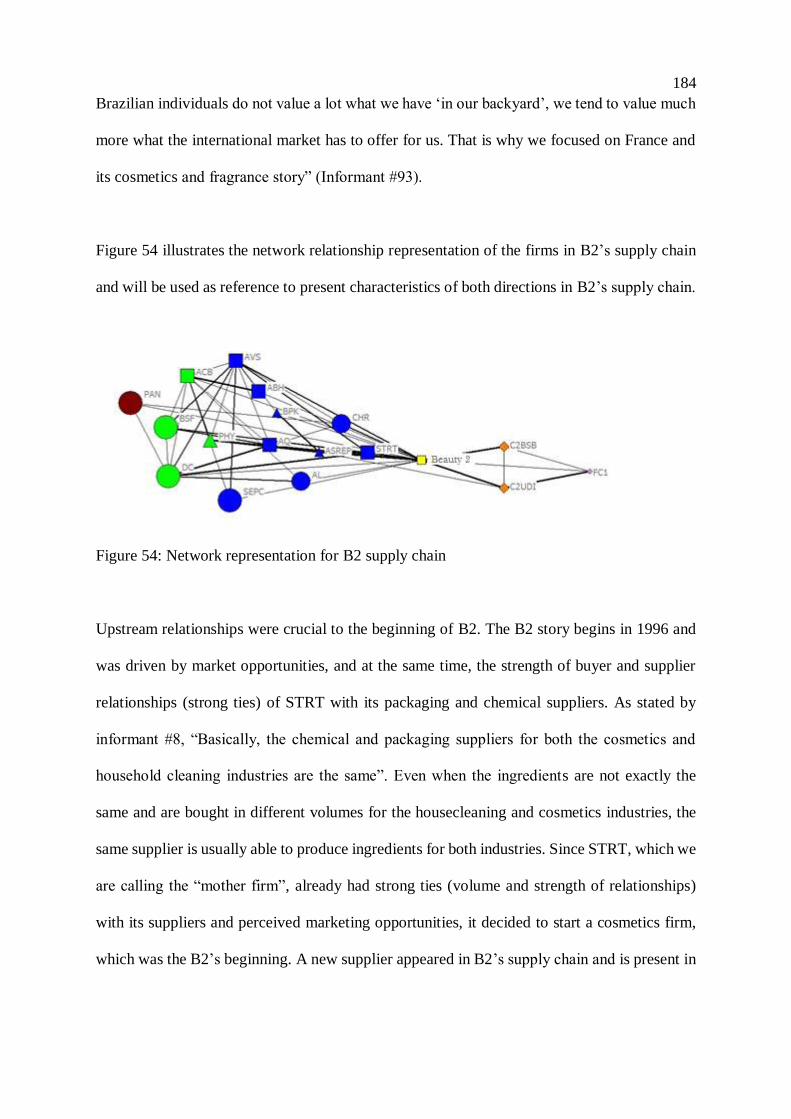
184
Brazilian individuals do not value a lot what we have ‘in our backyard’, we tend to value much
more what the international market has to offer for us. That is why we focused on France and
its cosmetics and fragrance story” (Informant #93).
Figure 54 illustrates the network relationship representation of the firms in B2’s supply chain
and will be used as reference to present characteristics of both directions in B2’s supply chain.
Figure 54: Network representation for B2 supply chain
Upstream relationships were crucial to the beginning of B2. The B2 story begins in 1996 and
was driven by market opportunities, and at the same time, the strength of buyer and supplier
relationships (strong ties) of STRT with its packaging and chemical suppliers. As stated by
informant #8, “Basically, the chemical and packaging suppliers for both the cosmetics and
household cleaning industries are the same”. Even when the ingredients are not exactly the
same and are bought in different volumes for the housecleaning and cosmetics industries, the
same supplier is usually able to produce ingredients for both industries. Since STRT, which we
are calling the “mother firm”, already had strong ties (volume and strength of relationships)
with its suppliers and perceived marketing opportunities, it decided to start a cosmetics firm,
which was the B2’s beginning. A new supplier appeared in B2’s supply chain and is present in

185
the B3’s and B4’s supply chains as well. It is a make-up outsourcing manufacturer, labeled
CHR (see Figure 55).
Figure 55: Upstream network illustration of B2’s supply chain
Downstream, B2 had to change its sales channel few years after its beginning. Initially, it was
focused on the direct sales model, “such as Avon, Mary Kay, or Natura” (Informant #62). B2
had about 500 “B2 ladies”, but then gave up this model after two or three years and adopted
the franchise model. “We were trying to develop and sell products with a high level of
aggregated value, especially for gifts on special occasions. Through the direct sales model, we
were not able to translate that value into sales, which is why we moved to franchise model”
(Informant # 62).
Focal firm
1st tier suppliers
(chemical)
“Mother firm”
Make up
outsourcer
1st tier suppliers
(packaging)
2nd and 3rd Tier
suppliers (services)
2nd tier suppliers
(chemical and
packaging)
3rd tier suppliers
(chemical)

186
The franchise model began about 2011. Up to fall of 2014, B2 had about 55 stores. In the
beginning of its franchise model, it committed several mistakes, including not choosing the
correct profiles for the franchisees and not picking the best places to open the stores. This
illustrates how trial and error is part of B2’s culture, as expressed by its CEO, “(…) Well, we
actually don’t have any planning, here is just about making dreams come true. We sleep
dreaming and wake up working to make the drams become reality!” (Informant # 62).
Despite its lack of planning, B2 is doing well. Besides its 55 franchise stores, it has ten more
planned to open through spring 2015. The existing stores are doing well. Informant #65, who
is the franchise owner of B2’s third store, which was opened in November 2011, said: “We
opened our store less than two months before Christmas, and just in the first December alone,
we had about 1,600 new customers visiting the store.” The focus of B2 is on the development
of products and kits for presents and gifts. “Our products are usually bought to be offered as
gifts for special occasions. Even the individuals who buy our products for themselves, they buy
as presents themselves, like ‘I deserve it, I can have it’. Figure 56 illustrates the downstream
organization of B2’s supply network.
Figure 56: Downstream network illustration of B2’s supply chain
Focal firm
3rd tier buyers 1st tier buyers

187
4.1.3.3 Case Five: Beauty 3 (B3)
B3 is one of the most important beauty products chains in the world. It is not just the biggest
Brazilian beauty products firm, but it is also the largest perfumery and cosmetics franchise in
the world. At the end of 2014, it had about 3,800 stores. Although the largest number of its
stores is located in Brazil, it also has stores in Portugal, Mexico, Bolivia, Peru, United States,
Paraguay, Japan, France, and Venezuela.
B3 is a group formed by four cosmetics sales chains. Three of them were new, with five years
or less of experience. This research will focus on B3’s main brand, which is its largest and
oldest one, which we will just call B3. Analogous to Dermo 1 and Dermo 2, B3 also started as
a small prescription drugstore. It started in 1977 in the city of Curitiba, in the southern area of
Brazil. However, different from D1 and D2, B3 since its beginning has focused on
manufacturing products to be used as gifts and presents for special occasions. One of its initial
stores was opened in an airport in southern Brazil. “The idea was that if you were arriving in
or from somewhere and had forgotten about buying a present or gift for someone special, you
could, for sure, find that something special in a B3 store located in the airport lobby” (Informant
92). B3 grew up during the last 37 years to become huge by itself. By spring 2015, it had about
7,000 direct employees and several thousand indirect employees.
B3’s supply chain is one of the biggest and most complex of the researched supply chains,
composed of more than 5,000 different suppliers of packaging, chemicals, and services. In
total, for B3’s supply chain, we investigated six tiers, which included B3 plus three levels of
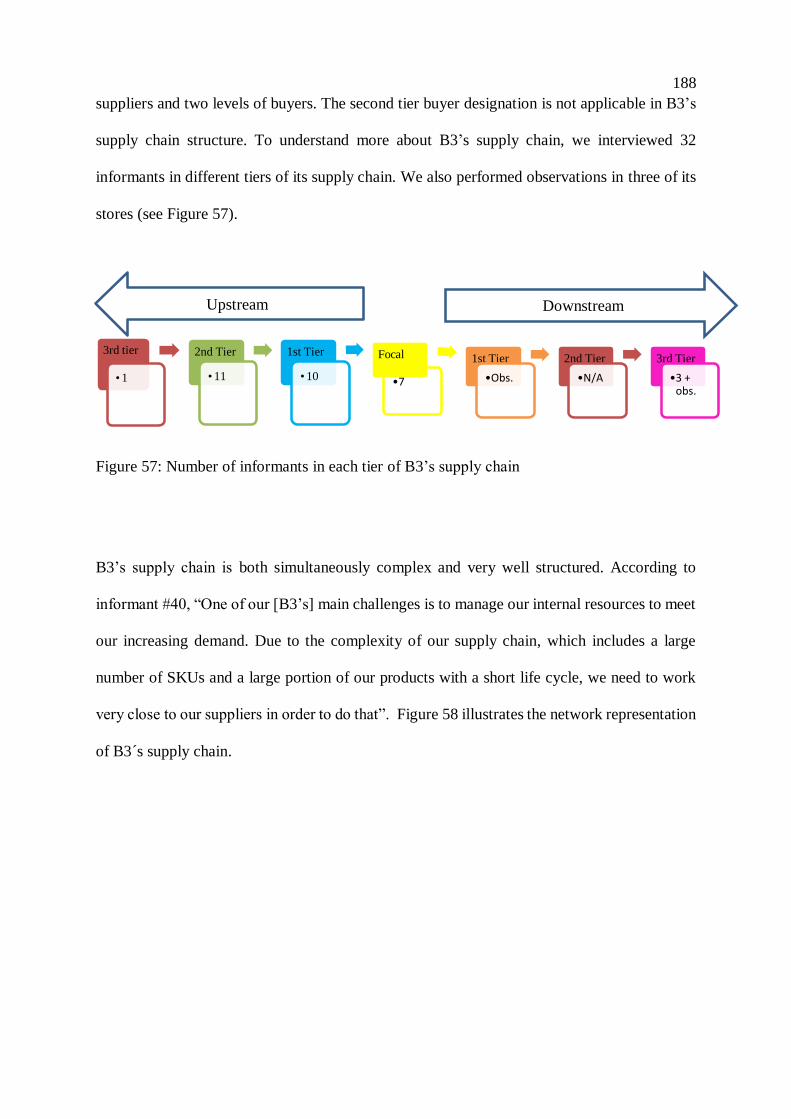
188
suppliers and two levels of buyers. The second tier buyer designation is not applicable in B3’s
supply chain structure. To understand more about B3’s supply chain, we interviewed 32
informants in different tiers of its supply chain. We also performed observations in three of its
stores (see Figure 57).
Figure 57: Number of informants in each tier of B3’s supply chain
B3’s supply chain is both simultaneously complex and very well structured. According to
informant #40, “One of our [B3’s] main challenges is to manage our internal resources to meet
our increasing demand. Due to the complexity of our supply chain, which includes a large
number of SKUs and a large portion of our products with a short life cycle, we need to work
very close to our suppliers in order to do that”. Figure 58 illustrates the network representation
of B3´s supply chain.
3rd tier
• 1
2nd Tier
• 11
1st Tier
• 10
Focal
•7
1st Tier
•Obs.
2nd Tier
•N/A
3rd Tier
•3 + obs.
Upstream Downstream

189
Figure 58: Network representation of B3 supply chain
B3’s upstream supply chain is one of its greatest strengths. “We have some venture partners
with whom we have been dealing since our first product was launched, in other words, we have
some suppliers who are the same for more than 25 years” (Informant #33), illustrating the
strong ties that B3 has with its suppliers. B3 organizes its suppliers into direct and indirect
suppliers. The direct suppliers are those whose products or services are directly related to final
product manufacturing. Indirect suppliers, “deal with anything else, from TV commercials to
employees’ health plans” (Informant #33)
B3’s direct suppliers include chemical, packaging, and service suppliers. Chemical suppliers
primarily provide ingredients and fragrances. Packaging suppliers supply material or services
related to primary and secondary packaging. Examples of service suppliers include those that
provide decorations on the bottles and boxes. Informant #33 describes B3’s supply chain of
direct supplies as “simpler to be managed” when compared to its supply chain of indirect
supplies. One explanation is related to its numbers, “While we have no more than 300 suppliers
for direct supplies, we have more than 5,000 active possible suppliers for indirect supplies”
(Informant #33), making the development of strong ties difficult. Although B3 has a large

190
number of suppliers, they are organized by strategic criteria, which are: what and with whom
we want to focus? Is this supplier strategic for us? Are we a strategic client for this supplier?
Answering questions like these, B3 was able to organize its strategic supply base into 42
strategic suppliers for direct supply (among about 300 possible ones), and 32 strategic suppliers
for indirect supplies (among more than 5,000 possible ones). This made the development of
strong ties with its strategic suppliers much more feasible.
According to Informant #40, B3’s supply chain is “complex and long”, however, what we
found in our research was that B3’s supply chain was complex and rather compact, compared
with the other supply chain that we studied. By compact, we mean that we found many more
first and second tier suppliers, compared with third or fourth tier suppliers. The reason for this
is linked to the fact that B3 buys its supplies more directly from the firms it deals with, no
matter whether that supplier is a multinational firm with plants in more than 100 countries or
it is a local long-term supplier.
Figure 59 highlights the upstream network representation of B3’s supply chain.
Figure 59: Upstream network illustration of B3’s supply chain
Focal firm
1st, 2nd, and 3rd tier suppliers
(services)
1st tier suppliers (packaging)
1st tier suppliers (chemical)
3rd tier supplier (chemical)

191
Downstream, B3’s supply chain network illustrates high dispersion. Almost 4,000 of B3’s sales
units can be found in more than 1,750 towns all over Brazil, with 22,000 employees. B3 has
about 900 franchise owners, some of whom have been with B3 for more than 30 years, while
others are in the second or even third generation of the same family in the business. “It is a
very good business. Many of our franchisees start with one store and then open another one,
and another one, and so on. They also prepare their kids to become the new entrepreneurs”
(Informant #64).
Different from the upstream characteristics of B3’s supply chain, which is very international,
B3’s downstream supply chain is mostly local. Although B3 has stores in ten countries besides
Brazil, its main operations are in Brazil, and as noted by one of its executives, “We do not have
any intention to go international for the next few years” (Informant #40). The reason stated for
this decision was related to Brazilian internal marketing characteristics and opportunities.
“Besides Asia, all the other countries in world are either stagnated or growing in a
very low rate. If we take that in consideration, Brazil is just behind China in terms of growing in the market. Everybody wants to come to Brazil. We have seen a huge
movement of many international companies coming to Brazil because of our internal
marketing. We already have this. We are the [beauty products] leaders here [in Brazil] by far. In other words, we are in the position where many other cosmetics
companies in the world would like to be. Why would we go international now?
There is no reason for that now and nor in a couple years” (Informant #40).
It is also important to note the 3rd tier buyers’ characteristics. B3 has been
able to develop a very significant and desirable brand. Its products are desired
by a very large range of customers representing different ages and genders.
“I love its perfume that looks like my tennis shoes”, said a teenage customer.
“It is quite impressive how many B3 bags and boxes we may see under our
Christmas tree every year” said Informant #84. If you do not know what to
buy or how to please someone, just enter a B3 store in a mall and you will,
for sure, find something interesting” (Informant #86).
Figure 60 illustrates the downstream representation of B3’s supply chain.

192
Figure 60: Downstream network illustration of B3’s supply chain
4.1.3.4 Case Six: Beauty 4 (B4)
B4 is a Brazilian cosmetics and beauty products manufacturer. It was founded in 1969, and in
1974 it adopted the direct sales model that it uses today. One of its main characteristics is the
natural appeal in the essence of its products and production processes. B4 is widely recognized
for its care for its environmental impact and its focus on natural-based and ethically sourced
products. In 2014 B4 had more than 1.7 million “consultants” (resellers), also called “B4
Ladies”, spread throughout Brazil, Argentina, Chile, Colombia, France, Mexico, and Peru
among others. B4 grew to become the leader in cosmetics sales in Brazil and in 2004 it became
a public firm, listed on the São Paulo stock exchange. Since 2006, B3 has surpassed Avon's
sales in Brazil and is the sixth biggest direct sales firm in the world (Direct Selling News,
2015). Since 2013, however, B3 has lost its position as the biggest cosmetics firm in Brazil to
B3.
Focal firm
1st tier buyers
(franchise stores)
3rd tier buyers
(final customers)

193
Together with B3, B4’s supply chain is one of the biggest and most complex in the researched
supply chains. B4 has more than 6,600 direct employees and many other thousands thorough
its resellers. It has more than 5,000 different suppliers for packaging, chemicals, and services,
with a special attention to 33 local communities in specific areas, such as Amazon rain forest,
where B4 has close relationships (strong ties). We investigated seven tiers of B4’s supply chain,
which include B4 plus three levels of suppliers and three levels of buyers. Although we
separated the first tier buyer from the focal firm, it is important to note that this person is an
employee of B4. However, due to the fact that she is not directly involved with the firm and
her area job was much closer to one of a middleman, we separated this tier. To understand more
about B4’s supply chain, we interviewed 40 informants in different tiers of its supply chain.
We also performed observations in two of its sales meetings (see Figure 61).
Figure 61: Number of informants in each tier of B4’s supply chain
B4’s supply chain is very complex and extended. Due to B4’s natural appeal in the essence of
its products, it has to pay very close attention to its suppliers and basic raw material producers,
which includes a high degree of traceability requirements. These requirements have been
emphasized during the last few years, especially due to regulatory reasons that will be further
3rd tier
• 5
2nd Tier
• 2
1st Tier
• 19
Focal
•6
1st Tier
•1
2nd Tier
•4 + observ
3rd Tier
•3
Upstream Downstream

194
discussed in section 4.2.3. B4’s supply chain is illustrated in Figure 62 and provides reference
for illustration of B3’s upstream and downstream supply chain.
Figure 62: Network representation of B4’s supply chain
Upstream, B4 organizes its suppliers in a manner that is analoguous to what B3 does. B4 calls
its main categories productive and non-productive suppliers. Both categories include sub-
categories for packaging, chemicals, and services. The productive suppliers are those whose
supplies go directly into the composition of the final product. Although B4 has a very large
number of suppliers, about ten percent (~500 suppliers) represent about 70% of the volume
purchased by B4.
A great number of suppliers for B3 and B4 are basically the same, thus we focused attention
on two distinct groups, the local communities for raw material supplies and outsourced
manufacturing plants. The local communities for raw material supplies are small groups of
individuals, usually families, who live in distant locations of Brazil and are responsible for the
harvest of fruits, flowers, and seeds that compose the Brazilian biodiversity. Access to these
comunities is very challenging for geographical and logistical reasons, however, B4 has
developed strategies to keep its relationship with them as close as possible. In 2014, B4 had

195
close relationships with 33 comunities, 25 of which supplied ingredients used in B4’s products.
These comunities include about 3,100 families who are directed impacted by B4’s actions.
These families are required to send detailed information about what is being planted and
harvested and how it was done. B4 uses iPads and other tablets to allow these families to send
the needed information, including pictures. There were strategic reasons behind this, not just
because B4 has strong roots in the Brazilian biodiverstiy, but especially due to regulatory
requirements. There is a Brazilian law (MP 2186/2001) that requires traceability of each
Brazilian biodiversity ingredient and that the profit from the use of these ingredients is shared
with the farmers and comunities. We will discuss more about this law and its impact on B4 and
other supply chains in Section 4.2.3.
The outsourced manufaturing plants are also an important part of B4’s service suppliers. They
are placed among the productive suppliers and are strategically selected. The reason why B4
uses some outsourced manufacturing plants is mostly due either to overloaded capacity in its
own plants, or due to specialized needs such as makeup, nail polishes, samples, or different
sizes for specific products. We will discuss further details about the relationship between B4
and one of its main outsorced plants in Section 4.2.2.2. Figure 63 provides the upstream
network representation of B4’s supply chain.

196
Figure 63: Upstream network representation of B4’s supply chain
B4 invests a substantial part of its resources in its downstream supply chain, where logistics
and transportation play a very important role. In order to attend to purchasing orders from its
resellers, B4 has eight distribution centers and third partner logistics (3PL) spread across
strategic geographical areas in Brazil. “We are offering our best level of service in B4’s history”
(Informant #81). According to B4’s annual report (2014), on average 60,000 purchasing orders
are picked and mailed per day, and 38% of all deliveries are made in less than 48 hours. Thus,
although a distribution center is a first tier supplier in service as a third party logistics provider
(3PL), we placed it in the downstream direction of the supply chain, due it being closer to the
customers.
Focal firm
1st, 2nd, and 3rd
tier suppliers
(services) 1st tier
suppliers
(packaging)
1st tier suppliers (outsourced
manufacturing plants)
1st tier suppliers
(chemical) 3rd tier suppliers (chemical and local raw
material producers)

197
B4 uses a direct sales model with a multi-level compensation structure. It has a regional director
who is responsible for a specific geographical area. “Usually, a regional director is responsible
for about 600 B4 ladies” (Informant #100). This regional director is a B4 employee, however
he or she (usually she) is always in her own geographical area and does not participate in hardly
any B4 decisions or processes. “We are employees because of legal requirements of the
Brazilian law, but we act much more as a middlemen” (Informant #100). Below the regional
director comes the B4 ladies’ coaches. They are usually long term B4 ladies who start to build
their own network of B4 ladies, and in direct connection with the final customers, there are the
B4 ladies. Even if a final customer wanted to, he or she would not be able to buy a B4 product
directly on the internet or from any other retail channel; B4 products can only be purchased
through one of the B4 ladies. B4 places a lot of value in its 1.7 million B4 ladies, but it
understands that the same model adopted in early 1970’s will need to be improved for the 21st
century. In December 2014, 15,000 “digital B4 ladies”, as they were called, started virtual
businesses.
Although B4 invests a lot of resources in its direct sales channel, it has been losing both B4
ladies and total sales. The reasons might be related to other competitors’ sales models, as stated
by informant # 90.
“I have been working with B4 for more than 10 years now. It helps me to pay some of
my bills, but not a lot. I saw some friends, some of them who were even B4-ladies’ coaches, however, leaving B4 and joining MaryKay. One of them actually might be
considered rich now, she drives the pink car, which would not had happen to her if she
had continued to work with B4” (Informant #90)
Figure 64 illustrates B4’s downstream supply chain network.

198
Figure 64: Downstream network representation of B4’s supply chain
4.1.4 Identified Mid-Range Events
Not all events in a source firm will have impacts on member of its own or other supply chains.
During this research, six mid-range events that had impact beyond its source organization and
which are depicted in Table 31.
Source Case Mid-range event
D1
1 Acquisition by an investment group
2 Event in the marketing and sales director
3 Event in sales model
B1 4 Commercial disagreement
5 New projects allocation for specific supplier
Gov 6 Legal event - MP 2186/2001
Table 31: Identified mid-range events
2nd tier buyers
(C4 ladies)
Focal firm
1st tier supplier (3PL)
3rd tier buyers
(final customers)
1st tier buyers (regional
directors C4-ladies coach)

199
4.2 Cross-Case Analysis: Dissemination of the Impact of Events in Multi-tier, Multi-
Dimension Supply Chains
This section aims to fulfill the third secondary goal for this research, which was to investigate
and analyze the dissemination of the impact of a mid-range event over real multi-tier,
multi-dimension supply chains in micro, macro, and integrated contexts. This supports the
answer for our research question: “Why and how does the impact of an event in a focal firm
affect other members of its own and other supply chains?” We used the data collected as
described in Chapter 3 with supply chains as our unit of reference as described in Section 4.1.
In this section, our unit of analysis was a mid-range event and its impact. We analyzed six
mid-range events. Five of them were initiated in one of the researched focal firms and one of
them was initiated in a government agency. We start each case presentation with a brief
explanation about the focal firm, and the main other involved firms. Following the initial
information, we present the proposition(s) that will be discussed in the following paragraphs.
We analyze each event individually. We focus on a mid-range event and its impact in the
source firm itself and on other firms in its supply chain or in other supply chains (see Table
32).

200
Source Case Mid-range event Upstream Downstream Perpendicular TOTAL
D1
1 Acquisition by an investment group 2 2 - 4
2 Event in the marketing and sales director 1 2 - 3
3 Event in sales model 2 3 1 6
B1 4 Commercial disagreement 3 3 1 7
5 New projects allocation for specific supplier 3 - 2 5
Gov 6 Legal event - MP 2186/2001 - 7 - 7
Total number of impacted tiers 11 17 4 32
Table 32: Tiers impacted by each mid-range event analyzed in this section
201
4.2.1 Events in D1’s Supply Chain
In this section, we discuss six mid-range events that occurred in D1’s supply chain. These
events began in 2010 when an investment group bought D1. This event led to several other
decisions, which led to other events, which led to other decisions and events as well, and so on.
The fact that D1 was bought by an investment group impacted a series of other events, such as
the hiring of executive professionals, financial and operational investments, the establishment
of new processes, rules, procedures, policies, and implementation of new software, among
others. Some of these events impacted directly D1 and links in its upstream and downstream
supply chain, while others did not.
We are aware that in real complex multi-tier, multi-dimension supply chains, decisions are not
made independently of each other. However, to help isolate specific cause-and-effect
relationships, we investigated each of the events and its impact separately, to the extent
possible. At the end of this section, we discuss other events, from which we could not perceive
any impact.
202
4.2.1.1 D1 Acquisition by an Investment Group
As described in section 4.1.2.1, D1 is a medium size Brazilian dermocosmetics firm, which
had been the market leader in products for beauticians and estheticians until the early 2000’s.
Over the last decade, it experienced several periods of financial crisis. Even after its financial
and market struggles, it was still considered one of the three major dermocosmetics firms in
the Brazilian market (Copernico, 2012). In the fall of 2010, an investment group bought D1.
For this event, we discuss the applicability of two propositions, which are P6: The Ripples
Effect and P1: The Pity-Pat Effect. We discuss the propositions in this sequence so that the
story behind the case illustrates its evidence.
P6: The Ripples Effect
The following paragraphs give support for P6: The Ripples Effect, which states that an event
in a focal firm may impact other tiers in the same supply chain or in other supply chains
(perpendicular direction). The acquisition had a great impact on D1, both financially and
operationally. Financially, because D1 had much greater financial resources, it was able to
make new investments, which included investments in R&D, marketing, strategically hiring
new employees, and investments in equipment and inventory for raw material and packaging
supplies. Operationally, due to a series of investments, D1 built its own manufacturing plant to
improve its production levels in terms of quantity and quality. However, the acquisition event
was not universally well received within D1. Some individuals who had been working for D1
for many years did not agree with it and resigned. D1 experienced about 50% turnover of its
plant employees during the first 12 months following its acquisition by the investment group.

203
D1’s acquisition by the investment group also had impacts in D1’s upstream and downstream
supply chain. Downstream, it impacted the first, second, and third tier buyers. Upstream, the
D1 acquisition impacted the first and second tier suppliers. It impacted different firms in each
of the tiers. In total, we could perceive an impact in 18 different firms beyond D1, which is
shown in Table 33.
Related to the extent of the impacts, we perceived an impact in both directions, upstream and
downstream. Downstream, all of the five franchises researched were greatly impacted. It also
impacted the second tier buyers, because with the substantial investments that had been made
by D1 since 2010, the franchises could improve their service for their clients (beauticians and
estheticians). Examples include having all the products available in the store, avoiding stock
outs and lateness in the delivery process for them. The final customers were also impacted by
the acquisition of D1, as well. After the investments had been completed, D1’s final customers
had better product availability in more franchise stores, as well as on the Internet.
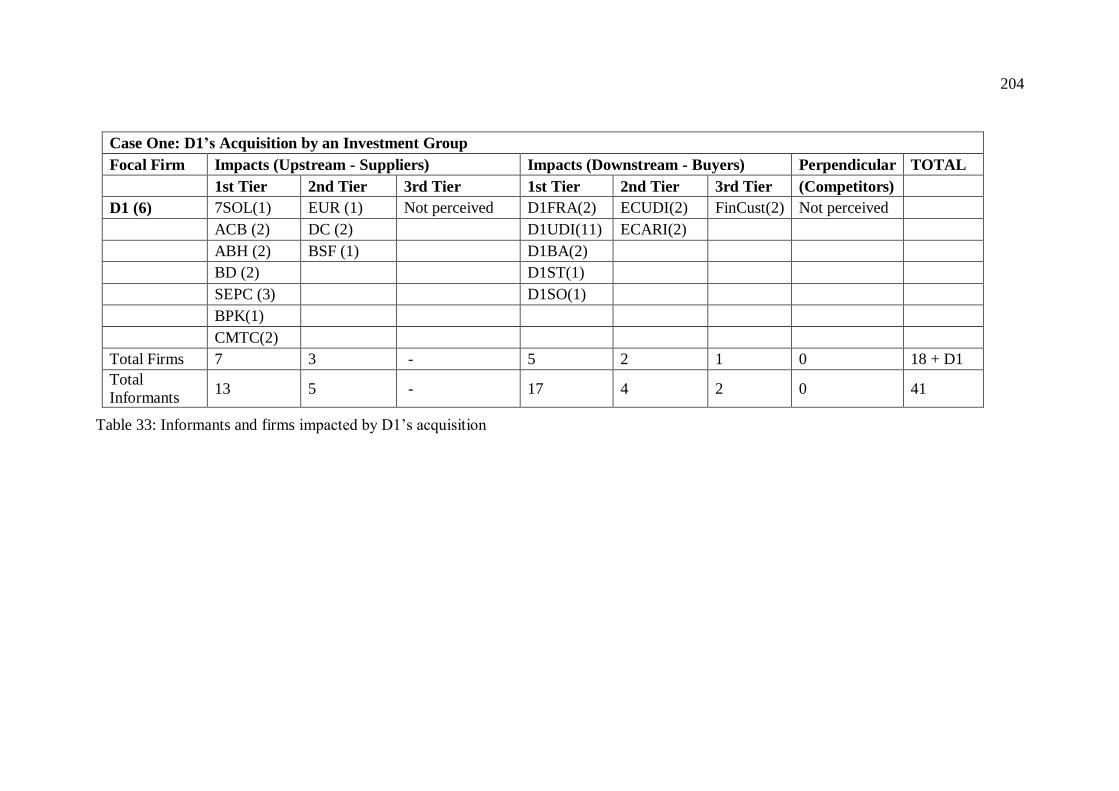
204
Case One: D1’s Acquisition by an Investment Group
Focal Firm Impacts (Upstream - Suppliers) Impacts (Downstream - Buyers) Perpendicular TOTAL
1st Tier 2nd Tier 3rd Tier 1st Tier 2nd Tier 3rd Tier (Competitors)
D1 (6) 7SOL(1) EUR (1) Not perceived D1FRA(2) ECUDI(2) FinCust(2) Not perceived
ACB (2) DC (2) D1UDI(11) ECARI(2)
ABH (2) BSF (1) D1BA(2)
BD (2) D1ST(1)
SEPC (3) D1SO(1)
BPK(1)
CMTC(2)
Total Firms 7 3 - 5 2 1 0 18 + D1
Total
Informants 13 5 - 17 4 2 0 41
Table 33: Informants and firms impacted by D1’s acquisition

205
Upstream, the first and the second tier suppliers’ effects were mostly related to D1’s new ability
to make its payments on the due dates without a struggle. Thus, these investments, which
allowed the event to have an impact in different tiers on D1’s supply chain, provided support
for P6, as stated below, which is illustrated in Figure 65.
Upstream
Downstream
Figure 65: Ripples Effect illustration for D1’s acquisition
P6: The Ripples Effect Principle. An event in a focal firm may impact other tiers in the same
supply chain or in other supply chains (perpendicular direction).

206
P1: The Pity-Pat Effect
Next, we describe how this event provides support for P1: The Pity-Pat Effect principle,
which states that the closer tiers in a supply chain will experience a stronger impact of a mid-
range event, which decreases for the farther tiers. Related to the intensity of the impacts of
D1’s acquisition by the investment group, the first tier buyers were the most strongly impacted.
This happened because the great majority of D1’s franchises were a single brand store, many
of them with more than 30 years of relationship with D1. In other words, everything that
impacted D1 would directly and strongly impact them, too. We also perceived a great impact
for first tier suppliers due to the new way of negotiating and ability to fulfill promises in terms
of financial commitments. The next most substantial impact was upon the second tier buyers,
the franchise’s clients, followed by the second tier suppliers, and finally the third tier buyers,
who were the final customers. We did not perceive impacts in the next links or tiers. This
phenomenon is illustrated in Figure 66 and Table 34 and provides evidence for the following
proposition:
P1: The Pity-Pat effect principle. The closer tiers in a supply chain will experience a stronger
impact of a mid-range event, which decreases for the farther tiers

207
Figure 66: Pity-Pat Effect illustration for D1’s acquisition
Source Firm 1st Tier
Buyers
1st Tier
Suppliers
2nd Tier
Buyers
2nd Tier
Suppliers
3rd Tier
Buyers
Other
Tiers
Dermo 1 D1SO ***** 7SOL ***** ECUDI ** EUR * FC1 * Not
perceived
D1ST ***** BPK *** ECARI ** DC * FC2
D1
UDI
***** BD ***
DOW * FC3
D1BA ***** CMTC ***
D1BH ***** SEPC **
ABH *
ACB *
Table 34: Pity-Pat Effect for D1’s acquisition
Bounces
Rip
ple
s
D1 1st tier buyers 1st tier
suppliers
2nd tier
buyers
2nd tier
suppliers
3rd tier
buyers
Other tiers were not perceived

208
4.2.1.2 D1´s New Marketing and Sales Director
This event also occurred in D1’s supply chain, as an impact of the event discussed earlier (D1’s
acquisition by an investment group). For this change in the marketing and sales director, we
will discuss the applicability of three propositions, which were P6: The Ripples Effect, P1: The
Pity-Pat Effect, and P3: The Magic Angle Principle, which are discussed in a sequence where
the story behind the case illustrates its evidence.
P6: The Ripples Effect Principle
The following paragraphs give support for P6: The Ripples Effect Principle, which states that
an event in a focal firm may impact other tiers in the same supply chain or in other supply
chains (perpendicular direction). About one year after D1 was acquired by the investment
group, a recent marketing manager was promoted to be the new marketing and sales director.
This event led to several impacts in the focal firm, as stated by Informant #5, “Just one change,
which is our new [marketing and sales] director, many other changes [impacts] were promoted
in our firm”. These impacts were seen in different areas and departments. The departments of
marketing and sales, of course, were highly impacted. The employees working in these areas
moved together with the new director into several new projects, including the redesign of the
packaging for more than 300 products and the launch of a new sales model, among others. Both
internally and externally, this event led to simultaneous challenges and opportunities.
Internally, one of the first impacts that was seen was related to production and operations. Due
to the redesigned packaging and visual appearance for so many different products, employees
in purchasing, R&D and manufacturing had to develop new processes and new suppliers. Many

209
of the manufacturing employees did not deal well with the new time and productivity pressures
and resigned from their position at D1.
Upstream, many of D1’s packaging suppliers were no longer able to meet the new standards,
especially regarding time, quantity, innovativeness and quality. D1’s operations and supply
chain staff had to develop new suppliers. In doing so, D1 ended its relationship with several
suppliers, and at the same time, had to begin new relationships with other suppliers.
Downstream, all five franchises were also impacted. They mentioned impacts on their store
space and their inventory. “The displays in my store are much more beautiful and attractive to
the customers now” (Informant #24). The new packaging became also a way to encourage
experimentation with new products by both the second and third tier buyers, which increased
sales (Informant #27). Simultaneously, D2 was impacted by the change in D1’s marketing and
sales director, “We are growing in a rhythm so fast that is bothering our competitors. I’ve heard
from one of our suppliers that D2 scheduled a meeting with its board of directors to discuss
what we’ve being doing here to sell so much” (Informant #5). Thus, overall, we saw impact of
the new marketing and sales director in five tiers, one upstream, three downstream, and one
perpendicular, which was a direct competitor (see Figure 67). Table 35 presents the impacted
firms and the number of informants interviewed in each, supporting the following proposition:
P6: The Ripples Effect Principle. An event in a focal firm may impact other tiers in the same
supply chain or in other supply chains (perpendicular direction).

210
Upstream
Downstream
Figure 67: Ripples Effect illustration for D1’s change of marketing and sales director

211
Case Two: Event in Sales and Marketing Director
Focal Firm Impacts (Upstream - Suppliers) Impacts (Downstream - Buyers) Perpendicular TOTAL
1st Tier 2nd Tier 3rd Tier 1st Tier 2nd Tier 3rd Tier (Competitors)
D1 (6) 7SOL(1) Not perceived Not perceived D1FRA(2) ECUDI(2) FinCust(3) D2 (8)
BPK (2) D1UDI(11) ECARI(2)
ACB (2) D1BA(2)
CMTC(2) D1ST(1)
D1SO(1)
Total Firms 4 - - 5 2 1 1 13 + D1
Total Informants 7 - - 17 4 3 8 39
Table 35: Informants and firms impacted by D1’s event in marketing and sales director

212
P1: The Pity-Pat Effect Principle
This change also provides support for P1: The Pity-Pat effect principle, which states that the
closer tiers in a supply chain will experience a stronger impact of a mid-range event, which
decreases for the farther tiers. Although we observed impacts in different tiers, both upstream
and downstream in D1’s supply chain, with the new director and the redesign in the packaging
for more than 300 products, the impacts were not the same in each tier. The most impacted
were at the franchise level (the first tier buyers). We also observed impacts in some of the first
tier suppliers, especially those related to packaging services. We also perceived impacts in the
second tier buyers, third tier buyers, and finally, some impact in D2, which is one of the D1’s
strongest competitors. We did not observe impacts in the next links or tiers. This phenomenon
is illustrated in Figure 68 and Table 36, providing evidence for the following proposition:
P1: The Pity-Pat effect principle. The closer tiers in a supply chain will experience a stronger
impact of a mid-range event, which decreases for the farther tiers.

213
Rip
ple
s
Figure 68: Pity-Pat Effect for D1’s new marketing and sales director
Source Firm 1st Tier
Buyers
1st Tier
Suppliers
2nd Tier
Buyers
3rd Tier
Buyers
Competitors Other
Tiers
Dermo 1 D1SO ***** 7SOL ***** ECUDI ** FC1 * D2 * Not
perceived
D1ST ***** BPK *** ECARI ** FC2 * ECES .
D1 UDI ***** BD **
FC3
D2ES
.
D1BA ***** CMTC ** D2SC .
ACB *
Table 36: Pity-Pat Effect of D1’s new marketing and sales director
D1 1st tier buyers
1st tier
suppliers
2nd tier
buyers 3rd tier
buyers
Other tiers were not
perceived Competitor
Bounces
214
P3: The Magic Angle Principle
The following paragraphs give support for P3: The Magic Angle Principle, which states that
even a low level of personal heuristics, biases, and locus of control will influence the impact
of an event over supply chain. Although D1 was a dermocosmetics firm, what we saw in the
redesign of most of its products did not translate the image associated with dermocosmetics.
Informant #1003, who used to be a D2 third tier buyer, did not know about D1 and decided to
Google its name. Her reaction, when she saw the images for D1 was, “It [D1] looks like
‘creminhos’14”. The same informant went further to state that, “This packaging [D1’s] reminds
me of another brand, which is the Xline from B4…” Based on Informant #1003’s comment
about the similarities between D1’s new packaging design and B4’s Xline products, we printed
both images and asked three final customers interviewed for this research and five other
informants from one of D1’s franchise store (Informants 54, 28, 1005, 27, and 26) about them.
We showed both images and asked the informants to value them in terms of their recollection
from zero (no remembrances) to ten (almost equal). On average, they said that both images
were about 70% related to each other.
It is important to note that D1’s new director of marketing and sales was a former B4 marketing
and sales executive, who worked several years for B4. When we pay attention to the design of
the new packaging of D1’s products, although we are aware that lots of financial and marketing
resources were invested, it is possible to note that some of this new director’s experiences as a
former B4 employee may have been directly applied to the design of this packaging. This may
also be because the same suppliers were considered in the selection of new venture partners.
14 “Creminhos” can be translated into small creams or lotions, but in this case, the informant used the expression
to indicate an undervalue she perceived in the brand due to the colorful appearance of its packaging.

215
This offers evidence for the influence of some heuristics and biases. For example, the fact that
the new director unconsciously chose a pattern for shapes and colors for D1´s products that
were similar to those for B4´s products is an example of the availability heuristic, since her
experience was still vivid in her mind. Also, even though the marketing and purchasing team
considered several different suppliers, the selected ones were those with which Informant #4
had had previous contact; this is an example of salient information and status quo bias. Illusory
correlation was illustrated by the fact that, even though most of the dermocosmetics packaging
tend to be more clean and more “medication like”, the new director chose a very colorful and
curvilinear pattern for D1’s dermocosmetics. This illustrates the misconception of the
regression bias and the representativeness heuristic. We also perceived insufficient adjustment
and illusion of control, when the new director started an entirely new process in D1 based on
her previous experience in B4. The two firms were very different in target marketing and
channel distribution, so applying similar strategies to such different realities and believing that
if they worked in one reality they would work in the other one, are examples of the illusion of
control and anchoring and adjustment heuristic. These support the following proposition:
P3: The Magic Angle Principle. Even a low level of personal heuristics, biases, and locus of
control will influence the impact of an event over supply chain.
216
4.2.1.3 D1’s New Sales Model
This event also occurred in the supply chain for Dermo 1, as an impact of the event discussed
earlier, the start of the new marketing and sales director. This director developed a new direct
sales model for D1. For the impact of the direct sales model, we discuss the applicability of
five propositions, which were P3: The Magic Angle Principle, P4: The Lift Force Principle,
P2: The Gyroscopic Effect, P6: The Ripples Effect, and P5: The Kinetic Energy Principle. The
propositions are discussed in a sequence so that the story behind the case illustrated its
evidence.
P3: The Magic Angle Principle and P4: The Lift Force Principle
The following paragraphs give support for P3: The Magic Angle Principle, which states that
even a low level of personal heuristics, biases, and locus of control will influence the impact
of an event over supply chain. They also offer support for P4: The Lift Force Principle, which
states that the impact of a mid-range event is proportional to its impact on individuals in the
supply chain links.
D1’s proposed direct sales model was inspired by some other cosmetics firm’s sales models,
especially beauty product firms that sell directly from the manufacturing plant to individual
salespeople (usually women), and then to the final customers. This director, who used to work
for B4, brought her experience and applied it to D1 with some additional considerations.
Because D1’s main target customers are estheticians and beauticians, D1 developed this sales
model for them, in a way that the only individuals who would be able to sell D1´s products

217
were the estheticians, who became salespeople with the benefitted from a great markup. Sales
were increased a lot, “Because of the direct sales, our sales increased more than 300% in 18
months” (Informant #5).
The impact of this new sales model was mostly perceived in the focal firm and its downstream
supply chain. In the focal firm, several processes needed to be redesigned in order to make it
happen. At the same time, a huge amount of work needed to be done with the franchisees, D1’s
1st tier buyers. The goal was to help them understand all the beneficial possibilities that the new
direct sales model could provide them and the estheticians, in terms of sales and profits. The
impact on the franchisees was manifested in different forms, such as increasing sales, in some
cases by about 50% (Informants #24, #25, # 88, and #54), or even more than 100% (Informant
#53). It also impacted the way that the franchisees hired and paid their employees, their goals
for sales, the buyer and supplier relationship (franchise store-esthetician), sales and purchasing
processes and volume, among others.
Inventory and financial impacts were also observed for 1st tier buyers, “We liked the new sales
model; some change was needed. However, they [D1] created a lot of new products and kits
for us to sell. What am I going to do with my old inventory? I have to buy the new ones
[products and kits], no matter how many of the old ones I have in my inventory. Who is going
to pay for that?” (Informant #25) From the five franchise owners interviewed for this research,
we observed indications of their locus of control. Two of them (Informants #46 and #48)
exhibited external locus of control, as can be indicated by the following statements, “You
know, I’ve been working with D1 for more than 20 years, and I like things the way they are. I
know we lost some market share, but that is because of the competition, there is not much we
can do by ourselves in this respect. The market is what it is” (Informant #46). “I tried to do

218
whatever I could, but I just don’t agree with this new model, and on top of that, the company
[D1] wants us to do all the hard work, they want that we go on the market and fight for the
customers; that should be their job” (Informant #48). On the other hand, other franchise owners
(even if they did not totally agree with it) did not question the value of the new sales model.
They decided to follow the guidance and do their job, as can be noted in the following, “When
we buy a franchise, we need to trust our franchiser, I trust mine. I know they invested lots of
money in this project and they want us to sell more, because if we [the franchisees] do not sell,
they do not sell as a consequence either. I am doing my job and encouraging all my team to do
the same” (Informant #54).
The four franchise owners who had the internal locus of control had success in their stores with
the direct sales model implementation. The same was not true to the two franchise owners who
had external locus of control. One of them (Informant #48) had already been cut from the D1
franchise chain and was in the process of closing his store. The other one (Informant #46) had
been losing market share for several years and was in the process of evaluation of whether or
not it would be allowed to continue with D1. Another informant (#54) shared that he had been
approached to check his interest in establishing a store in Informant #46’s area, which he
interpreted as a sign that Informant #46 was to be cut soon. These offer support for the
following propositions15:
P3 “The Magic Angle Principle”: Even a low level of personal heuristics, biases, and locus
of control will influence the impact of an event over supply chain
and
P4 “The Lift Force Principle”: The impact of a mid-range event is proportional to its impact
on individuals in the supply chain links.
15 Appendix G presents with the main heuristics and biases observed for the events analyzed in this research.
219
P2: The Gyroscopic Effect Principle
Next, we cite evidence that supports P2: Gyroscopic Effect Principle, which states that a
combination of personal social influence and strength of buyer and supplier relationships will
significantly contribute to the extent of the impact of a mid-range event over a supply chain.
Because of the obstacles against the new sales model, individual roles became even more
important in the dissemination of its impacts over D1’s supply chain. The new director of
marketing and sales, who was Informant #4, had a substantial amount of personal social
influence herself, as exemplified in Section 4.3.2. Another good example of personal social
influence was observed in the role of Informant #54, who was one of the franchise owners
interviewed for this research. In terms of reciprocity, he urged both his employees and peers to
adopt the new sales model as quickly as possible, stressing that now it was the time for them,
the franchisees, to work hard and make it happen with their customers. Consistency was
triggered through the idea that each sale, each day, and each person were important. He
established tools to follow the performance of each of his salespeople and shared them with his
peers, the franchise owners in other areas of Brazil. This also showed commitment, since he
made public what his goals were and what he was doing to achieve them. Social proof was
perceived in both formal and informal ways. Formally, D1 invited some already successful
franchisees (i.e. Informants #88 and #54) to come to training sessions and group meetings to
tell their peers about the success they had experienced using the new sales model. Informally,
during these meetings and after them, Informant #54 talked to several of his peers encouraging
them to work hard, using his own example to show that it was worthwhile. This one on one
relationship and the empathy perceived in these conversations also triggered liking between
220
Informant #54 and his peers, highlighting his personal social influence. This offers support for
the following proposition:
Proposition 2 (“Gyroscopic Effect” Principle). A combination of personal social influence
and strength of buyer and supplier relationships will significantly contribute to the extent of
the impact of a mid-range event over a supply chain.
P6: The Ripples Effect Principle
The following paragraphs give support for P6: The Ripples Effect Principle, which states that
an event in a focal firm may impact other tiers in the same supply chain or in other supply
chains (perpendicular direction). Regarding to the extent of the impact of the direct sales model
in D1, its second tier buyers (the estheticians), were also significantly impacted. The
estheticians had to try to think and act differently about their professional roles. In the past,
they had been only concerned about how well they performed their services for their clients
(body and face treatment). Under the new sales model, they were now supposed to encourage
their clients to buy their daily dermocosmetics from them. The 3rd tier buyers (final customers)
were also impacted by the events in the sales model, since they were able to have access to
more appealing D1 products in more places.
The marketing and sales director in this case remained in her position for about 30 months.
During that time, she and her team were able to implement many changes and start lots of
221
others. Even after she left the firm, the changes she had initiated continued to impact D1 (the
focal firm itself) and other tiers, including its franchisees (1st tier buyers), direct suppliers (1st
tier suppliers), and even its competitors. In the focal firm, the new team used some of the former
director’s strategies to continue to improve the direct sales model. On the franchisees’ side,
they kept the employee structure for fulfilling direct sales needs. As a continuous impact for
the 1st tier suppliers, we observed that her new standards for supplier selection remained. An
impact even farther, over a competitor’s supply chain, was observed through the information
that one of D1’s major competitors had scheduled a meeting with its board of directors to
discuss improvements that it would need to implement on its own sales strategies due to
“market movements”. This was also evidence of the importance of the weak ties in the
dissemination of the impact of an event over a supply chain. Thus, we observed that the local
context “touched” or impacted by the event will keep changing even after the event itself had
moved to another link or even “sunk”, supporting P6: The Ripples Effect principle proposition,
as shown below and illustrated in Figure 69.
Proposition 6 (Ripples Effect Principle): An event in a focal firm may impact other links in
the same supply chain and in other supply chains (perpendicular direction).

222
Upstream
Downstream
Figure 69: The Ripples Effect illustration of D1’s new sales model
P5: The Kinetic Energy Principle
In the new sales model, we also observed indications that support P5: The Kinetic Energy
Principle, which states that the impact of a mid-range event may create its own power and
keep impacting other supply chain links beyond the source, even if the initiators try to stop it.
The director, who had initiated and implemented the change in the sales model, left the focal
firm about 30 months after she initiated this event. The fact that she was not in the firm anymore
did not prevent the change she had initiated from continuing to impact both the source (D1)
itself and its supply chain. We performed another round of interviews and visited D1 and its
franchisees two months after the director had left D1. We observed that impact of the direct

223
sales model was still being felt and implemented among the franchisees. In addition, some of
the franchisees’ employees put in continuing effort to keep it expanding. “I know that D1 is
reviewing if this [direct sales] model is really applicable to all the stores. But I will keep doing
the way they proposed before, that is the way it makes sense for me and my customers”
(Informant #27). This supports for the following proposition:
Proposition 5 (The Kinetic Energy Principle): The impact of a mid-range event may create
its own power and keep impacting other supply chain links beyond the source, even if the
initiators try to stop it.
As additional support for P5: The Kinetic Energy Principle, we will illustrate its concepts using
the physics formula for kinetic energy. The kinetic energy of an object mass (m) is given by:
KE= ½ m.v2, where m is mass and v is velocity. In our analogy detailed in Section 2.4, mass
equals the urgency of an event and velocity, which in stone skipping is combination of linear
and spin velocity, equals power, which is a combination of source firm power and individual
personal social influence.
For an event to have other impact in a supply chain beyond its source, its urgency (mass) needs
to be high. Although high urgency in this research is a qualitative construct, we will assign it a
value in order to place it in the KE formula. Thus, we will consider that a “high” urgency event
will have a value ranging from 7 to 10 in a 0 to 10 scale. The new sales model implementation
was perceived by an “8” in terms of urgency since it presented a good amount of deadline
control and awareness of time, in other words, the faster it was implemented, the higher the
possibilities for increasing in sales and profitability.

224
Source firm power needs to be medium to high for an event to have greater impact in a supply
chain. In this case, we will consider a value ranging from 5 to 10. D1 cannot be considered a
very powerful organization, because of its size and purchased volume. In this case, the source
firm power number for D1 will be 5.
Personal social influence needs to be high to help stabilization and further impacts of the event
in a supply chain. This was true in the case of D1, as explored earlier in this section. Thus, we
will assume that the personal social influence of D1’s individuals was a 9. Thus, substituting
the proposed numbers into the kinetic energy formula (KE= ½ m.v2), we have:
KE = ½ (8) x (5+9) 2 = 784
We are aware that this value does not exactly express anything in an absolute sense, however,
it is helpful in illustrating D1’s kinetic energy, relative to other firms. This supports the
applicability of P5 and reinforces the role of the personal social influence in the dissemination
of the impact of an event over a supply chain. Figure 70 illustrates the propagation of the new
sales model’s influence over D1’s supply chain, even after the new director was no longer with
D1.

225
Figure 70: Kinetic Energy principle illustration for D1’s new direct sales model
D1 1st tier buyers
1st tier
suppliers
2nd tier
buyers 3rd tier
buyers Competitor

226
4.2.1.4 Other Events in D1’s Supply Chain: No Impact Perceived
We described several events above, for which we could identify an impact in D1’s supply
chain. However, other events were also implemented at the same time by D1. We identified
several other events that did not have any impact in D1’s supply chain. One example was the
hiring of a new OM director. This person was personally selected and hired by the president of
the investment group that bought D1 (high source firm power). He was a very capable person
with almost two decades of experience as an OM manager and director at another beauty
products firm in Brazil and with very good relationships, both within and across firms (high
personal social influence). He, too, initiated several mid-range events. We interviewed the new
OM director twice and also made a tour of D1’s plant with him. He also provided several good
other contacts to be interviewed. However, we did not perceive any impact of his decisions and
implemented changes in D1’s supply chain. One possible explanation might be related to extent
of the changes that he implemented. As described previously, an event whose impact is
disseminated in a supply chain should not be totally immersed in the source firm, analogous to
a stone that is able skip on the water that should be just partially immersed (see Figure 71),
otherwise it will sink.

227
Figure 71: Illustration of the exclusivity of the event
Although the new OM director implemented several important changes, they were mostly
related to the focal firm itself. Examples include the reorganization of the manufacturing
process, layout of machines, review of production flow, and development of new inventory
strategies, among others. Although these are important events, they mostly impact the focal
firm and have little or no impact on the immediate tier’s buyers or suppliers. Thus, their impact
was not disseminated through the supply chain.

228
4.2.2 Events in B1’s and Adjacent Supply Chains
The following mid-range events were initiated after a commercial disagreement between one
of the focal firms (B1) and one of its outsourced manufacturing plants in Brazil, which we are
calling PRO. This commercial disagreement impacted not just the two firms directly involved,
but also some of their supply chain tiers and also directly involved another focal firm (B4). In
the next paragraphs, we explain the background that led to these events and their impacts.
PRO is a cosmetics outsourcing firm in Brazil, which had produced for different firms for more
than a decade. After three years of negotiations, intense and thorough quality and technological
evaluations, PRO became the first firm certified to produce for B1 in Brazil. According to
PRO’s CEO, this certification was a “great quality endorsement and special victory for PRO.”
A couple weeks after certification, B1 and PRO began their actual business relationship. PRO
needed to increase its purchase volumes from its core suppliers, especially those related to B1’s
products, which were almost all international suppliers. Also, PRO’s employees and board of
directors feel very proud of itself, since it was then B1’s core Brazilian outsourcing partner. It
increased its production, hired more employees and increased its shifts in order to take care of
B1’s demand. PRO also had to say “no” to other potential customers, due to the fact that it was
very busy with B1’s production.
Due to Brazilian legal constraints and the fact that B1 did not have an actual manufacturing
plant in Brazil, its contract with PRO was required to be a “full service” contract. In full service
contracts, the outsourcing firm is responsible for everything, including the purchasing of
chemical ingredients, raw materials, and packaging supplies, up to the payment of federal and

229
state taxes and fees. During the contract negotiation time, B1 could directly participate in the
process of choosing and selecting the suppliers, analyzing their quality, and performance.
However, once the full service contract had been implemented, B1 was not allowed to buy its
material separately, send it to the outsourcing firm (PRO) and pay for the outsourcing service
itself. The contract between B1 and PRO needed a well-managed cash flow from the
outsourced firm, in our case PRO. The process is shown below:
1. B1 selects its preferred suppliers;
2. B1 notifies PRO what materials and from which suppliers it wanted PRO to buy;
3. PRO purchases B1’s supplies (chemical products, raw materials, packaging, etc.) from
the selected suppliers and pays for them;
4. PRO manufactures B1’s products, which includes the legal pre-registration, the
processing itself, packaging, paying taxes and legal fees, and finally making the
products available to be shipped to B1 wholesalers and retailers.
5. B1 pays PRO for its services.
Everything went very well for the first year of production. B1 then decided to have its new
Brazilian brand sold in another countries as well. Because of this, B1 asked PRO to increase
its production to a much larger (global) scale. PRO explained to B1 that it did not have enough
cash flow to afford this new global scale, because it would have to buy everything in much
larger quantities. PRO asked B1 if it would be willing to pay upfront. In other words, PRO
asked B1 to pay for its materials in advance, allowing PRO to buy its materials and supplies.
At this point, it is important to note that many of these materials, especially the chemical
ingredients, were imported from Europe and the U.S., so some could take months to arrive at
PRO’s plant. Thus, PRO would need to buy most of its supplies up to six months in advance
and pay for them six months in advance of receiving payment from B1. The timeline below
shows the average time spent between placing the order with the international supplier and

230
actually receiving it at PRO. Figure 72 illustrates the timeline of the number of days for an
order from a chemical supplier in Europe to arrive at PRO in Brazil.
~ # of days
30 60 to 90 15 to 60 2-5 days
Figure 72: Timeline for imported chemical products
B1 agreed to make the payments in advance and PRO started B1’s production for the global
market. Everything was going well, until a few months after the update of the contract for
expanding production, in fall 2013. B1’s Brazilian office contacted PRO and said that it could
not afford these upfront payments anymore and that B1’s headquarters in France did not want
to make them anymore, due to the fact that it was not in B1’s commercial policies. At this
point, a commercial disagreement between PRO and B1 started.
Place order at
the international
(ie: European)
supplier
Shipping of the
material from the
international
supplier to PRO
Arrival of the
material at Port of
Santos, SP, Brazil.
Have the material
released from
customs and free to be locally
shipped to PRO.
Material arrival at PRO.
231
4.2.2.1 B1: Commercial Disagreement
In this section, we analyze the impacts of the commercial disagreement that occurred in the fall
of 2013 between B1 and PRO. In analyzing the impacts of this commercial disagreement, we
selected 33 informants from 17 firms. Table 37 shows the label codes for the researched firms
in each one of the links in B1’s supply chain, as well as the number of informants in each firm.
For this event we discussed the applicability of two propositions, P6: The Ripples Effect
Principle and P1: The Pity-Pat Effect, which are discussed in a sequence illustrates the
evidence.

232
Event: Commercial Disagreament between B1 and PRO
Source Impacts (Upstream - Suppliers) Impacts (Downstream - Buyers) Perpendicular TOTAL
1st Tier 2nd Tier 3rd Tier 1st Tier 2nd Tier 3rd Tier (Competitors)
B1 (1) PRO (6) BSF (1) FCP (1) Probably* Yes* Yes (1) B4 (3)
ACB (2) BRC (1) MAN (1)
ABH (3) DC (2) SBELL (1)
MAP (3) ENG (1)
SEPC
(3) EUR (1)
SLB (3)
Total Firms 5 6 3 1 1 16 + B1
Total Informants 17 9 3 - - 1 3 33
* We did not interview anybody from B1’s first or second tier buyers, so all the data refers to secondary information gathered from other
informants and document analysis.
Table 37: Informants and firms impacted by the commercial disagreement

233
After the notification that B1 was unwilling to continue with the upfront payments, PRO
checked its contracts and realized it did not have enough safeguard mechanisms written in. B1
and PRO were not able to make an agreement to either get the businesses back or soften the
losses. Thus, PRO decided to stop producing for B1 and filed a legal complaint in the court.
After a couple months, PRO found itself with a loss of more than US$ 1.5 Million, which was
a very large sum considering that PRO was a mid-sized firm.
B1’s inventory was still at PRO´s plant during our research visit to its plant more than a year
after the commercial disagreement started. The problem was that, due to legal constraints, this
entire inventory, which was comprised chemical and packaging material, could not be sold or
used for anything else. The initial US$ 1.5 Million of purchases PRO made from European
chemical firms was then worth a lot more due to dollar fluctuation against local currency,
Brazilian interests and inflation. Informant #14, who was PRO’s CEO referred to it as “A great
white elephant”.
P6: The Ripples Effect Principle
The following paragraphs give support for P6: The Ripples Effect Principle, which states that
an event in a focal firm may impact other tiers in the same supply chain or in other supply
chains (perpendicular direction). Regarding the extent of the impact of the commercial
disagreement, PRO, which had always been a very well rated and well-established firm, started
experiencing serious financial problems. In less than two months after the disagreement with
B1, it had about 80 unpaid bills sent to court. After about six months following this problem,
PRO had gone from 180 employees to about 30. In addition, most former PRO suppliers did
not want to keep selling to it any more, which made PRO’s situation even more difficult. PRO

234
did not have either material to produce to its other clients or a way to receive revenue from
them, since it did not have their production ready. Figure 73 illustrates the impacts of the
commercial disagreement, both downstream, upstream, and in a perpendicular direction
(competitors) and provides evidence for the following proposition:
Figure 73: The ripples effect for B1 and PRO’s commercial disagreement
P6: The Ripples Effect Principle. An event in a focal firm may impact other tiers in the same
supply chain or in other supply chains (perpendicular direction).
P1: The Pity-Pat Effect Principle
We also observed support for P1: The Pity-Pat effect principle, which states that the closer
tiers in a supply chain will experience a stronger impact of a mid-range event, which decreases
for the farther tiers. The commercial disagreement occurred between B1 and one of its first
tier suppliers, however it impacted several other tiers in C1’s supply chain. It impacted B1’s
Commercial
disagreement
Impacts

235
second tier suppliers, which were PRO’s first tier suppliers. Those impacts reflexively
impacted B4, because PRO was not able to produce for B4 due to its lack of material. They
also impacted B1’s buyers, as well. We did not directly interview B1 wholesalers or retailers
for this research. However, we did interview some final customers who mentioned that they
observed a clued label over some of the products they bought from B1 in United States, which
was related to the manufacturer.
In Table 38 we show some of the firms that were impacted by the commercial disagreement
between B1 and PRO. Together with Figure 74, they illustrate the Pity-Pat Effect for B1´s
commercial disagreement with PRO, illustrating the support for the following proposition:
P1: The Pity-Pat effect principle. The closer tiers in a supply chain will experience a
stronger impact of a mid-range event, which decreases for the farther tiers
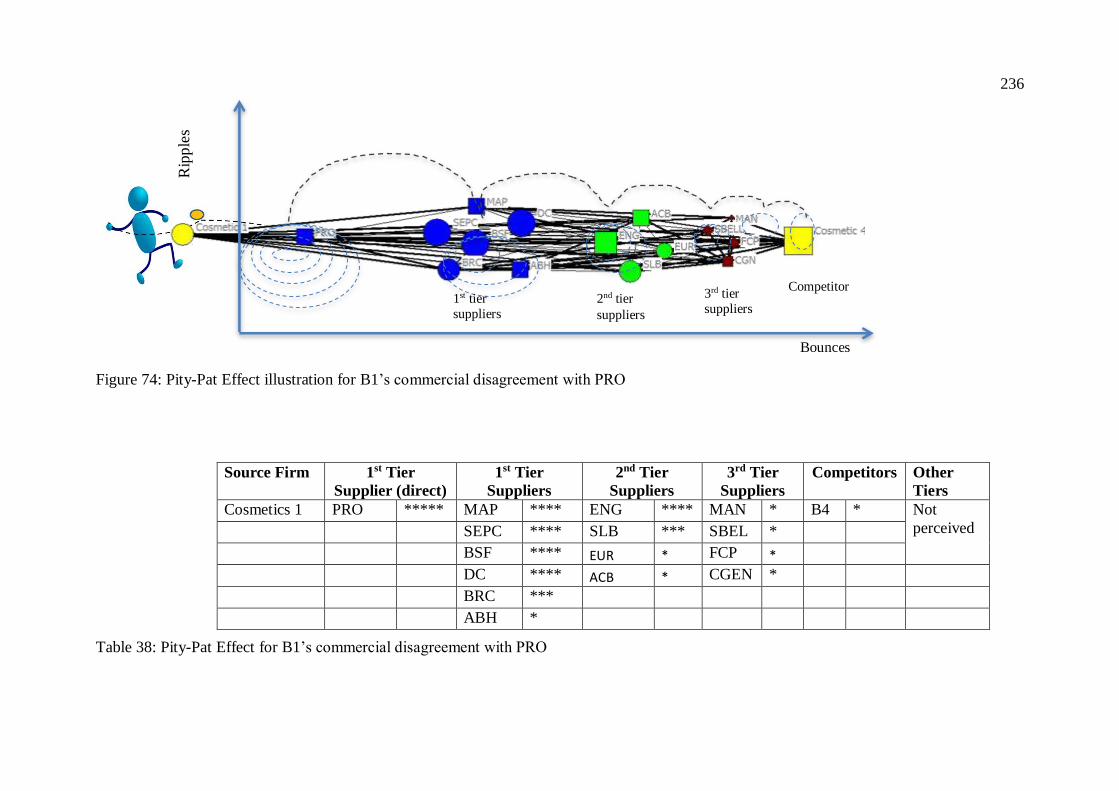
236
Rip
ple
s
Figure 74: Pity-Pat Effect illustration for B1’s commercial disagreement with PRO
Source Firm 1st Tier
Supplier (direct)
1st Tier
Suppliers
2nd Tier
Suppliers
3rd Tier
Suppliers
Competitors Other
Tiers
Cosmetics 1 PRO ***** MAP **** ENG **** MAN * B4 * Not
perceived
SEPC **** SLB *** SBEL *
BSF **** EUR * FCP *
DC **** ACB * CGEN *
BRC ***
ABH *
Table 38: Pity-Pat Effect for B1’s commercial disagreement with PRO
1st tier
suppliers
2nd tier
suppliers
3rd tier
suppliers
Competitor
Bounces

237
4.2.2.2 B4: New Projects Allocation to PRO
In this section, we analyze a second event that occurred as an impact of the commercial
disagreement between B1 and PRO. It refers to B4’s allocation of new projects to PRO. For
this event, we discuss the applicability of one proposition, P2: The Gyroscopic Effect.
We could clearly observe the impacts of the commercial disagreement between B1 and PRO
on B4 and its supply chain. Although the commercial disagreement occurred between B1 and
PRO, its impact reflexively impacted B4, as well (weak ties). It happened because PRO, which
was an outsourcing manufacturing plant for B4, was not able to produce for it due to lack of
material and other resources. The lack of material was happening because PRO was not able
to pay its financial debts with either its suppliers or with the financial institutions with which
it had relationships.
The contract between PRO and B4 was a little bit different from the one PRO had with B1.
With B1, it was required to have a full-service contract as explained in Section 4.2.2.1.
However, B4 could work with PRO using a basic contract for outsourcing manufacturing, since
B4 also had a manufacturing plant, itself. Thus, B4 could negotiate and purchase all the raw
materials and packaging from its direct suppliers, deliver those materials to PRO and then just
pay for the manufacturing service itself. Although B4 could use this kind of contract, it also
used a kind of “full-service” contract with some of its outsourcing manufacturers. Thus, B4
negotiated all the commercial and technical conditions directly with its suppliers, then
forwarded them to its outsourcing manufacturing plant. There were several reasons B4 decided
to pursue a basic contract, including that it could, at the same time, use its purchasing power to
negotiate with its suppliers. However, while allowing the outsourcing manufacturer to do all

238
the operational management, it could save time and resources by managing fewer suppliers. At
the same time, this option is beneficial to the outsourcer too because it allows better profits.
The great challenge in this contract situation was that PRO had to pay for all the expenses
initially and wait until the end of the process, to be paid back by B4.
P2: The Gyroscopic Effect
The event we are analyzing here is the B4’s allocation of new projects to PRO. The following
paragraphs give support for P2: The Gyroscopic Effect Principle, which states that a
combination of personal social influence and strength of buyer and supplier relationships will
significantly contribute to the continuance of the impact of a mid-range event over a supply
chain.
B4 has a strict policy for evaluating the performance of its suppliers. It considers several
aspects, including quality, logistics, innovation, cost, service, and relationship. In addition to a
global grade, B4 evaluates what it calls the supplier’s financial health. That is a very important
criterion, especially for the outsourced manufacturing plants, since they are responsible for
purchasing all the materials and resources to produce the final product for B4 before receiving
payment. The reason for the policy is to make sure that the outsourcing manufacturer provider
has no financial restrictions, in order to avoid disruptions in B4’s supply chain. If a financial
restriction is an issue for the outsourcer, the rule was to not use its services until the problem
was fixed.

239
PRO was a B4 outsourcing provider and was facing a very significant financial problem. Thus
the natural approach was for to B4 to cut its business with PRO until its financial problems had
been rectified. However, what happened was totally different from what was expected. B4
actually decided to allocate many more projects to PRO. One of B4’s buyers played a very
important role in this process. “I wanted to help PRO. It is a good supplier for us, with very
high quality and always willing to help when we needed them. Now it needs us, and I want to
help them, to keep them in the market” (Informant #60). However, PRO was in a very difficult
situation, without cash flow or credit from either the financial institutions or from its suppliers.
It was facing a great challenge to even keep its “doors opened”. The B4 buyer in this situation,
who was Informant #60 in this research, tried to directly help, but did not have the decision
power to pay in advance for PRO to help it with its cash flow. On the other hand, this same
buyer argued with his management team and was able to allocate more projects to PRO, even
with all the financial restrictions it was facing. In addition, the B4 buyer personally contacted
each of PRO’s major suppliers, which were all B4’s suppliers as well, and asked them to sell
to PRO. Thus, this buyer personally explained part of the situation to these suppliers, reassuring
them that PRO was a very good firm and that it (B4) was allocating more projects to it [PRO],
thus it would be able to pay its suppliers on time. This buyer personally contacted a chain of
PRO’s suppliers, showing them a kind of “moral sponsorship”. He had very significant source
firm power, since he was representing B4, a very large and important player in Brazil´s
cosmetics industry. In addition, although he had very little hierarchical power within B4, he
was able to bring the history of the relationship between B4 and PRO to his management team,
convincing them to not follow the policy and to actually allocate more projects to PRO, helping
it to fight through its financial challenges. He used his source firm power and personal social
influence to help PRO to obtain financial credit from its suppliers, so that it could keep

240
producing. This story offers evidence for the following proposition and illustrates a good
“throw”.
Proposition 2 (Gyroscopic Effect Principle): A combination of personal social influence
and strength of buyer and supplier relationships will significantly contribute to the
continuance of the impact of a mid-range event over a supply chain.
4.2.3 Legislation Event
“Brazil is taking great strides to implode your cosmetics, toiletries and
perfumery industry. It is truly amazing the capacity of government and
Congress to create legal obstacles for the business sector.”
Luiz Ricardo Marinello
The following mid-range event was initiated by the Genetic Heritage Department of the
Brazilian Ministry of Environment (CGEN), which is attached to the Brazilian Institute of
Environment and Renewable Natural Resource (IBAMA). The impact of the discussed event
give support to three propositions, which are P5: The Kinetic Energy Principle, P3: The Magic
Angle Principle, and P4: The Lift Force Principle. This event impacted many supply chains in
different industries. In the next paragraphs we explain the background that led to this event and
its impacts. In this case, we will, sometimes, use the real names of some firms, when we are
using public data.
241
4.2.3.1 Legislation Event: PM 2186/2001
The event we discuss in this section is the The Brazilian Heritage Regulatory Framework 2186-
16/2001, also known as the “AntiBiopiracy Law”. PM 2186/2001was published by the
Brazilian federal government through its Ministry of the Environment in August 2001. The
seven-page document has caused problems and confusion since it was published. Its original
goal was to “regulate the access to the national genetic heritage, the protection and the access
to the associated traditional knowledge, the sharing of benefits and access to the technology
and to the technology transfer for their conservation and use” (Brasil, 2001). However, it has
worked against some of Brazil’s most important industries, including agriculture,
pharmaceutical, and cosmetics. The following paragraphs offer support for P5: The Kinetic
Energy Principle, which states that the impact of a mid-range event may create its own power
and keep impacting other supply chain links beyond the source, even if the initiators try to stop
it. This event impacted many supply chains in different industries.
P5: The Kinetic Energy Principle
In 2010, based on PM 2186/2001, CGEN, through IBAMA, fined almost a hundred firms in
Brazil, levying more than 59 million dollars in fines in a process called “Operation New
Directions”. The argument was that “Brazil’s unique species have been exploited for centuries
by businesses, which often make fortunes while overlooking local communities” (Erickson-
Davis, 2010). Several firms were fined for not paying fair compensation to the local
communities for the use of native material and the associated knowledge. One of the most

242
substantial fines was imposed on B4 ($12.6 million) for allegedly including unregistered
genetic materials in its products and for not properly sharing benefits with the local
communities. This meant that B4 was charged with “biopiracy”. B4 appealed all of the legal
actions, providing substantial evidence of what it had been doing since its foundation more
than three decades earlier. B4 had been a pioneer in Brazil in reaching agreements to share
benefits with traditional communities since the beginning of the firm, when almost nobody
talked about these obligations, however, this episode had already caused substantial harm to
B4’s reputation.
In 2012, “Operation New Directions II ” levied fines against another 35 firms, for about $44
million, with even higher fines this time (IBAMA, 2012). The list of all fined firms is available
in Appendix F, whose examples include Ambev, Avon, Bayer, Beraca, Boticario, Croda, Eli
Lilly, L’oreal, Pfizer, Mapric, Merck, Novartis, and Unilever, to name a few.
Although PM 2186/2001 was created with the noble goal of protecting the local communities,
it was actually disturbing not only the big players, but also worked against innocent victims
like the local collectors and harvesters in the Amazon rain forest, whom it was supposed to
protect (Barreto, 2012). Informant # 19 said, “I feel like we are the new colony of Brazil, the
government forgets about us, what they think is not our reality”. Another thing that was not
considered by the government were the desires and needs of the local communities. Informant
#83 shared several situations when he tried to negotiate with different communities in Brazil,
but it was not on the business terms he was used to. “The government is driving us crazy and
we are crazy to negotiate and give money to these individuals, but it is hard to arrive at some
place, in this case at the Caatinga, and the guy you scheduled a meeting with 30 days back was
243
taking a nap on a hammock at 2 PM”, said Informant #83. He also shared a story about one of
his Amazon suppliers:
“One of my suppliers was a local community in the middle of the jungle, literally, about
eight hours by boat from Manaus [the state capital of Amazonas]. They had a machine, which they received from EMBRAPA [another Brazilian governmental agency] that had
the capacity to produce 500 liters per month of citronella oil, which was just one of the oils
that we had negotiated for that community. However, they were just producing 20 liters per month. I tried hard, several times to convince the leaders of that community to produce
the 500 liters that they had installed capacity for, because I had clients for each one of the
other 475 liters they were wasting, and thus, losing money. This person avoided this
conversation and possible agreement for several months, and then finally, he told me: ‘Doctor, let me explain something to you. There is a special way we live here. That is why
we like to live in the forest. We wake up at 4:30 in the morning, and all of us go to work
in the middle of the forest [harvest cupuaçu, citronella, and other fruits]. At 11 AM we come back to the village because we need to prepare lunch, take care of the kids, of our
animals, and plants. We also like to take a nap and have some fun. We play soccer, another
day we have our dance, and then, 5:30 PM at most we go to sleep, because the forest is too
closed and it becomes dark very early. If we had to produce this amount [you] the doctor is asking, we will have to either give up enjoying some of these things I just told you, or
we will have to allow more individuals to come and live in the village with us, too. I would
like neither one of these options’” (Informant #83)
PM 2186 was already recognized as one of the most complicated and confusing pieces of
legislation in Brazil. Because of that, several national and multinational firms, which used to
buy products from the local communities in Amazon, Pantanal and other biodiverse areas in
Brazil had given up. “Even when we try very hard - and we do that - we cannot fulfill CGEN’s
requirements [through MP 2186], thus, instead of buying from local suppliers in Amazon rain
forest, we are buying from local suppliers in Africa” (Informant #83).
MP 2186/2001 also negatively impacted research and academic institutions. As Informant #19
said on a behalf of a research foundation, “It has been difficult to work. Everything is too much
over-controlled since PM 2186. Neither of us, researchers [in Amazon] have enough freedom
to access the fauna and flora to do our job for several reasons, including this stuff about
associated knowledge” (Informant #19).

244
Although PM 2186 started in 2001, and was never actually transformed in a law16, this
provisional measure was able to do to Brazil what no other firm in any other country had been
able to do: curb the rapid growth and development of its cosmetics industry. Figure 75
illustrates the impact of PM 2186/2001 in the researched supply chains. The star marks its
initiation by the government agency. The circles are the impacted links. The dashed circles
illustrate indirect impacts. The continuous circles are the directly impacted firms. The firms
circled with thicker lines indicate those that were charged and fined by PM 2186/2001.
Figure 75: Tiers impacted by PM 2186/2001
In the researched supply chains, we observed impacts in all of the analyzed tiers, from third
tier suppliers to final customers, in four of the six supply chains. Some firms were directly
impacted, such as the one which was fined during “Operation New Directions I or II”. We also
observed several other links and tiers being impacted, as a consequence, thus PM 2186/2001
16 It was finally approved as a law in May 20, 2015 by the Brazilian Government, as Law 13.120/2015. To learn
more check http://goo.gl/09CPhX.

245
created its own energy. Although it was initiated by the Brazilian government with the good
intention of protecting its “genetic heritage”, it has been affecting the cosmetics industries in a
negative way. PM 2186 became like a monster that nobody liked, but nobody could stop its
effects either. The impacts related to the PM 2186-16/2001 are still going on in Brazil, even 14
years it was initiated. PM 2186/2001 is one example of an event that created a lot of “energy”
and impacted numerous supply chains links. This provides evidence to support the following
proposition:
Proposition 5 (The Kinetic Energy Principle): The impact of a mid-range event may create
its own power and keep impacting other supply chain links beyond the source, even if the
initiators try to stop it.
As we did in section 4.2.1.3, we will use the kinetic energy formula (KE= ½ m.v2), to illustrate
the energy created by PM 2186. As urgency (mass), we will assume that PM 2186/2001 was
considered highly urgent by the Brazilian government agency when it was initiated. We base
our assumption on parts of the analyzed data, such as, “Brazil's unique species have been
exploited for centuries by businesses which often make fortunes while overlooking local
communities” (Erickson-Davis, 2010). Thus, we will assign urgency a value of 10 for PM
2186/2001. Organizational power is also a 10, since we are talking about a federal
governmental agency, with a substantial amount of power to initiate different events. We assign
personal social influence an 8, because although controversial, PM 2186 had lots of supporters
inside and outside the government, which can be seen by the fact that, despite all the problems
caused by it, it is still valid. Thus, substituting the proposed numbers in the kinetic energy
formula (KE= ½ m.v2), the importance of organizational power in continuing to disseminate
the impact of the event is evident. This also illustrates that it has greater kinetic power then the
event that we previously discussed.

246
KE = ½ (10) x (10+8) 2 = 1,620
Figure 76 illustrates the dissemination of the impact of PM 2186/2001 over different tiers in
different supply chains. Unlike the other illustrations presented in this research for the Pity-Pat
Effect and the Kinetic Energy Principle, the dissemination of the impact of PM 2186/2001 did
not follow a specific pattern over the supply chain tiers. For example, the Kinetic Energy
illustrated in section 4.2.1.3 shows the impact going from the focal firm to its first tier buyers,
then first tier suppliers, second tier buyers, third tier buyers, and so on. However, the PM 2186
did not follow a pattern of a basic structured network (supplier-focal firm-buyers). Because
this event was initiated by a government agency, it directly impacted B4 and then the focal
firms, first and second tiers combined, then focal firms’, first, second, and third tiers combined
and kept increasing its energy. It is also important to note that the network of the impacts
generated by the PM 2186/2001 is denser than the earlier ones. That is because it presents a
higher level of interlocking relationships (Kim, 2014). Figure 76 illustrates the dissemination
of PM 2186’s impact over different tiers in different supply chains, and its pattern for
dissemination of the impact over the supply chains.
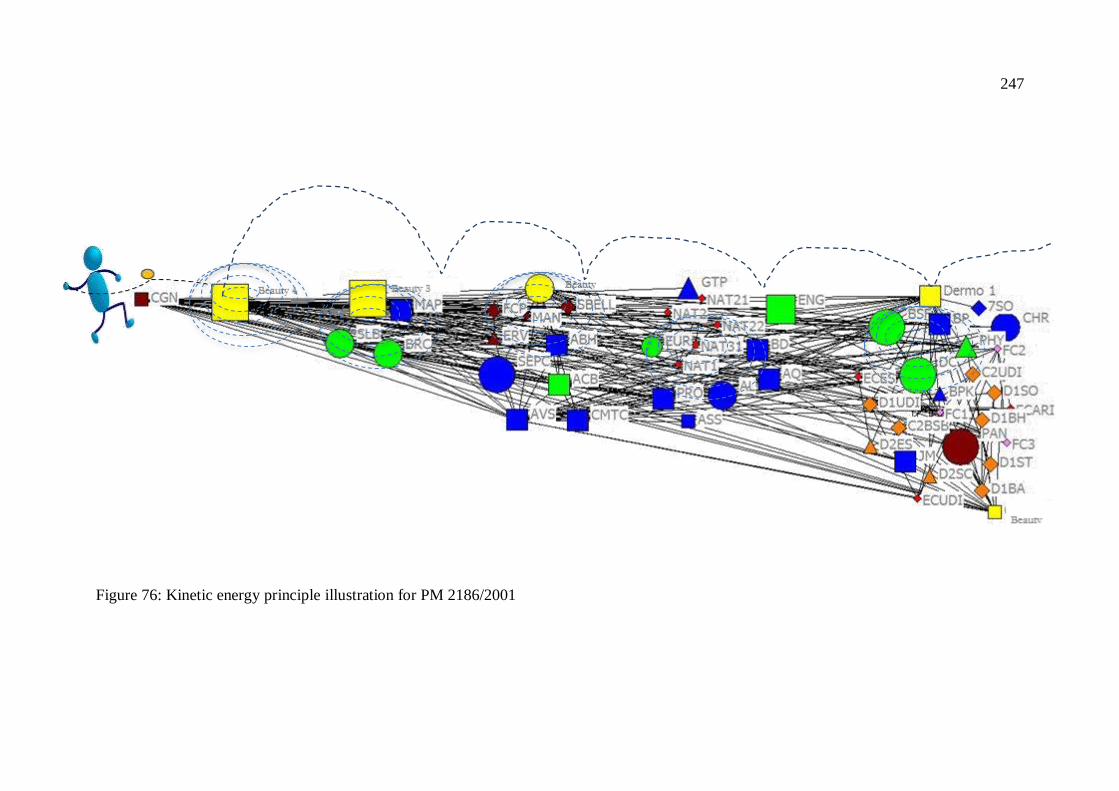
247
Figure 76: Kinetic energy principle illustration for PM 2186/2001

248
P3: The Magic Angle Principle and P4: The Lift Force Principle
The analysis of PM 2186/2001 also illustrates support for the individual influence in the event’s
impacts in a supply chain. The following paragraphs give support for P3: The Magic Angle
Principle, which states that even a low level of personal heuristics, biases, and locus of control
will influence the impact of an event over supply chain, and P4: The Lift Force Principle,
which states that the impact of a mid-range event is proportional to its impact on individuals
in the supply chain links.
One of the greatest problems with PM 2186/2001 was its lack of clarity. It was considered
vague on many points, and thus ended up “classifying everybody as illegitimate” (Ellsworth,
2010). B4 had always taken very good care of the local communities that supplied for it. It also
tried to follow all the steps required by PM 2186/2001, however, PM 2186, itself, had lots of
limitations and could not give confidence to the firms that they were acting in accordance with
its provisions (Informant #105).
Several articles, papers and books have been published over the last 14 years in order to try to
develop an understanding and follow PM 2186 (i.e. Ferreira and Sampaio, 2011). In addition
to what happened to B4, another one of our researched firms was also substantially impacted
by the lack of clarity of PM 2186/2001. MAP was an important supplier in the cosmetics
industry and was considered a role model for other firms for how to act correctly, in terms of
the biodiversity rules. In 2012, MAP through its CEO (Informant #83) receive an award from
the Environmental Ministry at a conference in Rio, which celebrated the 20 years of RIO 92,
considered a very important event in regard to sustainability in the world. A couple weeks after

249
that event, the same firm, MAP, was charged and fined through PM 2186, accused of
“biopiracy”. PM 2186 was considered inadequate by scientists and even some sectors of the
Brazilian government. Several lawyers and appeals have already proved its illegality. Even
though PM 2186 was just a provisional measure, not a bill, and it was ‘stopped’ in the senate
in 2007, IBAMA’s president at that time, Abelardo Bayma, decided to move forward with his
“Operation New Directions”, rejecting all the objections and saying that the PM 2186 was valid
and needed to be used (O Globo, 2012). His decision impacted many firms in several industries,
especially the cosmetics industry in Brazil. Another example of the inconsistencies with PM
2186’s interpretation can be seen in B4’s case. After being charged with 84 different infractions
during the “Operation New Directions I”, CGEN’s president, himself, stepped in, to rule in
favor of B4.
External locus of control was frequently perceived: “it is not my fault; I am just complying
with the law”. Also several heuristics and biases were noticed, which are shown in Appendix
G, with the main heuristics and biases observed for the events analyzed in this research. The
analysis of PM 2186/2001 also gives support for the following proposition:
Proposition 3: The Magic Angle Principle: Even a low level of personal heuristics, biases,
and locus of control will influence the impact of an event over supply chain
and
Proposition 4: The Lift Force Principle: The impact of a mid-range event is proportional to
its impact on individuals in the supply chain links.
Table 39 offer a summary of the applicability of the propositions stated in Section 2.4 and
investigated in this Section 4.2.
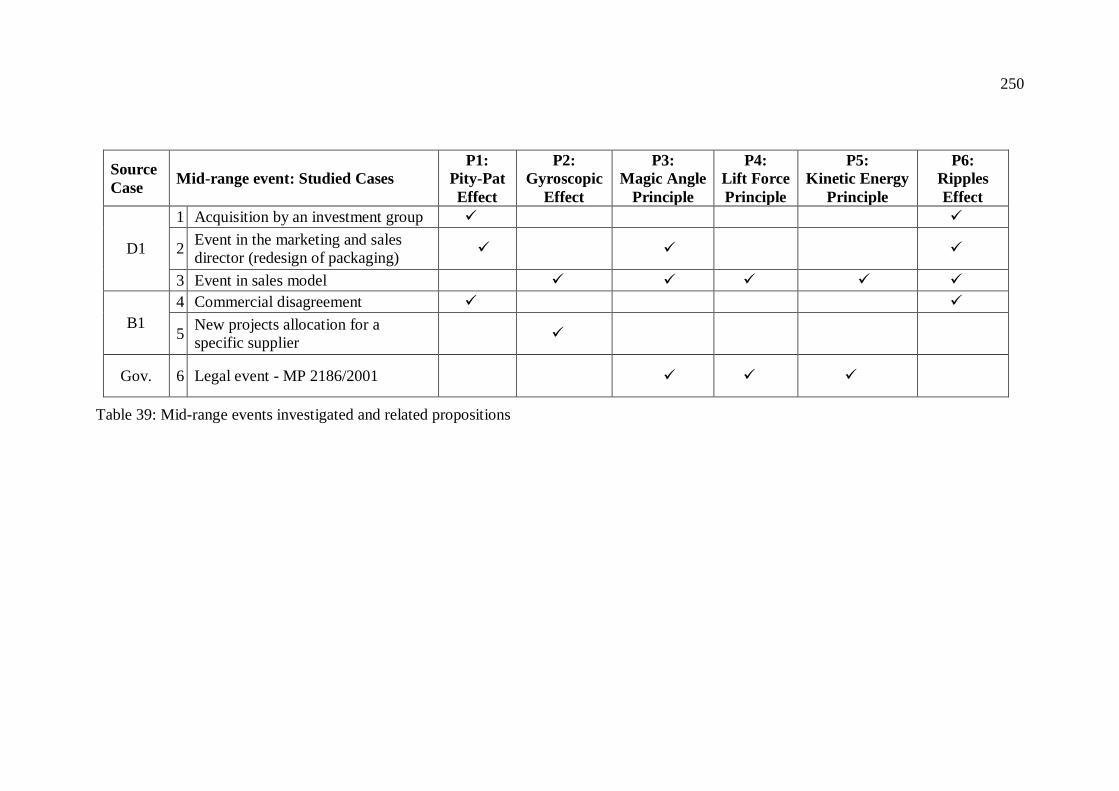
250
Source
Case Mid-range event: Studied Cases
P1:
Pity-Pat
Effect
P2:
Gyroscopic
Effect
P3:
Magic Angle
Principle
P4:
Lift Force
Principle
P5:
Kinetic Energy
Principle
P6:
Ripples
Effect
D1
1 Acquisition by an investment group
2 Event in the marketing and sales
director (redesign of packaging)
3 Event in sales model
B1
4 Commercial disagreement
5 New projects allocation for a
specific supplier
Gov. 6 Legal event - MP 2186/2001
Table 39: Mid-range events investigated and related propositions

251
5. CONCLUSIONS
In this research, we aimed to understand complex multi-tier, multi-dimension supply chains,
investigating why and how an event in a focal firm affects other members of its own and other
supply chains. In order to fulfill this goal, we established three secondary goals, which were to
identify the main elements that influence the dissemination of the impact of a mid-range event
over a supply chain; identify the main types of mid-range events and analyze their impact in
the focal firms; and then investigate and analyze the dissemination of the impact of a mid-range
event over multi-tier, multi-dimension supply chains in macro, micro, and integrated contexts.
5.1 Goal Fulfillment
In Section 2.4, we worked to fulfill the first goal, which was to identify the main elements that
influence the dissemination of the impact of a mid-range event over a supply chain. In order to
accomplish this, we conducted a theoretical study. We used metaphorical transfer to propose a
novel theoretical view, built upon the physics of stone skipping. At the end of this section, six
propositions were posed. They considered several elements interacting among each other,
including the source firm, the context of the supply chain where that event was initiated, and
the individuals involved in both contexts, within the source firm and across firms through buyer
and supplier relationships in the supply chain. The main aspects and elements were illustrated
in Table 4 and Figure 27, and the summary of the propositions is contained in Table 11 in
Section 2.4.

252
In Section 4.1, we fulfilled the second secondary goal, which was to identify the main types of
mid-range events and analyze their impact in focal firms. The main characteristics of a mid-
range event whose impact tend to be propagated over a supply chain are the types of event
which present the characteristics illustrated in in Table 4 in Section 2.4. We accomplished this
goal this by conducting an empirical study. We performed a multiple case study in six complex
multi-tier, multi-dimension supply chains. For each of the supply chains, we investigated five
to seven tiers, conducting interviews and observations in both the upstream and downstream
direction of the supply chain and interviewing individuals with different job titles in each tier.
In total, we conducted 131 in-depth interviews in 52 different firms. We identified six different
types of mid-range events that had an impact beyond their source firm.
In section 4.2, we fulfilled the third secondary goal, which was to investigate and analyze the
dissemination of the impact of a mid-range event over multi-tier, multi-dimension supply chains
in macro, micro, and integrated contexts. We conducted an empirical study, using the mid-
range events identified in Section 4.1 and applying the propositions posed in Section 2.4.
5.2 Research Question
Thus, through the fulfillment of all our primary and secondary goals, we answered our research
question, which was why and how does the impact of an event in a focal firm affect other
members of its own and other supply chains? This research showed that for the impact of an
event to be disseminated over a supply chain, it needs to fulfill certain criteria, such as: it cannot
be exclusive to the focal firm, and it needs to be supported by a substantial amount of source
firm power and personal social influence, as well. It is also important to consider that individual

253
personal heuristics and biases, as well as different locus of control, are important all contexts,
including internal (focal firm), and external (supply chin links), and that these human
irrationalities will impact the perception of the event and influence the continuity of its impact.
5.3 Key Findings
As expected, we found that the dissemination of the impact of a mid-range event over a multi-
tier, multi-dimension supply chain was a complex phenomenon. In analyzing each of the
identified mid-range events, we could typically apply more than one proposition, as discussed
in detail in Section 4.2. In addition, we also noted some interactions between elements, whose
impact deserves additional discussion. The main insights from this research are discussed in
the following paragraphs.
5.3.1 The role of power
We found that the role of power was very important in the dissemination of the impact of an
event over a multi-tier, multi-dimension supply chain. A helpful way to illustrate the role of
power is through its representation in the kinetic energy formula, which is the combination of
half of the importance of the change itself (mass) plus the quadratic of power (velocity). In the
same way that velocity is a combination of two different velocities (linear and rotational),
power involves both the power of the source firm and the personal social influence of the
254
individuals involved in the dissemination of the impact of the event over a supply chain.
Substituting values for each of these elements, we found that the greatest role in the
dissemination of the impact of an event was played by the power of the source. At first, personal
social influence plays the most important role, thus, influencing the dissemination of its impact
over several links in D1’s supply chain (for the example of both the change of D1’s sales model
and the PM 2186/2001 legislation change) and travelling (through D1’s weak ties) to other
supply chains. Later, for the legislation event, PM 2186/2001 took on power of its own,
illustrating the kinetic energy principle, as its impact continued to disseminate over B4’s supply
chain (and other supply chains), even after the government agency tried to stop it. Similarly,
the change of sales model continued to have an impact on D1’s supply chain, even after the
new director of sales and marketing had left D1.
5.3.2 Strong ties and personal relationships matter
Although buyer and supplier relationships are between firms, firms do not interact; individuals
interact, make decisions and implement changes. Strong ties with members of its supply chain
help build a firm’s competitive advantage (Krackhardt, 1992; Nelson, 1989). One example of
the strength of strong ties and the importance of personal relationships between supply chain
members was found when we analyzed a similar process that was implemented by the two
extra large beauty products firms.
In 2010, both B3 and B4 conducted a process of supplier base evaluation and improvement. At
B3, this process was initiated by one of its purchasing managers, who proposed evaluating B3’s
current main suppliers for chemical ingredients, packaging and services in order to evaluate

255
their performance and promote competitiveness among them. B4 employed a similar process
few months after B3 had initiated its process.
The main difference between them was that B3 conducted its supplier evaluation process in
what Informant #33 called an individual, open, transparent, and fair way. “We talked to them
one by one, openly, ‘eye to eye’, neither a letter nor e-mail was sent to our suppliers to talk
about this project. We talked in person to each one, explaining what we were doing, why, and
how we would be doing it” (Informant #33). B3 stated that its intention was not necessarily to
promote or increase the competitiveness among its suppliers or make them ‘fight against each
other’. Some of its suppliers were very concerned in the beginning, fearing that they could lose
B3’s business. However, as time went by, B3’s supplier evaluation process proved to not only
be very efficient, but also very worthwhile, too. “Our process was very caring and respectful.
Our intention was to grow and help our suppliers to grow with us” (Informant #33). At the end
of some months, some of B3’s suppliers had taken the challenge, becoming aware of what they
were doing that could be improved, and taking actions to correct their mistakes. As a result,
they ended up doing even more business with B3.
Some months after B3 had initiated its supplier evaluation process, Informant #33 became
aware (through weak ties – suppliers in common) that its two major competitors [the biggest
was B4] had started a similar process to evaluate their suppliers and promote competitiveness
among them. According to B3, “our greatest difference was the way we promoted it, our
personal attention to our suppliers”. This is credited to the fact that B3 is still a family owned
company, and the other two major competitors are open capital firms. “We did it one by one,
with care and attention, we did not let gossip spread on the market. When we noticed that some
things like these were happening, we called the suppliers and talked to them. We clarified their

256
questions and made clear to them what our intentions were. Our competitor, on the other hand,
made the changes in their standard way, from top to bottom. They said things like, “that’s how
it is going to be starting now, you either adapt yourself to it, or you will lose your business with
us” (Informant #33).
B3’s personal relationships helped improve its competitive advantage. Four years after it
initiated the new process described above, B3 became the market leader. “Of course there were
many other variables involved, including our great franchise basis, but the fact that all our
business is supply chain oriented, and we have such good and real partnerships with our
suppliers, I am pretty sure that it made a great difference in our success” (Informant #33).
Table 40 illustrates the basic similarities and differences between B3’s and B4’s process for
supplier evaluation and the final outcome.
Process: Supply Base Evaluation B3 B4
Year of initiation: 2010
Who was the #1 in beauty products in
Brazil?
Type of process conducted Individual and
personal Automatic
Four years later, who was the #1 in beauty
products in Brazil?
Table 40: Similarities and differences between the supply base evaluation of B3 and B4
We found that strong ties between buyers and suppliers will influence the focal firm’s
competitive advantage, reinforcing P1: The Pity-Pat Effect Principle that supply chain
members with closer relationships with the source where the event was initiated will observe a
stronger impact as illustrated in Figure 77.
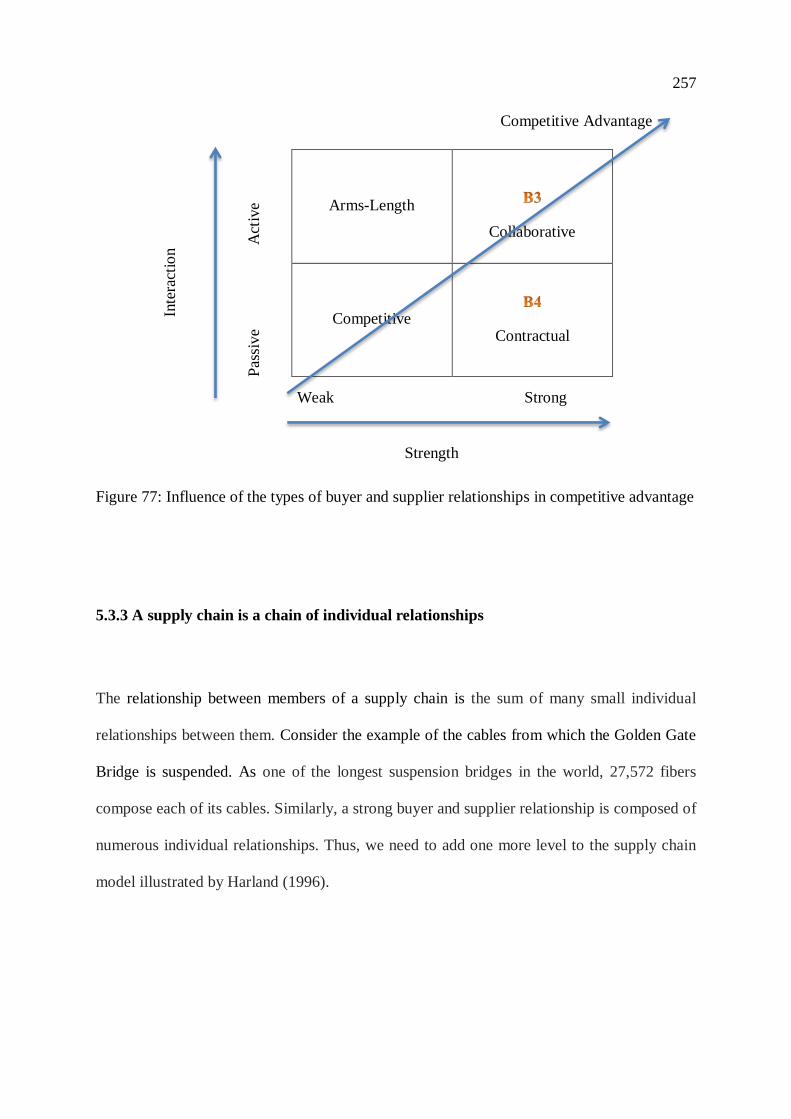
257
Inte
ract
ion A
ctiv
e
Pas
siv
e
Figure 77: Influence of the types of buyer and supplier relationships in competitive advantage
5.3.3 A supply chain is a chain of individual relationships
The relationship between members of a supply chain is the sum of many small individual
relationships between them. Consider the example of the cables from which the Golden Gate
Bridge is suspended. As one of the longest suspension bridges in the world, 27,572 fibers
compose each of its cables. Similarly, a strong buyer and supplier relationship is composed of
numerous individual relationships. Thus, we need to add one more level to the supply chain
model illustrated by Harland (1996).
Arms-Length
Collaborative
Competitive Contractual
Strong Weak
Strength
Competitive Advantage

258
Figure 78: A supply chain as a network of individual relationships
Because individuals make supply chain decisions and implement them, initiating supply chain
events, individuals’ personal heuristics, biases, and locus of control are important in
understanding the dissemination of the impact of an event over a supply chain.
5.3.3.1 Internal locus of control play an important role in supply chain performance

259
Many different elements are important to the success of a supply chain. Considering that a
supply chain is a chain of individual relationships, an individual’s capacity and ability to take
responsibility for her or himself (locus of control) and act in order to “make things happen”, is
an important personal characteristic to be considered in an employee or an entrepreneur.
Individuals with internal locus of control tend to take the responsibility to themselves and make
things happen, regardless of the difficulty of the situation. This is a very important individual
characteristic that should be considered in several situations, including the selection of supply
chain members.
Consider, for example, the selection of franchise owners. We investigated four focal firms that
used the franchise model (D1, D2, B2, and B3). For each of them, the challenge of finding the
“right” franchisee was mentioned. In D1’s supply chain, we had opportunity to talk to five
different franchise owners and were able to assess their individual locus of control, during our
interviews with them, analyzing the content of their words and expressions and using the locus
of control scale as reference (Rotter, 1966). We found that, especially in a situation where there
was an event that caused instability, the individual’s capacity to act and take responsibility was
essential in the success of the franchise. The two franchise owners who had external locus of
control were less successful with their stores, while the three with internal locus of control had
much more success with the challenges that they had faced. This indicates that individuals’
bounded rationality will influence the dissemination of the impact of an event over a supply
chain, giving support for P3: The Magic Angle Principle (even a low level of individual
heuristics, biases, and locus of control will influence the impact of an event over a supply chain
links), and P4: Lift Force Principle (the reaction to a mid-range event is proportional to the
reactions of individuals in the supply chain links).

260
5.3.4 Impact of an event travels through weak ties
The way a firm is connected to its indirect supply chain members is through weak ties. Weak
ties are built through supply chain members’ relationships with their own supply chains, and
these relationships help in the dissemination of the impact of an event in a supply chain and
across supply chains. For example, every spring there is a major international chemical fair in
Europe. Several of the R&D managers interviewed for this research prior to the 2014
international chemical fair, mentioned that they were waiting for their suppliers to bring “the
news”. Based on what their suppliers described during the fair, they would make their own
decisions related to which components they would be using in the next new products that they
developed.
It was also very common that a R&D manager, together with her or his top team management
selected a chemical component to be part of its formula based on prospective weak ties. In
other words, they would select a specific chemical component if their supplier made a
commitment to bring someone from their suppliers to interact with, for example, give speech
about the importance and usefulness of that specific component in one of the focal firm’s
national sales meetings. Similarly, since the relationship in a supply chain is a relationship
among individuals, the impact of an event is disseminated through the bridges built by weak
ties. Thus, a specific chemical component becomes available for the later tiers in the
downstream supply chain of a dermocosmetics focal firm, if weak ties were built through the
focal firm’s R&D staff and the supplier’s suppliers.
261
5.3.4.1 Weak ties are crucial for innovation in smaller firms
Because information travels through weak ties in a supply chain, the weak ties built between a
smaller firm and its suppliers are crucial in giving it access to information about product and
process innovation that it might not normally have access to. Smaller firms may not have access
to knowledge and innovation about products and process on their own, due to their lack of
resources. Because of this, the existence of bridges built by access to their suppliers’ suppliers
is crucial to its development and competitiveness. Through their suppliers’ suppliers, a smaller
firm can build a bridge to channels of innovation that allow it access to resources and
information that they would not otherwise have. This was reiterated by several different
informants within D1, D2, and B2, the smaller firms we researched. Specifically, the R&D
managers described the importance of relationships with their suppliers, especially the core
chemical suppliers, in order for them to have access to what was happening in most innovative
markets, such as Europe or the U.S. This also supports the premise that a strong relationship
between buyers and suppliers (strong ties) will significantly influence the dissemination of the
impact of a mid-range event in a supply chain (through weak ties), offering additional support
for P2: The Gyroscopic Effect.
5.4 Unexpected Findings
5.4.1 Loss aversion is not very significant in supply chains

262
Loss aversion and its associated biases is one of the most significant impact heuristics in B2C
situations. However, this was not true in our research, which focused on B2B relationships in
supply chains. We were expecting to see an important role of the biases associated with loss
aversion, such as the endowment effect and hyperbolic discount, which we did not find. There
is a very significant body of research on loss aversion and the impact of its associated biases in
the consumer behavior literature (Ariely, 2008; Sell, Jr, and Marcon, 2007; Thaler and
Sunstein, 2009; Thaler, 1985), thus, since we are talking about purchasing managers and buyers
as individuals, we had expected that a similar phenomenon would emerge in a supply chain
situation, which it did not.
One explanation for this is the fact that, since professional buyers are buying products and
services for someone else, in this case the firm they work to, their loss aversion is not “turned
on”. Thus professional buyers, in most of the situations, may not fear in losing a contract or a
supplier, for example. They might be much more concerned about how the impact of an event
might impact his or her individual situation in the firm, than with the firm itself. They may tend
to believe that there will be a similar opportunity it they do not take the first one, thus loss
aversion was not significantly manifested in supply chain situations.
5.4.2 Anchoring and adjustment heuristic was even manifested in high level strategic
decision making

263
We expected that the more educated the individual, the more rationally (less influenced by
heuristics and biases) he or she would act. We did not find that this was true in situations that
involved very highly educated individuals making decisions that involved a significant amount
of money. One example is the case of when D1 bought by the investment group. We discussed
the impact of this event in D1 and its supply chain and beyond, however, even though we did
not discuss the impact for the investment group itself, it was very interesting to see its impact
there. D1 was the case for which we had the greatest amount of primary and secondary data,
which gave us a kind of longitudinal view of this case.
In the interview with the investment group’s president, he made very clear to us the reasons
behind his intention to become part of the dermocosmetics business and what drove his
decision to buy an existing firm (D1) instead of starting a new firm and brand from scratch. He
invested in very good marketing research, but from what we had the opportunity to see, it
appears that he relied too heavily, or “anchored”, on one piece of the information he had
obtained, when making his decision. He believed that estheticians, the market he was targeting,
would prefer to keep the same brands they had been using instead of buying a new brand, thus
he judged them by the brand loyalty that he expected in this sub-sector. In actuality, the
estheticians did not show any particular loss aversion or concern about changing brands, rather,
they tended to value “what is new”. The investment group invested a very substantial amount
of money in D1 and its sales channel over more than three years, based on anchoring it on
brand loyalty. At the end of the data collection for this research, we had the opportunity to
interview the investment group’s president again, and he was starting to show signs of
questioning the success of his decision.

264
5.4.3 High mobility of individuals in the Brazilian cosmetics industry
In the Brazilian cosmetics industry, it is very common that one individual will work for
different firms within the same industry at different times in their careers. For example,
informant #80 worked for DC, a third tier supplier of the researched supply chains, then moved
to another chemical firm, and when we interviewed her, she was with SEPC, a second tier firm
in the chemical suppliers. Informant #51 had been a purchasing manager in B4 for several
years. Later in his career, he moved to work for SEPC, which was one of B4’s suppliers that
he had dealt with while he was there with B4. Informant #103 had worked for B3, left to work
for another major cosmetics products firm, and then, recently went back to B3 in a strategic
position within the firm. Informant #4 worked for B4 and then assumed a strategic position in
D1. In all these examples, the same individual played different roles at different times of their
careers. However, their previous network contacts helped them in their next move in their
careers, exemplifying the existence of the weak ties and their importance in building bridges
(Granoveter, 1973). This is important because individuals are sources of information when they
move between firms within and across supply chains. In doing so, they provide weak ties to
other organizations that can be important for product and process innovation. Because mobility
is so high within supply chains in the Brazilian cosmetics industry, the effect of weak ties is
very strong.
Overall in our research, we found support for all six of the propositions that we proposed, in
different events in multi-tier, multi-dimension supply chains. It was interesting to see the close
connection between the micro context (individuals) and the impact of the events being
disseminated in the macro context (supply chain).

265
5.5 Academic Contributions
We developed a set of propositions and collected evidence that provides tentative support for
them, using qualitative multiple case study research. In doing so, we applied the model
proposed by Chen et al. (2013) for the development of theory using metaphorical transfer. This
study also proposed a model for the dissemination of the impact of an event over a supply
chain. Our initial theory constitutive metaphor provides a new approach for interpreting,
analyzing and predicting multi-tier, multi-dimension, supply chain phenomena, and as such,
may provide new and deeper theoretical and managerial insights for supply chain management
and other fields of study.
OM/SCM is a field that has been often criticized for the lack of its own theories. Because of
this, OM/SCM researchers have borrowed theory from other fields, including economics,
management, and psychology. Our study provides a different perspective by building a new
theoretical approach specific to the supply chain context based on the physics of stone skipping.
According to Hawking (1996), a theory is considered a good theory if it satisfies two basic
requirements, which are accuracy and predictability. “It must accurately describe a large class
of observations on the basis of a model that contains only a few arbitrary elements, and it must
make definite predictions about the results of future observations” (p. 10). Our theoretical
metaphorical transfer satisfied both of these. It indeed describes a large class of observations
on the basis of a model that contains only a few elements, as it can be observed through the
elements discussed in the analogy part of the metaphorical transfer, of this research (Section
2.4). Our theoretical model also makes definite predictions about the results of future
observations (models and propositions). This is especially true if we consider the application

266
of the propositions. For example, applying the stone skipping model, if there is a great amount
of personal social influence in a buyer and supplier relationship, the tendency to have a
continued effect and extent of dissemination of the impact of an event over the supply chain is
greatly increased. This is basically P2: The Gyroscopic Effect Principle (a combination of
personal social influence and strength of buyer and supplier relationships will significantly
contribute to the extent of the impact of a mid-range event over a supply chain).
This study is relevant to many different fields of study. As many of the mid-range events
studied in this research represent changes, such as a change in sales model or legislation, our
study makes a contribution to the change management field. It responds to Todnem By's (2005)
call for studies that identify the critical success factors in the management of a change and
construct a valid framework to help better understand the success rate of a change’s initiatives.
Our study is also relevant to process studies of events in firms, since we focused on
understanding how and why supply chain relationships emerge, develop, grow, and terminate
over time (Langley, Smallman, Tsoukas, and Vand-De-Ven, 2013).
Our findings challenge the organizational change literature, suggesting that it may not be
relevant in the context of a supply chain. Weick and Quinn (1999) state that “change never
starts because it never stops” (p.381). In our work, however, we propose that the impact of
every event will stop at some point in time. Of course, an event can be (and many times it
actually is) followed by other different events. Even when an event ceases, its impacts can still
remain (see the Ripples Effect Principle).

267
We also introduced the concept of a mid-range event in a supply chain, which is an event of
moderate probability and moderate impact. It is in contrast with common events studied in
supply chain management (high probability, low impact) and those that have recently gained
increased attention in the field, which are the low probability and high impact events (Hora and
Klassen, 2013). It is important to study mid-range events because they are the ones that
frequently occur in supply chains and have a significant impact. Thus, developing a framework
to understand them is valuable for researchers.
5.6 Practical Contributions
Dealing with all the events that a supply chain is subject to on a daily basis is not an easy task.
The events are as diverse in terms of kind, size, and frequency of occurrence as they are in
terms of probability of occurrence. Although there is no “one size fits all” model, having a
model to serve as a reference help managers focus on the most important factors.
In our model, we are aware that many times, due to several factors within and outside a firm, a
proposed event may be already impacting a supply chain on a daily basis. These impacts can
be strategic, tactic, or operational, depending on the kind of event and from what source it was
initiated, and the context in which its impact is occurring at the moment. The power of the
source of an event will greatly impact its velocity and acceptance. On the other hand, the
acceptance or denial of the need for a change and dissemination of its impact will also be
influenced by the perceptions of the individuals who are involved. Individuals are not fully
rational all the time, so rules of thumb, such as heuristics and biases, automatically come to

268
Context
Source
mind and influence their perception of what has been implemented. Personality traits, such as
locus of control, are also important. Thus, considering the most common biases, heuristics and
their possible outcomes, can be useful in understanding supply chain relationships in a micro
and macro context. A practical model is presented in
Figure 79, which includes all the basic elements identified for the dissemination of the impact
of an event over a supply chain in our research.
Figure 79: Practical model of dissemination of the impact of an event in a supply chain
5.7 Future Studies
A substantial amount of research has shown that the best stone skipping happens when the
stone is thrown at an angle of about ~20o, which is called “the magic angle”. It is called magic
• Obstacles/ Incentives (Context)
• People (angle and lift force)
• Power (spin and linear velocities)
• Event (stone)
- Size
- Level
- Importance
Organizational power
- Social influence
- Macro and Micro
environment
- Heuristics and Biases
- Locus of control

269
because it has been proven through different methods (Boucquet, 2003; Clanet, Hersen, and
Boucquet, 2004; Clanet, Hersen, and Boucquet, 2004; Nagahiro and Hayakawa, 2005).
However, none of this research has yet described the “whys” behind the “magic” number. In
our theoretical development for a supply chain context, we can draw similar conclusions. It is
undeniable that there are individual influences and human irrationalities such as heuristics and
biases related to the dissemination of the impact of an event over a supply chain. However,
questions regarding to “how much” this matters still remains essentially unknown. What is
important, however, is that even a little portion of individuals’ characteristics can greatly
impact an event’s impact over a supply chain’s links. Future studies should isolate and
experimentally test some heuristics, biases and personality traits, such as locus of control.
According to Krackhardt (1992), one such important outcome of strong ties is trust. In this
research, we associate the power of strong ties with the power that comes from strong buyer
and supplier relationships, both within and across firms, however, we do not directly consider
trust as one of our elements in the dissemination of the impact of an event over a supply chain.
Trust has been extensively studied recently in OM/SCM (Ireland and Webb, 2007, Mesquita,
2007; Wang, Craighead, and Li, 2014; Zhang, Viswanathan, and Henke, 2011), but not in this
context. Thus, trust should be further studied as a possible outcome or prediction of the
dissemination of the impact of an event over a supply chain.
Future studies should also consider buyer behavior in isolation. Experiments or qualitative
studies could try to isolate the most important heuristics and biases that apply to buyers in
different types of buyer and supplier relationships. According to Narayandas and Rangan

270
(2004), the most underestimated behavior in all buyer and supplier relationships is buyer
behavior.
This research can be extended to related fields. In accounting, for example, a fact is similar to
what we are calling a mid-range event. Depending upon how the new fact (or event) was
accounted for, it can have different several impacts. Like skipping stones, an event can just
impact another tier when it is implemented and become an event itself, otherwise it is just a
intention.
Other metaphors from physics can also be explored, for example space and time constructs.
Time is defined as the number of events with respect to before and after, and the place of an
object as the innermost motionless boundary of that which surrounds it. It is important to note
that both space and time are not absolute; they are always relative to an observer. Any given
event and its impact will be perceived differently by different observers (buyers and suppliers)
in the firms’ macro and micro contexts in a supply chain. The understanding of the basic
concepts of the relativity of time and space in a four-dimensional context could be valuable to
supply chain management in both an academic and practical context.
In a recent presentation of part of this research at the POMS conference (May, 2015), one of
the attendees raised questions similar to these: “What if two or three stones are thrown at the
same time on a pond? What happen to their ripples and bounces? What if they chock against
themselves in the air before falling on the water? What if they collide basically at the same
point at the same time?” All these were very intriguing to think about in the context of

271
dissemination of the impact of an event in a multi-tier, multi-dimension supply chain and they
provide interesting topics to be explored in future research.
5.6 Limitations
Although we analyzed each of the events individually in this research, in real multi-tier, multi-
dimension complex supply chains, events and their impacts occur frequently and they do not
happen separately or independently of each other. For example, we described D1’s acquisition
by an investment group. After this event was implemented, several other events followed. We
focused on the hiring of a new marketing and sales director and two of the projects that this
individual initiated as another event’s impacts to be analyzed. However, other related events
were also implemented at the same time. We could also have discussed the new manufacturing
director, who started at D1 at the same time, or the new plant manufacturing building that was
purchased several months after the acquisition by the investment group. However, in order to
limit the scope of the case study, we looked at each event separately, in order to be able to
better understand it and its impacts. Figure 80 illustrates the three events discussed in Section
4.2.1.

272
Figure 80: Illustration of the events in D1’s supply chain that were discussed.
D1 acquisition by an investment group
New marketing and sales director with the redesign of the
packaging for more than 300 products
Change in the sales model

273
Also, real supply chains are complex and with many decisions being made and many events
being implemented at the same time. Although our conception of supply chains and multi-tier
and multi-dimension allowed us to explore the impact of these decisions in a much more
realistic manner, we nonetheless made some tradeoffs when we were choosing which
proposition(s) were illustrated by each case. We could, for example, have used P2: the
gyroscopic effect, to illustrate how the same source firm’s power was differently applied,
depending on the personal social influence of the individual involved (i.e. the president of the
firm, the marketing and sales director, some of the franchise owners, or the sales personnel in
each of the retail stores). However, we decided to investigate other propositions in those cases,
which also indicates another limitation of this research.
Finally, we presented the results of the dissemination of the impact of an event over complex
multi-tier, multi-dimension supply chains. We could have used, at least in some situations, a
supply chain flow different from the basic illustration based on Chen and Paulaj (2004). Since
most of the events discussed in Section 4.2 were initiated in a focal firm, the traditional model
of the upstream and downstream supply chain somewhat limited our illustration of the impacts,
since time always goes forward. Thus, to allow the comparison of the extent of the impacts,
instead of placing the source of the event in the middle of the network we could have placed
the source firm at the right side of the network representing the beginning of the event.
274
REFERENCES
ABIHPEC. (2014). Retrieved from www.abihpec.org.br
Anand, G., Ward, P. T., Tatikonda, M. V., & Schilling, D. a. (2009). Dynamic capabilities
through continuous improvement infrastructure. Journal of Operations Management,
27(6), 444–461. doi:10.1016/j.jom.2009.02.002
Ariely, D. (2008). Predictably Irrational. New York: Harper Collins Publishers.
Asch, S. E. (1956). Studies of independence and conformity: a minority of one against a
unanimous majority. Psychological Monographs General and Applied, 70(9), 1–70.
Astley, W. G., & Sachdeva, P. S. (1984). Structural Sources of Intraorganizational Power: A
Theoretical Synthesis. Academy of Management Review, 9(I), 104–113.
doi:10.5465/AMR.1984.4278071
Bar-Hillel, M. (1984). Representativeness and Fallacies of Probability Judgment. Acta
Psychologica, 55, 91–107.
Bartlett, R. (2007). Introduction to Sports Biomechanics: analysing human movement
patterns (2nd ed.).
Bellamy, M., Ghosh, S., & Hora, M. (2014). The influence of supply network structure on
firm innovation. Journal of Operations Management, 32(6), 357–373.
doi:10.1016/j.jom.2014.06.004
Bendoly, E., Croson, R., Goncalves, P., & Schultz, K. (2010). Bodies of Knowledge for
Research in Behavioral Operations. Production and Operations Management, 19(4),
434–452. doi:10.1111/j.1937-5956.2009.01108.x
Bendoly, E., Donohue, K., & Schultz, K. (2006). Behavior in operations management:
Assessing recent findings and revisiting old assumptions. Journal of Operations
Management, 24(6), 737–752. doi:10.1016/j.jom.2005.10.001
Bingham, C. B., & Eisenhardt, K. M. (2011). RATIONAL HEURISTICS : THE “ SIMPLE
RULES ” THAT STRATEGISTS LEARN FROM PROCESS EXPERIENCE. Strategic
Management Journal, 1464(June 2010), 1437–1464. doi:10.1002/smj
Boucquet, L. (2003). The physics of stone skipping. American Journal of Physics, 71(2),
150–155.
Boudreau, J., Hopp, W., McClain, J. O., & Thomas, L. J. (2003). On the Interface Between
Operations and Human Resources Management. Manufacturing & Service Operations
ManagementService Operations Management, 5(3), 179–202.
doi:10.1287/msom.5.3.179.16032

275
Bowman, C., & Ambrosini, V. (2000). Value Creation Versus Value Capture: Towards a
Coherent Definition of Value in Strategy. British Journal of Management, 11(1), 1–15.
doi:10.1111/1467-8551.00147
Boyer, K. K., & Pronovost, P. (2010). What medicine can teach operations: What operations
can teach medicine. Journal of Operations Management, 28(5), 367–371.
doi:10.1016/j.jom.2010.08.002
Brindley, C. (Ed.). (2004). Supply chain risk. Ashgate: Aldershot.
Burgess, K., Singh, P. J., & Koroglu, R. (2006). Supply chain management: a structured
literature review and implications for future research. International Journal of
Operations & Production Management, 26(7), 703–729.
doi:10.1108/01443570610672202
Camerer, C. (1999). Perspective Behavioral economics: Reunifying psychology and
economics, 96, 10575–10577.
Campbell, D. T., Stanley, J. C., & Gage, N. L. (1963). Experimental and quasi-experimental
designs for research. Boston: Houghton Mifflin.
Carter, C. R. (2011). A call for theory: The maturation of the supply chain management
discipline. Journal of Supply Chain Management, 47(April), 3–7. doi:10.1111/j.1745-
493X.2011.03218.x
Carter, C. R., Kaufmann, L., & Michel, A. (2007). Behavioral supply management: a
taxonomy of judgment and decision-making biases. International Journal of Physical
Distribution & Logistics Management, 37(8), 631–669.
doi:10.1108/09600030710825694
Chen, I. J., & Paulraj, A. (2004). Towards a theory of supply chain management: the
constructs and measurements. Journal of Operations Management, 22(2), 119–150.
doi:10.1016/j.jom.2003.12.007
Chen, Y.-S., Rungtusanatham, M. J., Goldstein, S. M., & Koerner, A. F. (2013). Theorizing
through metaphorical transfer in OM/SCM research: Divorce as a metaphor for strategic
buyer–supplier relationship dissolution. Journal of Operations Management, 31(7-8),
579–586. doi:10.1016/j.jom.2013.06.004
Choi, T. Y., & Kim, Y. (2008). Structural Embeddedness and Supplier Management: A
Network Perspective. Journal of Supply Chain Management, 44(4), 5–13.
Choi, T. Y., & Wu, Z. (2009). Taking the leap from dyads to triads: Buyer–supplier
relationships in supply networks. Journal of Purchasing and Supply Management, 15(4),
263–266. doi:10.1016/j.pursup.2009.08.003
Cialdini, R. B. (1984). Influence: The Psychology of Persuasion.
Cialdini, R. B. (2001a). Influence: Science and practice (4th ed.). Boston: Allyn & Bacon.
276
Cialdini, R. B. (2001b). The science of persuasion. Scientific American, 284, 76–81.
Cialdini, R. B., & Goldstein, N. J. (2004). Social influence: compliance and conformity.
Annual Review of Psychology, 55(1974), 591–621.
doi:10.1146/annurev.psych.55.090902.142015
Cialdini, R. B., & Trost, M. R. (1998). Social influence: Social norms, conformity and
compliance.
Cialdini, R. B., Wosinska, W., Barrett, D. W., Butner, J., & Gornik-Durose, M. (1999).
Compliance with a request in two cultures: The differential influence of social proof and
commitment/consistency on collectivists and individualists. Personality and Social
Psychology Bulletin, 25, 1242–1253.
Clanet, C., Hersen, F., & Boucquet, L. (2004). Secrets of successful stone-skipping. Nature,
427(January), 29–29.
Clanet, C., Hersen, F., & Lyderic Boucquet. (2004). The revealed secrets of stone skipping.
Nature (Vol. 427).
Cooper, M. C., Lambert, D. M., & Pagh, J. D. (1997). Supply Chain Management: More
Than a New Name for Logistics. The International Journal of Logistics Management, 1–
14.
Cummings, L. L. (1977). Needed Research in Production / Operations Management : A
Behavioral Perspective. Academy of Management Review, July, 500–505.
Davis, M. M., & Heineke, J. (1994). Understanding the Roles of the Customer and the
Operation for Better Queue Management. International Journal of Operations &
Production Management, 14(5), 21–34. doi:10.1108/01443579410056777
Direct Selling News. (2015).
Eisenhardt, K. M. (1989). Building Theories from Case Study Research. Academy of
Management Review, 14(4), 532–550.
Ellsworth, B. (2010). Brazil to step up crackdown on “biopiracy” in 2011. Reuters. Retrieved
from http://goo.gl/1aMdMR
Erickson-Davis, M. (2010). Biopiracy crackdown results in $59M in fines for Brazilian
companies, receives mixed reviews. Environmental News.
Falkovich, G., & Sreenivasan, K. R. (2006). Lessons from hydrodynamic turbulence. Physics
Today, 59(4), 43–49. doi:10.1063/1.2207037
Ferreira, Si. N., & Sampaio, M. J. A. M. (2011). Biodiversidade e Conhecimentos
Tradicionais Associados: implementação da legislação e repartição de benefícios no
Brasil. Sociedade Brasileira para o Progresso da Ciência.

277
Flynn, B. B., Sakibara, S. S., Schroeder, R. G., Bates, K. A., & Flynn, E. J. (1990). Empirical
Research Methods in Operations Management, 9(2).
Ford, J. K., & Foster-Fishman, P. (2012). Organizational Development and Change: linking
research from the profit, non profit, and public sectors. In The Oxford Handbook of
Organizational Psychology (pp. 956–992). Oxford Library of Psychology.
Freedman, J. L., & Fraser, S. C. (1966). Compliance without pressure: the foot-in-the-door
technique. Journal of Personality and Social Psychology, 4(2), 195.
Gareth, M. (1997). Images of organization. California, USA: SAGE Publications.
Gilovich, T., Griffin, D., & Kahneman, D. (2002). Heuristics and Biases: the Pshychology of
Intuituve Judgement. Cambridge University Press.
Gino, F., & Pisano, G. (2008). Toward a Theory of Behavioral Operations. Manufacturing &
Service Operations Management, 10(4), 676–691. doi:10.1287/msom.1070.0205
Glaser, B. G., & Strauss, A. L. (1967). The Discovery of Grounded Theory: Strategies for
Qualitative Research. Chicago: Aldine Publishing Company.
Goldstein, N. J., Martin, S. J., Cialdini, R. B., & Schuster, S. (2008). Yes! 50 Scientifically
Proven Ways to be Persuasive.
Gouldner, A. W. (1960). The Norm of Reciprocity: A Preliminary Statement. American
Sociological Review, 25(2), 161–178.
Granovetter, M. (1983). THE STRENGTH OF WEAK TIES : A NETWORK THEORY
REVISITED. Sociological Theory, 1, 201–233.
Granovetter, M. S. (1973). The Strength of Weak Ties The Strength of Weak Ties. The
American Journal of Sociology, 78(6), 1360–1380. doi:10.1086/225469
Hall, L. E. (2006). The Laws of Motion: An Anthology of Current Thought (First.). New
York: The Rosen Publishing Group.
Hannan, M. T., & Freeman, J. (1984). Structural Inertia and Organizational Change.
American Sociological Review, 49(2), 149–164.
Harland, C. M. (1996). Supply Chain Management: Relationships, Chains and Networks.
British Journal of Management, 7(s1), S63–S80. doi:10.1111/j.1467-
8551.1996.tb00148.x
Harland, C. M., Lamming, R. C., & Cousins, P. D. (1999). Developing the concept of supply
strategy. International Journal of Operations & Production Management (Vol. 19).
doi:10.1108/01443579910278910
Harvey, P., Madison, K., Martinko, M., Crook, T. R., & Crook, T. A. (2014). Attribution
Theory in the Organizational Sciences: the Road Travelled and the Path Ahead. The
Academy of Management Perspectives, 28(2), 128–146.

278
Hawking, S. (1996). A Brief History of Time (Updated an.). New York: Bantam Books.
Hong, Y., Pearson, J. N., & Carr, A. S. (2009). A typology of coordination strategy in multi-
organizational product development. International Journal of Operations & Production
Management, 29(10), 1000–1024. doi:10.1108/01443570910993465
Hopp, W. J. (2004). Fifty Years of Management Science. Management Science, 50(1), 1–7.
doi:10.1287/mnsc.1030.0181
Hora, M., & Klassen, R. D. (2013). Learning from others’ misfortune: Factors influencing
knowledge acquisition to reduce operational risk. Journal of Operations Management,
31(1-2), 52–61. doi:10.1016/j.jom.2012.06.004
Humble, S. (2007). Skimming and skipping stones. Teaching Mathematics and Its
Applications, 26(4), 95–102. doi:10.1093/teamat/hrl016
IBAMA. (2012). Operação Novos Rumos II autua 35 empresas por exploração irregular da
biodiversidade. Retrieved from http://www.ibama.gov.br/publicadas/operacao-novos-
rumos-ii-autua-35-empresas-por-exploracao-irregular-da-biodiversidade-
International, E. (2013). Beauty and Personal Care, (June).
Ito, N. C., Hayashi Junior, P., Gimenez, F. A. P., & Fensterseifer, J. E. (2012). Valor e
vantagem competitiva: buscando definições, relações e repercussões. Revista de
Administração Contemporânea, 16(2), 290–307. doi:10.1590/S1415-
65552012000200008
Judge, T. a, & Bono, J. E. (2001). Relationship of core self-evaluations traits--self-esteem,
generalized self-efficacy, locus of control, and emotional stability--with job satisfaction
and job performance: a meta-analysis. The Journal of Applied Psychology, 86(1), 80–92.
doi:10.1037/0021-9010.86.1.80
Kahneman, D. (2003). Maps of Bounded Rationality: Psychology for Behavioral. American
Economic Review, 93(5), 1449–1475.
Kahneman, D. (2011). Thinking fast and slow. New York: Farrar, Straus and Giroux.
Kahneman, D., & Frederick, S. (2002a). Heuristics of Intuitive Judgment: Extensions and
Applications. In T. Gilovich, D. Griffin, & Daniel Kahneman (Eds.), Heuristics of
Intuitive Judgment: Extensions and Applications (pp. 1–30). Cambridge: Cambridge
University Press.
Kahneman, D., & Frederick, S. (2002b). Representativeness Revisited: Attribute Substitution
in Intuitive Judgment. In T. Gilovich, D. Grifn, & D. Kahneman (Eds.), Heuristics and
biases: The psychology of intuitive thought. (pp. 49 – 81). New York: Cambridge
University Press.
Kahneman, D., Knetsch, J. L., & Thaler, R. H. (1991). Anomalies: The Endowment Effect ,
Loss Aversion , and Status Quo Bias, 5(1), 193–206.

279
Kahneman, D., Slovic, P., & Tversky, A. (1982). Judgement under uncertainty: heuristics
and biases. New York: Cambridge University Press.
Kahneman, D., & Tversky, A. (1972). Subjective Probability : A Judgment of
Representativeness. Cognitive Psychology, 3(3), 430–454.
Kahneman, D., & Tversky, A. (1973). On the psychology of prediction. Psychological
Review, 80(4), 237–251.
Kahneman, D., & Tversky, A. (1979). Prospect Theory: An analysis of decision under risk.
Econometrica, 47(2), 263–292.
Karuppan, C. M., & Ganster, D. C. (2004). The labor – machine dyad and its influence on
mix flexibility. Journal of Operations Management, 22, 533–556.
doi:10.1016/j.jom.2004.08.005
Katz, E., & Lazarsfeld, P. F. (1955). (1955). Personal Influence: the part played by people in
the flow of mass communications. Transaction Publishers.
Kelley, H. H., & Michela, J. L. (1980). Attribution theory and research. Annual Review of
Psychology, 31, 457–501. doi:10.1146/annurev.ps.31.020180.002325
Ketchenjr, D., & Hult, G. (2007). Toward greater integration of insights from organization
theory and supply chain management. Journal of Operations Management, 25(2), 455–
458. doi:10.1016/j.jom.2006.05.001
Kim, D.-Y. (2014). Understanding supplier structural embeddedness: A social network
perspective. Journal of Operations Management, 32(5), 219–231.
doi:10.1016/j.jom.2014.03.005
Kim, Y., Choi, T. Y., Yan, T., & Dooley, K. (2011a). Structural investigation of supply
networks: A social network analysis approach. Journal of Operations Management,
29(3), 194–211. doi:10.1016/j.jom.2010.11.001
Kim, Y., Choi, T. Y., Yan, T., & Dooley, K. (2011b). Structural investigation of supply
networks: A social network analysis approach. Journal of Operations Management,
29(3), 194–211. doi:10.1016/j.jom.2010.11.001
Knemeyer, a. M., Zinn, W., & Eroglu, C. (2009). Proactive planning for catastrophic events
in supply chains. Journal of Operations Management, 27(2), 141–153.
doi:10.1016/j.jom.2008.06.002
Krackhardt, D. (1992). The strength of strong ties: The importance of philos in organizations.
In Networks and organizations: Structure, form, and action (pp. 216–239).
Krippendorff, K. H. (2013). Content Analysis: An Introduction to Its Methodology. Sage.
La Londe, B. J., & James M. Monster. (1994). Emerging Logistics Strategies: Blueprints for
Next Century. International Journal of Physical Distribution and Logisitics
Management, 24(7), 135–47.
280
Lambert, D. M., & Cooper, M. C. (1998). Supply Chain Management: Implementation Issues
and Research Opportunities. The International Journal of Logistics Management, 9(2),
1–20.
Lambert, D. M., & Cooper, M. C. (2000). Issues in Supply Chain Management. Industrial
Marketing Management, 29(1), 65–83. doi:10.1016/S0019-8501(99)00113-3
Langley, A., Smallman, C., Tsoukas, H., & Van-De-Ven, A. H. (2013). Process studies of
change in organizartion and management: unveilling temporality, activity, and flow.
Academy of Management Journal, 56(1), 1–13.
Lewin, K. (1951). Field theory in social science.
Loewenstein, G., & Thaler, R. H. (1989). Intertemporal Choice , pages 181-93, Fall. Journal
of Economic Perspectives, 3(4), 181–193.
Marsh, J. (2014). The Theory of Everything.
Marsiglio, W., & Scanzoni, J. H. (1995). Families and Friendships: Applying the
Sociological Imagination. NewYork: Harper Collins Publishers.
McDonough, J. M. (2004). Introductory Lectures on Turbulence - Physics, Mathematics and
Modeling. Departments of Mechanical Engineering and Mathematics University of
Kentucky, (Course Notes), 1–174.
Mentzer, J. T., DeWitt, W., Keebler, J. S., Min, S., W., N. N., Smith, C. D., & Zacharia, Z. G.
(2001). Defining supply chain management. Journal of Business Logistics, 22(1), 1–25.
Mentzer, J. T., Keebler, J. S., Nix, N. W., Smith, C. D., & Zacharia, Z. G. (2001). Defining
Supply Chain Management. Journal of Business Logistics, 22(2), 1–25.
Meredith, J. (1998). Building operations management theory through case and field research.
Journal of Operations Management, 16(4), 441–454. doi:10.1016/S0272-
6963(98)00023-0
Mesquita, L. F. (2007). Starting Over When the Bickering Never Ends: Rebuilding Aggregate
Trust among Clustered Firms Through Trust Facilitators. Academy of Management
Review, 32(1), 72–91.
Miles, M. B., Huberman, A. M., & Saldaña, J. (2014). Qualitative Data Analysis: A Methods
Sourcebook (3rd ed.). Sage.
Milet, K., & Gallon, V. (2014). Brazil could become our first market, Nicolas Geiger,
L’Occitane. Premium Beauty News. Retrieved from
http://www.premiumbeautynews.com/en/brazil-could-become-our-first,6870
Milgram, S. (1974). Obedience to authority. New York: Harper & Row.
Morgan, G. (1980). Paradigms, Metaphors, and Puzzle Solving in Organization Theory.
Administrative Science Quarterly, 25(4), 605–622. doi:10.2307/2392283

281
Morgan, G. (1983). More on Metaphor: Why We Cannot Control Tropes in Administrative
Science. Administrative Science Quarterly, 28(4), 601–607. doi:10.2307/2393011
Muchinsky, P. M. (1996). The correction for attenuation. Educational and Psychological
Measurement, 56(1), 63–75.
Nagahiro, S. I., & Hayakawa, Y. (2005). Theoretical and numerical approach to “magic
angle” of stone skipping. Physical Review Letters, 94(May), 1–4.
doi:10.1103/PhysRevLett.94.174501
Narayanan, S., Jayaraman, V., Luo, Y., & Swaminathan, J. M. (2011). The antecedents of
process integration in business process outsourcing and its effect on firm performance.
Journal of Operations Management, 29(1-2), 3–16. doi:10.1016/j.jom.2010.05.001
Narayandas, D., & Rangan, V. K. (2004). Building and Sustaining Buyer – Seller
Relationships in Mature Industrial Markets. Journal of Marketing, 68(July), 63–77.
Nelson, R. E. (1989). The strength of strong ties: Social networks and intergroup conflict in
organizations. Academy of Management Journal, 32(2), 377–401.
Newell, A., & Simon, H. A. (1972). Human Problem Solving. New Jersey: Prentice Hall:
Englewood Cliffs.
Ng, T. W., Sorensen, K. L., & Lillian T. Eby. (2006). Locus of control at work: a meta‐
analysis. Journal of Organizational Behavior, 27(8), 1057–1087.
Nolan, J. M., Schultz, P. W., Cialdini, R. B., Goldstein, N. J., & Griskevicius, V. (2008).
Normative social influence is underdetected. Personality and Social Psychology
Bulletin, 34(7), 913–923.
Ortony, A. (1993). Metaphor and thought. Cambridge University Press.
Pagell, M. (2004). Understanding the factors that enable and inhibit the integration of
operations, purchasing and logistics. Journal of Operations Management, 22(5), 459–
487. doi:10.1016/j.jom.2004.05.008
Peng, D., Schroeder, R., & Shah, R. (2008). Linking routines to operations capabilities: A
new perspective. Journal of Operations Management, 26(6), 730–748.
doi:10.1016/j.jom.2007.11.001
Porras, J. I., & Silvers, R. C. (1991). Organization development and transformation. Annual
Review of Psychology, 42, 51–78. doi:10.1146/annurev.psych.42.1.51
Powell, G. N., & Johnson, G. A. (1980). An expectancy-equity model of productive system
performance. Journal of Operations Management, 1(1).
Powell, T. C. (1995). Total quality management as competitive advantage: A review and
empirical study. Strategic Management Journal, 16(1), 15–37.
doi:10.1002/smj.4250160105

282
Rosellini, L., Hersen, F., Clanet, C., & Bocquet, L. (2005). Skipping stones. Journal of Fluid
Mechanics, 543(1), 137. doi:10.1017/S0022112005006373
Rotter, J. B. (1966). Generalized expectancies for internal versus external control of
reinforcement. Psychoogical Monographs, 80(1), 609.
Schmenner, R. W., & Swink, M. L. (1998). On theory in operations management. Journal of
Operations Management, 17, 97–113. doi:10.1016/S0272-6963(98)00028-X
Schoenherr, T., & Swink, M. (2012). Revisiting the arcs of integration: Cross-validations and
extensions. Journal of Operations Management, 30(1-2), 99–115.
doi:10.1016/j.jom.2011.09.001
Schroeder, R. G. (2008). Introduction to the Special Issue on Incentives and Coordination in
Operations Management. Production and Operations Management, 17(3), 354–356.
doi:10.1287/mnsc.1040.0232
Seiter, R. H., & Gass, J. S. (2010). Persuasion, social influence, and compliance gaining.
Sell, J., Jr, M., & Marcon, R. (2007). Prospect Theory : A Study of the Endowment Effect,
11–28.
Simon, H. (1955). A Behavioral Model of Rational Choice. The Quarterly Journal of
Economics, 69(1), 99–118.
Simons, J. H., & Baumann, D. D. (1972). The Tornado Threat: coping styles of the North and
South. Science, 176(4042), 1386–1392.
Simons, J. H., & Baumann, D. D. (2012). The Tornado Threat: coping styles of the North and
South. In C. Campanella, J. Mosher, S. Frail, & M. Schricker (Eds.), Forty studies that
changed Psychology (7th ed., p. 195). Pearson.
Singhal, K., & Singhal, J. (2012). Opportunities for Developing the Science of Operations
and Supply Chain Management. Journal of Operations Management, 30(3), 245–252.
doi:10.1016/j.jom.2011.11.003
Speier, C., Whipple, J. M., Closs, D. J., & Voss, M. D. (2011). Global supply chain design
considerations: Mitigating product safety and security risks. Journal of Operations
Management, 29(7-8), 721–736. doi:10.1016/j.jom.2011.06.003
Steen, G. (2008). The Paradox of Metaphor: Why We Need a Three-Dimensional Model of
Metaphor. Metaphor and Symbol, 23(793117353), 213–241.
doi:10.1080/10926480802426753
Thaler, R. (1981). Some empirical evidence on dynamic inconsistency," Economics Letters,
Elsevier, vol. 8(3), pages 201-207. Economics Letters, 8(3), 201–207.
Thaler, R. (1985a). Mental Acconuting and Consumer Choice. Marketing Science, 4(3), 199–
214.

283
Thaler, R. (1985b). Mental Accounting and Consumer Choice. Marketing Science, 4(3), 199–
214.
Thaler, R., & Sunstein, C. R. (2009). Nudge: Improving decisions about health, wealth, and
happiness. Constitutional Political Economy (Vol. 19). New York: Penguin books.
doi:10.1007/s10602-008-9056-2
The Belmont report: Ethical principles and guidelines for the protection of human subjects of
research. ERIC Clearinghouse. (1978).
Tranfield, D., & Smith, S. (2002). Organisation designs for teamworking. International
Journal of Operations & Production Management, 22(5), 471–491.
doi:10.1108/01443570210425138
Tsai, J. Y., Raghu, T. S., & Shao, B. B. M. (2013). Information systems and technology
sourcing strategies of e-Retailers for value chain enablement. Journal of Operations
Management, 31(6), 345–362. doi:10.1016/j.jom.2013.07.009
Tsoukas, H. (1991). The Missing Link - a Transformational View of Metaphors in
Organizational Science. The Academy of Management Review, 16(3), 566–585.
doi:10.5465/AMR.1991.4279478
Tversky, A., & Kahneman, D. (1974). Judgment under Uncertainty : Heuristics and Biases.
Science, 415, 1124–1131.
Tversky, A., & Kahneman, D. (1983). Extensional Versus Intuitive Reasoning: the
conjunctions fallacy in probability judgment. Pshychological Review, 90(4), 293–315.
Tversky, A., & Kahneman, D. (1986). Rational Choice and the Framing of Decisions. The
Journal of Business, 59(S4), S251–S278. doi:10.1086/296365
Van De Ven, A. H. (1989). Nothing Is Quite So Practical as a Good Theory. Academy of
Management Review, 14(4), 486–489. doi:10.1177/1534484305276176
Vergano, D. (2006). Turbulence theory gets a bit choppy. USA Today, pp. 9–10. Retrieved
from http://usatoday30.usatoday.com/tech/science/columnist/vergano/2006-09-10-
turbulence_x.htm
Villena, V. H., Revilla, E., & Choi, T. Y. (2011). The dark side of buyer–supplier
relationships: A social capital perspective. Journal of Operations Management, 29(6),
561–576. doi:10.1016/j.jom.2010.09.001
Wang, Q., Craighead, C. W., & Li, J. J. (2014). Justice served: Mitigating damaged trust
stemming from supply chain disruptions. Journal of Operations Management, 32, 374–
386.
Weick, K. E. (1989). Theory Construction as Disciplined Imagination. Academy of
Management Review, 14(4), 516–531. Retrieved from
http://www.jstor.org/stable/10.2307/258556
284
Wood, W. (2000). Attitude change: persuasion and social influence. Annual Review of
Psychology, 51, 539–570. doi:10.1146/annurev.psych.51.1.539
Wu, Z., & Choi, T. Y. (2005). Supplier–supplier relationships in the buyer–supplier triad:
Building theories from eight case studies. Journal of Operations Management, 24(1),
27–52. doi:10.1016/j.jom.2005.02.001
Xiao, J.-H. (2010). Hard Fling Objectos Contact with Surface of Fluid as a Ricochet.
Mathematical and Computational Applications, 15(5), 940–945.
Yabe, T., Ogata, Y., Takizawa, K., Kawai, T., Segawa, a., & Sakurai, K. (2002). The next
generation CIP as a conservative semi-Lagrangian solver for solid, liquid and gas.
Journal of Computational and Applied Mathematics, 149(1), 267–277.
doi:10.1016/S0377-0427(02)00535-6
Yin, R. K. (2013). Case Study Research: Design and Methods. Sage.
Zhang, C., Viswanathan, S., & Henke, J. W. (2011). The boundary spanning capabilities of
purchasing agents in buyer–supplier trust development. Journal of Operations
Management, 29(4), 318–328. doi:10.1016/j.jom.2010.07.001

285
Appendix A: Interview Protocol
Informant: Buyer Side
Target functions: Buyer, Purchasing Manager, Operations Manager, Supply-Chain
Manager, or Supply-Chain Director)
A) Firm information (secondary data) Date: _____/______/__________
Firm name:
____________________________________________________________________
Industrial Sector:
______________________________________________________________
(Some information and numbers about the firm (# of units in the U. S.; # of units outside the
U.S.; # of units in Brazil; Headquarter; # of employees, etc.)
B) Interview protocol (draft)
1. Introductory Questions:
Warm-up, acknowledgment
2. Please tell me about your firm.
3. What are the main events that you noticed on your firm (or market) over the last
few years?
4. Please tell me about your suppliers. How do you classify them?
5. What do you purchase the most? Who are your most important suppliers?
6. How has the relationship with these suppliers been influenced over the last couple
years?
7. Please tell me about that event and its impacts.
8. Please tell me about the outcomes and the processes that you went through to
arrive on that outcomes.
9. Is there anything else you would like to comment or tell me?
Questionnaire
About you:
1. Name: _______________________________________________________________
2. Gender: ____ feminine ____ masculine ___
3. Age (in years)
a) Less than 25
b) between 26 and 35
c) between 36 and 45
d) between 46 and 59
e) Over 60 years
4. Function in the firm: _______________________________________________
5. Time in the firm: _________ years _______ months
6. Time in the function: _________ years _______ months
7. How do you perceive the importance of your job to the firm?
a) Crucial importance. The decisions that I, or someone under my supervision make, can
highly impact the firm ‘s results (operational or financial)

286
b) Medium importance. The decisions that I, or someone under my supervision make,
have relative impact on the firm’s results (operational or financial)
c) Low importance. The decisions that I, or someone under my supervision make, have
low impact on the firm’s results (operational or financial)
8. How many individuals in your department? ________
9. How many with similar function as yours? ______ Tell me about it.
10. Are there individuals with similar function as yours in other departments or business
units of the firm? Please tell me about that.
11. The annual budget of my department is ______% of the total firm budget.
12. This budget refers _____% to services and _____% to good purchases.
13. Any other specific information?
About educational and professional background
14. Educational background:
__________________________________________________________________________
__________________________________________________________________________
___________________________________________________________________________
15. Professional background:
___________________________________________________________________________
___________________________________________________________________________
___________________________________________________________________________

287
Appendix B: IRB Approval

288

289

290
Appendix C: Informed Consent
INDIANA UNIVERSITY INFORMED CONSENT STATEMENT FOR
“UNDERSTANDING HOW BUYER-SUPPLIER RELATIONSHIPS EVOLVE
AFTER A MID-RANGE EVENT”
You are invited to participate in a research study of buyer-supplier relationships. You were
selected as a possible subject because of your relationship with the phenomenon within your
firm. We ask that you read this form and ask any questions you may have before agreeing to
be in the study. The study is being conducted by Janaina Siegler who is a visiting scholar at
Indiana University in Indianapolis and a Ph.D. Candidate at Getulio Vargas Foundation in Sao
Paulo, Brazil.
STUDY PURPOSE
The purpose of this study is to understand how buyer and supplier relationships evolve after
mid-range events. As mid-range events we consider any events that are seen as important to
one firm or the other (the buyer or the supplier). Ex: there is an event in the director or key
person in a buyer-supplier relationship, one of the firms is acquired by another firm, there are
technological events (e.g.: RFID or EDI), legal events, or any other events that the firms may
judge significant. They are mid-range because they are not disastrous to either firm nor are they
day-to-day tactical events.
NUMBER OF INDIVIDUALS TAKING PART IN THE STUDY:
If you agree to participate, you will be one of the 38 subjects who will be participating in this
research.
PROCEDURES FOR THE STUDY:
If you agree to be in the study, you will participate in an interview with the researcher. This
interview is expected to range from 40 to 90 minutes. The interview might be conducted
personally or from a distance using telephone or Skype. If you agree, we will record the
interview for further transcription and codification.
RISKS OF TAKING PART IN THE STUDY:
There are no direct risks related to the study. However, we assure that in case of any discomfort
answering any question you can tell the researcher that you feel uncomfortable or do not care
to answer a particular question and in no way will you be pressed to do that. You also can ask
to stop the research at any time if you decide you do not want to participate in it anymore.

291
BENEFITS OF TAKING PART IN THE STUDY:
The expected benefits are related to the understanding of how buyer and supplier relationships
evolve after mid-range events. We address that because although buyer-supplier relationships
are between firms, decisions are made by individuals. There is evidence that the way buyers
and suppliers deal with “mid-range events” impacts buyer-supplier relationships, value
creation and appropriation, the buyer’s competitive advantage, and even the entire industry.
Also the results of this research may allow better relationships and also better results for either
the buyer or the supplier firm. An executive summary report will be sent to you with the main
findings of the research.
ALTERNATIVES TO TAKING PART IN THE STUDY:
If you prefer to not take part of the research, you can still help by indicating some other
individuals that might be able to participate.
CONFIDENTIALITY
Confidentiality will be ensured by not using the names of any of the informants. Your identity
will be held in confidence in reports in which the study may be published. In order to keep the
confidentiality of the firms, their names will also be eventd. We will develop “labels” for each
firm based on characteristics that emerge from the data that will be collected. A master list of
actual firm names and their labels, as well as their individual informants will be maintained by
the researchers, but will not be revealed in any reports or research papers. Efforts will be made
to keep all your personal information confidential, however we cannot guarantee absolute
confidentiality in case of information disclosure required by law. Firms that may inspect and/or
copy your research records for quality assurance and data analysis include groups such as the
study investigator and his/her research associates, the Indiana University Institutional Review
Board or its designees, and (as allowed by law) state or federal agencies, specifically the Office
for Human Research Protections (OHRP).
COSTS
Taking part in this study does not lead to added costs to you or your firm.
PAYMENT
You will not receive payment for taking part in this study.
FINANCIAL INTEREST DISCLOSURE
There are no individuals or firms involved in this research that might benefit financially from
this study. If you would like more information, please ask the researchers or study staff.
CONTACTS FOR QUESTIONS OR PROBLEMS
For questions about the study or a research-related injury, contact the researcher Janaina Siegler
at (317) 853-0226. If you cannot reach the researcher during regular business hours (i.e.

292
8:00AM-5:00PM), please call the IU Human Subjects Office at (317) 278-3458 or (800) 696-
2949. After business hours, please call (317) 993-9513 or (317) 853-0226.
For questions about your rights as a research participant or to discuss problems, complaints or
concerns about a research study, or to obtain information, or offer input, contact the IU Human
Subjects Office at (317) 278-3458 or (800) 696-2949.
VOLUNTARY NATURE OF STUDY
Taking part in this study is voluntary. You may choose not to take part or may leave the study
at any time. Leaving the study will not result in any penalty or loss of benefits to which you
are entitled. Your decision whether or not to participate in this study will not affect your current
or future relations with the researcher or the participant universities.
SUBJECT’S CONSENT
In consideration of all of the above, I give my consent to participate in this research study. I
will be given a copy of this informed consent document to keep for my records. I agree to take
part in this study and I agree to have my interview recorded for further transcription and
codification.
Subject’s Printed Name:
Subject’sSignature: Date:______________
(must be dated by the subject)
Printed Name of Person Obtaining Consent: :
Signature of Person Obtaining Consent:
Date: _______

293
Informed Consent In Portuguese
INDIANA UNIVERSITY CONSENTIMENTO DE INFOMACAO PARA:
“COMPREENDENDO COMO AS RELAÇÕES ENTRE COMPRADORES E
FORNECEDEORES EVOLUEM APOS MUDANCAS DE MEDIA COMPEXIDADE” Você está convidado(a) para participar de uma pesquisa que investiga as relações entre compradores e fornecedores. Você foi selecionado(a) como possível respondente devido a sua proximidade em relação ao fenômeno (relação entre compradores e fornecedores) em sua empresa. Solicitamos que leia este documento e nos solicite o esclarecimento que quaisquer dúvidas que possa ter antes de você concordar em participar do estudo. A pesquisa está sendo conduzida por Janaina Siegler que é pesquisadora visitante na Indiana University em Indianapolis, nos Estados Unidos, e estudante de doutorado na Fundação Getúlio Vargas em São Paulo, Brasil.
1. OBJETIVO DO ESTUDO O objetivo deste estudo é compreender como as relações entre compradores e fornecedores evoluem após mudanças de média complexidade. Por mudanças de média complexidade, nós consideramos quaisquer mudanças que possam ser vistas como importantes para uma empresa ou a outra (compradora ou fornecedora). Exemplos deste tipo de mudanças podem ser (mas não restritas a): mudança de diretoria ou pessoa chave na relação entre compradores e fornecedores, situação de fusões e aquisições em alguma das empresas envolvidas na relação, mudanças de ordem tecnológica (RFID, EDI, implantação de novo sistema de TI), mudanças de ordem legal, jurídica ou qualquer outra mudança que possa ser entendida como significativa. Elas são consideradas de média complexidade porque não são nem desastrosas para alguma das empresas nem mudanças do tipo contínuas e diárias nas empresas. 2. NUMERO DE PESSOAS PARTICIPANDO NO ESTUDO: Caso voce aceite participar, você será uma das 38 pessoas entrevistadas que deverão participar do estudo. 3. PROCEDIMENTOS DO ESTUDO: Caso voce aceite participar do estudo, você participará de uma entrevista com a pesquisadora. Esta entrevista deve durar aproximadamente entre 40 a 90 minutos. A entrevista poderá ser conduzida pessoalmente ou a distância utilizando telefone ou Skype. Caso concorde, a entrevista poderá ser gravada para posterior transcrição, codificação e análise. 4. RISCOS EM FAZER PARTE DO ESTUDO: Nao há nenhum risco diretamente relacionado ao estudo. No entanto, nós asseguramos que caso sinta qualquer constrangimento ou desconforto em responder qualquer questão, voce terá total liberdade em não respondê-la(s). Você também poderá parar a pesquisa em qualquer momento caso decida que não quer mais participar. 5. BENEFÍCIOS EM FAZER PARTE DO ESTUDO: Os benefícios esperados do estudo estão relacionados à compreensão de como as relações entre compradores e fornecedores evoluem após mudanças de média complexidade. Nós entendemos que apesar da relação entre compradores e fornecedores acontecerem entre empresas, as decisões são tomadas por pessoas. Existem evidências que a forma com compradores e fornecedeores lidam com essas mudanças de media complexidade impactam a relação entre eles, a criação e apropriação de valor, a vantagem competitiva do comprador e, até mesmo todo o setor industrial que estão envolvidos e toda a cadeia de suprimentos. Além disto os resultados desta pesquisa podem propiciar a criação de melhores relações e também melhores resultados para ambas as empresas evolvidas: compradores e fornecedores. Ao final da pesquisa, um sumário executivo detalhado com os principais achados da pesquisa será disponibilizado e enviado à você, caso você tenha interesse.

294
6. ALTERNATIVAS A PARTICIPAÇÃO DO ESTUDO:
Caso você prefira não fazer parte da pesquisa, você ainda pode colaborar com o estudo indicando alguma pessoa que possa participar. 7. CONFIDENCIALIDADE Confidencialidade será assegurada não utilizando o nome de nenhum dos respondentes. Sua identidade será mantida confidencial e não será utilizada nos trabalhos que possam ser publicados a partir deste estudo. Para manter a identidade das empresas, seus nomes também serão alterados. Nós desenvolveremos espécies de “labels” para cada empresa com base nas características que possam emergir dos dados coletados. Uma lista principal com o nome dos respondentes, empresas e seus nomes substitutos será mantida em sigilo pela pesquisadora e não serão revelados em nenhum trabalho publicado. Esforços também serão feitos para manter confidencial toda sua informação pessoal. Porém não podemos garantir a absoluta confidencialidade caso a abertura da informação seja requirida por força legal ou judicial. As organizações que poderiam inspecionar e ter acesso a seus dados para garantir a qualidade e seguranca da análise dos dados incluem grupos como o grupo de investigação diretamente e seus associados (orientadores da pesquisadora e comitê de avaliação), o Comitê de Ética da Universidade de Indiana e seus designados e, (como requerido pela legislação pertinente) as agências americanas federais ou estaduais, especialmente o Escritorio para Protecao de Pesquisa com Seres Humanos (OHRP). 8. CUSTOS Fazer parte deste estudo não implicará em nenhum custo para você ou sua empresa. 9. PAGAMENTO Voce nao recebera pagamento por participar desta pesquisa. 10. INTERESSES FINANCEIROS DIVERSOS Nenhum indivíduo ou empresa envolvidos neste estudo se beneficiará financeiramente a partir desta pesquisa. Por favor fique à vontade para fazer mais questionamentos a este respeito diretamente aos pesquisadores envolvidos. 11. CONTATOS PARA QUESTIONAMENTOS OU QUALQUER PROBLEMA Para questões relacionadas ao estudo, por favor entrar em contato com a pesquisadora Janaina Siegler no telefoone +1 (317) 853-0226 (Estados Unidos) ou +55 (11) 3230-1632 (Brasil). Caso não consiga falar com a mesma no horário comercial (8h as 18h), ou para outras questões, por favor contacte o escritório da Universidade de Indiana para pesquisas com seres humanos no telefone +1 (317) 278-3458 ou +1 (800) 696-2949. O e-mail da pesquisadora para contato é: [email protected] ou [email protected] Para questões sobre seus direitos como participante da pesquisa ou para discutir eventuais problemas, reclamações ou preocupações sobre a pesquisa, ou ainda para obter informações, contacte IU Human Subjects Office at +1 (317) 278-3458 ou +1 (800) 696-2949. 12. NATUREZA VOLUNTÁRIA DO ESTUDO Participar deste estudo é voluntário do respondente. Você poderá escolher não fazer parte da pesquisa ou finalizar sua participação a qualquer momento. Suan eventual desistência de participação nao implica em qualquer penalidade ou perda. Sua decisão em não fazer parte da pesquisa não afetará de nenhuma forma sua atual ou futura relação com a pesquisadora ou as universidades participantes.
13. CONSENTIMENTO DE PARTICIPAÇÃO
Considerando o exposto acima, eu concordo em participar da referida pesquisa. Uma cópia
deste consentimento será deixada comigo para que eu possa manter em meus arquivos. Eu

295
concordo em participar do estudo e autorizo que minha entrevista seja gravada para posterior
transcrição, análise e codificação pela pesquisadora.
Nome do Respondente: _________________________________________
Assinatura do Respondente:______________________________ Data: ______________
(deve ser preenchida pelo respondente)
Nome da pessoa obtendo consentimento:
_________________________________________
Assinatura da pessoa obtendo consentimento:__________________ Data: 18/03/2014
Janaina Siegler M. Batista

296
Appendix D: Golden Sheet Basic Data for Researched Firms
Codes Firm´s main business
Commodities
or not
Products or
Services
Main Position in
the SC
Size of
the firm Abrangencia State
1 ACB
Industry Representative Non-
Commodities
Services 2nd Tier Supplier Medium National SP
2 ABH
Manufacturers Association Non-
Commodities
Services 1st Tier Supplier Medium National SP
3 Dermo 2
Dermocosmetics
Manufacturer
Non-
Commodities
Products Focal Firm Medium National ES
4 D2SC
Franchisee Store Non-
Commodities
Products 1st Tier Buyer Small Regional SC
5 D2ES
Franchisee Store Non-
Commodities
Products 1st Tier Buyer Small Regional ES
6 AL
Packaging Solutions Non-
Commodities
Products 1st Tier Supplier Large International SP
7 AQ
Chemical Ingredients Non-
Commodities
Products 1st Tier Supplier Medium National SP
8 ASS
Legal Consultant Non-
Commodities
Services 1st Tier Supplier Small National DF
9 BSF
Chemical Ingredients Non-
Commodities
Products 2nd Tier Supplier X-Large International SP
10 BRC
Raw Material Converter Non-
Commodities
Products 2nd Tier Supplier Large International SP
11 BD
Chemical Ingredients Non-
Commodities
Products 1st Tier Supplier Medium National SP

297
Codes Firm´s main business
Commodities
or not
Products or
Services
Main Position in
the SC
Size of
the firm Abrangencia State
12 BPK
Packaging Solutions Commodities Products 1st Tier Supplier Small Regional MG
13 BP
Packaging Solutions Commodities Products 1st Tier Supplier Medium National RS
14 CGN Governamental Agency
Non-
Commodities
Services 1st Tier Supplier Small National DF
15 CHR
Outsourcing Manufacturer Non-
Commodities
Products 1st Tier Supplier Large International SP
16 CMTC
Chemical Ingredients Non-
Commodities
Products 1st Tier Supplier Medium National SP
17 DC
Chemical Ingredients Commodities Products 2nd tier supplier X-Large International SP
18 ENG
Packaging Solutions Non-
Commodities
Products 2nd Tier Supplier Large National SP
19 ERV
Raw material supplier Non-
Commodities
Products 3rd Tier Supplier Medium Regional RS
20 ECARI
Beauty Clinic or Salon Commodities Services 2nd Tier Buyer Micro Local MG
21 ECES
Beauty Clinic or Salon Commodities Services 2nd Tier Buyer Micro Local ES
22 ECUDI
Beauty Clinic or Salon Commodities Services 2nd Tier Buyer Micro Local MG
23 EUR
Market Research Non-
Commodities
Services 2nd Tier Supplier Medium International USA
24 FCP
Academic Research Institute Non-
Commodities
Services 3rd Tier Supplier Small Local AM
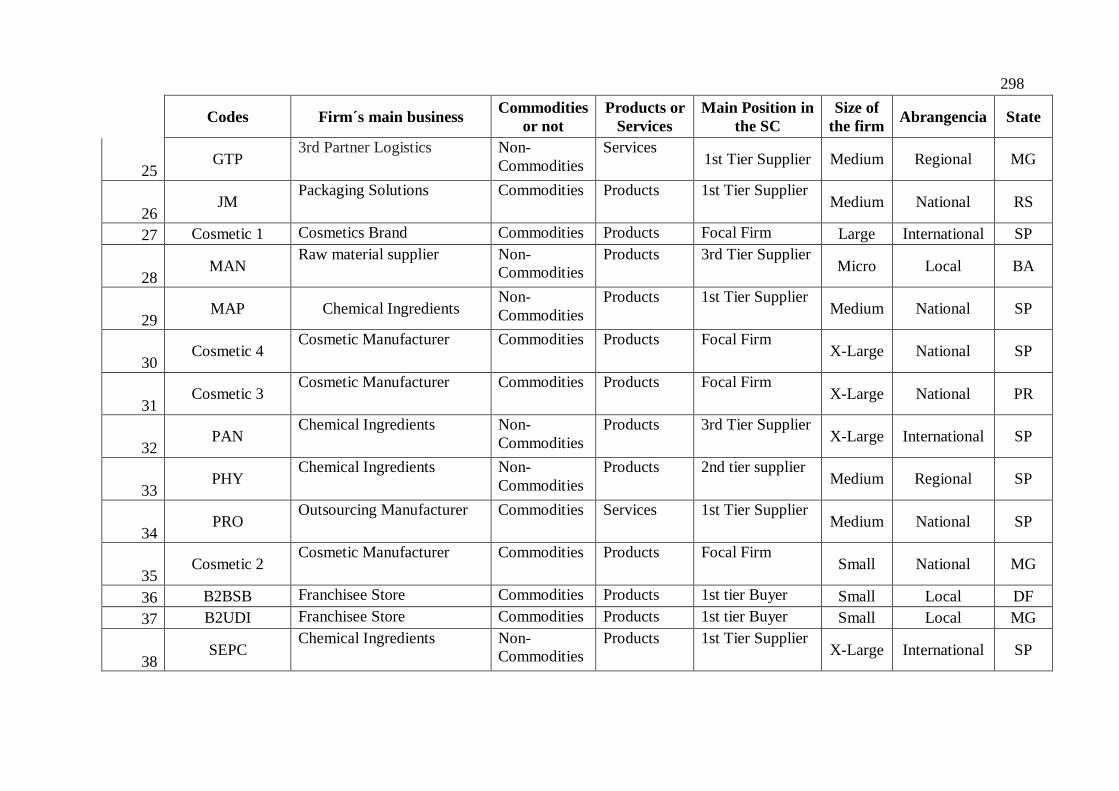
298
Codes Firm´s main business
Commodities
or not
Products or
Services
Main Position in
the SC
Size of
the firm Abrangencia State
25 GTP
3rd Partner Logistics Non-
Commodities
Services 1st Tier Supplier Medium Regional MG
26 JM
Packaging Solutions Commodities Products 1st Tier Supplier Medium National RS
27 Cosmetic 1 Cosmetics Brand Commodities Products Focal Firm Large International SP
28 MAN
Raw material supplier Non-
Commodities
Products 3rd Tier Supplier Micro Local BA
29 MAP Chemical Ingredients
Non-
Commodities
Products 1st Tier Supplier Medium National SP
30 Cosmetic 4
Cosmetic Manufacturer Commodities Products Focal Firm X-Large National SP
31 Cosmetic 3
Cosmetic Manufacturer Commodities Products Focal Firm X-Large National PR
32 PAN
Chemical Ingredients Non-
Commodities
Products 3rd Tier Supplier X-Large International SP
33 PHY
Chemical Ingredients Non-
Commodities
Products 2nd tier supplier Medium Regional SP
34 PRO
Outsourcing Manufacturer Commodities Services 1st Tier Supplier Medium National SP
35 Cosmetic 2
Cosmetic Manufacturer Commodities Products Focal Firm Small National MG
36 B2BSB Franchisee Store Commodities Products 1st tier Buyer Small Local DF
37 B2UDI Franchisee Store Commodities Products 1st tier Buyer Small Local MG
38 SEPC
Chemical Ingredients Non-
Commodities
Products 1st Tier Supplier X-Large International SP

299
Codes Firm´s main business
Commodities
or not
Products or
Services
Main Position in
the SC
Size of
the firm Abrangencia State
39 7SO
Packaging Solutions Commodities Services 1st Tier Supplier Small Local SP
40 SBELL
Raw material supplier Non-
Commodities
Products 3rd Tier Supplier Small Local SP
41 SLB
Raw Material Converter Non-
Commodities
Products 2nd Tier Supplier Large International
PR
42 STRT Chemical Industry Commodities Products 1st Tier Supplier Medium National MG
43 Dermo 1
Dermocosmetics
Manufacturer
Non-
Commodities
Products Focal Firm Medium National SP
44 D1BA
Franchisee Store Non-
Commodities
Products 1st tier Buyer Small Local BA
45 D1BH
Franchisee Store Non-
Commodities
Products 1st tier Buyer Small Local MG
46 D1ST
Franchisee Store Non-
Commodities
Products 1st tier Buyer Small Local SP
47 D1SO
Franchisee Store Non-
Commodities
Products 1st tier Buyer Small Local SP
48 D1UDI
Franchisee Store Non-
Commodities
Products 1st tier Buyer Small Local MG
49 ASREP Comercial Representative
Commodities Products 1st Tier Supplier Small Regional MG

300
Appendix E: Golden Sheet Basic Data for Researched Informants
Informa
nt Firm Job Titles Department Position in the Firm Gender
1 1 EUR Manager Sales Supplier Side Female
2 2 DC Manager Supply Chain Buyer Side Female
3 3 ABH Manager Marketing Intelligence Supplier Side Male
4 4_a COSMETICS 4 Manager Sales Supplier Side Female
5 4_b DERMO 1 Director Sales Supplier Side Female
6 5 DERMO 1 Manager Sales Supplier Side Male
7 6 DERMO 2 Director Operations Buyer Side Male
8 7 ABH Manager Foreign Trade Supplier Side Male
9 8 DERMO 1 Director Operations Buyer Side Male
10 9 DERMO 2 Manager Purchasing Buyer Side Female
11 10 CMTC Analyst Sales Supplier Side Male
12 11 CMTC Analyst Sales Supplier Side Male
13 12 DERMO 2 Manager Sales Supplier Side Male
14 13 DERMO 2 Manager R&D Buyer Side Female
15 14 PRO CEO Strategy Strategy Male
16 15 DERMO 1 Manager Purchasing Buyer Side Female
17 16 ACB Manager Administrative Supplier side Male
18 17 ACB Director Administrative Supplier side Female
19 18 Dermo 1 Manager R&D Buyer Side Female
20 19 FCP Consultant Academic Research Buyer Side Male
21 20 Cosmetics 2 CEO Strategy Supplier Side Male
22 21 Cosmetics 4 Manager IT Administrative Male

301
Informa
nt Firm Job Titles Department Position in the Firm Gender
23 22 Cosmetics 2 Manager Purchasing Buyer Side Female
24 23 BD Analyst Sales Supplier side Female
25 24 D1UDI Director Finance Buyer side Male
26 25 CMTC Manager Purchasing Buyer Side Female
27 26 D1UDI Director Purchasing Buyer side Female
28 27 D1UDI Analyst Sales Supplier Side Female
29 28 D1UDI Analyst Sales Supplier side Female
30 29 D1UDI Analyst Sales Supplier Side Female
31 30 D1UDI Manager Sales Supplier side Female
32 31 D1UDI Analyst Sales Supplier side Female
33 32 D1UDI Analyst Sales Supplier side Female
34 33 Cosmetics 3 Manager Purchasing Buyer Side Male
35 34 7SOL Director Sales Supplier side Male
36 35 PAN Director Operations Supplier Side Male
37 36 ECARI Small Businnes Owner Services Buyer Side Female
38 37 Cosmetics 2 Manager R&D Buyer Side Female
39 38 BSF Manager Sales Supplier Side Male
40 39 Cosmetics 3 Manager R&D Buyer Side Male
41 40 Cosmetics 3 Director Supply Chain Buyer Side Male
42 41_a BPK Comercial Representative Sales Supplier Side Female
43 41_b ASREP Comercial Representative Sales Supplier Side Female
44 42 ECUDI Esthetician Services Buyer Side Female
45 43 ECUDI Esthetician Services Buyer Side Female
46 44 BD Director Sales Supplier Side Female
47 45 D2ES Small Businnes Owner Franchising Buyer Side Female
48 46 D1BH Small Businnes Owner Franchising Buyer Side Female

302
Informa
nt Firm Job Titles Department Position in the Firm Gender
49 47 AL Director Innovation Supplier Side Male
50 48 D1BA Small Businnes Owner Franchising Buyer Side Male
51 49 Cosmetics 4 Manager Human Resources Administrative Male
52 50 ASS Director Legal Supplier Side Female
53 51_a Cosmetics 4 Analyst Purchasing Buyer Side Male
54 51_b AQ Manager Purchasing Buyer Side Male
55 52 ASREP Comercial Representative Sales Supplier Side Male
56 53 D1SO Small Businnes Owner Franchising Buyer Side Female
57 54 D1UDI Small Businnes Owner Franchising Buyer Side Male
58 55 Aqia Manager Sales Supplier Side Female
59 56 PHY President Strategy Strategy Male
60 57 Cosmetics 1 Manager Quality Buyer Side Male
61 58 SEC CEO Strategy Supplier side Male
62 59 SEC Manager Purchasing Buyer Side Female
63 60 Cosmetics 4 Analyst Purchasing Buyer Side Male
64 61 ECES Esthetician Services Buyer Side Female
65 62_a STRT President Strategy Strategy Male
66 62_b Cosmetics 2 President Strategy Strategy Male
67 63 Cosmetics 4 Manager Innovation Buyer Side Male
68 64 Cosmetics 3 Manager Franchising Supplier Side Female
69 65 B2BSB Small Businnes Owner Franchising Strategy Female
70 66 B2UDI Manager Operations Supplier Side Female
71 67 CHR Director Sales Supplier Side Male
72 68 D2SC Small Businnes Owner Franchising Buyer Side Female
73 69 ENG CEO Strategy Supplier Side Male
74 70_a JM Comercial Representative Sales Supplier Side Male

303
Informa
nt Firm Job Titles Department Position in the Firm Gender
75 70_b BP Comercial Represent. Sales Supplier Side Male
76 71 MAN Farmer Farming Supplier Side Male
77 72 SBELL Farmer Farming Supplier Side Male
78 73 ECARI Esthetician Services Buyer Side Female
79 74 SLB Manager Purchasing Buyer Side Male
80 75 SLB Manager R&D Buyer Side Male
81 76 Dermo 2 Analyst Marketing Supplier Side Female
82 77_a EUD Manager Marketing Buyer Side Male
83 77_b Cosmetics 3 Manager Marketing Buyer Side Male
84 78 Cosmetics 3 Manager Marketing Intelligence Supplier Side Male
85 79 ERV Farmer Farming Supplier side Female
86 80_a DC Comercial Represent. Sales Supplier Side Female
87 80_b SEC Analyst Sales Supplier Side Female
88 81 Cosmetics 4 Manager Marketing Supplier Side Female
89 82 SLB Manager Marketing Supplier Side Female
90 83_a MAP CEO Strategy Strategy Male
91 83_b CGN Consultant Legal Buyer Side Male
92 84 FNCUST_G Final Customer Final Customer Buyer Side Female
93 85 Final Customer Final Customer Final Customer Buyer Side Female
94 86 Final Customer Final Customer Final Customer Buyer side Female
95 87 DC Manager Supply Chain Buyer side Female
96 88 D1ST Small Businnes Owner Franchising Buyer Side Male
97 89 STRT Manager Purchasing Buyer Side Male
98 90 Cosmetics 4 Vendor Sales Buyer Side Female
99 91 Cosmetics 4 Manager Sales Buyer Side Female
100 92 D1UDI Small Businnes Owner Franchising Buyer Side Female

304
Informa
nt Firm Job Titles Department Position in the Firm Gender
101 93 Cosmetics 2 Director R&D Strategy Female
102 94 ABH Consultant Legal Administrative Male
103 95 PRO Director Finance Supplier Side Male
104 96 PRO Director Sales Supplier Side Male
105 97 PRO Director R&D Supplier Side Male
106 98_a Cosmetics 4 Vendor Sales Buyer Side Female
107 98_b MKY Director Sales Buyer Side Female
108 99 GTP Director Operations Supplier Side Male
109 100 Cosmetics 4 Director Sales Supplier Side Female
110 101 Cosmetics 4 Manager Sales Supplier Side Female
111 102 Cosmetics 4 Vendor Sales Supplier Side Female
112 103 Cosmetics 3 Director Operations Buyer Side Male
113 104 Dermo 1 President Strategy Supplier Side Male
114 105 BRC Manager Sustainability Buyer Side Male
115 1001 Not Interviewed Previous contact in industry Indication Contact Side Male
116 1002 Not Interviewed Previous contact in industry Indication Contact Side Female
117 1003 Not Interviewed Previous contact in industry Indication Contact Side Female
118 1004 Not Interviewed Previous contact in industry Indication Contact Side Female
119 1005 Not Interviewed Previous contact in industry Indication Contact Side Female
120 1006 Not Interviewed Previous contact in industry Indication Contact Side Female
121 1007 Not Interviewed Previous contact in industry Indication Contact Side Female
122 1008 Not Interviewed Previous contact in industry Indication Contact Side Female
123 1009 Not Interviewed Previous contact in industry Indication Contact Side Female
124 1010 Not Interviewed Previous contact in industry Indication Contact Side Male

305
Appendix F: List of Fined Companies in “Operation New Direction II” by IBAMA
1. Age do Brasil indústria e Comércio
2. Amazon Secrets Cosméticos
3. Ambev – companhia de Bebida das Américas
4. Anidro do Brasil Exportações
5. Avon Industrial
6. Avon International Operations
7. Bayer
8. Beraca Sabará Químicos e Ingredientes
9. Biofarma Farmacêutica
10. Biolab Sanus Farmacêutica
11. Botica Coemrcial Farmacêutica
12. Casa Granado
13. Croda do Brasil
14. Dupont do Brasil
15. Eli Lilly do Brasil
16. Fluidos da Amazônia
17. Fundação Dom Aguirre
18. Galderma Brasil
19. Glaxosmithkline Brasil
20. Hypermarcas
21. L’oreal Brasil
22. Laboratório Sklean do Brasil
23. Laboratórios Pfizer
24. Mapric Produtos Farmacosméticos
25. Merck
26. Nazca Cosméticos Indústria e Comércio
27. Novartis
28. Petit Savon Indústria e Comércio
29. Produtos Roche Químicos e Farmacêuticos
30. Sabic Innovate Plastics South América
31. SS Comércio de Cosméticos e Higiene Pessoal
32. Unilever Brasil Industrial
33. Vedic Hindus Ind. Com. Imp. E Exp.
34. Vitaderm
35. Weleda
* Lei de Acesso
Para ter acesso à informação pública do governo federal, é preciso preencher um cadastro no
E-SIC (Sistema de Informação ao Cliente) e fazer um pedido formal, por meio de um
formulário online no site Acesso à Informação. Qualquer cidadão pode ter acesso aos dados.
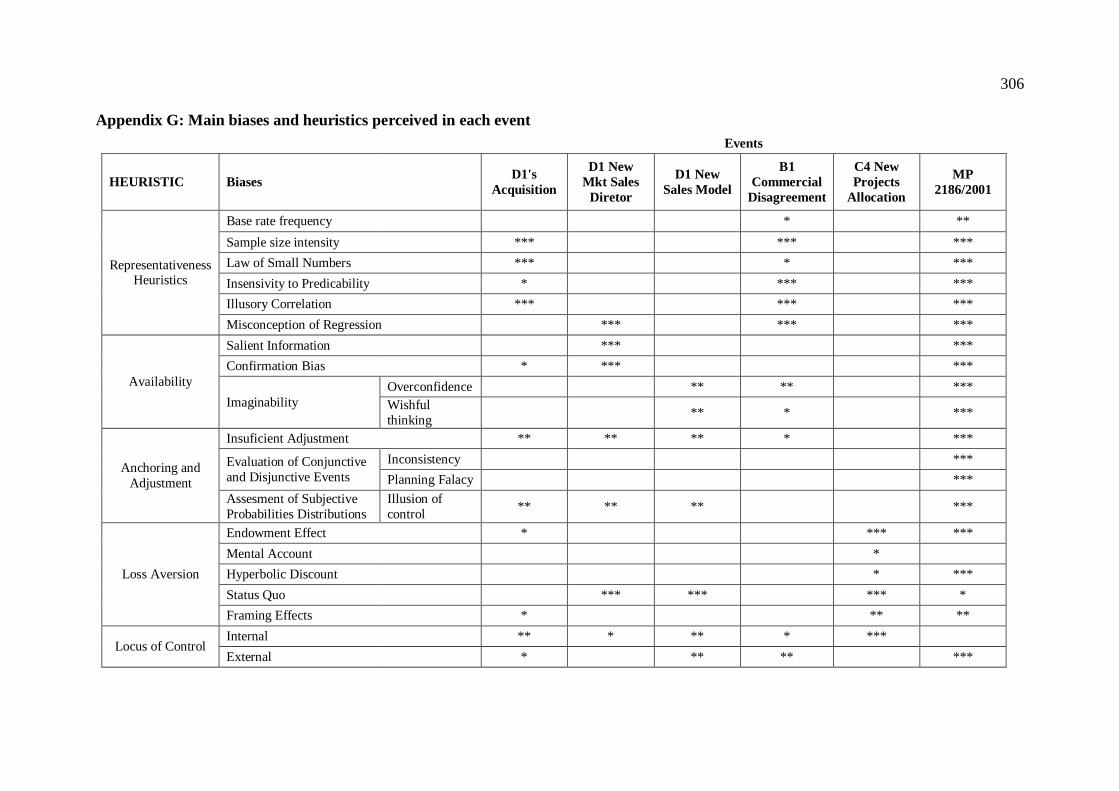
306
Appendix G: Main biases and heuristics perceived in each event
Events
HEURISTIC Biases D1's
Acquisition
D1 New
Mkt Sales
Diretor
D1 New
Sales Model
B1
Commercial
Disagreement
C4 New
Projects
Allocation
MP
2186/2001
Representativeness Heuristics
Base rate frequency * **
Sample size intensity *** *** ***
Law of Small Numbers *** * ***
Insensivity to Predicability * *** ***
Illusory Correlation *** *** ***
Misconception of Regression *** *** ***
Availability
Salient Information *** ***
Confirmation Bias * *** ***
Imaginability
Overconfidence ** ** ***
Wishful
thinking ** * ***
Anchoring and
Adjustment
Insuficient Adjustment ** ** ** * ***
Evaluation of Conjunctive
and Disjunctive Events
Inconsistency ***
Planning Falacy ***
Assesment of Subjective
Probabilities Distributions
Illusion of
control ** ** ** ***
Loss Aversion
Endowment Effect * *** ***
Mental Account *
Hyperbolic Discount * ***
Status Quo *** *** *** *
Framing Effects * ** **
Locus of Control Internal ** * ** * ***
External * ** ** ***