fusões & aquisições no brasil - kpmg | br · os estados unidos foram o país que mais...
TRANSCRIPT
kpmg
C o r p o r a t e F i n a n c e
Fusões & Aquisições no BrasilAnálise dos anos 90
Mergers & Acquisitions in BrazilAn analysis of the 90’s
kpmg
1994 – 2000
1994 – 2000
1992 – 2000
1994 – 2000
1993 – 2000
1998 – 2000
Sumário
Breves conclusões..........................................................3
Principais setores de investimento no
total das transações (anual) ....................................10
Participação dos principais países no total
das transações cross border (acumulado e anual) ....12Distribuição geográfica das transações
no Brasil (acumulado).............................................15
Evolução do número de transações ................................7
Ranking setorial de transações........................................8
Principais setores de investimento no
total das transações (acumulado) ..............................9
Contents
Executive summary ..................................................................3
Evolution by number of transactions..........................................7
Sector ranking of transactions...................................................8
Share of main investment sectors in the
total of transactions (accrued).............................................9
Share of main investment sectors in the
total of transactions (annual) ............................................10
Share of main country investors in the total
of cross border transactions (accrued and annual) .............12
Geographical distribution of transactions
in Brazil (accrued)............................................................15
2
Estudo inédito da KPMG Brasil faz uma análise da década de 90 e revela ainda um crescimento acumulado de 134%, no número de transações de fusões e aquisições no período.
O volume de transações envolvendo capital estrangeiro no Brasil, por meio de fusões e aquisições, cresceu mais de 44% ao longo da década de 90. Das 2.308 operações realizadas no período, 61% envolveram recursos estrangeiros. Esses são alguns dos resultados de um estudo inédito e detalhado realizado pela área de Corporate Finance da KPMG Brasil sobre o processo de Fusões e Aquisições ao longo da última década.
Os Estados Unidos foram o país que mais investiu no Brasil, seguido de França, Portugal e Espanha. O crescimento médio do período na soma geral, incluindo operações domésticas e cross border, foi de 13% ao ano. O crescimento acumulado do período chegou a 134%.
Para André Castello Branco, sócio da KPMG, a performance nacional nos últimos dez anos mostra que o Brasil, embora tenha iniciado o processo 20 anos depois dos Estados Unidos que já se encontram em outro estágio, o das megatransações , aprendeu rápido e está deixando de lado o estigma de país de terceiro mundo. ”O Brasil entrou de fato na rota dos investidores estrangeiros e hoje é muito bem visto internacionalmente”, enfatiza.
O setor de saneamento básico deve liderar o ranking das fusões e aquisições nos próximos anos. Este setor abrange um número significativo de empresas com possibilidades de passar para a iniciativa privada.
Capital estrangeiro em fusões e aquisiçõesaumentou mais de 44% na década de 90
Foreign capital in mergers and acquisitions has increased more than 44% during the 1990’s
An exclusive study by KPMG Brazil analyses the 90s decade and shows a 134% accumulated growth by number of transactions of mergers and acquisitions during the period.
The volume of transactions envolving foreign capitalin Brazil through merger and acquisition activity has grown more than 44% over the last decade. Of the 2.308 deals during that period, 61% of them involved foreign resources. These are some of the findings from the latest study done by the Corporate Finance area of KPMG Brazil covering the M&A process over the last decade.
The United States was the country that invested most in Brazil, followed by France, Portugal and Spain. The average growth in total transactions, including both domestic and cross border deals, totalled 13% per annum. The accumulated growth over the period reached 134%.
According to André Castello Branco, a partner at KPMG, even though Brazil has initiated its mergers and acquisitions process some 20 years after the United States, a country where today mega transactions take place, it has learned quickly and is leaving behind its third-world stigma. ”Brazil has entered the routeof foreign investors and is well considered internationally”, he emphasises.
The sewage & public waterworks sector should lead future mergers and acquisitions rankings in the upcoming years. This sector has a significant number of companies that have the potential to be privatized.
3
kpmg
Fatos da economia marcaram o ”boom” de alguns setoresO estudo da KPMG divide a década de 90 em três períodos marcados por fatos importantes ocorridos na economia. O primeiro, que vai até 1993, foi marcado pela abertura da economia. Pulverização, privatização, concentração e verticalização do mercado caracterizaram esses anos. Registraram-se grandes fusões e aquisições em setores considerados básicos, como produtos químicos e petroquímicos (22 negócios) e metalurgia e siderurgia (24).
A segunda fase, que vai de 1994 até 1997, teve como marcos o Plano Real e a presença expressiva de negócios nos segmentos financeiro (107 transações nos quatro anos), eletroeletrônico (53) e autopeças (42). Globalização, concentração e socorro a bancos em dificuldades foram a tônica do período. O ano de 1997 foi marcado pelo boom das fusões e aquisições no Brasil, com o recorde de 372 negócios realizados.
A última etapa vai de 1998 a 2000 e nela brilharam os setores mais avançados, como telecomunicações (104 transações) e tecnologia da informação (93). Conduzidos pelo próprio desenvolvimento, os setores publicitário e editorial ingressaram no ranking, somando 59 transações nos últimos três anos. O último período da década foi marcado também por globalização, privatizações, novas tecnologias e Internet.
A grande queda nas negociações, ao longo de todo o período estudado, ocorreu em 1999, ano em que todas as operações registradas somaram 309. A liberação do câmbio foi a grande responsável pelo fraco desempenho. Os investidores decidiram suspender ou adiar as negociações até a economia ficar mais estável. Já no segundo trimestre daquele ano, entretanto, os negócios foram retomados.
O resultado do ano 2000, quando o número de transações (353) volta a crescer, reflete uma economia estável e mostra, na avaliação dos especialistas da KPMG, que o Brasil entrou forte na rota dos investimentos estrangeiros.
Economic factors have caused a ”boom” in some sectorsKPMG’s study divides the 90’s in three periods, which were impacted by important economic events. The first, which ends in 1993, was impacted by the opening of the economy. Those years were characterised by decentralisation, followed by privatisation, concentration and verticalisation of the market. Large mergers and acquisitions were registered in basic industries, such as chemical and petrochemical products (22 deals), and metals and steel (24 deals).
The second period, ranging from 1994 to 1997, had as highlights the Real Plan and the significant importance of transactions held in the financial sector (107 transactions over the four years), electronics (53) and automobile parts (42). Globalisation, concentration and government aid to banks in financial distress were the tonic of the period. The boom in mergers and acquisitions in Brazil occurred in 1997, with a record of 372 transactions.
The last period, ranging from 1998 to 2000 was a time for more advanced industries, such as telecommunications (104 deals) and information technology (93). Due to the economic development, advertising and publishing houses entered the ranking, totalling 59 transactions during the three years. The decade's last period was impacted by globalisation, privatisation, new technologies and Internet.
Along the decade, the greatest drop in number of transactions occurred during 1999, a year where total transactions totalled 309. The currency devaluation was one of the main factors responsible for the weak performance, as investors preferred to suspend or postpone negotiations until the economy returned to a more stabilised scenario. However, during the second quarter of 1999, negotiations were resumed.
The result of 2000, when the number of transactions (353) again grew, points to a stable economy and indicates, according to an evaluation from KPMG specialists, that Brazil has certainly returned to the foreigners' investment route.
4
kpmg
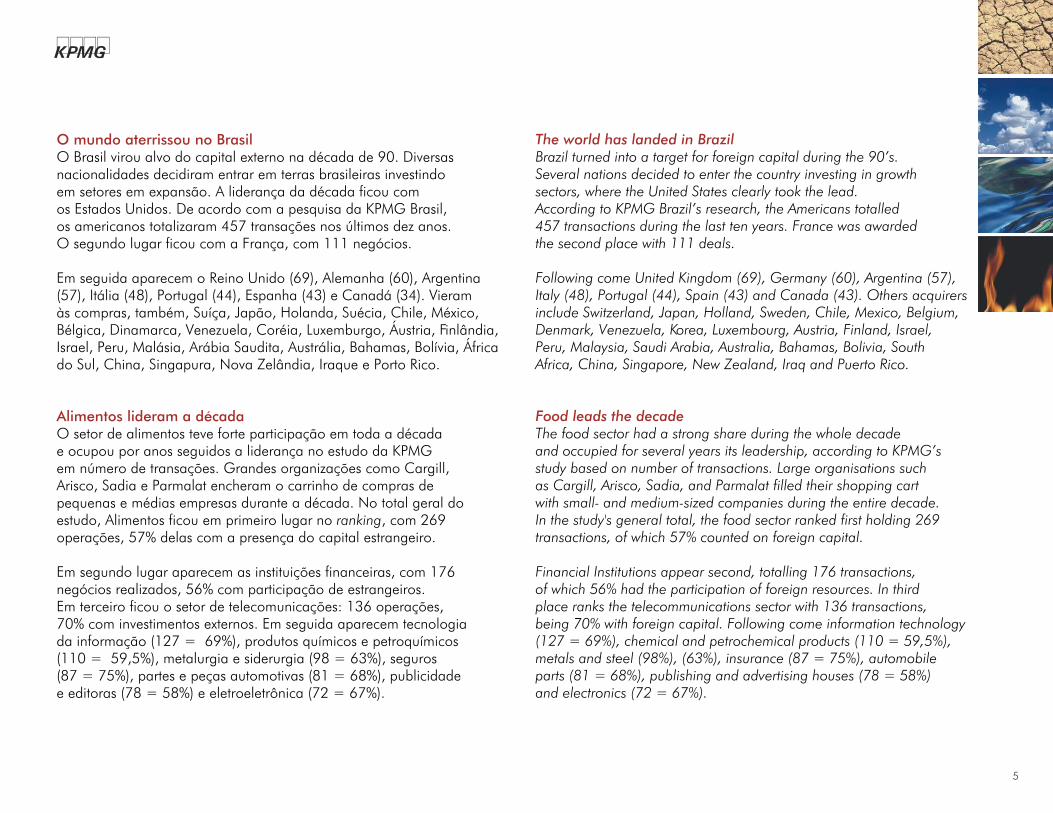
O mundo aterrissou no Brasil
Alimentos lideram a década
O Brasil virou alvo do capital externo na década de 90. Diversas nacionalidades decidiram entrar em terras brasileiras investindo em setores em expansão. A liderança da década ficou com os Estados Unidos. De acordo com a pesquisa da KPMG Brasil, os americanos totalizaram 457 transações nos últimos dez anos. O segundo lugar ficou com a França, com 111 negócios.
Em seguida aparecem o Reino Unido (69), Alemanha (60), Argentina (57), Itália (48), Portugal (44), Espanha (43) e Canadá (34). Vieram às compras, também, Suíça, Japão, Holanda, Suécia, Chile, México, Bélgica, Dinamarca, Venezuela, Coréia, Luxemburgo, Áustria, Finlândia, Israel, Peru, Malásia, Arábia Saudita, Austrália, Bahamas, Bolívia, África do Sul, China, Singapura, Nova Zelândia, Iraque e Porto Rico.
O setor de alimentos teve forte participação em toda a década e ocupou por anos seguidos a liderança no estudo da KPMG em número de transações. Grandes organizações como Cargill, Arisco, Sadia e Parmalat encheram o carrinho de compras de pequenas e médias empresas durante a década. No total geral do estudo, Alimentos ficou em primeiro lugar no ranking, com 269 operações, 57% delas com a presença do capital estrangeiro.
Em segundo lugar aparecem as instituições financeiras, com 176 negócios realizados, 56% com participação de estrangeiros. Em terceiro ficou o setor de telecomunicações: 136 operações, 70% com investimentos externos. Em seguida aparecem tecnologia da informação (127 = 69%), produtos químicos e petroquímicos(110 = 59,5%), metalurgia e siderurgia (98 = 63%), seguros (87 = 75%), partes e peças automotivas (81 = 68%), publicidade e editoras (78 = 58%) e eletroeletrônica (72 = 67%).
The world has landed in Brazil
Food leads the decade
Brazil turned into a target for foreign capital during the 90’s. Several nations decided to enter the country investing in growth sectors, where the United States clearly took the lead. According to KPMG Brazil’s research, the Americans totalled 457 transactions during the last ten years. France was awarded the second place with 111 deals.
Following come United Kingdom (69), Germany (60), Argentina (57), Italy (48), Portugal (44), Spain (43) and Canada (43). Others acquirers include Switzerland, Japan, Holland, Sweden, Chile, Mexico, Belgium, Denmark, Venezuela, Korea, Luxembourg, Austria, Finland, Israel, Peru, Malaysia, Saudi Arabia, Australia, Bahamas, Bolivia, South Africa, China, Singapore, New Zealand, Iraq and Puerto Rico.
The food sector had a strong share during the whole decade and occupied for several years its leadership, according to KPMG’s study based on number of transactions. Large organisations such as Cargill, Arisco, Sadia, and Parmalat filled their shopping cart with small- and medium-sized companies during the entire decade. In the study's general total, the food sector ranked first holding 269 transactions, of which 57% counted on foreign capital.
Financial Institutions appear second, totalling 176 transactions, of which 56% had the participation of foreign resources. In third place ranks the telecommunications sector with 136 transactions, being 70% with foreign capital. Following come information technology (127 = 69%), chemical and petrochemical products (110 = 59,5%), metals and steel (98%), (63%), insurance (87 = 75%), automobile parts (81 = 68%), publishing and advertising houses (78 = 58%) and electronics (72 = 67%).
5
kpmg
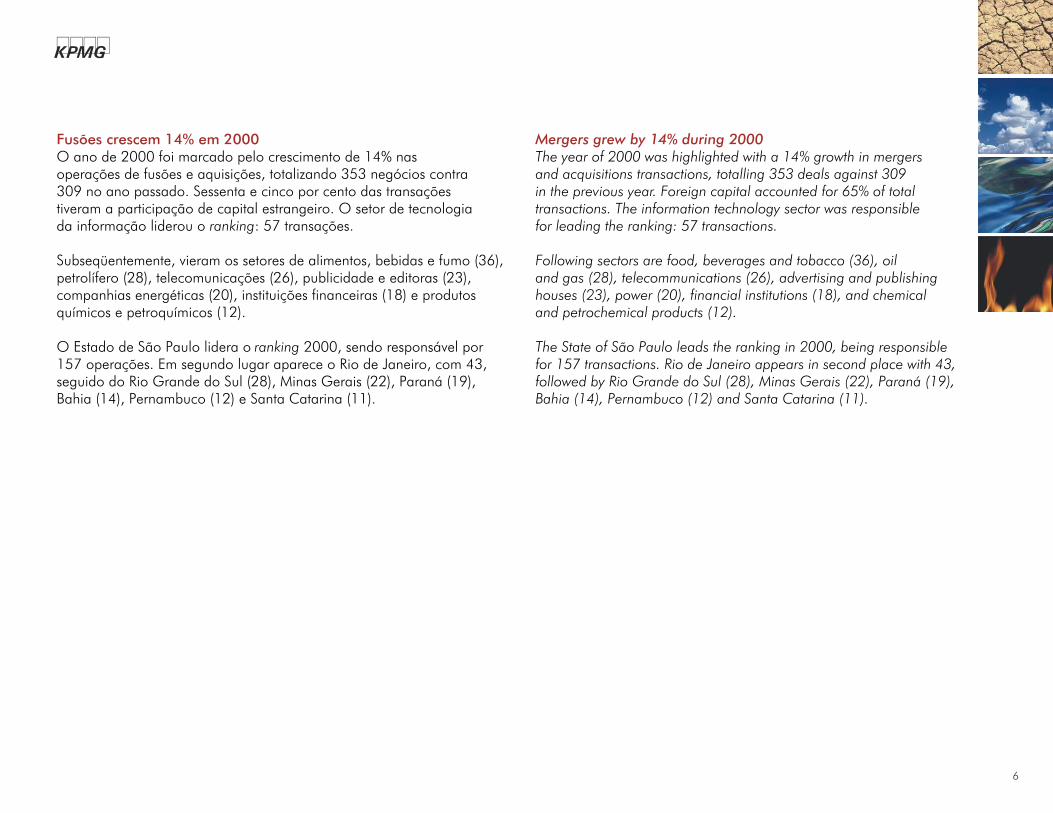
Fusões crescem 14% em 2000O ano de 2000 foi marcado pelo crescimento de 14% nas operações de fusões e aquisições, totalizando 353 negócios contra 309 no ano passado. Sessenta e cinco por cento das transações tiveram a participação de capital estrangeiro. O setor de tecnologia da informação liderou o ranking: 57 transações. Subseqüentemente, vieram os setores de alimentos, bebidas e fumo (36), petrolífero (28), telecomunicações (26), publicidade e editoras (23), companhias energéticas (20), instituições financeiras (18) e produtos químicos e petroquímicos (12).
O Estado de São Paulo lidera o ranking 2000, sendo responsável por 157 operações. Em segundo lugar aparece o Rio de Janeiro, com 43, seguido do Rio Grande do Sul (28), Minas Gerais (22), Paraná (19), Bahia (14), Pernambuco (12) e Santa Catarina (11).
Mergers grew by 14% during 2000The year of 2000 was highlighted with a 14% growth in mergers and acquisitions transactions, totalling 353 deals against 309 in the previous year. Foreign capital accounted for 65% of total transactions. The information technology sector was responsible for leading the ranking: 57 transactions.
Following sectors are food, beverages and tobacco (36), oil and gas (28), telecommunications (26), advertising and publishing houses (23), power (20), financial institutions (18), and chemical and petrochemical products (12).
The State of São Paulo leads the ranking in 2000, being responsible for 157 transactions. Rio de Janeiro appears in second place with 43, followed by Rio Grande do Sul (28), Minas Gerais (22), Paraná (19), Bahia (14), Pernambuco (12) and Santa Catarina (11).
6
kpmg
0 50 100 150 200 250 300 350 400
1994
1995
1996
1997
1998
1999
2000
175
212
351
328
372
309
353
81
94
82
130
161
167
168
204
130
221
101
208
123
230
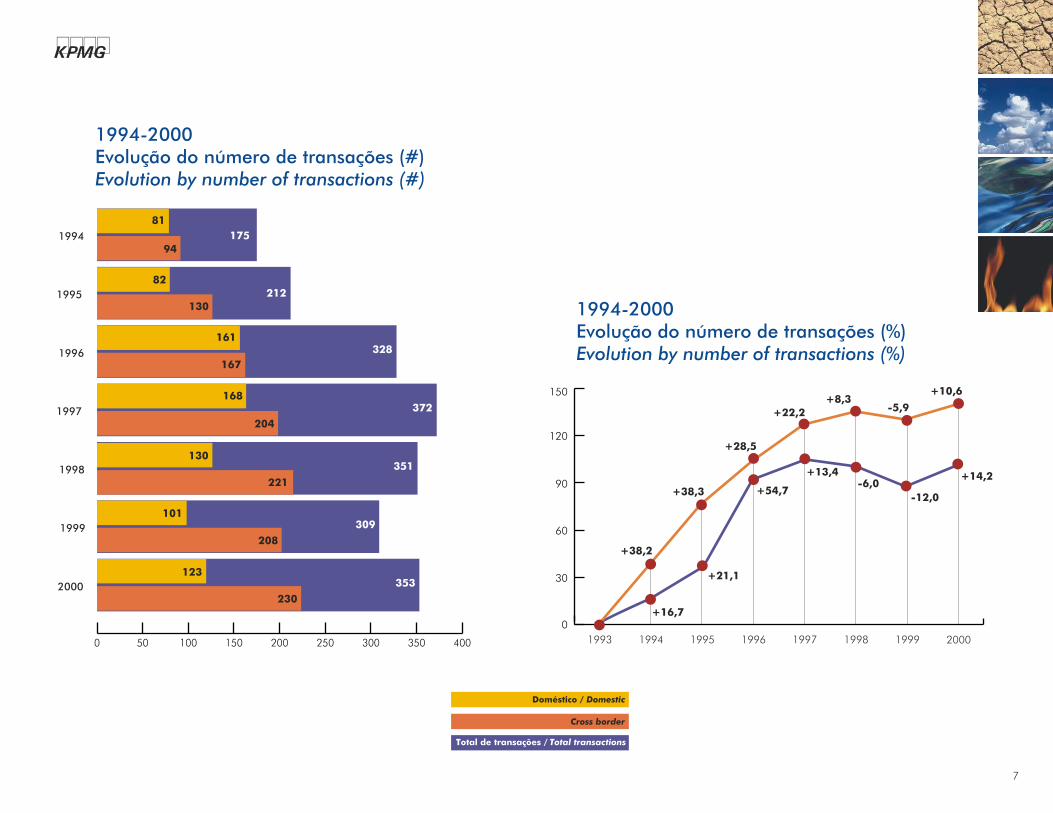
1994-2000Evolução do número de transações (#)Evolution by number of transactions (#)
Doméstico / Domestic
Cross border
Total de transações / Total transactions
7
120
150
0
30
60
90
1993 1994 1995 1996 1997 1998 1999 2000
+38,2
+16,7
+38,3
+28,5
+22,2
+8,3-5,9
+10,6
+21,1
+54,7
+13,4-6,0
-12,0
+14,2
kpmg
1994-2000Evolução do número de transações (%)Evolution by number of transactions (%)
1994-2000
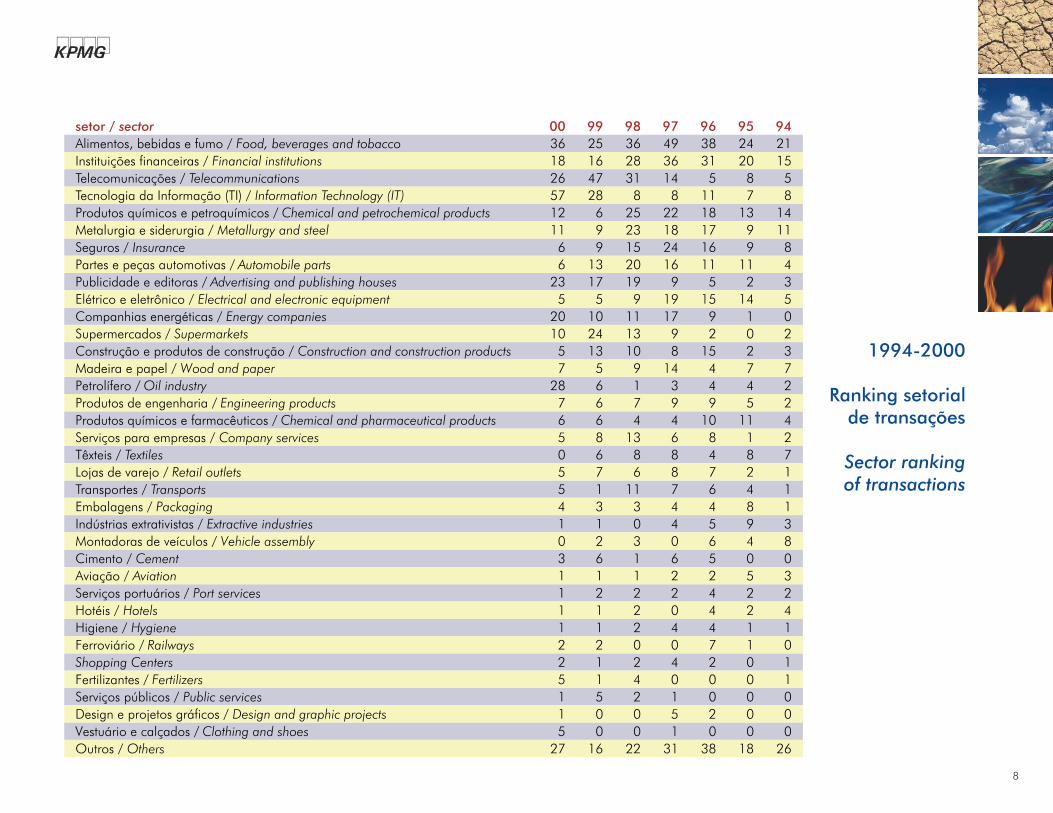
Ranking setorialde transações
Sector rankingof transactions
setor / sector 00 99 98 97 96 95 94
Alimentos, bebidas e fumo / Food, beverages and tobacco 36 25 36 49 38 24 21
Instituições financeiras / Financial institutions 18 16 28 36 31 20 15
Telecomunicações / Telecommunications 26 47 31 14 5 8 5
Tecnologia da Informação (TI) / Information Technology (IT) 57 28 8 8 11 7 8
Produtos químicos e petroquímicos / Chemical and petrochemical products 12 6 25 22 18 13 14
Metalurgia e siderurgia / Metallurgy and steel 11 9 23 18 17 9 11
Seguros / Insurance 6 9 15 24 16 9 8
Partes e peças automotivas / Automobile parts 6 13 20 16 11 11 4
Publicidade e editoras / Advertising and publishing houses 23 17 19 9 5 2 3
Elétrico e eletrônico / Electrical and electronic equipment 5 5 9 19 15 14 5
Companhias energéticas / Energy companies 20 10 11 17 9 1 0
Supermercados / Supermarkets 10 24 13 9 2 0 2
Construção e produtos de construção / Construction and construction products 5 13 10 8 15 2 3
Madeira e papel / Wood and paper 7 5 9 14 4 7 7
Petrolífero / Oil industry 28 6 1 3 4 4 2
Produtos de engenharia / Engineering products 7 6 7 9 9 5 2
Produtos químicos e farmacêuticos / Chemical and pharmaceutical products 6 6 4 4 10 11 4
Serviços para empresas / Company services 5 8 13 6 8 1 2
Têxteis / Textiles 0 6 8 8 4 8 7
Lojas de varejo / Retail outlets 5 7 6 8 7 2 1
Transportes / Transports 5 1 11 7 6 4 1
Embalagens / Packaging 4 3 3 4 4 8 1
Indústrias extrativistas / Extractive industries 1 1 0 4 5 9 3
Montadoras de veículos / Vehicle assembly 0 2 3 0 6 4 8
Cimento / Cement 3 6 1 6 5 0 0
Aviação / Aviation 1 1 1 2 2 5 3
Serviços portuários / Port services 1 2 2 2 4 2 2
Hotéis / Hotels 1 1 2 0 4 2 4
Higiene / Hygiene 1 1 2 4 4 1 1
Ferroviário / Railways 2 2 0 0 7 1 0
Shopping Centers 2 1 2 4 2 0 1
Fertilizantes / Fertilizers 5 1 4 0 0 0 1
Serviços públicos / Public services 1 5 2 1 0 0 0
Design e projetos gráficos / Design and graphic projects 1 0 0 5 2 0 0
Vestuário e calçados / Clothing and shoes 5 0 0 1 0 0 0
Outros / Others 27 16 22 31 38 18 26
8
kpmg
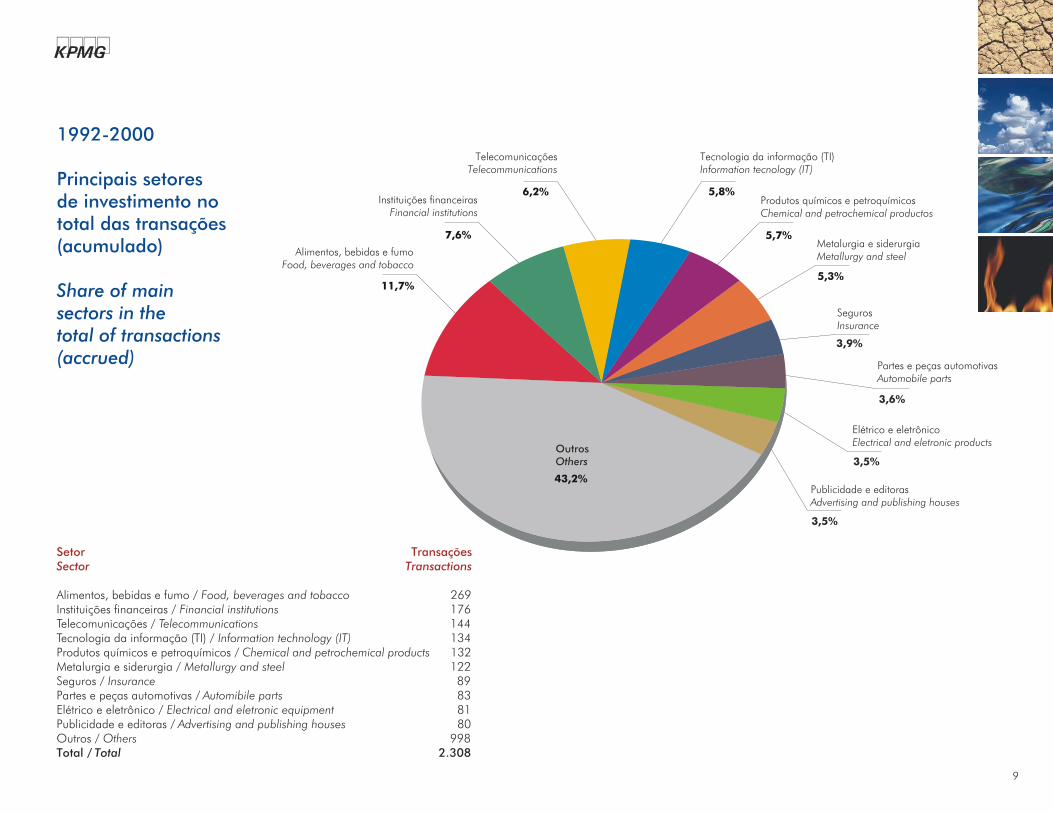
1992-2000
Principais setoresde investimento no total das transações (acumulado)
Share of main sectors in the total of transactions (accrued)
Setor Transações Sector Transactions
Alimentos, bebidas e fumo / Food, beverages and tobacco 269 Instituições financeiras / Financial institutions 176 Telecomunicações / Telecommunications 144 Tecnologia da informação (TI) / Information technology (IT) 134 Produtos químicos e petroquímicos / Chemical and petrochemical products 132 Metalurgia e siderurgia / Metallurgy and steel 122 Seguros / Insurance 89 Partes e peças automotivas / Automibile parts 83 Elétrico e eletrônico / Electrical and eletronic equipment 81 Publicidade e editoras / Advertising and publishing houses 80 Outros / Others 998 Total / Total 2.308
11,7%
7,6% 5,7%
6,2% 5,8%
5,3%
3,9%
3,6%
3,5%
3,5%
Alimentos, bebidas e fumoFood, beverages and tobacco
Instituições financeirasFinancial institutions
TelecomunicaçõesTelecommunications
Tecnologia da informação (TI)Information tecnology (IT)
Produtos químicos e petroquímicosChemical and petrochemical productos
Metalurgia e siderurgiaMetallurgy and steel
SegurosInsurance
Partes e peças automotivasAutomobile parts
Elétrico e eletrônicoElectrical and eletronic products
Publicidade e editorasAdvertising and publishing houses
43,2%
OutrosOthers
9
kpmg
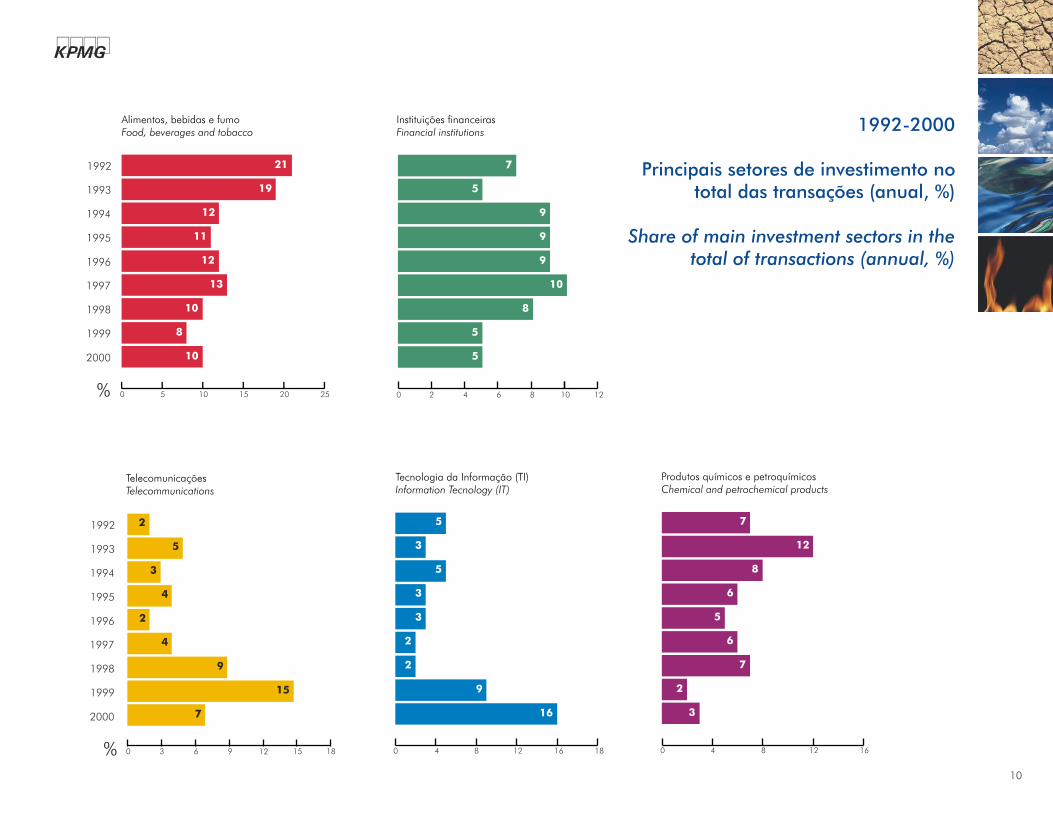
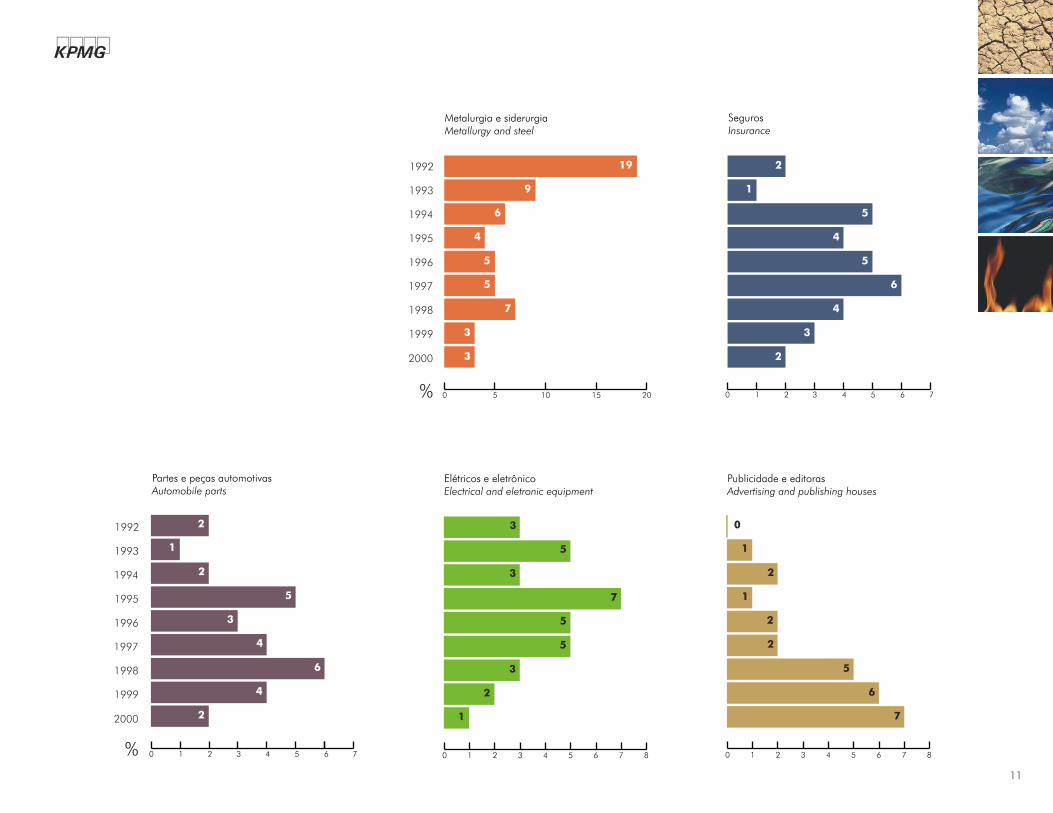
1992-2000
Principais setores de investimento no total das transações (anual, %)
Share of main investment sectors in the total of transactions (annual, %)
Instituições financeiras Financial institutions
7
5
9
10
8
9
9
5
5
0 2 4 6 8 10 12
Produtos químicos e petroquímicos Chemical and petrochemical products
7
12
8
6
7
6
5
2
3
0 4 8 12 16
Alimentos, bebidas e fumo Food, beverages and tobacco
21
19
12
11
13
10
8
12
10
1992
1993
1994
1995
1996
1997
1998
1999
2000
0 5 10 15 20 25%
Telecomunicações Telecommunications
2
5
3
4
9
4
2
15
7
0 3 6 9 12 15 18
Tecnologia da Informação (TI)Information Tecnology (IT)
5
3
5
2
2
3
3
9
16
0 4 8 12 16 18
1992
1993
1994
1995
1996
1997
1998
1999
2000
%
10
kpmg
1992
1993
1994
1995
1996
1997
1998
1999
Metalurgia e siderurgia Metallurgy and steel
0 5 10 15 20
19
9
6
5
7
4
5
3
3
Elétricos e eletrônico Electrical and eletronic equipment
0 1 2 3 4 5 6 7 8
3
5
3
5
3
7
5
2
1
0 1 2 3 4 5 6 7 8
Publicidade e editoras Advertising and publishing houses
0
1
2
2
5
1
2
6
7
Seguros Insurance
0 1 2 3 4 5 6 7
2
1
5
6
4
4
5
3
2
1992
1993
1994
1995
1996
1997
1998
1999
2000
Partes e peças automotivas Automobile parts
2
1
2
4
6
5
3
4
2
0 1 2 3 4 5 6 7
11
2000
%
%
kpmg
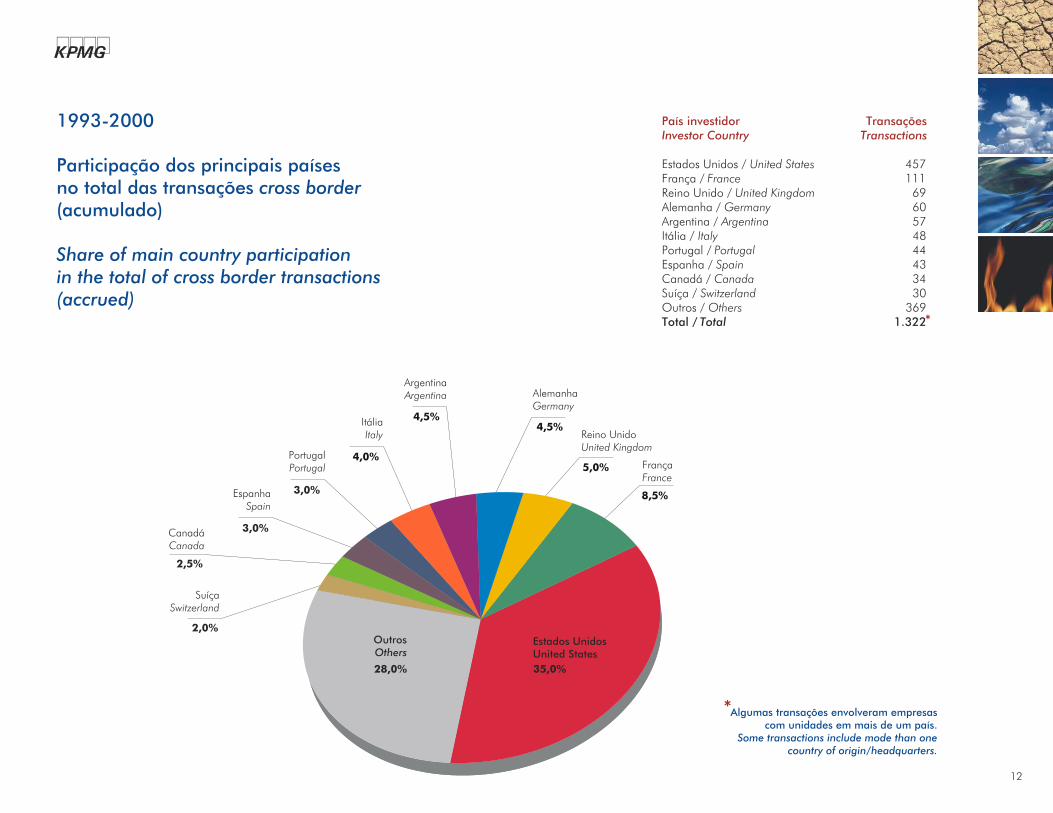
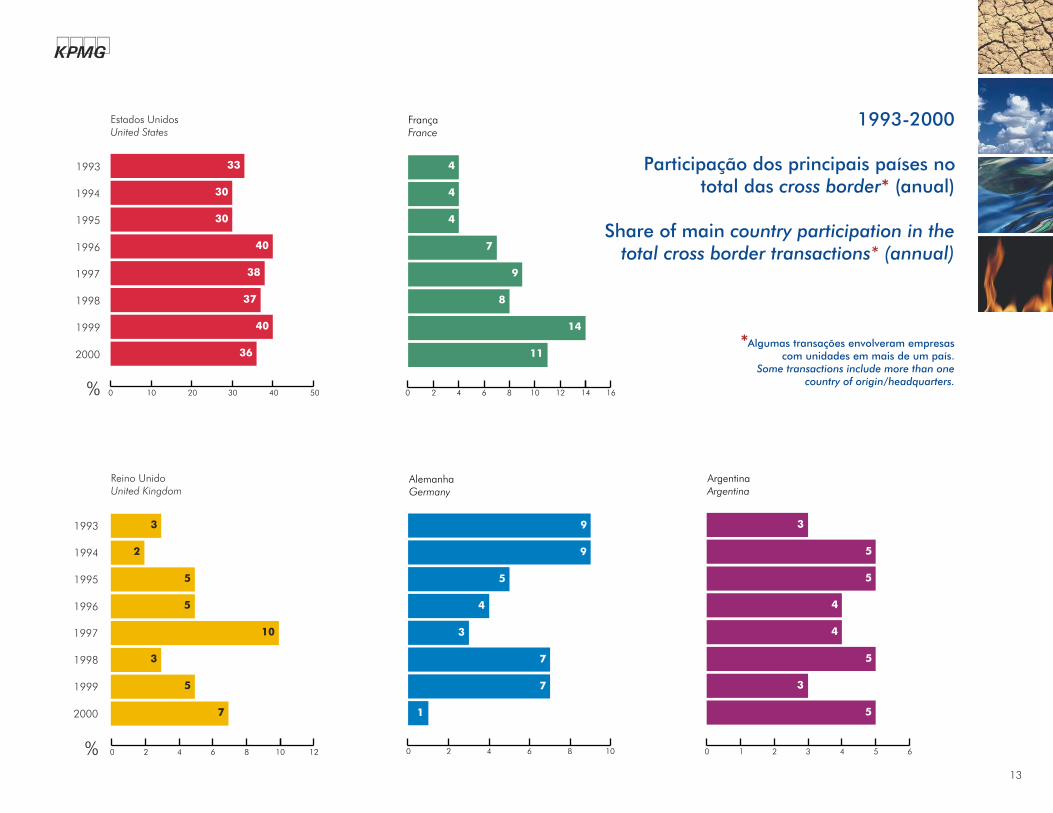
1993-2000
Participação dos principais países no total das transações cross border (acumulado)
Share of main country participationin the total of cross border transactions (accrued)
País investidor TransaçõesInvestor Country Transactions
Estados Unidos / United States 457França / France 111Reino Unido / United Kingdom 69Alemanha / Germany 60Argentina / Argentina 57Itália / Italy 48Portugal / Portugal 44Espanha / Spain 43Canadá / Canada 34Suíça / Switzerland 30Outros / Others 369Total / Total 1.322
8,5%
5,0%
4,5%4,5%
4,0%
3,0%
3,0%
2,5%
2,0%
28,0%
OutrosOthers
35,0%
Estados UnidosUnited States
FrançaFrance
Reino UnidoUnited Kingdom
AlemanhaGermany
ArgentinaArgentina
ItáliaItaly
PortugalPortugal
EspanhaSpain
CanadáCanada
SuíçaSwitzerland
12
kpmg
Algumas transações envolveram empresas com unidades em mais de um país.
Some transactions include mode than one country of origin/headquarters.
*
*
9
0 2 4 6 8 10
AlemanhaGermany
9
5
7
4
3
7
1
1993
1994
1995
1996
1997
1998
1999
2000
0 10 20 30 40 50
Estados UnidosUnited States
33
30
30
37
40
38
40
36
0 2 4 6 8 10 12 14 16
FrançaFrance
4
4
4
8
7
9
14
11
0 1 2 3 4 5
ArgentinaArgentina
3
5
5
5
4
4
3
5
6
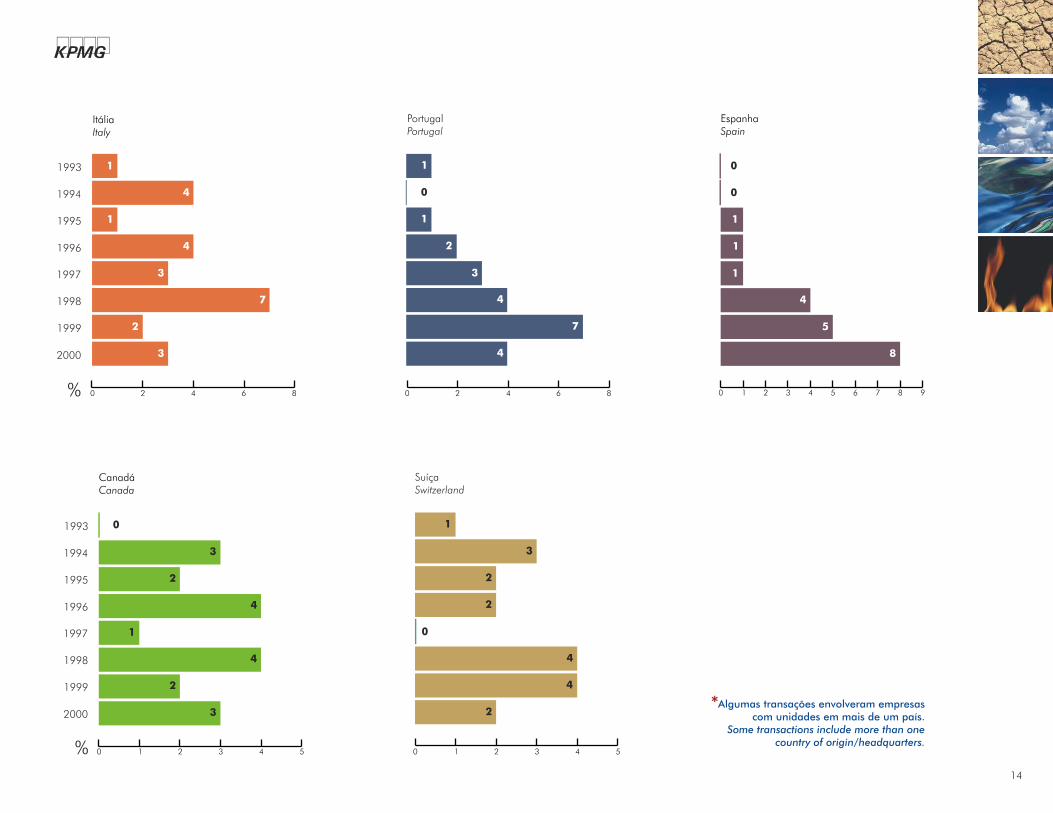
1993-2000
Participação dos principais países no total das cross border (anual)
Share of main country participation in the total cross border transactions (annual)
*
*
13
%
0 2 4 6 8 10 12
Reino UnidoUnited Kingdom
3
2
5
3
5
5
7
10
1993
1994
1995
1996
1997
1998
1999
2000
%
kpmg
Algumas transações envolveram empresas com unidades em mais de um país.
Some transactions include more than one country of origin/headquarters.
*
0 2 4 6 8
PortugalPortugal
1
0
1
4
2
3
7
4
1993
1994
1995
1996
1997
1998
1999
2000
0 2 4 6 8
ItáliaItaly
1
4
1
7
4
3
2
3
0 1 2 3 4 5 6 7 8
EspanhaSpain
0
0
1
4
1
1
5
8
9
5
1
3
2
4
2
0
4
2
0 1 2 3 4
SuíçaSwitzerland
14
Algumas transações envolveram empresas com unidades em mais de um país.
Some transactions include more than one country of origin/headquarters.
%
0 1 2 3 4 5
CanadáCanada
1993
1994
1995
1996
1997
1998
1999
2000
0
3
2
4
4
1
2
3
%
kpmg
*
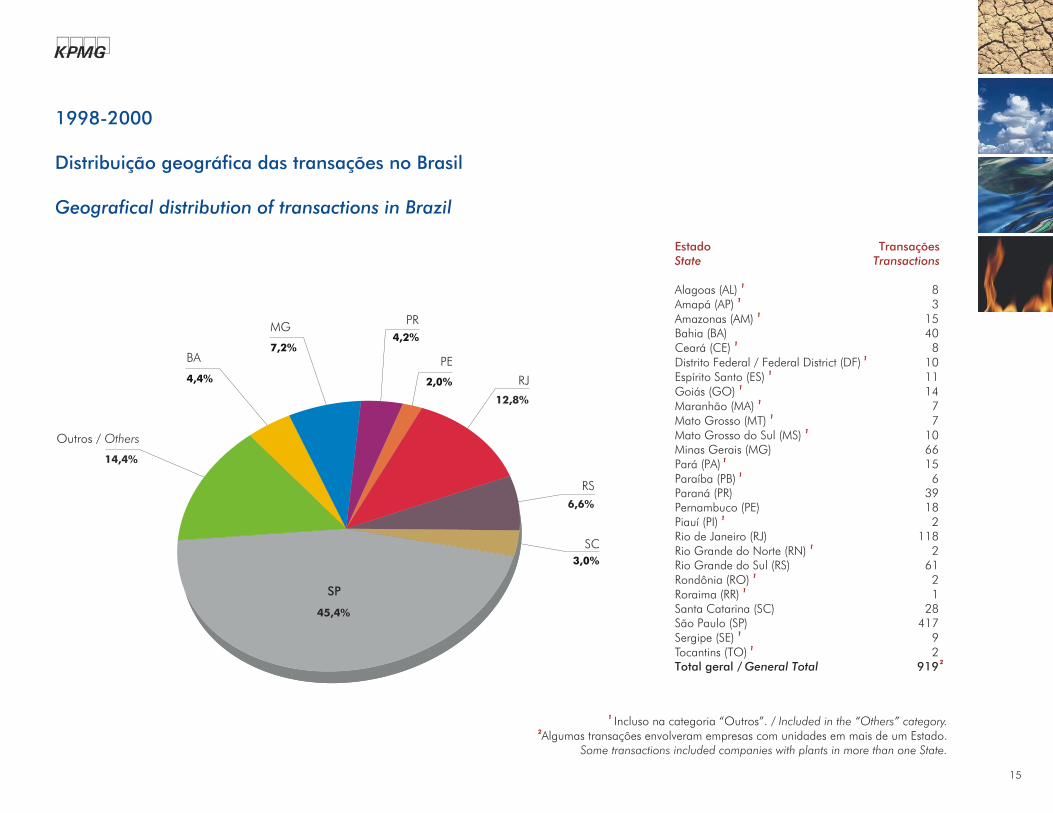
1998-2000
Distribuição geográfica das transações no Brasil
Geografical distribution of transactions in Brazil
Estado TransaçõesState Transactions
1
1
1
1
1
1
1
1
1
1
1
1
1
1
1
1
1
1
Alagoas (AL) 8Amapá (AP) 3Amazonas (AM) 15Bahia (BA) 40Ceará (CE) 8Distrito Federal / Federal District (DF) 10Espírito Santo (ES) 11Goiás (GO) 14Maranhão (MA) 7Mato Grosso (MT) 7Mato Grosso do Sul (MS) 10Minas Gerais (MG) 66Pará (PA) 15Paraíba (PB) 6Paraná (PR) 39Pernambuco (PE) 18Piauí (PI) 2Rio de Janeiro (RJ) 118Rio Grande do Norte (RN) 2Rio Grande do Sul (RS) 61Rondônia (RO) 2Roraima (RR) 1Santa Catarina (SC) 28São Paulo (SP) 417Sergipe (SE) 9Tocantins (TO) 2Total geral / General Total 919
2
1
2
Incluso na categoria “Outros”. / Included in the “Others” category.
Algumas transações envolveram empresas com unidades em mais de um Estado. Some transactions included companies with plants in more than one State.
PR
45,4%
4,4%
7,2% 4,2%
2,0%
12,8%
6,6%
3,0%
14,4%
Outros / Others
BA
MG
PE
RJ
RS
SC
SP
15
kpmg
Contatos / ContactsDavid Bunce
André L. Castello Branco
Márcio J. S. Lutterbach
José Luiz Saicali
www.kpmg.com.br
tel 55 (11) 3067.1570fax 55 (11) 3067.1649
Esta pesquisa foi desenvolvida pela KPMG Corporate Finance.Permitida a reprodução, desde que citada a fonte.This research was undertaken by KPMG Corporate Finance.Reproduction is permitted provided the source is quoted.Published by KPMG Corporate Finance, the Brazilian member firm of KPMG International, a Swiss association. February, 2001.Design & production: Índice de Comunicação
kpmg
16