fisiologia tÉrmica e vulnerabilidade dos lagartos da...
TRANSCRIPT
Museu Paraense Emílio Goeldi
Universidade Federal do Pará
Programa de Pós-Graduação em Zoologia
Curso de Mestrado em Zoologia
FISIOLOGIA TÉRMICA E VULNERABILIDADE DOS LAGARTOS DA AMAZÔNIA
(REPTILIA: SQUAMATA) FRENTE ÀS MUDANÇAS CLIMÁTICAS
LUISA MARIA VIEGAS BECERRA URTIAGA
Belém – PA
2017
LUISA MARIA VIEGAS BECERRA URTIAGA
FISIOLOGIA TÉRMICA E VULNERABILIDADE DOS LAGARTOS DA AMAZÔNIA
FRENTE ÀS MUDANÇAS CLIMÁTICAS (REPTILIA: SQUAMATA)
Belém – PA
2017
Dissertação apresentada ao Programa de Pós-
Graduação em Zoologia do convênio Universidade
Federal do Pará e Museu Paraense Emilio Goeldi,
para obtenção do título de mestre em zoologia.
Orientador: Dr. Helder Lima de Queiróz
Co-Orientadora: Dra. Teresa Cristina Ávila Pires

ii
“Sapere Aude!”
iii
Agradecimentos
À Capes pela concessão da bolsa de pesquisa;
Ao Helder Lima de Queiroz pela orientação;
À Teresa Cristina Ávila-Pires, por me inspirar, por acreditar em mim, por confiar no meu trabalho
e estar sempre disponível para conversar e me ajudar a ser uma pessoa melhor dentro e fora da
academia;
Ao Barry Sinervo pelo eterno entusiasmo para com a luta contra as extinções dos lagartos frente
às mudanças climáticas, por me receber de braços abertos na sua equipe de pesquisadores e por
todas as sugestões que enriqueceram imensamente o projeto;
À todos da equipe coordenada pelo Barry que, de alguma forma, contribuíram com a construção
do meu conhecimento e amadurecimento profissional, seja me auxiliando em campo, com as
análises ou me estimulando a pensar de maneira crítica: Carla Sette, Donald Miles, Fernanda
Werneck, Gabriel Caetano, Guarino Colli e Juan Santos;
À todos do laboratório de Herpetologia do Museu Paraense Emílio Goeldi pela hospitalidade
nestes dois anos de mestrado;
Aos meus amigos do Rio de Janeiro, que me apoiaram na decisão de vir para Belém e sempre se
mantiveram presentes, mesmo com a distância;
Aos amigos que fiz em Belém, por me fazerem sentir em casa nessa cidade acolhedora;
Ao meu amor, Elias Nunes de Aragão, por ser meu porto seguro, me impulsionar a ir além e sempre
acreditar em mim, até quando eu mesma pensei em deixar de acreditar;
À família Nunes Aragão, que me acolheu como sendo da família desde o primeiro momento;
À minha família, por todo o apoio e estímulo para que eu seguisse meu sonho de criança e me
tornasse uma profissional realizada! Sem vocês eu não seria metade do que sou hoje.
Obrigada!
iv
“Dedico esse trabalho a minha avó Leila Diele
Viegas (in memorian), por ser a maior inspiração
da minha vida. É tudo por ela e para ela, e assim
será sempre.”
v
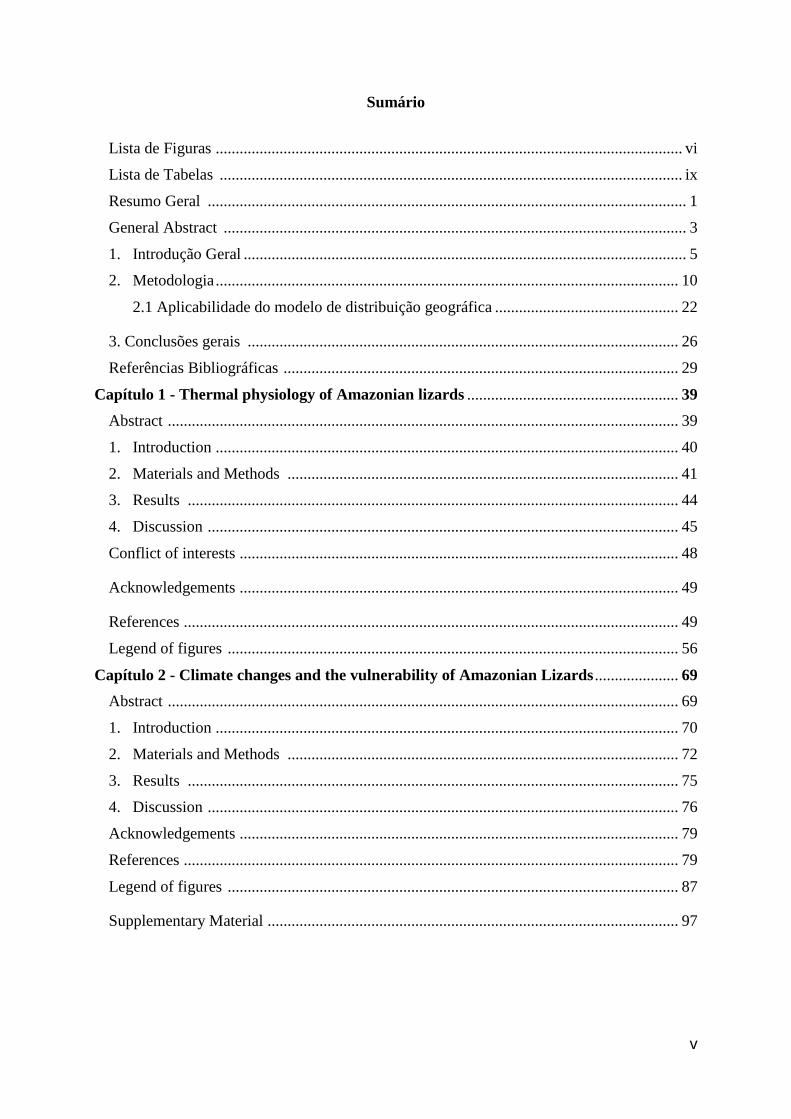
Sumário
Lista de Figuras ..................................................................................................................... vi
Lista de Tabelas .................................................................................................................... ix
Resumo Geral ........................................................................................................................ 1
General Abstract .................................................................................................................... 3
1. Introdução Geral ............................................................................................................... 5
2. Metodologia .................................................................................................................... 10
2.1 Aplicabilidade do modelo de distribuição geográfica .............................................. 22
3. Conclusões gerais ............................................................................................................ 26
Referências Bibliográficas ................................................................................................... 29
Capítulo 1 - Thermal physiology of Amazonian lizards ..................................................... 39
Abstract ................................................................................................................................ 39
1. Introduction .................................................................................................................... 40
2. Materials and Methods .................................................................................................. 41
3. Results ........................................................................................................................... 44
4. Discussion ...................................................................................................................... 45
Conflict of interests .............................................................................................................. 48
Acknowledgements .............................................................................................................. 49
References ............................................................................................................................ 49
Legend of figures ................................................................................................................. 56
Capítulo 2 - Climate changes and the vulnerability of Amazonian Lizards ..................... 69
Abstract ................................................................................................................................ 69
1. Introduction .................................................................................................................... 70
2. Materials and Methods .................................................................................................. 72
3. Results ........................................................................................................................... 75
4. Discussion ...................................................................................................................... 76
Acknowledgements .............................................................................................................. 79
References ............................................................................................................................ 79
Legend of figures ................................................................................................................. 87
Supplementary Material ....................................................................................................... 97
vi
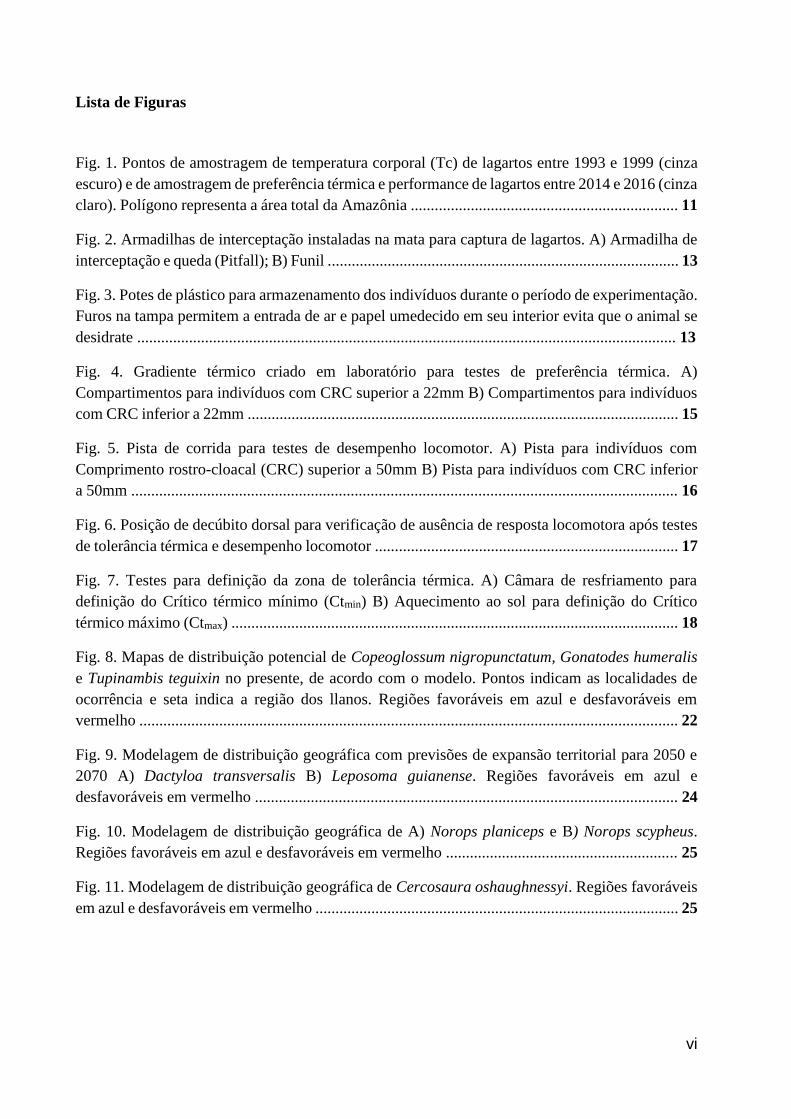
Lista de Figuras
Fig. 1. Pontos de amostragem de temperatura corporal (Tc) de lagartos entre 1993 e 1999 (cinza
escuro) e de amostragem de preferência térmica e performance de lagartos entre 2014 e 2016 (cinza
claro). Polígono representa a área total da Amazônia ................................................................... 11
Fig. 2. Armadilhas de interceptação instaladas na mata para captura de lagartos. A) Armadilha de
interceptação e queda (Pitfall); B) Funil ........................................................................................ 13
Fig. 3. Potes de plástico para armazenamento dos indivíduos durante o período de experimentação.
Furos na tampa permitem a entrada de ar e papel umedecido em seu interior evita que o animal se
desidrate ....................................................................................................................................... 13
Fig. 4. Gradiente térmico criado em laboratório para testes de preferência térmica. A)
Compartimentos para indivíduos com CRC superior a 22mm B) Compartimentos para indivíduos
com CRC inferior a 22mm ............................................................................................................ 15
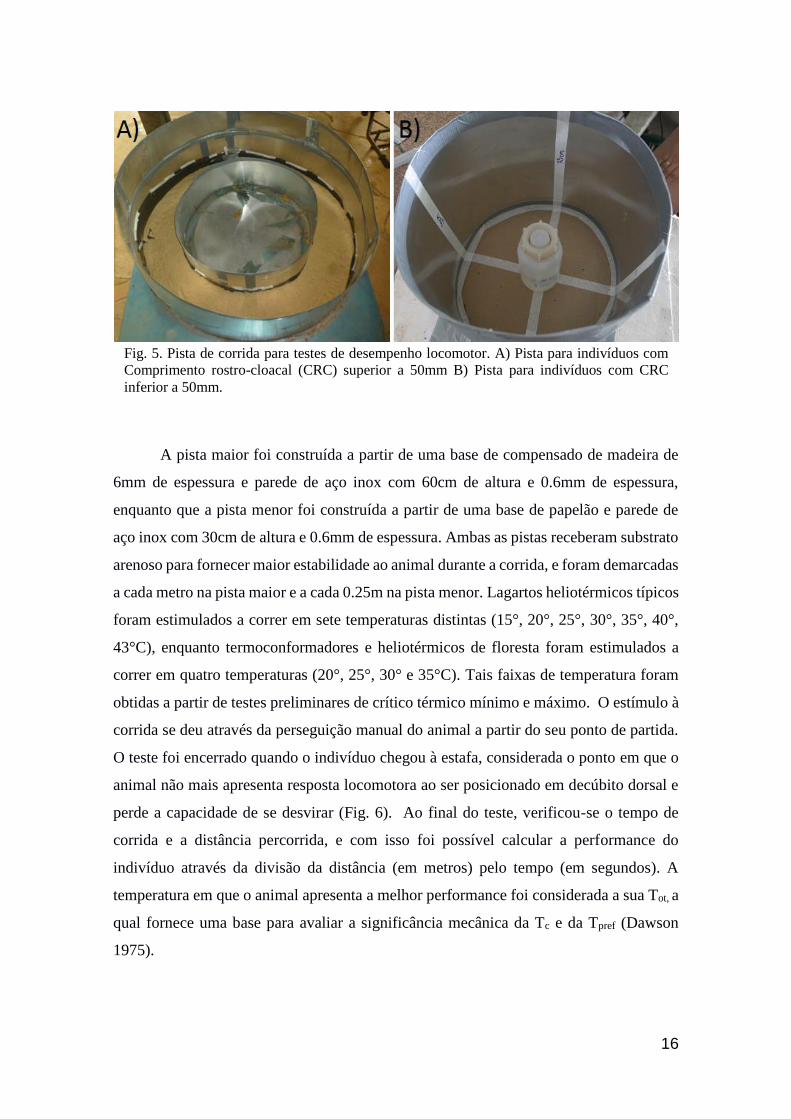
Fig. 5. Pista de corrida para testes de desempenho locomotor. A) Pista para indivíduos com
Comprimento rostro-cloacal (CRC) superior a 50mm B) Pista para indivíduos com CRC inferior
a 50mm ......................................................................................................................................... 16
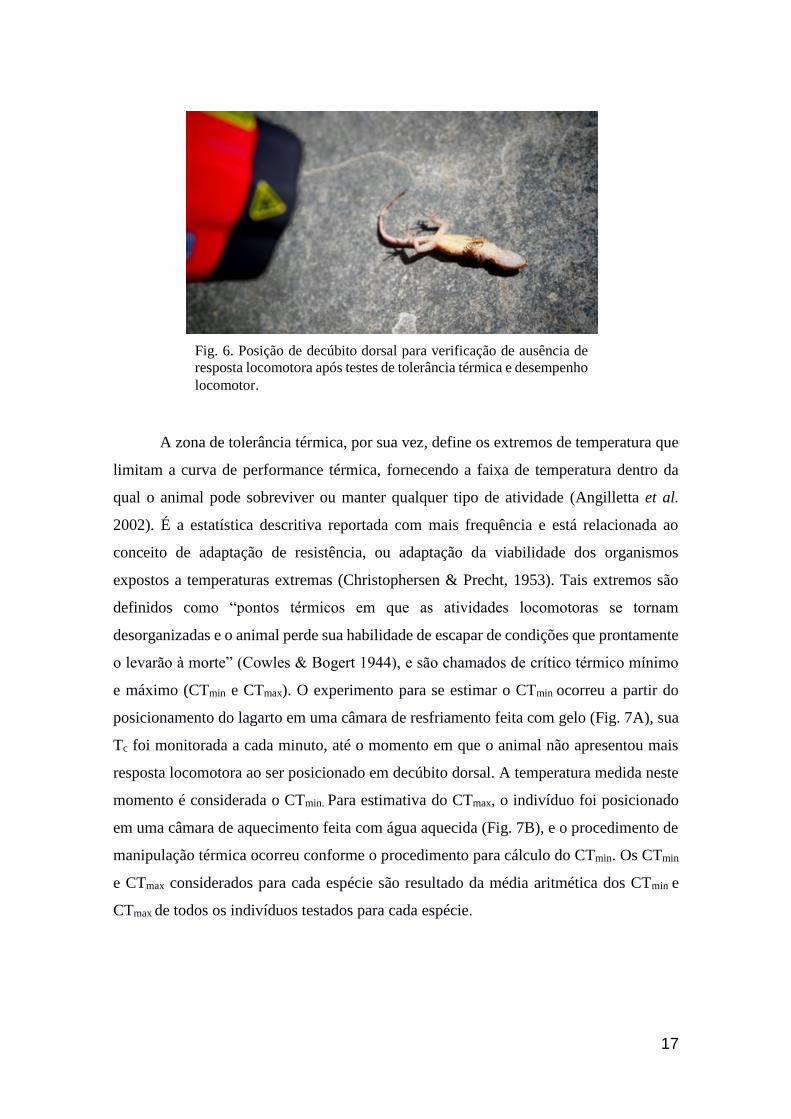
Fig. 6. Posição de decúbito dorsal para verificação de ausência de resposta locomotora após testes
de tolerância térmica e desempenho locomotor ............................................................................ 17
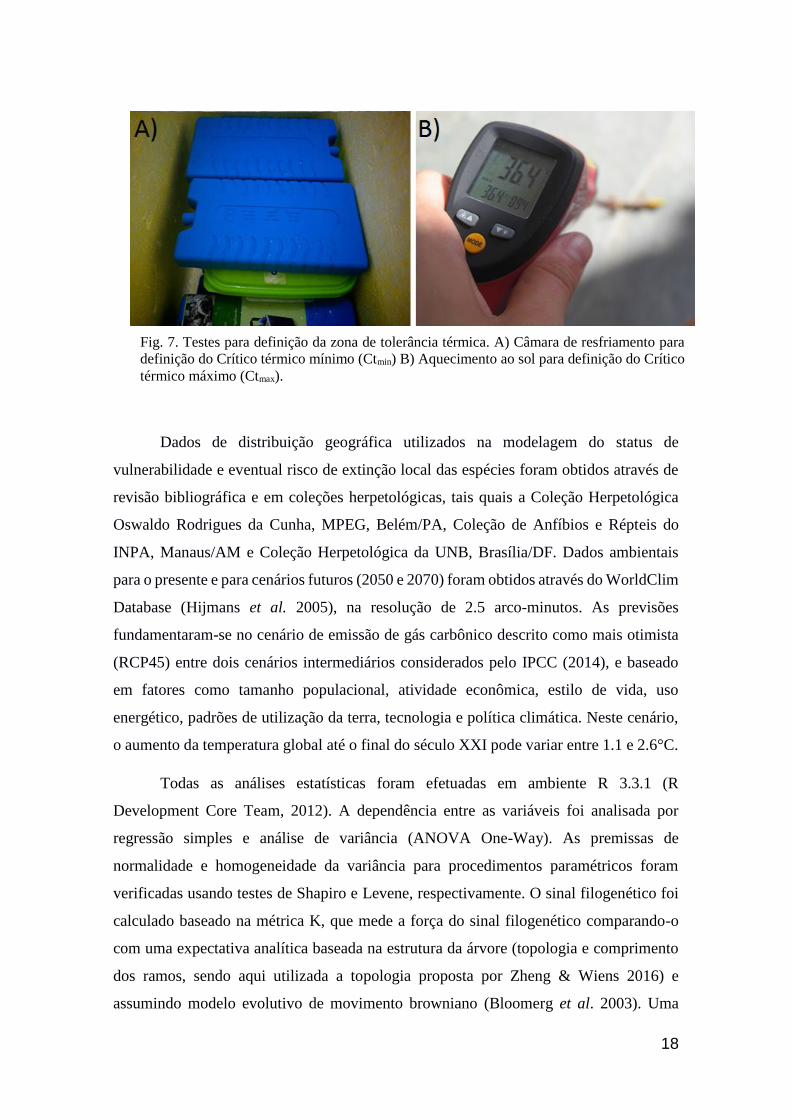
Fig. 7. Testes para definição da zona de tolerância térmica. A) Câmara de resfriamento para
definição do Crítico térmico mínimo (Ctmin) B) Aquecimento ao sol para definição do Crítico
térmico máximo (Ctmax) ................................................................................................................ 18
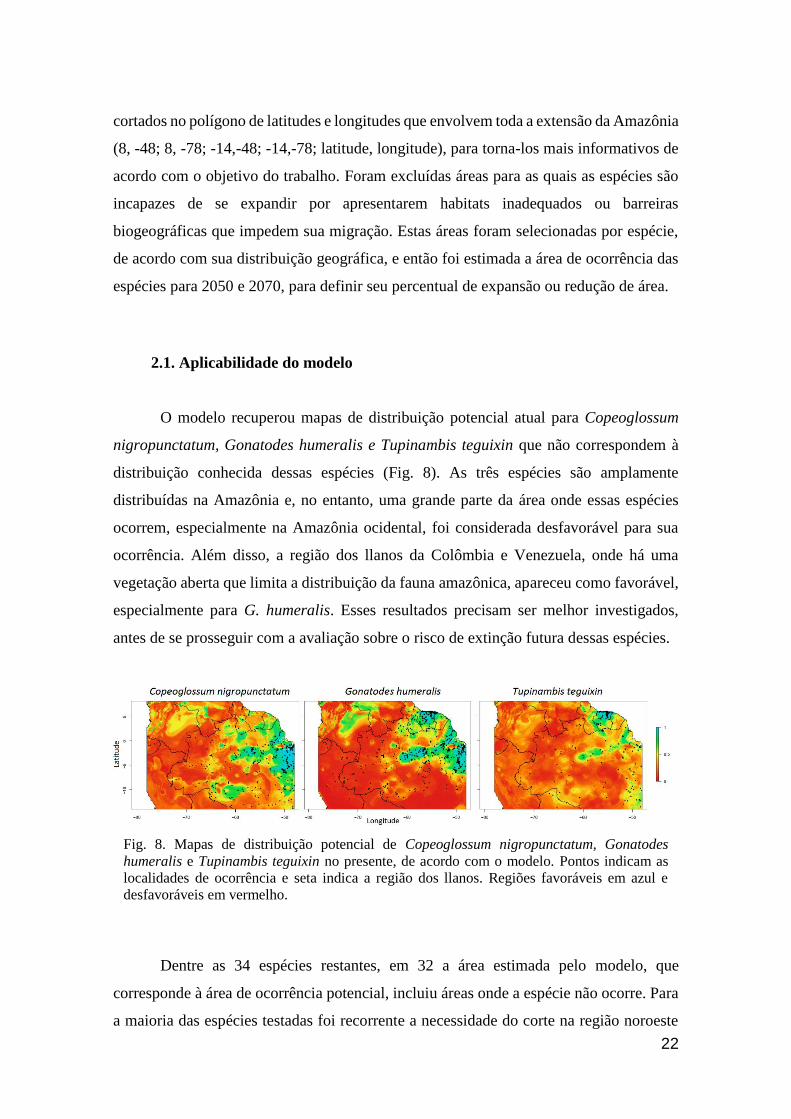
Fig. 8. Mapas de distribuição potencial de Copeoglossum nigropunctatum, Gonatodes humeralis
e Tupinambis teguixin no presente, de acordo com o modelo. Pontos indicam as localidades de
ocorrência e seta indica a região dos llanos. Regiões favoráveis em azul e desfavoráveis em
vermelho ....................................................................................................................................... 22
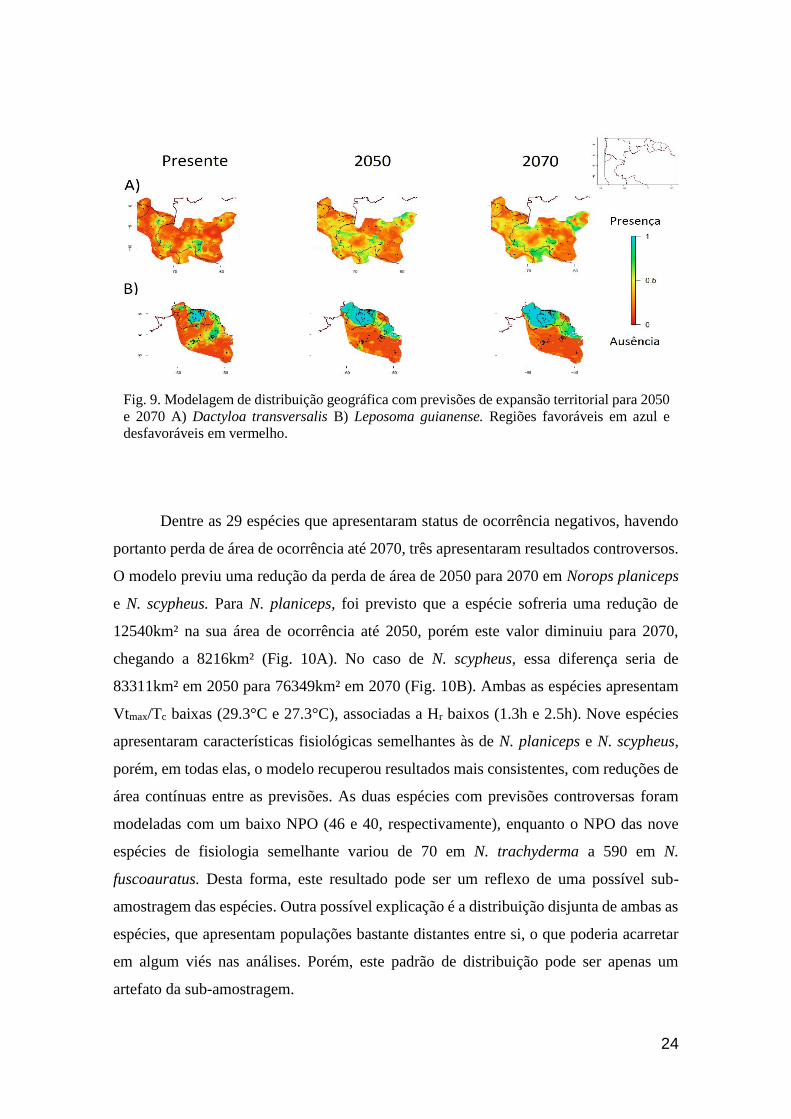
Fig. 9. Modelagem de distribuição geográfica com previsões de expansão territorial para 2050 e
2070 A) Dactyloa transversalis B) Leposoma guianense. Regiões favoráveis em azul e
desfavoráveis em vermelho .......................................................................................................... 24
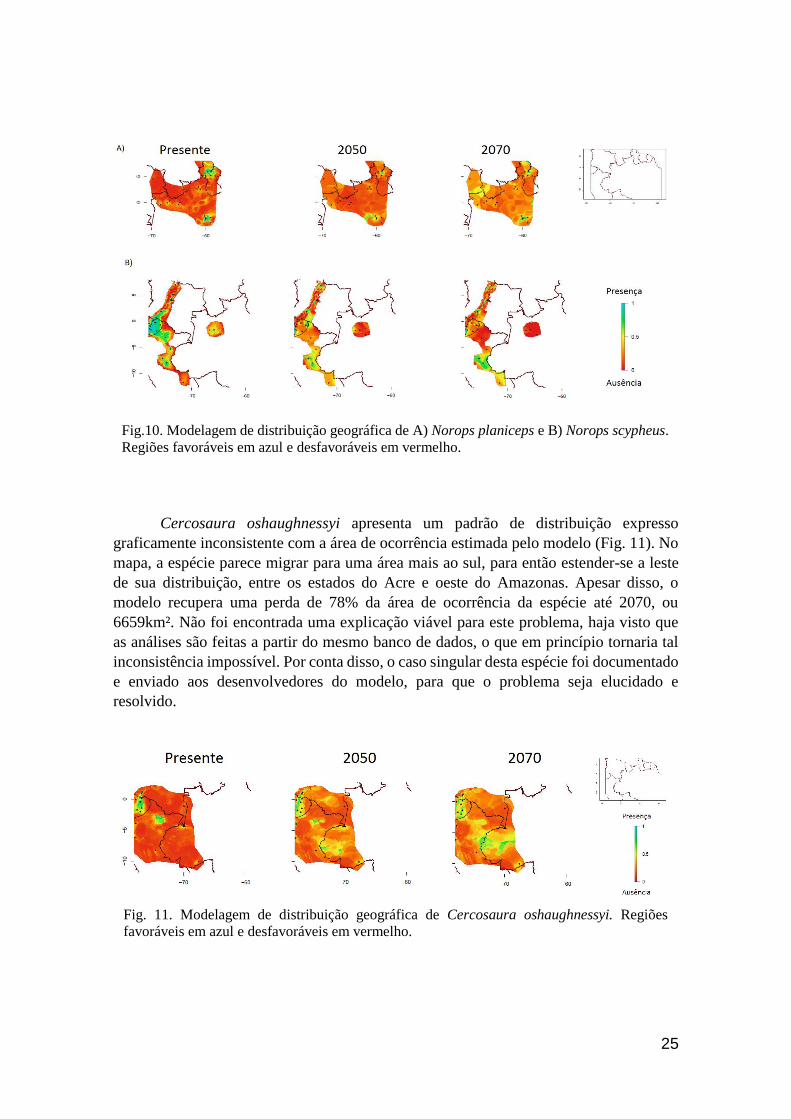
Fig. 10. Modelagem de distribuição geográfica de A) Norops planiceps e B) Norops scypheus.
Regiões favoráveis em azul e desfavoráveis em vermelho .......................................................... 25
Fig. 11. Modelagem de distribuição geográfica de Cercosaura oshaughnessyi. Regiões favoráveis
em azul e desfavoráveis em vermelho ........................................................................................... 25
vii
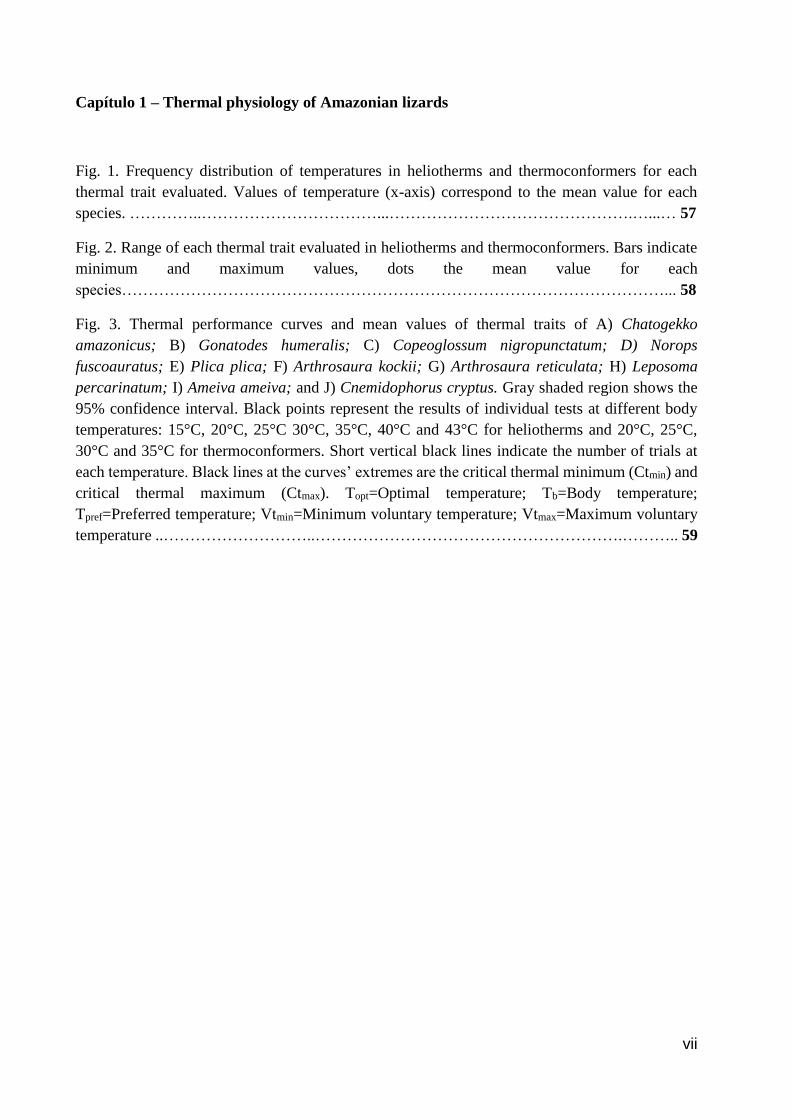
Capítulo 1 – Thermal physiology of Amazonian lizards
Fig. 1. Frequency distribution of temperatures in heliotherms and thermoconformers for each
thermal trait evaluated. Values of temperature (x-axis) correspond to the mean value for each
species. …………..……………………………...……………………………………….…...… 57
Fig. 2. Range of each thermal trait evaluated in heliotherms and thermoconformers. Bars indicate
minimum and maximum values, dots the mean value for each
species…………………………………………………………………………………………... 58
Fig. 3. Thermal performance curves and mean values of thermal traits of A) Chatogekko
amazonicus; B) Gonatodes humeralis; C) Copeoglossum nigropunctatum; D) Norops
fuscoauratus; E) Plica plica; F) Arthrosaura kockii; G) Arthrosaura reticulata; H) Leposoma
percarinatum; I) Ameiva ameiva; and J) Cnemidophorus cryptus. Gray shaded region shows the
95% confidence interval. Black points represent the results of individual tests at different body
temperatures: 15°C, 20°C, 25°C 30°C, 35°C, 40°C and 43°C for heliotherms and 20°C, 25°C,
30°C and 35°C for thermoconformers. Short vertical black lines indicate the number of trials at
each temperature. Black lines at the curves’ extremes are the critical thermal minimum (Ctmin) and
critical thermal maximum (Ctmax). Topt=Optimal temperature; Tb=Body temperature;
Tpref=Preferred temperature; Vtmin=Minimum voluntary temperature; Vtmax=Maximum voluntary
temperature ..………………………..………………………………………………….……….. 59
viii
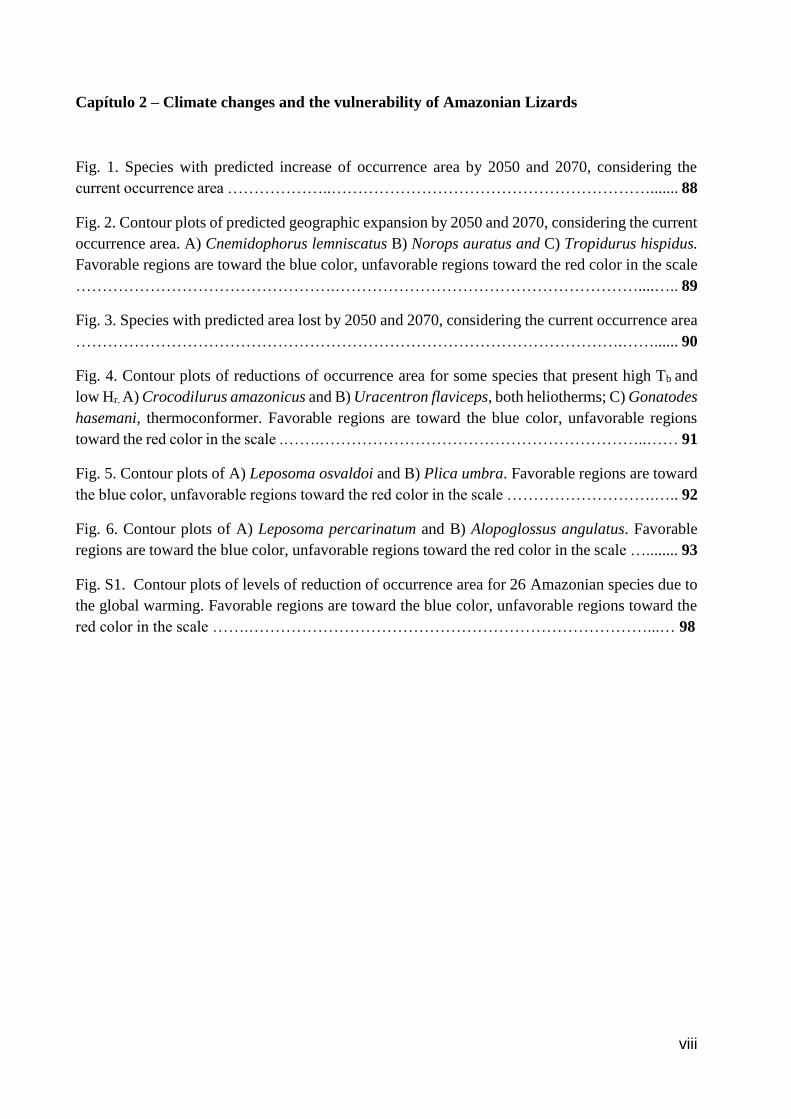
Capítulo 2 – Climate changes and the vulnerability of Amazonian Lizards
Fig. 1. Species with predicted increase of occurrence area by 2050 and 2070, considering the
current occurrence area ………………..……………………………………………………....... 88
Fig. 2. Contour plots of predicted geographic expansion by 2050 and 2070, considering the current
occurrence area. A) Cnemidophorus lemniscatus B) Norops auratus and C) Tropidurus hispidus.
Favorable regions are toward the blue color, unfavorable regions toward the red color in the scale
………………………………………….…………………………………………………....….. 89
Fig. 3. Species with predicted area lost by 2050 and 2070, considering the current occurrence area
………………………………………………………………………………………….……...... 90
Fig. 4. Contour plots of reductions of occurrence area for some species that present high Tb and
low Hr. A) Crocodilurus amazonicus and B) Uracentron flaviceps, both heliotherms; C) Gonatodes
hasemani, thermoconformer. Favorable regions are toward the blue color, unfavorable regions
toward the red color in the scale .…….……………………………………………………..…… 91
Fig. 5. Contour plots of A) Leposoma osvaldoi and B) Plica umbra. Favorable regions are toward
the blue color, unfavorable regions toward the red color in the scale ……………………….….. 92
Fig. 6. Contour plots of A) Leposoma percarinatum and B) Alopoglossus angulatus. Favorable
regions are toward the blue color, unfavorable regions toward the red color in the scale …........ 93
Fig. S1. Contour plots of levels of reduction of occurrence area for 26 Amazonian species due to
the global warming. Favorable regions are toward the blue color, unfavorable regions toward the
red color in the scale …….…………………………………………………………………...… 98
ix
Lista de Tabelas
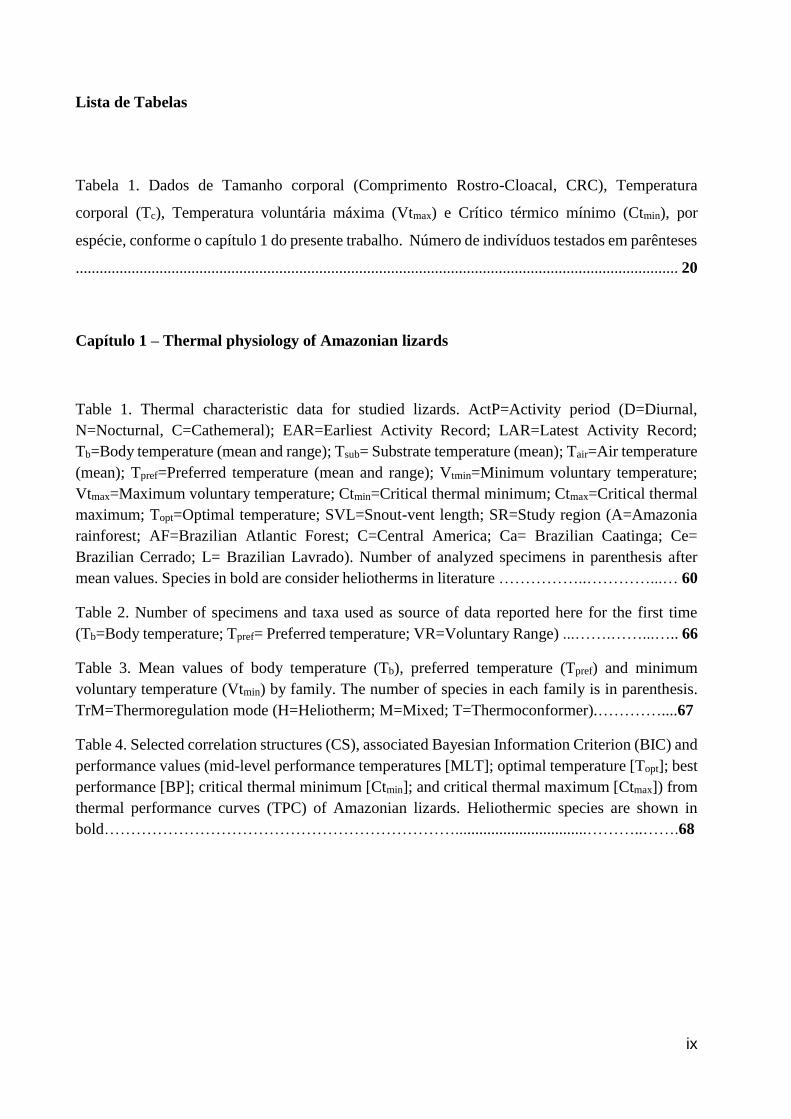
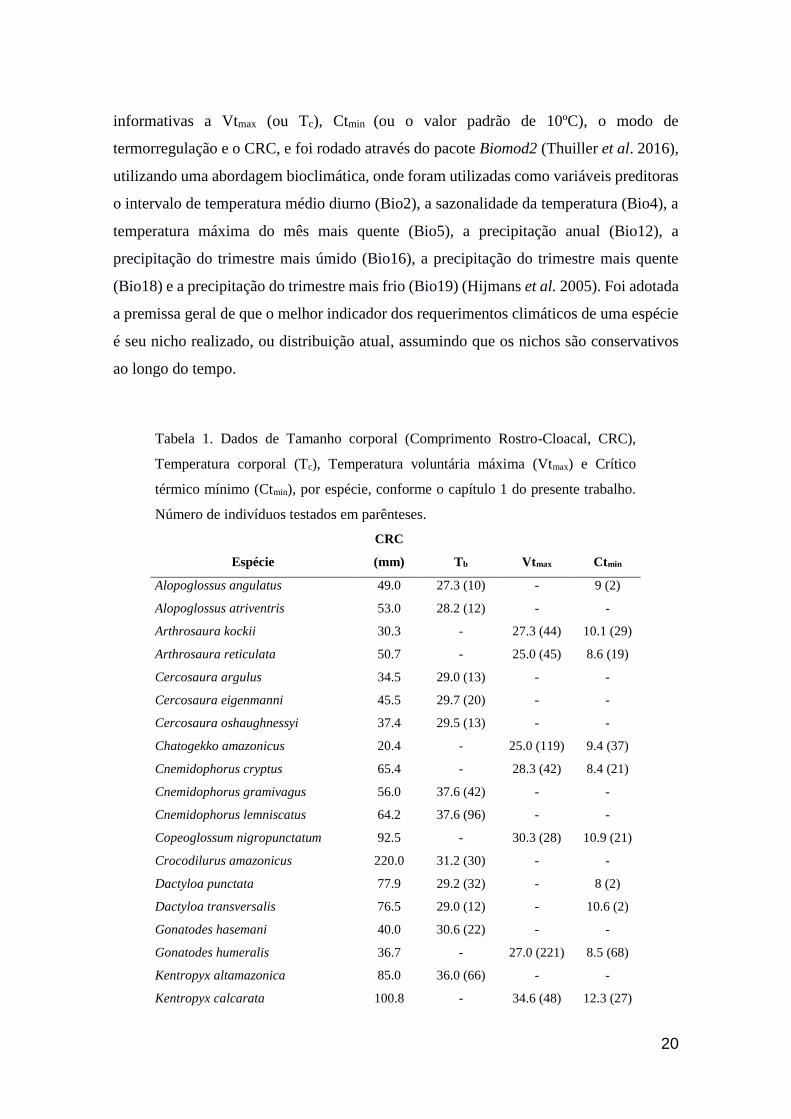
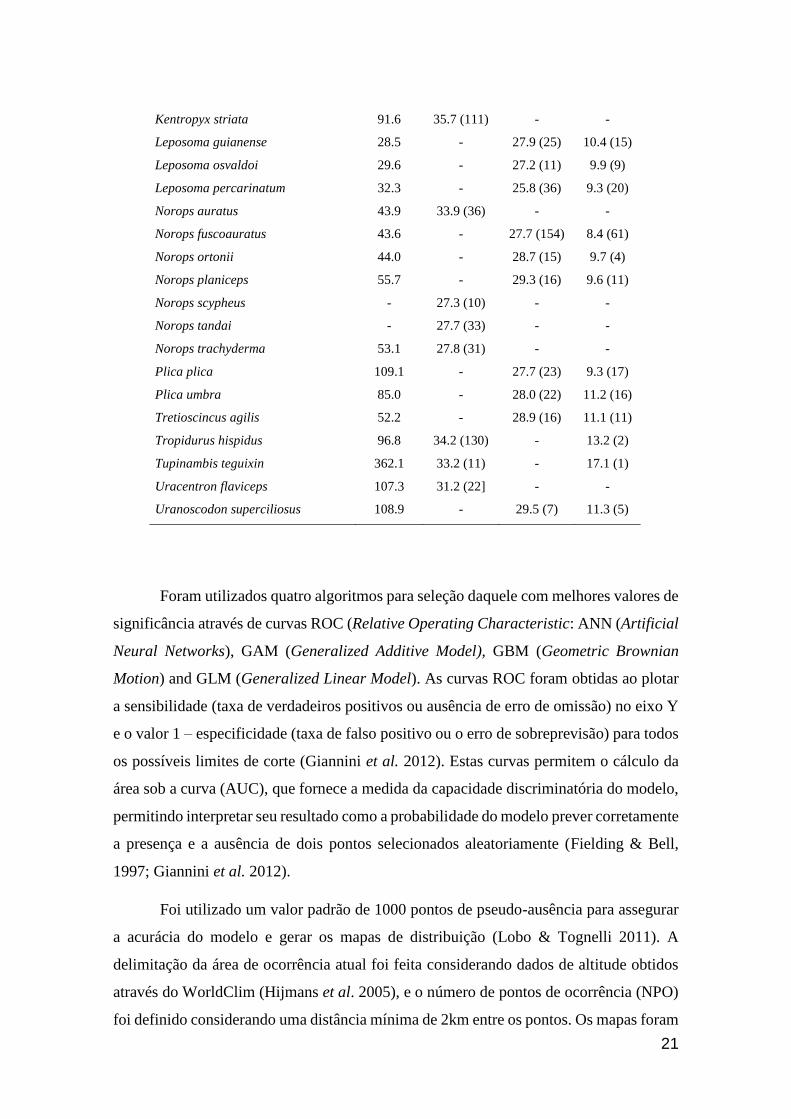
Tabela 1. Dados de Tamanho corporal (Comprimento Rostro-Cloacal, CRC), Temperatura
corporal (Tc), Temperatura voluntária máxima (Vtmax) e Crítico térmico mínimo (Ctmin), por
espécie, conforme o capítulo 1 do presente trabalho. Número de indivíduos testados em parênteses
....................................................................................................................................................... 20
Capítulo 1 – Thermal physiology of Amazonian lizards
Table 1. Thermal characteristic data for studied lizards. ActP=Activity period (D=Diurnal,
N=Nocturnal, C=Cathemeral); EAR=Earliest Activity Record; LAR=Latest Activity Record;
Tb=Body temperature (mean and range); Tsub= Substrate temperature (mean); Tair=Air temperature
(mean); Tpref=Preferred temperature (mean and range); Vtmin=Minimum voluntary temperature;
Vtmax=Maximum voluntary temperature; Ctmin=Critical thermal minimum; Ctmax=Critical thermal
maximum; Topt=Optimal temperature; SVL=Snout-vent length; SR=Study region (A=Amazonia
rainforest; AF=Brazilian Atlantic Forest; C=Central America; Ca= Brazilian Caatinga; Ce=
Brazilian Cerrado; L= Brazilian Lavrado). Number of analyzed specimens in parenthesis after
mean values. Species in bold are consider heliotherms in literature ……………..…………...… 60
Table 2. Number of specimens and taxa used as source of data reported here for the first time
(Tb=Body temperature; Tpref= Preferred temperature; VR=Voluntary Range) ...…….……...….. 66
Table 3. Mean values of body temperature (Tb), preferred temperature (Tpref) and minimum
voluntary temperature (Vtmin) by family. The number of species in each family is in parenthesis.
TrM=Thermoregulation mode (H=Heliotherm; M=Mixed; T=Thermoconformer).…………....67
Table 4. Selected correlation structures (CS), associated Bayesian Information Criterion (BIC) and
performance values (mid-level performance temperatures [MLT]; optimal temperature [Topt]; best
performance [BP]; critical thermal minimum [Ctmin]; and critical thermal maximum [Ctmax]) from
thermal performance curves (TPC) of Amazonian lizards. Heliothermic species are shown in
bold………………………………………………………….................................………..…….68
x
Capítulo 2 – Climate changes and the vulnerability of Amazonian Lizards
Table 1. Mean values of body temperature (Tb) , maximum voluntary temperature (Vtmax), critical
thermal minimum (Ctmin), hours of restriction (Hr) and snout-vent length (SVL) of Amazonian
lizards for each species and for heliotherms and thermoconformers; Selected Algorithm (SA); Area
Under the Curve (AUC) from the Relative Operating Characteristic (ROC); and source of data.
Numbers in parenthesis indicate the number of individuals tested. Species in bold are
heliotherms..…………………………………………………………………………………..… 94
Table 2. Total Occurrence Area (TOA) and percentage of expansion (+) or loss (-) of area by
2050 and 2070 for each species. Species in bold are heliotherms ............................................... 96
1
Resumo Geral
É previsto que o aquecimento global leve a Terra a um aumento da temperatura
de até 4.8°C até o final do século XXI, o que pode afetar negativamente distribuição das
espécies de lagartos, considerando que são animais ectotérmicos e dependem diretamente da
temperatura do ambiente para regularem a temperatura corporal (Tc). Estes animais
geralmente apresentam como resposta compensatória ao estresse térmico a restrição do
tempo de atividade em refúgios, para minimizar o risco de morte por superaquecimento.
Acredita-se que a vulnerabilidade das espécies seja portanto inversamente proporcional à Tc
e ao número de horas de restrição nos refúgios (Hr), e diretamente associada à temperatura
máxima do ambiente (TMA), o que significa que qualquer lagarto, seja ele
termoconformador ou heliotérmico, pode ser vulnerável às mudanças climáticas. Há pouca
informação disponível na literatura em relação a biologia dos lagartos da Amazônia, apesar
de ser a região mais biodiversa do mundo e abrigar cerca de 210 espécies de lagartos ao
longo de sua extensão. Com isso, o primeiro capítulo do presente trabalho teve como objetivo
sintetizar o conhecimento acerca da fisiologia térmica destes animais e incorporar dados
inéditos de preferência térmica de algumas espécies, além de caracterizar o seu modo de
termorregulação e recuperar as relações entre os caracteres. O segundo capítulo, por sua vez,
analisa o status de persistência/ausência de 29 espécies de lagartos amazônicos, com
projeções para 2050 e 2070, verificando se a sua vulnerabilidade está de fato associada à Tc,
Hr e TMA. Quarenta e cinco estudos reportando Tcs de 62 espécies foram encontrados, e
dados adicionais de Tc, bem como dados inéditos de preferência térmica, foram coletados em
13 localidades na Amazônia, abrangendo diversas fitofisionomias do bioma. Foram obtidos
dados de temperatura preferencial (Tpref), temperaturas voluntárias mínima (Vtmin) e máxima
(Vtmax) e zona de tolerância (críticos térmicos, Ctmin e Ctmax) para 33 espécies, e dados de
performance (Tot) para 10 espécies. Tc, Tpref e Vtmin apresentaram sinal filogenético fraco
(K<1), e todas as variáveis se correlacionam, exceto por 1) Tot, que não apresenta correlação
com Ctmax e 2) Ctmin, que só se correlaciona com Tot. Embora apresentem diferenças
estatisticamente significativas, heliotérmicos e termoconformadores apresentam
características térmicas intercaladas na escala de valores, demonstrando um continuum entre
os extremos dos modos de termorregulação. A utilização de um modelo de distribuição que
combina dados ambientais e de fisiologia para calcular a distribuição potencial atual e futura
das espécies, considerando um cenário de emissão de gás carbônico realista, permitiu a
2
verificação do status de persistência/ausência de 29 espécies de lagartos amazônicos. Três
delas, todas heliotérmicas, apresentaram um projeção de expansão territorial até 2070. Para
as demais, foi prevista uma redução de área de ocorrência, com heliotérmicos apresentando,
em média, menores Hr e maiores Tc que os termoconformadores. Não foi verificado um
padrão de vulnerabilidade relacionado ao modo de termorregulação, e a maioria das espécies
apresentou baixas Tcs e/ou Hr, concordando com a hipótese que relaciona vulnerabilidade à
Tc, Hr e TMA. Foi feita ainda a modelagem de outras oito espécies, porem estas apresentaram
resultados controversos nos cálculos de distribuição potencial e portanto não foram incluídas
nas análises de vulnerabilidade. Tais espécies estão sendo avaliadas pelos desenvolvedores
do modelo para eventuais ajustes. Por fim, caso as previsões se concretizem, as altas
restrições de área recuperadas pelo modelo podem refletir um elevado risco de extinção das
espécies. O resultado é preocupante mesmo considerando eventuais limitações do método, e
reforça a necessidade de políticas conservativas que levem em consideração os efeitos das
mudanças climáticas sobre a fauna, além de mais estudos visando ampliar nosso
entendimento acerca das consequências do aquecimento global.
Palavras-Chave: Amazônia, Aquecimento Global, Fisiologia térmica, Lagartos, Modelagem.

3
General Abstract
Is predicted that the global warming drive the Earth to an increase of temperature
of almost 4.8°C by the end of the XXI century, what may negatively affects the distribution
of lizards species, considering that they are ectotherms and depends directly on the
environmental temperatures to regulate their body temperatures (Tb). This animals usually
present as compensatory response to the thermal stress the restriction of activity time in
refuges, to minimize the risk of death by overheating. It is believed that the species’
vulnerability would be inversely proportional to Tb and to the number of hours of activity
restriction in refuges (Hr), and directly proportional to the maximum environmental
temperature (MET), what means that both heliotherm and thermoconformer lizards should
be vulnerable to the climate changes. There are little information available in literature about
the biology of Amazonian lizards, although it is the most biodiverse region in the world and
house about 210 species of lizards among all its extension. Therefore, the first chapter of this
work had as goal to synthetize the knowledge on thermal physiology of these animals and
incorporate unpublished data on thermal preferences for some species, besides to
characterize their thermoregulation mode and recover the phylogenetic relationships among
the characters. The second chapter, in turn, analyzes the persistence/absence status of 29
species, with projections to 2050 and 2070, in order to verify if their vulnerability is in fact
associated to Tb, Hr and MET. Fourty-five studies reporting Tbs from 62 species were found,
and additional data on Tb, as well as unpublished data on thermal preferences, were collected
among 13 localities of Amazonia, encompassing several phytophysiognomies of the biome.
Were obtained data on preferred temperature (Tpref), minimum (Vtmin) and maximum (Vtmax)
voluntary temperatures and tolerance zone (critical thermals, Ctmin and Ctmax) for 33 species,
and performance data (Topt) for 10 species. Tb, Tpref and Vtmin present low phylogenetic signal
(K<1), and all variables are correlated, with exception of 1) Topt, which does not present
correlation with Ctmax, and 2) Ctmin, which only correlates with Topt. Although shows
significant statistical differences, heliotherms and thermoconformers present thermal
characters intercalated in the scale of values, demonstrating a continuum between the
extreme thermoregulation modes. The use of a species distribution model that mix
environmental and physiological data to calculate the potential distribution of species in the
present and future, considering a realistic scenario of greenhouse gases’ emissions, allows
the verification of the persistence/absence status on 29 species of Amazonian lizards. Three
4
of them, all heliotherms, presents a projection of territorial expansion by 2070. The other 26,
presents a projection of reductions in their occurrence area, with heliotherms presenting
lower mean values of Hr and higher mean values of Tb than thermoconformers. Has not been
verified any pattern of vulnerability related to thermoregulation mode, and the majority of
the species present low Tb and/or Hr, agreeing with the hypothesis that relates vulnerability
to Tb, Hr and MET. Other eight species were also modeling, but they present issues in the
calculation of the potential distribution and thus were not included in the vulnerability
analysis. These species are being evaluated by the model’ developers to possible
adjustments. Lastly, if the forecasts concretizes, the high occurrence restrictions recovered
by the model can reflects a potentially high extinction risk of the species. The result is
worrying, even considering the model limitations, and reinforces the need of conservation
policies that take into account the effects of climate change on fauna, as well as further
studies aimed to improving our understanding about the consequences of the global
warming.
Key-Words: Amazonia, Global Warming, Lizards, Species Distribution Modeling, Thermal
Physiology.
5
1. Introdução Geral
O planeta Terra sofreu diversas variações climáticas ao longo de sua existência,
passando por ciclos naturais de aquecimento e resfriamento (Marengo 2006). As
flutuações da órbita terrestre em relação ao sol, ou ciclo de Milankovitch, explicam
variações climáticas de diferentes graus (Isla 1998), uma vez que causam variação no
grau de radiação solar recebido pela Terra e a distribuição latitudinal e sazonal da mesma
(Berger 1978). Essa variação afeta a temperatura, precipitação e outros aspectos do
ambiente atmosférico (Bennet 1990). Apesar disso, a atividade industrial desenvolvida a
partir da segunda metade do século XVIII vem afetando diretamente a variação climática
natural e a concentração de gases na atmosfera, que atualmente é apontada, junto a outros
fatores antropogênicos, como a maior causa do aquecimento global observado desde
meados do século XX (Marengo 2006).
As previsões das mudanças climáticas causadas por atividade humana começaram
em 1896, quando o químico suéco Svante Arrhenius percebeu que a quantidade de
dióxido de carbono liberado para a atmosfera estava aumentando, e continuaria a
aumentar caso o consumo de combustíveis fósseis se mantivesse ou se intensificasse
(Chambers & Ogle 2002). Isso ocasionaria um aumento da temperatura da Terra, e
embora suas descobertas não tenham apresentado grande repercussão à época, hoje é
sabido que entre 1750 e 2011 o acúmulo de gás carbônico, metano e óxido nítrico na
atmosfera aumentou de forma exponencial, de modo a apresentar atualmente a maior
concentração destes gases na atmosfera vista nos últimos 800.000 anos (IPCC 2014).
A média de temperatura global subiu 0,85°C de 1880 a 2012, sendo as últimas três
décadas consideradas as mais quentes desde 1850 (IPCC 2014). Não coincidentemente,
50% do gás carbônico acumulado na atmosfera atualmente foi emitido nos últimos 40
anos (IPCC 2014). Para o final do século XXI, a previsão é de que haja ainda outro
aumento de temperatura da Terra por conta da emissão de gás carbônico, podendo chegar
a 2°C num cenário mais brando e a 4,8°C num cenário mais pessimista (IPCC 2014).
As mudanças climáticas ameaçam a biodiversidade global, podendo levar à
extinção de diversas espécies (Bellard et al. 2012; Hof et al. 2011; Sinervo et al. 2010).
Nos trópicos esta ameaça parece maior (Tewksbury et al. 2008), uma vez que a
temperatura é mais homogênea e, portanto, há uma baixa sobreposição de temperaturas
6
em altitudes distintas, acarretando num aumento no custo de dispersão através do
gradiente climático e num baixo fluxo gênico entre as populações, ao contrário de regiões
temperadas cuja sazonalidade garante uma sobreposição de temperaturas em diferentes
altitudes e consequente custo reduzido de dispersão e alto fluxo gênico entre as
populações (Janzen 1967). A proposta de Janzen (1967) foi bastante discutida na literatura
(Addo-Bediako et al. 2000; Hoffman et al. 2003; Ghalambor et al. 2006) e, apesar da sua
complexidade, vários de seus pressupostos e conclusões parecem corretos.
Os impactos das mudanças climáticas em populações biológicas começaram a ser
abordados com a elucidação do papel das variações climáticas na retração geográfica das
espécies (Grinnell 1917). No norte da Europa, observações quanto à sensibilidade de
insetos às altas te mperaturas registradas na primavera e verão foram documentadas
desde a primeira metade do século XX (Ford 1945; Kaisila 1962; Uvarov 1931), enquanto
que para pássaros as mudanças na abundância de espécies e alterações na distribuição
geográfica foram bem documentadas durante os períodos de aquecimento de 1930-1940
(Kalela 1949; Kalela 1952; Salomonsen 1948), e aquecimento/resfriamento de 1950-
1960 (Burton 1975; Heath 1974; Williamson 1975). Os primeiros estudos extensos que
tratam a variabilidade climática como direcionador da evolução populacional datam da
década de 1940 (Dobzhansky 1943; 1947), e com o passar do tempo foram explorados
temas como eventos únicos de intensificação climática, tolerância fisiológica, relação
entre variáveis climáticas e distribuição de espécies, e relação entre características
climáticas e mudanças na distribuição, fenologia, genética e comportamento das espécies
através do tempo (Parmesan 2006).
Atualmente, sabe-se que eventuais mudanças climáticas podem levar os
organismos a apresentarem diferentes respostas compensatórias (Paranjpe et al. 2013),
conforme a escala temporal e o tamanho, mobilidade e longevidade do organismo.
Alterações climáticas podem levar os animais a se dispersarem para ambientes mais
favoráveis, bem como a ajustarem-se comportamental ou fisiologicamente, ou a
adaptarem-se ao longo de gerações (Paranjpe et al. 2013). Quando a população é incapaz
de apresentar respostas compensatórias suficientes para mitigar os efeitos das mudanças
climáticas, ela acaba por entrar em colapso demográfico e se extinguir (Sinervo et al.
2010, Hoffman & Sgró 2011, Paranjpe et al. 2013). Desta forma, as respostas dos
organismos às pressões seletivas geradas pelas mudanças climáticas dependem, a curto
7
prazo, da força da pressão seletiva e da estratégia disponível para a população lidar com
a pressão e, a longo prazo, do potencial plástico e evolutivo da população, de modo a
adaptar-se às novas condições (Angilletta et al. 2006, Hoffman & Sgró 2011, Paranjpe et
al. 2013). Portanto, fisiologia térmica, ecologia e condições climáticas gerais são fatores
cruciais para definir a distribuição das espécies e a variação espacial da diversidade na
Terra (Addo-Bediako et al. 2000; Gaston et al. 2009; Sunday et al. 2011) e,
consequentemente, prever os impactos biológicos das mudanças climáticas em
populações naturais (Huey & Slatkin 1976; Buckley 2008)
Lagartos são animais ectotérmicos e dependem diretamente da temperatura do
ambiente para regularem sua temperatura corporal (Tc). Esta, por sua vez, influencia tanto
a fisiologia como o comportamento do animal, uma vez que afeta o desempenho de
diversos processos metabólicos, tais como funções cardiovasculares (Baker & White
1970), digestão (Harlow et al. 1976), reprodução (Light 1966) e desempenho locomotor
(Crowley 1985, Hertz et al. 1983; Stevenson et al. 1985). Por este motivo, a manutenção
da Tc dentro dos limites adequados é essencial para a sobrevivência destes organismos e
possui um alto grau de complexidade (Bogert 1949; Bogert 1959), apresentando diversos
mecanismos, como a termorrecepção (capacidade do animal de perceber o ambiente
térmico a sua volta), controle hormonal e alterações no metabolismo (Seebacher &
Franklin 2005). As espécies podem desenvolver diferentes limites fisiológicos de acordo
com o ambiente em que se encontram (Scheffers et al. 2014), o que faz com que a variação
da temperatura do ambiente ou dos microhabitats da espécie ao longo de sua distribuição
influencie suas respostas comportamentais e fisiológicas (Withers 1992).
A forma com que os ectotérmicos desempenham suas funções fisiológicas
básicas em diferentes temperaturas é usualmente medida através de curvas de
performance térmica (Huey & Stevenson 1979), que especificam a performance do
indivíduo relativa a uma variável fisiológica através de um gradiente de temperaturas
corporais, fornecendo estimativas objetivas da temperatura ótima de performance (Tot),
da faixa de temperatura em que o animal possui um gradiente de performance superior a
80% do ótimo e dos limites térmicos da espécie, ou extremos de temperatura que
delimitam a performance do animal (CTmin e CTmax, Huey & Kingslover 1989).
Muitos lagartos da região neotropical são termoconformadores, que vivem em
constante sombreamento e apresentam Tc como reflexo do ambiente (Ruibal 1961, Huey
8
& Slatkin 1976, Huey 1982), embora possam apresentar certo grau de termorregulação
ativa, resultando em uma Tc um pouco acima da temperatura do ar e do substrato (Vitt et
al. 1998). Lagartos heliotérmicos, por sua vez, se expõem diretamente ao sol para
termorregular ativamente, apresentando mecanismos comportamentais que lhes
permitem alcançar temperaturas corporais mais altas (Heatwole & Taylor 1987). Em
campo, os lagartos são usualmente vistos ativos em temperaturas corporais características
(Tc), e comumente se assume que tais temperaturas representam sua preferência térmica
real (Licht et al. 1966). Apesar disso, experimentos em laboratório mostram que a Tc de
lagartos tropicais observada em campo frequentemente excede a Tc preferencial (Tpref)
observada em testes com gradientes térmicos (DeWitt 1967, Du 2000). Em geral, tais
temperaturas observadas em campo estão próximas ao limite térmico superior das
espécies, os quais podem ser excedidos nas próximas décadas com o aquecimento global
(Hoffman & Sgró 2011).
Em caso de estresse térmico, os heliotérmicos podem apresentar diversas
estratégias comportamentais para se adequarem ao ambiente, incluindo mudança postural
para alterar a área exposta às fontes de calor (Bartholomew 1966; DeWitt 1967; Heath
1965) e alternância entre os microambientes disponíveis para modificar o fluxo de calor
ao qual o animal está se submetendo (Hammel et al. 1967; Heath 1965).
Termoconformadores não utilizam tais estratégias com tanta frequência, uma vez que
possuem a Tc como reflexo do microambiente, não se expondo constantemente a áreas
abertas com incidência solar direta (Ruibal 1961, Huey 1982). Apesar dessa limitação,
heliotérmicos e termoconformadores compartilham, como estratégia para períodos de
estresse térmico, a regulação do tempo de atividade em refúgios mais frios para minimizar
o risco de morte por superaquecimento (Heatwole et al. 1969, Sinervo et al. 2010).
Mesmo sendo efetiva, a estratégia pode ter um efeito negativo sobre a população, uma
vez que as horas de restrição (Hr) limitam o forrageio, restringindo funções metabólicas
dispendiosas e assim minando as taxas de crescimento populacional (Sinervo et al. 2010).
Sendo assim, mesmo com as diferenças térmicas entre heliotérmicos e
termoconformadores, o risco de extinção das espécies não está relacionado ao modo de
termorregulação, estando na verdade mais relacionado às adaptações térmicas. Neste
sentido, baixas Tcs, baixas Hr e altas temperaturas máximas ambientais (TMA) poderiam
aumentar significativamente o risco de extinção das populações locais de lagartos, o que
9
significa que ambos, heliotérmicos e termoconformadores, podem ser vulneráveis às
mudanças climáticas (Sinervo et al. 2010).
Sinervo et al. (2010) elaboraram um modelo estatístico de distribuição de
espécies que combina dados de ecologia e fisiologia das espécies para calcular a sua
distribuição potencial atual e futura, considerando dados ambientais e diferentes cenários
de emissão de gás carbônico. Este modelo vem sendo aperfeiçoado por uma rede de
pesquisadores ao redor do mundo, da qual faço parte, com o intuito de se determinar a
vulnerabilidade e potencial risco de extinção de diferentes grupos de organismos em
decorrência do aquecimento global, de modo a tornar possível compreender os aspectos
da ecologia e fisiologia dos organismos frente ao cenário das alterações climáticas e gerar
subsídios para sua conservação em escala global. A rede de pesquisadores está associada
ao projeto internacional “Quantifying climate-forced extinction risks for lizards,
amphibians, fishes, and plants” (National Science Foundation), coordenado pelo Dr.
Barry Raymond Sinervo (Universidade da Califórnia, Santa Cruz), e, no Brasil, ao projeto
“Quantificação dos riscos de extinção induzida pelo clima em anfíbios, lagartos e plantas
do Brasil” (CNPq PVE 71/2013), coordenado pelo Dr. Guarino Rinaldi Colli
(Universidade de Brasília). Por utilizar dados de ecologia e fisiologia dos organismos, o
modelo promete gerar previsões mais precisas em relação aos modelos de distribuição
tradicionais, que utilizam apenas dados ambientais e coordenadas geográficas.
A Floresta Amazônica situa-se na região equatorial e possui uma área estimada de
8 milhões de quilômetros quadrados ao longo de nove países da América do Sul (Eva et
al. 2005). É a região de maior biodiversidade do planeta, abrigando cerca de 10% da
biodiversidade mundial (Silva et al. 2005). Cerca de 210 espécies de lagartos são
conhecidas para a região, mas apesar de sua grande extensão e do elevado número de
espécies, pouco se sabe sobre a biologia dos lagartos amazônicos. Há pouca informação
disponível na literatura quanto a dados de Tc e nenhuma em relação a temperatura
preferencial ou temperatura ótima, o que limita o entendimento acerca da fisiologia
térmica destes animais e dificulta melhores estimativas em relação a maneira com que
esta fauna será afetada pelas mudanças climáticas. Isto impede que medidas
conservacionistas sejam tomadas, uma vez que se ignora a situação das espécies no
cenário atual de alterações climáticas.
10
Desta forma, o primeiro capítulo do presente trabalho teve como objetivo sintetizar
os dados de fisiologia térmica das espécies de lagartos amazônicos disponíveis na
literatura, caracterizando seu modo de termorregulação e incorporando dados inéditos de
performance e temperatura preferencial para algumas espécies, além de recuperar as
relações filogenéticas entre os caracteres ao estimar seu sinal filogenético, definido como
a não-independência estatística entre os valores das características das espécies, devido a
sua relação filogenética (Revell et al. 2008). Ele foi elaborado em formato de artigo
científico, o qual será submetido para a revista Journal of Thermal Biology (Qualis A2),
em janeiro de 2017.
O segundo capítulo, por sua vez, analisa o status de presença/ausência de 29 espécies
de lagartos amazônicos, com projeções para 2050 e 2070, testando a hipótese de Sinervo
et al. (2010), que associa a vulnerabilidade das espécies à Tc, Hr e TMA, e não ao modo
de termorregulação, como proposto por Huey et al. 2009. Ele foi elaborado em formato
de artigo científico, o qual considera-se submeter para as revistas Proceedings of the
National Academy of Sciences, Global Ecology and Biogeography (ambas Qualis A1) ou
Physiological and Biochemical Zoology (Qualis A2), até maio de 2017. Foram detectados
problemas nos resultados da modelagem de algumas espécies, que portanto não foram
incluídas aqui, devido à necessidade de revisão. Tais problemas estão discriminados mais
adiante na metodologia, no subitem Aplicabilidade do Modelo.
2. Metodologia
Foram encontrados 45 estudos reportando Tcs de 62 espécies em doze famílias de
lagartos amazônicos. Dados adicionais de Tc foram coletados entre 1993 e 1999 em seis
localidades de floresta de terra firme da Amazônia: Estación Biologica de la Pontifícia
Universidad Católica de Quito, localizada a uma elevação de 260m na Reserva de
Produccion Faunistica Cuyabeno (0°0’N, 76°10’S), em Sucumbios, Equador; Bacia do
Rio Juruá, há aproximadamente 5km ao norte de Porto Walter, Acre (8°15’S, 72°46’W);
Rio Ituxi, no sudoeste do Amazonas (8°20’ S, 65°43’W); Rio Formoso, no Parque
Estadual Guajará-Mirim, Rondônia (10°55’S, 64°42’W); Sul de Manaus e do rio
Amazonas (3°20’S, 59°4’W); e Agropecuária Treviso LTDA, próximo ao Rio Curuá-
Una, aproximadamente 101km ao sul e 18 a leste de Santarém, Pará (3° 9’ S, 54° 50’W);
11
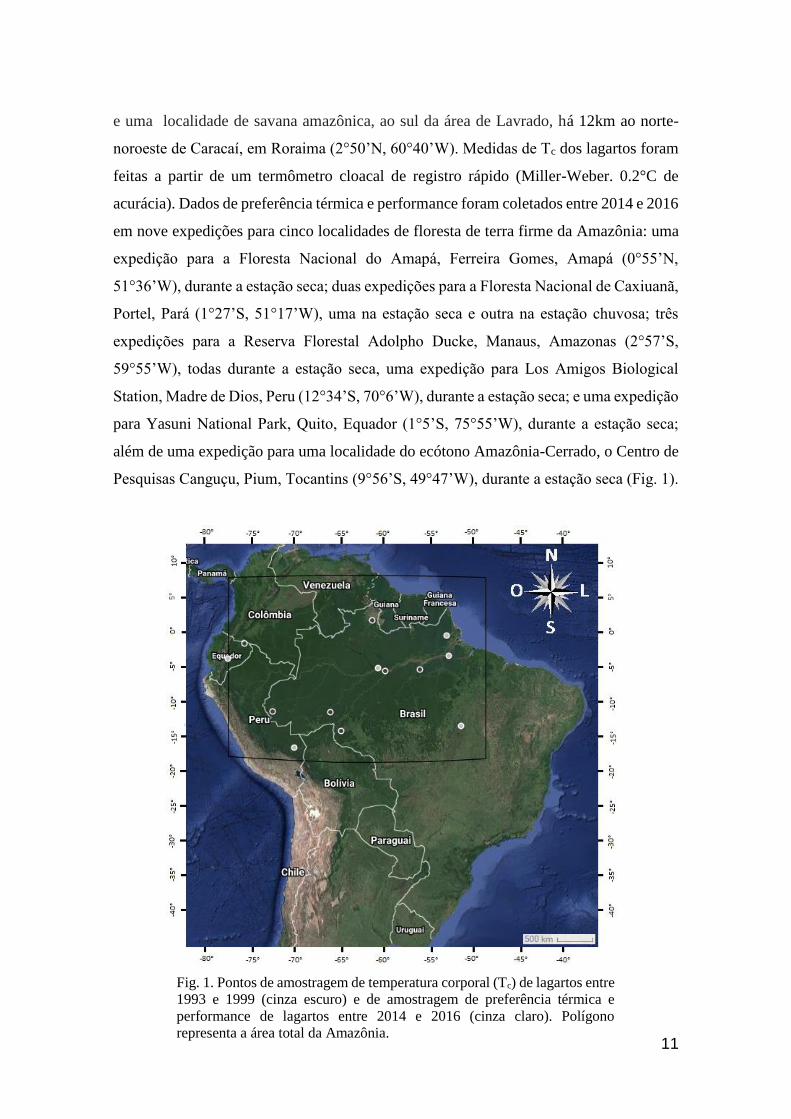
e uma localidade de savana amazônica, ao sul da área de Lavrado, há 12km ao norte-
noroeste de Caracaí, em Roraima (2°50’N, 60°40’W). Medidas de Tc dos lagartos foram
feitas a partir de um termômetro cloacal de registro rápido (Miller-Weber. 0.2°C de
acurácia). Dados de preferência térmica e performance foram coletados entre 2014 e 2016
em nove expedições para cinco localidades de floresta de terra firme da Amazônia: uma
expedição para a Floresta Nacional do Amapá, Ferreira Gomes, Amapá (0°55’N,
51°36’W), durante a estação seca; duas expedições para a Floresta Nacional de Caxiuanã,
Portel, Pará (1°27’S, 51°17’W), uma na estação seca e outra na estação chuvosa; três
expedições para a Reserva Florestal Adolpho Ducke, Manaus, Amazonas (2°57’S,
59°55’W), todas durante a estação seca, uma expedição para Los Amigos Biological
Station, Madre de Dios, Peru (12°34’S, 70°6’W), durante a estação seca; e uma expedição
para Yasuni National Park, Quito, Equador (1°5’S, 75°55’W), durante a estação seca;
além de uma expedição para uma localidade do ecótono Amazônia-Cerrado, o Centro de
Pesquisas Canguçu, Pium, Tocantins (9°56’S, 49°47’W), durante a estação seca (Fig. 1).
Fig. 1. Pontos de amostragem de temperatura corporal (Tc) de lagartos entre
1993 e 1999 (cinza escuro) e de amostragem de preferência térmica e
performance de lagartos entre 2014 e 2016 (cinza claro). Polígono
representa a área total da Amazônia.
12
As expedições tiveram um período mínimo de cinco dias (Los Amigos e Yasuni) e
máximo de 25 dias (FLONA Caxiuanã, estação chuvosa). Exceto por Los Amigos e
Yasuni, foram instalados sensores de temperatura (HOBO 2x External Temperature Data
Logger) na mata e em áreas abertas, com o intuito de se obter dados de temperatura
operativa dos animais (Top), ou a temperatura do 12uisa12ela12ona em que o organismo
se mantém em atividade. As temperaturas foram medidas a cada dois minutos durante
aproximadamente 15 dias por localidade, e a Top foi considerada a média das temperaturas
obtidas por hora do dia para cada HOBO instalado. Cada HOBO apresenta duas sondas,
que foram posicionadas de modo que uma delas sofresse o máximo de incidência
luminosa possível e a outra o mínimo, permitindo a estimativa do número de horas que
os lagartos podem se manter em atividade tanto nas manchas de sol quanto nas áreas com
cobertura vegetal.
A captura dos lagartos foi feita através dos métodos de busca ativa e armadilhas.
O primeiro método consiste na procura ativa dos indivíduos em campo, e para se coletar
o maior número de indivíduos e espécies diurnas possível, a estratégia de coleta foi
abranger diferentes microambientes potencialmente ocupados pelas espécies, verificando
a serapilheira, tocas e troncos de árvores, no período entre 08:00 e 17:00h. Espécies
noturnas foram eventualmente coletadas nas estações de trabalho, embora não fossem o
foco da amostragem. O tempo de coleta e a dimensão da área amostrada variaram por
localidade, de acordo com a infraestrutura local e equipe disponível. Foram dois tipos de
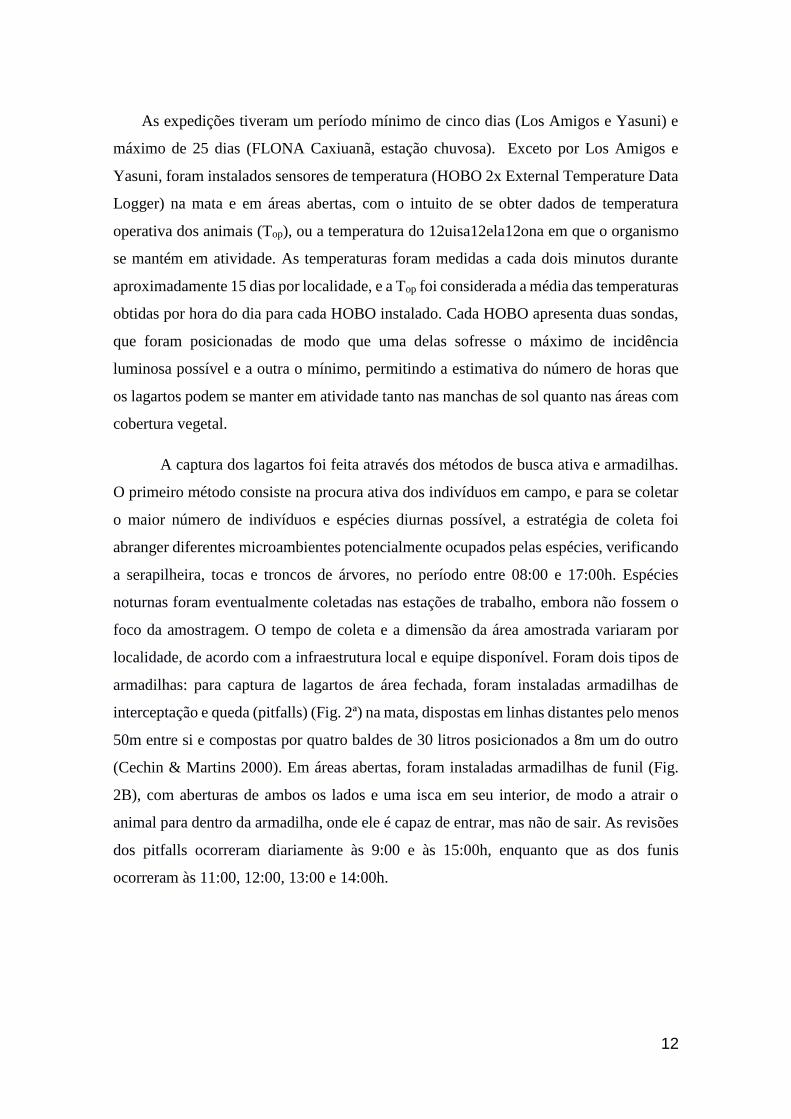
armadilhas: para captura de lagartos de área fechada, foram instaladas armadilhas de
interceptação e queda (pitfalls) (Fig. 2ª) na mata, dispostas em linhas distantes pelo menos
50m entre si e compostas por quatro baldes de 30 litros posicionados a 8m um do outro
(Cechin & Martins 2000). Em áreas abertas, foram instaladas armadilhas de funil (Fig.
2B), com aberturas de ambos os lados e uma isca em seu interior, de modo a atrair o
animal para dentro da armadilha, onde ele é capaz de entrar, mas não de sair. As revisões
dos pitfalls ocorreram diariamente às 9:00 e às 15:00h, enquanto que as dos funis
ocorreram às 11:00, 12:00, 13:00 e 14:00h.
13
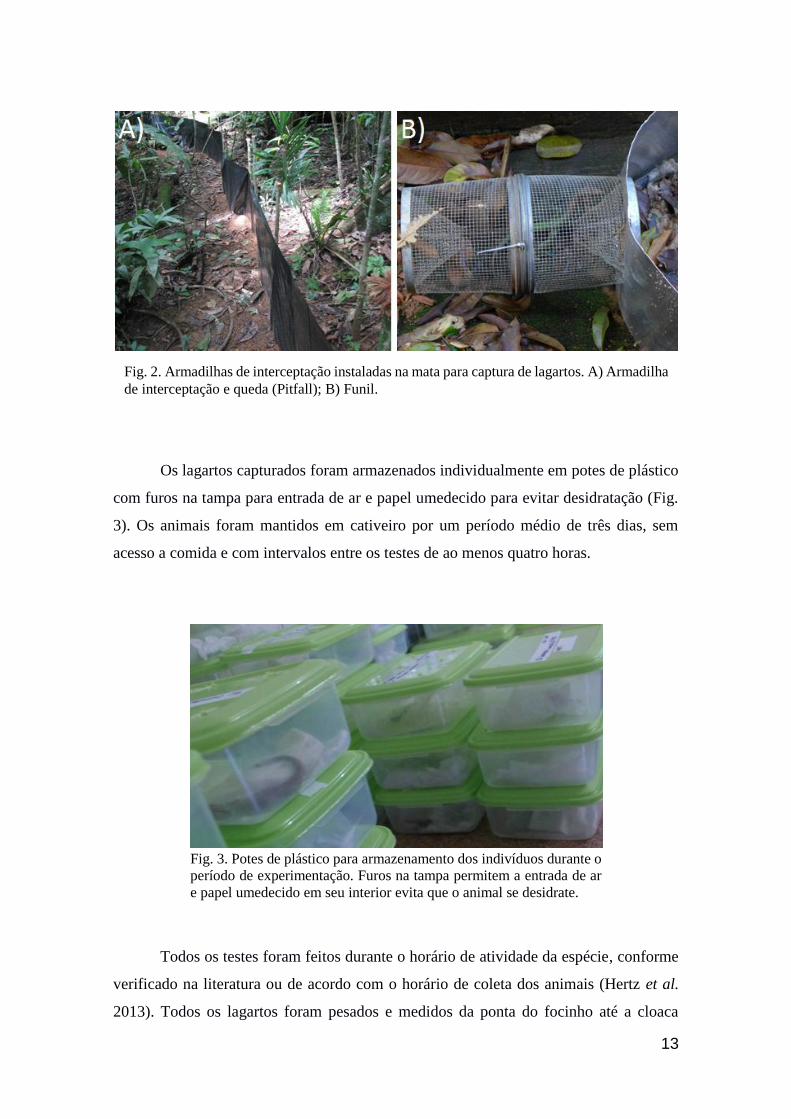
Os lagartos capturados foram armazenados individualmente em potes de plástico
com furos na tampa para entrada de ar e papel umedecido para evitar desidratação (Fig.
3). Os animais foram mantidos em cativeiro por um período médio de três dias, sem
acesso a comida e com intervalos entre os testes de ao menos quatro horas.
Todos os testes foram feitos durante o horário de atividade da espécie, conforme
verificado na literatura ou de acordo com o horário de coleta dos animais (Hertz et al.
2013). Todos os lagartos foram pesados e medidos da ponta do focinho até a cloaca
Fig. 2. Armadilhas de interceptação instaladas na mata para captura de lagartos. A) Armadilha
de interceptação e queda (Pitfall); B) Funil.
Fig. 3. Potes de plástico para armazenamento dos indivíduos durante o
período de experimentação. Furos na tampa permitem a entrada de ar
e papel umedecido em seu interior evita que o animal se desidrate.
14
(comprimento rostro-cloacal; CRC). Após o encerramento dos testes, os indivíduos que
sobreviveram foram liberados nos pontos em que foram capturados na mata, enquanto
que os indivíduos que morreram durante os experimentos foram fixados (Auricchio &
Salomão 2002) e depositados em coleções herpetológicas (Coleção Herpetológica
Oswaldo Rodrigues da Cunha, Museu Paraense Emílio Goeldi, Belém/PA; Coleção de
Anfíbios e Répteis do Instituto Nacional de Pesquisas da Amazônia, Manaus/AM;
Coleção Herpetológica da Universidade de Brasília, Brasília/DF; Reptiles and
Amphibians Collection from Monte L. Bean Life Science Museum, Provo/Utah, Estados
Unidos; e Colleción Científica de Anfíbios y Reptiles del Museo de Historia Narural de
la Universidad Nacional Mayor de San Marcos, San Marcos/Lima, Peru).
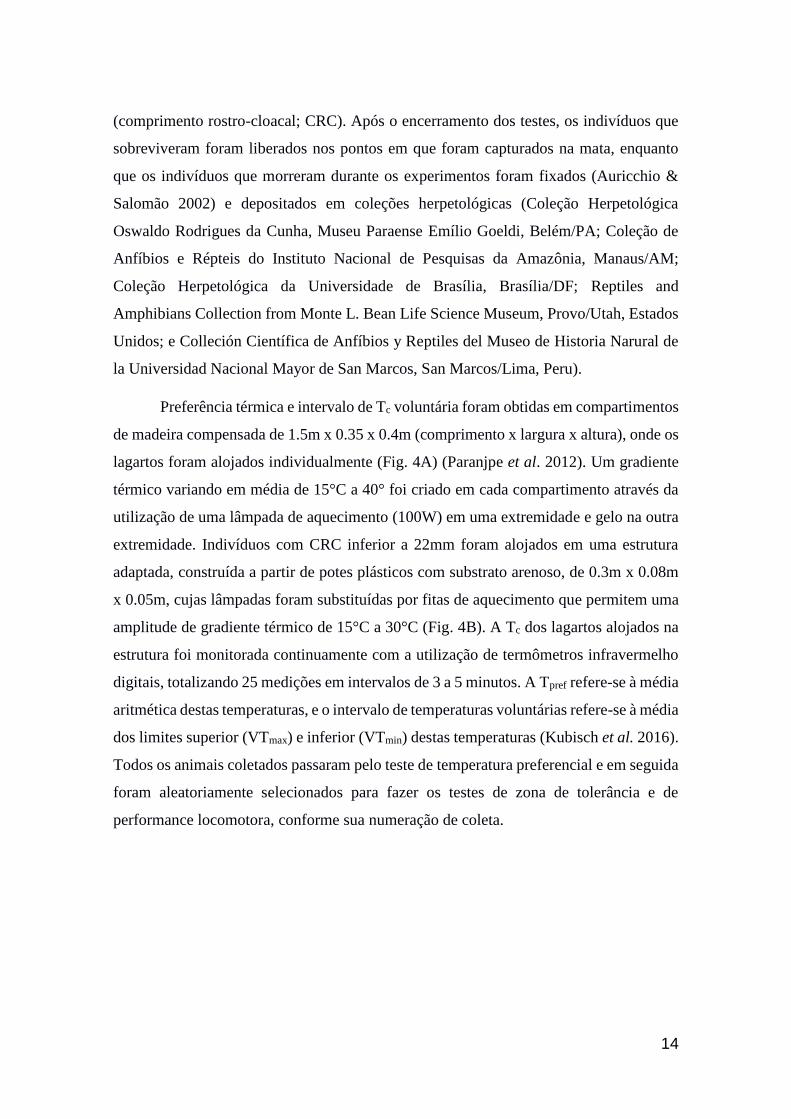
Preferência térmica e intervalo de Tc voluntária foram obtidas em compartimentos
de madeira compensada de 1.5m x 0.35 x 0.4m (comprimento x largura x altura), onde os
lagartos foram alojados individualmente (Fig. 4A) (Paranjpe et al. 2012). Um gradiente
térmico variando em média de 15°C a 40° foi criado em cada compartimento através da
utilização de uma lâmpada de aquecimento (100W) em uma extremidade e gelo na outra
extremidade. Indivíduos com CRC inferior a 22mm foram alojados em uma estrutura
adaptada, construída a partir de potes plásticos com substrato arenoso, de 0.3m x 0.08m
x 0.05m, cujas lâmpadas foram substituídas por fitas de aquecimento que permitem uma
amplitude de gradiente térmico de 15°C a 30°C (Fig. 4B). A Tc dos lagartos alojados na
estrutura foi monitorada continuamente com a utilização de termômetros infravermelho
digitais, totalizando 25 medições em intervalos de 3 a 5 minutos. A Tpref refere-se à média
aritmética destas temperaturas, e o intervalo de temperaturas voluntárias refere-se à média
dos limites superior (VTmax) e inferior (VTmin) destas temperaturas (Kubisch et al. 2016).
Todos os animais coletados passaram pelo teste de temperatura preferencial e em seguida
foram aleatoriamente selecionados para fazer os testes de zona de tolerância e de
performance locomotora, conforme sua numeração de coleta.
15
A Tot e e a zona de tolerância térmica foram obtidas por experimentos que
manipulam a Tc dos lagartos, de modo a alcançarem desde temperaturas extremas (limites
térmicos críticos) até temperaturas ideais para sua performance. Para medir a temperatura
ótima, foram feitos experimentos de desempenho locomotor, o qual pode ser limitado
tanto pela cinese contrátil muscular durante as corridas de velocidade/sprint (Bennett
1984; Marsh 1990), quanto pela capacidade de transporte de oxigênio nas corridas de
distância/endurance (Bennett 1982; Fry 1947), e está envolvido no escape de predadores,
na captura das presas e busca de companheiros para reprodução (Irschick & Garland
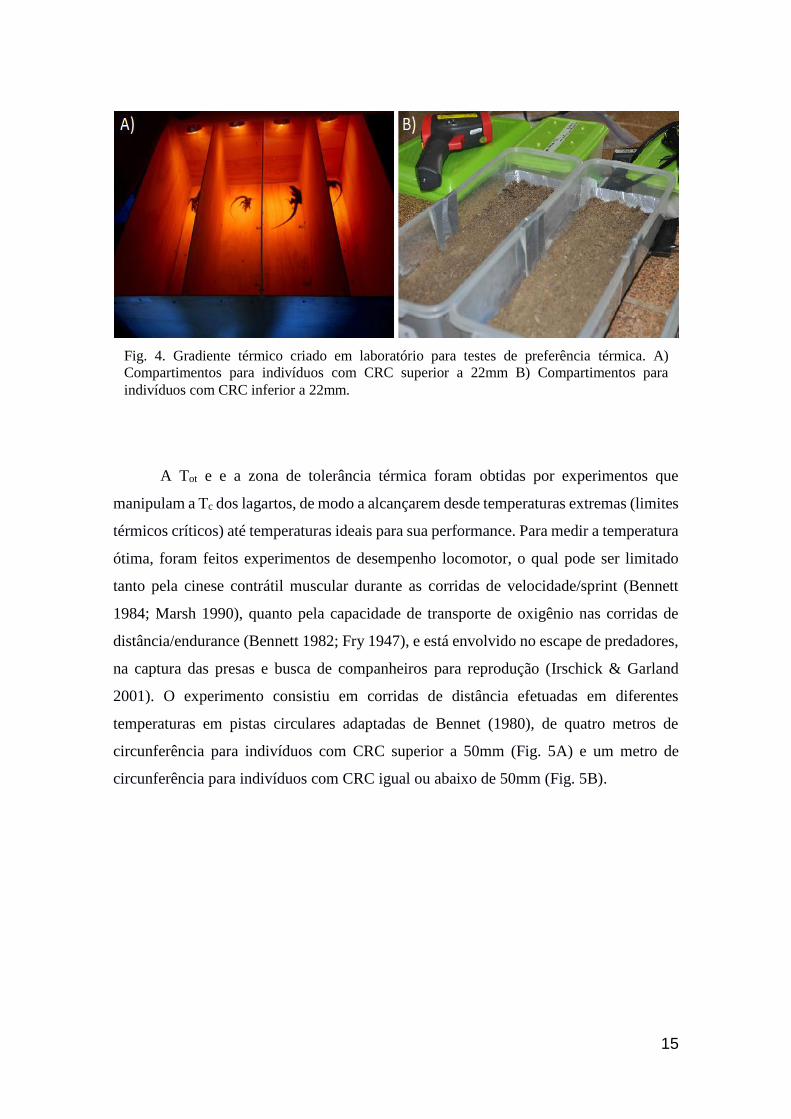
2001). O experimento consistiu em corridas de distância efetuadas em diferentes
temperaturas em pistas circulares adaptadas de Bennet (1980), de quatro metros de
circunferência para indivíduos com CRC superior a 50mm (Fig. 5A) e um metro de
circunferência para indivíduos com CRC igual ou abaixo de 50mm (Fig. 5B).
Fig. 4. Gradiente térmico criado em laboratório para testes de preferência térmica. A)
Compartimentos para indivíduos com CRC superior a 22mm B) Compartimentos para
indivíduos com CRC inferior a 22mm.
16
A pista maior foi construída a partir de uma base de compensado de madeira de
6mm de espessura e parede de aço inox com 60cm de altura e 0.6mm de espessura,
enquanto que a pista menor foi construída a partir de uma base de papelão e parede de
aço inox com 30cm de altura e 0.6mm de espessura. Ambas as pistas receberam substrato
arenoso para fornecer maior estabilidade ao animal durante a corrida, e foram demarcadas
a cada metro na pista maior e a cada 0.25m na pista menor. Lagartos heliotérmicos típicos
foram estimulados a correr em sete temperaturas distintas (15°, 20°, 25°, 30°, 35°, 40°,
43°C), enquanto termoconformadores e heliotérmicos de floresta foram estimulados a
correr em quatro temperaturas (20°, 25°, 30° e 35°C). Tais faixas de temperatura foram
obtidas a partir de testes preliminares de crítico térmico mínimo e máximo. O estímulo à
corrida se deu através da perseguição manual do animal a partir do seu ponto de partida.
O teste foi encerrado quando o indivíduo chegou à estafa, considerada o ponto em que o
animal não mais apresenta resposta locomotora ao ser posicionado em decúbito dorsal e
perde a capacidade de se desvirar (Fig. 6). Ao final do teste, verificou-se o tempo de
corrida e a distância percorrida, e com isso foi possível calcular a performance do
indivíduo através da divisão da distância (em metros) pelo tempo (em segundos). A
temperatura em que o animal apresenta a melhor performance foi considerada a sua Tot, a
qual fornece uma base para avaliar a significância mecânica da Tc e da Tpref (Dawson
1975).
Fig. 5. Pista de corrida para testes de desempenho locomotor. A) Pista para indivíduos com
Comprimento rostro-cloacal (CRC) superior a 50mm B) Pista para indivíduos com CRC
inferior a 50mm.
17
A zona de tolerância térmica, por sua vez, define os extremos de temperatura que
limitam a curva de performance térmica, fornecendo a faixa de temperatura dentro da
qual o animal pode sobreviver ou manter qualquer tipo de atividade (Angilletta et al.
2002). É a estatística descritiva reportada com mais frequência e está relacionada ao
conceito de adaptação de resistência, ou adaptação da viabilidade dos organismos
expostos a temperaturas extremas (Christophersen & Precht, 1953). Tais extremos são
definidos como “pontos térmicos em que as atividades locomotoras se tornam
desorganizadas e o animal perde sua habilidade de escapar de condições que prontamente
o levarão à morte” (Cowles & Bogert 1944), e são chamados de crítico térmico mínimo
e máximo (CTmin e CTmax). O experimento para se estimar o CTmin ocorreu a partir do
posicionamento do lagarto em uma câmara de resfriamento feita com gelo (Fig. 7A), sua
Tc foi monitorada a cada minuto, até o momento em que o animal não apresentou mais
resposta locomotora ao ser posicionado em decúbito dorsal. A temperatura medida neste
momento é considerada o CTmin. Para estimativa do CTmax, o indivíduo foi posicionado
em uma câmara de aquecimento feita com água aquecida (Fig. 7B), e o procedimento de
manipulação térmica ocorreu conforme o procedimento para cálculo do CTmin. Os CTmin
e CTmax considerados para cada espécie são resultado da média aritmética dos CTmin e
CTmax de todos os indivíduos testados para cada espécie.
Fig. 6. Posição de decúbito dorsal para verificação de ausência de
resposta locomotora após testes de tolerância térmica e desempenho
locomotor.
18
Dados de distribuição geográfica utilizados na modelagem do status de
vulnerabilidade e eventual risco de extinção local das espécies foram obtidos através de
revisão bibliográfica e em coleções herpetológicas, tais quais a Coleção Herpetológica
Oswaldo Rodrigues da Cunha, MPEG, Belém/PA, Coleção de Anfíbios e Répteis do
INPA, Manaus/AM e Coleção Herpetológica da UNB, Brasília/DF. Dados ambientais
para o presente e para cenários futuros (2050 e 2070) foram obtidos através do WorldClim
Database (Hijmans et al. 2005), na resolução de 2.5 arco-minutos. As previsões
fundamentaram-se no cenário de emissão de gás carbônico descrito como mais otimista
(RCP45) entre dois cenários intermediários considerados pelo IPCC (2014), e baseado
em fatores como tamanho populacional, atividade econômica, estilo de vida, uso
energético, padrões de utilização da terra, tecnologia e política climática. Neste cenário,
o aumento da temperatura global até o final do século XXI pode variar entre 1.1 e 2.6°C.
Todas as análises estatísticas foram efetuadas em ambiente R 3.3.1 (R
Development Core Team, 2012). A dependência entre as variáveis foi analisada por
regressão simples e análise de variância (ANOVA One-Way). As premissas de
normalidade e homogeneidade da variância para procedimentos paramétricos foram
verificadas usando testes de Shapiro e Levene, respectivamente. O sinal filogenético foi
calculado baseado na métrica K, que mede a força do sinal filogenético comparando-o
com uma expectativa analítica baseada na estrutura da árvore (topologia e comprimento
dos ramos, sendo aqui utilizada a topologia proposta por Zheng & Wiens 2016) e
assumindo modelo evolutivo de movimento browniano (Bloomerg et al. 2003). Uma
Fig. 7. Testes para definição da zona de tolerância térmica. A) Câmara de resfriamento para
definição do Crítico térmico mínimo (Ctmin) B) Aquecimento ao sol para definição do Crítico
térmico máximo (Ctmax).
19
evolução por movimento browniano significa que a variância entre as espécies se acumula
proporcionalmente a seu tempo de evolução independente, o qual é medido pelo
comprimento dos ramos que as separa (Felsenstein 1985, 2004).
As curvas de performance térmica foram geradas a partir do GAMM (Generalized
Additive Mixed Model), que por meio da regressão não-paramétrica modela efeitos
covariantes permitindo a adição de efeitos aleatórios à variável 19uisa19ela19 aditiva
(Lin 1999). Os critérios utilizados na seleção do modelo foram o Critério de Informação
de Akaike (AIC), que mede a qualidade do ajuste e a complexidade do modelo, e o
Critério de Informação Bayesiana (BIC), onde o número de observações também é levado
em consideração (Zuur et al. 2009). Foram testados diversas estruturas de correlação para
selecionar a melhor curva, como estruturas de correlação temporal (processo de auto-
regressão (corAR1), processo de auto-regressão contínuo (corCAR1) e processo de auto-
regressão com média móvel (corARMA)) e estruturas de correlação residual espacial
(correlação espacial de Gaussian (corGaus), correlação espacial exponencial (corExp),
correlação espacial quadrático-racional (corRatio) e correlação espacial esférica
(corSpher)). A melhor estrutura de correlação foi selecionada considerando os menores
valores de AIC e BIC fornecidos (Zuur et al. 2009).
Para a modelagem do status vulnerabilidade das espécies, foram utilizados dados
da literatura de Tc de 20 espécies, e dados de Vtmax e Ctmin de outras 17 espécies (Tabela
1). Para calcular as Hrs das espécies, a Top foi associada a Vtmax e Ctmin de cada espécie.
Para espécies que não tinham estes dados disponíveis, foi utilizado Tc ao invés de Vtmax
e um valor padrão de 10°C ao invés de Ctmin, calculado a partir da média de todos os Ctmin
disponíveis. Foi considerado como Hr o cumulativo de horas em que a Top excedeu a Vtmax
ou Tc, e tal característica foi calculada através da regressão logística generalizada,
conhecida como curva de Richards, que apresenta um parâmetro que viabiliza a definição
das curvas de modo a ser possível comparar tratamentos úteis (Richards 1959),
permitindo que o ponto de inflexão da curva fique em qualquer valor entre a assíntota
mínima e máxima (Birch 1999).
Para o cálculo do status de vulnerabilidade das espécies, foi utilizado um modelo de
distribuição que descreve as relações entre espécie e ambiente, considerando variáveis
ecológicas e ambientais para fazer projeções futuras sob o cenário mais realístico para as
mudanças climáticas (Thuiller et al. 2016). O modelo considera como variáveis
20
informativas a Vtmax (ou Tc), Ctmin (ou o valor padrão de 10ºC), o modo de
termorregulação e o CRC, e foi rodado através do pacote Biomod2 (Thuiller et al. 2016),
utilizando uma abordagem bioclimática, onde foram utilizadas como variáveis preditoras
o intervalo de temperatura médio diurno (Bio2), a sazonalidade da temperatura (Bio4), a
temperatura máxima do mês mais quente (Bio5), a precipitação anual (Bio12), a
precipitação do trimestre mais úmido (Bio16), a precipitação do trimestre mais quente
(Bio18) e a precipitação do trimestre mais frio (Bio19) (Hijmans et al. 2005). Foi adotada
a premissa geral de que o melhor indicador dos requerimentos climáticos de uma espécie
é seu nicho realizado, ou distribuição atual, assumindo que os nichos são conservativos
ao longo do tempo.
Tabela 1. Dados de Tamanho corporal (Comprimento Rostro-Cloacal, CRC),
Temperatura corporal (Tc), Temperatura voluntária máxima (Vtmax) e Crítico
térmico mínimo (Ctmin), por espécie, conforme o capítulo 1 do presente trabalho.
Número de indivíduos testados em parênteses.
Espécie
CRC
(mm) Tb Vtmax Ctmin
Alopoglossus angulatus 49.0 27.3 (10) - 9 (2)
Alopoglossus atriventris 53.0 28.2 (12) - -
Arthrosaura kockii 30.3 - 27.3 (44) 10.1 (29)
Arthrosaura reticulata 50.7 - 25.0 (45) 8.6 (19)
Cercosaura argulus 34.5 29.0 (13) - -
Cercosaura eigenmanni 45.5 29.7 (20) - -
Cercosaura oshaughnessyi 37.4 29.5 (13) - -
Chatogekko amazonicus 20.4 - 25.0 (119) 9.4 (37)
Cnemidophorus cryptus 65.4 - 28.3 (42) 8.4 (21)
Cnemidophorus gramivagus 56.0 37.6 (42) - -
Cnemidophorus lemniscatus 64.2 37.6 (96) - -
Copeoglossum nigropunctatum 92.5 - 30.3 (28) 10.9 (21)
Crocodilurus amazonicus 220.0 31.2 (30) - -
Dactyloa punctata 77.9 29.2 (32) - 8 (2)
Dactyloa transversalis 76.5 29.0 (12) - 10.6 (2)
Gonatodes hasemani 40.0 30.6 (22) - -
Gonatodes humeralis 36.7 - 27.0 (221) 8.5 (68)
Kentropyx altamazonica 85.0 36.0 (66) - -
Kentropyx calcarata 100.8 - 34.6 (48) 12.3 (27)
21
Foram utilizados quatro algoritmos para seleção daquele com melhores valores de
significância através de curvas ROC (Relative Operating Characteristic: ANN (Artificial
Neural Networks), GAM (Generalized Additive Model), GBM (Geometric Brownian
Motion) and GLM (Generalized Linear Model). As curvas ROC foram obtidas ao plotar
a sensibilidade (taxa de verdadeiros positivos ou ausência de erro de omissão) no eixo Y
e o valor 1 – especificidade (taxa de falso positivo ou o erro de sobreprevisão) para todos
os possíveis limites de corte (Giannini et al. 2012). Estas curvas permitem o cálculo da
área sob a curva (AUC), que fornece a medida da capacidade discriminatória do modelo,
permitindo interpretar seu resultado como a probabilidade do modelo prever corretamente
a presença e a ausência de dois pontos selecionados aleatoriamente (Fielding & Bell,
1997; Giannini et al. 2012).
Foi utilizado um valor padrão de 1000 pontos de pseudo-ausência para assegurar
a acurácia do modelo e gerar os mapas de distribuição (Lobo & Tognelli 2011). A
delimitação da área de ocorrência atual foi feita considerando dados de altitude obtidos
através do WorldClim (Hijmans et al. 2005), e o número de pontos de ocorrência (NPO)
foi definido considerando uma distância mínima de 2km entre os pontos. Os mapas foram
Kentropyx striata 91.6 35.7 (111) - -
Leposoma guianense 28.5 - 27.9 (25) 10.4 (15)
Leposoma osvaldoi 29.6 - 27.2 (11) 9.9 (9)
Leposoma percarinatum 32.3 - 25.8 (36) 9.3 (20)
Norops auratus 43.9 33.9 (36) - -
Norops fuscoauratus 43.6 - 27.7 (154) 8.4 (61)
Norops ortonii 44.0 - 28.7 (15) 9.7 (4)
Norops planiceps 55.7 - 29.3 (16) 9.6 (11)
Norops scypheus - 27.3 (10) - -
Norops tandai - 27.7 (33) - -
Norops trachyderma 53.1 27.8 (31) - -
Plica plica 109.1 - 27.7 (23) 9.3 (17)
Plica umbra 85.0 - 28.0 (22) 11.2 (16)
Tretioscincus agilis 52.2 - 28.9 (16) 11.1 (11)
Tropidurus hispidus 96.8 34.2 (130) - 13.2 (2)
Tupinambis teguixin 362.1 33.2 (11) - 17.1 (1)
Uracentron flaviceps 107.3 31.2 (22] - -
Uranoscodon superciliosus 108.9 - 29.5 (7) 11.3 (5)
22
cortados no polígono de latitudes e longitudes que envolvem toda a extensão da Amazônia
(8, -48; 8, -78; -14,-48; -14,-78; latitude, longitude), para torna-los mais informativos de
acordo com o objetivo do trabalho. Foram excluídas áreas para as quais as espécies são
incapazes de se expandir por apresentarem habitats inadequados ou barreiras
biogeográficas que impedem sua migração. Estas áreas foram selecionadas por espécie,
de acordo com sua distribuição geográfica, e então foi estimada a área de ocorrência das
espécies para 2050 e 2070, para definir seu percentual de expansão ou redução de área.
2.1. Aplicabilidade do modelo
O modelo recuperou mapas de distribuição potencial atual para Copeoglossum
nigropunctatum, Gonatodes humeralis e Tupinambis teguixin que não correspondem à
distribuição conhecida dessas espécies (Fig. 8). As três espécies são amplamente
distribuídas na Amazônia e, no entanto, uma grande parte da área onde essas espécies
ocorrem, especialmente na Amazônia ocidental, foi considerada desfavorável para sua
ocorrência. Além disso, a região dos llanos da Colômbia e Venezuela, onde há uma
vegetação aberta que limita a distribuição da fauna amazônica, apareceu como favorável,
especialmente para G. humeralis. Esses resultados precisam ser melhor investigados,
antes de se prosseguir com a avaliação sobre o risco de extinção futura dessas espécies.
Dentre as 34 espécies restantes, em 32 a área estimada pelo modelo, que
corresponde à área de ocorrência potencial, incluiu áreas onde a espécie não ocorre. Para
a maioria das espécies testadas foi recorrente a necessidade do corte na região noroeste
Fig. 8. Mapas de distribuição potencial de Copeoglossum nigropunctatum, Gonatodes
humeralis e Tupinambis teguixin no presente, de acordo com o modelo. Pontos indicam as
localidades de ocorrência e seta indica a região dos llanos. Regiões favoráveis em azul e
desfavoráveis em vermelho.
23
da Colômbia, onde estão presentes os llanos. Em outros casos, a espécie tem distribuição
limitada a uma parte da Amazônia (ao menos em parte possivelmente por questões
históricas), embora outras áreas, de acordo com o modelo gerado, pudessem ser
adequadas a sua ocorrência. Nesses casos, não havendo continuidade das áreas
favoráveis, essas áreas adicionais foram cortadas.
Duas entre as cinco espécies com status de ocorrência positivo, com previsão de
expansão territorial nos próximos anos, apresentaram resultados controversos. Dactyloa
transversalis apresenta uma expansão contida em 2050 (2.4%), que aumenta
exponencialmente até 2070, chegando a 134.3% (Fig. 9A). Isso significa que a espécie
expandiria mais de duas vezes a sua área de ocorrência só nos 20 anos entre 2050 e 2070,
o que parece irreal, visto que a espécie apresenta um alto número de Hr (11h), o que
impediria sua locomoção por longos períodos. Leposoma guianense apresenta uma
expansão de 107.3% de área até 2050, ou 194948km², embora apresente uma perda
substancial de áreas onde ocorre atualmente. Esse mesmo padrão se mantém para 2070,
chegando a uma expansão de 122.7% de área, apesar de mais perdas de áreas de
ocorrência atual (Fig. 9B). Valores de expansão muito altos não condizem com a biologia
de L. guianense, que por sua vez é uma espécie 23uisa23ela23onal23ras bastante
diminuta, alcançando no máximo 37mm (Ávila-Pires 1995), o que dificulta a locomoção
para longas distâncias. Além disso, o modelo considera uma possível migração das
populações do centro-sul do Pará e do sul do Amapá ao longo do litoral à norte, se
expandindo pela Ilha do Marajó, a qual é rodeada por rios que caracterizam barreiras para
a expansão da espécie (Ávila-Pires et al. 2012). As outras três espécies com expansões
previstas pelo modelo apresentaram resultados mais consistentes, os quais estão descritos
no capítulo 2 do presente estudo.
24
Dentre as 29 espécies que apresentaram status de ocorrência negativos, havendo
portanto perda de área de ocorrência até 2070, três apresentaram resultados controversos.
O modelo previu uma redução da perda de área de 2050 para 2070 em Norops planiceps
e N. scypheus. Para N. planiceps, foi previsto que a espécie sofreria uma redução de
12540km² na sua área de ocorrência até 2050, porém este valor diminuiu para 2070,
chegando a 8216km² (Fig. 10A). No caso de N. scypheus, essa diferença seria de
83311km² em 2050 para 76349km² em 2070 (Fig. 10B). Ambas as espécies apresentam
Vtmax/Tc baixas (29.3°C e 27.3°C), associadas a Hr baixos (1.3h e 2.5h). Nove espécies
apresentaram características fisiológicas semelhantes às de N. planiceps e N. scypheus,
porém, em todas elas, o modelo recuperou resultados mais consistentes, com reduções de
área contínuas entre as previsões. As duas espécies com previsões controversas foram
modeladas com um baixo NPO (46 e 40, respectivamente), enquanto o NPO das nove
espécies de fisiologia semelhante variou de 70 em N. trachyderma a 590 em N.
fuscoauratus. Desta forma, este resultado pode ser um reflexo de uma possível sub-
amostragem das espécies. Outra possível explicação é a distribuição disjunta de ambas as
espécies, que apresentam populações bastante distantes entre si, o que poderia acarretar
em algum viés nas análises. Porém, este padrão de distribuição pode ser apenas um
artefato da sub-amostragem.
Fig. 9. Modelagem de distribuição geográfica com previsões de expansão territorial para 2050
e 2070 A) Dactyloa transversalis B) Leposoma guianense. Regiões favoráveis em azul e
desfavoráveis em vermelho.
25
Cercosaura oshaughnessyi apresenta um padrão de distribuição expresso
graficamente inconsistente com a área de ocorrência estimada pelo modelo (Fig. 11). No
mapa, a espécie parece migrar para uma área mais ao sul, para então estender-se a leste
de sua distribuição, entre os estados do Acre e oeste do Amazonas. Apesar disso, o
modelo recupera uma perda de 78% da área de ocorrência da espécie até 2070, ou
6659km². Não foi encontrada uma explicação viável para este problema, haja visto que
as análises são feitas a partir do mesmo banco de dados, o que em princípio tornaria tal
inconsistência impossível. Por conta disso, o caso singular desta espécie foi documentado
e enviado aos desenvolvedores do modelo, para que o problema seja elucidado e
resolvido.
Fig.10. Modelagem de distribuição geográfica de A) Norops planiceps e B) Norops scypheus.
Regiões favoráveis em azul e desfavoráveis em vermelho.
Fig. 11. Modelagem de distribuição geográfica de Cercosaura oshaughnessyi. Regiões
favoráveis em azul e desfavoráveis em vermelho.
26
3. Conclusões gerais
Todas as características fisiológicas avaliadas (Tc, Tpref, Vtmin, Vtmax, Tot, Ctmin e
Ctmax) apresentaram diferenças entre os modos de termorregulação, CRC, famílias e
espécies. Três delas (Tpref, Tc e Vtmin) apresentaram K < 1, o que significa que tais
características exibem menos sinal filogenético que o esperado sob um modelo
estocástico simples de evolução dos caracteres. Foram recuperadas correlações
26uisa26ela26 entre todas as variáveis, exceto por 1) Tot, que não apresenta correlação
com Ctmax, e 2) Ctmin, que só apresentou correlação com Tot.
A maioria das espécies apresentou Tc>Tpref, embora esses valores difiram menos
em termoconformadores que em heliotérmicos. A curva de performance térmica foi
calculada para dez espécies, e sete delas apresentaram Tc<Tot, enquanto outras três
apresentaram o inverso, com Tc aparecendo em um platô dentro da curva. Ctmax está entre
6-12°C acima dos valores médios de Tc, e entre 4-11°C acima de seus valores máximos
para a maioria das espécies, com exceção de Kentropyx calcarata, que apresenta
diferença de 0.5°C, e Tropidurus hispidus, que apresenta diferença de 3.5°C.
Apesar de ter encontrado diferenças significativas entre os modos de
termorregulação, as características térmicas de heliotérmicos e termoconformadores estão
intercaladas na escala de valores e portanto não formam categorias completamente
separadas, como observado por Pough & Gans (1982). Teídeos são heliotérmicos
“típicos”, alcançando altas Tcs ao termorregularem diretamente ao sol, mas
gimnophthalmídeos como Arthrosaura kockii e Tretioscincus agilis termorregulam no sol
filtrado pelas árvores nas florestas, o que resulta em Tcs mais baixas que as dos teídeos,
mas ainda acima a maioria das temperaturas ambientais dentro da floresta. O mesmo
ocorre para os tropidurídeos termoconformadores Plica plica e P. umbra. A maioria dos
termoconformadores apresentam Tcs ligeiramente acima da temperatura do substrato e da
temperatura do ambiente, o que indica a seleção de pontos mais quentes para ganhar calor
adicional do ambiente. Portanto, tais espécies não podem ser consideradas
termoconformadoras em stricto sensu.
Dentre as 69 espécies com dados fisiológicos disponíveis, seja na literatura ou por
conta das expedições feitas durante o desenvolvimento do trabalho, foi possível testar a
aplicabilidade do modelo de distribuição em 37. As melhores modelagens foram feitas
27
pelo algoritmo GBM, exceto em três espécies melhor modeladas pelo ANN e outras três
pelo GLM. Embora se saiba que a expressividade do algoritmo GBM é maior que a dos
demais algoritmos, o que significa que este algoritmo expressa as relações complexas
entre os dados com mais habilidade (Elith et al. 2006), não foi possível concluir o motivo
pelo qual GBM foi o mais representativo entre os demais algoritmos, haja visto que tanto
GLM quanto ANN possuem suas próprias características positivas.
A impossibilidade de se prever o status de ocorrência de algumas espécies no
futuro por conta da incapacidade do modelo de assimilar diferentes ambientes térmicos
como favoráveis a uma mesma espécie foi atribuída ao fato destas espécies serem
amplamente distribuídas, o que confirma a indicação de Hernandez et al. (2006) de que
espécies ecologicamente especializadas seriam mais fáceis de se modelar. Portanto, para
tais espécies se faz necessário um ajuste do modelo, de modo que seja possível considerar
toda a extensão de sua distribuição, mesmo que esta abranja diferentes ambientes
térmicos.
O modelo aqui utilizado não levou em consideração diversos aspectos também
importantes para a ocorrência de uma espécie, como por exemplo o tipo de vegetação
onde o animal vive. Um novo tratamento do modelo, que vem sendo desenvolvido,
promete caminhar para uma abordagem mais abrangente ao considerar não somente
dados bioclimáticos e de fisiologia, mas também dados de ecologia, aclimatação e
habilidade de persistência das espécies (Sinervo, B., comunicação pessoal, Julho 2016),
além de considerar dados de evapotranspiração das plantas como variável preditiva, o que
permitirá a delimitação de áreas favoráveis e desfavoráveis considerando a vegetação
local. Isso possivelmente sanará os problemas apresentados e tornará a modelagem mais
precisa.
Foram previstas as distribuições futuras de 29 espécies, tendo em vista as
alterações climáticas projetadas. Destas, três espécies apresentaram um status de
ocorrência positivo. As três espécies são heliotérmicas que vivem em ambientes de
vegetação aberta, mas outras espécies com as mesmas características sofreram redução
de área. Em duas dessas espécies a expansão se deu até 2050, enquanto de 2050 para 2070
ocorreu redução de área, indicando que, com as temperaturas previstas em 2070, o
ambiente começa a tornar-se menos favorável para essas espécies.
28
Considerando todas as espécies com perda de área prevista, heliotérmicos
apresentam valores de Hr menores e Tc/Vtmax maiores que termoconformadores, e também
maiores valores percentuais de área perdida, embora a diferença para as previsões de 2070
sejam de apenas 2.7%. Além disso, Alguns heliotérmicos apresentam valores baixos de
percentual de perda de área, enquanto alguns termoconformadores, por sua vez,
apresentam valores mais altos. Com isso, no presente trabalho foram previstos
percentuais de perda de área tanto altos quanto baixos para ambos heliotérmicos e
termoconformadores, o que concorda com a hipótese proposta por Sinervo et al. (2010)
de que o risco de extinção não está relacionado ao modo de termorregulação. Além disso,
20 de nossas espécies com reduções de área previstas apresentam baixos valores de Hr, e
19 espécies apresentam baixos valores de Tc/Vtmax, características consideradas
significativas pelos autores para o aumento do risco de extinção das espécies de lagartos.
Sinervo et al. (2010) calcularam probabilidades de extinções locais e as
projetaram para o cálculo da probabilidade de extinção das espécies, o que resultou na
previsão de extinção de 20% das espécies testadas até 2080. Não foi calculado o risco de
extinção à nível específico no presente trabalho, porém as restrições de ocorrência
previstas no segundo capítulo foram extremamente altas, variando de 50,5% a 96,5%, e
portanto podem pôr as espécies avaliadas em risco de extinção, caso se concretizem.
Mesmo considerando as limitações do modelo utilizado, o resultado é preocupante e
reforça a necessidade tanto de mais estudos, visando melhorar nosso entendimento sobre
as consequências do aquecimento global sobre a fauna, como de elaboração de políticas
de conservação que levem em consideração esses efeitos. As previsões aqui apresentadas
não levam em conta fatores como a perda de habitat devido ao desmatamento ou outras
formas de degradação ambiental, seja na área atual de ocorrência da espécie, seja nas
áreas onde as projeções indicam expansão de ambientes favoráveis. Considerando a
tendência atual de que áreas não protegidas – seja como unidades de conservação ou terras
indígenas – tornem-se ambientes altamente antropizados, sem um planejamento adequado
há uma grande chance de que as espécies não tenham para onde se expandir em busca das
áreas mais favoráveis previstas pelos modelos.
29
Referências bibliográficas
Addo-Bediako, A, Chown, S. L., & Gaston, K. J., 2000. Thermal tolerance,
climatic variability and latitude. Proceedings. Biological Sciences / The Royal Society,
2671445, 739–745.
Angilletta, M. J. Jr, Bennett, A. F., Guderley, H., Navas, C. A. Seebacher, F. &
Wilson, R. S., 2006. Coadaptation: a unifying principle in evolutionary thermal biology.
Journal of Thermal Biology, 79, 282-294
Angilletta, M. J. Jr, Niewiarowski, P. H., Navas, C. A., 2002. The evolution of
thermal physiology in ectotherms. Journal of Thermal Biology, 27, 249-268.
Aertsen, W., Kint, V., Van Orshoven, J., Ozkan, K. & Muys, B. 2010. Comparison and ranking of different modelling techniques for prediction of site index in
Mediterranean mountain forests. Ecological Modelling 221: 1119–1130.
Auricchio, P. & Salomão, M. G. (Eds.), 2002. Técnicas de Coleta e Preparação
de Vertebrados. São Paulo: Terra Brasilis. 350p.
Ávila-Pires, T. C. S., 1995. Lizards of Brazilian Amazonia (Reptilia: Squamata).
Zoologische verhandelingen 299.1: 1-706.
Ávila-Pires, T. C. S., Mulcahy, D. G., Werneck, F. P. & Sites Jr., J. W. 2012.
Phylogeography of the Teiid lizard Kentropyx calcarata and the Sphaerodactylid
Gonatodes humeralis (Reptilia:Squamata): Testing a geological scenario for the lower
Amazon-Tocantins basins, Amazonia, Brazil. Herpetologica, 68(2): 272-287.
Baker, L. A., & F. N. White. 1970. Redistribution of cardiac output in response
to heating in Iguana iguana. Comp. Biochem. Physiol. 35:253-262.
Bartholomew, A., 1966. A field study of temperature relations in the Galapagos
Marine Iguana. Copeia, 1966: 241-250.
Bellard, C., Bertelsmeier, C., Leadley, P., Thuiller, W., Courchamp, F., 2012.
Impacts of climate change on the future of biodiversity. Ecol. Lett. 15, 5–377.
Bennet, K. D., 1990. Milankovitch Cycles And Their Effects On Species In
Ecological and Evolutionary Time. Paleobiology, vol. 16, n°1: 11-21.
Bennett, A. F. 1980. The thermal dependence of lizard 29uisa29el. Animal
Behaviour, 28:752-762.
30
Bennett, A. F., 1982. The energetics of reptilian activity. Pp. 155-199. In C. Gans
and F. H. Pough (Eds.), Biology of the Reptilia, Vol. 13. Academic Press, London.
Bennett, A. F., 1984. Thermal dependence of muscle function. American Journal
of Physiology-Regulatory, Integrative and Comparative Physiology, 247(2), R217-R229.
Berger, A., 1978. Long-term variation of caloric insolation resulting from the
earth’s orbital elements. Quaternary research 9:139-167.
Birch, C. P. D., 1999. A New Generalized Logistic Sigmoid Growth Equation
Compared with the Richards Growth Equation. Annals of Botany, 83:713-723.
Bloomerg, S. P., Garland, T. & Ives, A. R., 2003. Testing for phylogenetic signal
in comparative data: behavioral traits are more labile. Evolution, 57(4): 717, 745.
Bogert, C. M., 1959. How reptiles regulate their body temperature. Scientific
American 200: 105-120.
Bogert, C.M., 1949. Thermoregulation in reptiles: a factor in evolution. Evolution
3:195-211
Buckley, L. B., 2008. Linking traits to energetics and population dynamics to
predict lizard ranges in changing environments. The American Naturalist, 1711, E1–E19.
Burton, J., 1975. The effects of recent climatic change on British insects. Bird
Study 22:203–4
Cechin, S. Z. & Martins, M., 2000. Eficiência de armadilhas de queda Pitfalls
traps em amostragens de anfíbios e répteis no Brasil. Revista Brasileira de Zoologia
17:729-740.
Chambers, F. & Ogle, M. eds. 2002. Climate Change: Critical concepts in the
environment. Volume I. Taylor & Francis, 1:322.
Christophersen, J., & Precht, H, 1953. Die Bedeutung des Wassergehaltes der
Zelle für Temperaturanpassungen. Biol. Zbl., 72, 104-119.
Cowles, R. B., & Bogert, C. M., 1944. A preliminary study of the thermal
requirements of desert lizards. Bull. Am. Mus. Nat. Hist, 831, 265–296.
31
Crowley, S. R. 1985. Thermal sensitivity of sprint running in the lizard Sceloporus
undulatus: Support for a conservative view of thermal physiology. Oecologia 66:219-22
Dawson, W. R., 1975. On the physiological significance of the preferred body
temperatures of reptiles. In Perspectives of biophysical ecology. Springer Berlin
Heidelberg. Pp. 443-473
Dewitt, C. B., 1967. Precision of thermoregulation and its relation to environmental
factors in the Desert Iguana, Dipsosaum dorsalis. Physiol. Zool., 40: 49-66.
Dobzhansky, T. H., 1943. Genetics of natural populations. IX. Temporal changes
in the composition of populations of Drosophila pseudoobscura. Genetics 28:162–86
Dobzhansky, T.H., 1947. A response of certain gene arrangements in the third
chromosome of Drosophila pseudoobscura to natural selection. Genetics 32:142–60
Du, W. G., Yan, S. J., & Ji, X., 2000. Selected body temperature, thermal tolerance
and thermal dependence of food assimilation and locomotor performance in adult blue-
tailed skinks, Eumeces elegans. Journal of Thermal Biology, 25(3), 197-202.
Elith, J., Graham, C. H., Anderson, R. P., Dudík, M., Ferrier, S., Guisan, A.,
Hijmans, R. J., Huettmann, F., Leathwick, J. R., Lehmann, A., Li, J., Lohmann, L.,
Loiselle, B. A., Manion, G., Moritz, C., Nakamura, M., Nakazawa, Y., Overton,
Mc.C., Townsend Peterson, A., Philips, S. J., Richardson, K., Scachetti-Pereira, R.,
Schapire, R. E., Soberón, J., Williams, S., Wisz, M. S. & Zimmermann, N. E. 2006.
Novel methods improve prediction of species’ distributions from occurrence data.
Ecography, 29:129-151.
Eva, H. D., Huber, O., Achard, F., Balslev, H., Beck, S., Behling, H., ... &
Duivenvoorden, J. F., 2005. A proposal for defining the geographical boundaries of
Amazonia. Office for Official Publications of the European Communities, pp 1-52.
Felsenstein, J., 1985. Phylogenies and the comparative method. The American
Naturalist, 125:1–15.
Felsestein, J., 2004. Inferring phylogenies. Sinauer, Sunderland, Massachusetts.
Fielding, A. H., & Bell, J. F., 1997. A review of methods for the assessment of
prediction errors in conservation presence/absence models. Environmental Conservaton,
24(1): 38-49.
Ford E.B., 1945. Butterflies. London: Collins.
32
Fry, F. E. J., 1947. Effects of the environment on animal activity. University of
Toronto Studies in Biology 55:1–62.
33
Gaston, K. J., Chown, S. L., Calosi, P., Bernardo, J., Bilton, D. T., Clarke, A.,
Clusella-Trullas, S., Ghalambor, C. K., Konarzewski, M., Peck, L. S., Porter, W. P.,
Pörtner, H. O., Rezende, E. L., Schulte, P. M., Spicer, J. I., Stillman, J. H.,
Terblanche, J. S., Kleunen, M. V., 2009. Macrophysiology: a conceptual reunification.
Am. Nat. 174, 595–612.
Ghalambor, C. K., Huey, R. B., Martin, P. R., Tewksbury, J. J., & Wang, G.,
2006. Are mountain passes higher in the tropics? Janzen’s hypothesis revisited.
Integrative and Comparative Biology, 461, 5–17.
Giannini, T. C., Siqueira, M. F., Acosta, A. L., Barreto, F. C., Saraiva, A. M.,
Alves-dos-Santos, I., 2012. Current challenges of species distribution predictive
modelling.Rodriguésia, 63(3):733-749.
Grinnell J., 1917. Field tests of theories concerning distributional control. Am. Nat.
51:115–28
Hammel, T., Caldwell, F. T. & Abrams, R. M., 1967. Regulation of body
temperature in the Blue-Tongued Lizard. Science, 156: 1260-1262.
Harlow, H. J., S. S. Hillman, & M. Hoffman. 1976. The effect of temperature on
the digestive efficiency in the herbivorous lizard, Dipsosaurus dorsalis. J. Comp. Physiol.
111:1-6.
Heath J., 1974. A century of changes in the 33uisa33ela33o. In The Changing Flora
and Fauna of Britain, ed. DL Hawkesworth, 6:275–92. London: Syst. Assoc.
Heath, J., 1965. Temperature regulation and diurnal activity in horned lizards.
University of California Publ. Zool., 64: 97-136.
Heatwole, H. & Taylor, J. 1987. Ecology of reptiles. 2nd edition. Surrey Beatty &
Sons, Chipping Norton, NSW.
Heatwole, T. H. Lin, E. Villalon, A. Muniz. & Matta, A., 1969. Some aspects of
the thermal ecology of Puerto Rican Anoline lizards. J. Herpetol., 3: 65-77.
Hernandéz, P. A., Graham, C. H., Master, L. L. & Albert, D. L., 2006. The
effect of sample size and species characteristics on performance of different species
distribution modeling approach. Ecography 29:773-785.
Hertz P.E, Huey R. B. & Nevo, E., 1983. Homage to Santa Anita: thermal
sensitivity of sprint speed in agamid lizards. Evolution 37: 1075-1084.
34
Hertz, P. E., Azima, Y., Harrison, A., Huey, R. B., Losos, J. B., & Glor, R. E.
2013. Asynchronous evolution of physiology and morphology in Anolis lizards. Evolution
67-7:2101-2113.
Hijmans, R. J., Cameron, S. E., Parra, J. L., Jones, P. G. & Jarvis, A., 2005.
Very high resolution interpolated climates surfaces for global and land areas.
International Journal of Climatology, 25:1965-1978.
Hof, C., Araujo, M.B., Jetz, W., Rahbek, C., 2011. Additive threats from
pathogens, climate and land-use change for global amphibian diversity. Nature 480, 516–
519. (doi:10.1038/nature10650)
Hoffmann, A. A, & Sgrò, C. M., 2011. Climate change and evolutionary
adaptation. Nature, 4707335, 479–485.
Hoffmann, A. A., Hallas, R. J., Dean, J. A., Schiffer, M., 2003. Low potential for
climatic stress adaptation in a rainforest Drosophila species. Science 301:100-102.
Huey, R. B., 1982. Temperature, physiology, and the ecology of reptiles. In C.
Gans and F. H. Pough, eds. Biology of the Reptilia. Vol. 12, Pp 25–91. Physiology I.
Academic Press, London.
Huey, R. B. & Kingsolver, 1989. Evolution of thermal sensitivity of ectotherm
performance. Trends Ecol. Evol. 4, 131-5.
Huey, R. B. & Slatkin, M. 1976. Cost and Benefits of Lizard hermoregulation. The
Quarterly review of Biology, 513, 363–384.
Huey, R. B., & Stevenson, R. D., 1979. Integrating thermal physiology and
ecology of ectotherms: A discussion of approaches. American Zoologist, 19, 357–366.
Huey, R. B., Deutsch, C. A, Tewksbury, J. J., Vitt, L. J., Hertz, P. E., Alvarez
Pérez, H. J., & Garland, T., 2009. Why tropical forest lizards are vulnerable to climate
warming. Proceedings. Biological Sciences / The Royal Society, 2761664, 1939–1948.
Hutchinson, G.E. 1957. Concluding remarks. Cold Spring Harbor Symposium on
Quantitative Biology, 22, 415–457.
IPCC, 2014. Climate Change 2014: Synthesis Report. Contribution of Working
Groups I, II and III to the Fifth Assessment Report of the Intergovernmental Panel on
Climate Change. Core Writing Team, R.K. Pachauri and L.A. Meyer (eds.). IPCC,
Geneva, Switzerland, 151 pp.
35
Irschick, D. J., & T. Garland Jr. 2001. Integrating function and ecology in studies
of adaptation: investigations of locomotor capacity as a model system. Annual Review of
Ecology and Systematics 32:367–396.
Isla, F. I. 1998. Los fantasmas del planeta. Ciencia Hoy, v. 8, n. 46, p. 58-64.
Janzen, D. H., 1967. Why mountain passes are higher in the tropics. Am. Nat.
101:233-249.
Kaisila, J., 1962. Immigration und Expansion der Lepidopteren in Finnland in den
Jahren 1869–1960. Acta Entomol. Fenn. 18:1–452
Kalela, O., 1949. Changes in geographic ranges in the avifauna of northern and
central Europe in response to recent changes in climate. Bird-Band. 20:77–103
Kalela, O., 1952. Changes in the geographic distribution of Finnish birds and
mammals in relation to recent changes in climate. In The Recent Climatic Fluctuation in
Finland and its Consequences: A Symposium, ed. I Hustichi, pp. 38–51. Helsinki: Fennia
Kiefer, M.C.; Van Sluys , M. & Rocha , C.F.D. 2007. Thermoregulatory
35uisa35el in Tropidurus torquatus (Squamata, Tropiduridae) from Brazilian coastal
populations: an estimate of passive and active thermoregulation in lizards. Acta
Zoologica, 88: 81-87.
Kubisch, E. L., Corbálan, V., Ibargüengoytía, N. R. & Sinervo, B. 2016. Local
extinction risk of three species of lizard from Patagonia as a result of global warming.
Canadian Journal of Zoology, 94:49-59.
Li, X. & Wang, Y. 2013. Applying various algorithms for species distribution
modeling. Integrative Zoology, 8:124-135.
Licht, P., W. R. Dawson, V. H. Shoemaker, and A. R. Main. 1966. Observations
on the thermal relations of Western Australian lizards. Copeia 1966:97-110.
Light, P., 1966. Reproduction in lizards: Influence of temperature on
photoperiodism in testicular recrudescence. Science 154:1668-1670.
Lobo, J.M. & Tognelli, M.F. 2011. Exploring the effects of quantity and location
of pseudo-absences and sampling biases on the performance of distribution models with
limited point occurrence data. Journal for Nature Conservation 19: 1-7
36
Marengo, J A. 2006. Mudanças climáticas globais e seus efeitos sobre a
biodiversidade: caracterização do clima atual e definição das alterações climáticas para o
território brasileiro ao longo do século XXI. Brasília: MMA, 1:209.
Marsh, R. L., 1990. Deactivation rate and shortening velocity as determinants of
contractile frequency. American Journal of Physiology-Regulatory, Integrative and
Comparative Physiology, 259(2), R223-R230.
Paranjpe, D. A., Cooper, R. D., Patten, A. & Sinervo, B., 2012 Measuring
thermal profile of reptiles in laboratory and field. In Proceedings of Measuring Behavior
2012, 8th 36uisa36ela36onal Conference on Methods and Techniques in Behavioral
Research Utrecht, The Netherlands, August 28-31
Paranjpe, D. A., Bastians, E., Patten, A., Cooper, R. D., & Sinervo, B., 2013.
Evidence of maternal effects on temperature preference in side-blotched lizards:
Implications for evolutionary response to climate change. Ecology and Evolution,
37:1977–1991.
Parmesan, C., 2006. Ecological and Evolutionary Responses to Recent Climate
Change. Ann. Rev. Ecol. Evol. Syst. 37:637-69.
Pearson, R. G. & Dawson, T. P. 2003. Predicting the impacts of climate change
on the distribution of species: are bioclimate envelope models useful? Global Ecology &
Biogeography, 12:361-371.
Pough, F. H. and Gans, C. 1982. The vocabulary of reptilian thermoregulation. In
Gans, C. and Pough, F. H. (Eds): Biology of the Reptilia, Vol. 12: Physiological Ecology,
pp. 17–23. Academic Press, New York, NY.
R Development Core Team., 2012. R: A Language and environment for statistical
computing. R Foundation for Statistical Computing, Vienna, Austria. www.R-project.org
Revell, L. J., Harmon, L. J. & Collar, D. C. 2008. Phylogenetic Signal,
Evolutionary Process and Rate. Systematic Biology, 57(4): 591-601.
Richards, F. J., 1959. A flexible growth function for empirical use. Journal of
Experimental Botany, vol 10(29): 290-300.
Ruibal, R., 1961. Thermal relations of five species of tropical lizards. Evolution
15:98-111.
Salomonsen, F., 1948. The distribution of birds and the recent climatic change in
the North Atlantic area. Dansk. Orn. Foren. Tidsskr. 42:85–99
37
Scheffers, B.R., Edwards, D.P., Diesmos, A., Williams, S.E. & Evans, T.A.,
2014. Microhabitats reduce animal’s exposure to climate extremes. Global Change
Biology, 20, 495–503.
Seebacher, F. & Franklin, C. E., 2005. Physiological mechanisms of
thermoregulation in reptiles: a review. J. Comp. Physiol. B. 175:533-541.
Silva, J. M. C., Rylands, A. B., Fonseca, G. A. B., 2005. O destino das áreas de
endemismo da Amazônia. Megadiversidade, 1: 124-131.
Sinervo, B., Méndez-de-la-Cruz, F., Miles, D. B., Heulin, B., Bastiaans, E.,
Villagrán-Santa Cruz, M., Lara, R., Martinéz-Méndez, N., Calderón-Espinosa,
Meza-Lázaro, R. N., Gadsden, H., Avila, L. J., Morando, M., De la Riva, I. J.,
Sepulveda, P., Rocha, C. F., Ibargüengoytía, N., Puntriano, C. A., Massot, M.,
Lepetz, V., Oksanen, T. A., Chapple, D., Bauer, A., Branch, W., Clobert, J & Sites,
J. W., 2010. Erosion of lizard diversity by climate change and altered thermal niches.
Science (New York, N.Y.), 328(5980), 894-899.
Stevenson, R. D., Peterson, C. R. & Tsuji. J. S., 1985. The thermal dependence
of locomotion, tongue flicking, digestion and oxygen consumption in the wandering
garter snake. Physiological Zoology. 58: 46-57.
Sunday, J. M., Bates, A. E., Dulvy, N. K., 2011. Global analysis of thermal
tolerance and latitude in ectotherms. Proc. R. Soc. B 278, 1823–1830,
http://dx.doi.org/10.1098/rspb.2010.1295
Tewksbury, J. J., Huey, R. B., & Deutsch, C. A., 2008. Ecology. Putting the heat
on tropical animals. Science (New York, N.Y.), 320(5881), 1296–1297.
Thuiller, W., Georges, D. Engler, R. & Breiner, F. 2016. Package ‘biomod2’.
Uvarov, B. P., 1931. Insects and climate. R. Entomol. Soc. London 79:174–86.
Vitt, L. J., Avila-Pires, T. C., Caldwell, J. P. & Oliveira, V. R. L., 1998. The
Impact of Individual Tree Harvesting on Thermal Environments of Lizards in Amazonian
Rain Forest. Conservation Biology, 12:654-664.
Williamson, K., 1975. Birds and climatic change. Bird Study 22:143–64
Withers, P. C., 1992. Comparative Animal Physiology. Fort Worth: Saunders
College, USA, p949.
38
Zheng, Y. & Wiens, J. J., 2016. Combining phylogenomic and supermatrix
approaches, and a time-calibrated phylogeny for squamate reptiles (lizards and snakes)
based on 52 genes and 4162 species. Molecular phylogenetics and evolution, 94: 537-
547.
Zuur, A. F., Ieno, E. N., Walker, N. J., Saveliev, A. A. & Smith, G. M. 2009.
Mixed Effects Models and Extensions in Ecology with R. Springer, New York.
39
Thermal physiology of Amazonian lizards
Luisa Maria Diele-Viegas¹
Corresponding author; Museu Paraense Emílio Goeldi/CZO, C.P. 399, 66017-970 Belém, Pará, Brazil. Email:
Laurie J. Vitt
Sam Noble Museum, 2401 Chautauqua Avenue, Norman, Oklahoma 73072, United States. Email: [email protected]
Juan Carlos Santos
Brigham Young University, Provo, Utah, United States & St. John’s University, Queens, New York, United States. Email:
Carla Marie Sette
University of California, Santa Cruz, California, United States. Email: [email protected]
Teresa C.S. Ávila-Pires
Museu Paraense Emílio Goeldi/CZO, C.P. 399, 66017-970 Belém, Pará, Brazil. Email: [email protected]
Abstract
We summarize available thermal biology data on 69 species of Amazonian lizards
including thermoregulation mode and active field body temperatures (Tb), and provide new
data for 27 species on preferred temperature (Tpref), voluntary and tolerance temperature
ranges, and thermal performance curves (TPC’s). We tested for phylogenetic signals and
pairwise correlations within these thermal characteristics. Our analyses include 27 new
species records in nine sites in the Brazilian Amazonia, Savanna, and the Amazonia-Cerrado
interface. Of the 69 species, the 31 heliothermic species have the highest mean values of all
thermal characteristics, and large ranges for Tb, critical thermal maximum (Ctmax) and
optimal (Topt) temperatures. The other 38 thermoconforming species have large ranges for
Tpref, critical thermal minimum (Ctmin), and minimum voluntary (Vtmin) temperatures. In
spite of these differences, our results show that all thermal characteristics overlap between
both groups and suggest that Amazonian lizards do not follow discrete thermoregulatory
categories. The traits are all correlated, with the exceptions of (1) Topt, which does not
40
correlate with Ctmax, and (2) Ctmin, which only correlates with Topt. Weak phylogenetic signal
for Tb, Tpref and Vtmin indicates that these characters are influenced by phylogeny as well as
other factors. We found that open-habitat species perform well under present environmental
conditions, without suffering thermal stress from high environmental temperatures induced
in lab experiments. For forest-dwelling lizards, we expect warming and drying trends in
Amazonia to induce thermal stress, as temperatures surpass the thermal tolerances for these
species.
Keywords: Amazonia, Lizards, Physiology, Temperature.
1. Introduction
Body temperature (Tb) in ectotherms influences all physiological and behavioral
processes. Consequently, maintenance of Tb within suitable limits is essential to ectotherm
survival (Huey and Stevenson, 1979). Heliotherms maintain Tb within a restricted range of
temperatures by actively thermoregulating, basking in the sun (Pough and Gans, 1982) and
using behavioral/physiological mechanisms to regulate internal heat gain and loss (Heatwole
and Taylor, 1987, Kiefer et al., 2007). Thermoconformers in turn do not actively
thermoregulate, so their Tb is a reflection of fluctuations in the environmental temperature
(Huey and Slatkin, 1976, Huey, 1982). Using this type of ecophysiological strategy results
in species having broad thermal tolerances (Huey 1982), with higher variation in Tb
throughout the day, season and geographic range.
In the field, lizards are usually active at a characteristic Tb. It is commonly assumed
that these temperatures invariably represent their actual thermal preferences (Licht et al.,
1966). However, laboratory experiments show that the Tb range observed in nature for
tropical lizards markedly exceeds both the preferred Tb and the voluntary Tb range observed
when the animal is subjected to a thermal gradient (DeWitt, 1967, Du et al., 2000).
Consequently, tropical lizards are probably already experiencing Tb’s at or above their
physiological optima (Huey et al., 2009), putting them dangerously close to their upper
thermal thresholds. These upper thermal limits are likely to be exceeded in the next few
decades as a consequence of climate change (Hoffman and Sgró, 2011).
The efficiency with which ectotherms perform basic physiological functions at different
temperatures is described by thermal performance curves (TPC; Huey and Stevenson, 1979).
A species’ thermal sensitivity can be easily visualized and quantified through TPC’s, which
reveal several important thermal properties of ectotherms: the optimal temperature (Topt), at
which the animal performance is highest; the temperature range for mid-level performance,
at which a reptile performs at ≥ 80% of its optimal capacity; and the critical minimum and
maximum temperatures (Ctmin and Ctmax), the two extreme temperatures between which an
individual can maintain its activity (Angilletta et al., 2002b). The Topt can vary in an intra-
41
and interspecific context and is not the same for all physiological systems, according to the
hypothesis of multiple physiological optima (Huey, 1982). Locomotor performance is one
of the best-studied traits in thermal physiology, because it presumably reflects the ability to
escape from predators, capture of prey, and perform reproductive activities (Irschick and
Garland, 2001). TPC’s are also useful in assessing extinction risk of ectotherms. Because
global warming may alter the spatial distribution of preferred microclimates (Sears et al.
2011), animals that rely on behavioral thermoregulation might lose available activity time
during periods when preferred microclimates became too rare to locate without overheating
(Sears et al. 2016). Reduced activity time can result in extirpation or extinction if the
remaining time is insufficient to perform all the necessary functions for successful breeding
and recruitment (Sinervo et al. 2010).
One of the biogeographic regions most affected by climate change is the Amazonia
Rainforest. This region is home to approximately 210 species of lizards and covers about
eight million square kilometers spread over nine South American countries (Eva et al.,
2005). In spite of Amazonia’s vastness and complexity, thermal physiology data for
inhabiting lizards is limited, with most studies scattered among the major groups of
Squamata, concentrated on reports on field active Tb and very few controlled experiments
on preferred or optimal Tb.
The aims of our research are to provide an overview of available data on Tb’s of
Amazonian lizards (including some species that occur only peripherally, at the Amazonia-
Cerrado interface), to summarize information on lizards’ thermoregulation mode, and to
provide new data on the thermal biology of lizards of this region. Moreover, we also analyze
the evolutionary trends among thermophysiological traits, including their correlations and
non-independence among species traits due to their phylogenetic relatedness (i.e.,
phylogenetic signal), and relationships among thermophysiological traits using correlations.
Thus, our analyses and review provide an update on ecophysiological characteristics of
Amazonian lizards, which is essential to better understanding the effects of global warming
on present and future lizard diversity in this region.
2. Materials and Methods
We performed a literature survey for data on seven physiological traits of Amazonian
lizards: field active Tb, preferred temperature (Tpref), minimum and maximum voluntary
temperatures (Vtmin and Vtmax), Ctmin, Ctmax and Topt). The studies included in our literature
review extend beyond Amazonia, and include the Atlantic Rainforest, Caatinga, and Cerrado
areas of Brazil, as well as the Lavrado area, an enclave of savanna in northeastern Roraima,
Brazil. This is due to the fact that some species have widespread distributions beyond the
Amazonia. We also included data from lizards in tropical forests of Central America that
share ecophysiological similarities. The thermoregulation mode of each species was defined
according to the literature. Tb and associated substrate (Tsub) and air temperature (Tair) data
42
were recovered from 45 studies from the last 50 years, with reported Tb’s from 62 species
with occurrence in Amazonia.
We included previously unpublished Tb data on eight species collected from 1993 to
1999 in seven localities of Amazonia: Estación Biológica de la Pontifícia Universidad
Católica (Quito), within the Reserva de Producción Faunística Cuyabeno (Sucumbíos
Province, Ecuador, 0°0’N, 76°10’S); Juruá River Basin, ca. 5km north of Porto Walter
(Acre, Brazil, 8°15’S, 72°46’W); Ituxi River (Amazonas, Brazil, 8°20’S, 65°43’W); ca.
30km NW of Caracaraí (Roraima, Brazil, 2°50’N, 60°40’W); Parque Estadual Guajará–
Mirim, on the Formoso River (Rondônia, Brazil, 10°19’S, 72°47’W); SE of Manaus, on the
margin of the Amazon River (Amazonas, Brazil, 3°20’S, 59°4’W); and Agropecuária
Treviso, 101 km S and 18 km E of Santarém, close to Curuá-Una River (Pará, Brazil, 3° 9’
S, 54° 50’W). For the species included in this dataset, cloacal temperatures were measured
from adult individuals with Miller-Weber rapid register thermometers (accurate to 0.2°C).
We also collected new thermal preference and performance data on 27 species
between 2014 to 2016 in six localities, five in Amazonia – Floresta Nacional do Amapá
(Amapá, Brazil, 0°55’N, 51°36’W), Floresta Nacional de Caxiuanã (Pará, Brazil, 1°27’S,
51°17’W), Reserva Florestal Adolpho Ducke (Manaus, Brazil, 2°57’S, 59°55’W); Los
Amigos Biological Station (Peru, 12°34’S, 70°6’W), and Yasuni National Park (Ecuador,
1°5’S, 75°55’W), and one in an Amazonia/Cerrado ecotone – Centro de Pesquisas Canguçu
(Tocantins, Brazil, 9°56’S, 49°47’W). Specimens were captured by active search or with
pitfall traps checked twice daily. We measured snout-vent length (SVL) to 1mm with a
vernier caliper. Lizards collected as vouchers were euthanized with a lethal dose of
anesthetics, fixed in 10% formalin, and permanently stored in 70% ethanol. Voucher
specimens were deposited in the collections of Museu Paraense Emílio Goeldi, Pará, Brazil;
Instituto Nacional de Pesquisas da Amazônia, Amazonas, Brazil; Universidade de Brasília,
Distrito Federal, Brazil; Monte L. Bean Life Science Museum, Utah, USA; and Museo de
Historia Natural de la Universidad Nacional Mayor de San Marcos, Lima, Peru. Lizards were
kept in captivity for a period of no more than three days, then released at their capture sites.
While in captivity, animals were housed individually in plastic Tupperware containers with
air holes and a damp cloth for moisture, without access to food. We measured Tpref, Ctmin,
Ctmax, and thermal performance curve trials on captive lizards. Table 1 shows the number of
individuals used in each test by species.
We characterized the thermal biology of the collected lizards with the following
protocol. We measured the lizards’ Tb by using infrared thermometers. Tpref and voluntary
Tb range were measured using a thermal gradient. Lizards were placed for 2 hours in
plywood tracks 1m in length, with a thermal gradient of 15-40°C generated across each track
using ice at one end and a heating lamp ~100W full spectrum at the other (sensu Paranjpe et
al. 2012). Tb was measured every 3-5 minutes, and Tpref was calculated as the mean of all Tb
recorded. The voluntary upper (Vtmax) and lower (Vtmin) temperatures for each individual
during this interval were calculated as the bounds of Tpref (Kubisch et al., 2016). We
43
performed Tpref tests for all individuals captured. Afterwards, lizards were randomly to
undergo either the thermal tolerance or performance tests.
Critical temperatures were measured on 485 individuals of 26 species. An
individual’s body temperature was decreased or increased in a chamber cooled by ice packs
or heated by hot water until the animal lost its righting reflex. Each animal was tested for
both Ctmin and Ctmax, with a recovery period of at least four hours between trials at ambient
temperatures. To calculate Topt, we performed locomotor capacity experiments on 254
individuals. Because heliotherms are typically active at relatively high Tb, we stimulated
each individual to run at 3-7 randomly-assigned temperatures (15°, 20°, 25°, 30°, 35°, 40°,
43°C). Thermoconformers, which are typically active at lower Tb’s, were stimulated to run
once at 2-4 randomly-assigned temperatures (20°, 25°, 30° and 35°C). Lizards were allowed
to recover at least four hours between trials.
To measure performance, the experimenter manually stimulated lizards to run around
a circular track (sensu Bennett, 1980). A track with a 4m circumference was used for lizards
with >0.5m SVL, and a track with 1m circumference was used for lizards <0.5m SVL. Each
trial ended when the lizard reached exhaustion and was unable to right itself when placed in
a supine position. Animal performance was calculated as the travel distance (number of
times around the track x track circumference) divided by time until exhaustion (in seconds).
Topt was the Tb at which the animal presented its highest performance calculated from the
best fitting curve (see procedures below).
We used the statistical software environment R 3.3.1 (R Development Core Team
2012) for all calculations. Dependence between thermal physiology parameters was
analyzed by simple stepwise regression and one-way analysis of variance. Shapiro and
Levene’s tests were used respectively to test assumptions of normality and homogeneity of
variance for parametric variables. For the comparative analyses, we used the chronogram for
Squamata estimated by Zheng & Wiens (2016). Phylogenetic signal was calculated based
on Blomberg’s K (Blomberg et al., 2003), which is an evolutionary model-based metric of
phylogenetic signal strength. A K-value of one indicates that a trait shows the amount of
signal expected along the specified tree, assuming a Brownian motion (stochastic) model of
evolution for the character being tested (Blomberg et al., 2003). This indicates that trait
variance among species accumulates in direct proportion to their divergence time, as
measured by the branch lengths separating them in a phylogenetic tree (Felsenstein, 1985,
2004). Values of K < 1 mean that these traits exhibit less phylogenetic signal than expected
under a simple stochastic model, an indication that they may be subjected to selective
pressures.
TPC’s were generated for each species using Generalized Additive Mixed Modeling
(GAMM). These models use additive nonparametric functions to model covariate effects
while accounting for overdispersion and correlation by adding random effects to the additive
predictor (Lin, 1999). Akaike’s Information Criterion (AIC) and Bayesian Information
Criterion (BIC) were used to select the best GAMM model. AIC measures the quality of fit
of the model, penalized by model complexity, and BIC additionally considers the number of
44
observations included in the model (Zuur et al., 2009). Lizard performance at different
temperatures was the model factor, while individual was included as a random effect. The
extremes of the curve were fixed at the average Ctmin and Ctmax values for that species. We
tested several correlation structures to select the best fit including: temporal correlation
structures (autoregressive process [corAR1], continuous autoregressive process [corCAR1],
and autoregressive moving average process [corARMA]) and spatial residual correlation
structures (Gaussian spatial correlation [corGaus], exponential spatial correlation structure
[corExp], rational quadratics spatial correlation [corRatio] and spherical spatial correlation
[corSpher]). We chose the best correlation structure at that with the lowest AIC and BIC
values (Zuur et al., 2009).
3. Results
We obtained thermal data for 69 species of lizard from twelve families (Table 1),
including newly obtained data on field active Tb, Tpref, performance and thermal tolerance
from 27 species (Table 2). Among all species with physiological data, 64 are diurnal, one is
cathemeral, and four nocturnal. Based on literature, 38 species are classified as
thermoconformers, while 31 are heliotherms.
Body temperature positively correlated to environmental temperature in all lizard
species (Tb and Tsub: P<0.01, Tb and Tair: P<0.05). Seven thermoconformers had Tsub/Tair
higher than Tb, indicating that these species do not gain additional heat from the
environment. One-way ANOVA tests recovered significant differences in all physiological
traits based on thermoregulation mode, SVL, family, and species. Fig. 1 shows the range of
temperatures for each evaluated trait for each thermoregulation mode. Heliotherms had
higher mean values of all thermal traits than thermoconformers as well as larger variation in
Tb, Ctmax and Topt. Variation in Tpref, Vtmin and Ctmin is low in heliotherms and high in
thermoconformers, though mean values are relatively similar (Fig 2). In spite of these
differences, our results show an overlap in most thermal traits between heliotherms and
thermoconformers, with some lizards considered heliotherms having ranges of temperatures
similar to others identified as thermoconformers.
We also found phylogenetic pairwise correlations between all thermal characters
evaluated (Tb, Tpref, Vtmin, Vtmax, Ctmin, Ctmax, Topt), except between (1) Topt and Ctmax, and
(2) Ctmin, which only correlates with Topt. Thus, selection on one thermal characteristic
affects the evolution of all those considered here, except in the two cases mentioned above.
We only detected a phylogenetic signal for Tb (K=0.6351, p<0.05), Tpref (K=0.485, p<0.05)
and Vtmin (K=0.5426, p<0.05). Family Teiidae is comprised only of heliotherms, and had the
highest values for all three traits. The lowest Tb was found in one species of Hoplocercidae
(forest-dwelling lizards), and the lowest Tpref and Vtmin was observed in Alopoglossidae, both
families containing only thermoconformers. Families with both heliotherm and
thermoconformer species tended to have intermediate mean values for all thermal
parameters. For example, Tropiduridae, a family in which heliotherms are more numerous
45
than thermoconformers, had the highest thermal trait values among the families with taxa
that present both thermoregulatory modes (Table 3).
We measured locomotor performance for ten species of Amazonian lizards (Fig 3).
The best correlation structure and estimated TPC parameters for each species on Fig. 3 are
in Table 4. The Ctmax among all heliotherms reach up to 45-50°C, although in Arthrosaura
kockii a plateau exists, which is slightly inclined at lower temperatures. Ameiva ameiva
experiences a steep performance increase with rising temperature, peaking above the mean
values for Vt, field active Tb and Tpref. Plica plica has a pattern similar to that of A. kockii,
even though the former is considered a thermoconformer, the latter a heliotherm. Both
species have Topt closer to Vtmin. In Cnemidophorus cryptus, Topt is above its Vt’s, Tb, and
Tpref, similar to A. ameiva. Copeoglossum nigropunctatum performed best at temperatures
near Vtmax. Both Gonatodes humeralis and Norops fuscoauratus are forest
thermoconformers whose TPC’s have broad plateaus, with Ctmax reaching 40°C. Gonatodes
humeralis has a three-peak curve, with optimal performance within the second peak. The N.
fuscoauratus TPC increases consistently with temperature, with a peak considerably above
its Vt’s, Tb, and Tpref. Chatogekko amazonicus, Arthrosaura reticulata, and Leposoma
percarinatum are found in the leaf litter and all three species have Ctmax around 35°C,
although only the curve of L. percarinatum has two peaks, which may indicate some
differences in its thermal physiology. Like G. humeralis, C. amazonicus has a three-peak
curve, with Topt in the second peak. Chatogekko amazonicus and A. reticulata both have Topt
close to their field active Tb, while L. percarinatum’s Topt is nearer its Ctmax. Although we
measured heliotherms performance at hotter temperatures than thermoconformers, Topt
values for both groups partially overlap, similar to values for the other thermal physiological
parameters analyzed. Both thermoregulation modes also present similarities in the shape of
the curves, which are mostly broad and sometimes presents two or three peaks.
4. Discussion
We observed a non-significant phylogenetic correlation between Topt and Ctmax,
which implies that selection on Ctmax in response to higher environmental temperatures will
not affect locomotor performance of Amazonian lizards. Considering that Topt is correlated
with all other thermal traits, this inference is in agreement with the argument that tolerance
limits have less relevance to thermoregulation than Topt (Bartholomew, 1958; Huey, 1975).
On the other hand, this is incongruent with the results of Huey and Kingslover (1993), who
found that Topt and Ctmax are correlated and tend to coevolve. Conversely, the correlation
between Ctmin and Topt suggests that directional selection on Ctmin will have a direct effect
on locomotor performance, raising or lowering Topt and the mid-level performance
temperature range.
Blomberg et al. (2003) found relatively low values of K for physiological traits in
Australian skinks (e.g. Tpref and Topt), as we did here for Tb, Tpref and Vtmin. Such result was
expected considering the importance of the environment on the thermal characters of
46
ectotherms, which in turn influences nearly all their physiological processes. These traits are
apparently influenced by factors other than phylogeny, for example phenotypic plasticity,
which is the ability of an organism to express different phenotypes depending on its biotic
and abiotic environments (Agrawal, 2001). This factor influences not only the lizards
thermal physiology, but also all their life-history (Stearns and Koella, 1986; Beuchat and
Ellner, 1987; Adolph and Porter, 1991). For the thermal parameters Vtmax, Ctmin, Ctmax and
Topt, we could not reject the null hypothesis of no phylogenetic signal. Nevertheless, some
of these traits may be limited by physiological constraints common to all lizards, hindering
the chances of evolutionary changes that would be reflected in the phylogeny. According to
Huey & Kingslover 1993, if the population lacks the underlying genetic diversity to shift its
thermal sensitivity adequately as a response to selection, we might expect that this
population will not be able to adapt to evolve rapidly enough to track changes in
environmental temperatures, such as those caused by the climate warming.
Lizards frequently have Tb > Tpref in the field, but the differences are less in
thermoconformer than in heliotherm species. Tpref may be more inaccessible to heliotherms
in the rainforest microenvironment than to thermoconformers because most heliotherms
must seek out sunlight patches on the forest floor. These patches may be unpredictable both
spatially and temporally. Thermal conditions within lowland tropical forest are likely
insufficient to permit Tbs below the level found (DeWitt, 1967). Of the ten species with Topt
data, seven had Tpref < Tb < Topt, consistent with Bennett (1990), who suggested that Topt are
always higher than Tpref and Tb. The other three species with Topt available (C.
nigropunctatum, G. humeralis and P. plica) had Tb > Topt, although their Tb’s are within a
plateau of their TPC. By comparing Tb with Ctmax in 19 species with available data, Ctmax
was between 6-12°C above the mean values of Tb, consistent with Ji et al.’s (1997) study on
Sphenomorphus indicus and Du et al.’s (2000) study on Eumeces elegans males. When we
consider the highest values of Tb measured, the difference drops to 4-11°C for most species,
except Kentropyx calcarata and Tropidurus hispidus, where the difference is ~0.5°C and
3.5°C, respectively. Overall, our results partially support Hoffman and Sgró’s (2011) claim
that tropical lizards have their thermal characters close to their upper thermal thresholds,
which are likely to be exceeded in the next few decades.
Although we found statistical differences between thermoregulation modes, most
species regardless of their thermoregulation mode appear intercalated in their thermal
physiology and thus do not form discrete categories, as Pough and Gans (1982) suggested.
Teiids are “typical” heliotherms, reaching high body temperatures by basking in the open
sun, but gymnophthalmids like A. kockii and Tretioscincus agilis bask in the filtered sun that
reaches the forest floor, resulting in body temperatures lower than normal in Teiids, but still
above the estimated environmental temperatures in the forest. The same is true for the forest
tropidurids P. plica and Plica umbra, which are considered thermoconformers (Ávila-Pires,
1995, Vitt et al., 1997). Most thermoconformers that live in Amazonia appear to have Tb
slightly above Ts and Tair (e.g. Vitt et al., 2000; Colli et al., 2003; Vitt et al., 2007). These
species appear to prefer warmer microhabitats to gain additional heat from the environment
and thus cannot be considered thermoconformers in the strict sense (Colli et al., 2003).
47
Climatological variation across latitudes can lead to differences in thermal
physiology among species (Clusella-Trullas et al., 2011), so the physiological data obtained
for some species outside of Amazonia must be seen as an approximation of the thermal traits
for those species inside this biome. Among all species included in this study, smaller animals
had the lowest temperatures among all traits, probably due to their relatively low thermal
inertia (Yannas and Maldonado, 1995; Vitt et al., 2005). Chatogekko amazonicus, A. ameiva
and C. cryptus had Topt close to their Tb’s, so these species can achieve their highest
locomotor performance under current environmental conditions. In contrast, P. plica and A.
reticulata achieve their Topt closer to Tpref, and G. humeralis, C. nigropunctatum and A.
kockii achieve Topt closer to Vtmax; in both cases, Topt was lower than Tb obtained from field
measurements. Norops fuscoauratus and Leposoma percarinatum had Topt considerably
above Tb, Tpref, and Vtmax, closer to Ctmax. For these species, Topt might reflect the thermal
optimum of other physiological processes, or an intermediate thermal optimum for different
processes (Angilletta et al., 2002a). Among the species with Tb > Topt, the high Tb likely
reflects the thermal optima for other physiological process, such as digestion (Van Damme
et al., 1991; Ji et al., 1996; Angilletta et al., 2002b).
Although we fit multi-modal curves for five out of ten species with reported TPC’s,
this shape is atypical for TPC analysis. These results may represent an artifact of the GAMM
method of curve-fitting, since GAMM fits a curve with other curves (Lin 1999). One possible
solution is to change the stringency of model fitting to prioritize less noisy curves, but the
underlying reasons for multimodal curves should also be explored. Multi-modal curves can
be explained by biological factors not included in the model, such as differences between
sexes, color morphs, or age classes, or slow response to changing temperatures (Zajitschek
et al. 2012). We were not able to include these factors in our analysis due to sample sizes.
Our data suggests that many tropical rainforest lizards may not be affected by high
environmental temperatures, at least in the short term. Our inferences does contradict other
studies with fewer species and at higher latitudes, which predict that tropical lizards are at
an imminent risk of extinction due to man-made global warming (Tewksbury et al. 2008,
Huey et al. 2009, Sinervo et al. 2010). Additional factors are affecting large parts of
Amazonia such as forest loss, degradation, and fragmentation (Fearnside, 2009). These
factors can cause rapid microclimate changes towards hotter and drier conditions that
climatic models are unable to predict with accuracy (Pearson and Dawson 2003). Most of
the species in this study had some margin for an increase in average Tb with low cost to
performance, but, as shown by Huey and Kingslover (1993), selection is weaker on species
with broad TPC’s than narrow, lowering their capacity to evolve to track changes in climate.
Sinervo et al. (2010) provided the first model of the potential effect of a warming climate on
species distribution based on thermal physiology. Integrative models such as those that
incorporate phenotypic plasticity and genetic variability will allow projections of adaptive
radiation occurring under a warmer environment (Chevin et al., 2010; Sgrò et al., 2011).
Both phenotypic plasticity and genetic variability are directly dependent on environmental
conditions that allow lizards to gain and lose heat (Kearney et al., 2009; Sinervo et al., 2010;
Clusella-Trullas et al., 2011). We expect that with more temperature data on a higher
48
diversity of Amazonian lizards’ species, we can better understand the effects of climate
change on these animals.
5. Conclusions
Although heliotherms and thermoconformers shows significant differences among
their thermophysiological characters, our results indicate that these groups do not form
discrete categories, since most species are intercalated in their thermal physiology regardless
of their thermoregulation modes. Most thermoconformers in the Amazonia prefer warmer
microhabitats to gain additional heat from the environment and thus cannot be considered
thermoconformers in the strict sense. This corroborates the idea that thermoconformity is
one extreme of a continuum of thermoregulation modes, with the heliothermy in the other
extreme (Pough and Gans, 1982).
Half of our TPC’s present atypical shapes, which may be an artifact of our curve-
fitting methods. Factors other than temperature and locomotor capacity can be included in
the analyses to improve model fit. Sex, color morph, and age class as well as slow response
to changing temperatures can explain the multimodal curve fitting, although we were not
able to include these factors in our analyses due to our sample size.
Our results show that selection on Ctmax in response to higher environmental
temperatures will not affect locomotor performance of Amazonian lizards. Selection on Ctmin
will affect locomotor performance directly by amplifying or reducing the Topt and the range
of temperatures of mid-level performance. We could not reject the hypothesis of no
phylogenetic signal for Ctmax, Ctmin, Topt and Vtmax. In turn, Tb, Tpref and Vtmin present low
phylogenetic signal, so they appear to be influenced by factors other than phylogeny, such
as phenotypic plasticity.
Lizards are good indicators of the environmental effects of climate change. Though
Amazonian lizards have an apparent margin for an increase in Tb with low cost to
performance, suggesting that they may be show some resilience to warming, their broad
TPC’s may not allow rapid evolutionary response to a quickly warming climate. More
studies on the thermal physiology of Amazonian lizards are needed to obtain data
representative of the high species diversity in the region so we can better understand the
effects of climate changes on the survival or extinction of these lizards.
Conflict of interest:
None.
49
Acknowledgements
We thank Coordenação de Aperfeiçoamento de Pessoal de Nível Superior (CAPES)
to a graduate fellowship to LMDV and Conselho Nacional de Desenvolvimento Científico
e Tecnológico (CNPq) to a research fellowship to TCSAP. We are grateful to A.P. Costa, E.
Pontes, G. Lima, L. Chrisley and L. Franco for their help during fieldwork. LJV thanks the
Research Council of the University of Oklahoma and the Sam Noble Museum for support.
JCS thanks the support of Jack W. Sites, Jr (BYU). This work was supported by Museu
Paraense Emílio Goeldi (MPEG), Universidade Federal do Pará (UFPA), CNPq and
FAPESPA [ICAAF number 011/2012 Sisbiota Herpeto-Helminto] and National Science
Foundation – Emerging Frontiers [grant number 1241885, Collaborative Research:
“Quantifying Climate-forced Extinction Risks for Lizards, Amphibians, Fishes, and
Plants”].
References
Adolpho, S.C. and Porter, W.P., 1991. Temperature, activity and lizard life histories. Am.
Nat. 142, 273-295.
Agrawal, A.A., 2001. Phenotypic plasticity in the interactions and evolution of
species. Science 294.5541, 321-326.
Anaya-Rojas, J.M., Serrano-Cardozo, V.H., Ramirez-Pinilla, M.P., 2010. Diet, microhabitat
use, and thermal preferences of Ptychoglossus bicolor (Squamata: Gymnophthalmidae) in
an organic coffee shade plantation in Colombia. Pap. Avul. Zool. 50, 159–166.
Angilletta, M. J., Jr., 2009. Thermal Adaptation. Oxford University Press, Oxford.
Angilletta, M. J., Jr., Hill, T., Robson, M.A., 2002a. Is physiological performance optimized
by thermoregulatory behavior?: a case study of the eastern fence lizard, Sceloporus
undulatus. J. Therm. Biol. 27, 199–204.
Angilletta, M. J., Jr., Niewiarowski, P.H., Navas, C.A., 2002b. The evolution of thermal
physiology in ectotherms. J. Therm. Biol. 27, 249–268.
Avila-Pires, T.C.S., 1995. Lizards of Brazilian Amazonia. Zool. Verh. 299, 1–706.
Bartholomew, G.A., 1958. The role of physiology in the distribution of terrestrial
vertebrates. In C.L. Hubbs (ed.), Zoogeography, pp. 81–95. Publ. 51, AAAS, Washington,
D.C.
Bennet, A.F. 1980. The thermal dependence of lizard behavior. Anim. Behav. 28, 752-762
Beuchat, C.A., and Ellner, S., 1987. A quantitative test of life history theory:
thermoregulation by a viviparous lizard. Ecological Monographs 57, 45-60.
Blomberg, S.P., Garland, T., Ives, A.R., 2003. Testing for phylogenetic signal in
comparative data: behavioral traits are more labile. Evolution 57, 717–745.
Blouin-Demmers, G., Nadeau, P., 2005. The cost-benefit model of thermoregulation does
not predict lizard thermoregulatory behavior. Ecology 86, 560–566.
Brattstrom, B.H. 1965. Body temperatures of reptiles. Am. Midl. Nat. 73, 376–422.
Chevin, L.M., Lande, R., Mace, G.M., 2010. Adaptation, plasticity, and extinction in a
changing environment: towards a predictive theory. PLoS Biol. 8, e1000357.
50
Clusella-Trullas, S., Blackburn, T.M., Chown, S.L. 2011. Climatic predictors of temperature
performance curve parameters in ectotherms imply complex responses to climate change.
Am. Nat. 177, 738–751.
Colli, G.R., Mesquita, D.O., Rodrigues, P.V.V., Kitayama, K. 2003. Ecology of the gecko
Gymnodactylus geckoides amarali in a neotropical Savanna. J. Herpetol. 37, 694–706.
Cruz, F.B., Silva, S. and Scrocchi, G.J. 1998. Ecology of the lizard Tropidurus etheridgei
(Squamata: Tropidurudae) from the dry Chaco of Salta, Argentina. Herpetol. Nat. Hist. 6,
23–31.
DeWitt, C.B. 1967. Precision of thermoregulation and its relation to environmental factors
in the desert iguana, Dipsosaurus dorsalis. Physiol. Zool. 40, 49–66.
Dixon, J.R., Soini, P., 1975. The reptiles of the upper Amazon Basin, Iquitos region, Peru.
Part 1. Lizards and Amphisbaenians. Milwaukee Pub. Mus. Contr. Biol. Geol. 4, 1–58.
Dixon, J.R., Soini, P., 1986. The reptiles of the upper Amazon Basin, Iquitos region, Peru.
Milwaukee Pub. Mus. vii + 154.
Du, W. G., Yan, S. J., Ji, X., 2000. Selected body temperature, thermal tolerance and thermal
dependence of food assimilation and locomotor performance in adult blue-tailed skinks,
Eumeces elegans. J. Therm. Biol. 25, 197–202.
Eva, H.D., Huber, O. (Eds.), 2005. A proposal for defining the geographical boundaries of
Amazonia. Office for Official Publications of the European Communities, pp 1–52.
Fearnside, P.M., 2009. A vulnerabilidade da floresta amazônica perante as mudanças
climáticas. Oecol. brasil. 13, 609–618.
Felsenstein, J., 1985. Phylogenies and the comparative method. Am. Nat. 125:1–15.
Felsestein, J., 2004. Inferring Phylogenies. Sinauer, Sunderland, Massachusetts.
Fitch, H.S., 1968. Temperature and behavior of some equatorial lizards. Herpetologica 24,
35–38.
Heatwole, H.F., Taylor, J., 1987. Ecology of Reptiles. Surrey Beatty and sons PTY Limited,
Sydney. 325p.
Henderson, R.W., Powell, R. 2009. Natural history of West Indian Reptiles and Amphibians.
Univ. Florid Press, Gainsville.
Hoffmann, A.A., Sgrò, C.M., 2011. Climate change and evolutionary adaptation. Nature
470, 479–485.
Huey, R.B., 1975. Ecology of lizard thermoregulation. Ph. D. Diss., Harvard Univ.
Huey, R.B., 1982. Temperature, physiology and the ecology of reptiles. Pp. 25–91. In: Gans,
C., Pough, F.H. (eds.). Biology of the Reptilia, vol. 12. Physiological Ecology. Academic
Press, New York. 536p.
Huey, R.B., Kingslover, J.G., 1993. Evolution of resistance to high temperature in
ectotherms. The Am. Nat. 142, S21-S46.
Huey, R.B., Slatkin, M., 1976. Costs and benefits of lizard thermoregulation. Quart. Rev.
Biol. 51, 363–384.
Huey, R.B., Stenvenson, R.D., 1979. Integrating thermal physiology and ecology of
ectotherms. Am. Zool. 19, 357-366.
51
Huey, R.B., Deutsch, C.A., Tewksburry, J.J., Vitt, L.J., Hertz, P.E., Pérez, H.J.A., Garland,
T., Jr., 2009. Why tropical forest lizards are vulnerable to climate warming. Proc. of the
Royal Society B. pp 1-10. doi: 10.1098/rspb.2008.1957
Irschick D.J., Garland, T., Jr., 2001. Integrating function and ecology in studies of
adaptation: investigations of locomotor capacity as a model system. Ann. Rev. Ecol. Evol.
Syst. 32, 367–396.
Ji, X., Du, W., Sun, P., 1996. Body temperature, thermal tolerance and influence of
temperature on sprint speed and food assimilation in adult grass lizards, Takydromus
septentrionalis. J. Therm. Biol., 21, 155–161.
Ji, X., Sun, P.Y., Du, W.G., 1997. Selected body temperature, thermal tolerance and food
assimilation in a viviparous skink, Sphenomorphus indicus. Netherlands J. Zool. 47, 103–
110.
Kearney, M., Shine, R., Porter, W.P., 2009. The potential for behavorial thermoregulation
to buffer “cold blooded” animals against climate warming. Proc. Nat. Acad. Sci. 106, 3835–
3840.
Kiefer, M.C., Van Sluys, M., Rocha, C.F.D., 2005. Body temperatures of Tropidurus
torquatus (Squamata, Tropiduridae) from coastal populations: do body temperatures vary
along their geographic range? J. Therm. Biol. 30, 449–456.
Kiefer, M.C., Van Sluys, M., Rocha, C.F.D., 2007. Thermoregulatory behaviour in
Tropidurus torquatus (Squamata, Tropiduridae) from Brazilian coastal populations: an
estimate of passive and active thermoregulation in lizards. Acta Zool. 88, 81–87.
Kohlsdorf, T., Navas, C. A., 2006. Ecological constraints on the evolutionary association
between field and preferred temperatures in Tropidurinae Lizards. Evol. Ecol. 20.6, 549–
564.
Kubisch, E.L., Corbálan, V., Ibargüengoytía, N.R., Sinervo, B., 2016. Local extinction risk
of three species of lizard from Patagonia as a result of global warming. Can. J. Zool. 94, 49–
59.
Licht, P., Dawson, W.R., Shoemaker, V.H., Main, A.R. 1966. Observations on the thermal
relations of Western Australian lizards. Copeia 1966, 97–110.
Magnusson, W.E., Paiva, L.J.D., Rocha, R.M.D., Franke, C.R, Kasper, L.A., Lima, A.P.,
1985. The correlates of foraging mode in a community of Brazilian lizards. Herpetologica
41, 324–332.
Meiri, S., Bauer, A., Chirio, L., Colli, G.R., Das, I., Doan, T.M., Feldman, A., Herrera, F.C.,
Novosolov, M., Pafilis, P., Pincheira-Donoso, D., Powney, G., Torres-Carvajal, O., Uetz, P.,
Van Damme, R., 2013. Are lizards feeling the heat? A tale of ecology and evolution under
two temperatures. Global Ecol. Biogeogr. 22,834–845.
Mesquita, D.O., Colli, G.R., 2003. Geographical variation in the ecology of populations of
some Brazilian species of Cnemidophorus (Squamata, Teiidae). Copeia 2003, 285–298.
Mesquita, D.O., Colli, G.R., Costa, G.C., Franca, F.G.R., Garda, A.A., Peres, A.K., 2006a.
At the water’s edge: ecology of semiaquatic teiids in Brazilian Amazon. J. Herpetol. 40,
221–229.
Mesquita, D.O., Colli, G.R., Franca, F.G.R., Vitt, L.J., 2006b. Ecology of a Cerrado lizard
assemblage in the Jalapão region of Brazil. Copeia 2006, 460–471.
52
Miranda, J.P., Ricci-Lobao, A., Rocha, C.F.D., 2010. Influence of structural habitat use on
the thermal ecology of Gonatodes humeralis (Squamata: Gekkonidae) from a transitional
forest in Maranhao, Brazil. Zoologia 27, 35–39.
Moberly, W.R., 1968. The metabolic responses of the common iguana, Iguana iguana, to
activity under restraint. Comp. Biochem. Physiol. 27, 1–20.
Nunes, V.S., 1984. Ciclo de atividade e utilização do habitat por Gonatodes humeralis
(Sauria: Gekkonidae) em Manaus, Amazonas Dep. Zool., Univ. Fed. do Paraná, 1984.
Paranjpe, D.A., Cooper, R.D., Patten, A., Sinervo, B., 2012. Measuring thermal profile of
reptiles in laboratory and field. In Proceedings of Measuring Behavior 2012, 8th
International Conference on Methods and Techniques in Behavioral Research (Utrecht, The
Netherlands, August 28–31).
Pearson, R.G. and Dawson, T.P., 2003. Predicting the impacts of climate change on the
distribution of species: are bioclimate envelope models useful? Global Ecol. Biogeogr. 12,
361–371.
Pough, F.H., Gans, C., 1982. The vocabulary of reptilian thermoregulation. In Gans, C.,
Pough, F.H. (Eds): Biology of the Reptilia, Vol. 12: Physiological Ecology, pp. 17–23.
Academic Press, New York, NY.
R Development Core Team., 2012. R: A Language and environment for statistical
computing. R Foundation for Statistical Computing, Vienna, Austria. www.R-project.org
Recoder, R., Teixeira, M., Camacho, A., Rodrigues, M.T., 2012. Natural history of the
tropical gecko Phyllopezus pollicaris (Squamata, Phyllodactylidae) from a sandstone
outcrop in Central Brazil. Herpetol. Notes 5, 49–58.
Rocha, C.F.D., Van Sluys, M., Vrcibradic, D., Kiefer, M.C., Menezes, V.A., Siqueira, C.C.,
2009. Comportamento de termorregulação em lagartos brasileiros. Oecol. Brasil 13, 115–
131.
Sartorius, S.S., Vitt, L.J., Colli, G.R., 1999. Use of naturally and antropogenically disturbed
habitats in Amazonian rainforest by the teiid lizard Ameiva ameiva. Biol. Conserv. 90, 91–
101.
Savage, J.M., 2002. The Amphibians and Reptiles of Costa Rica. The University of Chicago
Press, Chicago.
Scharf, I., Feldman, A., Novosolov, M., Pincheira-Donoso, D., Dias, I., Bohm, M., Uetz, P.,
Torres-Carvajal, O., Bauer, A., Roll, U and Meiri, S. 2015. Late bloomers and baby boomers:
ecological drivers of longevity in squamates and the tuatara. Global Ecol. Biogeogr. 24,
396–405.
Seebacher, F., Franklin, C.E., 2012. Determining environmental causes of biological effects:
the need for a mechanistic physiological dimension in conservation biology. Phil. Trans.
Royal Soc. B, 367, 1607–1614.
Sears M.W., Raskin, E., Angilletta, M.J., Jr., 2011. The world is not flat: Defining relevant
thermal landscapes in the context of climate change. Integr Comp Biol 51(5):666–675.
Sears, M.W., Angilletta, M.J. Jr., Schuler, M.S., Borchert, J. Dilliplane, K.F., Stegman, M.,
Rusch, T.W., Mitchell, W.A., 2016. Configuration of the thermal landscape determines
thermoregulatory performance of ectotherms. Proc. Natl. Acad. Sci. 113, 10595–10600.
Sgrò, C., Lowe, A.J., Hoffmann, A.A., 2011. Building evolutionary resilience for conserving
biodiversity under climate change. Evol. Appl. 4, 326–337.
53
Simmons, P.M., Greene, B.T., Williamsoon, K.E., Powell, R., Parmerlee J.S., Jr., 2005.
Ecological interactions within a lizard community on Grenada. Herpetologica 61, 124–134
Sinervo, B., Méndez-de-la-Cruz, F., Miles, D.B., Heulin, B., Bastiaans, E., Villagrán-Santa
Cruz, M., Lara-Resendiz, R., Martinéz-Méndez, N., Calderón-Espinosa, M.L., Meza-
Lázaro, R.N., Gadsden, H., Avila, L.J., Morando, M., De la Riva, I.J., Sepulveda, P.V.,
Rocha, C.F., Ibargüengoytía, N., Puntriano, C.A., Massot, M., Lepetz, V., Oksanen, T.A.,
Chapple, D.G., Bauer, A., Branch, W.R., Clobert, J., Sites, J.W., 2010. Erosion of lizard
diversity by climate change and altered thermal niches. Science (New York, N.Y.) 328, 894–
899.
Stearns, S.C. and Koella, J.C., 1986. The evolution of phenotypic plasticity in life-history
traits: predictions of reaction norms for age and size at maturity. Evolution 40, 893-913.
Stamps, J.A., Crews, D., 1976. Changes in reproduction and social behavior in the lizard
Anolis aeneus. Copeia 3, 467–476.
Tewksbury, J.J., Huey, R.B., Deutsch, C.A., 2008. Putting the heat on tropical animals.
Science 320, 1296.
Tracy, C.R., Nussear, K.E., Esque, T.C., Dean-Bradley, K., Tracy, C.R., DeFalco, L.A.,
Castle, K.T., Zimmerman, L.C., Espinoza, R.E., Barber, A.M., 2006. The importance of
physiological ecology in conservation biology. Integr. Comp. Biol. 46, 1191–1205.
Van Damme, R., Bauwens, D., Verheyen, R.F., 1991. The thermal dependence of feeding
behaviour, food consumption and gut–passage time in the lizard Lacerta vivipara Jacquin.
Funct. Ecol. 5, 507–517.
Velásquez, J., González S., L.A., Arcas, A.P., 2011. Ecología térmica y patrón de actividad
del lagarto Anolis onca (Squamata: Polychrotidae) en la península de araya, venezuela
SABER. Revista Multidisciplinaria del Cons. de Invest. Univ. Oriente 23.1: 5-12.
Vieira, G.H.C., Mesquita, D.O., Kitayama, K., Colli, G.R., 2000. Micrablepharus atticolus
Natural History. Herpetol. Rev. 31, 241–242.
Vitt, L.J., 1991a. An introduction to the ecology of Cerrado lizards. J. Herpetol. 25, 79–90.
Vitt, L.J. 1991b. Ecology and life history of the wide-foraging lizard Kentropyx calcarata
(Teiidae) in Amazonian Brazil. Can. J. Zool. 69, 2791–2799.
Vitt, L.J. 1993. Ecology of isolated open formation Tropidurus (Reptilia: Tropiduridae) in
Amazonian lowland rain forest. Can. J. Zool. 71, 2370–2390.
Vitt, L.J., 1995. The ecology of tropical lizards in the caatinga of northeast Brazil. Occ. Pap.
Oklahoma Mus. Nat. Hist. 1, 1–29.
Vitt, L.J., Avila-Pires, T.C.S. 1998. Ecology of two sympatric species of Neusticurus
(Sauria: Gymnophthalmidae) in the western Amazon of Brazil. Copeia 1998, 570–582.
Vitt, L.J., Caldwell, J.P., 1993. Ecological observations on Cerrado lizards in Rondônia,
Brazil. J. Herpetol. 27, 46–52.
Vitt, L.J., Carvalho, C.M. 1992. Life in the trees: the ecology and life history of Kentropyx
striatus (Teiidae) in the lavrado area of Roraima, Brazil, with comments on the life histories
of tropical teiid lizards. Can. J. Zool. 70, 1995–2006.
Vitt, L.J., Carvalho, C.M. 1995. Niche partitioning in a tropical wet season: lizards in the
Lavrado area of northern Brazil. Copeia 1995, 305–329.
Vitt, L.J., Zani, P.A. 1996a. Organization of a taxonomically diverse lizard assemblage in
Amazonian Ecuador. Can. J. Zool. 74, 1313–1335.
54
Vitt, L.J., Zani, P.A., 1996b. Ecology of the elusive tropical lizard Tropidurus (=Uracentron)
flaviceps (Tropiduridae) in lowland rain forest of Ecuador. Herpetologica 52, 121–132.
Vitt, L.J., Zani, P.A. 1997. Ecology of the nocturnal lizard Thecadactylus rapicauda (Sauria:
Gekkonidae) in the Amazon Region. Herpetologica 53, 165–179.
Vitt, L.J., Zani, P.A., 1998. Ecological relationships among sympatric lizards in a transitional
forest in the northern Amazon of Brazil. J. Trop. Ecol. 14, 63–86.
Vitt, L.J., Zani, P.A., Caldwell, J.P., Carillo, E.O., 1995. Ecology of the lizard Kentropyx
pelviceps (Sauria: Teiidae) in lowland rain forest of Ecuador. Can. J. Zool. 73, 691–703.
Vitt, L.J., Zani, P.A., Caldwell, J.P., 1996. Behavioural ecology of Tropidurus hispidus on
isolated rock outcrops in Amazonia. J. Trop. Ecol. 12, 81–101.
Vitt, L.J., Zani, P.A., Avila-Pires, T.C.S., 1997. Ecology of the arboreal tropidurid lizard
Tropidurus (=Plica) umbra in the Amazon region. Can. J. Zool. 75:1876–1882.
Vitt, L.J., Souza, R.A., Sartorius, S.S. Avila-Pires, T.C.S., Espósito, M.C., 2000.
Comparative ecology of sympatric Gonatodes (Squamata: Gekkonidae) in the western
Amazon of Brazil. Copeia 2000, 83–95.
Vitt, L. J., Sartorius, S. S., Avila-Pires, T. C. S., Esposito, M. C., 2001a. Life at the river’s
edge: ecology of Kentropyx altamazonica in Brazilian Amazonia. Can. J. Zool. 79: 1855–
1865.
Vitt, L.J., Sartorius, S.S., Avila-Pires, T.C.S., Esposito, M.C., 2001b. Life on the Leaf Litter:
The ecology of Anolis nitens tandai in the Brazilian Amazon Copeia 2001, 401–412.
Vitt, L.J., Avila-Pires, T.C.S., Zani, P.A., Esposito, M.C., 2002. Life in shade: the ecology
of Anolis trachyderma (Squamata: Polychrotidae) in Amazonian Ecuador and Brazil, with
comparisons to ecologically similar Anoles. Copeia 2002, 275–286.
Vitt, L.J., Avila-Pires, T.C.S., Esposito, M.C., Sartorius, S.S., Zani, P.A., 2003a. Sharing
Amazonian rain-forest trees: ecology of Anolis punctatus and Anolis transversalis
(Squamata: Polychrotidae). J. Herpetol. 37, 276–285.
Vitt, L.J., Avila-Pires, T.C.S., Zani, P.A., Esposito, M.C., Sartorius, S.S., 2003b. Life at the
interface: ecology of Prionodactylus oshaughnessyi in the western Amazon and comparisons
with P. argulus and P. eigenmanni. Can. J. Zool. 81, 302–312.
Vitt, L.J., Avila-Pires, T.C.S., Zani, P.A., Sartorius, S.S., Esposito, M.C., 2003c. Life above
ground: ecology of Anolis fuscoauratus in the Amazon rain forest, and comparisons with its
nearest relatives. Can. J. Zool. 81, 142–156.
Vitt, L.J., Sartorius, S.S., Avila-Pires, T.C.S., Zani, P.A., Esposito, M.C., 2005. Small in a
big world: Ecology of leaf-litter geckos in New World tropical forests. Herpetol. Monogr.
19, 137–152.
Vitt, L.J., Avila-Pires, T.C.S., Esposito, M.C., Sartorius, S.S., Zani, P.A., 2007. Ecology of
Alopoglossus angulatus and A. atriventris (Squamata: Gymnophthalmidae) in western
Amazonia. Phyllomedusa 6, 11–21.
Vitt, L.J., Shepard, D.B., Vieira, G.H.C., Caldwell, J.P., Colli, G.R., Mesquita, D.O., 2008.
Ecology of Anolis nitens brasiliensis in Cerrado Woodlands of Cantão. Copeia 2008, 144–
153.
Vrcibradic, D., Rocha, C.F.D. 1998. The Ecology of the skink Mabuya frenata in an area of
rock outcrops in southeastern Brazil. J. Herpetol. 32, 229–237.
Werner, Y.L., 1980. Habitat-dependent thermal regimes of two Hawaiian geckos (Reptilia:
Gekkonidae). J. Therm. Biol. 15, 281–290.
55
Yannas, S., Maldonado, E., 1995. Designing for summer comfort - Chap. 4: Thermal Inertia.
eds. Pascool handbook Architectural Association Graduate School, London.
Zajitschek, S.R.K., Zajitschek, F., Miles, D.B., Clobert, J., 2012. The effect of coloration
and temperature on sprint performance in male and female wall lizards. Biol. J. Linn. Soc.
107, 573–582.
Zheng, Y., Wiens, J.J., 2016. Combining phylogenomic and supermatrix approaches, and a
time-calibrated phylogeny for squamate reptiles (lizards and snakes) based on 52 genes and
4162 species. Molec. Phylog. Evol. 94, 537–547.
Zimmerman, B.L., Rodrigues, M.T., 1990. Frogs, snakes, and lizards of the INPA-WWF
reserves near Manaus, Brazil. In: A.H. Gentry (ed.), Four Neotropical Rainforests: 426–454.
Yale Univ. Press, London.

56
Legend of figures.
Fig 1. Frequency distribution of temperatures in heliotherms and thermoconformers for each
thermal trait evaluated. Values of temperature (x-axis) correspond to the mean value for each
species.
Fig 2. Range of each thermal trait evaluated in heliotherms and thermoconformers. Bars
indicate minimum and maximum values, dots the mean value for each species.
Fig 3. Thermal performance curves and mean values of thermal traits of A) Chatogekko
amazonicus; B) Gonatodes humeralis; C) Copeoglossum nigropunctatum; D) Norops
fuscoauratus; E) Plica plica; F) Arthrosaura kockii; G) Arthrosaura reticulata; H)
Leposoma percarinatum; I) Ameiva ameiva; and J) Cnemidophorus cryptus. Gray shaded
region shows the 95% confidence interval. Black points represent the results of individual
tests at different body temperatures: 15°C, 20°C, 25°C 30°C, 35°C, 40°C and 43°C for
heliotherms and 20°C, 25°C, 30°C and 35°C for thermoconformers. Short vertical black
lines indicate the number of trials at each temperature. Black lines at the curves’ extremes
are the critical thermal minimum (Ctmin) and critical thermal maximum (Ctmax). Topt=Optimal
temperature; Tb=Body temperature; Tpref=Preferred temperature; Vtmin=Minimum voluntary
temperature; Vtmax=Maximum voluntary temperature.
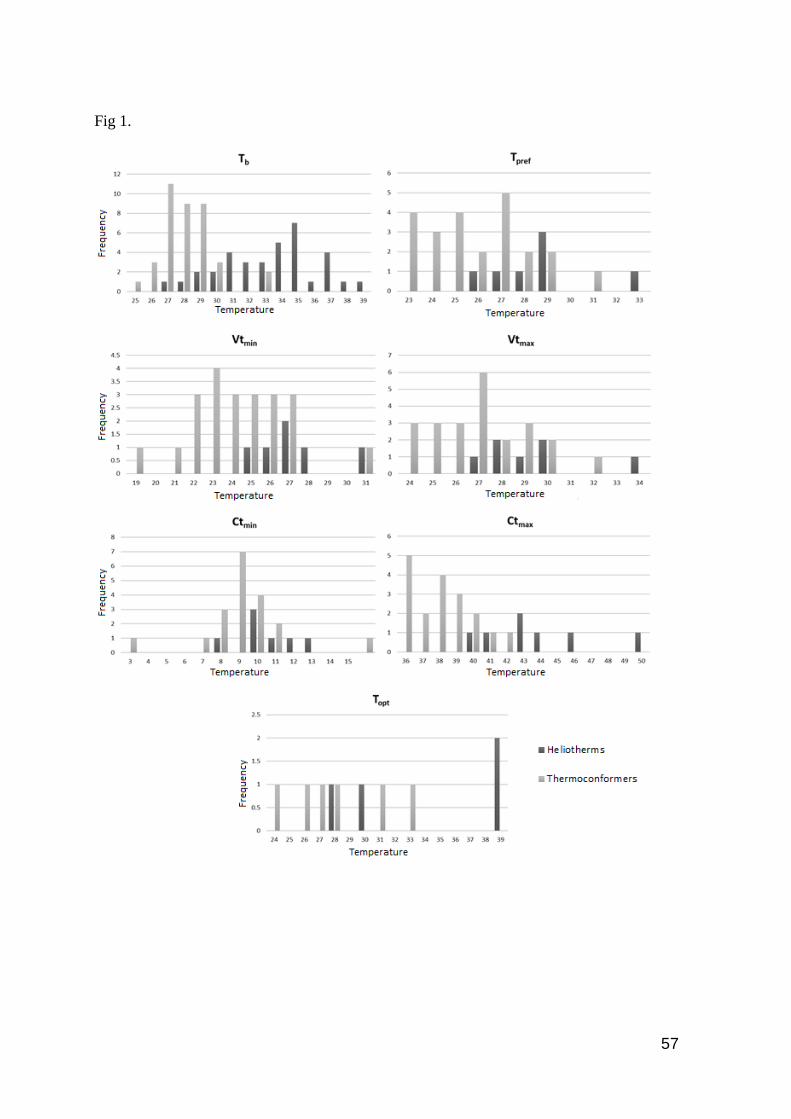
57
Fig 1.
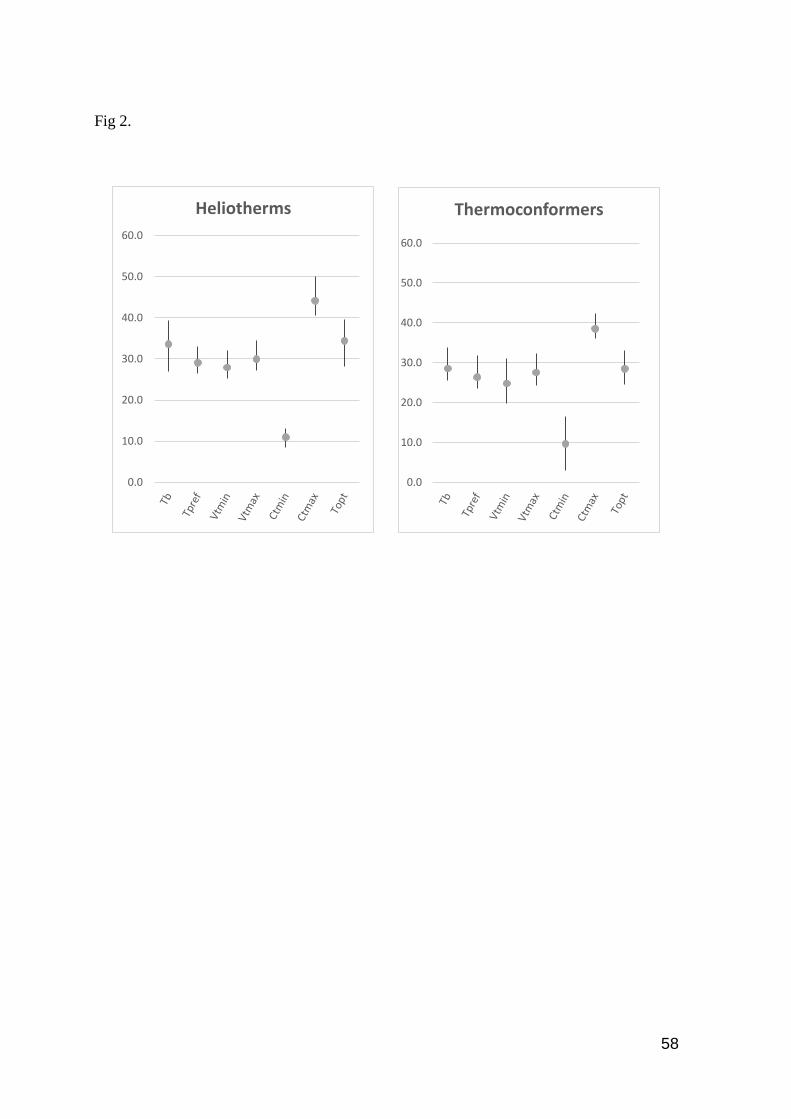
58
Fig 2.
0.0
10.0
20.0
30.0
40.0
50.0
60.0
Heliotherms
0.0
10.0
20.0
30.0
40.0
50.0
60.0
Thermoconformers
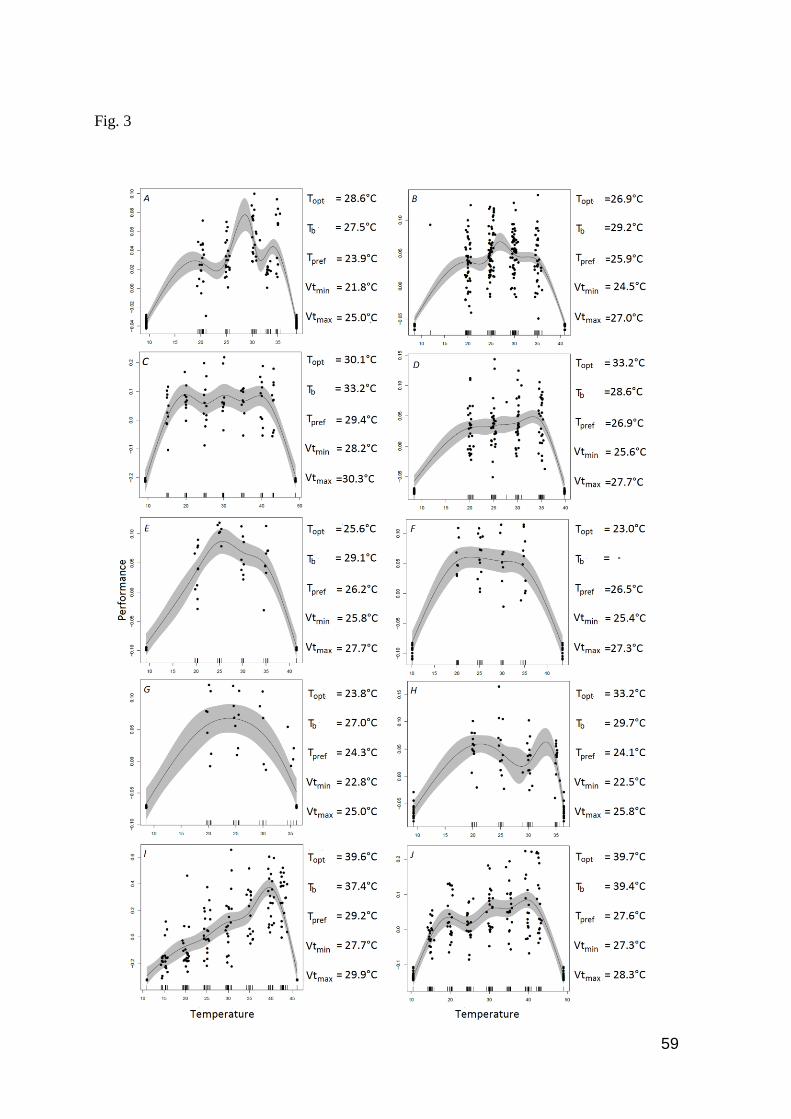
59
Fig. 3
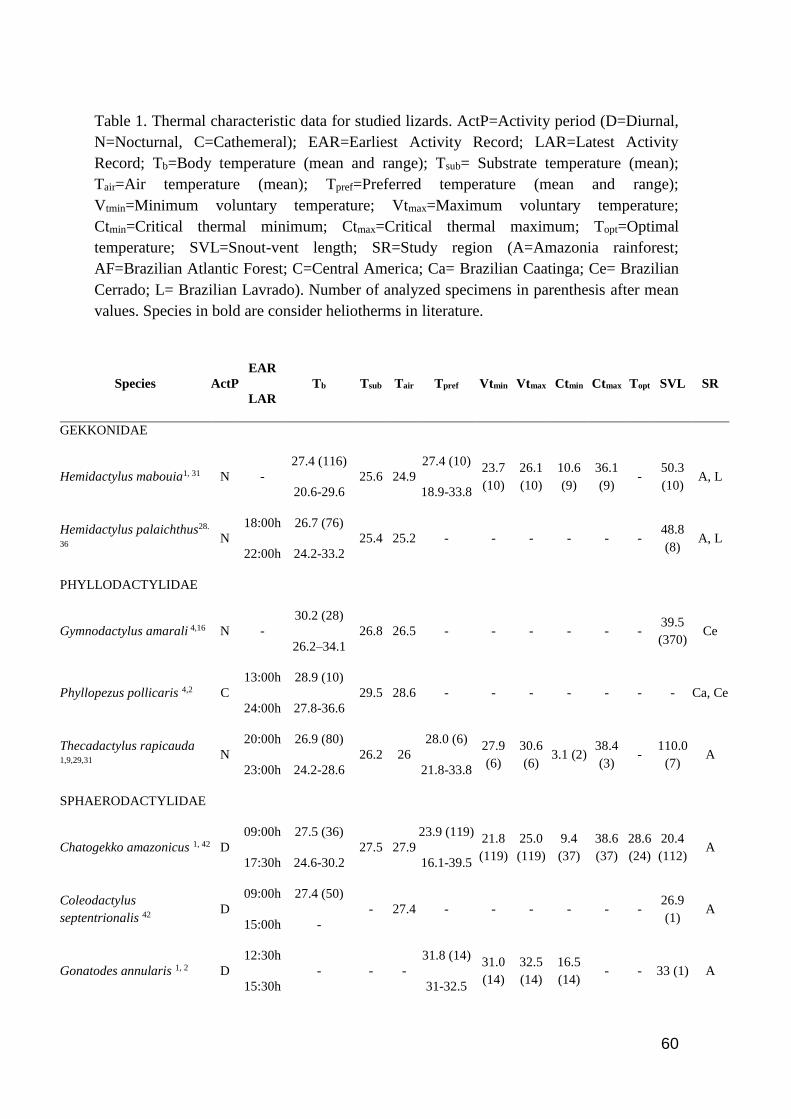
60
Table 1. Thermal characteristic data for studied lizards. ActP=Activity period (D=Diurnal,
N=Nocturnal, C=Cathemeral); EAR=Earliest Activity Record; LAR=Latest Activity
Record; Tb=Body temperature (mean and range); Tsub= Substrate temperature (mean);
Tair=Air temperature (mean); Tpref=Preferred temperature (mean and range);
Vtmin=Minimum voluntary temperature; Vtmax=Maximum voluntary temperature;
Ctmin=Critical thermal minimum; Ctmax=Critical thermal maximum; Topt=Optimal
temperature; SVL=Snout-vent length; SR=Study region (A=Amazonia rainforest;
AF=Brazilian Atlantic Forest; C=Central America; Ca= Brazilian Caatinga; Ce= Brazilian
Cerrado; L= Brazilian Lavrado). Number of analyzed specimens in parenthesis after mean
values. Species in bold are consider heliotherms in literature.
Species ActP
EAR
LAR
Tb Tsub Tair Tpref Vtmin Vtmax Ctmin Ctmax Topt SVL SR
GEKKONIDAE
Hemidactylus mabouia1, 31 N -
27.4 (116)
20.6-29.6
25.6 24.9
27.4 (10)
18.9-33.8
23.7
(10)
26.1
(10)
10.6
(9)
36.1
(9) -
50.3
(10) A, L
Hemidactylus palaichthus28.
36 N
18:00h
22:00h
26.7 (76)
24.2-33.2
25.4 25.2 - - - - - - 48.8
(8) A, L
PHYLLODACTYLIDAE
Gymnodactylus amarali 4,16 N -
30.2 (28)
26.2–34.1
26.8 26.5 - - - - - - 39.5
(370) Ce
Phyllopezus pollicaris 4,2 C
13:00h
24:00h
28.9 (10)
27.8-36.6
29.5 28.6 - - - - - - - Ca, Ce
Thecadactylus rapicauda 1,9,29,31
N
20:00h
23:00h
26.9 (80)
24.2-28.6
26.2 26
28.0 (6)
21.8-33.8
27.9
(6)
30.6
(6) 3.1 (2)
38.4
(3) -
110.0
(7) A
SPHAERODACTYLIDAE
Chatogekko amazonicus 1, 42 D
09:00h
17:30h
27.5 (36)
24.6-30.2
27.5 27.9
23.9 (119)
16.1-39.5
21.8
(119)
25.0
(119)
9.4
(37)
38.6
(37)
28.6
(24)
20.4
(112) A
Coleodactylus
septentrionalis 42 D
09:00h
15:00h
27.4 (50)
-
- 27.4 - - - - - - 26.9
(1) A
Gonatodes annularis 1, 2 D
12:30h
15:30h
- - -
31.8 (14)
31-32.5
31.0
(14)
32.5
(14)
16.5
(14) - - 33 (1) A
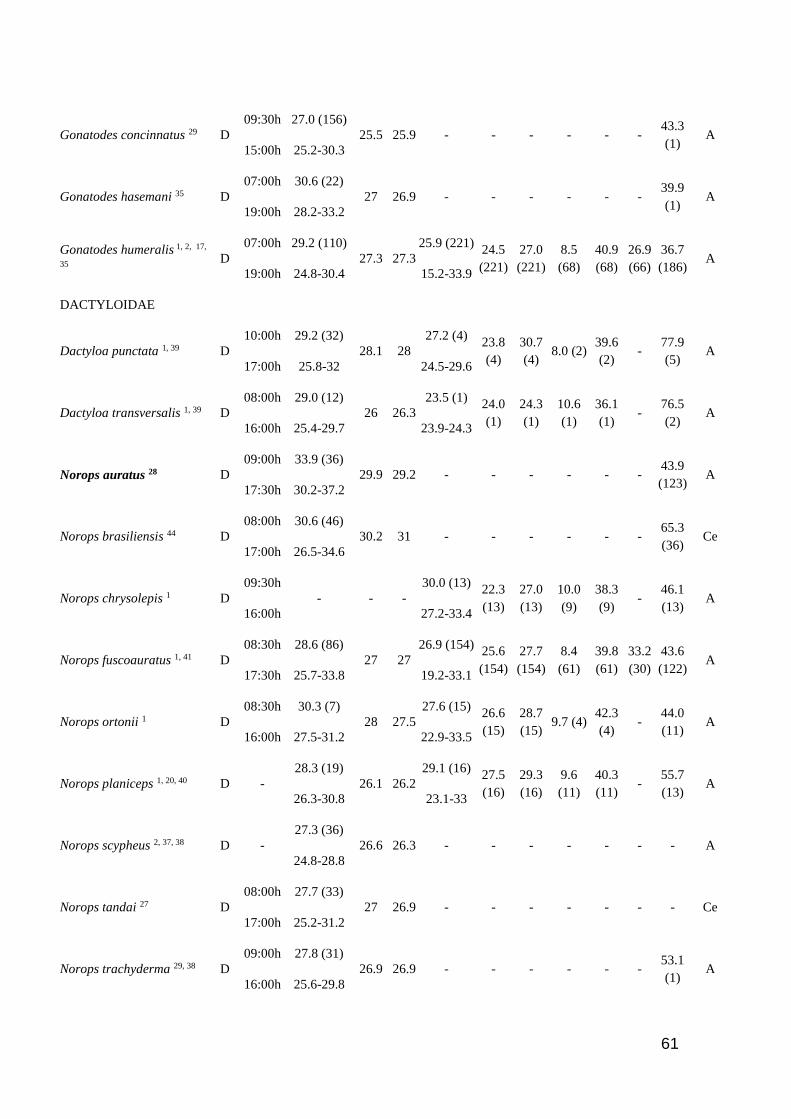
61
Gonatodes concinnatus 29 D
09:30h
15:00h
27.0 (156)
25.2-30.3
25.5 25.9 - - - - - - 43.3
(1) A
Gonatodes hasemani 35 D
07:00h
19:00h
30.6 (22)
28.2-33.2
27 26.9 - - - - - - 39.9
(1) A
Gonatodes humeralis 1, 2, 17,
35 D
07:00h
19:00h
29.2 (110)
24.8-30.4
27.3 27.3
25.9 (221)
15.2-33.9
24.5
(221)
27.0
(221)
8.5
(68)
40.9
(68)
26.9
(66)
36.7
(186) A
DACTYLOIDAE
Dactyloa punctata 1, 39 D
10:00h
17:00h
29.2 (32)
25.8-32
28.1 28
27.2 (4)
24.5-29.6
23.8
(4)
30.7
(4) 8.0 (2)
39.6
(2) -
77.9
(5) A
Dactyloa transversalis 1, 39 D
08:00h
16:00h
29.0 (12)
25.4-29.7
26 26.3
23.5 (1)
23.9-24.3
24.0
(1)
24.3
(1)
10.6
(1)
36.1
(1) -
76.5
(2) A
Norops auratus 28 D
09:00h
17:30h
33.9 (36)
30.2-37.2
29.9 29.2 - - - - - - 43.9
(123) A
Norops brasiliensis 44 D
08:00h
17:00h
30.6 (46)
26.5-34.6
30.2 31 - - - - - - 65.3
(36) Ce
Norops chrysolepis 1 D
09:30h
16:00h
- - -
30.0 (13)
27.2-33.4
22.3
(13)
27.0
(13)
10.0
(9)
38.3
(9) -
46.1
(13) A
Norops fuscoauratus 1, 41 D
08:30h
17:30h
28.6 (86)
25.7-33.8
27 27
26.9 (154)
19.2-33.1
25.6
(154)
27.7
(154)
8.4
(61)
39.8
(61)
33.2
(30)
43.6
(122) A
Norops ortonii 1 D
08:30h
16:00h
30.3 (7)
27.5-31.2
28 27.5
27.6 (15)
22.9-33.5
26.6
(15)
28.7
(15) 9.7 (4)
42.3
(4) -
44.0
(11) A
Norops planiceps 1, 20, 40 D -
28.3 (19)
26.3-30.8
26.1 26.2
29.1 (16)
23.1-33
27.5
(16)
29.3
(16)
9.6
(11)
40.3
(11) -
55.7
(13) A
Norops scypheus 2, 37, 38 D -
27.3 (36)
24.8-28.8
26.6 26.3 - - - - - - - A
Norops tandai 27 D
08:00h
17:00h
27.7 (33)
25.2-31.2
27 26.9 - - - - - - - Ce
Norops trachyderma 29, 38 D
09:00h
16:00h
27.8 (31)
25.6-29.8
26.9 26.9 - - - - - - 53.1
(1) A
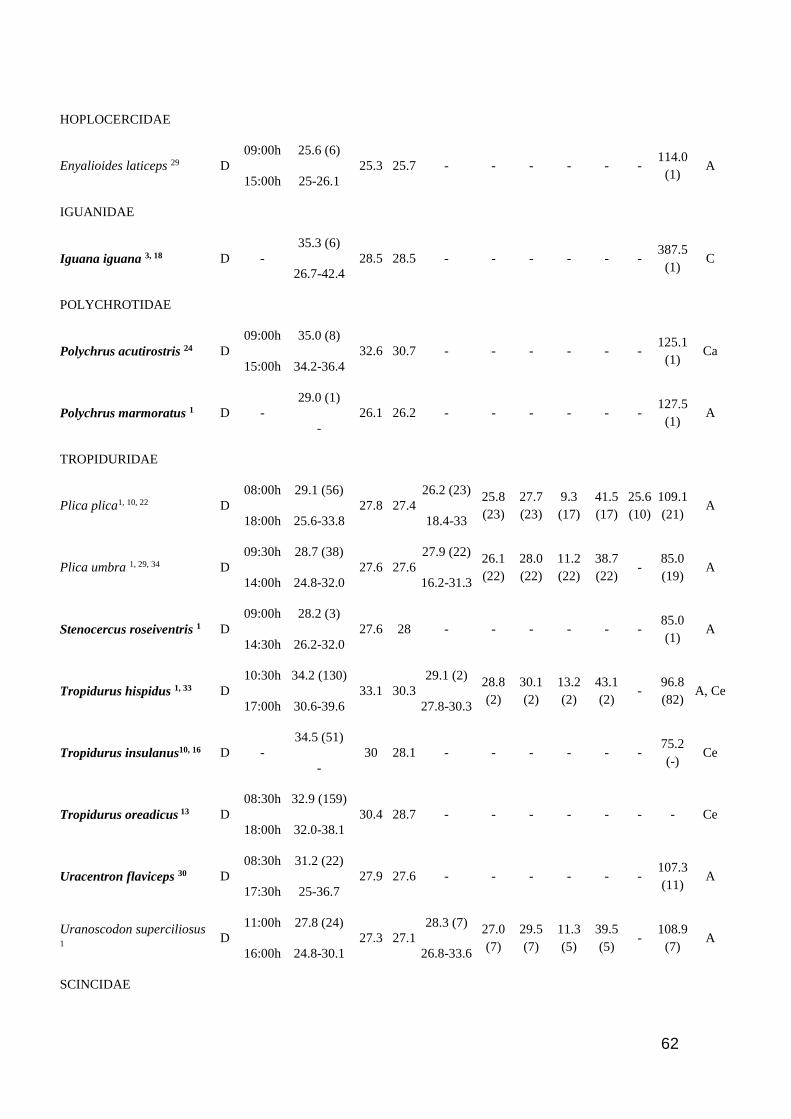
62
HOPLOCERCIDAE
Enyalioides laticeps 29 D
09:00h
15:00h
25.6 (6)
25-26.1
25.3 25.7 - - - - - - 114.0
(1) A
IGUANIDAE
Iguana iguana 3, 18 D -
35.3 (6)
26.7-42.4
28.5 28.5 - - - - - - 387.5
(1) C
POLYCHROTIDAE
Polychrus acutirostris 24 D
09:00h
15:00h
35.0 (8)
34.2-36.4
32.6 30.7 - - - - - - 125.1
(1) Ca
Polychrus marmoratus 1 D -
29.0 (1)
-
26.1 26.2 - - - - - - 127.5
(1) A
TROPIDURIDAE
Plica plica1, 10, 22 D
08:00h
18:00h
29.1 (56)
25.6-33.8
27.8 27.4
26.2 (23)
18.4-33
25.8
(23)
27.7
(23)
9.3
(17)
41.5
(17)
25.6
(10)
109.1
(21) A
Plica umbra 1, 29, 34 D
09:30h
14:00h
28.7 (38)
24.8-32.0
27.6 27.6
27.9 (22)
16.2-31.3
26.1
(22)
28.0
(22)
11.2
(22)
38.7
(22) -
85.0
(19) A
Stenocercus roseiventris 1 D
09:00h
14:30h
28.2 (3)
26.2-32.0
27.6 28 - - - - - - 85.0
(1) A
Tropidurus hispidus 1, 33 D
10:30h
17:00h
34.2 (130)
30.6-39.6
33.1 30.3
29.1 (2)
27.8-30.3
28.8
(2)
30.1
(2)
13.2
(2)
43.1
(2) -
96.8
(82) A, Ce
Tropidurus insulanus10, 16 D -
34.5 (51)
-
30 28.1 - - - - - - 75.2
(-) Ce
Tropidurus oreadicus 13 D
08:30h
18:00h
32.9 (159)
32.0-38.1
30.4 28.7 - - - - - - - Ce
Uracentron flaviceps 30 D
08:30h
17:30h
31.2 (22)
25-36.7
27.9 27.6 - - - - - - 107.3
(11) A
Uranoscodon superciliosus 1
D
11:00h
16:00h
27.8 (24)
24.8-30.1
27.3 27.1
28.3 (7)
26.8-33.6
27.0
(7)
29.5
(7)
11.3
(5)
39.5
(5) -
108.9
(7) A
SCINCIDAE
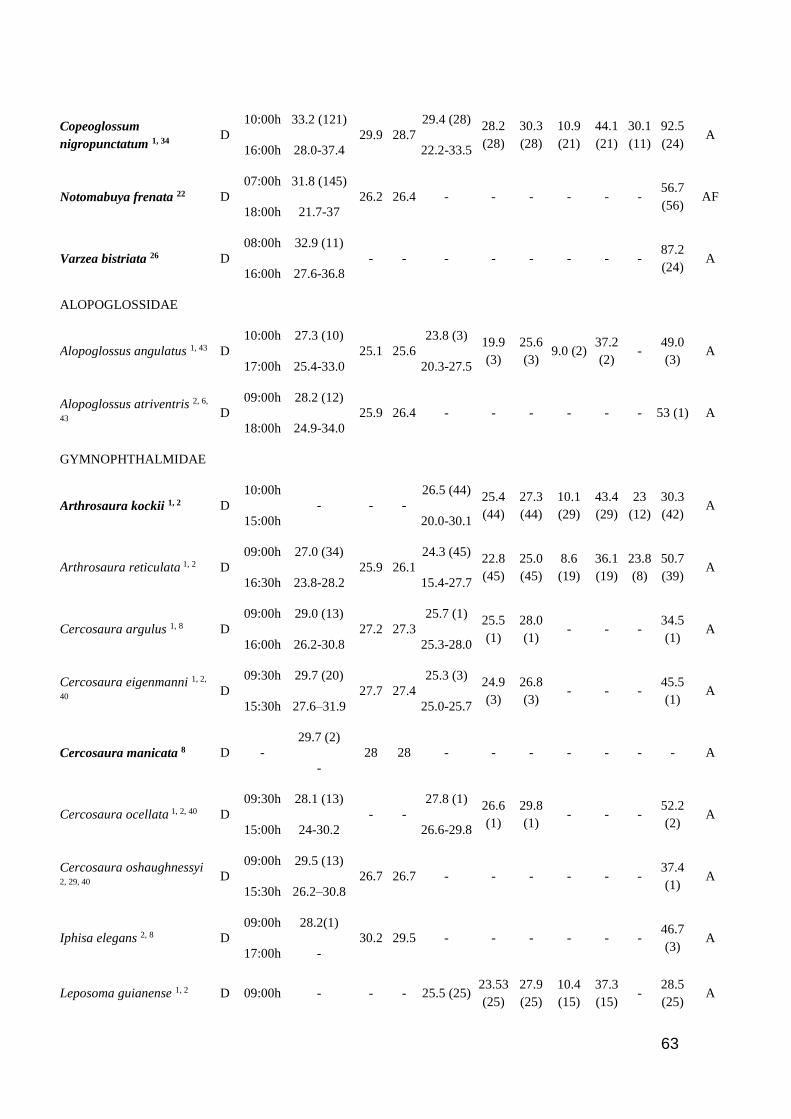
63
Copeoglossum
nigropunctatum 1, 34 D
10:00h
16:00h
33.2 (121)
28.0-37.4
29.9 28.7
29.4 (28)
22.2-33.5
28.2
(28)
30.3
(28)
10.9
(21)
44.1
(21)
30.1
(11)
92.5
(24) A
Notomabuya frenata 22 D
07:00h
18:00h
31.8 (145)
21.7-37
26.2 26.4 - - - - - - 56.7
(56) AF
Varzea bistriata 26 D
08:00h
16:00h
32.9 (11)
27.6-36.8
- - - - - - - - 87.2
(24) A
ALOPOGLOSSIDAE
Alopoglossus angulatus 1, 43 D
10:00h
17:00h
27.3 (10)
25.4-33.0
25.1 25.6
23.8 (3)
20.3-27.5
19.9
(3)
25.6
(3) 9.0 (2)
37.2
(2) -
49.0
(3) A
Alopoglossus atriventris 2, 6, 7,
43 D
09:00h
18:00h
28.2 (12)
24.9-34.0
25.9 26.4 - - - - - - 53 (1) A
GYMNOPHTHALMIDAE
Arthrosaura kockii 1, 2 D
10:00h
15:00h
- - -
26.5 (44)
20.0-30.1
25.4
(44)
27.3
(44)
10.1
(29)
43.4
(29)
23
(12)
30.3
(42) A
Arthrosaura reticulata 1, 2 D
09:00h
16:30h
27.0 (34)
23.8-28.2
25.9 26.1
24.3 (45)
15.4-27.7
22.8
(45)
25.0
(45)
8.6
(19)
36.1
(19)
23.8
(8)
50.7
(39) A
Cercosaura argulus 1, 8 D
09:00h
16:00h
29.0 (13)
26.2-30.8
27.2 27.3
25.7 (1)
25.3-28.0
25.5
(1)
28.0
(1) - - -
34.5
(1) A
Cercosaura eigenmanni 1, 2,
40 D
09:30h
15:30h
29.7 (20)
27.6–31.9
27.7 27.4
25.3 (3)
25.0-25.7
24.9
(3)
26.8
(3) - - -
45.5
(1) A
Cercosaura manicata 8 D -
29.7 (2)
-
28 28 - - - - - - - A
Cercosaura ocellata 1, 2, 40 D
09:30h
15:00h
28.1 (13)
24-30.2
- -
27.8 (1)
26.6-29.8
26.6
(1)
29.8
(1) - - -
52.2
(2) A
Cercosaura oshaughnessyi 2, 29, 40
D
09:00h
15:30h
29.5 (13)
26.2–30.8
26.7 26.7 - - - - - - 37.4
(1) A
Iphisa elegans 2, 8 D
09:00h
17:00h
28.2(1)
-
30.2 29.5 - - - - - - 46.7
(3) A
Leposoma guianense 1, 2 D 09:00h - - - 25.5 (25) 23.53
(25)
27.9
(25)
10.4
(15)
37.3
(15) -
28.5
(25) A
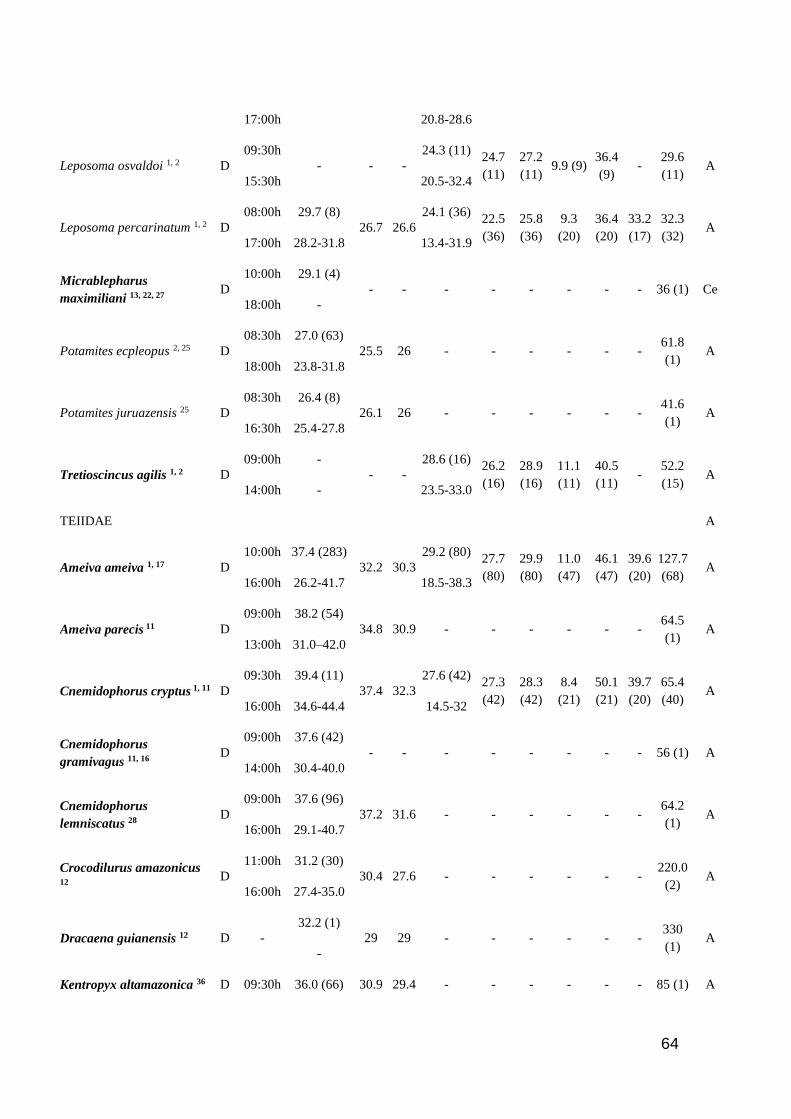
64
17:00h 20.8-28.6
Leposoma osvaldoi 1, 2 D
09:30h
15:30h
- - -
24.3 (11)
20.5-32.4
24.7
(11)
27.2
(11) 9.9 (9)
36.4
(9) -
29.6
(11) A
Leposoma percarinatum 1, 2 D
08:00h
17:00h
29.7 (8)
28.2-31.8
26.7 26.6
24.1 (36)
13.4-31.9
22.5
(36)
25.8
(36)
9.3
(20)
36.4
(20)
33.2
(17)
32.3
(32) A
Micrablepharus
maximiliani 13, 22, 27 D
10:00h
18:00h
29.1 (4)
-
- - - - - - - - 36 (1) Ce
Potamites ecpleopus 2, 25 D
08:30h
18:00h
27.0 (63)
23.8-31.8
25.5 26 - - - - - - 61.8
(1) A
Potamites juruazensis 25 D
08:30h
16:30h
26.4 (8)
25.4-27.8
26.1 26 - - - - - - 41.6
(1) A
Tretioscincus agilis 1, 2 D
09:00h
14:00h
-
-
- -
28.6 (16)
23.5-33.0
26.2
(16)
28.9
(16)
11.1
(11)
40.5
(11) -
52.2
(15) A
TEIIDAE A
Ameiva ameiva 1, 17 D
10:00h
16:00h
37.4 (283)
26.2-41.7
32.2 30.3
29.2 (80)
18.5-38.3
27.7
(80)
29.9
(80)
11.0
(47)
46.1
(47)
39.6
(20)
127.7
(68) A
Ameiva parecis 11 D
09:00h
13:00h
38.2 (54)
31.0–42.0
34.8 30.9 - - - - - - 64.5
(1) A
Cnemidophorus cryptus 1, 11 D
09:30h
16:00h
39.4 (11)
34.6-44.4
37.4 32.3
27.6 (42)
14.5-32
27.3
(42)
28.3
(42)
8.4
(21)
50.1
(21)
39.7
(20)
65.4
(40) A
Cnemidophorus
gramivagus 11, 16 D
09:00h
14:00h
37.6 (42)
30.4-40.0
- - - - - - - - 56 (1) A
Cnemidophorus
lemniscatus 28 D
09:00h
16:00h
37.6 (96)
29.1-40.7
37.2 31.6 - - - - - - 64.2
(1) A
Crocodilurus amazonicus 12
D
11:00h
16:00h
31.2 (30)
27.4-35.0
30.4 27.6 - - - - - - 220.0
(2) A
Dracaena guianensis 12 D -
32.2 (1)
-
29 29 - - - - - - 330
(1) A
Kentropyx altamazonica 36 D 09:30h 36.0 (66) 30.9 29.4 - - - - - - 85 (1) A
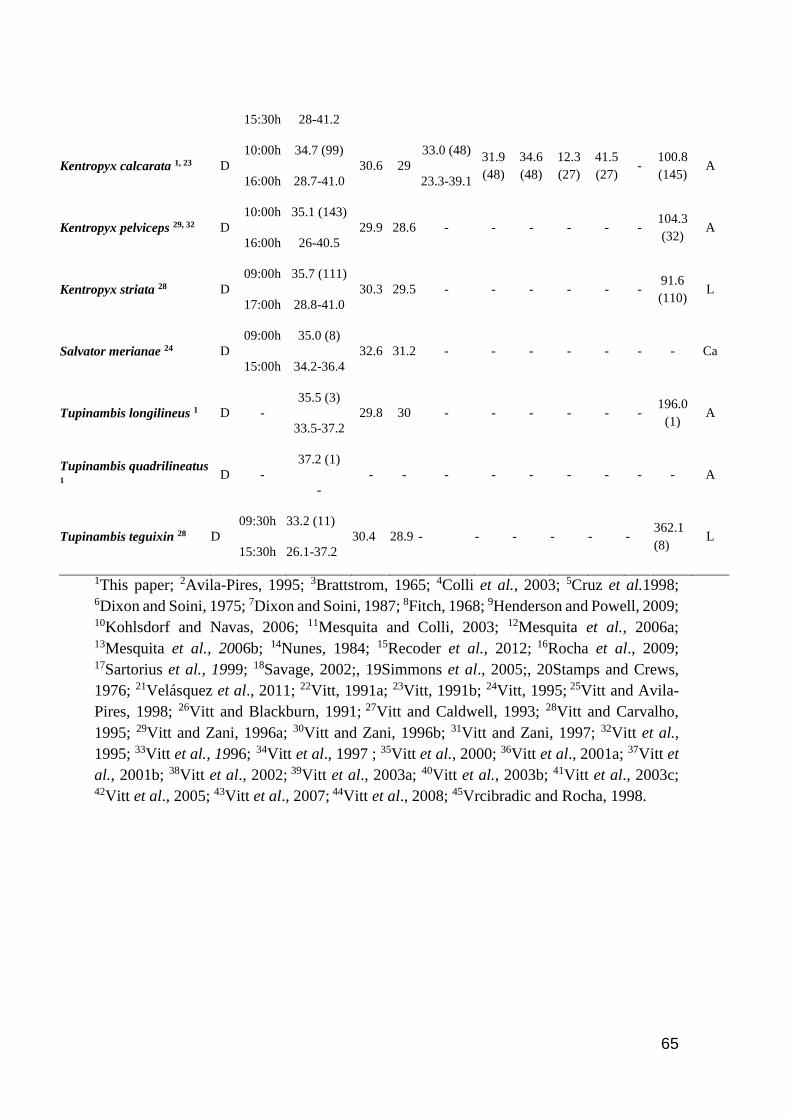
65
1This paper; 2Avila-Pires, 1995; 3Brattstrom, 1965; 4Colli et al., 2003; 5Cruz et al.1998; 6Dixon and Soini, 1975; 7Dixon and Soini, 1987; 8Fitch, 1968; 9Henderson and Powell, 2009; 10Kohlsdorf and Navas, 2006; 11Mesquita and Colli, 2003; 12Mesquita et al., 2006a; 13Mesquita et al., 2006b; 14Nunes, 1984; 15Recoder et al., 2012; 16Rocha et al., 2009; 17Sartorius et al., 1999; 18Savage, 2002;, 19Simmons et al., 2005;, 20Stamps and Crews,
1976; 21Velásquez et al., 2011; 22Vitt, 1991a; 23Vitt, 1991b; 24Vitt, 1995; 25Vitt and Avila-
Pires, 1998; 26Vitt and Blackburn, 1991; 27Vitt and Caldwell, 1993; 28Vitt and Carvalho,
1995; 29Vitt and Zani, 1996a; 30Vitt and Zani, 1996b; 31Vitt and Zani, 1997; 32Vitt et al.,
1995; 33Vitt et al., 1996; 34Vitt et al., 1997 ; 35Vitt et al., 2000; 36Vitt et al., 2001a; 37Vitt et
al., 2001b; 38Vitt et al., 2002; 39Vitt et al., 2003a; 40Vitt et al., 2003b; 41Vitt et al., 2003c;
42Vitt et al., 2005; 43Vitt et al., 2007; 44Vitt et al., 2008; 45Vrcibradic and Rocha, 1998.
15:30h 28-41.2
Kentropyx calcarata 1, 23 D
10:00h
16:00h
34.7 (99)
28.7-41.0
30.6 29
33.0 (48)
23.3-39.1
31.9
(48)
34.6
(48)
12.3
(27)
41.5
(27) -
100.8
(145) A
Kentropyx pelviceps 29, 32 D
10:00h
16:00h
35.1 (143)
26-40.5
29.9 28.6 - - - - - - 104.3
(32) A
Kentropyx striata 28 D
09:00h
17:00h
35.7 (111)
28.8-41.0
30.3 29.5 - - - - - - 91.6
(110) L
Salvator merianae 24 D
09:00h
15:00h
35.0 (8)
34.2-36.4
32.6 31.2 - - - - - - - Ca
Tupinambis longilineus 1 D -
35.5 (3)
33.5-37.2
29.8 30 - - - - - - 196.0
(1) A
Tupinambis quadrilineatus 1
D -
37.2 (1)
-
- - - - - - - - - A
Tupinambis teguixin 28 D
09:30h
15:30h
33.2 (11)
26.1-37.2
30.4 28.9 - - - - - - 362.1
(8) L
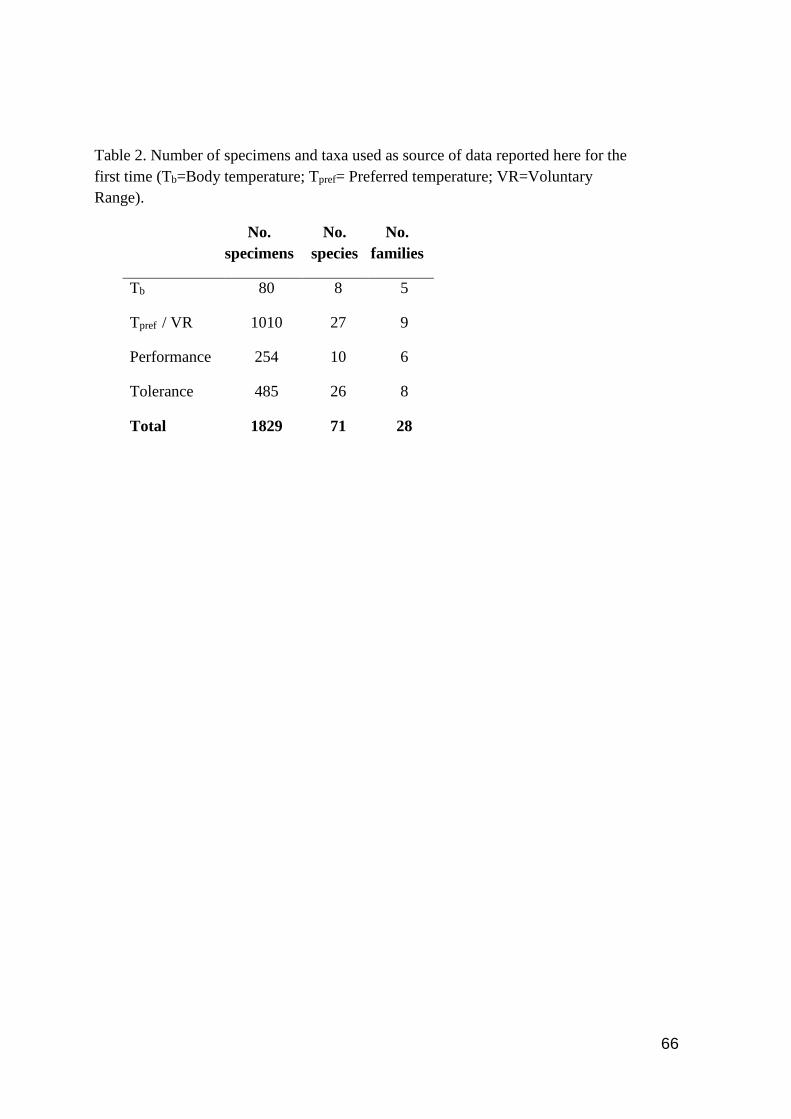
66
Table 2. Number of specimens and taxa used as source of data reported here for the
first time (Tb=Body temperature; Tpref= Preferred temperature; VR=Voluntary
Range).
No.
specimens
No.
species
No.
families
Tb 80 8 5
Tpref / VR 1010 27 9
Performance 254 10 6
Tolerance 485 26 8
Total 1829 71 28
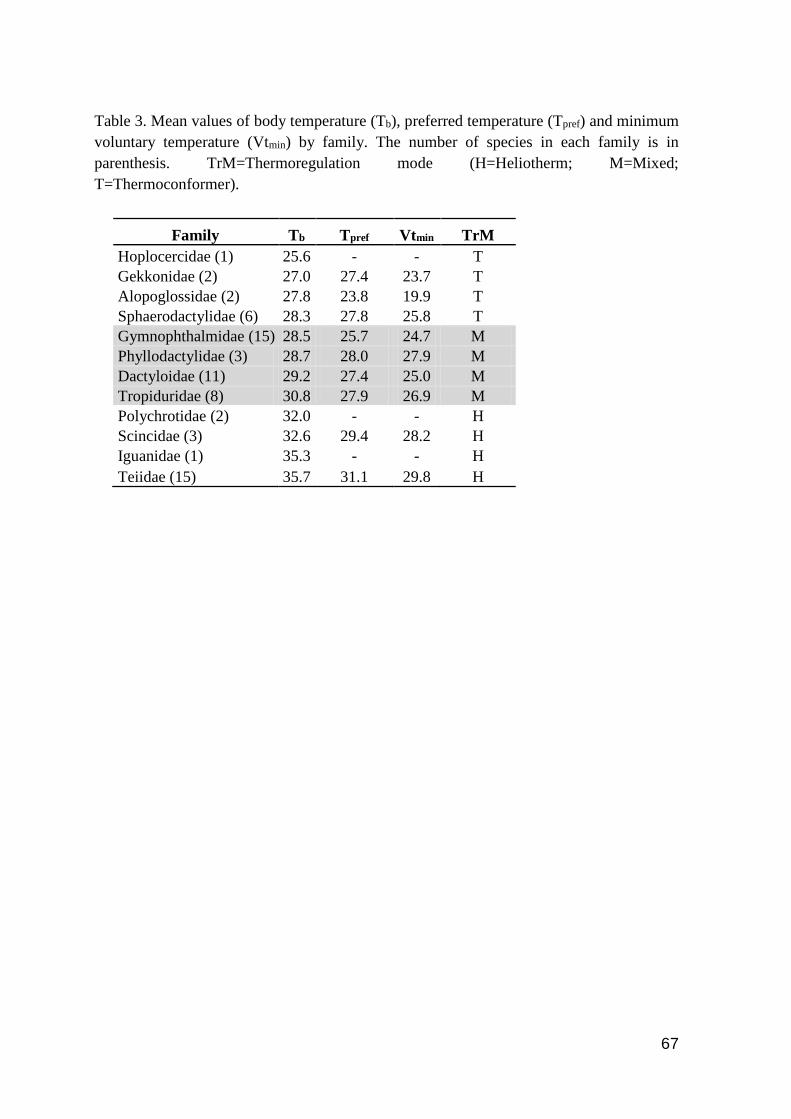
67
Table 3. Mean values of body temperature (Tb), preferred temperature (Tpref) and minimum
voluntary temperature (Vtmin) by family. The number of species in each family is in
parenthesis. TrM=Thermoregulation mode (H=Heliotherm; M=Mixed;
T=Thermoconformer).
Family Tb Tpref Vtmin TrM
Hoplocercidae (1) 25.6 - - T
Gekkonidae (2) 27.0 27.4 23.7 T
Alopoglossidae (2) 27.8 23.8 19.9 T
Sphaerodactylidae (6) 28.3 27.8 25.8 T
Gymnophthalmidae (15) 28.5 25.7 24.7 M
Phyllodactylidae (3) 28.7 28.0 27.9 M
Dactyloidae (11) 29.2 27.4 25.0 M
Tropiduridae (8) 30.8 27.9 26.9 M
Polychrotidae (2) 32.0 - - H
Scincidae (3) 32.6 29.4 28.2 H
Iguanidae (1) 35.3 - - H
Teiidae (15) 35.7 31.1 29.8 H
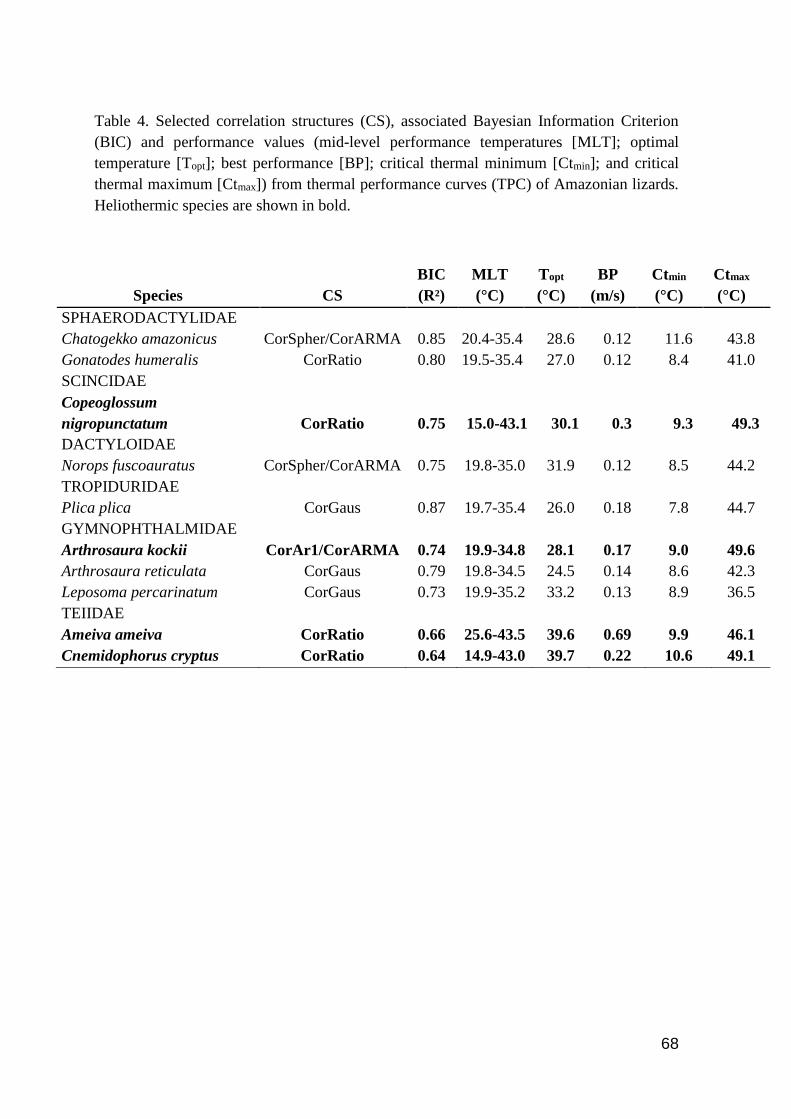
68
Table 4. Selected correlation structures (CS), associated Bayesian Information Criterion
(BIC) and performance values (mid-level performance temperatures [MLT]; optimal
temperature [Topt]; best performance [BP]; critical thermal minimum [Ctmin]; and critical
thermal maximum [Ctmax]) from thermal performance curves (TPC) of Amazonian lizards.
Heliothermic species are shown in bold.
Species CS
BIC
(R²)
MLT
(°C)
Topt
(°C)
BP
(m/s)
Ctmin
(°C)
Ctmax
(°C)
SPHAERODACTYLIDAE
Chatogekko amazonicus CorSpher/CorARMA 0.85 20.4-35.4 28.6 0.12 11.6 43.8
Gonatodes humeralis CorRatio 0.80 19.5-35.4 27.0 0.12 8.4 41.0
SCINCIDAE
Copeoglossum
nigropunctatum CorRatio 0.75 15.0-43.1 30.1 0.3 9.3 49.3
DACTYLOIDAE
Norops fuscoauratus CorSpher/CorARMA 0.75 19.8-35.0 31.9 0.12 8.5 44.2
TROPIDURIDAE
Plica plica CorGaus 0.87 19.7-35.4 26.0 0.18 7.8 44.7
GYMNOPHTHALMIDAE
Arthrosaura kockii CorAr1/CorARMA 0.74 19.9-34.8 28.1 0.17 9.0 49.6
Arthrosaura reticulata CorGaus 0.79 19.8-34.5 24.5 0.14 8.6 42.3
Leposoma percarinatum CorGaus 0.73 19.9-35.2 33.2 0.13 8.9 36.5
TEIIDAE
Ameiva ameiva CorRatio 0.66 25.6-43.5 39.6 0.69 9.9 46.1
Cnemidophorus cryptus CorRatio 0.64 14.9-43.0 39.7 0.22 10.6 49.1
69
CLIMATE CHANGES AND THE VULNERABILITY OF AMAZONIAN LIZARDS
Diele-Viegas, L. M.¹, Sinervo, B. R.², Colli, G. R.³, Werneck, F.4, Caetano, G.5, Santos,
J.6, Sette, C. M.7, Ávila-Pires, T. C. S.8
1 Programa de pós graduação em Zoologia UFPA/MPEG, Belem, Para, Brazil,
Author for correspondence: [email protected]
2University of California, Santa Cruz, California, United States.
3 Universidade de Brasilia, Brasilia, Distrito Federal, Brazil.
4 Instituto Nacional de Pesquisas da Amazonia, Manaus, Amazonas, Brazil.
5Graduate program in Ecology and Evolutionary Biology UCSC, Santa Cruz, California, United States.
6 Postdoctoral BYU, Provo, Utah, United States.
7 Graduate program in Ecology and Evolutionary Biology UCSC, Santa Cruz, California, United States.
8 Museu Paraense Emílio Goeldi, Belem, Para, Brasil.
Abstract
The global warming has the potential to drive many species to extinction. Lizards are
ectotherms and depend on the environmental temperature to thermoregulate, so the
increase in temperatures predicted by the end of the XXI century may drive many species
to experiences periods of thermic stress and thus to be vulnerable to the climate changes.
In the tropics, the threat appears to be more worrying, although, at least in Amazonia, the
species’ thermal physiology is poorly known, hindering good estimates about their
vulnerability to global warming. Therefore, here we model extinct/persistence status of
29 species of Amazonian lizards with available data on their thermal physiology. Some
authors have been posited that thermoconformers are more vulnerable than heliotherms
to climate changes, arguing that they are active at low body temperatures and are
intolerant of warm temperatures, but other authors disagree. Here we also test the
hypothesis that the extinction risk is unrelated to thermoregulatory mode, but is increased
by low body temperatures, low hours of restrictions (i.e., the period when lizards are
forced into retreat sites because environmental temperatures are too high) and high
maximum environmental temperatures. Our results shows that Three out of 29 species
are predicted to present a positive occurrence status, what means that territorial expansion
should occur in the next years, and present a mean of 86.2% of expansion by 2050 and
70
63.3% by 2070. The other 26 species present a negative occurrence status, thus losing
part of their occurrence area until 2070. These species present a mean of 64.3% of area
loss by 2050, varying from 10.9% in Leposoma percarinatum to 90.7% in Plica umbra.
By 2070, the mean reaches 80.7%, varying from 50.5% in L. percarinatum up to 96.5%
in Crocodilurus amazonicus. Heliotherms presents higher mean losses of occurrence area
than thermoconformers, although the predicted percentage values differs only 2.7% by
2070. We recovered heliotherms and thermoconformers with both high and low predicted
percentages of area loss, and most of the species with predicted reductions in occurrence
area present low body temperatures and/or low hours of restrictions. Therefore, our results
are in agreement with the hypothesis tested. We also agree with the remark that tropical
forest lizards would be markedly affected by global warming, by recovering a high
vulnerability of Amazonian lizards to the climate changes. Thus, our results allows the
researchers to survey extinctions by focusing on sites with predicted reductions of
occurrence area for several species, and defines protection areas where lizards are
predicted to persist or expand.
Key-Words: Amazonia, Global Warming, Lizards, Thermal Physiology, Species
Distribution Modeling.
1. Introduction
The concentration of greenhouse gases has increased exponentially since the
development of industrial activities in the middle of the XVIII century (Marengo 2006),
and nowadays is higher than seen in the last 800 thousand years (IPCC 2014). Together
with other anthropogenic factors, it is arguably the main cause of the global warming
observed since the middle of the XX century: the Earth is about 0.85°C hotter, and the
worse predictions indicate an increase in temperature of up to 4.8°C until the end of the
XXI century (IPCC 2014).
Climate change threatens the global biodiversity, with the potential of driving to
extinction many species (Bellard et al. 2012; Hof et al. 2011; Sinervo et al. 2010). In the
tropics, the threat appears even more worrying (Tewksbury et al. 2008), since the
acclimation capacity of the species appears to be more limited (Janzen 1967).
71
Environmental changes induce compensatory responses by the organisms. Climate
changes can cause animals to disperse to more favorable environments, as well to adjust
behavioral or physiologically, or even to adapt over generations to the new conditions
(Paranjpe et al. 2013). The responses will depend not only on the magnitude of the
environmental temperature shift and the temporal scale that it takes to happen, but also
on the behavior, morphology, physiology and ecology of the organisms in question
(Kearney & Porter 2004; Bradshaw & Holzapfel 2008). Alternatively, when the
population is incapable to present sufficient compensatory responses to mitigate the
climate change effects, it culminates in demographic collapse and extinction (Sinervo et
al. 2010; Hoffman & Sgró 2011; Paranjpe et al. 2013).
Lizards are ectotherms and depend on the environmental temperature to
thermoregulate. The maintenance of body temperature (Tb) within suitable limits is
essential for a lizard’s survival, once it affects the performance of several metabolic
processes, from cardiovascular functions to locomotor capacity (Baker & White 1970;
Stevenson et al. 1985). That is the reason for thermoregulation to have a high complexity
level and present many mechanisms, such as thermoreception, hormonal control and
metabolic shifts (Bogert 1959; Seebacher & Franklin 2005).
In the Neotropics, lizards’ diversity is primarily composed by thermoconformers,
which live in constant shading and track ambient air and surface temperatures (Huey
1982; Sinervo et al. 2010), even though they can present a certain degree of active
thermoregulation, resulting in Tbs a little higher than air or substrate temperatures (Vitt et
al. 1998). Heliotherms in turn are active thermoregulators and bask to achieve higher Tbs
(Huey & Stevenson 1979).
Amazonia comprises almost 8 million square kilometers of tropical rainforest over
nine South American countries (Eva et al. 2005), and it harbors more than 200 species of
lizards. Many species of the tropics already experience Tbs above their physiological
optimum and, for that reason, are already vulnerable to global warming (Huey et al.
2009). However, thermal physiology of Amazonian species is poorly known, hindering
good estimates about their vulnerability to global warming.
Heliotherms present many behavioral strategies to avoid thermic stress, such as
postural change and microenvironmental shifts (Heath 1965). In thermoconformers such
strategies are less frequent because they live in a more thermally homogeneous place and
72
generally do not expose themselves to open areas with direct solar incidence, maintaining
their Tb close to that of the environment (Huey 1982). Independent of such differences,
periods of thermic stress should restrain the activity of both thermoconformers and
heliotherms. As the periods of thermic stress increase, the number of hours of restriction
(Hr) also increases and limits foraging, constraining costly metabolic functions, thereby
undermining population growth rates and raising the population’s extinction risk (Sinervo
et al. 2010). Considering the differences in thermoregulation between heliotherms and
thermoconformers, one might expect that the extinction risk would be different for each
group, but Sinervo et al. (2010) obtained that this is not the case. Instead, they found
extinction risk to be negatively related to Tb and to Hr, and positively related to maximum
environmental temperatures. Here we model extinct/persistence status of 29 species of
Amazonian lizards based on their thermal physiology and test the hypothesis proposed
by Sinervo et al. (2010).
2. Materials and Methods
We surveyed data from literature and recovered Tbs on 16 species of Amazonian
lizards and thermal preference on other 13 species, which were collected from 2014 to 2016
in five Amazonian localities — Floresta Nacional do Amapá (Amapá, Brazil, 0°55’N,
51°36’W); Floresta Nacional de Caxiuanã (Pará, Brazil, 1°27’S, 51°17’W); Reserva
Florestal Adolpho Ducke (Manaus, Brazil, 2°57’S, 59°55’W); Los Amigos Biological
Station (Peru, 12°34’S, 70°6’W); and Yasuni National Park (Ecuador, 1°5’S, 75°55’W) —,
and one in an Amazonia–Cerrado ecotone — Centro de Pesquisas Canguçu (Tocantins,
Brazil, 9°56’S, 49°47’W). Operative temperatures (Top) were obtained with HOBO 2x
External Temperature Data Logger installed inside the forest and in open areas. Temperature
recordings were made every two minutes for each data logger during about 15 full days in
each locality, in both dry and wet seasons. Each Top was considered as the mean of
temperatures per hour for each data logger installed. As described by Diele-Viegas et al.
(chapter 1), the specimens were captured in the wild and taken to a field laboratory, where
the snout-vent length were measured to 1mm with a vernier caliper and the experiments
began.
Geographical distribution data used to model the species extinction/persistence status
were surveyed from the literature and in the following biological collections: Coleção
73
Herpetológica Osvaldo Rodrigues da Cunha, MPEG, Belém/PA, Coleção de Anfíbios e
Répteis do INPA, Manaus/AM e Coleção Herpetológica da UNB, Brasília/DF.
Environmental data from present and future projections (2050 and 2070) were obtained from
WorldClim Database (Hijmans et al. 2005), in 2.5 arc-minute resolution. Predictions were
made on basis of the most optimistic (RCP4.5) of two intermediate scenarios of carbon
dioxide emissions considered by IPCC (2014), based on factors such as population size,
economic activity, life style, energy use, land use patterns, technology and climate policy.
In this scenario, the increase of temperature by the end of 21st century is likely to be 1.1 to
2.6°C.
We made all analyses in the statistical software environment R 3.3.1. The species
status was calculated by using a model based on the physiological limits that define a
species’ climatic tolerance and the empirical relationships between observed species
distribution and environmental variables. The model was run in Biomod2 package
(Thuiller et al. 2016), having as informative variables the maximum voluntary
temperature (Vtmax), the upper bound of preferred temperature (Kubisch et al. 2016);
critical thermal minimum (Ctmin), which is the lower extreme temperature from which the
animal starts its activity (Angilletta et al. 2002); thermoregulation mode; hours of
restriction (Hr); and SVL. We used Tb instead of Vtmax when this value was missing, and
a standard value of 10°C for species without defined Ctmin (based on the mean of all Ctmins
available). Predictor variables (from WorldClim) where the mean of diurnal range (mean
of monthly (max temp – min temp)), annual precipitation, precipitation of the coldest,
warmest and wettest quarter, temperature seasonality (standard deviation*100), and
maximum temperature of the warmest month. The model is supported by the ecological
niche theory, which defines fundamental ecological niche as the environmental
conditions within which a species can survive and grow (Hutchinson 1957). It assumes
that niches are conservative over time and that a species’ realized niche (or current
distribution) represents the best indicator of its climatic requirements. It represents the
climate component of the fundamental niche, or the 'climate niche' (Pearson & Dawson
2003), and provide a simulation of the potential magnitude and the broad pattern of future
impacts on a species realized niche. It also provide insights into the biotic interactions, as
well as anthropogenic constraints that affect a species’ sensitivity to climate change
(Preston et al. 2008).
74
To calculate Hr we associated Top with Vtmax (or Tb) and Ctmin (or 10°C). We
considered as Hr the cumulative hours that Top exceeds Vtmax or Tb, and they were
calculated by Richard’s curves (Richards 1959), that allow that the inflection point of the
curve stays at any value between the minimum and maximum asymptote (Birch 1999),
and is represented by the equation below, where Asym is the upper asymptote, M is the
coefficient of form, K is the slope coefficient and Infl is the inflection coefficient:
Hr=Asym/((1+M*exp(-K*(t_air-Infl)))^(1/M)))
We used several algorithms to select the one with the highest values of significance
through Relative Operating Characteristic (ROC) curves. These curves provide the area
under the curve (AUC) that measure the discriminatory capacity of the model, allowing
to interpret the results as the probability that the model can predict the location of a point
of presence and other point of absence correctly (Fielding & Bell 1997; Giannini et al.
2012). The algorithms tested were Artificial Neural Networks (ANN), Generalized
Additive Model (GAM), Geometric Brownian Motion (GBM), and Generalized Linear
Model (GLM). We used a pattern value of 1000 pseudo-absence points to insure the
accuracy of the model and generate distribution maps (Lobo & Tognelli 2011). The
delimitation of current occurrence area were made considering data on altitude obtained
through WorldClim (Hijmans et al. 2005). The maps were cropped to include all the
extension of Amazonia (8, -48; 8, -78; -14,-48; -14,-78; latitude, longitude), which is the
area we focus on. We excluded areas that the species were not known to occur and were
considered not able to expand due to unsuitable habitats or biogeographic barriers, so that
the extension of the Total Occurrence Area (TOA) were based on Model Estimated Area
(MEA) – Suppressed Area (SA). Thus, we estimated the predicted species' occurrence
area to 2050 and 2070, based in TOA and with a binary threshold value of 0.75, to set the
percentage of reduction or expansion area forecast by the species.
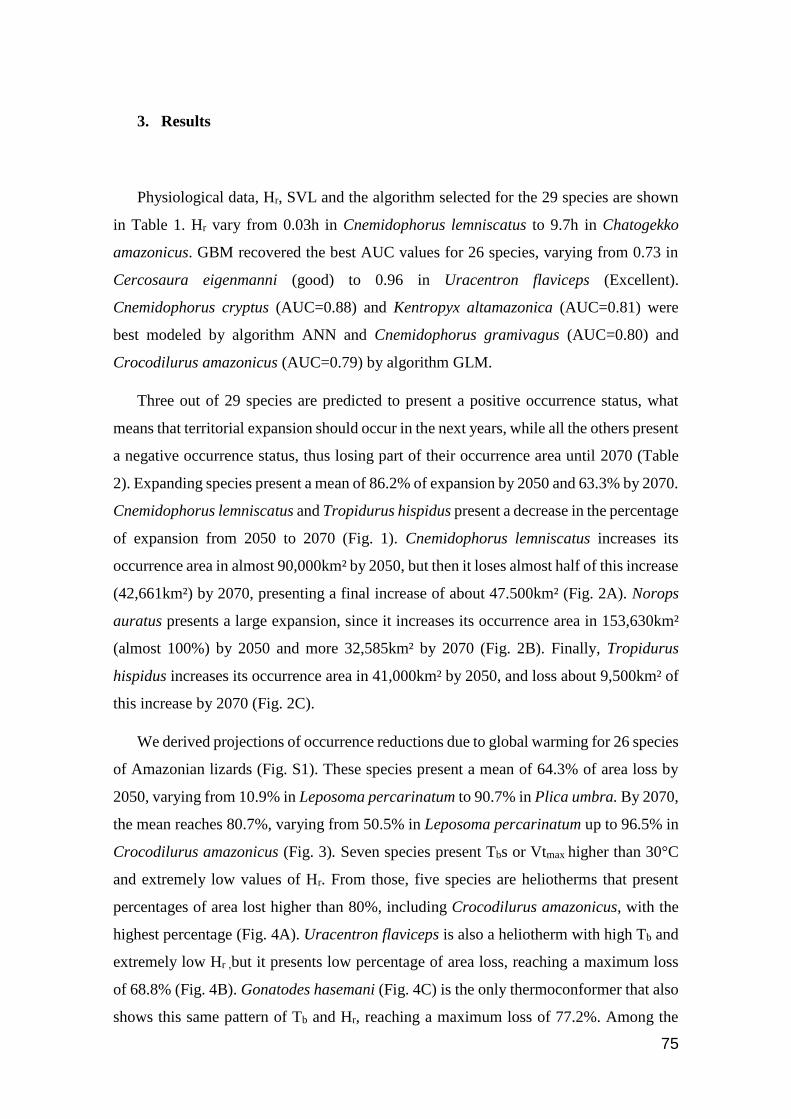
75
3. Results
Physiological data, Hr, SVL and the algorithm selected for the 29 species are shown
in Table 1. Hr vary from 0.03h in Cnemidophorus lemniscatus to 9.7h in Chatogekko
amazonicus. GBM recovered the best AUC values for 26 species, varying from 0.73 in
Cercosaura eigenmanni (good) to 0.96 in Uracentron flaviceps (Excellent).
Cnemidophorus cryptus (AUC=0.88) and Kentropyx altamazonica (AUC=0.81) were
best modeled by algorithm ANN and Cnemidophorus gramivagus (AUC=0.80) and
Crocodilurus amazonicus (AUC=0.79) by algorithm GLM.
Three out of 29 species are predicted to present a positive occurrence status, what
means that territorial expansion should occur in the next years, while all the others present
a negative occurrence status, thus losing part of their occurrence area until 2070 (Table
2). Expanding species present a mean of 86.2% of expansion by 2050 and 63.3% by 2070.
Cnemidophorus lemniscatus and Tropidurus hispidus present a decrease in the percentage
of expansion from 2050 to 2070 (Fig. 1). Cnemidophorus lemniscatus increases its
occurrence area in almost 90,000km² by 2050, but then it loses almost half of this increase
(42,661km²) by 2070, presenting a final increase of about 47.500km² (Fig. 2A). Norops
auratus presents a large expansion, since it increases its occurrence area in 153,630km²
(almost 100%) by 2050 and more 32,585km² by 2070 (Fig. 2B). Finally, Tropidurus
hispidus increases its occurrence area in 41,000km² by 2050, and loss about 9,500km² of
this increase by 2070 (Fig. 2C).
We derived projections of occurrence reductions due to global warming for 26 species
of Amazonian lizards (Fig. S1). These species present a mean of 64.3% of area loss by
2050, varying from 10.9% in Leposoma percarinatum to 90.7% in Plica umbra. By 2070,
the mean reaches 80.7%, varying from 50.5% in Leposoma percarinatum up to 96.5% in
Crocodilurus amazonicus (Fig. 3). Seven species present Tbs or Vtmax higher than 30°C
and extremely low values of Hr. From those, five species are heliotherms that present
percentages of area lost higher than 80%, including Crocodilurus amazonicus, with the
highest percentage (Fig. 4A). Uracentron flaviceps is also a heliotherm with high Tb and
extremely low Hr ,but it presents low percentage of area loss, reaching a maximum loss
of 68.8% (Fig. 4B). Gonatodes hasemani (Fig. 4C) is the only thermoconformer that also
shows this same pattern of Tb and Hr, reaching a maximum loss of 77.2%. Among the
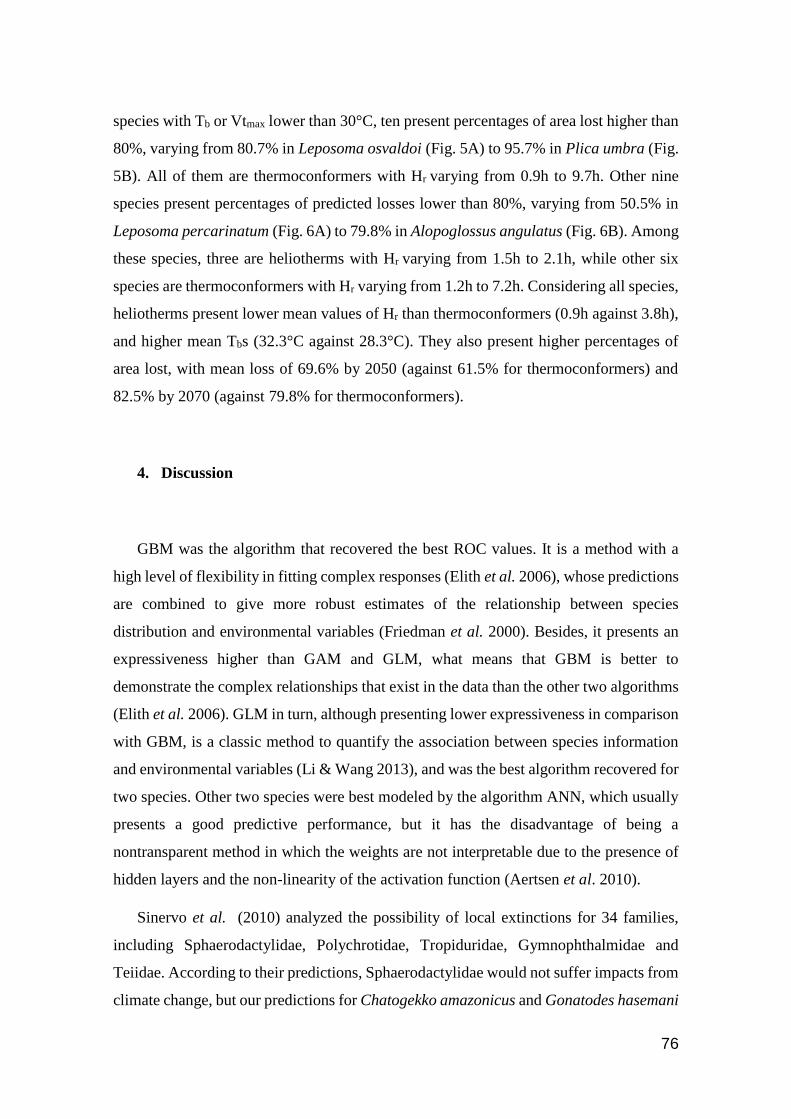
76
species with Tb or Vtmax lower than 30°C, ten present percentages of area lost higher than
80%, varying from 80.7% in Leposoma osvaldoi (Fig. 5A) to 95.7% in Plica umbra (Fig.
5B). All of them are thermoconformers with Hr varying from 0.9h to 9.7h. Other nine
species present percentages of predicted losses lower than 80%, varying from 50.5% in
Leposoma percarinatum (Fig. 6A) to 79.8% in Alopoglossus angulatus (Fig. 6B). Among
these species, three are heliotherms with Hr varying from 1.5h to 2.1h, while other six
species are thermoconformers with Hr varying from 1.2h to 7.2h. Considering all species,
heliotherms present lower mean values of Hr than thermoconformers (0.9h against 3.8h),
and higher mean Tbs (32.3°C against 28.3°C). They also present higher percentages of
area lost, with mean loss of 69.6% by 2050 (against 61.5% for thermoconformers) and
82.5% by 2070 (against 79.8% for thermoconformers).
4. Discussion
GBM was the algorithm that recovered the best ROC values. It is a method with a
high level of flexibility in fitting complex responses (Elith et al. 2006), whose predictions
are combined to give more robust estimates of the relationship between species
distribution and environmental variables (Friedman et al. 2000). Besides, it presents an
expressiveness higher than GAM and GLM, what means that GBM is better to
demonstrate the complex relationships that exist in the data than the other two algorithms
(Elith et al. 2006). GLM in turn, although presenting lower expressiveness in comparison
with GBM, is a classic method to quantify the association between species information
and environmental variables (Li & Wang 2013), and was the best algorithm recovered for
two species. Other two species were best modeled by the algorithm ANN, which usually
presents a good predictive performance, but it has the disadvantage of being a
nontransparent method in which the weights are not interpretable due to the presence of
hidden layers and the non-linearity of the activation function (Aertsen et al. 2010).
Sinervo et al. (2010) analyzed the possibility of local extinctions for 34 families,
including Sphaerodactylidae, Polychrotidae, Tropiduridae, Gymnophthalmidae and
Teiidae. According to their predictions, Sphaerodactylidae would not suffer impacts from
climate change, but our predictions for Chatogekko amazonicus and Gonatodes hasemani
77
is that they will lose part of their occurrence area by 2050 and more by 2070. Huey et al.
(2009) also indicated that some Sphaerodactylus species could be at risk, with some
populations under thermal stress during the summer even in the present. For the other
families Sinervo et al. (2010) predicted local extinctions, as we did here for most species
we analyzed. Our predictions about the decrease in the occurrence area in most of our
species is also in agreement with Sinervo et al. (2010) projections of local extinctions,
once it result in species extinction probabilities of 20% by 2080, while we recovered mean
losses of 80% of occurrence area for Amazonian species by 2070.
We predicted that three out of twenty-nine species might increase their area by 2070,
whereas most may experience a decrease in their areas and thus be negatively affected by
global warming. Among the species with predicted decrease in occurrence area,
heliotherms presents higher mean losses of occurrence area than thermoconformers,
although the predicted percentage values differs only 2.7% by 2070. Some heliotherms
present low percentages of area loss predicted, such as A. kockii, U. flaviceps and T. agilis,
while some thermoconformers, in turn, present high percentages of area loss predicted,
such as C. amazonicus, P. umbra and Norops ortonii. Thus, we recovered heliotherms
and thermoconformers with both high and low predicted percentages of area loss, what is
in agreement with the hypothesis proposed by Sinervo et al. 2010 that extinction risk was
unrelated to thermoregulatory mode. Besides, 20 of our species with predicted decrease
in their occurrence areas present low values of Hr and 19 species presents low values of
Tb/Vtmax, both characters consider by Sinervo et al. (2010) as significant for the increase
of the lizards’ extinction risk.
Although Huey et al. (2009) suggest that thermoconformers would be more
vulnerable to the global warming than heliotherms, what we and Sinervo et al (2010)
disagree, they also presented data suggesting that tropical forest lizards would be
markedly affected by global warming, a result similar to ours. With the exception of the
three species with predicted increase of area and the two Cnemidophorus with predicted
area losses, all of our species are tropical forest dwellers and according to our models
their populations would suffer large reductions due to climate warming. Logan et al.
(2013, 2014, 2015), however, question if the high vulnerability predicted for these
animals are not overestimated, arguing that possibilities of behavioral adjustments and
physiological adaptations are not taken into account. Ecophysiological characters are
posit to be good refinements to the model. Kearney et al. (2009) emphasizes that seasonal
78
timing of activity, including reproductive activity, can be an important determinant of a
species’ ability to tolerate climate change. Sinervo et al. (2010) include reproductive
activity in their model, but, in tropics, the breeding period tends to be long, sometimes
lasting almost all year (Ávila-Pires 1995). Even so, for some species, such as the
viviparous scincids, this variable can be fundamental. Kubish et al. (2016) suggest the
inclusion of more life-cycle stages to the assessment of extinction risk, based in the
statement that thermal environment can also affect development and newborn survival
(Elphick & Shine 1998). They predicted the local extinction risk of three species of lizard
from Patagonia, by using the model proposed by Sinervo et al. 2010, but considering
locomotor performance and reproduction. Locomotor performance is related to the
foraging mode: active foragers usually presents better endurance capacity (i. e. length of
time an activity can be sustained or maximal sustained speed; Bennett & Licht 1973),
which is correlated with maximal rates of metabolism (Bennett 1982, 1991). Sit-and-wait
foragers in turn usually present good sprint performance, by moving fast, but only short
distances at a time (Huey et al. 1984).
Global warming is expected to drive widespread extinctions along the entire globe,
and even with global efforts to reduce CO2, the projections by 2050 are unlikely to be
avoid (Sinervo et al. 2010). The forest is also forecast to be affect by the climate changes,
with some projections of savannization of part of Amazonia, especially in the southeast,
a process that is intensified by deforestation and forest degradation due to human impact
(Salazar et al. 2007; Fearnside 2009). The model used here takes into account not only
environmental, but also physiological variables, but it should be noted that these scenarios
are considered in absence of others variables that may influence the species responses to
climate change as much as the variables considered by the model. Changes as cited above
can also influence the animals’ distributions, including lizards. Thus, refining the
projections by adding more factors external to the species' biology, such as deforestation
or savannization, will increase even more the model complexity and the accuracy of the
projections. In spite of this remark, our projections shows a high vulnerability of
Amazonian lizards to the climate changes, what allows the researchers to survey
extinctions by focusing on sites with predicted reductions of occurrence area for several
species, and defines protection areas where lizards are predicted to persist or expand.
79
Acknowledgements
We thank Coordenação de Aperfeiçoamento de Pessoal de Nível Superior (CAPES)
for financial support to a graduate fellowship to LMDV, and Conselho Nacional de
Desenvolvimento Científico e Tecnológico (CNPq) to a research fellowship to TCSAP. We
are grateful to A.P. Costa, E. Pontes, G. Lima, L. Chrisley and L. Franco for their help with
the fieldwork, and to D. Miles and M. Sturaro for the support in the analysis. We also thank
the institutions for access to the databases containing the herpetological collections. JCS
thanks the support of Jack W. Sites, Jr (BYU). This research was supported by Museu
Paraense Emílio Goeldi (MPEG), Universidade Federal do Pará (UFPA). CNPq and
FAPESPA [ICAAF number 011/2012 Sisbiota Herpeto-Helminto] and National Science
Foundation – Emerging Frontiers [grant number 1241885, Collaborative Research:
“Quantifying Climate-forced Extinction Risks for Lizards, Amphibians, Fishes, and
Plants”], awarded to B. Sinervo, J. Pittermann, D.B. Miles, J.W. Sites, Jr., A. Bauer, and a
several number of international collaborators.
References
Aertsen, W., Kint, V., Van Orshoven, J., Ozkan, K. & Muys, B. 2010. Comparison
and ranking of different modelling techniques for prediction of site index in Mediterranean
mountain forests. Ecological Modelling 221: 1119–1130.
Angilletta, M. J. Jr, Niewiarowski, P. H., Navas, C. A., 2002. The evolution of
thermal physiology in ectotherms. Journal of Thermal Biology, 27, 249-268.
Avila-Pires, T. C. S., 1995. Lizards of Brazilian Amazonia. Zoologische
verhandelingen 299(1): 1-706.
Baker, L. A., & F. N. White. 1970. Redistribution of cardiac output in response to
heating in Iguana iguana. Comp. Biochem. Physiol. 35:253-262.
Bellard, C., Bertelsmeier, C., Leadley, P., Thuiller, W., Courchamp, F., 2012.
Impacts of climate change on the future of biodiversity. Ecology Letters. 15, 5–377.
Bennett, A. F., 1982. The energetics of reptilian activity. In: Gans, C. & Pough, F.H.
(eds) Biology of the Reptilia, vol 13. Academic Press, New York, pp 155–199
80
Bennett, A. F., 1991. The evolution of activity capacity. Journal of Experimental
Biology, 160:1-23.
Bennett, A. F. & Licht, P. 1973. Relative contributions of anaerobic and aerobic
energy production during activity in Amphibia. Journal of Comparative Physiology,
81:277-288.
Birch, C. P. D., 1999. A New Generalized Logistic Sigmoid Growth Equation
Compared with the Richards Growth Equation. Annals of Botany, 83:713-723.
Bogert, C. M., 1959. How reptiles regulate their body temperature. Scientific American
200: 105-120
Bradshaw, W. E., and Holzapfel C. M., 2008. Genetic response to rapid climate
change: It’s seasonal timing that matters. Molecular ecology 17.1: 157-166.
Case, M., 2006. Climate change impacts in the Amazon: review of scientific literature
(World Wildlife Fund – WWF). 8th Conference of the Parties to the Convention on
Biological Diversity. 20-31 March, Curitiba, Brazil.
Dixon, J.R. & Soini, P., 1975. The reptiles of the upper Amazon Basin, Iquitos region,
Peru. Part 1. Lizards and Amphisbaenians. Milwaukee Public Museum. Contributions on
Biology and Geology, 4:1-58.
Dixon, J.R. & Soini, P., 1986. The reptiles of the upper Amazon Basin, Iquitos region,
Peru: vii + 154. Milwaukee Public Museum.
Elith, J., Graham, C. H., Anderson, R. P., Dudík, M., Ferrier, S., Guisan, A.,
Hijmans, R. J., Huettmann, F., Leathwick, J. R., Lehmann, A., Li, J., Lohmann, L.,
Loiselle, B. A., Manion, G., Moritz, C., Nakamura, M., Nakazawa, Y., Overton, Mc.C.,
Townsend Peterson, A., Philips, S. J., Richardson, K., Scachetti-Pereira, R., Schapire,
R. E., Soberón, J., Williams, S., Wisz, M. S. & Zimmermann, N. E. 2006. Novel methods
improve prediction of species’ distributions from occurrence data. Ecography, 29:129-151.
Elphick, M. J., & Shine, R., 1998. Long term effects of incubation temperatures on the
morphology and locomotor performance of hatchling lizards (Bassiana duperreyi,
Scincidae). Biological Journal of the Linnean Society. 63: 429–447.
Eva, H. D., Huber, O., Achard, F., Balslev, H., Beck, S., Behling, H., ... &
Duivenvoorden, J. F., 2005. A proposal for defining the geographical boundaries of
Amazonia. Office for Official Publications of the European Communities, pp 1-52.
81
Fielding, A. H., & Bell, J. F., 1997. A review of methods for the assessment of
prediction errors in conservation presence/absence models. Environmental Conservaton,
24(1): 38-49.
Fitch, H. S. 1968. Temperature and behavior of some equatorial lizards. Herpetologica
24: 35-38.
Friedman J, Hastie T, Tibshirani R., 2000. Additive logistic regression: a statistical
view of boosting. The Annals of Statistics 28, 337–407.
Giannini, T. C., Siqueira, M. F., Acosta, A. L., Barreto, F. C., Saraiva, A. M., Alves-
dos-Santos, I., 2012. Current challenges of species distribution predictive modelling.
Rodriguésia, 63(3):733-749.
Goeldi, E. A., 1902. Lagartos do Brazil. Boletim do Museu Paraense, 3:499-560.
Heath, J., 1965. Temperature regulation and diurnal activity in horned lizards.
University of California. Press, 64: 97-136
Hijmans, R. J., Cameron, S. E., Parra, J. L., Jones, P. G. & Jarvis, A., 2005. Very
high resolution interpolated climates surfaces for global and land areas. International
Journal of Climatology, 25:1965-1978.
Hof, C., Araujo, M.B., Jetz, W., Rahbek, C., 2011. Additive threats from pathogens,
climate and land-use change for global amphibian diversity. Nature 480, 516–519.
(doi:10.1038/nature10650)
Hoffmann, A. A, & Sgrò, C. M., 2011. Climate change and evolutionary adaptation.
Nature, 470: 479–485.
Huey, R. B., 1982. Temperature, physiology, and the ecology of reptiles. in C. Gans
and F. H. Pough, eds. Biology of the Reptilia. Vol. 12, Pp 25–91. Physiology ©. Academic
Press, London.
Huey, R. B., & Stevenson, R. D., 1979. Integrating thermal physiology and ecology of
ectotherms: A discussion of approaches. American Zoologist, 19, 357–366.
Huey, R. B., Bennett, A. F., John-Alder, H. & Kenneth, A. N., 1984. Locomotor
capacity and foraging behaviour of Kalahari lacertid lizards. Animal Behavior, 32:41-50.
Huey, R. B., Deutsch, C. A, Tewksbury, J. J., Vitt, L. J., Hertz, P. E., Alvarez Pérez,
H. J., & Garland, T., 2009. Why tropical forest lizards are vulnerable to climate warming.
Proceedings. Biological Sciences / The Royal Society, 2761664, 1939–1948.
82
Hutchinson, G.E. 1957. Concluding remarks. Cold Spring Harbor Symposium on
Quantitative Biology, 22, 415–457.
IPCC, 2014. Climate Change 2014: Synthesis Report. Contribution of Working Groups
I, II and III to the Fifth Assessment Report of the Intergovernmental Panel on Climate
Change. Core Writing Team, R.K. Pachauri and L.A. Meyer (eds.). IPCC, Geneva,
Switzerland, 151 pp.
Janzen, D. H., 1967. Why mountain passes are higher in the tropics. Am. Nat. 101:233-
249.
Kearney, M. & Porter, W. P., 2004. Mapping the fundamental niche: physiology,
climate, and the distribution of a nocturnal lizard. Ecology 85.11: 3119-3131.
Kearney, M., Shine, R. & Porter, W. P. 2009. The potential for behavioral
thermoregulation to buffer “cold-blooded” animals agains climate warming. Proceedings of
National Academy of Sciences, 106(10): 3835-3840.
Kohlsdorf, T. & Navas, C. A., 2006. Ecological constraints on the evolutionary
association between field and preferred temperatures in Tropidurinae Lizards. Evolutionary
Ecology, 20.6: 549-564.
Kubisch, E. L., Corbalán, V., Ibargüengoytía, N. R. & Sinervo, B. 2016. Local
extinction risk of three species of lizard from Patagonia as a result of global warming.
Canadian Journal of Zoology, 94:49-59.
Li, X. & Wang, Y. 2013. Applying various algorithms for species distribution
modeling. Integrative Zoology, 8:124-135.
Lobo, J.M. & Tognelli, M.F. 2011. Exploring the effects of quantity and location of
pseudo-absences and sampling biases on the performance of distribution models with limited
point occurrence data. Journal for Nature Conservation 19: 1-7
Logan, M. L., Huynh, R. K., Precious, R. A. & Calsbeek, R. 2013. The impact of
climate change measured at relevant spatial scales: new hope for tropical lizards. Global
Change Biology, pp 1- 10, doi: 10.1111/gcb.12253.
Logan, M. L., Cox, R. M. & Calsbeek, R. 2014. Natural selection on thermal
performance in a novel thermal environment. Proceedings of National Academy of Sciences,
111(39): 14165-14169.
Logan, M. L. Fernandez, S. G. & Calsbeek, R., 2015. Abiotic constraints on the
activity of tropical lizards. Functional Ecology, 29: 694-700.
83
Marengo, J. A. 2006. Mudanças climáticas globais e seus efeitos sobre a
biodiversidade: caracterização do clima atual e definição das alterações climáticas para o
território brasileiro ao longo do século XXI. Brasília: MMA, 1:209.
Mesquita, D. O. & Colli, G. R. 2003. Geographical variation in the ecology of
populations of some brazilian species of Cnemidophorus (Squamata, Teiidae). Copeia,
2003(2): 285-298.
Mesquita, D. O., Colli, G. R., Costa, G. C., Franca, F. G. R., Garda, A. A. and
Peres, A. K. 2006a. At the water’s edge: ecology of semiaquatic teiids in Brazilian
Amazon. Journal of Herpetology 40: 221-229.
Mesquita, D. O., Colli, G. R., Franca, F. G. R. and Vitt, L. J. 2006b. Ecology of a
cerrado lizard assemblage in the Jalapao region of Brazil. Copeia 2006: 460-471.
Nijssen, B., O'Donnell, G., M., Hamlet, A., F. & Lettenmaier, D. P., 2001. Hydrologic
sensitivity of global rivers to climate change. Climate Change 50(1-2):143–175.
Nunes, V. S., 1984. Ciclo de atividade e utilização do habitat por Gonatodes humeralis
(Sauria: Gekkonidae) em Manaus, Amazonas. Departamento de Zoologia, Universidade
Federal do Paraná, 1984.
Paranjpe, D. A., Bastians, E., Patten, A., Cooper, R. D., & Sinervo, B., 2013.
Evidence of maternal effects on temperature preference in side-blotched lizards:
Implications for evolutionary response to climate change. Ecology and Evolution, 37, 1977–
1991.
Pearson, R. G. & Dawson, T. P. 2003. Predicting the impacts of climate change on the
distribution of species: are bioclimate envelope models useful? Global Ecology &
Biogeography, 12:361-371.
Preston, K.L., Rotenberry, J.T., Redak, R.A., Allen, M.F., 2008. Habitat shifts of
endangered species under altered climate conditions: the importance of biotic interactions.
Global Change Biology 14, 1–15
Richards, F. J., 1959. A flexible growth function for empirical use. Journal of
Experimental Botany, 10(39): 290-300
Salazar, L. F., Nobre, C. A. & Oyama, M. D. 2007. Climate change consequences on
the biome distribution in tropical South America. Geophysical Research Letters, 34:
L09708, doi:10.1029/2007GL029695
84
Sampaio, G., Nobre, C. A., Costa, M. H., Satyamurty, P., Soares-Filho, B. S. &
Cardoso, M., 2007. Regional climate change over eastern Amazonia caused by pasture and
soybean cropland expansion. Geophysical Research Letters, 34: L17709,
doi:10.1029/2007GL030612.
Sartorius, S. S., Vitt, L. J. & Colli, G. 1999. Use of naturally and antropogenically
disturbed habitats in Amazonian rainforest by the teiid lizard Ameiva ameiva. Biological
conservation, 90:91-101.
Seebacher, F. & Franklin, C. E., 2005. Physiological mechanisms of thermoregulation
in reptiles: a review. J. Comp. Physiol. B. 175:533-541.
Sinervo, B., Méndez-de-la-Cruz, F., Miles, D. B., Heulin, B., Bastiaans, E.,
Villagrán-Santa Cruz, M., Lara, R., Martinéz-Méndez, N., Calderón-Espinosa, Meza-
Lázaro, R. N., Gadsden, H., Avila, L. J., Morando, M., De la Riva, I. J., Sepulveda, P.,
Rocha, C. F., Ibargüengoytía, N., Puntriano, C. A., Massot, M., Lepetz, V., Oksanen,
T. A., Chapple, D., Bauer, A., Branch, W., Clobert, J & Sites, J. W., 2010. Erosion of
lizard diversity by climate change and altered thermal niches. Science (New York, N.Y.).
Stevenson, R. D., Peterson, C. R. & Tsuji. J. S., 1985. The thermal dependence of
locomotion, tongue flicking, digestion and oxygen consumption in the wandering garter
snake. Physiol. Zool. 58: 46-57.
Tewksbury, J. J., Huey, R. B., & Deutsch, C. A., 2008. Ecology. Putting the heat on
tropical animals. Science (New York, N.Y.), 320(5881), 1296–1297.
Thuiller, W., Georges, D., Engler, R., Breiner, F., Georges, M. D., & Thuiller, C.
W., 2016. Package ‘biomod2’. Available at: http://CRAN. R-project. org/package=
biomod2 (accessed December 2016).
Vitt, L. J., 1991. An introduction to the ecology of Cerrado lizards. Journal of
Herpetology, 25: 79-90.
Vitt, L. J. & Avila-Pires, T. C. S. 1998. Ecology of two sympatric species of
Neusticurus (Sauria: Gymnophthalmidae) in the western Amazon of Brazil. Copeia 1998:
570-582.
Vitt, L. J. & Carvalho, C. M. 1995. Niche Partitioning in a Tropical Wet Season:
Lizards in the Lavrado Area of Northern Brazil. Copeia (2):305-329.
Vitt, L. J. & Zani, P. A. 1996a. Organization of a taxonomically diverse lizard
assemblage in Amazonian Ecuador. Canadian Journal of Zoology 74: 1313-1335.
85
Vitt, L. J. & Zani, P. A., 1996b. Elusive tropical lizard Tropidurus (=Uracentron)
flaviceps in lowland rain forest of Ecuador. Herpetologica, 52(1):121-132.
Vitt, L. J., Avila-Pires, T. C., Caldwell, J. P. & Oliveira, V. R. L., 1998. The Impact
of Individual Tree Harvesting on Thermal Environments of Lizards in Amazonian Rain
Forest. Conservation Biology, 12:654-664.
Vitt, L. J., Avila-Pires, T. C., Zani, P. A. and Esposito, M. C. 2002. Life in shade:
the ecology of Anolis trachyderma (Squamata: Polychrotidae) in Amazonian Ecuador and
Brazil, with comparisons to ecologically similar Anoles. Copeia 2002(2): 275-286
Vitt, L. J., Avila-Pires, T. C. S., Esposito, M. C., Sartorius, S. S. and Zani, P. A.
2003a. Sharing Amazonian Rain-Forest Trees: Ecology of Anolis punctatus and Anolis
transversalis (Squamata: Polychrotidae). Journal of Herpetology, 37: 276-285.
Vitt, L. J., Avila-Pires, T. C. S., Zani, P. A., Sartorius, S. S. and Esposito, M. C.
2003b. Life above ground: ecology of Anolis fuscoauratus in the Amazon rain forest, and
comparisons with its nearest relatives. Canadian Journal of Zoology 81: 142-156.
Vitt, L. J., Avila-Pires, T. C. S., Zani, P. A., Esposito, M. C. & Sartorius, S. S. 2003c.
Life at the interface: ecology of Prionodactylus oshaughnessyi in the western Amazon and
comparisons with P. argulus and P. eigenmanni. Canadian Journal of Zoology 81:302-312.
Vitt, L. J., Avila-Pires, T. C. S., Esposito, M. C., Sartorius, S. S. & Zani, P. 2007.
Ecology of Alopoglossus angulatus and A. atriventris (Squamata: Gymnophthalmidae)
in western Amazonia. Phyllomedusa 6(1): 11-21.
Vitt, L. J., Sartorius, S. S., Avila-Pires, T. C. S. & Esposito, M. C., 2001a. Life at
the river’s edge: ecology of Kentropyx altamazonica in Brazilian Amazonia. Canadian
Journal of Zoology 79: 1855-1865.
Vitt, L. J., Sartorius, S. S., Avila-Pires, T. C. S. & Esposito, M. C., 2001b. Life on
the Leaf Litter: The ecology of Anolis nitens tandai in the Brazilian Amazon Copeia, 2001(2)
401-412
Vitt, L. J., Sartorius, S. S., Avila-Pires, T. C., Zani, P. A., Esposito, M. C. 2005.
Small in a Big World: Ecology of Leaf-Litter Geckos in New World Tropical Forests.
Herpetological Monographs, 19: 137-152.
Vitt, L. J., Shepard, D. B., Vieira, G. H. C. Caldwell, J. P., Colli, G. R. and
Mesquita, D. O., 2008. Ecology of Anolis nitens brasiliensis in Cerrado Woodlands of
Cantao. Copeia 2008: 144-153.
86
Vitt, L. J., Souza, R. A., Sartorius, S. S. Avila-Pires, T. C. & Espósito, M. C. 2000.
Comparative ecology of sympatric Gonatodes (Squamata: Gekkonidae) in the western
Amazon of Brazil. Copeia 2000(1):83-95
Vitt, L. J., Zani, P. A. & Avila-Pires, T. C. S., 1997. Ecology of the arboreal tropidurid
lizard Tropidurus (=Plica) umbra in the Amazon region. Canadian Journal of Zoology,
75:1876-1882.
87
Legend of figures.
Fig. 1. Species with predicted increase of occurrence area by 2050 and 2070, considering the
current occurrence area.
Fig. 2. Contour plots of predicted geographic expansion by 2050 and 2070, considering the
current occurrence area. A) Cnemidophorus lemniscatus B) Norops auratus and C)
Tropidurus hispidus. Favorable regions are toward the blue color, unfavorable regions
toward the red color in the scale.
Fig. 3. Species with predicted area lost by 2050 and 2070, considering the current occurrence
area.
Fig. 4. Contour plots of reductions of occurrence area for some species that present high Tb
and low Hr. A) Crocodilurus amazonicus and B) Uracentron flaviceps, both heliotherms; C)
Gonatodes hasemani, thermoconformer. Favorable regions are toward the blue color,
unfavorable regions toward the red color in the scale.
Fig. 5. Contour plots of A) Leposoma osvaldoi and B) Plica umbra. Favorable regions are
toward the blue color, unfavorable regions toward the red color in the scale.
Fig. 6. Contour plots of A) Leposoma percarinatum and B) Alopoglossus angulatus.
Favorable regions are toward the blue color, unfavorable regions toward the red color in the
scale.

88
Fig. 1.
12
5.7
94
.8
38
.2
66
.1
11
5.0
8.7
-10
10
30
50
70
90
110
130
150
Cnemidophoruslemniscatus
Norops auratus Tropidurus hispidus
% G
ain
Species
2050
2070
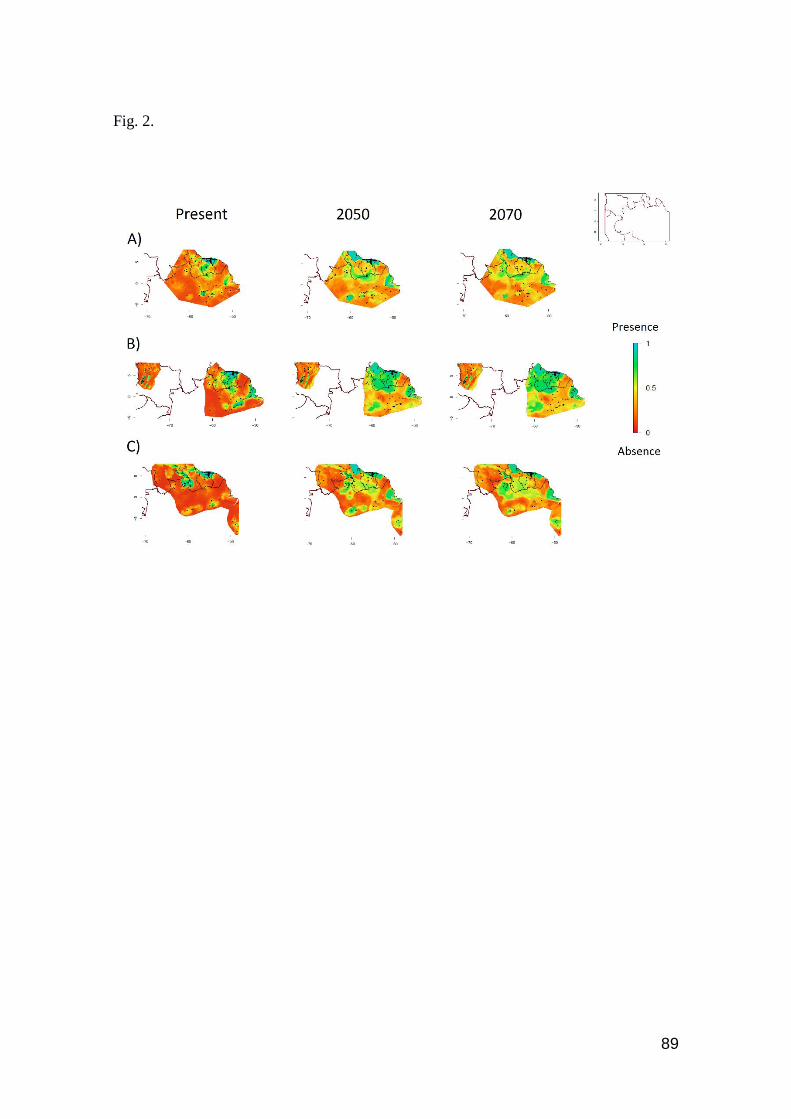
89
Fig. 2.
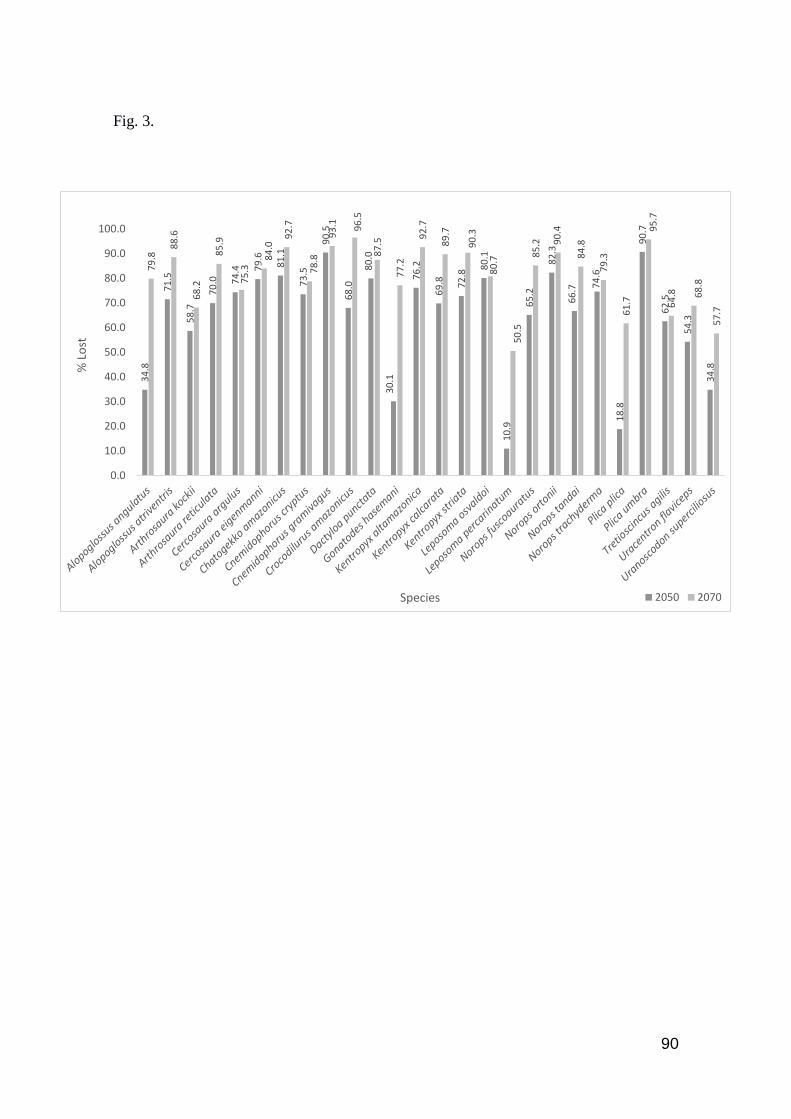
90
Fig. 3.
34
.8
71
.5
58
.7
70
.0 74
.4 79
.6
81
.1
73
.5
90
.5
68
.0
80
.0
30
.1
76
.2
69
.8 72
.8
80
.1
10
.9
65
.2
82
.3
66
.7 74
.6
18
.8
90
.7
62
.5
54
.3
34
.8
79
.8
88
.6
68
.2
85
.9
75
.3
84
.0
92
.7
78
.8
93
.1 96
.5
87
.5
77
.2
92
.7
89
.7
90
.3
80
.7
50
.5
85
.2 90
.4
84
.8
79
.3
61
.7
95
.7
64
.8 68
.8
57
.7
0.0
10.0
20.0
30.0
40.0
50.0
60.0
70.0
80.0
90.0
100.0
% L
ost
Species 2050 2070
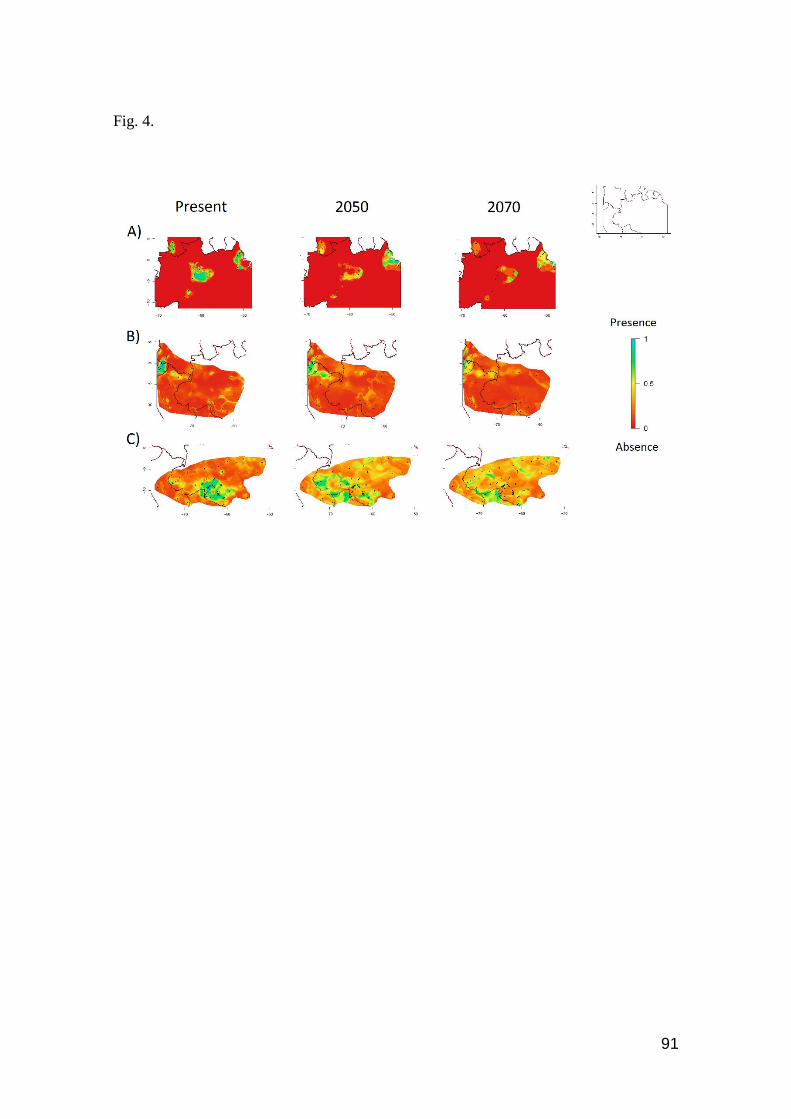
91
Fig. 4.
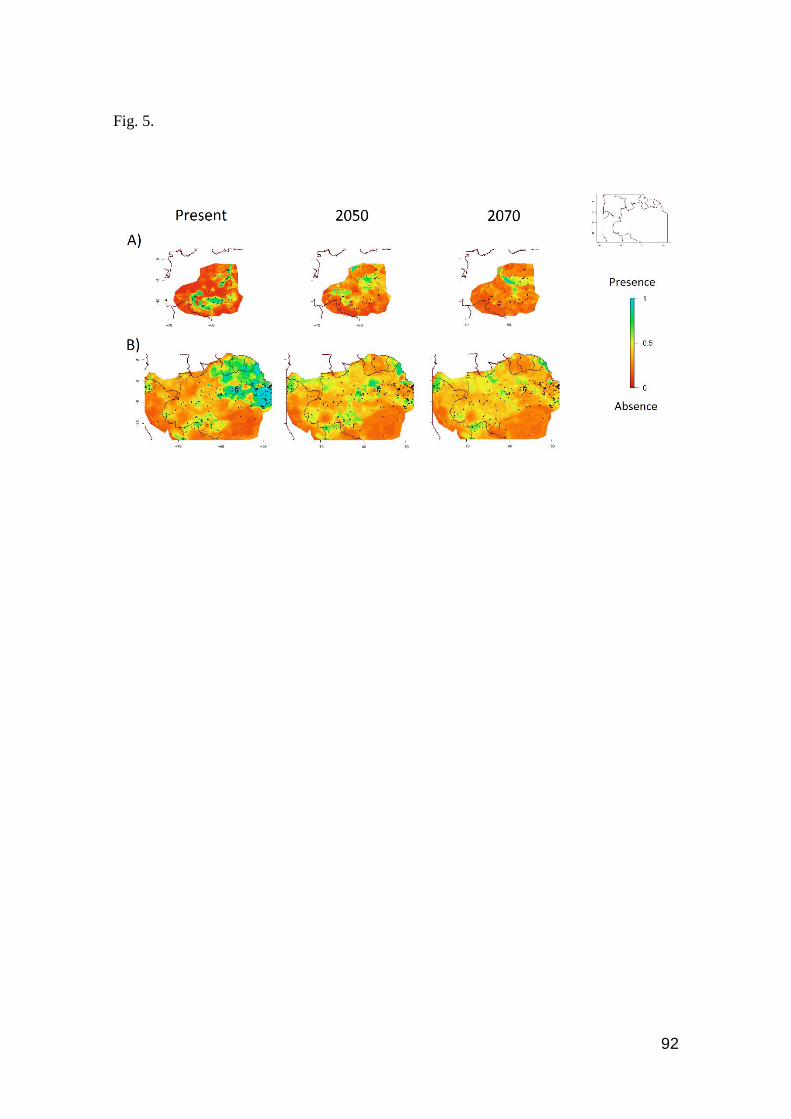
92
Fig. 5.
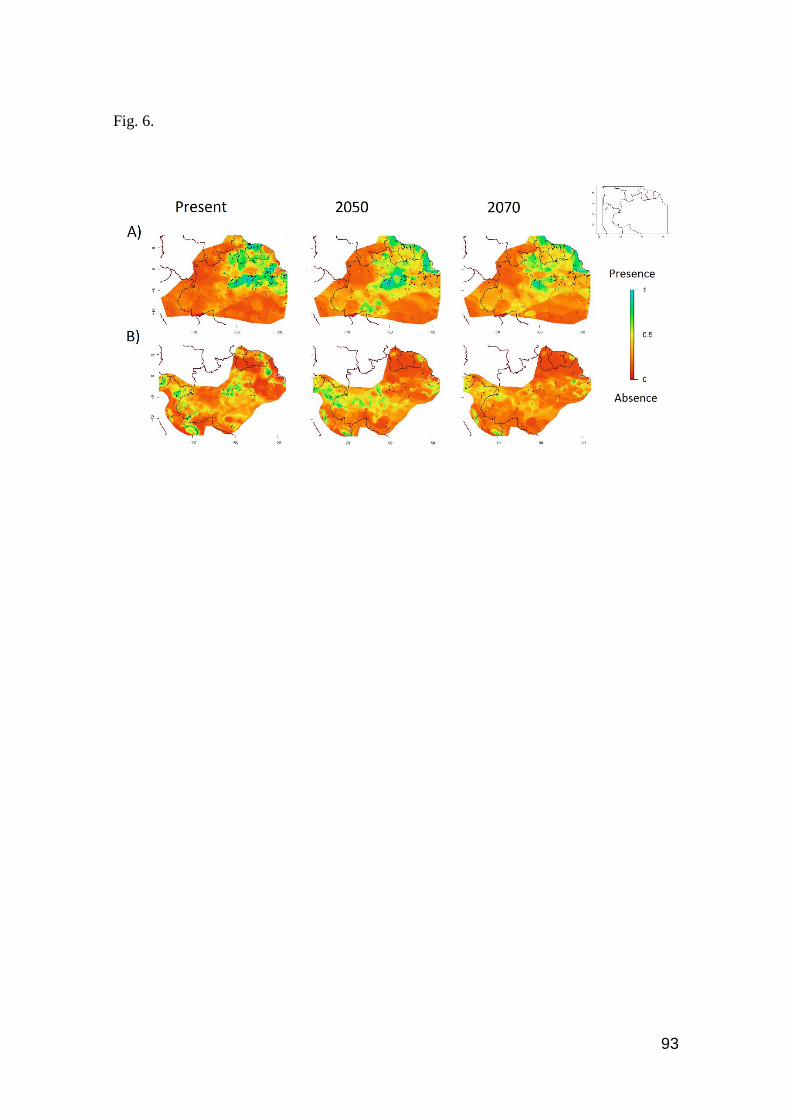
93
Fig. 6.
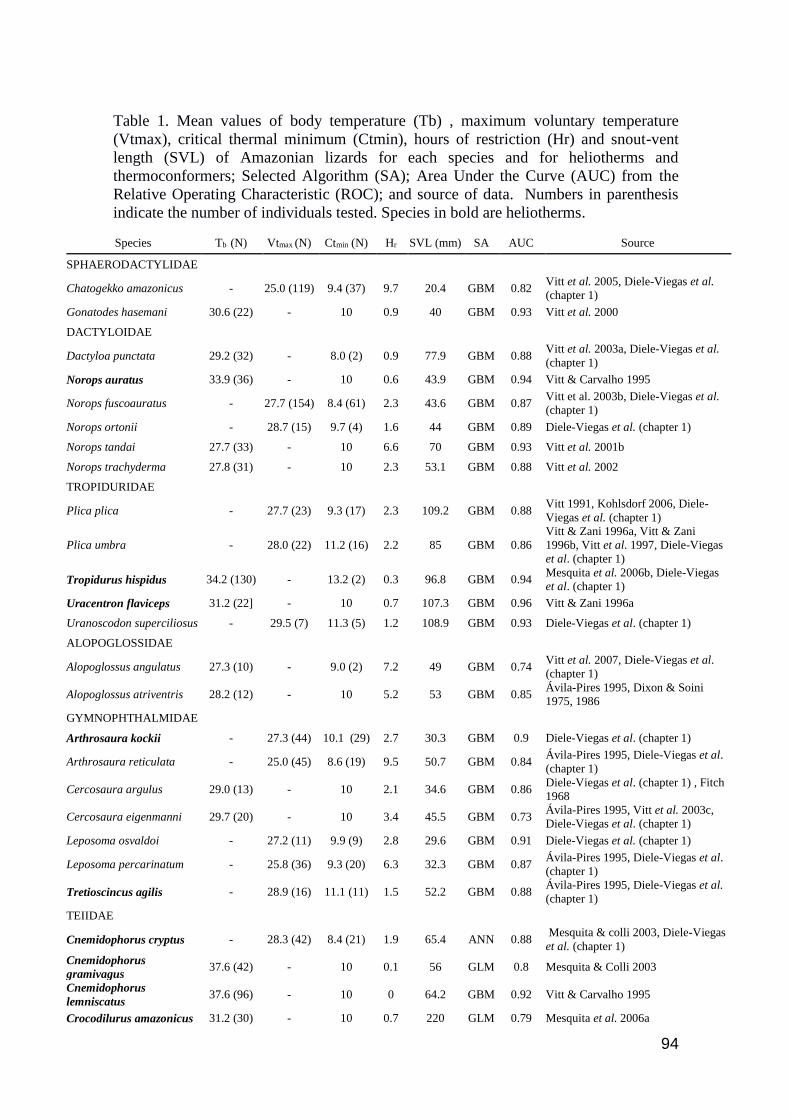
94
Table 1. Mean values of body temperature (Tb) , maximum voluntary temperature
(Vtmax), critical thermal minimum (Ctmin), hours of restriction (Hr) and snout-vent
length (SVL) of Amazonian lizards for each species and for heliotherms and
thermoconformers; Selected Algorithm (SA); Area Under the Curve (AUC) from the
Relative Operating Characteristic (ROC); and source of data. Numbers in parenthesis
indicate the number of individuals tested. Species in bold are heliotherms.
Species Tb (N) Vtmax (N) Ctmin (N) Hr SVL (mm) SA AUC Source
SPHAERODACTYLIDAE
Chatogekko amazonicus - 25.0 (119) 9.4 (37) 9.7 20.4 GBM 0.82 Vitt et al. 2005, Diele-Viegas et al.
(chapter 1)
Gonatodes hasemani 30.6 (22) - 10 0.9 40 GBM 0.93 Vitt et al. 2000
DACTYLOIDAE
Dactyloa punctata 29.2 (32) - 8.0 (2) 0.9 77.9 GBM 0.88 Vitt et al. 2003a, Diele-Viegas et al.
(chapter 1)
Norops auratus 33.9 (36) - 10 0.6 43.9 GBM 0.94 Vitt & Carvalho 1995
Norops fuscoauratus - 27.7 (154) 8.4 (61) 2.3 43.6 GBM 0.87 Vitt et al. 2003b, Diele-Viegas et al.
(chapter 1)
Norops ortonii - 28.7 (15) 9.7 (4) 1.6 44 GBM 0.89 Diele-Viegas et al. (chapter 1)
Norops tandai 27.7 (33) - 10 6.6 70 GBM 0.93 Vitt et al. 2001b
Norops trachyderma 27.8 (31) - 10 2.3 53.1 GBM 0.88 Vitt et al. 2002
TROPIDURIDAE
Plica plica - 27.7 (23) 9.3 (17) 2.3 109.2 GBM 0.88 Vitt 1991, Kohlsdorf 2006, Diele-
Viegas et al. (chapter 1)
Plica umbra - 28.0 (22) 11.2 (16) 2.2 85 GBM 0.86
Vitt & Zani 1996a, Vitt & Zani
1996b, Vitt et al. 1997, Diele-Viegas
et al. (chapter 1)
Tropidurus hispidus 34.2 (130) - 13.2 (2) 0.3 96.8 GBM 0.94 Mesquita et al. 2006b, Diele-Viegas
et al. (chapter 1)
Uracentron flaviceps 31.2 (22] - 10 0.7 107.3 GBM 0.96 Vitt & Zani 1996a
Uranoscodon superciliosus - 29.5 (7) 11.3 (5) 1.2 108.9 GBM 0.93 Diele-Viegas et al. (chapter 1)
ALOPOGLOSSIDAE
Alopoglossus angulatus 27.3 (10) - 9.0 (2) 7.2 49 GBM 0.74 Vitt et al. 2007, Diele-Viegas et al.
(chapter 1)
Alopoglossus atriventris 28.2 (12) - 10 5.2 53 GBM 0.85 Ávila-Pires 1995, Dixon & Soini
1975, 1986
GYMNOPHTHALMIDAE
Arthrosaura kockii - 27.3 (44) 10.1 (29) 2.7 30.3 GBM 0.9 Diele-Viegas et al. (chapter 1)
Arthrosaura reticulata - 25.0 (45) 8.6 (19) 9.5 50.7 GBM 0.84 Ávila-Pires 1995, Diele-Viegas et al.
(chapter 1)
Cercosaura argulus 29.0 (13) - 10 2.1 34.6 GBM 0.86 Diele-Viegas et al. (chapter 1) , Fitch
1968
Cercosaura eigenmanni 29.7 (20) - 10 3.4 45.5 GBM 0.73 Ávila-Pires 1995, Vitt et al. 2003c,
Diele-Viegas et al. (chapter 1)
Leposoma osvaldoi - 27.2 (11) 9.9 (9) 2.8 29.6 GBM 0.91 Diele-Viegas et al. (chapter 1)
Leposoma percarinatum - 25.8 (36) 9.3 (20) 6.3 32.3 GBM 0.87 Ávila-Pires 1995, Diele-Viegas et al.
(chapter 1)
Tretioscincus agilis - 28.9 (16) 11.1 (11) 1.5 52.2 GBM 0.88 Ávila-Pires 1995, Diele-Viegas et al.
(chapter 1)
TEIIDAE
Cnemidophorus cryptus - 28.3 (42) 8.4 (21) 1.9 65.4 ANN 0.88 Mesquita & colli 2003, Diele-Viegas
et al. (chapter 1)
Cnemidophorus
gramivagus 37.6 (42) - 10 0.1 56 GLM 0.8 Mesquita & Colli 2003
Cnemidophorus
lemniscatus 37.6 (96) - 10 0 64.2 GBM 0.92 Vitt & Carvalho 1995
Crocodilurus amazonicus 31.2 (30) - 10 0.7 220 GLM 0.79 Mesquita et al. 2006a
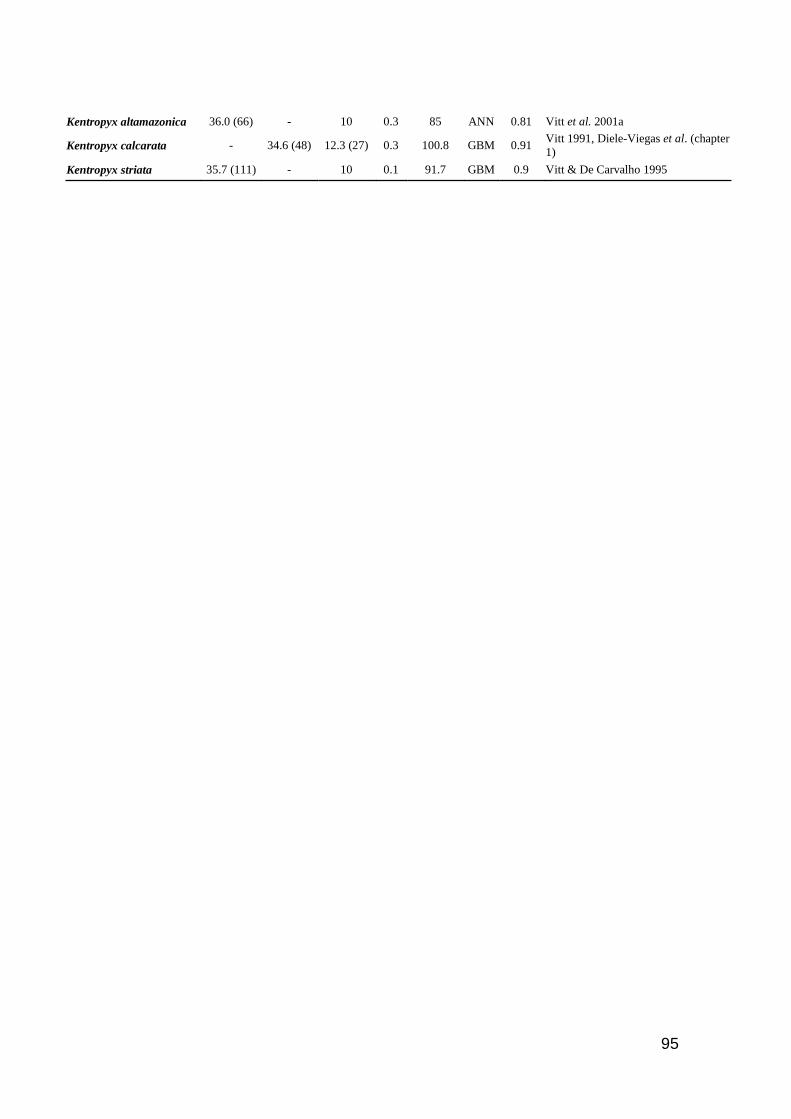
95
Kentropyx altamazonica 36.0 (66) - 10 0.3 85 ANN 0.81 Vitt et al. 2001a
Kentropyx calcarata - 34.6 (48) 12.3 (27) 0.3 100.8 GBM 0.91 Vitt 1991, Diele-Viegas et al. (chapter
1)
Kentropyx striata 35.7 (111) - 10 0.1 91.7 GBM 0.9 Vitt & De Carvalho 1995
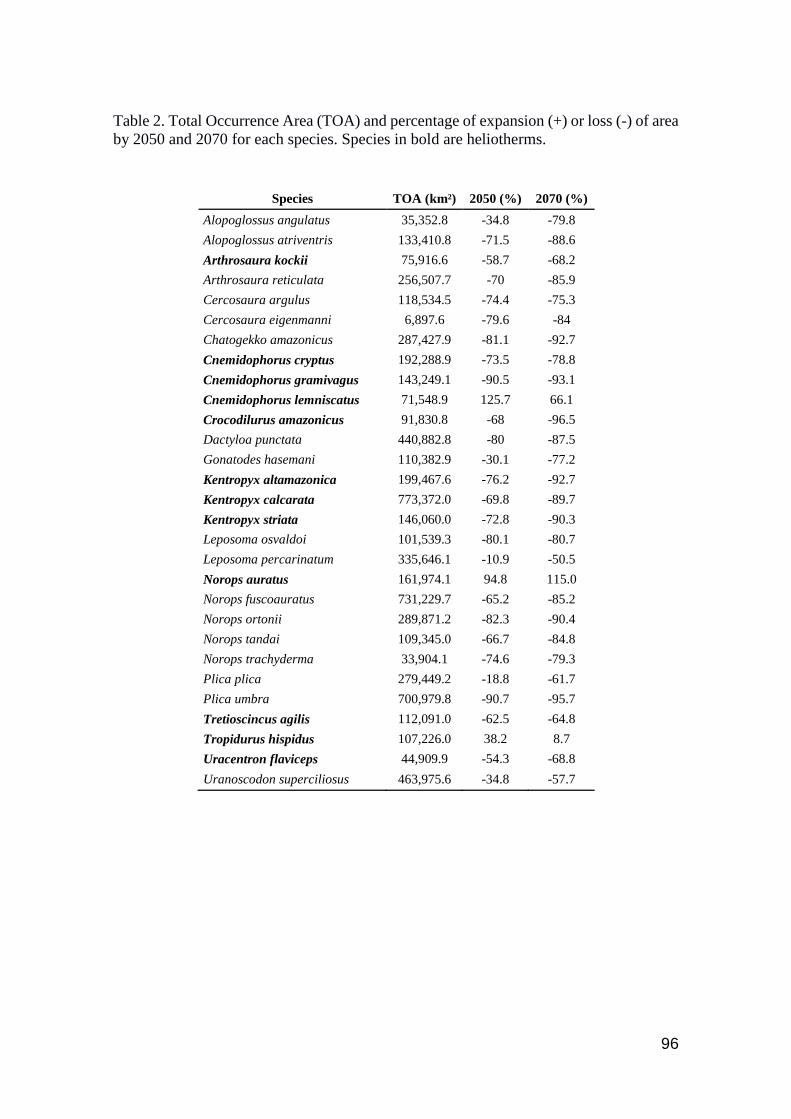
96
Table 2. Total Occurrence Area (TOA) and percentage of expansion (+) or loss (-) of area
by 2050 and 2070 for each species. Species in bold are heliotherms.
Species TOA (km²) 2050 (%) 2070 (%)
Alopoglossus angulatus 35,352.8 -34.8 -79.8
Alopoglossus atriventris 133,410.8 -71.5 -88.6
Arthrosaura kockii 75,916.6 -58.7 -68.2
Arthrosaura reticulata 256,507.7 -70 -85.9
Cercosaura argulus 118,534.5 -74.4 -75.3
Cercosaura eigenmanni 6,897.6 -79.6 -84
Chatogekko amazonicus 287,427.9 -81.1 -92.7
Cnemidophorus cryptus 192,288.9 -73.5 -78.8
Cnemidophorus gramivagus 143,249.1 -90.5 -93.1
Cnemidophorus lemniscatus 71,548.9 125.7 66.1
Crocodilurus amazonicus 91,830.8 -68 -96.5
Dactyloa punctata 440,882.8 -80 -87.5
Gonatodes hasemani 110,382.9 -30.1 -77.2
Kentropyx altamazonica 199,467.6 -76.2 -92.7
Kentropyx calcarata 773,372.0 -69.8 -89.7
Kentropyx striata 146,060.0 -72.8 -90.3
Leposoma osvaldoi 101,539.3 -80.1 -80.7
Leposoma percarinatum 335,646.1 -10.9 -50.5
Norops auratus 161,974.1 94.8 115.0
Norops fuscoauratus 731,229.7 -65.2 -85.2
Norops ortonii 289,871.2 -82.3 -90.4
Norops tandai 109,345.0 -66.7 -84.8
Norops trachyderma 33,904.1 -74.6 -79.3
Plica plica 279,449.2 -18.8 -61.7
Plica umbra 700,979.8 -90.7 -95.7
Tretioscincus agilis 112,091.0 -62.5 -64.8
Tropidurus hispidus 107,226.0 38.2 8.7
Uracentron flaviceps 44,909.9 -54.3 -68.8
Uranoscodon superciliosus 463,975.6 -34.8 -57.7
97
Supplementary Material
Fig. S1. Contour plots of levels of reduction of occurrence area for 26 Amazonian
species due to the global warming. Favorable regions are toward the blue color,
unfavorable regions toward the red color in the scale.
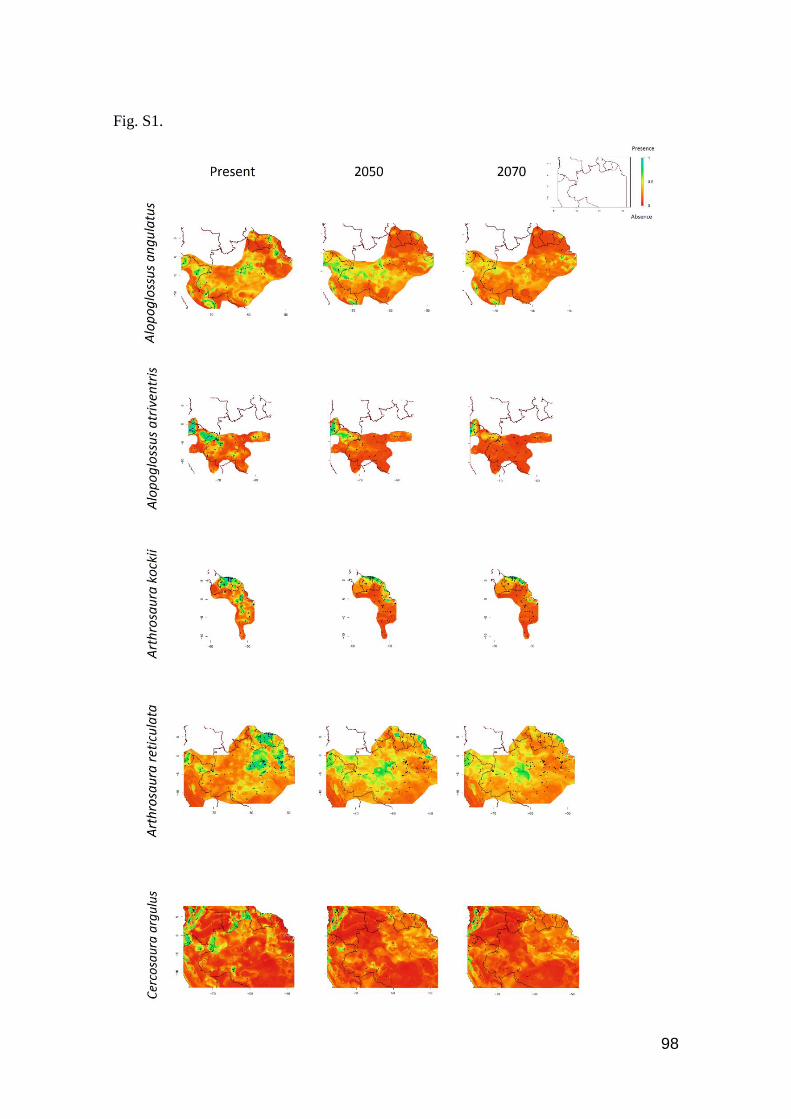
98
Fig. S1.
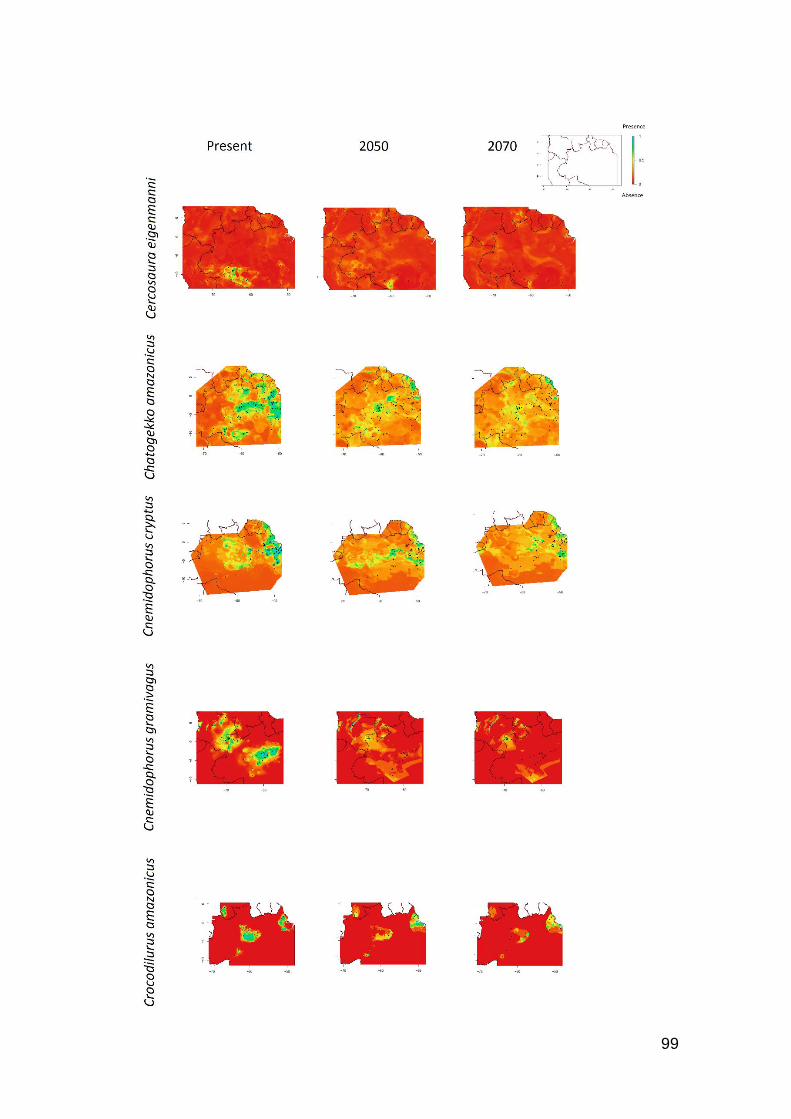
99
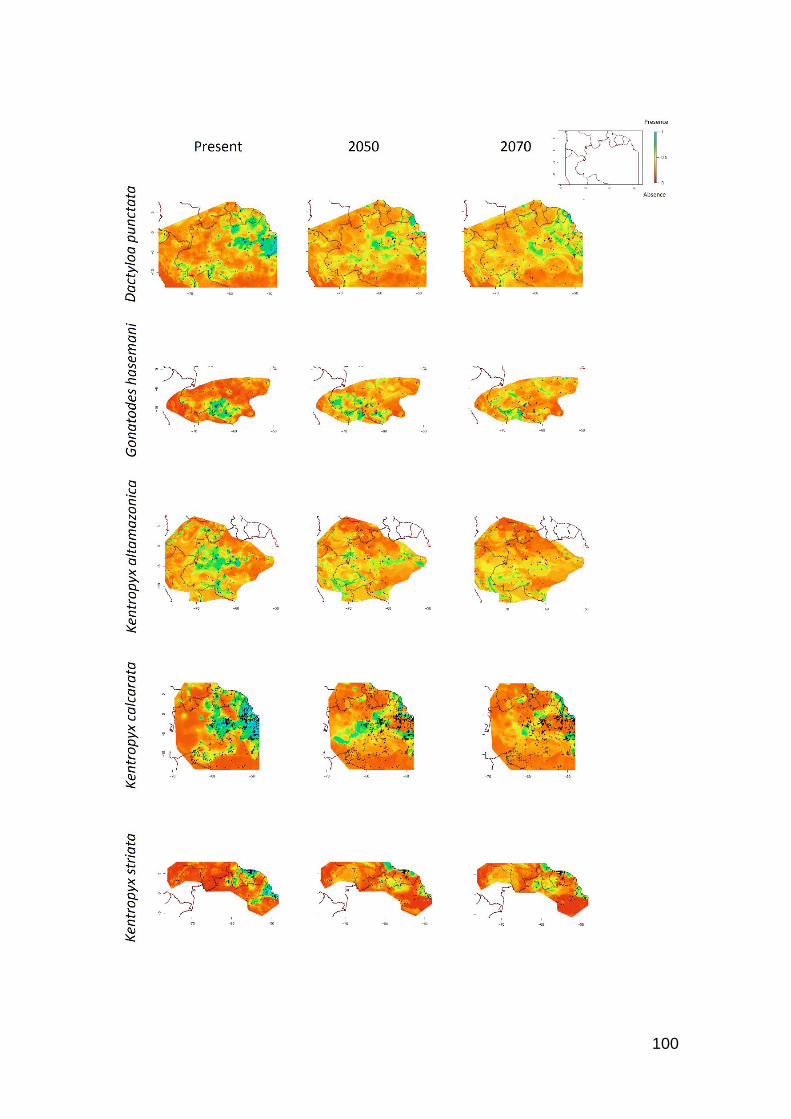
100
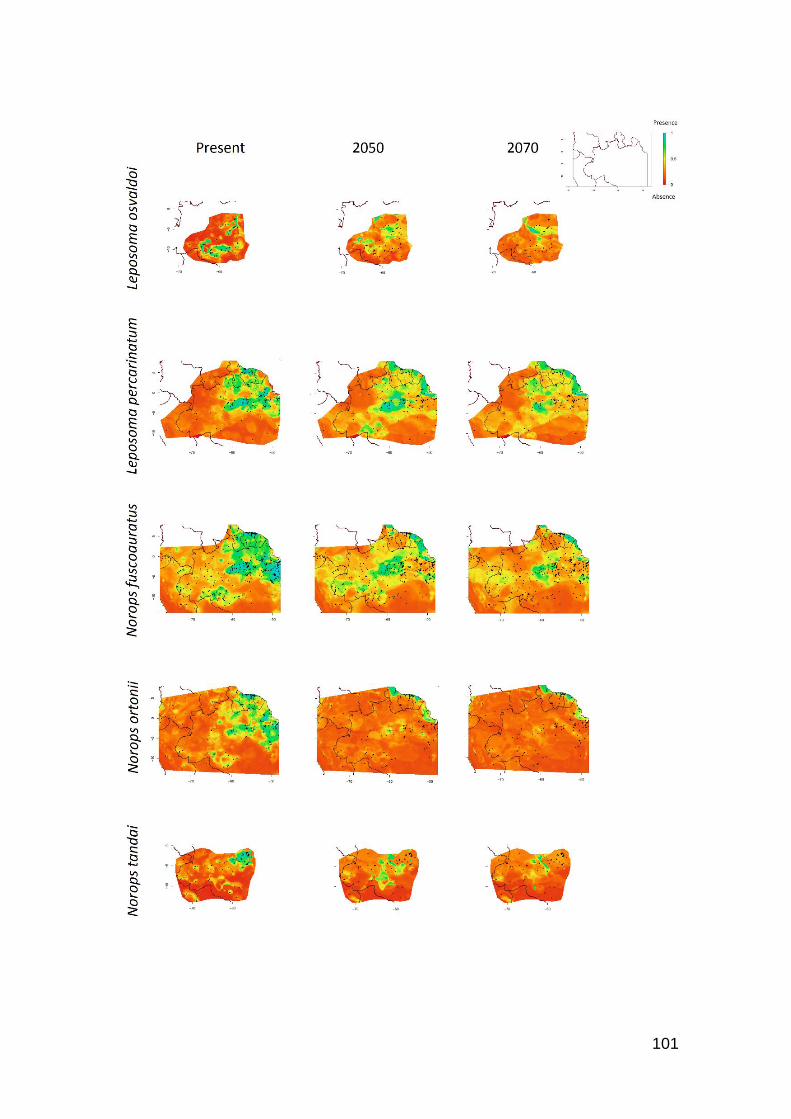
101
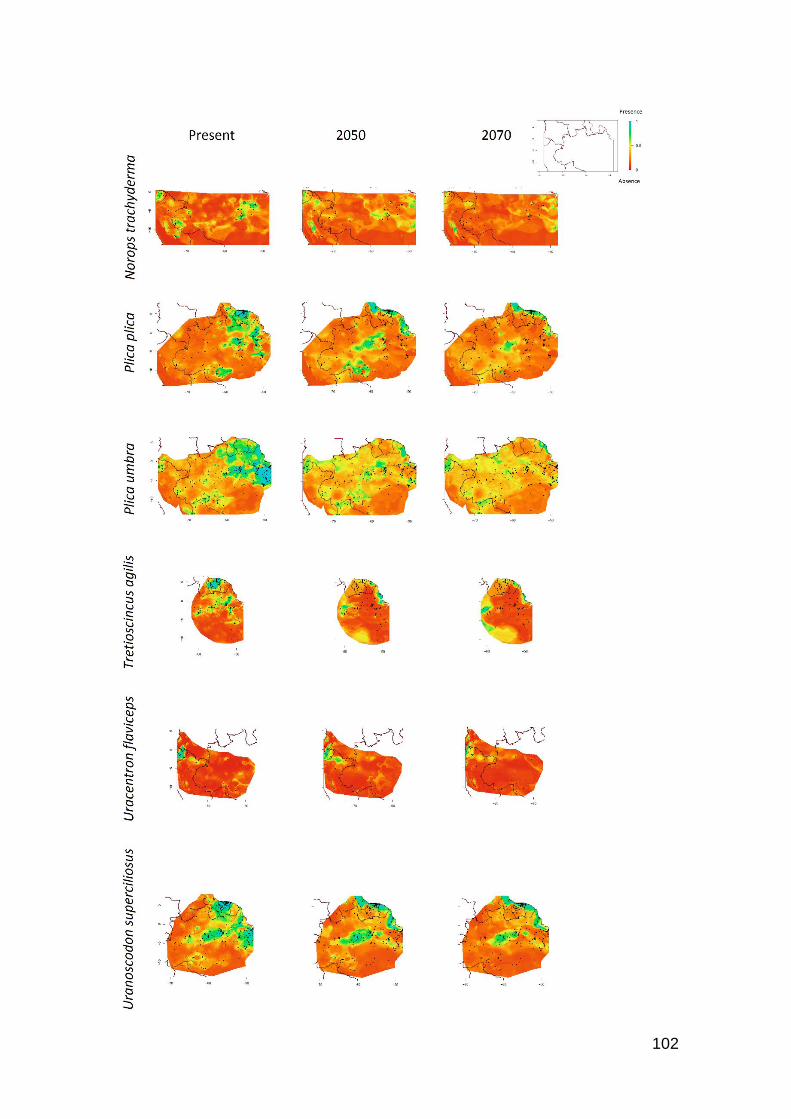
102