effect of a pharmaceutical care program on quality of life ... · pdf filevariables and...
TRANSCRIPT

*Correspondence: C. J. Correr. Departamento de Farmácia, Universidade Federal do Paraná, Campus Jardim Botânico, Av. Pref. Lothário Meissner, 632 - Jardim Botânico, 80210-170 – Curitiba – PR, Brasil. E-mail: [email protected]
ArticleBrazilian Journal of
Pharmaceutical Sciencesvol. 45, n. 4, oct./dec., 2009
Effect of a Pharmaceutical Care Program on quality of life and satisfaction with pharmacy services in patients with type 2
diabetes mellitus
Cassyano Januário Correr1*, Roberto Pontarolo1, Rodrigo Augusto de Paula e Souza1,2, Rafael Venson1, Ana Carolina Melchiors1, Astrid Wiens1
Pharmacy Practice Research Group from Universidade Federal do Paraná, 2 Pharmacy School from Universidade Positivo, Paraná
The aim is to evaluate the humanistic outcomes in type 2 diabetic patients by the adoption of pharmacotherapy follow-up in community pharmacies. Controlled, non-randomized, 12-months trial; n=161 patients distributed into control and intervention groups; 6 community pharmacies involved, all in the Curitiba city region, in the state of Paraná were used. The health-related quality of life (HRQoL) and the satisfaction index were determined using both the DQOL assessment tool, which measures HRQoL, and the satisfaction evaluation tool (QSSF). Interventions on 119 negative therapeutic outcomes were done (2.3/patient [SD=1.6]); the most commonly found problems were related to ineffectiveness of pharmacotherapy (68.1%). The Intervention-Group showed a significant improvement in HRQoL compared with the Control Group (0.08 vs -0.01, respectively; p=0.036). Satisfaction and impact domains presented the most significant improvement (0.13 vs 0.00 [p=0.030] and 0.07 vs -0.04 [p=0.033], respectively). After adjusting for baseline variables, the difference in improvement scores between groups on the QSSF was attributed to the allocation of patients in the intervention group. Pharmacotherapy follow-up of type 2 diabetic patients in community pharmacies can improve the HRQoL and satisfaction of patients.
Uniterms: Diabetes mellitus/type 2/pharmaceutical care. Pharmaceutical care. Community pharmacy. Pharmacists/community action.
O objetivo foi avaliar os resultados humanísticos de pacientes com diabetes tipo 2, por meio da adoção de acompanhamento farmacoterapêutico nas farmácias comunitárias. Utilizaram-se: ensaio controlado, não-randomizado, de 12 meses; n=161 pacientes, distribuídos entre Grupo Controle e de Intervenção, e 6 farmácias comunitárias, todas na região da cidade de Curitiba, Estado do Paraná. A qualidade de vida relacionada à saúde (HRQoL) e o índice de satisfação foram determinados utilizando a ferramenta de avaliação DQOL, que mede a HRQoL, e a ferramenta de avaliação da satisfação (QSSF). Intervenções em 119 resultados terapêuticos foram efetuadas (2,3/paciente [SD=1,6]. Os problemas mais comumente encontrados foram aqueles relacionados à ineficácia da farmacoterapia (68,1%). O Grupo de Intervenção mostrou melhoria significativa da HRQoL em comparação ao Grupo Controle (0,08 versus 0,00 [p=0,030 e 0,07 versus -0,04 [p=0,033], respectivamente). Após o ajuste da linha base das variáveis, a diferença na contagem de melhoramento entre os grupos no QSSF foi atribuída à alocação de pacientes no Grupo de Intervenção. O acompanhamento farmacoterapêutico em pacientes de diabetes tipo 2 em farmácias comunitárias pode melhorar a HRQoL e a satisfação dos pacientes.
Unitermos: Diabetes melito/tipo 2/atenção farmacêutica. Atenção farmacêutica. Farmácia comunitária. Farmacêuticos/ação comunitária.
INTRODUCTION
Pharmaceutical care is a professional practice
recommended by the WHO and other national and inter-national entities (De Castro et al., 2006). It contributes to the resolution of medical conditions and can help avoid undesirable outcomes in relation to patients’ drug therapy problems (DTP) (Hepler and Strand, 1990; Organización Mundial De La Salud, 1993), resulting in benefits to pa-

C. J. Correr, R. Pontarolo, R. A. P. Souza, R. Venson, A. C. Melchiors, A. Wiens810
tients and to society. Humanistic outcomes, also known as patients’ reported outcomes, involve the effect of tre-atment and pathology on the patient´s functional status, quality of life and satisfaction with the particulars of their care (Kozma,1993; McCaffrey, 2000). Evaluation of hu-manistic outcomes, often little valued by professionals, is important, along with clinical outcomes, especially in chronic diseases such as Diabetes Mellitus (DM) (DCCT Group, 1988).
Of the different types of diabetes, DM type 2 is the most prevalent worldwide, accounting for 90 to 95% of all cases of diabetes. Patients with this type of diabetes are usually overweight or obese, and tend to be diagnosed after 40 years of age (Sociedade Brasileira de Diabetes, 2007). By the year 2010, the worldwide prevalence of people with diabetes is set to rise to an estmated221 million people and by 2030, 300 million (Sociedade Brasileira de Diabetes, 2007; Zimmet et al., 2001).
Due to its high prevalence, chronic nature and the severity of its complications, this disease represents a high cost to society. This cost is not only economic, but also involves intangible aspects such as pain, anxiety and decreased quality of life of those afflicted (Sociedade Brasileira de Diabetes, 2005, 2007). The quality of life of diabetic patients is influenced by several factors, among which are the presence of complications and type of treat-ment used (Mata Cases et al., 2003; Redekop et al., 2002)
Another form of assessment of humanistic outco-mes and thus of the quality of interventions is the extent of patient satisfaction with the pharmaceutical care they receive. Satisfaction is a subjective parameter which re-flects the preferences and expectations of patients with the service provided, especially in technical and interpersonal aspects, thus allowing assessment of health professionals’ performance (Larson et al., 2002).
In this study, humanistic outcomes for patients with diabetes type 2 were evaluated from the perspective of provision of pharmaceutical care over 12 months.
PATIENTS AND METHODS
General study characteristics
A longitudinal, controlled, non-randomized study was conducted, comparing results of 161 subjects with type 2 DM distributed in two groups: one group received pharmacotherapeutic follow-up (PTF) in community phar-macies (intervention group), to a level above the normal standard of care, and the other received only standard care by the health team (control group).
The study was conducted between June 2004 and
March 2006 (21 months), and four community pharmacies located in Curitiba (PR) (2 pharmacies), Colombo (PR) (1 pharmacy) and Paranaguá (PR) (1 pharmacy) participated in the intervention group. All of these pharmacies had appropriate structure for the project, and their pharmacists received training in pharmacotherapeutic follow-up using the Dader Method (Machuca et al., 2003).
The control group was composed of patients with type 2 DM who did not receive Pharmacotherapeutic follow-up, were allocated to a Primary Care Unit (Nei-ghborhood Cajuru – Curitiba - PR) and a community pharmacy located in Campo Largo (neighboring Curitiba), in which the pharmacists did not apply PTF. The stan-dard service offered to control patients consisted of the following exams: laboratory blood examinations, blood pressure measurement (BP), body weight, and measure-ment of abdominal circumference (AC). The results were delivered to the patients and to their doctors who ordered the tests. In addition, pharmacists and technicians had dispensing medications in control pharmacies as is usual, and guidance on correct use of drugs.
Eligible patients were 30 years of age or older and were diagnosed with type 2 DM, with a prescription for hypoglycemic agents and/or insulin. Patients who were bedridden or unable to go to the pharmacy during the mo-nitoring period were considered ineligible for the study. In the control group, withdrawals were considered to be patients who did not undergo at least 2 parameter measure sessions (baseline and end of study). In the intervention group, patients who remained for more than 3 consecuti-ve months without pharmaceutical care during the study period were considered to be withdrawals from the study. These patients were excluded from the final evaluation.
Variables and measuring instruments
The humanistic outcomes considered were quality of life and satisfaction with the pharmacy services. Quality of life was measured by the evaluation instrument DQOL-Brazil, validated in Portuguese. The instrument consists of 44 multiple-choice questions organized into four domains: Satisfaction - 15 questions, Impact - 20 questions, Vocatio-nal / social preoccupations - 7 questions, diabetes related concerns - 4 issues (Correr et al., 2008th; DCCT Group, 1988). The instrument’s scale of measurement is Likert type, numbered from 1 to 5 according to the intensity of satisfaction (1 - very satisfied, 2 – quite satisfied, 3 – mo-derately satisfied, 4 - somewhat satisfied, 5 - unsatisfied); or frequency (1 - never, 2 - almost never, 3 - sometimes, 4 - often, 5 - always) (DCCT Group, 1988). The scale used in the original instrument was converted to a scale from

Effect of a Pharmaceutical Care Program on quality of life and satisfaction with pharmacy services 811
0.00 to 1.00, where 0.00 represents the worst perception of quality of life and 1.00 the best possible outcome for quality of life (Correr et al., 2008a).
The patients’ satisfaction data were obtained using the satisfaction with the pharmacy services questionnaire, also validated for the Portuguese language from the origi-nal instrument Pharmacy Services Questionnaire, develo-ped by Larson, Rovers et al. (Correr et al., 2008b; Larson et al., 2002). In addition to the original questionnaire in English, there is also a version translated into Portuguese from Portugal (Iglésias et al., 2005).
The questionnaire poses 20 direct questions, grou-ped into two domains: Friendly Explanation, with 11 items related to dispensing services and structural aspects of the dispensing pharmacy, and to Drug Therapy Management, with 9 items regarding services provided by the pharmacist related to the patient’s treatment. The patients answered each question on a Likert 5-point scale, which included the options: excellent, very good, good, moderate and poor (Correr et al., 2008b). The overall score for each patient was measured by the mean of 20 responses, where results closer to 5 indicate greater satisfaction.
Description of intervention
Each patient was monitored individually for a 12-month period. In the intervention group, the pharma-cist employed a Pharmacotherapeutic follow-up protocol, developed by Grupo de Investigación en Atención Far-macéutica, from the University of Granada (Spain). This protocol, called the Dáder method, has been in use since 1999, appearing in several published studies (Armando et al., 2005; Cubero-Caballero et al., 2006; Fontana Raspanti and Sola Uthurry, 2003; Martínez-Romero et al., 2001; Sil-va Castro et al., 2004). The process of patient monitoring applied by the participating pharmacists consisted of the following steps: 1) patient recruitment, 2) initial clinical interview, 3) situational analysis (detection of DTPs and their causes), 4) plan of pharmaceutical care and interven-tions and 5) evaluation of results.
Recruitment onto the study was done while dis-pensing hypoglycemic drugs and included those patients who sought out the pharmacist directly, in response to information obtained from posters announcing the study. For patients meeting the selection criteria and who agreed to participate, an initial interview was scheduled. Patients were instructed to bring along the medications they were currently taking, most recent prescriptions and laboratory exam results. After giving written informed consent, the initial step of data collection ensued, entailing patients being asked whether they would complete two additional
questionnaires (quality of life and satisfaction with phar-macy services).
The pharmacist collected information on socio-demographic profiles, current health problems and medi-cal history, medications in use (continuous and sporadic) and living habits. Pharmacological history was obtained, with specific emphasis on the patient’s use of drugs and adherence to therapy.
Based on the information from the initial inter-view, the pharmacist, organized the data for analysis in a form called Situational Status, to identify ongoing or potential DTPs. The situational analysis considered all the medications used by each patient (related to diabetes or otherwise), as well as other continuous, occasional and self administrated medication. The clinical and laboratory results required were: fasting glycemia (FG), glycated hemoglobin (HbA1), blood pressure (BP), abdominal circumference (AC), Body Mass Index (BMI) and exams or other information brought by the patient.
Following the situational analysis, the pharmacist devised a care plan for each patient based on their indi-vidual needs, information on how to use medications, referrals to medical or other services, advice on changes in lifestyle, guidance on food, education about the disease, and strategies for improving adherence to pharmacothera-py. This plan was discussed with each patient, aiming to establish a relationship of mutual collaboration.
Each pharmaceutical intervention was recorded on a standardized form, and during the subsequent return of the patients, its evolution/response was evaluated.
Ethical and statistical analysis
The null hypothesis of this study was that there was no difference between changes in quality of life indicators and satisfaction between the groups. All data collected for the two groups of patients were entered into the database and tested for normal distribution by the Kolmogorov-Smirnov test, before selection of the statistical tests. The mean and standard deviation (SD), 95% confidence interval (95% CI) were calculated. The mean and range intervals were used to describe results of HbA1, number of drugs in use, number of visits and time spent in con-sultations.
For comparison of means between groups, Student’s t test or the Mann-Whitney test was used (depending on the distribution), and for proportions, Chi-square test or Fisher’s exact test (depending on the number of occur-rences in the individual cells in each table). For analysis of correlations between data Pearson’s coefficient or Spearman’s was used. The ANOVA test was employed for

C. J. Correr, R. Pontarolo, R. A. P. Souza, R. Venson, A. C. Melchiors, A. Wiens812
comparison between three or more means. In the analyses comparing outcomes between intervention and control groups the differences (delta) between baselines and observed results at the study end-point were considered.
To correct any differences in baseline characteris-tics of groups of populations which could influence the outcomes, multivariate linear regression analyses were conducted. The results were adjusted for gender, age and time of diabetes diagnosis.
The organization of the database and statistical analysis was performed using the programs Microsoft Excel® 2003 and SPSS ® 12.0 for Windows. A probability of type I error of 5% was considered acceptable and a value of p <0.05 was considered significant.
This study was designed in accordance with the guidelines and regulatory standards for research invol-ving humans and was approved by the Research Ethics Committee of the University Hospital from Federal University of Paraná in August 2003. All patients were informed about the research objectives and those who met the criteria for selection and agreed to participate signed the written informed consent.
RESULTS
Patient profiles
A total of 161 patients were included in the study, 96 of whom completed the 12-month Pharmacothera-peutic follow-up. The demographic and clinical data of the groups are presented in Table I. The groups matched for most parameters, except the Charlson index of co-morbidity, access to health services and baseline values of HbA1 and BP.
Pharmaceutical service and interventions
In the intervention group, 574 patient visits to phar-macies were recorded (n = 50) during the study period. These meetings between pharmacist and patient totaled 174.5 hours of direct work, with an average of 4.2 hours per patient. There were 11.4 visits per patient (SD = 4.3), with an average time of 19.3 minutes for each service (SD = 6.6).
In the study group, 119 pharmaceutical interven-tions were documented during the study period, with an average of 2.3 interventions per patient (SD = 1.6, 0-9). For 4 patients (8%) the intervention was not performed but the majority (40%) received 2 pharmaceutical interven-tions during the follow-up. Considering only the diabetes treatment, 1.5 interventions per patient (SD = 1.1, 0-5)
occurred on average. This corresponded to 63.9% of total interventions. Considering the number of interventions per patient, the rate of interventions related to diabetes was 72.3%.
There were diverse interventions, although the main targets of the interventions were to improve the patient’s adherence to drug treatment (27.7%) and change in dose(s) of product(s) (17.6%). Pharmaceutical interventions were accepted in 76.5% of cases. For patients referred to the doctor, in 68% of cases the medical conduct was in-line with the suggestions made by pharmacists to the patient, written or verbally. The medical treatment remained un-changed in 11.8% of cases referred from the pharmacy.
Changes in quality of life
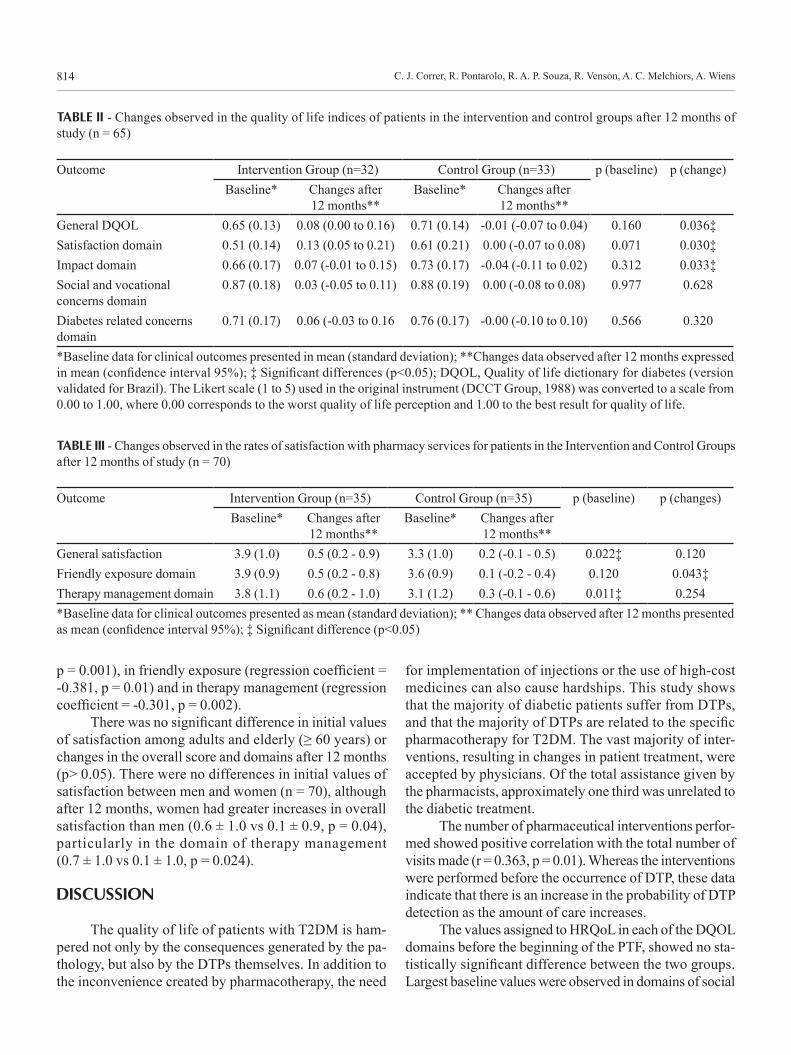
The initial and final HQoL scores were collected from 65 patients (67.7% of patients from each group). For the other patients, pharmacists could not apply the questionnaire at beginning and end of the research, due to the accumulation of activities related to Pharmacothera-peutic follow-up or due to blank questions that precluded a reliable comparative analysis. Table II contains the baseline quality of life and domains that composed the questionnaire, and the observed changes in these indexes after 12 months of study.
There were no significant differences between the two groups in baseline values of DQOL, for their overall score or each of the four domains. After 12 months, all HQoL indexes in the intervention group showed improve-ment. In the control group, on average, they remained un-changed or poorer. Significant differences were observed in the overall score DQOL score (0.08 95% CI 0.0 to 0.16 vs -0.01 95% CI -0.07 to 0.04, p = 0036) and in satisfaction and impact categories (Table II). In percentage terms, the intervention group had an improvement in quality of life of 8.6%, while in the control group there was a decrease of 1.6%.
Adjusting the baseline data for gender, age and time of diabetes diagnosis, the allocation of patients in the group that received Pharmacotherapeutic follow-up remains a significant predictor for changes in the ove-rall quality of life score (regression coefficient = 0.248, p = 0.047). The same is true for domain satisfaction (regression coefficient = 0.250, p = 0.044) and impact (regression coefficient = 0.259, p = 0.040) but not in the social / vocational (p = 0.686) and concerns related to diabetes (p = 0.365) domains.
There were no differences between men and women in changes in the overall score for quality of life, or in each of their fields in both intervention and control groups sepa-

Effect of a Pharmaceutical Care Program on quality of life and satisfaction with pharmacy services 813
rately, as in all the patients. The age group above 60 years was not important for the observed quality of life changes (regression coefficient = -0.138, p = 0.653).
Changes in satisfaction with pharmacy services
The initial and final scores for patient satisfaction with the pharmacy were collected for 70 patients (72.9% of total patients) and the results showed baseline differences between the two groups. Satisfaction was higher in the intervention group than in the Control Group (p = 0.022). In intervention Group (n = 35), the mean was 3.9 (SD = 1.0) and in the Control Group (n = 35) was 3.3 (SD = 1.0). After 12 months, the biggest difference was observed in the group
that received Pharmacotherapeutic follow-up (0.5 95% CI 0.1 to 0.9 vs. 0.2 95% CI -0.1 to 0.5); however, this difference was not significant (p = 0.120). Analyzing the domains, the baseline values differed between the groups in the managed therapy (p = 0.011) and in friendly exposure after 12 months, using the top score increase found in the intervention group (p = 0.043).
Given the baseline differences, baseline adjustments were made through a multivariate regression model of variables: gender, age, time of diagnosis of diabetes, and baseline score of satisfaction. Following this analysis, the allocation of patients into the intervention group emerges as the only positive predictor for the observed changes in overall satisfaction (regression coefficient = -0.348,
TABLE I - Comparative analysis of baseline values between patients in the intervention and control groups who completed the study (n = 96)
Parameter† Control Groupn=46
Intervention Groupn=50 p*
Gender n(%) Male 23 (50) 22 (44.0) 0.556Female 23 (50) 28 (56.0)
Mean age (SD) 59.5 (11.0) 58.1 (10.3) 0.534Diagnosis time mean (SD) 9.4 (7.8) 8.4 (8.7) 0.529Charlson index of co-morbiditymean (SD)
4.2 (1.4) 3.3 (1.2) 0.001‡
Access to health service n(%) Public 39 (84.8) 23 (46.0) <0.001‡Private 3 (6.5) 11 (22.0)Both 4 (8.7) 16 (32.0)
Schoolingn (%)
Primary incomplete 26 (56.5) 21 (42.0) 0.382Primary complete 8 (17.4) 14 (28.0)Secondary incomplete 1 (2.2) 5 (10.0)Secondary completo 7 (15.2) 6 (12.0)Higher incomplete 2 (4.3) 1 (2.0)Higher complete 2 (4.3) 3 (6.0)
Participation in a diabetic group n (%) 7 (15.2) 12 (24.0) 0.281Last medical consultation <6 months n(%) 40 (86.9) 41 (82.0) 0.339HbA1 % (SD) 8.6 (1.0) 9.8 (2.0) <0.001‡FG mg/dl(SD) 161.2 (53.2) 166.9 (56.4) 0.614Systolic BP mmHg (SD) 147.7 (31.5) 134.9 (17.8) 0.016‡Diastolic BP mmHg (SD) 91.1 (17.2) 81.5 (12.1) 0.002‡BMI Kg/m2 (SD) 27.6 (4.4) 29.2 (4.9) 0.100Male AC cm (SD) 96.2 (11.7) 97.1 (11.0) 0.778Female AC cm (SD) 93.7 (8.5) 93.8 (11.7) 0.965†Baseline data collected at study commencement. *Chi-square for two or more proportions and Student’s t to compare the means between independent groups. ‡Significant differences (p<0.05).
C. J. Correr, R. Pontarolo, R. A. P. Souza, R. Venson, A. C. Melchiors, A. Wiens814
p = 0.001), in friendly exposure (regression coefficient = -0.381, p = 0.01) and in therapy management (regression coefficient = -0.301, p = 0.002).
There was no significant difference in initial values of satisfaction among adults and elderly (≥ 60 years) or changes in the overall score and domains after 12 months (p> 0.05). There were no differences in initial values of satisfaction between men and women (n = 70), although after 12 months, women had greater increases in overall satisfaction than men (0.6 ± 1.0 vs 0.1 ± 0.9, p = 0.04), particularly in the domain of therapy management (0.7 ± 1.0 vs 0.1 ± 1.0, p = 0.024).
DISCUSSION
The quality of life of patients with T2DM is ham-pered not only by the consequences generated by the pa-thology, but also by the DTPs themselves. In addition to the inconvenience created by pharmacotherapy, the need
for implementation of injections or the use of high-cost medicines can also cause hardships. This study shows that the majority of diabetic patients suffer from DTPs, and that the majority of DTPs are related to the specific pharmacotherapy for T2DM. The vast majority of inter-ventions, resulting in changes in patient treatment, were accepted by physicians. Of the total assistance given by the pharmacists, approximately one third was unrelated to the diabetic treatment.
The number of pharmaceutical interventions perfor-med showed positive correlation with the total number of visits made (r = 0.363, p = 0.01). Whereas the interventions were performed before the occurrence of DTP, these data indicate that there is an increase in the probability of DTP detection as the amount of care increases.
The values assigned to HRQoL in each of the DQOL domains before the beginning of the PTF, showed no sta-tistically significant difference between the two groups. Largest baseline values were observed in domains of social
TABLE II - Changes observed in the quality of life indices of patients in the intervention and control groups after 12 months of study (n = 65)
Outcome Intervention Group (n=32) Control Group (n=33) p (baseline) p (change)Baseline* Changes after
12 months**Baseline* Changes after
12 months**General DQOL 0.65 (0.13) 0.08 (0.00 to 0.16) 0.71 (0.14) -0.01 (-0.07 to 0.04) 0.160 0.036‡Satisfaction domain 0.51 (0.14) 0.13 (0.05 to 0.21) 0.61 (0.21) 0.00 (-0.07 to 0.08) 0.071 0.030‡Impact domain 0.66 (0.17) 0.07 (-0.01 to 0.15) 0.73 (0.17) -0.04 (-0.11 to 0.02) 0.312 0.033‡Social and vocational concerns domain
0.87 (0.18) 0.03 (-0.05 to 0.11) 0.88 (0.19) 0.00 (-0.08 to 0.08) 0.977 0.628
Diabetes related concerns domain
0.71 (0.17) 0.06 (-0.03 to 0.16 0.76 (0.17) -0.00 (-0.10 to 0.10) 0.566 0.320
*Baseline data for clinical outcomes presented in mean (standard deviation); **Changes data observed after 12 months expressed in mean (confidence interval 95%); ‡ Significant differences (p<0.05); DQOL, Quality of life dictionary for diabetes (version validated for Brazil). The Likert scale (1 to 5) used in the original instrument (DCCT Group, 1988) was converted to a scale from 0.00 to 1.00, where 0.00 corresponds to the worst quality of life perception and 1.00 to the best result for quality of life.
TABLE III - Changes observed in the rates of satisfaction with pharmacy services for patients in the Intervention and Control Groups after 12 months of study (n = 70)
Outcome Intervention Group (n=35) Control Group (n=35) p (baseline) p (changes)Baseline* Changes after
12 months**Baseline* Changes after
12 months**General satisfaction 3.9 (1.0) 0.5 (0.2 - 0.9) 3.3 (1.0) 0.2 (-0.1 - 0.5) 0.022‡ 0.120Friendly exposure domain 3.9 (0.9) 0.5 (0.2 - 0.8) 3.6 (0.9) 0.1 (-0.2 - 0.4) 0.120 0.043‡Therapy management domain 3.8 (1.1) 0.6 (0.2 - 1.0) 3.1 (1.2) 0.3 (-0.1 - 0.6) 0.011‡ 0.254*Baseline data for clinical outcomes presented as mean (standard deviation); ** Changes data observed after 12 months presented as mean (confidence interval 95%); ‡ Significant difference (p<0.05)

Effect of a Pharmaceutical Care Program on quality of life and satisfaction with pharmacy services 815
and vocational concerns and worries related to diabetes. This indicates a better perception of quality of life in the-se domains, compared to the treatment satisfaction and disease impact. The biggest difference between the initial groups emerged in the satisfaction domain, in that patients in the control group showed indices closer to 1.0, although this did not reach significance (p = 0.071).
The data show that PTF conducted by the pharma-cists in community pharmacies led to an absolute increase in HRQL across all domains of the DQOL (satisfaction, impact, vocational and social concerns and preoccupations related to diabetes), whereas the satisfaction domain was the one which had the most evident improvement after 12 months. This improvement was not statistically significant for social and vocational domains or concerns related to the DM for both groups. In general, the increase in HRQL did not occur in the group not receiving the extra services in pharmaceutical care. The index for most domains in the standard care group remained unchanged or decreased, indicating stability or worsening of quality of life.
As regards patients’ satisfaction with pharmacy ser-vices, the baseline values were different for both groups (control and intervention) in overall score and the therapy management domain. This may be related to the influence of patients’ entry into the research study group and their levels of satisfaction in relation to the Control Group. After 12 months, there was a greater improvement in patients’ satisfaction in the Intervention Group than in the Control Group, but this was statistically significant only for the friendly exposure domain. This lack of response could have resulted from adjustments in data and correction of baseline differences. Pharmacotherapeutic Follow-up was a factor that impacted positively on the patients’ satisfaction, based on comparisons between Intervention and Control Groups.
This study showed similar results to previous studies conducted in other countries which evaluated the outcome of pharmaceutical care for various pathologies. The study by Elnour et al., assessed whether the introduction of the program of pharmaceutical care helped in improving HRQOL, among other outcomes. In their study, the SF-36 was applied to measure the quality of life and all domains presented more significant improvement in the Interven-tion Group (Elnour et al., 2008). Another study evaluated the effect of pharmaceutical care on humanistic outcomes of patients with heart failure and revealed similar findings: after 12 months of intervention, the HRQOL increased compared to the Control Group (Cabezas et al., 2006). Other studies in Brazil have found similar results working with one group of patients in analysis before and after intervention (Lyra et al., 2007; Lyra Junior et al., 2004).
Limitations
Among the several limitations of this study the main bias was the lack of randomization of patients between groups. The decision to work with intervention pharmacies and control pharmacies was made for three main reasons: (1) the operational difficulty of applying a different care process between patients within the same establishment in a non blinded study ; (2) problems recruiting patients who agreed to receive the standard care, knowing that other patients are receiving pharmaceutical care from other pharmacists; and (3) the ethical implications that would be imposed the pharmacist regarding decisions not to intervene in the treatment of patients allocated in the Control Group. The choice of intervention and control pharmacies allowed us to distinguish the type of services to patients, since in control pharmacies any type of phar-macotherapeutic follow-up service was implemented during the study period. To minimize the influence of non-randomization on the results of the study, patients’ baseline characteristics were adjusted in comprehensive multiple linear regression models.
The completion of clinical studies in a community pharmacy environment poses many challenges. The first and perhaps most important characteristic is the essentially commercial nature of the pharmacies that differentiates them from units pertaining to health services. Neverthe-less, the provision of a new service (pharmacotherapeutic follow-up) during recruitment presented no resistance among patients and it was relatively easy to achieve the goal originally established for 160 patients. In fact, at the end of recruitment period, further patients were interested in participating but could not be accommodated, due to the limitations of the project schedule and resources.
The most common reasons reported by patients who dropped out of the study were improvement in their laboratory exam results, lack of time or transportation difficulties attending appointments, lack of financial in-centive from the project, or simply loss of interest in the service (in both groups). The main reason perceived by the researchers was that, after several months of follow-up, those patients with improvement in glycemic and pressure control, lost interest in continuing attending the appointments, since these patients had to go to the pharmacy only to monitor and meet the objective of the research protocol. Furthermore, considering that the study was conducted in an actual practicing service, the rate of dropouts can be considered acceptable, because after 1 year, 52.6% of the patients were still being seen regularly in the Intervention Group.

C. J. Correr, R. Pontarolo, R. A. P. Souza, R. Venson, A. C. Melchiors, A. Wiens816
CONCLUSION
The adoption of a pharmaceutical care service in community pharmacies, focused on pharmacotherapeu-tic follow-up and detection and resolution of problems associated with pharmacotherapy, is effective in im-proving quality of life related to health and satisfaction with pharmacy services in patients with type 2 diabetes mellitus. These results should be evaluated in conjunction with clinical outcomes, and indicate the potential of this practice in patient care by the health team. Future studies can confirm these results in other groups of patients and different practice environments.
REFERENCES
ARMANDO, P.; SEMERIA, N.; TENLLADON, M.; SOLA, N. Pharmacotherapeutic follow-up of patients in community pharmacies. Atencion Primaria, v.36, n.3, p.129-134, 2005.
CABEZAS, C. L.; SALVADOR, C. F.; QUADRADA, D. C.; BARTÉS, A. A.; BORÉ, M. Y.; PEREAE, N. M.; PEIPOCH, H. Randomized clinical trial of a postdischarge pharmaceutical care program vs. regular follow-up in patients with heart failure. Farm. Hosp., v.30, n.6, p.328-342. 2006.
CORRER, C. J.; PONTAROLO, R.; MELCHIORS, A. C.; ROSSIGNOLI, P.; FERNANDEZ-LLIMOSR, F.; RADOMINSKI, B. Translation to portuguese and validation of the Diabetes Quality Of Life Measure (DQOL-Brazil). Arq. Bras. Endocrinol. Metabol., v.52, n.3, p.515-522. 2008a. (tirar a informação a da data)
CORRER, C. J.; PONTAROLO, R.; MELCHIORS, A. C.; SOUZA, R. A. P.; ROSSIGNOLIF, P.; FERNÁNDEZ-LLIMÓS, F. Satisfação dos Usuários com serviços da farmácia: tradução e validação do Pharmacy Services Questionnaire para o Brasil”. Cad. Saúde Pública, v.25, n.1, p.87-96, 2009
CUBERO-CABALLERO, S.; TORRES, M.; CAMPOS-PEREZ, M. A.; GOMEZ DEL RIOM, S.; CALLEJA-HERNANDEZ, A. Drug-related problems in the emergency department observation area of a third-level hospital. Farm. Hosp., v.30, n.3, p.187-192. 2006.
DCCT GROUP. Reliability and validity of a diabetes quality-of-life measure for the diabetes control and complications trial (DCCT). The DCCT Research Group. Diabetes Care, v.11, n.9, p.725-732. 1988.
DE CASTRO, M. S.; CHEMELLO, C.; PILGER, D.; JUNGES, F.; BOHNEN, L.; ZIMMERMAN, L. M.; PAULINO, M. A.; JACOBS, U.; FERREIRAF, M. B. C.; FUCHS, D. Contribuição da atenção farmacêutica no tratamento de pacientes hipertensos. Rev. Bras. Hip., v.13, n.3, p.198-202. 2006.
ELNOUR, A. A.; EL MUGAMMAR, I. T.; JABER, T.; REVELJ, T.; MCELNAY, C. Pharmaceutical care of patients with gestational diabetes mellitus. J. Eval. Clin. Pract., v.14, p.131-140. 2008.
FONTANA RASPANTI, D. ; SÓLA UTHURRY, N. . Pharmacotherapeutic follow-up in hospitalised paediatric patients: adapting Dáder methodology. Farm. Hosp., v.27, n.2, p.78-83. 2003.
HEPLER, C. D. STRAND, L. M. Opportunit ies and responsibilities in the pharmaceutical care. Am. J. Hosp. Pharm., v.47, n.3, p.533-543. 1990.
IGLÉSIAS, P.; SANTOS, H. S.; FERNÁNDEZ-LLIMÓS, F.; FONTES, E.; LEALC. MONTEIRO, M. Translation and Validation of the “Pharmacy Services Questionnaire” to Portuguese (european). Seg. Farmacoter., v.3, n.1, p.43-56, 2005.
KOZMA, C. M. Economic, Clinical, and Humanistic Outcomes: A Planning Model for Pharmacoeconomic Research. Clin. Ther., n.15, p.1121-1132, 1993.
LARSON, L. N.; ROVERSL, J. P.; MACKEIGAN, D. Patient satisfaction with pharmaceutical care: update of a validated instrument. J. Am. Pharm. Assoc. (Wash), v.42, n.1, p.44-50, 2002.
LYRA JR., D. P.; KHEIR, N.; ROCHA, C. E.; ABRIATA, J. P.; SANTOSI, C. B. D.; PELA, R. Impact of pharmaceutical care interventions in the identification and resolution of drug-related problems and on quality of life in a group of elderly outpatients in Ribeirão Preto (SP), Brazil. Ther. Clin. Risk Manag., v.3, n.6, p.989-998, 2007.
LYRA JR., D.; AMARAL, R. T.; ABRIATAI, J. P.; PELÁ, R. Satisfaction as an outcome of a pharmaceutical care program for elderly in Ribeirão Preto – São Paulo (Brazil). Seguim. Farmacoter., v.3, n.30, p.30-42, 2004.
MACHUCA, M.; FERNÁNDEZ-LLIMÓSM, F.; FAUS, J. Método Dáder: guía de seguimiento farmacoterapêutico. Granada: Universidade de Granada, 2003. 47 p.

Effect of a Pharmaceutical Care Program on quality of life and satisfaction with pharmacy services 817
MARTÍNEZ-ROMERO, F.; FERNÁNDEZ-LLIMÓS, F.; GASTELURRUTIA, M. A.; PARRASM, M.; FAUS, J. Pilot phase results of the Dáder programme for drug therapy follow up. Ars Pharm., v.42, n.1, p.53-65, 2001.
MATA CASES, M.; ROSET GAMISANS, M.; BADIA LLACH, X.; ANTONANZAS VILLARJ, F.; RAGEL ALCAZAR, J. Effect of type-2 diabetes mellitus on the quality of life of patients treated at primary care consultations in Spain. Atencion Primaria, v.31, n.8, p.493-499. 2003.
McCAFFREY III, D.J. Patient satisfaction: the forgotten outcome? Drug Topics, v.144, n.14, p.43-50, 2000.
ORGANIZACIÓN MUNDIAL DE LA SALUD. El papel del Farmacéutico en la Atención a la Salud: Declaración de Tokio. Genebra: OMS, 1993. 37 p.
REDEKOP, W. K.; KOOPMANSCHAP, M. A.; STOLK, R. P.; RUTTEN, G. E.; WOLFFENBUTTELL, B. H.; NIESSEN, W. Health-related quality of life and treatment satisfaction in Dutch patients with type 2 diabetes. Diabetes Care, v.25, n.3, p.458-463. 2002.
SILVA CASTRO, M. M.; CALLEJA HERNANDEZ, M. A.; TUNEU, I.; VALLS, L.; FUENTES CAPARROS, B.; GUTIERREZ SAINZM, J.; FAUS DADER, J. Drug therapy follow-up in patients admitted to a Surgery Department. Farm. Hosp., v.28, n.3, p.154-169, 2004.
SOCIEDADE BRASILEIRA DE DIABETES. Atualização Brasileira sobre Diabetes 2006. Rio de Janeiro: Diographic, 2005. 144 p.
SOCIEDADE BRASILEIRA DE DIABETES. Tratamento e acompanhamento do diabetes mellitus - Diretrizes da Sociedade Brasileira de Diabetes. Rio de Janeiro: Diagraphic, 2007. 168 p.
ZIMMET, P.; ALBERTI, K. G. M. M.; SHAW, J. Global and societal implications of the diabetes epidemic. Nature, v.414, n.6865, p.782-787, 2001.
Received for publication on 12th November 2008.Accepted for publication on 03rd March 2009.
