distribuição de aves de sub-bosque ao longo de gradientes
TRANSCRIPT
Instituto Nacional de Pesquisas da Amazônia
Programa de Pós-Graduação em Ecologia
Distribuição de aves de sub-bosque ao longo de
gradientes ambientais na Amazônia central
Anderson Saldanha Bueno
Manaus, Amazonas, Brasil
Agosto, 2010
ii
Anderson Saldanha Bueno
Distribuição de aves de sub-bosque ao longo de
gradientes ambientais na Amazônia central
Orientador: William Ernest Magnusson
Co-orientadora: Tânia Margarete Sanaiotti
Dissertação apresentada ao Programa de Pós-Graduação
em Ecologia do Instituto Nacional de Pesquisas da
Amazônia, como parte dos requisitos para obtenção do
título de Mestre em Biologia (Ecologia).
Manaus, Amazonas, Brasil
Agosto, 2010

iii
Banca examinadora do trabalho escrito
Dr. James Roper
Aprovado com correções
Dr. Philip Stouffer
Aprovado com correções
Dra. Marina Anciães
Necessita revisão
Banca examinadora da defesa oral pública
Dr. Renato Cintra
Dr. Thierry Gasnier
Dr. Bruce Nelson
iv
B928 Bueno, Anderson Saldanha Distribuição de aves de sub-bosque ao longo de gradientes ambientais na Amazônia centra l/ Anderson Saldanha Bueno.--- Manaus : [s.n.], 2010. viii, 38 f. : il. color. Dissertação (mestrado)-- INPA, Manaus, 2010 Orientador : William Ernest Magnusson Co-orientador : Tânia Margarete Sanaiotti Área de concentração : Ecologia 1. Aves – Ecologia. 2. Matas ripárias. 3. Ecologia de comunidades. 4. Reserva Florestal Adolpho Ducke (AM). 5. Distribuição de espécies. 6. Redes de neblina. 7. Gradientes ambientais. I. Título. CDD 19. ed. 598.298113
v
Agradecimentos
Sou grato ao estímulo e suporte que meus pais sempre me deram para estudar. Por
respeitarem e confiarem nas minhas escolhas e por se sentirem felizes com as minhas
conquistas.
Às minhas irmãs por me deixarem contente em saber que acham tri legal ter irmão
biólogo, que faz mestrado com passarinhos lá na Amazônia.
Aos meus eternos grandes amigos, Afonso, Diego, Fabiano (Bode), Ronaldo e Vitor
(Cabra), simplesmente por sempre cultivarem a nossa amizade. Em especial ao Vitor, que
posso chamar de irmão, por ser tão importante para a família que também faz parte.
À minha amada namorada, Aline Jaime Leal, por acreditar, juntamente comigo, que os
desafios fortalecem o nosso amor e que a distância só nós deixa com mais vontade de
ficarmos juntos.
Aos colegas e amigos da Universidade Federal de Santa Maria, Cristian, Ígor, Daiani e
Mauro, que vieram comigo para a Amazônia, por fortalecerem os nossos laços de amizade e
por terem sido referências para mim em uma terra distante das minhas origens.
Aos amigos que fiz em Manaus pela alegria proporcionada pela nossa vivência como
uma grande família de estudantes felizes em conviver uns com os outros.
Aos meus “irmãos”, Marlos e Andressa, e ao Jarbas, que começaram a fazer parte da
minha vida em Manaus, pela grande e sincera amizade que construímos.
Aos colegas e amigos da universidade, Gabriel e Franchesco, por fazerem minhas
visitas à Santa Maria tão saudosistas e felizes.
Ao INPA que viabilizou, por meio de sua infra-estrutura, professores e funcionários, a
realização do meu mestrado e à CAPES pela concessão da minha bolsa de mestrado.
Ao meu orientador, William Ernest Magnusson, por me conceder a oportunidade de
realizar este estudo, por ter confiado em mim durante todas as etapas do mestrado, por ter
compartilhado o seu conhecimento comigo e por ter me tornado um cientista melhor.
À minha co-orientadora, Tânia Margarete Sanaiotti, por ter me ajudado a planejar e a
executar o meu projeto de mestrado.
À Jess pela revisão do abstract e por tantas outras revisões de inglês.
Por fim, agradeço a todos os que fizeram parte da experiência de vida que tive durante
minha estadia na Amazônia.
vi
Resumo
Zonas ripárias são reconhecidas pela sua importância na manutenção da biodiversidade regional. Diversos estudos compararam a distribuição de aves em zonas ripárias e não-ripárias a fim de avaliar o valor para conservação das zonas ripárias. Contudo, nenhum estudo se dedicou a estabelecer até que distância em relação ao riacho as aves reconhecem como ripária. Nós investigamos a distribuição de aves de sub-bosque ao longo dos gradientes ambientais de distância do riacho, conteúdo de argila e inclinação do terreno em uma floresta de terra firme na Amazônia central. Para amostrar a comunidade de aves de sub-bosque, utilizamos redes de neblina em 45 parcelas, sendo cada parcela amostrada três vezes. Utilizamos Non-metric
Multidimensional Scaling (NMDS) para reduzir a dimensionalidade dos dados de composição quantitativa (abundância) e qualitativa (presença-ausência) de espécies em um eixo de ordenação multivariada. Em 9720 horas-rede, nós capturamos 1506 aves pertencentes a 98 espécies em 28 famílias. A estimativa da largura da zona ripária indicada pelas aves de sub-bosque na Reserva Ducke dependeu do atributo da comunidade considerado: composição quantitativa (100 m), composição qualitativa (140 m). A distribuição de espécies esteve relacionada com o conteúdo de argila, mas não esteve relacionada com a inclinação do terreno. Na Reserva Ducke, distância do riacho apresenta correlação com o conteúdo de argila, mas não apresenta correlação com inclinação do terreno. Conteúdo de argila afeta a composição de espécies vegetais, que, por sua vez, pode afetar a composição de aves. Contudo, o padrão de distribuição de aves em locais próximos e afastados do riacho é consistente entre estudos realizados em diversas geomorfologias, tanto em regiões temperadas quanto em regiões tropicais, o que indica um efeito da distância do riacho per se. A proteção de faixas adjacentes a riachos constitui umas das estratégias de conservação mais utilizadas. No Brasil, a faixa protegida ao redor do riacho se estende até 30 m. Nós demonstramos que a faixa protegida deve ser aumentada consideravelmente para que a legislação ambiental brasileira seja eficiente em cumprir o seu papel de proteger a biodiversidade associada a zonas ripárias.
vii
Abstract
Riparian zones are recognized by their importance to maintaining the regional biodiversity. Several studies compared the bird distribution between riparian and non-riparian zones to evaluate the conservation value of riparian zones. However, no study aimed to establish how wide is the riparian zone recognized by birds in relation to distance from the stream. We investigated the distribution of understory birds along the environmental gradients of distance from the stream, clay content and slope of the terrain in a terra firme central Amazonian forest. We sampled understory birds using mist nets in 45 plots, sampling each plot three times. We used Non-metric Multidimensional Scaling (NMDS) to reduce the data dimensionality of species quantitative (abundance) and qualitative (presence-absence) composition in one multivariate axis. In 9720 mist-net hours, we captured 1506 birds belonging to 98 species in 28 families. Estimation of the width of riparian zone as indicated by understory birds in Reserva Ducke depended on the community attribute considered: species quantitative composition (100 m), species qualitative composition (140 m). The species distribution was related to clay content, but it was not related to slope of the terrain. In Reserva Ducke, distance from the stream is correlated with clay content, but it is not correlated with slope of the terrain. Clay content affects the plant species composition, which in turn could affect the bird species composition. However, the distribution pattern of birds in places near to and away from the stream is consistent among the studies carried out in diverse geomorphologies in both temperate and tropical regions, indicating an effect of distance from the stream itself. The protection of strip’s adjacent to streams is one of the most used conservation strategies. In Brazil, the protected strip around the stream extends to 30 m. We demonstrated that the width of the protected strip should be increased considerably for the Brazilian environmental legislation to be effective in fulfilling its role of protecting the biodiversity associated with the riparian zones.
viii
Sumário
Agradecimentos ..........................................................................................................................v
Resumo ......................................................................................................................................vi
Abstract.....................................................................................................................................vii
Introdução...................................................................................................................................1
Objetivos.....................................................................................................................................2
Artigo..........................................................................................................................................3
Summary.................................................................................................................................4
Key words...............................................................................................................................5
Introduction ............................................................................................................................5
Materials and methods............................................................................................................7
Study area ...........................................................................................................................7
Sampling design .................................................................................................................8
Data collection....................................................................................................................8
Data analysis.....................................................................................................................10
Results ..................................................................................................................................11
The understory bird community .......................................................................................11
The effect of environmental variables on the distribution of understory birds ................11
Discussion.............................................................................................................................13
Implications for conservation ...........................................................................................15
Acknowledgments ................................................................................................................16
References ............................................................................................................................17
Figure legends ......................................................................................................................25
Figures ..................................................................................................................................26
Table. ....................................................................................................................................29
Conclusões................................................................................................................................33
Apêndices .................................................................................................................................34
1
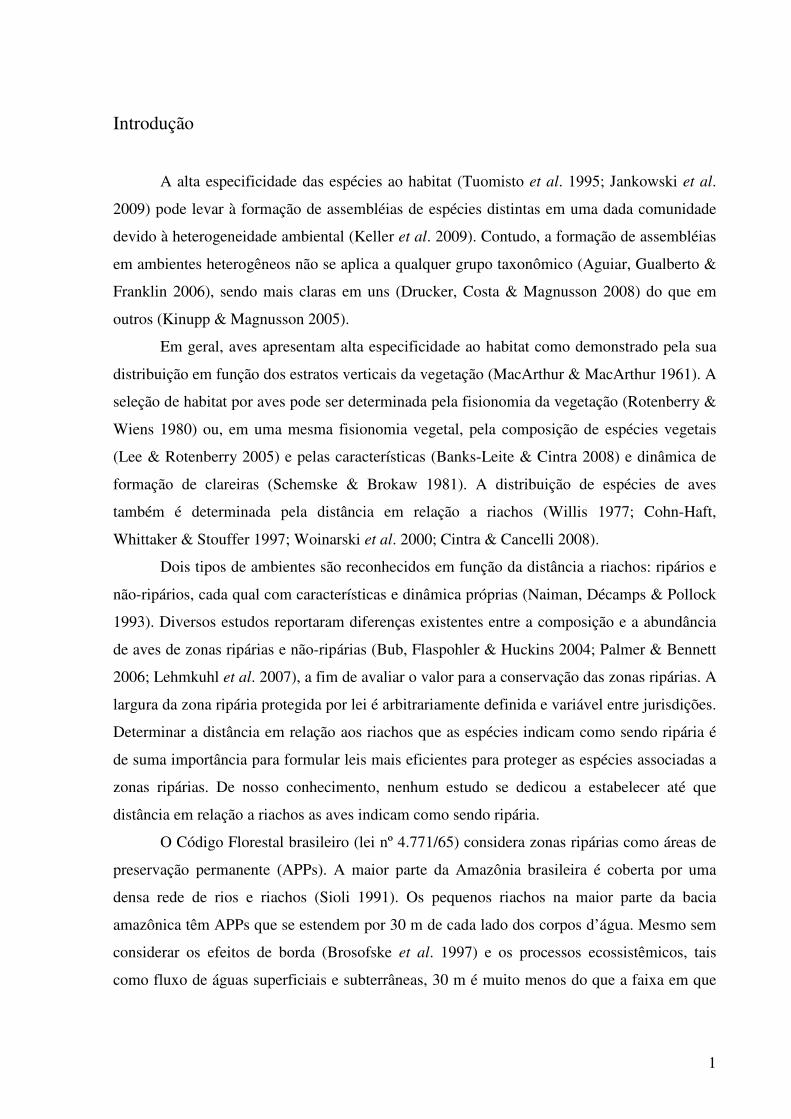
Introdução
A alta especificidade das espécies ao habitat (Tuomisto et al. 1995; Jankowski et al.
2009) pode levar à formação de assembléias de espécies distintas em uma dada comunidade
devido à heterogeneidade ambiental (Keller et al. 2009). Contudo, a formação de assembléias
em ambientes heterogêneos não se aplica a qualquer grupo taxonômico (Aguiar, Gualberto &
Franklin 2006), sendo mais claras em uns (Drucker, Costa & Magnusson 2008) do que em
outros (Kinupp & Magnusson 2005).
Em geral, aves apresentam alta especificidade ao habitat como demonstrado pela sua
distribuição em função dos estratos verticais da vegetação (MacArthur & MacArthur 1961). A
seleção de habitat por aves pode ser determinada pela fisionomia da vegetação (Rotenberry &
Wiens 1980) ou, em uma mesma fisionomia vegetal, pela composição de espécies vegetais
(Lee & Rotenberry 2005) e pelas características (Banks-Leite & Cintra 2008) e dinâmica de
formação de clareiras (Schemske & Brokaw 1981). A distribuição de espécies de aves
também é determinada pela distância em relação a riachos (Willis 1977; Cohn-Haft,
Whittaker & Stouffer 1997; Woinarski et al. 2000; Cintra & Cancelli 2008).
Dois tipos de ambientes são reconhecidos em função da distância a riachos: ripários e
não-ripários, cada qual com características e dinâmica próprias (Naiman, Décamps & Pollock
1993). Diversos estudos reportaram diferenças existentes entre a composição e a abundância
de aves de zonas ripárias e não-ripárias (Bub, Flaspohler & Huckins 2004; Palmer & Bennett
2006; Lehmkuhl et al. 2007), a fim de avaliar o valor para a conservação das zonas ripárias. A
largura da zona ripária protegida por lei é arbitrariamente definida e variável entre jurisdições.
Determinar a distância em relação aos riachos que as espécies indicam como sendo ripária é
de suma importância para formular leis mais eficientes para proteger as espécies associadas a
zonas ripárias. De nosso conhecimento, nenhum estudo se dedicou a estabelecer até que
distância em relação a riachos as aves indicam como sendo ripária.
O Código Florestal brasileiro (lei nº 4.771/65) considera zonas ripárias como áreas de
preservação permanente (APPs). A maior parte da Amazônia brasileira é coberta por uma
densa rede de rios e riachos (Sioli 1991). Os pequenos riachos na maior parte da bacia
amazônica têm APPs que se estendem por 30 m de cada lado dos corpos d’água. Mesmo sem
considerar os efeitos de borda (Brosofske et al. 1997) e os processos ecossistêmicos, tais
como fluxo de águas superficiais e subterrâneas, 30 m é muito menos do que a faixa em que
2
assembléias de ervas de sub-bosque associadas a zonas ripárias são distintas das assembléias
mais afastadas do riacho (Drucker, Costa & Magnusson 2008).
O Código Florestal brasileiro determina que cada propriedade rural situada em área de
floresta na Amazônia Legal deve manter uma cobertura florestal de 80% (sem considerar as
APPs). Entretanto, existe um forte movimento rural interessado em reduzir essa área para
50%. De qualquer forma, se a largura da faixa em relação ao riacho utilizada pelas espécies
associadas a zonas ripárias é maior que 30 m, o Código Florestal brasileiro seria mais
eficiente em proteger essas espécies se considerasse a configuração da paisagem em relação
às APPs. Possivelmente, 50% de cobertura florestal contígua às APPs seria mais eficiente que
80% de cobertura, se os 20% desmatados isolarem as APPs da floresta circundante e a faixa
de 30 m não for suficiente para manter as populações que estão isoladas.
Neste estudo, nós investigamos a distribuição de aves de sub-bosque em relação à
distância do riacho e a variáveis edáficas e topográficas (conteúdo de argila e inclinação do
terreno), que sabidamente são correlacionadas com a composição de espécies de plantas
(Costa, Magnusson & Luizão 2005; Kinupp & Magnusson 2005; Poulsen, Tuomisto &
Balslev 2006; Bohlman et al. 2008; Drucker, Costa & Magnusson 2008), em uma floresta de
terra firme na Amazônia central. Nós mostramos que aves de sub-bosque indicam uma zona
ripária que se estende muito além da largura de vegetação adjacente a cursos d’água protegida
pela legislação ambiental.
Objetivos
• Estimar a largura da zona ripária para aves de sub-bosque em uma floresta de terra
firme na Amazônia central.
• Determinar o efeito dos gradientes ambientais de distância do riacho, conteúdo de
argila e inclinação do terreno na distribuição de aves de sub-bosque.
3
Artigo formatado conforme as normas da revista Journal of Applied Ecology
Title: The width of riparian zones for understory birds in central Amazonia
Running head: Riparian zones for understory birds
Anderson Saldanha Bueno1*, William Ernest Magnusson1, Tânia Margarete Sanaiotti1, Renato
Saragoça Bruno2 and Tania Pena Pimentel1
1Coordenação de Pesquisas em Ecologia, Instituto Nacional de Pesquisas da Amazônia, CP
478, 69.011-970, Manaus, AM, Brasil
2Curso de Ciências Biológicas, Centro de Ciências Biológicas e da Saúde, Universidade
Presbiteriana Mackenzie, 01.302-907, São Paulo, SP, Brasil
*Correspondence author. E-mail: [email protected]

4
Summary
1. Riparian zones are important for maintenance regional biodiversity. Many studies have
compared bird distributions between riparian and non-riparian zones, but no published study
has been designed to establish how wide is the riparian zone recognized by birds in relation to
distance from the stream.
2. We investigated the distribution of understory birds along environmental gradients of
distance from the stream, clay content and terrain slope in a central Amazonian forest. We
sampled understory birds using mist nets in 45 plots, sampling each plot three times. We used
Non-metric Multidimensional Scaling (NMDS) to reduce the dimensionality of species
quantitative (abundance) and qualitative (presence-absence) composition to one multivariate
axis.
3. Estimation of the width of the riparian zone as indicated by understory birds depended on
the community attribute considered: species quantitative composition (100 m), species
qualitative composition (140 m). Species distributions were associated with clay content, but
were largely independent of slope.
4. Distance from the stream is correlated with clay content, but is largely independent of slope
in the study site. Clay content affects plant species composition, which in turn may influence
bird species composition. However, distribution patterns of birds with respect to distance
from the stream are consistent among studies in both temperate and tropical regions,
indicating an effect of distance from the stream itself.
5. Synthesis and applications. The protection of riparian zones is one of the most widely used
conservation strategies. Under Brazilian law, the protected strip around small streams extends
to 30 m. We show that the protected strip should be much wider and we recommend that
Brazilian environmental legislation be changed to fulfill its role of protecting biodiversity
associated with riparian zones.

5
Key words: biodiversity conservation, ecological boundaries, environmental legislation,
species distribution, environmental gradients, tropical forest, riparian zones, Neotropical
birds, mist nets
Introduction
Habitat specificity at the species level (Tuomisto et al. 1995; Jankowski et al. 2009) can
generate distinct species assemblages within a given community due to environmental
heterogeneity (Keller et al. 2009). However, this phenomenon is not universal among
taxonomic groups (Aguiar, Gualberto & Franklin 2006), being stronger in some (Drucker,
Costa & Magnusson 2008) and weaker in others (Kinupp & Magnusson 2005).
Birds typically show high habitat specificity, as shown in the classic study of their
distribution in vertical vegetation strata (MacArthur & MacArthur 1961). Habitat selection in
birds may be determined by vegetation type (Rotenberry & Wiens 1980), or, within the same
vegetation type, by plant species composition (Lee & Rotenberry 2005) and treefall-gap
characteristics (Banks-Leite & Cintra 2008) and dynamics (Schemske & Brokaw 1981). Bird
species distributions also vary in relation to distance from streams (Willis 1977; Cohn-Haft,
Whittaker & Stouffer 1997; Woinarski et al. 2000; Cintra & Cancelli 2008).
Ecologists typically recognize two habitat types along the gradient of increasing
distance from the stream: riparian and non-riparian, each with its own characteristics and
dynamics (Naiman, Décamps & Pollock 1993). Many studies of the conservation value of
riparian zones have documented differences between the species composition and abundance
distributions of bird communities in these two habitat types (Bub, Flaspohler & Huckins
2004; Palmer & Bennett 2006; Lehmkuhl et al. 2007). Since the width of riparian zones as
defined by environmental legislation is typically arbitrary, and varies between jurisdictions,
making that legislation more effective will require studies to determine the true width of
6
habitat that species recognize as riparian. To our knowledge, no published study has been
designed to establish how wide is the riparian zone recognized by birds in relation to distance
from the stream.
Brazil’s forestry code (law nº 4771/65) designates riparian zones as areas meriting
permanent protection (hereafter referred to by the Portuguese acronym APP). In most of the
Brazilian Amazon, where the landscape is criss-crossed by a dense network of rivers and
streams (Sioli 1991), APPs for small streams are defined as strips 30 m wide on each side of
small streams. However, Drucker, Costa & Magnusson (2008) showed that understory-herb
assemblage associated with riparian zones extends much farther from streams than this. Also,
30 m may not account for edge effects (Brosofske et al. 1997) and ecosystem processes, such
as above- and below-ground water flow.
The Brazilian forestry code mandates that all rural landholdings in the country’s
Amazon region must maintain at least 80% forest cover (not including APPs). A strong
political movement is currently pressuring the government to reduce this to 50%. If the width
of the riparian zone used by riparian-associated species is greater than 30 m, then the spatial
arrangement of the forest cover which rural landholders must maintain might determine the
effectiveness of APPs. For example, maintaining 50% of forest cover that is contiguous to
APPs could be more efficient than maintaining 80% of forest cover that is not contiguous to
APPs, since the latter arrangement would strand populations of riparian species in narrow,
isolated strips of forest extending 30 m to each side of streams.
In this study, we examined the distribution of understory birds in a terra firme forest in
central Amazonia in relation to both distance from the stream and edaphic and topographic
variables (clay content and terrain slope), which are known to be related to plant species
composition (Costa, Magnusson & Luizão 2005; Kinupp & Magnusson 2005; Poulsen,
Tuomisto & Balslev 2006; Bohlman et al. 2008; Drucker, Costa & Magnusson 2008). We
7
show that understory birds recognize a riparian zone that extends much farther than the width
of strips of riparian vegetation protected by environmental legislation.
Materials and methods
STUDY AREA
This study was carried out in the Reserva Ducke, administered by Instituto Nacional de
Pesquisas da Amazônia (INPA), in Manaus, central Amazonia (02º55’–03º01’ S, 59º53’–
59º59’ W). The reserve protects 10,000 ha of well-drained relatively undisturbed terra firme
forest that is not subject to long-term floods (Ribeiro et al. 1999). The understory is
dominated by sessile palms and shaded by a closed canopy approximately 30-37 m high, in
which occasional emergent trees reach 40–45 m (Ribeiro et al. 1999).
Topography at the site is a mosaic of plateaus and valley bottoms, the latter with
riparian areas (Ribeiro et al. 1999) along streams that are typically less than 10 m wide. The
elevational difference between the highest and lowest points in the reserve is 87 m (Drucker,
Costa & Magnusson 2008), while the difference between plateaus and adjacent valley bottoms
is generally 30 m (Castilho et al. 2006). The clay content of soils varies with elevation, such
that soils in higher areas contain more clay (Chauvel, Lucas & Boulet 1987). The strong
correlation between clay content and elevation (rs = 0.916, P < 0.001) means that elevation is
an effective proxy for clay content (Costa, Magnusson & Luizão 2005). Distance from the
stream is correlated with clay content (rs = 0.764, P < 0.001) but not with slope (rs = – 0.055,
P = 0.773). There is a rainy season at the site which typically extends from November to May,
and a dry season from July to October (Marques Filho et al. 1981). Between April 1965 and
November 1980, mean annual temperature was 26 ºC and mean annual precipitation was 2362
mm (Marques Filho et al. 1981).
8
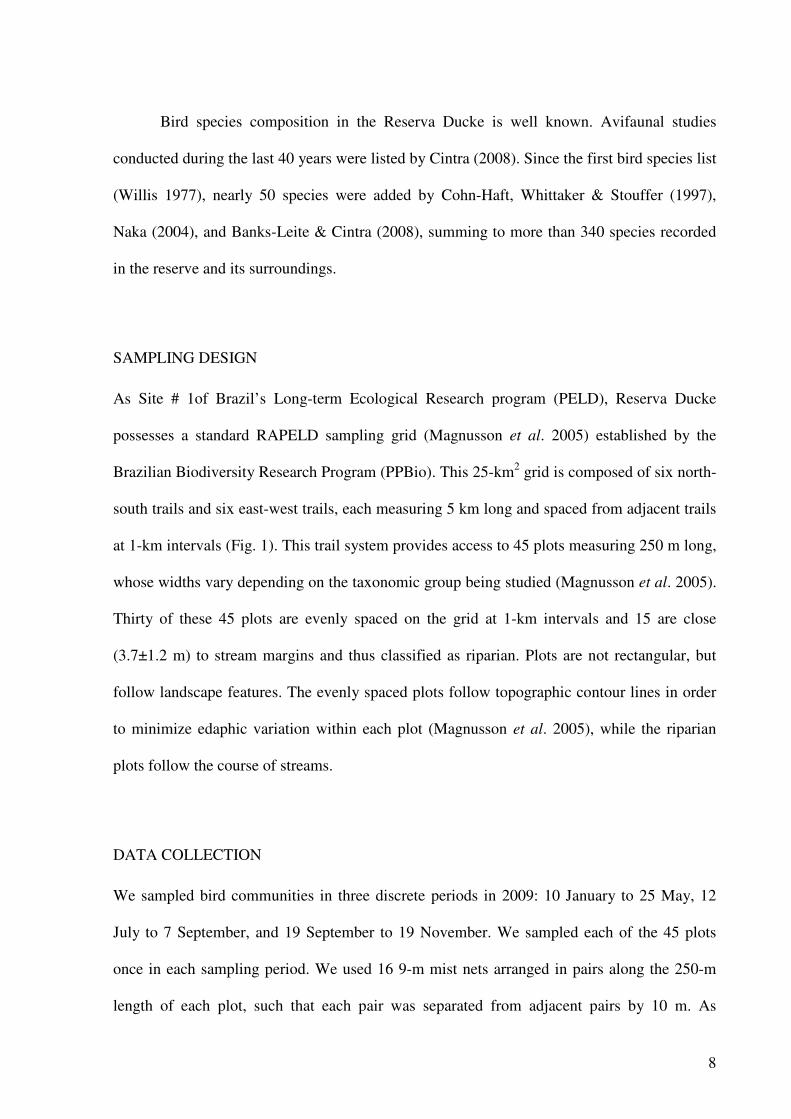
Bird species composition in the Reserva Ducke is well known. Avifaunal studies
conducted during the last 40 years were listed by Cintra (2008). Since the first bird species list
(Willis 1977), nearly 50 species were added by Cohn-Haft, Whittaker & Stouffer (1997),
Naka (2004), and Banks-Leite & Cintra (2008), summing to more than 340 species recorded
in the reserve and its surroundings.
SAMPLING DESIGN
As Site # 1of Brazil’s Long-term Ecological Research program (PELD), Reserva Ducke
possesses a standard RAPELD sampling grid (Magnusson et al. 2005) established by the
Brazilian Biodiversity Research Program (PPBio). This 25-km2 grid is composed of six north-
south trails and six east-west trails, each measuring 5 km long and spaced from adjacent trails
at 1-km intervals (Fig. 1). This trail system provides access to 45 plots measuring 250 m long,
whose widths vary depending on the taxonomic group being studied (Magnusson et al. 2005).
Thirty of these 45 plots are evenly spaced on the grid at 1-km intervals and 15 are close
(3.7±1.2 m) to stream margins and thus classified as riparian. Plots are not rectangular, but
follow landscape features. The evenly spaced plots follow topographic contour lines in order
to minimize edaphic variation within each plot (Magnusson et al. 2005), while the riparian
plots follow the course of streams.
DATA COLLECTION
We sampled bird communities in three discrete periods in 2009: 10 January to 25 May, 12
July to 7 September, and 19 September to 19 November. We sampled each of the 45 plots
once in each sampling period. We used 16 9-m mist nets arranged in pairs along the 250-m
length of each plot, such that each pair was separated from adjacent pairs by 10 m. As
9
sampling effort is usually measured as net-hours (i.e., one 12-m mist net open for one hour;
Keyes & Grue 1982), we converted our sampling effort with 9-m mist nets to those units. In
the first sampling period, we used eight mist nets with 50 mm mesh and eight mist nets with
70 mm mesh. In the later sampling periods, all mist nets had 32 mm mesh.
Mist nets were left open from 06:00 to 12:00 h and revised hourly. Captured birds
were identified using the field guide of Restall, Rodner & Lentino (2007) and banded with
standard CEMAVE bands (ICMBIO/SNA permission nº 3052). Birds that could not be
identified in the field were collected (IBAMA/SISBIO permission nº 17229-1) or
photographed and later identified by specialists. All collected birds were deposited in the
INPA Bird Collection.
The distance between each plot and the nearest stream was measured at six points
spaced at 50-m intervals along the central line of each plot with a measuring tape, and the
mean distance was used in analyses for plots whose starting point was less than 30 m from the
stream. For the other plots, the linear distance between the geographic coordinates of the plot
center and the nearest stream was used. A soil sample was collected to a depth of 5 cm at each
of the same six points per plots. These samples were mixed to form a composite sample for
each plot, 500 g of which was analyzed for clay content in INPA’s soil laboratory. Slope was
measured with a clinometer on a 3-m line perpendicular to the central line (1.5 m to each side)
at each of the same six points per plots. The mean of the six values for each plot was used in
analyses.
Data on distance from the stream were obtained for all 45 plots, while data on slope
and clay content were obtained for the 30 evenly spaced plots. Distance from the stream was
measured in previous studies and the data provided by R. de Fraga, F. R. C. Costa, and J.
Schietti. Slope and clay-content data, as well as information on the collection methods and the
researchers involved are available online at the PPBio website (http://ppbio.inpa.gov.br).
10
DATA ANALYSIS
Dissimilarity in species composition between plots was calculated with both abundance data
(referred to hereafter as quantitative composition) and presence-absence data (qualitative
composition). Patterns in quantitative data are typically driven by common species, which
tend to have large differences in abundances between plots. Qualitative data give more weight
to rare species, because common species occur in most plots and contribute little to between-
plot differences.
We used Non-metric Multidimensional Scaling (NMDS) to reduce the dimensionality
of species composition data to one axis of a multivariate ordination, in order to describe the
major patterns in understory bird community (McCune & Grace 2002). The ordinations with
quantitative data were based on a matrix of similarities calculated with the Bray-Curtis index.
Abundance of each species in each plot was standardized by converting it to relative
abundance prior to analysis. Abundance of a given species in a given plot was calculated as
the total number of individuals captured in the three sampling periods, excluding recaptures of
banded birds in the plot where they were originally captured. Ordinations of qualitative data
were based on Sørensen’s index.
We tested the effect of distance from the stream on species quantitative and qualitative
composition, represented by NMDS scores. To identify discontinuities in community
attributes with increasing distance from the stream, we used piecewise regression, a statistical
technique useful to identify ecological thresholds (Toms & Lesperance 2003). Piecewise
regression identifies the two lines which best characterize variance in the data. The
intersection point of these two lines was considered as an indicator of the size of the riparian
zone for understory birds. The piecewise regression was performed using the statistical
package SiZer (see Sonderegger et al. 2009) in the program R, version 2.8.1. We used direct
gradient analysis (McCune & Grace 2002) to illustrate in a compound graph (developed in the

11
program R by C. S. Dambros) the distribution of species in relation to distance from the
stream, based on qualitative data.
Results
THE UNDERSTORY BIRD COMMUNITY
In 9720 net-hours in the 45 plots, we captured 1506 birds belonging to 98 species in 28
families. In the 30 evenly spaced plots in 6480 net-hours, we captured 918 birds belonging to
80 species and 24 families. We captured two species (Glaucis hirsutus and Neopipo
cinnamomea) not previously recorded for the Reserva Ducke (Willis 1977; Cohn-Haft,
Whittaker & Stouffer 1997; Naka 2004; Banks-Leite & Cintra 2008). The number of species
captured in each plot varied from 10 to 28 (18.31 ± 3.85) and the number of individuals
captured varied from 15 to 58 (33.47 ± 9.64). The 20 most-captured species (n ≥ 23)
accounted for 72% of all captures. Twenty-five species were captured only once (Table 1).
THE EFFECT OF ENVIRONMENTAL VARIABLES ON THE DISTRIBUTION OF
UNDERSTORY BIRDS
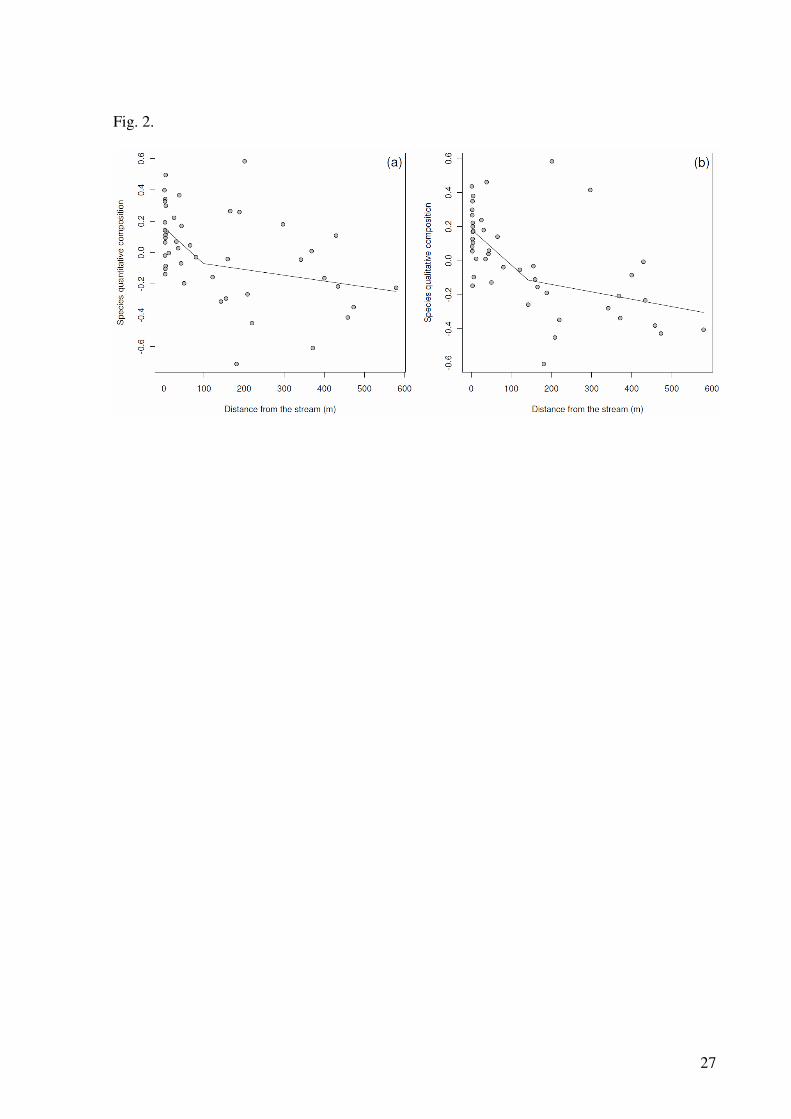
For the ordination of quantitative data from the 45 plots, one NMDS axis explained 40% of
the variation in the matrix of original differences between plots. The quantitative composition
of birds, represented by the NMDS axis, showed turnover throughout the gradient of
increasing distance from the stream (Fig. 2a). The piecewise regression indicated that the
effect of distance from the stream on the relative abundance of species extended to
approximately 100 m (CI = 45.5 – 492.9) from streams (r² = 0.213, d.f. = 42, P = 0.002).
For the ordination of qualitative data from the 45 plots, one NMDS axis explained
36% of the variation in the matrix of original distances between plots. The qualitative
12
composition of birds, represented by the NMDS axis, showed turnover throughout the
gradient of increasing distance from the stream (Fig. 2b). The piecewise regression indicated
that the effect of distance from the stream on the presence-absence of species extended
approximately 140 m (CI = 50.5 – 429.1) from streams (r² = 0.359, d.f. = 42, P < 0.001).
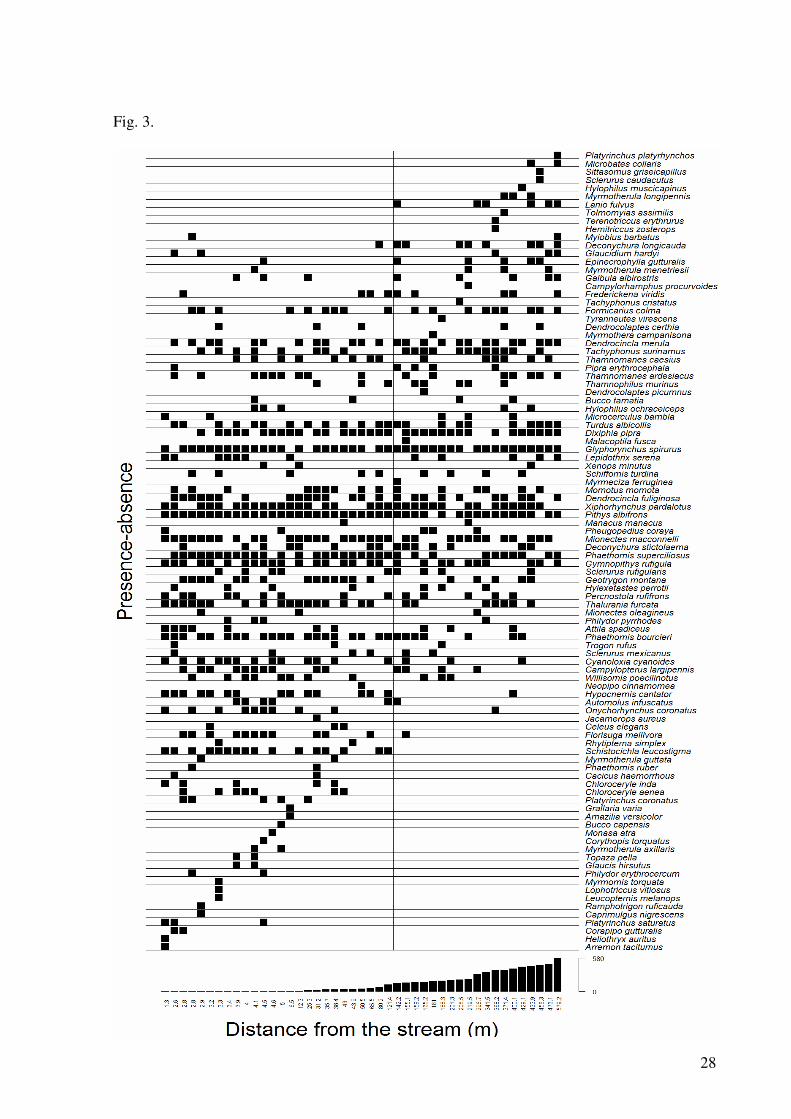
Based on the distance from the stream at which qualitative composition showed a
distinct turnover, we consider riparian plots to be those within 140 m of streams and non-
riparian plots to be all others. Using this criterion, 26 of all 45 plots were in the riparian zone
and 19 in the non-riparian zone (Fig. 3). More species were captured in riparian plots (n = 81)
than in non-riparian plots (n = 69; t = 2.769, d.f. = 43, P = 0.008). Most species (n = 52) were
captured in both riparian and non-riparian plots. The number of species captured per riparian
plot was greater than the number per plot captured exclusively in non-riparian plots (t =
3.334, d.f. = 60.981, P = 0.001). The number of individuals captured was also greater in
riparian plots than in non-riparian plots (t = 3.979, d.f. = 43, P < 0.001).
For the ordination of quantitative data from the 30 evenly spaced plots, a single
NMDS axis explained 45% of the variation in the matrix of original distances between plots.
Clay content and slope are not highly correlated (rs = – 0.096, P = 0.612) and were used in a
multiple regression model. Together, the two variables predicted 14% of the variation in
scores on the NMDS axis (quantitative composition = 0.143 – 0.004clay + 0.002slope, r² =
0.14, d.f. = 27, P = 0.049). Variation in scores on the NMDS axis was related to clay content
(t = 2.508, d.f. = 27, P = 0.018), but was independent of slope (t = 0.198, d.f. = 27, P =
0.845).
For the ordination of qualitative data from the 30 evenly spaced plots, a single NMDS
axis explained 35% of the variation in the matrix of original distances between plots. Both
clay content (t = 0.753, d.f. = 27, P = 0.458) and slope (t = 0.677, d.f. = 27, P = 0.504) were
not related to variation in scores on the NMDS axis (r² = – 0.04, d.f. = 27, P = 0.653).
13
Discussion
Understory bird assemblages in sites closer to streams were more diverse overall and had
more habitat-restricted species than those farther from streams. More birds were captured at
sites closer to streams, and both quantitative and qualitative compositions were distinct from
assemblages farther from streams. These patterns are similar to those documented for bird
assemblages in riparian and non-riparian zones throughout the world (Woinarski et al. 2000;
Catterall et al. 2001; Bub, Flaspohler & Huckins 2004; Palmer & Bennett 2006; Lehmkuhl et
al. 2007; Chan et al. 2008), and confirm that riparian zones play an important role in
maintaining regional biodiversity (Naiman, Décamps & Pollock 1993).
Previous studies comparing bird assemblages in riparian and non-riparian zones used
arbitrarily defined thresholds between these two habitat types. Riparian zones have been
defined as anywhere from the stream banks themselves to 30 m, while non-riparian zones
have been proposed at anywhere between 100 and 750 m from streams (Catterall et al. 2001;
Bub, Flaspohler & Huckins 2004; Palmer & Bennett 2006; Lehmkuhl et al. 2007; Chan et al.
2008). Although all of these studies report differences between sites that are very close to
streams and sites that are distant from them, a rigorous comparison of riparian and non-
riparian zones is difficult without a standard definition of the size of the riparian zone.
The distribution of species along a given environmental gradient may reflect changes
in factors correlated with that gradient (Whittaker 1972). The distribution of understory birds
along the gradient of increasing distance from the stream was related to clay content but not
with slope. In Reserva Ducke, distance from the stream is correlated with clay content but not
with slope. Earlier studies in Reserva Ducke have shown that plant species composition is
related to clay content (Costa, Magnusson & Luizão 2005; Costa et al. 2008). However, the
effect of clay content should be due to its correlation with distance from the stream, since
distance from the stream (Drucker, Costa & Magnusson 2008) and soil moisture (Catterall et

14
al. 2001) were also found to be related to plant species composition. Vegetation is an
important determinant of bird species composition (Rotenberry 1985; Lee & Rotenberry
2005; Fleishman et al. 2003). A relationship between bird species composition and clay
content documented in a tropical savanna in Australia, for example, was more likely driven by
changes in vegetation structure (which varied with soil texture) than by intrinsic soil
characteristics themselves (Woinarski, Fisher & Milne 1999). Moreover, in a subtropical
eucalypt forest in Australia, where plant species composition was independent of clay content,
bird species composition was not related to clay content (Catterall et al. 2001).
Bird species may respond differently to the gradient of distance from the stream. Some
species, such as Schistocichla leucostigma (Willis 1977), are more associated with streams,
while others, such as Willisornis poecilinotus (Cintra & Cancelli 2008), are more often found
away from streams. However, the distributions of many species, such as Dendrocincla
fuliginosa and D. merula (Cintra, Maruoka & Naka 2006), are independent of distance from
the stream. At the community level, distributional patterns of birds with regard to distance
from the stream are comparable in studies carried out in temperate (Bub, Flaspohler &
Huckins 2004; Lehmkuhl et al. 2007) and tropical regions (Palmer & Bennett 2006; Chan et
al. 2008). This indicates that distance from the stream itself may exercise an effect on bird
species distributions, rather than specific local effects, such as changes in soil. Areas close to
streams have more insects and consequently attract more insectivorous birds (Iwata, Nakano
& Murakami 2003; Chan et al. 2008). In addition, species, such as kingfishers (Chloroceryle
aenea and C. inda), depend on streams for the fish they eat. However, it is difficult to
untangle the effects of distance from the stream itself from the effects of environmental
variables correlated with that gradient (see Catterall et al. 2001). Studies carried out in
discretely defined habitats complicate the interpretation of the individual effects of correlated
variables, while studies carried out in continuously defined habitats allow for more detailed
15
interpretations, since correlated variables may vary in different ways along a given
environmental gradient. Since measures to protect riparian zones are based on distance from
the stream, more studies are needed to clarify the effects of distance per se on bird community
structure.
IMPLICATIONS FOR CONSERVATION
Understanding how biological communities vary at increasing distances from the stream is
vital for designing effective conservation strategies, because preserving strips of riparian
vegetation is one of the most commonly used conservation strategies (Marczak et al. 2010). It
is difficult to establish a single riparian strip that protects all species associated with riparian
zones, because the optimal width may vary among streams and taxonomic groups (Spackman
& Hughes 1995). In order to determine the width of the riparian strip to be protected it is
important to consider the specific community attributes used to define the strip which species
recognize as riparian (as in this study) as well as the width of the stream (Drucker, Costa &
Magnusson 2008).
In Brazil, the strips of riparian vegetation required by law to be retained vary with
river size. For streams or rivers less than 10 m wide, mandated strips are 30 m wide. The
Brazilian forestry code (law nº 4.771/65) has established permanent protection areas (APPs)
in order to “protect hydrological resources and the surrounding landscape, as well as
geological stability, biodiversity, and the gene flow of plants and animals, in addition to
preserving soils and assuring the well-being of human populations”. Studies carried out in
Reserva Ducke, where streams are typically less than 10 m wide, have shown that this 30 m
definition is too small to protect understory herbs (Drucker, Costa & Magnusson 2008),
snakes (Fraga 2009) and understory birds (this study) associated with riparian zones.
16
The most efficient width of a riparian strip for protecting riparian-associated species
depends on the adjacent vegetation (Peak & Thompson III 2006) and on the edge effects that
influence populations in riparian zones (Marczak et al. 2010). In addition, the specific
community attribute used to determine the width of the strip which species recognize as
riparian can affect estimates of that width. Since common species tend to occur widely, and
are thus poor indicators of specific assemblages (Strong & Bock 1990), qualitative
composition may be a more useful attribute for quantifying the distances to which riparian-
associated species assemblages extend.
Given that edge effects can extend 30-60 m into riparian zones (Brosofske et al. 1997),
and given that the effect of distance from the stream on qualitative composition extended for
140 m in this study, we hypothesize that 170-200 m are needed to protect understory birds in
the Reserva Ducke. This distance is more than five times the current width for protection of
riparian areas as defined by Brazilian environmental legislation. In 2010, the Brazilian
parliament is considering modifications of the law that would reduce the width of the
protected strips for small stream less than 5 m wide to 15 m. If Brazilian environmental
legislation is to effectively protect biodiversity associated with riparian zones, either the width
of APPs must be increased considerably, or APPs must be contiguous with other conservation
units.
Acknowledgments
We thank INPA staff and the Ducke guards for logistic support. Bruno Henrique Grolli
Carvalho, Andressa Barbara Scabin, Robson Disarz and the field assistants who helped in the
field, and Mario Cohn-Haft and Erik Johnson who helped identify species. ASB thanks the
people that were at Reserva Ducke for the time enjoyed together during the fieldwork,
especially Cíntia Gomes de Freitas and Carlos Eduardo Barbosa. We are grateful to the
17
researchers who provided data regarding distance from the stream, clay content, and slope,
and to Cristian de Sales Dambros for his valuable help with statistical analyses. We also thank
the researchers that evaluated ASB’s MSc thesis plan and an early version of this manuscript.
The bird bands used in this study were supplied by the Centro Nacional de Pesquisa para
Conservação das Aves Silvestres (CEMAVE). ASB was supported by a scholarship from
Coordenação de Aperfeiçoamento de Pessoal de Nível Superior (CAPES). This study was
financed by the Brazilian Biodiversity Research Program (PPBio).
References
Aguiar, N.O., Gualberto, T.L. & Franklin, E. (2006) A medium-spatial scale distribution
pattern of Pseudoscorpionida (Arachnida) in a gradient of topography (altitude and
inclination), soil factors, and litter in a central Amazonia forest reserve, Brazil. Brazilian
Journal of Biology, 66, 791–802.
Banks-Leite, C. & Cintra, R. (2008) The heterogeneity of Amazonian treefall gaps and bird
community composition. Ecotropica, 14, 1–13.
Bohlman, S.A., Laurance, W.F., Laurance, S.G., Nascimento, H.E.M., Fearnside, P.M. &
Andrade, A. (2008) Importance of soils, topography and geographic distance in structuring
central Amazonian tree communities. Journal of Vegetation Science, 19, 863–874.
Brosofske, K.D., Chen, J., Naiman, R.J. & Franklin, J.F. (1997) Harvesting effects on
microclimatic gradients from small streams to uplands in western Washington. Ecological
Applications, 7, 1188–1200.
18
Bub, B.R., Flaspohler, D.J. & Huckins, C.J.F. (2004) Riparian and upland breeding-bird
assemblages along headwater streams in Michigan’s Upper Peninsula. Journal of Wildlife
Management, 68, 383–392.
Castilho, C.V. de, Magnusson, W.E., Araújo, R.N.O. de, Luizão, R.C.C., Luizão, F.J., Lima,
A.P. & Higuchi, N. (2006) Variation in aboveground tree live biomass in a central Amazonian
Forest: effects of soil and topography. Forest Ecology and Management, 234, 85–96.
Catterall, C.P., Piper, S.D., Bunn, S.E. & Arthur, J.M. (2001) Flora and fauna vary with local
topography in a subtropical eucalypt forest. Austral Ecology, 26, 56–69.
CBRO (Comitê Brasileiro de Registros Ornitológicos) (2009) Listas das aves do Brasil.
Version 9/8/2009. Available on www.cbro.org.br, accessed 2/3/2010.
Cintra, R. (2008) Aves. Reserva Ducke: a biodiversidade amazônica através de uma grade
(eds M.L. Oliveira, F.B. Baccaro, R. Braga-Neto & W.E. Magnusson), pp. 77–85. Áttema
Design Editorial, Manaus, Amazonas, Brasil.
Cintra, R. & Cancelli, J. (2008) Effects of forest heterogeneity on occurrence and abundance
of the scale-backed antbird, Hylophylax poecilinotus (Aves: Thamnophilidae), in the Amazon
forest. Revista Brasileira de Zoologia, 25, 630–639.
Cintra, R., Maruoka, A.E. & Naka, L.N. (2006) Abundance of two Dendrocincla
woodcreepers (Aves: Dendrocolaptidae) in relation to forest structure in Central Amazonia.
Acta Amazonica, 36, 209–220.
19
Chan, E.K.W., Yu, Y.T., Zhang, Y. & Dudgeon, D. (2008) Distribution patterns of birds and
insect prey in a tropical riparian forest. Biotropica, 40, 623–629.
Chauvel, A., Lucas, Y. & Boulet, R. (1987) On the genesis of the soil mantle of the region of
Manaus, Central Amazonia, Brazil. Experientia, 43, 234–241.
Cohn-Haft, M., Whittaker, A. & Stouffer, P.C. (1997) A new look at the "species-poor"
central Amazon: the avifauna north of Manaus, Brazil. Ornithological Monographs, 48, 205–
235.
Costa, F.R.C., Magnusson, W.E. & Luizão, R.C. (2005) Mesoscale distribution patterns of
Amazonian understory herbs in relation to topography, soil and watersheds. Journal of
Ecology, 93, 863–878.
Costa, F.R.C., Jean-Louis, G., Lima, A.P. & Pereira, O.S. (2008) Gradients within gradients:
the mesoscale distribution patterns of palms in a central Amazonian forest. Journal of
Vegetation Science, 20, 69–78.
Drucker, D.P., Costa, F.R.C. & Magnusson, W.E. (2008) How wide is the riparian zone of
small streams in tropical forests? A test with terrestrial herbs. Journal of Tropical Ecology,
24, 65–74.
Fleishman, E., Mcdonal, N., Nally, R.M., Murphy, D.D., Walters, J. & Floyd, T. (2003)
Effects of floristics, physiognomy and non-native vegetation on riparian bird communities in
a Mojave Desert watershed. Journal of Animal Ecology, 72, 484–490.
20
Fraga, R. de (2009) A influência de fatores ambientais sobre padrões de distribuição espacial
de comunidades de serpentes em 25 km2 de floresta de terra firme na Amazônia Central. MSc
thesis, Instituto Nacional de Pesquisas da Amazônia, Manaus, Amazonas, Brazil.
Iwata, T., Nakano, S. & Murakami, M. (2003) Stream meanders increase insectivorous bird
abundance in riparian deciduous forests. Ecography, 26, 325–337.
Jankowski, J.E., Ciecka, A.L., Meyer, N.Y. & Rabenold, K.N. (2009) Beta diversity along
environmental gradients: implications of habitat specialization in tropical montane
landscapes. Journal of Animal Ecology, 78, 315–327.
Keller, A., Rödel, M.O., Linsenmair, K.E. & Grafe, T.U. (2009) The importance of
environmental heterogeneity for species diversity and assemblage structure in Bornean stream
frogs. Journal of Animal Ecology, 78, 305–314.
Keyes, B.E. & Grue, C.E. (1982) Capturing birds with mist nets: a review. North American
Bird Bander, 7, 2–14.
Kinupp, V.F. & Magnusson, W.E. (2005) Spatial patterns in the understorey shrub genus
Psychotria in central Amazonia: effects of distance and topography. Journal of Tropical
Ecology, 21, 363–374.
Lee, P.Y. & Rotenberry, J.T. (2005) Relationships between bird species and tree species
assemblages in forested habitats of eastern North America. Journal of Biogeography, 32,
1139–1150.

21
Lehmkuhl, J.F., Burger, E.D., Drew, E.K., Lindsey, J.P., Haggard, M. & Woodruff, K.Z.
(2007) Breeding birds in riparian and upland dry forests of the Cascade Range. Journal of
Wildlife Management, 71, 2632–2643.
MacArthur R.H. & MacArthur J.W. (1961) On bird species diversity. Ecology, 42, 594–598.
Magnusson, W.E., Lima, A.P., Luizão, R., Luizão, F., Costa, F.R.C., Castilho, C.V. de &
Kinupp, V.F. (2005) RAPELD: a modification of the Gentry method for biodiversity surveys
in long-term ecological research sites. Biota Neotropica, 5, 1–6.
Marczak, L.B., Sakamaki, T., Turvey, S.L., Deguise, I., Wood, S.L.R. & Richardson, J.S.
(2010) Are forested buffers an effective conservation strategy for riparian fauna? An
assessment using meta-analysis. Ecological Applications, 20, 126–134.
Marques Filho, A.O., Ribeiro, M.N.G., Santos, H.M. & Santos, J.M. (1981) Estudos
climatológicos da Reserva Florestal Ducke – Manaus-AM. IV. Precipitação. Acta Amazonica,
11, 759–768.
McCune, B. & Grace, J.B. (2002) Analysis of ecological communities. MjM Software
Design, Gleneden Beach, Oregon, USA.
Naiman, R.J., Décamps, H. & Pollock, M. (1993) The role of riparian corridors in maintaining
regional biodiversity. Ecological Applications, 3, 209–212.
22
Naka, L.N. (2004) Structure and organization of canopy bird assemblages in Central
Amazonia. The Auk, 121, 88–102.
Palmer, G.C. & Bennett, A.F. (2006) Riparian zones provide for distinct bird assemblages in
forest mosaics of south-east Australia. Biological Conservation, 130, 447–457.
Peak, R.G. & Thompson III, F.R. (2006) Factors affecting avian species richness and density
in riparian areas. Journal of Wildlife Management, 70, 173–179.
Poulsen, A.D., Tuomisto, H. & Balslev, H. (2006) Edaphic and floristic variation within a 1-
ha plot of lowland Amazonian rain forest. Biotropica, 38, 468–478.
Restall, R., Rodner, C. & Lentino, M. (2007) Birds of northern South America: an
identification guide. Volume 2: plates and maps. Yale University Press, New Haven,
Connecticut, USA.
Ribeiro, J.E.L.S., Hopkins, M.J.G., Vicentini, A., Sothers, C.A., Costa, M.A.S., Brito, J.M.,
Souza, M.A.D., Martins, L.H.P., Lohmann, L.G., Assunção, P.A.C.L., Pereira, E.C., Silva,
C.F., Mesquita, M.R. & Procópio, L.C. (1999) Flora da Reserva Ducke. Guia de
identificação das plantas vasculares de uma floresta de terra firme na Amazônia Central.
Editora INPA, Manaus, Amazonas, Brazil.
Rotenberry, J.T. (1985) The role of habitat in avian community composition: physiognomy or
floristics? Oecologia, 67, 213–217.

23
Rotenberry, J.T. & Wiens, J.A. (1980) Habitat structure, patchiness, and avian communities in
North American steppe vegetation: a multivariate analysis. Ecology, 61, 1228–1250.
Schemske, D.W. & Brokaw, N. (1981) Treefalls and the distribution of understory birds in a
tropical forest. Ecology, 62, 938–945.
Sioli, H. (1991) Amazônia: fundamentos da ecologia da maior região de florestas tropicais.
Editora Vozes, Petrópolis, Rio de Janeiro, Brazil.
Sonderegger, D.L., Wang, H., Clements, W.H. & Noon, B.R. (2009) Using SiZer to detect
thresholds in ecological data. Frontiers in Ecology and the Environment, 7, 190–195.
Spackman, S.C. & Hughes, J.W. (1995) Assessment of minimum stream corridor width for
biological conservation: species richness and distribution along mid-order streams in
Vermont. USA. Biological Conservation, 71, 325–332.
Strong, T.R. & Bock, C.E. (1990) Bird species distribution patterns in riparian habitats in
southeastern Arizona. The Condor, 92, 866–885.
Toms, J. D. & Lesperance, M.L. (2003) Piecewise regression: a tool for identifying ecological
thresholds. Ecology, 84, 2034–2041.
Tuomisto, H., Ruokolainen, K., Kalliola, R., Linna, H., Danjoy, W. & Rodriguez, T. (1995)
Dissecting Amazonian biodiversity. Science, 269, 63–66.
24
Whittaker, R.H. (1972) Evolution and measurement of species diversity. Taxon, 21, 213–251.
Willis, E.O. (1977) Lista preliminar das aves da parte noroeste e áreas vizinhas da Reserva
Ducke, Amazonas, Brasil. Revista Brasileira de Biologia, 37, 585–601.
Woinarski, J.C.Z., Fisher, A. & Milne, D. (1999) Distribution patterns of vertebrates in
relation to an extensive rainfall gradient and soil variation in the tropical savannas of the
Northern Territory, Australia. Journal of Tropical Ecology, 15, 381–398.
Woinarski, J.C.Z., Brock, C., Armstrong, M., Hempel, C., Cheal, D. & Brennan, K. (2000)
Bird distribution in riparian vegetation in the extensive natural landscape of Australia’s
tropical savanna: a broad-scale survey and analysis of a distributional data base. Journal of
Biogeography, 27, 843–868.

25
Figure legends
Fig. 1. Topography and streams at the study area in the Reserva Ducke, showing the trails and
plots of the RAPELD sampling grid. White dots indicate the location of the evenly distributed
plots and yellow dots indicate riparian plots. The lighter regions indicate lower areas, whereas
darker regions indicate the highest areas. Modified from Ribeiro et al. (1999).
Fig. 2. Effects of distance from the stream on (a) quantitative and (b) qualitative composition
of understory birds in the Reserva Ducke.
Fig. 3. Occurrence of understory bird species in relation to distance from the stream in 45
plots in the Reserva Ducke. The vertical line indicates the estimated distance from the stream
up to which streams influence species qualitative composition.

26
Figures
Fig. 1.
27
Fig. 2.
28
Fig. 3.

29
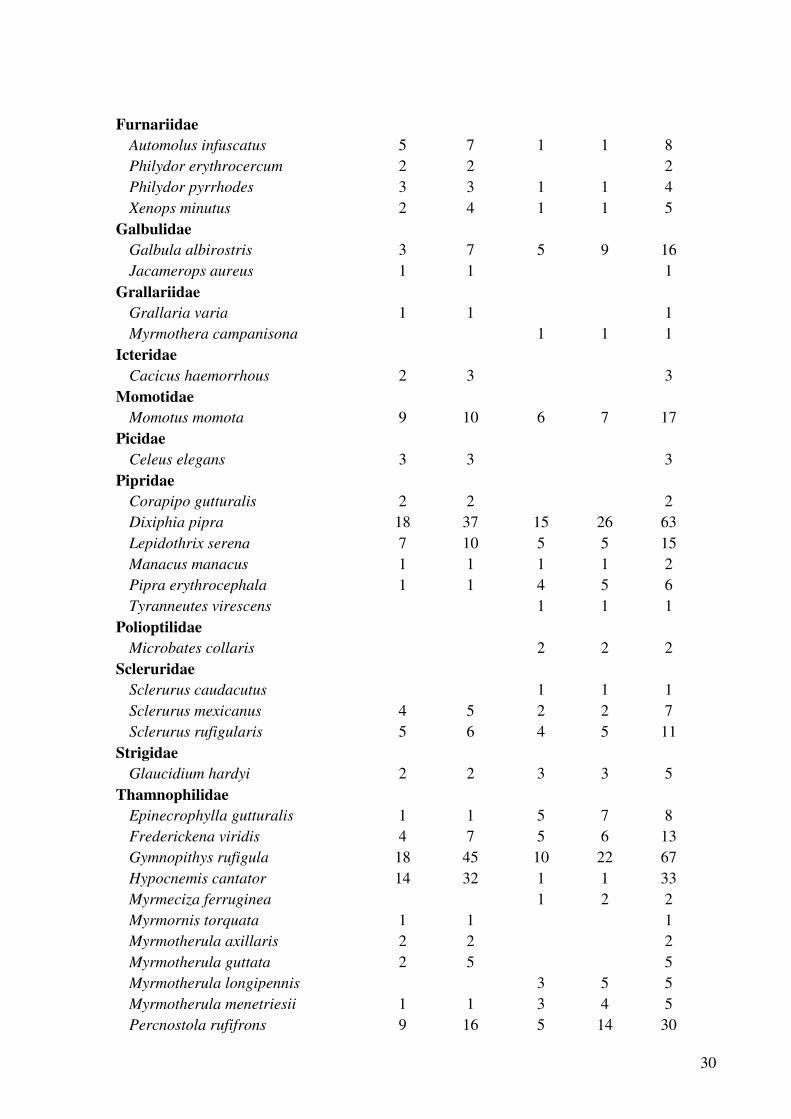
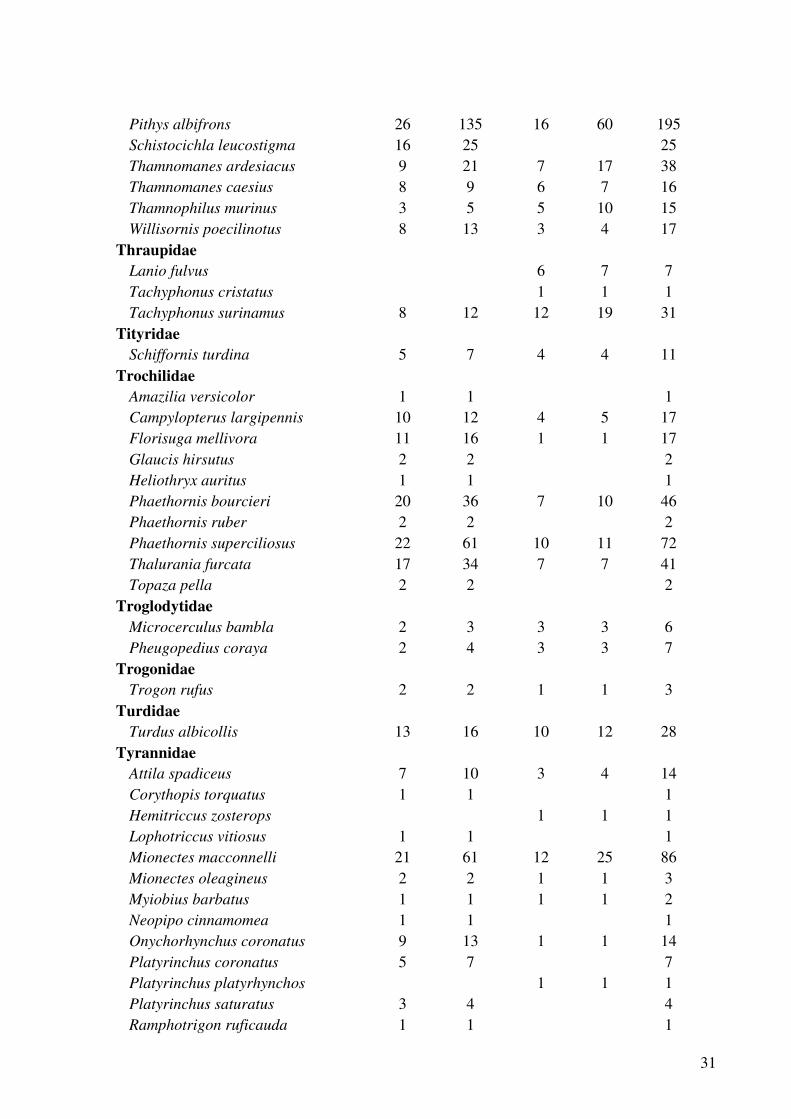
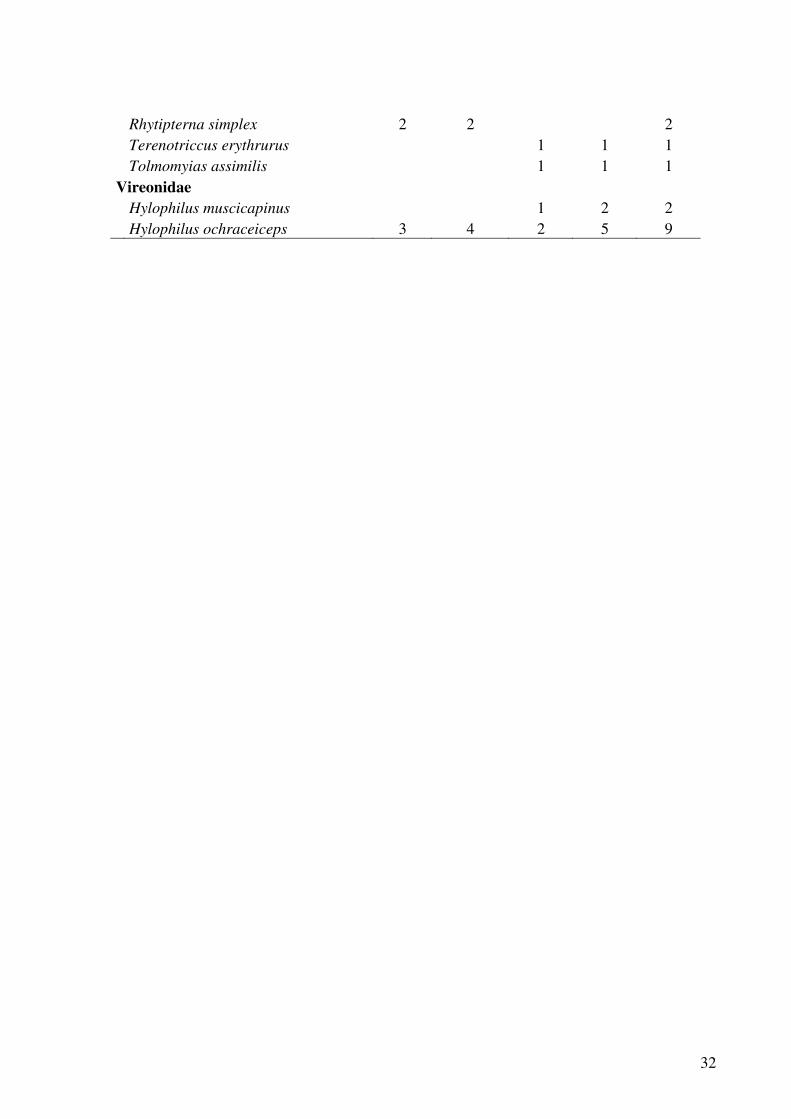
Table 1. List of understory bird species recorded in the Reserva Ducke, Manaus, Brazil. OR =
number of riparian plots where the species was recorded (n = 26), TR = total number of
individuals captured in riparian plots, OU = number of non-riparian plots where the species
was recorded (n = 19), TU = total number of individuals captured in non-riparian plots, T =
total number of individuals captured, summed over riparian and non-riparian plots (n = 45).
Species names follow CBRO (2009).
Species OR TR OU TU T Accipitridae Leucopternis melanops 1 1 1 Alcedinidae Chloroceryle aenea 7 7 7 Chloroceryle inda 5 5 5 Bucconidae Bucco capensis 1 1 1 Bucco tamatia 2 2 2 2 4 Malacoptila fusca 1 1 1 Monasa atra 1 1 1 Caprimulgidae Caprimulgus nigrescens 1 1 1 Cardinalidae Cyanoloxia cyanoides 13 20 3 3 23 Columbidae Geotrygon montana 14 20 5 8 28 Dendrocolaptidae Campylorhamphus procurvoides 1 1 1 Deconychura longicauda 1 1 8 12 13 Deconychura stictolaema 8 10 7 8 18 Dendrocincla fuliginosa 15 21 10 22 43 Dendrocincla merula 12 21 13 20 41 Dendrocolaptes certhia 3 3 2 2 5 Dendrocolaptes picumnus 1 1 1 Glyphorynchus spirurus 22 67 18 46 113 Hylexetastes perrotii 4 5 3 4 9 Sittasomus griseicapillus 1 1 1 Xiphorhynchus pardalotus 19 39 14 25 64 Emberizidae Arremon taciturnus 1 2 2 Formicariidae Formicarius colma 9 11 9 13 24
30
Furnariidae Automolus infuscatus 5 7 1 1 8 Philydor erythrocercum 2 2 2 Philydor pyrrhodes 3 3 1 1 4 Xenops minutus 2 4 1 1 5 Galbulidae Galbula albirostris 3 7 5 9 16 Jacamerops aureus 1 1 1 Grallariidae Grallaria varia 1 1 1 Myrmothera campanisona 1 1 1 Icteridae Cacicus haemorrhous 2 3 3 Momotidae Momotus momota 9 10 6 7 17 Picidae Celeus elegans 3 3 3 Pipridae Corapipo gutturalis 2 2 2 Dixiphia pipra 18 37 15 26 63 Lepidothrix serena 7 10 5 5 15 Manacus manacus 1 1 1 1 2 Pipra erythrocephala 1 1 4 5 6 Tyranneutes virescens 1 1 1 Polioptilidae Microbates collaris 2 2 2 Scleruridae Sclerurus caudacutus 1 1 1 Sclerurus mexicanus 4 5 2 2 7 Sclerurus rufigularis 5 6 4 5 11 Strigidae Glaucidium hardyi 2 2 3 3 5 Thamnophilidae Epinecrophylla gutturalis 1 1 5 7 8 Frederickena viridis 4 7 5 6 13 Gymnopithys rufigula 18 45 10 22 67 Hypocnemis cantator 14 32 1 1 33 Myrmeciza ferruginea 1 2 2 Myrmornis torquata 1 1 1 Myrmotherula axillaris 2 2 2 Myrmotherula guttata 2 5 5 Myrmotherula longipennis 3 5 5 Myrmotherula menetriesii 1 1 3 4 5 Percnostola rufifrons 9 16 5 14 30
31
Pithys albifrons 26 135 16 60 195 Schistocichla leucostigma 16 25 25 Thamnomanes ardesiacus 9 21 7 17 38 Thamnomanes caesius 8 9 6 7 16 Thamnophilus murinus 3 5 5 10 15 Willisornis poecilinotus 8 13 3 4 17 Thraupidae Lanio fulvus 6 7 7 Tachyphonus cristatus 1 1 1 Tachyphonus surinamus 8 12 12 19 31 Tityridae Schiffornis turdina 5 7 4 4 11 Trochilidae Amazilia versicolor 1 1 1 Campylopterus largipennis 10 12 4 5 17 Florisuga mellivora 11 16 1 1 17 Glaucis hirsutus 2 2 2 Heliothryx auritus 1 1 1 Phaethornis bourcieri 20 36 7 10 46 Phaethornis ruber 2 2 2 Phaethornis superciliosus 22 61 10 11 72 Thalurania furcata 17 34 7 7 41 Topaza pella 2 2 2 Troglodytidae Microcerculus bambla 2 3 3 3 6 Pheugopedius coraya 2 4 3 3 7 Trogonidae Trogon rufus 2 2 1 1 3 Turdidae Turdus albicollis 13 16 10 12 28 Tyrannidae Attila spadiceus 7 10 3 4 14 Corythopis torquatus 1 1 1 Hemitriccus zosterops 1 1 1 Lophotriccus vitiosus 1 1 1 Mionectes macconnelli 21 61 12 25 86 Mionectes oleagineus 2 2 1 1 3 Myiobius barbatus 1 1 1 1 2 Neopipo cinnamomea 1 1 1 Onychorhynchus coronatus 9 13 1 1 14 Platyrinchus coronatus 5 7 7 Platyrinchus platyrhynchos 1 1 1 Platyrinchus saturatus 3 4 4 Ramphotrigon ruficauda 1 1 1
32
Rhytipterna simplex 2 2 2 Terenotriccus erythrurus 1 1 1 Tolmomyias assimilis 1 1 1 Vireonidae Hylophilus muscicapinus 1 2 2 Hylophilus ochraceiceps 3 4 2 5 9
33
Conclusões
• A estimativa da largura da zona ripária não depende apenas do local do estudo, do
grupo taxonômico ou da largura do riacho, mas também do atributo da comunidade
considerado. A composição qualitativa de espécies provavelmente é o atributo da
comunidade mais útil para estabelecer a distância em relação ao riacho que delimita a
assembléia de espécies associadas a zonas ripárias.
• A distribuição de aves de sub-bosque esteve relacionada com a distância do riacho e
com o conteúdo de argila, mas não esteve relacionada com a inclinação do terreno.
Apesar de distância do riacho apresentar correlação com o conteúdo de argila na
Reserva Ducke, o padrão de distribuição de aves em locais próximos e afastados do
riacho é consistente entre estudos realizados em diversas geomorfologias, tanto em
regiões temperadas quanto em regiões tropicais, o que indica um efeito da distância do
riacho per se.
• Para que o Código Florestal brasileiro seja eficiente em cumprir o seu papel de
proteger a biodiversidade associada a zonas ripárias, a largura das Áreas de
Preservação Permanente (APPs) deve ser aumentada consideravelmente ou as APPs
devem ser associadas de forma contígua a outras áreas de conservação.
34
Apêndices
35
36

37
38