departamento de ciÊncias da vida¡cido... · departamento de ciÊncias da vida faculdade de...
TRANSCRIPT

DEPARTAMENTO DE CIÊNCIAS DA VIDA
FACULDADE DE CIÊNCIAS E TECNOLOGIA UNIVERSIDADE DE COIMBRA
Characterization of human umbilical cord matrix mesenchymal stem cells isolated and cultured on tunable hydrogel-based platforms
Plácido Júnio da Paixão Pereira
2013
Dissertação apresentada à Universidade de Coimbra para cumprimento dos requisitos necessários à obtenção do grau de Mestre em Biologia Celular e Molecular, realizada sob a orientação científica do Doutor Mário Grãos (Biocant) e do Professor Doutor Carlos Jorge Alves Miranda Bandeira Duarte (Universidade de Coimbra)
Este trabalho é financiado por Fundos FEDER através do Programa Operacional Fatores de Competitividade – COMPETE e por Fundos Nacionais através da FCT – Fundação para a Ciência e a Tecnologia no âmbito do projeto FCOMP-01-0124-FEDER-021150 (referência FCT: PTDC/SAU-ENB/119292/2010)

i
Agradecimentos / Acknowledgements
Primeiro de tudo gostaria de agradecer ao meu primeiro orientador Mário Grãos por
toda a sua predesposição a ajudar e orientar durante todo o projecto, por todo o apoio
que me deu e pela paciência e compreensão que teve comigo durante o ultimo ano.
Em segundo eu gostaria de agradecer às minhas colegas do laboratório Tânia Loureiro,
Manuela Lago e Catarina Domingues por toda a ajuda que me deram durante o ultimo
ano e por terem sido umas excelentes amigas e colegas, especialmente a Tânia e à sua
paciência.
Gostaria de agradecer ao Professor Carlos Duarte por ter aceite participar no projecto
enquanto orientador mesmo que para isso tivesse de se deslocar de Cantanhede a
Coimbra.
Queria agradecer ao principais financiadores deste projecto sem os quais não teria
sido possivel nomeadamente à FEDER através do Programa Operacional Fatores de
Competitividade – COMPETE e à FCT – Fundação para a Ciência e a Tecnologia no
âmbito do projeto FCOMP-01-0124-FEDER-021150 (referência FCT: PTDC/SAU-
ENB/119292/2010)
Queria ainda agradecer à Crioestaminal Saúde e Tecnologia S.A. pelas amostras de
cordões umbilicais e às suas duas funcionárias regulares do laboratório de Biologia
Celular Ana e Sofia pelas infindavéis horas que conversamos na sala de cultura
Queria também agradecer ao Dr. Artur Paiva e ao Tiago Carvalheiro do CHC pela ajuda
na caracterização fenótipica das MSCs e ao Professor Lopes da Silva da universidade de
Aveiro pela ajuda na caracterização dos hidrogéis de poliacrilamida.
Queria ainda agradecer a todo o pessoal do Biocant que me ajudou e me apoiou,
nomeadamente à Susana, ao Grilo, a Catarina, ao João, Curto, Rita e Ana Sofia.

ii
Queria agradecer à minha namorada Juliana pela paciencia e compreensão que teve
comigo assim como pelo seu apoio durante estes ultimos 2 anos de mestrado os quais
sem a sua companhia teriam sido muito mais dificéis.
Queria agredecer finalmente a minha familia principalmente ao meu Pai e a minha
Mãe por todo o apoio que me deram a todos os niveís e que sem eles nada disto teria
sido possivel
iii
Abstract
It is described that Mesenchymal Stem Cells (MSCs) are extremely responsive to
modulation by mecanotransduction (Chen, 2008; Eyckmans et al., 2011; Moore et al.,
2010), namely by expressing typical lineage-specific genes when cultured in vitro on
substrates with mechanical properties similar to those of the target tissues. Namely,
MSCs express neural genes when cultured on substrates compliant with neural tissues
(1-10 kPa) (Engler et al., 2006). It has also been described that these cells seem to
retain some memory related to the stiffness of the substrates in which they were
previously cultured on (Tse et al., 2011).
Typically, MSCs are isolated and cultured on polystyrene culture dishes (Tse et al.,
2011) and eventually transferred onto compliant substrates after several passages to
assess their plasticity in terms of lineage-specific expression markers, as reported in
case of osteogenic-, myogenic- or neural-like commitment (Engler et al., 2006).
Nevertheless, MSCs might retain memory (Tse et al., 2011) from the extremely high
stiffness of polystyrene, possibly restraining their full potential in terms of lineage
commitment.
It is of interest to understand what would be the effect of isolating MSCs directly on
substrates with stiffness similar to that of neural tissues in terms of their potential to
express neural markers. We propose to isolate and culture human umbilical cord
matrix MSCs directly on softer substrates, namely hydrogels compliant with neural
tissue (1 to 10KPa). As a control, part of the umbilical cord matrix of every sample will
be used to isolate MSCs using normal tissue-culture polystyrene plates (the typical
isolation and culture protocol) (Secco et al., 2008) and then transferred onto similar
hydrogels after several passages on polystyrene (P1-P5), to address if prolonged
culture on hard polystyrene is restraining their capacity to express neural markers later
on. To promote the attachment of MSCs onto the hydrogels for isolation and culture,
these will be covalently functionalized with collagen (Engler et al., 2006) and
Fibronectin.
We optimized a new hMSCs isolation protocol for MSCs from UCM, allowing us to
obtain naive hMSCs with a more homogenous population when compared to the
isolation in TCPs. The PA hydrogels used for the isolation are commonly used in
mechanotransduction experiments, but neither this specific formulation neither the

iv
isolation of hUCM-MSCs was ever done before in PA hydrogels to the best of our
knowledge. We can conclude that FN together with substrate stiffness have an
important role in the initial proliferation impulse of hMSCs when cultured on soft
substrates, namely at 10kPa (Figure 17). Preliminary results (Figure 18, 19 and Table III)
show what appears to be a more naive and more homogenous population of hMSCs
isolated and cultured on the PA hydrogels. Finally, it seems that neural markers (B-III
tubulin, Nestin, O4 and GFAP) are more expressed in differentiating hMSCs plated on
soft hydrogels than on plastic for hMSCs expanded for 5 passages on plastic. In terms
of hMSCs isolated exclusively on PA hydrogels, the differences between these and
hMSCs isolated on plastic were very evident, but O4 seems to be more expressed in
cells isolated on soft PA hydrogels.
Key words: MSCs, oligodendroglia, mecanotransduction, matrix elasticity, lineage
specification, differentiation.
.
v
Resumo
Está descrito que as células mesenquimais estaminais (MSCs) são extremamente
reactivas à modulação por mecanotransdução (Chen, 2008; Eyckmans et al., 2011;
Moore et al., 2010), nomeadamente através da expressão tipica de genes especificos
da linhagem de certos tecidos quando cultivados in vitro em substratos com
propriedades mecanicas similares ás dos mesmos. Nomeadamente, as MScs quando
cultivadas em substratos com rigídez semelhante a dos tecidos neuronais (1-10 kPa)
expressam genes neuronais (Engler et al., 2006)Também tem sido discrito que estas
células parecem reter algum tipo de memoria relacionada com a rigídez dos subtratos
em que estiveram cultivadas (Tse et al., 2011).
Normalmente as MSCs são isoladas e cultivadas em placas de cultura de poliestireno e
so depois de vários passagens transferidas para substratos apropriados para
determinar a sua pasticidade em termos de expressão de marcadores de linhagem
celular especifica , como já descrito nos casos de “compromisso” dos tipos osteogénico,
miogénico e neurogénico (Engler et al., 2006).
No entanto, as MSCs podem reter alguma “memoria” do contacto anterior com o
poliestireno de rigidez extremamente alta quando comparada a de tecidos humanos,
possivelmente diminuindo o potencial em termos de diferenciação (em termos de
compromisso com as diferentes linhagens celulares).
É do nosso interesse perceber quais serão os efeitos de isolar as MSCs directamente
em substratos com rigidez similar a dos tecidos neuronais em termos do seu potencial
para expressar marcadores neuronais. Propomos então isolar e cultivar MSCs da matriz
do cordão umbilical humano (hUCM) directamente em substratos mais moles,
nomeadamente, hidrogéis semelhantes em rigidez ao tecido neuronal (1 a 10 kPa).
Como control parte da matriz do cordão umbilical de cada amostra irá ser usado para
isolar MSCs usando o protocolo base em placas de cultura de tecidos de poliestireno
(TCPs) (Secco et al., 2008) sendo depois transferidas para hidrogéis similares após
algumas passagens em poliestireno (P1-P5), para verificar se a cultura prolongada em
poliestireno rigo é um factor de restrição na sua capacidade de expressar marcadores
neuronais após a cultura em plastico. Para promover a adesão das MSCs aos hidrogéis
para a isolação e cultura, estes vão ser covalentemente funcionalizados com colagénio
(Engler et al., 2006) e em alguns casos fibronectina.

vi
Conseguimos optimizar um novo protocolo para isolar MSCs humanas do cordão
umbilical, permitindo-nos obter uma população de MSCs humanas indiferenciadas
mais homogenea quando comparado com o protocolo de isolação em TCPs. Os
hidrogéis de poliacrilamida (PA) usados para a isolação já são utilizados comumente
em experiencias de mecanotransdução, mas tanto esta formulação dos hydrogéis
como a isolação das hUCM-MSCs em hidrogeis, nunca foi feito antes à luz do nosso
conhecimento. Podemos concluir que a FN juntamente com a rigidez do substrato tem
um papel importante na proliferação inicial das MSCs humanas quando cultivadas em
substratos moles, nomeadamente a 10kPa (Figura 17). Os resultados preliminares
(Figuras 18, 19 e tabela III) mostram o que parece ser uma população de MSCs
humanas mais indeferenciada e mais homogeneas quando isoladas e cultivadas nos
hidrogéis de PA. Finalmente, parece-nos que certos marcadores neuronais (B-III
tubulin, Nestin, O4 e GFAP) estão mais expressos nas células já em diferenciação
cultivadas nos hidrogéis moles do que nas cultivadas e em diferenciação no plástico
(TCP), isto para as células expandidas durante 5 passagens no plástico (TCPs). Em
relação as MSCs humana isoladas exclusivamente nos hidrogéis de PA as diferenças
entre estas e as MSCs isoladas no plastico não são muito evidentes, mas parece que o
O4 está mais expresso nas células isoladas em hidrogéis moles de PA.
Palavras-chave: MSCs, oligodendroglia, mecanotransdução, elasticidade da matriz,
compromisso de linhagens celulares, diferenciação.

vii

viii
Table of contents Acknowledgements i
Abstract iii
Resumo v
Table of contents viii
List of figures xi
List of tables
List of abbreviations
Chapter I 1
I – Introduction 3
I.1. Mesenchymal stem cells (MSCs) 3
I.1.1 - Sources of MSCs 3
I.1.2 -In vitro characterization of MSCs 4
I.1.2.1 - Immunophenotype 5
I.1.2.2 - CFU-F and proliferation capacity 5
I.1.2.3 -Multilineage differentiation capacity 5
I.2. - Mechanotransduction and its implications in cellular fate 6
I.2.1 -Mechanotransduction and mechanosensors 9
I.2.2 -Extracellular matrix and integrin-based mechanotransduction
Mechanisms 11
I.2.2.1 -Mechanisms of Rigidity Sensing 11
I.2.3 -Mechanotransduction and Stem Cells 15
I.2.3.1 - Mechanotransduction and MSCs differentiation 15
I.2.3.1.1-Stiffness effect on Neuronal and Glial
differentiation 19
I.2.3.2-Manipulation and measurement of cellular forces
in MSCs 21
I.3 - Project rationale and experimental approach 24
I.3.1 -Typical MSCs Isolation 24
I.3.2 -Durotaxis, Tissue Elasticity and MSCs “memory” 24
I.3.3 - Effects of the stiffness on the MSCs stemness genes 27

ix
I.4 – Objectives 29
Chapter II 31
II – Materials and Methods 33
II.1 - Materials 33
II.1.1 - Cell culture 33
II.1.2 – Polyacrylamide hydrogels 33
II.1.3 - Immunocytochemistry 33
II.1.4 – Biological material 34
II.1.4.1 - Umbilical Cord Samples 34
II.1.4.2 - human Mesenchymal Stem Cells (hMSCs) 34
II.2 - Methods 34
II.2.1 – Isolation of Mesenchymal Stem Cells (MSCs) from
Umbilical Cord Fragments (UCFs) in Tissue Culture Plates
(TCPs) and Polyacrylamide hydrogels 34
II.2.2 - Cell culture 35
II.2.3 - Cryopreservation of MSCs 35
II.2.4 - Phenotypic characterization of UCM-MSCs 35
II.2.5 - Preparation of polyacrylamide hydrogels 36
II.2.6 Differentiation protocols 38
II.2.6.1 adapted from Engler, et al. 2006 38
II.2.7 - Rheological characterization of polyacrylamide hydrogels 38
II.2.8 - Immunocytochemistry 39
II.2.9 - Statistical analysis 39
Chapter III 41
III – Results 43
III.1 – Rheological Characterization of Polyacrylamide Hydrogels 43
III.2 – Cell Adhesion to Polyacrylamide Hydrogels functionalized with Collagen I
(COL-1) 44
III. 3 – hMSCs Proliferation Assay 46
III.4 – Isolation and Proliferation of MSCs from Human Umbilical Cord Isolation
of hMSC from the Wharton Jelly on Polyacrylamide Hydrogels 47
III.5 - Immunophenotypic characterization of UCM-MSC 48

x
III. 6 – Influence on MSCs specification by matrix elasticity 51
Chapter IV 58
IV – Discussion and Conclusion 60
Discussion 60
Conclusion 67
References 69

xi
List of figures
Figure 1| Mechanotransduction in a Cell-ECM Unit: Center image– A cell connected to
another cell and to the ECM. Center image (A) and (D)- show where
mechanotransduction in the cell-ECM unit occurs. The “blue lines” represent
actomyosin filaments, “green lines” embody intermediate filaments and the “red lines”
correspond to microtubules in all panels. Integrins are represented by the “blue
structures” linking the cell with the ECM (D); Center “nucl.” – nucleus; (A) -
Mechanotransduction at adherens junctions;(A),LEFTShows different cell-cell junctions
–“Tight” is for tight junctions. “GAP” is for Gap junctions. “Desm” is for desmosomes.
“AJ” is for Adherens junctions.(A), RIGHT: Shows the Molecular structure of an AJ: E-
cad: E-Cadherin, a: Alpha Catenin, b: Beta Catenin, p120: p120 Catenin, v: Vinculin; (B)
-Mechanoreceptors at the cell membrane. Deformation of the plasma membrane by
the fluid flow or stretching, leads to activation of ion channels resulting in an ions
influx. Furthermore fluid flow directly impacts glycocalyx and cilia movement which
triggers diverse downstream signaling cascades. Mechanical forces also mediate
growth factor receptor (GR) clustering and endocytosis, and thus affect GR signal
transduction as well; (C) - Mechanotransduction at the nucleus. Intermediate filaments
and microtubules are interconnected with the nucleus and surrounding organelles
(Golgi apparatus, Mitochondria, rough and smooth endoplasmic reticulum). Nesprins
(N) bind the nucleus with the actomyosin cytoskeleton. With the change in cell shape
and contractility there is analteration to spatial localization of organelles which may
lead to a conformational change in the nuclear pores. (D) - Mechanotransduction at
the focal adhesion (FA). (D, LEFT): Nascent adhesions (NA), focal complexes (FXs) and
focal adhesions (FA), undergo through a maturating process controlled by actomyosin
contractility which can be modified by stiffness, shape or external application of
force.(D, RIGHT):molecular structure of FA.α/β: alpha and beta sub-units of integrins,
Pax: paxillin, F: Force delivered by actomyosin contraction. The clustering of integrins
may induce RhoA signaling which leads to an increase of myosin contractility and an
unfolding of proteins.Adapted from Eyckmans et al., 2011.

xii
Figure 2| Proteins related to the mechanosensory in Integrin-Mediated Rigidity
Sensing. The yellow boxes highlight the proteins wich bind directly to the depicted
domains.(A) FAK activity is regulated by mechanical forcebut does not bind integrins or
actin directly.(B) Stretching the p130Cas domain exposes its 15 tyrosine residues. (C)
Stretching of talin’s rod domain exposes vinculin binding sites (del Rioet al., 2009).(D)
Extension of filamin immunoglobulin repeats (labeled 1–24) has beenshown by AFM
(Furuike et al., 2001) and could regulate the binding of proteins.(E) a-actinin forms
antiparallel dimers; mechanical force could regulate thisdimerization or its association
with other proteins.Adapted fromMoore et al., 2010.
Figure 3| The Rigidity Sensing Cycle. In this rigidity sensing cycle scheme it is shown the
correlation between mechanosensory events as integrin/ECM catch bond formation,
stretching of talin (that recuitsvinculin and therefore reinforces the adhesion) and
stretching of FAK, leading to the disassembly and recycling of the adhesion, by the
activation of its kinase domain. Adapted from; Moore et al., 2010
Figure 4| Tissue Elasticity. Range of stiffness measured by the elastic modulus, E, of
some human solid tissues. Adapted fromEngler et al., 2006.
Figure 5| Images depicted on A) and B) quantify the morphological changes (mean ±
SEM) versus stiffness, E: shown are (A) cell branching per length ofprimary mouse
neurons, MSCs, and blebbistatin-treated MSCs and (B) spindle morphology of MSCs,
blebbistatin-treated MSCs, and mitomycin-C treated MSCs (open squares) compared
to C2C12 myoblasts (dashed line). Furthermore in C) MSCs change their morphology
developing increasingly branched, spindle, or polygonal shapes, respectively, when
cultured on matrices with the elastic modulus (E) respectively in the range typical of
brain (0.1–1 kPa), muscle (8– 17 kPa), or stiff crosslinked-collagen matrices (25–40
kPa). Blebbistatin blocks morphology changes due to stiffness (<2-fold different from
naive MSCs) and mitomycin-C inhibit cell proliferation.Adapted from Engler et al.,
2006.

xiii
Figure 6| Microarray profiling of MSC transcripts in cells cultured on 0.1, 1, 11, or 34
kPa matrices with or without blebbistatin treatment. Results are normalized to actin
levels and then normalized again to expression in naive MSCs, yielding the fold
increase at the bottom of each array. Neurogenic markers (left) are clearly highest on
0.1–1 kPa gels, while myogenic markers (center) are highest on 11 kPa gels and
osteogenic markers (right) are highest on 34 kPa gels. Adapted from Engler et al.,
2006).
Figure 7| A) Immunofluorescence images of B-III tubulin and NFH in branched
extensions of MSCs on soft matrices (E ≈ 1 kPa). Scale bars are 5 mm. B) B-III tubulin,
NFH, and P-NFH all localize to the branches of MSCs on the softest substrates with E< 1
kPa (mean ± SEM). Nestin, B-IIItubulin, MAP2, and NFL Western blotting (inset)
confirms expression only on soft gels (GL = Glass). Adapted from Engler et al., 2006.
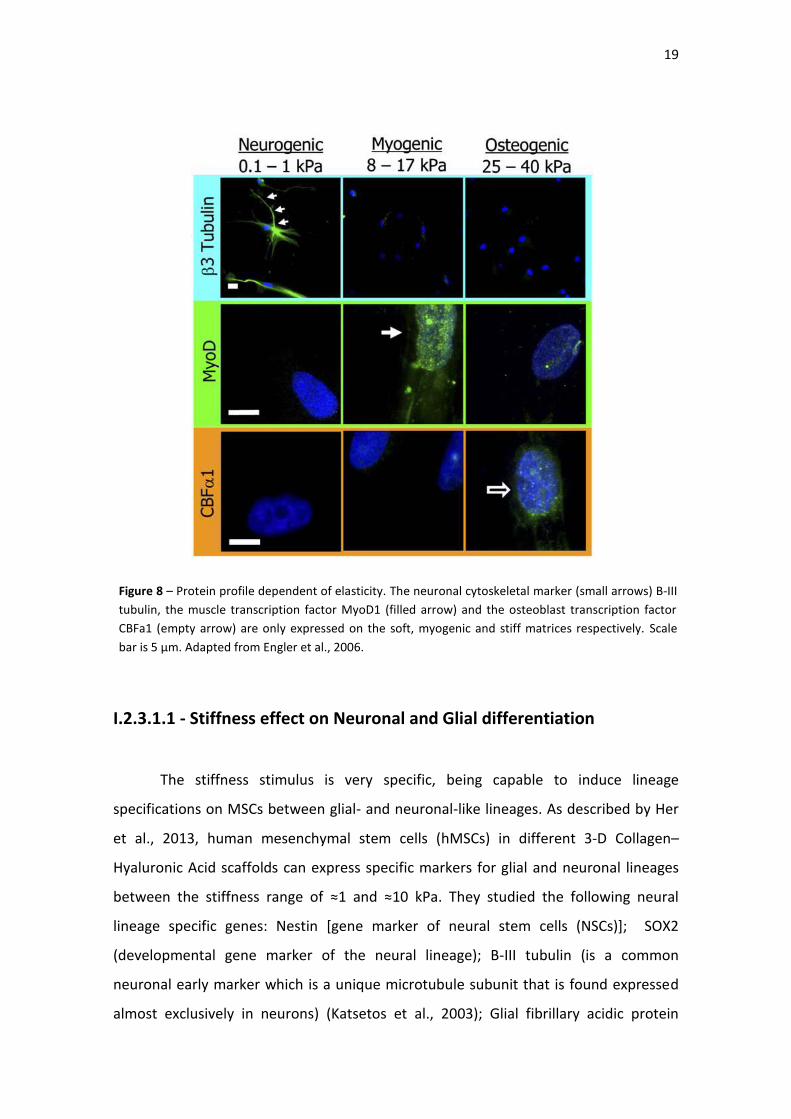
Figure 8| Protein profile dependent of elasticity. The neuronal cytoskeletal marker
(small arrows)B-III tubulin, the muscle transcription factor MyoD1 (filled arrow) and
the osteoblast transcription factor CBFa1 (empty arrow) are only expressed on the
soft, myogenic and stiff matrices respectively. Scale bar is 5 µm. Adapted from Engler
et al., 2006.
Figure 9| Characterization of neural-like lineage differentiation of hMSCs in 3-D
scaffolds.The qRT-PCR results for representativeneural lineage specific genes. D7= 7
days. D14 = 14 days. EDC_0.1% = ≈1kPa. EDC_2.0% = ≈10kPa (n =3,*P < 0.1, **P < 0.05)
(Adapted from Her et al.,2013).
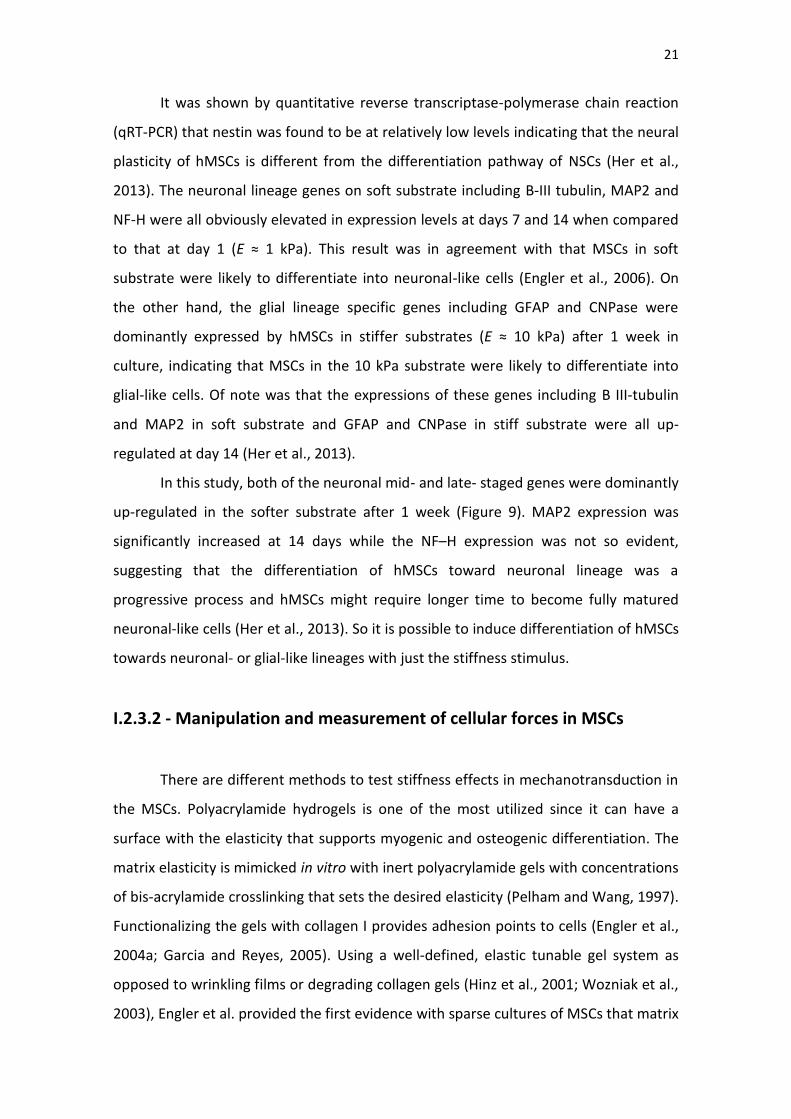
Figure 10| Figure representing analysis of microposts heights (L) by finite-element
method (FEM) each bending in response to applied horizontal traction force (F) of 20
nN.Adapted from Fu et al., 2010.
Figure 11| Images of mitomycin C-treated MSCs on gradient hydrogels (with stiffness
gradient, ≈1 to 15 kPa) and their spatial distribution. Hoescht 33342 (blue) and
phalloidin (red)-stained mitomycin C-treated MSCs plated at 250 cells/cm2, illustrate

xiv
the change in distribution with time. Scale bar is 56.5 µm. Adapted from Tse and
Engler, 2011.
Figure 12| MSCs cultured on 1 and 11 kPa static (top) and gradient (bottom) hydrogels
and stained for B-III- tubulin (red) (neuronal marker) and MyoD (green) (myogenic
marker). Open arrowheads indicate cells expressing either B-III- tubulin or MyoD while
filled arrowheads indicate doubly stained cells. Adapted from Tse and Engler,, 2011.
Figure 13| Quantification of B-III tubulin(grey) and MyoD (black) by MSCs fluorescent
intensity on gradient hydrogels(from 1 to 11 kPa, filled squares) and normalized to the
non-permissive static hydrogels (1 and 11kPa each and only, open circles).Adapted
from Tse and Engler, 2011.
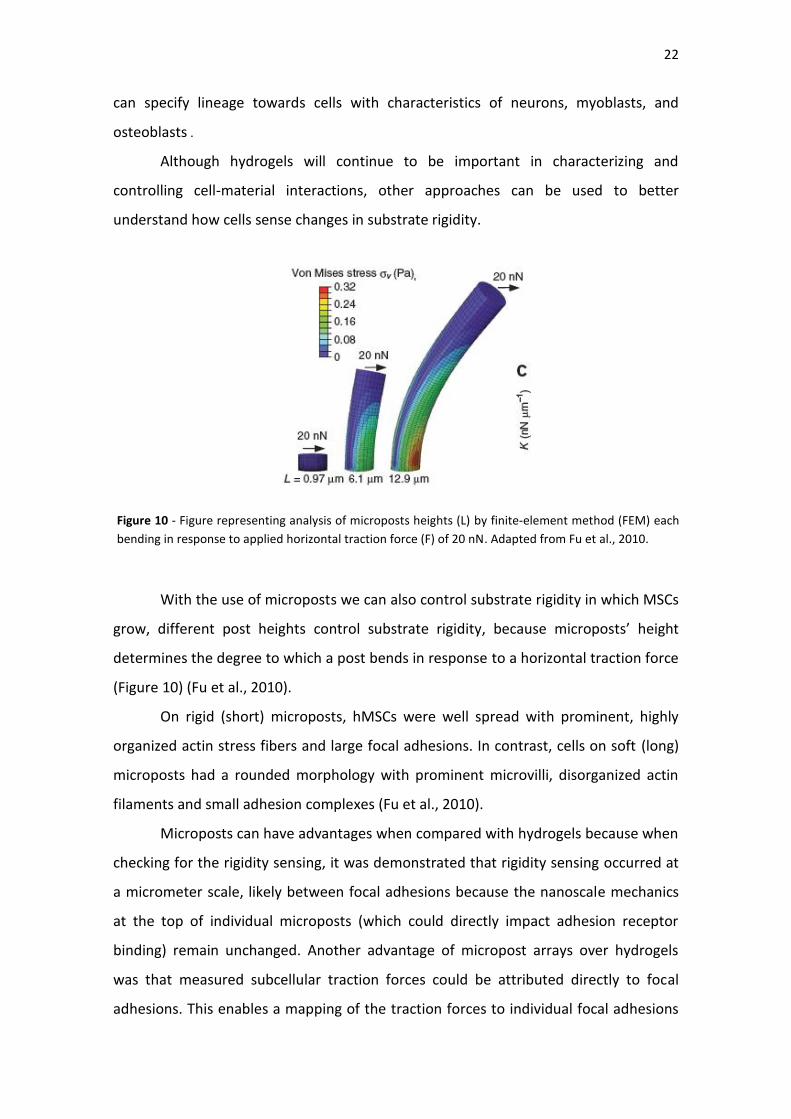
Figure 14| Represent the results of gene (CD73, CD90 and CD105) expression for 7
days (D7) and 14 days (D14) in the Col–HA scaffolds of EDC 0.1% and EDC2.0% which
have stiffnesses of approximately 1and 10 kPa, respectively, and were defined as soft
and stiff substrates, respectively. The results were compared to individual day 1 gene
expression levels. Adapted from Her et al., 2013).
Figure 15| Representative images of phase-contrast microscopy of cells cultured on ≈7
kPa PA hydrogels in which small spots of 2.5 ± 0.5 mm2 had been previously
functionalized with different COL-1 concentrations (as indicated) to assess cell
adhesion 1 and 6 days after seeding. MSCs were plated at 3000 cells/cm2 (n=2). Bar
represents 100 µm.
Figure 16| Left and right upper images: Representative fluorescence microscopy
images of hMSCs plated on polyacrylamide hydrogels with 12.5% acrylamide at day 1
(left) and 5 (right) after being fixed and stained with DAPI (in blue). Size bar
corresponds to 200µm. Bottom graphic: Proliferation assay of hMSCs in
polyacrylamide hydrogels, showing the fold increase of the number of cells from day 1
to day 5 (n=3).

xv
Figure 17| Colonies of hMSCs isolated in different PA hydrogels from UCM-WJ
fragments after 1 week and 2 weeks of fragments plating in the hydrogels with just
COL-1 or with COL-1 and FN (n=2). Bar corresponds to 200µm.
Figure 18| Immunophenotype of UCM-MSCs. The Y axis is the cell density. The X axis is
a logarithmic scale of fluorescence. Cells were detached, labelled with antibodies
against the indicated antigens and analyzed by flow cytometry. Cells were positive for
CD49e, CD73, CD13 and CD90 (red and green lines) when compared with unlabeled
MSCs (dark gray and light gray) for the 2 conditions, both from the PA hydrogels and
the Plastic/TCPs (n=1).
Figure 19| Immunophenotype of UCM-MSCs. The Y axis is the cell density. The X axis is
a logarithmic scale of fluorescence. Cells were detached, labelled with antibodies
against the indicated antigens and analyzed by flow cytometry. Cells were negative for
CD11b, HLA-DR, CD45 (red and green lines) when compared with unlabelled MSCs
(dark gray and light gray) for the 2 conditions, both from the hydrogels and of the
Plastic/TCPs (n=1).
Figure 20| hMSCs cultured on TCPs (Plastic) and PA hydrogels coated with COL-1 for 7
days after being treated with mitomycin C to inhibit proliferation. Cells were stained
with anti-B-III tubulin (red), anti-Nestin antibodies (green) and DAPI (blue). This
experiment was performed once (n=1). Bar corresponds to 400µm.
Figure 21| hMSCs cultured on TCPs (Plastic) and PA hydrogels coated with COL-1 for 7
days after being treated with mitomycin C to inhibit proliferation. Cells were stained
with anti-GFAP (red), anti-O4 antibodies (green) and DAPI (blue). This experiment was
performed once (n=1). Bar corresponds to 400µm.
Figure 22| hMSCs cultured on TCP (Plastic) and PA hydrogels coated with COL-1 for 7
days after being treated with mitomycin C to inhibit proliferation. Cells on the 7kPa
hydrogels and 1kPa hydrogels were isolated on 12 kPa hydrogels as mentioned in III.4.

xvi
Cells were stained with anti-B-III tubulin (red), anti-Nestin antibodies (green) and DAPI
(blue). This experiment was performed once (n=1). Bar corresponds to 200µm.
Figure 23| hMSCs cultured on TCP (Plastic) and PA hydrogels coated with COL-1 for 7
days after being treated with mitomycin C to inhibit proliferation, the cells on the 7kPa
hydrogels and 1kPa hydrogels were isolated on 12 kPa hydrogels as mentioned in III.4.
Cells were stained with anti-GFAP (red), anti-O4 antibodies (green) and DAPI (blue).
This experiment was performed once (n=1) for GFAP and twice for O4 (n=2). Bar
corresponds to 200µm.

xvii
List of tables
Table I - Composition of the hydrogels solutions - volume added of each
reagent (µL) per one milliliter of solution.
Table II - Mean ± standard deviation (SD) of the Young’s modulus (E) (amount of
force per unit of area needed to deform the material by a given fractional amount
without any permanent deformation) calculated from the shear modulus measured at
1Hz, according to the formula E= 2G’(1+ν), where G’ is the shear storage modulus
measured by the rheometer and ν is the Poisson ratio, assumed to be 0.5 (Moore
2010). Values represent results of measurement of three independent hydrogels (n=3).
* Hydrogels previously characterized in the laboratory (Lourenço, 2012).
Table III - Mean, Median and Coefficient of variation of the Fluorescence values
obtained by flow cytometry for the positive MSCs markers (CD49e, CD73, CD13 and
CD90) for cells isolated and cultured on PA hydrogels and from TCPs (n=1).

xviii
List of abbreviations
AA - Acetic Acid
Ac - Acrylamide
AJ - Adherens juctions
ALP - Alkaline phosphatase
Bac - Bisacrylamide
BM - Bone marrow
CD - Cluster of differentiation
COL-1 - Collagen type 1
CFU-F - Colony-forming unit-fibroblast
DAPI - 4',6-Diamidino-2-phenylindole dihydrochloride
Desm - Desmossomes
E - Elastic modulus
ECM - Extra-cellular matrix
ESC - Embryonic stem cell
FA - Focal adhesion
FAK - Focal adhesion kinase
FRET - Forster Resonance Energy Transfer
FN - Fibronectin
FX - Focal complex
GAP - GAP junctions
GFAP - Glial fibrillary acidic protein
GR - Growth facto receptor
HLA-DR - Human leucocyte antigens disease resistant
hMSC - Human mesenchymal stem cell
kPa - Kilopascal
Lip - Lipid droplets
MAP2 - Microtubule-associated protein 2
ML - Myosin light chain kinase

xix
MSC - Mesenchymal stem cell
N - Nestin
n - Number of experiments done
NA - Nascent adhesions
Ns - Nesprins
NSC - Neural stem cell
NF-H - Neurofilament, Heavy Chain
ISCT -International Society of Cellular Therapy
PA - Polyacrylamide
Pa - Pascal
Pax - Paxillin
PM - Proliferation Medium
qPCR - quantitative reverse transcriptase-polymerase chain reaction
SD - Standard deviation
TRP - Transient receptor potential
TMED - Tetramethylethylenediamine
TCPs - Tissue-culture polystyrene
TCP - Tissue culture plate
UC - Umbilical Cord
UCB - Umbilical cord blood
UCF - Umbilical Cord Fragment
UCM - Umbilical Cord Matrix
WJ - Wharton’s jelly
V - Poisson ratio

xx

1
Chapter I
Introduction

2

3
I - Introduction
I.1 - Mesenchymal stem cells (MSCs)
Mesenchymal stem cells (MSCs), also referred to as mesenchymal stromal cells or
mesenchymal progenitor cells were identified for the first time in the bone marrow
(BM) and were described as a population of plastic-adherent, non-hematopoietic and
spindle-shaped mesenchymal precursor cells. Due to their ability to form colonies of
cells similar to fibroblasts, those colonies were called, colony-forming unit-fibroblast
(CFU-Fs) (Friedenstein et al., 1970). As the studies and years advanced, observations
over MSCs showed that those cells from the bone marrow were multipotent and could
differentiate into osteoblasts, chondroblasts, myoblasts and adipocytes (Prockop,
1997; Nardi and da Silva Meirelles, 2006).
Therefore, MSCs are currently defined as multipotent cells capable of self-renewal
that can differentiate into different mesenchymal cell phenotypes (da Silva Meirelles
et al., 2008).
I.1.1 - Sources of MSCs
Although MSCs were initially identified and characterized in the bone marrow
(BM), with the years and research they have also been isolated from adipose and other
human adult tissues (Friedenstein et al., 1974; Zuk et al., 2001).
As there is a great interest for cells with proliferation and differentiation
potential and also because in adult tissues with ageing there is a decrease of MSCs
frequency and their differentiation capacity, alternative sources have been explored.
In this way, MSCs have been identified in several fetal tissues (including BM, liver,
blood, lung and spleen) but their full potential for use in clinical trials has been
compromised by technical and ethical factors (Malgieri et al., 2010). Hence,
alternatives like other primitive sources, namely extra-embryonic tissues like the
umbilical cord blood (UCB), the umbilical cord matrix/Wharton’s jelly (UCM/WJ),
placenta and amniotic membrane have been studied and protocols for the extraction
of MSCs from those tissues have been developed.

4
There are many advantages in using UCM as an alternative source of human MSCs
when comparing to BM and other adult tissues. Because the umbilical cord (UC)
physiologically supports development of the embryo only throughout fetal life until
birth, it is normally discarded at birth, being a tremendous waste, since the procedure
of collection is painless, non-invasive and harmless either to the mother or the
newborn. This procedure can increase the potential donors of MSCs (Weiss and Troyer
2006) and diminish the ethical and clinical issues (Malgieri et al., 2010). Moreover,
those are not the only positive aspects, there is also the fact that MSCs isolated from
the UC seem to be more primitive, have greater expansion capacity in vitro and shorter
doubling time than MSCs isolated from adult tissues (Park et al.,2006). Despite not
being as immature as embryonic stem cells (ESCs), UCM- and UCB-MSCs have a big
differentiation potential, being able to differentiate into cell types with characteristics
of the three germ layers and with very low chances to develop tumors when
transplanted (Lee et al., 2004).
When comparing the efficiency of MSCs isolation from the UC tissues (blood
and matrix), the blood is the one with lower efficiency (about 30%) (Bieback et
al.,2004) and this is a disadvantage when compared with the matrix that has been
consistently reported as having an efficiency of 100% (Secco et al.,2008; Zeddou et
al.,2010; Taghizadeh et al.,2011).
I.1.2 - In vitro characterization of MSCs
For many years the search for the identity of mesenchymal stem cell was mainly
dependent on three culture systems: the CFU-F assay, the isolation and analysis of
bone marrow stroma, and the cultivation of mesenchymal stem cell lines. The isolation
and culture conditions used to expand these cells rely mostly on the ability of MSCs to
adhere to plastic surfaces. MSCs populations in culture are typically composed by cells
that comprise some heterogeneity, in terms of differentiation potential and expression
of secondary MSC markers. Whether the culture conditions selectively favor the
expansion of different bone marrow precursors or induce similar cell populations to
acquire different phenotypes is not clear (Nardi and da Silva Meirelles, 2006).
5
I.1.2.1 - Immunophenotype
The Mesenchymal and Tissue Stem Cell Committee of the International Society for
Cellular Therapy proposed 3 minimal criteria to define human MSCs. Those are: i)
MSCs must be plastic-adherent when maintained in standard culture conditions; ii)
MSCs must express CD105, CD73 and CD90, and lack expression of CD45, CD34, CD14
or CD11b, CD79a or CD19 and HLA-DR surface molecules; iii) MSCs must differentiate
to osteoblasts, adipocytes and chondroblasts in vitro (Dominici et al., 2006). Although
MSCs express a high number of cell surface markers and those were all well
characterized, there is still no specific marker identified. However, there is a typical
neuroectodermal marker, nestin, which began to be regarded as a good marker for the
identification of MSCs (Mendez-Ferrer et al., 2010) and seems to be in agreement with
reports indicating at least a partial neuroectodermal origin of MSCs (Takashima et al.,
2007; Morikawa et al., 2009).
I.1.2.2 - CFU-F and proliferation capacity
Colony formation capacity is an important hallmark of stem cells and it
demonstrates the presence of highly proliferative cells in these cultures (Javazon et al.,
2001). MSCs also have the ability to form colonies in vitro after low-density plating or
single-cell sorting, however colonies derived from those assays are heterogeneous in
morphology, size and differentiation potential (Owen and Friedenstein, 1988;
Kuznetsov et al., 1997; Dominici et al., 2006).
I.1.2.3 - Multilineage differentiation capacity
MSCs are multipotent progenitor cells with the capability to differentiate in vivo
and in vitro into adipogenic, chondrogenic and osteogenic lineages (Caplan, 2009). This
capacity to differentiate in vitro into several mesenchymal phenotypes was what in
2006 the ISCT had defined as one of the main properties integrating the minimal
criteria that define MSCs (Dominici et al., 2006). However, those lineages are not the

6
only ones MSCs can differentiate into. It has been shown that the differentiation
potential of these cells covers cells with markers characteristic of the three germ layers
(ectoderm, mesoderm and endoderm), like cells similar to cardiomyocytes (Wang et
al., 2004), skeletal muscle cells (Conconi et al., 2006), endothelial cells (Wu et al.,
2007), hepatocytes (Lee et al., 2004; Anzalone et al., 2010) and neural-like lineages
(Weiss et al., 2003; Sanchez-Ramos et al., 2008).
Of particular interest for this thesis, is the neural-like differentiation of MSCs. It
was demonstrated that nestin-positive MSCs can differentiate into neuron-like cells
(Wislet-Gendebien et al., 2005) and probably the expression of this neuroectodermal
marker is related with the neuroepithelial origin of these cells (Takashima et al., 2007;
Mendez-Ferrer et al., 2010). Futher studies also showed that nestin-positive MSCs
were induced to a neural stem-like cell fate and then converted into oligodentrocyte
precursor-like cells (Zhang et al., 2010), reinforcing the idea that nestin-positive MSCs
have the capability to differentiate into neural-like lineages.
I.2. - Mechanotransduction and its implications in cellular fate
Mechanical forces are normally implicated in the regulation of many
physiologic and pathologic processes and are the basis of mechanotransduction.
Mechanical loading can induce hypertrophy and strengthening of muscles, tendons,
ligaments and bones, whereas prolonged exposure to weightlessness seems to make
the opposite, e.g. left early astronauts prone to bone fractures (Burkholder, 2007;
Duncan and Turner, 1995; Hattner and McMillan, 1968). Similar hypertrophic
thickening, but this time due to pathogenic symptoms, occurs in the heart with
unchecked hypertension, although in this case potentially dangerous consequences
may occur (Weber et al., 1989; Westerhof and O’Rourke, 1995). Differences in the
flow-induced shear stress on veins or arteries specify their endothelium differentiation
in part to become a venous or arterial phenotype, and certain regions are more
susceptible to inflammation due to the distribution of shear stresses within the arterial
tree, explaining the observed distribution of atherosclerotic plaques (Davies et al.,
1995; Garcia-Cardena et al., 2001). The contractile activity of cells generates
mechanical forces that drive physical changes in a developing embryo, but also are

7
transduced to affect cellular signaling, gene expression and cell function, which are
crucial to developmental programming (Lee et al., 2006; Somogyi and Rorth, 2004;
Farge, 2003). (Ingber et al., 1986a; Ingber and Folkman, 1989b). It was shown that
changes in the balance of mechanical forces between integrins and cytoskeleton that
accompany cells spreading and drive cytoskeletal restructuring control downstream
mitogenic signaling cascades and thereby control the cellular response to other
external stimuli. So mechanical forces are equally important biological regulators as
growth factors and ECM are (Huang et al., 1998).
It has long been noted that the differentiation of stem cells into multiple
lineages is accompanied by dramatic changes in cell morphologies, and the
demonstration that mechanical cues influence lineage commitment of stem cells
(McBeath et al., 2004). So, inhibition of cell-generated forces was showed to alter
many basic cellular functions, such as proliferation, differentiation, tissue organization
and migration (Huang et al., 1998; McBeath et al., 2004; Sordella et al., 2003; Krieg et
al., 2008; Lo et al., 2004).
By modulating the stress that is generated by these cellular forces altering the
mechanical stiffness of the substrate it is possible to achieve a similar response to the
one caused by directly altering cellular contractility (Pelham and Wang, 1997; Paszek
and Weaver, 2004; Engler et al., 2006).
Stiffness is the extent to which a substrate resists deformation. Substrate
stiffness itself can alter numerous cellular functions including migration, proliferation
and differentiation (Li et al., 2007; Peyton and Putnam, 2005; Leach et al., 2007; Lo et
al., 2000).

8
Figure 1. Mechanotransduction in a Cell-ECM Unit: Center image – A cell connected to another cell and
to the ECM. Center image (A) and (D)- show where mechanotransduction in the cell-ECM unit occurs.
The “blue lines” represent actomyosin filaments, “green lines” embody intermediate filaments and the
“red lines” correspond to microtubules in all panels. Integrins are represented by the “blue structures”
linking the cell with the ECM (D); Center “nucl.” – nucleus; (A) -Mechanotransduction at adherens
junctions; (A), LEFT Shows different cell-cell junctions –“Tight” is for tight junctions. “GAP” is for Gap
junctions. “Desm” is for desmosomes. “AJ” is for Adherens junctions.(A), RIGHT: Shows the Molecular
structure of an AJ: E-cad: E-Cadherin, a: Alpha Catenin, b: Beta Catenin, p120: p120 Catenin, v: Vinculin;
(B) -Mechanoreceptors at the cell membrane. Deformation of the plasma membrane by the fluid flow or
stretching, leads to activation of ion channels resulting in an ions influx. Furthermore fluid flow directly
impacts glycocalyx and cilia movement which triggers diverse downstream signaling cascades.
Mechanical forces also mediate growth factor receptor (GR) clustering and endocytosis, and thus affect
GR signal transduction as well; (C) - Mechanotransduction at the nucleus. Intermediate filaments and
microtubules are interconnected with the nucleus and surrounding organelles (Golgi apparatus,
Mitochondria, rough and smooth endoplasmic reticulum). Nesprins (Ns) bind the nucleus with the
actomyosin cytoskeleton. With the change in cell shape and contractility there is an alteration to spatial
localization of organelles which may lead to a conformational change in the nuclear pores. (D) -
Mechanotransduction at the focal adhesion (FA). (D, LEFT): Nascent adhesions (NA), focal complexes
Figure 1.
Adapted from:
Eyckmans et al.
2011

9
(FXs) and focal adhesions (FA), undergo through a maturating process controlled by actomyosin
contractility which can be modified by stiffness, shape or external application of force.(D, RIGHT):
molecular structure of FA. α/β: alpha and beta sub-units of integrins, Pax: paxillin, F: Force delivered by
actomyosin contraction. The clustering of integrins may induce RhoA signaling which leads to an
increase of myosin contractility and an unfolding of proteins. Adapted from Eyckmans et al., 2011.
I.2.1 - Mechanotransduction and mechanosensors
Generation of forces on the matrix can be sensed through integrins by 5 basic
mechanisms that have been suggested for mechano-sensing: catch bond formation,
channel opening, enzyme regulation, exposure of phosphorylation sites, or exposure of
binding sites. All could play significant roles in adhesion-related processes (Moore et
al., 2010).
Looking over mechanotransduction more closely, it is known that changes in
cell shape and cytoskeletal architecture are related with the integrins binding and
clustering against ECM ligands, anchoring the actin cytoskeleton to sites of adhesion.
The orientation of the integrin layer within the cell membrane is made with the
head domains connecting to the ECM and the cytoplasmic tails binding to focal
adhesion kinase (FAK) and paxillin. This cytoplasmatic layer is assembled with
complexes containing talin and vinculin, and an uppermost actin-regulatory sheet
consisting of zyxin, VASP and α-actinin that binds the cytoskeleton to the FA (Figure
1D) (Kanchanawong et al., 2010).
Since the cytoskeleton is linked to the nuclear envelope, forces experienced or
generated by the cell-ECM module (Figure 1) are transmitted and sensed throughout
as a coordinated system (Eyckmans et al., 2011). The actomyosin cytoskeleton works
as a connection between multiple parts of the cell membrane as well as the cell
membrane to the nucleus (Sims et al., 1992). These filaments anchor into clusters of
proteins (including focal adhesions, FAs) which link the ECM to the cytoskeleton
through transmembrane integrin receptors (Eyckmans et al., 2011). So if there is
application of a force to the cell-ECM unit, structural deformations and
rearrangements of the ECM will occur, the force is transmitted through the FA, and
almost every single aspect of the intracellular structure, like the position of
endoplasmic reticulum, mitochondria and the nucleus will get deformed (Figure

10
1C)(Dogterom et al., 2005). Not only intracellular structure gets deformed but also
receptor-mediated transduction of forces have been convincingly shown for integrins
(Wang et al., 1993) and stretch-activated ion channels (Lansman et al., 1987;
Sadoshima et al., 1992). Mechanical forces, for stretch-activated receptors, appears to
alter the conformation of the Transient Receptor Potential (TRP) family of channels,
leading to rapid signaling responses (such as calcium influx, <4 ms) following
mechanical perturbations (Figure 1B) (Matthews et al., 2010).
In vivo, cells are generally tightly connected to each other via cell-cell junctions
(Figure 1A) and adherens junctions (AJ) link the cytoskeletons of adjacent cells via
clusters of cadherins (Yamada et al., 2005).
Manipulation of Cell-ECM forces can be done by using traditional molecular
methods to directly target the force-generating mechanism and apparatus. A wide
amount of pharmacological inhibitors that behave like modulators of contractility are
available and able to act in several related mechanisms/proteins like the molecular
motor myosin II (blebbistantin), the upstream regulators of myosin phosphorylation
Myosin Light Chain Kinase (ML-6, ML-9), and the Rho/ ROCK signaling pathway (fasudil,
Y27639, C3 botulinum exotoxin), as well as the polymerization processes of actin
(latrunculin, cytochalasin D), (Figure 1D) (Eyckmans et al., 2011).
It is thought that at least in part, the effects of ECM stiffness on cells are similar
to effects of decreased integrin-mediated adhesion and cellular force generation. And
this is because cells can transduce alterations due to substrate stiffness (even if the
mechanism by which cells can do it is not fully understood) and it has been shown that
cells attached to more compliant substrates exhibit immature FAs, decreased traction
force generation, and suppressed integrin activation. When using hydrogels it can also
occur alterations in the internal structure, growth factor adhesion and surface
topology of the hydrogels due to the crosslinking chemistry (Houseman and Mrksich,
2001; Keselowsky et al., 2005; Crouzier et al., 2011).
Cilia and primary cilia also have a role in mechanotransduction studies. They
are microtubule-based structures enveloped in a specialized membrane that originate
from the cell body into the extracellular space and that take part in the development
of organs and tissues, such as kidney, pancreas, liver, cartilage, and bone among others
(Figure 1B). Although the molecular basis for cilia mechanosensing is still not
11
completely understood, they seem to transduce mechanical stimuli by modulating Wnt
and Sonic Hedgehog singaling or/ and gating polycystin-based ion channels
(Wallingford, 2010; Wallingford and Mitchell, 2011; Bisgrove and Yost, 2006; Berbari et
al., 2009).
I.2.2 - Extracellular matrix and integrin-based mechanotransduction
mechanisms
The extracellular matrix (ECM) mediates changes in cell shape according to its
mechanical properties and most adherent cells have a very their own shape but non-
adherent cell types are usually rounded and change shape when they attach to
surrounding tissue (Discher et al., 2009), suggesting that adherent cells can sense and
respond to mechanical signals from the ECM. The regulated interplay of intracellular
contractile forces and extracellular attachment might determine cellular shapes (Bauer
et al., 2009). Focal adhesions and other membrane sensors (e.g. tight junctions and
primary cilia) alter their structure and function as a result of changes in mechanical
stress when cells are attached to substrates of different stiffness (Chen et al., 2008).
Changes in stiffness can cause a change in cell shape and it is observed that
cells retain a more rounded morphology on soft substrates and take on a more
flattened shape on stiff substrates (normally associated with cells cultured on hard
tissue culture polystyrene) (Chen et al., 2008).
I.2.2.1 - Mechanisms of Rigidity Sensing
Substrate rigidity, besides changing cell shape can also influence a number of
cellular processes including retraction forces, cell adhesion, actin flow, gene
expression, and cell lineage (Bard and Hay, 1975; Choquet et al., 1997; Engler et al.,
2006; Lo et al., 2000; Pelham and Wang, 1997; Peyton and Putnam, 2005). The nature
of the matrix and the cell-type specific components involved in the responses will
define the rigidity responses. However, in a basic way, integrin-mediated rigidity
sensing can be taken as the decision to couple and reinforce the link between an

12
extracellular ligand and the cytoskeleton. So whether integrin-cytoskeleton bonds
become reinforced depends upon the intracellular component and the mechanical
properties of the microenvironment that make up this link.
The activation of Src family kinases is involved in the ligand binding to integrins.
This is supported because when applied a force, Src family have a rapid activation
(within 300 ms) and was observed that Src family kinases Fyn and Src are required for
rigidity sensing on fibronectin and vitronectin, respectively (Felsenfeld et al., 1999;
Kostic and Sheetz, 2006; Na et al., 2008). The activation of the Src family kinases will
bridge integrins to the cytoskeleton through talin (Duband et al., 1988; Felsenfeld et
al., 1996; Schmidt et al., 1993; Zhang et al., 2008). Ligand binding couples integrins to
the cytoskeleton once coupled to retrograde flowing actin, mechanical force on
integrins could engage the integrin/ECM catch bond. Under stretching forces, Talin
exposes vinculin binding sites (Figure 2C) that stabilize and recruit additional links to
actin (del Rio et al., 2009). To restart the process the activation of FAK may reverse
adhesions (Ilic et al., 1995; Zhang et al., 2008).

13
Figure 2 - Proteins related to the mechanosensory in Integrin-Mediated Rigidity Sensing. The yellow boxes
highlight the proteins wich bind directly to the depicted domains. (A) FAK activity is regulated by mechanical
force but does not bind integrins or actin directly. (B) Stretching the p130Cas domain exposes its 15 tyrosine
residues. (C) Stretching of talin’s rod domain exposes vinculin binding sites (del Rio et al., 2009). (D) Extension of
filamin immunoglobulin repeats (labeled 1–24) has been shown by AFM (Furuike et al., 2001) and could regulate
the binding of proteins. (E) a-actinin forms antiparallel dimers; mechanical force could regulate this dimerization
or its association with other proteins. Adapted from Moore et al., 2010.

14
This transient and multiple steps active process of rigidity sensing is sensitive to
the matrix rigidity (Figure 3) and so the cell retraction speed (loading rate) felt on the
integrin-ECM catch bond is determined by the substrate rigidity. Just as catch bonds
have a force providing maximum lifetime in a scenario of constant force application,
they will have a corresponding optimal loading rate in scenarios where force is loaded
progressively. But the loading rate, at the optimal rigidity, will maximize bond lifetime,
triggering subsequent mechanotransduction events when a force is applied. Coupling
between rearward flowing actin and the substrate is the key for rigidity sensing
(Moore et al., 2010).
Figure 3 - The Rigidity Sensing Cycle. In this rigidity sensing cycle scheme it is shown the correlation
between mechanosensory events as integrin/ECM catch bond formation, stretching of talin (that
recruits vinculin and therefore reinforces the adhesion) and stretching of FAK, leading to the
disassembly and recycling of the adhesion, by the activation of its kinase domain. Adapted from; Moore
et al., 2010

15
I.2.3 - Mechanotransduction and Stem Cells
I.2.3.1 - Mechanotransduction and MSCs differentiation
Living tissues are known to possess different physiologic characteristics
according to their function and cellular type, so considering the elasticity of solid
tissues, very different values of elasticity can be found as shown in Figure 4. The solid
tissues exhibit a range of stiffness, as measured by the elastic modulus, E (Engler et al.,
2006).
Mesenchymal stem cells will differentiate into different phenotypes as a
function of substrate stiffness. The lineage they can differentiate into when cultured
on a substrate with a certain range of stiffness has phenotypic features similar to cells
found in the solid tissues with the same range of stiffness (Figure 4), and MSCs appear
to do so in a way that would promote tissue-specific differentiation and healing (Engler
et al., 2006). For example, on brain-tissue-like stiffness cells undergo neuronal-like
differentiation, whereas muscle-equivalent stiffness promotes myogenesis (Figure 5)
(Engler et al., 2006).
Figure 4 – Tissue Elasticity. Range of stiffness measured by the elastic modulus, E, of some human
solid tissues. Adapted from Engler et al., 2006.

16
Analyzing the cells morphologies of Figure 5C, we can see that matrix-
dependent shape variations of MSCs are similar to primary neurons. Furthermore,
since the inhibition of proliferation by mitomycin-C (open squares, Figure 5 A) has little
impact on average cell shape, the morphology results are consistent with lineage
development being a population-level response to substrate elasticity (Engler et al.,
2006).
Transcriptional profiles of neurogenic, myogenic, and osteogenic markers (from
early commitment markers through mid/late development markers) (Figure 6) support
the morphology indications (Figure 5 A and B). This means that, as expected from the
softest gels, MSCs showed the greatest expression of neurogenic transcripts (Figure 6)
because the neuron-specific cytoskeletal markers are all upregulated (Engler et al.,
Figure 5 - Images depicted on A) and B) quantify the morphological changes (mean ± SEM) versus
stiffness, E: shown are (A) cell branching per length of primary mouse neurons, MSCs, and blebbistatin-
treated MSCs and (B) spindle morphology of MSCs, blebbistatin-treated MSCs, and mitomycin-C treated
MSCs (open squares) compared to C2C12 myoblasts (dashed line). Furthermore in C) MSCs change their
morphology developing increasingly branched, spindle, or polygonal shapes, respectively, when cultured on
matrices with the elastic modulus (E) respectively in the range typical of brain (0.1–1 kPa), muscle (8– 17
kPa), or stiff crosslinked-collagen matrices (25–40 kPa). Blebbistatin blocks morphology changes due to
stiffness (<2-fold different from naive MSCs) and mitomycin-C inhibit cell proliferation. Adapted from Engler
et al., 2006.

17
2006), such as nestin, an early commitment marker, and Beta-III tubulin, expressed in
neurons, as well as the mature marker neurofilament light chain (NFL) (Lariviere and
Julien, 2004) and the early/mid adhesion protein NCAM (Rutishauser, 1984). RNA
profiles indicate lineage specification on matrices of tissue-like stiffness.
To clarify neuro-induction microenvironments and the time series of images in
Figure 5 that shows outwardly branching MSCs on the softest gels (0.1–1 kPa) it was
seen that, in immunofluorescence (Figure 7 A), also show expression and branch
localization of neuron-specific Beta-III tubulin and neurofilament heavy chain (NFH and
its phosphoform, P-NFH) (Engler et al., 2006).
Figure 6 - Microarray profiling of MSC transcripts in cells cultured on 0.1, 1, 11, or 34 kPa matrices with or
without blebbistatin treatment. Results are normalized to actin levels and then normalized again to
expression in naive MSCs, yielding the fold increase at the bottom of each array. Neurogenic markers (left)
are clearly highest on 0.1–1 kPa gels, while myogenic markers (center) are highest on 11 kPa gels and
osteogenic markers (right) are highest on 34 kPa gels. Adapted from Engler et al., 2006).

18
Intensity analyses of immunofluorescence images as well as Western blots (Figure 7)
confirm that proteins markers for neural commitment are expressed only in cells on
the softest matrices. Protein markers for neuronal commitment (nestin), immature
neurons (B-III tubulin), mid/late neurons (microtubule associated protein 2; MAP2),
and even mature neurons (NFL, NFH, and P-NFH) (Engler et al., 2006). These results
from Engler et al. 2006 suggest that this process that occurs with MSCs somehow
recapitulates what is seen during neurogenesis in vivo, as seen in more complex
microenvironments like the brain (Kondo et al., 2005; Wislet-Gendebien et al., 2005).
Furthermore, when looking across the range of matrix stiffness, to the
cytoskeletal markers and transcription factors characteristic of the distinct lineages
(Figure 8) it is indicated that MSCs lineage specification occurs (process similar to an
incomplete differentiation), being consistent with the lineage profiling of Figure 5 and
6. On the softest, neurogenic matrices, a majority of cells express B-III tubulin, which,
along with P-NFH and NFH, is visible in long, branched extensions but is poorly
expressed, if at all, in cells on stiffer gels (Figure 7). On moderately stiff, myogenic
matrices, MSCs upregulate the transcription factor MyoD1, localizing it to the nucleus
(Figure 8) (Engler et al., 2006).
Figure 7 - A) Immunofluorescence images of Beta-III tubulin and NFH in branched extensions of MSCs on
soft matrices (E ≈ 1 kPa). Scale bars are 5 mm. B) B-III tubulin, NFH, and P-NFH all localize to the branches
of MSCs on the softest substrates with E < 1 kPa (mean ± SEM). Nestin, B-III tubulin, MAP2, and NFL
Western blotting (inset) confirms expression only on soft gels (GL = Glass). Adapted from Engler et al.,
2006.
19
I.2.3.1.1 - Stiffness effect on Neuronal and Glial differentiation
The stiffness stimulus is very specific, being capable to induce lineage
specifications on MSCs between glial- and neuronal-like lineages. As described by Her
et al., 2013, human mesenchymal stem cells (hMSCs) in different 3-D Collagen–
Hyaluronic Acid scaffolds can express specific markers for glial and neuronal lineages
between the stiffness range of ≈1 and ≈10 kPa. They studied the following neural
lineage specific genes: Nestin [gene marker of neural stem cells (NSCs)]; SOX2
(developmental gene marker of the neural lineage); B-III tubulin (is a common
neuronal early marker which is a unique microtubule subunit that is found expressed
almost exclusively in neurons) (Katsetos et al., 2003); Glial fibrillary acidic protein
Figure 8 – Protein profile dependent of elasticity. The neuronal cytoskeletal marker (small arrows) B-III
tubulin, the muscle transcription factor MyoD1 (filled arrow) and the osteoblast transcription factor
CBFa1 (empty arrow) are only expressed on the soft, myogenic and stiff matrices respectively. Scale
bar is 5 µm. Adapted from Engler et al., 2006.

20
(GFAP) (is a class-III intermediate filament which is the main constituent of
intermediate filaments in astrocytes and it serves as a cell specific marker that
distinguishes differentiated astrocytes from other glial cells during the development of
the central nervous system)(Eng et al., 2000); CNPase (is a myelin-associated enzyme
that makes up 4% of total central nervous system myelin protein and it is expressed
exclusively by oligodendrocytes and Schwann cells) (Scherer et al., 1994); MAP2
(encodes a protein that belongs to the microtubule-associated protein family which is
thought to be involved in microtubule assembly, it is an essential step in neurogenesis
and is commonly recognized as a neuronal mid/late marker) (Dehmelt et al., 2004) and
NF–H (for neuronal late marker, is a phosphorylated cytoskeletal intermediate filament
protein expressed in neurons) (Black et al., 1988).
Figure 9 - Characterization of neural-like lineage differentiation of hMSCs in 3-D scaffolds. The
graphic represents qRT-PCR results for representative neural lineage specific genes. D7= 7 days. D14 =
14 days. EDC_0.1% = ≈1kPa. EDC_2.0% = ≈10kPa (n =3,*P < 0.1, **P < 0.05) (Adapted from Her et al.,
2013).
21
It was shown by quantitative reverse transcriptase-polymerase chain reaction
(qRT-PCR) that nestin was found to be at relatively low levels indicating that the neural
plasticity of hMSCs is different from the differentiation pathway of NSCs (Her et al.,
2013). The neuronal lineage genes on soft substrate including B-III tubulin, MAP2 and
NF-H were all obviously elevated in expression levels at days 7 and 14 when compared
to that at day 1 (E ≈ 1 kPa). This result was in agreement with that MSCs in soft
substrate were likely to differentiate into neuronal-like cells (Engler et al., 2006). On
the other hand, the glial lineage specific genes including GFAP and CNPase were
dominantly expressed by hMSCs in stiffer substrates (E ≈ 10 kPa) after 1 week in
culture, indicating that MSCs in the 10 kPa substrate were likely to differentiate into
glial-like cells. Of note was that the expressions of these genes including B III-tubulin
and MAP2 in soft substrate and GFAP and CNPase in stiff substrate were all up-
regulated at day 14 (Her et al., 2013).
In this study, both of the neuronal mid- and late- staged genes were dominantly
up-regulated in the softer substrate after 1 week (Figure 9). MAP2 expression was
significantly increased at 14 days while the NF–H expression was not so evident,
suggesting that the differentiation of hMSCs toward neuronal lineage was a
progressive process and hMSCs might require longer time to become fully matured
neuronal-like cells (Her et al., 2013). So it is possible to induce differentiation of hMSCs
towards neuronal- or glial-like lineages with just the stiffness stimulus.
I.2.3.2 - Manipulation and measurement of cellular forces in MSCs
There are different methods to test stiffness effects in mechanotransduction in
the MSCs. Polyacrylamide hydrogels is one of the most utilized since it can have a
surface with the elasticity that supports myogenic and osteogenic differentiation. The
matrix elasticity is mimicked in vitro with inert polyacrylamide gels with concentrations
of bis-acrylamide crosslinking that sets the desired elasticity (Pelham and Wang, 1997).
Functionalizing the gels with collagen I provides adhesion points to cells (Engler et al.,
2004a; Garcia and Reyes, 2005). Using a well-defined, elastic tunable gel system as
opposed to wrinkling films or degrading collagen gels (Hinz et al., 2001; Wozniak et al.,
2003), Engler et al. provided the first evidence with sparse cultures of MSCs that matrix
22
can specify lineage towards cells with characteristics of neurons, myoblasts, and
osteoblasts .
Although hydrogels will continue to be important in characterizing and
controlling cell-material interactions, other approaches can be used to better
understand how cells sense changes in substrate rigidity.
With the use of microposts we can also control substrate rigidity in which MSCs
grow, different post heights control substrate rigidity, because microposts’ height
determines the degree to which a post bends in response to a horizontal traction force
(Figure 10) (Fu et al., 2010).
On rigid (short) microposts, hMSCs were well spread with prominent, highly
organized actin stress fibers and large focal adhesions. In contrast, cells on soft (long)
microposts had a rounded morphology with prominent microvilli, disorganized actin
filaments and small adhesion complexes (Fu et al., 2010).
Microposts can have advantages when compared with hydrogels because when
checking for the rigidity sensing, it was demonstrated that rigidity sensing occurred at
a micrometer scale, likely between focal adhesions because the nanoscale mechanics
at the top of individual microposts (which could directly impact adhesion receptor
binding) remain unchanged. Another advantage of micropost arrays over hydrogels
was that measured subcellular traction forces could be attributed directly to focal
adhesions. This enables a mapping of the traction forces to individual focal adhesions
Figure 10 - Figure representing analysis of microposts heights (L) by finite-element method (FEM) each
bending in response to applied horizontal traction force (F) of 20 nN. Adapted from Fu et al., 2010.

23
and spatially quantify subcellular distributions of focal-adhesion area, traction force
and focal-adhesion stress (defined as the ratio of traction force to corresponding focal
adhesion area).
It is of interest to know whether or not micropost rigidity could regulate stem
cell lineage commitment, and so it is described that hMSCs plated on micropost arrays
with different post heights (L) and exposed to growth medium did not express
differentiation markers at any micropost rigidity. However in bipotential
differentiation medium supportive of both osteogenic and adipogenic fates (Mcbeath
et al 2004; Beningo et al. 2001) after two weeks of induction, it was observed
substantial osteogenic and adipogenic differentiation on micropost arrays, indicated by
alkaline phosphatase (ALP) activity and formation of lipid droplets (Lip), respectively
(Fu et al., 2010). As expected, micropost rigidity shifted the balance of hMSC fates:
osteogenic lineage was favored on rigid micropost arrays whereas adipogenic
differentiation was enhanced on soft ones. It look micropost rigidity switches hMSCs
between osteogenic and adipogenic lineages but the mechanism by which this rigidity-
dependent switch occurred is not well understood (Fu et al., 2010).
Cultures of MSCs in hydrogels are widely used in mechanotransduction studies,
but the microposts can also be used as another viable option to study MSCs
mechanotransduction since they can also mimic different stiffness (to which hMSCs
appear to respond) and can be used to track traction forces of individual cells by
measuring post bending.

24
I.3 - Project rationale and experimental approach
I.3.1 - Typical MSCs Isolation
Typically, MSCs are isolated and cultured on polystyrene culture dishes (Secco
et al., 2008) and eventually transferred onto compliant substrates after several
passages to assess their plasticity in terms of lineage-specific expression markers, as
reported in case of osteogenic-, myogenic- or neural-like commitment (Engler et al,
2006).
Nevertheless, MSCs might retain memory (Tse and Engler, 2011) from the
extremely high stiffness of polystyrene, possibly restraining their full potential in terms
of lineage commitment.
I.3.2 - Durotaxis, Tissue Elasticity and MSCs “memory”
It has been shown that MSCs, even within shallow durotactic gradients, migrate
towards the stiffer matrix (durotaxis) and then differentiate into a more contractile
cell, but this behavior seems to be hampered by some degree of ‘memory’ that the
cells apparently retain from the previous soft environment from which they migrated
(Tse and Engler, 2011). MSCs can remain plastic and express differentiation program(s)
triggered by stiffness from a region in which they previous resided (Tse and Engler,
2011).

25
Making a closer approach to the durotaxis, it is described that the actomyosin
cytoskeleton maintains polarized morphology and requires tension for durotaxis. Focal
adhesion complexes at the leading edge of cells likely establish critical intracellular
signaling gradients for durotaxis (Tse and Engler, 2011). It was observed that by 21
days, the center of the hydrogel became locally confluent (Figure 11, right), and
because of the mitomycin C treatment (which inhibits cell proliferation), this was in
fact created by all cells undergoing directed migration to the stiffest region of the
hydrogel (Engler et al. 2006). Durotaxis can also be observed in mitomycin C-treated
MSCs plated at higher densities, i.e. 1000 cells/cm2, and again a loss of cells at the
softest regions and an accumulation of cells at the stiffest regions were observed (Tse
and Engler, 2011).
Figure 11 - Images of mitomycin C-treated MSCs on gradient hydrogels (with stiffness gradient, ≈1 to
15 kPa) and their spatial distribution. Hoescht 33342 (blue) and phalloidin (red)-stained mitomycin C-
treated MSCs plated at 250 cells/cm2, illustrate the change in distribution with time. Scale bar is 56.5
µm. Adapted from Tse and Engler, 2011.

26
To study the “memory” of MSCs, Tse and Engler showed that in static
hydrogels, after 7 days, in values of elasticity of 1 and 11 kPa there was expression of
B-III tubulin and MyoD-positive MSCs, respectively, and cells remaining on soft regions
of gradient hydrogels expressed B-III tubulin (Figure 12, open arrowheads). However,
MSCs on the stiffer regions of the gradient displayed a mixed phenotype consisting of
cells positive for MyoD alone (open arrowheads) and those also expressing low
amounts of B-III tubulin (filled arrowheads)(Figure 12). When B-III tubulin and MyoD
fluorescent intensities were quantified and normalized to the non-permissive static
hydrogel, i.e. 11 and 1 kPa hydrogels respectively (Figure 13), MSCs on stiffer regions
had on average a 3-fold higher B-III tubulin fluorescent intensity versus the control
static stiffer hydrogel (11kPa). On the other hand, MSCs on softer regions had less than
a 50% difference in MyoD fluorescence when compared to the cells plated on the
static hydrogel.
Figure 12 - MSCs cultured on 1 and 11 kPa static (top) and gradient (bottom) hydrogels and stained for
B-III- tubulin (red) (neuronal marker) and MyoD (green) (myogenic marker). Open arrowheads indicate
cells expressing either B-III- tubulin or MyoD while filled arrowheads indicate doubly stained cells.
Adapted from Tse and Engler,, 2011.

27
In Figure 13 we can see that B-III tubulin and MyoD intensities were normalized
to MSC intensity on static 11 and 1 kPa hydrogels, respectively. The dashed line
indicates no change of the proteins in the non-permissive static hydrogels (Tse and
Engler, 2011).
This data (Figure 12 and 13) suggests that MSCs can remain plastic and express
specific lineage markers triggered by stiffness from a region in which they previous
resided, the so called “memory” (Tse and Engler, 2011).
I.3.3 - Effects of the stiffness on the MSCs stemness genes
Stiffness can regulate the differentiation potential of MSCs (Engler et al., 2006; Her et
al., 2013; Tse and Engler, 2011). The influence of stiffness on MSCs stemness was also
reported (Her, et al. 2013), namely by evaluating how MSCs marker react to stiffness.
Using 3-D Col–HA scaffolds of 1 and 10 kPa, hMSCS were cultured for 1 or 2 weeks and
then collected for qRT-PCR. From the results, they observed that the expression of
MSC stemness genes (including CD73, CD90 and CD105) was down-regulated during
culture, suggesting that the hMSCs in soft and stiff substrates started to differentiate
under various mechanical stimuli (Figure 14). The gene expression of representative
MSC surface markers remained at a low level after 2 weeks of culture. The gene
expression level of CD73, CD90, and CD105 in stiff substrate was significantly lower
Figure 13 - Quantification of B-III tubulin(grey) and MyoD (black) by MSCs fluorescent intensity on
gradient hydrogels (from 1 to 11 kPa, filled squares) and normalized to the non-permissive static
hydrogels (1 and 11kPa each and only, open circles). Adapted from Tse and Engler, 2011.
28
than that in soft substrate. This suggests that hMSCs in stiff substrate might have
entered a differentiated state earlier than those in soft substrate (Her et al, 2013). So
to maintain hMSCs in a less differentiated state, softer substrates might be necessary
during their isolation and proliferation.
Figure 14 – Graphic represents the results of gene (CD73, CD90 and CD105) expression in MSCs cultured
for 7 days (D7) and 14 days (D14) in the Col–HA scaffolds of EDC 0.1% and EDC2.0% which have stiffness
of approximately 1 and 10 kPa, respectively, and were defined as soft and stiff substrates, respectively.
The results were compared to individual day 1 gene expression levels. Adapted from Her et al., 2013).

29
I.4 - Objectives
It is of interest to understand what would be the effect of isolating MSCs directly
on substrates with stiffness similar to that of neural tissues in terms of their potential
to express neural markers.
We propose to isolate and culture human umbilical cord matrix MSCs directly on
softer substrates, namely hydrogels compliant with neural tissue (1 to 10KPa) and, as a
control, part of the umbilical cord matrix of every sample will be used to isolate MSCs
using normal tissue-culture polystyrene plates (the typical isolation and culture
protocol) and then transferred onto similar hydrogels after several passages on
polystyrene (P1-P5). To study if prolonged culture of MSCs on stiff polystyrene (P2-P5)
will restrain their capacity to express neural markers later on or not when compared to
isolated cells in the hydrogels. We will then assess the differences in expression levels
of specific MSCs markers, but also of makers of neural stem/progenitor cells (nestin)
and specific neural lineage markers, such as neuronal (beta-III-tubulin),
oligodendroglial (O4) and astroglial (GFAP) markers.

30

31
Chapter II -
Materials and
Methods

32

33
II - Materials and methods
II.1 - Materials
II.1.1 - Cell culture
Cell culture dishes were from Corning-Costar. Cell culture Neurobasal○R medium (1x),
MEM-Alpha Medium (1x) and Dubecco’s Phosphate Buffered Saline 10x were from
Gibco○R. 0,05% Trypsin-EDTA (1x), Penicillin(10000 units/ml) / Streptomycin (10mg/ml)
solution and Fungirone○R Amphotericin B (250 µg/ml) were from Invitrogen. MSC-
qualified Fetal Bovine Serum (FBS) was from Hyclone - Thermo. Medium supplement
B27 was from Invitrogen and human recombinant EGF and bFGF were from Peprotech.
BSA was from Calbiochem and proteins used to promote cell attachment Collagen
type-I (COL-1) from rat tail and human Fibronectin (FN) isolated from plasma were
from BD Bioscience and Roche, respectively. All Biological processing was done under
sterile conditions using a class-II biosafety vertical air flow cabinet (HeraSafe HS-18,
Heraeus). The centrifugation was done using a centrifuge 5810 R from eppendorf. Cells
were observed with an Axiovert 40C ZEISS microscope and maintained in a Shel LAB
CO2 Series incubator.
II.1.2 – Polyacrylamide hydrogels
Acrylamide and bis-acrylamide were purchased from Bio-Rad and Applied Chem,
respectively. Ammonium persulfate (APS) and dichlorodimethylsilane,
Tetramethylethylenediamine (TEMED), NHS (N-Acryloxysuccinimide) and 3-
(trimethoxysilyl) propyl methacrylate were from Sigma-Aldrich, Fluka and Santa Cruz
Biotechnology, respectively. The gel polymerization system was Mini protean-3 from
Bio-Rad.
II.1.3 - Immunocytochemistry
Alexa 488-conjugated donkey anti-mouse and Alexa 568-conjugated goat anti-rabbit
antibodies were purchased from Invitrogen. Anti-O4 and anti-Nestin mouse antibodies
and anti-Beta-III-Tubulin and anti-GFAP rabbit antibodies are from R&D, Millipore,

34
Covance and DakoCytomation, respectively. DAPI (4',6-Diamidino-2-phenylindole
dihydrochloride) was from Sigma Aldrich.
II.1.4 – Biological material
II.1.4.1 - Umbilical Cord Samples
Cryopreserved Umbilical Cord Fragments were obtained from pre-existing frozen
samples from Crioestaminal, S.A and from the Cell Biology Lab (Biocant). All samples
were obtained after the informed consent of the donors.
II.1.4.2 - human Mesenchymal Stem Cells (hMSCs)
hMSCs were obtained both by isolation from cryopreserved umbilical cord fragments
or from pre-existing lines from the Cell Biology Lab (Biocant), from the previous work
of Leite, 2011.
II.2 - Methods
II.2.1 – Isolation of Mesenchymal Stem Cells (MSCs) from Umbilical Cord Fragments
(UCFs) in Tissue Culture Plates (TCPs) and Polyacrylamide hydrogels
The isolation of MSCs was adapted from a protocol described by Cristiana O. Leite,
2011. The UCFs normally had to be cut from 5-3 mm long to 1-2 mm long with the help
of a scalpel and forceps. Groups of 15 to 30 fragments were transferred to 21 cm2
tissue culture plate (TCP) or to 24x50 cm polyacrylamide hydrogels (12cm2) and left to
dry for the necessary time (10 to 25 minutes) to promote the attachment of the
fragments to the plastic or hydrogel surface. Once the cord fragments were properly
attached, MSCs proliferation medium [Alpha-MEM supplemented with 10% MSC-
qualified Fetal Bovine Serum (FBS), 1% Penicillin/Streptomycin and 1% Amphotericin
B], was added to the culture plate (the hydrogels were also inside a culture plate), until
all the fragments were totally immersed. The fragments were then cultured for 15 to
20 days in an incubator at 37°C with 5% CO2/95% air and 95% humidity, until MSCs
were migrating out of the UCM pieces and forming well defined colonies (Reinisch et
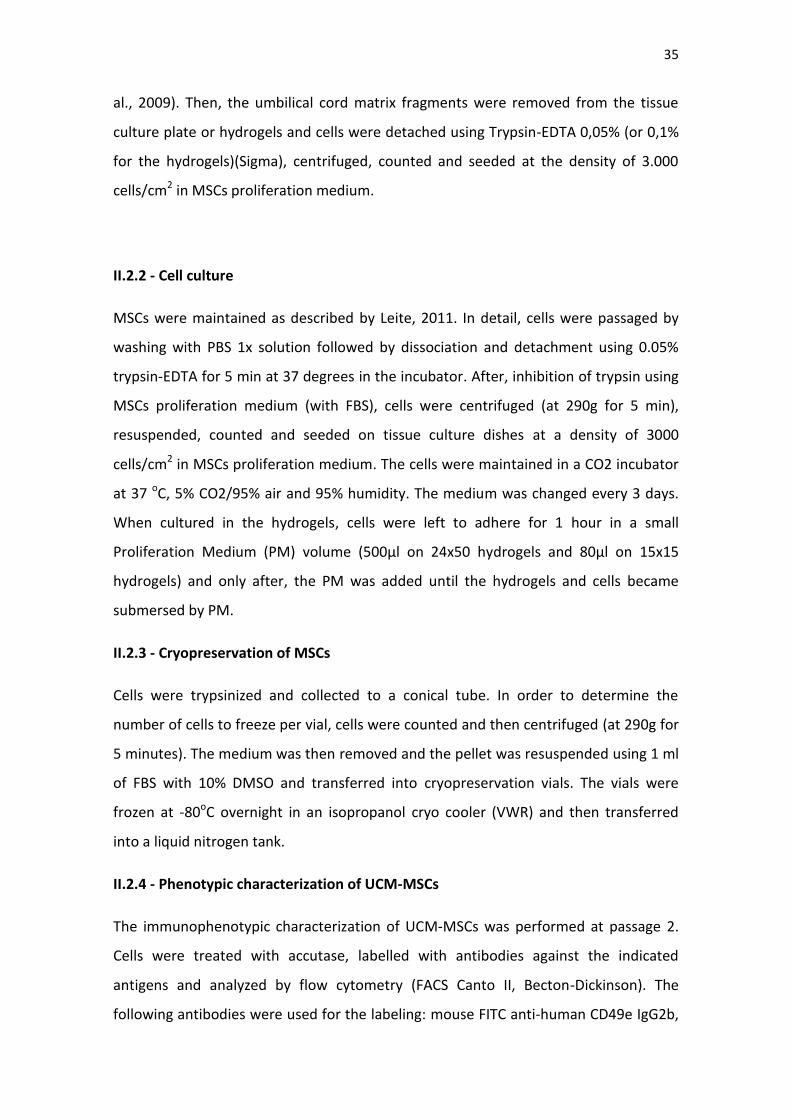
35
al., 2009). Then, the umbilical cord matrix fragments were removed from the tissue
culture plate or hydrogels and cells were detached using Trypsin-EDTA 0,05% (or 0,1%
for the hydrogels)(Sigma), centrifuged, counted and seeded at the density of 3.000
cells/cm2 in MSCs proliferation medium.
II.2.2 - Cell culture
MSCs were maintained as described by Leite, 2011. In detail, cells were passaged by
washing with PBS 1x solution followed by dissociation and detachment using 0.05%
trypsin-EDTA for 5 min at 37 degrees in the incubator. After, inhibition of trypsin using
MSCs proliferation medium (with FBS), cells were centrifuged (at 290g for 5 min),
resuspended, counted and seeded on tissue culture dishes at a density of 3000
cells/cm2 in MSCs proliferation medium. The cells were maintained in a CO2 incubator
at 37 oC, 5% CO2/95% air and 95% humidity. The medium was changed every 3 days.
When cultured in the hydrogels, cells were left to adhere for 1 hour in a small
Proliferation Medium (PM) volume (500µl on 24x50 hydrogels and 80µl on 15x15
hydrogels) and only after, the PM was added until the hydrogels and cells became
submersed by PM.
II.2.3 - Cryopreservation of MSCs
Cells were trypsinized and collected to a conical tube. In order to determine the
number of cells to freeze per vial, cells were counted and then centrifuged (at 290g for
5 minutes). The medium was then removed and the pellet was resuspended using 1 ml
of FBS with 10% DMSO and transferred into cryopreservation vials. The vials were
frozen at -80oC overnight in an isopropanol cryo cooler (VWR) and then transferred
into a liquid nitrogen tank.
II.2.4 - Phenotypic characterization of UCM-MSCs
The immunophenotypic characterization of UCM-MSCs was performed at passage 2.
Cells were treated with accutase, labelled with antibodies against the indicated
antigens and analyzed by flow cytometry (FACS Canto II, Becton-Dickinson). The
following antibodies were used for the labeling: mouse FITC anti-human CD49e IgG2b,

36
clone SAM1; mouse Pe-Cy7 anti-human CD13 IgG1, clone WM15; mouse PE anti-
human CD73 IgG1, clone AD2; mouse APC anti-human CD90 IgG1, clone 5E10; mouse
PO anti-human CD45 IgG1, clone HI30; mouse PB anti-human CD11b IgG1, clone
ICRF44; mouse APC-H7 anti-human HLA-DR IgG2a, clone G46-6. The staining and image
acquisition and analyze
II.2.5 - Preparation of polyacrylamide hydrogels
Since polyacrylamide hydrogels were polymerized on top of autoclaved glass coverslips
(15x15 cm or 24x50 cm), a treatment to allow the establishment of chemical covalent
links between the coverslip and the hydrogel using a silane agent was necessary
(adapted from Hoffecker et al., 2011).
A dilution of 3-(Trimethoxysilyl) propyl methacrylate in ethanol of 1:200 was made and
just before use was added 3% of diluted acetic acid (1:10 glacial acetic acid: water).
This solution was placed on top of cleaned coverslips, allowed to react for 3 minutes
and then the reactive coverslips were rinsed with ethanol to remove the residual
reagent and dried (Hoffecker, et al. 2011).
After the glass coverslips treatment with the silane agent, a saturated solution of N-
Acryloxysuccinimide (NHS) was prepared in toluene and kept covered to prevent
toluene evaporation. The NHS solution was used in the hydrogel composition to allow
the functionalization of the hydrogel surface with covalently bound proteins to allow
for cell adherence. Then, the solution of acrylamide, bis-acrylamide, water and TEMED
(Tetramethylethylenediamine) was prepared according to Table I. The solution was
degassed for 30 min (using a Vacuum Aspiration System from INTEGRA Biosciences).
Afterwards, the solutions of NHS and ammonium persulfate (APS) were added to the
hydrogel solutions and briefly mixed (adapted from Cretu, et al 2010).

37
Table I – Composition of the hydrogels solutions - volume added of each reagent (µL)
per one milliliter of solution.
Volume (µl)
Gel 1 - 15% Acrylamide/ 0,45% Bis-acrylamide Volume (µl)
Gel 2 - 12,5% Acryl/ 0,37% Bis-acryl (µl
Gel 3 - 10% Acryl, 0,3%
Bis-acryl (µl)
Gel 4 - 3% Acryl, 0,2% Bis-
acryl (µl)
Acrylamide 40% 375 312,5 250 75
Bis-acrylamide (2%) 225 185 150 100
NHS 220 220 220 220
APS 10% 3 3 3 3
TEMED 99% 1 1 1 1
Water 176 278,5 376 601
For hydrogels polymerization, each solution (Table I) was poured between the reactive
coverslips (which had been previously adsorbed to a back glass with 1 mm spacers)
and the outer glass of the gel casting system (Mini protean 3, Bio-Rad). In this
platform, the outer glass was treated with a solution of dichlorodimethylsilane in order
to turn it hydrophobic and facilitate the polymerization of an hydrogel with a smooth
surface and its subsequent detachment from the outer glass (Engler et al., 2004). After
polymerization (30 minutes), hydrogels on treated coverslips were washed three times
with PBS, on a rocker, five minutes per wash. The sterilization was made by exposure
to UV light during 30 minutes in an air flow cabinet.
The hydrogels need to be functionalized with proteins that allow cell attachment, since
cells do not adhere to polyacrylamide hydrogels and to mimic the extracellular matrix
(ECM). The proteins were covalently bond to the surface of the hydrogels by a NHS-
ester crosslinking reaction (primary amines with the NHS) on the hydrogel. Collagen
type-I (COL-1) and Fibronectin (FN) were diluted in 1x PBS (when referred COL-1 was
diluted in 0.2N acid acetic, AA) at a concentration of 2.4μg/cm2 and 10ug/ml
respectively. Combination of COL-1/FN was prepared maintaining the concentrations
as previously described.
38
To functionalize the complete surface of the hydrogels its surface were covered with
protein solution, using 500 μL or 70μL for an area of 12 cm2 (24x50 cm coverslips) or
2.25 cm2 (15x15 cm coverslips), respectively. The hydrogels were incubated ON at 4oC
to promote the crosslinking of the proteins with NHS and then were washed once with
PBS. The unreacted NHS was blocked with 1mg/mL heat-inactivated fatty-acid free BSA
(bovine serum albumin) in MEM-α for 30 minutes. BSA solution in PBS (20 mg/ml) was
inactivated in a 68°C water bath for 30 min. Hydrogels were rinsed once with PBS and
placed in a plate with MEM-α 4h to equilibrate. Hydrogels were washed with PBS once
before the cells were seeded (Adapted from Cretu, et al. 2010).
II.2.6 Differentiation protocols
II.2.6.1 adapted from Engler, et al. 2006
In order to see if the cells isolated in TCPs or in the tunable hydrogels had different
plasticity or not, hMSCs were cultured on 10% and 3% acrylamide hydrogels and in
TCP. To inhibit proliferation, cells were exposed to mitomycin C (10 mg/ml) for 2 hr
and washed three times with media prior to plating. Cells were plated at a 3000
Cells/cm2 and let in culture for 7 days. After it, cells were fixated and labelled with anti-
O4 and anti-Nestin mouse antibodies and anti-Beta-III-Tubulin and anti-GFAP rabbit
antibodies.
II.2.7 - Rheological characterization of polyacrylamide hydrogels
The stiffness of hydrogels was determined by rheology using Kinexus Pro rheometer
and rSpace software (Malvern). The hydrogels were prepared and polymerized using a
vertical electrophoresis system with a 1mm spacer (Mini-Protean 3, BioRad) and
equilibrated overnight in PBS, following a similar protocol as for those used for cell
culture, except that the gels were not linked to coverslips neither functionalized with
protein. After zeroing the rheometer, each gel was loaded and trimmed on the bottom
plate. Then, the gap (distance between the top and bottom plates) was defined as
1mm and fine-tuned to a distance at which the gel was applied a normal force of 0.1N.

39
Frequency sweeps were performed from 10 to 0.1Hz (3 reads per decade) with a
deformation of 2mstrain (amount of deformation, has no units), at 37oC. The elastic
modulus (E’, also known as Young’s modulus) was calculated using the formula E’=
2G’(1+ν), where G’ is the complex storage modulus measured by the rheometer at 1 Hz
and ν is Poisson’s ratio, assumed to be 0.5 for materials that do not vary its volume
upon stretch, according to the literature (Moore et al., 2010; Saha et al., 2008)
II.2.8 - Immunocytochemistry
Immunocytochemistry was performed on cells cultured on 96 well plates, coverslips or
on functionalized hydrogels (15x15 cm and 24x50 cm). The medium was removed,
MSCs were washed once with PBS 1x and fixed with 4% paraformaldehyde for 15
minutes at room temperature (RT). The fixing reagent was removed and cells were
washed with PBS 1x three times. To stain cells using antibodies, cells were further
permeabilized with PBS-Triton 0.1% for 20 minutes and for 5 minutes with PBS-Tween
0.1% and then blocked with 1% BSA in PBS fort 30 minutes. The primary antibody (anti
O4 and anti Nestin mouse antibodies and anti Beta-III-Tubulin and anti GFAP rabbit
antibodies) were diluted in PBS 1%BSA at the appropriated dilution (1:200) and
incubated overnight (ON) at 4oC in a humidified atmosphere. The secondary antibodies
used to label the primary antibody, Goat anti-rabbit Alexa-568 (1:200) and Donkey
anti-mouse Alexa-488 (1:200) were diluted in PBS with 1% BSA and let incubating for
1h at room temperature (RT). DAPI was used for nuclear staining, the cells were
incubated with 200ng/ml of DAPI for 5 minutes at RT. For the image acquisition the
stained samples were visualized using a Zeiss Axiovert 200M fluorescence microscope
using AxioVision release 4.8 software (Zeiss). The Image J software was used to analyze
the images.
II.2.9 - Statistical analysis
Statistical analysis was performed by repeated measures one-way ANOVA followed by
Tukey’s test using the software GraphPad Prism (*P<0,05; **P<0,01 and ***P<0,001
for statistically significant differences). Values represent mean ± SEM of at least 3
independent experiments.

40

41
Chapter III
Results

42

43
III – Results
III.1 – Rheological Characterization of Polyacrylamide Hydrogels
To obtain the stiffness values of the polyacrylamide (PA) hydrogels used in this study,
rheological measurements were done using a rheometer. The distinct formulations of
polyacrylamide hydrogels tested were the 15% acrylamide (Ac) and 0.45% Bis-
acrylamide (Bac) and the 12.5% Ac and 0.37% Bac (the Bis-acrylamide will be omited
from now on and we will refer only to the Ac percentage to simplify). Two additional
hydrogels formulations used in this study were already established and characterized
in the laboratory (Lourenço, 2012). These results, together with the ones obtained for
the new PA hydrogels are summarized in Table II.
The Young’s moduli (stiffness) of the hydrogels (E) were calculated from the G’ (shear
storage modulus) values measured at 1Hz, 2mstrain and 37ºC. E can be calculated
using the following formula: E=2G.(1+ν), where G is the complex shear storage
modulus and ν is the Poisson ratio, assumed to be 0.5 (Moore et al. 2010, Saha et al.,
2008). G may be calculated using the formula G=G’+G’’, where G’ is the shear storage
modulus and G’’ is the shear loss modulus, values which are measured by the
rheometer. The shear loss modulus (G’’) was ignored for the calculation of E, since its
contribution to the overall G (complex shear modulus) is neglectable. The frequency of
1HZ was chosen from a frequency sweep, as described in the literature (Saha et al.,
Formulations G' mean ± SD
(Pa) E ± SD (Pa)
≈ E (kPa)
3% Ac + 0.2% Bac* 317.35 ± 99.78 952.05 ± 299.34 1
10% Ac + 0.3% Bac* 2210.85 ± 775.22 6632.55 ± 2325.65 7
12.5% Ac + 0.37% Bac 3250.00 ± 363.27 9750.00 ± 1089.82 10
15% Ac + 0.45% Bac 4003.00 ± 337.13 12009.00 ± 1011.39 12
Table II - Mean ± standard deviation (SD) of the Young’s modulus (E) (amount of force per unit of area
needed to deform the material by a given fractional amount without any permanent deformation)
calculated from the shear modulus measured at 1Hz, according to the formula E= 2G’(1+ν), where G’ is the
shear storage modulus measured by the rheometer and ν is the Poisson ratio, assumed to be 0.5 (Moore
2010). Values represent results of measurement of three independent hydrogels (n=3). * Hydrogels
previously characterized in the laboratory (Lourenço, 2012).

44
2008) and also as previously established in the laboratory (Lourenço, 2012). The
percentage of acrylamide and bis-acrylamide is correlated with the stiffness of the
hydrogels and its increase enhances the Young’s moduli (Table I). The hydrogels
produced had a range of stiffness between ≈12kPa (15% Ac + 0.45% Bac) and ≈1kPa
(3% Ac + 0.2% Bac) (Table II). Being the soft ones compatible with the range of stiffness
described for the brain tissue (Moore et al., 2010) and the stiff ones for better
proliferation (Figure 16), as intended.
III.2 – Cell Adhesion to Polyacrylamide Hydrogels functionalized with
Collagen I (COL-1)
Collagen I (COL-1) is the most abundant type of collagen found in the ECM of
mammalian organisms and it is often used to coat or functionalize substrates for the
culture of a variety of cell types (Badylak, 2005). In order to culture human umbilical
cord matrix mesenchymal stem cells (hUCM-MSCs) on Polyacrylamide hydrogels
functionalized with COL-1, several concentrations of protein were tested to check in
which condition cells would show better adherence. Small protein spots (≈ 2.5mm2)
were created on the ≈7kPa hydrogels using 2 µl of COL-1 solutions at the following
concentrations: 3.125 µg/ml, 6.25 µg/ml, 12.5 µg/ml, 25 µg/ml and 50 µg/ml. Phase-
contrast microscopy images were taken at day 1 and day 6 after seeding the cells (at a
density of 3000 cells/cm2) to assess the adhesion of MSCs during a period of 6 days
(Figure 15). We can clearly see at day 1 that the less the concentration of COL-1 used,
the less MSCs initially adhere and that more cells get a round morphology, indicating
that these cells did not attach very well to the hydrogels and consequently will detach
and/or die. At day 6 we can see that at 3.125 µg/ml there are almost no cells attached;
at 6.25 µg/ml there is an area with almost no adherent cells; at 12.50 µg/ml the spot is
more homogeneous in terms of adhesion and cells are spread and adherent, but still a
lot of free space in the spot when compared with the 25 and 50 µg/ml spots, where we
can easily see almost all the spot filled with adherent cells that present a fibroblastoid-
like healthy morphology. We selected 50 µg/ml as the most suitable protein
concentration, since it promoted the best adhesion from day 1 to day 6.
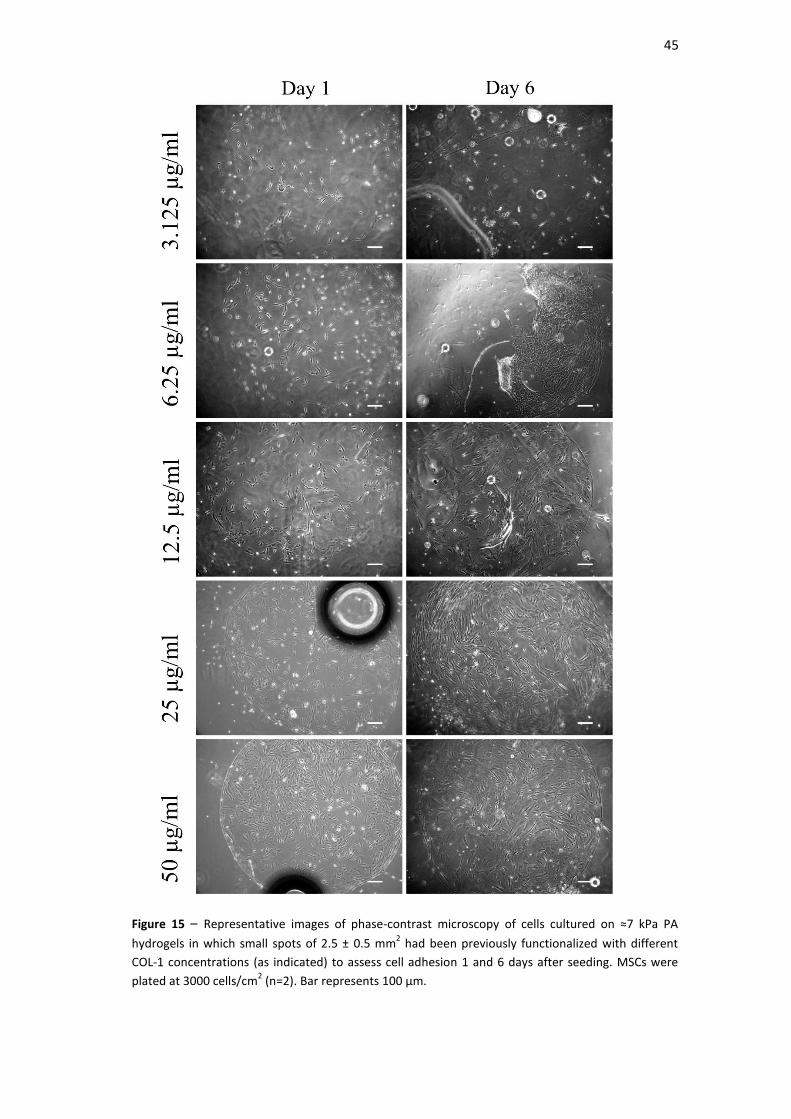
45
Figure 15 – Representative images of phase-contrast microscopy of cells cultured on ≈7 kPa PA
hydrogels in which small spots of 2.5 ± 0.5 mm2 had been previously functionalized with different
COL-1 concentrations (as indicated) to assess cell adhesion 1 and 6 days after seeding. MSCs were
plated at 3000 cells/cm2 (n=2). Bar represents 100 µm.

46
III. 3 – hMSCs Proliferation Assay
Mesenchymal stem cells (MSCs) are known to attach and proliferate on polyacrylamide
hydrogels functionalized with COL-1 (Engler et al., 2004). Hence, we decided to screen
hMSC proliferation on polyacrylamide hydrogels bearing distinct degrees of stiffness
(Figure 16). For that, hMSCs were plated at a density of 3000 cells/cm2 on hydrogels
previously functionalized with 50 µg/ml COL-1 diluted in 1x PBS (PBS) or in acetic acid
(AA). Cells were fixed after 1 or 5 days in culture, stained with DAPI and counted using
a fluorescence microscope. We observed that proliferation was generally higher on the
≈10 kPa hydrogels, especially when COL-1 was diluted in PBS. Although there were no
statistically significant differences, this condition showed slightly increased cell
proliferation when compared to plastic (Figure 16). We also observed that in general,
proliferation in the ≈7kPa and ≈12kPa hydrogels was normally lower than on plastic,
being the lowest in the ≈7kPa hydrogels. In order to proliferate hMSCs in
polyacrylamide hydrogels, the ≈10 kPa was selected for subsequent experiments.
Day 1 Day 5
12
.5%
Ac
PB
S
0
1
2
3
4
5
6
7
8
9
10
Fold
incr
eas
e o
f h
MSC
s
Proliferation Assay of hMSCs in Polyacrylamide Hydrogels from day 1 to day 5
≈12kPa PBS
≈12kPa AA
≈10kPa PBS
≈10kPa AA
≈7kPa PBS
≈7kPa AA
Plastic
Figure 16 – Left and right upper images: Representative fluorescence microscopy images of hMSCs plated on
polyacrylamide hydrogels with 12.5% acrylamide at day 1 (left) and 5 (right) after being fixed and stained with
DAPI (in blue). Size bar corresponds to 200µm. Bottom graphic: Proliferation assay of hMSCs in
polyacrylamide hydrogels, showing the fold increase of the number of cells from day 1 to day 5 (n=3).
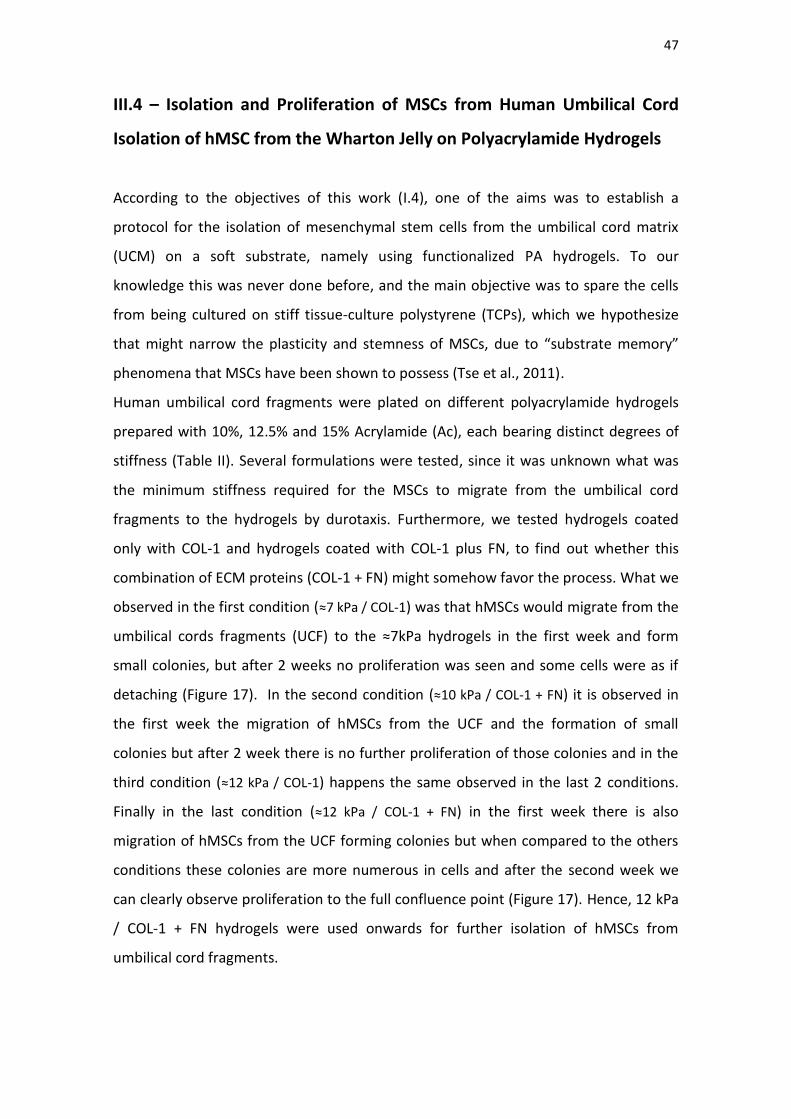
47
III.4 – Isolation and Proliferation of MSCs from Human Umbilical Cord
Isolation of hMSC from the Wharton Jelly on Polyacrylamide Hydrogels
According to the objectives of this work (I.4), one of the aims was to establish a
protocol for the isolation of mesenchymal stem cells from the umbilical cord matrix
(UCM) on a soft substrate, namely using functionalized PA hydrogels. To our
knowledge this was never done before, and the main objective was to spare the cells
from being cultured on stiff tissue-culture polystyrene (TCPs), which we hypothesize
that might narrow the plasticity and stemness of MSCs, due to “substrate memory”
phenomena that MSCs have been shown to possess (Tse et al., 2011).
Human umbilical cord fragments were plated on different polyacrylamide hydrogels
prepared with 10%, 12.5% and 15% Acrylamide (Ac), each bearing distinct degrees of
stiffness (Table II). Several formulations were tested, since it was unknown what was
the minimum stiffness required for the MSCs to migrate from the umbilical cord
fragments to the hydrogels by durotaxis. Furthermore, we tested hydrogels coated
only with COL-1 and hydrogels coated with COL-1 plus FN, to find out whether this
combination of ECM proteins (COL-1 + FN) might somehow favor the process. What we
observed in the first condition (≈7 kPa / COL-1) was that hMSCs would migrate from the
umbilical cords fragments (UCF) to the ≈7kPa hydrogels in the first week and form
small colonies, but after 2 weeks no proliferation was seen and some cells were as if
detaching (Figure 17). In the second condition (≈10 kPa / COL-1 + FN) it is observed in
the first week the migration of hMSCs from the UCF and the formation of small
colonies but after 2 week there is no further proliferation of those colonies and in the
third condition (≈12 kPa / COL-1) happens the same observed in the last 2 conditions.
Finally in the last condition (≈12 kPa / COL-1 + FN) in the first week there is also
migration of hMSCs from the UCF forming colonies but when compared to the others
conditions these colonies are more numerous in cells and after the second week we
can clearly observe proliferation to the full confluence point (Figure 17). Hence, 12 kPa
/ COL-1 + FN hydrogels were used onwards for further isolation of hMSCs from
umbilical cord fragments.

48
III.5 - Immunophenotypic characterization of UCM-MSC
In order to determine if the cells isolated from the Wharton’s jelly on the PA hydrogels
were MSCs, the expression of cell-surface antigens was evaluated at passage 2. As a
1 Week 2 Weeks
≈12
kPa
/ C
OL-
1 +
FN
≈7 k
Pa
/ C
OL-
1 ≈1
0 k
Pa
/ C
OL-
1+F
N
≈12
kP
a /
CO
L-1
Figure 17 – Colonies of hMSCs isolated in different PA hydrogels from UCM-WJ fragments after 1 week and 2 weeks of fragments plating in the hydrogels with just COL-1 or with COL-1 and FN (n=2). Bar corresponds to 200µm.

49
control, we used cells from the same biological sample, whose fragments had been
plated on TCPs and the resulting cells also cultured on plastic until passage 2. The cells
were cultured until subconfluency, detached with accutase and labelled with
antibodies against cell surface markers typically used for the characterization of MSCs
and analyzed by flow cytometry (Figure 18 and 19). Flow cytometry analysis showed
that the cells were strongly positive for CD49e, CD13, CD73 and CD90. In contrast, the
cells did not expresse CD45 (hematopoietic lineage marker), CD11b and HLA-DR. This
analysis showed that the MSCs obtained using the two isolation procedures (on TCPs
or on the PA hydrogels) have similar phenotypic profiles, consistent with an MSC
phenotype (Dominici et al., 2006).
Figure 18 - Immunophenotype of UCM-MSCs. The Y axis is the cell density. The X axis is a logarithmic scale of fluorescence. Cells were detached, labelled with antibodies against the indicated antigens and analyzed by flow cytometry. Cells were positive for CD49e, CD73, CD13 and CD90 (red and green lines) when compared with unlabeled MSCs (dark gray and light gray) for the 2 conditions, both from the PA hydrogels and the Plastic/TCPs (n=1).
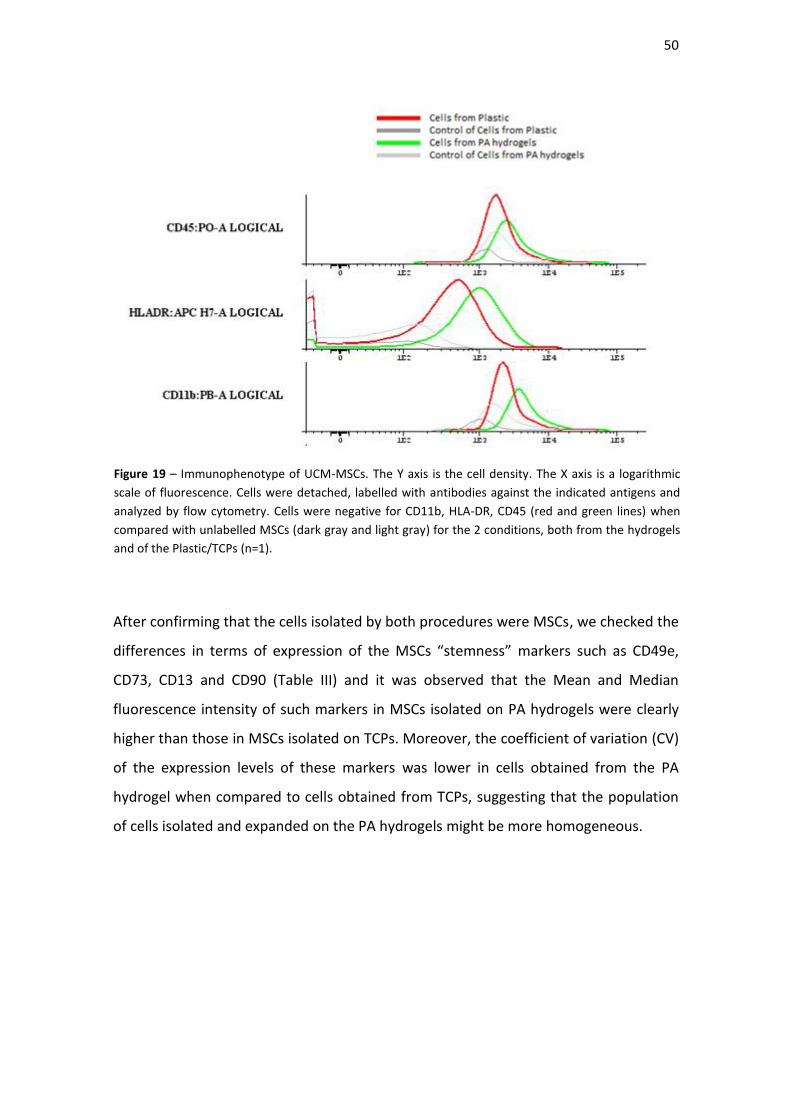
50
After confirming that the cells isolated by both procedures were MSCs, we checked the
differences in terms of expression of the MSCs “stemness” markers such as CD49e,
CD73, CD13 and CD90 (Table III) and it was observed that the Mean and Median
fluorescence intensity of such markers in MSCs isolated on PA hydrogels were clearly
higher than those in MSCs isolated on TCPs. Moreover, the coefficient of variation (CV)
of the expression levels of these markers was lower in cells obtained from the PA
hydrogel when compared to cells obtained from TCPs, suggesting that the population
of cells isolated and expanded on the PA hydrogels might be more homogeneous.
Figure 19 – Immunophenotype of UCM-MSCs. The Y axis is the cell density. The X axis is a logarithmic
scale of fluorescence. Cells were detached, labelled with antibodies against the indicated antigens and
analyzed by flow cytometry. Cells were negative for CD11b, HLA-DR, CD45 (red and green lines) when
compared with unlabelled MSCs (dark gray and light gray) for the 2 conditions, both from the hydrogels
and of the Plastic/TCPs (n=1).

51
III. 6 – Influence on MSCs specification by matrix elasticity
The second part of this work comprises the assessment of the specification of UCM-
MSCs into neural-like cells. The differentiation protocol was adapted from the
literature (Engler et al., 2006), from a study where the strong influence of
microenvironment stiffness on the specification of stem cells was addressed using
MSCs. In that study, cells were directed towards different fates (after inhibition of the
cell cycle progression using mitomycin-C), based only on the stiffness of the PA
hydrogel that served as substrate to the cells. Importantly, cells subjected to very soft
hydrogels (0.1-1 kPa) expressed neuronal lineage markers (like Beta-III tubulin) after 1
week in culture, but not naive mesenchymal stem cells (Engler et al., 2006). In order to
determine if cells isolated and expanded on soft matrices (PA hydrogels) show a higher
plasticity to differentiate towards neural-like lineages [in a more broad sense, not only
neuronal, as addressed by Engler and colleagues (Engler et al., 2006)] than cells
isolated and cultured using the conventional methods, we tested MSCs that were
isolated and expanded on PA hydrogels and cells isolated and expanded on TCPs
(Plastic).
Hence, two experimental setups were used. In the first approach, we used UCM-MSCs
previously obtained and characterized in the laboratory (Leite, 2011), that had been
expanded on TCPs for 5 passages. The cells were then induced towards neural-like
lineages by treating them with mitomycin-C and replating on ~1 kPa PA hydrogels
Markers
CD49e:FITC-A CD73:PE-A CD13:PE Cy7-A CD90:APC-A
PA hydrogel
Cells
Mean 12790 96650 16759 40724
Median 10037 84685 13104 31032
Coefficient of variation 75 52 79 88
TCPs Cells
Mean 7302 46978 8344 17243
Median 5585 39104 6356 13562
Coefficient of variation 82 65 90 97
Table III: Mean, Median and Coefficient of variation of the Fluorescence values obtained by flow
cytometry for the positive MSCs markers (CD49e, CD73, CD13 and CD90) for cells isolated and cultured
on PA hydrogels and from TCPs (n=1).

52
coated with COL-1 (similar to what was described in Engler et al., 2006), or on TCPs as
control. Cells differentiated on TCPs expressed less Beta-III (B-III) tubulin and Nestin (a
neuronal marker and an early neural marker, respectively) than the ones differentiated
on the PA hydrogels. On the other hand, there were no major differences between
cells differentiated on the ≈1kPa and ≈7kPa hydrogels (Figure 20). The expression of
the glial markers tested - O4 and GFAP (markers for oligodendrocyte and astrocyte
commitment, respectively) - was higher in the 10% PA hydrogels for GFAP, while for O4
it was higher in cells plated on TCPs and 10% PA hydrogels when compared with cells
on the softer (3% PA) hydrogels (Figure 21). In general, these results are consistent
with results obtained by others using MSCs cultured in 3D hydrogels (Her et al., 2013),
where glial fates were also favored by stiffer substrates (~10 kPa) and neuronal and
neural precursor markers were favored by softer substrates (~1 kPa).
Figure 20 – hMSCs cultured on TCPs (Plastic) and PA hydrogels coated with COL-1 for 7 days after being
treated with mitomycin C to inhibit proliferation. Cells were stained with anti-B-III tubulin (red), anti-Nestin
antibodies (green) and DAPI (blue). This experiment was performed once (n=1). Bar corresponds to 400µm.

53
The second experimental setup (and the most innovative part of this work) consisted
on isolating MSCs from one biological sample (umbilical cord matrix fragments from
one umbilical cord) in parallel on 12 kPa hydrogels and also on plastic, and cells were
further expanded for 2 passages on 10 kPa hydrogels or plastic, respectively. After 2
passages, cells were replated and induced to differentiate as described above, on PA
Figure 21- hMSCs cultured on TCPs (Plastic) and PA hydrogels coated with COL-1 for 7 days after being
treated with mitomycin C to inhibit proliferation. Cells were stained with anti-GFAP (red), anti-O4
antibodies (green) and DAPI (blue). This experiment was performed once (n=1). Bar corresponds to
400µm.
54
hydrogels of 1 and 7 kPa (for cells originally isolated on hydrogels and on plastic) and
on TCPs (for cells originally isolated on plastic), in order to check if the hard stiffness
from plastic was affecting the cells isolated even at low passages (P2) when compared
to cells that never had contact with hard stiff substrates. All cells were treated with
mitomycin C and let on the aforementioned substrates for 7 days with proliferation
medium (PM) after plating and then stained for BIII tubulin, Nestin, GFAP and O4. The
results (Figure 22 and 23) showed that for Nestin there is not much expression in any
of the conditions but there is a slight increase in the cells isolated and cultured on the
PA hydrogels only (7kPA hydrogels and 1kPa hydrogels) when compared to those that
had contact with the plastic (Plastic, 7kPa hydrogel/TCPs and 1kPA hydrogel/TCPs),
being the 7 kPa hydrogels the condition with highest staining. Expression of Beta-III
tubulin (BIII) seems higher in the cells cultured on 1 kPa hydrogels, both the ones
cultured exclusively on the hydrogels as the ones that were on TCPs (plastic) for 2
passages and then cultured on hydrogels. The expression of BIII tubulin seems to be
lower in cells plated exclusively on plastic, with an increase that can be observed when
the differentiation took place on hydrogels. In terms of O4, it seems that the cells
plated exclusively on the hydrogels (7kPa and 1kPa hydrogels) have more expression
when compared to the other cells that had contact with plastic (Plastic, 7kPa and 1kPa
Hydrogel/TCPs), being the cells plated exclusively on plastic the ones that show lower
O4 expression. Finally, GFAP expression seems to be very similar in all hydrogels being
probably the cells plated exclusively on plastic the ones with less expression of GFAP.
These results suggest that the expression of the oligodendroglial marker O4 is
increased when MSCs are isolated and differentiated on soft substrates (PA hydrogels).
This was also observed, to a lesser extent, regarding the expression of nestin. The
expression of Beta-III tubulin seems to be enhanced when differentiation takes place
on PA hydrogels (soft substrates), but the effect seems to be more independent of the
platform used to isolate the cells.

55
Figure 22 - hMSCs cultured on TCP (Plastic) and PA hydrogels coated with COL-1 for 7 days after being
treated with mitomycin C to inhibit proliferation. Cells on the 7kPa hydrogels and 1kPa hydrogels were isolated on 12 kPa hydrogels as mentioned in III.4. Cells were stained with anti-B-III tubulin (red), anti-Nestin antibodies (green) and DAPI (blue). This experiment was performed once (n=1). Bar corresponds to 200µm.

56
Figure 23 - hMSCs cultured on TCP (Plastic) and PA hydrogels coated with COL-1 for 7 days after being
treated with mitomycin C to inhibit proliferation, the cells on the 7kPa hydrogels and 1kPa hydrogels were isolated on 12 kPa hydrogels as mentioned in III.4. Cells were stained with anti-GFAP (red), anti-O4 antibodies (green) and DAPI (blue). This experiment was performed once (n=1) for GFAP and twice for O4 (n=2). Bar corresponds to 200µm.

57

58
Chapter IV –
Discussion and
Conclusion

59

60
Discussion
MSCs are widely used in vitro for purposes of regenerative medicine, tissue
engineering or in vitro screening due to their ability to proliferate, to form colonies of
cells similar to fibroblasts (Friedenstein et al., 1970) and finally due to their
multipotent capacity (can differentiate into osteoblasts, chondroblasts, myoblasts and
adipocytes) (Prockop, 1997; Nardi and da Silva Meirelles, 2006). MSCs may be isolated
from adult tissues such as bone marrow and adipose tissue (Friedenstein et al., 1974;
Zuk et al., 2001), but sometimes due to the insufficient amount of cells that can be
obtained from these sources, or even because MSCs proliferation frequency and
differentiation capacity decrease with age, it is necessary to get alternative sources,
such as UCM, UCB and placenta. The collection of these extra-embryonic tissues (that
are normally discarded at birth) is both easy and non-harmful to the donor, thus the
ethical issues are avoided (Weiss et al., 2006). When working with in vitro cell culture,
an important factor to keep in mind is the influence of the conditions used to culture
such cells and the same is valid when using MSCs, even more when the main objective
is cellular differentiation, because cellular response might be hampered by the in vitro
culture conditions. There is a need to mimic the in vivo conditions (to reproduce the
cellular in vivo environment) to the highest and reasonable extent possible using for
example soluble factors, ECM elements and mechanical cues.
In this study, our main focus was to address the effects of changing the biophysical
microenvironment (namely stiffness) of hMSCs, by isolating and culturing the cells on
stiff TCPs and on soft hydrogels, using the latter to mimic stiffness of human tissues
(namely the brain) and its effect on the differentiation potential of hMSCs.
During this work, some components had to be optimized, such as the concentration of
the ECM protein COL-1 to which hMSCs would adhere the best, the stiffness in which
hUCM-MSCs would migrate from UCF towards the PA hydrogel and the stiffness for
higher hMSCs proliferation ratio. Our approach was to identify the conditions that
would allow us to isolate hUCM-MSCs on the hydrogels, since it was never done before,
to our knowledge, in order to use a differentiation protocol to assess the difference in
neural markers when compared to hUCM-MSCs isolated on TCPs (Plastic).

61
The mechanical aspects of the hydrogels were approached with the objective to obtain
PA hydrogels slightly stiffer than those already established in the laboratory, which
spun from ~1 to ~7 kPa (Lourenço, 2012), in order to have a broader range of stiffness
where cells could be able to migrate (durotaxis) from the UCM to the hydrogels. We
obtained formulations that produced hydrogels presenting Young’s moduli ranging
from 10kPa and 12kPa (Table II). Both stiffness moduli were useful in this study and
used for cell expansion and hUCM-MSCs isolation, respectively.
Initially, hMSCs were plated on PA hydrogels functionalized with COL-1 spots with
different concentrations of protein (3.125 µg/ml, 6.25 µg/ml, 12.5 µg/ml, 25 µg/ml and
50 µg/ml), to assess in which concentration the adhesion of the hMSCs was more
stable (during 6 days). As expected, we observed that the 25 µg/ml and 50 µg/ml were
the best conditions with a slight better initial adhesion for the 50 µg/ml condition.
Probably because hMSCs in the first 24h are still recovering from the trypsin digestion
and do not have all the membrane adhesion proteins recovered, they need a higher
protein concentration to adhere on those 24h, thus the best initial results were on 50
µg/ml, but after recovering in the 25 µg/ml, cells can also stabilize and fill the whole
spot, as observed in Figure 15.
As above mentioned, the hMSCs proliferation in different PA hydrogels was assessed,
using 7kPa, 10 kPa and 12 kPa hydrogels in order to understand in which stiffness cells
would proliferate better for expansion, but still using a range of stiffness much lower
than the plastic. When culturing hMSCs for 5 days on the PA hydrogels, we could
observe that the 10 kPa hydrogel formulation was the one with higher fold increase in
cell number on day 5 compared to day 1, and when comparing to plastic, the cells on
the 10 kPa hydrogel with 1xPBS showed even higher proliferation (although not
statistically significant). In a general view, the cells on the 7kPa hydrogels were the
ones with less fold increase. These results are in agreement with the literature (Winer
et al., 2009), since BM-MSCs cultured on substrates with stiffness bellow 7kPa are
described to have much less proliferation.
One of our aims was to establish a protocol for the isolation of mesenchymal stem
cells from the umbilical cord matrix on a soft substrate, namely using functionalized PA
hydrogels. And as it can be observed in Figure 17 it was accomplished but several
differences between stiffness and coating were noticed. For the simple purpose of
62
isolating MSCs on the PA hydrogels, even the softest hydrogels tested (7kPa) would do,
but as we need to expand those cells, proliferation of the colonies was necessary. And
that was only accomplished on the hardest hydrogels (12 kPa) and with the help of
fibronectin. First, when we tried to isolated hUCM-MSCs on PA hydrogels it was
observed that the MSCs were migrating from the UCM to all hydrogels but the best
colonies were in the 12kPa hydrogels, with a slight improvement comparing to the
10kPa ones. But cells were not proliferating on any COL-1 functionalized hydrogels, so
to understand if it was a question of a biochemical ECM-like stimulus that was lacking,
we decided to add 1 more ECM protein present in the ECM - fibronectin (FN) - to see if
cells would respond better and trigger hMSCs proliferation. Fibronectin, together with
collagen-I, is one of the most abundant proteins of the Wharton’s jelly ECM (Hao et al.,
2013). The FN concentration tested (10 µg/ml) was the one already established in the
laboratory, known to provide sufficient adherence to MSCs on PA hydrogels (Loureiro,
2012). As we can observe in Figure 17, the presence of fibronectin was a crucial factor
for the successful accomplishment of this experiment because it allowed us to isolate
hMSC on the 12kPa hydrogels and thus keep the stiffness in low values as intended for
better differentiation in a further step. For reasons of time constrains, it was not
possible to fully evaluate the MSCs response to FN alone (since in our project only
“COL-1” and “COL-1 + FN” was tested). In the future, to better screen the effect of FN
in the isolation of hUCM-MSCs on PA hydrogels, we should test 12 kPa PA hydrogels
with the 3 conditions: COL-1, COL-1 + FN and FN.
It is interesting to observe that for MSCs that had already been isolated and
proliferated in vitro, it was sufficient to provide them with COL-1 to achieve
proliferation on PA hydrogels, but for de novo isolation and proliferation of these cells,
the presence of FN was required. It has been described that naive MSCs express high
levels of integrin α5β1, the main receptors of adhesion for FN (Goessler et al., 2008) -
the CD49e marker expressed by MSCs (Figure 18 and Table III) is an epitope of integrin
α5 subunit - and that when stimulated to differentiate this receptor lose expression as
if they were no longer needed. Being so, if MSCs stop needing these receptors as they
differentiate maybe they do need FN to adhere and proliferate when they are very
naive (which is the case of hMSCs isolated in the PA hydrogels). It was also shown that
FN plays a role in migration of MSCs via integrin α5β1 (Veevers-Lowe et al., 2011). We
63
may speculate that FN provides cells with additional migration (Veevers-Lowe et al.,
2010) and proliferation stimuli (Hung et al., 2013), activating intracellular signaling
pathways that may be required for cell cycle entry. At least in quiescent smooth
muscle cells, which are also mesenchymal cells, FN has an important role in promoting
the cell cycle entry in the presence of soluble growth factors (Roy et al., 2002). Since it
is thought that MSCs on their native tissues are essentially quiescent (namely arrested
in the G0 phase of the cell cycle), we may speculate that initiation of proliferation may
also have been triggered in our in vitro experiments by FN in presence of the soluble
growth factors present in the proliferation culture medium.
In order to determine if the cells isolated from the Wharton’s jelly on the PA hydrogels
were MSCs, the expression of cell-surface antigens was evaluated at passage 2. In
Figures 18 and 19 we can see that the cells isolated from UCM on the TCPs and PA
express typical MSCs markers. From a close observation it looks like both populations
(MSCs isolated from TCPs and PA hydrogels) are very homogeneous, meaning that
both isolation processes are very efficient. The population of hMSCs obtained from the
PA hydrogels might be more homogeneous than the population obtained from the
plastic, as suggested by the lower coefficient of variation obtained by flow cytometry
of the first compared to the latter (Table III). When observing the fluorescence obtain
by flow cytometry (Table III) for the positive MSCs markers (CD49e, CD73, CD13 and
CD90) for cells isolated and cultured on PA hydrogels and from TCPs, it is noticeable
that hMSCs isolated from the PA hydrogels have higher mean and median fluorescence
intensity values (roughly the double) when compared to hMSCs isolated from plastic.
This indicates that hMSCs might be retaining more those typical MSCs markers when
isolated and cultured on soft PA hydrogels than on stiff plastic, which is in line with
results described in the literature (Her et al., 2013), where gene expression analysis of
MSC markers were maintained at higher levels in MSCs differentiated in 3D soft
hydrogels than on stiffer hydrogels. These results suggest that maybe MSCs maintain
more their properties of naive MSCs on soft than on stiff substrates.
As for our objective to differentiate MSCs in PA hydrogels and assess the differences in
the cells isolated on PA hydrogels and on plastic, first we attempted to see if we could
repeat what was described in literature (Engler et al., 2006). In the first approach,
when we used cells previously obtained and characterized in the laboratory (Leite,
64
2011) and expanded on TCPs for 5 passages, our results were consistent with what was
already described in literature (Engler et al., 2006), that cells differentiated on soft PA
hydrogels express more BIII tubulin than the ones plated on plastic (Figure 20). We
could also confirm what had been referred, although not much detailed (Engler et al.,
2006) that Nestin was also less expressed in cells plated on the plastic when compared
to the ones plated in soft PA hydrogels. These results confirm that stiffness itself is
capable of stimulating hMSCs to express some neuronal markers. When we looked at
glial markers (GFAP and O4) we could observe that the stiffness can also direct MSCs
towards a glial-like differentiation (Figure 21), as referred in the literature using 3D
hydrogels (Her et al., 2013). Moreover, we observed that there is a small range of
stiffness (between 1kPa and 7kPa) from where MSCs can undergo neuronal- or glial-
like specification, being the softest substrates (1 kPa) more compliant with neuronal
and the hardest substrates (7 kPa) more compliant with glial phenotypes, in agreement
with what was described in the literature in promoting the differentiation of neural
stem cells into neuronal or glial fates (Saha et al., 2008) and maturation of primary
oligodendrocytes (Kippert et al., 2009). To be able to distinguish better in which point
the stiffness stimulus favors neuronal- or glial-like differentiation we would need to
test more substrates with stiffness between the ones tested. There was also
expression of O4 by cells cultured on plastic (Figure 21), which is somehow consistent
with the observed tendency of glial markers on stiffer substrates.
In the second experimental setup, looking at B-III tubulin, it is possible to see that cells
cultured on plastic have less expression than on hydrogels, but it is not very clear if
there is a difference between the cells isolated on PA hydrogels and plated on 1kPa
and 7kPa and the cells isolated and plated on plastic until passage 2 and then plated on
the 1kPa and 7kPa hydrogels (Figure 22). Nevertheless, the tendency of higher
expression of this marker on soft substrates remains. Possibly if cells had been
cultured for a longer period on plastic before being transferred onto hydrogels, this
difference would have been more evident. The higher levels of B-III tubulin observed
on cells that were cultured for only 2 passages on plastic and then plated on hydrogels
(Figure 22) comparing with cells from the first experimental setup, which had been in
culture already for 5 passages on plastic and then transferred to hydrogels (Figure 20)
might be explained by the longer culture period of the latter on a stiff substrate, which

65
may have caused the cells to lose some plasticity towards neuronal-like lineages, in
line with the “memory” issue of MSCs (Tse and Engler, 2011) already discussed in the
Introduction section. When observing Nestin, the expression was very low in cells in all
conditions. Nevertheless, it could be detected in cells that were isolated, expanded
and differentiated on hydrogels (Figure 22), but not in cells isolated and differentiated
on plastic, or those isolated on plastic and plated on hydrogels (Figure 22). Although
these results require confirmation, they suggest that cells isolated, expanded and
differentiated on soft substrates display expression of nestin. It was previously
reported that the gene expression levels of neural progenitor markers Nestin and Sox2
were quiet low on MSCs differentiated in 3D hydrogels, yet the conditions in which the
levels were higher were hydrogels with lower stiffness (~1 kPa rather than ~10 kPa;
Her et al., 2013), which is in agreement with our observations. When observing the
results for O4 (figure 23) we can see that MSCs isolated on plastic and then cultured on
hydrogels have less expression than the ones exclusively plated on hydrogels. This
might indicate that MSCs isolated on plastic are more restrained in terms of
differentiation and thus can not express O4 as high as the cells isolated on PA
hydrogels. In terms of GFAP expression (Figure 23) all cells seems to express the same
with maybe a little less expression in the cells plated on plastic.
It will be important to confirm the results regarding the isolation of MSCs on soft
substrates and the subsequent differentiation experiments. Also, it will be interesting
to follow cells isolated and cultured on hydrogels and on TCPs for several passages (as
originally proposed in the project) and assess their differentiation potential along each
passages. This was not possible to perform due to time constrains that occurred due to
difficulties in identifying the adequate conditions for the isolation of MSCs on
hydrogels. Nevertheless, this objective was achieved and to our knowledge, for the
first time.

66

67
Conclusion
In conclusion, we optimized a new hMSCs isolation protocol for MSCs from UCM,
allowing us to obtain naive hMSCs with a more homogenous population when
compared to the isolation in TCPs. The PA hydrogels used for the isolation are
commonly used in mechanotransduction experiments, but neither this specific
formulation neither the isolation of hUCM-MSCs was ever done before in PA hydrogels
to the best of our knowledge.
We can conclude that FN together with substrate stiffness have an important role in
the initial proliferation impulse of hMSCs when cultured on soft substrates, namely at
10kPa (Figure 17), since on softer hydrogels (7kPa) hUCM-MSCs did not proliferate.
Even on hard hydrogels (10kPa) without FN and only COL-1, hMSCs also did not
proliferate.
Preliminary results (Figure 18, 19 and Table III) show what appears to be a more naive
and more homogenous population of hMSCs isolated and cultured on the PA hydrogels,
since the typical MSCs markers studied are more expressed in the hMSCs from PA
hydrogels than from TCPs.
Finally, it seems that neural markers (B-III tubulin, Nestin, O4 and GFAP) are more
expressed in differentiating hMSCs plated on soft hydrogels than on plastic for hMSCs
expanded for 5 passages on plastic. In terms of hMSCs isolated exclusively on PA
hydrogels, the differences between these and hMSCs isolated on plastic were not very
evident, but O4 seems to be more expressed in cells isolated on soft PA hydrogels.
The added value of this work was discovery of the FN importance for the successful
isolation of hUCM-MSCs on soft substrates and more importantly the establishment of
a new hMSCs isolation protocol using 12kPa PA hydrogels adding new possibilities for
future studies in terms of maintenance and differentiation of hUCM-MSCs in vitro, and
to dissect the involvement of several important players, such as soluble factors, ECM
proteins and mechanotransduction elements.

68

69
III. References
Allingham, J.S., Smith, R., and Rayment, I. (2005). The structural basis of blebbistatin inhibition and specificity for myosin II. Nat. Struct. Mol. Biol. 12, 378–379.
Anzalone, R., M. Lo Iacono, et al. (2010). New emerging potentials for human Wharton’s jelly mesenchymal stem cells: immunological features and hepatocyte-like differentiative capacity. Stem Cells and Development 19(4): 423-438.
Aubin, J.E. (1998). Biochem. Cell Biol. 76, 899–910. Badylak, S.F. (2005). Regenerative medicine and developmental biology: the role of the extracellular matrix. Anat. Rec. B New Anat. 287:36- 41. Bard, J.B., and Hay, E.D. (1975). The behavior of fibroblasts from the devel- oping avian cornea. Morphology and movement in situ and in vitro. J. Cell Biol. 67, 400–418.
Bauer, N.G. and ffrench-Constant, C. (2009). Physical forces in myelination and repair: a question of balance? Journal of Biology: 8:78
Beningo, K.A., Dembo, M., Kaverina, I., Small, J.V. & Wang, Y.-L. (2001) J. Cell Biol. 153, 881–888.
Berbari, N.F., O’Connor, A.K., Haycraft, C.J., and Yoder, B.K. (2009). The primary cilium as a complex signaling center. Curr. Biol. 19, R526–R535.
Bieback, K., Kern, S., Klüter, H., Eichle, H. (2004). Critical Parameters for the Isolation of Mesenchymal Stem Cells from Umbilical Cord Blood. Stem Cells 22(4): 625-634.
Bisgrove, B.W., and Yost, H.J. (2006). The roles of cilia in developmental disorders and disease. Development 133, 4131–4143. Black M, Lee V. (1988) Phosphorylation of neurofilament proteins in intact neurons: demonstration of phosphorylation in cell bodies and axons. J Neurosci;8:3296–305. Burkholder, T. J. (2007). Mechanotransduction in skeletal muscle. Front. Biosci. 12, 174- 191. Caplan, A. (2009). Why are MSCs therapeutic? New data: new insight. The Journal of Pathology 217(2): 318-324. Choquet, D., Felsenfeld, D.P., and Sheetz, M.P. (1997). Extracellular matrix rigidity causes strengthening of integrin-cytoskeleton linkages. Cell 88, 39–48. Christopher S. Chen (2008). Journal of Cell Science. doi:10.1242/jcs.0235073285 Conconi, M., P. Burra, Di Liddo, R., Calore, C., Turetta, M., Bellini, S., Bo, P., Nussdorfer, G.G., Parnigotto, P.P. (2006). CD105(+) cells from Wharton's jelly show in vitro and in vivo myogenic differentiative potential." INTERNATIONAL JOURNAL OF MOLECULAR MEDICINE 18: 1089-1096.
70
Cretu, A., Castagnino, P. & Assoian, R. (2010). Studying the Effects of Matrix Stiffness on Cellular Function using Acrylamide-based Hydrogels. Journal of Visualized Experiments, doi:10.3791/2089. Crouzier, T., Fourel, L., Boudou, T., Albige` s-Rizo, C., and Picart, C. (2011). Presentation of BMP-2 from a soft biopolymeric film unveils its activity on cell adhesion and migration. Adv. Mater. 23, H111–H118. da Silva Meirelles, L., A. Caplan, Nardi, N.B.. (2008). In Search of the In Vivo Identity of Mesenchymal Stem Cells. Stem Cells 26(9): 2287-2299. Davies, P. F., Mundel, T. and Barbee, K. A. (1995). A mechanism for heterogeneous endothelial responses to flow in vivo and in vitro. J. Biomech. 28, 1553-1560. Dehmelt L, Halpain S. (2004). The MAP2/tau family of microtubule-associated proteins. Genome Biol;6:204 del Rio, A., Perez-Jimenez, R., Liu, R., Roca-Cusachs, P., Fernandez, J.M., and Sheetz, M.P. (2009). Stretching single talin rod molecules activates vinculin binding. Science 323, 638–641. Discher, D. E., Janmey, P. and Wang, Y. L. (2005). Tissue cells feel and respond to the stiffness of their substrate. Science 310, 1139-1143.
Dogterom, M., Kerssemakers, J.W., Romet-Lemonne, G., and Janson, M.E. (2005). Force generation by dynamic microtubules. Curr. Opin. Cell Biol. 17, 67–74.
Dominici, M., K. Le Blanc, et al. (2006). Minimal criteria for defining multipotent mesenchymal stromal cells. The International Society for Cellular Therapy position statement. Cytotherapy 8(4): 315-317. Duband, J.L., Nuckolls, G.H., Ishihara, A., Hasegawa, T., Yamada, K.M., Thiery, J.P., and Jacobson, K. (1988). Fibronectin receptor exhibits high lateral mobility in embryonic locomoting cells but is immobile in focal contacts and fibrillar streaks in stationary cells. J. Cell Biol. 107, 1385–1396. Duncan, R. L. and Turner, C. H. (1995). Mechanotransduction and the functional response of bone to mechanical strain. Calcif. Tissue Int. 57, 344-358. Eng LF, Ghirnikar RS, Lee YL. Glial fibrillary acidic protein: GFAP-thirty-one years (1969–2000). Neurochem Res 2000;25:1439–51. Engler, A. J., Griffin, M. a, Sen, S., Bönnemann, C. G., Sweeney, H. L., & Discher, D. E. (2004). Myotubes differentiate optimally on substrates with tissue-like stiffness: pathological implications for soft or stiff microenvironments. The Journal of cell biology, 166(6), 877–87. doi:10.1083/jcb.200405004 Engler, A. J., Sen, S., Sweeney, H. L., & Discher, D. E. (2006). Matrix elasticity directs stem cell lineage specification. Cell, 126(4), 677–89. doi:10.1016/j.cell.2006.06.044
71
Eyckmans, J. et al., 2011. A hitchhiker’s guide to mechanobiology. Developmental cell, 21(1), pp.35–47. Available at: http://www.ncbi.nlm.nih.gov/pubmed/21763607 [Accessed March 8, 2012]. Friedenstein, A.J. et al. (1974). Precursors for fibroblasts in different populations of hematopoietic cells as detected by the in vitro colony assay method. Experimental hematology 2, 83-92. Goh Jih Her, Hsi-Chin Wu, Ming-Hong Chen, Ming-Yi Chen, Shun-Chih Chang, Tzu-Wei Wan. Control of three-dimensional substrate stiffness to manipulate mesenchymal stem cell fate toward neuronal or glial lineages. Acta Biomaterialia 9 (2013) 5170–5180 Hao, H., Chen, G., Liu, J., Ti, D., Zhao, Y., Xu, S., … Han, W. (2013). Culturing on Wharton’s Jelly Extract Delays Mesenchymal Stem Cell Senescence through p53 and p16INK4a/pRb Pathways. PloS one, 8(3), e58314. doi:10.1371/journal.pone.0058314 Her, G. J., Wu, H.-C., Chen, M.-H., Chen, M.-Y., Chang, S.-C., & Wang, T.-W. (2013). Control of three-dimensional ssubtrate stiffness to manipulate mesenchymal stem cell fate toward neuronal or glial lineages. Acta biomaterialia, 9(2), 5170–80. doi:10.1016/j.actbio.2012.10.012 Hermann, A. et al. Comparative analysis of neuroectodermal differentiation capacity of human bone marrow stromal cells using various conversion protocols. Journal of neuroscience research 83, 1502-14 (2006). Hoffecker, I. T., Guo, W.-h. & Wang, Y.-l. (2011). Assessing the spatial resolution of cellular rigidity sensing using a micropatterned hydrogel–photoresist composite. Lab on a Chip 11, 3538, doi:10.1039/c1lc20504h. Huang, S., Chen, C.S. & Ingber, D.E., 1998. Control of cyclin D1, p27(Kip1), and cell cycle progression in human capillary endothelial cells by cell shape and cytoskeletal tension. Molecular biology of the cell, 9(11), pp.3179–93. Hung, H.-S., Tang, C.-M., Lin, C.-H., Lin, S.-Z., Chu, M.-Y., Sun, W.-S., … Hsu, S. (2013). Biocompatibility and favorable response of mesenchymal stem cells on fibronectin-gold nanocomposites. PloS one, 8(6), e65738. doi:10.1371/journal.pone.0065738 Katsetos CD, Herman MM, Mörk SJ. Class III b-tubulin in human development and cancer. Cell Motil Cytoskeleton 2003;55:77–96. Kippert, A., Fitzner, D., Helenius, J. & Simons, M. (2009). Actomyosin contractility controls cell surface area of oligodendrocytes. BMC Cell Biology 10, 71, doi:10.1186/1471-2121-10-71 Lourenço, T. (2012). Regulation of ECM mimetics during oligodendrocytes differentiation in vitro. In Life Science (Coimbra: University of Coimbra)

72
McBeath, R. et al., 2004. Cell shape, cytoskeletal tension, and RhoA regulate stem cell lineage commitment. Developmental cell, 6(4), pp.483–95. Moore, S.W., Roca-Cusachs, P. & Sheetz, M.P., 2010. Stretchy Proteins on Stretchy Substrates: The Important Elements of Integrin-Mediated Rigidity Sensing. Developmental Cell, 19(2), pp.194–206. Owen, M. and A. Friedenstein (1988). Stromal Stem Cells: Marrow-Derived Osteogenic Precursors. Ciba Foundation Symposium 136 - Cell and Molecular Biology of Vertebrate Hard Tissues, John Wiley & Sons, Ltd.: 42-60. Park, K.-S., Y.-S. Lee, et al. (2006). In vitro neuronal and osteogenic differentiation of mesenchymal stem cells from human umbilical cord blood. J Vet Sci 7(4): 343-348. Paszek, M. J. and Weaver, V. M. (2004). The tension mounts: mechanics meets morphogenesis and malignancy. J. Mammary Gland Biol. Neoplasia 9, 325-342. Peyton, S. R. and Putnam, A. J. (2005). Extracellular matrix rigidity governs smooth muscle cell motility in a biphasic fashion. J. Cell Physiol. 204, 198-209. Pelham, R. J., Jr and Wang, Y. (1997). Cell locomotion and focal adhesions are regulated by substrate flexibility. Proc. Natl. Acad. Sci. USA 94, 13661-13665. Prockop, D. (1997). Marrow Stromal Cells as Stem Cells for Nonhematopoietic Tissues. Science 276(5309): 71-74. Reinisch, A. & Strunk, D. (2009). Isolation and animal serum free expansion of human umbilical cord derived mesenchymal stromal cells (MSCs) and endothelial colony forming progenitor cells (ECFCs). Journal of visualized experiments: JoVE 4-7 .doi:10.3791/1525 Roy, J., Tran, P. K., Religa, P., Kazi, M., Henderson, B., Lundmark, K., & Hedin, U. (2002). Fibronectin promotes cell cycle entry in smooth muscle cells in primary culture. Experimental cell research, 273(2), 169–77. doi:10.1006/excr.2001.5427 Rosen, E.D. & Spiegelman, B.M. (2000). Annu. Rev. Cell Dev. Biol. 16, 145–171. Rutishauser, U. (1984). Developmental biology of a neural cell adhesion molecule. Nature 310, 549–554. Sadoshima, J., Takahashi, T., Jahn, L., and Izumo, S. (1992). Roles of me- chano-sensitive ion channels, cytoskeleton, and contractile activity in stretch-induced immediate-early gene expression and hypertrophy of cardiac myocytes. Proc. Natl. Acad. Sci. USA 89, 9905–9909. Saha, K. et al. (2008). Substrate Modulus Directs Neural Stem Cell Behavior. Biophysical Journal 95, 4426-4438, doi:10.1529/biophysj.108.132217
73
Sanchez-Ramos, J., S. Song, et al. (2008). The potential of hematopoietic growth factors for treatment of Alzheimer's disease: a mini-review. BMC Neuroscience 9(Suppl 2): S3. Scherer SS, Braun PE, Grinspan J, Collarini E, Wang DY, Kamholz J. (1994). Differential regulation of the 20,30-cyclic nucleotide 30-phosphodiesterase gene during oligodendrocyte development. Neuron;12:1363–75. Schmidt, C.E., Horwitz, A.F., Lauffenburger, D.A., and Sheetz, M.P. (1993). Integrin-cytoskeletal interactions in migrating fibroblasts are dynamic, asymmetric, and regulated. J. Cell Biol. 123, 977–991. Secco, M., E. Zucconi, et al. (2008). Multipotent Stem Cells from Umbilical Cord: Cord Is Richer than Blood! Stem Cells 26(1): 146-150. Sims, J.R., Karp, S., and Ingber, D.E. (1992). Altering the cellular mechanical force balance results in integrated changes in cell, cytoskeletal and nuclear shape. J. Cell Sci. 103, 1215–1222. Somogyi, K. and Rorth, P. (2004). Evidence for tension-based regulation of Drosophila MAL and SRF during invasive cell migration. Dev. Cell 7, 85-93. Sordella, R., Jiang, W., Chen, G. C., Curto, M. and Settleman, J. (2003). Modulation of Rho GTPase signaling regulates a switch between adipogenesis and myogenesis. Cell 113, 147-158. Taghizadeh, R., K. Cetrulo, et al. (2011). Wharton’s Jelly stem cells: Future clinical applications. Placenta 32, Supplement 4(0): S311-S315. Takashima, Y., T. Era, et al. (2007). Neuroepithelial Cells Supply an Initial Transient Wave of MSC Differentiation. Cell 129(7): 1377-1388. Veevers-Lowe, J., Ball, S. G., Shuttleworth, A., & Kielty, C. M. (2011). Mesenchymal stem cell migration is regulated by fibronectin through α5β1-integrin-mediated activation of PDGFR-β and potentiation of growth factor signals. Journal of cell science, 124(Pt 8), 1288–300. doi:10.1242/jcs.076935 Wallingford, J.B. (2010). Planar cell polarity signaling, cilia and polarized ciliary beating. Curr. Opin. Cell Biol. 22, 597–604. Wallingford, J.B., and Mitchell, B. (2011). Strange as it may seem: the many links between Wnt signaling, planar cell polarity, and cilia. Genes Dev. 25, 201–213. Wang, H.-S., S.-C. Hung, et al. (2004). Mesenchymal Stem Cells in the Wharton's Jelly of the Human Umbilical Cord. Stem Cells 22(7): 1330-1337.

74
Wang, N., Butler, J.P., and Ingber, D.E. (1993). Mechanotransduction across the cell surface and through the cytoskeleton. Science 260, 1124–1127. Weber, K. T., Jalil, J. E., Janicki, J. S. and Pick, R. (1989). Myocardial collagen remodeling in pressure overload hypertrophy. A case for interstitial heart disease. Am. J. Hypertens. 2, 931-940. Weiss, M. and D. Troyer (2006). "Stem cells in the umbilical cord." Stem Cell Reviews and Reports 2(2): 155-162. Westerhof, N. and O’Rourke, M. F. (1995). Haemodynamic basis for the development of left ventricular failure in systolic hypertension and for its logical therapy. J. Hypertens. 13, 943-952. Winer, Jessamine P.; Janmey, Paul A.; McCormick, Margaret E.; Funaki, Makoto 2009 Goessler, U. R., Bugert, P., Bieback, K., Stern-Straeter, J., Bran, G., Hörmann, K., & Riedel, F. (2008). Integrin expression in stem cells from bone marrow and adipose tissue during chondrogenic differentiation. International journal of molecular medicine, 21(3), 271–9. Wislet-Gendebien, S., G. Hans, et al. (2005). Plasticity of Cultured Mesenchymal Stem Cells: Switch from Nestin-Positive to Excitable Neuron-Like Phenotype. Stem Cells 23(3): 392-402. Wozniak,M.A., Desai,R., Solski,P.A., Der,C.J., and Keely, P.J. (2003). ROCK-generated contractility regulates breast epithelial cell differen- tiation in response to the physical properties of a three-dimensional collagen matrix. J. Cell Biol. 163, 583–595. Wu, K. H., B. Zhou, et al. (2007). In vitro and in vivo differentiation of human umbilical cord derived stem cells into endothelial cells. Journal of Cellular Biochemistry 100(3): 608-616. Yamada, S., Pokutta, S., Drees, F., Weis, W.I., and Nelson, W.J. (2005). Deconstructing the cadherin-catenin-actin complex. Cell 123, 889–901. Zhang, H.-T., J. Fan, et al. (2010). Human Wharton’s jelly cells can be induced to differentiate into growth factor-secreting oligodendrocyte progenitor-like cells. Differentiation 79(1): 15-20. Zeddou, M., A. Briquet, et al. (2010). The umbilical cord matrix is a better source of mesenchymal stem cells (MSC) than the umbilical cord blood. Cell Biology International 34(7): 693-701. Zuk, P., M. Zhu, et al. (2001). Multilineage Cells from Human Adipose Tissue: Implications for Cell-Based Therapies. Tissue Engineering 7(2): 211-228.