apresentação de dados coletados pelo flurry sobre os hábitos de uso de aplicativos pelos...
TRANSCRIPT

Christina Choy | Market Research Manager | B2B Strategic Insights
Mobile Insights
2
3
4
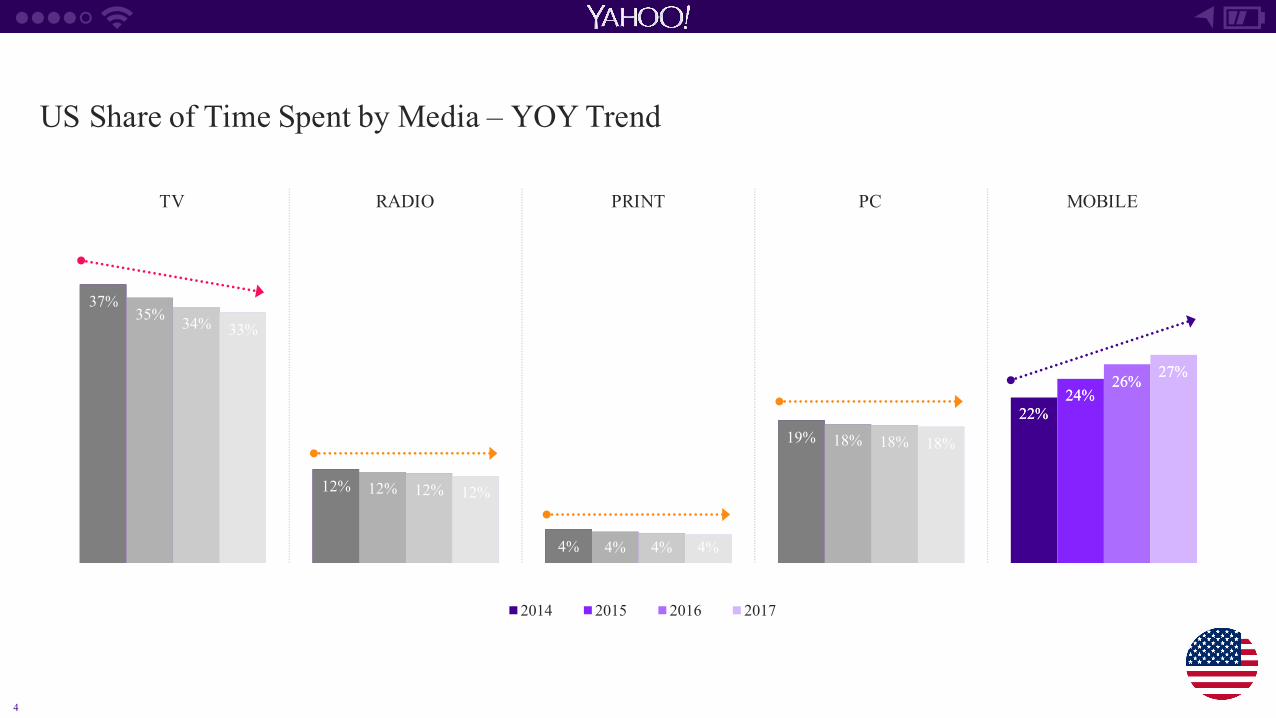
US Share of Time Spent by Media – YOY Trend
37%
12%
4%
19%22%
35%
12%
4%
18%
24%
34%
12%
4%
18%
26%
33%
12%
4%
18%
27%
2014 2015 2016 2017
37%
12%
4%
19%22%
35%
12%
4%
18%
24%
34%
12%
4%
18%
26%
33%
12%
4%
18%
27%
TV RADIO PRINT PC MOBILE

5
In Brasil, time spent with internet is growing rapidlyDAILY MEDIA USERS IN BRASIL
65%
26%21%
6% 1%
73%
37%30%
7% 2%
2013 2014
TV INTERNET RADIO NEWSPAPERS MAGAZINES

6
Mobile phones nearly as popular as PC computers for internet access in BrasilDEVICES MOST FREQUENTLY USED TO ACCESS THE INTERNET ACCORDING TO CONSUMERS IN BRASIL, NOV 2014
71% 66%7%
COMPUTER MOBILE TABLET
7
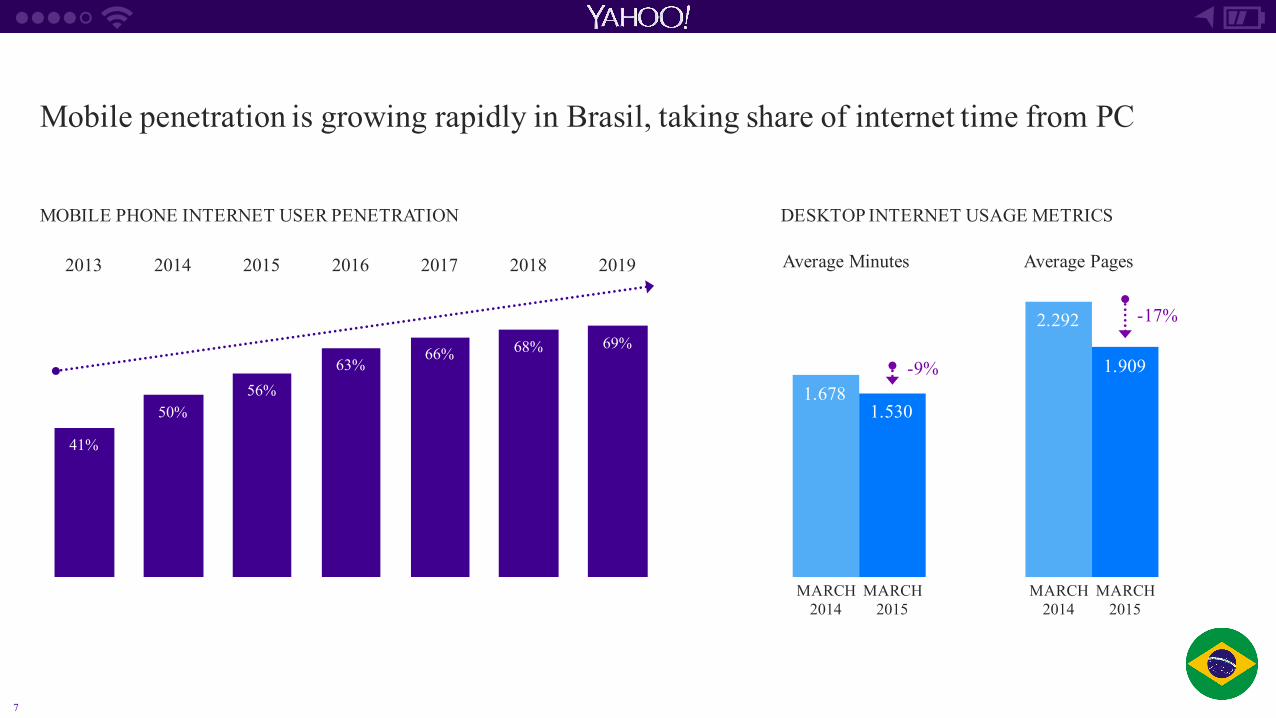
1.678
2.292
1.530
1.909
Mobile penetration is growing rapidly in Brasil, taking share of internet time from PC
DESKTOP INTERNET USAGE METRICS
MARCH2014
MARCH2015
MARCH2014
MARCH2015
41%
50%56%
63%66% 68% 69%
2013 2014 2015 2016 2017 2018 2019
MOBILE PHONE INTERNET USER PENETRATION
Average Minutes Average Pages
-9%
-17%
8
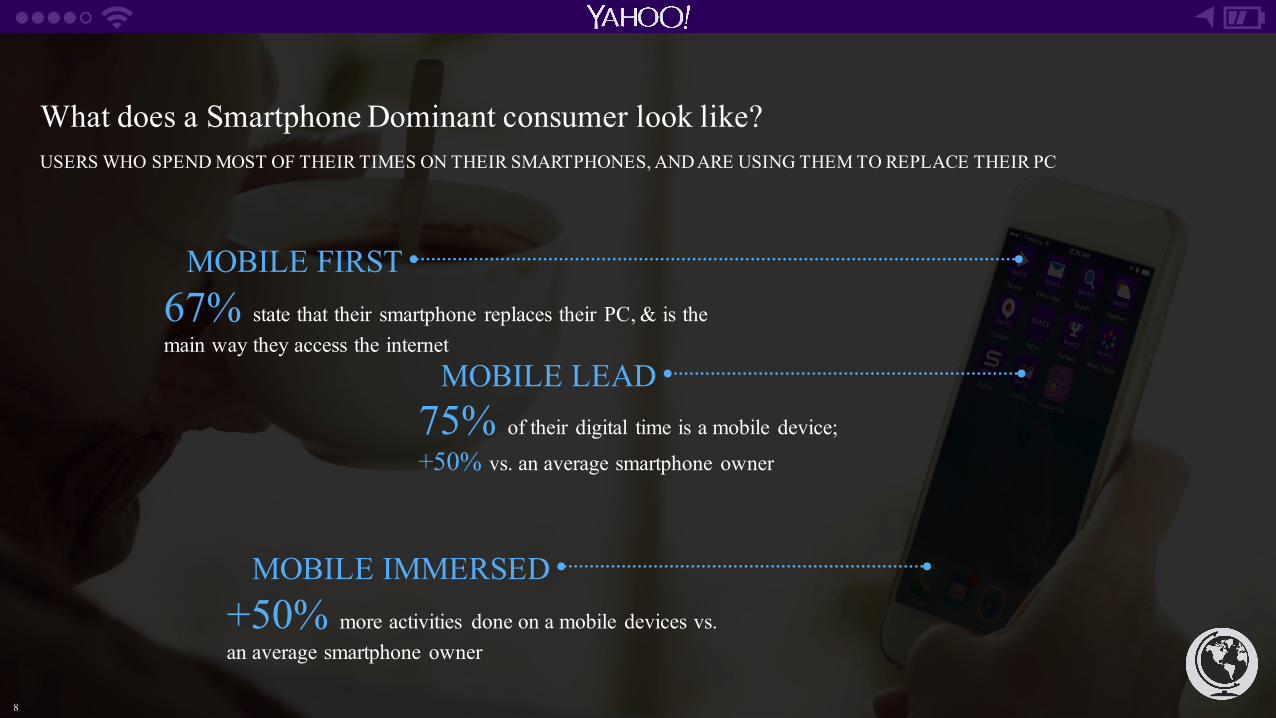
What does a Smartphone Dominant consumer look like? USERS WHO SPEND MOST OF THEIR TIMES ON THEIR SMARTPHONES, AND ARE USING THEM TO REPLACE THEIR PC
MOBILE FIRST67% state that their smartphone replaces their PC, & is the main way they access the internet
MOBILE LEAD75% of their digital time is a mobile device;
+50% vs. an average smartphone owner
MOBILE IMMERSED+50% more activities done on a mobile devices vs. an average smartphone owner
8
9
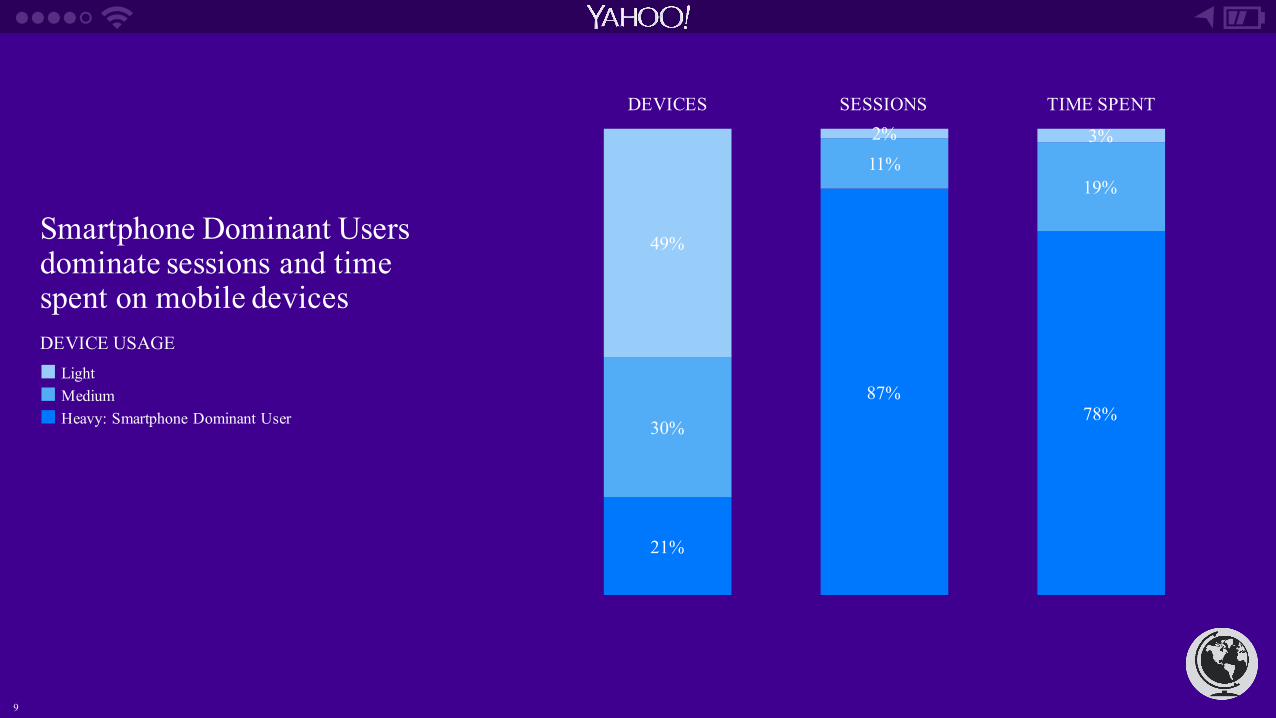
21%
87%78%
30%
11%19%
49%
2% 3%
DEVICES SESSIONS TIME SPENT
Smartphone Dominant Users dominate sessions and time spent on mobile devicesDEVICE USAGE¢ Light¢ Medium¢ Heavy: Smartphone Dominant User
10
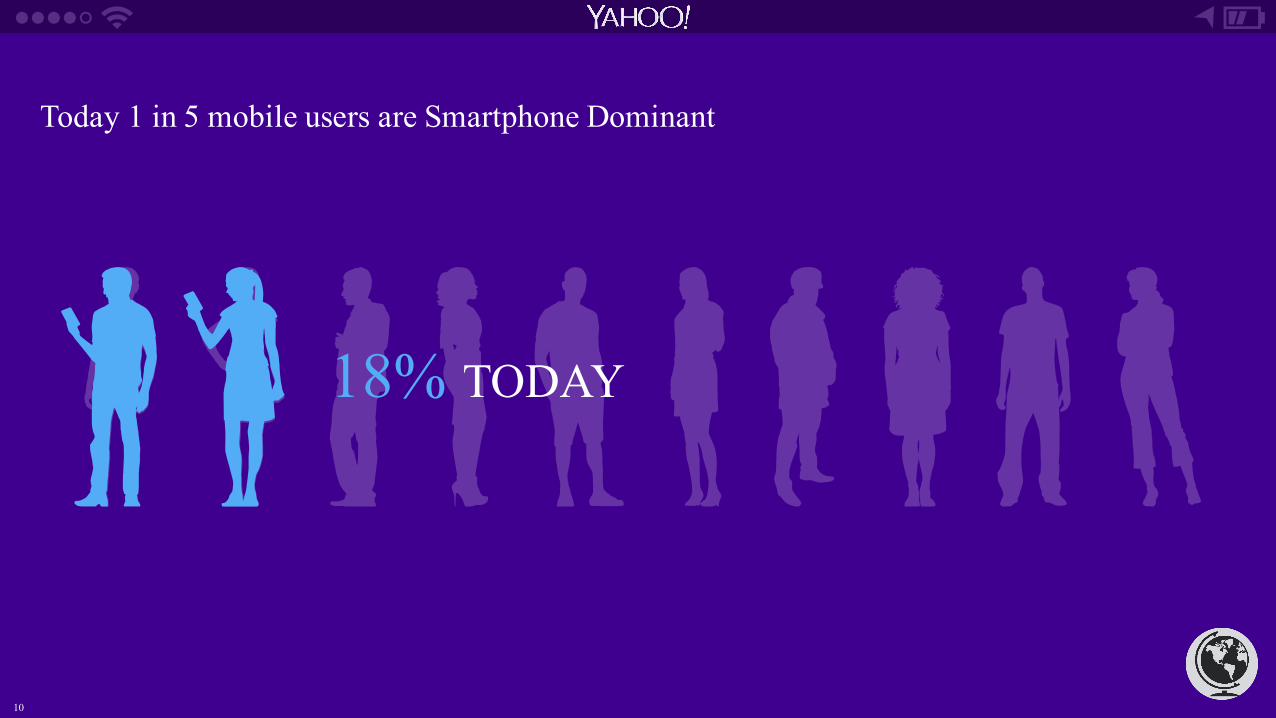
Today 1 in 5 mobile users are Smartphone Dominant
18% TODAY
11
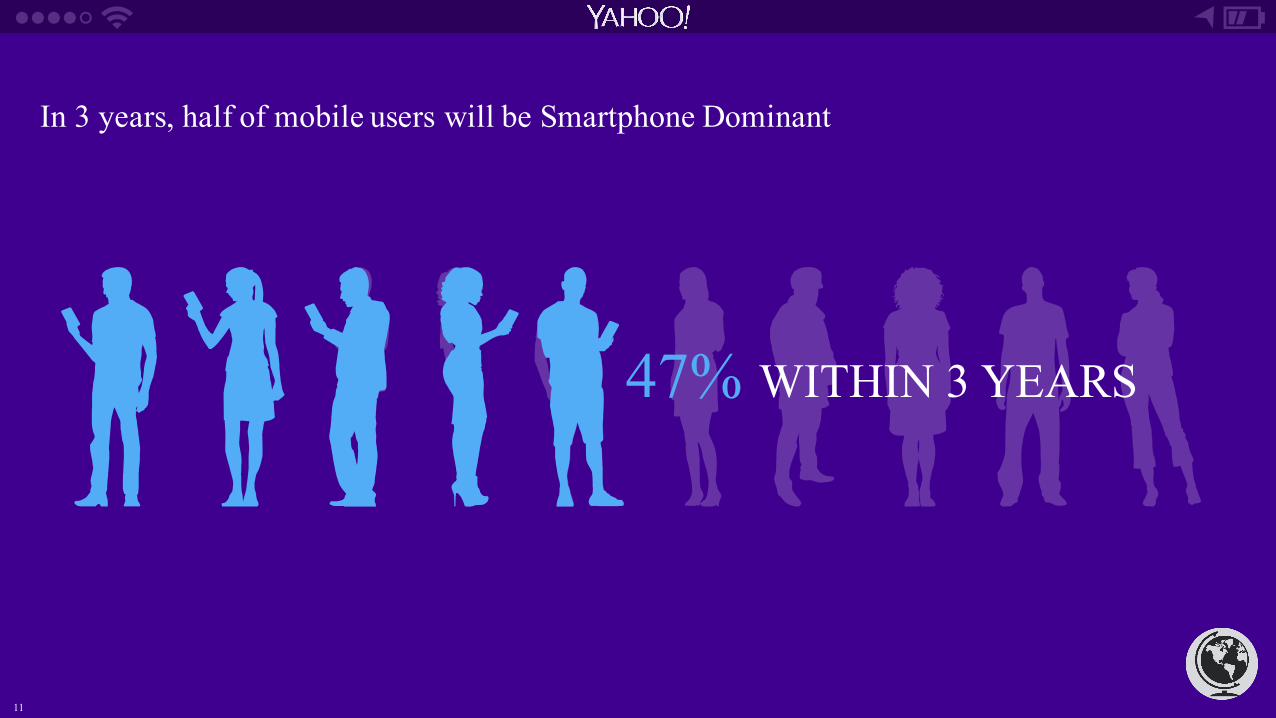
In 3 years, half of mobile users will be Smartphone Dominant
47% WITHIN 3 YEARS
12
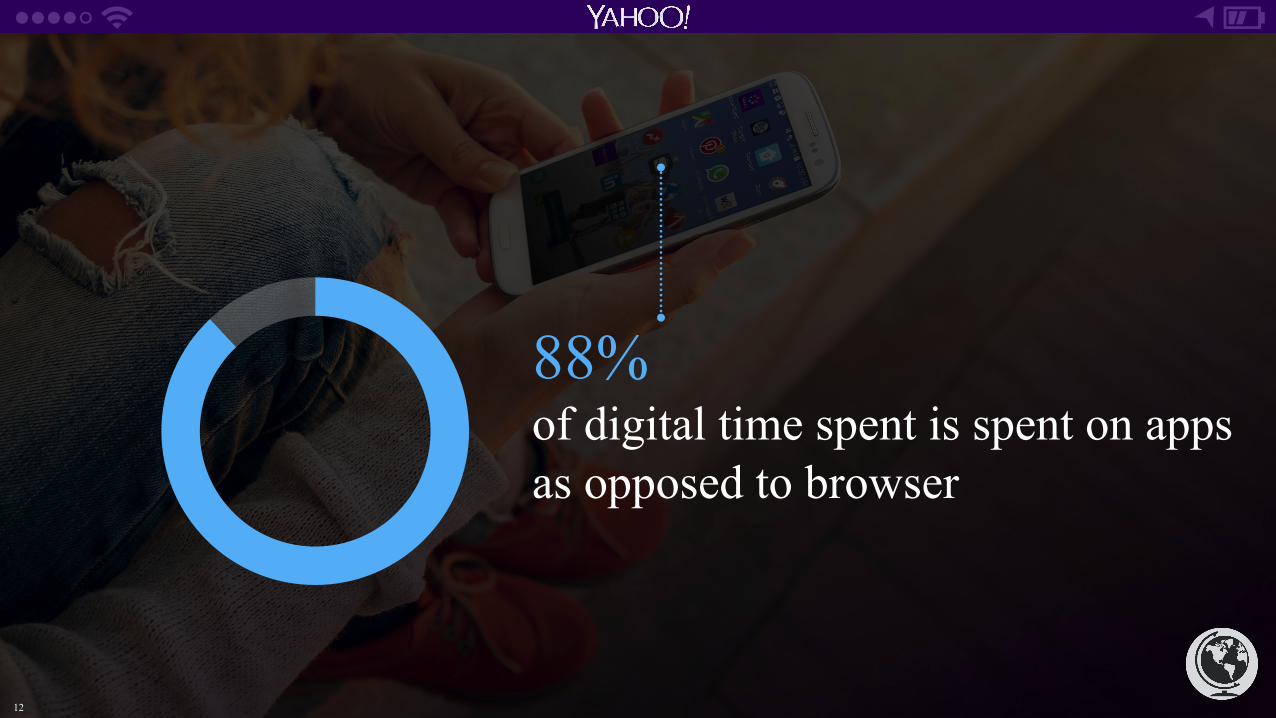
88% of digital time spent is spent on apps as opposed to browser
12
13
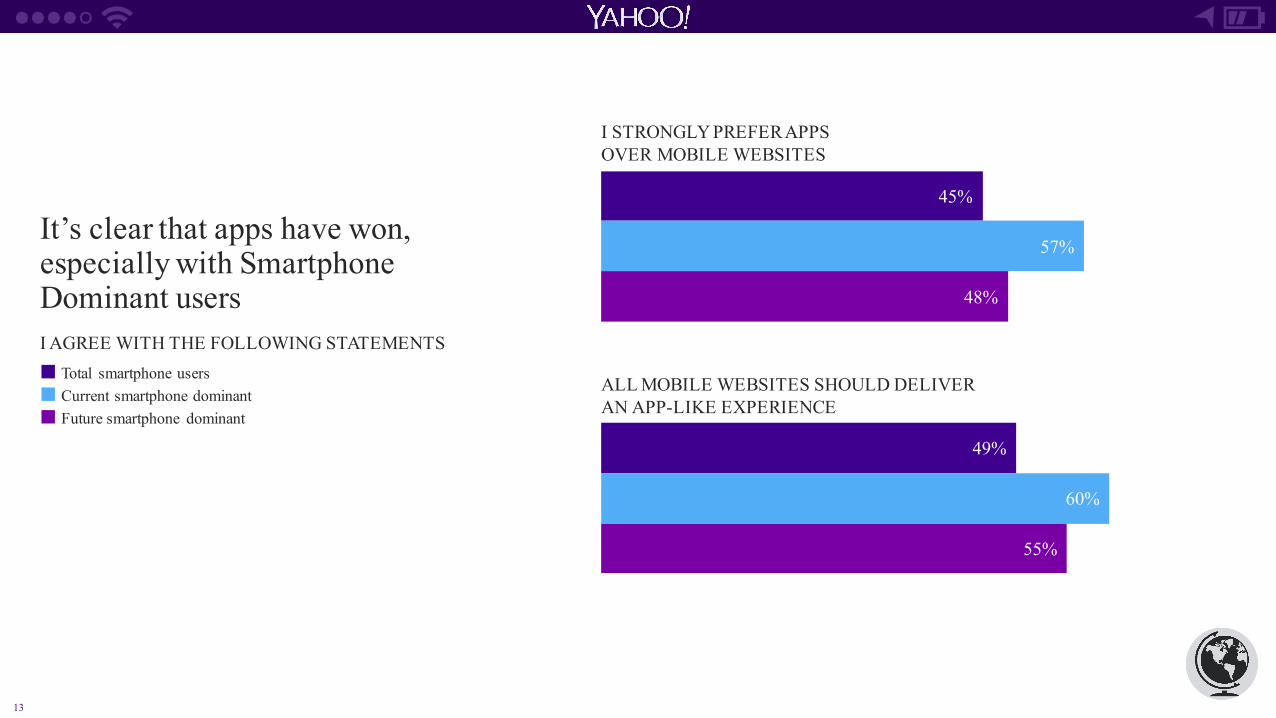
It’s clear that apps have won, especially with Smartphone Dominant usersI AGREE WITH THE FOLLOWING STATEMENTS¢ Total smartphone users¢ Current smartphone dominant¢ Future smartphone dominant
45%
49%
57%
60%
48%
55%
I STRONGLY PREFER APPS OVER MOBILE WEBSITES
ALL MOBILE WEBSITES SHOULD DELIVER AN APP-LIKE EXPERIENCE
14
A DAY IN THE LIFE OF A
MOBILE APP USERFlurry Research & Insights
14
15
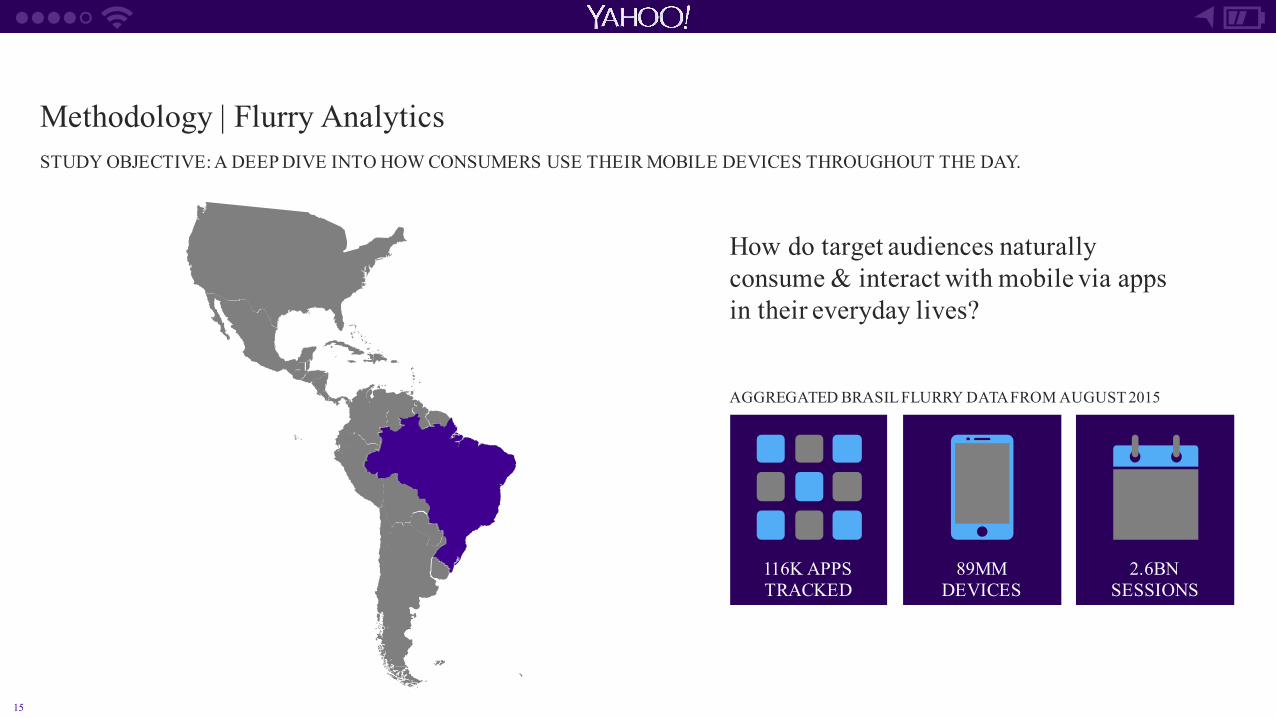
Methodology | Flurry AnalyticsSTUDY OBJECTIVE: A DEEP DIVE INTO HOW CONSUMERS USE THEIR MOBILE DEVICES THROUGHOUT THE DAY.
How do target audiences naturally consume & interact with mobile via apps in their everyday lives?
116K APPS TRACKED
89MMDEVICES
2.6BNSESSIONS
AGGREGATED BRASIL FLURRY DATA FROM AUGUST 2015
16
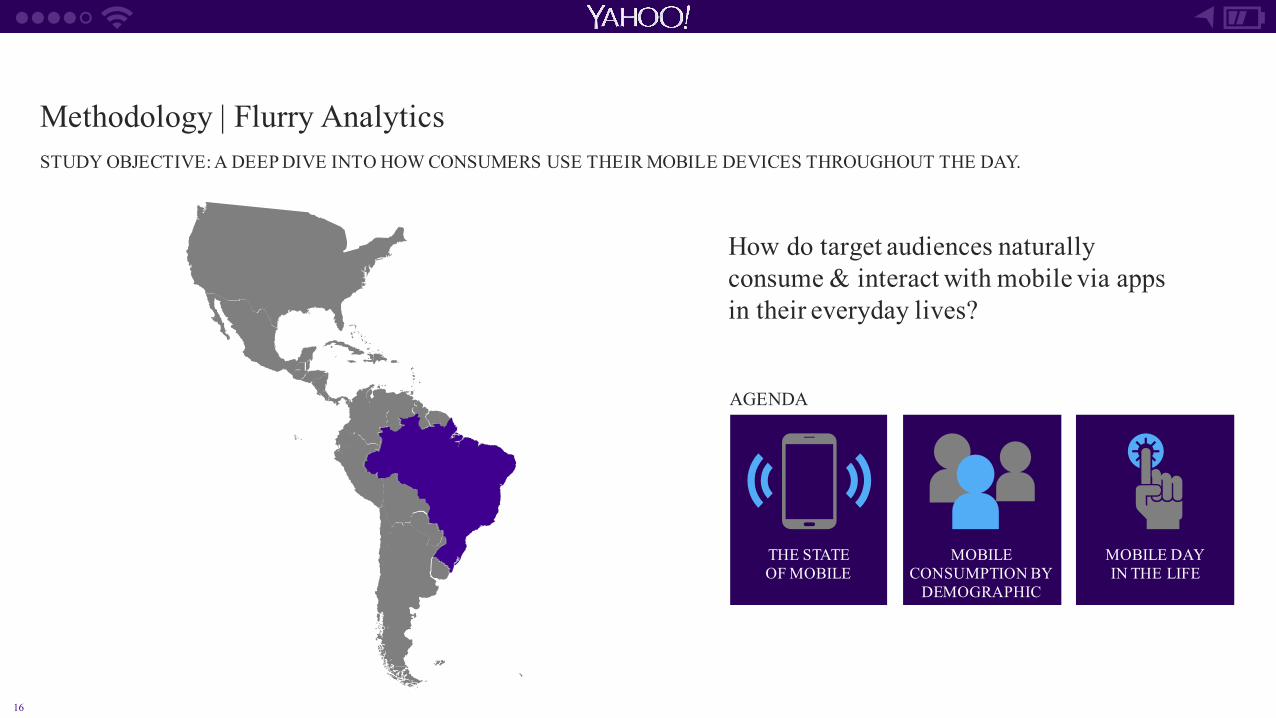
Methodology | Flurry AnalyticsSTUDY OBJECTIVE: A DEEP DIVE INTO HOW CONSUMERS USE THEIR MOBILE DEVICES THROUGHOUT THE DAY.
How do target audiences naturally consume & interact with mobile via apps in their everyday lives?
AGENDA
MOBILE DAY IN THE LIFE
THE STATE OF MOBILE
MOBILE CONSUMPTION BY
DEMOGRAPHIC
17
THE STATE OF MOBILE
17
18
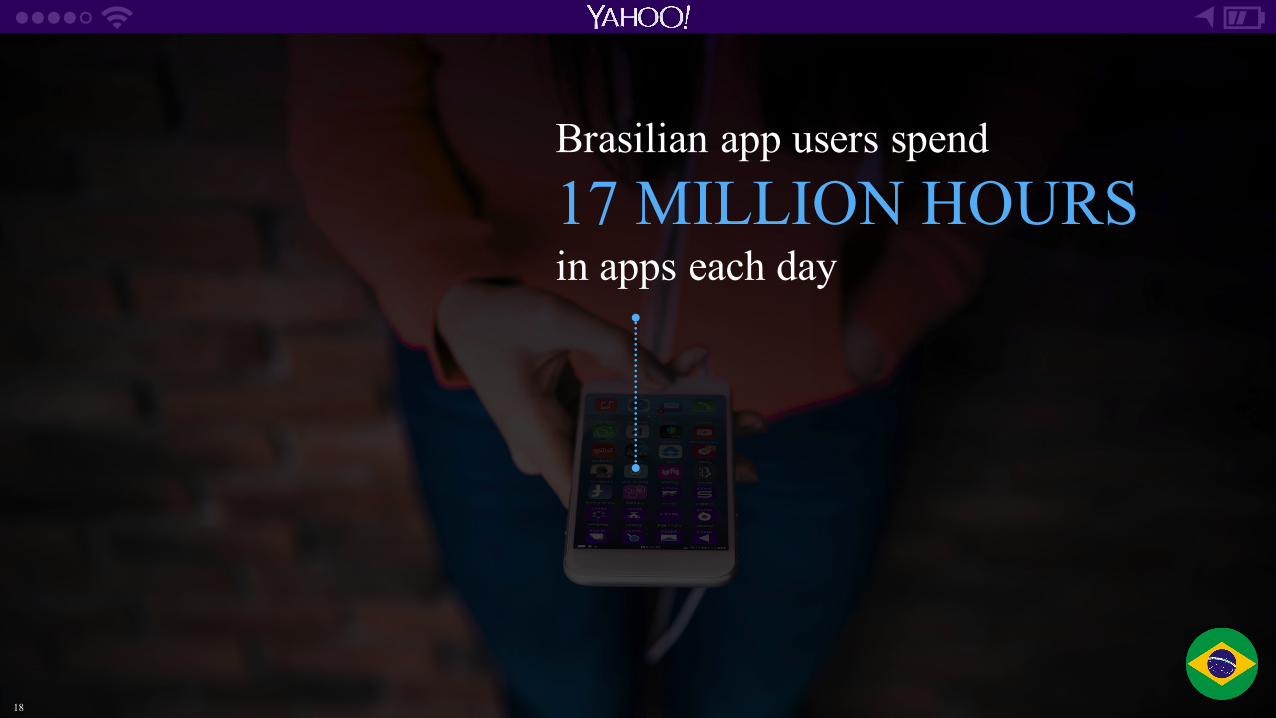
Brasilian app users spend
17 MILLION HOURSin apps each day
18

19
Utility & productivity apps have highest engagement, sports and messaging/social apps closely followTIME SPENT BY CATEGORY
¢ Utilities & Productivity
¢ Sports
¢ Messaging & Social
¢ Games
¢ Lifestyle & Shopping
¢ Music & Entertainment
¢ Health & Fitness
¢ News & Magazines
44%
19%
17%
12%
4%3% 1%

20
44%
19%
17%
12%
4%3% 1%
Brasil mobile users spend much more time on Sports apps than global app users TIME SPENT BY CATEGORY 40%
1%
23%
18%
5%
8%2% 3%
¢ Utilities & Productivity
¢ Sports
¢ Messaging & Social
¢ Games
¢ Lifestyle & Shopping
¢ Music & Entertainment
¢ Health & Fitness
¢ News & Magazines

21
Sports, lifestyle/shopping and health/fitness apps lead YoY growth in BrasilYoY BRASIL SESSION GROWTH
SPORTS LIFESTYLE & SHOPPING
HEALTH & FITNESS
MESSAGING & SOCIAL
NEWS & MAGAZINES
UTILITIES & PRODUCTIVITY
GAMES MUSIC, MEDIA & ENTERTAINMENT
TRAVEL
119%
72% 70%
22% 16% 2%
-9% -14% -33%
22
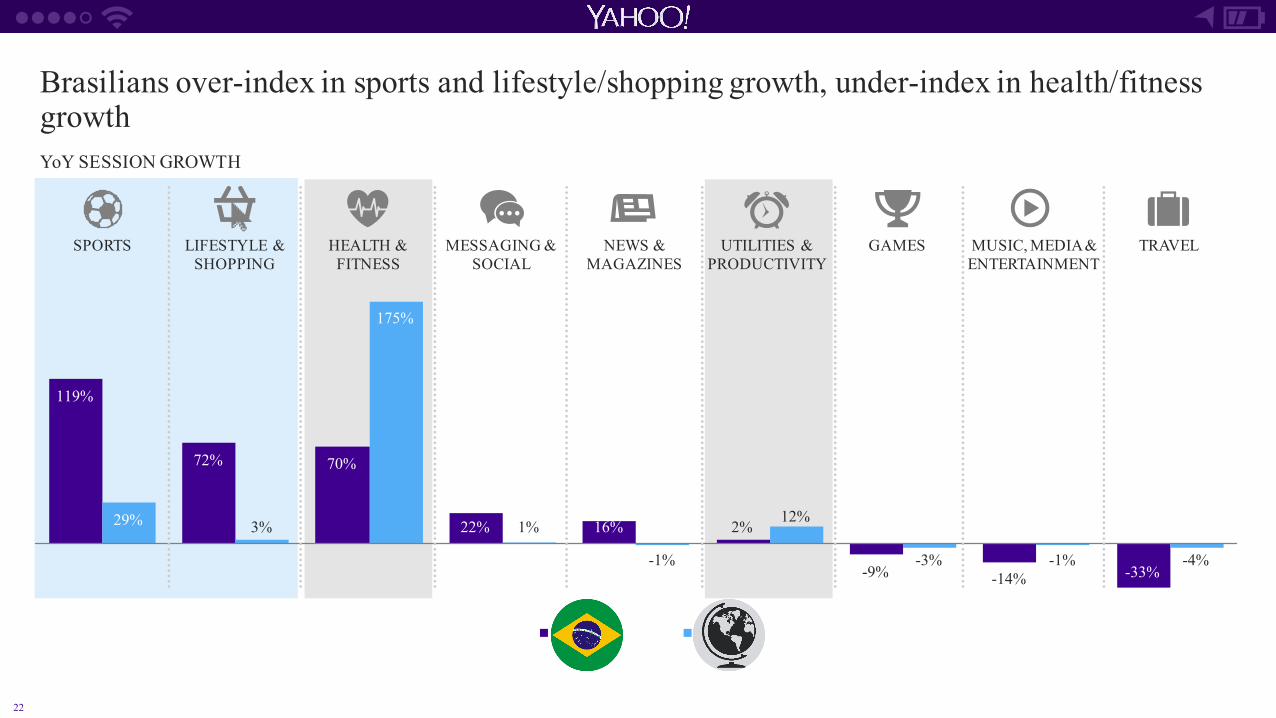
119%
72% 70%
22% 16% 2%
-9% -14% -33%
29% 3%
175%
1%
-1%
12%
-3% -1% -4%
Brazil Global
Brasilians over-index in sports and lifestyle/shopping growth, under-index in health/fitness growthYoY SESSION GROWTH
SPORTS LIFESTYLE & SHOPPING
HEALTH & FITNESS
MESSAGING & SOCIAL
NEWS & MAGAZINES
UTILITIES & PRODUCTIVITY
GAMES MUSIC, MEDIA & ENTERTAINMENT
TRAVEL
23
WHAT DOES MOBILE APP CONSUMPTION LOOK LIKE BY DEMOGRAPHIC?
23
24
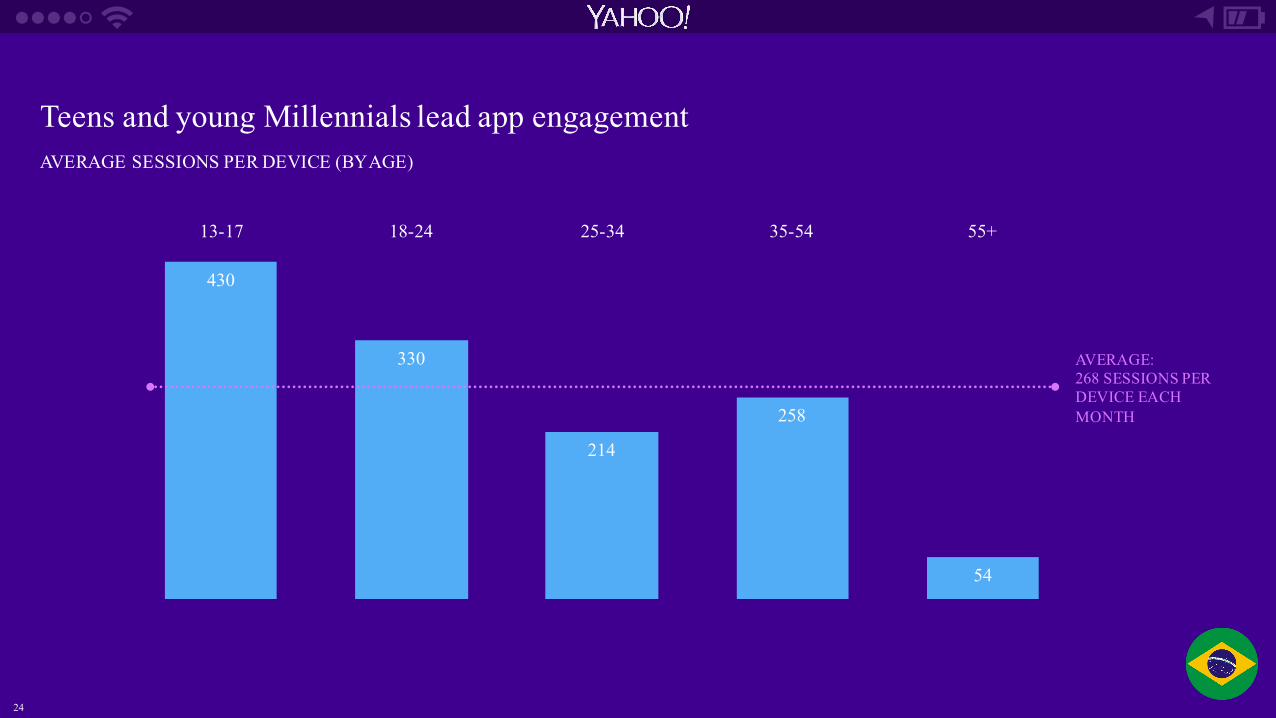
Teens and young Millennials lead app engagementAVERAGE SESSIONS PER DEVICE (BY AGE)
430
330
214
258
54
AVERAGE: 268 SESSIONS PER DEVICE EACH MONTH
13-17 18-24 25-34 35-54 55+
25
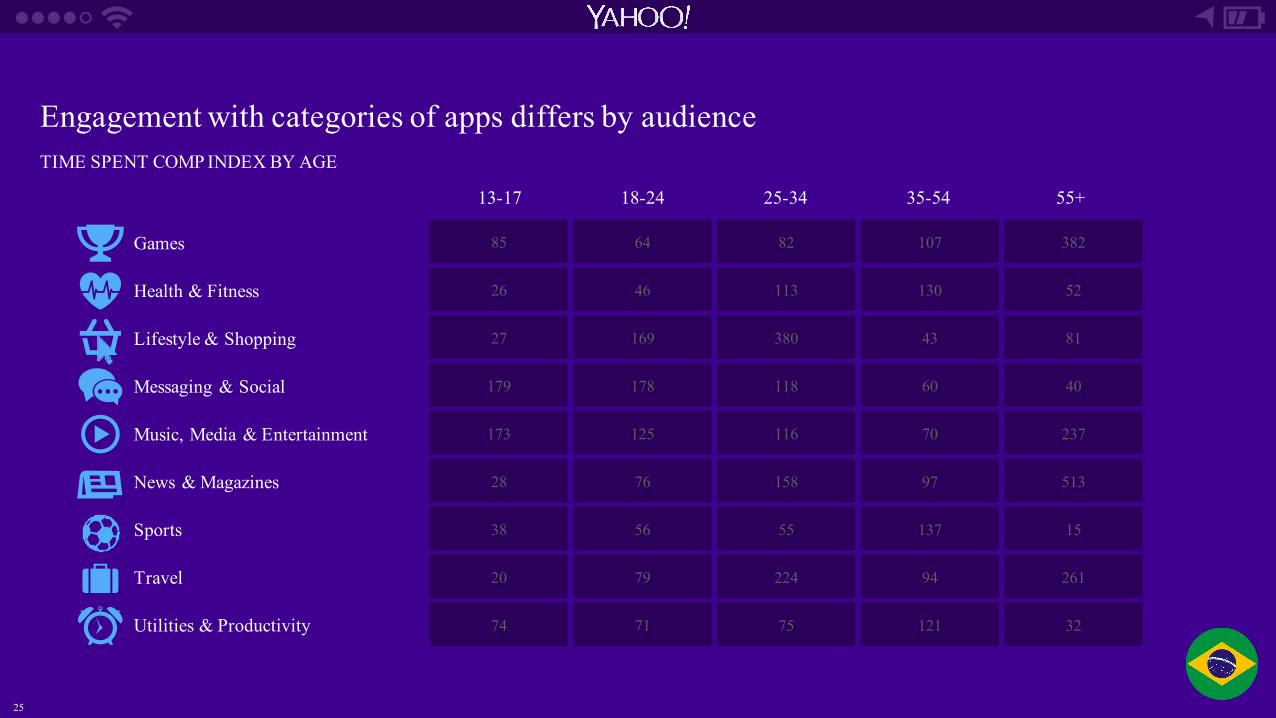
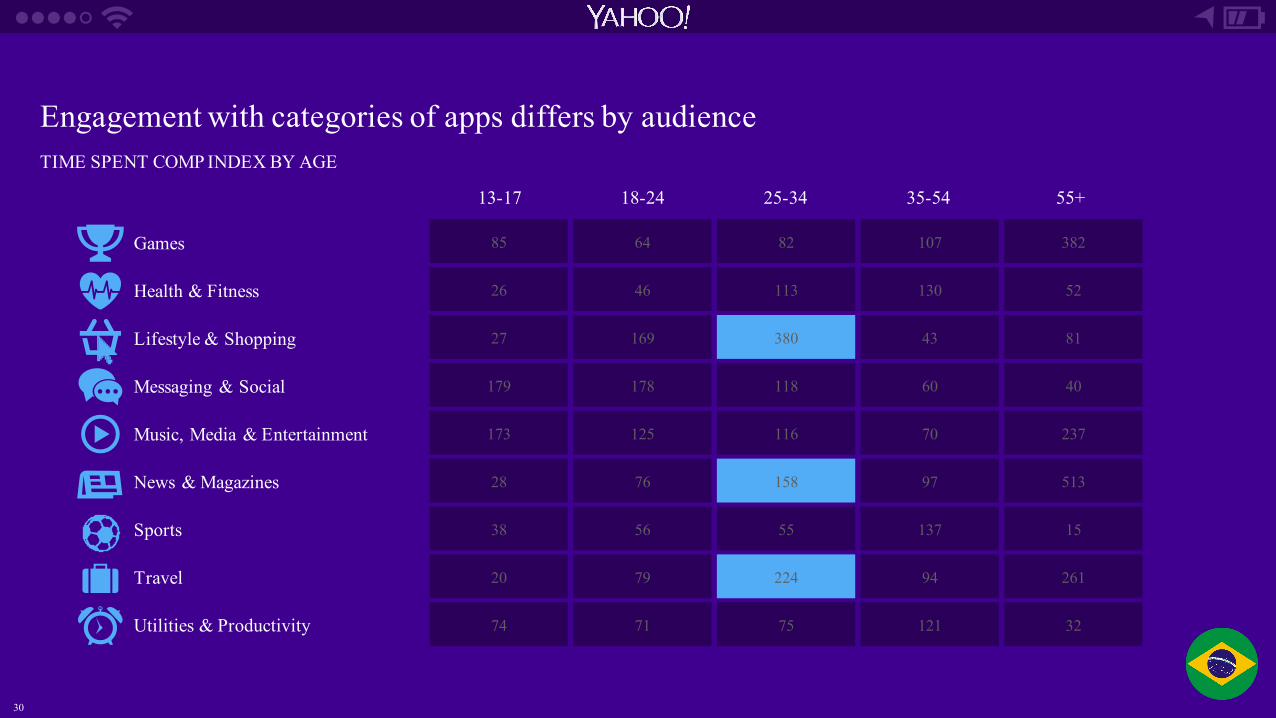
Engagement with categories of apps differs by audienceTIME SPENT COMP INDEX BY AGE
13-17 18-24 25-34 35-54 55+
Games 85 64 82 107 382
Health & Fitness 26 46 113 130 52
Lifestyle & Shopping 27 169 380 43 81
Messaging & Social 179 178 118 60 40
Music, Media & Entertainment 173 125 116 70 237
News & Magazines 28 76 158 97 513
Sports 38 56 55 137 15
Travel 20 79 224 94 261
Utilities & Productivity 74 71 75 121 32
85
26
27
179
173
28
38
20
74
64
46
169
178
125
76
56
79
71
82
113
380
118
116
158
55
224
75
107
130
43
60
70
97
137
94
121
382
52
81
40
237
513
15
261
32

26
Engagement with categories of apps differs by audienceTIME SPENT COMP INDEX BY AGE
13-17 18-24 25-34 35-54 55+
Games 85 64 82 107 382
Health & Fitness 26 46 113 130 52
Lifestyle & Shopping 27 169 380 43 81
Messaging & Social 179 178 118 60 40
Music, Media & Entertainment 173 125 116 70 237
News & Magazines 28 76 158 97 513
Sports 38 56 55 137 15
Travel 20 79 224 94 261
Utilities & Productivity 74 71 75 121 32
85
26
27
179
173
28
38
20
74
64
46
169
178
125
76
56
79
71
82
113
380
118
116
158
55
224
75
107
130
43
60
70
97
137
94
121
382
52
81
40
237
513
15
261
32

27
Teens 13-17 are relatively more engaged on social/messaging and entertainment/music/media apps
SPORTS LIFESTYLE &SHOPPING
TRAVEL
NEWS &MAGAZINES
HEALTH &FITNESS
MESSAGING & SOCIAL
UTILITIES &PRODUCTIVITY
GAMES
MEDIA &ENTERTAINMENT
28
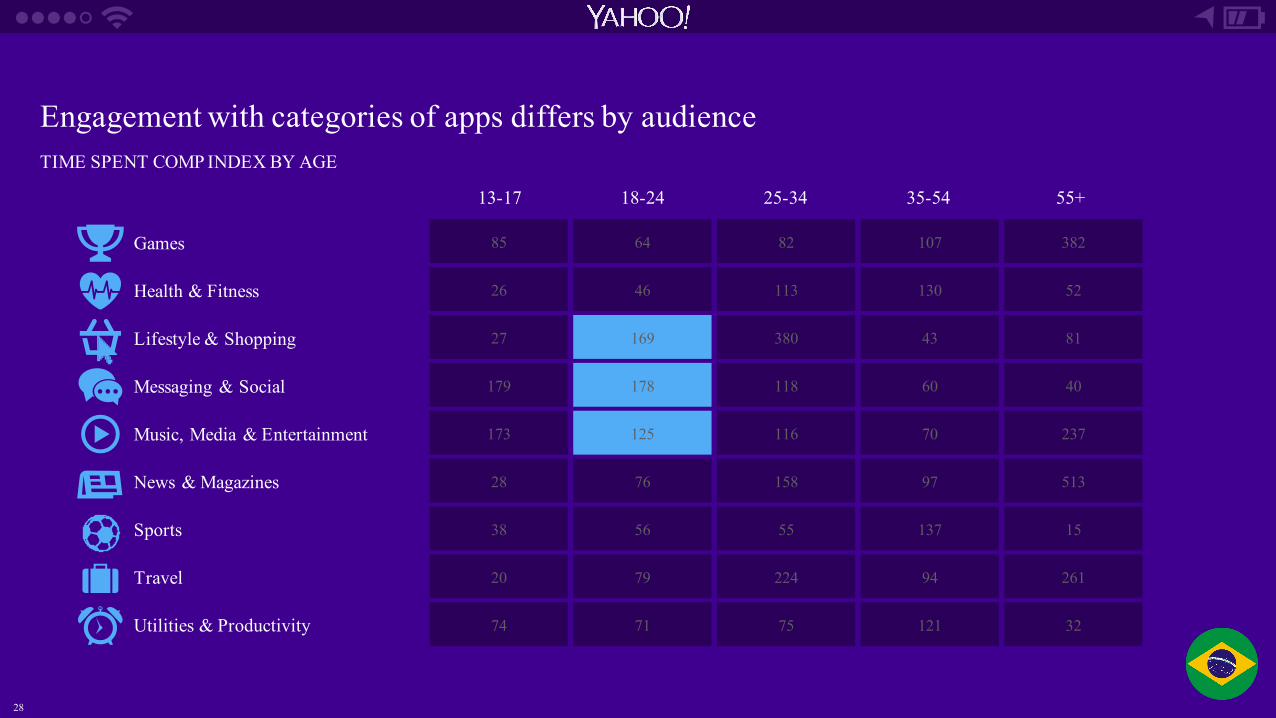
Engagement with categories of apps differs by audienceTIME SPENT COMP INDEX BY AGE
13-17 18-24 25-34 35-54 55+
Games 85 64 82 107 382
Health & Fitness 26 46 113 130 52
Lifestyle & Shopping 27 169 380 43 81
Messaging & Social 179 178 118 60 40
Music, Media & Entertainment 173 125 116 70 237
News & Magazines 28 76 158 97 513
Sports 38 56 55 137 15
Travel 20 79 224 94 261
Utilities & Productivity 74 71 75 121 32
85
26
27
179
173
28
38
20
74
64
46
169
178
125
76
56
79
71
82
113
380
118
116
158
55
224
75
107
130
43
60
70
97
137
94
121
382
52
81
40
237
513
15
261
32
29
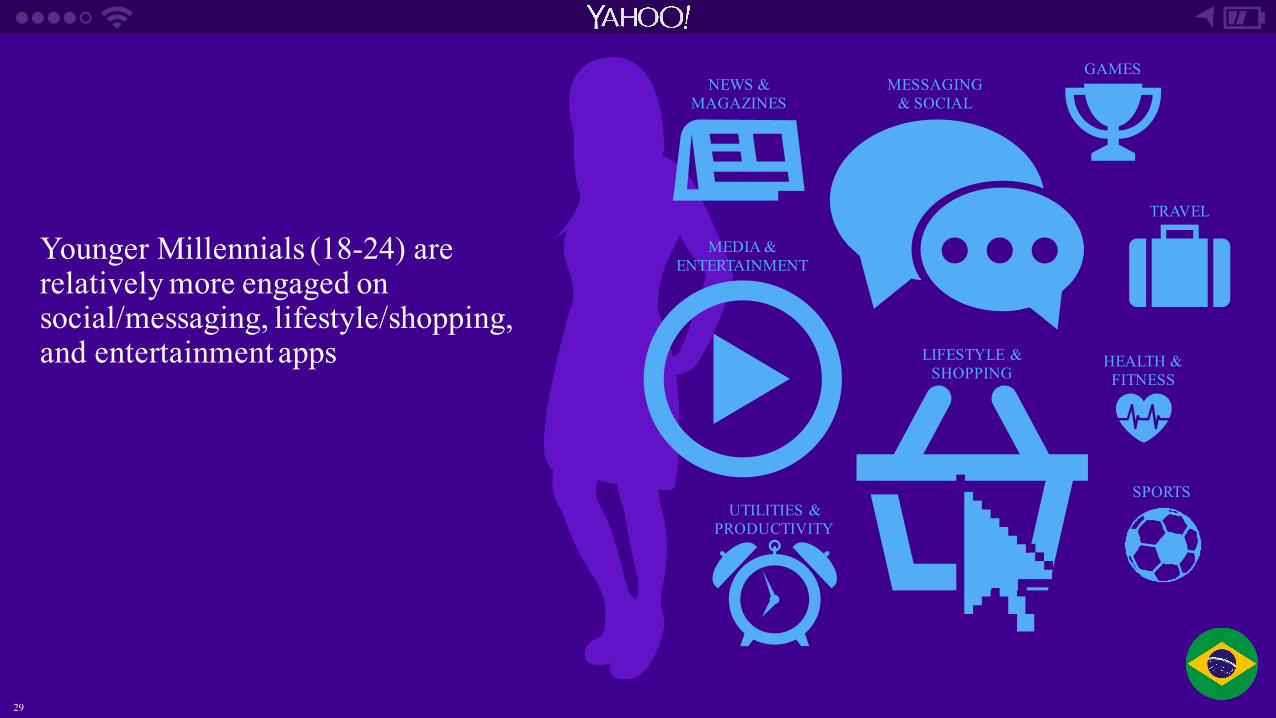
Younger Millennials (18-24) are relatively more engaged on social/messaging, lifestyle/shopping, and entertainment apps
SPORTS
LIFESTYLE &SHOPPING
TRAVEL
NEWS &MAGAZINES
HEALTH &FITNESS
MESSAGING & SOCIAL
UTILITIES &PRODUCTIVITY
GAMES
MEDIA &ENTERTAINMENT
30
Engagement with categories of apps differs by audienceTIME SPENT COMP INDEX BY AGE
13-17 18-24 25-34 35-54 55+
Games 85 64 82 107 382
Health & Fitness 26 46 113 130 52
Lifestyle & Shopping 27 169 380 43 81
Messaging & Social 179 178 118 60 40
Music, Media & Entertainment 173 125 116 70 237
News & Magazines 28 76 158 97 513
Sports 38 56 55 137 15
Travel 20 79 224 94 261
Utilities & Productivity 74 71 75 121 32
85
26
27
179
173
28
38
20
74
64
46
169
178
125
76
56
79
71
82
113
380
118
116
158
55
224
75
107
130
43
60
70
97
137
94
121
382
52
81
40
237
513
15
261
32
31
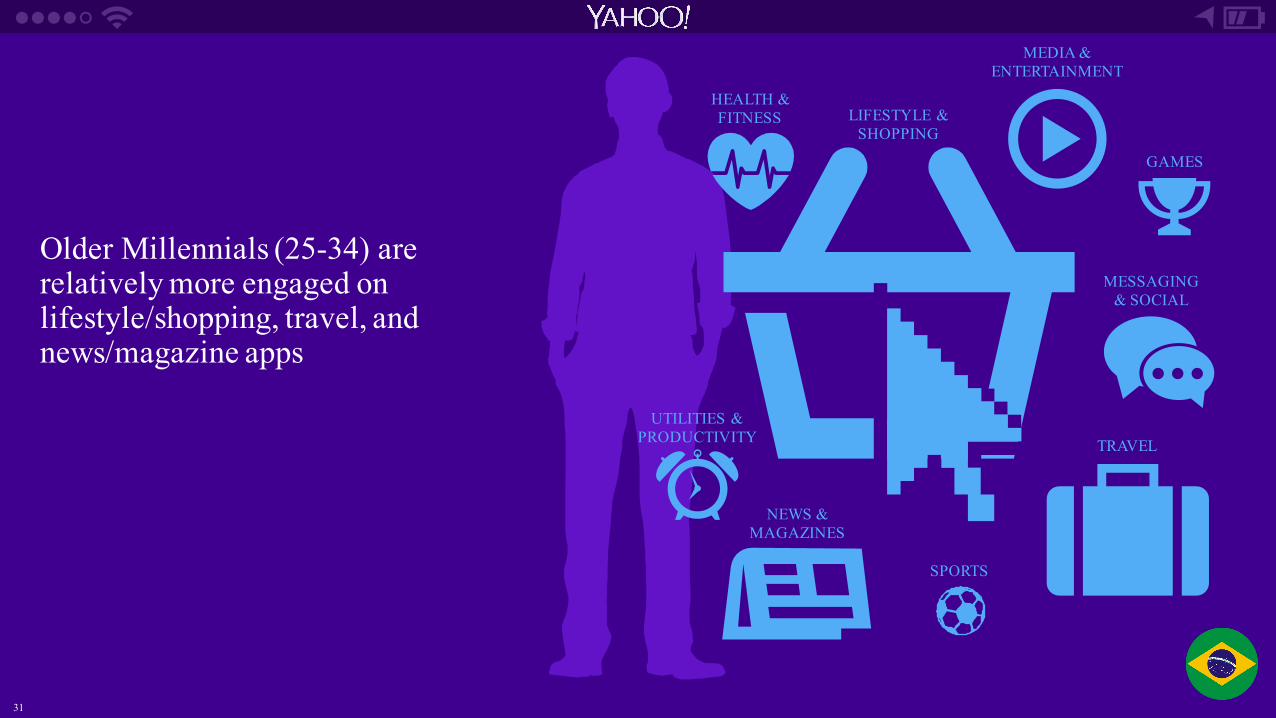
Older Millennials (25-34) are relatively more engaged on lifestyle/shopping, travel, and news/magazine apps
SPORTS
LIFESTYLE &SHOPPING
TRAVEL
NEWS &MAGAZINES
HEALTH &FITNESS
MESSAGING & SOCIAL
UTILITIES &PRODUCTIVITY
GAMES
MEDIA &ENTERTAINMENT

32
Engagement with categories of apps differs by audienceTIME SPENT COMP INDEX BY AGE
13-17 18-24 25-34 35-54 55+
Games 85 64 82 107 382
Health & Fitness 26 46 113 130 52
Lifestyle & Shopping 27 169 380 43 81
Messaging & Social 179 178 118 60 40
Music, Media & Entertainment 173 125 116 70 237
News & Magazines 28 76 158 97 513
Sports 38 56 55 137 15
Travel 20 79 224 94 261
Utilities & Productivity 74 71 75 121 32
85
26
27
179
173
28
38
20
74
64
46
169
178
125
76
56
79
71
82
113
380
118
116
158
55
224
75
107
130
43
60
70
97
137
94
121
382
52
81
40
237
513
15
261
32
33
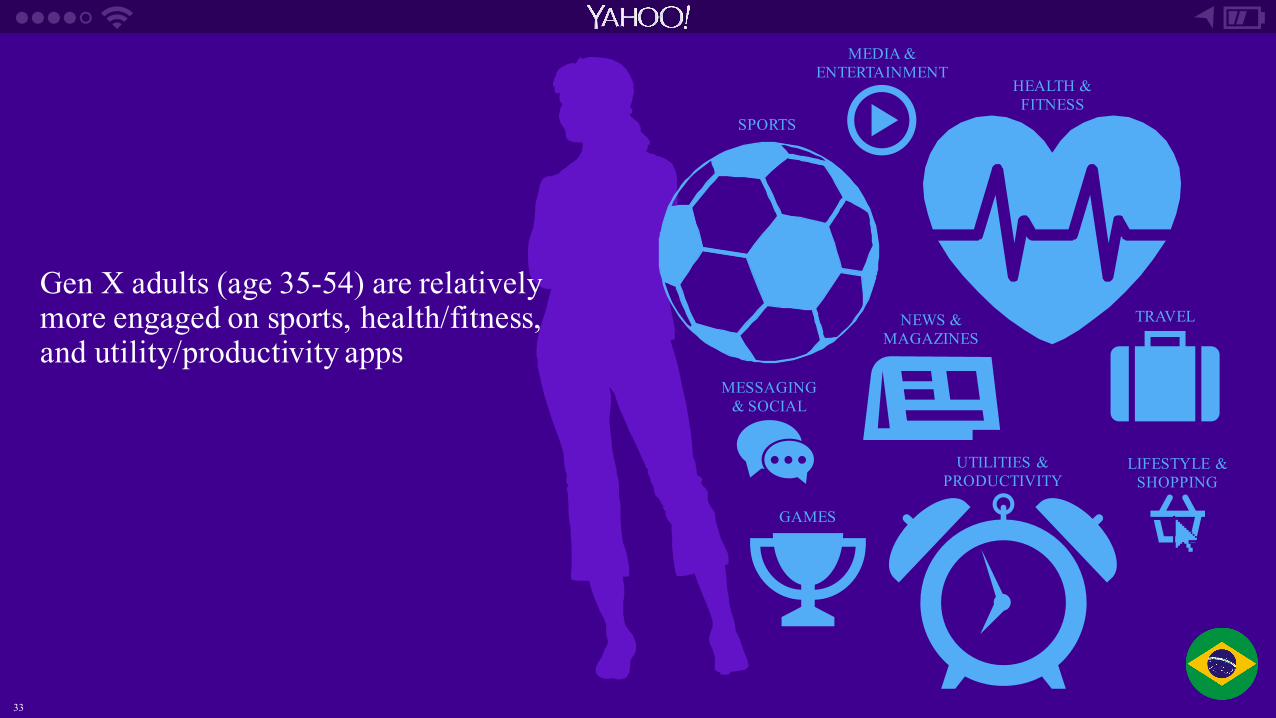
Gen X adults (age 35-54) are relatively more engaged on sports, health/fitness, and utility/productivity apps
SPORTS
LIFESTYLE &SHOPPING
TRAVELNEWS &MAGAZINES
HEALTH &FITNESS
MESSAGING & SOCIAL
UTILITIES &PRODUCTIVITY
GAMES
MEDIA &ENTERTAINMENT

34
Engagement with categories of apps differs by audienceTIME SPENT COMP INDEX BY AGE
13-17 18-24 25-34 35-54 55+
Games 85 64 82 107 382
Health & Fitness 26 46 113 130 52
Lifestyle & Shopping 27 169 380 43 81
Messaging & Social 179 178 118 60 40
Music, Media & Entertainment 173 125 116 70 237
News & Magazines 28 76 158 97 513
Sports 38 56 55 137 15
Travel 20 79 224 94 261
Utilities & Productivity 74 71 75 121 32
85
26
27
179
173
28
38
20
74
64
46
169
178
125
76
56
79
71
82
113
380
118
116
158
55
224
75
107
130
43
60
70
97
137
94
121
382
52
81
40
237
513
15
261
32

35
Boomers (age 55+) are much more engaged on news/magazines and games apps; also relatively more engaged on entertainment/music/media and travel apps
SPORTS
LIFESTYLE &SHOPPING
TRAVEL
NEWS &MAGAZINES
HEALTH &FITNESS
MESSAGING & SOCIAL
UTILITIES &PRODUCTIVITY
GAMES
MEDIA &ENTERTAINMENT
36
MOBILE DAY IN THE LIFE
36

37
In Brasil mobile usage is constant, users are engaged throughout the day
5AM 6AM 7AM 8 AM 9AM 10AM 11AM 12PM 1PM 2PM 3PM 4PM 5PM 6PM 7PM 8PM 9PM 10PM 11PM 12AM 1AM 2AM 3AM 4AM
Brazil Global
% O
F D
AIL
Y SE
SSIO
NS
HOUR OF DAY
38
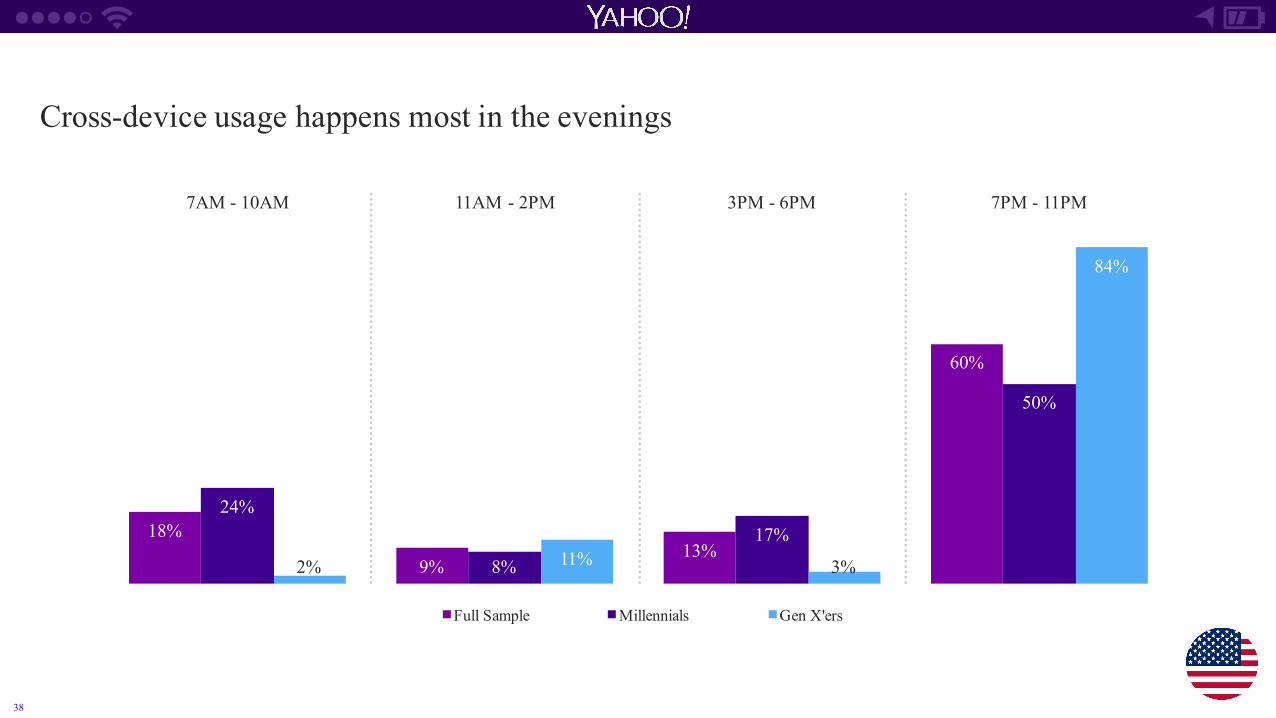
Cross-device usage happens most in the evenings
18%
9%13%
60%
24%
8%
17%
50%
2% 11% 3%
84%
7AM - 10AM 11AM - 2PM 3PM - 6PM 7PM - 11PM
Full Sample Millennials Gen X'ers
39
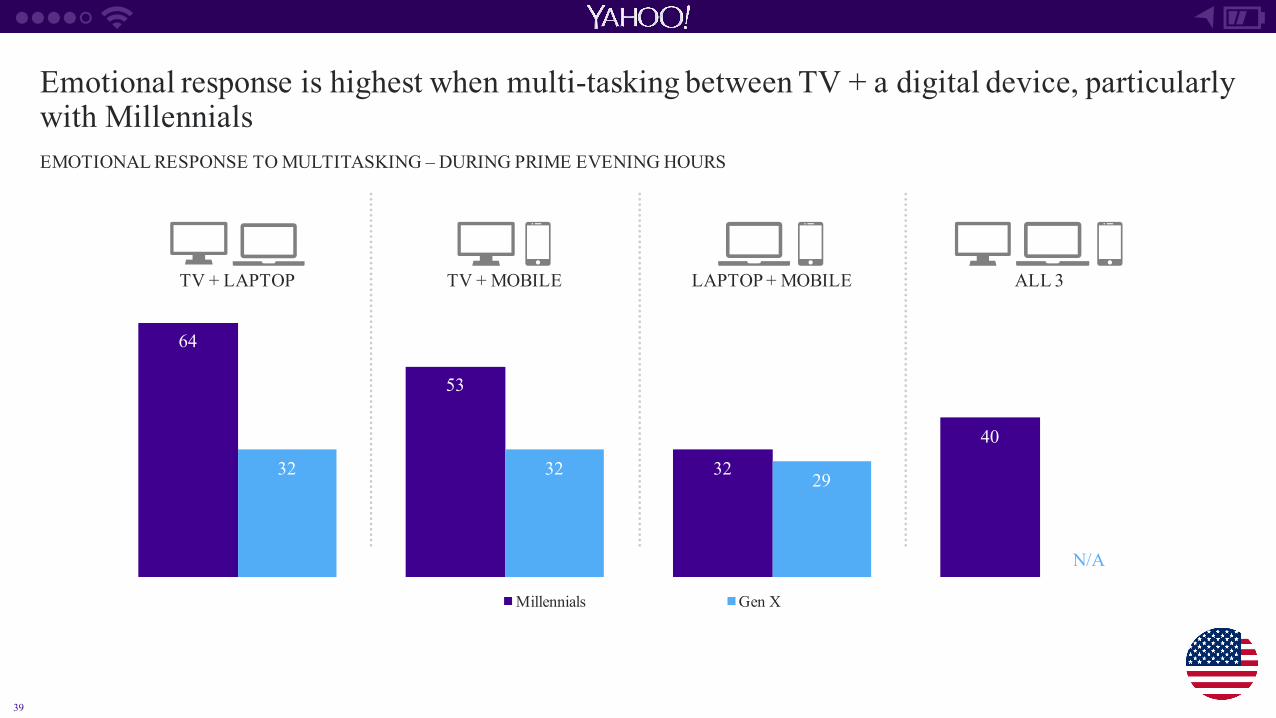
64
53
32
40
32 32 29
N/A
TV + LAPTOP TV + MOBILE LAPTOP + MOBILE ALL 3
Millennials Gen X
Emotional response is highest when multi-tasking between TV + a digital device, particularly with MillennialsEMOTIONAL RESPONSE TO MULTITASKING – DURING PRIME EVENING HOURS
40
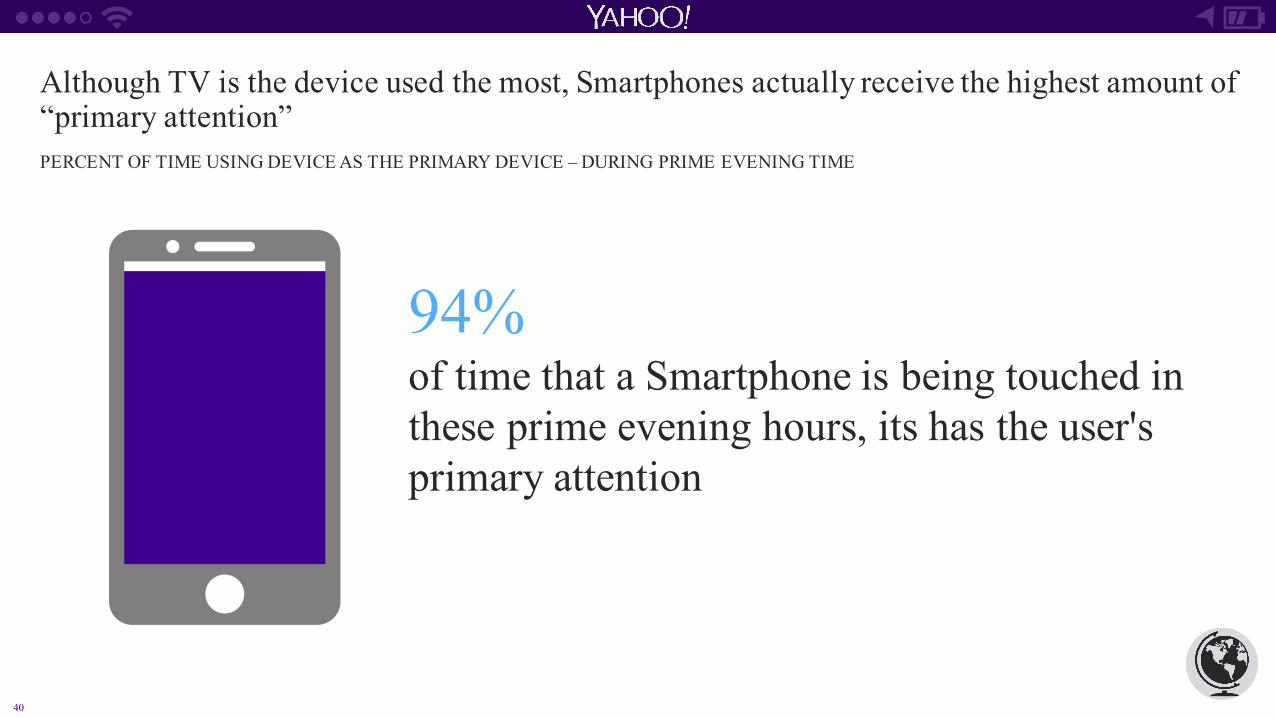
Although TV is the device used the most, Smartphones actually receive the highest amount of “primary attention”PERCENT OF TIME USING DEVICE AS THE PRIMARY DEVICE – DURING PRIME EVENING TIME
94% of time that a Smartphone is being touched in these prime evening hours, its has the user's primary attention
41
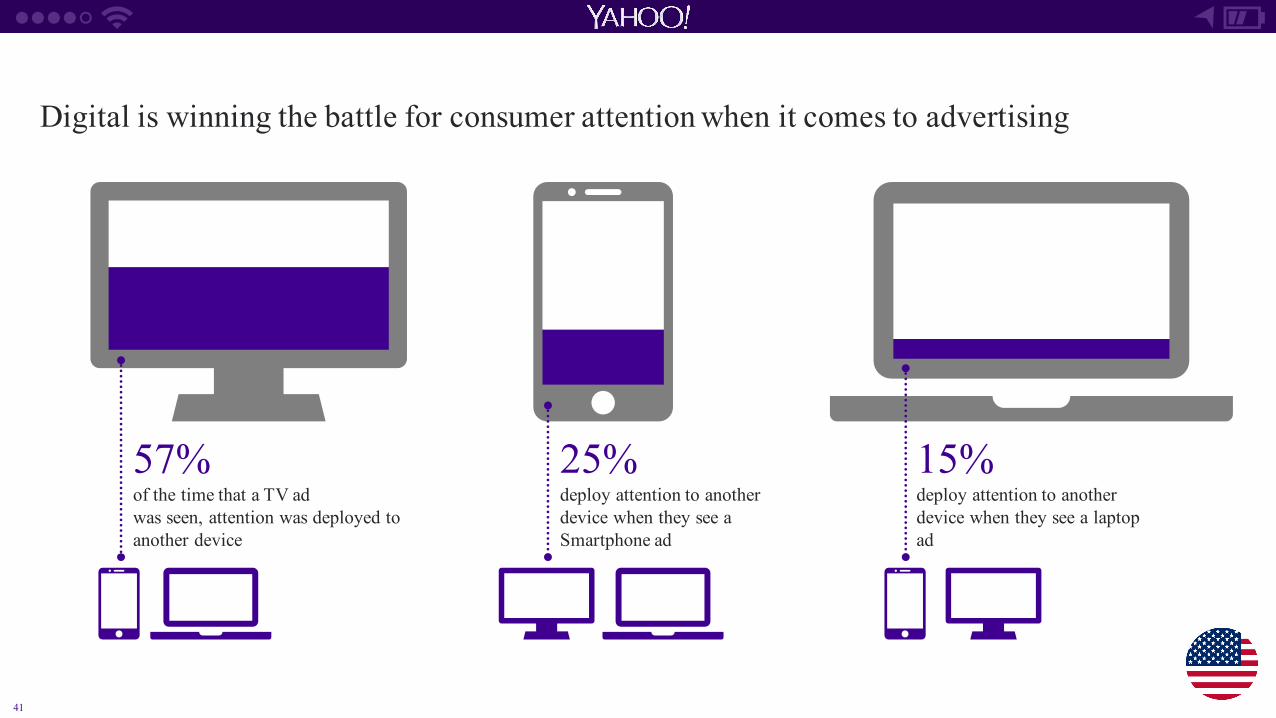
Digital is winning the battle for consumer attention when it comes to advertising
57%of the time that a TV ad was seen, attention was deployed to another device
15% deploy attention to another device when they see a laptop ad
25% deploy attention to another device when they see a Smartphone ad
42
TOP THINGS TO KNOW
Photo needs to be purchased & created for real if approved
42
43
MOBILE IS GROWING

9:52Monday, March 7
MOBILE USAGE = APP USAGE
presentation
44

45
PRODUCTIVITY & UTILITY CONSUMPTION RULES IN BRASIL
SPORTS & LIFESTYLE/SHOPPING APPS HAVE HIGHEST GROWTH
45
46
ENGAGEMENT ACROSS APP CATEGORIES IS UNIQUE BY DEMOGRAPHIC
47
APPS ARE THE EVENING ENTERTAINMENT VEHICLE OF
CHOICE

THANK YOU!Christina Choy | B2B Strategic Insights
49
APPENDIX

50
Mobile usage throughout the day is similar across audiencesTIME OF DAY APP USAGE
7AM - 10AM 11AM – 2PM 3PM – 6PM 7PM – 10PM 11PM – 6AM
% O
F TO
TAL
APP
SES
SIO
NS
13-17
18-24
25-34
35-55
55+

51
Teens 13-17 engage with social/messaging and entertainment/music/media apps most in the eveningsTIME OF DAY APP USAGE
7AM – 10:59AM 11AM – 2:59PM 3PM – 6:59PM 7PM – 10:59PM 11PM – 6:59AM
% O
F TO
TAL
APP
SES
SIO
NS
13-17
Messaging&Social
MusicMedia&Entertainment

52
Young Millennial 18-24 engage with lifestyle/shopping apps in the afternoon with a peak in the eveningsTIME OF DAY APP USAGE
7AM – 10:59AM 11AM – 2:59PM 3PM – 6:59PM 7PM – 10:59PM 11PM – 6:59AM
% O
F TO
TAL
APP
SES
SIO
NS
18-24
Lifestyle&Shopping
Messaging&Social
MusicMedia&Entertainment
53
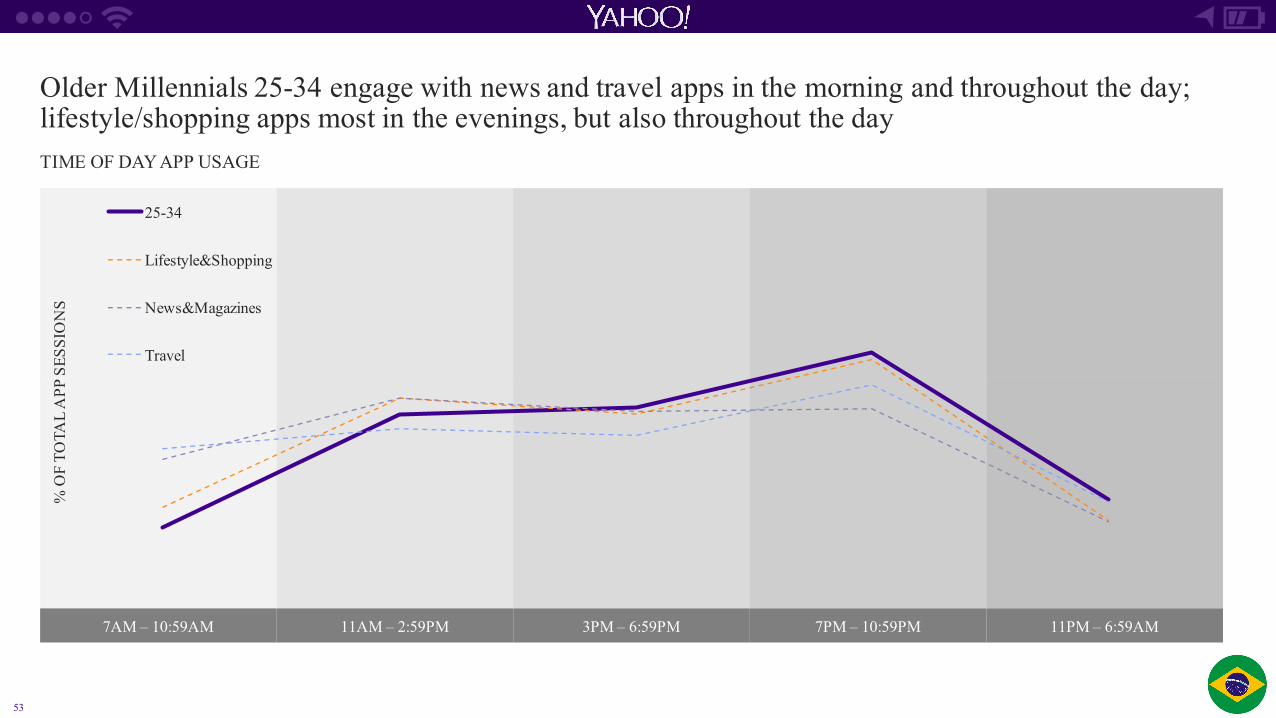
Older Millennials 25-34 engage with news and travel apps in the morning and throughout the day; lifestyle/shopping apps most in the evenings, but also throughout the dayTIME OF DAY APP USAGE
7AM – 10:59AM 11AM – 2:59PM 3PM – 6:59PM 7PM – 10:59PM 11PM – 6:59AM
% O
F TO
TAL
APP
SES
SIO
NS
25-34
Lifestyle&Shopping
News&Magazines
Travel

54
Health and fitness apps engage Gen X from morning to evening; sports engagement is high throughout the day with a peak in the eveningsTIME OF DAY APP USAGE
7AM – 10:59AM 11AM – 2:59PM 3PM – 6:59PM 7PM – 10:59PM 11PM – 6:59AM
% O
F TO
TAL
APP
SES
SIO
NS
35-54
Health&Fitness
Sports
Utilities&Productivity
55
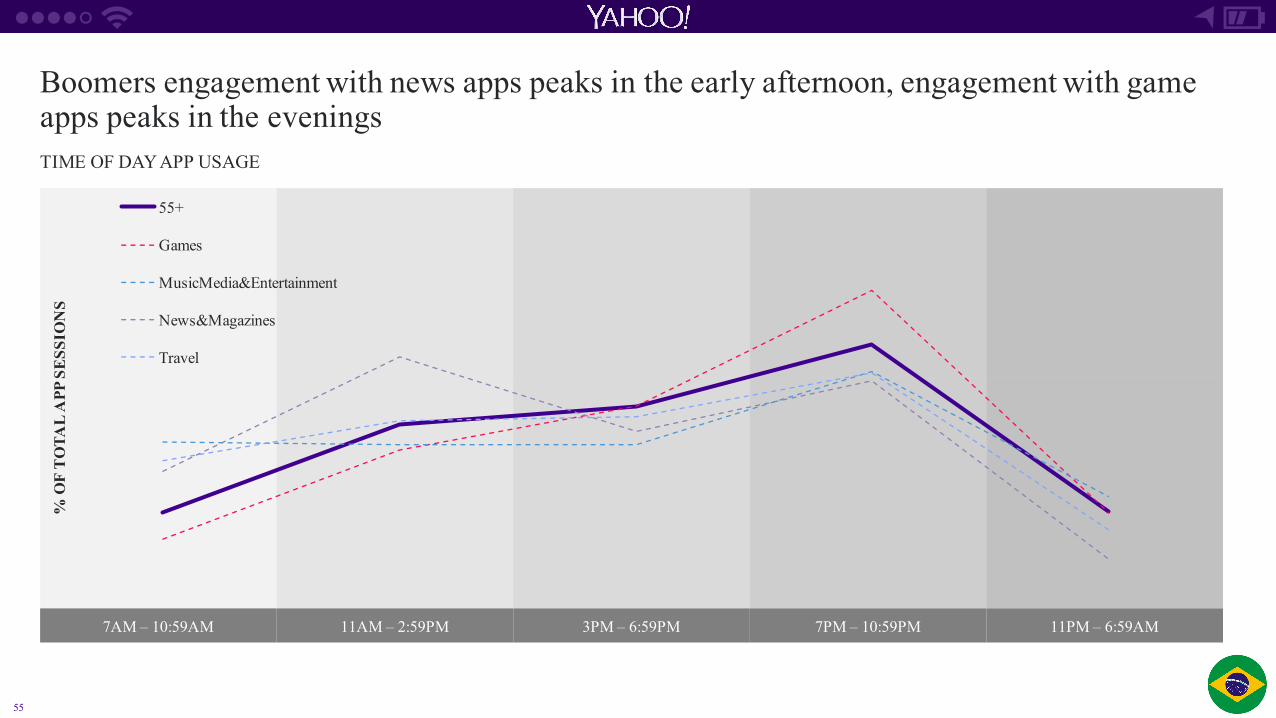
Boomers engagement with news apps peaks in the early afternoon, engagement with game apps peaks in the eveningsTIME OF DAY APP USAGE
7AM – 10:59AM 11AM – 2:59PM 3PM – 6:59PM 7PM – 10:59PM 11PM – 6:59AM
% O
F T
OTA
L A
PP S
ESS
ION
S
55+
Games
MusicMedia&Entertainment
News&Magazines
Travel

56
Time spent on torso & tail apps have grown significantlyGROWTH IN TIME SPENT BY APP TYPEUS Daily Average
69 min 70 min70 min
85 min
TOP 25 APPS TORSO & TAIL
Q1 2014 Q3 2014 Q1 2014 Q3 2014
+1%
+21%

57
Although TV is the device used the most, Smartphones actually receive the highest amount of “primary attention”PERCENT OF TIME USING DEVICE AS THE PRIMARY DEVICE – DURING PRIME EVENING HOURS
94% of the time that a Smartphone is being touched during these hours, it is being used as the primary device.
SMARTPHONE TV LAPTOP
94% 83% 80%
58
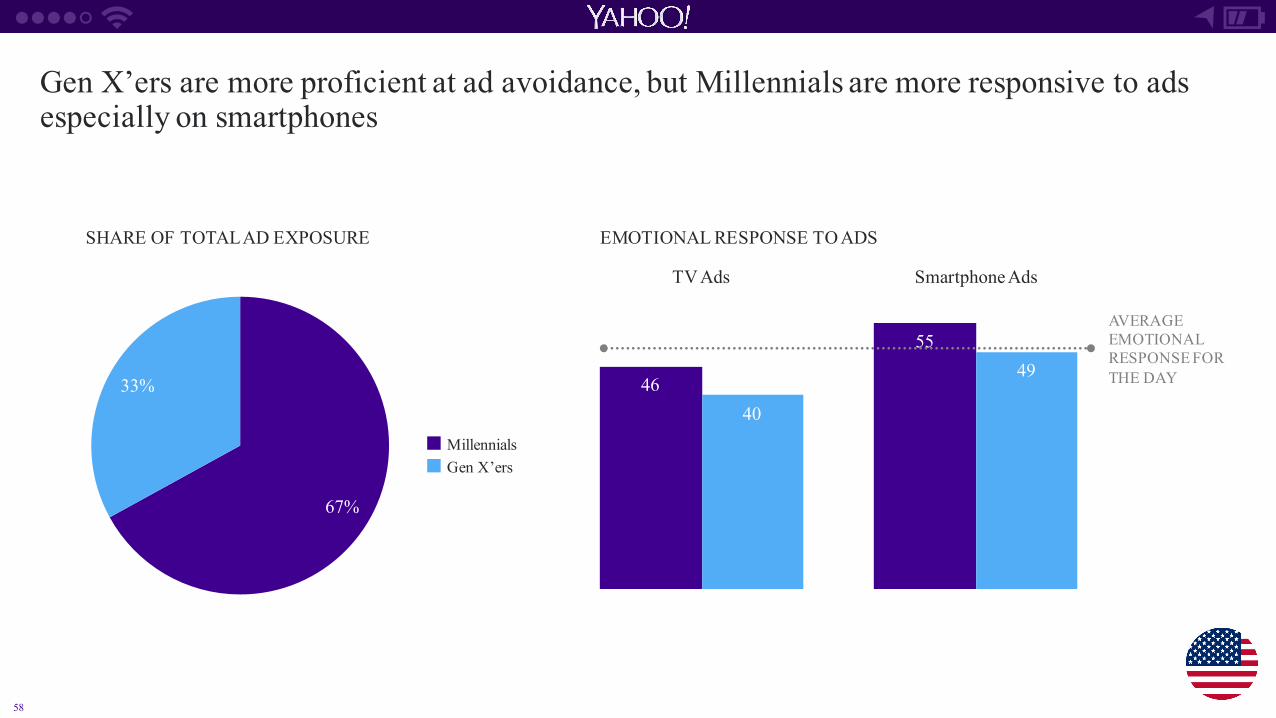
Gen X’ers are more proficient at ad avoidance, but Millennials are more responsive to ads especially on smartphones
SHARE OF TOTAL AD EXPOSURE EMOTIONAL RESPONSE TO ADS
67%
33% 46
55
40
49
TV Ads Smartphone Ads
AVERAGE EMOTIONAL RESPONSE FOR THE DAY
¢ Millennials¢ Gen X’ers
59
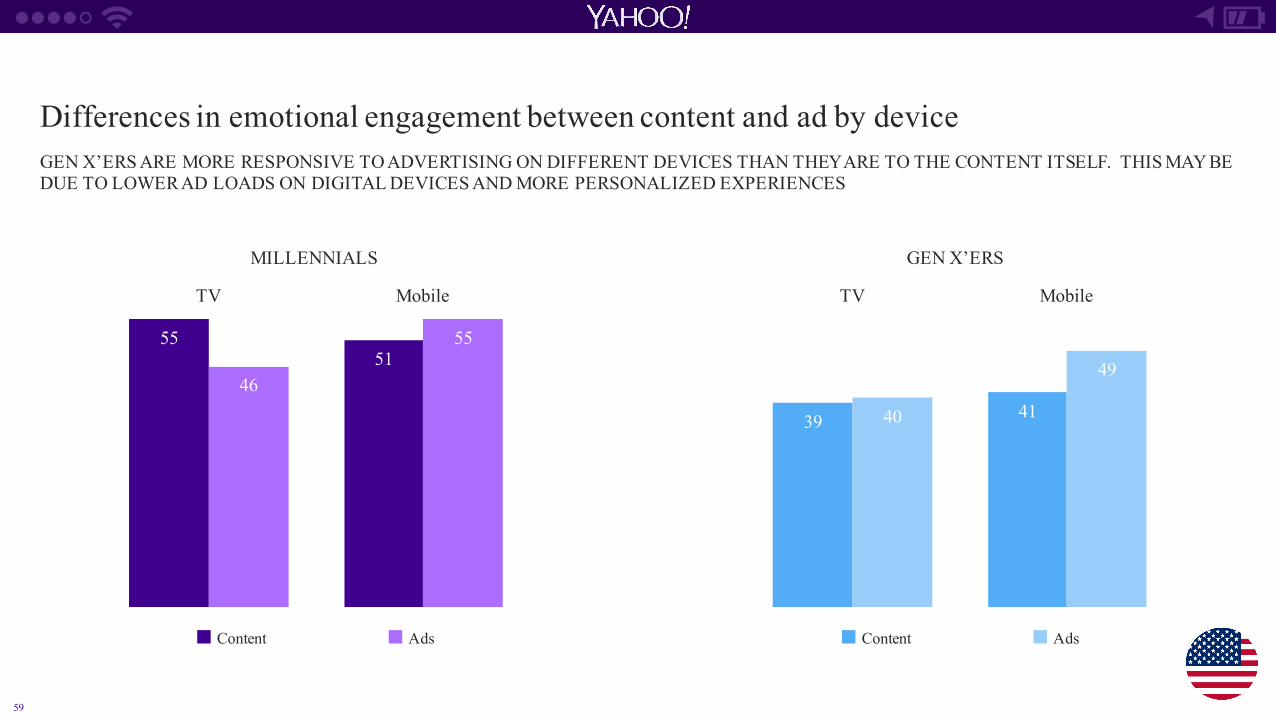
Differences in emotional engagement between content and ad by deviceGEN X’ERS ARE MORE RESPONSIVE TO ADVERTISING ON DIFFERENT DEVICES THAN THEY ARE TO THE CONTENT ITSELF. THIS MAY BE DUE TO LOWER AD LOADS ON DIGITAL DEVICES AND MORE PERSONALIZED EXPERIENCES
5551
39 4146
55
40
49
TV Mobile TV Mobile
MILLENNIALS GEN X’ERS
¢ Content ¢ Ads ¢ Content ¢ Ads
60
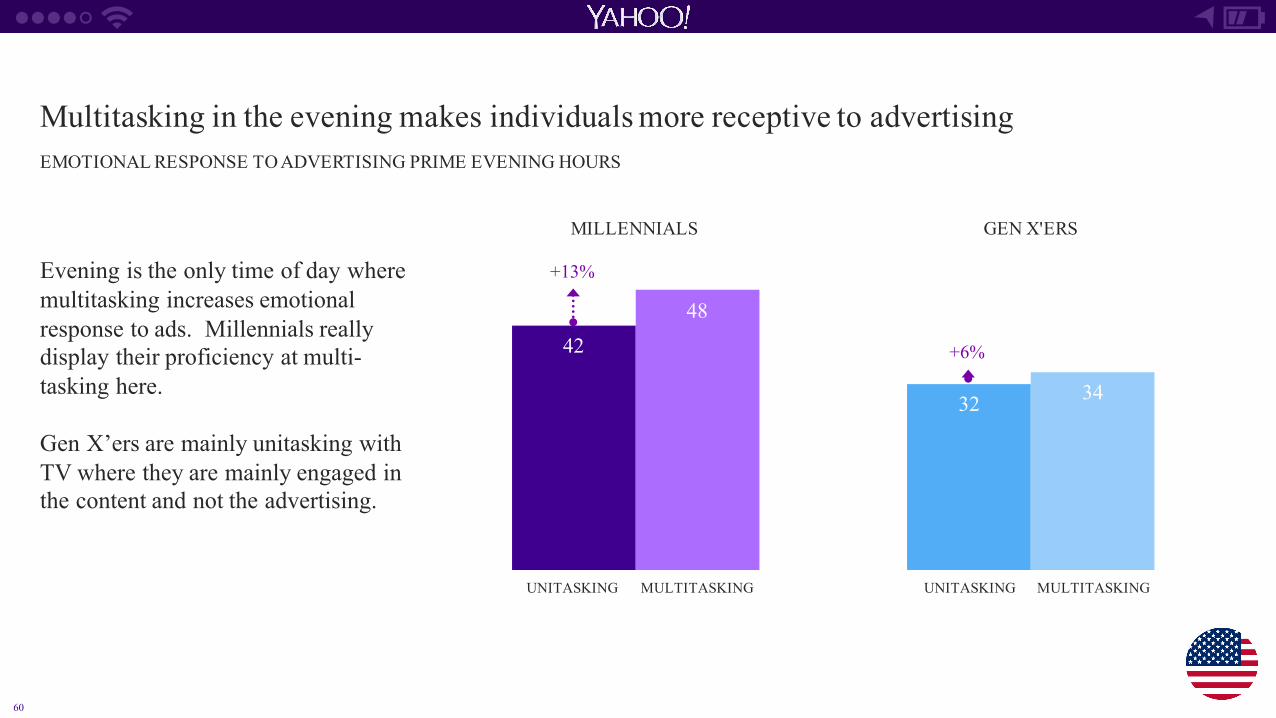
Multitasking in the evening makes individuals more receptive to advertisingEMOTIONAL RESPONSE TO ADVERTISING PRIME EVENING HOURS
42
32
48
34
MILLENNIALS GEN X'ERS
UNITASKING MULTITASKING UNITASKING MULTITASKING
+13%
+6%
Evening is the only time of day where multitasking increases emotional response to ads. Millennials really display their proficiency at multi-tasking here.
Gen X’ers are mainly unitasking with TV where they are mainly engaged in the content and not the advertising.

61
Yahoo Mobile Inventory Availability – BrasilMONTHLY AVAILABILITY
Adult 18-24 30M
Adult 25-34 73M
Adult 35-54 990K
Adult 55+ 57.6K
Total 140M