application of ionic liquids and enzymes for the removal ... · dissertação apresentada na...
TRANSCRIPT

Catarina Luísa Cortes Pereira Licenciada em Arte - Conservação e Restauro especialização em Pintura
pela Universidade Católica do Porto – Escola das Artes
Application of ionic liquids and enzymes for the removal of proteinaceous layers from
polychrome of works of art and evaluation of the cleaning effectiveness
Dissertação Apresentada na Faculdade de Ciências e Tecnologia da Universidade Nova de Lisboa para obtenção do grau de Mestre
em Ciências da Conservação, especialização em Pintura.
Orientador: Doutora Irina Sandu, Investigadora da FCT-UNL Co-orientador: Doutor Luís C. Branco, Investigador FCT-UNL Co-orientador: Doutor Tito Busani, Investigador do CENIMAT
da FCT-UNL
Júri:
Presidente: Doutor Fernando Jorge Pina, Professor Catedrático da FCT-UNL
Arguente: Doutor António Jorge Parola, Professor Associado da FCT-UNL
Dezembro de 2012


i
Application of ionic liquids and enzymes for the removal of proteinaceous layers from polychrome
of works of art and evaluation of the cleaning effectiveness
Catarina Luísa Cortes Pereira©
FCT/UNL©
UNL©
A Faculdade de Ciências e Tecnologia e a Universidade Nova de Lisboa têm o direito, perpétuo e
sem limites geográficos, de arquivar e publicar esta dissertação através de exemplares impressos
reproduzidos em papel ou de forma digital, ou por qualquer outro meio conhecido ou que venha a
ser inventado, e de a divulgar através de repositórios científicos e de admitir a sua cópia e
distribuição com objectivos educacionais ou de investigação, não comerciais, desde que seja dado
crédito ao autor e editor.


iii
Acknowledgments
This Project could not be possible without the precious contribution and help from this big list of
persons from the Paintings laboratory; Metals laboratory, Electronic and Optoelectronic Materials &
Devices laboratory; Nanofabrication laboratory & Photochemistry laboratory at FCT-UNL;
Bromatology laboratory at FFUP; Biochemistry & Microbiology laboratory at VŠCHT:
Alexandra Costa; Ana Serafim; Ana Teresa Lopes; Anabela Costa; Andreia Forte; Armindo Melo;
Artur Moro; Catarina Petisca; Elsa Vieira; Isabel Ferreira; Juliana Teixeira; Leslie Carlyle; Luís
Branco; Michaela Crhová; Olga Viegas; Petra Junková; Peter Konik; Raquel Gavara; Sandra Dias;
Sara Fragoso; Shari Almeida; Štěpánka Kučková; Susana Sá and Tito Busani.
To all of them my sincere thanks.
To some thank you for the opportunity you gave me to participate in this project;
To others thank you for letting me work a little with you;
To others thank you for sharing your space with me;
To others thank you for sharing with me your knowledge;
To others thank you for helping me with equipment, reagents and other tips;
To others thank you for the patience;
To others thank you for your minds that help me figure out solutions;
To others thank you for all of the above.
Very little in the field of conservation generates as much
controversy as the cleaning of surfaces
Narayan Khandekar

v
Resumo:
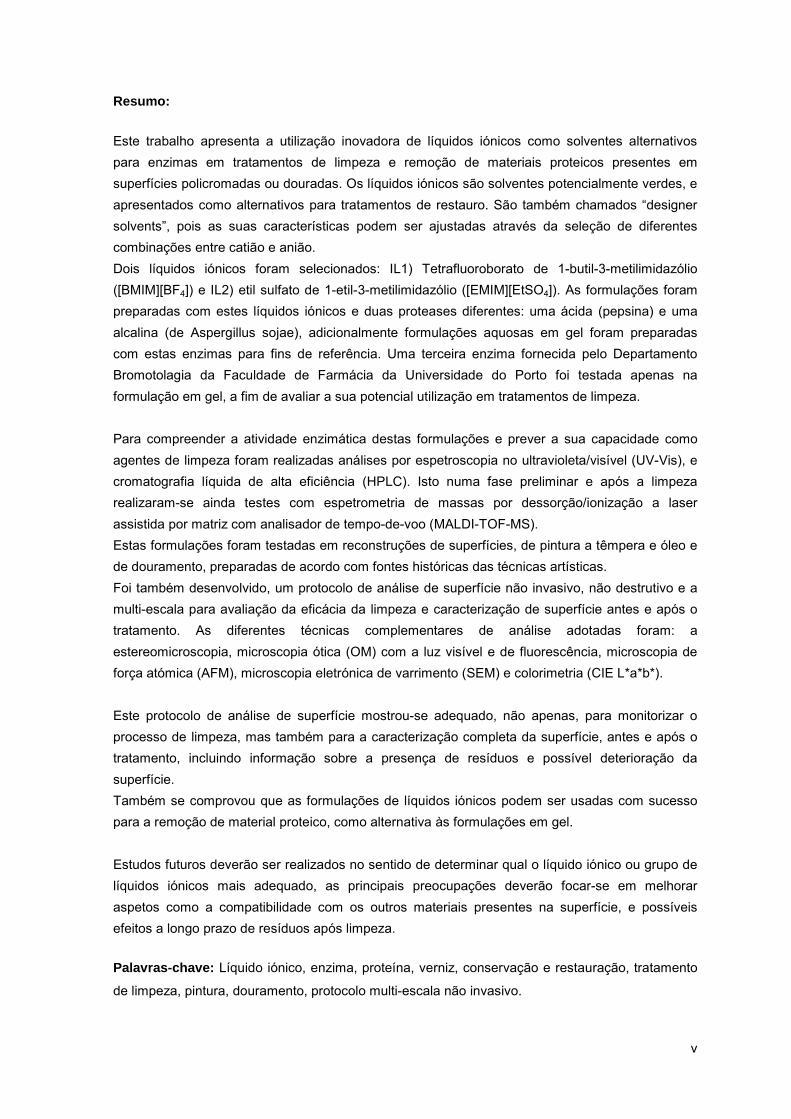
Este trabalho apresenta a utilização inovadora de líquidos iónicos como solventes alternativos para enzimas em tratamentos de limpeza e remoção de materiais proteicos presentes em superfícies policromadas ou douradas. Os líquidos iónicos são solventes potencialmente verdes, e apresentados como alternativos para tratamentos de restauro. São também chamados “designer solvents”, pois as suas características podem ser ajustadas através da seleção de diferentes combinações entre catião e anião. Dois líquidos iónicos foram selecionados: IL1) Tetrafluoroborato de 1-butil-3-metilimidazólio ([BMIM][BF4]) e IL2) etil sulfato de 1-etil-3-metilimidazólio ([EMIM][EtSO4]). As formulações foram preparadas com estes líquidos iónicos e duas proteases diferentes: uma ácida (pepsina) e uma alcalina (de Aspergillus sojae), adicionalmente formulações aquosas em gel foram preparadas com estas enzimas para fins de referência. Uma terceira enzima fornecida pelo Departamento Bromotolagia da Faculdade de Farmácia da Universidade do Porto foi testada apenas na formulação em gel, a fim de avaliar a sua potencial utilização em tratamentos de limpeza. Para compreender a atividade enzimática destas formulações e prever a sua capacidade como agentes de limpeza foram realizadas análises por espetroscopia no ultravioleta/visível (UV-Vis), e cromatografia líquida de alta eficiência (HPLC). Isto numa fase preliminar e após a limpeza realizaram-se ainda testes com espetrometria de massas por dessorção/ionização a laser assistida por matriz com analisador de tempo-de-voo (MALDI-TOF-MS). Estas formulações foram testadas em reconstruções de superfícies, de pintura a têmpera e óleo e de douramento, preparadas de acordo com fontes históricas das técnicas artísticas. Foi também desenvolvido, um protocolo de análise de superfície não invasivo, não destrutivo e a multi-escala para avaliação da eficácia da limpeza e caracterização de superfície antes e após o tratamento. As diferentes técnicas complementares de análise adotadas foram: a estereomicroscopia, microscopia ótica (OM) com a luz visível e de fluorescência, microscopia de força atómica (AFM), microscopia eletrónica de varrimento (SEM) e colorimetria (CIE L*a*b*). Este protocolo de análise de superfície mostrou-se adequado, não apenas, para monitorizar o processo de limpeza, mas também para a caracterização completa da superfície, antes e após o tratamento, incluindo informação sobre a presença de resíduos e possível deterioração da superfície. Também se comprovou que as formulações de líquidos iónicos podem ser usadas com sucesso para a remoção de material proteico, como alternativa às formulações em gel. Estudos futuros deverão ser realizados no sentido de determinar qual o líquido iónico ou grupo de líquidos iónicos mais adequado, as principais preocupações deverão focar-se em melhorar aspetos como a compatibilidade com os outros materiais presentes na superfície, e possíveis efeitos a longo prazo de resíduos após limpeza.
Palavras-chave: Líquido iónico, enzima, proteína, verniz, conservação e restauração, tratamento
de limpeza, pintura, douramento, protocolo multi-escala não invasivo.

vii
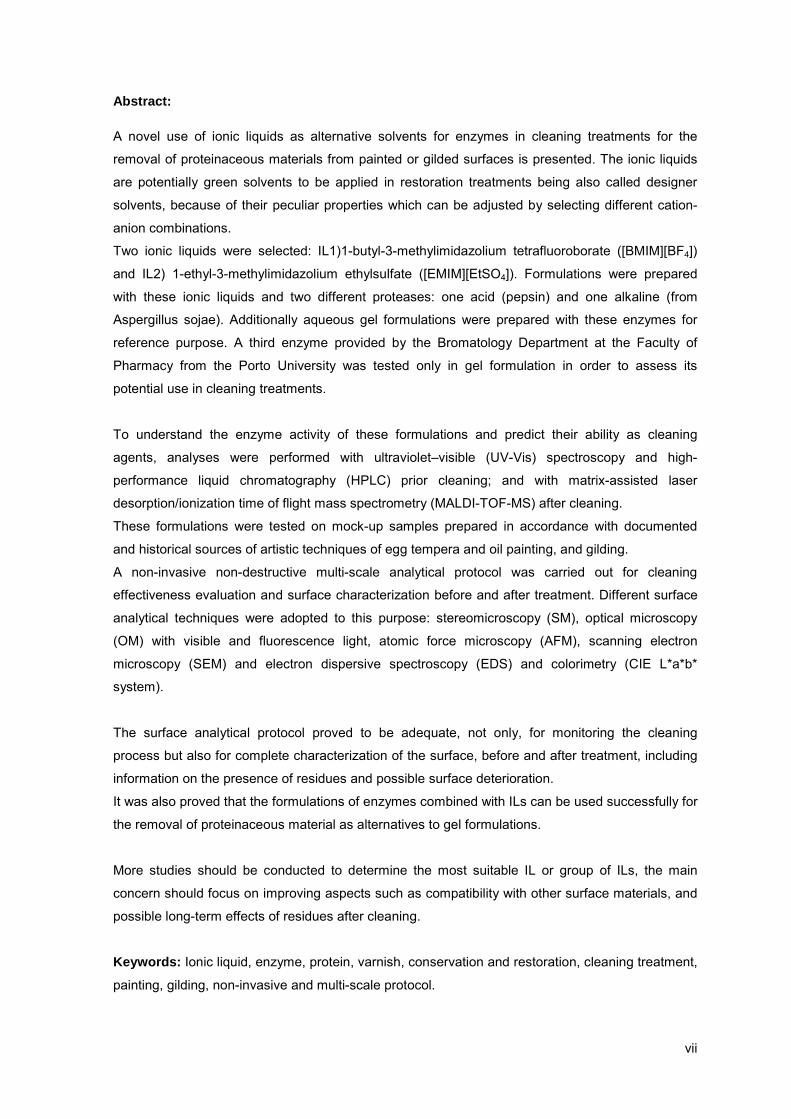
Abstract:
A novel use of ionic liquids as alternative solvents for enzymes in cleaning treatments for the
removal of proteinaceous materials from painted or gilded surfaces is presented. The ionic liquids
are potentially green solvents to be applied in restoration treatments being also called designer
solvents, because of their peculiar properties which can be adjusted by selecting different cation-
anion combinations.
Two ionic liquids were selected: IL1)1-butyl-3-methylimidazolium tetrafluoroborate ([BMIM][BF4])
and IL2) 1-ethyl-3-methylimidazolium ethylsulfate ([EMIM][EtSO4]). Formulations were prepared
with these ionic liquids and two different proteases: one acid (pepsin) and one alkaline (from
Aspergillus sojae). Additionally aqueous gel formulations were prepared with these enzymes for
reference purpose. A third enzyme provided by the Bromatology Department at the Faculty of
Pharmacy from the Porto University was tested only in gel formulation in order to assess its
potential use in cleaning treatments.
To understand the enzyme activity of these formulations and predict their ability as cleaning
agents, analyses were performed with ultraviolet–visible (UV-Vis) spectroscopy and high-
performance liquid chromatography (HPLC) prior cleaning; and with matrix-assisted laser
desorption/ionization time of flight mass spectrometry (MALDI-TOF-MS) after cleaning.
These formulations were tested on mock-up samples prepared in accordance with documented
and historical sources of artistic techniques of egg tempera and oil painting, and gilding.
A non-invasive non-destructive multi-scale analytical protocol was carried out for cleaning
effectiveness evaluation and surface characterization before and after treatment. Different surface
analytical techniques were adopted to this purpose: stereomicroscopy (SM), optical microscopy
(OM) with visible and fluorescence light, atomic force microscopy (AFM), scanning electron
microscopy (SEM) and electron dispersive spectroscopy (EDS) and colorimetry (CIE L*a*b*
system).
The surface analytical protocol proved to be adequate, not only, for monitoring the cleaning
process but also for complete characterization of the surface, before and after treatment, including
information on the presence of residues and possible surface deterioration.
It was also proved that the formulations of enzymes combined with ILs can be used successfully for
the removal of proteinaceous material as alternatives to gel formulations.
More studies should be conducted to determine the most suitable IL or group of ILs, the main
concern should focus on improving aspects such as compatibility with other surface materials, and
possible long-term effects of residues after cleaning.
Keywords: Ionic liquid, enzyme, protein, varnish, conservation and restoration, cleaning treatment,
painting, gilding, non-invasive and multi-scale protocol.


ix
Index:
Acknowledgments .............................................................................................................................. iii
Resumo: ..............................................................................................................................................v
Abstract: ............................................................................................................................................ vii
1. Introduction: ............................................................................................................................ 1
1.1. Concepts review: ............................................................................................................ 2
1.2. Surface characterization and treatment monitoring ....................................................... 6
2. Materials and methods ........................................................................................................... 9
2.1. Materials ......................................................................................................................... 9
2.2. Mock up samples from documented reconstructions ..................................................... 9
2.3. Cleaning formulations ................................................................................................... 10
2.4. Cleaning protocol .......................................................................................................... 11
3. Analytical protocol and Instruments: .................................................................................... 13
3.1. Enzymatic activity measurements ................................................................................ 13
3.2. High-performance liquid chromatography (HPLC) ....................................................... 13
3.3. Cross-sections and staining test .................................................................................. 13
3.4. Surface characterization, assessment and control of the cleaning process ................ 14
3.5. Other techniques - MALDI-TOF Mass Spectrometry ................................................... 16
4. Results .................................................................................................................................. 17
5. Discussion ............................................................................................................................ 23
5.1. Enzyme activity ............................................................................................................. 23
5.2. Other considerations on the new formulations ............................................................. 24
5.3. Surface monitoring protocol ......................................................................................... 26
5.4. Peptide analysis - MALDI-TOF-MS .............................................................................. 35
6. Conclusion ............................................................................................................................ 39
7. Future trends ........................................................................................................................ 41
8. Bibliography .......................................................................................................................... 43
Appendix ........................................................................................................................................... 49


xi
Figures Index:
Figure 1.1: Examples of documented reconstructions as it would be observed in a cross-section, with the identification of the different types of layers; a) painting on canvas support, b) gilding on wood support. ..................................................................................................................................... 2
Figure 1.2: a) General structure of an amino acid; b) Peptide bond between amino acids. .............. 3
Figure 1.3 – Diagram of the “lock and key" hypothesis of enzyme action. ........................................ 5
Figure 2.1 – Overall view of the initial condition of the samples used in this project, Grouped vertically: a) Tempera painting with egg white and fish glue varnishes; b) Oil painting with egg white and fish glue varnishes; c) Oil painting with casein varnish; d) Gilding with animal glue varnish; a & b prepared on canvas mounted on glass slides and c & d prepared on wood. ................................. 9
Figure 2.2: methylimidazolium cation [R-MIM]+ and some examples of anions in ionic liquids: ...... 11
Figure 4.1 - UV spectrometry compared results with reference blank solutions (B) for the alkaline enzyme (E2) with every formulation buffer (T), gel (G) and ionic liquids (IL1 & IL2). ...................... 18
Figure 4.2 – UV spectrometry compared results: a) for the alkaline enzyme (E2) with every formulation buffer (T), gel (G) and ionic liquids (IL1 & IL2); b) tests for IL2 with enzymes E1 & E2.18
Figure 4.3 – HPLC chromatograms, for casein catalysis with E2 in different solutions: Tris HCL 8.4pH buffer (T), 8.4pH gel (G) and ionic liquid IL1. ........................................................................ 20
Figure 5.1 – Cross-section images of the sample GG-CA with OM at 100x with visible light.......... 26
Figure 5.2 – Cross-section images of the sample OG-Ca with OM at 100x with visible light ......... 26
Figure 5.3 - 100x OM image of the sample EG-S-EW with visible light, showing craquelure pattern. .......................................................................................................................................................... 27
Figure 5.4 - 100x OM images with visible light, the effect of varnish: a) OG-S, unvarnished surface; b) OG-S-Ca, sample with casein varnish. ........................................................................................ 28
Figure 5.5 - 100x OM UV fluorescence images of the different materials used in the samples: a) EG-YO-EW Egg white varnish over a egg tempera paint sample; b) EG-YO unvarnished egg tempera paint sample; ...................................................................................................................... 28
Figure 5.6 - 2D and 3D rendering of the AFM image set of height/topography, amplitude and phase (a) Unvarnished reference sample of tempera painting; (b) Unvarnished reference sample of oil painting. ............................................................................................................................................ 29
Figure 5.7 - 3D and 2D AFM height images, surface features measured on the obtained section and: a) tempera painting without varnish, pigment grain size measurements of. b) tempera painting e with egg white varnish, measurement of the height of the varnish layer in a gap area. ............... 29
Figure 5.8 2D and 3D rendering of the AFM image set of topography, amplitude and phase (a) Tempera painting sample after cleaning; (b) Unvarnished reference sample of tempera painting. 31
Figure 5.9 - 3D rendering of the AFM topographic image and OM with visible light and UV light, images set of animal glue coating from a gilded surface sample (a) Before cleaning ..................... 32
Figure 5.10 – EG-S-CP; images set after removal of isinglass varnish of a egg tempera painting sample with IL1+E1: OM images with visible light and UV light 100x; SEM at 1000x and 3000x and 2D and 3D rendering of the AFM images, , and. .............................................................................. 32

xii
Figure 5.11 – OG-S-CP sample: OM images with visible light and UV light after removal with IL1+E1, and 3D rendering of the AFM image and, after removal of isinglass varnish. .................... 33
Figure 5.12 – EG-S-EW. Tempera painting sample after removal of egg white varnish with cleaning formulation: IL1+E1 (a) Elemental mapping with SEM/EDX, (b) 2D and 3D rendering of the AFM image set on the same area. ............................................................................................................ 33
Figure 5.14 – AFM images for topography, amplitude and phase of a reference tempera painting surface with fish glue varnish sample cleaned with IL2 [EMIM][EtSO4]. .......................................... 34
Figure 5.13 – Cotton swab collection after cleaning of two samples. .............................................. 34
Figure 5.15 – MALDI-TOF-MS analysis of the material retrieved from the cotton swabs used on samples of egg white varnish on oil painting (OG-EW) samples, with E1 formulations (3A-Gel, 40A-IL1 and 51A-IL2). .............................................................................................................................. 35
Figure 5.16 – MALDI-TOF-MS analysis of the material retrieved from the cotton swabs used on samples of egg white varnish on oil painting (OG-EW) samples, with Gel formulations (4A-E1, 17A-E2 and 28A-E3). ............................................................................................................................... 36
Figure 5.17 – MALDI-TOF MS analysis of material retrieved from the cotton swabs used: a) fish glue varnish sample cleaned with E1+IL2 formulation. Peptide analysis up to 3500 N/z and large peptides/proteins analysis with more than 4000 m/z b) [40], b) Animal glue varnish sample, after treatment with just IL2; measurements done with standard trypsin cleavage. ................................. 36

xiii
Tables Index:
Table 2.1 – Final formulations composition summary. ..................................................................... 11
Table 4.1 – Results of the removal tests obtained for different periods of time for the four proteinaceous varnishes with the three enzyme+gel formulations. ................................................. 17
Table 4.2 – UV Spectrometry absorbance for enzyme activity: ....................................................... 17
Table 5.1 – HPLC analysis - Peptide and protein quantification for casein catalysis with enzyme E2: in Tris HCL 8.4pH buffer; 8.4pH gel and ionic liquid IL1; E2+IL1 casein catalysis for 1, 2, 4 & 8 days old solution. ...................................................................................................................................... 24


xv
Abbreviations list:
IL – Ionic liquids
IL1 – [BMIM][BF4] 1-butyl-3-methylimidazolium tetrafluoroborate
IL2 – [EMIM][EtSO4] 1-ethyl-3-methylimidazolium ethylsulfate
RTIL – Room temperature ionic liquids
E.C. – Enzyme classification
E1 – Acidic protease
E2 – Basic protease
E3 – Yeast extract
EG – Egg tempera
OG – Oil paint
GG – Gold leafing - gilding
S – Sinopia
YO – Yellow ochre
EW – Egg white varnish
CP – Fish glue varnish
Ca – Casein varnish
CA – Animal glue varnish
G – Aqueous cellulose based buffered gel
UV-Vis – Ultraviolet–visible spectroscopy
HPLC – High-performance liquid chromatography
MALDI-TOF-MS – Matrix-assisted laser desorption/ionization time of flight mass spectrometry
SM – Stereomicroscopy
OM – Optical microscopy
AFM – Atomic force microscopy
SEM – Scanning electron microscopy
EDS – Electron dispersive spectroscopy
EDX –Dispersive X-ray spectroscopy


1
1. Introduction:
Although cleaning is a frequent treatment in the restoration field, and it is mostly agreed on why
should be performed, it is never fully accepted without controversy on how, as it goes against the
major ethical principles of conservation: it is completely irreversible and causes the biggest visible
alteration to the object. A way to justify the need of such treatment is accepting its benefits and
choosing the material and techniques that are most compatible, with the lowest risk for the object
and no long term consequences.
There is always a search for new methods as none of the known ones are suitable for every
situation. The use of enzymes was a breakthrough in the cleaning process as they are highly
selective to the material to be removed not affecting surrounding materials of different nature [1, 2].
Usually they are used with an aqueous system but [1], this cannot be applied for every situation. An
innovative solution is related with the possible use of ionic liquids (ILs) as alternative solvent
systems.
Similar problems and considerations that are usually addressed in any cleaning treatment as
summarized by Khandekar [2], on the subject of aqueous gel cleaning on painted and varnished
surfaces, should be considered also for the use of ionic liquids. Firstly the efficiency of the
treatment: what is being cleaned and the active components, the clearance process, residues (of
the varnish and cleaning solution) associated problems of compatibility and long term effects.
Secondly, as stated by Khandekar, there is a need to develop ‘an adequate experimental
methodology’.
The experimental project developed here has the main objective of giving a scientific groundwork
for the novel use of combined ionic liquids and enzyme formulations for the cleaning and removal
of proteinaceous material (varnishes) in conservation and restoration surface treatments.
Another objective is to establish valid treatment monitoring and effectiveness assessment protocol,
using non-invasive surface analytical techniques. The experimental protocol should be also
suitable for other surface treatments and surface characterization on cultural objects.
The experimental work was mainly divided in four steps:
a) Formulation selection and establishment of the cleaning protocol. Two proteases
(appendixes I and II), commercially available for restoration treatments, were acquired; and a
third one was provided by the Bromatolagy Department of the Faculty of Pharmacy from the
Porto University. Several ionic liquids, selected from those available and recommended by
relevant bibliography, were tested in preliminary trials for evaluation of enzymatic activity by
ultraviolet–visible (UV-Vis) spectroscopy and high-performance liquid chromatography
(HPLC); from these two ionic liquids were selected. Finally seven enzyme formulations were
prepared with the two ionic liquids or gel and the three enzymes. The preliminary tests also
helped to establish the cleaning procedures.

1. Introduction
2
b) Complete surface characterization Mock-up samples were prepared as documented
reconstructions of oil and tempera painting and gilding, with four proteinaceous varnishes
(egg white, isinglass, animal glue and casein). The second step was a complete surface
characterization of these samples by different analytical microscopy techniques, namely
Stereomicroscopy (SM), Optical Microscopy (OM), Scanning Electron Microscopy (SEM) and
Atomic Force Microscopy (AFM); and also Colorimetry (CIE L*a*b*), in order to describe the
surface and conservation state before the treatment.
c) Experimental cleaning tests on the mock up samples with the enzyme formulations
prepared with both ionic liquids and, for reference, with gel.
d) Evaluation of the effectiveness assessment, by surface characterization analysis with the
techniques mentioned in step b); in addition, residue identification measurements were done
with Matrix-Assisted Laser Desorption/Ionization Time of Flight Mass Spectrometry (MALDI-
TOF-MS).
1.1. Concepts review:
The documented reconstructions (mock-up samples) are prepared duplicating the stratigraphy
(structure and materials) of artistic techniques as described in relevant literature, such as historical
art treatises or manuals and other sources1. For this project oil (OG) and egg tempera (EG)
painting and gilding (GG) were prepared following the structure represented in Figure 1.1.
Figure 1.1: Examples of documented reconstructions as it would be observed in a cross-section, with the identification of the different types of layers; a) painting on canvas support, b) gilding on wood support.
The varnish, usually the top layer of such composites, provides protection of the surface against
foreign degradation elements, and also enhances optical properties of the polychrome surface
such as glow and color saturation. So it is expected of the material to be the more transparent,
elastic and unaltered as possible with time2 [1]. Different materials have been used through time for
the preparations of varnishes: natural resins, proteins, even oil and more recently synthetic
materials.
Painting materials and particularly varnishes suffer deterioration due to ageing (natural material
degradation) enhanced by external factors (e.g.: light, humidity, microbial degradation, deposition
of pollutants and others). When the deterioration reaches the point where the varnish no longer
fulfills its use i.e., does not protect the surface and/or alters its perception, needs to be removed
1 There are several ancient treatises and more recent studies and compilations on the artistic materials and techniques, here more than a specific replica the intended was a generic painting structure. 2 Even though ancient art treatises advice the use of clear varnishes it is known that artists used colored varnishes and would add pigments and other material to achieve special effects/alter its properties. But this issue will not be addressed at this time.

1. Introduction
3
and replaced. Here it will be addressed the problem of the removal of four protein varnishes as
they become highly insoluble with time and can hardly be removed. The varnishes studied in this
project are: egg white (EW), animal glue (CA), isinglass (fish glue, CP) and casein (Ca).
The preparation of these proteins as filmogenic materials to be applied as varnish is described in
many ancient recipes and art treatises [3, 4].
Cennino Cennini3 advises the use of animal glue as a pre-varnish for the pigment terre-verte; and
egg white4 as “a sort of varnish” to make the work seem “stronger”5; or for wood and stone
sculptures to be applied over the skin areas of hands and face [3]. Other authors advise the use of
egg white as a temporary protection varnish, Palomino6 in the eighteen century already focusing on
the conservation of paintings, points out the advantage of this varnish as a sacrificial layer because
it can easily be removed with sponge and water when its dirty and again replaced with new one [4].
Other protein varnishes are found in painting surfaces as original varnish or in later additions such
as in conservation treatments. For instance on tempera paintings, sometimes done without varnish
layer, fish glue varnish was used as a “reviving” technique popularized by De Mayerne7 in the
seventeen century; according to him the tempera paintings would, “look as if they were painted in
oil” [1].
Proteins are bio-functional8 polymeric chains composed of amino acids, amphoteric compounds9,
containing both functional carboxylic acid group (-COOH) and basic amine (-NH2) and a
side chain (-R) that is specific to each amino acid (Figure 1.2a) [5].
Figure 1.2: a) General structure of an amino acid; b) Peptide bond between amino acids.
There are twenty naturally occurring amino acids and a protein can have chains in the order of the
thousands amino acids linked together by –NHCO– the peptide bond (Figure 1.2b). The number of
amino acids and the order in which they are aligned in the chain identifies and gives specific
structure and function to the proteins. Amino acids aligned themselves in chains, the primary
3 Cennino d'Andrea Cennini (c. 1370 – c. 1440), Italian painter and author of the “Il libro dell'arte”. 4 Also historically referred as glair. 5 These were pre-varnishes as the final varnish should be applied only after one year of the painting execution [1]. 6 Acislo Antonio Palomino de Castro y Velasco (1653 – 1726), Spanish painter and author of the “El Museo Pictórico y Escala Óptica”. 7 Théodore Turquet de Mayerne (1573 – c.1655) was a Swiss physician and author. 8 Compounds that participate in reactions inside living cell, or have structural and mechanical function in the living tissues. 9 Capable of reacting chemically either as an acid or as a base substance.
C
R
N+H3
COO-
H
α carbon
Side chain
carboxyl terminal group
Amine terminal groupa
C
OH
O
RH
H2N
R ' H
H2N C
CNH
H
R'
COOH
O
H2N
R H
H2OO
OH
b

1. Introduction
4
structure of the protein. A spatial arrangement of the chain as helixes, sheets and turns allows for
interactions between non sequenced amino acids stabilized by hydrogen bonds (secondary
structure). The third order of structure for the proteins is the functional shape of the secondary
structure, polypeptides within the protein folds in a unique three-dimensional way [6]. With time
denaturation occurs, i.e. unfolding of the natural three-dimensional configuration of the protein
chain, this is what makes the surface of the protein varnish to become more opaque, hardened and
brittle and the protein less soluble. Considerable more stable to oxidation processes than other
materials of the painted surface, proteins are however very susceptible to humidity, being this the
main factor for their deterioration [7]. The other important factor is related with their biological
degradation as proteins are a food source to microorganisms.
Common proteins used as artistic and restoration materials, and considered in this study, are:
Egg white, contains about 87% water, 2% of other materials and 12% of protein mixture, of the
latter about 65% is albumin, a class of proteins that are present both in egg white and egg yolk and
other materials. The alteration in the egg white varnish properties was already recognized in the
nineteen century, and its use inadvisable in conservation treatments since no satisfying
effectiveness of the removal of these varnishes was achieved by conventional methods [8].
Gelatins are the group of proteins found in biological tissues and main constituent of animal and
fish glues, the purity of the glue is related with the quality and amount of other materials. The fish
and animal glue are differentiated by the specific amino acid proportions; in general the fish glues
are also more pure which results in a clearer and stable glue.
Caseins are proteins obtained from precipitation of milk and may contain different impurities such
us lactose, acids and butter. The casein is differentiated from the other proteins because it belongs
to the phosphoproteins group, which are proteins that are physically bond to substances containing
phosphoric acid [6, 9]. For this they are insoluble in water and more susceptible to deterioration by
oxidation processes. The conservation practice reported some difficulty in removing the
proteinaceous materials [7, 8,] and therefore, required the use of more aggressive treatments,
usually toxic for the conservator, that endangered the other layers. The ideal was to find a specific
treatment to proteins that did not affect the rest of the materials. This would be only achieved with
the introduction of enzymes in the cleaning process [1, 2] a major breakthrough as enzymes are
catalysts very specific to substrates and can be used in moderate conditions. Early works of the
mid-twentieth century already reports the use of enzymes [10] albeit with doubtful approaches, and
in the late 1960s Banks [11] refers the use of collagenase10, to remove glues, with some success
and conscious of the needed cares and possibilities
Enzymes are themselves proteins with specific amino acids sequences and unique three-
dimensional configuration that allows the interactions with very specific materials in certain active
areas, that have been described many times as a lock and key system [6, 12] Figure 1.3.
10 The enzymes are named by adding the suffix -ase to the end of the that is to be converted to the desired product. e.g. peptidase that converts peptides to smaller molecules such as amino acids.

1. Introduction
5
Figure 1.3 – Diagram of the “lock and key" hypothesis of enzyme action.
Enzymes of interest to conservators are those that facilitate degradation processes acting as
catalyst11 in hydrolytic reactions12, in this case the hydrolysis of proteinaceous material specifically
known as proteases or peptidases. In the international enzyme classifications it is the group
E.C.3.4.13, where E.C. stands for enzyme classification; 3. for hydrolysis and 4. for the affected
substrate: peptides or proteins.
As early as 1977 Hatton [13] proposes the use of the enzymes as cleaning agent in cellulose
based gel for the first time. More recently Wolbers [14] popularized the use of aqueous cleaning
systems for conservation purpose, as a viable, less toxic alternative to common free organic
solvents, including the preparation of enzyme in gel mixtures. Another author that disseminated the
use of enzymes in conservation treatments was Cremonesi [15].
But there are situations where these aqueous systems do not give the best results. The works
mentioned [14, 15] show recipes of complex mixtures with over 4 components, this high number
makes difficult to fully predict the interaction of the mixture, its interaction with the treated surface
and possible long term deterioration problems.
The use of organic solvents that are compatible with the enzymes is not advised as they are
usually highly toxic and strong solvents in themselves establishing interactions with the other
materials of the painted surface. A possible alternative could be related with the use of “green
solvents”, mainly based on ionic liquids.
Ionic liquids (ILs) can be defined as organic salts with a melting point below 100ºC, or more
interesting as liquids at room temperature (room temperature ionic liquids; RTIL). In the last 20
years the interest from both academia and industry has gained significant impact mainly due to
their environmental friendly characteristics as green14 alternative for traditional volatile organic
solvents (VOCs) and because of their wide range of physicochemical properties. There are a large
number of organic cations and anions that can be combined to form different ionic liquids, and this
is one of the most important features of these compounds.
11 A catalyst is a substance that without being consumed, or change the reaction equilibrium, accelerates its process and/or allows it to occur in more desirable conditions, such as lower temperature. 12 Includes lipase, amylase and peptidase enzymes that catalyses the hydrolytic breakdown of lipids, sugars and proteins respectively. 13 Enzyme classification as recommended by the International Union of Biochemistry and Molecular Biology and available at http://www.chem.qmul.ac.uk/iubmb/. 14 The negligible vapor pressure is one of the main reasons to distinguish ionic liquids as green solvents [16], as possible release to the environment can be controlled, allows safer handling for the user and do not have the risk of fire or explosions. The green solvent status of the ionic liquids has been discussed as some of the compounds are proved to have some toxicity and the means to obtain them are sometimes also toxic [17-19]. Despite this, new productions methods are being developed, and the toxic effect could be an advantageous characteristic for controlling of microbiologic contaminations.

1. Introduction
6
ILs have been also described with some peculiar properties such as their high conductivity,
variable range of density and viscosity values, tunable polarity and solubility as well as their high
thermal and chemical stability. Overall, the number of possible ionic liquids is estimated around the
ten to the eighteenth (1018), whereas the number of traditional solvents widely used in industry
accounts for a few hundred.
Ionic liquids are also called “designer solvents” because, by changing cation-anion combinations
[16], they can be adjusted to specific situations or requirements such as stability, solubility,
viscosity, improvement of enzyme cleaning effectiveness, surface compatibility, and lower toxicity
behavior [20]. The previous work of Pacheco [21] reports on the use of IL as a potential new
material for heritage conservation treatments; it is focused on the use of the IL as alternative
solvents and cleaning agents for resinous material, natural and synthetic, with some encouraging
results.
The use of enzymes in IL media it is not an old science, and is still an unstudied area in
conservation science with a large number of possibilities. The first report of the use of IL for
biocatalysis with enzymes has just a little more than 10 years [22] but, rapidly started to be a major
interest area of research. Kragl & coworkers [23] and Roosen & coworkers [24] show the
production of articles registered on the web of science on the subject of biocatalysis using ILs in
the past years. Fred van Rantwijk & coworkers [25] and Moniruzzaman & coworkers [26] reported
reviews about biocatalysis using ionic liquids.
In the present work, the ILs will be addressed from the point of view of compatibility in restoration
treatments when combined with enzymes, as an alternative to traditional gel formulation.
1.2. Surface characterization and treatment monitoring
The characterization of the materials present in a cultural heritage object is the first step before any
conservation or restoration procedure [1, 27]. In a painted surface besides the rheological and
other physical-chemical properties of paint materials, the applications method, number of paint and
varnish layers and their thickness are important issues to consider.
To fully understand the object’s surface characteristics and its state of conservation analytical tools
are needed and in some cases sampling of the objects is required. The sampling is always a
problem to consider as it means the loss of material, even if the information retrieved is considered
most valuable and the sample is minute in size. But in the case of surface treatments such as the
removal of varnish layers this problem can be overcome by applying noninvasive and
nondestructive surface techniques.
Surface properties of cultural heritage artifacts have been approached in recent years by
conservation and material scientists and physicists who applied non-invasive analytical tools to
describe the behavior of the polychrome and gilding surfaces, according to the optical, mechanical,
physical and chemical characteristics [28-31]. The analytical data obtained from a multiscale and
multiple technique approach is useful for the practitioner (conservator, curator or art historian) to
assess the composition, conservation state and eventually provenance and authenticity, as well as

1. Introduction
7
to predict future changes of the surface with regard to the choice of best preservation conditions or
of the right restoration treatment (for example: cleaning, consolidation or varnishing) [5, 29, 32].
The techniques chosen herein have been previously reported for their usefulness:
stereomicroscopy (SM), optical microscopy (OM), scanning electron microscopy (SEM-EDX),
atomic force microscopy (AFM), colorimetry (CIE L*a*b*) [28, 29, 31, 33-36]. AFM was recently
reported in researches relating to the study of the surfaces of gilding layers and the nano-scale
effectiveness assessment of cleaning treatments [31, 37-39]. This technique has a great potential
for monitoring cleaning interventions on paintings or polychromed surfaces of works of art, and
could bring an important contribution in assessing the presence of residues of the cleaning
formulation at a nano-scale.
It will be demonstrated that the use and combination of different surface analytical techniques
returns an extensive and complete set of information that fully characterize the surface at different
scales (from macro- through micro- to nano-scale) in order to assist the proposed treatment.
The evaluation of the formulations behavior, specifically the activity of the enzymes, was monitored
before and after its use in the cleaning process. The analytical techniques used are those
commonly reported in proteomic science: UV-Vis spectroscopy [40], HPLC [41] and MALDI-TOF-
MS [42, 43].

9
2. Materials and methods
2.1. Materials
Most of the reagents used in this work were provided by Sigma-Aldrich. Acetonitrile and
trifluoroacetic acid were supplied by Merck. Antares supplied two enzymes as commercial ready to
use gel formulations (G+E1, pepsin; and G+E2, from Aspergillus sojae), also Tylose powder, White
Spirit, Shelsol, cotton and proteinaceous glues. The sequencing grade modified trypsin, was
provided by Promega; The ZipTips, pipette tips for sample preparation were supplied by Millipore.
Ionic liquids were provided by Solchemar; embedding polyester resin for cross-sections is
distributed by MR Dinis dos Santos.
2.2. Mock up samples from documented reconstructions
To better understand the possible use and effectiveness of the formulations suggested here, tests
were done on documented reconstructions of polychromed surfaces prepared during 2009 and
March of 201115.
Mock-up samples of tempera (EG) and oil (OG) painting on canvas and wood supports and also
traditional water gilding (GG) over bole ground were replicated in accordance with historical and
artistic sources [3, 44, 45] following the general scheme from figure 1.
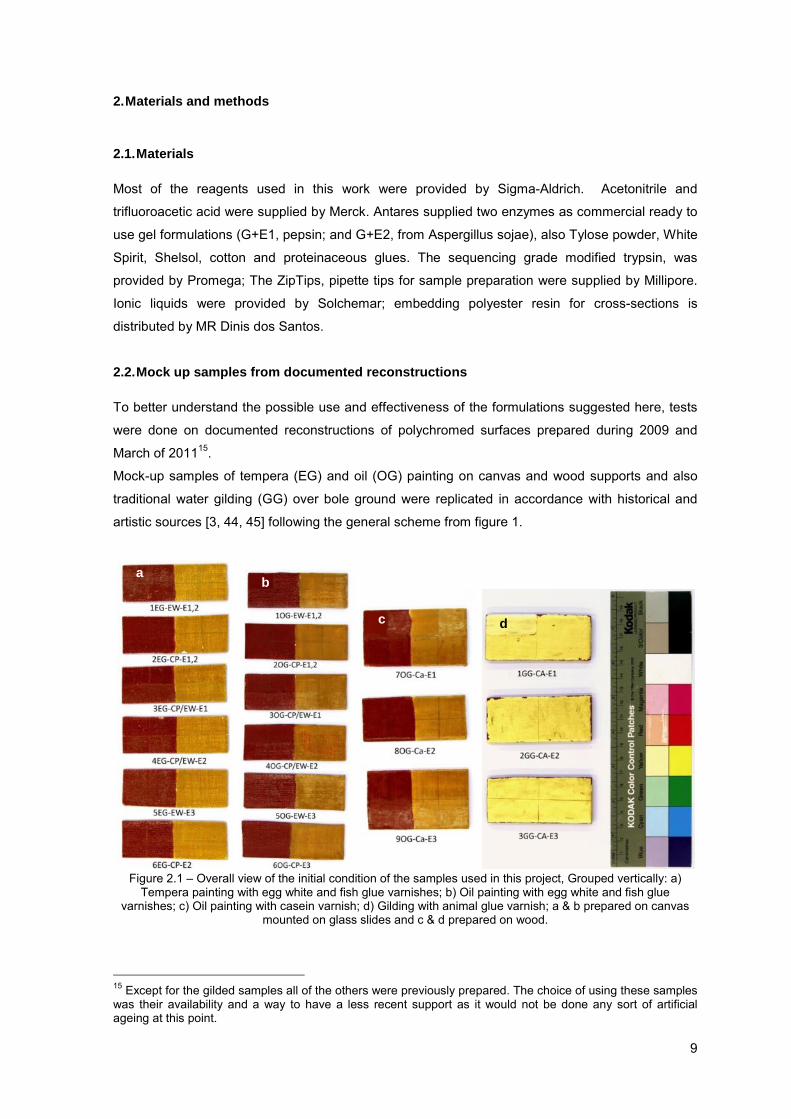
Figure 2.1 – Overall view of the initial condition of the samples used in this project, Grouped vertically: a)
Tempera painting with egg white and fish glue varnishes; b) Oil painting with egg white and fish glue varnishes; c) Oil painting with casein varnish; d) Gilding with animal glue varnish; a & b prepared on canvas
mounted on glass slides and c & d prepared on wood.
15 Except for the gilded samples all of the others were previously prepared. The choice of using these samples was their availability and a way to have a less recent support as it would not be done any sort of artificial ageing at this point.
dc
b a

2. Materials and methods
10
The Figure 2.1 shows the initial aspect of the prepared mock up samples. For each technique a
type of protein vrnish – egg white (EW), fish glue (CP), animal glue (CA) and casein (Ca) – was
selected and applied at the end of 2010 and in April 201116. Except for the gilded surfaces all
samples were duplicated in two different colors of iron oxide based pigments – yellow ochre and
sinopia – to control possible darkening or blanching17 of the surface after treatment. A small area of
the surface in each artistic technique was preserved in order to be tested with every formula (44
areas for testing the four new IL+Enzyme formulations and other 33 for reference gel formulations);
also other areas were left without varnish to serve as reference surfaces.
Although mock-up samples are not a real situation of an ancient paint or polychrome, their use
allows the test of the cleaning formulations in a setting where multiple factors influence the removal
process but, the precise composition is known. As pointed out by Phenix & Sutherland [46] this can
be accepted as a stepping stone and a good compromise when developing new methods.
Preliminary cleaning tests were developed to establish the cleaning protocol and IL selection for
this, thin layers of the same four varnishes were prepared over microscope glass slides.
2.3. Cleaning formulations
Two commercially available enzymes, used in conservation for the removal of proteinaceous
materials, were acquired: an acid enzyme (E1), pepsin (appendix I) a protease of the pig’s stomach
mucosa and an alkaline enzyme (E2) from Aspergillus sojae (appendix II). A third enzyme (E3) is
an extract from yeast [40] provided by the Bromatology department of the Faculty of Pharmacy
from the University of Porto, to be tested as a new alternative enzymatic agent, active at pH 7, and
potentially less expensive. Because E3 has not only one active agent but, is an extract with three
different enzymes [40] it is expected a potentially more effective performance with a higher range of
catalytic interactions. However, because is not in a purified form at this moment; the enzyme
activity may vary from batch to batch.
For E1 and E2 the supplier provides also ready-to-use cellulose based buffered gel to the specific
conditions of each enzyme. For the third enzyme however a gel was prepared following Cremonesi
[15] instructions.18 The enzymes were chosen according to optimal performance in the different pH
ranges. Depending on the desired work conditions in a restoration treatment a basic or an alkaline
or a neutral enzyme can thus be selected.
The imidazolium based ILs (figure) are by far the most common ILs used in enzymatic reactions
[20, 24, 47-49]. But the ILs general properties, although follow some pattern, varies substantially
with specific anion- cation- combinations [17, 49, 50]. Park [20] also makes notice that although
polar solvents inactivate the enzymes, ionic liquids does not.
16 We would like to acknowledge at this point the collaboration of Michaela Crhová who helped with the preparation of the samples. 17 Blanching – A local, opaque, whitish discoloration on the surface of a painting. Blanching occurs because of a loss of or an alteration in the binding medium in an oil film, or because of the partial dissolution of a varnish. In accordance with the definition at the Canadian Conservation Institute - CCI Notes 10/11 [http://www.cci-icc.gc.ca/publications/notes/10-11-eng.aspx]. 18 Paolo Cremonesi. L’uso degli enzimi nella pulitura di opera policrome. Padova : Il Prato Editore, 2001. page 48.

2. Materials and methods
11
Figure 2.2: methylimidazolium cation [R-MIM]+ and some examples of anions in ionic liquids: Trifluoroacetate [TFA]-, Trifluoromethanesulfonate [TFO]-, Tetrafluoroborate [BF4]-,
bis(trifluoromethylsulfonyl)imide [NTF2]-, Ethylsulfate [EtSO4]-, Hexafluorophosphate [PF6]-.
In order to select among the numerous IL possibilities preliminary tests for enzyme activity and
cleaning capability were done with ten ionic liquids, Figure 2.1 shows common possible anions.
The different ILs were chosen in accordance with literature review for bio-compatibility, availability
at the lab and predicted compatibility with the painted surfaces [21]. From the ten ionic liquids two
with the best results in the preliminary tests were chosen and labeled as IL1 and IL2 (appendix III):
1-butyl-3-methylimidazolium tetrafluoroborate (IL1 – [BMIM][BF4]) and 1-ethyl-3-methylimidazolium
ethylsulfate (IL2 – [EMIM][EtSO4]).
Seven formulations were prepared: four innovative formulations using two commercial proteases
(E1, E2) and two ionic liquids (IL1, IL2) and three reference formulations with the three enzymes
(E1, E2 and E3) in the traditional cellulose gel mixture (table 2.1 ).
Table 2.1 – Final formulations composition summary.
Formulation Enzyme Solvent pHE1+G
Enzyme + solvent (≅ 1g / 100ml)
Pepsin Commercial cellulose based gel 5 E2+G from Aspergillus sojae Commercial cellulose based gel 8.4
E3+G Yeast extract 3% Tylose / 7pH phosphate buffer Prepared cellulose based gel 7
E1+IL1 Pepsin
20% water v/v
[BMIM] [BF4] - E2+IL1 from Aspergillus sojae [BMIM] [BF4] - E1+IL2 Pepsin [EMIM] [EtSO4] - E2+IL2 from Aspergillus sojae [EMIM] [EtSO4] -
E1 = acidic protease; E2 = basic protease; E3 = yeast protease (Porto); G =gel; IL1 = [BMIM] [BF4]; IL2 = [EMIM] [EtSO4].
2.4. Cleaning protocol
For the new formulations an optimized cleaning protocol needed to be developed. The cleaning
process is in itself a complex issue. There are a great number of variables to be considered in
particular: type of substrate that is to be removed, its nature and state of conservation. The
materials present in the formulation, including their proportions and possible interactions; the
needed conditions to activate the formulation, mixing, temperature, pH, to name a few; and the
cleaning, namely the manner and time of application, as well as the removal and clearance steps.
N
N
R
CH3
[RMIM]+
N
S S
O
O O
O
F
FF F
F
F
NTF2-
S
O
O
OO
EtSO4-
P
F
F
FF
F FPF6
-
B
F
F
F
F
BF4-
S
O
O
OF
F
FTFO-
F
F
F TFA-
O
O

2. Materials and methods
12
For an innovative method such as the one proposed here it was necessary to simplify whenever
possible. Basically the protocol would follow the indications of use for the enzymes with gel
formulations as described by Wolbers [14], Cremonesi [15] and in the suppliers’ material data sheet
(appendix I and II). The enzyme is added to the solvent in accordance with the supplier indications
in a proportion of approximately 1g of the enzyme to 100ml of the proper gel (buffered at the ideal
pH for each enzyme) and the same proportions were used for the ionic liquids. The mixture, after
stirring, is left to stand for 20 minutes in a double-boiler set at 37oC, this step allows for some of the
air introduced during the mixing to be released and to activate the enzyme. The mixture is then
applied with a soft brush and let it be for different amounts of time. As this step depends upon the
type of material present, the preliminary tests helped to establish the contact time for each
formulation and varnish. Following, the cleaning material is removed with dry cotton swabs and in
sequence, allow drying in between, two damp cotton swabs and one with white spirit19 was used.
This is the clearance phase, the first swabs are to remove all residual products and cleaning
material and the last one is to inactivate possible enzyme residues on the surface, as
recommended by the supplier instructions (appendix I and II) and bibliography [14, 15].
Following this cleaning protocol, different times of contact with the varnish surface (from 30
seconds to 35 minutes) were considered and tested for each enzyme + gel formulation and each
protein (egg white, isinglass, animal glue and casein) on the prepared glass slides. When
necessary, in order to avoid drying of the gel on the surface, the area tested was covered with a
transparent polyester film.
With the application times established another round of test were done, then using different ionic
liquids to choose the ones that presented, at least, similar behavior as the gel formulation, i e, that
needed the same amount of time to obtain observed similar cleaning efficiency.
19 White-spirit is a petroleum base distillate also called mineral spirit.

13
3. Analytical protocol and Instruments:
3.1. Enzymatic activity measurements
For the measurements of enzymatic activity the Kunitz method was followed for liquid solutions as
described by Whitaker [51] and also adapted for gel solutions. Initially E1 and E2 were tested, as
recommended, in buffered solutions. Stock solutions of acetate buffer (pH=5) and Tris HCL buffer
(pH=8.4) were prepared as described by Gomori [52]. The enzymatic activity is obtained by
quantifying the products, specifically the aromatic amino acids, in solution after a certain amount of
time with UV absorbance spectroscopy and comparing these values to reference blank solutions.
It was verified that the enzyme activity protocol can be used in a similar approach with the gel
formulations for the three enzymes; the same was done for the ILs with E1 and E2. This test
excluded all the ILs that showed enzyme inactivation, i.e., not compatible for these enzymes.
Two UV-Vis spectrometers (Shimadzu UV-1800 UV-VIS Spectrophotometer and Varian Cary 100
Bio UV-Visible Spectrophotometer) were used for the absorption studies.
As the specific enzyme activity was not the purpose of these tests no comparison was done
between the obtained values and known standards20.
3.2. High-performance liquid chromatography (HPLC)
The HPLC at the Bromatology Department of the Faculty of Pharmacy from the Porto University
was used to study some of the formulations for enzymatic activity and formulations shelf-life; these
tests were done following the protocol as described by Mota & coworkers [41]. The enzymatic
activity was followed by HPLC spectra with the indication of peptide separation different from the
blank samples and by comparison of the peak areas. For measuring shelf-life the test was done at
time intervals of the same preparation and peaks area was compared for interpretation of the
possible loss of enzyme activity. Due to work constrictions HPLC was not used extensively, on all
samples.
3.3. Cross-sections and staining test
Although in the present work the varnishes in the samples are well known it is suggested the
preparation of cross-sections for the identification of the painting structures and generic qualitative
protein identification/mapping by means of staining tests21. Cross-sections were prepared from
minute fragments from a set of representative samples with and without varnish and before and
after treatment. These fragments are imbedded in a polyester resin, followed by polishing with
successive finer grain of micro-mesh paper. Images were obtained by optical microscopy (OM)
technique with visible and fluorescent-light sources. For the identification of the protein material
20 The specific enzyme activity for E1 and E2 is included in the product data sheet in appendixes I and II. For E3 further studies are to be carried out at University of Porto (Faculty of Pharmacy), but reference values are described by Teixeira [40]. 21 In real cultural objects this can be done by retrieving samples from lacunar areas, borders or material loosen during the deterioration process if the origin can be identified on the object surface.

3. Analytical protocol and Instruments
14
and its location in the surface structure a spot test was done using Sypro® Ruby Protein Stain dye,
this identifies and maps the distribution of the proteinaceous material by an orange color observed
under green emission of fluorescence22.
3.4. Surface characterization, assessment and control of the cleaning process
To monitor and assess effectiveness of the treatment an analytical protocol was established and
used before and after the removal of the protein-based varnish. This protocol is based on the
complementary use of different microscopy techniques, at a multi-scale, non-invasive and with little
or no sample preparation: the stereomicroscope (SM) at 10x magnifications, then the optical
microscope (OM) 50x to 200x magnifications, and scanning electron microscope (SEM) on
uncoated samples allowing good resolution imaging up to 3000x magnification. The atomic force
microscopy (AFM) was introduced at an image size of 5 micrometers.
Also measurements of colorimetric values (CIE L*a*b*) were performed. The comparison of the
images and values obtained before and after treatment of the same surface allowed the surface
characterization, but also, to gather information about cleaning effectiveness, possible residues,
and other features in useful time.
3.4.1. Stereomicroscopy and Optical Microscopy
An Olympus stereomicroscope system SZX12, mounted on an extendable arm SZ-STU2 with a
digital camera DP-12 and an independent light source HighLight 3100 was used to record the
sample areas at 10x, 32x and 90x magnifications. Then Axioplan Zeiss 2 imaging binocular
microscope (at 50x, 100x and 200x), with both visible (dark field) and fluorescent radiation, coupled
to a Nikon DXM1200F digital camera was used to image the surfaces, before and after the removal
of the varnish layers. The blocks of filters used for observing the fluorescence were: BP 300-400,
FT 395 and LP 420 (filter 8); BP 450-490, FT 510 and LP 515 (filter 6).
3.4.2. Scanning Electron Microscopy
SEM images were acquired from backscattered electrons and low vacuum secondary electrons
with an Auriga CrossBeam Workstation (SEM-FIB) operating at 1-5 kV, with a typical working
distance (WD) 4.5-9.6 mm, aperture size 30µm, magnifications: from 200x up to 3000x. Due to
work constrictions SEM was not used extensively, on all samples.
With similar operating conditions Electron Scanning Microscopy with Energy Dispersive X-ray
Spectroscopy (SEM/EDX), was also conducted to selected samples for the purpose image
processing and elemental mapping of the surfaces after treatment.
22 Mean excitation wavelength: 302, 470nm / Mean emission wavelength (fluorescence) 610 nm. (From product data sheet available at Sigma-Aldrich: http://www.sigmaaldrich.com/.

3. Analytical protocol and Instruments
15
3.4.3. Atomic Force Microscopy
MFP-3D Asylum instrument was used in non contact imaging mode (AC mode) using Si probes
Tap300Al from Budget Sensors (cantilevers with 300 KHz resonance frequency and 0.2 N/m spring
constant). The scan size was 5 μm2 with a resolution of 512 by 512 lines. Before AFM
measurements, the samples were cleaned with a soft N2 flow to remove free dust contaminations.
The images record the height mapping, this results in 2D images, that throughout this work are,
shown in a gray scale, where brighter areas represent higher areas, from these 3D images are
easily obtained using Igor Pro 6.2 Software. Images were recorded at 3 different locations, for each
investigated area, in order to verify the repeatability and statistical significance of the observed
features. Measurements of surface roughness, the average value of the three scanned areas, were
obtained with the software. Other images were also recorded: amplitude images, which registered
the tip amplitude changes at the given frequency, and phase images, which measure the
dissipative forces between the tip and the samples.
In a non contact mode, the amplitude is set at constant oscillation amplitude maintained by
feedback loop. When there is a height variation, in order to maintain the average tip-to-sample
distance the oscillation amplitude is adjusted. The amplitude images are the result of the amplitude
oscillation adjustments of the cantilever.
The phase is a qualitative measurement of the interaction forces between the tip and the sample.
Even if, no amplitude changes are monitored, the phase can show regions where the sample tends
to interact with the tip in a non-conservative regime: when it shows high contrast between the white
areas (positive) due to attractive interactions and dark areas (negative) due to repulsive
interactions. This interaction with the tip can be particularly relevant indicating, for example, the
presence of different materials or just the same material with different molecular arrangement
(amorphous/crystalline), for example. Notice that these are false colors and can be adjusted to
different hue/tones with different software settings, in this project it was set to a gray scale.
3.4.4. Colorimetry
For the colorimetric measurements a Datacolor International Microflash colorimeter, with a Xe lamp
was used. The measuring area has a diameter of 18mm (22mm illuminated area), the geometry
was 0°/0° and the light source D65.
The colorimetric characterization for each investigated area was performed through the
measurement of L*a*b* parameters (using CIE L*a*b* 1976 system) [34]. Calibration was carried
out before each set of measurements using a pure white standard (calibration values: L= 96.43,
a=-0.33, b= 1.27). Understanding possible variations of each component is important: L* value
measures “lightness” from 0 to 100 corresponding to a variation from black to white. If variation of
L* (∆L*) is positive this means that the sample is lighter after the treatment than before, and when
the value is negative indicates an increase in darkness. a* values ranging from positive to negative
represent color changes from magenta to green, while b* variation indicates changes from yellow
to blue, which means an actual change in color. For each value three sets of data were acquired

3. Analytical protocol and Instruments
16
and the average values were calculated together with the standard deviation from the mean. Delta
E was finally calculated from the L*, a*, b* values before and after the removal of the coating layer
and compared with reference samples.
3.5. Other techniques - MALDI-TOF Mass Spectrometry
Following the cleaning procedures each third cotton swab was analyzed for the presence of
peptides, by MALDI-TOF mass spectrometry in accordance with the protocol described by Kučková
[42]. This allowed for the identification of peptides, demonstrating and comparing the activity of the
enzymes in the different formulations, and some interpretation could be made with respect to
presence of residues from the varnish material.

17
4. Results
Table 4.1 shows the results summary of the preliminary tests done for the two commercial
enzymes (E1 and E2) and E3 in the gel formulation to establish contact time.
From the available ILs, ten structures based on imidazolium cation family were selected and tested
in the same way. Appendix III summarizes the main characteristics of the ILs and preliminary tests
observations.
Table 4.1 – Results of the removal tests obtained for different periods of time for the four proteinaceous
varnishes with the three enzyme+gel formulations. Cleaning formulation
Effectiveness/time of application EW CP CA Ca
E1+gel (pH = 5)
++/3 min ++/3-9 min ++/9 min +/35 min +/30 seconds +/30 seconds -/30 seconds - -/30 seconds
E2+gel (pH = 8.4)
++/30 seconds ++/30 seconds ++/3-9 min ++/27 min - - +/30 seconds - -/30 seconds
E3+gel (pH = 7)
++/3 min ++/3 min ++/9 min +/35 min +/30 seconds +/30 seconds -/30 seconds - -/30 seconds
Legend: ++ Easy removal (the varnish layer is easily removed with the removal of excess formula); + Removal (after gel application the varnish is swollen and this allow a mechanical removal); - Difficult removal (after gel application the varnish is swollen and this allows a mechanical removal, leaving residues); - - No removal (the varnish could not be visibly removed).
Simultaneously, enzyme activity tests with the UV spectrometer technique23 were done for the
formulations, once more using enzymes E1 and E2 as reference, first just in buffered aqueous
solution24 (table 4.2), then in gel and finally with the most promising ILs after preliminary cleaning.
Table 4.2 – UV Spectrometry absorbance for enzyme activity:
Measurements for casein hydrolysis in buffered aqueous solutions.
Test ID Protein pH Enzyme Abs. at 280 nm
B5E1
Casein solution 50mg/ml
pH5 Acetate Buffer E1 0.598
B8E2 pH8,4 Tris HCL Buffer E2 1.33
B7E3 pH7 Phosphate Buffer E3 0.530
Procedure notes: Adaptation of Whitaker’s procedures [51], according with the work done by Teixeira [41]
Absorbance at 280nm represents one of the standard measurements in order to indicate enzyme
activity, the results were obtained for the buffer aqueous solutions relates with concentration of
aromatic amino acids present in solution which can be converted to enzyme activity units by
23 Procedure notes: 3 tubes, one blank and 2 for testing enzymatic activity; the catalysis occurred during 30min in a double-boiler at 37ºC; after that it was added 1ml of triichloroacetic acid (TCA) to stop the enzymatic activity (to the blank tube, 1ml TCA was added before the addition of the enzyme solution); waited 30min; after centrifuge at 10000xg for 10min the supernatant was measure for absorption considering the absorption of the blank as zero [51]. 24 E3 was also analyzed at this point, with the same conditions.

4. Results
18
comparison with standard solutions with known concentrations 25 , this however was not the
objective at this point. Firstly because E1 and E2 have known activity values from the supplier26,
and for E3, as it is an extract that varies from batch to batch27; and secondly because when
changing the conditions, changing the solvent, the results are no longer comparable. However this
is important in order to understand if the enzyme is active in the solution (when the conditions are
similar the results can be compared).
Figure 4.1 - UV spectrometry compared results with reference blank solutions (B) for the alkaline enzyme (E2)
with every formulation buffer (T), gel (G) and ionic liquids (IL1 & IL2).
Figure 4.2 – UV spectrometry compared results: a) for the alkaline enzyme (E2) with every formulation buffer
(T), gel (G) and ionic liquids (IL1 & IL2); b) tests for IL2 with enzymes E1 & E2.
25 “One unit of is defined as the amount of enzyme which yields absorbance of 1mmole of tyrosine per minute under the conditions used” [51] 26 See appendix 1 and 2 for material characteristics data sheets. 27 Complete study of its characteristics is being done at Bromatology Department of the Porto University (Faculty of Pharmacy), and results cannot be presented here.
A
A A

4. Results
19
Enzymes need a minimum amount of available water to be active [20, 53-55]. Additional UV
absorbance tests were performed at different water/IL (v/v) proportions in order to identify the
minimum amount of water required, that was 20%, this high amount could be related to the water
affinity of the IL itself, leaving less available water for the enzymes [53, 54].
Figure 4.1 shows the complete set of results for E2; it was detected that in the IL tests the blank
solution (B), measurements before enzyme catalysis show some absorbance. This observation
could be due to the fact that ILs have higher viscosity and for its characteristics able to retain some
amount of protein after centrifugation.
Figure 4.2 shows results for IL2 with the enzymes E1 and E2. No control of pH was done because
during the preliminary cleaning tests both enzymes were active with both selected ILs. However,
for the enzyme activity tests an associated problem was identified related with the preparation of
protein solution with casein in alkaline medium. For the IL and E1 with affinity to acid medium, the
absorption curve shows anomalies, as the blank solution (B) presented higher absorbance (Figure
4.2).
From these tests, the precise compositions of the formulations to be tested were set and also
established the application times for each protein: approximately 30seconds to 1minute for fish
glue and egg white varnish; 3minutes for animal glue varnish and 30minutes for casein varnish. In
total seven formulations were prepared to be experimented at 1g/100ml (enzyme/solution), and for
E3 1ml/100ml (extract/solution); for the IL, the formulation has 20% v/v of water content: IL1E1,
IL1E2, IL2E1, IL2E2, GE1, GE2 and GE328 (table 2.1).
For the HPLC the same catalytic protocol29 was followed as it was done for the UV spectrometer
technique and as described by Mota [41]. Due to time restrictions, a complete study was done only
for formulation IL1+E2. Figure 4.2 shows that the enzyme is fully active in the IL formulation,
although the peptide distribution is different. The elution of peptides is done by their polarity and
this is related with size of molecular chain; first to be eluted are the most polar components (the IL
is the first component to be separated), and last the proteins 30 , as polarity decreases with
increasing size and secondary interaction of non-sequenced amino acids by hydrogen bonds [12].
The peak area relates with the quantity of peptides, therefore adding all peak areas gives us the
amount of eluted peptides.
When comparing the three groups of peptides, for the different formulations (figure 4.3) it is
observed that the cleavage in the IL, for the same amount of time results in predominantly bigger
sized peptides.
28 E1 = acidic protease; E2 = basic protease; E3 = neutral, yeast protease (Porto Faculty of Pharmacy); G =gel; IL1 and 2 = the selected ionic liquids. 29 See footnote 23. 30 The casein in protein form does not appear as a single peak since the casein is not a protein but, the designation for a set of proteins.

4. Results
20
Figure 4.3 – HPLC chromatograms, for casein catalysis with E2 in different solutions: Tris HCL 8.4pH buffer
(T), 8.4pH gel (G) and ionic liquid IL1.
For the same formulation a shelf-life test was done, i e, determining how long the formulation would
be active after mixing all the ingredients31. For gel formulations it is common practice to use the
same formula for just one working week, this is because the cellulose based gels are susceptible to
contamination by bacterial growth and inactivation of the enzyme with time. This is less likely with
IL because of toxicity levels32, but inactivation can occur naturally, most commonly due to self
cleavage processes and possible external contaminations. Tests show (table 5.1) that after one
week there was still 85% activity measured in amount of peptides. The anomaly observed, for the
second day measurements, is because it was not observed the waiting time33 required for enzyme
activation before adding the protein.
Enzymes need a medium that allows them to have the three-dimensional configuration required to
establish an interaction with the substrate. This occurs in the presence of water; as the water
molecules interacts with the enzyme maintaining the tertiary structure The protein is breakdown in
peptides through the rupture of the peptide bond consuming water, which means that a small
amount of water should always be added to the solution. Preliminary cleaning tests and enzyme
activity tests showed that at least 20% v/v (water/IL) was needed. Such high amount can be
explained because the ILs selected are hydrophilic and can strip the enzymes of the water needed
for the reaction to occur and for the maintenance of the tertiary structure [20, 53].
A set of images was acquired for each sample area with all the surface analytical techniques34,
these studies gave us a surface characterization for each artistic technique and materials;
appendix IV show representative examples of all the samples, varnished and unvarnished.
31 Formulation kept in a refrigerated environment, at 4oC. 32 The toxicity in the imidazolium ionic liquids family is related to the ring in the structure and tends to increase with the increase in the alkyl chain length [17]. 33 After refrigeration it is recommended by the supplier to wait at room temperature at least 15min. 34 For comparisons purpose these images are presented together in appendix IV.

4. Results
21
The SM registers the surface close to the human eye perception, this is important especially for
documentation purposes of the surface before treatment. Both SM and OM make record of the
surface in terms of color (the perceived hue and tone). The OM goes further registering the general
appearance of the varnish layer, aspects such as, glossiness and transparency or smoothness;
also relative size and color of the pigment grains. Surface defects, such as gaps or fissures, can
become apparent at this scale. Some OM images were obtained with an ultraviolet (UV) light
source which added information when fluorescence occurred; showing the overall blue appearance
(OM-UV image, appendix IV) characteristic of the protein material of the varnish [55].
The set of images is completed with SEM and AFM scans for a micro and nano-scale. For AFM
also quantitative data was gathered, measurements of roughness and profiles can give information
on size and height of surface features.
If this was a situation where the samples were unknown, observation of a sample in cross-section
would be of major importance. Cross-section analysis gives us the structure of the surface and the
distribution of the materials used; it can also be used to perform spot tests. For the identification of
proteins the Sypro ® Ruby stain was applied, the result is orange hue fluorescence under green
emission (mean emission wavelength 610 nm)35 when proteins are present.
For specific color characterization the colorimetric values (CIE L*a*b*) were acquired in three spots
so to have statistical significance (appendix V).
The cleaning protocol was done for every formulation of enzyme, with both gel and IL solvent. To
ascertain the effectiveness of the treatment a second set of images with the mentioned techniques
was acquired, and also measurements of roughness with AFM.
AFM measurements after cleaning should be in the range of the average value for the
measurement done for unvarnished reference samples (appendix VI). These values could give
some indications on the cleaning effectiveness, much lower values them the ones for the reference
sample could refer to surfaces with varnish residues. And on the contrary, when values are much
higher than expected this could mean some deterioration of the surface.
MALDI analysis was done to the third cotton swab of the cleaning procedures (first damp swab),
following Kučková protocol [42]. MALDI is a very sensitive technique with great potential for
conservation science, since this requires capable techniques with unambiguous results [43].
Initially it was hoped that analysis with MALDI could give information on residues of the treatment,
but limitations verified to the selected protocol only allowed analysis to the third cotton swab; it
would have been needed a larger amount of samples, in order to have a statistical analysis of the
complete cleaning surface to a given protein and formulation. Nevertheless the results obtained are
encouraging for the use of this technique for the purpose of residues analysis. The analysis
performed allow to the separation of peptides attesting to the catalysis by the enzymes on the
sample varnishes.
35 Idem footnote 22.


23
5. Discussion
Khandekar [2] discusses some of the potential problems when using Enzyme+Gel mixtures36,
namely relating to the cleaning mechanism, the precise role of each component in the formulations;
the residue question, their long-tem effect on the surface and possible interaction with other
materials; the same reasoning can and should be applied to E+ILs formulations.
5.1. Enzyme activity
It has been reported that the enzymes remain stable and active in the ILs although the reason for
this stability is not fully understood, literary sources also report that the enzymes in IL follow the
same catalytic mechanism [20, 56-59], i e, the enzyme is active in the same places, the catalysis
follow the same cleavage process and the same resulting peptides. While no quantification was
done, the tests performed here with UV-Vis spectrometry and HPLC showed that the enzymes
were active in the formulations; also MALDI analysis, without further catalysis by trypsin37, showed
separation of peptides with the tested enzymes after hydrolysis of the varnish layers (see section
5.4).
UV-spectroscopy proved to be a good tool to verify the formulation activity38, in the sense that gives
immediate results and valid data for real time adjustments to the protocol. Although the absorptions
between different formulations cannot be compared, it was used to: select potentially compatible
ILs, measure the needed amount of water in the formulation and verify the enzyme activity. Some
limitations were found in the protocol for the acid enzyme E1 because of the strong alkalinity of the
substrate (casein in a NaOH solution), that could inactivate the enzyme.
Also when comparing protocols, adjustments were done for the ILs; it was noted the need of longer
times of centrifugation, this can be related to the ILs viscosity, but also some possible capability of
the ILs, by molecular interaction, to trap the proteins and peptides; was also verified by HPLC
analysis. Table 5.1 show that for the IL formulations 20% of protein was still present in solution
after 20 minutes the centrifugation39, while for the aqueous systems does not reach the 9% after
only 10 minutes centrifugation.
With similar protocol to UV/Vis spectroscopy, HPLC gave more information about the formulations.
There are some concerns when analyzing IL with HPLC; the IL is the first to be separated and the
most polar components would be masked by it, also there is a dragging effect for a short period of
time (figure 4.2). This can be compensated adjusting elution gradient sequence and time.
36 To have in consideration when studying new cleaning methods and/or formulations: what is being cleaned and the active components, the clearance process, residues (of the varnish and cleaning solution) associated problems of compatibility and long term effects; an adequate experimental methodology [2]. 37 MALDI analytical protocol includes enzymatic digestion of the samples with sequencing grade trypsin, but in this work measurements were done also simply dissolving the sample in water and direct MALDI analysis with DHB protocol for peptides [42]. 38 In reference to the potential action of the enzyme, this is the active component of the formulation. 39 Because the presence of protein material was still evident in the mixture after 10 minutes centrifugation cycle, a second cycle was done for the formulations with ILs.

5. Discussion
24
From figure 4.2 the resulting peptides are comparable, divided in three groups; it is possible to see
that for ILs there is a predominance of peptides for the pep1 group: i e, larger, less polar peptides
(the first group of peptides is not comparable to the aqueous formulations because it can be
affected by the dragging effect of the IL). This however, is not relevant for the cleaning process,
since successful removal is less dependent on the size of the peptides, as verified in the
preliminary tests.
Table 5.1 – HPLC analysis - Peptide and protein quantification for casein catalysis with enzyme E2: in Tris HCL 8.4pH
buffer; 8.4pH gel and ionic liquid IL1; E2+IL1 casein catalysis for 1, 2, 4 & 8 days old solution.
In accordance with most of the literature available, and in every referenced bibliography throughout
this text, the IL formulation enhances enzyme stability; here measured by shelf-life tests (table 5.1).
These gave optimistic results as a good enzyme activity (85%) was still observed even after a
week.
5.2. Other considerations on the new formulations
Some authors who addressed the use of enzymes [14, 15] suggest different formulations in
accordance with the practical needs, making mixtures with various components, most of the times
more than four elements (the enzyme, buffered solution, thickener, surfactant among others). But,
it can be difficult to predict the behavior of each component, unwanted interactions between them
and with the surface, and also the degradation process and the long-term interaction with the
surface.
With three-component formulations, as proposed here (enzyme + IL + water), it will be easier to
test the different interactions and this is an advantage of these new formulations.
Some information is already available on the subject. As described above, the water is needed for
the catalytic process as a reagent but at the same time as plasticizer helping the enzymes keep
their tertiary structure (functional structure) [56]. The enzyme activity is therefore dependent on
water availability at a minimum critical level [22]. Finding the appropriate level of water to be added
to the formulation is also an important step. The hydrophilic ILs will affect this level as they will strip
the enzyme of the needed water [60], which explains the high amount (20%) verified in this
situation for both [BMIM][BF4] and [EMIM][EtSO4]. It is possible to predict that less polar IL (for
Peak group PEP3 PEP2 PEP1 PROT1 Peptide Protein Time range [13.9-21.3] [21.3-22.8] [22.74-23.9] [23.9-29.4] Total Area % Total Area % Buffer+E2 2.27 x10⁷ 4,10 x10⁷ 6,87 x10⁶ 7,05 x10⁶ 93,21% 7,38%
Gel+E2 2,43 x10⁷ 3,94 x10⁷ 7,04 x10⁶ 8,23 x10⁷ 93,48% 8,62% IL1+E2 1st Day 4.09x10⁷ 1.22x10⁷ 2.25x10⁷ 1.64x10⁷ 100.00% 17.16%
IL1+E2 2nd Day 2.88x10⁷ 6.89x10⁶ 1.59x10⁷ 1.96x10⁷ 68.18% 20.54%
IL1+E2 4rd Day 3.24x10⁷ 9.06x10⁶ 1.61x10⁷ 1.08x10⁷ 76.04% 11.29%
IL1+E2 1 week 3.74x10⁷ 1.21x10⁷ 1.50x10⁷ 1.26x10⁷ 85.25% 13.18%
Reference IL1 + E2 9.74x10⁵ 1.09x10⁵ 1.90x10⁴ 3.21x10⁶ 1.46% 3.36%
Reference IL1 + Ca 9.51x10⁴ 2.05x10⁶ 1.75x10⁶ 9.54x10⁷ 5.15% 100.00%

5. Discussion
25
instance with longer alkyl chains) will be less likely to remove the available water for the enzymes,
and for the hydrophobic IL it can be expected a low minimum water needed, that authors predict
under 5% [48, 53, 60]. Noritomi [56] also points out that, with hydrophobic ILs, there can be the
advantage of a fine dispersion of the enzyme and water, affecting positively on the enzyme
availability in the formulation.
Nevertheless, the choice of experimenting with two hydrophilic ILs fell on the premise of choosing
between those available and because the tested hydrophobic ILs did not show the best results
(appendix III).
Going for a “green solvent” solution does not or should not depend only on the negligible vapor
pressure, it is important to verify what other characteristics can be environmental friendly. The re-
use of the ILs is one way to minimize its impact on the environment; in addition this helps to reduce
their potential cost. The recycling process of ILs was not considered in this work because of the
small amounts of IL used, but the referred bibliography [47, 56, 58] express optimistic remarks of
its possibilities. Products and enzymes can be recovered by processes of filtration or centrifugation;
and if the IL is hydrophobic, washing the IL with water can be a simple alternative.
Most if not all ILs in the imidazolium cation family show some level of toxicity [17-19], this however,
is not considered a disadvantage, on the contrary. Knowing that bio-contamination is one of the
factors that inhibit enzyme activity, the toxicity levels of these ILs will work in favor of prolonging the
formulation shelf-life40 by preventing bacterial growth.
The praised negligible vapor pressure poses however an important problem about the possible
residues on the surface after cleaning. The long-term effects that these residues might have on the
surface are an important issue that cannot be predicted with the limited time frame of this work;
nevertheless some consideration can be brought forward. As designer solvents the prevention
might be the key, choosing the cation-anion combinations that have expected non-reactive
degradation products [17, 49]. For example the [BF4]- residues will be affected by atmospheric
moisture, and possible degradation products can be the hydrofluoric acid with potentially
dangerous effects on the painted layers. As explained before however, in this work this anion was
chosen as it was important to have a well known compatible IL for enzyme testing. But possibly,
more suited ILs can be found on the non-halide ILs group. Other prevention measures may include
adjusting the cleaning protocol, using for example, only the minimum amount of formulation needed
for a given area, and optimizing the clearance steps.
The viscosity is another property that distinguishes the ILs from the traditional organic solvents.
Even though literature addresses concerns on this point, for surface cleaning this is an advantage;
ILs´ high viscosity can correspond to the gel function as solution thickener, this is important
because reduces penetration to other layers, limiting formulation action to the desired top layer. A
way to adjust viscosity in ILs is in the alkyl groups, a longer alkyl chains usually translates into
more viscous ILs [20, 48].
40 Shelf life is understood as the recommended time that products can be stored, during which its qualities remain acceptable for its use under the advised storage conditions.

5. Discussion
26
5.3. Surface monitoring protocol
For surface analysis each technique contributed with a set of important data (appendix IV), but is
the cross correlation of all data that completely characterizes the surface.
Due to the complexity of the painted structure there are multiple factors that influence the surface.
Each of the proteinaceous varnish has a very different behavior as film-forming material. Egg white
will form a dry film in short time that becomes insoluble with ageing, and it loses its flexibility; the
casein after drying becomes promptly hard and an insoluble material. For glues, the temperature at
the moment of application is determinant, as a higher temperature means a less viscous liquid and
results in a more homogeneous and flat surface. Therefore the results obtained should be
interpreted as features of the studied samples and not as general characteristics of the mentioned
paint materials.
5.3.1. Surfaces Characterization of the varnished
In a situation where the paint or polychrome composite structure is unknown the cross-section
observation gives important information, including the varnish layer properties. In the case of the
samples prepared here the structure and the materials are well known and this step was done for
reference purpose. Figures 5.1 and 5.2 show selected examples for two different artistic techniques
with two different varnishes and reference unvarnished samples, prepared in cross-section.
Figure 5.1 – Cross-section images of the sample GG-CA with OM at 100x with visible light and with UV light before and after staining with Sypro® Ruby. And reference unvarnished samples (ref.).
Figure 5.2 – Cross-section images of the sample OG-Ca with OM at 100x with visible light and with UV light before and after staining with Sypro® Ruby. And reference unvarnished samples (ref.).
The fluorescent staining tests with Sypro® Ruby make evident the presence of proteins with
orange color. It is possible to indentify and map the protein based varnish layer at the top of the
samples. As a comparison, the correspondent reference unvarnished samples show no
fluorescence at the top layers. Also, it is possible to conclude that the ground layer was prepared
with proteinaceous material because of the visible orange hue (the ground layer was prepared for
all samples with animal glue as binding agent.).

5. Discussion
27
Colorimetric values (CIE L*a*b*) obtained for each surface showed the alteration introduced by the
varnish to the perceived color [34], this is important for surface characterization because it gives a
quantitative color interpretation. Appendix V table1 shows the expected E variation (∆E) by
comparison of the average values of the varnished and unvarnished surfaces. Except for some of
the fish glue varnished samples, all of them have ∆E>1, this corresponds to an important change
introduced by the varnish that is visible to the human eye. One possible explanation is that these
samples have a thinner varnish layer.
Each cleaning treatment introduces a big change to the surface so it is normal that the
measurements reveal considerable high ∆E values. Appendix V table 2 presents the collected date
for all samples end the calculated ∆E. One could reason that the ∆E if it is near to the reference
values (table1) that would mean a good cleaning, going over or under this value would mean
respectively surface deterioration or presence of residues. However these can be misleading,
because of the unknown number of factors that influence the colorimetric values. For the present
work this tool is only important for surface characterization and does not give relevant information
about the treatment. Regarding the color: the pigments present in the model samples (Sinopia and
Yellow Ochre) have a similar chemical composition and apart the difference in color (one is red,
another one is yellow) they did not display other relevant
differences.
Observations with SM, aside from making the record of the
surface, were important for treatment monitoring. Due to its
portability it is possible when in doubt, or for sensitive areas, to
perform the cleaning protocol under SM observation.
The images obtained by means of the OM gave qualitative
information about the surface (perceived texture, color,
glossiness) and some aspects of the state of conservation such
as the presence of gaps or fissures. Figure 5.3 shows a sample with egg white varnish, it is easily
identified a pattern of craquelure 41 on the varnish layer. It is also visible that the cracks do not
prolong to the inferior layers. It is possible to conclude that they are not the result of ageing of the
sample but, formed with little time after varnish application. The alteration that the varnish
introduces to the surface is visible in figure 5.4 of oil painting samples on wood at 100x
magnification, when comparing figure 5.4a and 5.4b: a) shows a surface without varnish, and b)
shows casein varnish, the colors are stronger and brighter; and it is perceived a general glow over
the surface.
41 Craquelure on a painting is the network, or pattern, of cracks developed across the surface.
Figure 5.3 - 100x OM image of the sample EG-S-EW with visible light,
showing craquelure pattern.

5. Discussion
28
Figure 5.4 - 100x OM images with visible light, the effect of varnish: a) OG-S, unvarnished surface; b) OG-S-
Ca, sample with casein varnish.
Observation under fluorescent light (UV) was used to study the auto-fluorescence of proteins
varnishes present on each area, this occurs mainly due to the presence of the aromatic amino
acids, such as: tryptophan and tyrosine, which results in a blue fluorescence Figure 5.5. Also, the
binding medium (protein or oil, Figure 5.5b and 5.5c) displays a stronger or lighter blue-green
fluorescence according to its chemical nature, deterioration, ageing and added pigments [55, 61].
Hence, unvarnished tempera painting should present a blue fluorescence as it is similar in nature
to the varnishes used. The fluorescence observed in the unvarnished oil painting is associated to
the autoxidation process and consequent presence of unsaturated acids. Although these were not
aged samples, they were stored in the dark and this might explain the premature fluorescence of
the oil [62]. The gilded surface is not fluorescent so there is a visible difference between varnished
and unvarnished surfaces Figure 5.5d and 5.5e.
Figure 5.5 - 100x OM UV fluorescence images of the different materials used in the samples: a) EG-YO-EW
Egg white varnish over a egg tempera paint sample; b) EG-YO unvarnished egg tempera paint sample; c) OG-YO unvarnished oil paint sample; d) GG-CA animal glue varnish over a gilded surface;
e) GG unvarnished gilded sample.
The pigments used due to their nature can have a small contribution in diminishing the oil
fluorescence [61, 62], but the fluorescence pattern is not diagnostic of the material; i e, is not
possible to identify which pigment or protein is present from the observed fluorescence. In a
general situation the fluorescence microscopy is a good tool to analyze and identify what is to be
removed, setting the first assessment needed when choosing a cleaning method [2].

5. Discussion
29
Figure 5.6 - 2D and 3D rendering of the AFM image set of height/topography, amplitude and phase (a) Unvarnished reference sample of tempera painting; (b) Unvarnished reference sample of oil painting.
AFM gives the nano-scale evaluation of the surface; at this scale a new level of features comes
into evidence. To achieve nano scale details of the material in order to qualitative indentify the
material and to map the topographical features of the surface, phase, amplitude and height
scanning were correlated. The amplitude registers the tip alteration and in a false way replicates
the surface features, where light parts are relates to movement of the tip up and what seems like
shadows is when the tip adjusts down. The phase image relates with interactions to the surface
material.
For example, the observation of the surface with AFM reveals the mapping of the binding material
and pigment. For the tempera sample (figure 5.6a) a number of spots are visible in high contrast
(black/white high phase and low phase compare to 90 deg.), this suggests the presence of different
materials at the surface, and possible relates to surfacing of pigment grains that are uncovered by
binding media. For the oil sample (figure 5.6b), however, the material seems more homogeneous
because the phase image follows a similar pattern of the amplitude image; pigment grains appear
more undifferentiated and overall the surface seems smoother.
Indeed the oil painting has a higher proportion of binding medium (oil) and pigment grains stays
more embedded in the paint.
Figure 5.7 - 3D and 2D AFM height images, surface features measured on the obtained section and: a)
tempera painting without varnish, pigment grain size measurements of. b) tempera painting e with egg white varnish, measurement of the height of the varnish layer in a gap area.

5. Discussion
30
2D profiles can be then extrapolated using software tools. This information in a real sample is
important when characterizing the surface of the sample, studying date or the provenance of the
material, if natural or artificial. For example, in figure 5.7a, pigment grains identified as individual
spherical features can be measured, the small uniform round grains suggests an artificially or
industrialized prepared pigment. In gap areas it was possible to measure the height of the thinner
layers (figure 5.7b) and observe features of other paint layers.
Appendix VI shows roughness measurements (R) done for each sample surface and standard
reference samples.
Appendix IV, figures 1-4, show the most representative images of the four varnishes studied here
on different surfaces, analyzed by SM, OM, AFM and for the sample prepared on canvas also
some SEM images. Interesting features observed at nano-scale can be related to macro-and
micro-scale properties and artistic technique. For example: glair (egg white varnish) samples show
a wrinkle pattern (figure 1, appendix IV), comparable to what is observed at macro scale for
varnishes applied in layers, when the top layer is applied over another that is not completely dried.
The samples with animal glue are the ones with less homogeneous surface (figure3, appendix IV)
and this can be related with the temperature at which the glue was applied. As it cools down, the
glue ceases to melt and when applied is not a completely fluid mixture resulting in a non uniform
surface. The casein is not soluble in water, for preparing the varnish it has to be mixed in an
aqueous solution with sodium hydroxide (NaOH), and heated for long time; in the lower right side of
the figure IV.4 (appendix IV) what is observed is probably one grain of casein that was not
completely dissolved.
The comparison of the varnished areas average values with the reference unvarnished samples
allows to interpret the alteration introduced by the varnish layer on the surface (appendix IV, figures
5-7). For example, all the surfaces, except the gilded ones, show lower roughness values after
varnishing. This can be easily related with the change in the optical properties, as the varnish
smoothed the surface, changing the refractive index and increasing specular reflection.
The gilded surfaces are the exception, and this is related with the purpose of the varnish. The
animal glue is applied for lowering the glossiness, and this can be corroborated with the AFM
measurements, showing in turn an increase of the surface roughness (appendix VI).
SEM gave similar information of the surface as the AFM; images show an apparent three-
dimensional view of the surface, and surface features can be measured for length and area.
However, is limited for the measuring of height, which is only possible with AFM profiles.
Nevertheless this technique was chosen because it is already a common tool in conservation
science, so there would be comparable data for AFM interpretation; and in some situations can be
helpful for elemental mapping analysis.
SEM images are acquired in vacuum and can be hard to collect if the samples are non conductive.
Charges effects on the surface will not allow a proper focusing impairing the quality of the pictures.
A strategy around it is to coat the samples with some gold or carbon. This means contaminating

5. Discussion
31
the sample. Furthermore, coating the sample would have most likely picture the coated surface
instead of the original one. The wood samples were prepared with not aged common wood, which
is more reactive to differences in air humidity. Left in an uncontrolled room environment, the paint
and varnish layers when drying became less adhered to the support, because they do not follow
the movements of wood. For these reasons, the samples prepared for casein and animal glue
varnishes (on wood support) could not be analyzed by SEM. Indeed, when the wood gilded
samples were introduced in the vacuum chamber, the gold started to foil out.
5.3.2. Cleaning effectiveness assessment
Cleaning effectiveness assessment means comparing the before treatment with the after treatment
data and also with data obtained for reference unvarnished samples.
During surface characterization, every technique show important data that can be read separately
(for some examples see appendix IV figures 8-14). However, cleaning effectiveness assessment is
only possible when cross-correlating all of the mentioned surface characterization analytical
techniques.
The interpretation of data for the successful cleaning is simple and immediate: images after
treatment should be similar to the sample prior varnishing or reference unvarnished samples.
Figure 5.8 2D and 3D rendering of the AFM image set of topography, amplitude and phase (a) Tempera
painting sample after cleaning; (b) Unvarnished reference sample of tempera painting.
Figure 5.8 shows a tempera painting sample after treatment with [EMIM][EtSO4] and the alkaline
enzyme (E2) for the removal of egg white (EW) varnish. In this case the three AFM images helped
to establish that this as a successful cleaning as the surface features repeat themselves and are
similar to the unvarnished reference sample (figure 5.8b).
Figure 5.9 shows the surface of a gilded sample before and after treatment for the removal of
animal glue coating. The OM image obtained under UV light source show total loss in fluorescence
after treatment, ascertaining the absence of proteinaceous material (figure 5.9b), as the gold leaf
has no fluorescence under UV light. Therefore it can be assessed that the cleaning treatment was
effective, For the figure 5.9b, however, the topographic image obtained with AFM shows surface
degradation and the presence of grooves; suggesting the effect of scratching left by the cotton
swabs, maybe because of excessive pressure when cleaning.

5. Discussion
32
Figure 5.9 - 3D rendering of the AFM topographic image and OM with visible light and UV light, images set of
animal glue coating from a gilded surface sample (a) Before cleaning (b) After cleaning with E3+Gel.
In restoration treatments some amount of residues is acceptable in conservation [1], a way to
evaluate cleaning effectiveness is also to identify the presence of varnish residues after treatment.
For the assessment of varnish residues after cleaning the next two examples (figure 5.10 and 5.11)
show two different situations: a) OM, SEM and AFM all revealed the presence of varnish residue
and b) the residue is only registered by the AFM
Figure 5.10 – EG-S-CP; images set after removal of isinglass varnish of a egg tempera painting sample with IL1+E1: OM images with visible light and UV light 100x; SEM at 1000x and 3000x and 2D and 3D rendering
of the AFM images, , and.
Figure 5.10 shows a sample cleaned with the alkaline enzyme with IL [BMIM][BF4] (E2+IL1) for the
removal of isinglass varnish of a tempera painting surface. The image obtained with the OM, under
UV made possible to registered protein residue as it gives a different fluorescence pattern on the
surface. The difference in fluorescence although not enough to positively identify the material
present, allows identification of the indicated areas as varnish residue, and therefore, this suggests
an incomplete cleaning; in this case the conservator could choose to repeat the treatment. In the
AFM phase image (figure 5.10b), a different interaction of the tip with the surface is observed
resulting in areas with higher contrast. The white areas are similar in texture to the surrounding
material, implying a change in the nature of the material. This reinforces the conclusion retrieved
for the OM. Thus, it can be strongly concluded that the surface is not homogeneous and most likely
composed by two different materials.
The same was not observed on the correspondent image of another sample with isinglass varnish
on oil paint surface (figure 5.11); but, at a nano-scale with AFM both samples registered residues in
this sample the residue is visible as a flat plate between crests.

5. Discussion
33
The residue areas can be measured by the AFM using software tools and extrapolated to a larger
scale; this gives answers on how much of the varnish is still on the surface after the treatment. This
is useful information for the art restorator.
Figure 5.11 – OG-S-CP sample: OM images with visible light and UV light after removal with IL1+E1, and 3D
rendering of the AFM image and, after removal of isinglass varnish.
Although enough statistical information was gathered for quantification of the amount of residue
present on the surface, this is not addressed here due to space limitations. But it is important to
leave this note to refer this yet another potential use for AFM.
Figure 5.12 – EG-S-EW. Tempera painting sample after removal of egg white varnish with cleaning
formulation: IL1+E1 (a) Elemental mapping with SEM/EDX, (b) 2D and 3D rendering of the AFM image set on the same area.
Another important aspect in evaluating the cleaning effectiveness is the ionic liquid residue. A small
set of the tempera painting samples cleaned with [BMIM][BF4] shows polyhedric crystals on the
surface, visualized with both SEM and AFM methods (figure 5.12). These structures were not
found before cleaning in any of the studied samples; therefore their presence is the result of the
cleaning treatment. All the materials used on the samples are organic therefore, mainly composed
by C chains.

5. Discussion
34
The Energy-dispersive X-ray spectroscopy (EDX) is not able to differentiate between materials,
since it only detects atoms and not molecules; and as to be used at low intensities, because the
samples are not coated. But, the Fluorine of the [BMIM] [BF4] can be easily mapped using the
EDX. Figure 5.10a shows the elemental mapping of Fluorine on the surface as green spots,
identifying the observed crystal as being in fact IL crystals. Because this
only happened in a set of 4 samples, all done at the same time, and
because this was not observed on other samples where the same IL
was used, it is concluded that this was a flaw in the cleaning protocol.
The images obtained for each microscopic technique for the perceived
cleanness, the presence of residue, and possible damage of the
surface; allows a global evaluation of the cleaning effectiveness for each
tested area.
For the purpose of assessing the cleaning effectiveness with the two
enzyme formulations, it became evident the advantage of using the AFM
comparison with OM or SEM, and the examples above mentioned
demonstrate the complementary information that can be obtained using
cross-correlation multi level investigation from micro to nano-scale.
Some of the samples showed some level of deterioration of the paint
layer after cleaning; it was concluded that this was not caused by the cleaning agent, the enzymes,
as they are highly selective to the varnish material. The cotton swabs (figure 5.13) show that the
deterioration occurred with the clearance process and most probably because they are un-aged
samples; the surfaces still maintains some solubility to water (used for the 3rd cotton swab) used for
the removal of the gel, varnish and protein residues. This problem can be overcome by adjusting
the cleaning protocol, changing either the materials used for the clearance phase or in the
application procedures.
Figure 5.14 – AFM images for topography, amplitude and phase of a reference tempera painting surface with
fish glue varnish sample cleaned with IL2 [EMIM][EtSO4].
The global evaluation of the cleaning tests showed that all enzymes formulations presented a
potentially42 good removal capability, although enzyme activity favored the formulations with IL1
42 Here is not taken in to account the wear of the treatment observed in some samples mostly caused, as explained by the mechanical action and clearance steps.
Figure 5.13 – Cotton swab collection after cleaning of
two samples.

5. Discussion
35
([BMIM][BF2]). The justifications could be on some cleaning capability of the IL2 ([EMIM][EtSO4])
itself as observed in the AFM (Figure 5.14; also appendix IV figure15).
For the E3 the surface analytical techniques showed that albeit less enzyme activity was
measured, the samples showed an overall good removal of the varnish with less deterioration of
the surface, this can be observed also in the roughness measurements (appendix VI).
5.4. Peptide analysis - MALDI-TOF-MS
Analysis of the cotton swabs after cleaning could show if the enzymes were in fact, active in the
different formulations during the cleaning process, due to sensitivity limitations this could not be
performed by HPLC technique. The technique selected was MALDI-TOF-MS.
Figure 5.15 – MALDI-TOF-MS analysis of the material retrieved from the cotton swabs used on samples of egg white varnish on oil painting (OG-EW) samples, with E1 formulations (3A-Gel, 40A-IL1 and 51A-IL2).
The indication of peptides size and amino acid sequence are obtained after enzyme hydrolysis43,
this is dependent upon the specific hydrolytic process of each enzyme. Even though the limited
time of action (except for casein samples, where the formulation was left on the surface for
approximately 30minutes), there were some promising results, as there was peak separation in the
samples measured, with no further catalysis by trypsin44; this proves that in fact, the catalysis of the
proteinaceous varnishes occurred. Each peak corresponds to a peptide and time of separation
relates to mass, smaller peptides would be the first in the obtained spectra.
Comparison of mass spectra of samples A3, A40 and A51 (figure 5.15) shows that a greater
number of peptides was removed in sample A3. Using the databases, it was confirmed that pepsin
was most successful in cleaving the egg white varnish in samples A3.
Figure 5.16 shows the comparison of mass spectra between the three enzymes in gel formulations.
43 Protein and peptide identification is done by peptide analysis after catalysis with trypsin in comparison with known databases. 44 Idem, footnote 37.

5. Discussion
36
A greater number of peptides was obtained in the sample A4 containing the material retrieved from
the cotton swabs after cleaning with E1+Gel formulation (90 peptides). The second most
successful enzyme was E2 (40 peptides) and the last was e3 (30 peptides).
The whole proteins from egg white were removed and confirmed using trypsin digestion and
comparison with a database containing tryptic peptides of reference materials. In the samples A3
and A4, 25 peptides were found originating from the whole proteins.
Figure 5.16 – MALDI-TOF-MS analysis of the material retrieved from the cotton swabs used on samples of egg white varnish on oil painting (OG-EW) samples, with Gel formulations (4A-E1, 17A-E2 and 28A-E3).
When peak separation is observed this proves effectiveness of the formulations, i.e., that enzyme
catalysis occurred with the tested formulations on the varnished surfaces. The short period of
contact of the formulation with the varnished surface explains the presence of bigger
peptide/proteins (figure 5.17a). There is no complete cleavage of the protein, as there is still
considerable number of peaks in the high molecular weight interval. These were most likely
removed mechanically, and not in solution with the cleaning formulation.
Figure 5.17 – MALDI-TOF MS analysis of material retrieved from the cotton swabs used: a) fish glue varnish
sample cleaned with E1+IL2 formulation. Peptide analysis up to 3500 N/z and large peptides/proteins analysis with more than 4000 m/z b) [40], b) Animal glue varnish sample, after treatment with just IL2; measurements
done with standard trypsin cleavage.
a b

5. Discussion
37
MALDI analysis of the cotton swabs with IL2 did not show relevant peak separation but, there was
removal of the varnish layer. Figure 5.17b confirms the indication by the AFM (example on figure
5.11), that the ionic liquids have some cleaning capability; and was able to remove the varnish
without the need of enzyme cleavage.
Some samples did not show peptide separation; this could be due to a limitation of the protocol
since only the third cotton swab (of the cleaning protocol sequence) was analyzed.


39
6. Conclusion
Whenever a novel and alternative solvent is introduced in a cleaning formulation, it is important to
evaluate its major advantages and drawbacks compared to other media. For IL the same concerns
apply: efficiency, safety, handling, interaction with other layers and presence of residues, among
others. Due to limitations of time and the introductory nature of this work some of them were only
addressed theoretically.
The main purposes of the work were to show that the chosen enzymes were active with new
formulations made of enzymes and ionic liquids, and that the protein layer could be successfully
removed in a cleaning protocol with these formulations; the results obtained from testing the
solutions show a promising starting point in these aspects. UV-Vis, HPLC and MALDI showed that
the catalysis occurs in the selected IL and with comparable results to the gel, reference
formulations.
The enzyme combination with IL1 was overall more successful, and even though there is some
reservation to the use of this IL, namely due to possible long term degradation problems, it is a
promising start and could be considered as reference for future studies.
The multiscale monitoring protocol of painted/gilded surface was effective for their characterization
and assessment of cleaning effectiveness including the residue analysis.
An important advantage of the analytical techniques used resides in the real time monitoring of the
cleaning process: comparative study of unvarnished and varnished surfaces allowed to prove their
usefulness in the assessment of the removal effectiveness; and this can further help to adjust the
cleaning protocol.
Going to a nano-scale with the use of AFM proved to be of major importance to achieve a further
level of information on the studied surfaces; at the same time the conclusions were easily
extrapolated to a larger scale. Not only AFM qualitative information was obtained but also
quantitative, when measuring surface roughness and sections profiles, before and after the
treatment on the same area, enabling the assessment of cleaning effectiveness and deterioration
at nano-scale.
Residues could be evaluated in a qualitative approach with OM, SEM and also quantitatively using
AFM.
Although further research is needed to confirm these experimental findings, these preliminary
results are promising; this work gave thus an important contribution to the study of surface cleaning
treatments using new formulations based on enzymes and ionic liquids; and surface analysis.


41
7. Future trends
This is an unstudied area and this proposal is just an introduction to the subject but it hopefully
shows that entails great potential on the research of alternative cleaning formulations.
The formulation can be improved by exploring other ILs families changing anion-cation
combinations. Adjustments can be done to the cleaning protocol for better answering to specific
situations dependent on the surface materials and their state of conservation.
Further studies should be done for comparison between fresh materials and aged ones, and also
for improving the residue analysis: the ILs degradation process, interaction with other materials
present in the system and long term effects should be also studied.
The analytical multiscale protocol for surface cleaning assessment proved to be a useful tool for
this type of treatment but it could also be considered for monitoring other surface treatments or
used as a tool to gather better and more comprehensive knowledge about the materials present in
the surface layers of cultural artifacts


43
8. Bibliography
1. Calvo, A. Conservación y restauración de pintura sobre lienzo, Ediciones del Serbal, Barcelona
(2002).
2. Khandekar, N. ‘A survey on the conservation literature relating to the development of acqueous
gel cleaning on painted and varnished surfaces’ Reviews in Conservation 1 (2000) 10-20.
3. Cennini, C. Il libro dell’arte o trattato della pittura/di Cennino Cennini; a cura di Fernando
Tempesti Biblioteca Longanes, Milano (1984).
4. Palomino, A. El Museu Pictórico Y Escala Óptica. Tomo Segundo, Aguilar Madrid (1947).
5. Mills, J. S. and White, R. The organic chemistry of museum objects, Butterworth-Heinemann,
London (1994).
6. Halpern, Manuel Júdice. Bioquímica. Porto : Lidel, (1997).
7. Karpowicz, A. ‘Ageing and deterioration of proteinaceous media’ Studies in Conservation. 26
(1981) 153-160.
8. Woudhuysen-Keller, R. and Woudhuysen, P. ‘The history of egg-white varnishes’ in. Hamilton
Kerr Institute Bulletin 2 ed. A. Massing, Whittlesford, Cambridge, Hamilton Kerr Institute, University
of Cambridge (1994) 90-141.
9. Masschelein-Kleiner, L.. Ancient binding media, varnishes and adhesives, ICCROM, Roma
(1995).
10. Plenderleith, H. J. The conservation of antiquities and works of art, Oxford University Press,
London (1956).
11. Banks, P. N. ‘Paper Cleaning’ Restaurator. 1 (1969) 52-66.
12. Cabral, J.M.S., Aires-Barros e M., M. R. Gama. Engenharia enzimatica, Lidel, Porto (2003).
13. Hatton, M. ‘Enzymes in a viscous medium’ The Paper Conservator 2:1 (1977) 9.
14. Wolbers, R. Cleaning painted surfaces, Aqueous methods, Archetype Publications, London
(2003).
15. Cremonesi, P. L’uso degli enzimi nella pulitura di opera policrome. Il Prato Editore, Padova
(2001).
16. Branco, L.C., Carrera, G.V.S.M. and Aires-de-Sousa, J. ‘Physico-chemical properties of task-
specific ionic liquids’. In Ionic liquids: theory, properties, new approaches ed. A. Kokorin, InTech,
(2011) 61-94.

8. Bibliography
44
17. Ventura, S. P.M., Marques, C. S., Rosatella, A. A., Afonso, C. A. M., Gonçalves, F. and
Coutinho, J. A.P. ‘Toxicity assessment of various ionic liquid families towards Vibrio fischeri marine
bacteria’ Ecotoxicology and Environmental Safety 76 (2012) 162-168.
18. Docherty, K.M., Dixon, J. K. and Kulpa Jr, C.F. ‘Biodegradability of imidazolium and pyridinium
ionic liquids by an activated sludge microbial community’ Biodegradation 18 (2007) 481-493.
19. Romero, A., Santos, A., Tojo, J. and Rodríguez, A. ‘Toxicity and biodegradability of imidazolium
ionic liquids’. Journal of Hazardous Materials 151 (2008) 268-273.
20. Park, S. and Kazlauskas, R. ‘Biocatalysis in ionic liquids - Advantages beyond green
technology’ Current Opinion in Biotechnology, Elsevier 14 (2003) 432-437.
21. Pacheco, M. F. Remoção de vernizes de pinturas utilizando líquidos iónicos. Faculdade de
Ciências e Tecnologia, Universidade Nova de Lisboa, Dissertação apresentada para obtenção do
grau de Mestre em Conservação e Restauro. Lisboa (2010).
22. Erbeldinger, M., Mesiano, A. and e Russel, A. ‘Enzymatic catalysis of formation of Z-aspartame
in ionic liquid - An alternative to enzymatic catalysis in organic solvents’ Biotechnol. Prog. American
Chemical Society and American Institute of Chemical Engineers, 16 (2000) 1129-1131.
23. Kragl, U., Eckstein, M. and Kaftzik, N. ‘Enzyme catalysis in ionic liquids’ Chemical
biotechnology. Elsevier Science, 13 (2002) 565-571.
24. Roosen, C., Müller, P. and Greiner, L. ‘Ionic liquids in biotechnology: applications and
perspectives for biotransformations’ Appllied Microbiol Biotechnollogy. 81 (2008) 607-614.
25. van Rantwijk, F., Lau, R. M. and Sheldon, R. A. ‘Biocatalytic transformations in ionic liquids’
TRENDS In Biotechnology. 21: 3 (2003) 131-138.
26. Moniruzzaman, M., Nakashima, K., Kamiya, N. and Goto, M. ‘Recent advances of enzymatic
reactions in ionic liquids’ Biochemical Engineering Journal. Elsevier 48 (2010) 295-314.
27. May, E. e Jones, M. (ed.). Conservation science. Heritage materials. Cambridge : RSC
Publishing, (2006).
28. Pinna, D., Galeotti, M. and Mazzeo, Rocco (eds.). Scientific examination for the investigation of
Paintings. A Handbook for Conservator-restorers Centro Di, Firenze (2009) 224.
29. Aucouturier, M. e Darque-Ceretti, E. ‘The surface of cultural heritage artefacts: physico-
chemical investigations for their knowledge and their conservation’ Chem. Soc. Rev. 36 (2007)
1605-1621.
30. Vickerman, J.C e Gilmore, I.S.(eds.). Surface Analysis. The Principal Techniques 2nd ed Wiley
Publications (2009).

8. Bibliography
45
31. Sandu, I.C.A., Bracci, S., Lobefaro, M. and Sandu, I. ‘Integrated methodology for the evaluation
of cleaning effectiveness in two Russian icons (16th-17th centuries)’ Microscopy Research and
Technique (2010).
32. Fuster-López, L. A., Charola, E., Mecklenburg, M. F. and Domenéch-Carbo, M. T. (ed.) ‘New
insights into the Cleaning of Paintings. Cleaning’ Preprints of the International Conference
Universidad Politecnica de Valencia, Instituto de Resta (2010).
33. Sandu, I.C.A., de Sa, M.H e Pereira, M. C. ‘Ancient “gilded” art-objects from the European
cultural heritage: a review on different scales of characterization’ Surface and Interface Analysis in
Cultural Heritage. Special Issue 43, 8 (2011) 1134-1151.
34. Lorusso, S., Natali, A. e Matteucci, C. ‘Colorimetry applied to the field of cultural heritage:
examples of study cases’ Conservation Science in Cultural Heritage. 7 (2007) 187-220.
35. Van den Berg, K.J., Daudin, M., Joosten, I., Wei, W., Morrison, R. and Burnstock, A. ‘A
comparison of light microscopy techniques with scanning electron microscopy for imaging the
surface cleaning of paintings’ 25-30 May Proceedings of Art2008 - 9th International Conference on
NDT of Art. Jerusalem, Israel (2008).
36. Schreiner, M., Melcher, M. and Uhlir, K. ‘Scanning electron microscopy and energy dispersive
analysis: applications in the field of cultural heritage’ Anal Bioanal Chem. 387 (2007) 737-747.
37. Ormsby, B., Learner, T., Foster, G., Druzik, J. and Schilling, M. ‘Wet-cleaning Acrylic Emulsion
Paint Films: An evaluation of Physical, Chemical and Optical Changes’ Modern Paints uncovered:
proceedings from the Modern Paints Uncovered Symposium, May 16-19 Getty Conservation
Institute, 2006, Los Angeles (2008). 187-198.
38. Baglioni, M., Rengstl, D., Bonini, M., Giorgi, R. and Baglioni, P. ‘Removal of acrylic coatings
from works of art by means of nanofluids: understanding the mechanism at the nanoscale’.
Nanoscale. 2 (2010) 173-1732.
39. de Sá, M. H., Ferreira, J. L., Melo, M. J. and Ramos, A. M. ‘An AFM contribution to the
understanding of surface effects caused by ageing and cleaning on acrylic glass. The Shadows by
Lourdes Castro, a case study’ Surface and Interface Analysis (2010).
40. Teixeira, S. J. V. ‘Hidrólise Enzimática das Proteínas da Dreche’, Faculdade de Farmácia da
Universidade do Porto, Dissertação do 2ºCiclo de Estudos Conducente ao Grau de Mestre em
Controlo de Qualidade na Especialidade de Água e Alimentos, Porto (2011).
41. Mota, M. V. T., Ferreira, I. M. P. L. V. O., Oliveira, M. B. P. Rocha, I. C. and Teixeira, J. A.
‘Enzymatic Hydrolysis of Whey Protein Concentrates: Peptide HPLC Profiles’ Journal of liquid
chromatography & related technologies 27 (2004) 2625-2639.

8. Bibliography
46
42. Kuckova, S., Hynek, R. and Kodicek, M. ‘Identification of proteinaceous binders used in
artworks by MALDI-TOF mass spectrometry’ Anal Bioanal Chem. 388 (2007) 201-206.
43. Leo, G, Cartechini, L., Pucci, P., Sgamellotti, A., Marino, G. and Birolo, L. ‘Proteomic strategies
for the identification of proteinaceous binders in paintings’ Anal Bioanal Chem 395 (2009) 2269-
2280.
44. Carlyle, L. ‘The Artist’s Assistant. Oil painting Instruction Manuals and Handbooks in Britain
1800-1900 with reference to selected eighteenth-century sources’ Archetype Publications, London
(2001).
45. Alonso, E. G. M. ‘Tratado del dorado, plateado y su policromía: Tecnología, conservación y
restauración’: Servicio de Publicaciones, Universidad Politécnica de Valencia, Valencia (1997).
46. Pheonix, A. and Sutherland, K. ‘The cleaning of paintings: effects of organic solvents on oil
paint films’. Reviews in Conservation. 2 (2001) 47-60.
47. Gorke, J., Srienc, Fr. And Kazlauskas, R. ‘Toward advanced ionic liquids - Polar enzyme-
friendly solvents for biocatalysis’ Biotechnology and Bioprocess Engineering, Spinger 15 (2010) 40-
53.
48. Moon, Y. H., Lee, S. M., Ha, S.H. and Koo, Y. ‘Enzyme-catalyzed reactions in ionic liquids’
Korean J. Chem. Eng. 23 2 (2006) 247-263.
49. Zhao, H. ‘Effects of ions and other compatible solutes on enzyme activity, and its implications
for biocatalysis using ionic liquids’ Journal of Mulecular Catalysis B. Elsevier, 37 (2005) 16-25.
50. Tietze, A. A., Heimer, P., Stark, A. and Imhof, D. ‘Ionic Liquid Applications in Peptide
Chemistry: Synthesis, Purification and Analytical Characterization Processes’ Molecules 17 (2012)
4158-4185.
51. Whitaker, J.R. ‘Proteolytic Enzymes’ J.R. Whitaker, A.G.J. Voragen e D.W.S. Wong. Handbook
of food enzymology. Marcel Dekker, NY (2003).
52. Gomori, G. ‘Preparation of Buffers for Use in Enzyme Studies’ in Methods in Enzymology. 1
(1955) 138-146.
53. Tran, C. D., Lacerda, S. H., De Paoli and OLIVEIRA, D. ‘Absorption of Water by Room-
Temperature Ionic Liquids: Effect of Anions on Concentration and State of Water Applied
Spectroscopy. 57 2 (2003) 152-157.
54. Johnson, K.E. ‘What’s an Ionic Liquid?’ The Electrochemical Society Interface (2007) 38-41.
55. de la Rie, E. R. ‘Fluorescence of paint and varnish layers (Part III)’. Studies in Conservation. 27
(1982) 102-108.

8. Bibliography
47
56. Noritomi, H. ‘Protease-Catalyzed Synthetic Reactions in Ionic Liquids’. In Ionic Liquids:
Applications and Perspectives ed. A. Kokorin, InTech (2011) 517-528.
57. Hernandez-Fernandez, F., de los Ríos, A. P., Lozano-Blanco, L. J. and Godínez, C.
‘Biocatalytic ester synthesis in ionic liquid media’ J Chem Technol Biotechnol. 85 (2010). 1423–
1435.
58. Okrasa, K., Guibé-Jampel, E. and Therisod, M. ‘Ionic liquids as a new reaction medium for
oxidase–peroxidase-catalyzed sulfoxidation’ Tetrahedron: Asymmetry. Elsevier - Science Direct, 14
(2003) 2487-2490.
59. Zhao, H. ‘Methods for stabilizing and activating enzymes in ionic liquids - a review’ J. Chem.
Technol. Biotechnol. Society of Chemical Industry 85 (2010) 891-907.
60. Yang, Z., Yue, Y. and Xing, M. ‘Tyrosinase activity in ionic liquids’ Biotechnol Lett. 30 (2008)
153–158.
61. Pelagotti, A., Pezzati, L., Bevilacqua, N., Vascotto, V., Reillon, V. and Daffara, C. ‘A study of
UV fluorescence emission of painting materials’. Proc. of Art'05, 8th Int. Conf. on Non-Destructive
Testing and Microanalysis for the Diagnostics and Conservation of the Cultural and Environmental
Heritage (2005).
62. de la Rie, E. R. ‘Fluorescence of paint and varnish layers (Part II)’. Studies in Conservation. 27 (1982) 65-69.


49
Appendix
Appendix I - Material Data Sheet: Acid enzyme - Pepsin
Appendix II - Material Data Sheet: Alkaline enzyme – Aspergillus sojae
Appendix III - Tested ionic liquids, and main characteristics
Appendix IV - Surface characterization by Stereomicroscopy (SM), Optical Microscopy (OM), Scanning Electron Microscopy (SEM) and Atomic Force Microscopy (AFM)
Appendix V - Colorimetry analysis
Appendix VI - AFM analysis


51
Appendix I Material Data Sheet: Acid enzyme - Pepsin


53
Appendix II Material Data Sheet: Alkaline enzyme – Aspergillus sojae


55
Appendix III Tested ionic liquids, and main characteristics
Table 1 – List of the ionic liquids tested, some of its characteristics and result of the preliminary cleaning tests.


57
Appendix IV Surface characterization by Stereomicroscopy (SM), Optical Microscopy (OM), Scanning Electron Microscopy (SEM) and Atomic Force Microscopy (AFM)
Sample surface analysis before treatment with stereomicroscope (SM) 10x, 32x and 90x, optical
microscope (OM) Vis. 100x, 200x and UV 200x, scanning electron microscope (SEM) 200x, 1000x
and 3000x and atomic force microscopy (AFM) 5µm x 5µm for varnished samples of egg white
(EW), Isinglass (fish glue, CP), animal glue (CA) and casein (Ca); and unvirnished samples of
tempera (EG) and oil (OG) painting grounds and gilding grounds (GG).
Figure 1 – Surface analysis set for sample OG-EW, oil painting with egg white varnish.
Figure 2 – Surface analysis set for sample EG-CP, egg tempera painting with isinglass varnish.
SM 10x SM 32x SM 90x
OM 100x OM 200x OM 200x UV
AFMAmplitude PhaseSEM 200x SEM 1000x SEM 3000x UV
SM 10x SM 32x SM 90x
OM 100x OM 200x OM 200x UV
Amplitude PhaseSEM 1000x

Appendix IV Surface characterization by Stereomicroscopy (SM), Optical Microscopy (OM), Scanning Electron Microscopy (SEM) and Atomic Force Microscopy (AFM)
58
Figure 3 – Surface analysis set for sample GG-CA, gilding with animal glue varnish.
Figure 4 – Surface analysis set for sample OG-Ca, oil painting with casein varnish
Figure 5 – Surface analysis set for sample EG egg tempera painting unvarnished reference sample.
Figure 6 – Surface analysis set for sample OG oil painting unvarnished reference sample.
SM 10x SM 32x SM 90x
OM 100x OM 200x OM 200x UV
AFM
Amplitude
Phase
SM 10x SM 32x SM 90x
OM 100x OM 200x OM 200x UV
AFM
Amplitude
Phase
SM 10x SM 32x SM 90x
OM 100x OM 200x OM 200x UV
AFMAmplitude PhaseSEM 200x SEM 1000x SEM 3000x UV
SM 10x SM 32x SM 90x
OM 100x OM 200x OM 200x UV
AFM
Amplitude
Phase

Appendix IV Surface characterization by Stereomicroscopy (SM), Optical Microscopy (OM), Scanning Electron Microscopy (SEM) and Atomic Force Microscopy (AFM)
59
Figure 7 – Surface analysis set for sample GG, gilding unvarnished reference sample.
Sample surface analysis after treatment with the same techniques as before, an example for each
cleaning formulation: Pepsin + Gel; Aspergillus sojae enzyme + Gel; Yeast extract + Gel; Pepsin +
[BMIM] [BF4]; Pepsin + [EMIM] [EtSO4]; Aspergillus sojae enzyme + [BMIM] [BF4]; Aspergillus sojae
enzyme + [EMIM] [EtSO4].
Figure 8 – Surface analysis set for sample EG-EW, tempera painting with egg white varnish,
after cleaning with E1+G, Pepsin + Gel.
Figure 9 – Surface analysis set for sample EG-CP, tempera painting with isinglass varnish,
after cleaning with E2+G, Aspergillus sojae enzyme + Gel.
SM 10x SM 32x SM 90x
OM 100x OM 200x OM 200x UV
AFM
Amplitude
Phase
SM 10x SM 32x SM 90x
OM 100x OM 200x OM 200x UV
AFM
Amplitude
Phase
SM 10x SM 32x SM 90x
OM 100x OM 200x OM 200x UV
AFMAmplitude PhaseSEM 200x SEM 1000x SEM 3000x UV

Appendix IV Surface characterization by Stereomicroscopy (SM), Optical Microscopy (OM), Scanning Electron Microscopy (SEM) and Atomic Force Microscopy (AFM)
60
Figure 10 – Surface analysis set for sample GG-CA, gilding with animal glue varnish,
after cleaning with E3+G, Yeast extract + Gel.
Figure 11 – Surface analysis set for sample EG-CP, tempera painting with isinglass varnish,
after cleaning with E1+IL1G, Pepsin + [BMIM] [BF4].
Figure 12 – Surface analysis set for sample GG-CA, gilding with animal glue varnish,
after cleaning with E1+IL2, Pepsin + [EMIM] [EtSO4].
Figure 13 – Surface analysis set for sample OG-Ca, oil painting with casein varnish,
after cleaning with E2+IL1, Aspergillus sojae enzyme + [BMIM] [BF4].
SM 10x SM 32x SM 90x
OM 100x OM 200x OM 200x UV
AFM
Amplitude
Phase
SM 10x SM 32x SM 90x
OM 100x OM 200x OM 200x UV
AFM
Amplitude
Phase
SM 10x SM 32x SM 90x
OM 100x OM 200x OM 200x UV
AFM
Amplitude
Phase
SM 10x SM 32x SM 90x
OM 100x OM 200x OM 200x UV
AFM
Amplitude
Phase

Appendix IV Surface characterization by Stereomicroscopy (SM), Optical Microscopy (OM), Scanning Electron Microscopy (SEM) and Atomic Force Microscopy (AFM)
61
Figure 14 – Surface analysis set for sample EG-EW, tempera painting with egg white varnish,
after cleaning with E2+IL2, Aspergillus sojae enzyme + [EMIM] [EtSO4].
Figure 15 – Surface analysis set for reference samples cleaned only with ionic liquid. a) Left the EG-CP sample after cleaning with IL1, [BMIM] [BF4]; b) Right the OG-EW sample after cleaning with IL2, [EMIM]
[EtSO4].
SM 10x SM 32x SM 90x
OM 100x OM 200x OM 200x UV
AFM
Amplitude
Phase
OM 100x OM 200x OM 200x UV
AFM
Amplitude
Phase
OM 100x OM 200x OM 200x UV
AFM
Amplitude
Phase
a) b)


63
Appendix V Colorimetry analysis
Table 1 – Average CIE L*a*b* values for all varnish and un-varnished samples, compared values for the
expected (∆E) variation after cleaning treatment, by comparison with unvarnished reference samples.
Unvarnished Samples L Avrg L StDv a Avrg a StDv b Avrg b StDv expected ∆E
2 EG-S-a 37.50 0.2159 25.44 0.2829 19.51 0.3005 - 1 OG-S-a 35.91 0.0473 23.76 0.2888 19.47 0.3889 - 7 OG-S-a 36.55 0.0643 24.06 0.1484 19.98 0.1510 -
2 EG-YO-a 59.19 0.9602 19.56 0.5093 46.23 0.9965 - 1 OG-YO-a 53.82 0.5624 18.89 0.5326 41.14 0.5907 - 7 OG-YO-a 54.71 0.3272 20.69 0.2778 43.40 0.7319 -
1 GG-a 85.22 0.4661 6.41 0.1007 36.63 0.1270 - Varnished Samples L Avrg L StDv a Avrg a StDv b Avrg b StDv -
EG-S-EW 42.16 1.0928 18.11 1.9360 14.45 1.2962 10.05 EG-S-CP 36.97 1.2079 24.86 0.9472 19.06 0.9518 0.91 OG-S-EW 38.23 1.0959 20.55 0.8945 14.50 0.8881 6.35 OG-S-CP 36.32 0.8013 22.10 0.3614 16.06 0.3909 3.81 OG-S-Ca 36.43 0.4609 22.30 0.2182 16.25 0.2500 4.13
EG-YO-EW 61.59 1.9892 16.07 2.8030 41.30 2.0451 6.50 EG-YO-CP 58.92 1.2373 19.24 0.5628 44.79 1.4788 1.50 OG-YO-EW 54.49 1.7775 15.31 1.2828 32.79 2.1961 9.11 OG-YO-CP 52.45 0.7765 16.94 0.7843 37.47 1.5336 4.37 OG-YO-Ca 53.45 1.2133 18.14 1.4112 38.26 1.8490 5.87
GG-CA 82.89 0.4388 7.76 0.2987 42.16 0.3317 6.15

Appendix I Colorimetry analysis
64
Table 2 – Colorimetric measurements and ∆E values after cleaning treatment.
Sample Formulation Avg L before
Avg L after ∆ L Avg a
beforeAvg a after ∆ a Avg b
beforeAvg b after ∆ b ∆ E
1 EG-S-EWb
E1 + G
41,59 39,19 -2,40 15,03 23,44 8,41 16,47 19,09 2,62 9,13
1 EG-YO-EWb 64,52 63,55 -0,97 11,20 18,32 7,12 44,74 47,00 2,26 7,53
1 OG-S-EWc 37,65 37,93 0,28 21,70 17,37 -4,32 15,59 19,54 3,95 5,87
1 OG-YO-EWb 56,32 58,42 2,10 17,03 12,70 -4,33 34,22 48,24 14,02 14,83
2 EG-S-CPb 37,55 38,26 0,71 24,27 25,09 0,82 18,41 20,54 2,13 2,39
2 EG-YO-CPb 60,35 64,05 3,70 20,09 17,49 -2,60 47,78 45,13 -2,66 5,24
2 OG-S-CPb 36,83 37,35 0,52 22,19 17,75 -4,44 16,11 21,21 5,10 6,78
2 OG-YO-CPb 52,21 54,44 2,23 16,26 11,01 -5,25 35,88 42,47 6,59 8,72
7 OG-S-Cab 36,60 35,39 -1,21 22,22 22,58 0,36 16,14 17,10 0,96 1,59
7 OG-YO-Cab 51,77 53,27 1,50 15,88 16,68 0,80 35,79 36,76 0,97 1,96
1 GG-CAb 82,86 83,64 0,78 7,92 4,93 -2,99 42,60 43,87 1,27 3,34
1 EG-S-EWc
E2 + G
43,05 39,44 -3,61 14,70 24,01 9,32 16,08 18,66 2,58 10,32
1 EG-YO-EWc 63,98 63,27 -0,71 12,00 18,26 6,26 50,22 46,06 -4,16 7,55
2 EG-S-CPc 38,08 37,71 -0,37 23,66 25,36 1,70 17,93 20,42 2,49 3,04
2 EG-YO-CPc 59,24 63,68 4,44 19,47 16,60 -2,87 45,99 41,30 -4,69 7,06
1 OG-S-EWd 38,15 37,99 -0,16 20,68 19,21 -1,47 14,64 19,30 4,66 4,89
1 OG-YO-EWc 52,81 55,45 2,64 16,04 11,09 -4,96 35,40 43,60 8,20 9,94
2 OG-S-CPc 36,72 37,45 0,73 22,38 17,44 -4,94 16,45 20,29 3,84 6,30
2 OG-YO-CPc 52,82 56,18 3,35 17,03 11,61 -5,42 36,72 45,63 8,90 10,95
8 OG-S-Cab 36,55 36,77 0,22 21,99 22,70 0,72 16,04 16,94 0,90 1,17
8 OG-YO-Cab 53,88 54,66 0,77 18,27 18,02 -0,25 38,45 38,93 0,48 0,94
2 GG-CAb 83,18 83,13 -0,05 7,68 8,16 0,48 41,87 40,38 -1,49 1,57
5 EG-S-EWb
E3 + G
42,44 41,03 -1,40 18,51 17,18 -1,34 13,02 20,09 7,07 7,33
5 EG-YO-EWb 59,64 65,06 5,41 18,41 11,79 -6,61 41,85 51,50 9,65 12,89
6 EG-S-CPb 35,52 39,70 4,19 25,30 18,69 -6,61 19,88 22,49 2,61 8,25
6 EG-YO-CPb 58,00 66,33 8,33 19,38 10,34 -9,04 44,77 45,76 0,99 12,33
5 OG-S-EWb 36,66 40,05 3,39 21,39 16,14 -5,25 15,62 17,16 1,53 6,43
5 OG-YO-EWb 53,45 56,45 3,00 14,40 9,94 -4,47 31,23 39,22 7,99 9,63
6 OG-S-CPb 34,97 38,17 3,20 22,05 16,47 -5,58 16,21 17,93 1,72 6,66
6 OG-YO-CPb 53,40 57,01 3,61 17,98 11,65 -6,33 38,61 43,81 5,20 8,96
9 OG-S-Cab 35,74 36,85 1,10 22,29 23,21 0,92 16,36 17,68 1,32 1,95
9 OG-YO-Cab 54,29 55,27 0,98 19,69 18,66 -1,04 40,50 38,71 -1,79 2,29
3 GG-CAb 83,04 84,09 1,05 7,28 7,37 0,09 42,01 39,21 -2,80 2,99
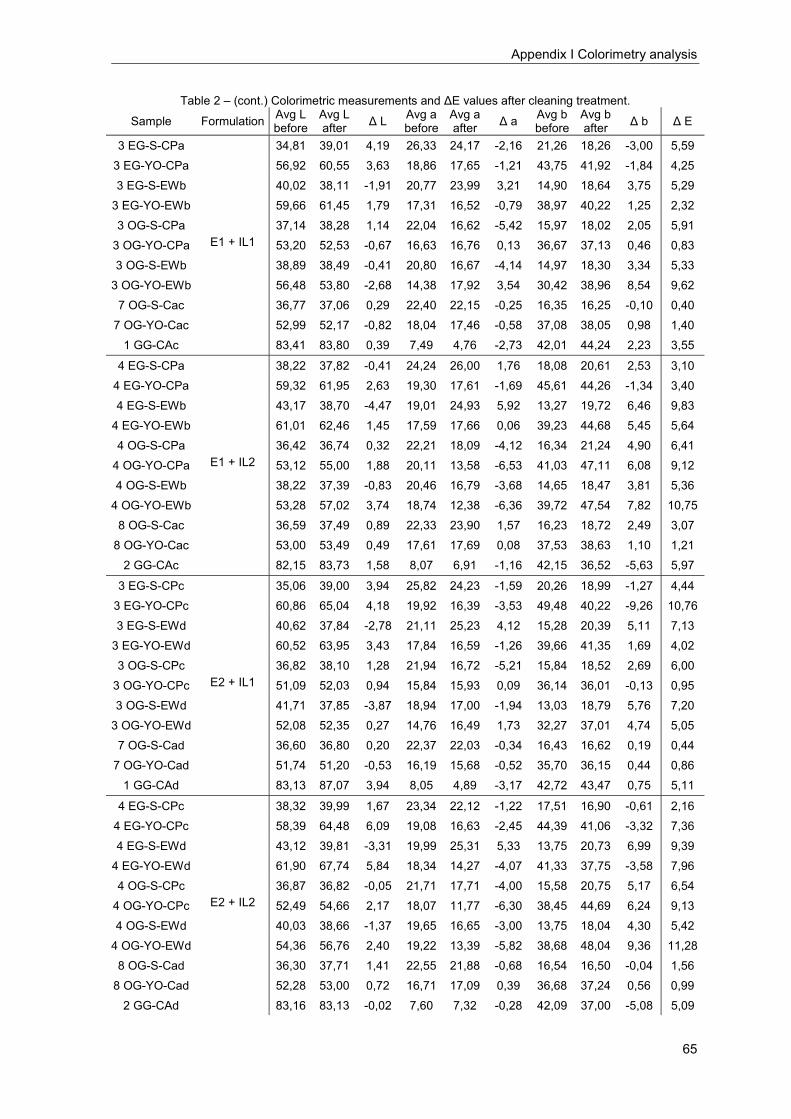
Appendix I Colorimetry analysis
65
Table 2 – (cont.) Colorimetric measurements and ∆E values after cleaning treatment.
Sample Formulation Avg L before
Avg L after ∆ L Avg a
beforeAvg a after ∆ a Avg b
before Avg b after ∆ b ∆ E
3 EG-S-CPa
E1 + IL1
34,81 39,01 4,19 26,33 24,17 -2,16 21,26 18,26 -3,00 5,59
3 EG-YO-CPa 56,92 60,55 3,63 18,86 17,65 -1,21 43,75 41,92 -1,84 4,25
3 EG-S-EWb 40,02 38,11 -1,91 20,77 23,99 3,21 14,90 18,64 3,75 5,29
3 EG-YO-EWb 59,66 61,45 1,79 17,31 16,52 -0,79 38,97 40,22 1,25 2,32
3 OG-S-CPa 37,14 38,28 1,14 22,04 16,62 -5,42 15,97 18,02 2,05 5,91
3 OG-YO-CPa 53,20 52,53 -0,67 16,63 16,76 0,13 36,67 37,13 0,46 0,83
3 OG-S-EWb 38,89 38,49 -0,41 20,80 16,67 -4,14 14,97 18,30 3,34 5,33
3 OG-YO-EWb 56,48 53,80 -2,68 14,38 17,92 3,54 30,42 38,96 8,54 9,62
7 OG-S-Cac 36,77 37,06 0,29 22,40 22,15 -0,25 16,35 16,25 -0,10 0,40
7 OG-YO-Cac 52,99 52,17 -0,82 18,04 17,46 -0,58 37,08 38,05 0,98 1,40
1 GG-CAc 83,41 83,80 0,39 7,49 4,76 -2,73 42,01 44,24 2,23 3,55
4 EG-S-CPa
E1 + IL2
38,22 37,82 -0,41 24,24 26,00 1,76 18,08 20,61 2,53 3,10
4 EG-YO-CPa 59,32 61,95 2,63 19,30 17,61 -1,69 45,61 44,26 -1,34 3,40
4 EG-S-EWb 43,17 38,70 -4,47 19,01 24,93 5,92 13,27 19,72 6,46 9,83
4 EG-YO-EWb 61,01 62,46 1,45 17,59 17,66 0,06 39,23 44,68 5,45 5,64
4 OG-S-CPa 36,42 36,74 0,32 22,21 18,09 -4,12 16,34 21,24 4,90 6,41
4 OG-YO-CPa 53,12 55,00 1,88 20,11 13,58 -6,53 41,03 47,11 6,08 9,12
4 OG-S-EWb 38,22 37,39 -0,83 20,46 16,79 -3,68 14,65 18,47 3,81 5,36
4 OG-YO-EWb 53,28 57,02 3,74 18,74 12,38 -6,36 39,72 47,54 7,82 10,75
8 OG-S-Cac 36,59 37,49 0,89 22,33 23,90 1,57 16,23 18,72 2,49 3,07
8 OG-YO-Cac 53,00 53,49 0,49 17,61 17,69 0,08 37,53 38,63 1,10 1,21
2 GG-CAc 82,15 83,73 1,58 8,07 6,91 -1,16 42,15 36,52 -5,63 5,97
3 EG-S-CPc
E2 + IL1
35,06 39,00 3,94 25,82 24,23 -1,59 20,26 18,99 -1,27 4,44
3 EG-YO-CPc 60,86 65,04 4,18 19,92 16,39 -3,53 49,48 40,22 -9,26 10,76
3 EG-S-EWd 40,62 37,84 -2,78 21,11 25,23 4,12 15,28 20,39 5,11 7,13
3 EG-YO-EWd 60,52 63,95 3,43 17,84 16,59 -1,26 39,66 41,35 1,69 4,02
3 OG-S-CPc 36,82 38,10 1,28 21,94 16,72 -5,21 15,84 18,52 2,69 6,00
3 OG-YO-CPc 51,09 52,03 0,94 15,84 15,93 0,09 36,14 36,01 -0,13 0,95
3 OG-S-EWd 41,71 37,85 -3,87 18,94 17,00 -1,94 13,03 18,79 5,76 7,20
3 OG-YO-EWd 52,08 52,35 0,27 14,76 16,49 1,73 32,27 37,01 4,74 5,05
7 OG-S-Cad 36,60 36,80 0,20 22,37 22,03 -0,34 16,43 16,62 0,19 0,44
7 OG-YO-Cad 51,74 51,20 -0,53 16,19 15,68 -0,52 35,70 36,15 0,44 0,86
1 GG-CAd 83,13 87,07 3,94 8,05 4,89 -3,17 42,72 43,47 0,75 5,11
4 EG-S-CPc
E2 + IL2
38,32 39,99 1,67 23,34 22,12 -1,22 17,51 16,90 -0,61 2,16
4 EG-YO-CPc 58,39 64,48 6,09 19,08 16,63 -2,45 44,39 41,06 -3,32 7,36
4 EG-S-EWd 43,12 39,81 -3,31 19,99 25,31 5,33 13,75 20,73 6,99 9,39
4 EG-YO-EWd 61,90 67,74 5,84 18,34 14,27 -4,07 41,33 37,75 -3,58 7,96
4 OG-S-CPc 36,87 36,82 -0,05 21,71 17,71 -4,00 15,58 20,75 5,17 6,54
4 OG-YO-CPc 52,49 54,66 2,17 18,07 11,77 -6,30 38,45 44,69 6,24 9,13
4 OG-S-EWd 40,03 38,66 -1,37 19,65 16,65 -3,00 13,75 18,04 4,30 5,42
4 OG-YO-EWd 54,36 56,76 2,40 19,22 13,39 -5,82 38,68 48,04 9,36 11,28
8 OG-S-Cad 36,30 37,71 1,41 22,55 21,88 -0,68 16,54 16,50 -0,04 1,56
8 OG-YO-Cad 52,28 53,00 0,72 16,71 17,09 0,39 36,68 37,24 0,56 0,99
2 GG-CAd 83,16 83,13 -0,02 7,60 7,32 -0,28 42,09 37,00 -5,08 5,09

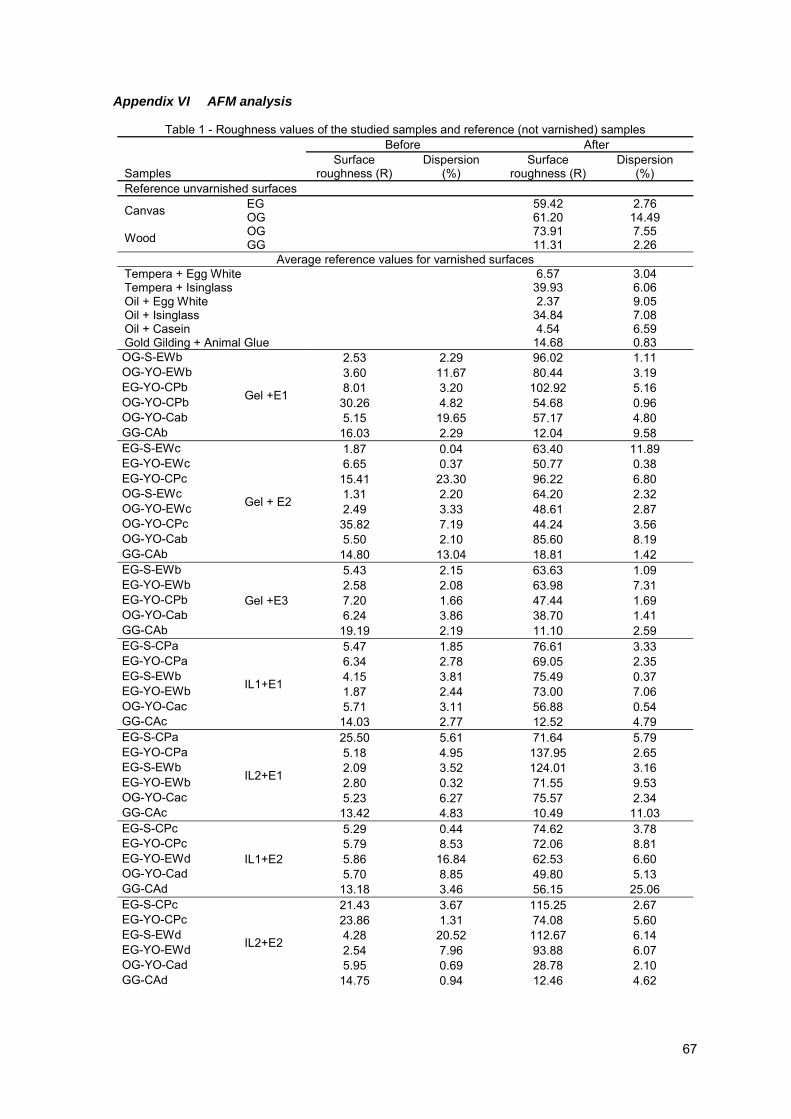
67
Appendix VI AFM analysis
Table 1 - Roughness values of the studied samples and reference (not varnished) samples
Samples
Before After Surface
roughness (R) Dispersion
(%) Surface
roughness (R) Dispersion
(%) Reference unvarnished surfaces
Canvas EG 59.42 2.76 OG 61.20 14.49
Wood OG 73.91 7.55 GG 11.31 2.26
Average reference values for varnished surfaces Tempera + Egg White 6.57 3.04 Tempera + Isinglass 39.93 6.06 Oil + Egg White 2.37 9.05 Oil + Isinglass 34.84 7.08 Oil + Casein 4.54 6.59 Gold Gilding + Animal Glue 14.68 0.83 OG-S-EWb
Gel +E1
2.53 2.29 96.02 1.11 OG-YO-EWb 3.60 11.67 80.44 3.19 EG-YO-CPb 8.01 3.20 102.92 5.16 OG-YO-CPb 30.26 4.82 54.68 0.96 OG-YO-Cab 5.15 19.65 57.17 4.80 GG-CAb 16.03 2.29 12.04 9.58 EG-S-EWc
Gel + E2
1.87 0.04 63.40 11.89 EG-YO-EWc 6.65 0.37 50.77 0.38 EG-YO-CPc 15.41 23.30 96.22 6.80 OG-S-EWc 1.31 2.20 64.20 2.32 OG-YO-EWc 2.49 3.33 48.61 2.87 OG-YO-CPc 35.82 7.19 44.24 3.56 OG-YO-Cab 5.50 2.10 85.60 8.19 GG-CAb 14.80 13.04 18.81 1.42 EG-S-EWb
Gel +E3
5.43 2.15 63.63 1.09 EG-YO-EWb 2.58 2.08 63.98 7.31 EG-YO-CPb 7.20 1.66 47.44 1.69 OG-YO-Cab 6.24 3.86 38.70 1.41 GG-CAb 19.19 2.19 11.10 2.59 EG-S-CPa
IL1+E1
5.47 1.85 76.61 3.33 EG-YO-CPa 6.34 2.78 69.05 2.35 EG-S-EWb 4.15 3.81 75.49 0.37 EG-YO-EWb 1.87 2.44 73.00 7.06 OG-YO-Cac 5.71 3.11 56.88 0.54 GG-CAc 14.03 2.77 12.52 4.79 EG-S-CPa
IL2+E1
25.50 5.61 71.64 5.79 EG-YO-CPa 5.18 4.95 137.95 2.65 EG-S-EWb 2.09 3.52 124.01 3.16 EG-YO-EWb 2.80 0.32 71.55 9.53 OG-YO-Cac 5.23 6.27 75.57 2.34 GG-CAc 13.42 4.83 10.49 11.03 EG-S-CPc
IL1+E2
5.29 0.44 74.62 3.78 EG-YO-CPc 5.79 8.53 72.06 8.81 EG-YO-EWd 5.86 16.84 62.53 6.60 OG-YO-Cad 5.70 8.85 49.80 5.13 GG-CAd 13.18 3.46 56.15 25.06 EG-S-CPc
IL2+E2
21.43 3.67 115.25 2.67 EG-YO-CPc 23.86 1.31 74.08 5.60 EG-S-EWd 4.28 20.52 112.67 6.14 EG-YO-EWd 2.54 7.96 93.88 6.07 OG-YO-Cad 5.95 0.69 28.78 2.10 GG-CAd 14.75 0.94 12.46 4.62

Appl
icat
ion
of io
nic
liqui
ds a
nd e
nzym
es fo
r the
rem
oval
of p
rote
inac
eous
laye
rs fr
om p
olyc
hrom
e of
wor
ks o
f art
and
eval
uatio
n of
the
clea
ning
effe
ctiv
enes
s - C
atar
ina
Pere
ira
2012