aplicaÇÕes de mÉtodos de sensoriamento de vibraÇÃo...
TRANSCRIPT
UNIVERSIDADE ESTADUAL DE CAMPINAS
Faculdade de Engenharia Elétrica e de Computação
CAROLINA FRANCISCANGELIS
TOWARDS VIBRATION SENSING APPLICATIONS BASED ON PHASE-OTDR
TECHNIQUES
APLICAÇÕES DE MÉTODOS DE SENSORIAMENTO DE VIBRAÇÃO BASEADOS EM
TÉCNICAS DE PHASE-OTDR
CAMPINAS
2017
UNIVERSIDADE ESTADUAL DE CAMPINAS
FEEC – Faculdade de Engenharia Elétrica e de Computação
CAROLINA FRANCISCANGELIS
TOWARDS VIBRATION SENSING APPLICATIONS BASED ON PHASE-OTDR
TECHNIQUES
APLICAÇÕES DE MÉTODOS DE SENSORIAMENTO DE VIBRAÇÃO BASEADOS EM
TÉCNICAS DE PHASE- OTDR
Thesis presented to the School of Electrical
and Computer Engineering and of the
University of Campinas in partial fulfillment
of the requirements for the degree of Doctor,
in the area of Electronics, Microelectronics
and Optoelectronics
Tese apresentada à Faculdade de Engenharia
Elétrica e de Computação da Universidade
Estadual de Campinas como parte dos
requisitos exigidos para a obtenção do título
de Doutora em Engenharia Elétrica, na Àrea
de Eletrônica, Microeletrônica e
Optoeletrônica
Supervisor/Orientador: FABIANO FRUETT
Co-supervisor/Co-orientador: CLAUDIO FLORIDIA
ESTE EXEMPLAR CORRESPONDE À VERSÃO FINAL
TESE DEFENDIDA PELA ALUNA CAROLINA
FRANCISCANGELIS E ORIENTADA PELO PROF. DR.
FABIANO FRUETT
CAMPINAS
2017

COMISSÃO JULGADORA – TESE DE DOUTORADO
Candidata: Carolina Franciscangelis RA: 072905
Data da Defesa: 4 de dezembro de 2017
Título da Tese (inglês): ”Towards vibration sensing applications based on phase-OTDR techniques” Título da Tese (português): “Aplicações de métodos de sensoriamento de vibração baseados em técnicas de phase-OTDR” Prof. Dr. Fabiano Fruett (Presidente, FEEC/UNICAMP) Dra. Livia Ribeiro Alves (INPE) Dr. Roberto Ricardo Panepucci (CTI) Prof. Dr. Peter Jürger Tatsch (FEEC/UNICAMP) Prof. Dr. Cristiano Monteiro de Barros Cordeiro (IFGW/UNICAMP) A ata de defesa, com as respectivas assinaturas dos membros da Comissão Julgadora, encontra-se no processo de vida acadêmica do aluno.
ACKNOWLEDGEMENTS
Firstly, I thank God for life and all these amazing opportunities!
I thank my parents, Rosangela and Batista for all the fantastic support along
my whole life, for inspiring me so much and for teaching me how to chase my dreams and
make them come true.
I thank my stepfather, Fernando, for all the support, inspiration, motivation
and for always believing in me and in my goals.
Thanks also to my stepmother, Silvana, for all the love, support and
friendship.
I am grateful to my grandparents, Jubeide, Orlando, Josephina and Antônio
(in memoriam), for all the love and comfort.
Thanks to my dear Frímann, for the love, comfort, support, inspiration, smiles
and chocolates.
I am very grateful to my supervisor at Unicamp. Prof. Dr. Fabiano Fruett, for
supporting and guiding me through all these years during my bachelor studies, master and
PhD. I deeply thank you for all your knowledge, patience, experience and support.
I deeply thank Dr. Walter Margulis, my supervisor during my one-year PhD
sandwich period at RISE Acreo facilities in Sweden. Dr. Margulis great experience and
knowledge in optical fibers were essential for the development of this work and its relevant
results. Thank you very much, Walter, for being an example as scientist as well as for
teaching me and supporting me so much.
Thanks to my co-supervisor at CPqD, Dr. Claudio Floridia, for supervising me
since my first internship in optical fiber sensors. During both my master’s and PhD studies,
Dr. Floridia shared his extensive knowledge in optical fiber monitoring, which was of great
importance for all the obtained results.
I thank all the amazing team at RISE Acreo: Sebastian, Carola, Magnus, Johan,
Sasha, Leif, João, Pär and Pierre-Yves. Special thanks to Erik Zetterlund and Åsa Claesson,
group and department managers respectively, who greatly supported me and gave me
fantastic opportunities!
I thank Saab AB for all the support that made my PhD sandwich feasible,
specially to Lars Sjöström for his interest in this work. Special thanks also to my Saab

supervisor, Dr. Ingemar Söderquist, to Dr. Tonny Nyman, Mikael J. Petersson and to Dr.
Per Hallander for all the great technical discussions.
I also thank KTH, especially Prof. Dr. Fredrik Laurell and Prof. Dr. Stefan
Hallström for all the technical discussions and advises.
I hugely thank the amazing friends (family, actually!) that I made in Stockholm
during my PhD sandwich: Alexandra, Nikoletta, Reihaneh, Argiro, Cristine, Antonios,
Efthimios, Carlos, Adriana, Janna, Naiara, Ibrahim, among other amazing people that made
my year fantastic!
I thank my beloved friends in Brazil, that supported me with love and
comprehension during all these years: Marselle, Camila R., Camila B., Camila D., Camila P.,
Caike, Monike, Ricardo R., Guilherme M., Guilherme S., Thais, Fernando, Bruna, William,
Raudiner, Paulo, Micheli, Michele, Aline, Gabriel, Tatiane, Anapaula, Ulysses, Getúlio,
Glauco.
My huge thanks to the great team at LSMO – CPqD, for all the support, lessons
and friendship: João Rosolem, Rivael, Ariovaldo, Felipe, Fábio, João Fracarolli, Danilo and
Eduardo.
I thank my friends and colleagues at LSM – Unicamp: Giuliano, José, Luciane,
Pedro, Ricardo and Diego.
I thank CISB for all the finantial support during my PhD sandwich.
I thank CAPES and CNPq funding agencies for the finantial support.

“A man must shape himself to a new mark directly the old one goes to ground.”
(Sir Ernest Henry Shackleton)
ABSTRACT
Distributed optical fiber sensors have been increasingly employed for monitoring several
parameters, such as temperature, vibration, strain, magnetic field and current. When
compared to other conventional techniques, these sensors are advantageous due to their
small dimensions, lightweight, immunity to electromagnetic interference, high adaptability,
robustness to hazardous environments, less complex data multiplexing, the feasibility to be
embedded into structures with minimum invasion, the capability to extract data with high
resolution from long perimeters using a single optical fiber and detect multiple events along
the fiber.
In particular, distributed acoustic sensors (DAS) based on optical time domain
reflectometry (OTDR), are of high interest, due to their capability to be used in applications
such as structural health monitoring (SHM) and perimeter surveillance. Through the
frequency analysis of a structure, for instance an aircraft, a bridge, a building or even
machines in a workshop, it is possible to evaluate its condition and detect damages and
failures at an early stage. Also, OTDR based solutions for vibration monitoring can be easily
adapted with minimum setup modifications to detect intrusion in a perimeter, a useful tool
for surveillance of military facilities, laboratories, power plants and homeland security.
The same OTDR technique can be used as a non-destructive diagnostic tool to
evaluate vibrations and disturbances on both small structures with some dozens of
centimeters’ resolution and in big structures or perimeters with some meters of spatial
resolution and hundreds of kilometers of reach. Another useful feature of this optical fiber-
based solution is the possibility to be combined with high-performance digital signal
processing techniques, enabling fast disturbance detection and location, real-time intrusion
pattern recognition and fast data multiplexing of structure surfaces for SHM applications.
The main goal of this thesis is to make use of these features to employ DAS techniques as
key enabling technologies solutions for several applications. In this work, OTDR based
techniques were studied and the thesis main contributions were focused on bringing
innovative solutions and validations for SHM and surveillance applications.

This PhD had a sandwich period at Acreo AB, Stockholm, Sweden, where
experimental tests were performed, and it was part of the 42ª CISB/Saab/CNPq Call.

RESUMO
Sensores à fibra óptica distribuídos têm sido empregados para monitorar vários parâmetros,
tais como temperatura, vibração, tensão mecânica, campo magnético e corrente elétrica.
Quando comparados a outras técnicas convencionais, tais sensores são vantajosos devido a
suas pequenas dimensões, imunidade a interferências eletromagnéticas, alta
adaptabilidade, robustez a ambientes nocivos, dentre outros. Sensores acústicos
distribuídos em particular são interessantes devido a sua capacidade em serem usados em
aplicações tais como monitoração de saúde de estruturas e vigilância de perímetros.
Através da análise em frequência da estrutura, por exemplo uma aeronave, uma
ponte, um edifício ou mesmo máquinas em uma fábrica, é possível avaliar sua condição e
detectar danos e falhas em um estágio primário. Tais soluções podem cobrir ambas as
aplicações de detecção de intrusão e monitoração estrutural com mínimas adaptações no
sistema sensor.
Desta forma, vibrações e distúrbios pequenas estruturas com resolução de dezenas
de centímetros e em grandes estruturas ou perímetros com alguns metros de resolução
espacial e centenas de quilômetros de alcance podem ser detectadas. Outra característica
útil desta solução baseada em fibra óptica é a possibilidade de ser combinada com técnicas
de processamento digital de sinais, permitindo a detecção e localização de perturbações
rápidas, reconhecimento de padrões de intrusão em tempo real e multiplexação de dados
de superfícies estruturais para aplicações SHM.
O principal objetivo desta tese é fazer uso desses recursos para empregar técnicas de
DAS como soluções de tecnologias- chave para várias aplicações. Neste trabalho, as técnicas
de phase-OTDR foram estudadas e as principais contribuições da tese focaram em trazer
soluções inovadoras e validações para aplicações de vigilância e vigilância. Como resultado,
artigos foram publicados em revistas e congressos internacionais.
Este doutorado teve um período sanduíche nas instalações da RISE Acreo AB,
Estocolmo, Suécia, onde experimentos foram realizados e foi parte da 42ª Chamada
CISB/Saab/CNPq.
ABBREVIATIONS LIST
ADC Analog to Digital Converter
ANN Artificial Neural Network
APC Angled Physical Contact
APD Avalanche Photodetector
B-OTDR Brillouin-Optical Time Domain
Reflectometer
BP Back Propagation
BRAM Block Random Access Memory
DAS Distributed Acoustic Sensor
DOFS Distributed Optical Fiber Sensor(s)
DSP Digital Signal Processing
EDFA Erbium Doped Fiber Amplifier
FBA Fiber Brillouin Amplification
FDM Frequency Domain Multiplexed
FIFO First In First Out
FPGA Field Programmable Gate Array
FUT Fiber Under Test
IIR Infinite Impulse Response
NA Numerical Aperture
NAR Nuisace Alarm Rates
NLL Narrow Linewidth Laser
OFDR Optical Frequency Domain Reflectometer
OTDR Optical Time Domain Reflectometer
PC Physical Contact
phase-OTDR phase-sensitive Optical Time Domain
Reflectometer
PMD Polarization Mode Dispersion
SHM Structural Health Monitoring
SMF Single Mode Fiber
SMOS Sinusoid Modulated Optical Signals
SNR Signal-to-Noise Ratio
SOA Semiconductor Optical Amplifier
VHDL Very High Speed Integrated Circuits
Hardware Description Language

SYMBOLS LIST
η Attenuation coeficiente
PBS Backscattered signal
K Constant that depends on the fiber core
compositon
G Derivative
E Light electrical field
θ Maximum trace angle of light guided
mode
V Normalized frequency
M Number of reflecting sections
𝛼𝐴 Optical fiber absorption coeficiente
z Optical fiber length
NA Optical fiber numerical aperture
𝛼𝑅 Optical fiber Rayleigh scattering coeficient
n Optical fiber refractive index
I Optical intensity
P Optical power attenuation
PR Optical power loss due to Rayleigh
scattering
vg Optical pulse group velocity
TMax Optical pulse repetition rate
τ Optical pulse width
ΔtW Optical pulse width
∆𝑆𝑅 OTDR spatial resolution
Δφ Phase difference between two
backscattered waves
𝛼 Scattering center amplitude
𝜑 Scattering wave phase
c Speed of the light
t Time
𝛼𝑇 Total attenuation optical fiber coefficient
L Total fiber length
λ Wavelength

SUMMARY
1. CHAPTER 1: INTRODUCTION 15
1.1. MOTIVATIONS AND CONTRIBUTIONS 16
1.2. THESIS OUTLINE 19
2. CHAPTER 2: SCATTERING IN OPTICAL FIBERS FOR DISTRIBUTED
ACOUSTIC SENSING 21
2.1. OVERVIEW 21
2.2. THE RAYLEIGH SCATTERING THEORY 24
2.3. THE PHASE-OTDR TECHNIQUE BASED ON RAYLEIGH SCATTERING 27
2.3.1. THE BASIC OTDR METHOD 28
2.3.2. FUNDAMENTALS OF THE PHASE-OTDR TECHNIQUE 33
2.3.3. LITERATURE REVIEW OF THE PHASE-OTDR METHOD 39
2.4. CHAPTER CONCLUSION 50
3. CHAPTER 3: MULTIPOINT SIMULTANEOUS INTRUSION DETECTION FOR
SURVEILLANCE SYSTEMS BASED ON PHASE-OTDR 51
3.1. BACKGROUND ON SURVEILLANCE APPLICATIONS BASED ON
PHASE-OTDR 51
3.2. EXPERIMENTAL SETUP 54
3.3. SINGLE AND MULTIPOINT INTRUSION DETECTION 56
3.4. OPTICAL COILS MESH FOR 2D SURFACE MAPPING 59
3.5. INTRUSION DETECTION BASED ON PHASE-OTDR AND FPGA
ARCHITECTURES 62
3.5.1. MOVING AVERAGE FILTER 64
3.5.2. SOBEL FILTER 64
3.5.3. FPGA IMPLEMENTATIONS 65
3.5.4. PHASE-OTDR DISTURBANCE DETECTION USING MOVING
AVERAGE 66
3.5.5. PHASE-OTDR DISTURBANCE DETECTION USING SOBEL
FILTER 67
3.5.6. DETECTION AND LOCALIZATION OF ONE DISTURBANCE
POINT 68
3.5.7. DETECTION AND LOCALIZATION OF TWO DISTURBANCE
POINTS 70
3.5.8. RESULTS ANALYSIS 71
3.6. CHAPTER CONCLUSION 72
4. CHAPTER 4: VIBRATION MEASUREMENT ON COMPOSITE MATERIAL
WITH EMBEDDED OPTICAL FIBER BASED ON PHASE-OTDR 73
4.1. BACKGROUND ON AIRCRAFT COMPOSITE STRUCTURE
MONITORING 74
4.2. INFLUENCE OF OPTICAL FIBERS EMBEDMENT INTO COMPOSITE
MATERIAL 78
4.3. DESIGN AND MANUFACTURING OF COMPOSITE BOARD SAMPLE WITH
EMBEDDED OPTICAL FIBERS 80
4.4. VIBRATION FREQUENCY MEASUREMENTS ON COMPOSITE BOARD
SAMPLE 84
4.5. CHAPTER CONCLUSION 89
5. CHAPTER 5: REAL-TIME DISTRIBUTED OPTICAL FIBER MICROPHONE
BASED ON PHASE-OTDR 91
5.1. OVERVIEW 91

5.2. METHODOLOGY 93
5.3. SYSTEM CHARACTERIZATIONS 95
5.4. SOUND LISTENING EXPERIMENTS 97
5.4.1. FREQUENCY SWEEP, VOICE AND MUSIC 97
5.4.2. FOOTSTEPS ON WOODEN PLANK 98
5.4.3. COMPOSITE KNOCKING AND SCREW DROP 100
5.4.4. MULTIPLE MACHINES SIMULTANEOUS LISTENING 102
5.5. CHAPTER CONCLUSIONS 104
6. CHAPTER 6: CONCLUSIONS 107
BIBLIOGRAPHY 111
APPENDIX A: PUBLISHED PAPERS 117
15
CHAPTER 1
1. INTRODUCTION
Distributed optical fiber sensors (DOFS) have been increasingly employed for monitoring
several parameters, such as temperature, vibration, strain, magnetic field and current [1].
When compared to other conventional techniques, these sensors are advantageous due to their
small dimensions, lightweight, immunity to electromagnetic interference and high
adaptability [2]. Also, these solutions can be also robust to hazardous environments, require
less complex data multiplexing and can be embedded into structures with minimum invasion.
Differently from point or multi-point solutions where the insertion of single or multiple
sensing elements in the fiber is required, in DOFS the whole fiber itself is a continuous sensing
element [3]. This feature allows to extract data with spatial resolution of centimeters from
perimeters of kilometers lengtht using a single optical fiber and to detect multiple
simultaneous events along it. In particular, distributed acoustic sensors (DAS) based on
Rayleigh scattering and phase-sensitive optical time domain reflectometry (phase-OTDR), this
thesis’ subject of study, are of high interest due to their capability to be used in applications
such as structural health monitoring (SHM) and perimeter surveillance. When compared to
other fiber optics sensing solutions, the phase-OTDR technique features a relevant
compromise between spatial resolution, reach and dynamic measurement limits. This method
can be adjusted to cover hundreds of kilometers [4], to deliver a 20 cm spatial resolution [5] or
measure frequencies from mHz to hundreds of kHz [6], revealing, thus, flexibility and the
capability to attend the wide SHM and surveillance applications requirements.
The SHM solutions can detect cracks and material fatigue inside structures. One highly
effective non-destructive diagnostic tool for SHM is the damage identification based upon
changes in the vibration characteristics of the structure. Usually, frequency information is the
most important parameter in vibration sensing [7]. Through the frequency analysis of a
structure provided by the phase-OTDR technique, for instance an aircraft, a bridge, a building

16
or even machines in a workshop, it is possible to evaluate its condition and detect damages
and failures at an early stage [8].
It is also known that DAS solutions based on phase-OTDR can be employed for
surveillance applications [9]. Perimeter security is an issue of major concern in environments
such as: military facilities, electrical plants, oil pipelines, dams, private properties and others.
In these facilities, it is important to employ robust, high performance and cost-effective
monitoring systems which enables multi-zone disturbance detection and localization
capabilities. In this scenario, the phase-OTDR technique rises as a feasible solution, because it
can monitor hundreds of kilometers with a meter spatial resolution and needs access to one
fiber end only [4]. In these solutions, the sensing fiber can be buried a few meters in the ground,
guaranteeing the sensor camouflage from the intruders. Together with parallel hardware
architecture approaches, this method allows implementing real-time detecting and locating
invasion, enabling a fast response towards the intruder.
It is worth stressing that minimum setup modifications in a phase-OTDR system can
make it capable to evaluate vibration frequencies and disturbances locations on both structures
that some dozens of centimeters of spatial resolution and also on structures that demand
spatial resolutions in the order of meters. Thus, this DAS method can be classified as a key
enabling technology solution for several SHM and surveillance applications.
This PhD had a sandwich period at Acreo AB, Stockholm, Sweden, where experimental
tests were performed. It was part of the 42ª CISB/Saab/CNPq Call and all the research
presented here was performed to present to Saab AB solutions in SHM and surveillance.
1.1. MOTIVATIONS AND CONTRIBUTIONS
The main goal of this thesis is to make use of the phase-OTDR features to employ this DAS
technique as key enabling technology solution for applications concerning SHM and
surveillance. The motivations rely on the fact that both areas can be covered using the same
phase-OTDR method with minor setup changes, which highlights the adaptability feature of
this DAS approach. In this work, phase-OTDR based techniques were investigate and the
thesis main contributions were focused on bringing innovative solutions and validations for
SHM and surveillance applications, described in the subsections below.

17
A. Structural Health Monitoring
Fiber optic sensors for aircraft SHM allow evaluating both: new aeronautic materials and the
behavior of aircraft structures under harsh environmental conditions of pressure, temperature
and acoustic disturbance. As previously explained, distributed optical fiber sensors features
allow the fiber to be embedded into aircraft structures in a nearly non-intrusive way to sense
and measure vibrations along every point along the fiber length. The capability of measuring
vibrations on aircraft composite structures is of interest when concerning the study of the
material fatigue or the occurrence of undesirable phenomena like flutter.
Therefore, the contribution of this thesis regarding aircraft SHM was the evaluation of the
phase-OTDR technique to measure vibration frequencies in carbon composites using
embedded optical fibers. Frequencies ranging from 0 to 1000 Hz were correctly measured in
two layers of the investigated composite board and this work was published in the SPIE Smart
Structures NDE Conference, 2107. Also, a literature review was also performed in order to
evaluate the influence of the embedded optical fibers in the composite reinforcing carbon
fibers, showing that no significant resistance reduction is observed when the optical fibers are
embedded in parallel with respect to the material carbon fibers.
B. Perimeter surveillance
Perimeter surveillance usually requires real-time multi-zone processing of disturbance signals.
In this scenario it is important to have: (i) a high performance and reliable computational
approach that receives and filters the data at the sampling frequency allowing multiple
disturbances to be detected and located; (ii) a scalable and easy configurable processing
solution that can be adapted to different scenarios and follows the optical distributed sensors
along incremental perimeters and structures.
This thesis contribution to the intrusion detection field based on DAS is the propose of
using parallel hardware architectures to implement real-time detecting and locating
perturbations through a phase-OTDR distributed vibration sensor. In this multidisciplinary
investigation, hardware architectures of the iterative moving average filter and the Sobel filter
were mapped on field programmable gate arrays, exploring the intrinsic parallelism in order

18
to achieve real-time requirements. Experimental results validate the employment of this DAS
technique allied with FPGA solutions for surveillance applications. The experimental results
were published in the 14th EEE International Conference on Networking, Sensing and Control,
2017.
C. Structural Health Monitoring & Perimeter surveillance: distributed optical fiber
microphone
The use of DAS as a distributed microphone allows extracting information from sound which
is useful to monitor perimeter security and equipment in industrial plants, since it allows
spatially locating the acoustic disturbance and its frequency content. Recently, a distributed
fiber microphone was reported based on the phase-OTDR. The amount of data generated by
a system used to monitor the acoustic response of the entire fiber all the time is massive, and
data acquisition to a memory followed by off-line processing is required. This is a serious
limitation, and most DAS systems reported in the literature involve a posteriori analysis of
recorded data. In that publication, for example, consecutive phase-OTDR curves were
acquired and processed off-line to recover the sound signal.
In some cases, it would be very advantageous to listen to the acoustic signal in real-
time, without additional signal processing. In this thesis, a novel proposal is demonstrated to
solve this issue, employing a phase-OTDR with direct detection. The method comprises a
sample-and-hold circuit capable of both tuning the receiver to an arbitrary section of the fiber
considered of interest and to recover in real-time the detected acoustic wave. The system
allows listening to the sound of a sinusoidal disturbance with variable frequency, music and
human voice with ~60 cm of spatial resolution through a 300 m long optical fiber. The
experimental results were published in the Optics Express journal, 2016, as show in Appendix
A.
The developed system distributed capability allied with the real-time spatial tuning
makes it also suitable for listening to several machines in a workshop, one at a time. Thus, the
phase-OTDR real-time microphone technique was also employed to listen to two different
machines, a drill and a cooling water system pump, using a single optical fiber. Both machines
were attached to two different sections of the optical fiber and they were both working
19
simultaneously. By triggering the sample-and-hold device, both machines were successfully
listened to, along with the recording of their soundwaves. Also, the knocking sounds on the
carbon composite border evaluated in the previous SHM section were also listened to, a result
that reinforce the use of this microphone for SHM.
These experiments shown the quality limits of an optical fiber as microphone when
employing the phase-OTDR technique, which proved to be satisfying when using a proper
transducer. It is expected that these results will feed further researches regarding sound
coupling and analysis in optical fibers.
1.2. THESIS OUTLINE
This thesis next chapters are organized as follow:
Chapter 2 – Scattering in optical fibers for distributed sensing applications
This chapter shows a literature review in scattering in optical fibers applied to
distributed sensing. Firstly, an overview of the Brillouin, Rayleigh and Raman
scattering. Then, a detailed section is dedicated to explain the Rayleigh scattering
phenomenon, which is the one employed in the phase-OTDR technique, the method
explored in this thesis. This section is followed by an explanation about the phase-
OTDR vibration sensing method and a literature review of its applications for
surveillance and SHM.
Chapter 3 – Multipoint simultaneous intrusion detection for surveillance systems
based on phase-OTDR
In this chapter, the application of the phase-OTDR technique for multiple intrusion
detection for surveillance systems is presented. Experimental results containing both
the traditional method and the joint research between DAS and FPGA methods are
shown. The advantages and limitations of this application are discussed.
Chapter 4 – Vibration measurement on composite material with embedded optical
fiber based on phase-OTDR

20
This chapter stresses about one of the phase-OTDR applications covered: the
measurement of vibration on composite material. The chapter introduces concepts of
carbon composite material and its adherence with embedded optical fibers. Also, the
fabrication process of these materials is explained and the results of the validation
regarding vibration frequencies measurements in two layers of the material is
presented.
Chapter 5 – Real-time distributed optical fiber microphone based on phase-OTDR
In this chapter, a novel distributed microphone based on phase-OTDR technique is be
presented along with experimental results and discussions regarding its capacity
limits and future challenges.
Chapter 6 – Conclusions
This chapter will summarize this thesis main achievements and contributions along
with a discussion regarding future works.
Appendix A – Published papers
Bibliography
21
CHAPTER 2
2. SCATTERING IN OPTICAL FIBERS FOR
DISTRIBUTED ACOUSTIC SENSING
This chapter begins with a review about scattering phenomenon in optical fibers for
distributed sensing. The theoretical fundaments behind the main scattering types,
Raman, Rayleigh and Brillouin, are stressed with an emphasis on the Rayleigh
scattering which is the one explored. Next, the operating principle of the phase-
sensitive Optical Time Domain Reflectometer (phase-OTDR) technique, main subject
of this thesis, is explained, including a detailed literature review.
2.1. OVERVIEW
Scattering of electromagnetic waves in any medium is related to the heterogeneity of
that medium: heterogeneity on the molecular scale or on the scale of aggregations of
many molecules [10]. An optical fiber is a non-homogeneous waveguide in which
properties such as density, composition and structure vary along its length. When a
light beam propagating through an optical fiber encounters these material
irregularities, it suffers scattering [11]. If the propagating light doesn’t affect the optical
properties of the medium, the scattering phenomenon is classified as spontaneous and
the irregularities are excited by thermal effect.
However, if the light intensity is enough to produce these properties
fluctuations, then the scattering is called stimulated. Part of the scattering light goes
back to the input of the fiber and is known as backscattered light [12]. When converted
22
from frequency/time domain to spatial domain, it represents the phase/amplitude
behavior of light along the fiber length. Since these parameters can be sensitive to
phenomena as temperature, strain and vibration, this small fraction of the light is the
one employed for distributed optical fiber sensors (DOFS) techniques. Since these
fluctuations, also known as scattering centers, occurs within micrometers of distance
from each other, the DOFS methods are capable to reach a high spatial resolution and
extract information continuously along the fiber length [13].
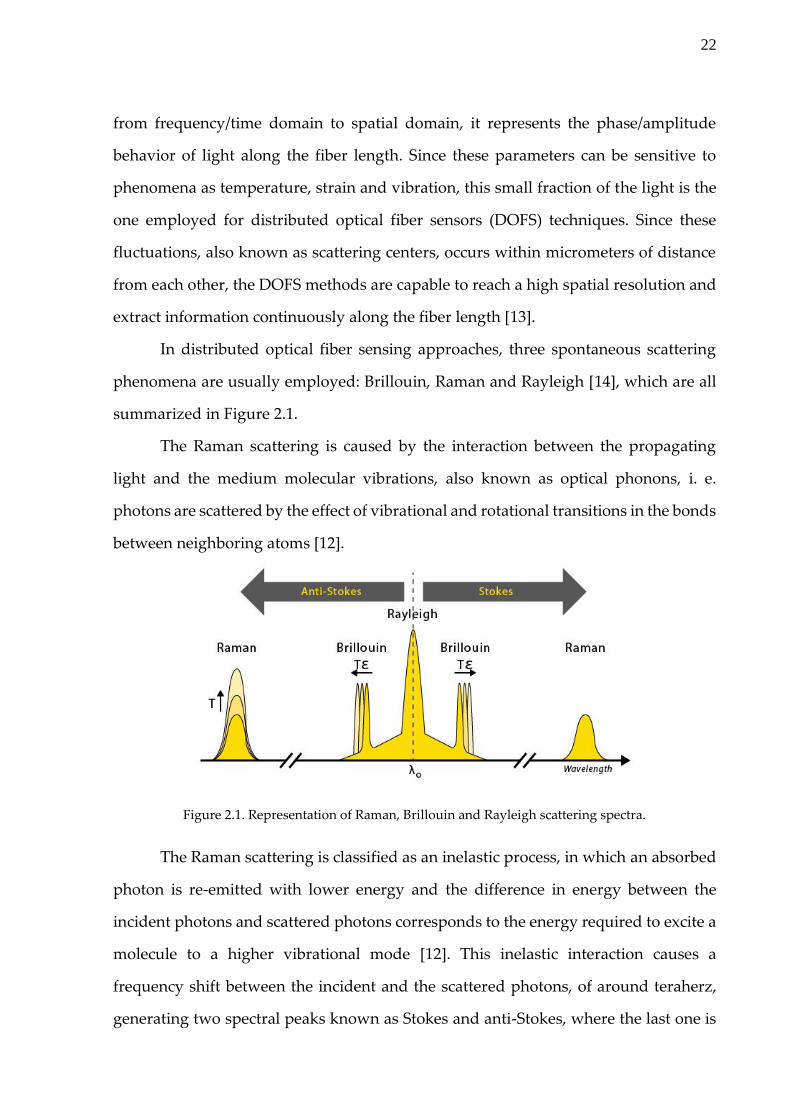
In distributed optical fiber sensing approaches, three spontaneous scattering
phenomena are usually employed: Brillouin, Raman and Rayleigh [14], which are all
summarized in Figure 2.1.
The Raman scattering is caused by the interaction between the propagating
light and the medium molecular vibrations, also known as optical phonons, i. e.
photons are scattered by the effect of vibrational and rotational transitions in the bonds
between neighboring atoms [12].
Figure 2.1. Representation of Raman, Brillouin and Rayleigh scattering spectra.
The Raman scattering is classified as an inelastic process, in which an absorbed
photon is re-emitted with lower energy and the difference in energy between the
incident photons and scattered photons corresponds to the energy required to excite a
molecule to a higher vibrational mode [12]. This inelastic interaction causes a
frequency shift between the incident and the scattered photons, of around teraherz,
generating two spectral peaks known as Stokes and anti-Stokes, where the last one is
23
sensitive to temperature changes while the other is not. Thus, the Raman
backscattering is widely employed for temperature sensing but is insensitive to strain
or vibration monitoring. Therefore, this scattering type will not be further addressed
in this thesis, which is focused on vibration sensing only.
The Brillouin scattering is also an inelastic process in which part of the power is
lost from the optical wave and absorbed by the transmission medium [15]. However,
in this case the contribution comes from the acoustic phonons, i. e. the phonons in
which the atoms motions are in phase, differing from Raman where the atoms motions
are out of phase. Thus, the Brillouin scattering also generates scattered photons with
shifted frequencies when compared to the incident photon, but within gigaherz shift
only, as depicted in Figure 2. This Brillouin backscattered light is sensitive to
temperature and strain [12] and some applications in DOFS involve the simultaneous
measurement of strain and temperature. However, the dynamic strain measurements,
i. e. the capacity of measuring vibrations of solutions based on this scattering are very
limited when compared to Rayleigh based solutions [12].
The Rayleigh scattering, the basis phenomenon for the phase-OTDR technique,
is an elastic process. In this situation, the incident and scattered photons have the same
energy, thus the same frequency [11]. This scattering type is caused by the optical fiber
density fluctuations with a size much smaller than the propagating light wavelength,
usually less than 10% [16]. Part of the scattered light backscatters and, when analyzed
at the sensor receiver-side, delivers a curve that represents the light intensity along the
fiber length.
This elastic scattering has been widely used for temperature, strain,
polarization-mode dispersion (PMD), vibration and attenuation sensing, for both
telecommunications and sensors applications. It has been explored in techniques such
as Optical Frequency Domain Reflectometer (OFDR), Optical Time Domain
Reflectometer (OTDR), polarization-OTDR (pOTDR) and phase-OTDR [12]. The last
one, explored for dynamic disturbances detection since the 90’s, is the main subject
explored and will be further addressed in this chapter.

24
Since the understanding of the Rayleigh scattering mechanism is demanding for the
comprehension of the phase-OTDR technique for vibration sensing, the next section is
fully dedicated to exploring its theoretical fundaments and applications.
2.2. THE RAYLEIGH SCATTERING THEORY
In a medium like an optical fiber, its molecules are immersed in a strong internal
electromagnetic field. This field is responsible for the constant readjust of the
molecules’ electron clouds. These readjustments cause a chain reaction that propagates
to the neighboring molecules, causing local charge density changes [11]. Thus,
fluctuations in the molecule position in the medium are observed in distances in the
fiber in the order of some hundreds of nanometers, which is around ten times a
molecule size and smaller than the propagating light wavelength. These fluctuations
result in an inhomogeneity of the fiber refractive index along its length, in points called
scattering centers [17].
When light propagates into an optical fiber, its electromagnetic field rearranges
the orientation of these fluctuating molecular electron clouds in the scattering centers,
causing a joint response to the electromagnetic field that results in light scattering in
all directions [18], as shown in Figure 2.2.
Figure 2.2. Illustration of the backscattering concept in optical fibers, highlighting the presence of the
Rayleigh scattering centers.

25
Some of the scattered light is collected by the optical fiber and guided in the
backward direction, a fraction of light called backscattering.
In general, the optical characteristics of scattering depend on the size of scatter
in comparison to the optical signal wavelength. In optical fibers, the scatter, i. e. the
refractive index fluctuations, are usually smaller than the optical signal wavelength,
which explains the presence of the Rayleigh scattering. This scattering causes a
continuously decrease in the power of the propagating light beam along the optical
fiber. The shorter the wavelength, λ, the stronger the Rayleigh scattering coefficient,
which can be expressed for silica optical fibers according to the following equation
[11]:
𝛼𝑅 =𝐾
𝜆4 (2.1)
where K is a constant that depends on the fiber core composition and it ranges around
0.7 ~ 0.9 (dB/km)μm4.
Regarding the total loss in optical fibers, expressed in dB/km, it can be caused
by both the Rayleigh scattering and the material absorption phenomenon coefficient,
αA. Thus, the total attenuation coefficient, αT, can be represented as following [11]:
𝛼𝑇 = 𝛼𝑅 + 𝛼𝐴 (2.2)
Also, the input optical power attenuation along the optical fiber length, which
exhibits an exponential pattern, can be expressed according to the equation below:
𝑃(𝑧) = 𝑃0𝑒𝑥𝑝{−∫ [𝛼𝑇(𝑧)]𝑑𝑥𝑧
0} (2.3)
If the Rayleigh scattering in the fiber is modeled by the scattered caused by
every short fiber section of length dz, then the optical power loss due to the scattering
inside this section is:
𝑑𝑃𝑅(𝑧) = 𝑃(𝑧)𝛼𝑅(𝑧)𝑑𝑧 (2.4)
26
However, only a small fraction of this scattered energy is coupled to the
waveguide and propagates back to the optical fiber input side. Therefore, the
backscattered light resulting from each dz section is calculated as follow [19]:
𝑑𝑃𝐵𝑆 = 𝑃(0)𝜂𝛼𝑅(𝑧)𝑑𝑧𝑒𝑥𝑝{−2∫ 𝛼𝑇(𝑥)𝑑𝑥𝑧
0} (2.5)
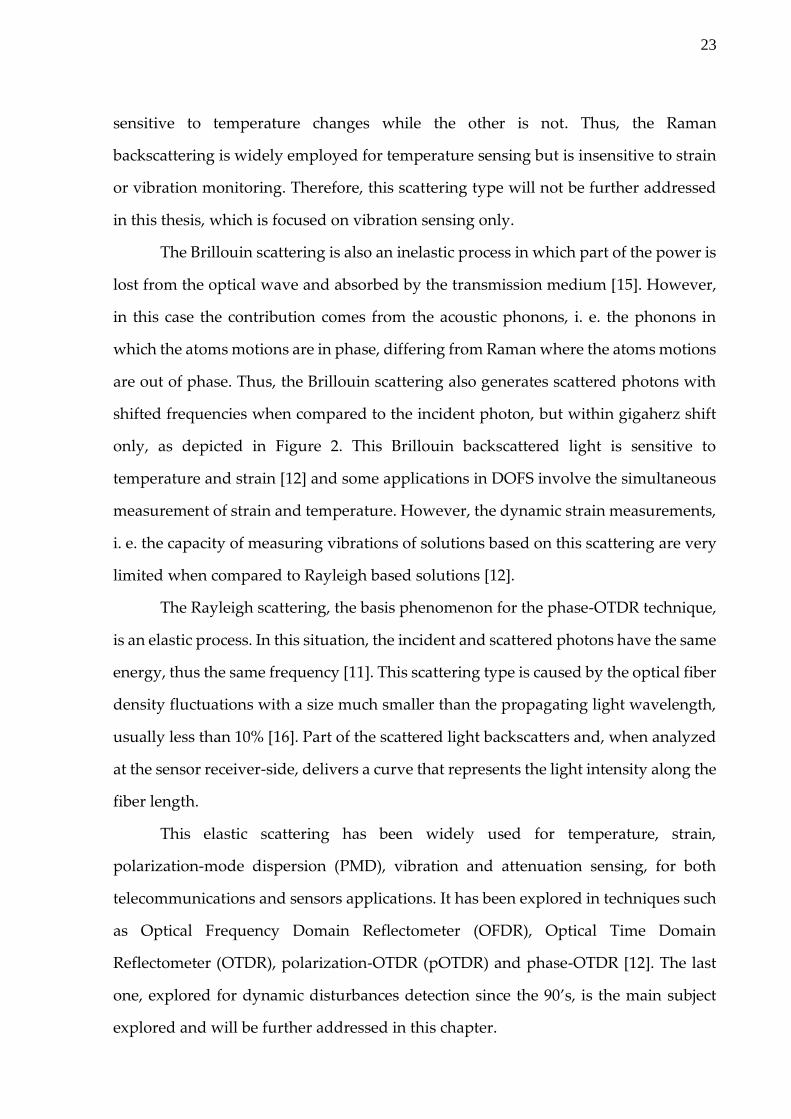
where η is a parameter called conversion efficiency. When Rayleigh scattering occurs
in an optical fiber, each scattering center scatters the light into all directions, filling the
entire 4π solid angle [19]. However, only a small part of the scattered light whose angle
lies within the numerical aperture (NA) can be converted into guided mode inside the
fiber core and become the backscatter that travels back to the fiber input. The rest of
the scattered light will be radiated into the cladding and lost. Thus, the ratio between
the captured light and the total scattered optical power is given by the following
equation [19]:
𝜂 =2𝜋(1−𝑐𝑜𝑠𝜃)
4𝜋=
1−𝑐𝑜𝑠𝜃
2 (2.6)
where 4π is the total area of the unit sphere that represents the scattering center, θ is
the maximum trace angle of the guided mode with respect to the fiber axis and 2π(1-
cosθ) is the area of the spherical cap in the shadowed blue area shown in Figure 2.3.
Figure 2.3. Detailed illustration of the Rayleigh scattering mechanism in optical fiber cores.
The optical fiber NA is the maximum acceptance angle at a fiber optics input:
27
𝑁𝐴 = √𝑛12 − 𝑛2
2 (2.7)
Considering a normalized frequency, V < 2.4, the required for single mode
fibers, the conversion efficiency can be expressed as following [19]:
𝜂 ≈1
4.55(𝑁𝐴
𝑛1) (2.8)
Thus, the amount of captured backscattered light is directly dependent on the
optical fiber numerical aperture. This knowledge is suitable to maximize the
amplitude of the phase-OTDR traces for vibration sensing, as shown in further
chapters.
If an optical pulse of certain width, τ, is launched into an optical fiber at the time t0,
neglecting the effect of chromatic dispersion and fiber nonlinearities, the locations of
the pulse leading and trailing edges at time t are zl = vg(t-t0) and zt = vg(t-t0-τ), where vg
is the optical pulse group velocity [19]. In this case, the backscattered signal, PBS, that
returns to the fiber originated from a short fiber section of length Δz/2 = (zl – zt)/2 = vgτ
has its amplitude defined by the following equation:
𝑃𝐵𝑆(𝑧) = 𝑣𝑔𝜏
2𝑃(0)𝜂𝛼𝑅(𝑧)exp{−2∫ 𝛼𝑇(𝑥)𝑑𝑥
𝑧
0} (2.9)
It is also worthy stressing that the collected backscatter power is usually very
low, ranging around -50 dBm or even lower [19]. The operating principles of the phase-
OTDR technique are explored in the next section.
2.3. THE PHASE-OTDR TECHNIQUE BASED ON
RAYLEIGH SCATTERING
This section stresses about the main principles involved in the phase-OTDR method,
including historical context, basic setup and summarized main applications. In order
to better understand the phase-OTDR operation mechanisms, an overview of the
traditional OTDR method is firstly presented.
28
2.3.1. THE BASIC OTDR METHOD
The parameters that characterize an optical fiber, such as losses and optical power
attenuation can be modified due to environmental conditions: humidity, temperature,
mechanical stress, vibrations, among others. These properties were always of interest
in installed optical fiber communication cables, since the attenuation profile of an
optical fiber determines directly its loss, affecting the transmission system quality.
In this context, the traditional and oldest method to measure insertion loss in
optical fibers is also a very destructive one, since it requires the fiber link to be cut in
tracks and the loss measured in the end of each track [19]. This method was widely
used until 1976, where Barnoski and Jensen, the authors of the first publication
regarding backscattering in optical waveguides [20] proved the application of the
scattering phenomenon in optical monitoring. They developed, thus, the first OTDR,
a distributed method sensitive enough to measure Rayleigh backscatter in optical
fibers within hundreds of kilometers of range, a spatial resolution that nowadays can
achieve centimeters and requires access to one fiber ending only.
The OTDR analysis techniques also evolved along the decades in such way that
now this distributed monitoring method is widely used for optical network
monitoring, measuring the attenuation of the transmitted signal along the fiber length
and detecting undesirable events such as insertion loss, splice loss, bending and bad
connections [19].
A basic OTDR setup is depicted in Figure 2.4.
29
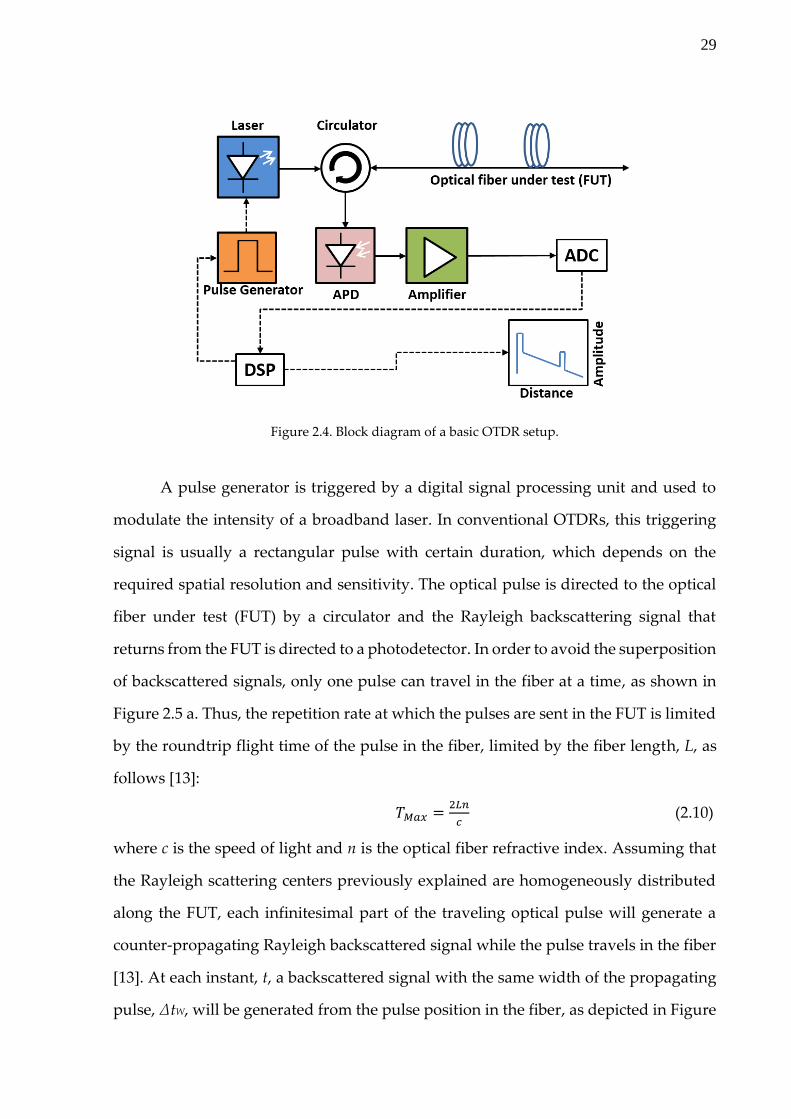
Figure 2.4. Block diagram of a basic OTDR setup.
A pulse generator is triggered by a digital signal processing unit and used to
modulate the intensity of a broadband laser. In conventional OTDRs, this triggering
signal is usually a rectangular pulse with certain duration, which depends on the
required spatial resolution and sensitivity. The optical pulse is directed to the optical
fiber under test (FUT) by a circulator and the Rayleigh backscattering signal that
returns from the FUT is directed to a photodetector. In order to avoid the superposition
of backscattered signals, only one pulse can travel in the fiber at a time, as shown in
Figure 2.5 a. Thus, the repetition rate at which the pulses are sent in the FUT is limited
by the roundtrip flight time of the pulse in the fiber, limited by the fiber length, L, as
follows [13]:
𝑇𝑀𝑎𝑥 =2𝐿𝑛
𝑐 (2.10)
where c is the speed of light and n is the optical fiber refractive index. Assuming that
the Rayleigh scattering centers previously explained are homogeneously distributed
along the FUT, each infinitesimal part of the traveling optical pulse will generate a
counter-propagating Rayleigh backscattered signal while the pulse travels in the fiber
[13]. At each instant, t, a backscattered signal with the same width of the propagating
pulse, ΔtW, will be generated from the pulse position in the fiber, as depicted in Figure
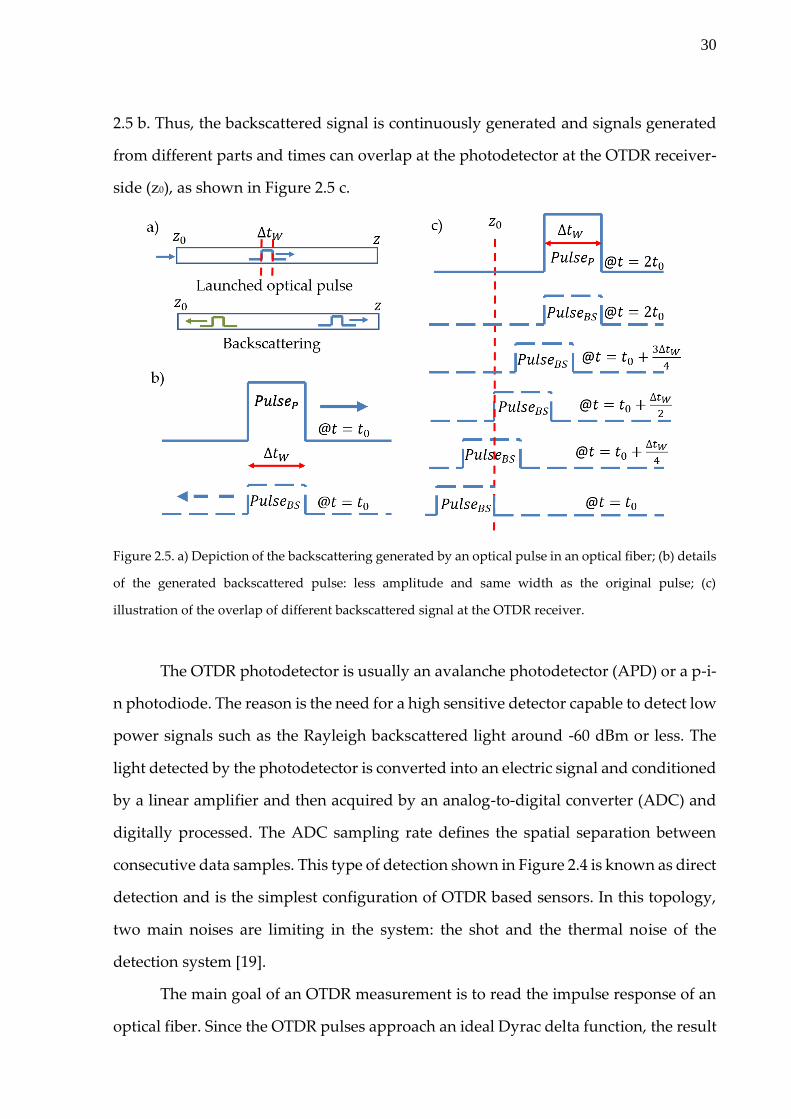
30
2.5 b. Thus, the backscattered signal is continuously generated and signals generated
from different parts and times can overlap at the photodetector at the OTDR receiver-
side (z0), as shown in Figure 2.5 c.
Figure 2.5. a) Depiction of the backscattering generated by an optical pulse in an optical fiber; (b) details
of the generated backscattered pulse: less amplitude and same width as the original pulse; (c)
illustration of the overlap of different backscattered signal at the OTDR receiver.
The OTDR photodetector is usually an avalanche photodetector (APD) or a p-i-
n photodiode. The reason is the need for a high sensitive detector capable to detect low
power signals such as the Rayleigh backscattered light around -60 dBm or less. The
light detected by the photodetector is converted into an electric signal and conditioned
by a linear amplifier and then acquired by an analog-to-digital converter (ADC) and
digitally processed. The ADC sampling rate defines the spatial separation between
consecutive data samples. This type of detection shown in Figure 2.4 is known as direct
detection and is the simplest configuration of OTDR based sensors. In this topology,
two main noises are limiting in the system: the shot and the thermal noise of the
detection system [19].
The main goal of an OTDR measurement is to read the impulse response of an
optical fiber. Since the OTDR pulses approach an ideal Dyrac delta function, the result
31
is a convolution between the fiber response and a pulse of finite temporal duration,
resulting in a smoothed version of the impulse response.
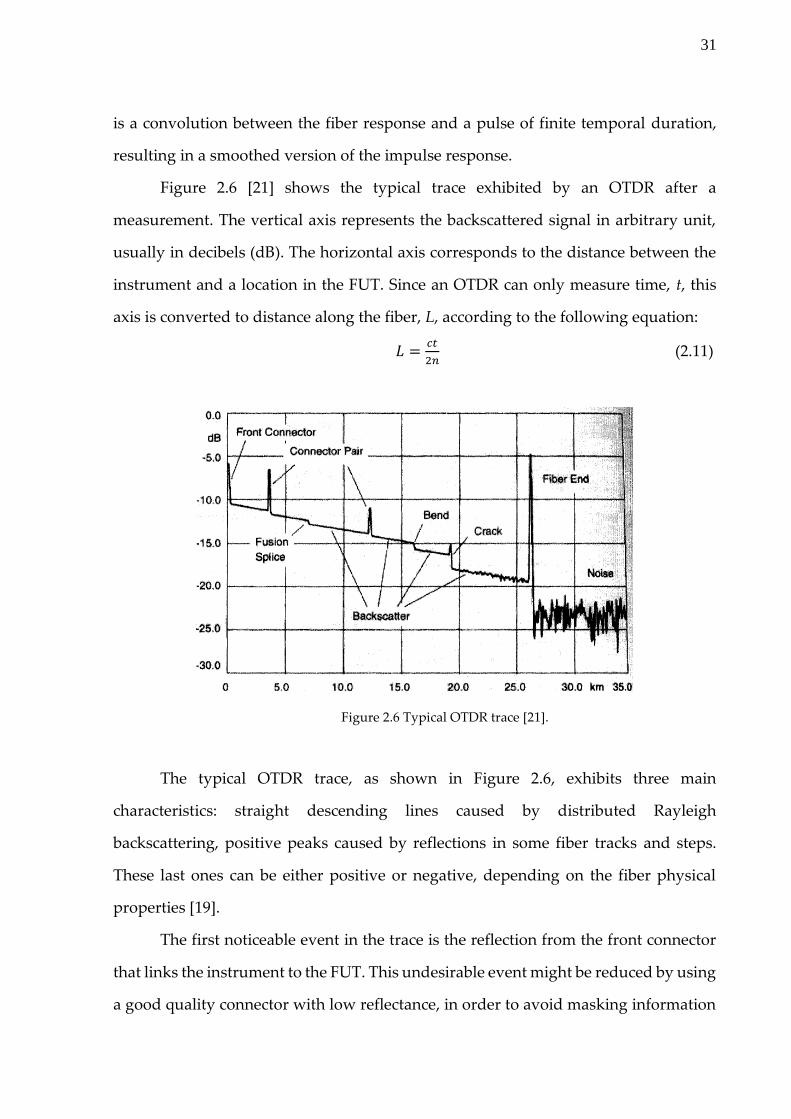
Figure 2.6 [21] shows the typical trace exhibited by an OTDR after a
measurement. The vertical axis represents the backscattered signal in arbitrary unit,
usually in decibels (dB). The horizontal axis corresponds to the distance between the
instrument and a location in the FUT. Since an OTDR can only measure time, t, this
axis is converted to distance along the fiber, L, according to the following equation:
𝐿 =𝑐𝑡
2𝑛 (2.11)
Figure 2.6 Typical OTDR trace [21].
The typical OTDR trace, as shown in Figure 2.6, exhibits three main
characteristics: straight descending lines caused by distributed Rayleigh
backscattering, positive peaks caused by reflections in some fiber tracks and steps.
These last ones can be either positive or negative, depending on the fiber physical
properties [19].
The first noticeable event in the trace is the reflection from the front connector
that links the instrument to the FUT. This undesirable event might be reduced by using
a good quality connector with low reflectance, in order to avoid masking information
32
from the beginning of the fiber. An unsuitable connector reduces the launched optical
power in the fiber due to insertion loss and might cause a new reflection in the
backscattered light, generating the so called “ghost patterns” [19]. These patterns are
characterized as peaks that doesn’t represent a feature of the fiber itself and might be
minimized by using angled physical contact (APC) connectors instead of physical
contact (PC).
Since the OTDR traces represent optical power versus distance, the trace slopes
provide the fiber attenuation in dB/km. Splices between two optical links cause a
reduce of the backscattered optical power level and if both links are the same fiber
type, then the insertion loss value is determined by this drop. Another event shown in
the OTDR trace are the fiber twists and bends, which result in the reflection of part of
the propagating light to outside of the fiber core and cladding, causing a power loss.
Another remarkable event is a crack between two fiber links, resulting in a small
air gap between then and, consequently, in a high reflection and an abrupt slop in the
optical power level. Lastly, there is the remote fiber end, an open ending responsible
for causing an intense reflection. It there is a transition between fiber and air after this
ending, more than 4% of the propagating signal optical power can be reflected to the
OTDR input. No optical signal is detected beyond the fiber end, thus the OTDR curve
experiences an attenuation to the receiver noise level, limiting the lowest power level
capable to be detected by the instrument.
The characterization of an optical fiber using an OTDR is based in three
parameters: dynamic range, dead zone and spatial resolution. The dynamic range is
the difference between the backscattered signal level in the input of the fiber and the
noise level where the signal-to-noise ratio (SNR) is equal to 1 dB. This parameter is
dependent on the OTDR launched pulse width and determines the maximum fiber
length possible to be measured by the OTDR, considering the attenuation in the fiber
itself and in the splices and connections. There is a trade-off between dynamic range,
pulse width and spatial resolution: the shorter the pulse width, the higher the spatial
resolution, the smaller the pulse energy and thus the shorter the dynamic range.
33
The spatial resolution, ΔSR, indicates the precision that the OTDR provides the
location of the events long the optical fiber length. This parameter is defined by the
pulse width, ΔtW, and is expressed as follows [13]:
∆𝑆𝑅 =𝑐𝛥𝑡𝑊
2𝑛 (2.12)
It is worth stressing that a high spatial resolution requires narrow optical pulses,
which demands a broader bandwidth in the photodetector at receiver-side of the
instrument, increasing its total cost [19]. The last parameter is the dead zone, which is
caused by the reflections in the beginning of the FUT that saturate the OTDR receiver
system. When these reflections occur, the returned signal is then superimposed at the
receiver-side due to saturation caused by the high-power reflections, resulting in an
information loss concerning the beginning of the fiber. The dead zone depends on the
pulse width, wavelength, receiver bandwidth and optical fiber reflectance.
All the parameters and features shown in this section about an OTDR also suits
a phase-OTDR as well. The only difference is the use of a narrow linewidth laser in a
phase-OTDR instead of a broadband one usually employed in the OTDR setup. This
characteristic as well as the phase-OTDR principle of operation will be explained in
next section.
2.3.2. FUNDAMENTALS OF THE PHASE-OTDR TECHNIQUE
The phase-OTDR was first proposed and demonstrated by W. Lee and H. F. Taylor, in
1993 [22]. It was initially developed and employed as a distributed intrusion sensor
capable to detect and localize disturbances along a perimeter. The reported system is
practically identical to a common OTDR already shown in Figure 2.4, the only
difference is the employment of a narrow linewidth laser that presents minimum
frequency shift and thus is very coherent, instead of a broadband light source.
If the coherence length of the phase-OTDR light source is equal or longer than
the spatial width of the probe optical pulse, the backscattered light fields from the
Rayleigh scattering centers will coherently interfere within the pulse, since these fields
maintain a fixed and predictable phase relationship between each other. These
34
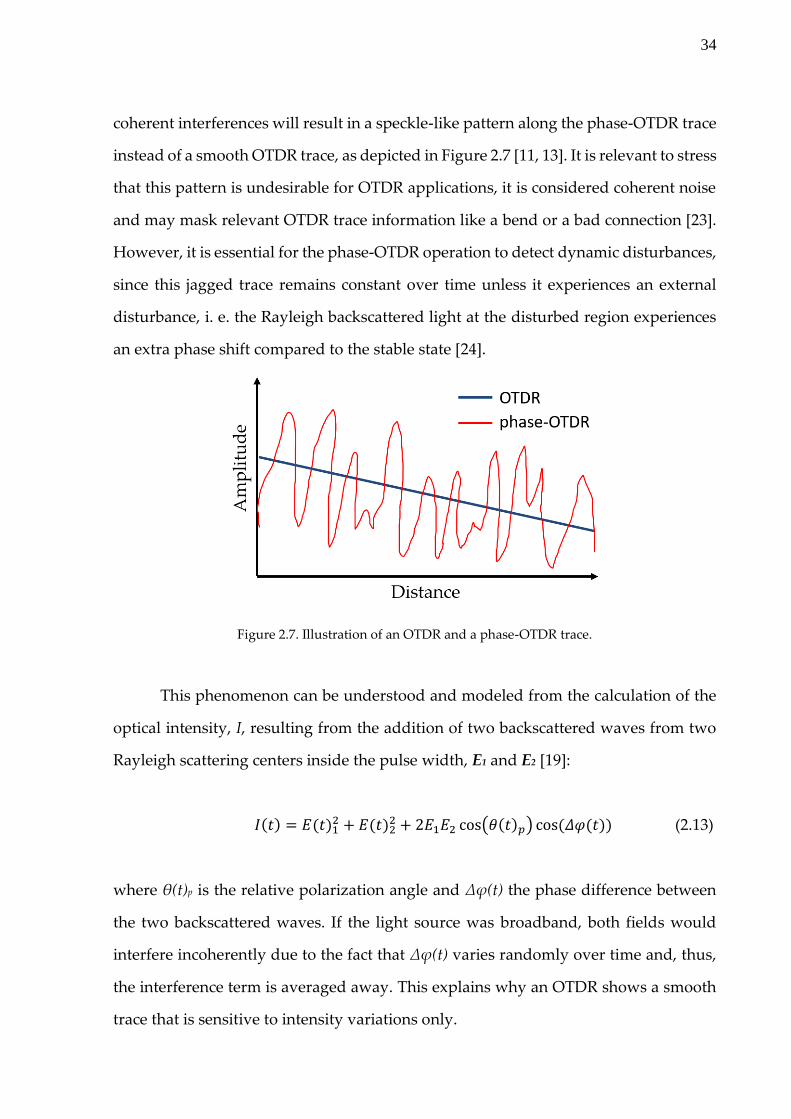
coherent interferences will result in a speckle-like pattern along the phase-OTDR trace
instead of a smooth OTDR trace, as depicted in Figure 2.7 [11, 13]. It is relevant to stress
that this pattern is undesirable for OTDR applications, it is considered coherent noise
and may mask relevant OTDR trace information like a bend or a bad connection [23].
However, it is essential for the phase-OTDR operation to detect dynamic disturbances,
since this jagged trace remains constant over time unless it experiences an external
disturbance, i. e. the Rayleigh backscattered light at the disturbed region experiences
an extra phase shift compared to the stable state [24].
Figure 2.7. Illustration of an OTDR and a phase-OTDR trace.
This phenomenon can be understood and modeled from the calculation of the
optical intensity, I, resulting from the addition of two backscattered waves from two
Rayleigh scattering centers inside the pulse width, E1 and E2 [19]:
𝐼(𝑡) = 𝐸(𝑡)12 + 𝐸(𝑡)2
2 + 2𝐸1𝐸2 cos(𝜃(𝑡)𝑝) cos (𝛥𝜑(𝑡)) (2.13)
where θ(t)p is the relative polarization angle and Δφ(t) the phase difference between
the two backscattered waves. If the light source was broadband, both fields would
interfere incoherently due to the fact that Δφ(t) varies randomly over time and, thus,
the interference term is averaged away. This explains why an OTDR shows a smooth
trace that is sensitive to intensity variations only.
35
On the other hand, if a coherent source was employed, e. g. in a phase-OTDR,
the fields would interfere coherently and the interference terms would have a value
dependent on Δφ(t). Thus, the optical intensity of the resulting interference signal
would be sensitive to variations of the relative phase among the backscattered fields,
caused by external disturbances such as phase shifts caused by vibrations, strain or
temperature, as previously explained.
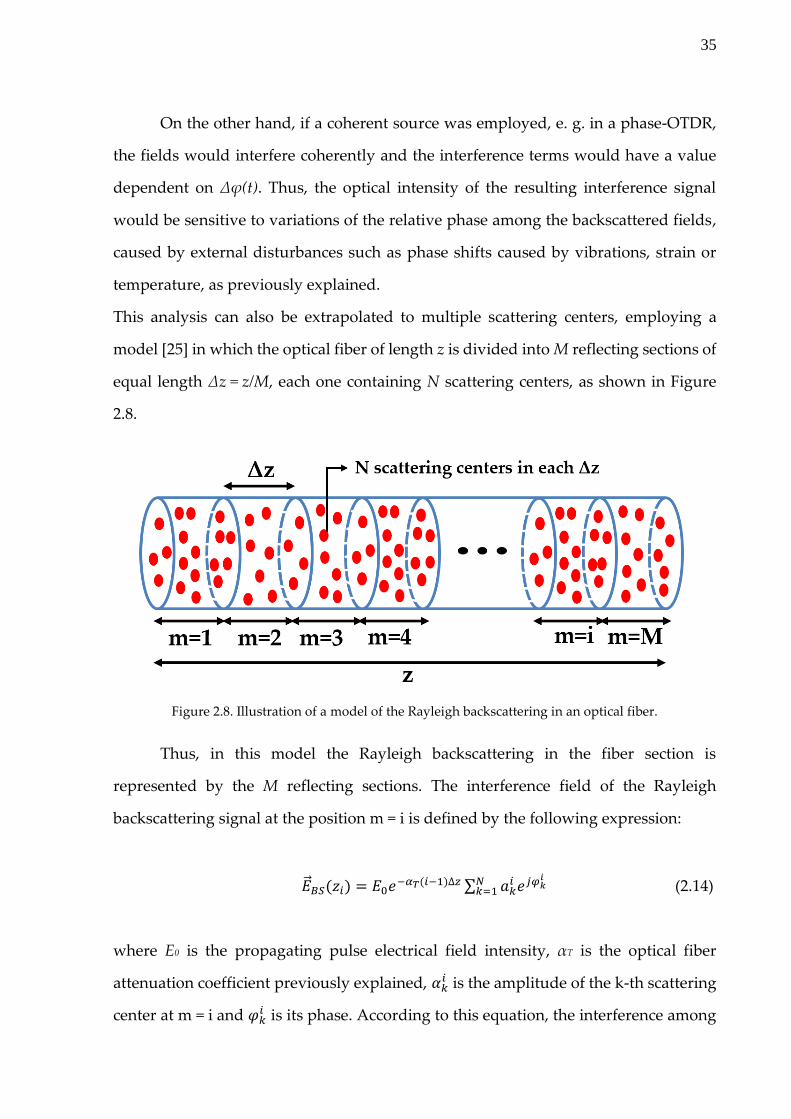
This analysis can also be extrapolated to multiple scattering centers, employing a
model [25] in which the optical fiber of length z is divided into M reflecting sections of
equal length Δz = z/M, each one containing N scattering centers, as shown in Figure
2.8.
Figure 2.8. Illustration of a model of the Rayleigh backscattering in an optical fiber.
Thus, in this model the Rayleigh backscattering in the fiber section is
represented by the M reflecting sections. The interference field of the Rayleigh
backscattering signal at the position m = i is defined by the following expression:
�⃗� 𝐵𝑆(𝑧𝑖) = 𝐸0𝑒−𝛼𝑇(𝑖−1)∆𝑧 ∑ 𝑎𝑘
𝑖 𝑒𝑗𝜑𝑘𝑖𝑁
𝑘=1 (2.14)
where E0 is the propagating pulse electrical field intensity, αT is the optical fiber
attenuation coefficient previously explained, 𝛼𝑘𝑖 is the amplitude of the k-th scattering
center at m = i and 𝜑𝑘𝑖 is its phase. According to this equation, the interference among

36
the Rayleigh backscattering light is represented by the complex sum of the scattering
centers amplitude and phase in each section, which can be interpreted as the spatial
width of the propagating optical pulse. Simulations already presented in literature
using this model show as result typical phase-OTDR traces with a jagged appearance,
as expected, which is due to the random position of the Rayleigh scattering centers
along the optical fiber [25].
It is worthy stressing that the phase-OTDR method presents a non-cumulative
effect in the result traces, i. e. the signal detected from one section in the fiber is totally
independent from another section if the distance between both is not within the sensor
spatial resolution defined by the spatial width of the optical pulse. This concept is
shown in Figure 2.9a, where two consecutive phase-OTDR from before and after a
disturbance in the section between 360 m and 380 m of a 1 km optical fiber are
displayed. It is visible from the figure and from the inset zoom that the trace only
changes where the disturbance is applied. In Figure 2.9b this is even more evident,
since a peak is observed only in the disturbed region of the differential curve between
both traces. This feature is advantageous when compared to cumulative methods such
as the pOTDR, which can detect only where the disturbance begun but not where it
ends.
Figure 2.9. a) Two consecutive phase-OTDR traces: before (blue) and after (red) a disturbance in ~20 m
section (inset) of a 1 km optical fiber; b) Trace resultant from the subtraction of the two-consecutive
phase-OTDR traces.

37
In the case of detecting dynamic disturbances, i. e. mechanical vibrations, the
phase-OTDR trace will show local amplitude variations that are synchronized with the
applied vibration frequency, which makes possible to measure the frequency profile
of the disturbance [27]. In order to do so, several consecutive phase-OTDR traces are
acquired and processed. The time-domain signal is rebuilt from the amplitude
variation of the disturbed point along the traces, as shown in Figure 2.10a, which
shows the time-domain waveform of a 1000 Hz vibration disturbance acquired with
the phase-OTDR technique. Also, Figure 2.10b shows the frequency profile of the
acquired signal, where it is possible to see a high predominant peak at 1000 Hz, as
expected.
The maximum frequency that can be acquired using this technique and
correctly rebuilt is limited by the Nyquist theorem, which stresses that, in theory, a
signal can be rebuilt if it is sampled with a frequency that is at least twice as higher as
the signal’s frequency. Thus, in order to be capable to acquired and rebuilt signals of
20 kHz, for instance, the phase-OTDR pulse frequency must be at least 40 kHz.
However, there is a trade-off between the maximum frequency that can be measured
and the maximum distance achieved by the system: the highest the frequency to be
measured, the highest the required pulse frequency and, thus, the shorter the
maximum fiber length that can be probed.
Figure 2.10. a) Time domain waveform of the 1000 Hz vibration signal measured with the phase-
OTDR technique; b) Frequency profile of this acquired signal.
38
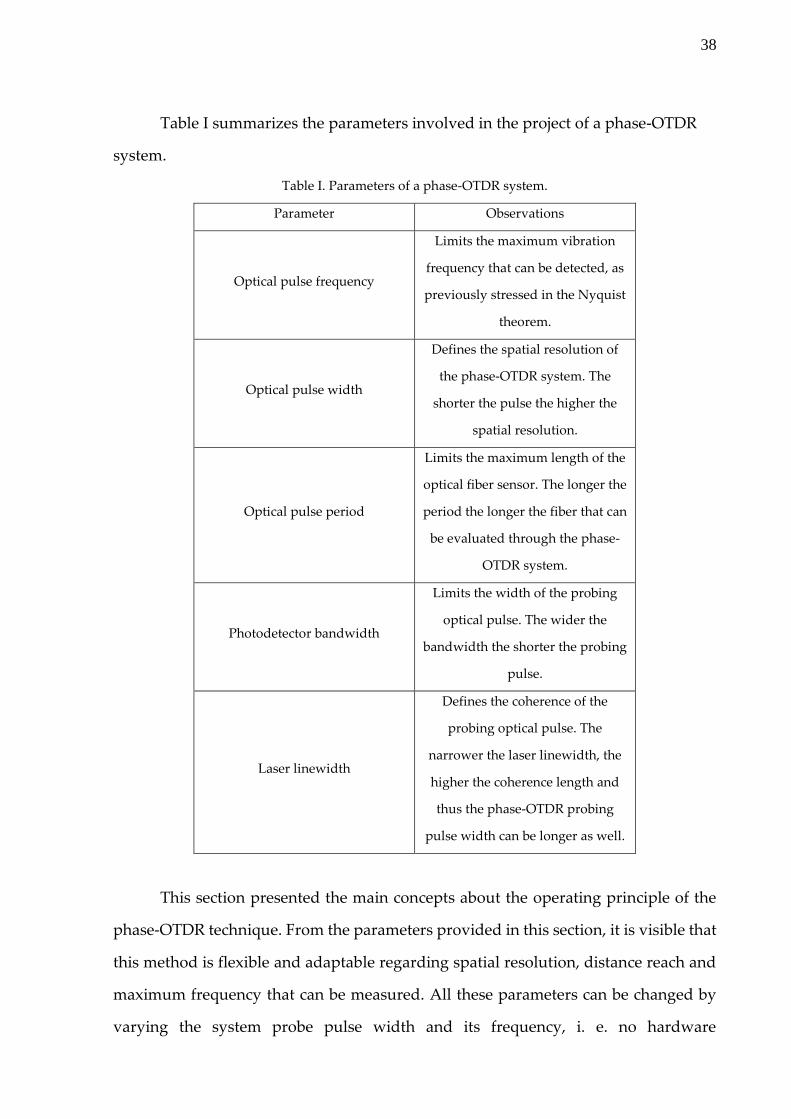
Table I summarizes the parameters involved in the project of a phase-OTDR
system.
Table I. Parameters of a phase-OTDR system.
Parameter Observations
Optical pulse frequency
Limits the maximum vibration
frequency that can be detected, as
previously stressed in the Nyquist
theorem.
Optical pulse width
Defines the spatial resolution of
the phase-OTDR system. The
shorter the pulse the higher the
spatial resolution.
Optical pulse period
Limits the maximum length of the
optical fiber sensor. The longer the
period the longer the fiber that can
be evaluated through the phase-
OTDR system.
Photodetector bandwidth
Limits the width of the probing
optical pulse. The wider the
bandwidth the shorter the probing
pulse.
Laser linewidth
Defines the coherence of the
probing optical pulse. The
narrower the laser linewidth, the
higher the coherence length and
thus the phase-OTDR probing
pulse width can be longer as well.
This section presented the main concepts about the operating principle of the
phase-OTDR technique. From the parameters provided in this section, it is visible that
this method is flexible and adaptable regarding spatial resolution, distance reach and
maximum frequency that can be measured. All these parameters can be changed by
varying the system probe pulse width and its frequency, i. e. no hardware
39
modifications are required. Thus, the phase-OTDR technique flexibility allows it to be
employed for several different applications, from environments when high spatial
resolution and short range are required, e. g. aircraft structural health monitoring, to
situations where long range and short spatial resolution are demanded, for instance,
long perimeters surveillance. Also, this method can be used as a distributed
microphone as well, since it has enough bandwidth to listen to sound from different
sections of the fiber.
The applications mentioned were explored in this thesis and the obtained
results will be show and discussed in further chapters. The next section presents a
literature review of the phase-OTDR method, its applications and how the technique
evolved along the decades, since its first demonstration in the 90’s until the most recent
publications.
2.3.3. LITERATURE REVIEW OF THE PHASE-OTDR METHOD
In 1984, years before the phase-OTDR technique was proposed and demonstrated, the
fading phenomenon was already observed and explained in OTDR methods that
employ coherent detection [23]. In these situations, the use of a narrow linewidth laser
was necessary, which caused the undesirable jagged appearance in the OTDR curve
that could be removed by averaging many independent traces.
Later in the 90’s, as previously mentioned, the phase-OTDR method was
proposed, first in a patent [22] and then in a paper [24], using the fading phenomenon
as a tool to detect local disturbances in an optical fiber, a feature not achieved by a
common OTDR. The employed setup was simple, basically a normal OTDR with a
long coherence length light source, and the obtained results were still course:
qualitative detection and location of intrusion in a 9 km length optical fiber with 400
m of spatial resolution.
After the first publication, several proposals were presented in order to improve
and sophisticated this distributed acoustic sensor system. In 2005, a phase-OTDR
based DAS for intrusion detection was demonstrated [27]. In this work, a fiber laser
40
with very narrow linewidth (~3 kHz) was built in the laboratory. The setup was tested
both in laboratory and on field, by burying a 44 m section of 14 km of optical fiber at
20 cm depth. Intrusions caused by an 80 kg person stepping in the ground above the
cable were detected within 2 km of spatial resolution. It was concluded that this
technique could represent a low-cost perimeter security for nuclear power plants,
electrical power distribution centers, storage facilities, military bases, national borders,
among others.
Later in 2007, the same authors published a field test [28] with the same
developed system in desert terrain, where 19 km of optical fiber were monitored in
real time by detecting intruders on foot and on vehicles traveling down a road near
the cable line. It was observed a sensitivity change by the factor of 4 between different
sections of the fiber under test, which was credited to the differences in the cable
installation: burial depth, tension or tautness of the cable.
Also in 2007, a brief publication [29] showed that the digital signal processing
(DSP) of the detected phase-OTDR traces can be used to identify specific signature
characteristics for different types of intruders. Thus, this publication suggested a joint
work between this optical sensor method and computational pattern identification
techniques, an approach that would be largely employed in the next decades.
In 2008, a distributed intrusion sensor based on the combination of the phase-
OTDR and the pOTDR techniques was demonstrated. In this proposal, both methods
shared the same optical device and were used together to enhance the veracity of the
intrusion detection. Also, the wavelet transform method [30] and the peak-enhancing
signal processing technique to improve the system performance, testifying once again
the flexibility of the phase-OTDR method to be integrated to DSP approaches.
Ran et al [31] presented in 2009 a scheme to provide security service in passive
optical access networks (PON) using a phase-OTDR system. The method was
employed to detect intrusion close to the optical network cables and the system was
integrated to the PON itself. The only requirement was to choose a wavelength for the
phase-OTDR pulse that is sufficiently far from the upstream and downstream traffic

41
wavelengths. Intrusions along 15 km of optical fiber network were successfully located
with 100 m of spatial resolution. This work proved that this distributed sensing
technique can be also useful when applied to solve peripheric issues in
telecommunications systems.
In 2010, a novel DAS scheme based on coherent detection of phase-OTDR was
demonstrated [26], employing also two DSP techniques called moving averaging and
moving differential to the acquired traces. In this work, pencil break measurements
were used to emulate the acoustic emission of cracks in concrete or steel bridges for
early crack identification, thus a useful tool for SHM. The best spatial resolution
achieved is 5 m. The use of heterpodyne detection improved the SNR of the detected
vibration when compared to direct detection, thus increasing the sensor sensitivity,
while the DSP methods reduced the noise power and increased the frequency response
range of the sensor. So far, the phase-OTDR was used only to detect intrusions,
without exploiting the frequency information of the disturbance. Thus, this work
innovates by showing frequency measurements of up to 1000 Hz and also by
employing coherent detection in a phase-OTDR system for the first time.
Another coherent detection based DAS was proposed in 2011 [32]. In this work,
it was possible to recover the phase of the disturbing signal by using heterodyne
detection. The paper also stresses that, when using this type of detection, the phase
noise of the laser source becomes an overwhelming noise factor to the measured phase
as the fiber length increases. In order to reduce the influence of this noise, the coherent
performance of the laser must be enhanced. The authors did so by developing an ultra-
low frequency noise narrow linewidth laser source. Also, it is stated that both the
interference within pulse duration and the polarization state rotation lead to fading in
the beat signal, causing a low SNR where the phase could be hardly demodulated. In
order to overcome this issue, the phase modulated paired pulse technique was
employed in this work. By injecting paired pulses in the fiber, the detected beat signal
is the result of the combination of the two pulses and the local oscillator. For single
pulse injection, signal fading is inevitable because the inner-pulse interference result

42
is random, while for paired pulse case, the fading problem could be overcome by
transforming the random inner pulse interference to controllable pulse-pulse
interference.
In 2012, Z. Qin et al achieved a 20 cm spatial resolution in a phase-OTDR system
[33]. The authors also employed coherent detection and a DSP method, the continuous
wavelet transform, to process the DAS signal, where they could evaluate the evolution
of the vibration frequency value along time at a specific point in the optical fiber. This
technique was capable to provide simultaneously the frequency and time information
of the vibration event. Also, a novel DSP method called global wavelet power
spectrum was used to find the location of the disturbance. These tools are proven to
be useful to evaluate vibration events in SHM applications, e. g. for damage detection
in civil or mechanical structures, through the analysis of its frequency profile
evolution.
Another approach that explored the use of DSP methods in phase-OTDR
systems for disturbance detection was reported in 2013 [34]. In this reference, the SNR
and spatial resolution of the sensor is enhanced by employing the Sobel filtering
technique and the two-dimensional edge detection method. As result, when the pulse
width was 50 ns, 3 m spatial resolution and 8.4 dB SNR was achieved, testifying the
approach capability to enhance de performance of phase-OTDR based sensors.
Also in 2013, H. Martins et al [35] presented a direct detection phase-OTDR
scheme to measured ultrasonic vibrations. The main novelty of the system is the use
of a semiconductor optical amplifier (SOA) to modulate the probing optical pulse. This
feature allows to achieve high extinction rate (ER) between pump pulses, decreasing
the setup intra-band coherent noise. This paper also presents the concept of visibility
in the phase-OTDR traces, which is defined as the ratio between the subtraction of the
minimum trace value from the maximum and the addition of both. The highest the
visibility of the trace, the better the vibration measurement quality and its reliability.
For the first time, vibrations up to 39.5 kHz were measured with the phase-OTDR
method in a range that could achieve 1.25 km of distance.

43
In the same year, T. Zhu et al proposed for the first time a DAS that merged a
phase-OTDR setup and a Mach-Zehnder interferometer [36]. Vibration measurement
with high-frequency response and high spatial resolution was demonstrated, where
modulated pulses were proposed to be used as sensing source. Frequency response
and location information were obtained by Mach-Zehnder interferometer and phase-
OTDR technology, respectively. In order to simulate high-frequency vibration of crack
of cable and civil structure, experiments on detection of piezoelectric transducer and
pencil-break were carried out. Spatial resolution of 5 m and the maximum frequency
response of ~3 MHz were achieved in 1064 m fiber link when the narrow pulse width
is 50 ns. So far, this was the highest frequency capable to be measured by a phase-
OTDR based sensor.
A work published in 2014 [37] investigated the influences of the laser source in
phase-OTDR distributed intrusion sensors. A numerical simulation was performed to
illustrate the relationships between trace-to-trace fluctuations and frequency drift rate
as well as pulse width, and fluctuations ratio coefficient (FRC) was proposed to
evaluate the level of trace-to-trace fluctuations. The simulation results show that the
FRC grows with increasing frequency drift rate and pulse width, reaches, and
maintains the peak value when the frequency drift rate and/or the pulse width are high
enough. Furthermore, experiments were implemented using a phase-OTDR prototype
with a low frequency drift laser (<5 MHz∕min), of which the high frequency drift rate
is simulated by frequency sweeping. The good agreement of experimental with
simulated results in the region of high frequency drift rate validates the theoretical
analysis, and the huge differences between them in the region of low frequency drift
rate indicate the place of laser frequency drift among system noises. The conclusion is
useful for choosing laser sources and improving the performance of phase-OTDR.
Still in 2014, an extension of the sensing range of the phase-OTDR technique to
up to 100 km was experimentally demonstrated by employing counter pumping fiber
Brillouin amplification (FBA) [38]. Also, the effect of pump frequency variation was
studied, and the system shows reasonable robustness. It should be noted that further
44
extension of the sensing range can be envisioned by combining counter pumping
Brillouin amplification with co-pumping Raman amplification (the first-order or
higher-order Raman amplification). In summary, this work shows great potential for
FBA to be adopted in many other distributed fiber-optic sensing systems.
Another type of amplification, Raman amplification, was also used in 2014 for
increasing the range of a phase-OTDR based DAS to 125 km, the highest achieved so
far [39]. In this study, the authors presented an experimental and theoretical
description of the use of first-order Raman amplification to improve the performance
of a phase-OTDR when used for vibration measurements. The evolution of the φOTDR
signal along the fiber is shown to have a good agreement with the theoretical model
for different Raman pump powers. The Raman amplification combined with the noise
reduction provided by using balanced detection, an SOA and an optical switch allows
to greatly increase the SNR and sensing range of the phase-OTDR. The sensor was able
to detect vibrations of up to 250/300 Hz in a distance of 125/110 km with a resolution
of 10 m and no post-processing. This sensor could be used in the monitoring of
intrusions in large structures such as national borders or pipelines, thus being useful
for both SHM and surveillance applications. However, use of bi-directional Raman
pumping is a clear drawback in this setup, as access to both fiber ends is required.
This distance record was overcome also in 2014 by Peng et al [40], that presented
an ultra-long phase-OTDR capable to achieve high-sensitivity intrusion detection over
131.5km fiber with high spatial resolution of 8m, which is the longest phase-OTDR
reported to date, to the best of our knowledge. It is found that the combination of
distributed Raman amplification with heterodyne detection can extend the sensing
distance and enhances the sensitivity substantially, leading to the realization of ultra-
long phase-OTDR with high sensitivity and spatial resolution. Furthermore, the
feasibility of applying such an ultra-long phase-OTDR to pipeline security monitoring
is demonstrated and the features of intrusion signal can be extracted with improved
SNR by using the wavelet detrending/denoising method proposed.

45
In another reported work [41], the phase-OTDR method was also merged to a
Michelson interferometer for acoustic measurement. Phase, amplitude, frequency
response and location information could be directly obtained at the same time by using
the passive 3×3 coupler demodulation. Experiments on detection of two piezoelectric
transducers within 200 m detection fibers were carried out. The result shows that the
system could well describe each piezoelectric transducer with different intensity,
respectively. The system offered a versatile new tool for acoustic sensing and imaging,
such as through the formation of a massive acoustic camera/telescope. This proposed
technology can be used for surface, seabed and downhole measurements, being useful
for both SHM and surveillance applications.
In 2015, a technique to separate and determine the disturbing signals in phase-
OTDR was proposed [42]. It is known that a phase-OTDR system is easy to be
interfered by ambient noises, and the nonlinear coherent addition of different
interferences always makes it difficult to detect real human intrusions and causes high
nuisance alarm rates (NARs) in practical applications. In this paper, a temporal signal
separation and determination method is proposed to improve its detection
performance in noisy environments. Unlike the conventional analysis of transverse
spatial signals, the time-evolving sensing signal of phase-OTDR system was at first
obtained for each spatial point by accumulating the changing OTDR traces at different
moments. Then, its longitudinal temporal signal was decomposed and analyzed by a
multi-scale wavelet decomposition method. By selectively recombining the
corresponding scale components, it could extract human intrusion signals, and
separate the influences of slow change of the system and other environmental
interferences. Compared with the conventional differentiation way and fast Fourier
transformation denoising method, the SNRs of the detecting signals for the proposed
method was raised by up to ∼35 dB for the best case. Moreover, from the decomposed
components, different event signals could be effectively determined by their energy
distribution features, and the NAR can be controlled to be less than 2% in the test.
46
In the same year, a phase-OTDR system based on phase-generated carrier
algorithm was demonstrated [43]. In this work, an unbalanced Michelson
interferometer was introduced at the receiving end of the system. The Rayleigh
backscattering light from a certain position along the sensing fiber interfered to
generate interference light signal over time, whose phase carries the sensing
information. Phase-generated carrier demodulation algorithm was proposed and
carried out to recover the phase information. A single frequency vibration event was
applied to a certain position along the sensing fiber and demodulated correctly. The
noise level of the phase-OTDR system was about 3 × 10⁻³ rad/√Hz and a signal to noise
ratio about 30.45 dB was achieved. The maximum sensing length and the spatial
resolution of the phase-OTDR system was 10 km and 6 m with pulse repetition rate at
10 kHz and 6 m fiber delay in MI with interrogating pulse width of 30 ns. Thus, this
work is one more successful joint application of the phase-OTDR technique with DSP
methods.
Also in 2015, a distributed fiber microphone based on phase-OTDR and
employing coherent detection was demonstrated [44]. The authors employed coherent
detection and performed a comparison study of two different sensing topologies: the
sensing fiber as a suspended loop and as a flat package, glued to a metal sheet. It was
verified that the last option was the most sensitive and thus the better choice. The
multiplexing capability of the microphone was proven with 1.2 km sensing range and
5 m spatial resolution. Human voice was detected and reproduced, indicating a
promising solution for acoustic waves detection.
In 2016, C. Baker et al presented a novel approach for the generation of high
extinction-ratio square pulses based on self-phase modulation of sinusoid modulated
optical signals (SMOS) [45]. A SMOS in a nonlinear medium experiences self-phase
modulation induced by the nonlinear Kerr effect leading to the generation of distinct
sidebands. A small variation in the peak power of the SMOS leads to a large variation
in the power of the sidebands. Impressing a square pulse on the SMOS and filtering a
sideband component results in a higher extinction-ratio square pulse. The advantage
47
of high extinction-ratio pulses was demonstrated by a reduced background noise level
in the Rayleigh backscattering traces of a phase-OTDR vibration measurement system.
In the same year, M. Zhang et al demonstrated a method to enhance the
performance of DAS systems based on phase-OTDR by using a narrow linewidth light
source and signal processing [46]. They employed a combination of segmented
unwrapping algorithm, averaging estimation of phase difference, and infinite impulse
response (IIR) filtering method. The enhancement of the signal quality was
numerically demonstrated, and they also studied the influence resulted from the light
source noise on the phase-OTDR performance. The result has shown that when the
linewidth of light source used in the phase-OTDR system is narrower, the performance
of the system is better. Such a phase-OTDR system could obtain higher quality
demodulated signals when the narrower linewidth light source is chosen and the
method of averaging estimation phase difference is used. Also, the averaging
estimation of phase difference algorithm proved to be more efficient than the
traditional method of the direct phase difference for different linewidths.
Also in 2016, a disruptive modulated-pulse based high spatial resolution
distributed fiber system for multi-parameter sensing was proposed [47]. The authors
demonstrated a hybrid distributed fiber sensing system which is the integration of
phase-OTDR and Brillouin optical time domain reflectometry (B-OTDR). This system
enabled the measurement of vibration, temperature and strain. Exploiting the fast
changing property of vibration and the static property of temperature and strain, the
laser pulse width and intensity were modulated and then injected into the single-mode
sensing fiber proportionally, so that the three concerned parameters could be extracted
simultaneously by only one photo-detector and data acquisition channel. Combining
with advanced data processing methods, the modulation of laser pulse brought
additional advantages because of trade and balance between the backscattering light
power and nonlinear effect noise, which enhanced the signal-to-noise ratio, and
enabled sub-meter level spatial resolution together with long sensing distance. The
proposed method realized up to 4.8 kHz vibration sensing with 3 m spatial resolution

48
at 10 km standard single-mode fiber. And measurements of the distributed
temperature and stress profile along the same fiber with 80 cm spatial resolution were
also achieved concurrently.
Another disruptive phase-OTDR setup modification was also demonstrated in
2016 by A. Garcia-Ruiz [48]. So far, the optical pulses used in phase-OTDR were
typically engineered to have a constant phase along the pulse. In this work, it was
demonstrated that by acting on the phase profile of the optical pulses, it is possible to
introduce important conceptual and practical changes to the traditional phase-OTDR
operation, thus opening a door for new possibilities which are yet to be explored.
Using a phase-OTDR with linearly chirped pulses and direct detection, the distributed
measurement of temperature/strain changes from trace to trace, with 1mK/4nε
resolution, was theoretically and experimentally demonstrated. The measurement
resolution and sensitivity could be tuned by acting on the pulse chirp profile. The
technique does not require a frequency sweep, thus greatly decreasing the
measurement time and complexity of the system, while maintaining the potential for
metric spatial resolutions over tens of kilometers as in conventional phase-OTDR. The
technique allows for dynamic measurements at kHz rates, while maintaining
reliability over several hours.
In 2017, a distributed measurement of acoustic vibration location with
frequency multiplexed phase-OTDR was demonstrated [49]. So far, phase-OTDR
systems couldn’t measure high-frequency vibration whose cycle is shorter than the
repetition time of the OTDR. That is, the maximum detectable frequency depends on
fiber length. In this paper, describe a vibration sensing technique with frequency
division multiplexed (FMD) phase-OTDR that detected the entire distribution of a
high-frequency vibration thus allowing to locate a high-speed vibration point was
presented. The method measured the position, frequency and dynamic change of a
high frequency vibration whose cycle is shorter than the repetition time. Both
frequency and position were visualized simultaneously for a 5-km fiber with an 80-
kHz frequency response and a 20-m spatial resolution.
49
Also in the same year, an evolution of the chirped pulse technique was
demonstrated [50]. In this improved method, the input pulses were temporally
stretched by a suitable dispersive device, and the backscattered traces were re-
compressed in the optical domain prior to detection. This allows to substantially
increase the probe pulse energy, while avoiding nonlinear interaction within the fiber
under test, resulting in an increased SNR without compromising the spatial resolution
of the sensor. This configuration allows for high resolution measurements without the
need for coherent detection or signal post-processing (as required for instance in
OPCR). By compressing in the optical domain with a polarization-insensitive element,
there is no need for phase detection (which is typically polarization dependent). Thus,
this method should exhibit very low polarization dependence. The reported
experiment demonstrated an SNR increase of 20 dB over the traditional phase-OTDR
architecture in a system with 1.8 cm spatial resolution.
The papers briefly reviewed in this section show the growth of the phase-OTDR
method along the years, highlighting the main achievements and enhancements,
Figure 2.11 summarizes the publications in a timeline. It was proven how flexible and
adaptive this method can be, since it is possible to integrate it with other distributed
sensing technologies, such as pOTDR and B-OTDR, and also apply DSP methods to
improve its performance. It was demonstrated that this method can cover a large area
of applications, from SHM, surveillance and also as a distributed microphone, which
can be useful for the other two. The last reports also show the capability of the method
to be used for quantitative measurements of dynamic strain, not anymore limited by
only frequency measurements, while keeping direct detection. Thus, this review
indicates that this method can be seen as a key solution for distributed sensing
technologies.

50
Figure 2.11. Timeline summarizing the main literature publications regarding the phase-OTDR
evolution over time.
2.4. CHAPTER CONCLUSION
This chapter provided an overview about scattering phenomenon in optical fibers for
distributed sensing, presenting the main theoretical fundaments behind the scattering
types: Raman, Rayleigh and Brillouin. The Rayleigh scattering, the phenomenon
explored in this thesis, was emphasized and explained through mathematical and
physical models. After, the operating principle of the phase-OTDR technique was
stressed and a model was also provided for better understand. Lastly, a literature
review was presented, showing the evolution of this Rayleigh scattering based DAS
along the years, in order to stress its multiple capabilities of integration with other
technologies and several applications possibilities in SHM and surveillance.
51
CHAPTER 3
3. MULTIPOINT SIMULTANEOUS
INTRUSION DETECTION FOR
SURVEILLANCE SYSTEMS BASED ON
PHASE-OTDR
In this chapter, the phase-OTDR method for intrusion detection is explored, both in its
most basic setup and in an original contribution where it is merged with Field
Programmable Gate Array (FPGA) architectures. The original results obtained in this
chapter of the thesis were presented and published at the Proceedings of the 14th IEEE
International Conference on Networking, Sensing and Control 2017, Calabria (Italy).
3.1. BACKGROUND ON SURVEILLANCE
APPLICATIONS BASED ON PHASE-OTDR
Perimeter security is an issue of major concern in environments such as: military
facilities, electrical plants, oil pipelines, dams, private properties and others. In these
places, it is necessary a real-time monitoring system to detect invasions in real time,
capable to cover the whole perimeter and to feature spatial resolution that allows
distinguishing between multiple simultaneous intrusion events [51].
Traditional security systems, including seismic sensors, cameras, motion
detectors, and fences, have limited range and several drawbacks. They are deployed
above ground, allowing for them to be seen and giving the intruder a chance of
dodging detection. Power support is also required, which could be challenging in

52
remote locations. Long perimeters increase the number of components necessary,
adding to the overall complexity of the system [52].
In this scenarium, distributed optical fiber sensor solutions suit the above
requirements, since they can cover perimeters of hundreds of kilometers and operate
in hazardous environments such electrical plants. Also, these sensors can be buried a
few feet under the ground and be almost undetectable, unlike the common above
ground solutions [53]. The phase-OTDR method features hundreds of kilometers of
reach, dynamic response to intrusions and the capability to be merged with DSP
techniques in order to improve performance [42]. As shown in Chapter 2, this method
has been widely explored through the decades for surveillance applications.
Figure 3.1 [27] illustrates the concept of the phase-OTDR method applied to intrusion
detection.
Figure 3.1. Depiction of a phase-OTDR technique used for intrusion detecion in surveillance
applications [27].
In this concept, the optical fiber is buried underneath the perimeter to be
monitored, providing remote sensing since the active optoelectronic part of the setup,
i.e. the transmitter and the receiver side, is away from the sensing element itself, e.g.
the fiber optics. As shown in the picture, when an intrusion occurs, the sensor response

53
will provide the location of this event along the fiber lenght. The reported depth of the
buried fiber is so far round 30 ~45 cm [27].
This topology was already tested on field, where 8.5 km of SSMF was buried 30 cm
deep into the ground [28]. In this configuration, the phase-OTDR traces were acquired
and processed in real time. High sensitivity and consistent detection of intruders on
foot and of vehicles traveling down a road near the cable line was achieved.
Also, another reported contribution to this area was the use of digital signal
processing of the phase-OTDR curves to identify specific signature characteristics of
diferente intruders [29]. In this reference, data was taken with an 80 kg intruder
walking towards the buried fiber section, and also the signature of a car traveling at
10-20 mph along a nearby road was recorded, both results shown in Figure 3.2. The
footsteps of the intruder are clearly revealed in the extracted signature, and a vehicle
can easily be differentiated from a walker based on the difference in signatures. Thus,
this approached allowed surveillance based on phase-OTDR to reach another level of
integration with DSP techniques and intruder pattern identification.
Figure 3.2. Data signature of (a) intruder on foot and (b) car traveling down a nearby road [29].
A recent and relevant contribution was addressed to extract human intrusion
events from noisy background in phase-OTDR traces [42]. Instead of using the
conventional differential OTDR curve, time-evolving signals for each spatial point are
accumulated and analyzed; multi-scale wavelet decomposition and reconstruction
54
was employed to separate real intrusions from the nonlinearly mixed signals. Different
types of signals can be exposed with different distribution features along with the
decomposed scales and thus they can be further determined. In this paper, by
physically separating real intrusions and other systematic and environmental
influences by thewavelet tool, the authors also constructed a 3-layer back propagation
(BP) artificial neural network (ANN) network to identify the different distributions of
three typical events, no intrusion, human intrusion, and hand clapping for simulating
the ambient time-varying sounds and air movements in the environments. Thus, this
is one more example of a succesful combination between DSP methods and the phase-
OTDR technique.
After stressing in this section the feasibility to use phase-OTDR methods for
surveillance applications and its advantages, as well as the performance improvement
that can be obtained by merging it with DSP techniques, experiments were performed
and an original contribution was achieved.
3.2. EXPERIMENTAL SETUP
In order to perform intrusion experiments for surveillance proposals, a phase-OTDR
system was built in the Acreo AB laboratory, in Kista, Stockholm, Sweden. The
experimental setup scheme is shown in Figure 3.3.
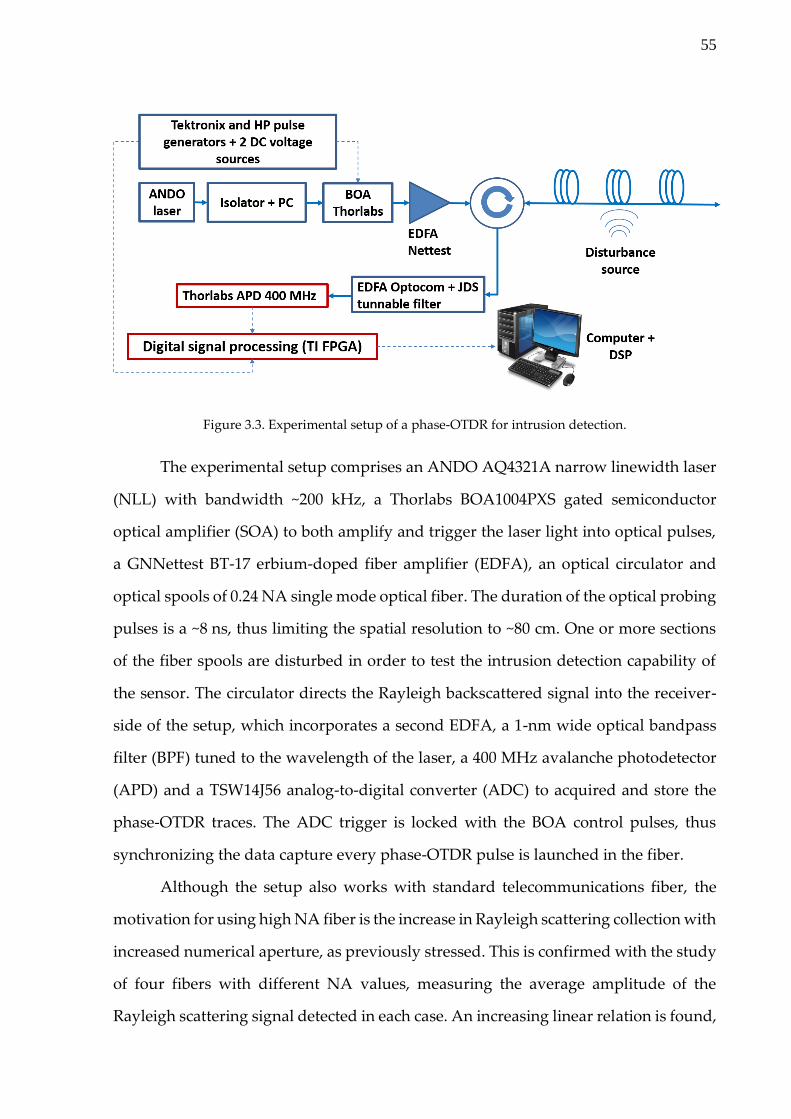
55
Figure 3.3. Experimental setup of a phase-OTDR for intrusion detection.
The experimental setup comprises an ANDO AQ4321A narrow linewidth laser
(NLL) with bandwidth ~200 kHz, a Thorlabs BOA1004PXS gated semiconductor
optical amplifier (SOA) to both amplify and trigger the laser light into optical pulses,
a GNNettest BT-17 erbium-doped fiber amplifier (EDFA), an optical circulator and
optical spools of 0.24 NA single mode optical fiber. The duration of the optical probing
pulses is a ~8 ns, thus limiting the spatial resolution to ~80 cm. One or more sections
of the fiber spools are disturbed in order to test the intrusion detection capability of
the sensor. The circulator directs the Rayleigh backscattered signal into the receiver-
side of the setup, which incorporates a second EDFA, a 1-nm wide optical bandpass
filter (BPF) tuned to the wavelength of the laser, a 400 MHz avalanche photodetector
(APD) and a TSW14J56 analog-to-digital converter (ADC) to acquired and store the
phase-OTDR traces. The ADC trigger is locked with the BOA control pulses, thus
synchronizing the data capture every phase-OTDR pulse is launched in the fiber.
Although the setup also works with standard telecommunications fiber, the
motivation for using high NA fiber is the increase in Rayleigh scattering collection with
increased numerical aperture, as previously stressed. This is confirmed with the study
of four fibers with different NA values, measuring the average amplitude of the
Rayleigh scattering signal detected in each case. An increasing linear relation is found,

56
as shown in Figure 3.4. Consequently, the use of a high NA fiber is advantageous for
measurements with higher amplitude than with a lower NA.
Figure 3.4. Relationship between the optical fiber numerical aperture and the phase-
OTDR average amplitude.
After building the setup, experiments were performed regarding single and
multipoint detection, 2D surface mapping and a novel proposal merging phase-OTDR
and FPGA architectures, as will be shown in the follwing subsections.
3.3. SINGLE AND MULTIPOINT INTRUSION
DETECTION
In order to evaluate the system capability to detect intrusion, a single point detection
was performed first. The experiment consisted of disturbing a fiber section of a 1 km
length optical fiber. The disturbed section was from 360 m to 380 m, as shown in the
acquired phase-OTDR traces exhibited in Figure 3.5a. Figure 3.5b shows the
differential resultant trace obtained from the phase-OTDR traces, which indicates the
disturbed section location. This differential signal is calculated by simple subtracting
two consecutive phase-OTDR traces.

57
The disturbance locations are detected by locating the highest peaks in the
differential traces when compared to the noise floor. The value of the noise floor can
vary according to the application. It is worth mentioning that this measurement is only
qualitative and relative, thus this method is uncappable to measure absolute
amplitude values of the disturbances.
Figure 3.5. Experimental results of a single point intrusion detection: a) Two consecutive phase-OTDR
traces: before (blue) and after (red) the disturbance in ~20 m section (inset) of optical fiber; b) Differential
resultant trace indicating the location of the disturbed section.
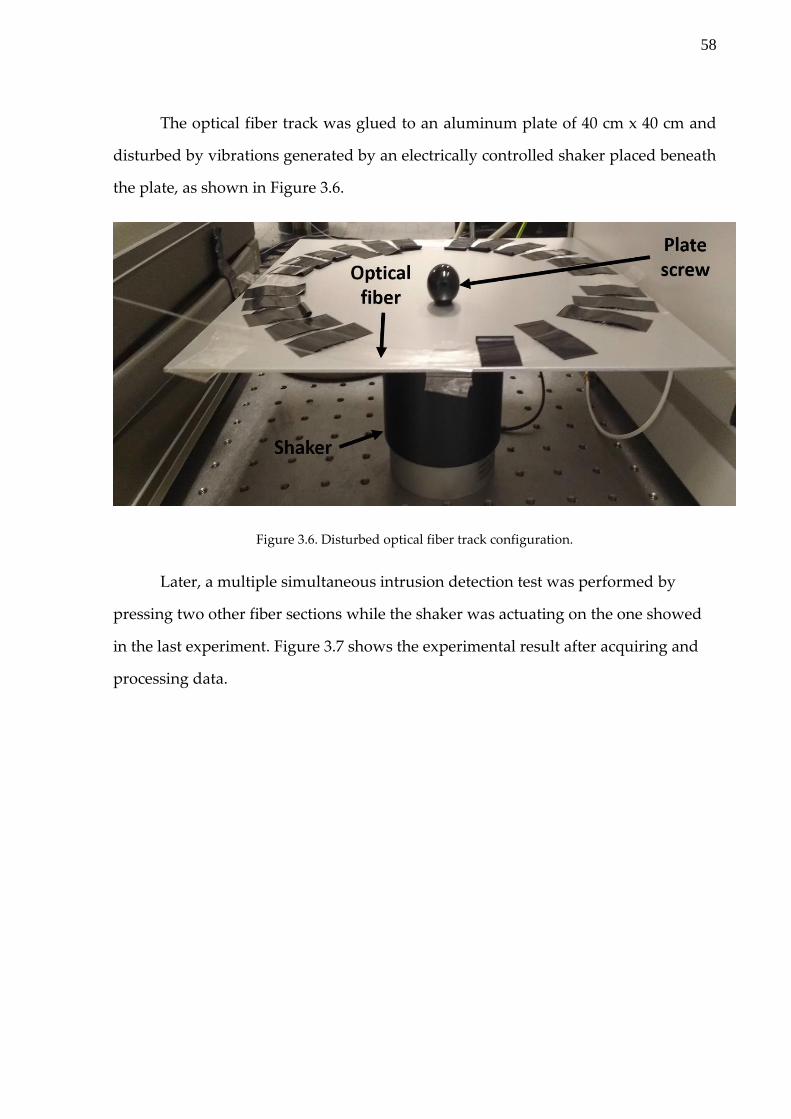
58
The optical fiber track was glued to an aluminum plate of 40 cm x 40 cm and
disturbed by vibrations generated by an electrically controlled shaker placed beneath
the plate, as shown in Figure 3.6.
Figure 3.6. Disturbed optical fiber track configuration.
Later, a multiple simultaneous intrusion detection test was performed by
pressing two other fiber sections while the shaker was actuating on the one showed
in the last experiment. Figure 3.7 shows the experimental result after acquiring and
processing data.
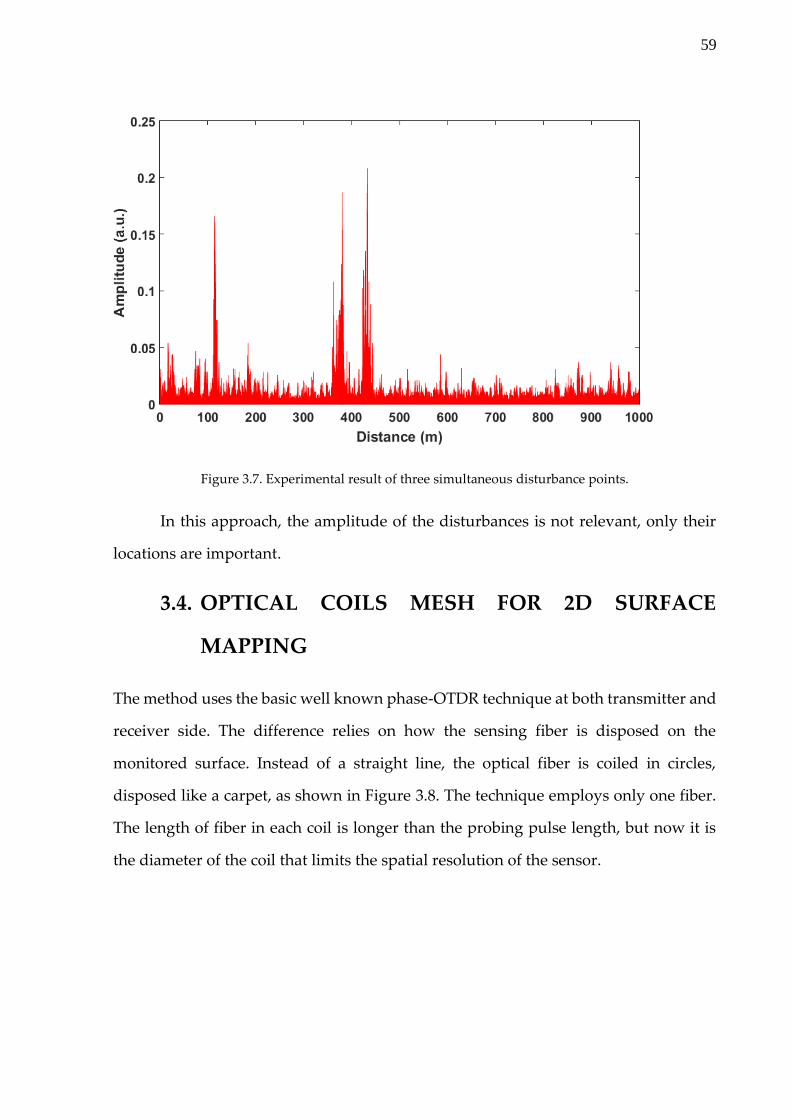
59
Figure 3.7. Experimental result of three simultaneous disturbance points.
In this approach, the amplitude of the disturbances is not relevant, only their
locations are important.
3.4. OPTICAL COILS MESH FOR 2D SURFACE
MAPPING
The method uses the basic well known phase-OTDR technique at both transmitter and
receiver side. The difference relies on how the sensing fiber is disposed on the
monitored surface. Instead of a straight line, the optical fiber is coiled in circles,
disposed like a carpet, as shown in Figure 3.8. The technique employs only one fiber.
The length of fiber in each coil is longer than the probing pulse length, but now it is
the diameter of the coil that limits the spatial resolution of the sensor.

60
Figure 3.8. phase-OTDR based optical fiber coil mesh concept (left figure) and laboratory
implementation example (right figure).
According to Figure 3.8, each coil represents the element of a matrix and can be
used to evaluate each part of the surface area. In the experiment, a 30 cm x 30 cm
surface was monitored using a fiber coiled in 9 coils of 10 cm diameter each. In order
to be capable to resolve all coils, the length of the coiled fiber in every coil must be at
least longer than the spatial width of the optical pulse. Thus, 3 m of fiber was wrapped
around each one. Every coil represents a region in the phase-OTDR trace that can be
mapped to a 2D representation of the monitored surface without employing specialty
fibers. This technique can also monitor all the coils at the same time, detecting
simultaneous events and providing a complete analysis of the monitored surface.
In order to proof the method concept, each coil was disturbed separately and
the average change in amplitude due to the disturbance was mapped into a 2D
representation of the analyzed surface, as shown in Figure 3.9. From these graphs, it
was able to distinguish each disturbed section of the surface with a 10 cm spatial
resolution, which is the diameter of each optical fiber coil. The pulse width used for
probing was 8 ns, which in a conventional phase-OTDR would result in an 80 cm
spatial resolution. If a higher resolution is required, then smaller coils should be made,
respecting the requirement that the fiber length coiled in each coil should be at least
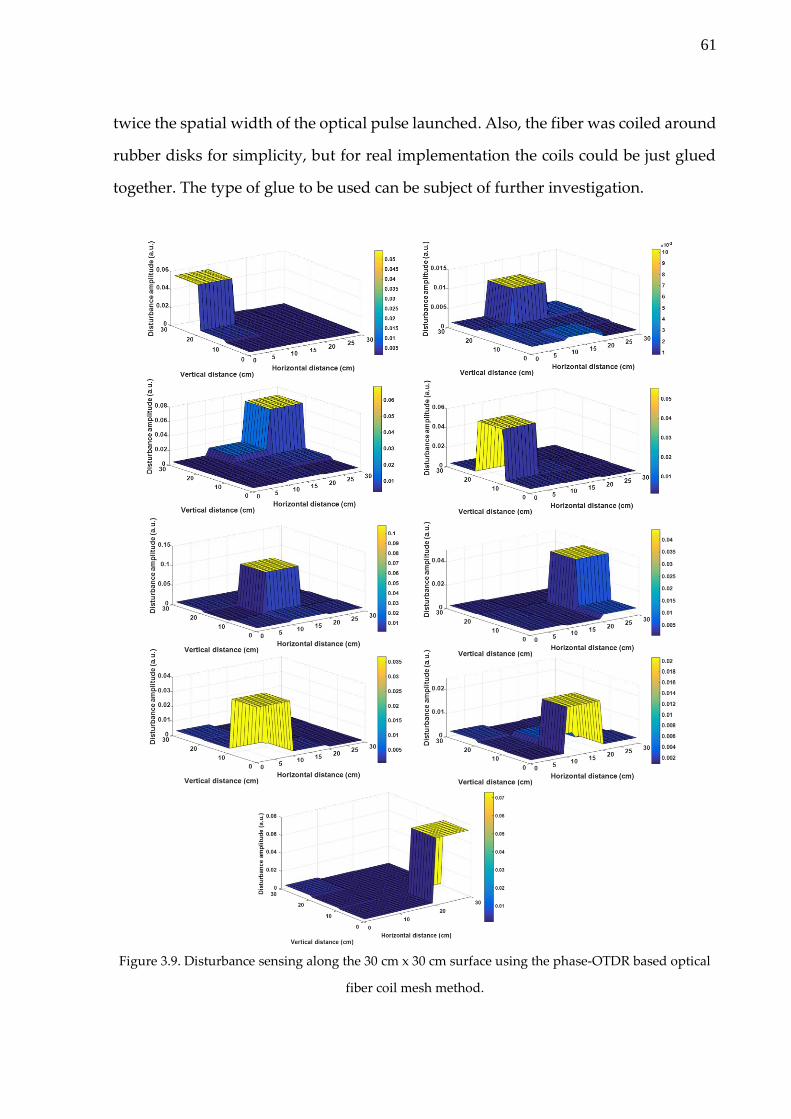
61
twice the spatial width of the optical pulse launched. Also, the fiber was coiled around
rubber disks for simplicity, but for real implementation the coils could be just glued
together. The type of glue to be used can be subject of further investigation.
Figure 3.9. Disturbance sensing along the 30 cm x 30 cm surface using the phase-OTDR based optical
fiber coil mesh method.

62
The color map represents the relative amplitude of the disturbance. Also, three
coils were disturbed at the same time, in order to prove the simultaneous disturbance
detection capability of the method. The result is shown in Figure 3.10, where the three
disturbed coils can be distinguished: green, yellow and ochre.
Figure 3.10. Simultaneous disturbance of three coils in the optical fiber coil mesh.
This solution can be useful for mapping disturbances on surfaces of different
sizes and shapes.
3.5. INTRUSION DETECTION BASED ON PHASE-
OTDR AND FPGA ARCHITECTURES
When it comes to fast location of potential intrusions along oil pipelines, dams, high-
voltage cables or military facilities, the capability to deal with real-time multi-zone
disturbance signal processing is a key feature. In this scenario, it is important to have:
(i) a high performance and reliable computational approach that receives and filters
the data at the sampling frequency allowing multiple disturbances to be detected and
located; (ii) a scalable and easy configurable processing solution that can be adapted

63
to different scenarios and follows the optical distributed sensors along incremental
perimeters and structures.
In this section, it is shown a joint work that proposed and demonstrated the use
of of parallel hardware architectures to implement digital filters for detecting and
locating perturbations in a phase-OTDR distributed optical fiber intrusion sensor. It
addresses the above described requirements by implementing hardware architectures
of the moving average and Sobel filters, exploring their intrinsic parallelism to achieve
low latency solutions and to detect and locate multi-zone disturbances along the
optical fiber.
This work proposal is focused on these three main contributions: (i) the
development of hardware pipelined architectures for real-time processing of --OTDR
signals. The architectures were designed to facilitate the adaptability to different
optical fiber lengths and resolutions of the analog-to-digital converter (ADC); (ii) the
analysis of numerical simulations using experimental data in order to validate the
capabilities of the system to detect multiple disturbances; (iii) a scalability analysis of
the proposed hardware architectures.
Two different scenarios were tested: one single disturbance and two
simultaneous disturbances in the fiber under test. For the single disturbance scenario,
we used 57 m length optical fiber and a coiled section of ~3 m upon a plate was
disturbed with the shaker. In the two simultaneous disturbances scenario we
employed 295 m of optical fiber and disturbed two fiber sections of ~5 m each, 90 m of
fiber away from each other. Commonly, the --OTDR signals are acquired, stored in a
memory and then digitally processed offline. In general, the digital processing is
divided in four main task: filtering, detection, localization and information extraction.
This experiments evaluate the real-time processing capabilities of this phase–OTDR
setup for the filtering and detection tasks, mapping in hardware the recursive moving
average filter and the Sobel filter in order to achieve a low latency solution.
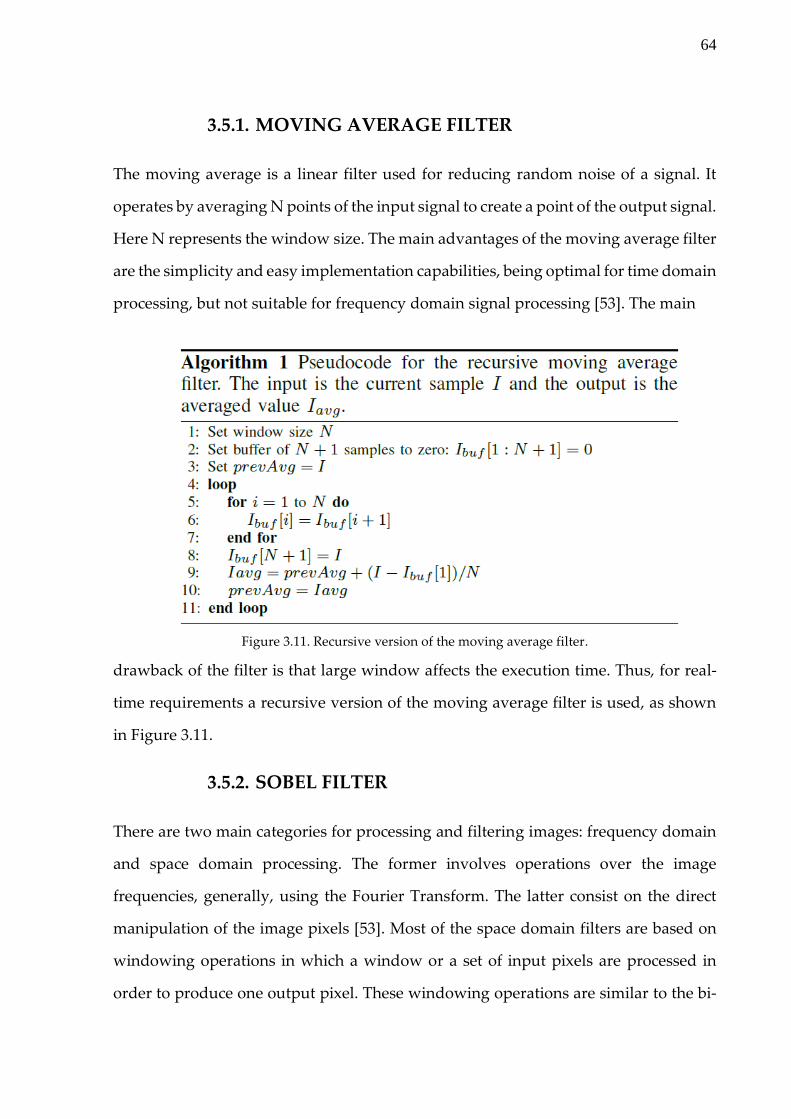
64
3.5.1. MOVING AVERAGE FILTER
The moving average is a linear filter used for reducing random noise of a signal. It
operates by averaging N points of the input signal to create a point of the output signal.
Here N represents the window size. The main advantages of the moving average filter
are the simplicity and easy implementation capabilities, being optimal for time domain
processing, but not suitable for frequency domain signal processing [53]. The main
Figure 3.11. Recursive version of the moving average filter.
drawback of the filter is that large window affects the execution time. Thus, for real-
time requirements a recursive version of the moving average filter is used, as shown
in Figure 3.11.
3.5.2. SOBEL FILTER
There are two main categories for processing and filtering images: frequency domain
and space domain processing. The former involves operations over the image
frequencies, generally, using the Fourier Transform. The latter consist on the direct
manipulation of the image pixels [53]. Most of the space domain filters are based on
windowing operations in which a window or a set of input pixels are processed in
order to produce one output pixel. These windowing operations are similar to the bi-

65
dimensional discrete convolution operation in signal processing, as shown in Equation
3.1.
𝐾(𝑥, 𝑦) ⊗ 𝐼(𝑥, 𝑦) = ∑ ∑ 𝐾(𝑖, 𝑗)𝐼(𝑥 − 𝑖, 𝑦 − 𝑗)𝑛/2𝑗=−𝑛/2
𝑚/2𝑖=−𝑚/2 (3.1)
where I is the input signal and the masks or kernels, K(x,y), assume different sizes and
arbitrary values depending on the function to be performed.
In image processing different kernels can be used in order to extract several
characteristics. The Sobel filter is an edge detection method based on the assumption
that the edge occurs where there is a discontinuity in the intensity of the image. Thus,
edges can be detected by applying the gradient across the image, as shown in Equation
3.2, and finding the points where values are significant larger than surroundings. Gx
and Gy estimate the derivate along the x and y directions as exhibited in Equation 3.3.
∇(𝑥, 𝑦) = [𝜕𝐼
𝜕𝑥
𝜕𝐼
𝜕𝑦]𝑇
= [𝐺𝑥 𝐺𝑦]𝑇 (3.2)
𝐺𝑥 = [−1 0 1−2 0 2−1 0 1
]⨂𝐼; 𝐺𝑦 = [−1 −2 −10 0 01 2 1
]⨂𝐼
(3.3)
In the context of phase-OTDR, Rayleigh backscattered traces can be treated as
an image and disturbances can be located by detecting significant variations in gray
level.
3.5.3. FPGA IMPLEMENTATIONS
The moving average and Sobel digital filters were implemented in VHDL hardware
description language. For the sake of simplicity all the architectures are based on
integer arithmetic and logic operations easily implemented on FPGAs. Since different
optical fiber lengths and ADC’s resolutions can be used we parametrized the
architectures in order to facilitate the scalability and reconfiguration of the circuits to
different experimental setups. In order to accomplish real-time requirements the

66
proposed circuits were developed using pipeline architectures allowing one output
per clock cycle to be processed after an initial latency.
3.5.4. phase-OTDR DISTURBANCE DETECTION USING
MOVING AVERAGE
Figure 3.12 shows the general architecture for peak detection of phase-OTDR samples
using the moving average filter. According to Algorithm 1 a buffer for storing N input
samples is required. Here, N was selected to be a power of two simplifying the division
operation by a shift right logic operation. Initially the Iadc input signals are sequentially
displaced and stored into a FIFO (First In, First Out) buffer. When this input buffer is
full the oldest sample in the buffer is subtracted from the input signal and a shift right
operation performs the division by N.
The result is accumulated in order to obtain the filtered value Iavg. Afterward,
the square of the differences between sequential phase-OTDR filtered traces are
computed. For that, the Iavg values are shifted every clock cycle through a new FIFO
register composed of the same number of samples along the optical fiber, F.
Figure 3.12. General architecture of the recursive moving average filter for peak detection and
localization of phase-OTDR signals. The blue blocks denote the FIFO buffer of the moving average and
the green blocks represent the FIFO buffer along the optical fiber. The peak localization block was
repeated in order to detect two simultaneous perturbation points.
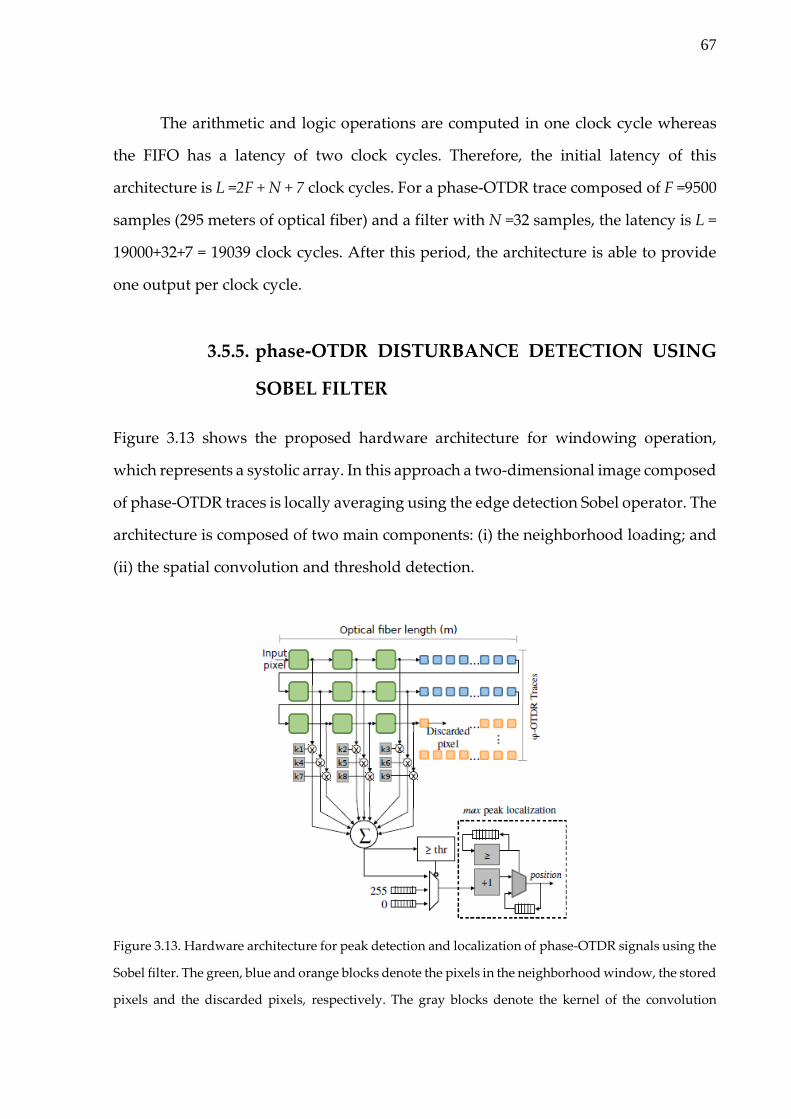
67
The arithmetic and logic operations are computed in one clock cycle whereas
the FIFO has a latency of two clock cycles. Therefore, the initial latency of this
architecture is L =2F + N + 7 clock cycles. For a phase-OTDR trace composed of F =9500
samples (295 meters of optical fiber) and a filter with N =32 samples, the latency is L =
19000+32+7 = 19039 clock cycles. After this period, the architecture is able to provide
one output per clock cycle.
3.5.5. phase-OTDR DISTURBANCE DETECTION USING
SOBEL FILTER
Figure 3.13 shows the proposed hardware architecture for windowing operation,
which represents a systolic array. In this approach a two-dimensional image composed
of phase-OTDR traces is locally averaging using the edge detection Sobel operator. The
architecture is composed of two main components: (i) the neighborhood loading; and
(ii) the spatial convolution and threshold detection.
Figure 3.13. Hardware architecture for peak detection and localization of phase-OTDR signals using the
Sobel filter. The green, blue and orange blocks denote the pixels in the neighborhood window, the stored
pixels and the discarded pixels, respectively. The gray blocks denote the kernel of the convolution
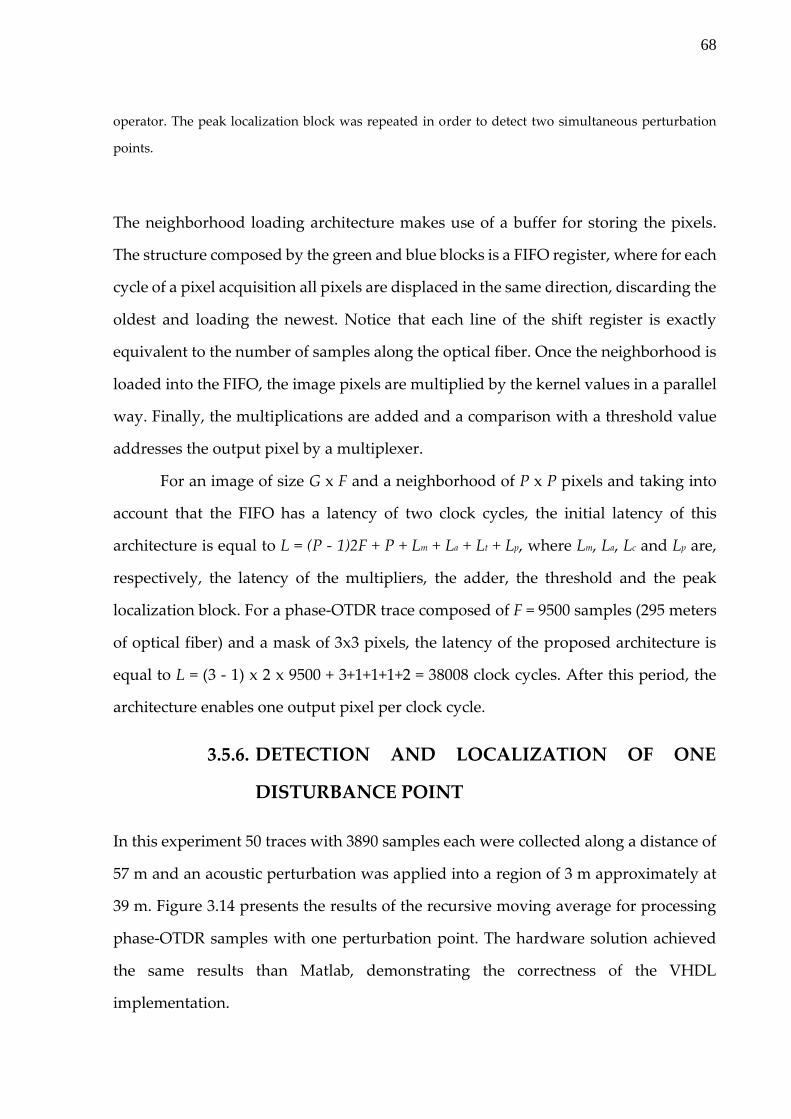
68
operator. The peak localization block was repeated in order to detect two simultaneous perturbation
points.
The neighborhood loading architecture makes use of a buffer for storing the pixels.
The structure composed by the green and blue blocks is a FIFO register, where for each
cycle of a pixel acquisition all pixels are displaced in the same direction, discarding the
oldest and loading the newest. Notice that each line of the shift register is exactly
equivalent to the number of samples along the optical fiber. Once the neighborhood is
loaded into the FIFO, the image pixels are multiplied by the kernel values in a parallel
way. Finally, the multiplications are added and a comparison with a threshold value
addresses the output pixel by a multiplexer.
For an image of size G x F and a neighborhood of P x P pixels and taking into
account that the FIFO has a latency of two clock cycles, the initial latency of this
architecture is equal to L = (P - 1)2F + P + Lm + La + Lt + Lp, where Lm, La, Lc and Lp are,
respectively, the latency of the multipliers, the adder, the threshold and the peak
localization block. For a phase-OTDR trace composed of F = 9500 samples (295 meters
of optical fiber) and a mask of 3x3 pixels, the latency of the proposed architecture is
equal to L = (3 - 1) x 2 x 9500 + 3+1+1+1+2 = 38008 clock cycles. After this period, the
architecture enables one output pixel per clock cycle.
3.5.6. DETECTION AND LOCALIZATION OF ONE
DISTURBANCE POINT
In this experiment 50 traces with 3890 samples each were collected along a distance of
57 m and an acoustic perturbation was applied into a region of 3 m approximately at
39 m. Figure 3.14 presents the results of the recursive moving average for processing
phase-OTDR samples with one perturbation point. The hardware solution achieved
the same results than Matlab, demonstrating the correctness of the VHDL
implementation.
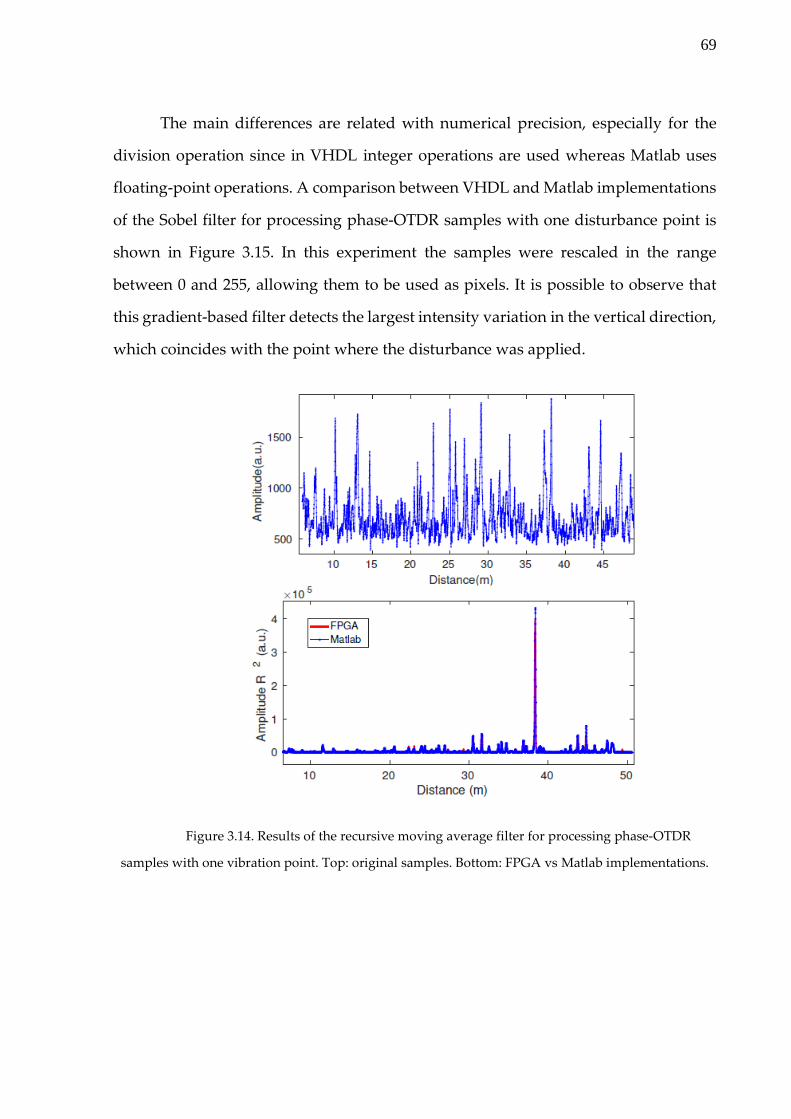
69
The main differences are related with numerical precision, especially for the
division operation since in VHDL integer operations are used whereas Matlab uses
floating-point operations. A comparison between VHDL and Matlab implementations
of the Sobel filter for processing phase-OTDR samples with one disturbance point is
shown in Figure 3.15. In this experiment the samples were rescaled in the range
between 0 and 255, allowing them to be used as pixels. It is possible to observe that
this gradient-based filter detects the largest intensity variation in the vertical direction,
which coincides with the point where the disturbance was applied.
Figure 3.14. Results of the recursive moving average filter for processing phase-OTDR
samples with one vibration point. Top: original samples. Bottom: FPGA vs Matlab implementations.

70
Figure 3.15. Rescale of the Sobel filter results for processing phase-OTDR samples with one
disturbance point. Left: Matlab implementation. Right: FPGA implementation.
3.5.7. DETECTION AND LOCALIZATION OF TWO
DISTURBANCES POINT
In this experiment, 201 traces with 9500 samples each were collected along a distance
of 295 m and two acoustic perturbations were applied 90 m of fiber away from each
other at positions 132 m and 32 m. Figure 3.16 shows the achieved results by the Sobel
filter for detection of two simultaneous perturbations. The achieved result is presented
in the bottom image. It is possible to observe the presence of two groups of pixels at
the positions where the disturbances were applied. Sobel filters with large kernels will
efficiently remove the noise; however, information containing small vibrations in the
fiber can be lost.
Figure 3.17 illustrates the achieved results by the recursive moving average
filter where two simultaneous disturbance points were applied to the optical fiber. It
was observed the presence of two peaks along the traces whereas the noise was
attenuated. The peak detection block was able to localize the perturbations by looking
for the two-maximum peak value across the traces. The second highest peak was found
looking for the maximum peak out the perturbation region of 5 m of the highest peak.
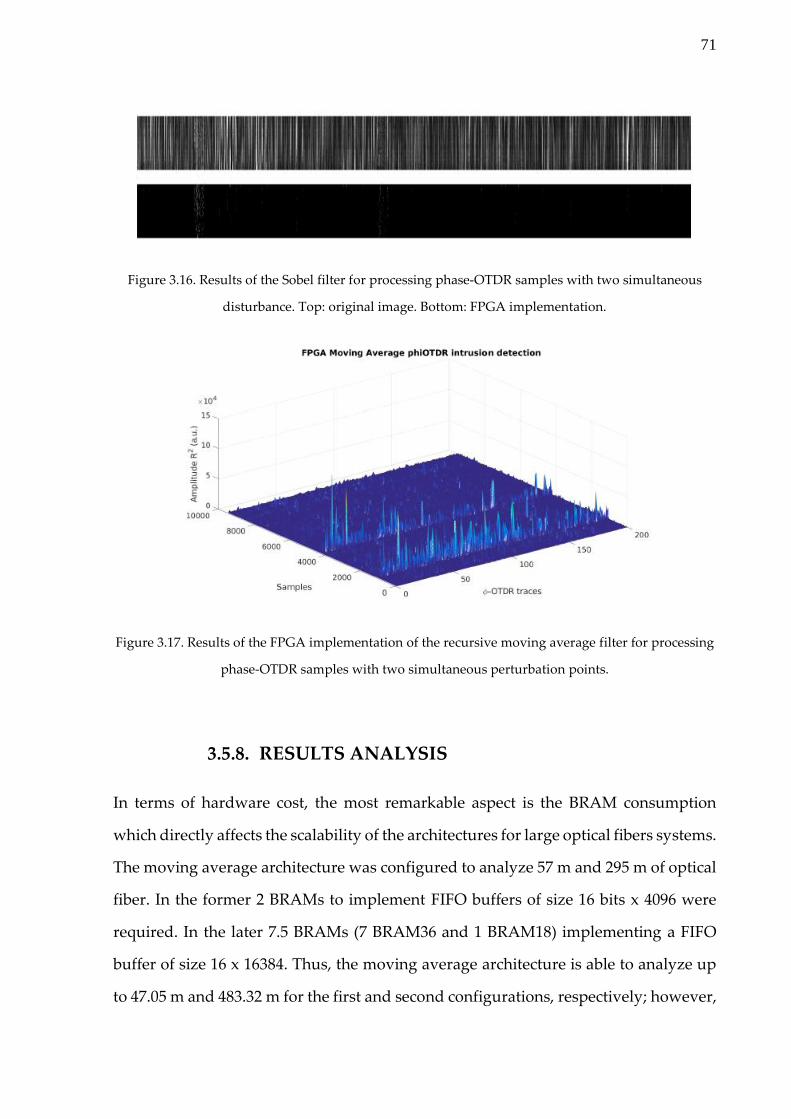
71
Figure 3.16. Results of the Sobel filter for processing phase-OTDR samples with two simultaneous
disturbance. Top: original image. Bottom: FPGA implementation.
Figure 3.17. Results of the FPGA implementation of the recursive moving average filter for processing
phase-OTDR samples with two simultaneous perturbation points.
3.5.8. RESULTS ANALYSIS
In terms of hardware cost, the most remarkable aspect is the BRAM consumption
which directly affects the scalability of the architectures for large optical fibers systems.
The moving average architecture was configured to analyze 57 m and 295 m of optical
fiber. In the former 2 BRAMs to implement FIFO buffers of size 16 bits x 4096 were
required. In the later 7.5 BRAMs (7 BRAM36 and 1 BRAM18) implementing a FIFO
buffer of size 16 x 16384. Thus, the moving average architecture is able to analyze up
to 47.05 m and 483.32 m for the first and second configurations, respectively; however,

72
using the total available BRAMs resources in the FPGA it can inspect systems up to 3.8
km length.
The Sobel filter architecture achieves better results in term of filtering
capabilities; however, it requires more BRAM resources (two phase-OTDR traces
instead of one in the moving average) and, as a consequence, it is able to inspect
systems up to 1.9 km length. The recursive moving average and Sobel filters were
implemented using pipelined architectures, achieving a latency of 0.127 ms and 0.304
ms, respectively. After that initial period, the implemented circuits of the moving
average and Sobel filter are able to process one output every 13.2 ns and 16 ns,
respectively. This fact points-out the feasibility of the proposed hardware architectures
and experimental setup for real-time vibration sensing at frequencies in the order of
MHz. It is important to highlight that the FPGA device has enough resources (more
than 90%) for implementing parallel classification algorithms allowing to extract
information along the optical fiber in a simultaneous way.
As future work will be to explore real-time processing solutions and the FPGA
parallelism capabilities to listen to sound disturbances in multiple zones along the
optical fiber.
3.6. CHAPTER CONCLUSION
In this chapter, the phase-OTDR method for multi-point intrusion detection was
explored, both in its most basic setup and in an original contribution where it is
merged with Field Programmable Gate Array architectures. An optical fiber coil mesh
was also proposed, showing the versatility of the method and the capability to increase
its spatial resolution without employing higher bandwidth expensive ADC solutions.
The original results obtained in this chapter of the thesis were presented and published
at the Proceedings of the 14th IEEE International Conference on Networking, Sensing
and Control 2017, Calabria (Italy).

73
CHAPTER 4
4. VIBRATION MEASUREMENT ON
COMPOSITE MATERIAL WITH
EMBEDDED OPTICAL FIBER BASED ON
PHASE-OTDR
As previously reported in the early chapters, distributed sensors based on phase-
OTDR are also suitable for structure health monitoring. These sensors features allow
the fiber embedment into aircraft structures in a nearly non-intrusive way to measure
vibrations along its length. The capability of measuring vibrations on airplane
composite structures is of interest for what concerns the study of material fatigue [55]
or the occurrence of undesirable phenomena like flutter [56]. This chapter is addressed
to the vibration measurement on composite material with embedded optical fiber
using the phase-OTDR method. Firstly, a brief introduction of the importance of
measuring vibrations in aeronautic structures is presented, followed by a previously
reported study of fiber embedment into composites, addressing the main challenges.
Then, the fabrication process of composite samples with embedded fibers performed
for this work is explained. Lastly, vibrations measurements based on phase-OTDR
ranging from some dozens of Hz to kHz in two layers of a built composite material
board with embedded polyimide coating 0.24 NA SMF are shown and discussed. The
results presented here were presented and published at the Proceedings of SPIE Smart
Structures and Nondestructive Evaluations 2017, Portland (USA).
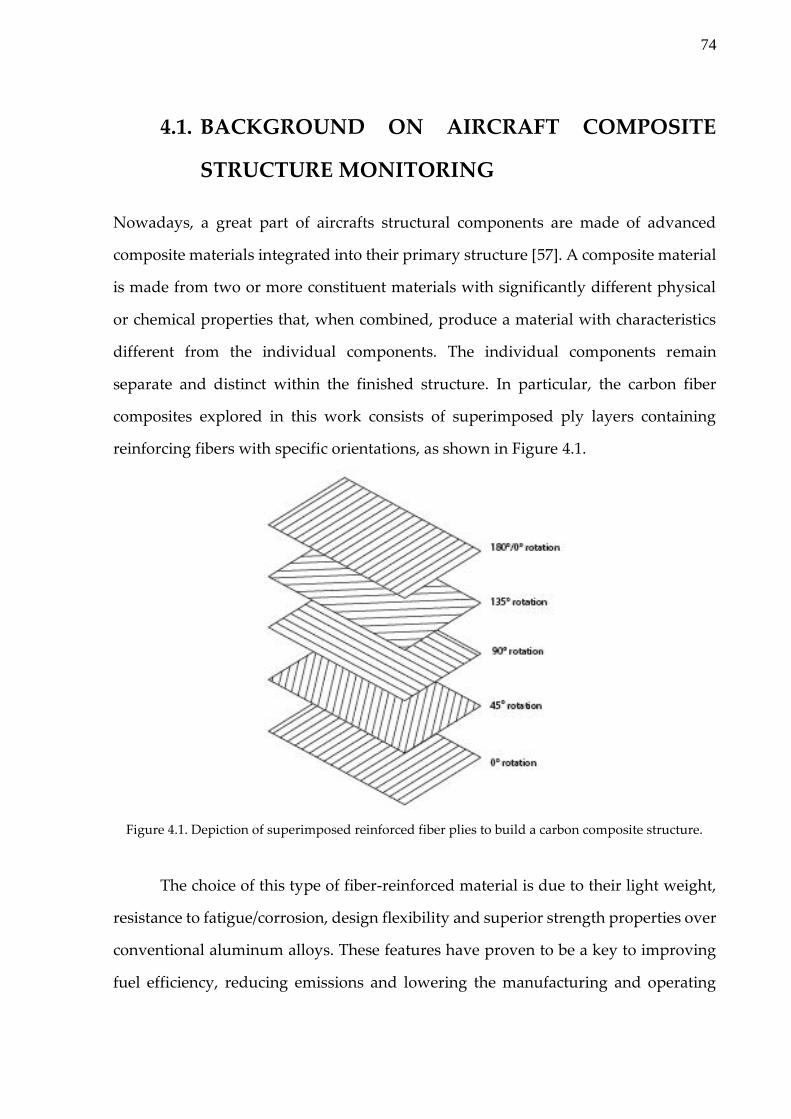
74
4.1. BACKGROUND ON AIRCRAFT COMPOSITE
STRUCTURE MONITORING
Nowadays, a great part of aircrafts structural components are made of advanced
composite materials integrated into their primary structure [57]. A composite material
is made from two or more constituent materials with significantly different physical
or chemical properties that, when combined, produce a material with characteristics
different from the individual components. The individual components remain
separate and distinct within the finished structure. In particular, the carbon fiber
composites explored in this work consists of superimposed ply layers containing
reinforcing fibers with specific orientations, as shown in Figure 4.1.
Figure 4.1. Depiction of superimposed reinforced fiber plies to build a carbon composite structure.
The choice of this type of fiber-reinforced material is due to their light weight,
resistance to fatigue/corrosion, design flexibility and superior strength properties over
conventional aluminum alloys. These features have proven to be a key to improving
fuel efficiency, reducing emissions and lowering the manufacturing and operating

75
costs in both civil and military aircrafts [57]. Figure 4.2 shows the composition of a
Boeing 787 structure, which 50% of its structure is made of composite materials [57].
The expectation is that, over the next years, the percentage of composites in
aircrafts grow even more, making them more affordable, safer, cleaner and quieter
than the current ones [57]. However, these fiber-reinforced materials are more complex
than metallic ones, since their structural anisotropy and their multiphase materials
might result in many types of damage with different propagation characteristics,
causing the remaining strength and residual life of the structure difficult to predict
after a damage.
In these structures, the most common type of damage is caused by impact, such
as bird strikes, tool drop during manufacturing and maintenance or even detached
ground stones during take-off. These impacts may cause failures in the structure, such
as indentation, delamination or reinforcing fibers cracking, compromising the strength
and integrity of the structure. Visible damage is more straightforward to detect and
solve, while hidden damage is a major concern because failures to detect it may result
in an accident.
Figure 4.2. Composition of a Boeing 787 structure [57].
Another hazardous and more dynamic event that may occur in aircrafts is
flutter, a phenomenon that can happen when a structure is subject to aerodynamic
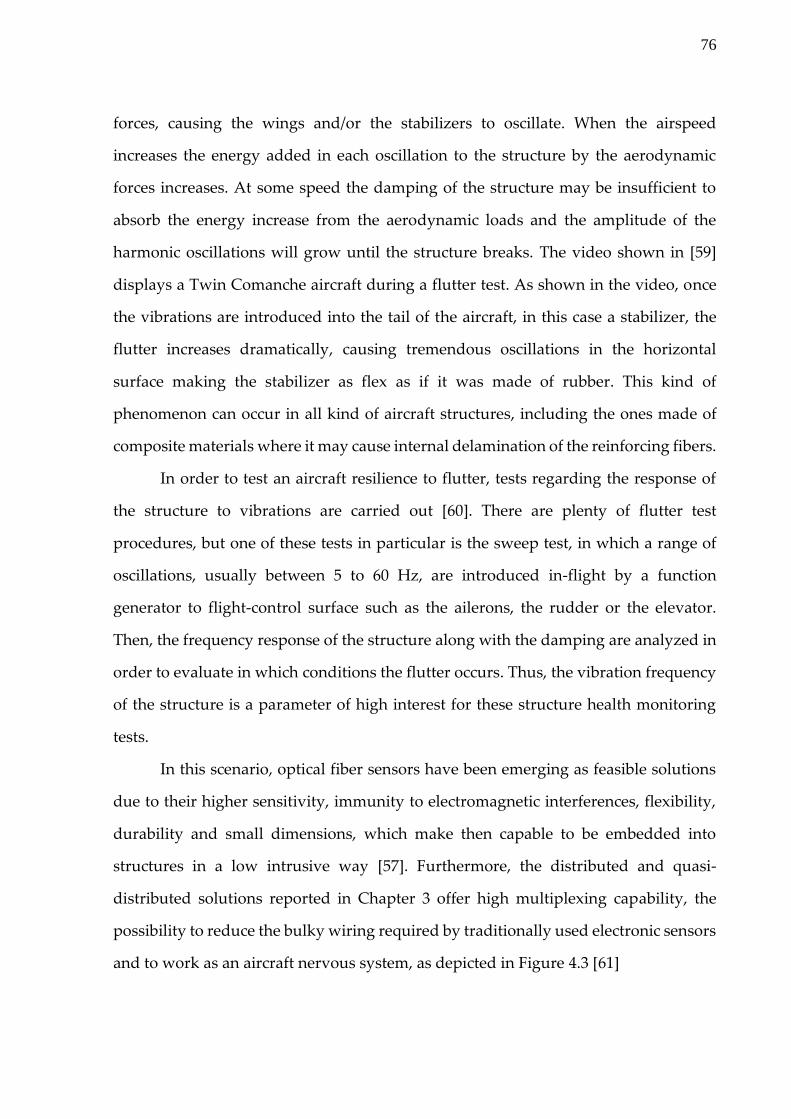
76
forces, causing the wings and/or the stabilizers to oscillate. When the airspeed
increases the energy added in each oscillation to the structure by the aerodynamic
forces increases. At some speed the damping of the structure may be insufficient to
absorb the energy increase from the aerodynamic loads and the amplitude of the
harmonic oscillations will grow until the structure breaks. The video shown in [59]
displays a Twin Comanche aircraft during a flutter test. As shown in the video, once
the vibrations are introduced into the tail of the aircraft, in this case a stabilizer, the
flutter increases dramatically, causing tremendous oscillations in the horizontal
surface making the stabilizer as flex as if it was made of rubber. This kind of
phenomenon can occur in all kind of aircraft structures, including the ones made of
composite materials where it may cause internal delamination of the reinforcing fibers.
In order to test an aircraft resilience to flutter, tests regarding the response of
the structure to vibrations are carried out [60]. There are plenty of flutter test
procedures, but one of these tests in particular is the sweep test, in which a range of
oscillations, usually between 5 to 60 Hz, are introduced in-flight by a function
generator to flight-control surface such as the ailerons, the rudder or the elevator.
Then, the frequency response of the structure along with the damping are analyzed in
order to evaluate in which conditions the flutter occurs. Thus, the vibration frequency
of the structure is a parameter of high interest for these structure health monitoring
tests.
In this scenario, optical fiber sensors have been emerging as feasible solutions
due to their higher sensitivity, immunity to electromagnetic interferences, flexibility,
durability and small dimensions, which make then capable to be embedded into
structures in a low intrusive way [57]. Furthermore, the distributed and quasi-
distributed solutions reported in Chapter 3 offer high multiplexing capability, the
possibility to reduce the bulky wiring required by traditionally used electronic sensors
and to work as an aircraft nervous system, as depicted in Figure 4.3 [61]
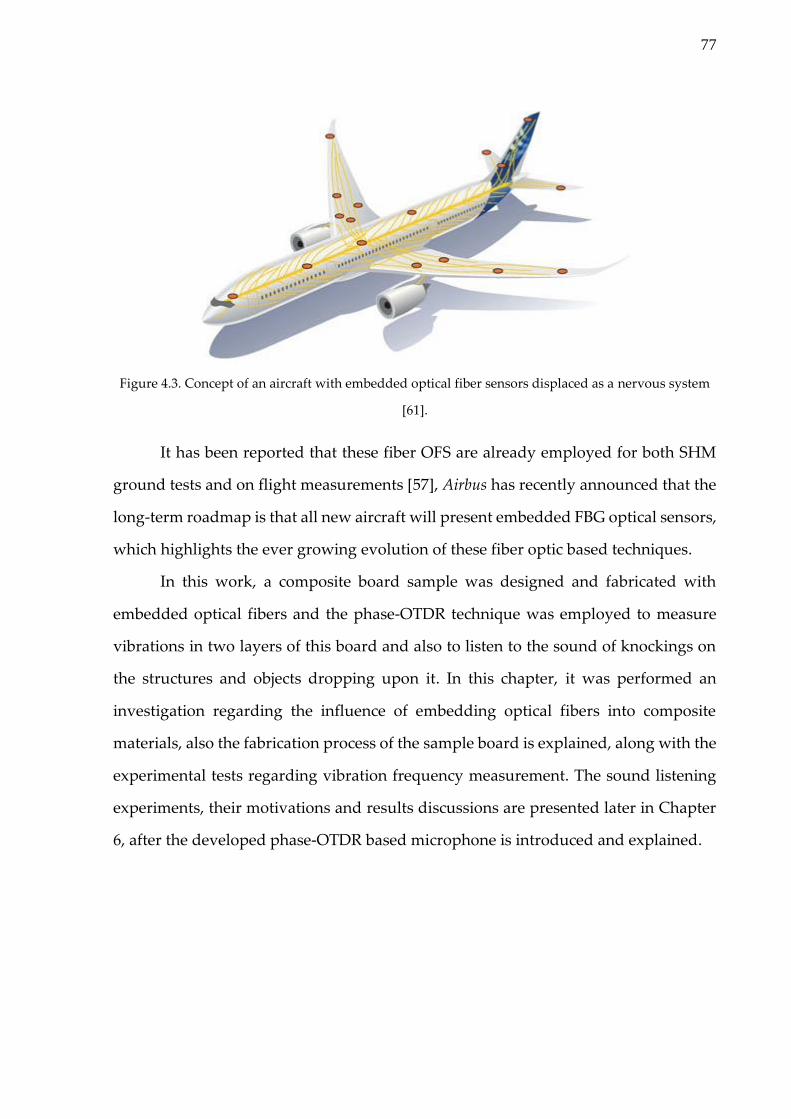
77
Figure 4.3. Concept of an aircraft with embedded optical fiber sensors displaced as a nervous system
[61].
It has been reported that these fiber OFS are already employed for both SHM
ground tests and on flight measurements [57], Airbus has recently announced that the
long-term roadmap is that all new aircraft will present embedded FBG optical sensors,
which highlights the ever growing evolution of these fiber optic based techniques.
In this work, a composite board sample was designed and fabricated with
embedded optical fibers and the phase-OTDR technique was employed to measure
vibrations in two layers of this board and also to listen to the sound of knockings on
the structures and objects dropping upon it. In this chapter, it was performed an
investigation regarding the influence of embedding optical fibers into composite
materials, also the fabrication process of the sample board is explained, along with the
experimental tests regarding vibration frequency measurement. The sound listening
experiments, their motivations and results discussions are presented later in Chapter
6, after the developed phase-OTDR based microphone is introduced and explained.

78
4.2. INFLUENCE OF OPTICAL FIBERS EMBEDMENT
INTO COMPOSITE MATERIALS
As previously stressed, optical fibers can be embedded into composite material
structures with minimum intrusion due to their geometric versatility and small size
[62]. However, even though very small (around 100 to 200 µm), the optical fiber
diameter is still considerable in comparison to the sandwich composite material
reinforcing fibers (around 5 to 10 µm) [63]. Thus, in order for embedded optical fiber
sensors to be accepted into aircraft composite structures, it must be proved that the
insertion of these fibers does not reduce the mechanical properties of the material, like
lifetime, strength, and resistance to fatigue.
In literature, previous studies addressed this concern. According to these
studies, there are many considerations to successfully integrating fiber sensors into
composite materials, and this is itself an active area of research. Issues include the
manufacturing process to integrate the sensors without compromising the composite
matrix, sensor ingress/egress, and sensor survivability maintenance [65].
Figure 4.4 shows pictures of the cross sections of the composite boards with
embedded optical fibers in different orientations.
Figure 4.4. Cross section pictures of embedded optical fibers at different orientations with respect to
the composite reinforcing fibers [65].

79
According to the pictures shown in Figure 4.4, it is visible that when the optical
fiber is embedded in parallel to the ply reinforcing fibers (0°), no resin pockets are
formed around the optical fiber after the fabrication process, presenting then a high
absorption by the composite material. However, for embedment angles different from
0°, these pockets, i.e. lenticular regions rich in resin and without reinforcing fibers,
appear around the fiber and acts like a interlaminar discontinuity that can be a
potential source of damage when submitted to loads [65]. Figure 4.5 illustrates the
concept of these resin pockets.
Figure 4.5. Depiction of an arbitrary resin pocket formed by the embedment of an optical fiber not in
parallel with the material reinforcing fibers.
These lenticular regions occur due to the fact that when submitted to high
temperature and pressure in the curing process, the optical fibers keep their volume
and geometry, while the composite plies have the tendency to shrink due to their
different thermal expansion coefficients. Thus, the presence of a not aligned optical
fiber becomes a local flaw that disturbs the ply sequence and compromises the
integrity of the composite structure.
According to the literature, the composite flexure strength and modulus were
not significantly influenced by the optical fibers embedded in parallel with respect to
the material reinforcing fibers. Also, the impact seems to be more critical in specimen
configurations containing embedded optical fibers in the laminate middle plane. This
fact was even more notorious for cross-ply laminates, which revealed premature
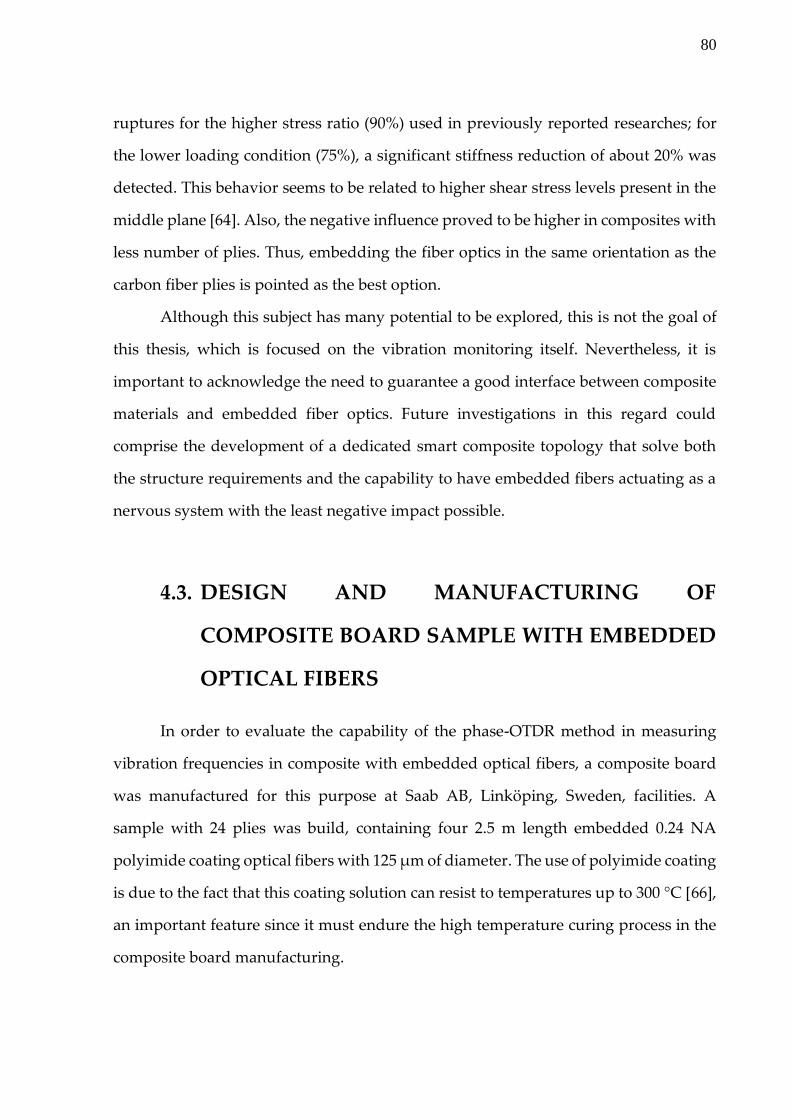
80
ruptures for the higher stress ratio (90%) used in previously reported researches; for
the lower loading condition (75%), a significant stiffness reduction of about 20% was
detected. This behavior seems to be related to higher shear stress levels present in the
middle plane [64]. Also, the negative influence proved to be higher in composites with
less number of plies. Thus, embedding the fiber optics in the same orientation as the
carbon fiber plies is pointed as the best option.
Although this subject has many potential to be explored, this is not the goal of
this thesis, which is focused on the vibration monitoring itself. Nevertheless, it is
important to acknowledge the need to guarantee a good interface between composite
materials and embedded fiber optics. Future investigations in this regard could
comprise the development of a dedicated smart composite topology that solve both
the structure requirements and the capability to have embedded fibers actuating as a
nervous system with the least negative impact possible.
4.3. DESIGN AND MANUFACTURING OF
COMPOSITE BOARD SAMPLE WITH EMBEDDED
OPTICAL FIBERS
In order to evaluate the capability of the phase-OTDR method in measuring
vibration frequencies in composite with embedded optical fibers, a composite board
was manufactured for this purpose at Saab AB, Linköping, Sweden, facilities. A
sample with 24 plies was build, containing four 2.5 m length embedded 0.24 NA
polyimide coating optical fibers with 125 µm of diameter. The use of polyimide coating
is due to the fact that this coating solution can resist to temperatures up to 300 °C [66],
an important feature since it must endure the high temperature curing process in the
composite board manufacturing.

81
The stacking sequence of the composite board plies is shown in Table I, where the
angles refer to the orientation of the material reinforcing carbon fibers. The painted
numbers refers to the plies in between an optical fiber was inserted.
Table II. Ply sequence and angles.
Ply 1 2 3 4 5 6
Angle 45° -45° 0° 90° 45° -45°
Ply 7 8 9 10 11 12
Angle 0° 90° 45° -45° 0° 90°
Ply 13 14 15 16 17 18
Angle 90° 45° -45° 0° 90° 45°
Ply 19 20 21 22 23 24
Angle -45° 0° 90° 45° -45° 0°
The board size was 50 cm x 50 cm and it was 3 mm thick after the curing process,
which was performed as follows:
1. Firstly, the composite plies were cut at the desired shape and quantity;
2. Then, the composite sample board was built by superposing the plies according
to the mentioned stacking sequence, putting 2.5 m of optical fibers between some plies
as showed in Figure 4.6. The fibers were inserted between the plies: 4-5, 8-9, 12-13
(middle plane) and 17-18. Since the plies were already very sticky, no extra glue were
need to bond the optical fibers to the material. Also, the fiber optics were inserted in
parallel to the plies orientation as much as possible and the stacking was already built
upon a curing table;
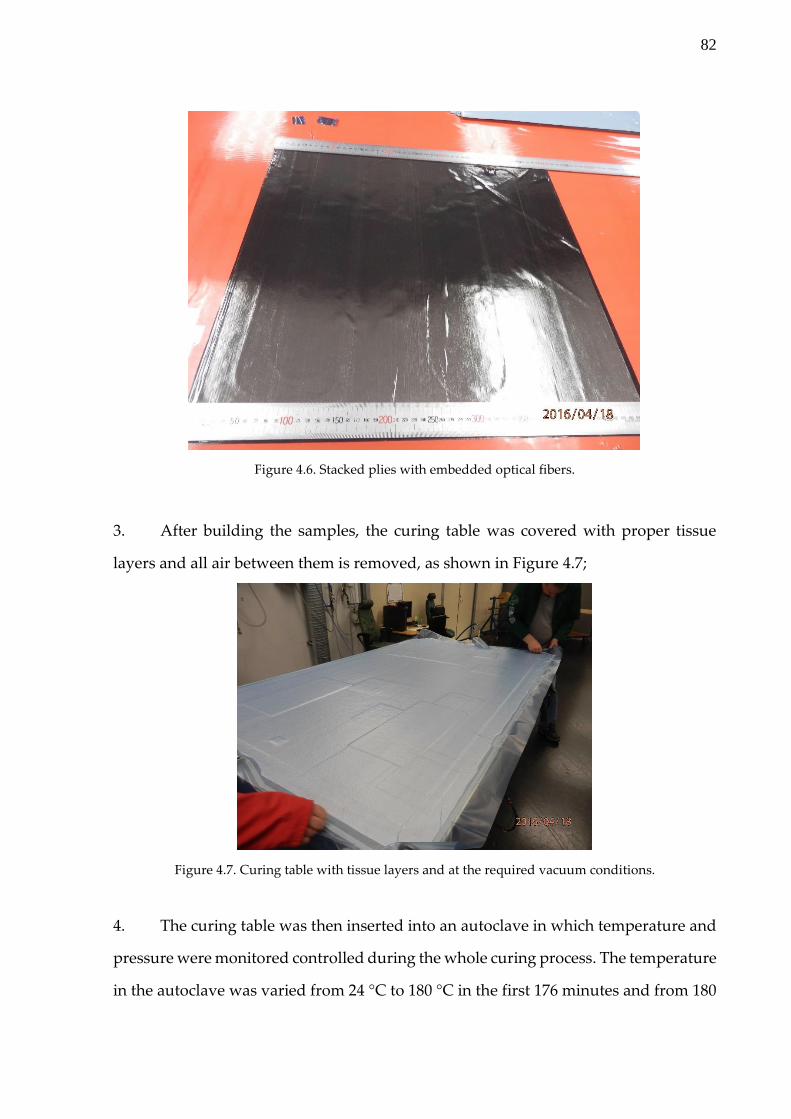
82
Figure 4.6. Stacked plies with embedded optical fibers.
3. After building the samples, the curing table was covered with proper tissue
layers and all air between them is removed, as shown in Figure 4.7;
Figure 4.7. Curing table with tissue layers and at the required vacuum conditions.
4. The curing table was then inserted into an autoclave in which temperature and
pressure were monitored controlled during the whole curing process. The temperature
in the autoclave was varied from 24 °C to 180 °C in the first 176 minutes and from 180

83
°C to 37 °C after 112 minutes more. During almost the whole process, which takes 286
minutes, the pressure inside the autoclave was kept around 310 kPa;
5. After the curing time, the table was removed from the autoclave and the cover
layers were gently removed, always taking care with the optical fibers in the output of
the composite. Figure 4.8 shows the final composite sample with embedded fibers, a
zoom in the fibers coming out of the material, which will be used to access the
embedded fibers, and also a microscope picture of a transversal cut view of one sample
where one can see the optical fiber totally absorbed by the plies, as recommended;
Figure 4.8. (a) Final composite sample with embedded optical fibers, (b) zoom in the fibers inserted in
the material and (c) transversal cut view of a sample with the embedded optical fiber in parallel to the
carbon reinforcing fibers.
When finished, the composite board was taken to Acreo’s facilities in Kista,
Stockholm. Both endings of the four embedded optical fibers were then connectorized
and tested with a red light, as shown in Figure 4.9, in order to investigate if some fibers
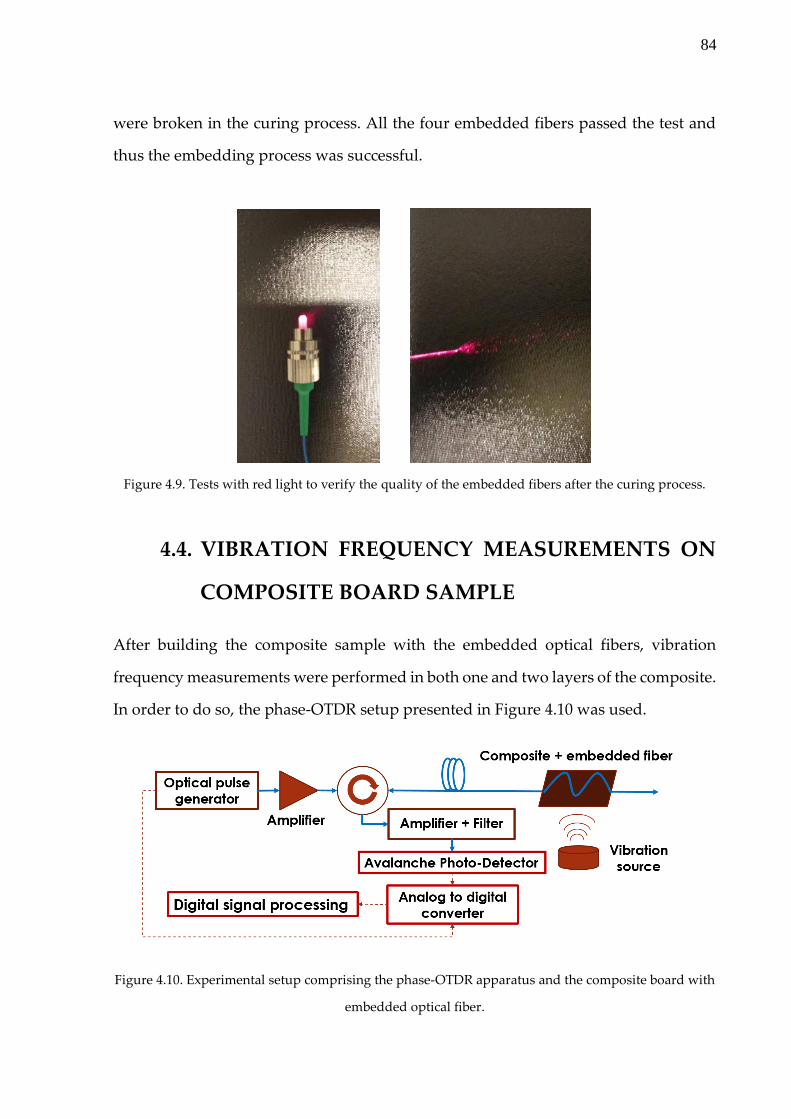
84
were broken in the curing process. All the four embedded fibers passed the test and
thus the embedding process was successful.
Figure 4.9. Tests with red light to verify the quality of the embedded fibers after the curing process.
4.4. VIBRATION FREQUENCY MEASUREMENTS ON
COMPOSITE BOARD SAMPLE
After building the composite sample with the embedded optical fibers, vibration
frequency measurements were performed in both one and two layers of the composite.
In order to do so, the phase-OTDR setup presented in Figure 4.10 was used.
Figure 4.10. Experimental setup comprising the phase-OTDR apparatus and the composite board with
embedded optical fiber.

85
The experimental setup comprises an ANDO AQ4321A narrow linewidth laser
(NLL) with bandwidth ~200 kHz, a Thorlabs BOA1004PXS gated semiconductor
optical amplifier (SOA) to both amplify and trigger the laser light into optical pulses,
a GNNettest BT-17 erbium-doped fiber amplifier (EDFA), an optical circulator and a
45.5 m of 0.24 N.A. single mode optical fiber. The other end of this fiber was connected
to one of the 2.5 m optical fibers embedded into one layer of the composite board and
used as the fiber under test (FUT). The circulator directs the Rayleigh backscattered
signal into the receiver-side of the setup, which incorporates a second EDFA, a 1 nm
wide optical bandpass filter (BPF) tuned to the wavelength of the laser, a 400 MHz
avalanche photodetector (APD) and a TSW14J56 analog-to-digital converter (ADC) to
acquired and store the phase-OTDR traces. The duration of the optical probing pulses
is a ~8 ns, thus limiting the spatial resolution to ~80 cm. Figure 4.11 shows pictures of
the experimental setup.
Figure 4.11. (a) Optical transmitter and receiver-side of the employed phase-OTDR setup; (b) ADC to
acquire and store the phase-OTDR traces.
Figure 4.12 depicts the composite board with its embedded fibers already
connectorized and mounted upon a structure where an electromagnetic mini shaker
of 10 cm diameter controlled by a sinewave generator is placed underneath and used
as a vibration source.
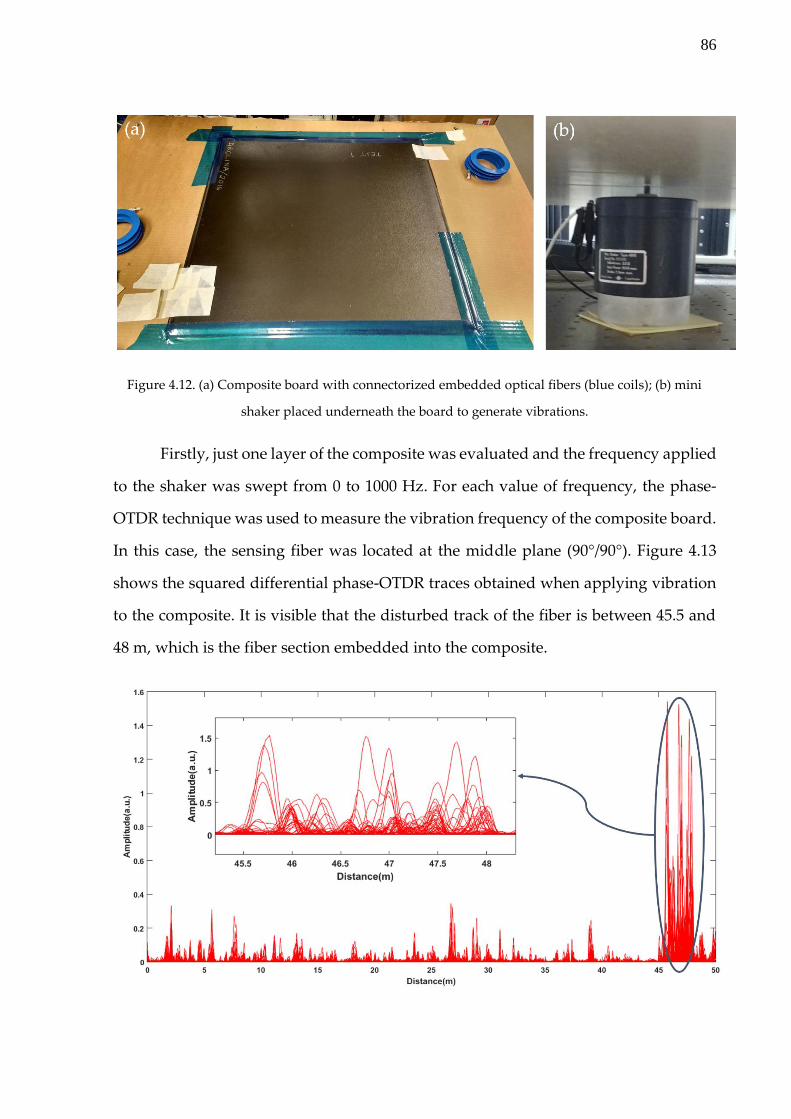
86
Figure 4.12. (a) Composite board with connectorized embedded optical fibers (blue coils); (b) mini
shaker placed underneath the board to generate vibrations.
Firstly, just one layer of the composite was evaluated and the frequency applied
to the shaker was swept from 0 to 1000 Hz. For each value of frequency, the phase-
OTDR technique was used to measure the vibration frequency of the composite board.
In this case, the sensing fiber was located at the middle plane (90°/90°). Figure 4.13
shows the squared differential phase-OTDR traces obtained when applying vibration
to the composite. It is visible that the disturbed track of the fiber is between 45.5 and
48 m, which is the fiber section embedded into the composite.
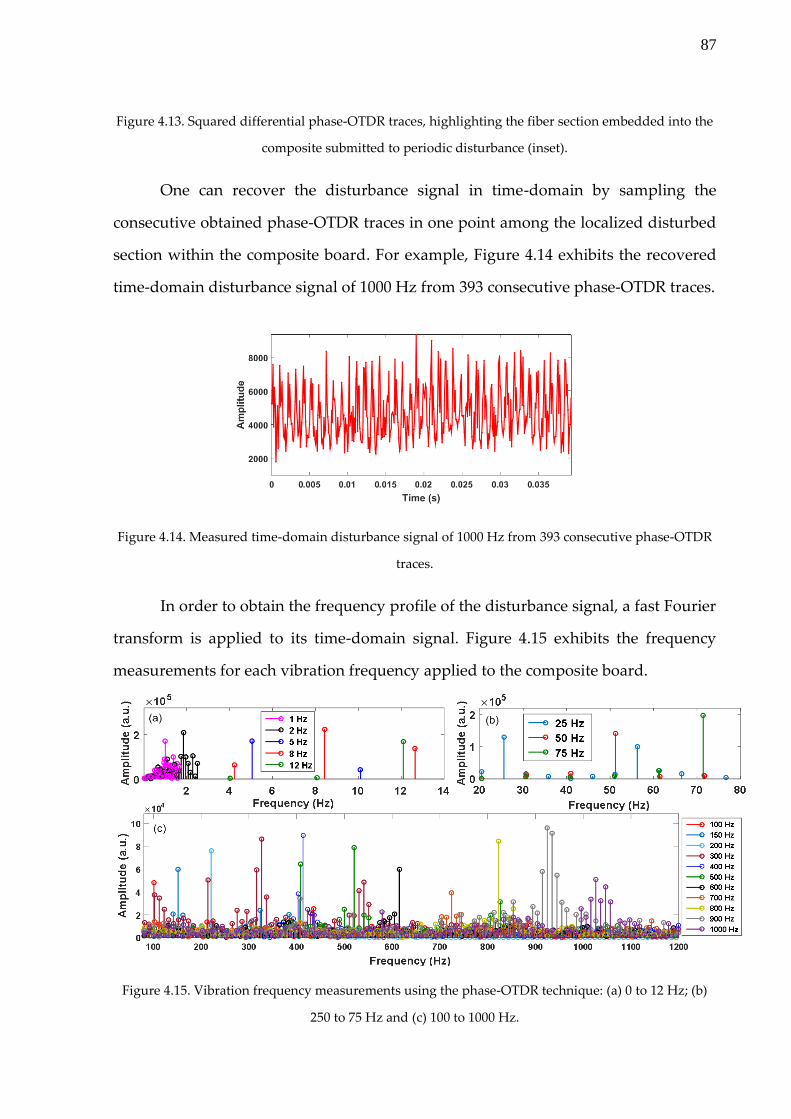
87
Figure 4.13. Squared differential phase-OTDR traces, highlighting the fiber section embedded into the
composite submitted to periodic disturbance (inset).
One can recover the disturbance signal in time-domain by sampling the
consecutive obtained phase-OTDR traces in one point among the localized disturbed
section within the composite board. For example, Figure 4.14 exhibits the recovered
time-domain disturbance signal of 1000 Hz from 393 consecutive phase-OTDR traces.
Figure 4.14. Measured time-domain disturbance signal of 1000 Hz from 393 consecutive phase-OTDR
traces.
In order to obtain the frequency profile of the disturbance signal, a fast Fourier
transform is applied to its time-domain signal. Figure 4.15 exhibits the frequency
measurements for each vibration frequency applied to the composite board.
Figure 4.15. Vibration frequency measurements using the phase-OTDR technique: (a) 0 to 12 Hz; (b)
250 to 75 Hz and (c) 100 to 1000 Hz.
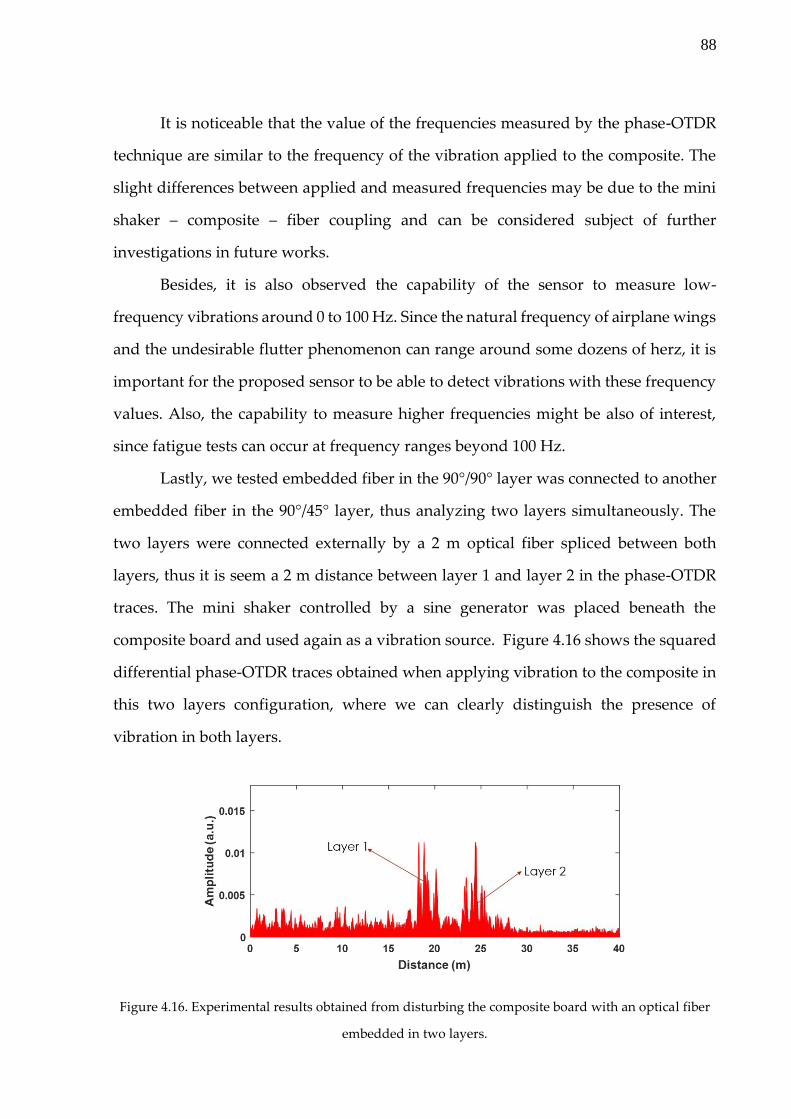
88
It is noticeable that the value of the frequencies measured by the phase-OTDR
technique are similar to the frequency of the vibration applied to the composite. The
slight differences between applied and measured frequencies may be due to the mini
shaker – composite – fiber coupling and can be considered subject of further
investigations in future works.
Besides, it is also observed the capability of the sensor to measure low-
frequency vibrations around 0 to 100 Hz. Since the natural frequency of airplane wings
and the undesirable flutter phenomenon can range around some dozens of herz, it is
important for the proposed sensor to be able to detect vibrations with these frequency
values. Also, the capability to measure higher frequencies might be also of interest,
since fatigue tests can occur at frequency ranges beyond 100 Hz.
Lastly, we tested embedded fiber in the 90°/90° layer was connected to another
embedded fiber in the 90°/45° layer, thus analyzing two layers simultaneously. The
two layers were connected externally by a 2 m optical fiber spliced between both
layers, thus it is seem a 2 m distance between layer 1 and layer 2 in the phase-OTDR
traces. The mini shaker controlled by a sine generator was placed beneath the
composite board and used again as a vibration source. Figure 4.16 shows the squared
differential phase-OTDR traces obtained when applying vibration to the composite in
this two layers configuration, where we can clearly distinguish the presence of
vibration in both layers.
Figure 4.16. Experimental results obtained from disturbing the composite board with an optical fiber
embedded in two layers.
89
The frequencies applied to the board were 1 Hz, 100 Hz and 200 Hz, and the
phase-OTDR was used to measure the vibration frequency in both layers. The results
are depicted in Figure 4.1.7
The value of the frequencies measured by the phase-OTDR technique are
compatible to the frequency of the vibration applied to the composite and also a similar
frequency spectrum is observed in both layers for each scenario. The capability to
evaluate two layers separately and simultaneously is important when analyzing
material fatigue, that may vary from layer to layer according to the curing process and
environmental conditions to which the composite is exposed.
Thus, this experimental validation proved the capacity of the presented method
to evaluate vibration frequencies in composite boards with embedded optical fibers,
which shows the suitability of the technique for aeronautic applications.
4.5. CHAPTER CONCLUSION
This chapter showed the experimental validation of a phase-OTDR technique to
localize and measure vibration frequencies in composite materials. In order achieve
this goal, 0.24 numerical aperture SMFs were embedded into aircraft composite
material and the proposed phase-OTDR method was applied to measure frequencies
in one layer, from 0 to 1000 Hz, and in two layers simultaneously, where vibration
frequency measurements of 1 Hz, 100 Hz and 200 Hz were demonstrated.
Since the natural frequency of airplane wings and the undesirable flutter
phenomenon can range around some dozens of herz, it is important for the proposed
sensor to be able to detect vibrations within these frequency values. Also, the capability
to measure higher frequencies might be also of interest, since fatigue tests can occur at
frequency ranges beyond 100 Hz. Thus, according to the experimental results, the
capacity of the presented method to evaluate vibration frequencies in composites with
embedded optical fibers was proved, which highlights its usefulness for aeronautic
applications.

90
Figure 4.17. Frequency measurements in two layers using the phase-OTDR technique: (a) 1 Hz; (b) 100
Hz and (c) 200 Hz.
91
CHAPTER 5
5. REAL-TIME DISTRIBUTED OPTICAL FIBER
MICROPHONE BASED ON PHASE-OTDR
The use of an optical fiber as a novel real-time distributed microphone is demonstrated
employing a phase-OTDR with direct detection. The method comprises a sample-and-
hold circuit capable of both tuning the receiver to an arbitrary section of the fiber
considered of interest and to recover in real-time the detected acoustic wave. The
system allows listening to the sound of a sinusoidal disturbance with variable
frequency, music, footsteps, machines, human voice, knocks and underwater sounds
with ~60 cm of spatial resolution through hundreds of meters of optical fiber. Part of
the experimental results obtained in this chapter were published at the Optics Express
Journal and to the IMOC 2017.
5.1. OVERVIEW
Distributed acoustic sensors (DAS) based on optical fibers and Rayleigh scattering
have been widely exploited in the last three decades, as reported in Chapter 2,
exploiting the fibers small dimensions, immunity to electromagnetic interference, long
perimeter coverage and large bandwidth [67]. Like other distributed fiber sensing
techniques, DAS also offers high multiplexing capability as well as the possibility of
using standard telecommunication fibers and telecommunication demodulation
techniques [68].
92
The use of DAS as a distributed microphone allows extracting information from
sound which is useful to monitor perimeter security and equipment in industrial
plants, since it allows spatially locating the acoustic disturbance and its frequency
content. Recently, a distributed fiber microphone was reported based on the phase-
sensitive optical time-domain reflectometry technique (phase-OTDR) [44]. The
amount of data generated by a system used to monitor the acoustic response of the
entire fiber all the time is massive, and data acquisition to a memory followed by off-
line processing is required. This is a serious limitation, and most DAS systems reported
in the literature involve a posteriori analysis of recorded data. In that publication [44],
for example, consecutive phase-OTDR curves were acquired and processed off-line to
recover the sound signal.
In some cases, it would be very advantageous to listen to the acoustic signal in
real-time, without additional signal processing. In perimeter security for instance,
conventional DAS could be used in a distributed way to define when and where
intrusion takes place. From then on, one could listen to the sound generated at the
intrusion location in real-time, paying full attention to that point of the fiber, while
maintaining the distributed measurement capability in parallel, to keep tracking
possible new disturbance points. Another potential application of the technique would
be monitoring from the control room in real-time the sound from various machines in
a factory, one at a time.
In the present work, we demonstrate the implementation of a simple phase-
OTDR, capable of reproducing in real-time the sound detected along an arbitrary
section of a fiber length, while maintaining a good spatial resolution of ~60 cm. The
system developed is similar to a traditional phase-OTDR setup. In addition, it
incorporates a simple low-cost electronic sample-and-hold circuit providing short
reading time for good spatial resolution and storing the information for sufficiently
long time to reconstruct the detected acoustic wave. The sample-and-hold is triggered
after a delay which defines the point of the fiber to which one listens. An audio circuit
plays the recovered sound in real-time. In contrast to distributed microphones
93
reported in the literature, direct detection is employed, simplifying the receiver-side
topology and minimizing polarization fading phenomena [25].
In order to evaluate the proposed technique, sound disturbed a section of
optical fiber along a fiber link. A frequency-sweeping sinusoidal signal, music,
footsteps, machines, human voice, knocks and screw drops were used as acoustic
disturbance for testing. After tuning the delay, it was possible to recover and listen to
the applied disturbances, proving the suitability of this simple system as a real-time
fiber microphone capable of interrogating a fiber link.
5.2. METHODOLOGY
The experimental setup of the modified phase-OTDR is shown in Figure 5.1. The
transmitter-side of the setup comprises an ANDO AQ4321, which is a narrow
linewidth laser (NLL) with bandwidth ~ 200 kHz tuned to 1543.7 nm and producing 0
dBm power. This signal passes an external isolator and inputs a Thorlabs BOA1004PXS
gated semiconductor optical amplifier (SOA) to both amplify to 18 dBm and to carve
the cw laser light into optical pulses. The current pulse supplied to the SOA has 600
mA, lasts for 8 ns and has a repetition rate 20 kHz, which is the sampling rate of this
experiment. They are further amplified in a GNNettest BT-17 erbium-doped fiber
amplifier (EDFA). An optical circulator sends the coherent optical pulses into the fiber
under test, whose numerical aperture is 0.24. The length of the fiber and the sound
source depends on the experiment performed, as addressed in section 5.4.
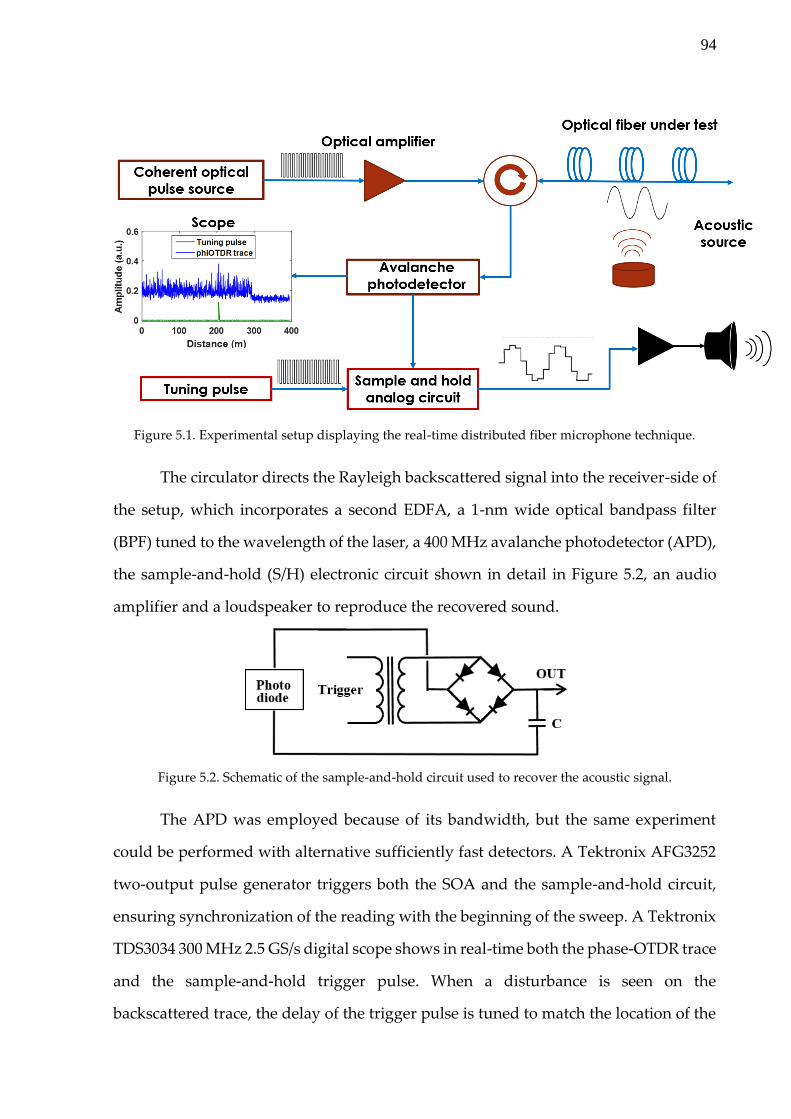
94
Figure 5.1. Experimental setup displaying the real-time distributed fiber microphone technique.
The circulator directs the Rayleigh backscattered signal into the receiver-side of
the setup, which incorporates a second EDFA, a 1-nm wide optical bandpass filter
(BPF) tuned to the wavelength of the laser, a 400 MHz avalanche photodetector (APD),
the sample-and-hold (S/H) electronic circuit shown in detail in Figure 5.2, an audio
amplifier and a loudspeaker to reproduce the recovered sound.
Figure 5.2. Schematic of the sample-and-hold circuit used to recover the acoustic signal.
The APD was employed because of its bandwidth, but the same experiment
could be performed with alternative sufficiently fast detectors. A Tektronix AFG3252
two-output pulse generator triggers both the SOA and the sample-and-hold circuit,
ensuring synchronization of the reading with the beginning of the sweep. A Tektronix
TDS3034 300 MHz 2.5 GS/s digital scope shows in real-time both the phase-OTDR trace
and the sample-and-hold trigger pulse. When a disturbance is seen on the
backscattered trace, the delay of the trigger pulse is tuned to match the location of the

95
disturbance. The sample-and-hold circuit zooms in only in the region of interest and
rebuilds in real-time the acoustic disturbance signal at this particular location in the
fiber. It consists of a small transformer with 7 windings in primary and secondary, a
diode bridge with 1N4138 diodes and a storage capacitor (C=100 pF). The latter feeds
a high-impedance audio amplifier and holds the voltage value read from the
photodiode until the next sampled pulse comes in. This home built sample-and-hold
circuit performed better than a commercial circuit tested previously.
It is worth stressing the importance of the hold function of the sample-and-hold
device to recover the signal. The samples have very short duration (ns) to allow for
good spatial resolution. It was found that reading only a sequence of such samples at
20 kHz rate with conventional audio circuitry was insufficient to reconstruct the sound
wave. Holding the sampled voltage value until the next sample is acquired allows the
system to recover the acoustic disturbance signal in real-time, which is later amplified
sufficiently to drive a loudspeaker.
5.3. SYSTEM CHARACTERIZATIONS
The spatial resolution of the system depends on the sample-and-hold time-window
(sampling time) and the pulse duration. In order to quantify the sampling time, square
pulses of three different widths (5, 10 and 20 ns) are fed into device input, replacing
the photodiode signal (Figure 5.2). If these pulses come much before or much after the
sampling, no charge is stored in the capacitor and the output is zero. Convolved
measurements are obtained by sweeping the delay between these input pulses and the
sample-and-hold trigger pulse, while monitoring the output voltage. The sampling
time is then found from the empiric deconvolution of the measured data and the
known durations of the input pulses. The experimental results of each convolution are
shown in Figure 5.3 (blue traces). The value of the sampling time found empirically
that best fits the data in Figure 5.3 is 6 ns, as seen in the simulated convolutions (red
dotted curves). In the calculations, it is assumed that the sampling is a square function.

96
This is in good agreement with the RC charging time of the circuit of Figure 5.2 with a
100 pF capacitance and total impedance slightly above 50 Ω.
Figure 5.3. Theoretical and experimental results of the convolution between the
sampling time and electrical pulses of (a) 5 ns, (b) 10 ns and (c) 20 ns width.
From these experiments, it is concluded that the sampling time is 6 ns, which
limits the spatial resolution to around 60 cm, even if the phase-OTDR pulses are very
short. Faster response time can be achieved for example by reducing the capacitance
value.
The time resolution of the total system including optical pulses was investigated
by probing acoustic disturbance employing the experimental setup depicted in Figure
5.1. The FUT was disturbed by driving the actuator loudspeaker with a continuous 80
Hz sinusoidal signal. The sample-and-hold device was triggered after a delay adjusted
in steps of 2 ns. This corresponded to scanning the disturbance location in the phase-
OTDR curve in 20-cm steps. The sound waveform was recorded during 3 s for every
delay. A total tuning interval of 16 ns was covered. Figure 5.4a shows the time-domain
sound waveforms for each tuning position. It is seen that the disturbing acoustic wave
is detectable only in the central traces (6-10 ns) of the phase-OTDR response. The
average of the absolute value of the amplitude for each delay is plotted in Figure 5.4b
(blue dots). Its full-width-at-half-maximum (FWHM) measures 6 ns, which indicates a
spatial resolution ~60 cm for the phase-OTDR system.

97
Figure 5.4. (a) Experimental results of the system spatial resolution evaluation using
acoustic disturbance; (b) Measurement of the FWHM of the delay which captures a
signal of large amplitude.
5.4. SOUND LISTENING EXPERIMENTS
5.4.1. FREQUENCY SWEEP, VOICE AND MUSIC
In order to evaluate the ability of the system to reproduce intelligible sound a
sinusoidal signal was used to disturb a 60-cm section of a 300 m fiber. The frequency
was swept manually from ~0 to 2000 Hz. The reproduced sound was recorded by
tuning the delay of the sample-and-hold circuit to match the disturbed section of the
fiber, as explained in Section 2. The recording is available in [69]. From this audio file,
it is possible to recognize the frequency sweep in time, which validates the technique
for listening to single tone sounds.
The capability of the system to detect and reproduce music was tested in the
following. A 20 seconds segment of Beethoven’s 5th Symphony played through the
actuator loudspeaker was reproduced by the phase-OTDR system in real time and
recorded. The detected sound can be found in [69]. Figure 5.5a shows the acquired
sound waveform in the time-domain. The capability of the system to detect and
reproduce in real-time complex acoustic disturbance such as music is noticeable.
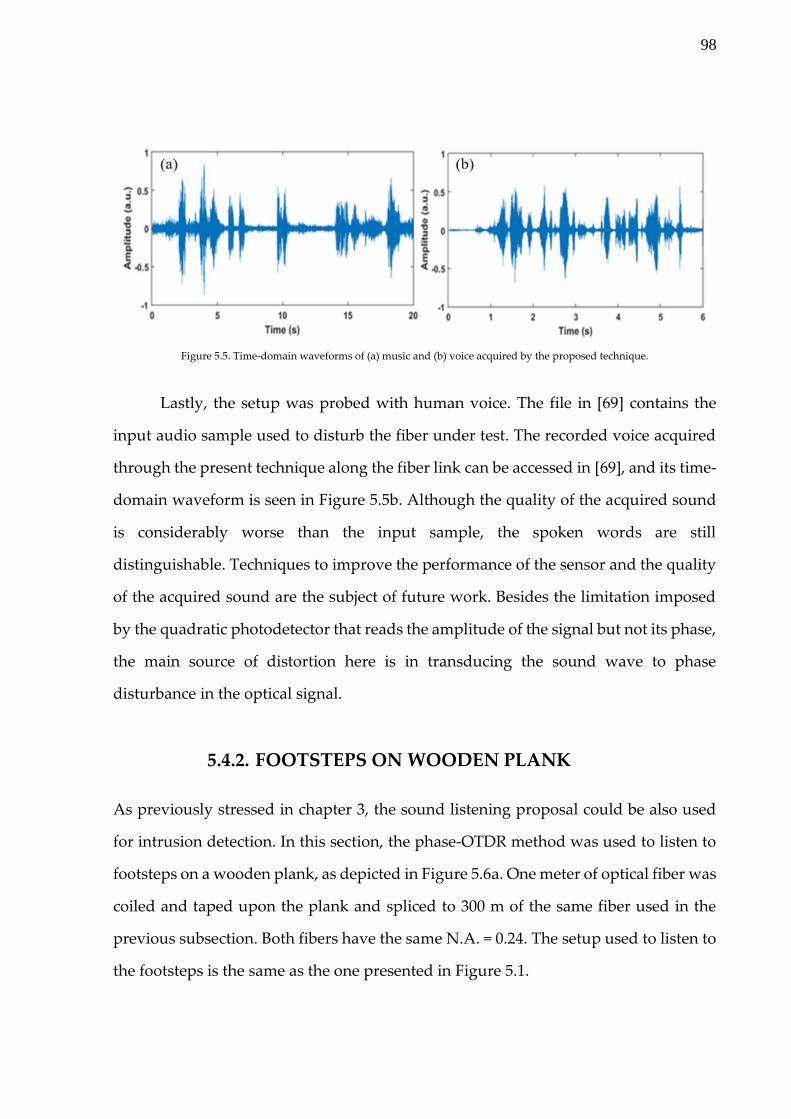
98
Figure 5.5. Time-domain waveforms of (a) music and (b) voice acquired by the proposed technique.
Lastly, the setup was probed with human voice. The file in [69] contains the
input audio sample used to disturb the fiber under test. The recorded voice acquired
through the present technique along the fiber link can be accessed in [69], and its time-
domain waveform is seen in Figure 5.5b. Although the quality of the acquired sound
is considerably worse than the input sample, the spoken words are still
distinguishable. Techniques to improve the performance of the sensor and the quality
of the acquired sound are the subject of future work. Besides the limitation imposed
by the quadratic photodetector that reads the amplitude of the signal but not its phase,
the main source of distortion here is in transducing the sound wave to phase
disturbance in the optical signal.
5.4.2. FOOTSTEPS ON WOODEN PLANK
As previously stressed in chapter 3, the sound listening proposal could be also used
for intrusion detection. In this section, the phase-OTDR method was used to listen to
footsteps on a wooden plank, as depicted in Figure 5.6a. One meter of optical fiber was
coiled and taped upon the plank and spliced to 300 m of the same fiber used in the
previous subsection. Both fibers have the same N.A. = 0.24. The setup used to listen to
the footsteps is the same as the one presented in Figure 5.1.

99
The receiver side of the phase-OTDR scheme was tuned to the plank location at
the same time it was stepped on several times, as indicated in Figure 5.6b. The time-
domain waveform of the 10 s of the footsteps acquired signal is shown in Figure 5.7
and its sound can be listened to in [70].
Figure 5.6. (a) Wooden plank with sensing optical fiber; (b) footsteps sound listening experiment.
Figure 5.7. (a) Time-domain waveform of the footsteps on the wooden plank; (b) Zoomed section
showing the dumped sound waveform of a footstep.
The results shown in Figure 5.7 and in the audio file confirm the capability of
the phase-OTDR system to listen to footsteps when the sensing fiber and the disturbing
source share the same medium, i.e. the wooden plank. The approximate frequency of
the acquired sound is ~1Hz, which within the 1 to 4 Hz frequency range expected for
footsteps.
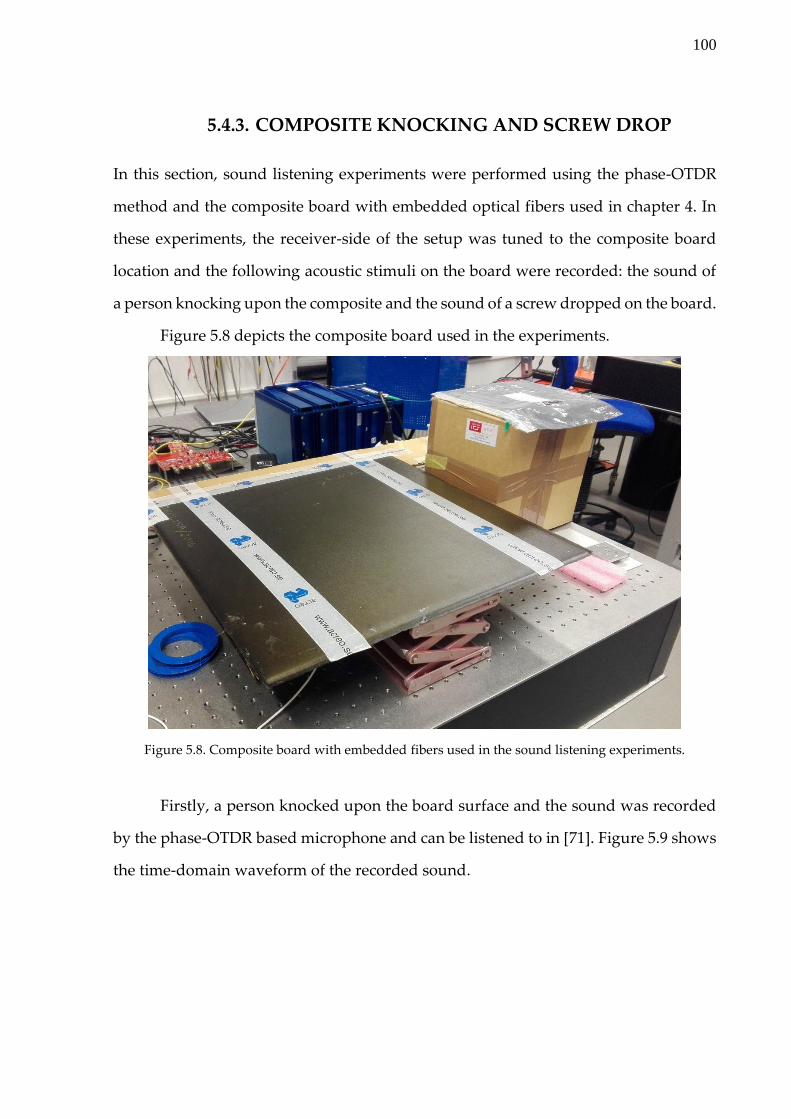
100
5.4.3. COMPOSITE KNOCKING AND SCREW DROP
In this section, sound listening experiments were performed using the phase-OTDR
method and the composite board with embedded optical fibers used in chapter 4. In
these experiments, the receiver-side of the setup was tuned to the composite board
location and the following acoustic stimuli on the board were recorded: the sound of
a person knocking upon the composite and the sound of a screw dropped on the board.
Figure 5.8 depicts the composite board used in the experiments.
Figure 5.8. Composite board with embedded fibers used in the sound listening experiments.
Firstly, a person knocked upon the board surface and the sound was recorded
by the phase-OTDR based microphone and can be listened to in [71]. Figure 5.9 shows
the time-domain waveform of the recorded sound.
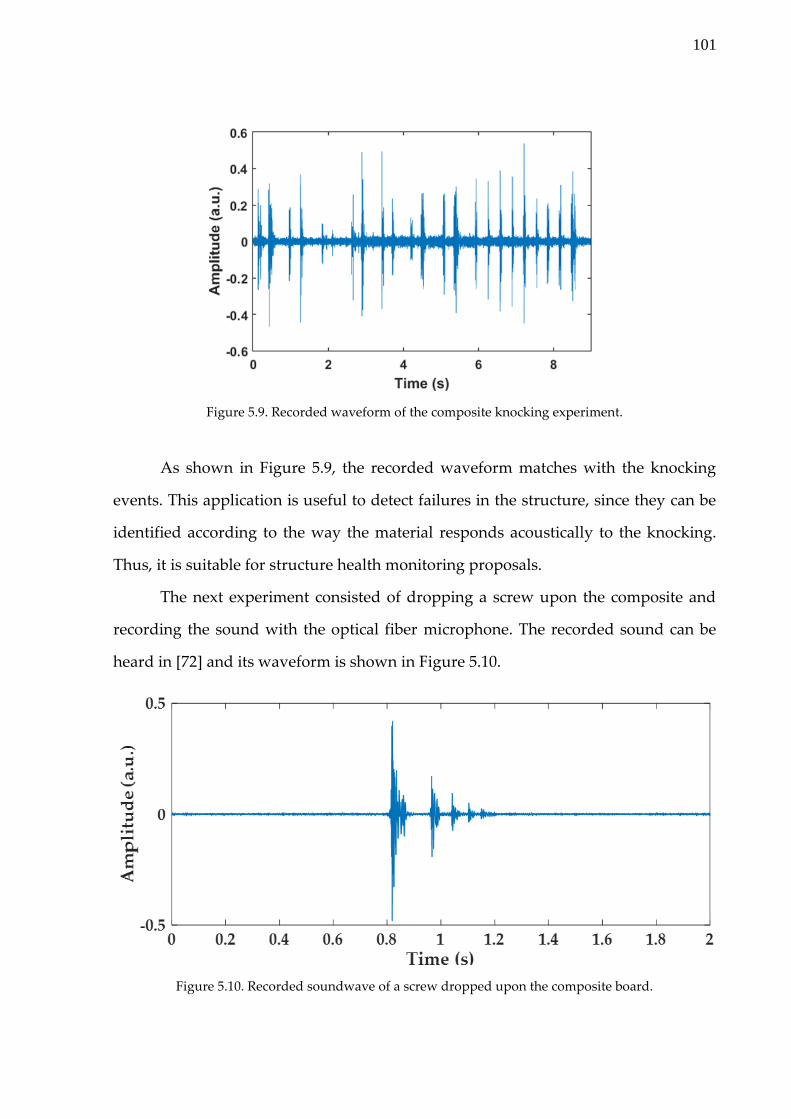
101
Figure 5.9. Recorded waveform of the composite knocking experiment.
As shown in Figure 5.9, the recorded waveform matches with the knocking
events. This application is useful to detect failures in the structure, since they can be
identified according to the way the material responds acoustically to the knocking.
Thus, it is suitable for structure health monitoring proposals.
The next experiment consisted of dropping a screw upon the composite and
recording the sound with the optical fiber microphone. The recorded sound can be
heard in [72] and its waveform is shown in Figure 5.10.
Figure 5.10. Recorded soundwave of a screw dropped upon the composite board.

102
According to the sound recorded and to its waveform, it is noticeable that the
screw bounces upon the board surface a couple of times before stopping, each time
exhibiting a lower amplitude. The results are in accordance to the event, which testifies
this method capability to detect and reproduce such impacts on a structure.
5.4.4. MULTIPLE MACHINES SIMULTANEOUS
LISTENING
The distributed capability of this system allied with the real-time spatial tuning makes
this method suitable for listening to several machines in a workshop, one at a time. In
this section, the phase-OTDR real-time microphone technique was employed to listen
to two different machines, a drill and a cooling water system pump, using a single
optical fiber. Both machines were attached to two different sections of the optical fiber,
as shown in Figure 5.11, and they were working simultaneously.
Figure 5.11. Phase-OTDR microphone applied to listen to two machines simultaneously.
Firstly, their locations along the optical fiber were tracked by monitoring on the
oscilloscope screen and locating the two amplitude changing points in the phase-
OTDR corresponding to the acoustic disturbance caused by both machines. Then, the
delay of the sample-and-hold circuit is adjusted by spatially tuning the trigger pulse,
matching it to the disturbed fiber section in the phase-OTDR curve, i. e. the machine
one wants to listen to first. Initially, the system was tuned to listen to the sound of the

103
drill, which was intermittently switched on and off. Then, 10 s of the detected sound
were recorded, which can be listened to in the link present in [73]. Also, its time-
domain waveform is shown in Figure 5.12.
Figure 5.12. Time-domain waveform of the drill sound acquired with the proposed method.
By analyzing and listening to the drill sound recorded with the proposed
distributed microphone, it is possible to distinguish between the time slots
corresponding to the machine switching on (slots 0~1 s, 2.7~3.7 s and 4.5~5 s) and to
the operating regimes (slots 1~1.7 s and 5~9.1 s). The occurrence of a higher amplitude,
i.e. louder sound in the switching events than in the operating regime time slots is
noticeable.
Further, the system was spatially tuned to listen to the cooling water system
pump sound. Forty seconds of its acoustic waveform are recorded and shown in
Figure 5.13. Also, the acquired sound can also be listened to in this link present in [73].

104
Figure 5.13. Time-domain waveform of the cooling water system pump sound acquired with
the proposed method.
The recorded sound revealed the pump operation cycle: its system actuates for
~11 s, every 2.5 s, as it is depicted in Figure 5.13, where acoustic signal is observed from
0 to 11 s, from 13.5 to 24.5 s and from 27 to 38.5 s. Outside these time slots only noise
is detected, and the observed behavior agrees with the pump operating cycles.
It is also important to mention that although both machines were in the same
room and operating simultaneously, the generated sounds were successfully
distinguished through the proposed method, i. e. there was no appreciable crosstalk
between both acoustic sources. The experimental results validate then the application
of the newly developed phase-OTDR based distributed microphone for listening to
and evaluating the operation of multiple machines in a workshop.
5.5. CHAPTER CONCLUSION
In this section a novel distributed optical fiber microphone based on phase-OTDR was
demonstrated. The method is capable to tune to different parts of the optical fiber with
60 cm of spatial resolution and listen to nearby sound disturbances in real time. The
method comprises a simplified phase-OTDR setup and, in addition, it incorporates a
simple low-cost electronic sample-and-hold circuit providing short reading time for

105
good spatial resolution and storing the information for sufficiently long time to
reconstruct the detected acoustic wave.
It was demonstrated that this technique can be used for both SHM and
surveillance applications. Sound sources like a frequency-sweeping sinusoidal signal,
music, footsteps, machines, human voice, knocks and screw drops were used as
acoustic disturbance for testing. After tuning the delay, it was possible to recover and
listen to the applied disturbances. Moreover, tests with two simultaneous acoustic
sources proved the capability to successfully recover both soundwaves without
crosstalk between them. Also, small disturbance events like the drop of a screw upon
a composite structure could be heard and recorded to analysis. It was proven as well
that the disturbance source does not have to be directly upon the sensing fiber to be
listened to, all it takes is to share a common medium with the optical fiber, e.g. the
wooden plank used for the footsteps listening experiment.
Although no quantitative tests were performed to investigate the capacity limits
of this microphone, it is worth mentioning that a qualitative experience was performed
by dropping a 10 x 5 cm piece of foam, 5 cm thick upon the composite with the
embedded optical fiber. The sound of the foam touching the composite surface was
clearly detected by the developed technique.
Thus, the experiments performed in this section prove the suitability of this
simple system as a real-time fiber microphone capable of interrogating a fiber link.
Next goals comprise the study of the sensitivity of the microphone regarding
minimum detectable acoustic pressure and also an optimized specialty fiber to
enhance the sound coupling between source and sensor.

106
107
CHAPTER 6
6. CONCLUSIONS
The main goal of this thesis was to make use of the phase-OTDR features to employ
this DAS technique as key enabling technology solution for applications concerning
SHM and surveillance. The motivations relied on the fact that both areas can be
covered using the same phase-OTDR method with minor setup changes, which
highlights the adaptability feature of this DAS approach. In this work, phase-OTDR
based techniques were investigate and the thesis main contributions were focused on
bringing innovative solutions and validations for SHM and surveillance applications.
The contribution of this thesis regarding aircraft SHM was the evaluation of the
phase-OTDR technique to measure vibration frequencies in carbon composites using
embedded optical fibers. Frequencies ranging from 0 to 1000 Hz were correctly
measured in two layers of the investigated composite board and this work was
published in the SPIE Smart Structures NDE Conference, 2107. Also, a literature
review was also performed in order to evaluate the influence of the embedded optical
fibers in the composite reinforcing carbon fibers, showing that no significant resistance
reduction is observed when the optical fibers are embedded in parallel with respect to
the material carbon fibers.
This work also contributed with intrusion detection systems based on DAS, by
proposing the use of parallel hardware architectures to implement real-time detecting
and locating perturbations through a phase-OTDR distributed vibration sensor. In this
multidisciplinary investigation, hardware architectures of the iterative moving
average filter and the Sobel filter were mapped on field programmable gate arrays,
exploring the intrinsic parallelism in order to achieve real-time requirements.
Experimental results validate the employment of this DAS technique allied with FPGA
108
solutions for surveillance applications. The experimental results were published in the
14th EEE International Conference on Networking, Sensing and Control, 2017.
Lastly, a novel distributed optical fiber tunable microphone was proposed is
demonstrated employing a phase-OTDR with direct detection. This technique covers
both the surveillance and SHM applications. The method comprises a sample-and-
hold circuit capable of both tuning the receiver to an arbitrary section of the fiber
considered of interest and to recover in real-time the detected acoustic wave. The
system allows listening to the sound of a sinusoidal disturbance with variable
frequency, music and human voice with ~60 cm of spatial resolution through a 300 m
long optical fiber. The experimental results were published in the Optics Express
journal, 2016, as show in Appendix A.
The developed system distributed capability allied with the real-time spatial
tuning makes it also suitable for listening to several machines in a workshop, one at a
time. Thus, the phase-OTDR real-time microphone technique was also employed to
listen to two different machines, a drill and a cooling water system pump, using a
single optical fiber. Both machines were attached to two different sections of the optical
fiber and they were both working simultaneously. By triggering the sample-and-hold
device, both machines were successfully listened to, along with the recording of their
soundwaves. These results were published in the IMOC 2017 International
Conference. Also, the knocking sounds on the carbon composite border evaluated in
the previous SHM section were also listened to, a result that reinforce the use of this
microphone for SHM. It is expected that these results will feed further researches
regarding sound coupling and analysis in optical fibers.
It is worth mentioning that this research drove the RISE Acreo laboratories into
a new business area of distributed acoustic sensors, a field yet unexplored by the
company, which aggregates a technological effort value to this work.
Thus, this thesis accomplished its main goal which was to employ DAS
techniques as key enabling technologies solutions for several applications. It is worthy
stressing that with a single setup of the parameters addressed in Table I it was possible

109
to cover the three proposed applications, reinforcing the versatility of this method.
Thus, phase-OTDR based techniques were studied and innovative solutions were
proposed and validated for SHM and surveillance applications.

110

111
BIBLIOGRAPHY
1. A. Barrias, J. R. Casas and S. Villalba, “A review of distributed optical fiber sensors for
civil engineering applications,” Sensors, vol. 16, n. 5, 738, May 2016.
2. Q. Cui, S. Pamukcu and M. Pervizpour, “Impact wave monitoring in soil using a
dynamic fiber sensor based on stimulated Brillouin scattering,” Sensors, vol 15, n.4, pp.
8163-8172, April 2015.
3. L. S. Grattan and B. T. Meggitt, “Optical fiber sensor technology,” Springer Science &
Business Media, 2013.
4. F. Peng, H. Wu, X. Jia, Y. Rao, Z. Wang and Z. Peng, “Ultra-long high-sensitivity Φ-
OTDR for high spatial resolution intrusion detection of pipelines,” Optics Express, vol.
22, n. 11, pp. 13804-13810, May 2014.
5. Z. Qin, L. Chen and X. Bao, “Continuous wavelet transform for non-stationary vibration
detection with phase-OTDR,” Optics Express, vol. 20, n. 18, pp. 20459-20465, August
2012.
6. Q. He, T. Zhu, X. Xiao, B. Zhang, D. Diao and X. Bao, “All fiber distributed vibration
sensing using modulated time-difference pulses,” IEEE Photonics Technology Lettters,
vol. 25, n. 20, pp. 1955-1957, October 2013.
7. D. Balageas, C. Fritzen and A. Guemes, “Structural health monitoring,” Wiley-ISTE,
2006.
8. Z. Qin, L. Chen and X. Bao, “Continuous wavelet transform for non-stationary vibration
detection with phase-OTDR,” Optics Express, vol. 20, n. 18, pp. 20459-20465, August
2012.
9. J. C. Juarez, E. W. Maier, K. N. Choi and H. F. Taylor, “Distributed fiber-optic intrusion
sensor system,” Journal of Lightwave Technology, vol. 23, n. 6, pp. 2081-2087, June
2005.
10. C. F. Bohren and D. R. Huffman, “Absorption and scattering of light by small particles,”
Wiley- VCH, 1998.
11. Q. Zengguang, “Distributed optical fiber vibration sensor based on Rayleigh
backscattering,” PhD Thesis, Univ. of Ottawa, Canada, 2013.
12. X. Bao and L; Chen, “Recent progress in distributed fiber optic sensors,” Sensors vol.
12, pp-8601-8639, June 2012.
13. H. F. Martins, “Distributed and remote fiber sensing assisted by Raman effect,” PhD
Thesis, Univ. do Porto/Univ. de Alcalá, Portugal/Spain, 2014.
112
14. Link: http://febus-optics.com/1/en/technology/systeme/
15. R. Billington, “Measurement methods for stimulated Raman and Brillouin scattering in
optical fibres,” NPL Report COEM 31, June 1999.
16. Link: http://hyperphysics.phy-astr.gsu.edu/hbase/atmos/blusky.html
17. I. Bikandi et al, “Spectral dependence of scattered light in step-index polymer optical
fibers by side-illumination technique,” Journal of Lightwave Technology, vol. 32, n.23,
pp. 4539-4543, December 2014.
18. M. Nakazawa, “Rayleigh backscattering theory for single-mode optical fibers,” J. Opt.
Soc. Am., vol. 73, n. 9, pp. 1175-1180, September 1983.
19. R. Hui and M. O’Sullivan, “Fiber optics measurement techniques,” Elsevier Academic
Press, USA 2009.
20. M. Barnoski and S. Jensen, “Fiber waveguides: a novel technique for investigating
attenuation characteristics,” Applied Optics, vol.15, n. 9, pp. 2112-2115, September
1976.
21. D. Derickson, “Fiber optic test and measurement,” Prentice Hall PTR, USA 1998.
22. H. Taylor and C. Lee, “Apparatus and method for fiber optic intrusion sensing,” US
Patent 5194847, 1993.
23. P. Healey, “Fading in heterodyne OTDR,” Electronic Letters, vol. 20, n.1, pp. 30-32,
November 1983.
24. J. Park, W. Lee and H. Taylor, “A fiber optic intrusion sensor with the configuration of
an optical time domain reflectometer using coherent interference of Rayleigh
backscattering,” SPIE vol. 3555, pp. 49-56, 1998.
25. M. Ren, L. Chen and X. Bao, “Theoretical and experimental analysis of phase-OTDR
based on polarization diversity detection,” IEEE Photonics Technology Letters, vol. 28,
n. 6, pp. 697-700, December 2015.
26. Y. Lu, T. Zhu, L. Chen and X. Bao, “Distributed vibration sensor based on coherent
detection of phase-OTDR,” Journal of Lightwave Technology, vol. 28, n. 22, pp. 3243-
3249, November 2010.
27. J. Juarez, E. Maier, K. Choi and H. Taylor, “Distributed fiber-optic intrusion sensor
system,” Journal of Lightwave Technology, vol. 23, n. 6, pp. 2081-2087, June 2005.
28. J. Juarez and H. Taylor, “Field test of a distributed fiber-optic intrusion sensor system
for long perimeters,” Applied Optics, vol. 46, n. 11, pp. 1968-1971, April 2007.
29. C. Madsen, T. Bae and R. Atkins, “Long fiber-optic perimeter sensor: signature
analysis,” Photonic Applications Systems Technologies Conference, PWA5, May 2007.
113
30. Y. Rao, J. Li, Z. Ran and K. Xie, “Distributed intrusion detection based on combination
of phase-OTDR and pOTDR,” Proc. of SPIE, vol. 7004, May 2008.
31. Z. Ran, Y. Rao, L. Luo, S. Xiong, Q. Deng, “Phase-OTDR used for providing security
service in EPON,” 14th OECC, July 2009.
32. Z. Pan, K. Liang, Q. Ye, H. Cai, Q. Qu and Z. Fang, “Phase-sensitive OTDR system
based on digital coherent detection,” Proc. of ACP, vol. 8311, 2011.
33. Z. Qin, L. Chen and X. Bao, “Continuous wavelet transform for non-stationary vibration
detection with phase-OTDR,” Optics Express, vol. 20, n. 18, pp. 20459-20465, August
2012.
34. T. Zhu, X. Xiao, Q. He and D. Diao, “Enhancement of SNR and spatial resolution in
phase-OTDR system by using two-dimensional edge detection method,” Journal of
Lightwave Technology, vol. 31, n. 17, pp. 2851-2856, September 2013.
35. H. Martins et al, “Coherent noise reduction in high visibility phase-sensitive optical time
domain reflectometer for distributed sensing of ultrasonic waves,” Journal of Lightwave
Technology, vol. 31, n. 23, pp. 3631-3637, December 2013.
36. Q. et al, “All fiber distributed vibration sensing using modulated time-difference
pulses,” IEEE Photonics Technology Letters, vol. 25, n. 20, pp. 1955-1957, October
2013.
37. Z. Zhong et al, “Influences of laser source on phase-sensitivity optical time-domain
reflectometer-based distributed intrusion sensor,” Applied Optics, vol. 53, n. 21, pp.
4645-4650, July 2014.
38. Z. Wang et al, “Phase-sensitive optical time-domain reflectometry with Brillouin
amplification,” Optics Letters, vol. 39, n.15, pp. 4313-4316, August 2014.
39. H. Martins et al, “Phase-sensitive optical time domain reflectometer assisted by first-
order Raman amplification for distributed vibration sensing over > 100 km,” Journal of
Lightwave Technology, vol. 32, n. 8, pp. 1510-1518, April 2014.
40. F. Peng et al, “Ultra-long high-sensitivity Φ-OTDR for high spatial resolution intrusion
detection of pipelines,” Optics Express, vol. 22, n. 11, pp. 13804-13810, June 2014.
41. C. Wang et al, “Distributed acoustic mapping based on self-interferometry of phase-
OTDR,” ACP 2014, ATh3A, 2014.
42. H. Wu et al, “Separation and determination of the disturbing signals in phase-sensitive
optical time domain reflectometry (phase-OTDR),” Journal of Lightwave Technology,
vol. 33, n. 15, pp. 3156-3162, August 2015.
114
43. G. Fang, T. Xu, S. Feng and F. Li, “Phase-sensitive optical time domain reflectometer
based on phase-generated carrier algorithm,” Journal of Lightwave Technology, vol. 33,
n. 13, pp. 2811-2816, July 2015.
44. Y. Wu et al, “Distributed fiber voice sensor based on phase-sensitive optical time-
domain reflectometry,” IEEE Photonics Journal, vol. 7, n. 6, 6803810, December 2015.
45. C. Baker et al, “Enhancement of optical pulse extinction-ratio using the nonlinear Kerr
effect for phase-OTDR,” Optics Express, vol. 24, n.17, pp. 19424-19434, August 2016.
46. M. Zhang, S. Wang, Y. Zheng and Y. Yang, “Enhancement for phase-OTDR
performance by using narrow linewidth light source and signal processing,” Photonic
Sensors, vol. 6, n.1, pp. 58-62, 2016.
47. J. Zhang et al, “Modulated pulses based high spatial resolution distributed fiber system
for multi-parameter sensing,” Optics Express, vol. 24, n. 24, pp.27482-27493,
November 2016.
48. Y. Shang et al, “Phase-OTDR based on space difference of Rayleigh backscattering,”
15th ICOCN, 2016.
49. D. Iida, K. Toge and T. Manabe, “Distributed measurement of acoustic vibration
location with frequency multiplexed phase-OTDR,” Optical Fiber Technology, vol. 36,
pp. 19-25, February 2017.
50. J. Pastor-Graells, “Chirped-pulse phase-sensitive reflectometer assisted by first-order
Raman amplification,” Journal of Lightwave Technology, vol. 35, n. 21, pp. 4677-4683,
September 2017.
51. C. Franciscangelis, C. Floridia and F. Fruett, “Optical fibre intrusion detection method
based on Lefevre-loop and bidirectional polarization optical time-domain reflectometer-
C technique,” The Journal of Engineering, 2 pp., November 2015.
52. A. Owen, G. Duckworth and J. Worsley, “OptaSense: Fibre optic distributed acoustic
sensing for border monitoring,” IEEE Conf. Intelligence and Security Informatics, pp.
362-364, August 2012.
53. X. Yu et al, “Phase-sensitive optical time domain reflectometer for distributed fence-
perimeter intrusion detection,” SPIE Int. Conf. Optical Fiber Sensors and Applications,
October 2015.
54. D. M. Munoz, C. Franciscangelis, W. Margulis and I. Söderquist, “Low latency
disturbance detection using distributed optical fiber sensors,” Proc. of IEEE 14th
International Conference on Networking, Sensing and Control (ICNSC), May 2017.
115
55. K. Diamanti and C. Soutis, “Structural health monitoring techniques for aircraft
composite structures,” Progress in Aerospave Sciences 46, pp. 342-352, May 2010.
56. M. Kehow, “A historical overview of flight flutter testing,” NASA Technical
Memorandum 4720, October 1995.
57. R. Di Sante, “Fibre optic sensors for structural health monitoring of aircraft composite
structures: recent advances and applications,” Sensors, vol. 15, pp. 18666-18713, July
2015.
58. Link: http://www.quartus.com/resources/white-papers/composites-101/
59. Link: https://www.wired.com/2010/03/flutter-testing-aircraft/
60. T. Krishnamurthy, “Frequencies and flutter speed estimation for damaged aircraft wing
using scaled equivalent plate analysis,” 51st AIAA, 2010-2759, April 2010.
61. Link: https://www.compositesworld.com/articles/structural-health-monitoring-
composites-get-smart
62. C. Franciscangelis et al, “Vibration measurement on composite material with embedded
optical fiber based on phase-OTDR,” Proc. of SPIE Smart Structures NDE, 101683Q,
March 2017.
63. Link: http://altairenlighten.com/in-depth/fiber-reinforced-composites/
64. J. Silva et al, “Mechanical characterization of composites with embedded optical
fibers,” Journal of Composite Materials, vol. 39, n. 14, pp. 1261-1281, October 2004.
65. K. Shivakumar, “Mechanics of failure of composite laminates with an embedded fiber
optic sensor,” Journal of Composite Materials, vol. 38, n. 8, pp. 669-680, 2004.
66. Link: https://fibercore.com/product/polyimide-coated-sm-fiber
67. L. Palmieri and L. Schenato, “Distributed optical fiber sensing based on Rayleigh
scattering,” The Open Opt. Journal 7, 104-127 (2013).
68. Z. Wang, L. Zhang, S. Wang, N. Xue, F. Peng, M. Fan, W. Sun, X. Qian, J. Rao, and
Y. Rao, "Coherent Φ-OTDR based on I/Q demodulation and homodyne detection," Opt.
Express, vol. 24, n. 2, 853-858, 2016.
69. C. Franciscangelis, W. Margulis, L. Kjellberg, I. Söderquist and F. Fruett, “Real-time
distributed fiber microphone based on phase-OTDR,” Opt. Express, vol. 24, n. 26, pp.
29597-29602, December 2016.
70. Link: https://clyp.it/ypv3zvfv
71. Link: https://clyp.it/4t43xzr4
72. Link: https://clyp.it/yyzb2cek

116
73. C. Franciscangelis, W. Margulis, L. Kjellberg, C. Floridia and F. Fruett, “Real-time
multiple sound listening using a phase-OTDR based distributed microphone,” Proc. of
IMOC 2017, August 2017.
117
APPENDIX A: PUBLISHED PAPERS
This appendix section summarizes the papers published by the author during the PhD
period.
1. C. Franciscangelis, C. Floridia, G. C. Simões, F. Schmmidt and F. Fruett, “On-
field distributed first-order PMD measurement based on pOTDR and optical
pulse width sweep,” Opt. Express, vol. 23, n. 10, pp. 12582-12594, May 2015.
2. C. Franciscangelis, C. Floridia and F. Fruett, “Optical fibre intrusion detection
method based on Lefevre-loop and bidirectional polarisation optical time-
domain reflectometer-C technique,” The Journal of Engineering, pp. 1-2,
October 2015.
3. C. Franciscangelis, W. Margulis, L. Kjellberg, I. Söderquist and F. Fruett, “Real-
time distributed fiber microphone based on phase-OTDR,” Opt. Express, vol.
24, n. 26, pp. 29597-29602, December 2016.
4. C. Franciscangelis et al, “Vibration measurement on composite material with
embedded optical fiber based on phase-OTDR,” Proc. of SPIE Smart Structures
NDE, 101683Q, March 2017.
5. D. M. Munoz, C. Franciscangelis, W. Margulis and I. Söderquist, “Low latency
disturbance detection using distributed optical fiber sensors,” Proc. of IEEE 14th
International Conference on Networking, Sensing and Control (ICNSC), May
2017.
6. C. Franciscangelis, W. Margulis, L. Kjellberg, C. Floridia and F. Fruett, “Real-
time multiple sound listening using a phase-OTDR based distributed
microphone,” Proc. of IMOC 2017, August 2017.