universidade federal do rio grande do norte centro de ... · oportunidade de realizar o curso de...
TRANSCRIPT

i
Universidade Federal do Rio Grande do Norte
Centro de Ciências Exatas e da Terra
Programa de Pós-Graduação em
Geodinâmica e Geofísica
EVOLUÇÃO DOS SISTEMAS DE FALHAS DE BORDA DO RIFTE
POTIGUAR COM BASE EM CURVAS DE CRESCIMENTO DE
FALHAS
Autora:
Alanny Christiny Costa de Melo
Orientador:
Prof. Dr. David Lopes de Castro (PPGG/UFRN)
Coorientador:
Prof. Dr. Francisco Hilário Rego Bezerra (PPGG/UFRN)
Dissertação n.o
167/PPGG
Natal- RN, março de 2016.
ii
Universidade Federal do Rio Grande do Norte
Centro de Ciências Exatas e da Terra
Programa de Pós-Graduação em
Geodinâmica e Geofísica
Autora:
Alanny Christiny Costa de Melo
Dissertação de mestrado apresentada em 04 de
março de 2016 ao Programa de Pós-Graduação
em Geodinâmica e Geofísica da Universidade
Federal do Rio Grande do Norte
(PPGG/UFRN) como requisito à obtenção do
Título de Mestre em Geodinâmica e Geofísica
com área de concentração em Geofísica.
Comissão Examinadora:
Prof. Dr. David Lopes de Castro (PPGG/UFRN – Orientador)
Prof. Dra. Helenice Vital (PPGG/UFRN – Membro Interno)
Prof. Dra. Roberta Mary Vidotti (IG/UNB – Membro Externo)
Natal- RN, março de 2016.

iii
Catalogação da Publicação na Fonte Universidade Federal do Rio Grande do Norte - UFRN Sistema de Bibliotecas -
SISBI
Melo, Alanny Christiny Costa de.
Evolução dos sistemas de falhas de borda do Rifte Potiguar com
base em curvas de crescimento de falhas / Alanny Christiny Costa de
Melo. - Natal, 2016.
ix, 58f: il.
Orientador: Prof. Dr. David Lopes de Castro. Coorientador:
Prof. Dr. Francisco Hilário Rego Bezerra.
Dissertação (Mestrado) - Universidade Federal do Rio Grande do
Norte. Centro de Ciências Exatas e da Terra. Programa de Pós
Graduação em Geodinâmica e Geofísica.
1. Modelagem gravimétrica 3D. 2. Crescimento de falha. 3.
Evolução do rifte. 4. Bacia Potiguar. I. Castro, David Lopes de.
II. Bezerra, Francisco Hilário Rego. III. Título.
RN/UF/CCET CDU 543.21

i
AGRADECIMENTOS
Agradeço à ANP pela cessão dos dados gravimétricos, sísmicos e de poços, ao CNPq
pela concessão da bolsa que permitiu a realização deste trabalho, e ao PPGG pela
oportunidade de realizar o curso de mestrado, em especial a Nilda Araújo, sempre muito
prestativa e atenciosa.
Agradeço também ao meu orientador, o prof. Dr. David Lopes de Castro por ter me
apresentado ao mundo da Geofísica, tendo a paciência e a dedicação de ensinar desde os
conceitos mais básicos aos softwares e procedimentos mais elaborados.
Ao professor Dr. Francisco Hilário Rego Bezerra por estar presente nesta pesquisa,
desde a elaboração do plano de trabalhos ao artigo final. E também ao prof. Dr. Giovanni
Bertotti, que se fez presente não só quando estava em Natal, sempre atencioso nos enviando
suas observações e sugestões.
Quero agradecer aos meus pais, Auridéa e Cláudio, meus maiores apoiadores,
sempre ansiando pelo melhor para mim.
Gostaria de agradecer ao meu namorado Danilo, por todo carinho e companheirismo,
e por se dispor a revisar o inglês do meu artigo.
E aos colegas do PPGG, que vivenciaram comigo dúvidas, angústias e alegrias,
desde o início processo de seleção do mestrado. Em especial aos novos amigos que fiz:
Suelen Ferreira, minha companheira de sala, que com toda sua calma e tranquilidade me
ensinou a ter paciência para usar as mais variadas ferramentas do Geosoft; e ao David
Vasconcelos, peça fundamental para a confecção desta dissertação, responsável não só por me
ensinar fazer as figuras no Corel como também a estruturar todo o trabalho.
ii
RESUMO
A discussão sobre a evolução dos riftes da margem equatorial da América do Sul durante a
separação América do Sul-África no Jurássico/Cretáceo tem sido o foco de muitas pesquisas.
Mas a evolução de riftes com base em curvas de crescimento de falhas não tem sido
explorado. Neste sentido, nós investigamos Bacia Potiguar na margem Equatorial do Brasil
para entender a geometria das grandes falhas e a influência da heterogeneidade da crosta
terrestre e do fabric estrutural preexistente na evolução da arquitetura interna da bacia.
Estudos anteriores apontaram que o rifte é um meio gráben assimétrico alongado de direção
NE-SW. Para determinar o deslocamento máximo (Dmáx) e comprimento (L) dos principais
segmentos de falha de borda do Rifte Potiguar foram usados sísmica 2D, dados de poços e
modelagem gravimétrica 3D. A modelagem gravimétrica 3D foi parametrizada com os dados
de poços e interpretações das seções sísmicas. O grau de incerteza do modelo gravimétrico foi
da ordem 10% aos dados sísmicos e de poços. Por meio das curvas de crescimento de falhas
foi possível dividir as falhas de borda do rifte em quatro segmentos principais, os quais
forneceram valores Dmáx/L da mesma ordem de grandeza. As curvas de crescimento de falhas
sugerem que um mecanismo tectônico uniforme regional teria influenciado o crescimento dos
segmentos dessas falhas. As variações dos deslocamentos máximos ao longo dos segmentos
de falha indicam que estes segmentos se desenvolveram de forma independente durante o
início do rifteamento e, posteriormente, foram unidos por ligações rigídas e flexíveis. Este
último chegou a formar uma rampa de alívio entre as falhas de Baixa Grande e Carnaubais.
Nos pontos de interligação entre falhas as taxas Dmáx / L são mais elevadas devido à
interferência do crescimento dos segmentos de falha adjacentes. A evolução do Rifte Potiguar
foi dividida em cinco etapas com base nas relações Dmáx/L, que foram correlacionadas com as
principais fases tectônicas da separação entre a América do Sul e África no Cretáceo Inferior.
Palavras-chave: modelagem gravimétrica 3D; crescimento de falha; evolução do rifte; Bacia
Potiguar.

iii
ABSTRACT
The discussion about rift evolution in the Brazilian Equatorial margin during the South
America-Africa breakup in the Jurassic/Cretaceous has been focused in many researches. But
rift evolution based on development and growth of faults has not been well explored. In this
sense, we investigated the Cretaceous Potiguar Basin in the Equatorial margin of Brazil to
understand the geometry of major faults and the influence of crustal heterogeneity and
preexisting structural fabric in the evolution of the basin internal architecture. Previous studies
pointed out that the rift is an asymmetrical half-graben elongated along the NE-SW direction.
We used 2D seismic, well logs and 3D gravity modeling to analyze four major border fault
segments and determine their maximum displacement (Dmax) and length (L) ratio in the
Potiguar Rift. We constrained the 3D gravity modeling with well data and the interpretation of
seismic sections. The difference of the fault displacement measured in the gravity model is in
the order of 10% compared to seismic and well data. The fault-growth curves allowed us to
divide the faulted rift border into four main fault segments, which provide roughly similar
Dmax/L ratios. Fault-growth curves suggest that a regional uniform tectonic mechanism
influenced growth of the rift fault segments. The variation of the displacements along the fault
segments indicates that the fault segments were formed independently during rift initiation
and were linked by hard and soft linkages. The latter formed relay ramps. In the
interconnection zones the Dmax/L ratios are highest due to interference of fault segment
motions. We divided the evolution of the Potiguar Rift into five stages based on these ratios
and correlated them with the major tectonic stages of the breakup between South America and
Africa in Early Cretaceous.
Keywords: 3D gravity modeling, fault growth, rift evolution, Africa-South America breakup.

iv
SUMÁRIO
Agradecimentos ..................................................................................................................... i
Resumo .................................................................................................................................. ii
Abstract ................................................................................................................................. iii
Sumário .................................................................................................................................. iv
Lista de Figuras ..................................................................................................................... vi
Lista de Tabelas ..................................................................................................................... ix
1 – INTRODUÇÃO ............................................................................................................... 1
1.1 – Apresentação ................................................................................................................. 1
1.2 – Justificativa ................................................................................................................... 1
1.3 – Localização da área de estudo ..................................................................................... 3
1.4 – Objetivos ........................................................................................................................ 3
2 – CONTEXTO GEOLÓGICO DA BACIA POTIGUAR ............................................... 5
2.1 – Contexto litoestratigráfico ........................................................................................... 5
2.2 – Contexto tectônico ....................................................................................................... 6
2.2.1 – Fase Rifte ..................................................................................................................... 7
2.2.2 – Fase Pós-Rifte .............................................................................................................. 8
3 – CRESCIMENTO DE FALHAS ..................................................................................... 10
3.1 – Tipos de crescimento e ligações de falhas ................................................................... 11
4 – ASPECTOS METODOLÓGICOS ................................................................................ 14
4.1 – Dados de sísmica e poços exploratórios ...................................................................... 14
4.2 – Gravimetria .................................................................................................................. 16
4.2.1 – Modelagem Gravimétrica 3D ...................................................................................... 18
5 – ARTIGO - Rift fault geometry and evolution in the Cretaceous Potiguar Basin (NE
Brazil) based on fault growth models .................................................................................. 24
Abstract .................................................................................................................................. 25
5.1 Introduction ..................................................................................................................... 26
5.2 Geological setting ............................................................................................................. 27
5.3 Determination of fault geometry and throw using seismic and well data .................. 29
5.4 Gravity data and modeling ............................................................................................. 29
5.5 Analysis of fault-growth curves ...................................................................................... 31
5.5.1. Growth of fault segments .............................................................................................. 31

v
5.5.2. Fault segments of the Potiguar rift ............................................................................... 31
5.5.3. Fault-growth curves from the Potiguar rift ................................................................... 32
5.6 The Potiguar rift evolution based on growth-fault models ......................................... 33
5.7 Conclusions ..................................................................................................................... 35
References............................................................................................................................... 36
Tables ...................................................................................................................................... 40
Figures .................................................................................................................................... 40
6 – CONSIDERAÇÕES FINAIS .......................................................................................... 52
REFERÊNCIAS BIBLIOGRÁFICAS ................................................................................ 54
vi
LISTA DE FIGURAS
Figura 1.1: Mapa de localização do Rifte Potiguar (Modificado de Bertani et al., 1990; De
Castro e Bezerra, 2015). .......................................................................................................... 1
Figura 2.1: Carta estratigráfica da Bacia Potiguar (Modificado de Pessoa Neto et al., 2007).
................................................................................................................................................. 6
Figura 2.2: Mapa do arcabouço estrutural do Rifte Potiguar (Adaptado de Cremonini et al.,
1996). ...................................................................................................................................... 7
Figura 2.3: Modelo estrutural dos estágios de rifteamento durante a abertura do Atlântico Sul
e Equatorial (Adaptado de Matos, 1992). CG – Cráton Congo; CSF – Cráton São Francisco;
CSLAF – Cráton São Luiz/África Oeste. Traço pontilhado em preto: Linha de quebra
continental. ............................................................................................................................. 8
Figura 3.1: Propagação radial de falha, sendo que I, II e III representam três estágios
consecutivos de propagação de uma mesma falha (Modificado de Cartwright et al., 1995). 11
Figura 3.2: Evolução de três segmentos de falha isolados (A, B e C) que se interligam,
gerando uma falha única maior. (I) Segmentos de falhas isoladas que se propagam
radialmente. (II) Sobreposição e interação dos segmentos. (III) União dos três segmentos em
uma única falha maior (Modificado de Cartwright et al., 1995). ........................................... 12
Figura 3.3: Evolução de um sistema de falhas, através de uma modelagem numérica. (I)
Nucleação inicial de vários segmentos; (II) maior crescimento de alguns segmentos (W, X, Y,
Z); (III) Deformação localizada nas falhas z e y, enquanto a atividade nos segmentos
adjacentes já se encontra interrompida (Modificado de Cowie, 1998). ................................. 12
Figura 3.4: Modelo de crescimento de falha por Ligação Flexível (Adaptado de Kim &
Sanderson, 2004) .................................................................................................................... 13
Figura 3.5: Modelo de crescimento de falha por Ligação Rígida (Adaptado de Kim &
Sanderson, 2004) .................................................................................................................... 13
Figura 4.1: Mapa geológico da Bacia Potiguar com a localização das seções sísmicas e dos
poços exploratórios utilizados neste trabalho. ........................................................................ 14
Figura 4.2: Distribuição espacial das linhas sísmicas e poços (A, B e C) utilizados nesta
pesquisa. ................................................................................................................................. 15

vii
Figura 4.3: Seção sísmica 9 (A), interpretação sísmica (B) e modelo em profundidade (C) do
perfil, localizados na figura 4.1. ............................................................................................. 16
Figura 4.4: Mapa de anomalias Bouguer da Bacia Potiguar com a localização das estações
gravimétricas. ......................................................................................................................... 18
Figura 4.5: Técnica de modelagem que considera o pacote sedimentar e o embasamento
homogêneos (Adaptado de De Castro, 2005). ........................................................................ 19
Figura 4.6: Técnica de modelagem que considera o embasamento heterogêneo (Adaptado de
De Castro, 2005). .................................................................................................................... 19
Figura 4.7: Fluxograma da Modelagem Gravimétrica 3D, mostrando os passos e parâmetros
utilizados durante o processo de inversão. ............................................................................. 21
Figura 4.8: Localização dos dados gravimétricos, excluídos aqueles na região do rifte,
utilizados para calcular as anomalias do embasamento. ......................................................... 21
Figura 4.9: Mapas das modelagens obtidas para cada iteração. ............................................. 22
Figure 5.1: (A) Schematic geological map of the northeastern Brazil and its main Cretaceous
rift basins (AR: Araripe, IG: Iguatu, JA: Jatobá, PO: Potiguar, RE: Recôncavo, RP: Rio do
Peixe, SA: Sergipe-Alagoas), adapted from Matos (1992) and De Castro (2011). (B)
Simplified geological map of the Potiguar Basin, showing the Potiguar Rift and the major
border faults (modified from Bertani et al., 1990; De Castro and Bezerra, 2015). ................ 42
Figure 5.2: Gravity anomaly map of the Potiguar Basin with the location of gravity stations,
seismic sections and wells used in the present study. ............................................................ 43
Figure 5.3: Seismic section (A), seismic interpretation (B) and depth model (C) of the Profile
1 (location in Fig. 2). .............................................................................................................. 44
Figure 5.4: Seismic section (A), seismic interpretation (B) and depth model (C) of the Profile
9 (location in Fig. 2). .............................................................................................................. 45
Figure 5.5: Gravity residual anomaly map of the Potiguar Basin with rift faults mapped by
Matos (1992). ......................................................................................................................... 46
Figure 5.6: 3D gravity model of the basement relief. ............................................................. 47

viii
Figure 5.7: 3D gravity model of the Potiguar rift, showing the location of the measurement of
maximum fault displacements of the main border faults (A – Apodi (red); B – Baixa Grande
(blue); C and D– Carnaubais (green and purple). ................................................................... 48
Figure 5.8: Dmax/L curves of the Potiguar rift fault segments (A, B, C, and D in Fig. 7).
................................................................................................................................................. 49
Figure 5.9: Potiguar Rift evolution based on Dmax/L curves derived from 3D gravity model
and seismic data. Fault segments: A – Apodi, B – Baixa Grande, B – SW Carnaubais, D – NE
Carnaubais. ............................................................................................................................. 50
Figure 5.10: Paleogeographic position of South America and Africa before the Pangea
breakup in the Early Cretaceous (Modified from Matos, 1992). ............................................ 51

ix
LISTA DE TABELAS
Tabela 4.1: Profundidades dos topos das principais formações interceptada nos poços. ....... 15
Tabela 4.2: Velocidades e densidades médias das unidades geológicas da Bacia Potiguar. ..16
Tabela 4.3: Relação entre a profundidade do embasamento obtida a cada iteração. ............. 23
Table 5.1: Velocities and densities of stratigraphic units of the Potiguar Basin. ................... 40

1
1 INTRODUÇÃO
1.1 Apresentação
O presente trabalho constitui a dissertação de mestrado que integra os requisitos
necessários para a obtenção do título de Mestre em Geodinâmica e Geofísica do Curso de
Mestrado do Programa de Pós-graduação em Geodinâmica e Geofísica (PPGG) da
Universidade Federal do Rio Grande do Norte (UFRN). Esta pesquisa foi desenvolvida sob a
orientação do Prof. Dr. David Lopes de Castro e pela qual foram abordadas as relações de
crescimento das falhas com base nos indicadores geométricos das falhas de borda da Bacia
Potiguar. A partir destas informações foi produzido um artigo científico submetido ao Journal
of South American Earth Sciences.
Na presente dissertação, foi efetuada uma modelagem gravimétrica 3D da porção
rifte da Bacia Potiguar. O procedimento de inversão utilizado estima as profundidades de uma
interface complexa, que separa dois meios geológicos (embasamento e bacia sedimentar),
contendo heterogeneidades de densidade. O processamento digital dos dados gravimétricos,
utilizando o software Oasis Montaj v.8.1, proporcionou a identificação do arcabouço
estrutural e a modelagem gravimétrica 3D do rifte. Através do software Bacia3D, foi possível
estimar a arquitetura interna da bacia, como também identificar o controle estrutural do
arcabouço pré-cambriano sobre a arquitetura interna da Bacia Potiguar.
1.2 Justificativa
A evolução e a geometria de sistemas rifte vêm sendo tema de muitos estudos
(Rosendahl, 1987; Larsen, 1988; Jackson & White, 1989; Nelson et al., 1992; Patton et al.,
1994; De Castro & Bezerra, 2015) sobre a influência de heterogeneidades crustais no controle
estrutural e evolução tectono-sedimentar de bacias cratônicas. A Bacia Potiguar mantém sua
porção rifte bem preservada sob um pacote sedimentar pós-rifte pouco espesso, sendo um
considerável alvo de pesquisas sobre o crescimento e reativações de falhas (Bezerra, et al.,
2011). Estudos demonstram que as rochas da Bacia Potiguar são afetadas por deformações
tectônicas provocadas por diferentes sistemas de falhas, como os Sistemas de Falhas Apodi,
Baixa Grande e Carnaubais (Bezerra & Vita-Finzi, 2000; Moura-Lima et.al, 2010).
O Sistema de Falhas de Apodi é representado por segmentos de falhas normais de
direção predominantemente NW-SE, o qual atinge profundidades em torno de 4,5 km
(Hoerlle et al., 2007; Rodrigues et al., 2014). A implantação da Falha de Apodi no
Neocomiano marca o fim da primeira fase do Rifte Potiguar. Esta falha também registra a
segunda fase do rifteamento da Bacia Potiguar, que é representado pela mudança de direção

2
dos esforços, deslocando a falha para E-W (Matos, 1992). Recentemente, De Castro e Bezerra
(2015) observaram que o deslocamento lateral do Sistema de Falhas Apodi condicionou a
deposição de unidades pós-rifte e exerceu controle estrutural da borda SW do Rifte Potiguar,
gerando o Gráben de Algodões.
A Falha de Baixa Grande localiza-se no extremo S-SW do Rifte Potiguar, limitando,
ao sul, o Gráben de Umbuzeiro e parte do Gráben de Apodi. Seu prolongamento para oeste
define, após sua inflexão para NW, o Sistema de Falhas de Apodi, já nos limites do Gráben de
Apodi. Em direção E-NE, a falha perde rejeito, enquanto que o Sistema de Falhas Carnaubais
tende a aumentar seu rejeito nesta direção, tornando-se o limite S-SE do Rifte Potiguar
(Pontes, 2005).
O Sistema de Falhas de Carnaubais compreende segmentos paralelos de falhas,
predominantemente lístricas, de direção NE-SW, sendo a Falha de Carnaubais a mais
expressiva deste sistema. Diversos autores (Matos, 1992; Bezerra et al., 1998) estudaram este
sistema de falhas e o interpretou como sendo o principal sistema do Rifte Potiguar, tendo a
Bacia Potiguar se depositado seguindo o trend do embasamento cristalino de direção NE-SW,
durante o Eocretáceo. Os mesmos apontam os sistemas de falhas de Afonso Bezerra
(transcorrente dextral) e de Carnaubais (rejeito normal) como exemplos de reativação das
estruturas pré-cambrianas no Cretáceo. De Castro et al. (2012) analisaram dados
gravimétricos e magnéticos regionais em busca de evidências das prováveis causas das
reativações no Sistema de Falhas de Carnaubais. Segundo estes autores, as reativações
promoveram movimentos verticais e direcionais, afetando grande parte da sequência pós-rifte
da Bacia Potiguar.
Interpretações sísmicas, informações de poços sobre profundidades do embasamento
e dados gravimétricos vêm sendo utilizados para o mapeamento da arquitetura interna da
Bacia Potiguar (p.ex. De Castro, 2011; Gaino et al., 2013). Este tipo de mapeamento é de
grande importância para a identificação e localização de feições geológicas, como falhas e
altos estruturais, capazes de acumular óleo e gás, e para proposição de modelos geológicos
estruturais.
A utilização de métodos potenciais em estudos na Bacia Potiguar vem sendo
largamente empregado devido à praticidade e ao baixo custo da aquisição dos dados
gravimétricos e magnéticos (Pedrosa Jr. et al., 2010; Rodrigues et al., 2014). Por meio dos
dados de campos potenciais, podem-se obter informações sobre a geometria interna do rifte e
suas relações com as estruturas pretéritas. Os métodos potenciais podem ser empregados em
mapeamentos regionais de estruturas crustais relacionadas ao armazenamento de recursos

3
petrolíferos e hídricos subterrâneos, como falhas de borda da bacia, grábens e horsts, diápiros
de sal, profundidades do embasamento e estimativa de fluxo de calor (Rodrigues, 2012).
1.3 Localização da área de estudo
A pesquisa foi realizada em uma área de aproximadamente 38.344 km2, na porção NE da
Província Borborema, compreendendo toda a porção emersa e submersa do Rifte Potiguar
(Fig. 1.1). Do ponto de vista tectônico, a porção rifte da Bacia Potiguar é delimitada pelos
sistemas de falhas de Apodi (FA) e Carnaubais (FC), a sul e leste respectivamente, pela Zona
de Charneira de Areia Branca, a oeste, e pela quebra da plataforma continental, a norte
(Bertani et al., 1990).
Figura 1.1: Mapa de localização do Rifte Potiguar (Modificado de Bertani et al., 1990; De Castro e Bezerra,
2015).
1.4 Objetivos
O objetivo principal desta pesquisa é entender a evolução tectônica das falhas de
borda do Rifte Potiguar durante a extensão crustal e rifteamento da bacia, bem como a
influência das heterogeneidades crustais e o fabric estrutural pré-existente na evolução da
arquitetura interna da bacia. Para tanto, pretende-se determinar as relações de deslocamentos
(Dmáx) e comprimento (L) dos sistemas de falhas de Apodi e Carnaubais (Fig. 1), com base
em dados de sísmica 2D, poços exploratórios e modelagem gravimétrica 3D. A intepretação
dos dados sísmicos e de poços possibilita o mapeamento com precisão do posicionamento e

4
cinemática de falhas, assim como a sobreposição e espessuras das formações geológicas em
uma escala local. Enquanto que, a modelagem gravimétrica 3D, utilizando um procedimento
de inversão, fornece a estimativa do relevo do embasamento em escala regional. Para isto,
enumeram-se alguns objetivos específicos:
Realizar a interpretação das assinaturas gravimétricas do arcabouço estrutural do Rifte
Potiguar;
Mapear as principais falhas de borda do Rifte Potiguar nas seções sísmicas;
Desenvolver a modelagem gravimétrica 3D do rifte;
Determinar a geometria dos sistemas de Falhas de Carnaubais e Apodi;
Determinar as relações de deslocamentos (Dmáx) e crescimento (L) das falhas de
borda da Bacia Potiguar, com base na integração dos resultados da interpretação
sismoestratigráfica e modelagem gravimétrica;
Propor modelo evolutivo do Rifte Potiguar com base em curvas de crescimento de
segmentos das falhas principais de borda.
Com isso, este trabalho vem a preencher uma lacuna no que diz respeito ao estudo de
deslocamento e crescimento das falhas de borda, que afetam as fases rifte e pós-rifte da Bacia
Potiguar. Estas estruturas permitem a migração e o armazenamento de hidrocarbonetos na
parte rasa da bacia, bem como concentram os principais campos produtores de óleo e gás.

5
2 CONTEXTO GEOLÓGICO DA BACIA POTIGUAR
A Bacia Potiguar localiza-se no extremo leste da margem equatorial brasileira.
Compreende uma área de 49.000 km2, inserida em parte dos estados do Ceará e Rio Grande
do Norte. Limita-se a leste/sudeste com a Bacia Paraíba e pelo Alto de Touros, a noroeste
com a Bacia do Ceará e a oeste e sul com embasamento pré-cambriano, que compõe a
Província Borborema (Pessoa Neto et al., 2007).
As bacias da margem continental do leste brasileiro são denominadas marginais
passivas. O regime distensional destas bacias está ligado à abertura do Atlântico Sul,
apresentando uma seção rifte, localizada na sua porção inferior, com falhas normais
envolvendo o embasamento cristalino e vulcanismo básico associado (Matos, 1992). O Rifte
Potiguar, assim como outros riftes continentais, apresenta domínios estruturais controlados
pela geometria das interações entre importantes segmentos de falhas (De Castro et al., 2008).
2.1 Contexto litoestratigráfico
Com base na sequência estratigráfica da Bacia Potiguar, Pessoa Neto et al. (2007)
sugerem três estágios para sua evolução tectônica (Fig. 2.1). O primeiro estágio, denominado
Supersequência Rifte, foi depositado no Cretáceo Inferior, representado pelos depósitos
lacustres, flúvio-deltaicos e fandeltaicos das fossas tectônicas, que constituem a Formação
Pendência. A Supersequência Pós-Rifte, depositada durante o Aptiano-Albiano Inferior, é
representada por rochas sedimentares transicionais da Formação Alagamar. A Supersequência
Drifte corresponde à fase termal, quando foram depositadas as sequências marinhas
transgressivas e regressivas, compreendendo toda a sedimentação marinha ocorrida a partir do
Albiano até o recente.
Três eventos magmáticos foram identificados na Bacia Potiguar: a) Rio Ceará-
Mirim, que ocorreu durante o Neocomiano, em forma de diques de diabásio com forte
orientação E-W no embasamento adjacente à borda sul da bacia, também estariam
relacionadas a este evento as rochas vulcânicas intercaladas com as rochas sedimentares da
porção basal da Formação Pendência; b) Serra do Cuó, que ocorre em forma de derrames
basálticos com tendência alcalina, durante o Turoniano; e c) Macau, que ocorre intercalado às
rochas sedimentares da sequência regressiva e no embasamento adjacente à bacia, constituído
principalmente por basaltos no alinhamento Macau-Queimadas, cujas idades dos pulsos
ocorreram durante o Eoceno ao Mioceno (Pessoa Neto et al., 2007).

6
Figura 2.1: Carta estratigráfica da Bacia Potiguar (Modificado de Pessoa Neto et al., 2007).
2.2 Contexto Tectônico
A Bacia Potiguar foi controlada por um regime tectônico distencional, sendo o seu
arcabouço composto por sistemas de horsts e grábens. O Rifte Potiguar é limitado por dois
sistemas de falhas lístricas normais, a sul pela Falha de Apodi e a leste pela Falha de
Carnaubais, ativas durante a reativação mesozoica de zonas de cisalhamento
neoproterozoicas, e pela Zona de Charneira de Areia Branca a oeste (Matos, 1992). O
arcabouço estrutural do Rifte Potiguar é constituído por um conjunto de grábens e meio-
grábens assimétricos, basculados para SE (Fig. 2.2), que são separados por horsts do
embasamento com direção NE-SW (Bertani et al., 1990).
Os grábens da bacia estão preenchidos por sequências sedimentares do Eocretáceo.
Na parte emersa, são representados pelos grábens do Apodi, Umbuzeiro, Guamaré e Boa
Vista. Estes exibem feições lineares, de direções NE-SW, limitadas a SE e NW por falhas que
possuem rejeito superiores a 5 km (Bertani et al., 1990; Matos, 1992). Já na porção submersa,
mostram-se orientadas sub-paralelamente à linha de costa atual. Os principais horsts da Bacia
Potiguar são os de Quixaba, Serra do Carmo e Macau, compostos por blocos do embasamento
soerguidos por falhas normais. As plataformas do embasamento que limitam os grábens a

7
oeste e a leste são denominadas de Aracati e Touros, respectivamente. Estas foram recobertas
por sedimentos do Aptiano e do Neocretáceo na porção emersa, e por sequências cenozoicas
na porção marítima (Bertani et al., 1990).
Figura 2.2: Mapa do arcabouço estrutural do Rifte Potiguar (Adaptado de Cremonini et al., 1996).
2.2.1 Fase Rifte
Três importantes estágios tectônicos são reconhecidos na fase rifte da Bacia Potiguar
(Matos, 1992), denominados de Sin-Rifte I, Sin-Rifte II e Sin-Rifte III (Fig. 2.3). O estágio
Sin-Rifte I (Jurássico Superior ~ 150 Ma) compreende o início da deformação distensional,
com a deposição de sedimentos clásticos na Depressão Afro-Brasileira. O enxame de diques
de diabásio Rio Ceará-mirim é a expressão mais significativa deste evento, na região da Bacia
Potiguar.
O estágio Sin-Rifte II (Cretáceo Inferior ~ 145-130 Ma) é caracterizado pelo
desenvolvimento de uma série de bacias rifte, controladas por falhas de rejeito
preferencialmente normal. Foram formados meio-grábens assimétricos, a exemplo do rifte
Neocomiano da Bacia Potiguar emersa e demais riftes intracontinentais do Nordeste
Brasileiro.
No estágio Sin-Rifte III (Cretáceo Inferior ~ 130-125 Ma), o processo distensional
começou a concentrar a deformação ao longo da futura margem continental equatorial,
causando uma mudança na cinemática rifte. Na Bacia Potiguar, esse evento provocou um
deslocamento do eixo de rifteamento para a porção submersa, ao mesmo tempo em que
causou um soerguimento e erosão na porção emersa (Matos, 1992). A direção de transporte
tectônico mudou de NW-SE para E-W, com movimentos predominantemente transtrativos
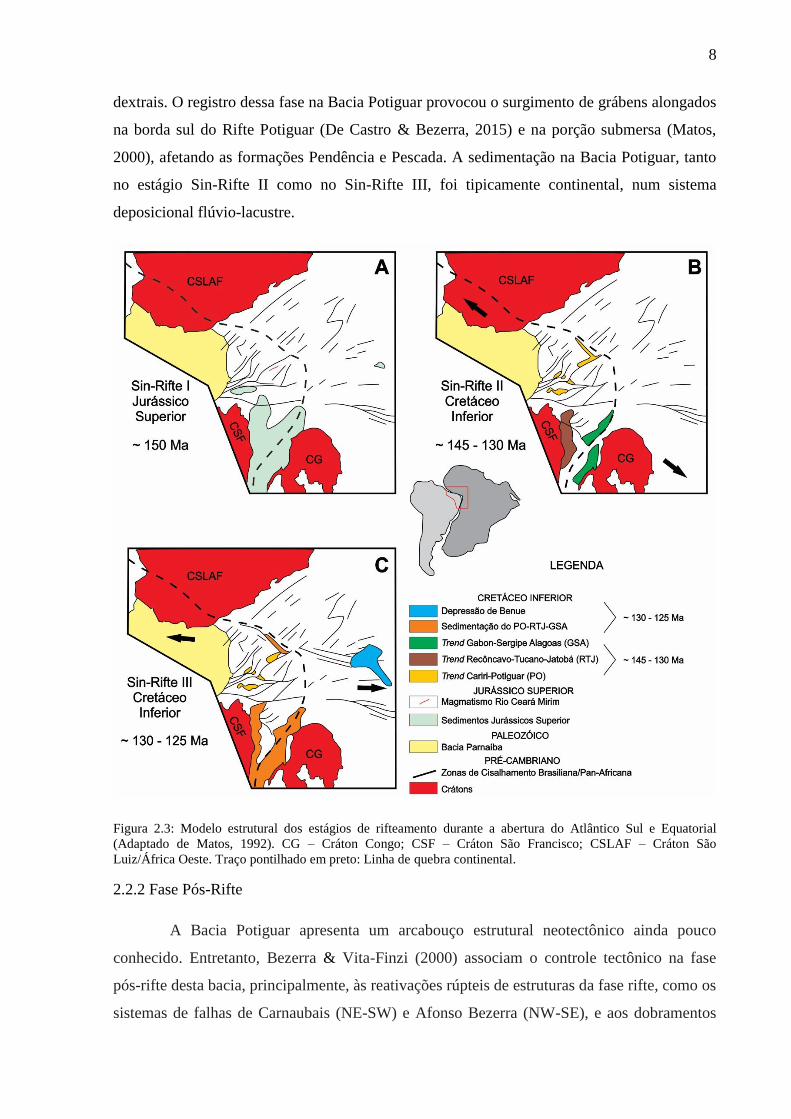
8
dextrais. O registro dessa fase na Bacia Potiguar provocou o surgimento de grábens alongados
na borda sul do Rifte Potiguar (De Castro & Bezerra, 2015) e na porção submersa (Matos,
2000), afetando as formações Pendência e Pescada. A sedimentação na Bacia Potiguar, tanto
no estágio Sin-Rifte II como no Sin-Rifte III, foi tipicamente continental, num sistema
deposicional flúvio-lacustre.
Figura 2.3: Modelo estrutural dos estágios de rifteamento durante a abertura do Atlântico Sul e Equatorial
(Adaptado de Matos, 1992). CG – Cráton Congo; CSF – Cráton São Francisco; CSLAF – Cráton São
Luiz/África Oeste. Traço pontilhado em preto: Linha de quebra continental.
2.2.2 Fase Pós-Rifte
A Bacia Potiguar apresenta um arcabouço estrutural neotectônico ainda pouco
conhecido. Entretanto, Bezerra & Vita-Finzi (2000) associam o controle tectônico na fase
pós-rifte desta bacia, principalmente, às reativações rúpteis de estruturas da fase rifte, como os
sistemas de falhas de Carnaubais (NE-SW) e Afonso Bezerra (NW-SE), e aos dobramentos

9
com longo comprimento de onda e eixos orientados na direção N-S (Moura-Lima et al.,
2010). Estes autores sugerem que as reativações desses extensos sistemas de falhas
condicionam tectonicamente a disposição dos depósitos neogênicos e quaternários da Bacia
Potiguar.

10
3 CRESCIMENTO DE FALHAS
O estudo do crescimento das falhas de borda é fundamental para a compreensão da
evolução tectônica do rifte (Kim & Sanderson, 2005; De Castro et al., 2008). Esse tipo de
falha se destaca das outras por apresentar vasta extensão e deslocamento expressivo, além de
um deslocamento da ordem de quilômetros.
A análise das relações do deslocamento máximo (Dmáx) da falha pelo seu
comprimento em superfície (L) contribui para a compreensão de como um conjunto de
segmentos de falha evolui para formar uma única falha de primeira ordem (Cartwright et al.,
1995). As curvas de crescimento de falha obtidas pela razão Dmáx/L são de fundamental
importância para o entendimento da evolução tectono-estrutural das feições geológicas
desenvolvidas essencialmente por falhamentos, como as bacias do tipo rifte. Para obter os
dados dos deslocamentos das falhas e suas extensões não aflorantes, torna-se necessária a
aplicação de métodos geofísicos que forneçam informações detalhadas dos parâmetros
geométricos das falhas em profundidade. Estes estudos procuram compreender a deformação
pretérita, caracterizando as estruturas produzidas e os regimes tectônicos envolvidos.
As falhas crescem a partir de microfraturas ou zonas de bandas de deformação, que
tendem a nuclear-se em muitos locais diferentes quando uma região é submetida a um esforço
tectônico, como um rifte (Fossen, 2012). As relações Dmáx/L têm sido largamente estudadas,
principalmente para tentar entender a geometria de falhas em diferentes escalas (Watterson,
1986; Cartwright et al., 1995). Para esses estudos, foram utilizados dados adquiridos a partir
de diferentes métodos como observações de campo (Dawers et al., 1993), sísmica de reflexão
(Pickering et al., 1997) e, mais recentemente, dados gravimétricos (De Castro et al., 2008).
Kim & Sanderson (2005), em uma revisão sobre o tema, sugerem que vários fatores
controlam a relação Dmáx/L, tais como: tipo de rocha; tipo de falha, incluindo sua posição e
direção, tipo de ruptura e histórico de propagação; e suas reativações. Pesquisas de campo de
Wilkins & Gross (2002) e modelos numéricos de Burgmann et al. (1994) sugerem que as
diferenças nas propriedades mecânicas e os contatos entre unidades litológicas adjacentes
podem criar barreiras que inibem a propagação de falhas. E que os deslocamentos podem ser
afetados quando as falhas passam por diferentes limites litológicos. As razões Dmáx/L são
diferentes dependendo do tipo de falha (Kim et al., 2000).
Kinabo et al. (2008) afirmam que o entendimento dos fatores que controlam o
crescimento e propagação das falhas nas fases iniciais de rifteamento leva a uma melhor
compreensão global dos processos que controlam o desenvolvimento de riftes continentais. A
localização, orientação e a evolução de falhas normais que se formam durante o rifteamento

11
exerce uma forte influência sobre o desenvolvimento de características regionais como:
geomorfologia, padrões de drenagem, localização da bacia, estratigrafia, magmatismo e
geometria de margens passivas.
Estudos sobre crescimento de falhas (Walsh & Watterson, 1988; Cowie & Scholz,
1992) demonstraram que as primeiras falhas a serem formadas têm comprimentos que são
significativamente menores do que os seus comprimentos finais. As falhas não tendem a
crescer como estruturas individuais por períodos muito longos. À medida que elas crescem,
tendem a interferir nas falhas vizinhas. Por esse processo, duas falhas podem unir-se para
formar uma falha única de maior comprimento, para as quais as razões Dmáx/L são diferentes
dependendo da cinemática da falha (Kim et al., 2000).
3.1 Tipos de crescimento e ligações de falhas
Cartwright et al. (1995) dividiram os processos envolvidos no crescimento de falhas
em dois grandes grupos: i) crescimento por propagação radial (Fig. 3.1); e ii) crescimento pela
união de segmentos (Fig. 3.2).
Figura 3.1: Propagação radial de falha, sendo que I, II e III representam três estágios consecutivos de propagação
de uma mesma falha (Modificado de Cartwright et al., 1995).
Cowie (1998) apresenta outra proposta para explicar o crescimento de falhas (Fig.
3.3). Ele sugere que o deslocamento das falhas ocorre enquanto elas ainda permanecem
relativamente isoladas. Isso é alcançado via crescimento preferencial de falhas localizadas em
pontos de simetria de ruptura na evolução da bacia. O segmento de uma falha pode alcançar
maior comprimento e, entretanto, ter um grande deslocamento, antes mesmo que ocorra uma
ligação estrutural. Além disso, a relação dos parâmetros geométricos, entre o deslocamento

12
máximo (Dmáx) e comprimento (L), pode revelar o crescimento das falhas principais e
formação de depocentros na arquitetura do rifte.
Figura 3.2: Evolução de três segmentos de falha isolados (A, B e C) que se interligam, gerando uma falha única
maior. (I) Segmentos de falhas isoladas que se propagam radialmente. (II) Sobreposição e interação dos
segmentos. (III) União dos três segmentos em uma única falha maior. (Modificado de Cartwright et al., 1995).
Figura 3.3: Evolução de um sistema de falhas, através de uma modelagem numérica. (I) Nucleação inicial de
vários segmentos; (II) maior crescimento de alguns segmentos (W, X, Y, Z); (III) Deformação localizada nas
falhas z e y, enquanto a atividade nos segmentos adjacentes já se encontra interrompida. (Modificado de Cowie
et al., 1998).
O modelo de crescimento de falhas por Ligação Rígida (hard linkage; Fig. 3.4)
ocorre quando há ligação completa dos segmentos e estes passam a se comportar como uma

13
única falha (Kim & Sanderson, 2005). Neste modelo, as falhas recém-unidas são
subdeslocadas em relação a falhas isoladas ou aquelas que foram unidas anteriormente. O
crescimento diminui a partir do centro para as extremidades. Outro tipo de ligação que pode
ocorrer entre segmentos de falhas é denominado de Ligação Flexível (soft linkage; Kim &
Sanderson, 2005; Fig. 3.5). Neste caso, os segmentos de falhas crescem através de interações
com falhas adjacentes, as quais inibem a propagação e, assim, elas adquirem altas razões
Dmáx/L.
Figura 3.4: Modelo de crescimento de falha por Ligação Flexível (Adaptado de Kim & Sanderson, 2004).
Figura 3.5: Modelo de crescimento de falha por Ligação Rígida (Adaptado de Kim & Sanderson, 2004).
As taxas típicas de crescimento de falhas em riftes são da ordem de 2-5 mm/ano na
porção central da falha, e de 0,5 mm/ano próxima às terminações (Gawthorpe et al., 1994).

14
4 ASPECTOS METODOLÓGICOS
4.1 Dados de sísmica e poços exploratórios
Com propósito de aproximar a modelagem gravimétrica ao real contexto geológico
que envolve a geometria interna do Rifte Potiguar, foram incorporadas informações de seções
sísmicas de reflexão e dados de poços. Os dados sísmicos e de poços, utilizados nesse
trabalho, foram fornecidos pelo Banco de Dados de Exploração e Produção (BDEP) da
Agência Nacional do Petróleo, Gás Natural e Combustível (ANP), por meio da sua política de
gratuidade para universidades. Estas seções sísmicas encontram-se perpendiculares às
principais estruturas do Rifte Potiguar (Fig. 4.1).
Figura 4.1: Mapa geológico da Bacia Potiguar com a localização das seções sísmicas e dos poços exploratórios
utilizados neste trabalho.
Para auxiliar nas interpretações das seções sísmicas, correlacionaram-se os topos das
principais formações geológicas com os horizontes sísmicos correspondentes, de acordo com
os dados obtidos nos poços. As informações sobre as composições e espessuras das formações
estratigráficas da Bacia Potiguar foram obtidas a partir de três poços exploratórios perfurados
na porção rifte da bacia (Fig. 4.1). A partir desses dados, foi possível elaborar tabelas de
conversão do tempo sísmico em profundidade.
As linhas sísmicas e os dados de poços foram inseridos no software Opendtect 5.0.
Inicialmente, foram introduzidas diversas informações dos poços, tais como elevação,
coordenadas, profundidade inicial/final e os topos das formações (Tab. 4.1). Com base nas
relações de tempo duplo percorrido e profundidades, os topos das principais formações,
atravessadas no poço, foram correlacionados com refletores sísmicos, permitindo mapear
estes horizontes ao longo das seções sísmicas.

15
Tabela 4.1: Profundidades dos topos das principais formações interceptadas nos poços.
Formações Profundidades (m)
Poço A Poço B Poço C
Jandaíra 0 54 111
Açu 222 537 545
Alagamar 600 1170 1114
Pendência 1032 1421 -
Embasamento - - 1256
Contudo, como algumas seções sísmicas não são interceptadas pelos poços,
impossibilitando usar a correlação direta, outra forma de amarração dos intervalos foi feita
por meio do cruzamento entre as linhas sísmicas (Fig. 4.2), o que significa marcar os
intervalos de uma linha sísmica onde há intersecção com outra linha já interpretada.
Figura 4.2: Distribuição espacial das linhas sísmicas e poços (A, B e C) utilizados nesta pesquisa.
Depois de realizar as interpretações sísmicas, geraram-se os modelos sísmicos em
profundidade. Este procedimento foi realizado no modulo GMSYS do software Oasis Montaj
5.1 (Fig. 4.3) Para isto, foram utilizadas as seções sísmicas interpretadas, as velocidades
médias e as densidades médias (Tab. 4.2), obtidas com base nos dados de poços.

16
Figura 4.3: Seção sísmica 9 (A), interpretação sísmica (B) e modelo em profundidade (C) do perfil, localizados
na figura 4.1.
Tabela 4.2: Velocidades e densidades médias das unidades geológicas da Bacia Potiguar.
Formações Velocidade (m/s) Densidade (kg/m3)
Jandaíra 4096 2370
Açu 3094 2450
Alagamar 5350 2500
Pendência 5480 2600
Embasamento 5674 2750
4.2 Gravimetria
O método gravimétrico tem sido utilizado para identificação e localização de feições
geológicas capazes de acumular reservas de hidrocarbonetos, como, por exemplo, alto
estruturais e falhas (Telford et al., 1992; Blakeley, 1996; De Castro, 2005). Segundo a lei da
atração gravitacional, as massas de dois corpos (m1 e m2) se atraem com uma força (F)
diretamente proporcional ao seu produto e inversamente proporcional ao quadrado da
distância (r2) que as separa, o que pode ser representado através da seguinte fórmula (Kearey
et al., 2002):

17
Na qual G é a constante de gravitação universal, e seu valor no sistema cgs é de
aproximadamente 6,67 x 10⁻⁸
dina.cm²/g².
O método gravimétrico para a investigação do interior da terra baseia-se nas
medições e interpretações das variações do campo gravitacional terrestre, resultante das
diferenças de densidade entre as diversas litologias presentes na superfície e sub-superfície
terrestre (Kearey et al., 2002). Para um corpo de densidade ρ1 encaixado em um meio de
densidade ρ2, o contraste de densidade Δρ será igual a:
O sinal do contraste de densidade (Δρ) determina o sinal da anomalia gravimétrica. A
maioria das rochas sedimentares tem densidade entre 1,6 e 2,9 g/cm3, enquanto as densidades
das rochas que compõem o embasamento, ígneas e metamórficas, ficam entre 2,5 e 3,2 g/cm3
(Telford et al., 1990). Sendo assim, em uma bacia sedimentar espera-se uma anomalia
Bouguer negativa em relação ao embasamento. Com exceção de intrusões de rochas básicas,
que são mais densas, a bacia sedimentar produz uma anomalia negativa.
Nos primeiros estudos gravimétricos (Bott, 1960; Corbató, 1965) foram presumidos
valores de densidade constantes para o pacote sedimentar. Posteriormente, os modelos
interpretativos passaram a admitir um aumento da densidade do pacote sedimentar com a
profundidade, e, por conseguinte, uma diminuição do contraste de densidade com a
profundidade (De Castro, 2005). Sendo que os modelos interpretativos que admitem a
variação da densidade com a profundidade são os que mais se aproximam da realidade
geológica.
O conjunto de dados gravimétricos utilizados neste trabalho constitui-se de
informações de mais de 120 mil estações gravimétricas (Fig. 4.4), marinhas e terrestres,
compiladas de vários levantamentos geofísicos independentes realizados por várias
universidades (UFRN, UFC, UFOP, UFPA, USP), instituições de pesquisa e órgãos
governamentais (Petrobrás, CPRM, ANP e IBGE).
Δρ = ρ1 - ρ2
F = G.m1.m2
r2

18
Figura 4.4: Mapa de anomalias Bouguer da Bacia Potiguar com a localização das estações gravimétricas.
4.2.1 Modelagem Gravimétrica 3D
Os métodos de inversão de dados gravimétricos utilizados para estimar o relevo do
embasamento de uma bacia costumam empregar duas abordagens diferentes. Uma considera o
pacote sedimentar e o embasamento cristalino homogêneo (Fig. 4.5). Enquanto a outra propõe
o embasamento heterogêneo (Fig. 4.6), além de considerar a diminuição do contraste de
densidade entre o pacote sedimentar e as rochas do embasamento, com o aumento da
profundidade.
De Castro (2005) ressalta que a modelagem gravimétrica é a técnica geofísica mais
consagrada para a determinação das formas internas e profundidades de bacias sedimentares.
Ele propôs um procedimento de inversão de dados gravimétricos que foi baseado na
metodologia desenvolvida por Jachens & Moring (1990), que considerava o embasamento
heterogêneo, o qual foi empregado neste trabalho.
Neste método, as profundidades do relevo do embasamento são estimadas a partir
das espessuras de prismas verticais justapostos (Fig. 4.5), centrados sobre a malha regular
obtida pela interpolação das observações gravimétricas. O valor inicial para a profundidade
da base do prisma em um ponto (i,j) qualquer da malha é obtido por:
Z(i, j ) (1)
= gobs (i, j)
2pγa0

19
Figura 4.5: Técnica de modelagem que considera o pacote sedimentar e o embasamento homogêneos (Adaptado
de De Castro, 2005).
Figura 4.6: Técnica de modelagem que considera o embasamento heterogêneo (adaptado de De Castro, 2005).
Onde gobs é a anomalia gravimétrica observada e γ é a constante gravitacional
universal. O efeito gravimétrico devido ao conjunto total de prismas (gcal) é calculado para
cada ponto da malha, usando-se as espessuras obtidas nas iterações prévias. A diferença entre

20
as anomalias observadas e estimadas na k-ésima iteração (∆g(k)
) é calculada e então uma nova
estimativa para as espessuras dos prismas é obtida pela expressão:
O processo é repetido até a anomalia estimada ajustar-se satisfatoriamente à
anomalia observada. O modelo prismático final representa a melhor estimativa para o topo do
embasamento cristalino da bacia sedimentar fornecida por este método de inversão. Nas áreas
onde a anomalia gravimétrica observada é positiva, o algoritmo assume uma espessura igual à
zero para o prisma.
Este procedimento é realizado no software BACIA 3D, codificado em linguagem
computacional FORTRAN 77. Esta metodologia tenta separar as componentes do campo
devidas à fonte e às variações de densidade no embasamento. A Metodologia utilizada para a
realização da modelagem seguiu os passos presentes na figura 4.7.
A partir do banco de dados gravimétricos devidamente corrigidos dos efeitos não
geológicos, foi gerado um mapa com uma malha regular de anomalias Bouguer com
espaçamento de 1,0 km (Fig. 4.8), utilizando o método de interpolação kriging. Em seguida,
foi separada a componente residual do campo gravimétrico a partir de um filtro de separação
regional-residual com distribuição gaussiana, usando um desvio padrão de 0,02 ciclos/m.
Do mapa de anomalias residuais foi gerado obtendo-se assim um novo conjunto de
dados gravimétricos, excluindo as anomalias na região do Rifte Potiguar. O mapa
gravimétrico do embasamento é, então, gerado e a partir dele obtém-se o mapa gravimétrico
da bacia, o qual é usado para a modelagem do rifte por meio do método de inversão.
A partir da primeira inversão obtêm-se os seguintes dados de saída: a) primeira
estimativa da geometria interna 3D da bacia; b) primeira estimativa das anomalias
gravimétricas sem o efeito da bacia; e c) a segunda estimativa das anomalias do
embasamento. Como dados de saída, tem-se o modelo da geometria da bacia devidamente
ajustado e uma nova estimativa para as anomalias do embasamento, sem o efeito gravimétrico
da bacia. A nova estimativa das anomalias da bacia é então calculada pela subtração da nova
estimativa das anomalias do embasamento das anomalias residuais. Estes dados são utilizados
como dado de entrada para uma nova etapa do procedimento de inversão, e assim
sucessivamente.

21
Figura 4.7: Fluxograma da Modelagem Gravimétrica 3D, mostrando os passos e parâmetros utilizados durante o
processo de inversão.
Figura 4.8: Localização dos dados gravimétricos, excluídos aqueles na região do rifte, utilizados para calcular as
anomalias do embasamento.
Para cada iteração, observou-se um aumento contínuo da profundidade do
embasamento (Fig. 4.9; Tab. 4.3). Depois de realizada as quatro primeiras iterações, obteve-se
a arquitetura interna da bacia caracterizada por um rifte alongado, com seus limites sul e leste
marcados por dois sistemas de falhas normais de bordas, com rejeitos expressivos superiores a
5000 m. As profundidades do embasamento, obtidas no modelo gravimétrico da quarta

22
iteração mostram-se compatíveis com as profundidades observadas nas seções sísmicas e nos
dados dos poços. Para a quinta iteração, as espessuras do pacote sedimentar ultrapassaram os
valores esperados, sendo este o critério para escolher o modelo gravimétrico da quarta
iteração.
Figura 4.9: Mapas das modelagens obtidas para cada iteração.

23
Tabela 4.3: Profundidade máxima do topo do embasamento obtida a cada iteração da inversão gravimétrica.
Número de Iterações Profundidade do Embasamento
1 3,6 km
2 4,0 km
3 4,5 km
4 5,5 km
5 7,2 km

24
Rift fault geometry and evolution in the Cretaceous Potiguar Basin (NE
Brazil) based on fault growth models
Alanny C. C. Meloa, David L. de Castro
a,b*, Francisco H. R. Bezerra
a,b, Giovanni
Bertottic
aPrograma de Pós-Graduação em Geodinâmica e Geofísica, Departamento de Geologia,
Universidade Federal do Rio Grande do Norte, Campus Universitário, Lagoa Nova, 59.078-
970 Natal – RN, Brazil.
bDepartamento de Geologia, Universidade Federal do Rio Grande do Norte, Campus
Universitário, Lagoa Nova, 59.078-970 Natal – RN, Brazil.
c Faculty of Civil Engineering and Geosciences, Delft University of Technology, Building 23,
Stevinweg 1, PO-box 5048, 2628 CN Delft, 2600 GA Delft, Netherlands.
*Corresponding author: [email protected], telephone: 55 84 32153807, R – 220 (D.L.
de Castro)

25
Abstract
The discussion about rift evolution in the Brazilian Equatorial margin during the South
America-Africa breakup in the Jurassic/Cretaceous has been focused in many researches. But
rift evolution based on development and growth of faults has not been well explored. In this
sense, we investigated the Cretaceous Potiguar Basin in the Equatorial margin of Brazil to
understand the geometry of major faults and the influence of crustal heterogeneity and
preexisting structural fabric in the evolution of the basin internal architecture. Previous studies
pointed out that the rift is an asymmetrical half-graben elongated along the NE-SW direction.
We used 2D seismic, well logs and 3D gravity modeling to analyze four major border fault
segments and determine their maximum displacement (Dmax) and length (L) ratio in the
Potiguar Rift. We constrained the 3D gravity modeling with well data and the interpretation of
seismic sections. The difference of the fault displacement measured in the gravity model is in
the order of 10% compared to seismic and well data. The fault-growth curves allowed us to
divide the faulted rift border into four main fault segments, which provide roughly similar
Dmax/L ratios. Fault-growth curves suggest that a regional uniform tectonic mechanism
influenced growth of the rift fault segments. The variation of the displacements along the fault
segments indicates that the fault segments were formed independently during rift initiation
and were linked by hard and soft linkages. The latter formed relay ramps. In the
interconnection zones the Dmax/L ratios are highest due to interference of fault segment
motions. We divided the evolution of the Potiguar Rift into five stages based on these ratios
and correlated them with the major tectonic stages of the breakup between South America and
Africa in Early Cretaceous.
Keywords: 3D gravity modeling, fault growth, rift evolution, Africa-South America breakup.

26
1. Introduction
The relation between maximum fault displacement and length (Dmax/L) has been
widely studied to understand the geometry of faults at different scales and the influence of
crustal heterogeneity and preexisting structural fabric in the evolution of rift basins (e.g.
Watterson, 1986; Cartwright et al.,1995; McLeod et al., 2000). These studies used methods
such as field observations (Dawers et al., 1993), seismic reflection (Pickering et al., 1997)
and, more recently, 3D gravity models (De Castro et al., 2008).
Previous studies on fault growth indicate that the first fault segments are substantially
smaller than their final fault length (Walsh and Watterson, 1988; Cowie and Scholz, 1992).
However, faults do not tend to grow as individual segments for a very long time. As they
grow, they tend to interact and link with adjacent faults and form single longer structures
(Kim et al., 2000).
Several factors control the Dmax/L ratio, such as rock type, type of faults, fault
direction and dip, rupture, and reactivation (Kim and Sanderson, 2005). Some differences in
mechanical properties and lithologic boundaries can create barriers that inhibit fault
propagation, such that fault displacement may be affected when faults go through different
lithological boundaries (Burgmann et al., 1994). The ratios for strike-slip faults often are
greater than for normal or reverse faults (Kim et al., 2000).
In the Equatorial margin of South America, several studies have already discussed rift
evolution during the South America-Africa breakup in the Jurassic/Cretaceous (Bertani et al.,
1990; Matos, 1992, 2000; De Castro et al., 2012). However, the evolution and growth of rift
faults were not fully explained. In addition, the role of preexisting ductile Precambrian fabric
in the evolution of fault segments and their linkage has been addressed by a few studies in
small basins (e.g., De Castro et al., 2008), but additional cases are needed for the
understanding of the rift evolution in the Equatorial margin and the subsequent opening of the
South Atlantic.
The main objectives of this research are (1) to unravel the tectonic evolution of the
border faults of the Potiguar Basin during rifting and (2) to assess the influence of crustal
heterogeneities and the preexisting structural fabric in the evolution of the internal rift
architecture. We choose the Cretaceous Potiguar Basin in the Equatorial margin of Brazil as a
case study because it exhibits characteristics that allowed the investigation of fault growth in
an early rift stage. The aborted rift forms a 5.0 km deep, 177 km long and 54 km wide half
graben, overlapped by a 500 m thick post-rift sequence (Bertani et al., 1990; Matos, 1992).
We determined the relation between maximum displacement (Dmax) and length (L) of the

27
border faults of the Potiguar Basin using 2D seismic data, well logs, and 3D gravity modeling.
The interpretation of seismic data and well logs provided information about the stratigraphy
and structural features, enabling the precise identification of fault segments and kinematics.
The 3D gravity modeling using the inversion method provided an estimate of the basement
relief on a regional scale. The analysis of the fault growth curves can contribute to the
understanding of the early development of faults during crustal extension and rifting. This
analysis can shed light on the tectonic evolution of the Cretaceous Northeastern Brazilian Rift
System.
2. Geological setting
The onshore Potiguar Basin is part of a series of Cretaceous rift basins in northeastern
Brazil (Fig. 1A). The region encompasses the Recôncavo, Sergipe-Alagoas, Tucano, Jatobá,
Araripe, Rio do Peixe, Iguatu, Potiguar and many other small basins. They were generated
during the first stages of the breakup between the South American and African plates in the
Early Cretaceous, resulted from NW-SE oriented extensional regime, that later suffered a
counterclockwise rotation changing its direction to E-W during the final stage of rifting
(Chang et al., 1988; Matos, 1992). The offshore part of the Potiguar Basin was formed in the
last stages, when the Equatorial margin started to form (Matos, 2000).
The Potiguar Basin (Fig. 1B) is located in the northern part of the Borborema
Province, which is a Precambrian shield composed of Archean and Proterozoic inliers
amalgamated during the Brasiliano orogeny at 760-540 Ma (Almeida et al., 2000). During this
period, a widespread network of steeply dipping, continental scale, strike-slip ductile shear
zones affected the entire Borborema Province, which was also intruded by many syn- to late-
kinematic granite bodies. A considerable number of the NE–SW and E–W-striking shear
zones exhibit brittle reactivation associated with breakup between South America and Africa
in the early Cretaceous, which resulted in a series of aborted small cratonic basins of the NE
Brazilian Rift System. The Potiguar Basin encompasses a NE-SW elongated rift capped by
two post-rift sedimentary units (Bertani et al., 1990).
The Potiguar rift is composed of a system of horsts and grabens. It is limited to the
west by the Areia Branca hinge zone, to the south and to the east by the Apodi and Carnaubais
fault systems, and to the north by the oceanic crust. The major grabens are bounded by faults
formed by the reactivation of Neoproterozoic shear zones (Matos, 1992; De Castro et al.,
2012). The Potiguar rift internal architecture consists of a set of asymmetric grabens and half-
grabens tilted to SE, which are separated by NE-SW-trending basement horsts. The onshore

28
part of the basin encompasses the Apodi, Umbuzeiro, Guamaré, and Boa Vista grabens (Fig.
1B). These grabens trend NE-SW and are bounded to SE and NW by faults with more than
5.0 km of throws (Bertani et al., 1990; Matos, 1992). The main horsts of the Potiguar Basin
are the Quixaba, Serra do Carmo, and Macau (Fig. 1B). They comprise uplifted basement
blocks. The basement platforms located to the west and the east of the central rift are the
Aracati and Touros horst, respectively (Bertani et al., 1990).
The Potiguar rift is composed of three main listric faults. The Carnaubais Fault System
is composed by predominantly NE–SW-striking listric segments. This is the main fault
system of Potiguar Rift (Matos, 1992). The Apodi Fault System is composed of segments
offset by secondary transfer faults. It shows a strong NW-SE to NE-SW inflection, with ~ 4.5
km of throw at the NW edge (Hoerlle et al., 2007; Rodrigues et al., 2014). The Baixa Grande
Fault is located in the extreme S-SE corner of the Potiguar rift and marks the boundary of the
southern limit of the Umbuzeiro Graben and part of the Apodi Graben (Rodrigues et al.,
2014).
The Potiguar Basin exhibits three main stratigraphic sequences (Pessoa Neto et al.,
2007). The first sequence was deposited in the early Cretaceous during the rifting period. This
sequence is composed of lacustrine deposits, fluvial-deltaic and fan-deltaic units of the
Pendência Formation. The limit between syn-rift and post-rift units is marked by an angular
unconformity. The transitional sedimentary post-rift sequence was deposited during the
Aptian - Albian and is composed of fluvial- deltaic sedimentary units of the Alagamar
Formation. The last depositional sequences correspond to the drift stage, when a transgressive
and regressive marine sequence was deposited from the Albian to the recent. These units
correspond to river, platform, and deep slope facies of the Açu, Quebradas, Jandaíra, Ubarana,
Guamaré, and Tibau formations.
Three major tectonic stages mark the rift phase of Potiguar Basin (Matos, 1992). The
Syn-rift I stage (Jurassic, ~150 Ma) comprises the early extensional deformation, with the
deposition of clastic sediments in the African-Brazilian Depression. Normal faults of the
Potiguar rift were not generated yet during this phase, but the first motions of the breakup
between South America and Africa started to take place, resulting in a swarm of NE-SW- to
E-W-trending basalt dikes. The Syn-rift II stage (early Cretaceous, ~145-130 Ma) was
characterized by the development of a series of rift basins controlled by normal faults, which
formed several asymmetric half-grabens in intra-continental rifts in the region (Fig. 1B). In
the Syn-rift III stage, (early Cretaceous, ~130-125 Ma), the extensional process started to
concentrate deformation along to the future equatorial continental margin, causing change in

29
rift kinematics, from NW-SE extension to E-W predominantly transtensional dextral
movement (Matos, 2000). These processes resulted in elongated grabens in the southern edge
of the Potiguar rift (De Castro and Bezerra, 2015).
The tectonic deformation in post-rift phase of the Potiguar Basin is associated with
brittle reactivation of rift faults, such as the Carnaubais (NE-SW) and Afonso Bezerra (NW-
SE) fault systems. The reactivation of these faults affected the Cretaceous units and
Neogenic-Quaternary sedimentary deposits (Bezerra and Vita-Finzi, 2000; Moura Lima et al.,
2010).
3. Determination of fault geometry and throw using seismic and well data
In this study, we used seismic reflection data and well logs provided by the Brazilian
Oil Agency (ANP). The seismic data were already processed and time migrated by the
Brazilian oil company (Petrobras). We selected eleven seismic sections orthogonal to the
border faults of the Potiguar rift and three exploratory wells to constrain the gravity modeling
(Fig. 2). We correlated the top boundaries of the stratigraphic units with corresponding
seismic horizons based on stratigraphic data from the wells to assist the seismic interpretation.
We used time-to-depth curves and density logs derived from the well logs to obtain depth
models of the Potiguar rift (Figs. 3 and 4). We ascribed for each stratigraphic unit one average
velocity and density (Table 1).
The seismic sections indicate a N dipping segment of the Apodi fault in the southern
limit of the Potiguar rift (Fig. 3). The Baixa Grande fault exhibits a NW dip, which is lower
toward its limit with the Carnaubais fault and Umbuzeiro Graben. Seismic sections and wells
data crossing the Apodi Graben exhibit the thickening of the sedimentary package near the
Apodi fault, indicating that this fault has a strong normal component. The Apodi fault flattens
around 2s, which corresponds to a depth of ~ 4.5 km.
The Carnaubais fault system is characterized by a typically listric geometry, with steep
dips at the top that decrease with depth and become horizontal around 2.5 to 3.0 s. Most of
this displacement occurred during the rift phase. The throws of the fault system reach values
of up to 5.2 km (Fig. 4).
4. Gravity data and modeling
The gravity data set used in this study integrated 120,000 gravity onshore and offshore
stations, which were compiled from several independent geophysical surveys carried out by
universities, public research agencies, and private companies (Fig. 2). These data were

30
already corrected for the non-geological effects in the gravitational field, yielding a Bouguer
gravity anomalies, and were interpolated on a regular 500-m grid using the kriging method.
The residual component was separated from the Bouguer anomaly through a spectral filter
with Gaussian distribution, with a standard deviation of 0.02 cycles/m.
We used the residual gravity anomalies (Fig. 5) to model the internal basin
architecture. However, before starting the modeling process, we subtracted a constant value of
10 mGal from the gravity anomalies to force all gravity anomalies becoming negative in the
rift zone. Thus, we maintain the premise, required by the inversion algorithm, that negative
gravity anomalies are related to low density sedimentary infill in contrast to positive
anomalies associated to denser basement rocks.
The residual anomalies range from -24.3 to 20.1 mGal (Fig. 5). The NE-SW-trending
gravity lows are related to main graben depocenters (Umbuzeiro, Boa Vista, and Apodi),
whereas the gravity highs reveal the faulted rift boundaries and internal horsts (Quixaba and
Macau). The gravity lows in the southern part of the basin trend NW-SE, indicating changes
in the rift geometry and kinematics NW-SE to E-W, during the Syn-Rift III described by
Matos (1992), which indicate a strike-slip component (A in Fig. 5). In addition, gravity lows,
which occur outside the rift area, are probably associated with supracrustal blocks (De Castro,
2011), composed of Neoproterozoic metasedimentary sequences or granitic bodies (B in Fig.
5).
We adopted the inversion approach developed by Jachens and Moring (1990) and De
Castro (2005) to obtain the 3D gravity model, which assumes a heterogeneous basement in
the gravity modeling. The gravitational effect of the basin was estimated and subtracted from
the basement gravity stations to obtain the next approximation for the basement gravity
anomalies. This process was repeated until we had a result converged to a satisfactory
separation of basin and basement gravity. Using the Rao and Babu (1990) algorithm, the basin
internal architecture was computed as an interface that separates two homogeneous media. In
this method, a quadratic function simulates the increase in density with depth due to
sedimentary compaction. We extracted the coefficients of the function from well logs (Fig. 2),
whose average density contrast between basin infill and basement rocks is 382 kg/m3. The
difference between the depth of the basement in 23 exploratory wells, described by Gaino
(2013), and our gravity model varies from 0.547 to 0.002 m. It represents a confidence of
89% obtained by the inverse method.
The 3D gravity model highlights the main structural features of the Potiguar rift (Fig.
6). The rift boundaries are defined to the south by the NW-SE-striking Apodi Fault System, to

31
the east by the Carnaubais System Fault, and to the west by the Areia Branca Hinge Zone,
both of which trend NE–SW. The Umbuzeiro and Apodi grabens represented the main
depocenters, reaching thickness greater than 5500 m, which are consistent with seismic and
well data (Fig. 6). The main horsts, revealed by the 3D modeling, are the Quixaba (340 m
deep), and Boa Vista (800 m deep).
5. Analysis of fault-growth curves
5.1. Growth of fault segments
Knowing the degree to which fault segments interact is important to understand the
faults themselves, the structures associated with them and the evolution of rift basins (e.g.
Segall and Pollard, 1980). As predicted by most models, fault growth leads to an initial fault
population of short, low-displacement faults that evolve into a population comprising a few
large faults (Cowie and Scholz, 1998; Gupta et al., 1998). The relation between maximum
displacement and fault length (Dmax/L) is an important parameter for understanding the
growth of fault segments and the evolution of major faults that limited the rift borders (Cowie
et al., 2000; McLeod et al., 2000; De Castro et al., 2008). Curves of fault growth can be
obtained measuring the Dmax along the fault trace and divided it by the fault length. The
analysis of Dmax/L curves is based on the premise that border faults of the rift were formed by
the growth and connection of individual faults.
The growing fault segments can unite in at least two different ways: a hard link and a
soft link (Kim and Sanderson, 2005). The model of growth faults of union segments assumes
that the highest increase of displacement profile occurs subsequent to complete union of
segments, named hard linkage. In this model when the linkage between the segments is
complete, the linked segments start to proceed as a single fault. The soft linked fault segments
grow through interactions with adjacent faults, which inhibit propagation, and thus, they
acquire high Dmax/L ratios. The curves of fault growth form steep displacement gradients near
their interacting tips at the point of maximum displacement away from the center of both fault
segments. The growth decreases from the center to the ends. The growth rates for faults in
rifts range from 2-5mm/year in the central portion of the fault to 0.5 mm/year to the next
endings (Gawthorpe et al., 1994).
5.2. Fault segments of the Potiguar rift
Based on the structural map of the Matos (1992), we identified the major faults, which
characterize the evolution of the Potiguar Basin, in the gravity model (Fig. 7). These faults are

32
the Apodi (A), Baixa Grande (B), and Carnaubais (C and D segments) fault systems, which
form the boundaries of the Potiguar rift at its southern, southeastern, and eastern edges,
respectively (Fig. 7). Based on the structural maps described by Matos (1992) and De Castro
and Bezerra (2015), the faults have lengths that vary from 76 to 102 km (A = 76; B = 31; C =
99; D = 102 km). On the southern rift border, the Apodi (segment A) and Baixa Grande
(segment B) faults strike NW-SE and NE-SW, respectively. The combination of these two
fault systems forms an extensional triangular wedge (Matos, 1992; Hoerlle et al., 2007). The
Apodi fault is cross cut by secondary normal faults with small throws, which form a collapse
graben (Hoerlle et al., 2007).
At the eastern border of the rift, there is a set of NE-SW trending fault segments,
which forms the Carnaubais fault system (segments C and D) that bounds the Umbuzeiro and
Guamaré grabens (Figs. 1 and 7). These are listric normal faults dipping to W and/or NW
(Fig. 4). They are cut by another group of faults, classified as ENE-WSW trending transfer
faults. They correspond to previous transfer segments, which were reactivated as dextral
transfer faults during the Syn-rift III (Matos, 1992).
The Apodi Fault (A) and the Baixa Grande Fault (B) () present a hard linkage between
them. This occurs where faults present mechanical interaction and, from the point of view of
fault displacement, behave as a single fault (Fig. 7). In the same way, the geometry and length
of segments C and D of the Carnaubais Fault System suggest that a hard linkage united them
(Fig. 7). On the other hand, the connection between the Baixa Grande Fault ( B) () and
Carnaubais Fault (C) is expressed by a 3 to 7 km wide relay ramp that dips to NE, towards to
the Umbuzeiro Graben depocenter (Fig. 7). This relay ramp was generated by a normal stress
regime with the propagation of the faults of Carnaubais toward Baixa Grande Fault. Relay
ramp represents a soft link, which transfers the offset from one fault to the other (Soliva and
Benedicto, 2004). In that case the linkage is not complete, the faults overlapped, but do not
linkage completely. In conclusion, the growth of Potiguar rift border faults occurred by
connecting four major different segments, which characterize the progressive evolution of
faults and formation of the half-graben boundaries.
5.3. Fault-growth curves from the Potiguar rift
We selected 45 transects perpendicular to the fault strike to elaborate the growth
curves. These transects are spaced 5 km from each other along the major boundary faults of
the Potiguar rift (Fig. 7) to measure the maximum displacements of the fault segments (Dmax)
from the 3D gravity model and seismic sections. The difference between Dmax values derived

33
from gravity along the seismic profiles and those estimated from seismic data varies from 7 to
11%. Thus, the confidence in the computed Dmax/L curves is ~ 10% for our 3D gravity model.
The largest discrepancies occur in the Apodi Fault due to greater structural complexity
interfering in the gravity pattern. In fact, Apodi fault experienced more intense strike-slip
deformation during the late stages of the rifting, generating marginal graben-like structures
(De Castro and Bezerra, 2015).
The maximum displacement curves as a function of the length of the fault segment
show an asymmetric distribution, separated in four well-defined segments (Fig. 8). This great
variation of fault displacement along the faults indicates complex interconnections of fault
segments, typical of faulted rift borders. The Dmax/L curves suggest that the fault segments (A,
B, C and D) propagated toward one another, formed linkage zones where displacements are
increased (Fig. 8). For example, the area of the relay ramp between segments B and C exhibits
displacement of 5.1 km. The Apodi Fault System shows a maximum displacement located in
its central part and two marginal areas with high displacements, which indicate that the major
fault is composed of small fault segments.
In addition, we calculate the ratios between maximum displacement and lengths for
each fault segment. From segment A to D, the Dmax/L ratios are 0.055, 0.079, 0.051, and
0.021, respectively. These values are very similar to each other, showing a reliable result for
the entire rift and indicating that the uniform regional tectonic mechanism acted during the
growth and interaction of fault segments. The Dmax/L ratios of the Potiguar border faults are
similar to those of normal faults, in agreement with the theoretical curves described by Kim
and Sanderson (2005). It is noteworthy that the high Dmax/L ratio of the Baixa Grande Fault
(segment B) probably reflects the structural interaction with the Carnaubais Fault (segment
C), forming a relay ramp. On the other hand, the low Dmax/L ratio of the segment D is due that
this fault segment formed far away from the main deformation efforts, concentrated to the
south along the SE part of the Carnaubais Fault system.
6. The Potiguar rift evolution based on growth-fault models
The evolution of the rift faults can be divided into many stages based on the Dmax/L
ratio. We determined these stages measuring the maximum displacement along the all border
fault system (Fig. 7) and subtracting 500 m from them to determine a previous stage in the rift
evolution. Thereafter, we compiled five stages (Fig. 9) and correlated each one with the major
tectonic events previously identified in the evolution of the Potiguar Basin.

34
The separation of South American and African continents began in the southern part,
and increasing from south to north. This period is marked by an intense stress extensional
deformation NW -SE, which culminated in the formation of a series of rift basins. In this early
rifting stage, the Potiguar Basin was located nearby the St. Helena hotspot, which is also
associated with the aborted rift of the Benue Trough in the African counterpart (Fig. 10). This
hotspot caused thermal uplift, leading to weakening and thinning of the continental crust,
followed by tensional faulting (Beasley et al., 2010, De Castro et al., 2012;).
The stage I (Fig. 9) represents the first tectonic motions of the Potiguar rift during the
main rift phase (Syn-rift II). These extensional deformations led to the Pangea breakup
between South America and Africa in the Early Cretaceous (Matos, 1992). The Carnaubais
Fault started growing from the southeastern part of the rift, reactivating NE-SW-striking
Precambrian shear zones (Matos, 1992; De Castro et al., 2012). The fault segment reached an
extension of 10 km and an up to 0.6 km throw during the Berriasian. This stage was
accompanied by the Rio Ceará Mirim magmatism (132 +/- 1.0 Ma), which occurs as dike
swarms, in the southern border of the Potiguar Basin (Matos, 1992; Pessoa Neto et al., 2007).
In stage II (Fig. 9), as the extensional activity progressed, the Carnaubais Fault
propagated and increased the Dmax/L ratio to 2.1/60 km. NW-SE-oriented extension initiated
the formation of the Apodi Fault. During this rifting phase, this fault segment reached a length
of 45 km and Dmax of 1.2 km in the southernmost part of the rift. The formation of the NW-
SE-oriented Apodi graben started along the Apodi Fault system.
The Carnaubais fault spread in the SE portion of the rift as the rifting process
intensified during stage III (Fig. 9). The Dmax and L values of the Carnaubais Fault were 2.4
and 85 km, respectively. The Apodi Fault, which behaved as a normal fault in the first
extension stage (Matos 1992), began to behave as a dextral fault moving laterally and cutting
across the Precambrian fabric (De Castro and Bezerra, 2015). The Apodi fault reached
maximum displacement of 2.2 km and length of 70 km during stage III.
The stage IV was characterized by stretching and increasing of the Dmax/L, especially
of segments B (1.5/30 km) and C (1.2/9 km). The Apodi Fault grew 20 km westwards,
forming NW-SE oriented marginal grabens in the SW border of the Potiguar Rift (Fig. 9).
New fault segments B and D (Baixa Grande Fault and NE segment of the Carnaubais Fault,
respectively) started growing independently from the Carnaubais Fault (segment C) tips,
expanding the Umbuzeiro Graben in both N and W directions. In the later phase of this stage,
the four main fault segments linked and formed a more than 310-km long faulted rift border.
The Baixa Grande and the Apodi faults showed a soft linkage as well as the segments C and

35
D of the Carnaubais Fault System. On the other hand, the zone between Baixa Grande and
Apodi Faults was composed by a 40-km long relay ramp.
At the end of stage IV, the Potiguar Basin experienced an important change in the
tectonic deformation in the Barremian (Matos, 1992, 2000). The extensional movement
ceased onshore, left behind an aborted rift and migrated northwards to the future Brazilian
equatorial margin with a more E-W strike-slip component. The record of this phase in the
onshore Potiguar Basin is the elongated marginal grabens in the western border of the
Potiguar Rift (De Castro and Bezerra, 2015). In the offshore basin, the entire western part
experienced slightly oblique transtension with the opening of probably narrow NW-SE
trending elongated basins, while in the eastern part and a deep and wide basin developed
(Matos, 2000).
In the last stage V (Fig. 9) the Potiguar rift became stabilized and the fault segments
attained their present configuration. The Apodi Fault (segment A) was characterized by the
change of direction and interruption of NE-SW faults that are the predominant direction of the
Potiguar Rift. Its final length is 76 km and the displacement increased to 4.3 km. The Baixa
Grande Fault was more than 31 km long and its extension to the west defined the limits of the
Umbuzeiro Graben and part of Apodi Graben. The Carnaubais Fault (segment C) reached a
length of approximately 99.4 km, and its final maximum displacement reached 5.1 km. It
bounds the eastern portion of the onshore Potiguar rift, and it was responsible for the
formation of the Umbuzeiro and Guamaré grabens. Finally, the segment D reached a final
length of approximately 102.3 km, but its displacement did not exceed 2.2 km, indicating that
the basin experienced more modest subsidence rate close to the continental margin. During
the Aptian, the extensional efforts jumped eastwards to South Atlantic and northwards to
Equatorial Atlantic, leaving an aborted continental rift system in NE Brazil. An overall
thermal subsidence stage took place and the Potiguar rift was overlapped by post-rift
sedimentary sequences.
7. Conclusions
A 3D gravity model and seismic data were used to define the internal architecture of
the Cretaceous Potiguar Rift, NE Brazil. The results show the evolution of propagation of
normal fault systems. They allowed us to examine fault-segment displacement, length,
geometry, spacing, overlapping, and relationship with the preexisting ductile basement fabric.
The Dmax/L curve analysis indicates to the existence of several stages of fault growth
in the Potiguar Basin. The Potiguar Rift was generated from four major faults: Apodi (A),

36
Baixa Grande (B) and Carnaubais (C and D) that grew up independently and linked by soft
and hard linkages. The rift process of the Potiguar Basin began from a single segment:
segment C, which corresponds to the Carnaubais fault, reactivating NE-SW oriented
Precambrian shear zones. As the stress proceeded and the kinematics changed, the Apodi
Fault (segment A) started to form as a NW-SE-trending transfer faults, of dextral movement,
that controlled the south border of the rift. The tectonic activity increased and formed the new
fault segments, Baixa Grande Fault (segment B) and the NE segment of the Carnaubais Fault
(segment C), respectively. All these segments grew and linked one to another.
Fault segments A and B and C and D present a hard linkage between them. This
occurs where fault segments present mechanical interaction and, from the point of view of
fault displacement, behave as a single fault. Fault segments B and C present soft linkage, as a
relay ramp. This occurs where fault segments interact but still preserve some degree of
independence. These various stages of fault segment interaction and linkage are part of the
evolution of rift basins.
The fault-growth curves also reveal that the fault displacement is more pronounced in
the linkage zones of the fault segments. The Dmax/L ratio is especially high in the relay ramp
between Baixa Grande and Carnaubais faults. The lowest ratios occur in the NE part of the
Carnaubais fault, indicating that the tectonic efforts concentrated in the southern portion of
the Potigura rift, where the Umbuzeiro and Apodi grabens are up to 5 km deep. Our study
indicated that this method to investigate fault growth divided in stages may be applicable to
the rifts that culminated with the Pangea breakup, especially for rift basin that composed the
rift systems in northeastern Brazil.
Acknowledgements
References
Almeida, F. F. M; Brito Neves, B.B; Carneiro, C.D.R., 2000. The origin and evolution of the
South American Platform. Earth Science Reviews 50, 77-111.
Bezerra, F.H.R.; Vita-Finzi, C. 2000. How active is a passive margin? Paleoseismicity in
Northeastern Brasil. Geology 28, 591-594.
Bertani, R.T.; Costa, I.G.; Matos, R.M.D., 1990. Evolução Tecto-Sedimentar, estilo Estrutural
e Habitat do Petróleo na Bacia Potiguar. In: Raja De; Gabaglia, G.P.; Milani, E.J. (Coords.):
Origem e Evolução de Bacias Sedimentares. Petrobras, 291-310.

37
Beasley, C.J., Fiduk, J.C., Bize, E., Boyd, A., Frydman, M., Zerilli, A., Dribus, J.R., Moreira,
J.L.P., Capeleiro Pinto, A. C., 2010.Brazil’s Presalt Play. Schlumberger Oilfield Review
Autumn, 22 (3), 28-37.
Burgmann, R., Pollard, D.D., Martel, S.J., 1994. Slip distributionson faults: effects of stress
gradients, inelastic deformation, heterogeneous host-rock stiffness, and fault interaction.
Journal of Structural Geology 16, 1675–1690.
Cartwright, J.A., Trudgill, B.D., Mansfield, C.S., 1995. Fault growth by segment linkage: an
explanation for scatter in maximum displacement and trace length data from the Canyonlands
grabens of SE Utah. Journal of Structural Geology 17 , 319–1326.
Chang, H.K., Koswmann, R.O., Figueiredo, A.M.F., 1988. New concepts on the development
of East Brazilian marginal basins. Episodes 11 (3), 194-202.
Cowie, P. A., Scholz, C. H., 1992., Physical explanation for the displacement-length
relationship of faults using a post-yield fracture mechanics model. Journal of Structural
Geology 14, 1133-1148
Cowie, P. A., Scholz, C. H., 1998. Faults tip displacement gradients and process zone
dimensions. Journal of Strutural Geology 20, 938-997.
Cowie, P.A., Gupta, S., Dawers, N.H., 2000. Implications of fault array evolution forsynrift
depocentre development: insights from a numerical fault growth model. Basin Research 12,
241–261.
Dawers, N.H., Anders, M.H., Scholz, C.H., 1993. Fault length and displacement: scaling
laws. Geology 21, 1107–1110.
De Castro, D.L., 2005. Modelagem gravimétrica 3-D de corpos graníticos e bacias
sedimentares com embasamento estrutural de densidade variável. Revista Brasileira de
Geofísica 23 (3), 295–308.
De Castro, D.L., 2011. Gravity and magnetic joint modeling of the Potiguar rift basin (NE
Brazil): basement control during Neocomian extension and deformation. Journal of South
American Earth Sciences, 31, 186-198.
De Castro, D.L., Bezerra, F.H.R. 2015. Fault evolution in the Potiguar rift termination,
equatorial margin of Brazil. Solid Earth 6, 185-196.

38
De Castro, D.L., Bezerra, F.H.R., Castelo Branco, R.M.G., 2008. Geophysical evidence of
crustal-heterogeneity control of fault growth in the Neocomian Iguatu Basin, ne Brazil.
Journal of South American Earth Sciences 26, 271-285.
De Castro, D.L., Bezerra, F.H.R., Sousa, M.O.L., Fuck, R.A., 2012. Influence of
Neoproterozoic tectonic fabric on the origin of the Potiguar Basin, northeastern Brazil and its
links with West Africa based on Gravity and Magnetic Data. Journal of Geodynamics, 52, 29-
42.
Gaino, M., Lyrio, J.C., Medeiros, W.E. 2014. Gravity Inversion of the Onshore Potiguar
Basin Basement in different Exploratory Phases. Revista Brasileira de Geofísica, 31 (4), 661-
672.
Gawthorpe, R. L.; Fraser, A. J.; Collier, R. E. L., 1994. Sequence stratigraphy in active
extensional basin-fills. Marine and Petroleum Geology 11 (6), 642-658.
Gupta, S.; Cowie, P.A; Dawers, N.H; J.R., 1998. A mechanism to explain rift-basin
subsidence and stratigraphic patterns through fault-array evolution. Geology, 26, 595-598.
Hoerlle M.R., Gomes C.J.S; Matos R.M.D., 2007. O Graben de Apodi, região sudoeste da
Bacia Potiguar, RN, uma interpretação com base em secções sísmicas e dados de poços.
Revista da Escola de Minas, 60, 593-602.
Jachens, R.C., Moring, B.C., 1990. Maps of thickness of Cenozoic deposits and theisostatic
residual gravity over basement for Nevada. US Geological SurveyOpen-File Report 90-404,
scale 1:1,000,000.
Kim, Y.S., Andrews, J.R., Sanderson, D.J., 2000. Damage zones around strike–slip fault
systems and strike–slip fault evolution, Crackington Haven, southwest England. Geoscience
Journal 4, 53 – 72.
Kim, Y.-S., Sanderson, D.J., 2005. The relationship between displacement and length of
faults: a review. Earth Science Reviews 68, 317–334.
Matos, R.M.D., 1992. The northeast brazilian rift sistem. Tectonics, 11, 766-791.
Matos, R. M. D., 2000. Tectonic Evolution of the Equatorial South Atlantic, Geophysical
Monography AGU 115, 331–354.
McLeod, A.E., Dawers, N.H., Underhill, J.R., 2000. The propagation and linkage of normal
faults: insights from Strathspey-Brent-Statfjord fault array, northern North Sea. Basin
Research 12, 263–284.

39
Moura-Lima, E.N.; Sousa, M.O.L.; Bezerra, F.H.R; Aquino, M.A.; Vieira, M.M.; Lima-Filho,
F.P.; Fonseca, V.P.; Amaral, R.F., 2010.Sedimentação e deformação tectônica neogênicas e
quaternárias no centro da Bacia Potiguar. Geologia USP, Série Científica 10 (1), p. 15-28.
Pessoa Neto, O. C., Soares, U. M., Silva, J. G. F., Roesner, E. H., Florência, C. P., and Souza,
C. A. V., 2007. Bacia Potiguar, Boletim de Geociências da Petrobras 15, 357–369.
Pickering, G., Peacock, D.C.P., Sanderson, D.J., Bull, J.M., 1997. Modelling tip zones to
predict the displacement and length characteristics of faults. American Association of
Petroleum Geologists Bulletin 81, 82–99.
Rao, D.B., Babu, N.R., 1990. A Fortran-77 computer program for three-dimensional analysis
of gravity anomalies with variable density contrast. Computers and Geosciences 17 (5), 655–
667.
Rodrigues, R.S.; De Castro, D.L.; Reis Jr, J.A. 2014. Characterization of the Potiguar Basin
Rift Structure Based on Euler Deconvolution. Revista Brasileira de Geofísica 32, 109-121.
Segall, P.; Pollard, D.D., 1980. Mechanics of discontinuous faults. Journal of Geophysical
Research 85, (B8), 4337-4350.
Soliva, R., Benedicto, A., 2004. A linkage criterion for segmented normal faults. Journal of
Structural Geology 12, 2251-2267.
Watterson, J., 1986. Fault dimensions, displacements and growth. Pure and Applied
Geophysics 124, 365-363.
Walsh, J. J., Watterson, J., 1988. Analysis of the relationship between the displacements and
dimensions of faults. Journal of Structural Geology 10, 239-247.

40
Tables
Table 1. Velocities and densities of stratigraphic units of the Potiguar Basin.
Stratigraphic Units Velocity (m/s) Density
(kg/m3)
Depth of unit top (m)
Well A Well B Well C
Jandaíra 4096 2370 - 500 110
Açu 3094 2450 220 5300 540
Alagamar 5350 2500 600 1100 1100
Pendência 5480 2600 1000 1400 -
Basement 5674 2750 - - 1200
Figures
Figure 1. (A) Schematic geological map of the northeastern Brazil and its main Cretaceous rift
basins (AR: Araripe, IG: Iguatu, JA: Jatobá, PO: Potiguar, RE: Recôncavo, RP: Rio do Peixe,
SA: Sergipe-Alagoas), adapted from Matos (1992) and De Castro (2011). (B) Simplified
geological map of the Potiguar Basin, showing the Potiguar Rift and the major border faults
(modified from Bertani et al., 1990; De Castro and Bezerra, 2015). Inset: The South American
Continent.
Figure 2. Bouguer anomaly map of the Potiguar Basin with the location of gravity stations,
seismic sections and wells used in the present study.
Figure 3. Seismic section (A), seismic interpretation (B) and depth model (C) of the Profile 1
(location in Fig. 2).
Figure 4. Seismic section (A), seismic interpretation (B) and depth model (C) of the Profile 9
(location in Fig. 2).
Figure 5. Residual anomaly map of the Potiguar Basin with rift faults mapped by Matos
(1992) (fine lines). Gravity lows are associated with grabens within the rift zone (A) or
supracrustal blocks (B).
Figure 6. 3D gravity model of the basement relief.
Figure 7. 3D gravity model of the Potiguar rift, showing the location of the measurement of
maximum fault displacements of the main border faults (A – Apodi (red); B – Baixa Grande
(blue); C and D – Carnaubais (green and purple)).
Figure 8. Dmax/L curves of the Potiguar rift fault segments (A, B, C, and D in Fig. 7).

41
Figure 9. Potiguar Rift evolution based on Dmax/L curves derived from 3D gravity model and
seismic data. Fault segments: A – Apodi, B – Baixa Grande, B – SW Carnaubais, D – NE
Carnaubais.
Figure 10. Paleogeographic position of South America and Africa before the Pangea breakup
in the Early Creataceous (Modified from Matos, 1992).

42
Fig. 1

43
Fig. 2

44
Fig. 3

45
Fig. 4

46
Fig. 5

47
Fig. 6

48
Fig. 7

49
Fig. 8

50
Fig. 9
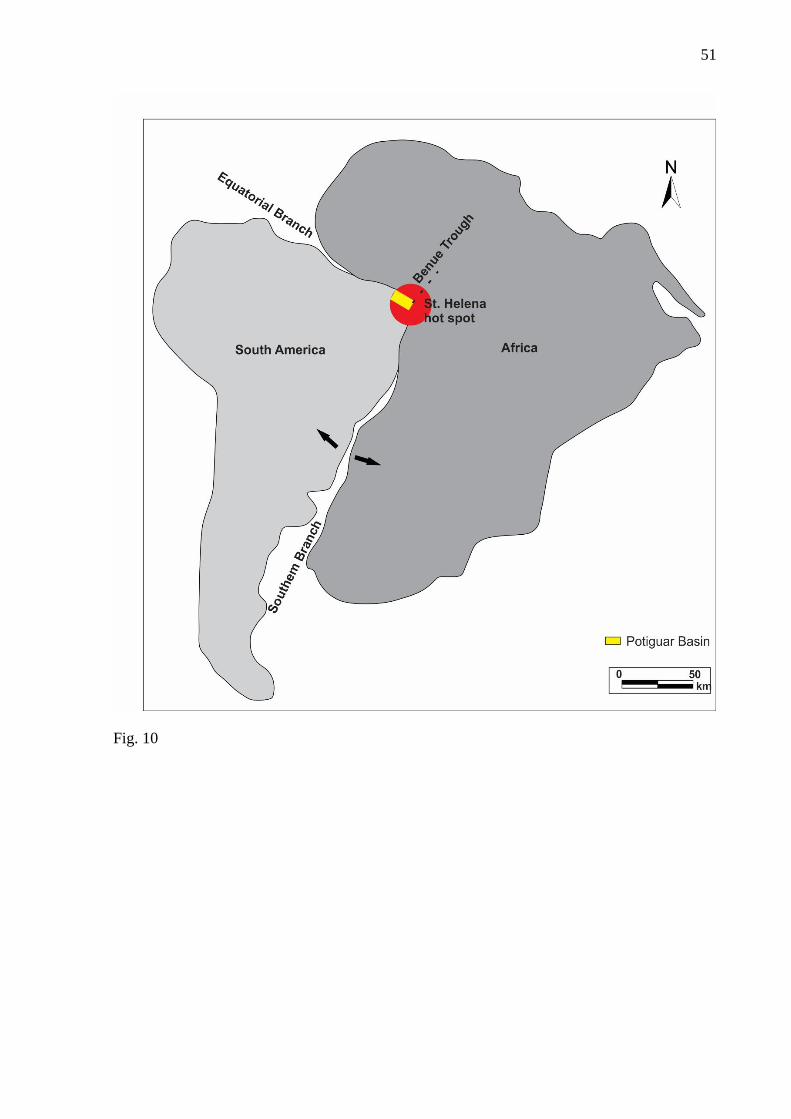
51
Fig. 10

52
6. CONSIDERAÇÕES FINAIS
A partir das análises dos dados de poços exploratórios, seções sísmicas, e dos mapas
de anomalias gravimétricas residuais, foi possível realizar uma modelagem gravimétrica 3D
do rifte da Bacia Potiguar. Após quatro iterações do procedimento de inversão obteve-se o
relevo estimado para o embasamento do Rifte Potiguar, tornando possível observar a estrutura
principal do rifte como sendo constituída por um semi-gráben assimétrico, alongado na
direção NE-SW. Seus limites leste e sul representam as bordas falhadas do rifte, os sistemas
de falhas Apodi e Carnaubais. Estas estruturas limitam os principais grábens da bacia, Apodi
e Umbuzeiro, que possuem profundidades superiores a 5,5 km.
Os modelos sísmicos utilizados podem conter incoerências inerentes ao método, uma
vez que a sísmica 2D utilizada foi adquirida com parametrização regional no final da década
de 80. Além disso, na porção mais profunda da bacia ocorre uma perda de resolução na
definição dos refletores referentes ao embasamento dificultando sua identificação. Outro
ponto a ser considerado é a conversão dos dados de tempo para profundidade, processo que
pode ter ocasionado erros devido às variações das velocidades das rochas. Esses fatores
podem ter contribuído para fornecer um modelo de referência que não reproduz com
fidelidade as estruturas em sub-superfície.
A amarração das seções sísmicas com as informações de poços exploratórios e nas
intersecções de outras linhas sísmicas foi fundamental para assegurar a consistência dos
resultados no que diz respeito aos valores absolutos de estimativa de profundidade. O grau de
incerteza nas medidas do deslocamento das falhas medidos no modelo gravimétrico foi de
10% se comparado com os dados de sísmica e de poços. Já a diferença encontrada entre o
modelo gravimétrico e os dados de poços variou de 547 a 0,002 m, representando um erro
máximo de até 11%.
Foram identificadas, através das curvas Dmáx/L, as principais falhas de bordas que
caracterizam a evolução do Rifte Potiguar: Apodi (A), Baixa Grande (B) e Carnaubais (C e
D). Seus comprimentos variam de 76 a 102 km (A = 76; B = 31; C = 99; D = 102 km).
Enquanto que, os deslocamentos máximos foram de cerca de 5,1 km para as falhas de Apodi e
Carnaubais e de 2,3 km para a Falha de Baixa Grande. As razões Dmáx/L foram de 0,05 para
os segmentos A e C, 0,08 para o segmento B e de 0,02 para o segmento D, indicando uma
maior intensidade dos esforços tectônicos na porção central-sul do Rifte Potiguar, diminuindo
para norte na direção da atual margem continental.
A partir dos resultados obtidos foi possível dividir a sequência evolutiva das falhas
de borda em cinco principais estágios e relacioná-los aos eventos tectônicos que originaram o

53
Rifte Potiguar, baseando-se nas relações Dmáx/L das Falhas de Apodi, Baixa Grande e
Carnaubais.
O estágio I foi correlacionado ao início da formação do rifte, quando ocorreu a
fragmentação do Supercontinente Pangeia, separando a América do Sul da África. Neste
momento inicial, começou a se desenvolver a Falha de Carnaubais (C) na porção sudeste do
rifte, com um comprimento de 10 km e um rejeito de 0,6 km.
O estágio II foi marcado por um aumento da atividade tectônica, denunciado por um
aumento nas taxas de Dmáx/L da Falha de Carnaubais para 2,1/60 km. Neste mesmo estágio,
esforços de direção NW-SE provocaram a abertura da Falha de Apodi (A), medindo 45 km de
comprimento e um Dmáx de 1,2 km.
Durante o estágio III, houve um aumento nos esforços na porção SE do rifte, fazendo
com que os valores Dmáx/L para a Falha de Carnaubais (C) aumentassem para 2,4/85 km.
Enquanto que, a Falha de Apodi (A), que se comportava exclusivamente com uma falha
normal, passa-se a se comportar como uma falha de transferência, como movimentos dextrais,
medindo 70 km de comprimento a um deslocamento máximo de 2,2 km.
O estágio IV é caracterizado pelo surgimento de novos segmentos de falhas, a Falha
de Baixa Grande (B) paralela à Falha de Carnaubais, e o segmento de falha D, crescendo
independente a NE da Falha de Carnaubais. Os valores Dmáx/L para estes segmentos foram
de 1,5/30 km para o segmento B e de 1,2/9 km para o segmento C.
No estágio V ocorreu a estabilização do rifte. A Falha de Apodi atingiu uma extensão
superficial de 76 km e com um deslocamento máximo de 4,3 km. A Falha de Baixa Grande se
estendeu até 31 km, definindo-se a oeste como limite do Gráben de Umbuzeiro e parte do
Gráben de Apodi. A Falha de Carnaubais (C) atingiu um comprimento de aproximadamente
99 km e um deslocamento máximo de 5,1 km. Já o segmento D se uniu à Falha de Carnaubais
(C), com uma baixa razão Dmáx/L de 2,2/102 km.
A análise do crescimento das falhas de borda do Rifte Potiguar revelou como vários
segmentos de falhas evoluíram para um único e complexo sistema de falhas interligado. A
ligação rígida está presente entre os segmentos de falhas: Apodi (A) e Baixa Grande (B); e
Carnaubais (C e D). Estes segmentos se ligaram por completo e passaram a se comportar
como uma única falha. Já os segmentos de falhas, Baixa Grande (B) e Carnaubais (C)
apresentam ligação flexível, formando uma rampa de alívio. Neste caso, a interação entre os
segmentos não foi completa, eles se sobrepuseram, mas ainda preservaram um certo grau de
independência.

54
REFERÊNCIAS BIBLIOGRÁFICAS
Bertani, R.T.; Costa, I.G.; Matos, R.M.D. 1990. Evolução Tecto-Sedimentar, estilo Estrutural
e Habitat do Petróleo na Bacia Potiguar. In: Raja De; Gabaglia, G.P.; Milani, E.J. (Coords.):
Origem e Evolução de Bacias Sedimentares. PETROBRAS, 291-310.
Bezerra, F.H.R.; Lima Filho, F.P.; Amaral, R.F.; Caldas, L.H.O.; Costa Neto, L.X. 1998.
Holocene Coastal Tectonics in NE Brazil. In: Geol. Soc., London, Special Publication. (Org.).
Coastal Tectonics. Stewart, I. and Vita-Finzi, C. (eds.) 146 ed., Londres: Geological Society,
146, 279-293.
Bezerra, F.H.R.; Vita-Finzi, C. 2000. How active is a passive margin? Paleoseismicity in
Northeastern Brasil. Geology, 28, 591-594.
Bezerra, F.H.R.; Do Nascimento, F.; Ferreira, J.M.; Nogueira, F.C.C.; Fuck, R.A.; Brito
Neves, B.B.; Sousa, M.O.L. 2011. Review of active faults in the Borborema Province,
Intraplate South America Integration of seismological and paleoseismological data.
Tectonophysics (Amsterdam), 510, 269-290.
Blakey, R.J. 1995. Potential theory in gravity and magnetic applications. Cambridge
University Press, London, 441p.
Bott, M.H.P. 1960. The use of rapid digital computing methods for direct gravity
interpretation of sedimentary basins. Geophysical Journal of the Royal Astronomical Society,
3, 63-67.
Burgmann, R., Pollard, D.D., Martel, S.J., 1994. Slip distributions on faults: effects of stress
gradients, inelastic deformation, heterogeneous host-rock stiffness, and fault interaction.
Journal of Structural Geology, 16, 1675– 1690.
Cartwright, J.A.; Trudgill, B.D.; Mansfield, C.S. 1995. Fault growth by segment linkage D an
explanation for scatter in maximum displacement and trace length data from the Canyonlands
grabens of SE Utah. Journal of Structural Geology, 17, 1319-1326.
Corbató, C.E. 1965. A least-squares procedure for gravity interpretation. Geophysics, 30, 228-
23.
Cowie, P. A. 1998. A healing-realoading feedback control on the growth rate seismogenic
fault. Journal of Structural Geology 20, 1075-1087.

55
Cowie, P. A.; Scholz, C. H. 1992. Physical explanation for the displacement-length
relationship of faults using a post-yield fracture mechanics model. Journal of Structural
Geology, 14, 1133-1148.
Cremonini, O. A. & Karner, G. D., 1995. Soerguimento termal e erosão na Bacia Potiguar
submersa e seu relacionamento com a evolução da margem equatorial brasileira. In: SBG,
Simpósio de Geologia do Nordeste, 16, Recife, Boletim, 14, 181-184.
Dawers, N.H.; Anders, M.H.; Scholz, C.H. 1993. Fault length and displacement: scaling laws.
Geology, 21, 1107-1110.
De Castro, D.L. 2005. Modelagem Gravimétrica 3-D de Corpos Graníticos e Bacias
Sedimentares com Embasamento Estrutural de Densidade Variável. Revista Brasileira de
Geofísica, Rio de Janeiro – RJ, 2 (3), 295-308.
De Castro, D. L. 2011. Gravity and magnetic joint modeling of the Potiguar rift basin (NE
Brazil): basement control during Neocomian extension and deformation. Journal of South
American Earth Sciences, 31, 186-198.
De Castro, D.L.; Bezerra, F.H.R.; Castelo Branco, R.M.G. 2008. Geophysical evidence of
crustal-heterogeneity control of fault growth in the neocomian iguatu basin, ne Brazil. Journal
of South American Earth Sciences, 26, 271-285.
De Castro, D.L.; Bezerra, F.H.R.; Sousa, M.O.L.; Fuck, R.A. 2012. Influence of
Neoproterozoic tectonic fabric on the origin of the Potiguar Basin, northeastern Brazil and its
links with West Africa based on Gravity and Magnetic Data. Journal of Geodynamics, 52, 29-
42.
De Castro, D.L.; Bezerra, F.H.R. 2015. Fault evolution in the Potiguar rift termination,
equatorial margin of Brazil. Solid Earth, 6, 185-196.
Fossen, H.; tradução Andrade, F. R. D. 2012. Geologia Estrutural. São Paulo: Oficina de
Textos, 584 p.
Gaino, M.; Lyrio, J.C.; Medeiros, W.E. 2013. Gravity Inversion of the Onshore Potiguar
Basin Basement Reliferent Exploratory Phases. Revista Brasileira de Geofísica, 31 (4), 661-
672.
Gawthorpe, R. L.; Fraser, A. J.; Collier, R. E. L., 1994. Sequence stratigraphy in active
extensional basin-fills. Marine and Petroleum Geology, 11 (6), 642-658.
56
Hoerlle, M.R., Gomes, C.J.S; Matos, R.M.D. 2007. O Graben de Apodi, região sudoeste da
Bacia Potiguar, RN, uma interpretação com base em secções sísmicas e dados de poços.
Revista da Escola de Minas, 60, 593-602.
Jackson, J.A. & White, N.J., 1989. Normal faulting in the upper continental crust:
observations from regions of active extension. Journal of Structural Geology, 11, 15-36.
Jachens, R.C; Moring, B.C. 1990. Maps of thickness of Cenozoic deposits and the isostatic
residual gravity over basement for Nevada. U.S. Geological Survey Open-File Report 90-404,
scale 1:1.000.000.
Kearey, P.; Brooks, M.E.; Hill, L. 2002. An Introduction to Geophysical Exploration. Malden,
Blackwell 3, 262p.
Kim, Y.S.; Andrews, J.R.; Sanderson, D.J. 2000. Damage zones around strike-slip fault
systems and strike-slip fault evolution, Crackington Haven, southwest England. Geoscience
Journal, 4, 53-72.
Kim, Y.-S., Sanderson, D.J., 2005. The relationship between displacement and length of
faults: a review. Earth Science Reviews, 68, 317–334.
Kinabo, B. D.; Hogan, J. P.; Atekwana, E. A.; Abdesalam, M. G.; Modisi, M. P. 2008. Fault
growth and propagation during incipient continental rifting: Insights from a combined
aeromagnetic and Shuttle Radar Topography Mission digital elevation model investigation of
the Okavango Rift Zone, northwest Botswana. Tectonics, 27, TC3013, 1-16.
Larsen, P. H., 1988. Relay structures in a Lower Permian basement-involved extension
system, East Greenland. Journal of Structural Geology, 10 (1), 3-8.
Matos, R.M.D., 1992. The northeast brazilian rift sistem. Tectonics, 11, 766-791.
Matos, R.M.D., 2000. Tectonic evolution of the equatorial South Atlantic. In: Mohriak, W.U.,
Talwani, M. (Eds.), Atlantic rifts and continental margins. AGU Geophysical Monograph,
115, 331–354.
Moura-Lima, E.N.; Sousa, M.O.L.; Bezerra, F.H.R; Aquino, M.A.; Vieira, M.M.; Lima-Filho,
F.P.; Fonseca, V.P.; Amaral, R.F. 2010.Sedimentação e deformação tectônica neogênicas e
quaternárias no centro da Bacia Potiguar. Geologia USP, Série Científica, 10 (1), 15-28.

57
Nelson, R.A., Patton, T.L., Morley, C.K. 1992. Rift-segment interaction and its relation to
hydrocarbon exploration in continental rift systems. AAPG Bulletin, 76 (8), 1153-1169.
Patton T.L., Moustafa A.R., Nelson R.A., Abdine S.A. 1994. Tectonic evolution and
structural setting of the Suez rift. In: S.M. Landon
Pessoa Neto O.C.; Soares U.M.; Da Silva J.G.F.; Roesner E.H.; Florencio C.P.; De Souza
C.A.V. 2007. Bacia Potiguar. Boletim de Geociências da Petrobras, 15(2), 357-369.
Pedrosa JR. N.C., De Castro D.L., De Matos J.P.L. 2010. Assinaturas magnéticas e
gravimétricas do arcabouço estrutural da Bacia Potiguar emersa, NE do Brasil. Revista
Brasileira de Geofísica 28 (2): 265-278.
Pickering, G.; Peacock, D.C.P.; Sanderson, D.J.; Bull, J.M. 1997. Modelling tip zones to
predict the displacement and length characteristics of faults. American Association of
Petroleum Geologists Bulletin, 81, 82-99.
Pontes, R.M. 2005. Dobramentos distensionais e a geometria da falha de baixa grande,
Graben de Umbuzeiro, Bacia Potiguar (RN). Dissertação de Mestrado PPGG-UFRN, Natal-
RN, 145p.
Rodrigues, R. S. 2012. Evidências da Herança Geotectônica Pré-Cambriana na Geração da
Bacia Potiguar: Um Estudo Geofísico Multidisciplinar, 83p. Dissertação de Mestrado. PPGG-
UFRN, Natal-RN, 120p.
Rodrigues, R.S.; De Castro, D.L.; Reis Jr, J.A. 2014. Characterization of the Potiguar Basin
Rift Structure Based on Euler Deconvolution. Revista Brasileira de Geofísica 32, 109-121.
Rosendahl B.R., 1987. Architecture of continental rifts with special reference to East Africa.
Annual Review of Earth and Planetary Sciences, 15, 445-503.
Telford, W.M; Geldart, L.P; Sheriff, R.E. 1990. Applied Geophysics Cambridge University
Press, Cambridge, 770 p.
Walsh, J.J.; Watterson, J. 1988. Analysis of the relationship between the displacements and
dimensions of faults. Journal of Structural Geology, 1, 239-247.
Watterson, J. 1986. Fault dimensions, displacements and growth. Pure & Appl. Geophysics,
124, 365-363.

58
Wilkins, S.J., Gross, M.R., 2002. Normal fault growth in layered rocks at Split Mountain,
Utah: influence of mechanical stratigraphy on dip linkage, fault restriction and fault scaling.
Journal of Structural Geology, 24, 1413– 1429.