universidade federal do espÍrito santo programa … · observe o esquema abaixo do famoso...
TRANSCRIPT
UNIVERSIDADE FEDERAL DO ESPÍRITO SANTO
PROGRAMA DE PÓS-GRADUAÇÃO EM CIÊNCIAS BIOLÓGICAS
DOUTORADO EM BIOLOGIA ANIMAL
PROCESSO SELETIVO 2017-2018
Prova Teórica
No. de Inscrição: _____________________ 13 de novembro de 2017
PARTE 1 [6,0 pontos]
a) Escreva um resumo de no máximo de 200 palavras para cada um dos artigos científicos
apresentados, de onde foram removidos o título e resumo originais (Anexos 1 a 3). Cada
sentença do texto deve começar em uma linha diferente. [Valor: 1,5 pontos cada resumo]
b) Proponha um título criativo que melhor sintetize cada um dos artigos [Valor: 0,5 ponto cada
título]
PARTE 2 [4,0 pontos]
Questões objetivas.
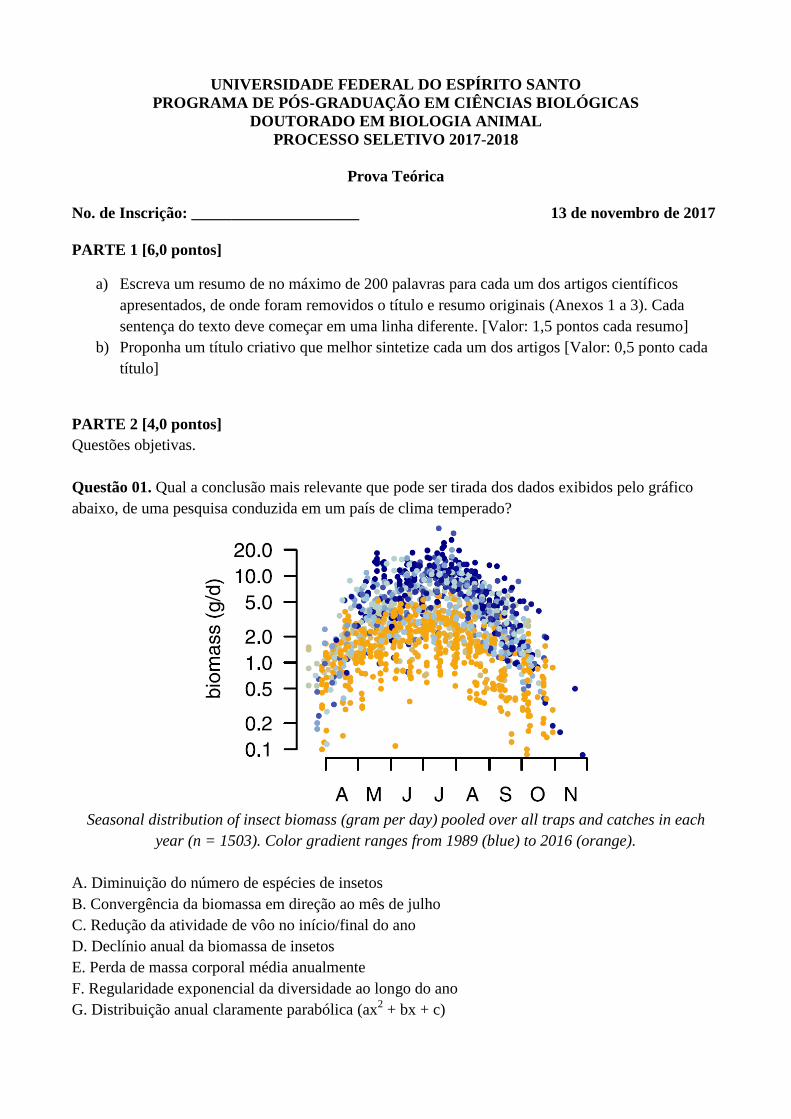
Questão 01. Qual a conclusão mais relevante que pode ser tirada dos dados exibidos pelo gráfico
abaixo, de uma pesquisa conduzida em um país de clima temperado?
Seasonal distribution of insect biomass (gram per day) pooled over all traps and catches in each
year (n = 1503). Color gradient ranges from 1989 (blue) to 2016 (orange).
A. Diminuição do número de espécies de insetos
B. Convergência da biomassa em direção ao mês de julho
C. Redução da atividade de vôo no início/final do ano
D. Declínio anual da biomassa de insetos
E. Perda de massa corporal média anualmente
F. Regularidade exponencial da diversidade ao longo do ano
G. Distribuição anual claramente parabólica (ax2 + bx + c)

Questão 02. Analisando os resultados apresentados nas figuras abaixo, qual a conclusão correta
sobre a diversidade de vertebrados na China?
Frequency distributions of species richness based on field surveys versus long-term averages of
evapotranspiration (ET) in China.
Average evapotranspiration in China.
A. Deve ser máxima no noroeste
B. Deve ser maior na faixa central de latitude
C. Deve ser máxima aproximadamente ente 19˚-25˚ N
D. Deve aumentar progressivamente do sul para o norte
E. Deve aumentar progressivamente do norte para o sul
F. Deve ser máxima no sudoeste
G. Deve ser inversamente proporcional à latitude
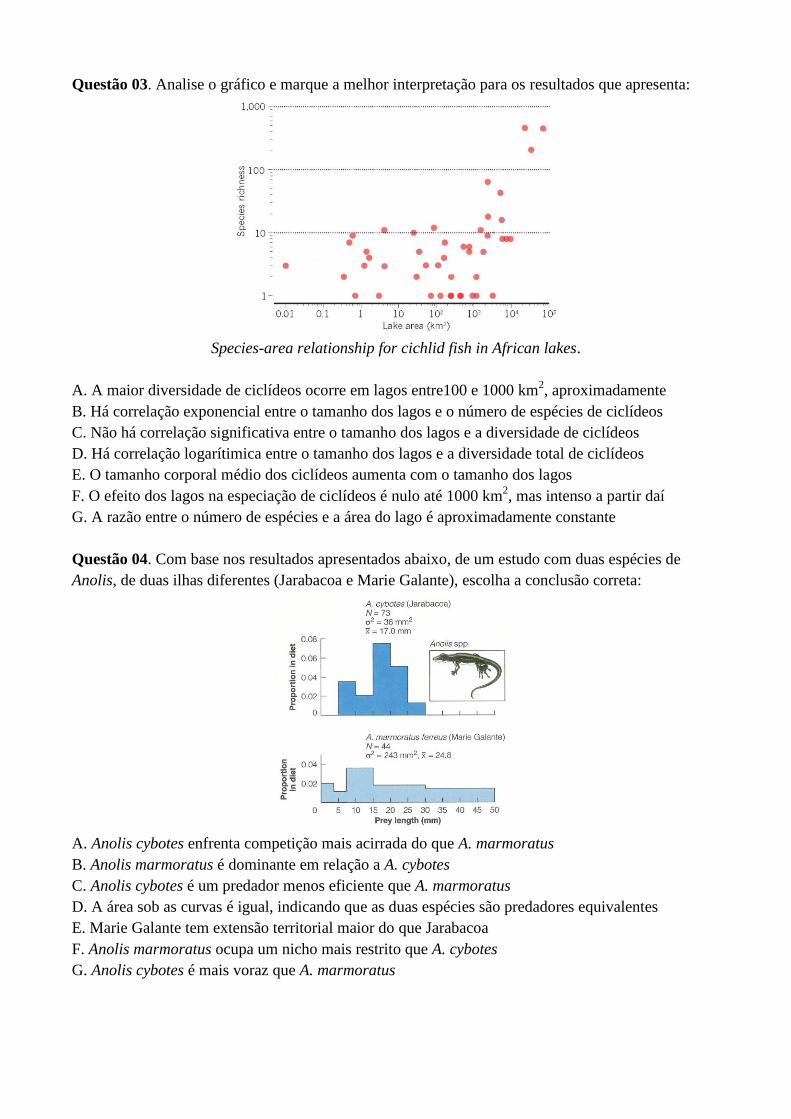
Questão 03. Analise o gráfico e marque a melhor interpretação para os resultados que apresenta:
Species-area relationship for cichlid fish in African lakes.
A. A maior diversidade de ciclídeos ocorre em lagos entre100 e 1000 km2, aproximadamente
B. Há correlação exponencial entre o tamanho dos lagos e o número de espécies de ciclídeos
C. Não há correlação significativa entre o tamanho dos lagos e a diversidade de ciclídeos
D. Há correlação logarítimica entre o tamanho dos lagos e a diversidade total de ciclídeos
E. O tamanho corporal médio dos ciclídeos aumenta com o tamanho dos lagos
F. O efeito dos lagos na especiação de ciclídeos é nulo até 1000 km2, mas intenso a partir daí
G. A razão entre o número de espécies e a área do lago é aproximadamente constante
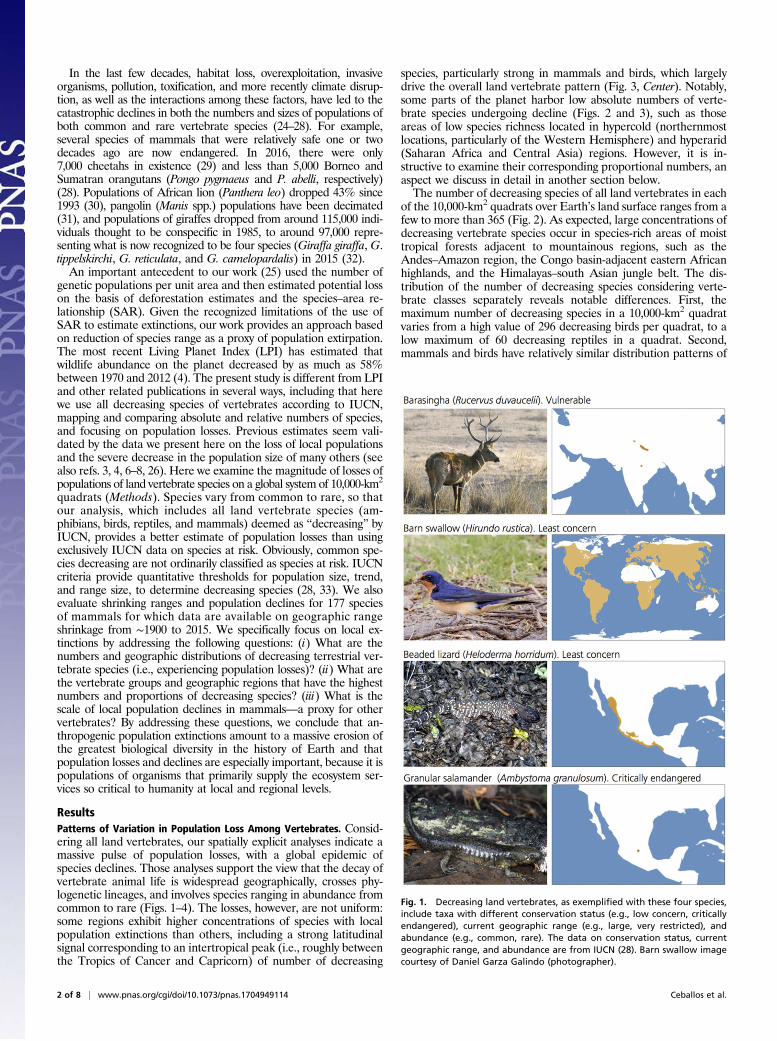
Questão 04. Com base nos resultados apresentados abaixo, de um estudo com duas espécies de
Anolis, de duas ilhas diferentes (Jarabacoa e Marie Galante), escolha a conclusão correta:
A. Anolis cybotes enfrenta competição mais acirrada do que A. marmoratus
B. Anolis marmoratus é dominante em relação a A. cybotes
C. Anolis cybotes é um predador menos eficiente que A. marmoratus
D. A área sob as curvas é igual, indicando que as duas espécies são predadores equivalentes
E. Marie Galante tem extensão territorial maior do que Jarabacoa
F. Anolis marmoratus ocupa um nicho mais restrito que A. cybotes
G. Anolis cybotes é mais voraz que A. marmoratus

Questão 05. Assinale a alternativa correta com base no gráfico abaixo:
A. A chance de sobrevivência de uma animal que nasce com 5 kg em uma população de 150
indivíduos é maior do que a chance de sobrevivência de um animal que nasce com 8 kg em uma
população de 70 indivíduos.
B. A probabilidade de sobrevivência no inverno é diretamente proporcional ao tamanho populacional
e inversamente proporcional ao peso do animal ao nascer.
C. Indivíduos que nascem maiores tem menor chance de sobreviver no inverno.
D. A probabilidade de sobrevivência no inverno é maior do que no verão.
E. Quanto maior o tamanho da população, menor o peso ao nascer.
F. A probabilidade de sobrevivência no inverno de quem nasce com 4 kg em uma população de 150
indivíduos é a mesma de quem nasce com 5,5 kg em uma população de 170 indivíduos.
G. O tamanho populacional depende do peso no inverno.
Questão 06. Escolha a alternativa falsa com base nos gráficos abaixo.
Richness of forest birds on an island through time according to diet (C) and (D) foraging preference.
A. A eliminação das espécies terrestres levou à extinção dos predadores.
B. Frugívoros e insetívoros não sofreram com as primeiras ocupações humanas.
C. Espécies frugívoras e terrestres foram as mais impactadas.
D. A riqueza diminuiu com o tempo em todos os grupos, exceto nas espécies aéreas.
E. Espécies da copa e do sub-bosque apresentaram tendências quase idênticas ao longo do tempo.
F. Onívoros foram os que apresentaram menor flutuação na riqueza durante todo o período.
G. Frugívoros foram beneficiados com a introdução recente de árvores frutíferas.

Questão 07. Escolha a alternativa correta com base no gráfico abaixo.
Occupancy of suitable habitat by the silver-studded blue butterfly (Plebejus argus) in North Wales in
1990. Filled circle = occupied patch; open circle = unoccupied patch.
A. A distância da fonte aumenta na medida em que a área aumenta.
B. A área é inversamente proporcional à distância percorrida pelas borboletas.
C. As borboletas ocupam fragmentos de mais de 0,1 ha, desde que eles estejam a pelo menos 1 km
de distância da fonte.
D. O habitat ideal para as borboletas tem menos de 1 ha e está entre 0,1 e 1 km de distância da fonte.
E. A distância da fonte é mais importante do que a área para a ocupação das borboletas.
F. Borboletas ocupadas percorrem distâncias menores se estiverem em círculos abertos.
G. As borboletas ocupam fragmentos de mais de 0,1 ha, desde que com menos 1 km de distância da
fonte.
Questão 08. Com base na figura, indique qual das alternativas abaixo está incorreta.
A comparison of phylogenetic and phenetic (character-based) concepts.
A. A fenética estabele a relação de organismos baseado em similaridades não fazendo distinção entre
plesiomorfias e apomorfias.
B. Os agrupamentos fenéticos 1+2+3 e 4+5 não seriam recuperados no método filogenético.
C. O caráter 1 apresenta uma resolução maior que o caráter 2 na distinção de grupos fenéticos.

D. Os agrupamentos filogenéticos e fenéticos são distintos.
E. A figura deixa claro que a similaridade dos caracteres não reflete a filogenia.
F. A espécie 3 é mais parecida com a espécie 2, mas é filogeneticamente mais próxima da espécie 4.
G. A espécie 6 compartilha ancestral comum mais recente com a espécie 1 do que com a espécie 4.
Questão 09. Observe o esquema abaixo do famoso experimento de Dodd com populações de
Drosophila pseudoobscura, criadas isoladas por várias gerações em meios com amido (amarelo) ou
maltose (marrom) e marque a alternativa correta:
A. O isolamento reprodutivo das populações levou ao isolamento geográfico entre as espécies.
B. O meio selecionou positivamente os animais homozigotos para a coloração.
C. O meio provocou mutação, aparecendo formas variantes na população com o passar do tempo e
consequentemente o início de uma especiação parapátrica.
D. Estamos observando o início de uma especiação simpátrica.
E. No final do experimento, moscas criadas no amido preferem cruzar com moscas criadas na
maltose e vice-versa.
F. Após longo tempo isoladas, ocorreu isolamento reprodutivo entre as populações do amido e da
maltose.
G. Após muitas gerações, as moscas não conseguem diferenciar parceiros criados no mesmo meio ou
em um meio diferente.
[continua...]

Questão 10. Qual alternativa melhor explica a figura abaixo?
A. Quanto menor o táxon, maior o fluxo gênico
B. Táxons com menos fluxo gênico especiam em ilhas menores
C. Quanto maior a ilha, maiores os indivíduos
D. Quanto maior o fluxo gênico, maior a especiação
E. O tamanho da ilha não influencia na taxa de fluxo gênico
F. Animais apresentam mais especiação e fluxo gênico do que plantas
G. Especiação nas aves ocorre em ilhas menores do que o esperado dado seu fluxo gênico.
* * *
No. de Inscrição: _____________________
Questão: 01 02 03 04 05 06 07 08 09 10
Resposta:

Gerardo Ceballosa,1, Paul R. Ehrlichb,1, and Rodolfo Dirzob
aInstituto de Ecología, Universidad Nacional Autónoma de México, Mexico City 04510, Mexico; and bDepartment of Biology, Stanford University, Stanford,CA 94305
Contributed by Paul R. Ehrlich, May 23, 2017 (sent for review March 28, 2017; reviewed by Thomas E. Lovejoy and Peter H. Raven)
quantitative viewpoint, that Earth’s sixth mass extinction is moresevere than perceived when looking exclusively at species extinc-tions. Therefore, humanity needs to address anthropogenic popula-tion extirpation and decimation immediately. That conclusion isbased on analyses of the numbers and degrees of range contraction(indicative of population shrinkage and/or population extinctionsaccording to the International Union for Conservation of Nature)using a sample of 27,600 vertebrate species, and on a more detailedanalysis documenting the population extinctions between 1900 and2015 in 177mammal species. We find that the rate of population lossin terrestrial vertebrates is extremely high—even in “species of lowconcern.” In our sample, comprising nearly half of known vertebratespecies, 32% (8,851/27,600) are decreasing; that is, they have de-creased in population size and range. In the 177 mammals for whichwe have detailed data, all have lost 30% or more of their geographicranges and more than 40% of the species have experienced severepopulation declines (>80% range shrinkage). Our data indicate thatbeyond global species extinctions Earth is experiencing a huge epi-sode of population declines and extirpations, which will have nega-tive cascading consequences on ecosystem functioning and servicesvital to sustaining civilization. We describe this as a “biological an-nihilation” to highlight the current magnitude of Earth’s ongoingsixth major extinction event.
sixth mass extinction | population declines | population extinctions |conservation | ecosystem service
The loss of biological diversity is one of the most severe human-caused global environmental problems. Hundreds of species
and myriad populations are being driven to extinction every year(1–8). From the perspective of geological time, Earth’s richest biotaever is already well into a sixth mass extinction episode (9–14).Mass extinction episodes detected in the fossil record have beenmeasured in terms of rates of global extinctions of species or highertaxa (e.g., ref. 9). For example, conservatively almost 200 species ofvertebrates have gone extinct in the last 100 y. These represent theloss of about 2 species per year. Few realize, however, that ifsubjected to the estimated “background” or “normal” extinctionrate prevailing in the last 2 million years, the 200 vertebrate specieslosses would have taken not a century, but up to 10,000 y to dis-appear, depending on the animal group analyzed (11). Consideringthe marine realm, specifically, only 15 animal species have beenrecorded as globally extinct (15), likely an underestimate, given thedifficulty of accurately recording marine extinctions. Regardingglobal extinction of invertebrates, available information is limitedand largely focused on threat level. For example, it is estimatedthat 42% of 3,623 terrestrial invertebrate species, and 25% of1,306 species of marine invertebrates assessed on the InternationalUnion for Conservation of Nature (IUCN) Red List are classifiedas threatened with extinction (16). However, from the perspectiveof a human lifetime it is difficult to appreciate the current mag-nitude of species extinctions. A rate of two vertebrate species ex-tinctions per year does not generate enough public concern,
especially because many of those species were obscure and hadlimited ranges, such as the Catarina pupfish (Megupsilon aporus,extinct in 2014), a tiny fish from Mexico, or the Christmas Islandpipistrelle (Pipistrellus murrayi, extinct in 2009), a bat that van-ished from its namesake volcanic remnant.Species extinctions are obviously very important in the long run,
because such losses are irreversible and may have profound effectsranging from the depletion of Earth’s inspirational and estheticresources to deterioration of ecosystem function and services (e.g.,refs. 17–20). The strong focus among scientists on species extinc-tions, however, conveys a common impression that Earth’s biota isnot dramatically threatened, or is just slowly entering an episode ofmajor biodiversity loss that need not generate deep concern now(e.g., ref. 21, but see also refs. 9, 11, 22). Thus, there might besufficient time to address the decay of biodiversity later, or todevelop technologies for “deextinction”—the possibility of thelatter being an especially dangerous misimpression (see ref. 23).Specifically, this approach has led to the neglect of two criticalaspects of the present extinction episode: (i) the disappearance ofpopulations, which essentially always precedes species extinctions,and (ii) the rapid decrease in numbers of individuals within someof the remaining populations. A detailed analysis of the loss ofindividuals and populations makes the problem much clearer andmore worrisome, and highlights a whole set of parameters that areincreasingly critical in considering the Anthropocene’s biologicalextinction crisis.
Significance
The strong focus on species extinctions, a critical aspect of thecontemporary pulse of biological extinction, leads to a commonmisimpression that Earth’s biota is not immediately threatened,just slowly entering an episode of major biodiversity loss. Thisview overlooks the current trends of population declines andextinctions. Using a sample of 27,600 terrestrial vertebrate spe-cies, and a more detailed analysis of 177 mammal species, weshow the extremely high degree of population decay in verte-brates, even in common “species of low concern.” Dwindlingpopulation sizes and range shrinkages amount to a massiveanthropogenic erosion of biodiversity and of the ecosystemservices essential to civilization. This “biological annihilation”underlines the seriousness for humanity of Earth’s ongoing sixthmass extinction event.
Author contributions: G.C., P.R.E., and R.D. designed research; G.C. and P.R.E. performedresearch; G.C., P.R.E., and R.D. contributed new reagents/analytic tools; G.C. analyzeddata; and G.C., P.R.E., and R.D. wrote the paper.
Reviewers: T.E.L., George Mason University; and P.H.R., Missouri Botanical Garden.
The authors declare no conflict of interest.
Freely available online through the PNAS open access option.1To whom correspondence may be addressed. Email: [email protected] [email protected].
This article contains supporting information online at www.pnas.org/lookup/suppl/doi:10.1073/pnas.1704949114/-/DCSupplemental.
www.pnas.org/cgi/doi/10.1073/pnas.1704949114 PNAS Early Edition | 1 of 8
ECOLO
GY
PNASPL
US
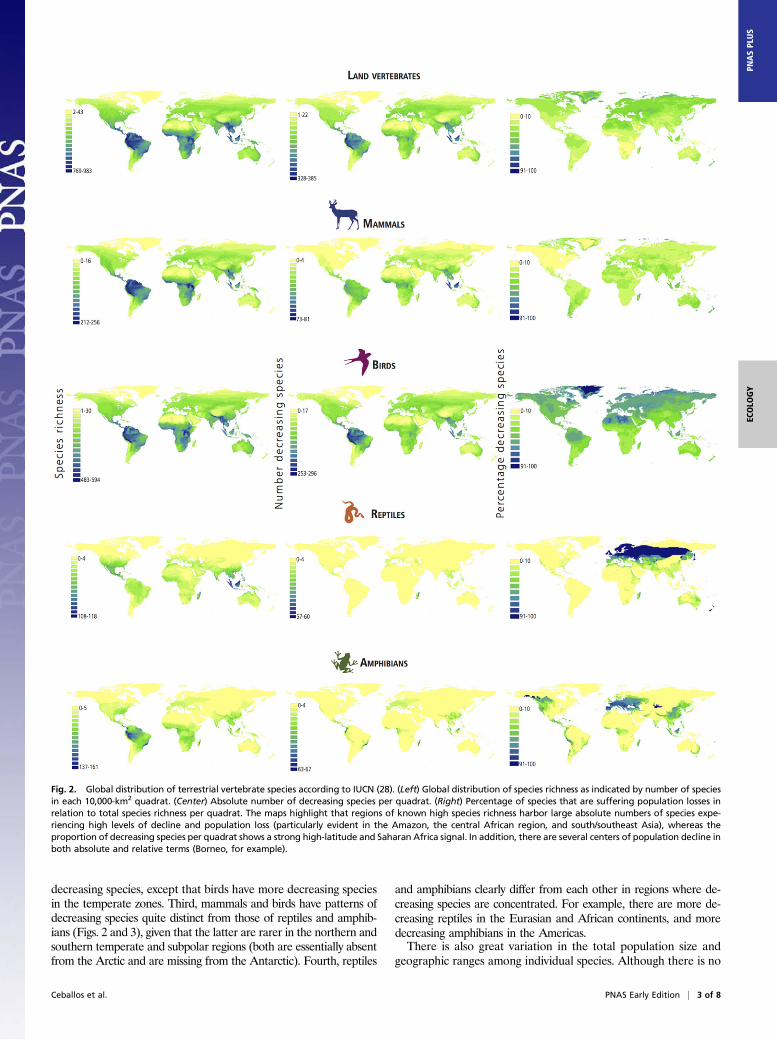
In the last few decades, habitat loss, overexploitation, invasiveorganisms, pollution, toxification, and more recently climate disrup-tion, as well as the interactions among these factors, have led to thecatastrophic declines in both the numbers and sizes of populations ofboth common and rare vertebrate species (24–28). For example,several species of mammals that were relatively safe one or twodecades ago are now endangered. In 2016, there were only7,000 cheetahs in existence (29) and less than 5,000 Borneo andSumatran orangutans (Pongo pygmaeus and P. abelli, respectively)(28). Populations of African lion (Panthera leo) dropped 43% since1993 (30), pangolin (Manis spp.) populations have been decimated(31), and populations of giraffes dropped from around 115,000 indi-viduals thought to be conspecific in 1985, to around 97,000 repre-senting what is now recognized to be four species (Giraffa giraffa, G.tippelskirchi, G. reticulata, and G. camelopardalis) in 2015 (32).An important antecedent to our work (25) used the number of
genetic populations per unit area and then estimated potential losson the basis of deforestation estimates and the species–area re-lationship (SAR). Given the recognized limitations of the use ofSAR to estimate extinctions, our work provides an approach basedon reduction of species range as a proxy of population extirpation.The most recent Living Planet Index (LPI) has estimated thatwildlife abundance on the planet decreased by as much as 58%between 1970 and 2012 (4). The present study is different from LPIand other related publications in several ways, including that herewe use all decreasing species of vertebrates according to IUCN,mapping and comparing absolute and relative numbers of species,and focusing on population losses. Previous estimates seem vali-dated by the data we present here on the loss of local populationsand the severe decrease in the population size of many others (seealso refs. 3, 4, 6–8, 26). Here we examine the magnitude of losses ofpopulations of land vertebrate species on a global system of 10,000-km2
quadrats (Methods). Species vary from common to rare, so thatour analysis, which includes all land vertebrate species (am-phibians, birds, reptiles, and mammals) deemed as “decreasing” byIUCN, provides a better estimate of population losses than usingexclusively IUCN data on species at risk. Obviously, common spe-cies decreasing are not ordinarily classified as species at risk. IUCNcriteria provide quantitative thresholds for population size, trend,and range size, to determine decreasing species (28, 33). We alsoevaluate shrinking ranges and population declines for 177 speciesof mammals for which data are available on geographic rangeshrinkage from ∼1900 to 2015. We specifically focus on local ex-tinctions by addressing the following questions: (i) What are thenumbers and geographic distributions of decreasing terrestrial ver-tebrate species (i.e., experiencing population losses)? (ii) What arethe vertebrate groups and geographic regions that have the highestnumbers and proportions of decreasing species? (iii) What is thescale of local population declines in mammals—a proxy for othervertebrates? By addressing these questions, we conclude that an-thropogenic population extinctions amount to a massive erosion ofthe greatest biological diversity in the history of Earth and thatpopulation losses and declines are especially important, because it ispopulations of organisms that primarily supply the ecosystem ser-vices so critical to humanity at local and regional levels.
ResultsPatterns of Variation in Population Loss Among Vertebrates. Consid-ering all land vertebrates, our spatially explicit analyses indicate amassive pulse of population losses, with a global epidemic ofspecies declines. Those analyses support the view that the decay ofvertebrate animal life is widespread geographically, crosses phy-logenetic lineages, and involves species ranging in abundance fromcommon to rare (Figs. 1–4). The losses, however, are not uniform:some regions exhibit higher concentrations of species with localpopulation extinctions than others, including a strong latitudinalsignal corresponding to an intertropical peak (i.e., roughly betweenthe Tropics of Cancer and Capricorn) of number of decreasing
species, particularly strong in mammals and birds, which largelydrive the overall land vertebrate pattern (Fig. 3, Center). Notably,some parts of the planet harbor low absolute numbers of verte-brate species undergoing decline (Figs. 2 and 3), such as thoseareas of low species richness located in hypercold (northernmostlocations, particularly of the Western Hemisphere) and hyperarid(Saharan Africa and Central Asia) regions. However, it is in-structive to examine their corresponding proportional numbers, anaspect we discuss in detail in another section below.The number of decreasing species of all land vertebrates in each
of the 10,000-km2 quadrats over Earth’s land surface ranges from afew to more than 365 (Fig. 2). As expected, large concentrations ofdecreasing vertebrate species occur in species-rich areas of moisttropical forests adjacent to mountainous regions, such as theAndes–Amazon region, the Congo basin-adjacent eastern Africanhighlands, and the Himalayas–south Asian jungle belt. The dis-tribution of the number of decreasing species considering verte-brate classes separately reveals notable differences. First, themaximum number of decreasing species in a 10,000-km2 quadratvaries from a high value of 296 decreasing birds per quadrat, to alow maximum of 60 decreasing reptiles in a quadrat. Second,mammals and birds have relatively similar distribution patterns of
Fig. 1. Decreasing land vertebrates, as exemplified with these four species,include taxa with different conservation status (e.g., low concern, criticallyendangered), current geographic range (e.g., large, very restricted), andabundance (e.g., common, rare). The data on conservation status, currentgeographic range, and abundance are from IUCN (28). Barn swallow imagecourtesy of Daniel Garza Galindo (photographer).
2 of 8 | www.pnas.org/cgi/doi/10.1073/pnas.1704949114 Ceballos et al.
decreasing species, except that birds have more decreasing speciesin the temperate zones. Third, mammals and birds have patterns ofdecreasing species quite distinct from those of reptiles and amphib-ians (Figs. 2 and 3), given that the latter are rarer in the northern andsouthern temperate and subpolar regions (both are essentially absentfrom the Arctic and are missing from the Antarctic). Fourth, reptiles
and amphibians clearly differ from each other in regions where de-creasing species are concentrated. For example, there are more de-creasing reptiles in the Eurasian and African continents, and moredecreasing amphibians in the Americas.There is also great variation in the total population size and
geographic ranges among individual species. Although there is no
Fig. 2. Global distribution of terrestrial vertebrate species according to IUCN (28). (Left) Global distribution of species richness as indicated by number of speciesin each 10,000-km2 quadrat. (Center) Absolute number of decreasing species per quadrat. (Right) Percentage of species that are suffering population losses inrelation to total species richness per quadrat. The maps highlight that regions of known high species richness harbor large absolute numbers of species expe-riencing high levels of decline and population loss (particularly evident in the Amazon, the central African region, and south/southeast Asia), whereas theproportion of decreasing species per quadrat shows a strong high-latitude and Saharan Africa signal. In addition, there are several centers of population decline inboth absolute and relative terms (Borneo, for example).
Ceballos et al. PNAS Early Edition | 3 of 8
ECOLO
GY
PNASPL
US
accurate information on population size for most taxa, whatever isavailable indicates that the total population size in species with
decreasing populations varies from fewer than 100 individuals incritically endangered species such as the Hainan black-crested
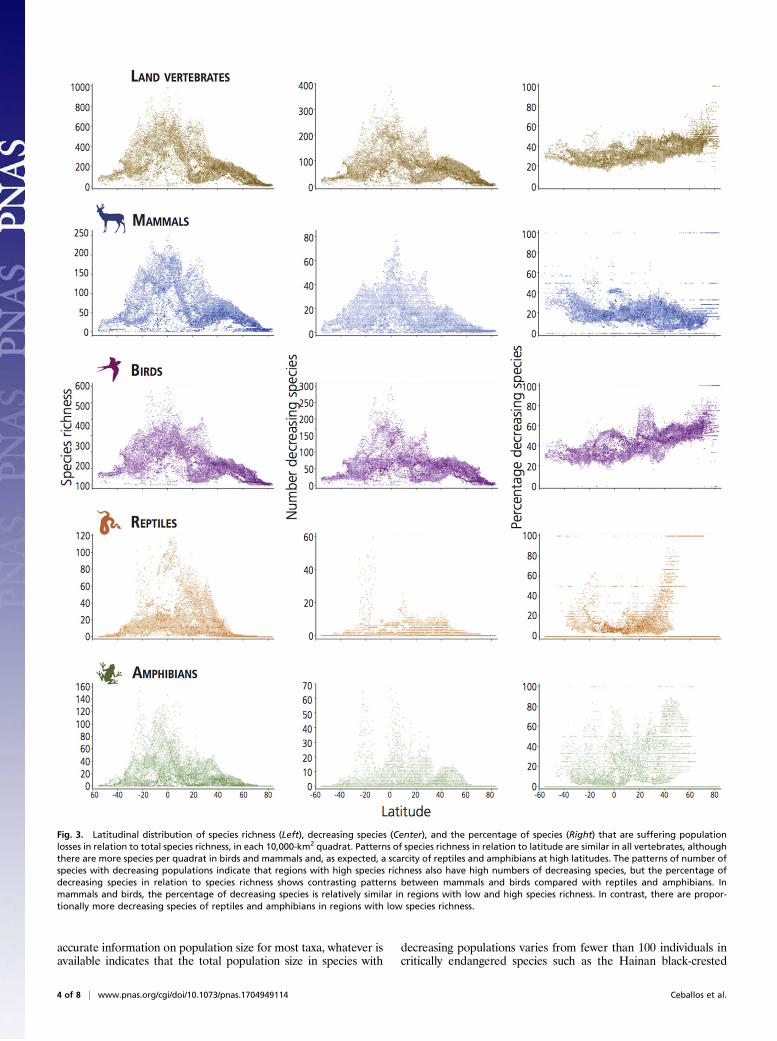
Fig. 3. Latitudinal distribution of species richness (Left), decreasing species (Center), and the percentage of species (Right) that are suffering populationlosses in relation to total species richness, in each 10,000-km2 quadrat. Patterns of species richness in relation to latitude are similar in all vertebrates, althoughthere are more species per quadrat in birds and mammals and, as expected, a scarcity of reptiles and amphibians at high latitudes. The patterns of number ofspecies with decreasing populations indicate that regions with high species richness also have high numbers of decreasing species, but the percentage ofdecreasing species in relation to species richness shows contrasting patterns between mammals and birds compared with reptiles and amphibians. Inmammals and birds, the percentage of decreasing species is relatively similar in regions with low and high species richness. In contrast, there are propor-tionally more decreasing species of reptiles and amphibians in regions with low species richness.
4 of 8 | www.pnas.org/cgi/doi/10.1073/pnas.1704949114 Ceballos et al.

gibbon (Nomascus hainanus), to many millions of individuals indecreasing common species such as the barn swallow (Hirundorustica). Similarly, the smallest ranges (i.e., <1 km2) are seen inspecies such as the Carrizal seedeater (Amaurospiza carrizalensis)from Venezuela and Herrera’s false coral snake (Lampropeltisherrerae) from Mexico, both denizens of tiny islands. The largestranges are hundreds of thousands of square kilometers, as inthe bush dog (Speothos venaticus) from South America and thecommon lizard (Zootoca vivipara) from Eurasia. The sum ofthe 10,000-km2 quadrats representing the current ranges of the8,851 decreasing vertebrate species is 1,350,876 quadrats. A highlyconservative estimate would indicate a similar number of localpopulations facing extinction. This is, of course, a very rough es-timate of the total number of populations, as the number ofpopulations of a decreasing species in each quadrat largely de-pends, aside from suitable habitat distribution within the quadrat,on animal body mass and trophic position (e.g., ref. 34). The as-sumption of one population per 10,000 km2 might seem very con-servative, as this area could accommodate many populations ofsmall animals (e.g., 0.1-kg rodents), most of which could have beenextirpated. However, 10,000 km2 may not be sufficient for, or canbarely accommodate a viable population of large carnivores (say a330-kg Siberian tiger; ref. 34). Nonetheless, our results provideevidence of the extremely large numbers of vertebrate populationsfacing extinction, compared with the number of species.
Proportion of Vertebrate Species Decreasing. The proportion ofdecreasing vertebrates shows that there are areas across the planetwith high concentrations of decreasing species in all vertebratesand regions with high proportions of decreasing species of a par-ticular group (Figs. 2, 3, and 5). For example, in mammals, thehighest percentage of decreasing species is concentrated in tropicalregions, mostly in the Neotropics and Southeast Asia, whereas inreptiles, the proportional decline concentrates almost exclusively inMadagascar. Decreasing amphibians are prominent in Mexico,Central America, the northern Andes, and Brazil’s Atlantic forestin the Americas; West Africa and Madagascar in Africa; and Indiaand Southeast Asia, including Indonesia and Philippines in Asia–Southeast Asia. Finally, decreasing species of birds are found overlarge regions of all continents (Fig. 2).
Roughly a third (8,851/27,600) of all land vertebrate speciesexamined are experiencing declines and local population losses ofa considerable magnitude (Figs. 2–4). Such proportion of de-creasing species varies, depending on the taxonomic group, from30% or more in the case of mammals, birds, and reptiles, to 15%in the case of amphibians. Furthermore, of the decreasing species,many are now considered endangered (Fig. 4). Beyond that,roughly 30% of all decreasing species are still sufficiently commonthat they are considered of “low concern” by IUCN, rather than“endangered.” That so many common species are decreasing is astrong sign of the seriousness of the overall contemporary bi-ological extinction episode.In our 10,000-km2 quadrats, the proportion of decreasing
species ranges from less than 10% to more than 50% (Fig. 2). Thegeographic distributions of absolute (i.e., number) and relative(i.e., percentage) of decreasing species is contrasting. Whereastropical regions have larger numbers of decreasing species, asexpected, given their higher species richness, their correspondingproportions are relatively low. In contrast, temperate regions tendto have similar or higher proportions of decreasing species, a trenddramatically prominent in the case of reptiles.
Local Population Extinctions in Mammals. Our most detailed dataallow comparison of historic and present geographic range of asample of 177 mammal species (Figs. 5 and 6). Most of the177 mammal species we sampled have lost more than 40% of theirgeographic ranges in historic times, and almost half have lost morethan 80% of their ranges in the period ∼1900–2015. At the con-tinental and subcontinental level, some patterns become evident(Fig. 5). The predominant category of range contraction is ≥80%in Africa (56% of the sampled mammal species), Asia (75% of thespecies), Australia (60% of the species), and Europe (40% of thespecies). In the Americas, range contractions are less marked butstill considerable: 22% of the species in North America and 17%of the species in South America have experienced range contrac-tions of at least 80%. Nevertheless, 50% of the species in NorthAmerica and 28% of the species in South America have experi-enced a range contraction of 41% or more.The comparison of the 1900–2015 geographic ranges showed
that the 177 species of mammals have disappeared from 58,000grid cells. On the assumption that on average each of the 10,000-km2
occupied quadrats held a single population of the species foundwithin it, this implies that roughly 58,000 populations of the177 mammals we examined have gone extinct. Consider thefollowing emblematic cases: The lion (Panthera leo) was historicallydistributed over most of Africa, southern Europe, and the Middle
Fig. 4. The percentage of decreasing species classified by IUCN as “endangered”(including “critically endangered,” “endangered,” “vulnerable,” and “near-threatened”) or “low concern” (including “low concern” and “data-deficient”)in terrestrial vertebrates. This figure emphasizes that even species that have notyet been classified as endangered (roughly 30% in the case of all vertebrates)are declining. This situation is exacerbated in the case of birds, for which closeto 55% of the decreasing species are still classified as “low concern.”
Fig. 5. The percentage of species of land mammals from five major conti-nents/subcontinents and the entire globe undergoing different degrees (inpercentage) of decline in the period ∼1900–2015. Considering the sampledspecies globally, 56% of them have lost more than 60% of their range, apattern that is generally consistent in Africa, Asia, Australia, and Europe,whereas in South America and North America, 35–40% of the species haveexperienced range contractions of only 20% or less. (See text for details.)
Ceballos et al. PNAS Early Edition | 5 of 8
ECOLO
GY
PNASPL
US

East, all the way to northwestern India (SI Appendix, Fig. S1). It isnow confined to scattered populations in sub-Saharan Africa and aremnant population in the Gir forest of India. The vast majority oflion populations are gone. In its African stronghold, it historicallyoccupied roughly two thousand 10,000-km2 cells, and now it is re-duced to some 600 cells. Other species, such as the mountain lion(Puma concolor), are known to be doing better. The mountain lionhas lost some of its local populations in North America, but has notsuffered such disastrous losses as its Old World relative, adaptingrelatively well to human-dominated landscapes, and it is still foundacross 85% of its historic range.Clearly, the extinction of mammal populations, although varying
from species to species, has been a global phenomenon (Fig. 6).Strikingly, the predominant color code in the mammalian map isthat of 70% or more of population losses, with the exception ofsome areas of South America and high latitudes of North America.Particularly hard hit have been the mammals of south and south-east Asia, where all of the large-bodied species of mammals ana-lyzed have lost more than 80% of their geographic ranges. TheCape and Sahara regions in Africa, central Australia, the easternUnited States, and the Atlantic forest in South America have alsosuffered severely from population extinctions.
DiscussionIt has recently been shown, using conservative estimates of currentand background species extinction rates, that Earth is now in aperiod of mass global species extinction for vertebrate animals(11). But the true extent of this mass extinction has been under-estimated, because of the emphasis on species extinction. Thisunderestimate largely traces to overlooking the accelerating ex-tinction of populations. Whereas scientists have known for a longtime that several relatively well-studied species have undergonemajor contraction of their ranges, experienced considerable pop-ulation decreases, and suffered many population extinctions, theglobal extent of population shrinkage and extirpation has pre-viously not been recognized and quantified.In addition, some studies document that invertebrates and plants
are suffering massive losses of populations and species (35–38).Here we extend investigation of mass extinction to terrestrial ver-tebrate population decreases and losses, and give estimates of thenumber of their species with decreasing populations. The accuracyof the estimates is strongly dependent on an unknown parameter,namely, the actual average area occupied by a vertebrate pop-ulation (e.g., refs. 35, 39–41). However, even if a population would,on average, occupy an area five times larger than what we haveused here (i.e., 50,000 km2) there would still be hundreds ofthousands of populations that have suffered extinction in the pastfew centuries. On the other hand, most vertebrates (∼70%) aresmall species of mammals, birds, reptiles, and amphibians. If, onaverage, they have one population every 10 km2 then vertebrateswould have suffered more than a billion population extinctions.Our results show that population extinction in land vertebrates
is geographically omnipresent, but with notable prominence intropical, species-rich regions. It is interesting, however, thatwhen population extinctions are evaluated as the percentage oftotal species richness, temperate regions, with their typical lowspecies diversity, show higher proportions of population loss.There are some illustrative qualitative examples of population
decreases and their consequences within terrestrial and marinevertebrates, but ours is an attempt at a quantitative evaluation ofglobal trends in population extinctions. Recent reviews indicate thatspecies extinctions, population decreases, and range contraction(implying population extinctions) among terrestrial invertebratesand plants are as severe as among vertebrates (e.g., refs. 35–38). Forexample, long-term monitoring of insect populations in the UnitedKingdom shows that 30–60% of species per taxonomic order havecontracting ranges (36). The situation in plants has been lessevaluated; thus it is difficult to compare them with animals, butthere is little reason to believe that the extinction situation in plantsis dramatically different (37). Furthermore, research shows that theloss of animal populations indirectly leads to changes in plantcommunities (20, 37, 39), frequently causing the reduction of localspecies richness and dominance of a few plant taxa that either ex-perience “ecological release” in response to decreasing herbivorepressures (42, 43), and/or experience population reductions due tothe decline of animals responsible for pollination or dispersal (e.g.,refs. 2−3, 20). The status of biodiversity among microorganisms istoo poorly known to permit us to make any comparison and gen-eralizations about the current pulse of extinctions, although somerecent research has unraveled feedbacks between local large her-bivore defaunation and mycorrhizal richness (44, 45). Given whatwe know about genetic population differentiation, it is expectedthat the range contractions and declines we document here imply aconsiderable loss of intraspecific genetic diversity (23) but this is,clearly, an aspect that warrants further investigation.In sum, by losing populations (and species) of vertebrates, we are
losing intricate ecological networks involving animals, plants, andmicroorganisms (e.g., refs. 2, 8, 18, 45, 46). We are also losing poolsof genetic information that may prove vital to species’ evolutionaryadjustment and survival in a rapidly changing global environment.
Fig. 6. Percentage of local population extinction in 177 species of mammalsin 1° × 1° quadrats, as an indication of the severity of the mass extinctioncrises. The maps were generated by comparing historic and current geo-graphic ranges (49) (SI Appendix, SI Methods). Note that large regions in allcontinents have lost 50% or more of the populations of the evaluatedmammals. Because of the small sample size, biased to large mammal species,this figure can only be used to visualize likely trends in population losses.
6 of 8 | www.pnas.org/cgi/doi/10.1073/pnas.1704949114 Ceballos et al.

This suggests that, even if there was not ample sign that the crisisextends far beyond that group of animals, today’s planetarydefaunation of vertebrates will itself promote cascading cata-strophic effects on ecosystems, worsening the annihilation of nature(2, 3, 46). Thus, while the biosphere is undergoing mass speciesextinction (11), it is also being ravaged by a much more serious andrapid wave of population declines and extinctions. In combination,these assaults are causing a vast reduction of the fauna and flora ofour planet. The resulting biological annihilation obviously will alsohave serious ecological, economic, and social consequences (46).Humanity will eventually pay a very high price for the decimation ofthe only assemblage of life that we know of in the universe.
ConclusionPopulation extinctions today are orders of magnitude more fre-quent than species extinctions. Population extinctions, however, area prelude to species extinctions, so Earth’s sixth mass extinctionepisode has proceeded further than most assume. The massive lossof populations is already damaging the services ecosystems provideto civilization. When considering this frightening assault on thefoundations of human civilization, one must never forget thatEarth’s capacity to support life, including human life, has beenshaped by life itself (47). When public mention is made of theextinction crisis, it usually focuses on a few animal species (hun-dreds out of millions) known to have gone extinct, and projectingmany more extinctions in the future. But a glance at our mapspresents a much more realistic picture: they suggest that as much as50% of the number of animal individuals that once shared Earthwith us are already gone, as are billions of populations. Further-more, our analysis is conservative, given the increasing trajectoriesof the drivers of extinction and their synergistic effects. Futurelosses easily may amount to a further rapid defaunation of theglobe and comparable losses in the diversity of plants (36), in-cluding the local (and eventually global) defaunation-driven coex-tinction of plants (3, 20). The likelihood of this rapid defaunationlies in the proximate causes of population extinctions: habitatconversion, climate disruption, overexploitation, toxification, spe-cies invasions, disease, and (potentially) large-scale nuclear war—all tied to one another in complex patterns and usually reinforcingeach other’s impacts. Much less frequently mentioned are, however,the ultimate drivers of those immediate causes of biotic destruction,namely, human overpopulation and continued populationgrowth, and overconsumption, especially by the rich. These drivers,all of which trace to the fiction that perpetual growth can occur on afinite planet, are themselves increasing rapidly. Thus, we emphasizethat the sixth mass extinction is already here and the window foreffective action is very short, probably two or three decades at most
(11, 48). All signs point to ever more powerful assaults on bio-diversity in the next two decades, painting a dismal picture of thefuture of life, including human life.
MethodsFor full methods, please see SI Appendix. We determined the number of de-creasing vertebrate species using the IUCN (28) Red List of Threatened Species.In the IUCN, species are classified as decreasing, stable, or increasing (see alsoref. 33). Either range contraction (population extinction) or reduction innumbers in extant populations determines whether a species is decreasing. Weused the IUCNmaps of terrestrial vertebrates (i.e., mammals, birds, reptiles, andamphibians) to create the global maps of number of species (richness) and ofdecreasing species, and percentage of decreasing species in relation to totalspecies richness. The distribution of all of the species was superimposed in a22,000 grid of 10,000-km2 quadrats covering the continental lands. For thegrid, a Lambert azimuthal equal-area projection was used (see ref. 49 for de-tails of the projection methods). In our analyses a critical issue is how gridsquares and populations correspond. This is a very difficult problem that varieswith definitions of species. (In this paper, we stick with the classic biologicaldefinition of species.) The number of populations also varies from species tospecies; for example, a highly phylopatric species would have more populationsper square than a very vagile species, and species with different mating systemswould have different estimates of numbers of Mendelian populations, andthese would not be the same as estimates of number of demographic units(50). For the purposes of understanding the annihilation, these differences arenot critical. For example, if we have lost 90% of the lion’s geographic range,whether this amounts to 10,000 demographic units or 4,000 Mendelian pop-ulations is trivial in the present context. It would be extremely useful if we hadmuch more information on population structure for all vertebrates, but this is amajor, pending agenda.
The population extinction analysis was conducted on 177mammalian speciesoccurring on five continents. Specifically, we analyzed 54 species in Africa, 14 inAsia, 57 in Australia, 15 in Europe, and 35 in America. The historical distributionwas gathered from specialized literature (see details in ref. 26) and the currentdistribution from IUCN (28). Historic and current ranges were digitized asgeographic information system polygons and elaborated in ArcGis 10.1 (51).For each species, we calculated the area of the historical and present distri-bution (in square kilometers) to estimate the percentage of lost area and thepercentage of area where the species are extant. A caveat of these estimatesregards how representative the sample of 177 species is. We recognize a bias inthat the data include a large number of medium- and large-sized species, forwhich the best information is available. However, given that such medium andlarge species are the most seriously threatened by the predominant proxi-mate drivers of defaunation (2, 3), the likely bias against small-sized spe-cies should not affect our overall interpretation of results.
ACKNOWLEDGMENTS. We thank John Harte for very helpful comments onthe manuscript and Noé Torres, Giulia Santulli, and Jesús Pacheco for theirhelp with data analyses. The Universidad Nacional Autónoma de Méxicoand Stanford University supported our work.
1. Ehrlich P-R (1995) The scale of the human enterprise and biodiversity loss. ExtinctionRates, eds Lawton JH, May RM (Oxford Univ Press, Oxford, UK), pp 214–226.
2. Dirzo R, et al. (2014) Defaunation in the Anthropocene. Science 345:401–406.3. Young HS, McCauley DJ, Galleti M, Dirzo R (2016) Patterns, causes, and consequences
of Anthropocene defaunation. Annu Rev Ecol Evol Syst 47:433–458.4. World Wide Fund for Nature (2016) Living Planet Report 2016. Risk and resilience in a
new era. (WWF International, Gland, Switzerland). Available at wwf.panda.org/about_our_earth/all_publications/lpr_2016/. Accessed June 10, 2017.
5. Maxwell SL, Fuller RA, Brooks TM, Watson JEM (2016) Biodiversity: The ravages ofguns, nets and bulldozers. Nature 536:143–145.
6. Laliberte AS, Ripple WJ (2004) Range contractions of North American carnivores andungulates. BioScience 54:123–138.
7. Worm B, Tittensor DP (2011) Range contraction in large pelagic predators. Proc NatlAcad Sci USA 108:11942–11947.
8. Ripple WJ, et al. (2014) Status and ecological effects of the world’s largest carnivores.Science 343:1241484.
9. Barnosky AD, et al. (2011) Has the Earth’s sixth mass extinction already arrived?Nature 471:51–57.
10. Ceballos G, García A, Ehrlich PR (2010) The sixth extinction crisis: Loss of animalpopulations and species. J. Cosmology 8:1821–1831.
11. Ceballos G, et al. (2015) Accelerated modern human-induced species losses: Enteringthe sixth mass extinction. Sci Adv 1:e1400253.
12. Wake DB, Vredenburg VT (2008) Colloquium paper: Are we in the midst of the sixth massextinction? A view from theworld of amphibians. Proc Natl Acad Sci USA 105:11466–11473.
13. McCallum ML (2015) Vertebrate biodiversity losses point to a sixth mass extinction.Biol Conserv 24:2497–2519.
14. Pimm SL, et al. (2014) The biodiversity of species and their rates of extinction, dis-tribution, and protection. Science 344:1246752.
15. McCauley DJ, et al. (2015) Marine defaunation: Animal loss in the global ocean.Science 347:1255641.
16. Collen B, Böhm M, Kemp R, Baillie J (2012) Spineless: Status and Trends of the World’sInvertebrates (Zoological Society of London, London).
17. Daily G (1997) Nature’s Services: Societal Dependence on Natural Ecosystems. (IslandPress, Covello, CA).
18. Naeem S, Duffy JE, Zavaleta E (2012) The functions of biological diversity in an age ofextinction. Science 336:1401–1406.
19. Estes JA, et al. (2011) Trophic downgrading of planet Earth. Science 333:301–306.20. Brosi BJ, Briggs HM (2013) Single pollinator species losses reduce floral fidelity and
plant reproductive function. Proc Natl Acad Sci USA 110:13044–13048.21. Briggs JC (2014) Global biodiversity gain is concurrent with decreasing population
sizes. Biodiver J 5:447–452.22. Hooper DU, et al. (2012) A global synthesis reveals biodiversity loss as a major driver
of ecosystem change. Nature 486:105–108.23. Ehrlich PR (2014) The case against de-extinction: It’s a fascinating but dumb idea.
Yale Environment 360 (Yale University, New Haven, CT). Available at bit.ly/1gAIuJF).Accessed June 10, 2017.
24. Hobbs RJ, Mooney HA (1998) Broadening the extinction debate: Population deletionsand additions in California and Western Australia. Conserv Biol 12:271–283.
Ceballos et al. PNAS Early Edition | 7 of 8
ECOLO
GY
PNASPL
US
25. Hughes JB, Daily GC, Ehrlich PR (1997) Population diversity: Its extent and extinction.
Science 278:689–692.26. Ceballos G, Ehrlich PR (2002) Mammal population losses and the extinction crisis.
Science 296:904–907.27. Gaston KJ, Fuller RA (2008) Commonness, population depletion and conservation
biology. Trends Ecol Evol 23:14–19.28. International Union of Conservation of Nature (2015) The IUCN Red List of Threat-
ened Species, Version 2015.2 (IUCN, 2015). Available at www.iucnredlist.org. Accessed
February 10, 2016. Revised January 10, 2017.29. Durant SM, et al. (2017) The global decline of cheetah Acinonyx jubatus and what it
means for conservation. Proc Natl Acad Sci USA 114:528–533.30. Henschel P, et al. (2014) The lion in West Africa is critically endangered. PLoS One
9:e83500.31. Challender D, et al. (2016) On scaling up pangolin conservation. Traffic Bulletin 28:
19–21.32. Fennessy J, et al. (2016) Multi-locus analyses reveal four giraffe species instead of one.
Curr Biol 26:2543–2549.33. Butchart S, Dunn E (2003) Using the IUCN Red List criteria to assess species with de-
clining populations. Conserv Biol 17:1200–1202.34. Gaston K, Blackburn T (2008) Pattern and Process in Macroecology (Blackwell Pub-
lishing, Hoboken, NJ).35. Thomas JA (2016) ECOLOGY. Butterfly communities under threat. Science 353:216–218.36. Régnier C, et al. (2015) Mass extinction in poorly known taxa. Proc Natl Acad Sci USA
112:7761–7766.37. Burkle LA, Marlin JC, Knight TM (2013) Plant-pollinator interactions over 120 years:
loss of species, co-occurrence, and function. Science 339:1611–1615.38. Ter Steege H, et al. (2015) Estimating the global conservation status of more than
15,000 Amazonian tree species. Sci Adv 1:e1500936.
39. Cardinale BJ, et al. (2012) Biodiversity loss and its impact on humanity. Nature 486:59–67.
40. Hurlbert AH, Jetz W (2007) Species richness, hotspots, and the scale dependence ofrange maps in ecology and conservation. Proc Natl Acad Sci USA 104:13384–13389.
41. Peterson AT, Navarro‐Sigüenza AG, Gordillo A (2016) Assumption- versus data-basedapproaches to summarizing species’ ranges. Conserv Biol, 10.1111/cobi.12801.
42. Martínez-Ramos M, Ortíz-Rodríguez I, Piñero D, Dirzo R, Sarukhán J (2016) Humansdisrupt ecological processes within tropical rainforest reserves. Proc Natl Acad Sci USA113:5323–5328.
43. Camargo-Sanabria AA, Mendoza E, Guevara R, Martínez-Ramos M, Dirzo R (2015)Experimental defaunation of terrestrial mammalian herbivores alters tropical rain-forest understorey diversity. Proc Biol Sci 282:20142580.
44. Petipas RH, Brody AK (2014) Termites and ungulates affect arbuscular mycorrhizalrichness and infectivity in a semiarid savanna. Botany 92:233–240.
45. Wardle DA, et al. (2004) Ecological linkages between aboveground and belowgroundbiota. Science 304:1629–1633.
46. Ceballos G, Ehrlich AH, Ehrlich PR (2015) The Annihilation of Nature: HumanExtinction of Birds and Mammals (Johns Hopkins Univ Press, Baltimore).
47. Knoll AH (2015) Life on a Young Planet: The First Three Billion Years of Evolution onEarth (Princeton Univ Press, Princeton, NJ).
48. Barnosky AD, et al. (2014) Introducing the scientific consensus on maintaininghumanity’s life support systems in the 21st century: Information for policy makers.The Anthropocene Review 1:78–109.
49. Ceballos G, Ehrlich PR, Soberón J, Salazar I, Fay JP (2005) Global mammal conserva-tion: What must we manage? Science 309:603–607.
50. Brown IL, Ehrlich PR (1980) Population biology of the checkerspot butterfly, Euphy-dryas chalcedona structure of the Jasper Ridge colony. Oecologia 47:239–251.
51. Environmental Systems Research Institute (2011) Release 10. Documentation Manual(Environmental Systems Research Institute, Redlands, CA).
8 of 8 | www.pnas.org/cgi/doi/10.1073/pnas.1704949114 Ceballos et al.
Artem Blagodatskia,1, Anton Sergeevb, Mikhail Kryuchkova,c, Yuliya Lopatinad, and Vladimir L. Katanaevc,e,1
aInstitute of Protein Research, Russian Academy of Sciences, 142290 Pushchino, Russian Federation; bInstitute of Mathematical Problems of Biology, RussianAcademy of Sciences, 142290 Pushchino, Russian Federation; cDepartment of Pharmacology and Toxicology, Faculty of Biology and Medicine, University ofLausanne, 1005 Lausanne, Switzerland; dDepartment of Entomology, Faculty of Biology, Lomonosov Moscow State University, 119234 Moscow, RussianFederation; and eSchool of Biomedicine, Far Eastern Federal University, Vladivostok, Russian Federation
Edited by Jeremy Nathans, Johns Hopkins University, Baltimore, MD, and approved July 17, 2015 (received for review March 23, 2015)
Nipple-like nanostructures covering the corneal surfaces of moths,butterflies, and Drosophila have been studied by electron andatomic force microscopy, and their antireflective properties havebeen described. In contrast, corneal nanostructures of the majorityof other insect orders have either been unexamined or examinedby methods that did not allow precise morphological character-ization. Here we provide a comprehensive analysis of cornealsurfaces in 23 insect orders, revealing a rich diversity of insectcorneal nanocoatings. These nanocoatings are categorized intofour major morphological patterns and various transitions be-tween them, many, to our knowledge, never described before.Remarkably, this unexpectedly diverse range of the corneal nano-structures replicates the complete set of Turing patterns, thuslikely being a result of processes similar to those modeled by AlanTuring in his famous reaction−diffusion system. These findingsreveal a beautiful diversity of insect corneal nanostructures andshed light on their molecular origin and evolutionary diversi-fication. They may also be the first-ever biological example ofTuring nanopatterns.
nanocoating | cornea | insects | nanostructures | Turing
Biological patterning at the microscale and macroscale levelshas been under intensive investigation by developmental
biology, and its fundamental principles, such as the concept ofthe morphogens, have become textbook knowledge (1). In con-trast, nanoscale biological patterning is not well studied andunderstood. Among the rare known examples of biologicalnanopatterns are the 3D nanostructures covering insect cor-neal surfaces (2). They were described in moths and butter-flies and later some Dipterans as pseudoregularly spacednipple-type protrusions, up to 200 nm in height and width (3–7).These nanostructures may carry antireflective, dirt-removing/self-cleaning, and hydrophobic/antiwetting functions (2, 8–12).Later, some other insects were found to possess a very differenttype of corneal nanocoating, such as the antireflective maze-like30-nm-high evaginations covering corneae of the overwater eyesof Gyrinidae beetles (13). An attempt to analyze the variety ofcorneal nanocoatings throughout the insect class was made in theclassical study by Bernhard et al. (5). However, the scanningelectron microscopy technique of that time was mostly per-formed on platinum replicas of the insect samples and wascompromised by the partial collapse of the nanoprotrusions. Itpermitted reliable identification of 50- to 250-nm-high nipple-type protrusions in Lepidoptera, some Dipterans, Trichopterans,and, interestingly, the primitive Thysanuras, but not identifica-tion of other types of corneal nanocoatings (5).To use the corneal nanocoatings as the model to study
nanoscale biological patterning, a comprehensive investigationacross insect lineages using modern techniques must be per-formed. We recently applied atomic force microscopy (AFM),providing nanometer and subnanometer resolution of undam-aged biological material, to investigate different types of cornealnanostructures of some Dipteran and Coleopteran insects (6, 13).
Here we expand this analysis to 23 insect orders and some non-insect arthropods, describing a striking richness and beautyof the corneal nanocoatings (Fig. 1, Figs. S1–S3, Table S1, andDetailed Description of Diverse Corneal Nanostructures Orderby Order). These nanostructures can be grouped as follows.(i) Nipple-like structures (Fig. 1A and Fig. S1) include the regu-larly packed protrusions of Lepidopterans (Fig. S1A), irregularpackaging in Dipterans (Fig. S1B), and irregular packaging ofirregularly shaped nipple-like protrusions in a range of otherorders: Trichoptera (Fig. 1A), Mecoptera (Fig. S1C), Mega-loptera (Fig. S1D), Hemiptera (Fig. S1 E and F), Psocoptera(Fig. S1G), Thysanura (Fig. S1H), Raphidioptera (Fig. S1I),Neuroptera (Fig. S1J), Orthoptera (Fig. S1K), and Odonata(Fig. S1L). (ii) Maze-like nanocoatings (Fig. 1B and Fig. S2) canbe observed in Coleopterans (Fig. S2 A and B) but also in otherorders such as Trichoptera (Fig. 1B) and Hymenoptera (Fig.S2C), and in some arachnids (Fig. S2 D and E). (iii) Parallelstrands/ridges (Fig. 1C) formed by fusion of nipple-type pro-trusions can mostly be seen in Dipterans (Fig. 1 F and G) and,interestingly, in true spiders (Fig. 1C). (iv) Novel dimple-typenanocoating (Fig. 1D and Fig. S3) can be seen in different or-ders: Siphonaptera (Fig. S3A), Coleoptera (Fig. S3B), Hyme-noptera (Fig. S3C), Hemiptera (Fig. S3 D and E), Blattodea(Fig. S3F), and Dermaptera (Fig. 1D), and, interestingly, incentipedes (Fig. S3H). We also see various transitions be-tween these major forms: (v) nipples-to-maze transition (e.g., in
Significance
Corneal surfaces of some insects are coated with nipple-likenanostructures reducing the light reflection. Here we providean extensive analysis of corneae across insect groups. Usingatomic force microscopy, we discover a striking diversity ofcorneal nanocoatings, omnipresent in arthropods. These fasci-nating bionanostructures replicate the complete set of theTuring patterns—shapes resulting from the reaction−diffusionmodeling underlying many examples of patterning in bi-ological and physicochemical systems. Our work, verging onthe interface of nanotechnology and zoology, evolution andbiophysics, and ecology and genetics, sheds light on the mo-lecular origin and evolutionary diversification of a beautifuldiversity of insect corneal nanostructures. It also describes, toour knowledge, the first-ever biological example of Turingnanopatterns.
Author contributions: V.L.K. designed research; A.B., A.S., and M.K. performed research;A.S. and Y.L. contributed new reagents/analytic tools; A.B., A.S., M.K., and V.L.K. analyzeddata; and A.B. and V.L.K. wrote the paper.
The authors declare no conflict of interest.
This article is a PNAS Direct Submission.
Freely available online through the PNAS open access option.1To whom correspondence may be addressed. Email: [email protected] [email protected].
This article contains supporting information online at www.pnas.org/lookup/suppl/doi:10.1073/pnas.1505748112/-/DCSupplemental.
10750–10755 | PNAS | August 25, 2015 | vol. 112 | no. 34 www.pnas.org/cgi/doi/10.1073/pnas.1505748112

Plecoptera, Fig. 1E); (vi) maze-to-strands transition (e.g., in Dip-tera, Fig. 1F); (vii) nipples-to-strands transition (e.g., in Diptera,Fig. 1G); and (viii) dimples-to-maze transition (e.g., in Hymenop-tera, Fig. 1H).The rich diversity of these nanostructures and the easiness
with which the corneal nanopatterns merge one into another inclosely related orders and even within the orders (Fig. 2 andDetailed Description of Diverse Corneal Nanostructures Order byOrder) is striking and permits posing questions on the underlyingmolecular, developmental, and evolutionary mechanisms. De-velopmentally, the nipple-type protrusions were proposed tooriginate, during eye development, from secretion by the regu-larly spaced microvilli of the cone cells (5, 14). However, thisidea could appear plausible when the ordered Lepidopterannipple arrays were studied but, with the current diversity ofnanostructures and transitions among them, sometimes withinthe same lens (Fig. 1G), is not satisfactory. Instead, we proposethat certain mechanisms of patterning at the nanoscale are inplace, and the diverse arthropod corneal nanostructures we de-scribe here represent a model to study such nanopatterning.Further, we notice that this diversity of corneal nanostructures isremarkably similar to the complete set of the Turing patterns(Fig. 3).In his seminal paper in 1952, Alan Turing provided a system of
differential equations describing the reaction−diffusion systemof two reacting morphogens—a slowly diffusing activator anda fast diffusing inhibitor—which can model various biologic,chemical, and physical patterns (15, 16). Applicability of thismodel to biological pattern formation has been shown in severalrecent examples, such as formation of colored stripes in zebrafish(17), hair follicle spacing in mice (18), and digit specification inlimbs (19). The insect corneal nanopatterns we describe herediffer from these examples, as they reproduce not just one of themany possible forms produced by the reaction−diffusion modelbut a thorough set of possible variants including the intermediateforms (Figs. 1 and 3). This remarkable completeness of coverageof the possible set of Turing structures by the arthropod corneal
nanopatterns strongly argues in favor of the hypothesis thatthese nanopatterns are indeed a consequence of the Turingreaction−diffusion mechanisms.We hypothesize that the Turing mechanism-based reaction−diffu-
sion processes patterning the nanocoatings are mediated byorganic components of the lens, possessing different diffusionproperties and mutually influencing each other’s abundance/polymerization/aggregation, the outcome of this being the ste-reotypical formation of the nanostructures. In previous applica-tions of the Turing principles to biological processes, patterningat the microscale was modeled (17–19). Formal mathematicalanalysis shows how key parameters of the reaction−diffusionequations (primarily the diffusion coefficients of the two inter-acting morphogens) can result in the appearance of repeateddevelopmental structures with the experimentally observedmicrometer-scale wavelength (20). Our mathematical analysis(Turing modeling of corneal nanopatterns) demonstrates thatnanoscale patterns are expected to form in the reaction−diffu-sion system acting in the colloidal or liquid crystal-type envi-ronment [which is indeed the environment of the lens of the eye(21)] where diffusion properties are reduced (compared with theliquid phase).Although the molecular identity of the morphogens patterning
corneal nanocoatings remains to be revealed, simulations ofthe Turing reaction−diffusion processes provide interestinghints into the potential molecular mechanisms underlyingformation of different types of the nanocoatings and transi-tions among them (Fig. 3I and Fig. S4). Although differentsets of the reaction−diffusion coefficients (like that of TableS2 used to obtain images on Fig. 3 and Fig. S4; see also Fig.S4B for schematic description of the parameters and Fig. S5for analysis of the parameter space) can model differentnanopatterns, simulations find that three of the major types ofpatterns we observe in insect corneae occupy defined regionswithin the parameter space and transit to each other as fol-lows: dimples ↔ maze ↔ nipples (Fig. 3I and Fig. S4A). Thespace in these figures is populated by the incremental changes of
Fig. 1. The diversity of corneal nanostructural patterns among arthropod groups: (A and B) Corneal nanostructures of Trichoptera. Merged as well asundersized nipples in an irregular nipple array of the Phryganeidae family (A) and maze-like nanocoating of the Limnephilidae family (B). (C) Clearlyexpressed parallel strands in a true spider. (D) Dimpled nanopattern of an earwig (Dermaptera). (E) Nipples merging into maze on stonefly (Plecoptera)corneae. (F and G) Merging of individual Dipteran nipples into parallel strands and mazes: full merging of nipples into strands and mazes on the entirecorneal surface in Tabanidae (F); partial merging of nipples in the center of Tipulidae cornea into elongated protrusions and then complete fusion into anarray of parallel strands near the ommatidial edge (G). (H) Merging of individual burrows and dimples into a maze-like structure on bumblebee (Apidae,Hymenoptera) corneae. All image dimensions are 5 × 5 μm, except for H, which is 3 × 3 μm. Surface height in nanometers is indicated by the color scale shownnext to 2D images.
Blagodatski et al. PNAS | August 25, 2015 | vol. 112 | no. 34 | 10751
EVOLU
TION
ENGINEE
RING
two of the reaction−diffusion parameters av and bu describingthe degree of influence of the two diffusing components (acti-vator u and inhibitor v) on each other (Fig. S4B) (16, 22). In-terestingly, transition from the dimple-type nanocoating to themaze-type and then further to the nipples occurs by increasingthe absolute value of either of the two reaction−diffusion pa-rameters (Fig. 3I and Fig. S4A). In this regard, it may be spec-ulated that the initial reaction−diffusion nanopatterningsystem emerged when these parameters just exceeded theborderline, permitting the Turing patterns to appear (16, 22),and thus was likely of the dimple type. In this regard, it isinteresting to note that the dimple pattern is not only seen inmany insect groups but also in centipedes (Fig. S3H), whichare believed to retain more characteristics of the presumedarthropod ancestor than other arthropods with sequencedgenomes (23).
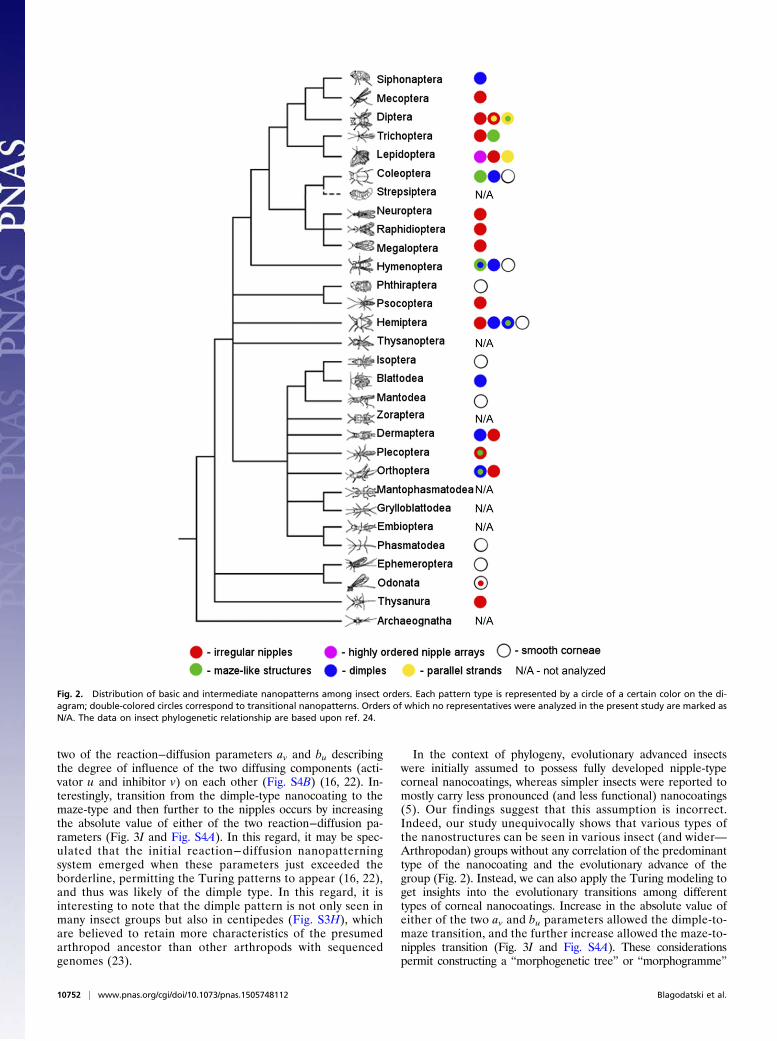
In the context of phylogeny, evolutionary advanced insectswere initially assumed to possess fully developed nipple-typecorneal nanocoatings, whereas simpler insects were reported tomostly carry less pronounced (and less functional) nanocoatings(5). Our findings suggest that this assumption is incorrect.Indeed, our study unequivocally shows that various types ofthe nanostructures can be seen in various insect (and wider—Arthropodan) groups without any correlation of the predominanttype of the nanocoating and the evolutionary advance of thegroup (Fig. 2). Instead, we can also apply the Turing modeling toget insights into the evolutionary transitions among differenttypes of corneal nanocoatings. Increase in the absolute value ofeither of the two av and bu parameters allowed the dimple-to-maze transition, and the further increase allowed the maze-to-nipples transition (Fig. 3I and Fig. S4A). These considerationspermit constructing a “morphogenetic tree” or “morphogramme”
Fig. 2. Distribution of basic and intermediate nanopatterns among insect orders. Each pattern type is represented by a circle of a certain color on the di-agram; double-colored circles correspond to transitional nanopatterns. Orders of which no representatives were analyzed in the present study are marked asN/A. The data on insect phylogenetic relationship are based upon ref. 24.
10752 | www.pnas.org/cgi/doi/10.1073/pnas.1505748112 Blagodatski et al.
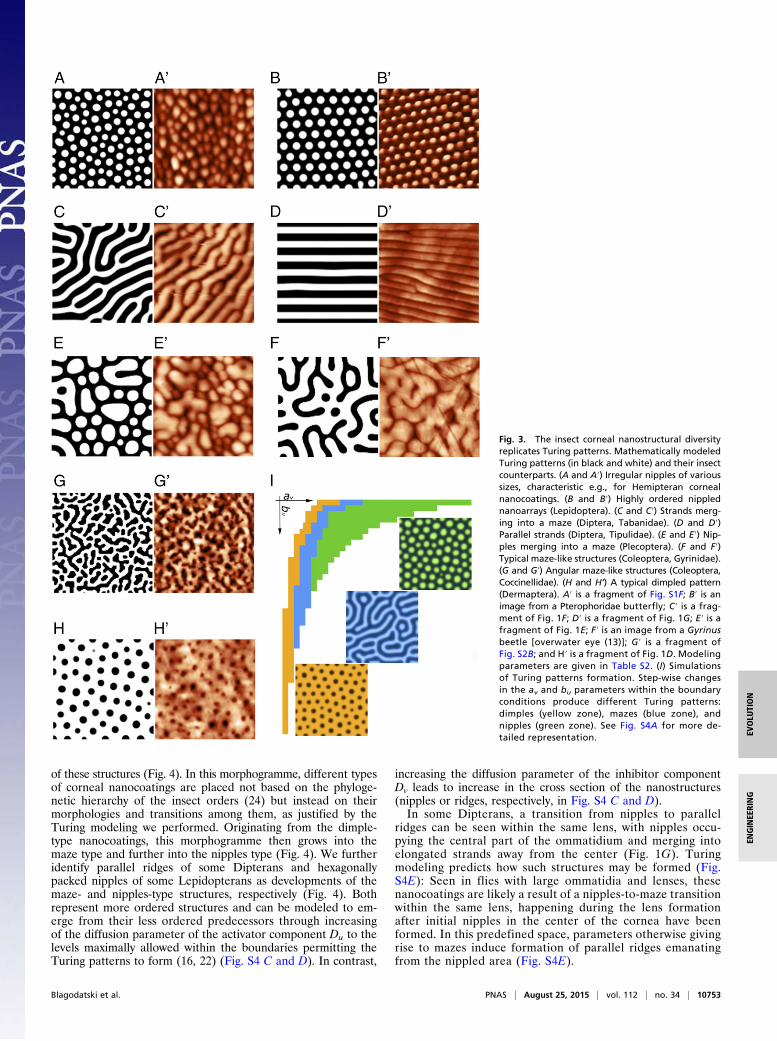
of these structures (Fig. 4). In this morphogramme, different typesof corneal nanocoatings are placed not based on the phyloge-netic hierarchy of the insect orders (24) but instead on theirmorphologies and transitions among them, as justified by theTuring modeling we performed. Originating from the dimple-type nanocoatings, this morphogramme then grows into themaze type and further into the nipples type (Fig. 4). We furtheridentify parallel ridges of some Dipterans and hexagonallypacked nipples of some Lepidopterans as developments of themaze- and nipples-type structures, respectively (Fig. 4). Bothrepresent more ordered structures and can be modeled to em-erge from their less ordered predecessors through increasingof the diffusion parameter of the activator component Du to thelevels maximally allowed within the boundaries permitting theTuring patterns to form (16, 22) (Fig. S4 C and D). In contrast,
increasing the diffusion parameter of the inhibitor componentDv leads to increase in the cross section of the nanostructures(nipples or ridges, respectively, in Fig. S4 C and D).In some Dipterans, a transition from nipples to parallel
ridges can be seen within the same lens, with nipples occu-pying the central part of the ommatidium and merging intoelongated strands away from the center (Fig. 1G). Turingmodeling predicts how such structures may be formed (Fig.S4E): Seen in flies with large ommatidia and lenses, thesenanocoatings are likely a result of a nipples-to-maze transitionwithin the same lens, happening during the lens formationafter initial nipples in the center of the cornea have beenformed. In this predefined space, parameters otherwise givingrise to mazes induce formation of parallel ridges emanatingfrom the nippled area (Fig. S4E).
Fig. 3. The insect corneal nanostructural diversityreplicates Turing patterns. Mathematically modeledTuring patterns (in black and white) and their insectcounterparts. (A and A′) Irregular nipples of varioussizes, characteristic e.g., for Hemipteran cornealnanocoatings. (B and B′) Highly ordered nipplednanoarrays (Lepidoptera). (C and C′) Strands merg-ing into a maze (Diptera, Tabanidae). (D and D′)Parallel strands (Diptera, Tipulidae). (E and E′) Nip-ples merging into a maze (Plecoptera). (F and F′)Typical maze-like structures (Coleoptera, Gyrinidae).(G and G′) Angular maze-like structures (Coleoptera,Coccinellidae). (H and H’) A typical dimpled pattern(Dermaptera). A′ is a fragment of Fig. S1F; B′ is animage from a Pterophoridae butterfly; C′ is a frag-ment of Fig. 1F; D′ is a fragment of Fig. 1G; E′ is afragment of Fig. 1E; F′ is an image from a Gyrinusbeetle [overwater eye (13)]; G′ is a fragment ofFig. S2B; and H′ is a fragment of Fig. 1D. Modelingparameters are given in Table S2. (I) Simulationsof Turing patterns formation. Step-wise changesin the av and bu parameters within the boundaryconditions produce different Turing patterns:dimples (yellow zone), mazes (blue zone), andnipples (green zone). See Fig. S4A for more de-tailed representation.
Blagodatski et al. PNAS | August 25, 2015 | vol. 112 | no. 34 | 10753
EVOLU
TION
ENGINEE
RING

Detailed analysis of the physical (such as antireflective andantiwetting) properties of the diverse corneal nanostructureswe present here is still to be performed, but the fact that boththe nipple-type and maze-type nanostructures serve the anti-reflective function (2, 13) suggests the functionality of themajority, if not all, of them. The variety of these nanostructurescan serve as a highly promising model, obeying the Turingmechanism of pattern formation. Insect eyes, especially those ofthe genetically tractable model insect Drosophila melanogaster(6, 25), can therefore serve as a powerful tool to further ex-plore the precise mechanisms of the reaction−diffusion-drivenprocesses in living organisms, to identify the molecular componentsgoverning formation of corneal nanocoatings, and to geneticallyengineer novel Turing nanopatterns with novel physical properties.
MethodsInsect Specimens. The dried insect samples were obtained from a collectionof the Department of Entomology, Moscow State University. Fresh speci-mens were collected in the woods around the town of Pushchino, Moscowregion. The phylogenetic tree of the insect class was taken from Su andcoworkers (24).
Atomic Force Microscopy. To prepare corneal samples, the head of aninsect was cut out of the body, followed by removal of the mouth ap-paratus with a scalpel, splitting of the head into the two hemispheres, andcareful extraction of the brain tissue with forceps. Next, the cornea wascleared from the head capsule tissue as well as the underlying brain
material with a scalpel. The sample was attached to a glass slide for AFMby means of two-sided scotch tape. AFM scanning of the corneal surfaceswas performed with the Integra-Vita microscope (NT-MDT). For thesemicontact procedure, the nitride silicon cantilever NSG 03 (NT-MDT)was used. The parameters of the cantilever were: length, 100 μm; reso-nant frequency, 62–123 kHz; radius, 10 nm; and force constant, 0.4–2.7 N/m.For the contact procedure, the cantilever CSG 10 (NT-MDT) was used,with the following parameters: length, 250 μm; resonant frequency,14–28 kHz; radius, 10 nm; and force constant, 0.03–0.2 N/m. The choicebetween the semicontact and the contact measuring procedures wasdictated by the size and curvature of the studied surface of the samplebut provided essentially identical results. In each AFM experiment, severalscans were made to check the reproducibility of images and the ab-sence of possible surface damages. Measurements of height andwidth of the corneal nanostructures were performed by the Nova software(NT-MDT).
Turing Modeling. The 2D patterns were made using the software RDsimJ.jar(16) with the parameter values listed in Table S2.
ACKNOWLEDGMENTS. We thank Gennadiy Enin for the atomic force mi-croscopy technical assistance, Anastasia Ozerova for providing severalLepidopteran samples, Alexey Koval for help with Fig. 4 and for fruitfuldiscussions, Gonzalo Solis and Oleksii Bilousov for critically readingthe manuscript, and the Dynasty Foundation School of Molecular andTheoretical Biology for supporting the initiation of this work. This workwas funded by Grant DP-B-14/13 from the Dynasty foundation (to A.B.)and by the Scientific & Technological Cooperation Program Switzerland-Russia (V.L.K.).
1. Gilbert SF (2014) Developmental Biology (Sinauer Assoc, Sunderland, MA), 10th Ed.2. Stavenga DG, Foletti S, Palasantzas G, Arikawa K (2006) Light on the moth-eye cor-
neal nipple array of butterflies. Proc Biol Sci 273(1587):661–667.3. Bernhard CG, Miller WH (1962) A corneal nipple pattern in insect compound eyes.
Acta Physiol Scand 56:385–386.4. Bernhard CG, Miller WH, Moller AR (1963) Function of the corneal nipples in the
compound eyes of insects. Acta Physiol Scand 58:381–382.5. Bernhard CG, Gemne G, Sällström J (1970) Comparative ultrastructure of corneal
surface topography in insects with aspects on phylogenesis and function. J Comp
Physiol A 67(1):1–25.6. Kryuchkov M, et al. (2011) Analysis of micro- and nano-structures of the corneal
surface of Drosophila and its mutants by atomic force microscopy and optical dif-
fraction. PLoS One 6(7):e22237.7. Sukontason KL, et al. (2008) Ommatidia of blow fly, house fly, and flesh fly: Impli-
cation of their vision efficiency. Parasitol Res 103(1):123–131.8. Watson GS, Myhra S, Cribb BW, Watson JA (2008) Putative functions and functional
efficiency of ordered cuticular nanoarrays on insect wings. Biophys J 94(8):3352–3360.9. Dewan R, et al. (2012) Studying nanostructured nipple arrays of moth eye facets helps
to design better thin film solar cells. Bioinspir Biomim 7(1):016003.
10. Peisker H, Gorb SN (2010) Always on the bright side of life: Anti-adhesive properties
of insect ommatidia grating. J Exp Biol 213(Pt 20):3457–3462.11. Huang YF, et al. (2007) Improved broadband and quasi-omnidirectional anti-
reflection properties with biomimetic silicon nanostructures. Nat Nanotechnol 2(12):
770–774.12. Palasantzas G, De Hosson JTM,Michielsen KFL, Stavenga DG (2005) Optical properties and
wettability of nanostructured biomaterials: Moth eyes, lotus leaves, and insect wings.
Handbook of Nanostructured Biomaterials and their Applications in Nanobiotechnology,
ed Nalwa HS (Am Sci Publ, Valencia, CA), Vol 1, pp 273–301.13. Blagodatski A, et al. (2014) Under- and over-water halves of Gyrinidae beetle eyes
harbor different corneal nanocoatings providing adaptation to the water and air
environments. Sci Rep 4:6004.14. Fröhlich A (2001) A scanning electron-microscopic study of apical contacts in the eye
during postembryonic development of Drosophila melanogaster. Cell Tissue Res
303(1):117–128.15. Turing AM (1952) The chemical basis of morphogenesis. Philos Trans R Soc B 237(641):
37–72.16. Kondo S, Miura T (2010) Reaction-diffusion model as a framework for understanding
biological pattern formation. Science 329(5999):1616–1620.
Fig. 4. Transformations of corneal nanopatterns. The morphogramme depicts the likely interconversions among the nanostructural patterns found in theinsect class rather than phylogenetic relationships of the patterns. Primordial dimpled nanopatterns (1, here from a Forficula earwig) can transform intovarious maze-type nanostructures (2–4; 2 from a Pyrrhocoris firebug, 3 from a Tabanidae fly, and 4 from the butterfly Protographium asius). The latter canfurther transform into disordered nipples (6, here from the fruit fly Drosophila melanogaster), which can further become orderly packed (7, here from aPterophoridae moth). Alternatively, parallel ridges (5, here from a Tipulidae fly) can evolve either from mazes or nipples. The figure is made of reconstructed3D AFM images fused, for the sake of visualization not in exact scale, using MATLAB.
10754 | www.pnas.org/cgi/doi/10.1073/pnas.1505748112 Blagodatski et al.

17. Nakamasu A, Takahashi G, Kanbe A, Kondo S (2009) Interactions between zebrafishpigment cells responsible for the generation of Turing patterns. Proc Natl Acad SciUSA 106(21):8429–8434.
18. Sick S, Reinker S, Timmer J, Schlake T (2006) WNT and DKK determine hair folliclespacing through a reaction-diffusion mechanism. Science 314(5804):1447–1450.
19. Raspopovic J, Marcon L, Russo L, Sharpe J (2014) Modeling digits. Digit patterning iscontrolled by a Bmp-Sox9-Wnt Turing network modulated by morphogen gradients.Science 345(6196):566–570.
20. Miura T, Maini PK (2004) Speed of pattern appearance in reaction–diffusion models:Implications in the pattern formation of limb bud mesenchyme cells. Bull Math Biol66(4):627–649.
21. Tardieu A (1988) Eye lens proteins and transparency: From light transmission theoryto solution X-ray structural analysis. Annu Rev Biophys Biophys Chem 17:47–70.
22. Miura T, Maini PK (2004) Periodic pattern formation in reaction–diffusion systems: Anintroduction for numerical simulation. Anat Sci Int 79(3):112–123.
23. Chipman AD, et al. (2014) The first myriapod genome sequence reveals conservativearthropod gene content and genome organisation in the centipede Strigamia mar-itima. PLoS Biol 12(11):e1002005.
24. Ishiwata K, Sasaki G, Ogawa J, Miyata T, Su ZH (2011) Phylogenetic relationshipsamong insect orders based on three nuclear protein-coding gene sequences. MolPhylogenet Evol 58(2):169–180.
25. Boseman A, Nowlin K, Ashraf S, Yang J, Lajeunesse D (2013) Ultrastructural analysis ofwild type and mutant Drosophila melanogaster using helium ion microscopy. Micron51:26–35.
26. Meyer-Rochow VB, Stringer IA (1993) A system of regular ridges instead of nipples ona compound eye that has to operate near the diffraction limit. Vision Res 33(18):2645–2647.
27. Clay Smith W, Butler JF (1991) Ultrastructure of the Tabanidae compound eye: Un-usual features for Diptera. J Insect Physiol 37(4):287–296.
28. Parker AR, Hegedus Z, Watts RA (1998) Solar–absorber antireflector on the eye of anEocene fly (45 Ma). Proc R Soc B 265(1398):811–815.
29. Anderson MS, Gaimari SD (2003) Raman-atomic force microscopy of the ommatidialsurfaces of Dipteran compound eyes. J Struct Biol 142(3):364–368.
30. Chu H, Norris DM, Carlson SD (1975) Ultrastructure of the compound eye of thediploid female beetle, Xyleborus ferrugineus. Cell Tissue Res 165(1):23–36.
31. Mishra M, Meyer-Rochow VB (2006) Eye ultrastructure in the pollen-feeding beetle,Xanthochroa luteipennis (Coleoptera: Cucujiformia: Oedemeridae). J Electron Microsc(Tokyo) 55(6):289–300.
32. Dey S, Dkhar B (1992) An unusual type of corneal nipple in the earwig, Forficula sp.,with a possible anti-reflection role. Micron and Microscopica Acta 23(3):337–339.
33. Dey S (1988) Scanning electron microscopic detection of corneal anti-reflectioncoating in the grasshopper, Epacromia dorsalis and its physiological significance.Vision Res 28(9):975–977.
34. Sheth R, et al. (2012) Hox genes regulate digit patterning by controlling the wave-length of a Turing-type mechanism. Science 338(6113):1476–1480.
35. Desai A, Mitchison TJ (1997) Microtubule polymerization dynamics. Annu Rev Cell DevBiol 13:83–117.
36. Alonso U, et al. (2011) Colloid diffusion coefficients in compacted and consolidatedclay barriers: Compaction density and colloid size effects. Phys Chem Earth Parts ABC36(17-18):1700–1707.
37. Pumpa M, Cichos F (2012) Slow single-molecule diffusion in liquid crystals. J PhysChem B 116(49):14487–14493.
38. Sergeev A, et al. (2015) Origin of order in bionanostructures. RSC Adv 5(78):63521–63527.
Blagodatski et al. PNAS | August 25, 2015 | vol. 112 | no. 34 | 10755
EVOLU
TION
ENGINEE
RING
Gordon M. Bennett and Nancy A. Moran1
Department of Integrative Biology, University of Texas at Austin, Austin, TX 78712
Edited by W. Ford Doolittle, Dalhousie University, Halifax, NS, Canada, and approved January 26, 2015 (received for review December 19, 2014)
Many eukaryotes have obligate associations with microorganismsthat are transmitted directly between generations. A model forheritable symbiosis is the association of aphids, a clade of sap-feeding insects, and Buchnera aphidicola, a gammaproteobacte-rium that colonized an aphid ancestor 150 million years ago andpersists in almost all 5,000 aphid species. Symbiont acquisitionenables evolutionary and ecological expansion; aphids are oneof many insect groups that would not exist without heritable sym-biosis. Receiving less attention are potential negative ramificationsof symbiotic alliances. In the short run, symbionts impose meta-bolic costs. Over evolutionary time, hosts evolve dependence be-yond the original benefits of the symbiosis. Symbiotic partnersenter into an evolutionary spiral that leads to irreversible code-pendence and associated risks. Host adaptations to symbiosis (e.g.,immune-system modification) may impose vulnerabilities. Symbi-ont genomes also continuously accumulate deleterious mutations,limiting their beneficial contributions and environmental toler-ance. Finally, the fitness interests of obligate heritable symbiontsare distinct from those of their hosts, leading to selfish tendencies.Thus, genes underlying the host–symbiont interface are predictedto follow a coevolutionary arms race, as observed for genes gov-erning host–pathogen interactions. On the macroevolutionaryscale, the rapid evolution of interacting symbiont and host genesis predicted to accelerate host speciation rates by generating geneticincompatibilities. However, degeneration of symbiont genomesmay ultimately limit the ecological range of host species, poten-tially increasing extinction risk. Recent results for the aphid–Buchnera symbiosis and related systems illustrate that, whereasheritable symbiosis can expand ecological range and spur diversi-fication, it also presents potential perils.
Buchnera | aphid | Muller’s ratchet | selection levels | coevolution
Obligate symbiotic relationships shape the evolution ofpartner lineages. In symbioses that are mutually beneficial,
partners evolve traits that enable and stabilize the symbiosis: thiscooperative coevolution is emphasized in most studies of sym-bioses. Genomic work has also revealed that obligate symbiosisproduces unusual genome modifications, including extreme re-duction, rapid protein evolution, and codon reassignments, all ofwhich are evident in ancient obligate symbionts of insects (1, 2).Recent studies suggest that host genomes also have acquiredunusual modifications that are linked to symbiosis, includingacquisition of genes from bacterial donors that seem to play arole in controlling or supporting symbionts (3–5). Below, weexplore why lineages entering into obligate heritable symbiosisundergo strange patterns of genome evolution and display featuresthat are difficult to interpret simply as adaptations for improvingsymbiotic function. We refer to the commitment to obligate,inherited symbiosis as the evolutionary “rabbit hole” of obligatesymbiosis, implying a generally irreversible journey into a veryodd world where the usual rules do not apply.Broadly, the symbiosis rabbit hole refers to the confluence of
selection and neutral evolution in generating the extreme pat-terns of genomic evolution observed in symbiotic partners. As weargue, these extremes are driven by three main forces: deleteri-ous symbiont evolution due to genetic drift, within-host selection
leading to symbiont selfishness, and adaptive compensation onthe part of hosts (Fig. 1). The interaction of these forces resultsin rapid and ongoing evolutionary change in both symbioticpartners, with profound evolutionary consequences. Symbiont de-generation coupled with host compensation is a defining charac-teristic of heritable symbiosis. A salient feature of this relationship isthat the host must maintain a viable symbiosis with a partner thathas a rapidly evolving genome due to the nonadaptive fixation ofmutations through drift. In sum, the host must keep pace withits symbiont as multiple forces draw it ever further down therabbit hole.In this perspective, we focus on insect–bacterial symbioses,
especially the symbiosis of pea aphid (Hemiptera: Acyrthosiphonpisum) and Buchnera aphidicola (Gammaproteobacteria), for whichrecent experimental studies have yielded new insights into theintegration of symbiotic partners. These ideas are potentially ap-plicable to a broad range of heritable symbioses in which the sym-biont is strictly clonal and restricted to living in hosts.
Evolutionary Opportunities from Symbiosis: EcologicalBenefit and Lineage ExpansionOn macroevolutionary time scales, symbiont acquisition has oftenenabled evolutionary diversification and ecological expansion.By acquiring maternally transmitted bacterial symbionts, manyinsect lineages have succeeded in unlocking new ecological niches,particularly ones that present nutritionally unbalanced diets.Aphids and other sap-feeding insects rely on phloem sap or xylemsap as their only food, and these diets are extremely limited inessential amino acids and some vitamins (6). Use of these un-balanced diets is possible because symbionts supply missingnutrients (7–10).The macroevolutionary and ecological consequences of ac-
quiring symbionts can be immense. Continuing with the sameexample, symbiont-dependent sap-feeding insects were amongthe first herbivores to exploit vascular plants (11, 12) and includehighly successful clades such as aphids (5,000 described species),whiteflies (1,600 species), psyllids (3,000 species), scale insects(8,000 species), leafhoppers (>20,000 species), cicadas (2,500species), spittlebugs (3,000 species), and planthoppers (13,000species) (11). All possess needle-like mouthparts, or stylets, usedto access plant fluid and sap diets. These groups exhibit diverseplant–parasitic lifestyles and are critical players in terrestrialecosystems as vectors of plant disease, food to diverse predatorsand parasites, and mutualists to other insects including ants. Ineach of these sap-feeding insect groups, phylogenetic analyses
This paper results from the Arthur M. Sackler Colloquium of the National Academy ofSciences, “Symbioses Becoming Permanent: The Origins and Evolutionary Trajectories ofOrganelles,” held October 15–17, 2014, at the Arnold and Mabel Beckman Center of theNational Academies of Sciences and Engineering in Irvine, CA. The complete program andvideo recordings of most presentations are available on the NAS website at www.nasonline.org/Symbioses.
Author contributions: G.M.B. and N.A.M. designed research, performed research, ana-lyzed data, and wrote the paper.
The authors declare no conflict of interest.
This article is a PNAS Direct Submission.1To whom correspondence should be addressed. Email: [email protected].
www.pnas.org/cgi/doi/10.1073/pnas.1421388112 PNAS | August 18, 2015 | vol. 112 | no. 33 | 10169–10176
EVOLU
TION
COLLOQUIUM
PAPE
R

show that obligate symbionts have been vertically transmitted formillions of years, in many cases from the late Permian [>250Mya (million years ago)] (8, 10). The diversity and abundance ofinsects feeding on xylem or phloem sap reflect the dominance ofvascular plants in terrestrial ecosystems: symbionts provided theentry to a vast and expanding new niche that spread across theglobe. As a counterexample, the Coleorrhyncha, which resem-bles other sap-feeding groups in originating around the sametime (the Permian) and having an obligate symbiont, containsonly about 24 species, reflecting ties to specific nonvascularplants (certain mosses) (13, 14).Parallel cases of symbiont-driven ecological expansion have
been documented in other insects, including cockroaches (15,16), ants (17), lice (18), and beetles (19–21). Examples extendinto other animal hosts although, in some, transmission may bepartly or wholly horizontal rather than strictly vertical. Examplesinclude vesicomyid clams (22, 23), corals (24), earthworms (25),sponges (26), tunicates (24), and flashlight fish (27). In most,phylogenetic analyses demonstrate that symbiont acquisitionsoccurred in a shared ancestor of a major clade. By freeing hostsfrom specific nutritional requirements or by providing new pro-tection against pathogens or predators, symbiosis has enablednovel lifestyles and increased long-term fitness.Acquiring a heritable symbiont is effectively a mutation of
major effect, increasing host fitness at the population and cladelevel. In many, although not all, identified cases, these acquisi-tions have resulted in a proliferation of descendant lineages, usuallycomprised of species restricted to a particular dietary niche. Thus,long-term, heritable symbiosis underlies many dominant insectlifestyles and has shaped macroevolutionary and ecological patterns.
Evolutionary Hazards of SymbiosisBecoming Irreversibly Obligate. The continuous presence of a verti-cally transmitted symbiont leads to the evolution of developmentaldependence beyond the symbiont’s original contribution; that is,hosts become addicted to their symbionts. In aphids, eliminationof Buchnera through antibiotic treatment interferes with de-velopment, which typically stalls if Buchnera fails to colonize (28).Aphid females deprived of Buchnera, due to heat, antibiotics, orold age, produce few or no progeny, even when dietary nutrition issufficient (29). This dependence on Buchnera for developmentreflects 150 million years of fixation of aphid mutations that arebeneficial or neutral in the presence of Buchnera but potentiallydeleterious in its absence. Thus, adoption of symbionts fornutrient provisioning is a gateway to developmental dependenceeven when those nutrients are not needed. Indeed, so long as thesymbiont is continuously present, addiction can evolve even to del-eterious microbes, such as the reproductive parasite Wolbachia (30).Reflecting their reliance on symbionts, hosts have evolved
specialized mechanisms and tissues for housing and supportingsymbionts and for transferring them from mother to progeny. In
aphids, cells that are specified to become bacteriocytes showdistinctive gene expression in early developmental stages, andtheir cellular fate is determined before Buchnera colonization(31, 32). Bacteriocyte expression of genes underlying amino acidmetabolism complements Buchnera pathways for amino acidbiosynthesis, reflecting extensive host–symbiont collaboration inthis central nutritional function (33–35). Certain aphid genesseem to function solely in controlling or supporting Buchnera.For example, some highly expressed peptides are confined tobacteriocytes or surrounding sheath cells (36). An amino acidtransporter expressed in bacteriocytes has altered substrate af-finity that imposes negative feedback regulation of essential aminoacid production by Buchnera (37). Finally, an aphid-encoded pro-tein, originally of bacterial origin (but not Buchnera), has beenshown to be localized within Buchnera cells although its function isnot yet known (5). Taken together, these findings for the Buchnera–aphid symbiosis point to extensive genomic and metabolic in-tegration of symbiotic partners and blur the distinction betweensymbiont and organelle.Accommodation of symbionts may require that hosts suppress
or modify immune responses (38, 39), potentially elevating risk ofpathogen invasion. In aphids, many genes underlying responses toGram-negative bacteria have been eliminated, including the im-mune deficiency signaling pathway (IMD), peptidoglycan receptorproteins, and antimicrobial peptides (40, 41). Potentially, theselosses facilitated the evolution of symbioses with Buchnera, andwith numerous facultative symbionts, as supported by the ob-servation that Buchnera cells elicit the IMD pathway in otherinsects (42). This reduction in immunity seems to have con-sequences because aphids are susceptible to infections by bac-terial pathogens during feeding and during nutritional stress (43,44). The prospect that immune-system reduction paved the wayfor the elaborate symbioses in sap-feeding insects generally willlikely be resolved from ongoing genome sequencing of additionalinsect species that vary in symbiotic associations.As these examples illustrate, once a symbiont is required for
development, hosts may become locked in, even when the orig-inal symbiotic benefit is reduced or eliminated due to changingecological conditions or deterioration of symbiont functionality.Evidence that such deterioration indeed occurs is discussed inthe next sections.
Symbiont Decay. A well-documented force affecting heritablesymbionts is genetic drift leading to the fixation of neutral ordeleterious mutations that cause gene inactivation, gene loss, orinefficiency of gene products (45, 46). The basis for elevatedgenetic drift is the drastic shift in population genetic structurethat occurs when a free-living microorganism adopts an obligatesymbiotic lifestyle. The genetic population size becomes largelydependent on the host population size (47), and free-livingbacteria have much larger populations than do animals (48).
Symbiotic Coevolution as a Source of Genetic IncompatibilitySymbiosis Rabbit HoleHost & Symbiont Mutation
Selfish Mutation
Deleterious Mutation
Host CompensatoryMutation
Increased Genetic Incompatability
SymbiontAcquisition
Insect Ancestor
Fig. 1. Causes and consequences of symbiotic co-evolution. Mutations that negatively impact thesymbiosis can be fixed through genetic drift due toclonality and small population size (shown in blue)or through within-host selection for selfish sym-bionts that favor their own fitness over that of thehost (red). In response, the host is selected to bufferthese mutations (green), leading to a spiral downthe symbiosis rabbit hole. This symbiont–host co-evolution may drive the rapid accumulation of ge-netic incompatibilities between host lineages andbetween hosts and symbiont strains. Lineage-spe-cific symbiont–host coevolution may lead to accel-erated reproductive isolation and speciation, whichcould further reduce the effective size of geneti-cally compatible host populations.
10170 | www.pnas.org/cgi/doi/10.1073/pnas.1421388112 Bennett and Moran
Furthermore, most heritable symbionts are strictly clonal, beingtransmitted only through host matrilines. This radical change inpopulation structure results in less efficient selection genome-wide, leading to elevated rates of fixation of deleterious mutations(45, 46, 49, 50).Symbiont genome decay affects genes in all functional cate-
gories (8). The first obligate symbiont genome sequenced, that ofBuchnera of the pea aphid, was most notable for the fact that ithad undergone extensive gene loss and contained no novel genesyet did retain genes for biosynthesis of essential amino acidsneeded by hosts (51). With more genome sequencing, it becameapparent that Buchnera genomes in different aphid lineagescontinue to undergo irreversible gene loss, over long and shorttime scales (52–56). Similar ongoing gene loss is evident in everyobligate symbiont clade for which multiple genomes have beensequenced (16, 57, 58). Many show far more extreme genomereduction than does Buchnera. Indeed, symbiont genomes haverepeatedly evolved to be the very smallest genomes known incellular organisms (aside from organelles), with total gene countsoften <300 and sometimes <150 (1, 3, 10, 58–62). Continuinglosses from established obligate symbionts include genes un-derlying central cellular functions and cell-envelope production,as well as genes underlying symbiotic benefits such as nutrientbiosynthesis.Essential genes that are retained are subject to elevated bur-
dens of slightly deleterious mutations in heritable symbionts.Compared with homologs in free-living relatives, gene productshave lower efficiencies and reduced thermal stability (53, 63).Symbionts also exhibit genome-wide accelerated sequence evo-lution and mutation-driven biases in nucleotide base composi-tion (8, 45, 46, 64, 65). This mutation-driven bias generally favorsA+T nucleotides and has extreme effects on polypeptide com-position; all encoded proteins in most insect symbionts arestrongly shifted toward amino acids that enable higher A+T inthe DNA sequence. The negative effects of these mutations arepartially masked by constitutively high expression of chaperonesthat help to stabilize impaired proteins (66–68), but high chap-erone expression is itself metabolically costly.These observations raise a question: How can seemingly del-
eterious mutations that eliminate or hinder useful symbiontfunctions become fixed? One explanation depends on the fluc-tuations in nutrient availability in environments. Host insectsencounter varying ecological conditions, such as changes in hostplants that affect nutrient availability. If the symbiont provisionsnutrients, but the diet sometimes is enriched for those nutrients,selection to maintain the corresponding symbiont pathway willbe relaxed, opening the way for inactivation of the underlyinggenes. The result is that the host now requires the dietary supply,leading to a long-term narrowing of its ecological range (Fig. 2).For example, in some gall-feeding aphids, Buchnera has lostbiosynthetic pathways for some nutrients (53), probably be-
cause gall formation results in enrichment of ingested sap. Thisunidirectional loss of Buchnera capabilities potentially preventsthe aphid lineage from returning to a broader feeding niche.Loss and decay of symbiont functionality result in selection on
hosts to compensate. Hosts require symbionts for nutritionalbenefits or for proper development so ongoing symbiont decayforces hosts to continually adapt. Host compensatory adapta-tions are reflected in the elaborate support systems that arebeginning to be revealed from studies of symbioses of sap-feeding insects. For example, in mealybugs and psyllids, sym-bionts have lost most of the genetic machinery for generating cell-envelope components, and genes underlying these functions areinstead found within host genomes and are highly expressed inbacteriocytes (3, 4). As hosts evolve to shore up symbiont short-comings, the latter are able to lose even more functionality, leadingto increasingly intricate host support systems. This pressure on hoststo compensate for symbiont decay explains why obligate symbiontshave the smallest genomes, by far, of any cellular organisms: Theirhosts evolve to compensate for symbiont gene losses, facilitatingfurther loss of symbiont function over time. Thus, the lineagedescends into the symbiosis rabbit hole, driven by genetic drift in thesymbionts and compensatory adaptation by hosts (Fig. 1).
Symbiont Selfishness. Fitness of a maternally inherited symbiont isclosely aligned with that of its hosts. Thus, natural selection gen-erally favors symbiont features that benefit hosts, such as mech-anisms for efficient nutrient provisioning at economical metaboliccosts. Indeed, some symbiont features seem to be specific adap-tations for increasing host-level fitness: e.g., in Buchnera, pathwaysfor production of some essential amino acids are amplified andlocated on plasmids as mechanisms for overproducing or regu-lating the production of these nutrients (9). Nonetheless, the fit-ness interests of host and symbiont are not identical. The potentialfor the spread of “selfish” symbiont mutations persists even in themost intimate codependent associations (69). A symbiont muta-tion that speeds replication of the mutant cell line within a host–and thereby increases its proportional representation in theprogeny–can increase in frequency even if it lowers her overallfecundity. Although mutualistic symbioses are often consideredas fully cooperative, in fact, we should expect elements ofa coevolutionary arms race, or Red Queen evolution, of the sortwidely demonstrated for host–pathogen coevolution (70). Ac-cordingly, the machinery underlying symbiont–host integration mayrepresent not a stable solution to host–symbiont integration, but thecurrent status of an ongoing struggle, driven by both conflict andconcordance in evolutionary interests.Among the clear examples of selfishness on the part of ma-
ternally inherited symbionts are mechanisms that favor femaleover male progeny. In most cases, males are a dead end for sym-bionts (but see ref. 71), and symbionts are not expected to sup-port male reproduction (72). Numerous cases of symbionts
Loss of environmental genes
Ecological Range RestrictionBroad Host Range Symbiont Genome Reduction Host ExtinctionRange Restriction
Fig. 2. Ecological range restriction by symbiontgene loss. In a specific environment, some symbiontgenes may not be needed, resulting in relaxed se-lection for their maintenance and inactivation. Insap-feeding insects with obligate symbionts, usinga food plant with abundant levels of a particularnutrient can lead to irreversible loss of symbiontgenes for making that nutrient. A consequenceis permanent restriction of the host’s ecologicalrange: for example, confinement to a smaller set offood plant species. As available resources changeover time (e.g., due to climate change), a possibleconsequence of a narrower ecological niche is smallerpopulation size or eventual extinction.
Bennett and Moran PNAS | August 18, 2015 | vol. 112 | no. 33 | 10171
EVOLU
TION
COLLOQUIUM
PAPE
R

manipulating reproduction to favor production of infectedmatrilines, at male expense, have been documented, includingmany within the widely known Wolbachia (Alphaproteobacteria)(73), as well as Cardinium (Bacteroidetes) (74). In ancient ob-ligate symbiosis, mechanisms for the propagation of symbiontshave been fixed, but ongoing mutations can favor the proliferationand transmission of selfish symbionts within matrilines.In general, a mutant symbiont cell lineage that replicates faster
but does not provision nutrients to hosts might increase pro-portionally within progeny of a female. However, once fixed, itshosts will have lower fecundity than hosts in which all symbiontsprovision nutrients (47). Thus, matrilines in which selfish sym-bionts become fixed are negatively selected within the host pop-ulation, implying strict limits on symbiont selfishness. Nonetheless,selection at the host level will not eliminate selfish tendencies ofsymbionts, and hosts are expected to evolve counteradaptations.Several observations do suggest elements of arms race coevolu-tion in intimate, heritable insect symbioses. In both aphids andSitophilus grain weevils, peptides resembling the classic antimi-crobial peptides that are effectors of the innate immune systemseem to be key in the containment of maternally inherited nu-tritional symbionts (36, 75). Likewise, in the obligate symbiosis oftsetse, immune components play a part in regulating symbionts(38). Thus, hosts seem to control symbionts using mechanismsrelated to those that limit pathogen invasion. However, host controlof heritable symbiont proliferation has been investigated in onlya few systems.In addition to favoring direct controls on selfish symbionts, se-
lection on hosts could lead to mechanisms that limit the potentialfor symbiont-level selection. Such adaptations could involve sep-aration of a distinct symbiont pool used for transmission toprogeny (69) or enforcing small inoculum size (47). Host controlsseem most likely to evolve when symbionts replicate many timesper host generation. Potentially, hosts can eliminate a bacteriocytealong with its resident bacteria if the bacteriocyte is under-performing by not provisioning sufficient nutrients or if pro-liferating symbiont cells become cancerous. During the life of anaphid female, bacteriocytes are lost; speculatively, this eliminationcould be selective, functioning as a means of disfavoring retentionand transmission of selfish Buchnera cell lines. Although hostsmight police their symbionts so as to minimize selfish tendenciesand promote cooperation (76), such policing is not yet knownfrom insect symbioses. Most likely, some selfish mutations occurand are countered by hosts. Thus, along with genomic decaythrough drift, symbiont selfishness is an additional pressure thatultimately tightens the specificity of host–symbiont associations.
Consequences of Symbiosis for Host EvolutionSpeciation Rates. We have argued that symbionts are prone toevolve in directions detrimental to hosts, due both to geneticdrift in clonal symbiont populations and to selection favoringselfish traits. An implication is that hosts are continually selectedto compensate. Under this scenario, the host–symbiont interfaceis predicted to rely on rapidly evolving genes that quickly acquireincompatibilities between populations (Fig. 1). In effect, host andsymbiont coevolution will drag each symbiotic lineage deeper intoits own unique rabbit hole. Thus, incompatibilities between symbi-ont and host loci, or between different host loci involved in sym-biotic control, are expected to emerge quickly and to accelerate theemergence of postzygotic isolating mechanisms, reinforcingreproductive isolation at early stages of lineage divergence.Incompatibilities involving loci functioning in symbioses mightarise even for host loci and symbiont genotypes circulating withina population, as seems to occur for nuclear loci within popula-tions (77).If symbiont–host incompatibilities emerge rapidly, insect clades
with obligate symbionts might have higher speciation rates thansimilarly aged clades without obligate symbionts. In theory, this
prediction is testable using a comparative phylogenetic frameworkto evaluate speciation rates in host clades with and without sym-bionts. In practice, such tests would be difficult because we stillhave poor estimates of species diversity in many insect clades, andcomprehensive phylogenies are nonexistent. A further prediction,and one that might be tested more readily, is that reproductiveisolation in insects with symbionts will often be enforced by in-compatibilities between host and symbiont loci or between dif-ferent host loci that contribute to the regulation, support, andtransmission of symbionts. Understanding the role of symbiosisin generating reproductive isolation can be approached throughexperimental investigations of symbiosis using hybridization ortransfection to produce novel host–symbiont combinations (78).If symbiosis does facilitate speciation, one of the driving forces,
genetic drift affecting symbiont genomes, is exacerbated. A majordeterminant of the rate of fixation of deleterious mutations insymbionts is host population size (47, 50), and each speciationevent generates two smaller populations. As the host strives tokeep pace with its symbiont, we expect an accelerated descentinto the symbiosis rabbit hole.
Ecological Range. Symbiont evolution can lead to restricted eco-logical range of hosts by limiting tolerance of both biotic andabiotic factors, such as nutritional availability and temperature.As discussed in Symbiont Decay, if a symbiont loses genes un-derlying pathways for provisioning its host with nutrients, due torelaxation of purifying selection during periods of temporarynutrient abundance, then the host lineage becomes permanentlydependent on environmental sources (or must acquire a new sym-biont) (Fig. 2). Losses of nutrient provisioning capabilities are on-going in all groups of obligate insect symbionts for which genomecomparisons within a symbiont clade are available (2, 52–55). Byenforcing dietary requirements, these losses are expected to narrowthe range of suitable environments for host-insect lineages (Fig. 2).Host insects cannot completely buffer their symbionts’ envi-
ronment, and symbionts incur mutations that impact their envi-ronmental tolerance, particularly to heat. Obligate symbionts ininsects are heat-sensitive and can be killed by temperatures thatdo not kill their hosts. For example, carpenter ants are limited bythe heat sensitivity of their obligate symbiont, Blochmannia (79).Likewise, Buchnera numbers plummet after heat exposure (80,81). In pea aphid populations that experience continuous cooltemperatures, Buchnera evolves to become even more heat sen-sitive, due to the spread of a mutation inactivating a heat shockpromoter (82, 83).Although symbiont heat sensitivity will be constrained by
prevailing temperatures, symbionts generally seem to have nar-row thermal range relative to that of hosts (84). The major effectof deleterious amino acid replacements is to lower protein sta-bility. As a general compensation for protein instability, chaperoneexpression in obligate symbionts is high even under nonstressconditions (68). In Buchnera, chaperonin (GroEL) is producedconstitutively at levels equivalent to those during extreme heatshock in Escherichia coli (66). Other Buchnera chaperones are alsooverexpressed constitutively, and only a few genes retain anytranscriptional response to heat (67). Thus, ability to compensatefor environmental stressors that destabilize proteins seems to becompromised. The net effect of these tendencies in symbionts is toreduce ecological range and, thus, host population size.
Escaping the Hazards of Symbiosis: Acquiring NovelSymbioses Through Replacement and SupplementationOnce a host lineage has proceeded down the irreversible pathinto obligate symbiosis, it seems that there is little opportunity toexit. In a few cases, such as the leafhopper subfamily Typhlocybinae,symbionts may have been lost in connection with dietary shifts:e.g., phloem sap to parenchyma. More often, the only escape fromdegenerate partners seems to be to supplement or replace them
10172 | www.pnas.org/cgi/doi/10.1073/pnas.1421388112 Bennett and Moran

with new symbionts. Numerous clear examples of an ancientobligate symbiont being joined or replaced by a newer one areevident, including several in the sap-feeding insects of suborderAuchenorrhyncha (Fig. 3). A likely driver for adding a newsymbiont is the degradation of functions in an ancient one: Anew symbiont can replace or supplement functions that arelost or inefficient in the older partner.Initially a newly acquired symbiont has a large set of bio-
synthetic capabilities, including some that are redundant withthose of the existing symbiont. Over evolutionary time, this re-dundancy is eliminated, as illustrated by the perfectly comple-mentary and nonredundant combinations of biosynthetic pathwaysrepeatedly observed for genomes of coresident symbionts in sap-feeding insects (1, 85, 86). Depending on which genome initiallyloses specific biosynthetic capabilities, a likely outcome is thatboth old and new symbionts become obligate for the host, eachmaintaining distinct and complementary contributions.
New symbionts can take on functions previously carried outby more ancient symbionts. For example, the aphid Cinara cedricontains Buchnera along with a second obligate symbiont, Serratiasymbiotica, which lives in a distinct type of bacteriocyte (87–89).The acquisition of S. symbiotica coincides with further gene lossin Buchnera: The C. cedri Buchnera genome is substantiallysmaller and lacks several amino acid biosynthetic genes presentin other Buchnera (55). The missing pathways are retained byS. symbiotica, despite its genome also being reduced (87, 90). Inthis case and others (86), a new symbiont has replaced or sup-plemented capabilities of an older one. However, the new sym-biont embarks on the same evolutionary path of genome decay,driven by mutation and drift.The sequential acquisition of multiple symbionts that retain
complementary biosynthetic capabilities can be reconstructed forseveral lineages in the sap-feeding suborder Auchenorrhyncha[e.g., cicadas, spittlebugs, leafhoppers, and sharpshooters (10,
Heteroptera
BetaSymbSulcia
Psylloidea
Aphidoidea
Coccoidea
Aleyrodoidea
Fulgoroidea
Membracoidea
Cicadoidea
Cercopoidea
Coleorrhyncha
Hodgkinia
Sodalis-like
Baumannia
Yeast-like
?
SerratiaYeast-like
Phylloxeroidea
Portiera
Carsonella
Evansia
Vidania
Nasuia
Zinderia
Profftella
Symbiont Types
TremblayaMoranella +
UzinuraWalczuchella
?
Buchnera
Annandia
Ishikawaella Burkholderia
Sternorrhyncha
Auchenorrhyncha
Betaproteo
Alphaproteo
Yeast-like
Gamma Entero.
Bacteroidetes
Hypotheticalor Loss
Gamma Halomo.
Origin of
Symbiosis
Fig. 3. Summary of the gains and losses of heritable symbionts across sap-feeding insects in the order Hemiptera. The phylogenies show evolutionaryrelationships of host insect groups (gray) and heritable symbionts. For color-coded lines, see Inset legend. Host phylogeny represents the most recent un-derstanding, but placement of certain lineages (e.g., the Coleorrhyncha and Heteroptera) is uncertain (12, 89). Ancestral symbiont names are in boxes alongtheir lineage; in some cases, the same symbiont lineage has different names in different insect clades. Names of acquired symbionts are shown where thesymbiont is acquired on the host phylogeny. Dashed lines represent hypothetical relationships and possible origins of symbiosis deep in the evolution of theHemiptera. The white-dashed lineage represents an ancestral symbiont that permitted the initial diversification of the Hemiptera; its identity is not yetknown. Lineages that terminate at a question mark remain uncertain; host–symbiont relationships in these clades are diverse and their origins unclear. Seetext for citations regarding specific symbionts presented on the tree.
Bennett and Moran PNAS | August 18, 2015 | vol. 112 | no. 33 | 10173
EVOLU
TION
COLLOQUIUM
PAPE
R
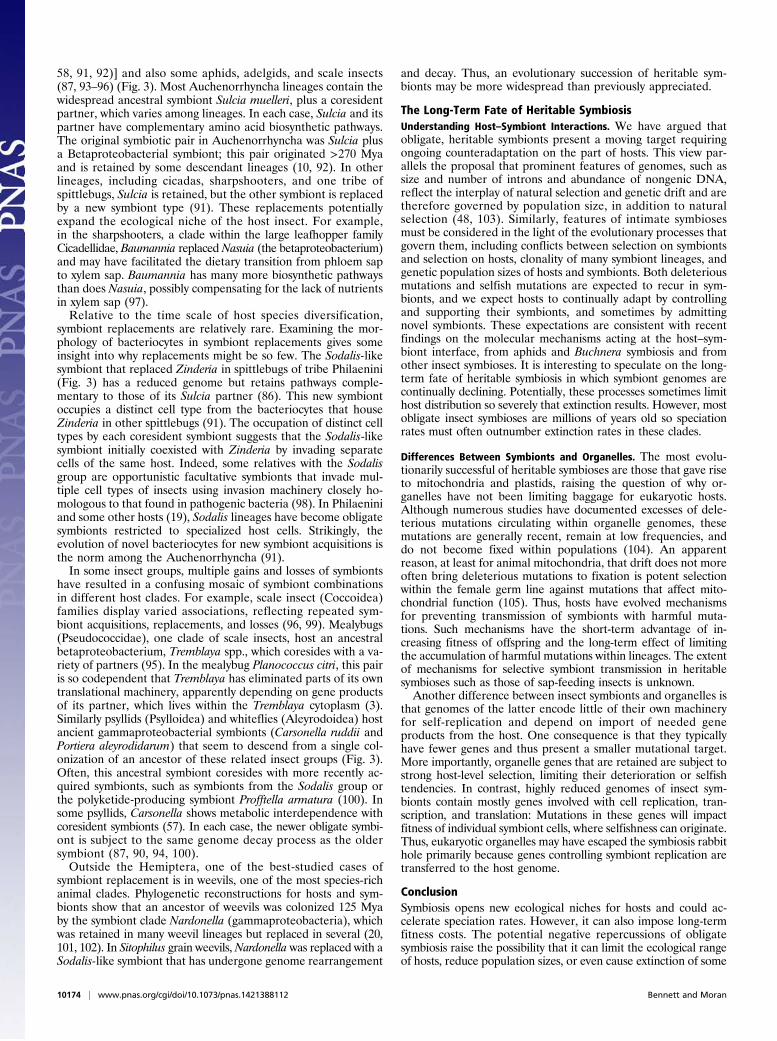
58, 91, 92)] and also some aphids, adelgids, and scale insects(87, 93–96) (Fig. 3). Most Auchenorrhyncha lineages contain thewidespread ancestral symbiont Sulcia muelleri, plus a coresidentpartner, which varies among lineages. In each case, Sulcia and itspartner have complementary amino acid biosynthetic pathways.The original symbiotic pair in Auchenorrhyncha was Sulcia plusa Betaproteobacterial symbiont; this pair originated >270 Myaand is retained by some descendant lineages (10, 92). In otherlineages, including cicadas, sharpshooters, and one tribe ofspittlebugs, Sulcia is retained, but the other symbiont is replacedby a new symbiont type (91). These replacements potentiallyexpand the ecological niche of the host insect. For example,in the sharpshooters, a clade within the large leafhopper familyCicadellidae, Baumannia replaced Nasuia (the betaproteobacterium)and may have facilitated the dietary transition from phloem sapto xylem sap. Baumannia has many more biosynthetic pathwaysthan does Nasuia, possibly compensating for the lack of nutrientsin xylem sap (97).Relative to the time scale of host species diversification,
symbiont replacements are relatively rare. Examining the mor-phology of bacteriocytes in symbiont replacements gives someinsight into why replacements might be so few. The Sodalis-likesymbiont that replaced Zinderia in spittlebugs of tribe Philaenini(Fig. 3) has a reduced genome but retains pathways comple-mentary to those of its Sulcia partner (86). This new symbiontoccupies a distinct cell type from the bacteriocytes that houseZinderia in other spittlebugs (91). The occupation of distinct celltypes by each coresident symbiont suggests that the Sodalis-likesymbiont initially coexisted with Zinderia by invading separatecells of the same host. Indeed, some relatives with the Sodalisgroup are opportunistic facultative symbionts that invade mul-tiple cell types of insects using invasion machinery closely ho-mologous to that found in pathogenic bacteria (98). In Philaeniniand some other hosts (19), Sodalis lineages have become obligatesymbionts restricted to specialized host cells. Strikingly, theevolution of novel bacteriocytes for new symbiont acquisitions isthe norm among the Auchenorrhyncha (91).In some insect groups, multiple gains and losses of symbionts
have resulted in a confusing mosaic of symbiont combinationsin different host clades. For example, scale insect (Coccoidea)families display varied associations, reflecting repeated sym-biont acquisitions, replacements, and losses (96, 99). Mealybugs(Pseudococcidae), one clade of scale insects, host an ancestralbetaproteobacterium, Tremblaya spp., which coresides with a va-riety of partners (95). In the mealybug Planococcus citri, this pairis so codependent that Tremblaya has eliminated parts of its owntranslational machinery, apparently depending on gene productsof its partner, which lives within the Tremblaya cytoplasm (3).Similarly psyllids (Psylloidea) and whiteflies (Aleyrodoidea) hostancient gammaproteobacterial symbionts (Carsonella ruddii andPortiera aleyrodidarum) that seem to descend from a single col-onization of an ancestor of these related insect groups (Fig. 3).Often, this ancestral symbiont coresides with more recently ac-quired symbionts, such as symbionts from the Sodalis group orthe polyketide-producing symbiont Profftella armatura (100). Insome psyllids, Carsonella shows metabolic interdependence withcoresident symbionts (57). In each case, the newer obligate symbi-ont is subject to the same genome decay process as the oldersymbiont (87, 90, 94, 100).Outside the Hemiptera, one of the best-studied cases of
symbiont replacement is in weevils, one of the most species-richanimal clades. Phylogenetic reconstructions for hosts and sym-bionts show that an ancestor of weevils was colonized 125 Myaby the symbiont clade Nardonella (gammaproteobacteria), whichwas retained in many weevil lineages but replaced in several (20,101, 102). In Sitophilus grain weevils,Nardonella was replaced with aSodalis-like symbiont that has undergone genome rearrangement
and decay. Thus, an evolutionary succession of heritable sym-bionts may be more widespread than previously appreciated.
The Long-Term Fate of Heritable SymbiosisUnderstanding Host–Symbiont Interactions. We have argued thatobligate, heritable symbionts present a moving target requiringongoing counteradaptation on the part of hosts. This view par-allels the proposal that prominent features of genomes, such assize and number of introns and abundance of nongenic DNA,reflect the interplay of natural selection and genetic drift and aretherefore governed by population size, in addition to naturalselection (48, 103). Similarly, features of intimate symbiosesmust be considered in the light of the evolutionary processes thatgovern them, including conflicts between selection on symbiontsand selection on hosts, clonality of many symbiont lineages, andgenetic population sizes of hosts and symbionts. Both deleteriousmutations and selfish mutations are expected to recur in sym-bionts, and we expect hosts to continually adapt by controllingand supporting their symbionts, and sometimes by admittingnovel symbionts. These expectations are consistent with recentfindings on the molecular mechanisms acting at the host–sym-biont interface, from aphids and Buchnera symbiosis and fromother insect symbioses. It is interesting to speculate on the long-term fate of heritable symbiosis in which symbiont genomes arecontinually declining. Potentially, these processes sometimes limithost distribution so severely that extinction results. However, mostobligate insect symbioses are millions of years old so speciationrates must often outnumber extinction rates in these clades.
Differences Between Symbionts and Organelles. The most evolu-tionarily successful of heritable symbioses are those that gave riseto mitochondria and plastids, raising the question of why or-ganelles have not been limiting baggage for eukaryotic hosts.Although numerous studies have documented excesses of dele-terious mutations circulating within organelle genomes, thesemutations are generally recent, remain at low frequencies, anddo not become fixed within populations (104). An apparentreason, at least for animal mitochondria, that drift does not moreoften bring deleterious mutations to fixation is potent selectionwithin the female germ line against mutations that affect mito-chondrial function (105). Thus, hosts have evolved mechanismsfor preventing transmission of symbionts with harmful muta-tions. Such mechanisms have the short-term advantage of in-creasing fitness of offspring and the long-term effect of limitingthe accumulation of harmful mutations within lineages. The extentof mechanisms for selective symbiont transmission in heritablesymbioses such as those of sap-feeding insects is unknown.Another difference between insect symbionts and organelles is
that genomes of the latter encode little of their own machineryfor self-replication and depend on import of needed geneproducts from the host. One consequence is that they typicallyhave fewer genes and thus present a smaller mutational target.More importantly, organelle genes that are retained are subject tostrong host-level selection, limiting their deterioration or selfishtendencies. In contrast, highly reduced genomes of insect sym-bionts contain mostly genes involved with cell replication, tran-scription, and translation: Mutations in these genes will impactfitness of individual symbiont cells, where selfishness can originate.Thus, eukaryotic organelles may have escaped the symbiosis rabbithole primarily because genes controlling symbiont replication aretransferred to the host genome.
ConclusionSymbiosis opens new ecological niches for hosts and could ac-celerate speciation rates. However, it can also impose long-termfitness costs. The potential negative repercussions of obligatesymbiosis raise the possibility that it can limit the ecological rangeof hosts, reduce population sizes, or even cause extinction of some
10174 | www.pnas.org/cgi/doi/10.1073/pnas.1421388112 Bennett and Moran
symbiont-dependent host lineages (along with their symbionts).We have argued that acquiring a maternally inherited obligatesymbiont thrusts lineages into a peculiar irreversible coevolutionaryrelationship that potentially increases speciation rate as well asextinction risk. Genomics-based analyses provide some support-ive evidence for these disparate evolutionary consequences of ob-ligate symbiosis.A main driving force for this process is the genomic decay in
symbionts that results from strict clonality and small geneticpopulation size. Therefore, we emphasize that these sameexpectations do not apply when the symbionts undergo horizontalor environmental transmission or when they are transmittedbiparentally. In such cases, the opportunity for continued DNAuptake from the environment or for homologous recombination(sex) persist, circumventing the ratchet-like loss of symbiontfunction and genes. This point is illustrated by the nephridialsymbioses of earthworms. The ancient vertically transmittedsymbiont, Verminephrobacter, is inherited biparentally, continuesto incorporate foreign DNA, and does not undergo genome
reduction (106, 107). Conversely, entrance to the symbiosis rabbithole does not require that symbionts be intracellular: Genomedecay is observed in maternally transmitted extracellular sym-bionts, exemplified by Ishikawaella capsulata in plataspid stinkbugs(108). The evolutionary rabbit hole does require that the symbiosisbe beneficial to hosts, driving them to coadapt. Hosts do not adaptto maintain pathogens, which therefore must retain sufficientcapabilities to function independently. Although genomic re-duction occurs in host-restricted pathogens, gene loss is far moreextreme in obligate symbionts (2), implying that reduction is fa-cilitated by host adaptation. Finally, acquiring a novel symbiontcan slow the descent into the symbiosis rabbit hole, but newsymbionts ultimately undergo the same drastic genome decay,requiring compensatory evolution in the host.
ACKNOWLEDGMENTS. We thank members of the N.A.M. and HowardOchman laboratory group for feedback. Funding came from a US Depart-ment of Agriculture, Agriculture and Food Resource Initiative postdoctoralfellowship TEXW-2013-03420 (to G.M.B.) and National Science FoundationAward IOS1347116.
1. McCutcheon JP, Moran NA (2012) Extreme genome reduction in symbiotic bacteria.Nat Rev Microbiol 10(1):13–26.
2. Moran NA, Bennett GM (2014) The tiniest tiny genomes. Annu Rev Microbiol 68:195–215.
3. Husnik F, et al. (2013) Horizontal gene transfer from diverse bacteria to an insectgenome enables a tripartite nested mealybug symbiosis. Cell 153(7):1567–1578.
4. Sloan DB, et al. (2014) Parallel histories of horizontal gene transfer facilitated ex-treme reduction of endosymbiont genomes in sap-feeding insects. Mol Biol Evol31(4):857–871.
5. Nakabachi A, Ishida K, Hongoh Y, OhkumaM, Miyagishima S-Y (2014) Aphid gene ofbacterial origin encodes a protein transported to an obligate endosymbiont. CurrBiol 24(14):R640–R641.
6. Sandström J, Moran N (1999) How nutritionally imbalanced is phloem sap foraphids? Entomol Exp Appl 91(1):203–210.
7. Douglas AE (1998) Nutritional interactions in insect-microbial symbioses: Aphids andtheir symbiotic bacteria Buchnera. Annu Rev Entomol 43:17–37.
8. Moran NA, McCutcheon JP, Nakabachi A (2008) Genomics and evolution of heritablebacterial symbionts. Annu Rev Genet 42:165–190.
9. Baumann P (2005) Biology bacteriocyte-associated endosymbionts of plant sap-sucking insects. Annu Rev Microbiol 59:155–189.
10. Bennett GM, Moran NA (2013) Small, smaller, smallest: The origins and evolu-tion of ancient dual symbioses in a Phloem-feeding insect. Genome Biol Evol 5(9):1675–1688.
11. Grimaldi D, Engel MS (2005) Evolution of the Insects (Cambridge Univ Press, NewYork).
12. Misof B, et al. (2014) Phylogenomics resolves the timing and pattern of insect evo-lution. Science 346(6210):763–767.
13. Santos-Garcia D, et al. (2014) Small but powerful, the primary endosymbiont of mossbugs, Candidatus Evansia muelleri, holds a reduced genome with large biosyntheticcapabilities. Genome Biol Evol 6(7):1875–1893.
14. Kuechler SM, Gibbs G, Burckhardt D, Dettner K, Hartung V (2013) Diversity of bac-terial endosymbionts and bacteria-host co-evolution in Gondwanan relict moss bugs(Hemiptera: Coleorrhyncha: Peloridiidae). Environ Microbiol 15(7):2031–2042.
15. Lo N, Bandi C, Watanabe H, Nalepa C, Beninati T (2003) Evidence for cocladogenesisbetween diverse dictyopteran lineages and their intracellular endosymbionts. MolBiol Evol 20(6):907–913.
16. Sabree ZL, Degnan PH, Moran NA (2010) Chromosome stability and gene loss incockroach endosymbionts. Appl Environ Microbiol 76(12):4076–4079.
17. Sauer C, Stackebrandt E, Gadau J, Hölldobler B, Gross R (2000) Systematic relation-ships and cospeciation of bacterial endosymbionts and their carpenter ant hostspecies: Proposal of the new taxon Candidatus Blochmannia gen. nov. Int J Syst EvolMicrobiol 50(Pt 5):1877–1886.
18. Allen JM, Reed DL, Perotti MA, Braig HR (2007) Evolutionary relationships of“Candidatus Riesia spp.,” endosymbiotic enterobacteriaceae living within hema-tophagous primate lice. Appl Environ Microbiol 73(5):1659–1664.
19. Heddi A, et al. (2005) Molecular and cellular profiles of insect bacteriocytes: Mutu-alism and harm at the initial evolutionary step of symbiogenesis. Cell Microbiol 7(2):293–305.
20. Lefèvre C, et al. (2004) Endosymbiont phylogenesis in the dryophthoridae weevils:Evidence for bacterial replacement. Mol Biol Evol 21(6):965–973.
21. Toju H, Tanabe AS, Notsu Y, Sota T, Fukatsu T (2013) Diversification of endosymbi-osis: Replacements, co-speciation and promiscuity of bacteriocyte symbionts inweevils. ISME J 7(7):1378–1390.
22. Stewart FJ, Young CR, Cavanaugh CM (2008) Lateral symbiont acquisition in a ma-ternally transmitted chemosynthetic clam endosymbiosis. Mol Biol Evol 25(4):673–687.
23. Newton ILG, et al. (2007) The Calyptogena magnifica chemoautotrophic symbiontgenome. Science 315(5814):998–1000.
24. Kwan JC, et al. (2012) Genome streamlining and chemical defense in a coral reefsymbiosis. Proc Natl Acad Sci USA 109(50):20655–20660.
25. Pinel N, Davidson SK, Stahl DA (2008) Verminephrobacter eiseniae gen. nov.,sp. nov., a nephridial symbiont of the earthworm Eisenia foetida (Savigny). Int J SystEvol Microbiol 58(Pt 9):2147–2157, and erratum (2013) 63(Pt 2):796.
26. Hentschel U, Piel J, Degnan SM, Taylor MW (2012) Genomic insights into the marinesponge microbiome. Nat Rev Microbiol 10(9):641–654.
27. Hendry TA, de Wet JR, Dunlap PV (2014) Genomic signatures of obligate host de-pendence in the luminous bacterial symbiont of a vertebrate. Environ Microbiol16(8):2611–2622.
28. Koga R, Tsuchida T, Sakurai M, Fukatsu T (2007) Selective elimination of aphid en-dosymbionts: Effects of antibiotic dose and host genotype, and fitness con-sequences. FEMS Microbiol Ecol 60(2):229–239.
29. Wilkinson TL, Ishikawa H (2000) Injection of essential amino acids substitutes forbacterial supply in aposymbiotic pea aphids (Acyrthosiphon pisum). Entomol ExpAppl 94(1):85–91.
30. Dedeine F, et al. (2001) Removing symbiotic Wolbachia bacteria specifically inhibitsoogenesis in a parasitic wasp. Proc Natl Acad Sci USA 98(11):6247–6252.
31. Braendle C, et al. (2003) Developmental origin and evolution of bacteriocytes in theaphid-Buchnera symbiosis. PLoS Biol 1(1):E21.
32. Koga R, Meng X-Y, Tsuchida T, Fukatsu T (2012) Cellular mechanism for selectivevertical transmission of an obligate insect symbiont at the bacteriocyte-embryo in-terface. Proc Natl Acad Sci USA 109(20):E1230–E1237.
33. Nakabachi A, et al. (2005) Transcriptome analysis of the aphid bacteriocyte, thesymbiotic host cell that harbors an endocellular mutualistic bacterium, Buchnera.Proc Natl Acad Sci USA 102(15):5477–5482.
34. Poliakov A, et al. (2011) Large-scale label-free quantitative proteomics of the peaaphid-Buchnera symbiosis. Mol Cell Proteomics 10(6):007039.
35. Hansen AK, Moran NA (2011) Aphid genome expression reveals host-symbiontcooperation in the production of amino acids. Proc Natl Acad Sci USA 108(7):2849–2854.
36. Shigenobu S, Stern DL (2013) Aphids evolved novel secreted proteins for symbiosiswith bacterial endosymbiont. Proc Biol Sci 280(1750):20121952.
37. Price DRG, et al. (2014) Aphid amino acid transporter regulates glutamine supply tointracellular bacterial symbionts. Proc Natl Acad Sci USA 111(1):320–325.
38. Wang J, Wu Y, Yang G, Aksoy S (2009) Interactions between mutualist Wigglesworthiaand tsetse peptidoglycan recognition protein (PGRP-LB) influence trypanosometransmission. Proc Natl Acad Sci USA 106(29):12133–12138.
39. Ratzka C, Gross R, Feldhaar H (2013) Gene expression analysis of the endosymbiont-bearing midgut tissue during ontogeny of the carpenter ant Camponotus floridanus.J Insect Physiol 59(6):611–623.
40. Gerardo NM, et al. (2010) Immunity and other defenses in pea aphids, Acyrthosiphonpisum. Genome Biol 11(2):R21.
41. International Aphid Genomics Consortium (2010) Genome sequence of the peaaphid Acyrthosiphon pisum. PLoS Biol 8(2):e1000313.
42. Douglas AE, Bouvaine S, Russell RR (2011) How the insect immune system interactswith an obligate symbiotic bacterium. Proc Biol Sci 278(1704):333–338.
43. Stavrinides J, McCloskey JK, Ochman H (2009) Pea aphid as both host and vector forthe phytopathogenic bacterium Pseudomonas syringae. Appl Environ Microbiol75(7):2230–2235.
44. Nakabachi A, Ishikawa H, Kudo T (2003) Extraordinary proliferation of micro-organisms in aposymbiotic pea aphids, Acyrthosiphon pisum. J Invertebr Pathol82(3):152–161.
45. Moran NA (1996) Accelerated evolution and Muller’s rachet in endosymbiotic bac-teria. Proc Natl Acad Sci USA 93(7):2873–2878.
46. Wernegreen JJ (2002) Genome evolution in bacterial endosymbionts of insects. NatRev Genet 3(11):850–861.
47. Rispe C, Moran NA (2000) Accumulation of deleterious mutations in endosymbionts:Muller’s ratchet with two levels of selection. Am Nat 156(4):425–441.
Bennett and Moran PNAS | August 18, 2015 | vol. 112 | no. 33 | 10175
EVOLU
TION
COLLOQUIUM
PAPE
R

48. Lynch M, Conery JS (2003) The origins of genome complexity. Science 302(5649):1401–1404.
49. Rispe C, Delmotte F, van Ham RCHJ, Moya A (2004) Mutational and selective pres-sures on codon and amino acid usage in Buchnera, endosymbiotic bacteria of aphids.Genome Res 14(1):44–53.
50. Pettersson ME, Berg OG (2007) Muller’s ratchet in symbiont populations. Genetica130(2):199–211.
51. Shigenobu S, Watanabe H, Hattori M, Sakaki Y, Ishikawa H (2000) Genome sequenceof the endocellular bacterial symbiont of aphids Buchnera sp. APS. Nature 407(6800):81–86.
52. Tamas I, et al. (2002) 50 million years of genomic stasis in endosymbiotic bacteria.Science 296(5577):2376–2379.
53. van Ham RCHJ, et al. (2003) Reductive genome evolution in Buchnera aphidicola.Proc Natl Acad Sci USA 100(2):581–586.
54. Moran NA, McLaughlin HJ, Sorek R (2009) The dynamics and time scale of ongoinggenomic erosion in symbiotic bacteria. Science 323(5912):379–382.
55. Pérez-Brocal V, et al. (2006) A small microbial genome: The end of a long symbioticrelationship? Science 314(5797):312–313.
56. Jiang Z, et al. (2013) Comparative analysis of genome sequences from four strainsof the Buchnera aphidicola Mp endosymbion of the green peach aphid, Myzuspersicae. BMC Genomics 14:917.
57. Sloan DB, Moran NA (2012) Genome reduction and co-evolution between the pri-mary and secondary bacterial symbionts of psyllids. Mol Biol Evol 29(12):3781–3792.
58. Bennett GM, McCutcheon JP, MacDonald BR, Romanovicz D, Moran NA (2014) Dif-ferential genome evolution between companion symbionts in an insect-bacterialsymbiosis. MBio 5(5):e01697–e14.
59. Rio RVM, et al. (2012) Insight into the transmission biology and species-specificfunctional capabilities of tsetse (Diptera: glossinidae) obligate symbiont Wigglesworthia.MBio 3(1):e00240–e11.
60. Sabree ZL, Huang CY, Okusu A, Moran NA, Normark BB (2013) The nutrient sup-plying capabilities of Uzinura, an endosymbiont of armoured scale insects. EnvironMicrobiol 15(7):1988–1999.
61. Williams LE, Wernegreen JJ (2013) Sequence context of indel mutations and theireffect on protein evolution in a bacterial endosymbiont. Genome Biol Evol 5(3):599–605.
62. Nakabachi A, et al. (2006) The 160-kilobase genome of the bacterial endosymbiontCarsonella. Science 314(5797):267.
63. Lambert JD, Moran NA (1998) Deleterious mutations destabilize ribosomal RNA inendosymbiotic bacteria. Proc Natl Acad Sci USA 95(8):4458–4462.
64. Herbeck JT, Funk DJ, Degnan PH, Wernegreen JJ (2003) A conservative test of ge-netic drift in the endosymbiotic bacterium Buchnera: Slightly deleterious mutationsin the chaperonin groEL. Genetics 165(4):1651–1660.
65. Wernegreen JJ (2011) Reduced selective constraint in endosymbionts: Elevation inradical amino acid replacements occurs genome-wide. PLoS ONE 6(12):e28905.
66. Baumann P, Baumann L, Clark MA (1996) Levels of Buchnera aphidicola chaperoninGroEL during growth of the aphid Schizaphis graminum. Curr Microbiol 32:279–285.
67. Wilcox JL, Dunbar HE, Wolfinger RD, Moran NA (2003) Consequences of reductiveevolution for gene expression in an obligate endosymbiont. Mol Microbiol 48(6):1491–1500.
68. Kupper M, Gupta SK, Feldhaar H, Gross R (2014) Versatile roles of the chaperoninGroEL in microorganism-insect interactions. FEMS Microbiol Lett 353(1):1–10.
69. Frank SA (1997) Models of symbiosis. Am Nat 150(Suppl 1):S80–S99.70. Karlsson EK, Kwiatkowski DP, Sabeti PC (2014) Natural selection and infectious dis-
ease in human populations. Nat Rev Genet 15(6):379–393.71. Watanabe K, Yukuhiro F, Matsuura Y, Fukatsu T, Noda H (2014) Intrasperm vertical
symbiont transmission. Proc Natl Acad Sci USA 111(20):7433–7437.72. Frank SA (2012) Evolution: Mitochondrial burden on male health. Curr Biol 22(18):
R797–R799.73. Werren JH, Baldo L, Clark ME (2008) Wolbachia: Master manipulators of invertebrate
biology. Nat Rev Microbiol 6(10):741–751.74. Penz T, et al. (2012) Comparative genomics suggests an independent origin of cy-
toplasmic incompatibility in Cardinium hertigii. PLoS Genet 8(10):e1003012.75. Login FH, et al. (2011) Antimicrobial peptides keep insect endosymbionts under
control. Science 334(6054):362–365.76. Frank SA (2003) Perspective: Repression of competition and the evolution of co-
operation. Evolution 57(4):693–705.77. Corbett-Detig RB, Zhou J, Clark AG, Hartl DL, Ayroles JF (2013) Genetic incompatibilities
are widespread within species. Nature 504(7478):135–137.78. Moran NA, Yun Y (2015) Experimental replacement of an obligate insect symbiont.
Proc Natl Acad Sci USA 112(7):2093–2096.79. Fan Y, Wernegreen JJ (2013) Can’t take the heat: High temperature depletes bac-
terial endosymbionts of ants. Microb Ecol 66(3):727–733.80. Burke G, Fiehn O, Moran N (2010) Effects of facultative symbionts and heat stress on
the metabolome of pea aphids. ISME J 4(2):242–252.
81. Montllor CB, Maxmen A, Purcell AH (2002) Facultative bacterial endosymbiontsbenefit pea aphids Acyrthosiphon pisum under heat stress. Ecol Entomol 27(2):189–195.
82. Dunbar HE, Wilson ACC, Ferguson NR, Moran NA (2007) Aphid thermal tolerance isgoverned by a point mutation in bacterial symbionts. PLoS Biol 5(5):e96.
83. Burke GR, McLaughlin HJ, Simon J-C, Moran NA (2010) Dynamics of a recurrentBuchnera mutation that affects thermal tolerance of pea aphid hosts. Genetics186(1):367–372.
84. Wernegreen JJ (2012) Mutualism meltdown in insects: Bacteria constrain thermaladaptation. Curr Opin Microbiol 15(3):255–262.
85. McCutcheon JP, McDonald BR, Moran NA (2009) Convergent evolution of meta-bolic roles in bacterial co-symbionts of insects. Proc Natl Acad Sci USA 106(36):15394–15399.
86. Koga R, Moran NA (2014) Swapping symbionts in spittlebugs: Evolutionary re-placement of a reduced genome symbiont. ISME J 8(6):1237–1246.
87. Lamelas A, et al. (2011) Serratia symbiotica from the aphid Cinara cedri: A missinglink from facultative to obligate insect endosymbiont. PLoS Genet 7(11):e1002357.
88. Gómez-Valero L, et al. (2004) Coexistence of Wolbachia with Buchnera aphidicolaand a secondary symbiont in the aphid Cinara cedri. J Bacteriol 186(19):6626–6633.
89. Burke GR, Normark BB, Favret C, Moran NA (2009) Evolution and diversity of fac-ultative symbionts from the aphid subfamily Lachninae. Appl Environ Microbiol75(16):5328–5335.
90. Burke GR, Moran NA (2011) Massive genomic decay in Serratia symbiotica, a recentlyevolved symbiont of aphids. Genome Biol Evol 3:195–208.
91. Koga R, Bennett GM, Cryan JR, Moran NA (2013) Evolutionary replacement of ob-ligate symbionts in an ancient and diverse insect lineage. Environ Microbiol 15(7):2073–2081.
92. Urban JM, Cryan JR (2012) Two ancient bacterial endosymbionts have coevolvedwith the planthoppers (Insecta: Hemiptera: Fulgoroidea). BMC Evol Biol 12:87.
93. Toenshoff ER, Gruber D, Horn M (2012) Co-evolution and symbiont replacementshaped the symbiosis between adelgids (Hemiptera: Adelgidae) and their bacterialsymbionts. Environ Microbiol 14(5):1284–1295.
94. McCutcheon JP, von Dohlen CD (2011) An interdependent metabolic patchwork inthe nested symbiosis of mealybugs. Curr Biol 21(16):1366–1372.
95. Thao ML, Gullan PJ, Baumann P (2002) Secondary (gamma-Proteobacteria) endo-symbionts infect the primary (beta-Proteobacteria) endosymbionts of mealybugsmultiple times and coevolve with their hosts. Appl Environ Microbiol 68(7):3190–3197.
96. Rosenblueth M, Sayavedra L, Sámano-Sánchez H, Roth A, Martínez-Romero E (2012)Evolutionary relationships of flavobacterial and enterobacterial endosymbionts withtheir scale insect hosts (Hemiptera: Coccoidea). J Evol Biol 25(11):2357–2368.
97. Wu D, et al. (2006) Metabolic complementarity and genomics of the dual bacterialsymbiosis of sharpshooters. PLoS Biol 4(6):e188.
98. Dale C, Plague GR, Wang B, Ochman H, Moran NA (2002) Type III secretion systemsand the evolution of mutualistic endosymbiosis. Proc Natl Acad Sci USA 99(19):12397–12402.
99. Rosas-Pérez T, Rosenblueth M, Rincón-Rosales R, Mora J, Martínez-Romero E (2014)Genome sequence of “Candidatus Walczuchella monophlebidarum” the flavobacterialendosymbiont of Llaveia axin axin (Hemiptera: Coccoidea: Monophlebidae). GenomeBiol Evol 6(3):714–726.
100. Nakabachi A, et al. (2013) Defensive bacteriome symbiont with a drastically reducedgenome. Curr Biol 23(15):1478–1484.
101. Toju H, et al. (2010) “Candidatus Curculioniphilus buchneri,” a novel clade of bac-terial endocellular symbionts from weevils of the genus Curculio. Appl EnvironMicrobiol 76(1):275–282.
102. Conord C, et al. (2008) Long-term evolutionary stability of bacterial endosymbiosis incurculionoidea: Additional evidence of symbiont replacement in the dryophthoridaefamily. Mol Biol Evol 25(5):859–868.
103. Kuo C-H, Moran NA, Ochman H (2009) The consequences of genetic drift for bac-terial genome complexity. Genome Res 19(8):1450–1454.
104. Nachman MW (1998) Deleterious mutations in animal mitochondrial DNA. Genetica102-103(1-6):61–69.
105. Hill JH, Chen Z, Xu H (2014) Selective propagation of functional mitochondrial DNAduring oogenesis restricts the transmission of a deleterious mitochondrial variant.Nat Genet 46(4):389–392.
106. Kjeldsen KU, et al. (2012) Purifying selection and molecular adaptation in the ge-nome of Verminephrobacter, the heritable symbiotic bacteria of earthworms. Ge-nome Biol Evol 4(3):307–315.
107. Lund MB, Kjeldsen KU, Schramm A (2014) The earthworm-Verminephrobactersymbiosis: An emerging experimental system to study extracellular symbiosis. FrontMicrobiol 5:128.
108. Nikoh N, Hosokawa T, Oshima K, Hattori M, Fukatsu T (2011) Reductive evolution ofbacterial genome in insect gut environment. Genome Biol Evol 3:702–714.
10176 | www.pnas.org/cgi/doi/10.1073/pnas.1421388112 Bennett and Moran