universidade de lisboarepositorio.ul.pt/bitstream/10451/2588/1/ulfc090566_tm_d_alves.pdf · de um...
TRANSCRIPT

UNIVERSIDADE DE LISBOA
FACULDADE DE CIÊNCIAS
DEPARTAMENTO DE BIOLOGIA VEGETAL
The role of fitness frequency-dependent in the evolution of
antibiotic resistance
Diana Ribeiro Alves
Mestrado em Microbiologia Aplicada
2010
UNIVERSIDADE DE LISBOA
FACULDADE DE CIÊNCIAS
DEPARTAMENTO DE BIOLOGIA VEGETAL
The role of fitness frequency-dependent in the evolution of
antibiotic resistance
Diana Ribeiro Alves
Dissertação orientada por
Prof. Doutor Francisco Dionísio
Doutora Ana Rita Ponce
Mestrado em Microbiologia Aplicada
2010
i
ACKNOWLEDGMENTS
I want to express my sincere gratitude to all the people that contributed to the
success of this work, especially to:
- Francisco Dionísio, for giving me the opportunity to develop my Master´s Thesis in
his research group, for being a great supervisor and for being always extremely
supportive.
- Ana Rita Ponce, for her constant motivation, suggestions and advice that
improved this project.
- Professor Ana Reis, for her kind support and encouragement and especially for
her outstanding help in finding a research group for the Leonardo da Vinci
fellowship.
- Silvia Mendonça and Rui Silva, for being always ready to help and support me
and, most importantly, for being excellent friends. A special thanks to Silvia for her
critical proofreading of this thesis.
- Evolutionary Ecology of Microorganisms group members, for their share of
knowledge, support and contribution to a good working environment.
- My family and friends for all their invaluable support and love.
ii
ABSTRACT
Antibiotic resistance is, usually, associated with fitness costs for the bacteria. Therefore,
it is expected that if one competes a resistant bacterial strain with an otherwise isogenic
susceptible strain in an antibiotic free environment, resistant bacteria will be eliminated.
Here, I report the occurrence of stabilizing frequency-dependent selection in 43% of a set of
antibiotic resistant strains. Stabilizing frequency-dependent selection may promote the
maintenance of a stable polymorphism between resistant and susceptible bacteria. If
resistant bacteria are rare, their fitness is higher than that of the susceptible strain. If
resistant bacteria are the majority in the competition assay, their fitness is smaller than that
of the susceptible strain. This enables a stable coexistence between sensitive and resistant
strains. Genetic and ecological causes of frequency-dependent selection were investigated.
The demonstration of frequency-dependent selection involving drug resistance strains
implies that antibiotic resistant bacteria will not be easily eliminated or reversed upon
reduction of antibiotic use. This reveals a worrying scenario for the eradication of antibiotic
resistance.
Keywords: Antibiotic Resistance, Fitness Cost of Resistance, Bacteria, Competition,
Frequency-Dependent Selection, Coexistence.
iii
RESUMO
Durante muito tempo foi admitido que as populações bacterianas seriam mantidas num
estado monomórfico devido a dois fenómenos: competição exclusiva e selecção periódica.
O principio da exclusão competitiva refere que duas ou mais espécies que competem pelos
mesmos recursos não podem coexistir, uma vez que a espécie mais eficiente irá eliminar
gradualmente todas as outras (Hardin, 1960). O processo de selecção periódica, em que a
evolução de populações bacterianas num recurso limitante consiste numa série temporal de
substituições por genótipos cada vez com maior sucesso reprodutivo ou fitness, é
responsável por eliminar toda a variabilidade genética (Atwood, et al., 1951, Levin, 1981). A
existência de polimorfismos seria, então, apenas uma etapa transitória no processo
evolutivo.
Contudo, o processo de competição entre espécies é muito mais complexo. O ambiente
dos organismos, biótico e físico, é heterogéneo espacial e temporalmente. Portanto, as
frequências dos diferentes genótipos numa população estão continuamente a sofrer
alterações. Ao mesmo tempo, existem mecanismos responsáveis pela manutenção de
polimorfismos nas populações bacterianas. A selecção dependente da frequência é um
desses mecanismos.
A selecção dependente da frequência já foi observada em organismos como Drosophila
(Ayala, 1971), Escherichia coli (Levin, 1972, Helling, et al., 1987) e em vírus (Elena, et al.,
1997, Yuste, et al., 2002). Num sistema biológico, em que a selecção dependente da
frequência actua, o sucesso reprodutivo de um organismo está dependente da sua
frequência. Este mecanismo pode resultar em dois cenários diferentes. Assim sendo, a
selecção pode favorecer o genótipo mais comum, definindo-se como selecção dependente
da frequência disruptiva. Por outro lado, se a selecção favorecer o genótipo mais raro, então
estamos perante selecção dependente da frequência estabilizante.
A selecção dependente da frequência disruptiva leva à eliminação de polimorfismos na
população. Um genótipo, mesmo possuindo uma qualquer vantagem, apenas será
seleccionado face a outro genótipo se a sua frequência se encontrar acima de um certo
valor (Levin, 1988). Caso contrário, o genótipo é eliminado.
A selecção dependente da frequência estabilizante, sobre a qual nos iremos focar neste
trabalho, resulta num ponto de equilíbrio que permite a coexistência estável entre os
genótipos. Se a frequência de um dos genótipos está abaixo do equilíbrio estável, o seu
fitness relativamente ao outro genótipo será maior, permitindo-lhe aumentar a sua
frequência. Se a sua frequência estiver acima do ponto de equilíbrio, o seu fitness será
menor do que o outro genótipo em competição, e consequentemente irá ocorrer uma
iv
redução do seu número. No ponto de equilíbrio o fitness de ambos os genótipos é idêntico,
levando a um polimorfismo estável. Vários estudos demonstram a coexistência de genótipos
diferentes mesmo em ambientes simples. Algumas sugestões foram sendo dadas na
tentativa de explicar os mecanismos ecológicos que permitem a coexistência:
(i) Trade-off demográfico, em que cada genótipo é especializado num diferente nicho
ecológico (Levin, 1972, Helling, et al., 1987, Turner, et al., 1996, Rozen & Lenski, 2000). Por
exemplo, um dos genótipos possui um maior fitness quando a glucose no meio é abundante,
enquanto o outro genótipo possui um fitness mais elevado quando a glucose é escassa
(Turner, et al., 1996);
(ii) Cross-feeding, em que o genótipo com maior sucesso excreta um metabolito
resultante do seu metabolismo ou morte celular para o meio. O segundo genótipo é eficiente
a utilizar este metabolito (Turner, et al., 1996, Rozen & Lenski, 2000);
(iii) Interacção antagonista, em que durante a fase estacionária um dos genótipos
devido a uma mutação ou a um efeito pleiotrópico de uma mutação é capaz de inibir o
genótipo mais frequente, interferindo com o seu crescimento máximo (Lemonnier, et al.,
2008).
Os mecanismos ecológicos acima descritos não se excluem entre si. Aliás, a ocorrência
de um trade-off demográfico está geralmente associado a uma interacção por cross-feeding
(Rosenzweig, et al., 1994, Turner, et al., 1996).
No presente estudo demonstro a ocorrência de selecção dependente da frequência em
bactérias resistentes a antibióticos.
A resistência aos antibióticos pode resultar de mutações genéticas e/ou aquisição de
determinantes de resistência por transferência horizontal de genes (revisto emMartinez, et
al., 2009). As mutações que conferem resistência podem alterar processos fisiológicos da
célula (Andersson & Levin, 1999). De forma similar, quando a resistência está localizada em
elementos genéticos móveis (plasmídeos, integrões ou transposões), a replicação e
expressão dos seus genes é responsabilidade da bactéria hospedeira. Tal irá interferir no
crescimento normal da bactéria (Bjorkman & Andersson, 2000). Assim, um fenótipo
resistente acarreta na maioria das vezes, custos para a bactéria, fazendo com que sofra
uma diminuição do seu fitness (Andersson, 2006). Neste trabalho, utilizei bactérias
resistentes a três antibióticos diferentes: ácido nalidíxico, rifampicina e estreptomicina. Para
estes antibióticos a resistência é causada por mutações cromossomais em genes envolvidos
na replicação (Marcusson, et al., 2009) , transcrição (Reynolds, 2000) e tradução (Kurland,
et al., 1996), respectivamente.
Estudos anteriores têm demonstrado que, face às alterações fisiológicas inerentes à
resistência, bactérias resistentes em competição com bactérias sensíveis e na ausência de
antibióticos, possuem uma desvantagem competitiva (Gillespie, 2001, Trindade, et al.,
v
2009). Deste modo, a simples redução no uso de antibióticos deveria erradicar o grave
problema das resistências aos antibióticos. Ou seja, as estirpes resistentes seriam
eliminadas. Contudo, o cenário apresenta-se muito mais complexo (Johnsen, et al., 2009).
Existem vários processos que permitem manter bactérias resistentes na população ao
reduzirem ou eliminarem o custo provocado pelas mesmas: mutações compensatórias
(Bjorkman & Andersson, 2000), epistasia entre resistências a antibióticos (Trindade, et al.,
2009), mutações sem custo (Ramadhan & Hegedus, 2005, Criswell, et al., 2006) e co-
selecção de resistências a antibióticos (Enne, et al., 2004, Andersson & Hughes, 2010). A
ocorrência de selecção dependente da frequência aqui apresentada poderá ser um outro
fenómeno.
Os resultados aqui apresentados mostram que 13 dos 30 clones espontâneos (43%)
resistentes a antibióticos testados apresentam um fenótipo de dependência na frequência
quando em competição com um clone sensível. É de notar que, para as mesmas mutações
pontuais nos genes envolvidos na resistência ao antibiótico respectivo, os clones resistentes
apresentavam um comportamento diferente durante a competição. Isto sugere que o
fenótipo para a dependência na frequência seria causado, não pelas mutações para a
resistência, mas por outra qualquer mutação a ocorrer no cromossoma. Contudo, tal
hipótese não ficou demonstrada.
Relativamente, ao mecanismo ecológico responsável pela dependência na frequência
sugeri a ocorrência de um cross-feeding ou uma interacção antagonista. Relativamente, ao
cross-feeding os resultados não foram esclarecedores. No entanto, a hipótese de uma
interacção antagonista, apesar de ainda não testada, aponta-se esclarecedora: os clones
resistentes seriam portadores de uma mutação capaz de inibir os clones sensíveis através
de um contacto célula a célula.
Os resultados mostram uma incidência elevada de selecção dependente da frequência
(43%) nos clones resistentes aos antibióticos. Tal incidência pode ser reflexo do método
utilizado para selecção dos clones, o qual poderá estar a favorecer a selecção de clones
com estas características. Apesar desta hipótese não estar ainda esclarecida, e portanto,
desconhecermos se a selecção dependente da frequência tem uma baixa ou elevada
incidência nas populações bacterianas resistentes, este estudo vem reforçar que a simples
redução ou mesmo eliminação do uso de antibióticos não é uma medida eficaz no combate
às resistências aos antibióticos. A ocorrência de selecção dependente da frequência em
bactérias resistentes irá possibilitar a sua manutenção nas populações bacterianas, mesmo
em baixas frequências. Assim que se reintroduzir novamente o antibiótico a resistência irá
emergir em larga escala (De Gelder, et al., 2004).
A selecção dependente da frequência deve ser um mecanismo considerado no estudo
das dinâmicas das populações bacterianas e, em particular, nas populações resistentes aos
vi
antibióticos. Deste modo, torna-se necessário o desenvolvimento de novas terapêuticas
alternativas aos antibióticos no combate às infecções bacterianas. Tal necessidade está na
base do recente desenvolvimento de terapêuticas profiláticas, tais como a interferência
bacteriana, vacinas bacterianas e a terapia fágica.
Palavras-Chave: Resistência a Antibióticos, Custo de Fitness da Resistência, Bactéria,
Competição, Selecção Dependente da Frequência, Coexistência.
vii
INDEX
ACKNOWLEDGMENTS ............................................................................................................................. i
ABSTRACT .............................................................................................................................................. ii
RESUMO ................................................................................................................................................ iii
I – INTRODUCTION ................................................................................................................................. 1
1 COMPETITIVE EXCLUSION PRINCIPLE ........................................................................................ 1
2 FREQUENCY-DEPENDENT SELECTION ....................................................................................... 1
2.1 DISRUPTING FREQUENCY-DEPENDENT SELECTION .......................................................... 2
2.2 STABILIZING FREQUENCY-DEPENDENT SELECTION .......................................................... 3
3 ANTIBIOTIC RESISTANCE............................................................................................................ 5
3.1 MECHANISMS RESPONSIBLE FOR ANTIBIOTIC RESISTANCE ............................................. 6
3.2 BIOLOGICAL COSTS OF RESISTANCE ................................................................................. 6
3.3 COMPENSATORY EVOLUTION ............................................................................................ 7
3.4 EPISTASIC INTERACTIONS BETWEEN ANTIBIOTIC RESISTANCES ...................................... 8
3.5 COST-FREE MUTATIONS .................................................................................................... 8
3.6 CO-SELECTION OF ANTIBIOTIC RESISTANCE ..................................................................... 9
4 OBJECTIVES ............................................................................................................................... 9
II – MATERIALS AND METHODS ........................................................................................................... 10
1. BACTERIAL STRAINS AND GROWTH CONDITIONS .................................................................. 10
2. SELECTION OF SPONTANEOUS ANTIBIOTIC RESISTANT CLONES .......................................... 10
3. COMPETITION ASSAYS ............................................................................................................ 12
4. SCREENING FOR MUTATOR PHENOTYPES ............................................................................. 13
5. BACTERIAL GROWTH IN SUPERNATANT PREPARATIONS ....................................................... 13
6. DEVELOPMENT OF AN EXPERIMENTAL PROTOCOL TO UNDERSTAND THE ORIGIN OF CLONES
WITH HIGH FITNESS WHEN RARE ..................................................................................................... 14
7. ESTIMATION OF FITNESS ......................................................................................................... 14
8. STATISTICAL AND MATHEMATICAL ANALYSIS .......................................................................... 15
III – RESULTS ....................................................................................................................................... 16
1 DEMONSTRATION OF FREQUENCY-DEPENDENCY IN SPONTANEOUS ANTIBIOTIC RESISTANT
CLONES ............................................................................................................................................ 16
1.1 COMPETITIONS 1:105 OF RESISTANT TO WILD-TYPE CELLS ........................................... 16
1.2 COMPETITIONS 1:1 OF RESISTANT AND WILD-TYPE CELLS ............................................. 21
1.3 COMPETITIONS 1:1 OF RESISTANT AND ΔARA CELLS ..................................................... 22
viii
1.4 COMPETITIONS 1:102 OF ΔARA TO RESISTANT CELLS .................................................... 22
1.5 FREQUENCY-DEPENDENT FITNESS OF NAL48 CLONE .................................................... 24
1.6 EVIDENCE FOR ANOTHER MUTATION OCCURRING IN THE CHROMOSOME...................... 25
2 SCREENING FOR MUTATORS ................................................................................................... 26
3 TESTING IF ANOTHER MUTATION IS OCCURRING ELSEWHERE IN THE CHROMOSOME ........... 27
4 TESTING THE OCCURRENCE OF CROSS-FEEDING INTERACTION ............................................ 28
5 EVALUATION OF RESISTANT CLONES SELECTION METHOD .................................................... 28
IV – DISCUSSION ................................................................................................................................. 32
V – CONCLUSION ................................................................................................................................. 37
VI – REFERENCES ............................................................................................................................... 38
I – INTRODUCTION
1
I – INTRODUCTION
1 COMPETITIVE EXCLUSION PRINCIPLE
Can two or more related species coexist when competing for the same limited
resources? The question has been debated for a long time. Gause‟s principle, or principle of
competitive exclusion, states that species using the same resource cannot coexist. The
reason is that the more efficient species will gradually increase over the competition and
displace the less efficient (Hardin, 1960). Given that bacteria reproduce asexually, it is
generally assumed that their evolution in a limiting resource will consist of a temporal series
of replacements by ever more fit genotypes, via the process of periodic selection, eliminating
all genetic variability (Atwood, et al., 1951, Levin, 1981). Therefore, the existence of
polymorphisms would be a process, only transitive, for evolution. So, natural populations
should be maintained monomorphic via these two phenomena: periodic selection and
competitive exclusion.
However, Gause‟s principle ignores the complexities of the competition process. In fact,
the environment of organisms, physical and biotic, is heterogeneous both spatially and
temporally. So, the frequencies of genotypes in a population are continually changing. At the
same time, mechanisms responsible for the maintenance of polymorphisms are acting in
bacterial populations. Frequency-dependent selection is one of those mechanisms.
2 FREQUENCY-DEPENDENT SELECTION
Frequency-dependent selection phenomena have been demonstrated to occur in very
different organisms, such as Drosophila (Wright & Dobzhansky, 1946, Ayala, 1971),
Escherichia coli (Chao, et al., 1977, Helling, et al., 1987), vesicular stomatitis (VSV) and
human immunodeficiency type 1 (HIV-1) viruses (Elena, et al., 1997, Yuste, et al., 2002). It
has been hypothesized that frequency-dependent selection occurs in natural populations
(Ayala & Campbell, 1974, Hori, 1993). However, model organisms with short generation
time, large population size and the possibility to control environmental factors, allow studying
more precisely the phenomenon of frequency-dependent selection.
In a biological system where there is frequency-dependent selection, the fitness of a
given organism depends on its frequency. If selection favors the most common genotype it is
called disrupting frequency-dependent selection. If selection favors the rare genotype over a
I – INTRODUCTION
2
frequent one it is called stabilizing frequency-dependent selection. The latter will result in the
maintenance of genetic variability in a population [containing at least one stable equilibrium].
2.1 DISRUPTING FREQUENCY-DEPENDENT SELECTION
Disrupting frequency-dependent selection implies that there is no internal stable
equilibrium in the population and only the most common genotype will be selected.
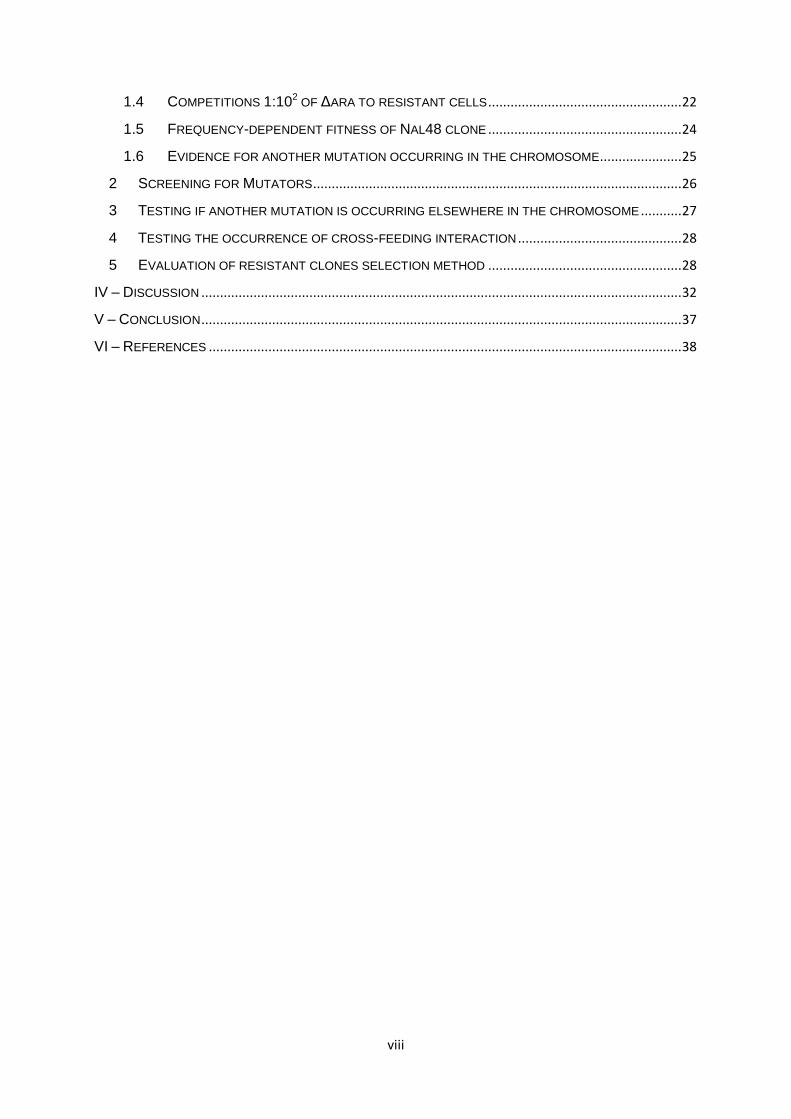
A good example for disrupting frequency-dependent selection in bacterial populations is
the competition between bacteria producing allelopathic molecules and a sensitive one.
Allelopathic molecules are capable of killing or inhibiting the growth of competing bacteria,
including antibiotics, bacteriocins (Reeves, 1972) and temperate bacteriophages (Levin &
Lenski, 1983, Stewart & Levin, 1984). Competitions between bacteriocin sensitive and
bacteriocin-producing E. coli in liquid media have demonstrated that the latter only invade the
population if it is above frequency on the order of 10-2 (Chao & Levin, 1981). In other words,
only when bacteriocin-producing bacteria are in a high frequency, they will able to invade
[where their quantity is sufficient to produce enough bacteriocin to overcome the growth rate
disadvantage of its production]. If not, bacteriocin-producing bacteria will be gradually
eliminated due to its growth disadvantage (Figure 1).
Figure 1: Changes in frequency of colicinogenic bacteria competing with sensitive bacteria in liquid
medium cultures (adapted from Chao & Levin, 1981).
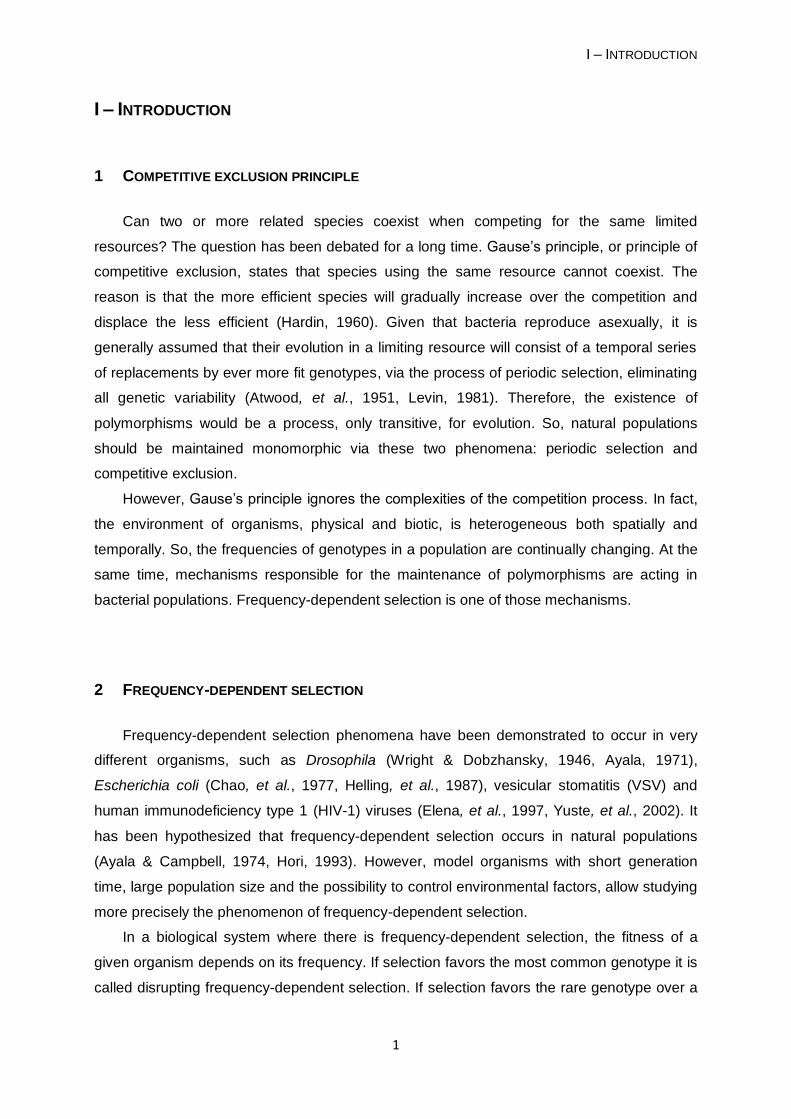
Another example for disrupting frequency-dependent selection involves bacterial toxin-
antitoxin (TA) gene systems. TA systems code for a stable toxin that kills or inhibits their own
cell, and an unstable antitoxin which counteracts the toxin‟s effect. The toxin is always a
protein. The antitoxin can be: (i) an antisense small RNA complementary to the toxin mRNA
(type I) inhibiting its translation or (ii) a protein capable of neutralizing the toxin through
formation of a proteic complex (type II). These systems are widely distributed in Bacteria and
Archaea (Gerdes, 2000) and are found both in plasmids and in chromosomes (Gerdes, et al.,
I – INTRODUCTION
3
2005, Pandey & Gerdes, 2005). The presence of TA systems in plasmids, especially those
with low-copy number, contributes to plasmid maintenance in growing bacterial populations.
Plasmid-free daughter cells are selectively eliminated by post-segregational killing. This
elimination occurs after cell division. The antitoxin is unstable and easily degraded by
cytoplasmatic proteases. Without its replacement, because the plasmid is lost, the toxin may
act (Jaffe, et al., 1985). Conjugative plasmids with TA loci (TA+) have the ability to invade a
bacterial population of the same incompatibility group carrying plasmids without TA loci (TA-).
This means that, within-cell plasmid competition between TA+ e TA- will provide an
advantage to TA+ plasmids (Figure 2) (Cooper & Heinemann, 2000, Cooper & Heinemann,
2005). In liquid cultures where all resources are distributed to all surviving bacteria, TA
plasmids would only have an advantage when their initial frequency is high enough to
overcome the costs for the host of carrying it. If not, the TA plasmids are unable to invade
and tend to extinction (Cooper & Heinemann, 2005).
Figure 2: Advantage conferred to bacteria carrying a TA plasmid. (A) Vertical transmission.
Prevalence of TA plasmids is increased by post-segregational killing of plasmid-free daughter
bacteria. (B) Horizontal transmission. Plasmid-plasmid competition gives an advantage to TA+ plasmid
that outcompete TA- plasmid. Bacteria that lose TA+ plasmid are killed. On the contrary, bacteria that
lose TA- plasmid suffer no damage. Bacterial dead (grey), TA+ plasmid (purple) and TA
- plasmid
(black) (adapted from Van Melderen & Saavedra De Bast, 2009).
2.2 STABILIZING FREQUENCY-DEPENDENT SELECTION
Stabilizing frequency-dependent selection occurs when the fitness of a genotype is
higher when that genotype is rare relative to other genotype. This selection results in a stable
coexistence. The system is stable because the competitive fitness of one genotype relative
to the other is smaller when its frequency is above the equilibrium point and greater when its
frequency is below the equilibrium. At the equilibrium frequency, the competitive fitness of
the two genotypes is identical.
A B
I – INTRODUCTION
4
In natural bacterial populations, one can find some examples of stabilizing frequency
dependence selection. One example refers to bacteria capable of neutralizing compounds
that kill or inhibit cell growth and cell division (like antibiotics or heavy metals). These
bacteria reduce the concentration of those toxic compounds in the environment.
Consequently, susceptible bacteria that have disadvantage due to the presence of the toxin
are only capable of invading and maintaining in a population where resistant cells are
present. When this happens, both bacteria will eventually reach a stable equilibrium. In that
equilibrium, the disadvantage of resistant bacteria owing to costs associated to neutralization
of the toxin is overcome by its resistance; and the advantage of susceptible bacteria is
counterbalanced by dead due to toxin‟s action. In a theoretical study, Lenski and Hatting
showed that E. coli strains carrying a chloramphenicol resistant (Cmr) plasmid and plasmid-
free strains: (i) in an environment without chloramphenicol, Cmr plasmid reduced the fitness
of the host bacterium relative to plasmid-free bacteria; (ii) in an environment with
chloramphenicol, plasmid-free cells were unable to maintain if resistant ones were not
present. However, if plasmid-free bacteria were introduced, at low frequencies, into resistant
bacteria cultures with chloramphenicol, plasmid-free bacteria were able to invade and
maintain a stable equilibrium with the resistant population (Lenski & Hattingh, 1986). In
another theoretical model, presence of beta-lactamase producing bacteria in an environment
with the antibiotic (ampicillin) allowed sensitive bacteria to survive at low frequencies.
Sensitive bacteria were regarded as cheaters, because they do not harbor a cost from beta-
lactamase production, taking advantage from the producing-bacteria (Domingues, 2010).
Besides the biological system above there are several experimental works, mostly done
with E. coli showing that different genotypes are able to maintain ecologically relevant
genetic diversity even in simple environments (Levin, 1972, Helling, et al., 1987, Turner, et
al., 1996, Rozen & Lenski, 2000).
In attempting to explain the observation of coexistence in simple environments, some
hypotheses have been suggested:
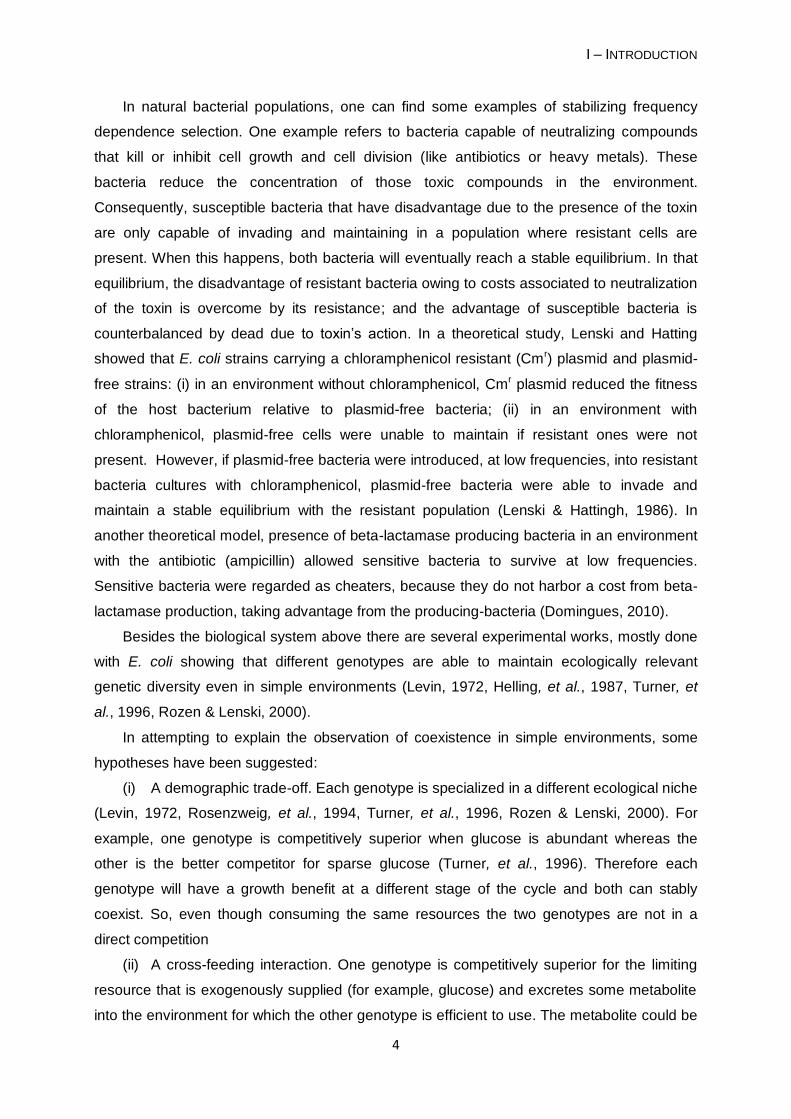
(i) A demographic trade-off. Each genotype is specialized in a different ecological niche
(Levin, 1972, Rosenzweig, et al., 1994, Turner, et al., 1996, Rozen & Lenski, 2000). For
example, one genotype is competitively superior when glucose is abundant whereas the
other is the better competitor for sparse glucose (Turner, et al., 1996). Therefore each
genotype will have a growth benefit at a different stage of the cycle and both can stably
coexist. So, even though consuming the same resources the two genotypes are not in a
direct competition
(ii) A cross-feeding interaction. One genotype is competitively superior for the limiting
resource that is exogenously supplied (for example, glucose) and excretes some metabolite
into the environment for which the other genotype is efficient to use. The metabolite could be
I – INTRODUCTION
5
a result of cell metabolism or a by-product from dead cells. If the amount of the metabolite is
proportional to the density of the genotype that is producing it, the rare genotype will benefit.
Likewise, the frequent competitor will also benefit when rare because it is more efficient to
use the limiting resource, having a higher fitness. Thus, the relative fitnesses of both
genotypes will be decreasing functions of their own frequencies, because each has an
advantage when rare (Turner, et al., 1996, Rozen & Lenski, 2000);
(iii) An antagonistic interaction. During stationary-phase a genotype carrying a mutation
or a pleiotropic effect of a mutation is able to inhibit or kill the other genotype. Such
interaction was defined as stationary phase contact-dependent inhibition (SCDI) (Lemonnier,
et al., 2008). The inhibition does not occur until bacteria are at (or close to) stationary phase
and the total cell density being sufficiently high. Hence, rare SCDI-bacteria are able to
increase in frequency by directly decreasing frequency of the other competitor. In that study,
the SCDI phenomenon was attributed to mutations in glgC, which codes for a regulatory
enzyme that catalyzes the first reaction of bacterial glycogen synthesis (Ballicora, et al.,
2003).
The above three hypotheses do not exclude each other and stable coexistence could be
explained by all of them simultaneously. It is important to emphasize that these stable
equilibria will eventually change or disappear. Over generations, environment could change
and/or mutations will constantly arise and allow the fixation of beneficial mutations. One
genotype will be allowed to win the competition by displacing the other, or both genotypes
will coexist in a different stable equilibrium.
In the present study, I attempt to understand if stabilizing frequency-dependent selection
is acting in antibiotic resistant bacterial populations.
3 ANTIBIOTIC RESISTANCE
The widespread use of antibiotics in past decades to treat bacterial infectious diseases
has greatly assisted the improvement of modern medicine. However, their extensive usage
sometimes without rule was responsible for the considerable selection and spread of
antibiotic resistant bacteria in both hospital and community settings (Reichler, et al., 1992,
Mulvey & Simon, 2009). This scenario imposes a serious problem for public health. Bacterial
pathogens are now widely resistant to common antibiotics and new developing drugs
became quickly ineffective (Woodford & Livermore, 2009).
I – INTRODUCTION
6
3.1 MECHANISMS RESPONSIBLE FOR ANTIBIOTIC RESISTANCE
Antibiotic resistance occurs by genetic mutations and/or acquisition of horizontal gene
transfer (HGT) of resistant determinants (for review Martinez, et al., 2009). The rate of
formation of resistant bacteria will be determined by the bacteria mutation rate, the biological
cost of resistance (Andersson & Levin, 1999) and the rate of antibiotic use (Lipsitch & Levin,
1997). DNA repair systems assure that mutation rate is kept low. However, the mutation rate
is greatly determined by the presence of mutator strains. Mutator strains are characterized by
increased mutations rates (Oliver, et al., 2000) and recombination frequencies (Matic, et al.,
1995) due to a defective methyl-directed mismatch DNA repair (MMR) system (Matic, et al.,
1997, Oliver, et al., 2000). The presence of mutators strain in a population will contribute to
the emergence of resistant bacteria (Oliver, et al., 2000).
Resistance genes may be found on transferable genetic elements, such as plasmids,
transposons or integrons. These elements can spread very fast in bacterial populations,
consequently, being fundamental in bacterial genome evolution (Frost, et al., 2005) and in
antibiotic resistance dissemination (Whittle, et al., 2002, Bennett, 2008).
The most common mechanisms for antibiotic resistance are the following (Walsh, 2000):
(i) alteration of antibiotic target, (ii) enzymatic modification and degradation of the antibiotic or
(iii) drug efflux or reduced membrane permeability to prevent antibiotic entry into the cell.
3.2 BIOLOGICAL COSTS OF RESISTANCE
Mutations conferring resistance may disrupt normal physiological processes in the cell.
Examples include inhibition of bacterial cell wall synthesis, protein synthesis or nucleic acid
replication (Andersson & Levin, 1999). Moreover, if resistance is located in a mobile genetic
element, as bacteria are responsible for their replication and gene expression, these
elements may interfere with the normal cell growth (Bjorkman & Andersson, 2000). As a
consequence, antibiotic resistance is usually associated with fitness costs (Lenski, 1998,
Andersson, 2006, Gagneux, et al., 2006, Andersson & Hughes, 2010), which can be
reflected in a lower growth rate and virulence.
In the present study, I will focus on chromosomal mutations. Strains harboring resistance
mutations in the rpoB, rpsL and gyrA genes were used. Mutations in the rpoB gene, which
codes for RNA polymerase β-subunit, confer resistance to rifampicin in E. coli. Those
mutations exhibit reduced efficiency of the transcription (Reynolds, 2000). Mutations on rpsL
gene, which codes for the S12 ribosomal protein, are responsible for resistance to
streptomycin in E. coli. In these resistant bacteria a diminished translational rate is observed
I – INTRODUCTION
7
(Kurland, et al., 1996). Mutations in gyrA gene, which confer resistance to quinolones, result
in alterations in DNA supercoiling. Such alterations give rise to disturbed patterns of
transcriptional regulation in E. coli (Marcusson, et al., 2009).
In previous studies it has been demonstrated that, in the absence of antibiotic selective
pressure, resistant bacteria have a fitness cost, being in disadvantage compared to their
counterpart antibiotic-sensitive bacteria (Lenski, 1998, Gillespie, 2001). For this reason it is
not clear why resistant bacteria are not eliminated or reverse to a susceptible phenotype
upon antibiotic control strategies, i.e. reduction of antibiotic prescription (Johnsen, et al.,
2009).
There are four known processes for stability of resistance caused by chromosomal
mutation(s) which reduce/eliminate the cost of resistance and make reversion a less
probable event: compensatory mutations, epistasic interaction between antibiotic
resistances, cost-free mutations and co-selection.
3.3 COMPENSATORY EVOLUTION
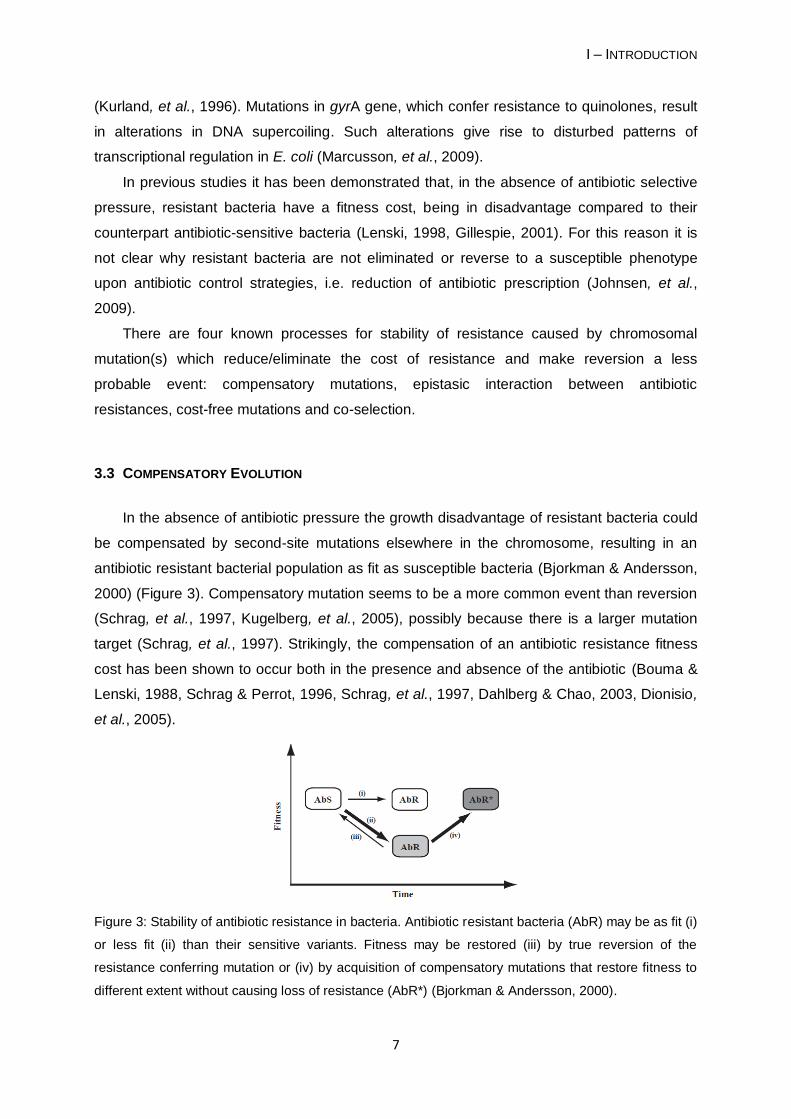
In the absence of antibiotic pressure the growth disadvantage of resistant bacteria could
be compensated by second-site mutations elsewhere in the chromosome, resulting in an
antibiotic resistant bacterial population as fit as susceptible bacteria (Bjorkman & Andersson,
2000) (Figure 3). Compensatory mutation seems to be a more common event than reversion
(Schrag, et al., 1997, Kugelberg, et al., 2005), possibly because there is a larger mutation
target (Schrag, et al., 1997). Strikingly, the compensation of an antibiotic resistance fitness
cost has been shown to occur both in the presence and absence of the antibiotic (Bouma &
Lenski, 1988, Schrag & Perrot, 1996, Schrag, et al., 1997, Dahlberg & Chao, 2003, Dionisio,
et al., 2005).
Figure 3: Stability of antibiotic resistance in bacteria. Antibiotic resistant bacteria (AbR) may be as fit (i)
or less fit (ii) than their sensitive variants. Fitness may be restored (iii) by true reversion of the
resistance conferring mutation or (iv) by acquisition of compensatory mutations that restore fitness to
different extent without causing loss of resistance (AbR*) (Bjorkman & Andersson, 2000).
I – INTRODUCTION
8
Compensatory mutations can occur by different mechanisms. The most common is the
restoration of the structure and function of an altered RNA or protein by intragenic (Hanson,
et al., 1993, Reynolds, 2000, Nagaev, et al., 2001) or extragenic (Bjorkman, et al., 1998,
Maisnier-Patin, et al., 2007) mutations.
3.4 EPISTASIC INTERACTIONS BETWEEN ANTIBIOTIC RESISTANCES
Epistasis occurs when two or more genes interact with each other resulting in a
phenotypically different scenario then if they were acting independently. There are epistasic
gene interactions between different antibiotic resistance genes. If different antibiotic
mutations enhance each other‟s costs it is defined as synergistic. If antibiotic mutations mask
each other‟s costs, it is defined antagonistic. In the former case, synergistic interactions will
constrain evolution of multiple drug resistance by aggravating its costs. In the latter case
antagonistic interactions will promote stability of multidrug-resistant bacteria by reducing its
costs. Many studies in this area have found that epistasis tends to be antagonistic (Trindade,
et al., 2009, Ward, et al., 2009) and recently a similar epistasis study between antibiotic
resistance mutations occurring in the chromosome and in a plasmid has revealed the same
trend (Silva, 2010). These findings suggest that epistasis interactions between antibiotic
resistances have a key role in the evolution and could explain the difficulties to eliminate
multidrug resistant bacteria, as in the case of Mycobacterium tuberculosis (Santos, et al.,
2010) or methicillin-resistant Staphylococcus aureus (MRSA) (Rodriguez-Noriega, et al.,
2010).
3.5 COST-FREE MUTATIONS
Cost-free mutations refer to the occurrence of resistance mutations that confer no fitness
costs, therefore reducing the driving force for reversibility. Such mutations have been found
for several types of antibiotics and bacterial species (Ramadhan & Hegedus, 2005, Criswell,
et al., 2006). For instance, substitutions in the 30S ribosomal protein S12, which confer
resistance to streptomycin, seems to be a no-cost mutation in E. coli and Salmonella
typhimurium (Kurland, et al., 1996). It should be noted that methods used to measure fitness
costs might not detect the lower ones. So, it could appear that certain mutations do not
harbor fitness cost. However, those mutations may reduce growth of bacteria in other
environments.
I – INTRODUCTION
9
3.6 CO-SELECTION OF ANTIBIOTIC RESISTANCE
Co-selection appears mainly in two different scenarios. First, a genetic linkage between
a resistance gene and other genetic marker under selection could occur. Therefore, a costly
resistance mutation could be maintained in the population (Enne, et al., 2004). Second,
resistance to one antibiotic could lead to resistance of antibiotics with a similar structure. If
different variants of an antibiotic are used in two different environments [for example, in
agriculture and in veterinary] that have different antibiotic control strategies, acquisition of
resistance in one environment may develop resistance in the other environment (Andersson
& Hughes, 2010).
4 OBJECTIVES
This study aims to demonstrate the occurrence of frequency-dependent selection in
antibiotic resistant bacteria. To measure the cost of resistance, competitions experiments are
usually performed between resistant and sensitive bacteria in a 1:1 proportion (for example
Bjorkman & Andersson, 2000, Trindade, et al., 2009). Nevertheless, only rarely would
resistant and sensitive bacteria would be present in a similar proportion in natural
environments. Moreover, their proportions are in constant fluctuation. For example, the
migration of antibiotic resistant bacteria to antibiotic-free environments, that will result in a
lower frequency of the resistant bacteria. Therefore, I performed competitions in antibiotic
free environment between spontaneous antibiotic resistant and sensitive clones at different
proportions.
I tried to understand if the genetic cause of the frequency-dependent phenotype is a
result of a second chromosomal mutation, besides the antibiotic resistance mutation. Then, I
tried to determine if a cross-feeding interaction could be the ecological mechanism
underlying frequency-dependent selection.
Finally, I developed an experimental protocol to understand the origin of clones with high
fitness when rare.
II – MATERIALS AND METHODS
10
II – MATERIALS AND METHODS
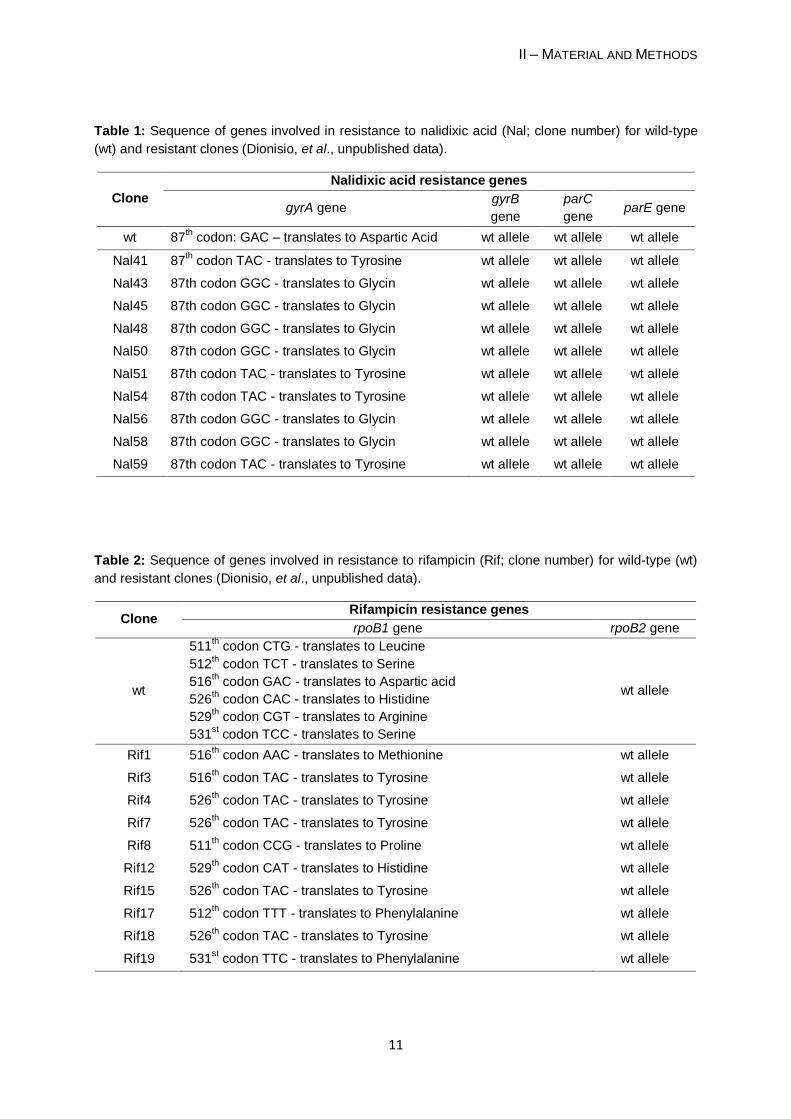
1. BACTERIAL STRAINS AND GROWTH CONDITIONS
The Escherichia coli strains used were K12 MG1655 (wild-type), K12 MG1655 Δara, K12
MG1655 srl::Tn10 mutS- StrR (mutator strain) (Giraud, et al., 2001) and K12 MG1655
srl::Tn10 StrR (non-mutator strain) (Giraud, et al., 2001). Spontaneous resistant clones to
nalidixic acid, rifampicin and streptomycin, were derived from the ancestral strain E. coli K12
MG1655. Genes known to be involved in the resistance to the corresponding antibiotics have
been sequenced (Dionisio, et al., unpublished data): gyrA, gyrB, parC and parE for
resistance to nalidixic acid (NalR) clones; rpoB for resistance to rifampicin (RifR) clones; and
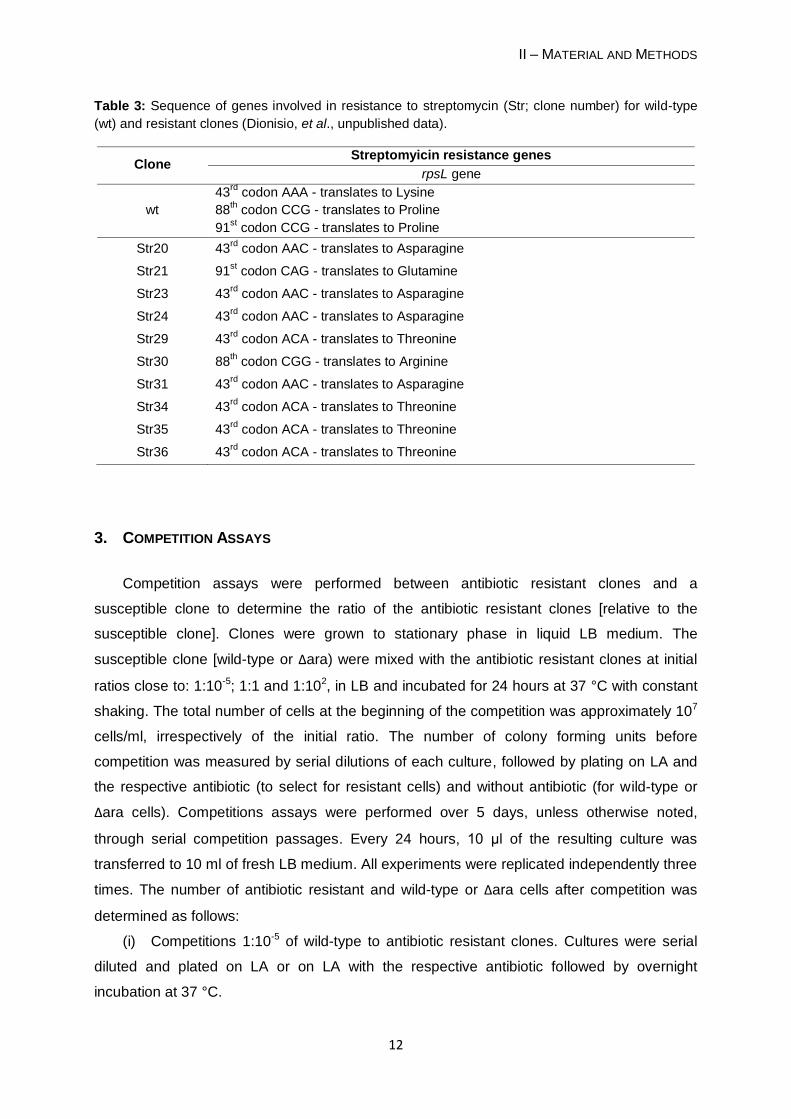
rpsL for resistance to streptomycin (StrR) clones (Tables 1, 2 and 3).
Clones were grown in liquid Luria Bertani (LB) or LB supplemented with agar (LA).
In all experiments, the final antibiotic concentrations in the media were: 40 μg/ml of
nalidixic acid, 100 μg/ml of rifampicin and 100 μg/ml of streptomycin.
Competitions assays were performed between E. coli K12 MG1655 or E. coli K12
MG1655 Δara and spontaneous antibiotic resistant clones. Δara is due to a deletion in the
arabinose operon giving rise to red colonies on the tetrazolium arabinose (TA) indicator agar
(Lenski, 1988), being distinguished from antibiotic resistant clones (ara+) that produce white
colonies. Competitions were performed over a pre-determined time in 50 ml tubes containing
10 ml of LB medium at 37 ºC with constant shaking (170 rpm).
All serial dilutions were done in MgSO4 10-2 M. All clones were stored in 15% (V/V)
glycerol at -80 °C for future experiments.
2. SELECTION OF SPONTANEOUS ANTIBIOTIC RESISTANT CLONES
Escherichia coli K12 MG1655 cells were inoculated on several tubes of 10 ml of LB
medium for 24 hours, at 37°C and constant shaking. The stationary phase of each culture
was platted on LA supplemented with the appropriate antibiotic, followed by incubation at
37°C over 24 hours. Resistant well individualized colonies from each culture were selected
and streaked twice onto other selective plates. Then, each clone was grown overnight in LB
with the appropriated antibiotic at 37 °C with constant shaking and stored.
II – MATERIAL AND METHODS
11
Table 1: Sequence of genes involved in resistance to nalidixic acid (Nal; clone number) for wild-type
(wt) and resistant clones (Dionisio, et al., unpublished data).
Clone
Nalidixic acid resistance genes
gyrA gene gyrB
gene
parC
gene parE gene
wt 87th codon: GAC – translates to Aspartic Acid wt allele wt allele wt allele
Nal41 87th codon TAC - translates to Tyrosine wt allele wt allele wt allele
Nal43 87th codon GGC - translates to Glycin wt allele wt allele wt allele
Nal45 87th codon GGC - translates to Glycin wt allele wt allele wt allele
Nal48 87th codon GGC - translates to Glycin wt allele wt allele wt allele
Nal50 87th codon GGC - translates to Glycin wt allele wt allele wt allele
Nal51 87th codon TAC - translates to Tyrosine wt allele wt allele wt allele
Nal54 87th codon TAC - translates to Tyrosine wt allele wt allele wt allele
Nal56 87th codon GGC - translates to Glycin wt allele wt allele wt allele
Nal58 87th codon GGC - translates to Glycin wt allele wt allele wt allele
Nal59 87th codon TAC - translates to Tyrosine wt allele wt allele wt allele
Table 2: Sequence of genes involved in resistance to rifampicin (Rif; clone number) for wild-type (wt)
and resistant clones (Dionisio, et al., unpublished data).
Clone Rifampicin resistance genes
rpoB1 gene rpoB2 gene
wt
511th codon CTG - translates to Leucine
512th codon TCT - translates to Serine
516th codon GAC - translates to Aspartic acid
526th codon CAC - translates to Histidine
529th codon CGT - translates to Arginine
531st codon TCC - translates to Serine
wt allele
Rif1 516th codon AAC - translates to Methionine wt allele
Rif3 516th codon TAC - translates to Tyrosine wt allele
Rif4 526th codon TAC - translates to Tyrosine wt allele
Rif7 526th codon TAC - translates to Tyrosine wt allele
Rif8 511th codon CCG - translates to Proline wt allele
Rif12 529th codon CAT - translates to Histidine wt allele
Rif15 526th codon TAC - translates to Tyrosine wt allele
Rif17 512th codon TTT - translates to Phenylalanine wt allele
Rif18 526th codon TAC - translates to Tyrosine wt allele
Rif19 531st codon TTC - translates to Phenylalanine wt allele
II – MATERIAL AND METHODS
12
Table 3: Sequence of genes involved in resistance to streptomycin (Str; clone number) for wild-type
(wt) and resistant clones (Dionisio, et al., unpublished data).
Clone Streptomyicin resistance genes
rpsL gene
wt
43rd
codon AAA - translates to Lysine
88th codon CCG - translates to Proline
91st codon CCG - translates to Proline
Str20 43rd
codon AAC - translates to Asparagine
Str21 91st codon CAG - translates to Glutamine
Str23 43rd
codon AAC - translates to Asparagine
Str24 43rd
codon AAC - translates to Asparagine
Str29 43rd
codon ACA - translates to Threonine
Str30 88th codon CGG - translates to Arginine
Str31 43rd
codon AAC - translates to Asparagine
Str34 43rd
codon ACA - translates to Threonine
Str35 43rd
codon ACA - translates to Threonine
Str36 43rd
codon ACA - translates to Threonine
3. COMPETITION ASSAYS
Competition assays were performed between antibiotic resistant clones and a
susceptible clone to determine the ratio of the antibiotic resistant clones [relative to the
susceptible clone]. Clones were grown to stationary phase in liquid LB medium. The
susceptible clone [wild-type or Δara) were mixed with the antibiotic resistant clones at initial
ratios close to: 1:10-5; 1:1 and 1:102, in LB and incubated for 24 hours at 37 °C with constant
shaking. The total number of cells at the beginning of the competition was approximately 107
cells/ml, irrespectively of the initial ratio. The number of colony forming units before
competition was measured by serial dilutions of each culture, followed by plating on LA and
the respective antibiotic (to select for resistant cells) and without antibiotic (for wild-type or
Δara cells). Competitions assays were performed over 5 days, unless otherwise noted,
through serial competition passages. Every 24 hours, 10 μl of the resulting culture was
transferred to 10 ml of fresh LB medium. All experiments were replicated independently three
times. The number of antibiotic resistant and wild-type or Δara cells after competition was
determined as follows:
(i) Competitions 1:10-5 of wild-type to antibiotic resistant clones. Cultures were serial
diluted and plated on LA or on LA with the respective antibiotic followed by overnight
incubation at 37 °C.
II – MATERIAL AND METHODS
13
(ii) Competitions 1:1 of wild-type and antibiotic resistant clones. Cultures were serial
diluted and plated on LA followed by overnight incubation at 37°C, after which 100 random
isolated colonies were picked and plated on both LA and LA with corresponding antibiotic,
and incubated overnight at 37 °C.
(iii) Competitions 1:1 and 1:102 of Δara and antibiotic resistant clones. Cultures were
serial diluted and plated TA indicator agar. An overnight incubation at 37 °C was followed.
4. SCREENING FOR MUTATOR PHENOTYPES
I followed the method of Leclerc et al (1996). Each clone (resistant and wild-type) was
grown, in three independently cultures, until stationary-phase in LB for 48 hours at 37°C, with
constant shaking. After incubation, 108 bacteria from each culture were plated, for resistant
(R) count, on LA supplemented with rifampicin, with the exception of RifR clones that were
plated on LA with nalidixic acid. To count the total number of cells, dilutions were performed
and plated on LA. An overnight incubation at 37 ºC was followed for all plates.
As a positive control, I performed the same assay with a mutator strain (E. coli K12
MG1655 srl::Tn10 mutS- StrR (Giraud, et al., 2001)). This strain was used to compare the
results of the resistant and wild-type clones mutation frequency.
The mutation frequency for each clone was calculated by the following formula:
mlcfuTotal
mlcellsRfrequencyMutation
5. BACTERIAL GROWTH IN SUPERNATANT PREPARATIONS
Bacterial cells were grown to stationary phase in liquid LB medium over one day at 37
°C with constant shaking. Then, cells were removed by centrifugation (10 min at 5000 RPM),
followed by decantation. Finally, the supernatant was filtered twice (pore size 0.22 μm).
Then, this supernatant was used to grow other bacterial cells over 50 hours at 37 °C with
shaking. The number of cells, during incubation, for the first 6 hours was measured hourly,
then measurements were done again at 10 hours and 50 hours, by plating in LA or LA with
the appropriate antibiotic. After incubation a growth curve was set up.
.
II – MATERIAL AND METHODS
14
6. DEVELOPMENT OF AN EXPERIMENTAL PROTOCOL TO UNDERSTAND THE ORIGIN OF
CLONES WITH HIGH FITNESS WHEN RARE
The experiments performed in this thesis have shown an unexpected high number of
clones with a greater fitness when rare. I tried to understand if the resistant bacteria selection
method favored the selection of these clones. The ancestral strain E. coli K12 MG1655 was
grown in LB overnight at 37 ºC with constant shaking (170 rpm). A dilution to 10-2 was
performed and plated on 24 plates with LA. Plates were divided to carry out two independent
experiments during incubation: (A) no mixing and (B) manual mixing with glass beads. For
experiment (B), 50 μl of MgSO4 10-2 M was added to the plate before mixing, which
happened every one and a half hour, for the first 10 hours. Replica plating (Lederberg &
Lederberg, 1952) was performed to LA plates with nalidixic acid. After 48 hours of incubation,
one clone of each plate was selected randomly and streaked twice to nalidixic acid plates. All
clones were stored. Then I checked for an advantage when rare of each of these 24 clones
(12 clones under protocol A and 12 clones under protocol B).
7. ESTIMATION OF FITNESS
To measure the fitness of resistant clones relative to the wild-type clones we use the
following formula according to Lenski et al. (Lenski, 1991), where the fitness of wild-type is
normalized to 1:
trRRtR
20
trwtwttwt
20
trR
tRLog
R
tRR
trR
02
02
trwt
twtLog
wt
twtwt
trwt
02
02
Hence:
)0(
)(
)0(
)(
)0(
)(
)0(
)(
/
2
2
2
2
wt
twtLog
R
tRLog
rr
wt
twtLog
R
tRLog
rr wtRwtR ,
where R0, Rt, wt0 and wtt stand for colony forming units of antibiotic resistant and wild-type
cells in the beginning and in the end of competition assay. This formula assumes that fitness
II – MATERIAL AND METHODS
15
is not frequency-dependent. Nevertheless, I used it to measured fitness in a 24 hour
competition where I will fundamentally be measuring differences in the exponential growth
(the principal component of the formula) of both competing strains. Besides, in a 24 hour
competition there is not a huge difference in the frequency of the frequency-dependent
clones.
8. STATISTICAL AND MATHEMATICAL ANALYSIS
To test if frequency of resistant clones were in equilibrium I performed a linear
regression, given as follows: y = mt + b, where y is the log-frequency of the clone, m is the
slope, t is time in days, and b is the y-intercept. Then an ANOVA was performed to assess if
the slope (m) of the regression line of the last three or four days of competition is statistically
significant different from zero.
To assess if fitness values of resistant clones were superior to the fitness of the
reference strain I performed a Student’s t-test.
To find differences between mutation rates of clones and those of mutator strains I
tested data for homogeneity with Levene‟s test and I performed a one-way analysis of
variances (ANOVA) followed by a Tukey‟s HSD test. This was performed in SPSS 17.0.
All tests were performed with a confidence level of 95%.
III – RESULTS
16
III – RESULTS
1 DEMONSTRATION OF FREQUENCY-DEPENDENCY IN SPONTANEOUS ANTIBIOTIC
RESISTANT CLONES
The aim of the present study was to understand if populations of antibiotic resistant
clones show a frequency-dependent phenotype. I performed competition assays, in the
absence of antibiotics, between antibiotic resistant clones and a sensitive clone at different
proportions. In these competitions I used thirty clones conferring resistance to commonly
used antibiotics belonging to three different classes: 10 clones resistant to the quinolone
nalidixic acid (NalR); 10 clones resistant to the rifampicin from rifamicyns class (RifR); and 10
clones resistant to the aminoglycoside streptomycin (StrR). Mutations that confer resistance
are located in important genes involved in replication (gyrA), transcription (rpoB) and
translation (rpsL), respectively. I measured the ratio of the resistant clones in the population
along 5 days (unless otherwise noted) of serial dilutions [serial dilutions of 1/1000, implying
about 9.966 generations per day]. Each new culture had an initial inoculum of 107 cells/ml.
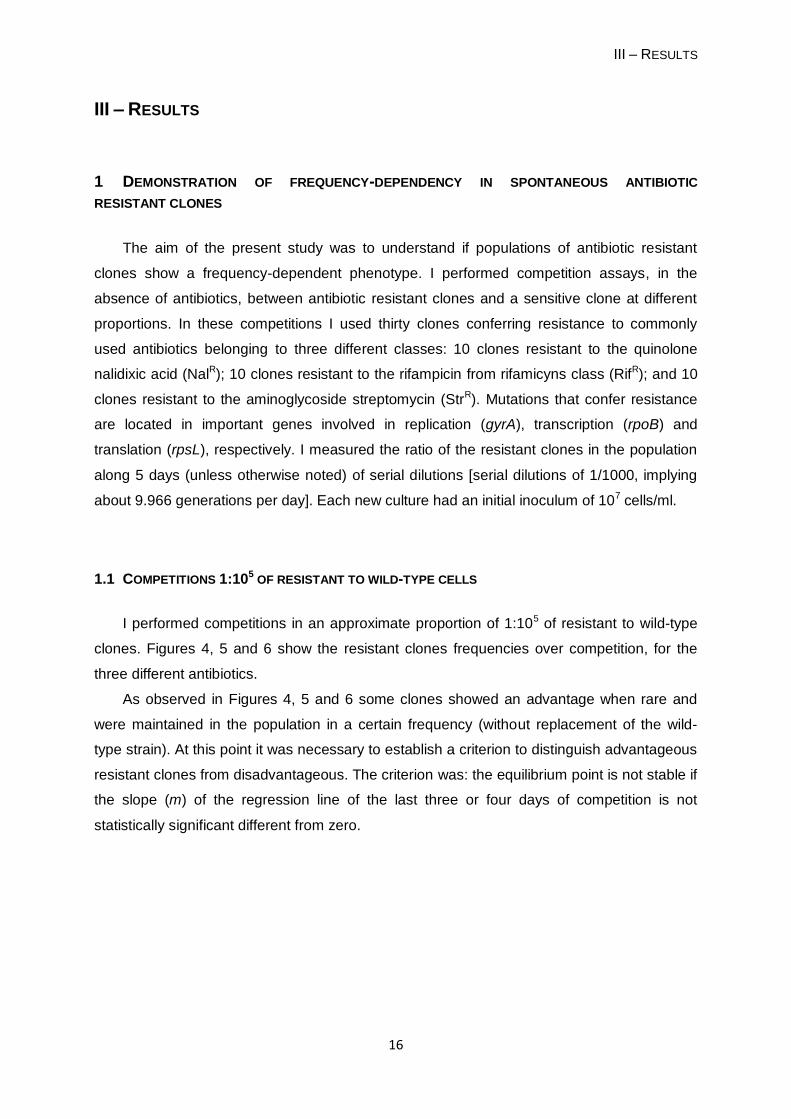
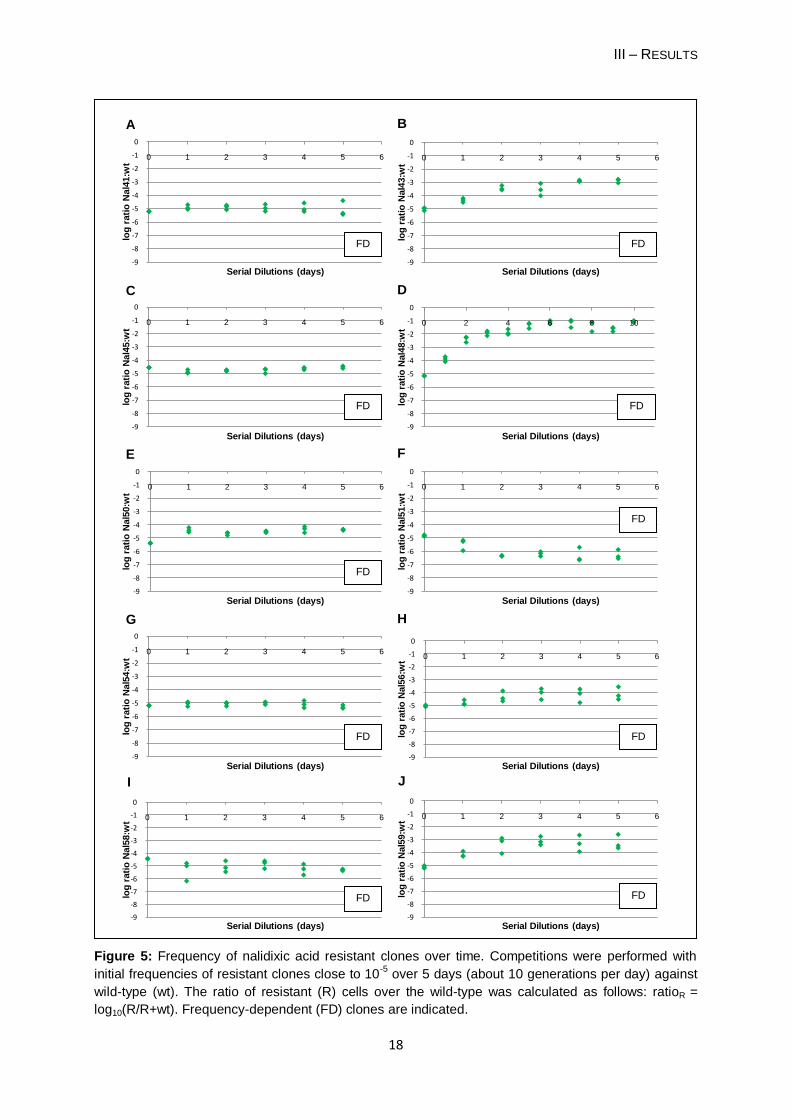
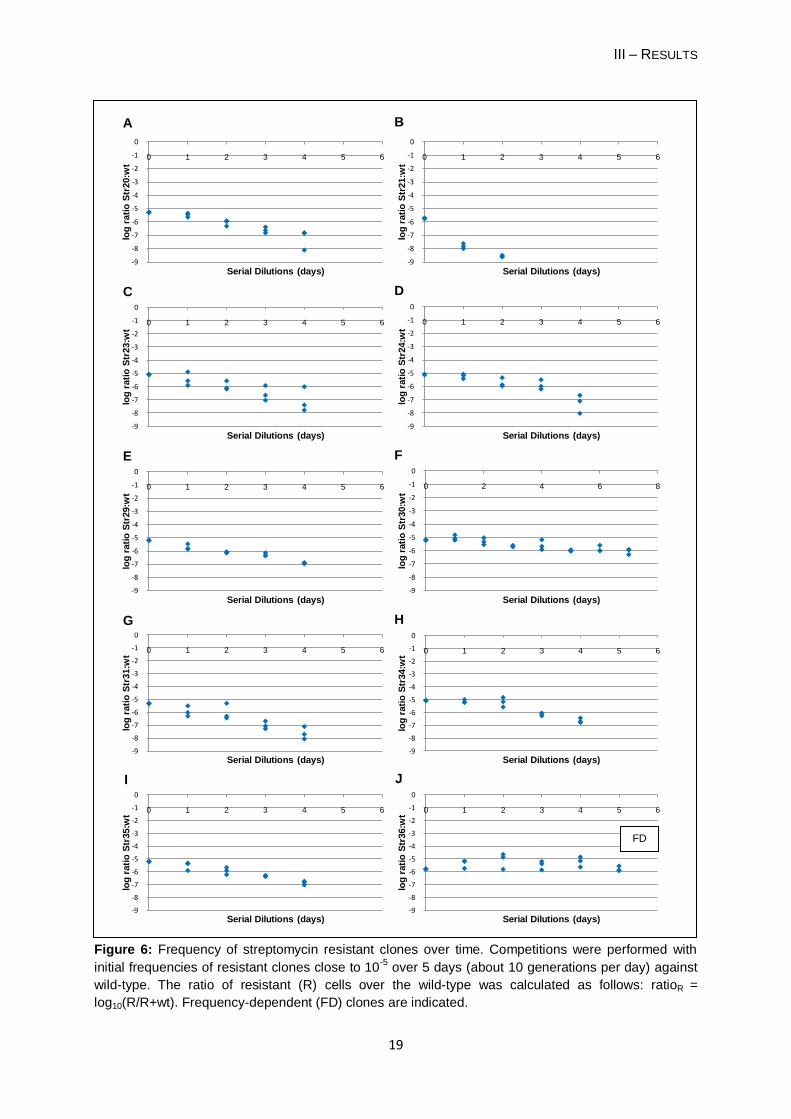
1.1 COMPETITIONS 1:105 OF RESISTANT TO WILD-TYPE CELLS
I performed competitions in an approximate proportion of 1:105 of resistant to wild-type
clones. Figures 4, 5 and 6 show the resistant clones frequencies over competition, for the
three different antibiotics.
As observed in Figures 4, 5 and 6 some clones showed an advantage when rare and
were maintained in the population in a certain frequency (without replacement of the wild-
type strain). At this point it was necessary to establish a criterion to distinguish advantageous
resistant clones from disadvantageous. The criterion was: the equilibrium point is not stable if
the slope (m) of the regression line of the last three or four days of competition is not
statistically significant different from zero.

III – RESULTS
17
Figure 4: Frequency of rifampicin resistant clones over time. Competitions were performed with initial
frequencies of resistant clones close to 10-5
over 5 days (about 10 generations per day) against wild-
type (wt). The ratio of resistant (R) cells over the wild-type was calculated as follows: ratioR =
log10(R/R+wt). Frequency-dependent (FD) clones are indicated.
-9
-8
-7
-6
-5
-4
-3
-2
-1
0
0 1 2 3 4 5 6
log
rati
o R
if1:w
t
Serial Dilutions (days)-9
-8
-7
-6
-5
-4
-3
-2
-1
0
0 1 2 3 4 5 6
log
rati
o R
if3:w
t
Serial Dilutions (days)
-9
-8
-7
-6
-5
-4
-3
-2
-1
0
0 1 2 3 4 5 6
log
rati
o R
if4:W
wt
Serial Dilutions (days)-9
-8
-7
-6
-5
-4
-3
-2
-1
0
0 1 2 3 4 5 6
log
rati
o R
if7:w
t
Serial Dilutions (days)
-9
-8
-7
-6
-5
-4
-3
-2
-1
0
0 1 2 3 4 5 6
log
rati
o R
if8:w
t
Serial Dilutions (days)-9
-8
-7
-6
-5
-4
-3
-2
-1
0
0 1 2 3 4 5 6
log
rati
o R
if12:w
t
Serial Dilutions (days)
-9
-8
-7
-6
-5
-4
-3
-2
-1
0
0 1 2 3 4 5 6
log
rati
o R
if15:w
t
Serial Dilutions (days)-9
-8
-7
-6
-5
-4
-3
-2
-1
0
0 1 2 3 4 5 6
log
rati
o R
if17:w
t
Serial Dilutions (days)
-9
-8
-7
-6
-5
-4
-3
-2
-1
0
0 1 2 3 4 5 6
log
rati
o R
if18:W
wt
Serial Dilutions (days)-9
-8
-7
-6
-5
-4
-3
-2
-1
0
0 1 2 3 4 5 6
log
rati
o R
if19:W
T
Serial Dilutions (days)
A B
C D
E F
G H
I J
FD
FD
III – RESULTS
18
Figure 5: Frequency of nalidixic acid resistant clones over time. Competitions were performed with
initial frequencies of resistant clones close to 10-5
over 5 days (about 10 generations per day) against
wild-type (wt). The ratio of resistant (R) cells over the wild-type was calculated as follows: ratioR =
log10(R/R+wt). Frequency-dependent (FD) clones are indicated.
-9
-8
-7
-6
-5
-4
-3
-2
-1
0
0 1 2 3 4 5 6
log
rati
o N
al4
1:w
t
Serial Dilutions (days)-9
-8
-7
-6
-5
-4
-3
-2
-1
0
0 1 2 3 4 5 6
log
rati
o N
al4
3:w
t
Serial Dilutions (days)
-9
-8
-7
-6
-5
-4
-3
-2
-1
0
0 1 2 3 4 5 6
log
rati
o N
al4
5:w
t
Serial Dilutions (days)-9
-8
-7
-6
-5
-4
-3
-2
-1
0
0 2 4 6 8 10
log
rati
o N
al4
8:w
t
Serial Dilutions (days)
-9
-8
-7
-6
-5
-4
-3
-2
-1
0
0 1 2 3 4 5 6
log
rati
o N
al5
0:w
t
Serial Dilutions (days)-9
-8
-7
-6
-5
-4
-3
-2
-1
0
0 1 2 3 4 5 6
log
rati
o N
al5
1:w
t
Serial Dilutions (days)
-9
-8
-7
-6
-5
-4
-3
-2
-1
0
0 1 2 3 4 5 6
log
rati
o N
al5
4:w
t
Serial Dilutions (days)-9
-8
-7
-6
-5
-4
-3
-2
-1
0
0 1 2 3 4 5 6
log
rati
o N
al5
6:w
t
Serial Dilutions (days)
-9
-8
-7
-6
-5
-4
-3
-2
-1
0
0 1 2 3 4 5 6
log
rati
o N
al5
8:w
t
Serial Dilutions (days)-9
-8
-7
-6
-5
-4
-3
-2
-1
0
0 1 2 3 4 5 6
log
rati
o N
al5
9:w
t
Serial Dilutions (days)
A B
C D
E F
G H
I J
FD FD
FD FD
FD
FD
FD FD
FD FD
III – RESULTS
19
Figure 6: Frequency of streptomycin resistant clones over time. Competitions were performed with
initial frequencies of resistant clones close to 10-5
over 5 days (about 10 generations per day) against
wild-type. The ratio of resistant (R) cells over the wild-type was calculated as follows: ratioR =
log10(R/R+wt). Frequency-dependent (FD) clones are indicated.
-9
-8
-7
-6
-5
-4
-3
-2
-1
0
0 1 2 3 4 5 6
log
rati
o S
tr20:w
t
Serial Dilutions (days)-9
-8
-7
-6
-5
-4
-3
-2
-1
0
0 1 2 3 4 5 6
log
rati
o S
tr21:w
t
Serial Dilutions (days)
-9
-8
-7
-6
-5
-4
-3
-2
-1
0
0 1 2 3 4 5 6
log
rati
o S
tr23:w
t
Serial Dilutions (days)-9
-8
-7
-6
-5
-4
-3
-2
-1
0
0 1 2 3 4 5 6
log
rati
o S
tr24:w
t
Serial Dilutions (days)
-9
-8
-7
-6
-5
-4
-3
-2
-1
0
0 1 2 3 4 5 6
log
rati
o S
tr29:w
t
Serial Dilutions (days)-9
-8
-7
-6
-5
-4
-3
-2
-1
0
0 2 4 6 8
log
rati
o S
tr30:w
t
Serial Dilutions (days)
-9
-8
-7
-6
-5
-4
-3
-2
-1
0
0 1 2 3 4 5 6
log
rati
o S
tr31:w
t
Serial Dilutions (days)-9
-8
-7
-6
-5
-4
-3
-2
-1
0
0 1 2 3 4 5 6
log
rati
o S
tr34:w
t
Serial Dilutions (days)
-9
-8
-7
-6
-5
-4
-3
-2
-1
0
0 1 2 3 4 5 6
log
rati
o S
tr35:w
t
Serial Dilutions (days)-9
-8
-7
-6
-5
-4
-3
-2
-1
0
0 1 2 3 4 5 6
log
rati
o S
tr36:w
t
Serial Dilutions (days)
FD
A B
C D
E F
G H
I J
III – RESULTS
20
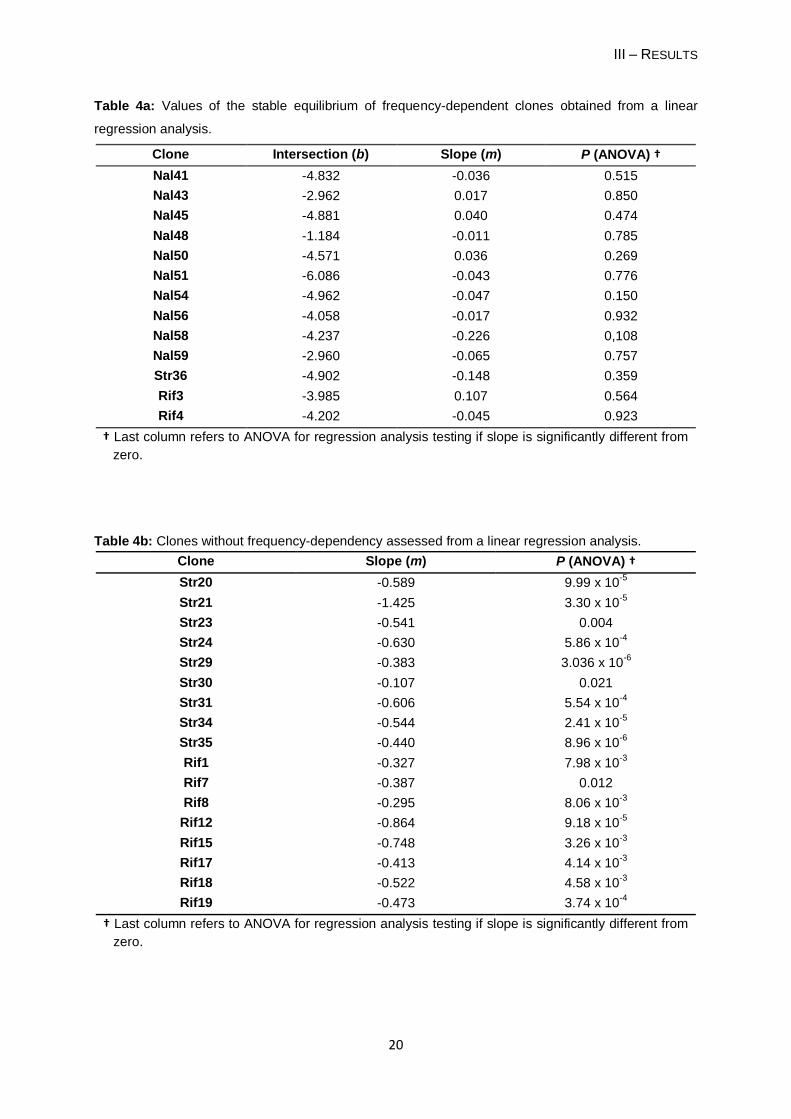
Table 4a: Values of the stable equilibrium of frequency-dependent clones obtained from a linear
regression analysis.
Clone Intersection (b) Slope (m) P (ANOVA) †
Nal41 -4.832 -0.036 0.515
Nal43 -2.962 0.017 0.850
Nal45 -4.881 0.040 0.474
Nal48 -1.184 -0.011 0.785
Nal50 -4.571 0.036 0.269
Nal51 -6.086 -0.043 0.776
Nal54 -4.962 -0.047 0.150
Nal56 -4.058 -0.017 0.932
Nal58 -4.237 -0.226 0,108
Nal59 -2.960 -0.065 0.757
Str36 -4.902 -0.148 0.359
Rif3 -3.985 0.107 0.564
Rif4 -4.202 -0.045 0.923
† Last column refers to ANOVA for regression analysis testing if slope is significantly different from
zero.
Table 4b: Clones without frequency-dependency assessed from a linear regression analysis.
Clone Slope (m) P (ANOVA) †
Str20 -0.589 9.99 x 10⁻⁵
Str21 -1.425 3.30 x 10⁻⁵
Str23 -0.541 0.004
Str24 -0.630 5.86 x 10⁻⁴
Str29 -0.383 3.036 x 10⁻⁶
Str30 -0.107 0.021
Str31 -0.606 5.54 x 10⁻⁴
Str34 -0.544 2.41 x 10⁻⁵
Str35 -0.440 8.96 x 10⁻⁶
Rif1 -0.327 7.98 x 10⁻³
Rif7 -0.387 0.012
Rif8 -0.295 8.06 x 10⁻³
Rif12 -0.864 9.18 x 10⁻⁵
Rif15 -0.748 3.26 x 10⁻³
Rif17 -0.413 4.14 x 10⁻³
Rif18 -0.522 4.58 x 10⁻³
Rif19 -0.473 3.74 x 10⁻⁴
† Last column refers to ANOVA for regression analysis testing if slope is significantly different from
zero.
III – RESULTS
21
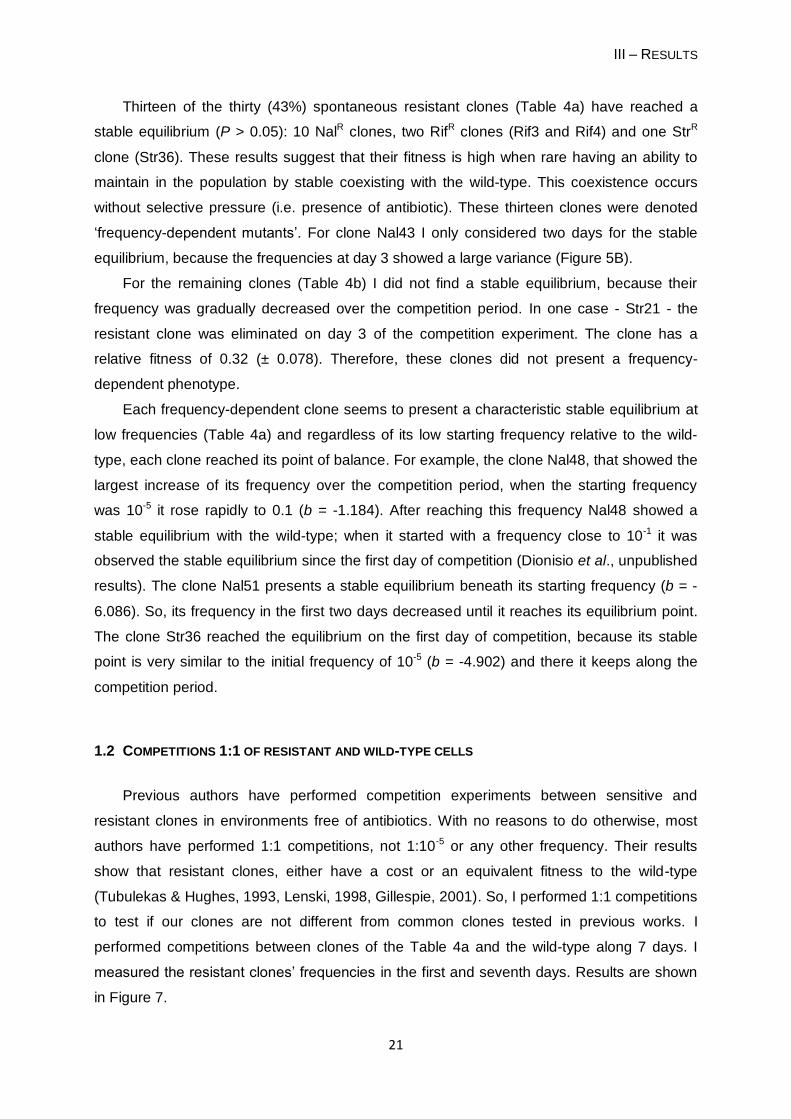
Thirteen of the thirty (43%) spontaneous resistant clones (Table 4a) have reached a
stable equilibrium (P > 0.05): 10 NalR clones, two RifR clones (Rif3 and Rif4) and one StrR
clone (Str36). These results suggest that their fitness is high when rare having an ability to
maintain in the population by stable coexisting with the wild-type. This coexistence occurs
without selective pressure (i.e. presence of antibiotic). These thirteen clones were denoted
„frequency-dependent mutants‟. For clone Nal43 I only considered two days for the stable
equilibrium, because the frequencies at day 3 showed a large variance (Figure 5B).
For the remaining clones (Table 4b) I did not find a stable equilibrium, because their
frequency was gradually decreased over the competition period. In one case - Str21 - the
resistant clone was eliminated on day 3 of the competition experiment. The clone has a
relative fitness of 0.32 (± 0.078). Therefore, these clones did not present a frequency-
dependent phenotype.
Each frequency-dependent clone seems to present a characteristic stable equilibrium at
low frequencies (Table 4a) and regardless of its low starting frequency relative to the wild-
type, each clone reached its point of balance. For example, the clone Nal48, that showed the
largest increase of its frequency over the competition period, when the starting frequency
was 10-5 it rose rapidly to 0.1 (b = -1.184). After reaching this frequency Nal48 showed a
stable equilibrium with the wild-type; when it started with a frequency close to 10-1 it was
observed the stable equilibrium since the first day of competition (Dionisio et al., unpublished
results). The clone Nal51 presents a stable equilibrium beneath its starting frequency (b = -
6.086). So, its frequency in the first two days decreased until it reaches its equilibrium point.
The clone Str36 reached the equilibrium on the first day of competition, because its stable
point is very similar to the initial frequency of 10-5 (b = -4.902) and there it keeps along the
competition period.
1.2 COMPETITIONS 1:1 OF RESISTANT AND WILD-TYPE CELLS
Previous authors have performed competition experiments between sensitive and
resistant clones in environments free of antibiotics. With no reasons to do otherwise, most
authors have performed 1:1 competitions, not 1:10-5 or any other frequency. Their results
show that resistant clones, either have a cost or an equivalent fitness to the wild-type
(Tubulekas & Hughes, 1993, Lenski, 1998, Gillespie, 2001). So, I performed 1:1 competitions
to test if our clones are not different from common clones tested in previous works. I
performed competitions between clones of the Table 4a and the wild-type along 7 days. I
measured the resistant clones‟ frequencies in the first and seventh days. Results are shown
in Figure 7.
III – RESULTS
22
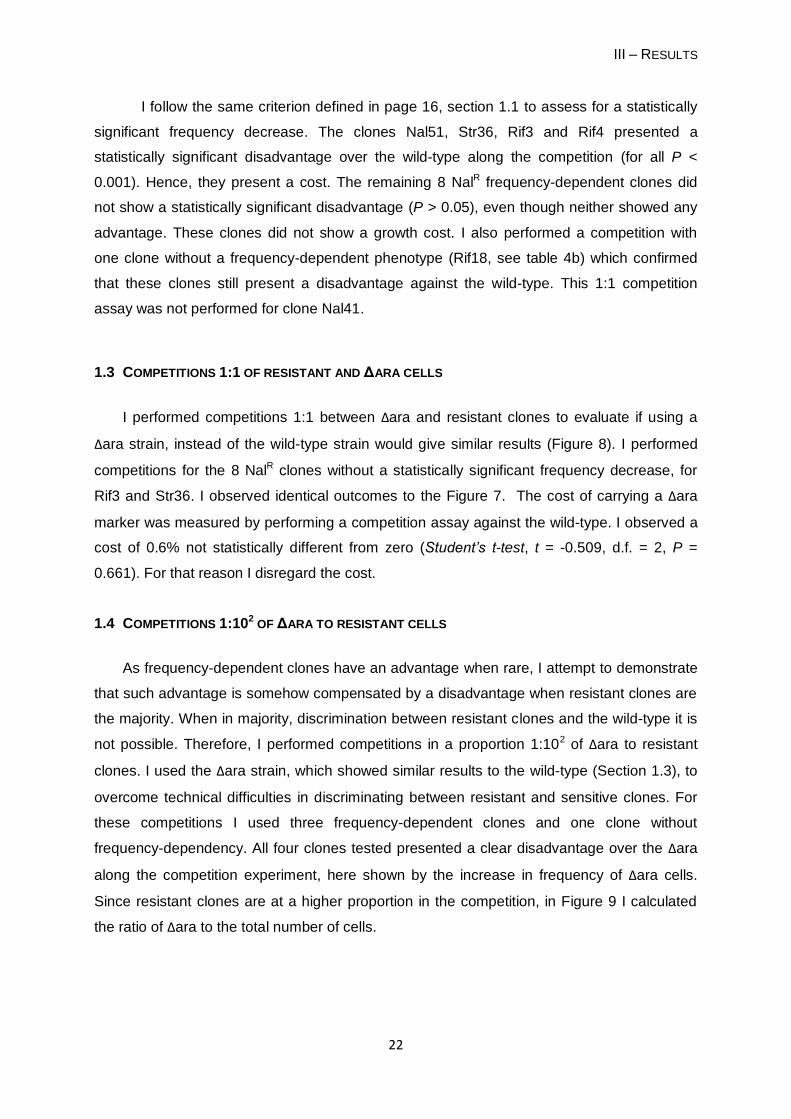
I follow the same criterion defined in page 16, section 1.1 to assess for a statistically
significant frequency decrease. The clones Nal51, Str36, Rif3 and Rif4 presented a
statistically significant disadvantage over the wild-type along the competition (for all P <
0.001). Hence, they present a cost. The remaining 8 NalR frequency-dependent clones did
not show a statistically significant disadvantage (P > 0.05), even though neither showed any
advantage. These clones did not show a growth cost. I also performed a competition with
one clone without a frequency-dependent phenotype (Rif18, see table 4b) which confirmed
that these clones still present a disadvantage against the wild-type. This 1:1 competition
assay was not performed for clone Nal41.
1.3 COMPETITIONS 1:1 OF RESISTANT AND ΔARA CELLS
I performed competitions 1:1 between Δara and resistant clones to evaluate if using a
Δara strain, instead of the wild-type strain would give similar results (Figure 8). I performed
competitions for the 8 NalR clones without a statistically significant frequency decrease, for
Rif3 and Str36. I observed identical outcomes to the Figure 7. The cost of carrying a Δara
marker was measured by performing a competition assay against the wild-type. I observed a
cost of 0.6% not statistically different from zero (Student’s t-test, t = -0.509, d.f. = 2, P =
0.661). For that reason I disregard the cost.
1.4 COMPETITIONS 1:102 OF ΔARA TO RESISTANT CELLS
As frequency-dependent clones have an advantage when rare, I attempt to demonstrate
that such advantage is somehow compensated by a disadvantage when resistant clones are
the majority. When in majority, discrimination between resistant clones and the wild-type it is
not possible. Therefore, I performed competitions in a proportion 1:102 of Δara to resistant
clones. I used the Δara strain, which showed similar results to the wild-type (Section 1.3), to
overcome technical difficulties in discriminating between resistant and sensitive clones. For
these competitions I used three frequency-dependent clones and one clone without
frequency-dependency. All four clones tested presented a clear disadvantage over the Δara
along the competition experiment, here shown by the increase in frequency of Δara cells.
Since resistant clones are at a higher proportion in the competition, in Figure 9 I calculated
the ratio of Δara to the total number of cells.
III – RESULTS
23
Figure 7: One to one competitions of each clone of Table 4a and Rif18 against the wild-type strain.
Competitions were performed along 7 days. The ratio of resistant (R) cells over the wild-type was
calculated as follows: ratioR = log10(R/R+wt). To assess statistically significant decrease an ANOVA of
the regression line was performed. Clones Rif3, Rif4, Rif18, Str36 and Nal51 decrease over time in
competition with wild-type strain (P < 0.05). Clones Nal43, Nal45, Nal48, Nal50, Nal54 and Nal56
present no cost (P > 0.05).
-3
-2
-1
0
0 2 4 6 8
log
rati
o N
al4
3:w
t
Serial Dilutions (days)
-3
-2
-1
0
0 2 4 6 8
log
rati
o N
al4
5:w
t
Serial Dilutions (days)
-3
-2
-1
0
0 2 4 6 8
log
rati
o N
al4
8:w
t
Serial Dilutions (days)
-3
-2
-1
0
0 2 4 6 8
log
rati
o N
al5
0:w
t
Serial Dilutions (days)
-3
-2
-1
0
0 2 4 6 8
log
rati
o N
al5
1:w
t
Serial Dilutions (days)
-3
-2
-1
0
0 2 4 6 8
log
rati
o N
al5
4:w
t
Serial Dilutions (days)
-3
-2
-1
0
0 2 4 6 8
log
rati
o N
al5
6:w
t
Serial Dilutions (days)
-3
-2
-1
0
0 2 4 6 8
log
rati
o N
al5
8:w
t
Serial Dilutions (days)
-3
-2
-1
0
0 2 4 6 8
log
rati
o N
al5
9:w
tSerial Dilutions (days)
-3
-2
-1
0
0 2 4 6 8
log
rati
o S
tr36:w
t
Serial Dilutions (days)
-3
-2
-1
0
0 2 4 6 8
log
rati
o R
if3:w
t
Serial Dilutions (days)
-3
-2
-1
0
0 2 4 6 8
log
rati
o R
if4:w
t
Serial Dilutions (days)
-3
-2
-1
0
0 2 4 6 8
log
rati
o R
if18:w
t
Serial Dilutions (days)
A B C
D E F
G H I
J K L
M
III – RESULTS
24
Figure 8: One to one competitions between each clone of table 4a (with the exception of Rif4 and
Nal51) and Δara strain. Competitions were performed along 5 days. The ratio of resistant (R) cells
over the wild-type was calculated as follows: ratioR = log10(R/R+wt). To assess statistically significant
decrease an ANOVA of the regression line was performed. Clones Rif3 and Str36 decrease over time
in competition with Δara strain (P < 0.05). Clones Nal43, Nal45, Nal48, Nal50, Nal54 and Nal56
present no cost (P > 0.05). The outcomes of these competitions are similar to those of Figure 7.
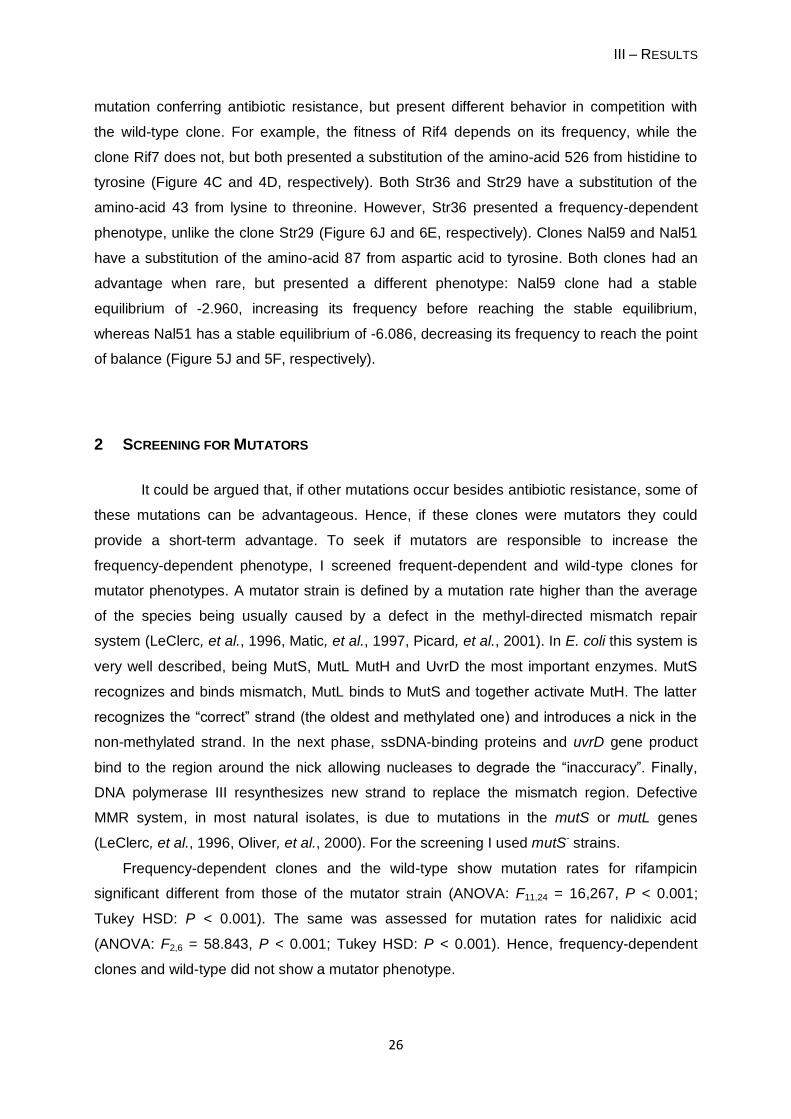
1.5 FREQUENCY-DEPENDENT FITNESS OF NAL48 CLONE
Figure 10 shows the fitness of the Nal48 clone plotted against its frequency in the
population. Fitness values were calculated using data shown in Figures 5, 7 and 9.
-3
-2
-1
0
0 2 4 6
log
rati
o N
al4
3:w
t
Serial Dilutions (days)
-3
-2
-1
0
0 2 4 6
log
rati
o N
al4
5:w
t
Serial Dilutions (days)
-3
-2
-1
0
0 2 4 6
log
rati
o N
al4
8:w
tt
Serial Dilutions (days)
-3
-2
-1
0
0 2 4 6
log
rati
o N
al5
0:w
t
Serial Dilutions (days)
-3
-2
-1
0
0 2 4 6
log
rati
o N
al5
4:w
t
Serial Dilutions (days)
-3
-2
-1
0
0 2 4 6
log
rati
o N
al5
6:w
t
Serial Dilutions (days)
-3
-2
-1
0
0 2 4 6
log
rati
o N
al5
8:w
t
Serial Dilutions (days)
-3
-2
-1
0
0 2 4 6
log
rati
o N
al5
9:w
t
Serial Dilutions (days)
-3
-2
-1
0
0 2 4 6
log
rati
o R
if3:w
tSerial Dilutions (days)
-3
-2
-1
0
0 2 4 6
log
rati
o S
tr36:w
t
Serial Dilutions (days)
A B C
D E F
G H I
K
III – RESULTS
25
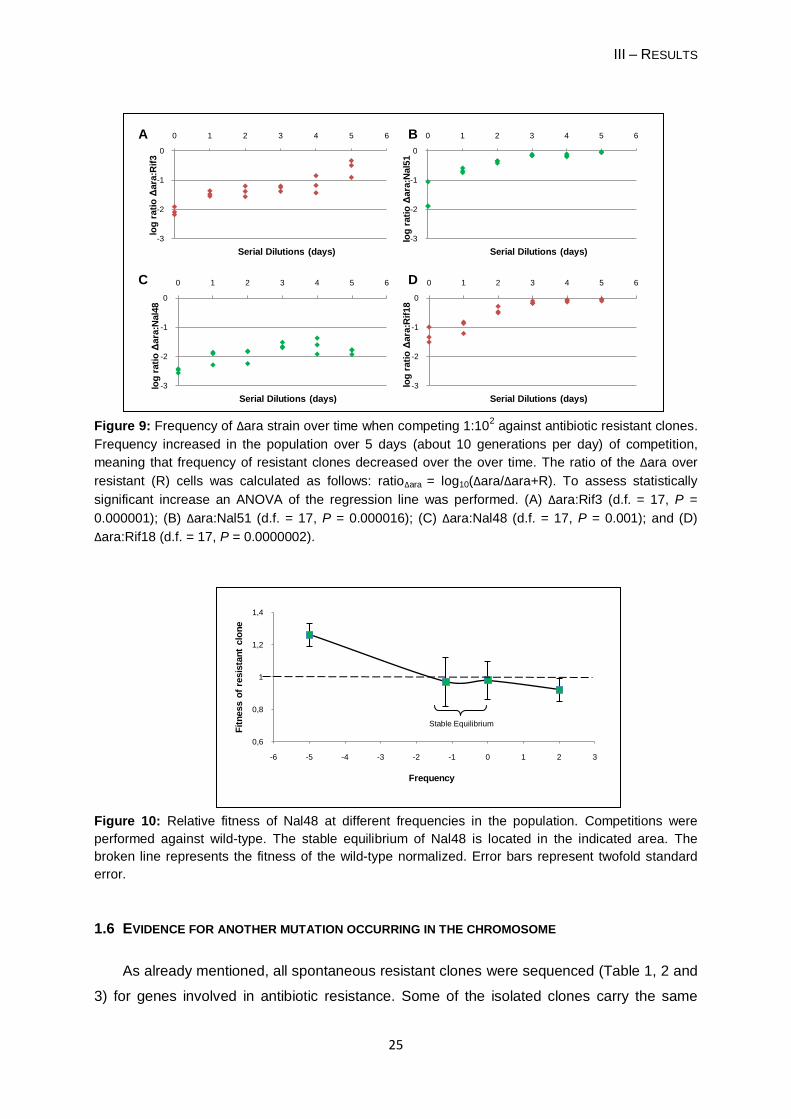
Figure 9: Frequency of Δara strain over time when competing 1:102 against antibiotic resistant clones.
Frequency increased in the population over 5 days (about 10 generations per day) of competition,
meaning that frequency of resistant clones decreased over the over time. The ratio of the Δara over
resistant (R) cells was calculated as follows: ratioΔara = log10(Δara/Δara+R). To assess statistically
significant increase an ANOVA of the regression line was performed. (A) Δara:Rif3 (d.f. = 17, P =
0.000001); (B) Δara:Nal51 (d.f. = 17, P = 0.000016); (C) Δara:Nal48 (d.f. = 17, P = 0.001); and (D)
Δara:Rif18 (d.f. = 17, P = 0.0000002).
Figure 10: Relative fitness of Nal48 at different frequencies in the population. Competitions were
performed against wild-type. The stable equilibrium of Nal48 is located in the indicated area. The
broken line represents the fitness of the wild-type normalized. Error bars represent twofold standard
error.
1.6 EVIDENCE FOR ANOTHER MUTATION OCCURRING IN THE CHROMOSOME
As already mentioned, all spontaneous resistant clones were sequenced (Table 1, 2 and
3) for genes involved in antibiotic resistance. Some of the isolated clones carry the same
-3
-2
-1
0
0 1 2 3 4 5 6
log
rati
o Δ
ara
:Rif
3
Serial Dilutions (days)
-3
-2
-1
0
0 1 2 3 4 5 6
log
rati
o Δ
ara
:Nal5
1
Serial Dilutions (days)
-3
-2
-1
0
0 1 2 3 4 5 6
log
rati
o Δ
ara
:Nal4
8
Serial Dilutions (days)
-3
-2
-1
0
0 1 2 3 4 5 6
log
rati
o Δ
ara
:Rif
18
Serial Dilutions (days)
0,6
0,8
1
1,2
1,4
-6 -5 -4 -3 -2 -1 0 1 2 3
Fit
ness o
f re
sis
tan
t clo
ne
Frequency
A B
C D
Stable Equilibrium
III – RESULTS
26
mutation conferring antibiotic resistance, but present different behavior in competition with
the wild-type clone. For example, the fitness of Rif4 depends on its frequency, while the
clone Rif7 does not, but both presented a substitution of the amino-acid 526 from histidine to
tyrosine (Figure 4C and 4D, respectively). Both Str36 and Str29 have a substitution of the
amino-acid 43 from lysine to threonine. However, Str36 presented a frequency-dependent
phenotype, unlike the clone Str29 (Figure 6J and 6E, respectively). Clones Nal59 and Nal51
have a substitution of the amino-acid 87 from aspartic acid to tyrosine. Both clones had an
advantage when rare, but presented a different phenotype: Nal59 clone had a stable
equilibrium of -2.960, increasing its frequency before reaching the stable equilibrium,
whereas Nal51 has a stable equilibrium of -6.086, decreasing its frequency to reach the point
of balance (Figure 5J and 5F, respectively).
2 SCREENING FOR MUTATORS
It could be argued that, if other mutations occur besides antibiotic resistance, some of
these mutations can be advantageous. Hence, if these clones were mutators they could
provide a short-term advantage. To seek if mutators are responsible to increase the
frequency-dependent phenotype, I screened frequent-dependent and wild-type clones for
mutator phenotypes. A mutator strain is defined by a mutation rate higher than the average
of the species being usually caused by a defect in the methyl-directed mismatch repair
system (LeClerc, et al., 1996, Matic, et al., 1997, Picard, et al., 2001). In E. coli this system is
very well described, being MutS, MutL MutH and UvrD the most important enzymes. MutS
recognizes and binds mismatch, MutL binds to MutS and together activate MutH. The latter
recognizes the “correct” strand (the oldest and methylated one) and introduces a nick in the
non-methylated strand. In the next phase, ssDNA-binding proteins and uvrD gene product
bind to the region around the nick allowing nucleases to degrade the “inaccuracy”. Finally,
DNA polymerase III resynthesizes new strand to replace the mismatch region. Defective
MMR system, in most natural isolates, is due to mutations in the mutS or mutL genes
(LeClerc, et al., 1996, Oliver, et al., 2000). For the screening I used mutS- strains.
Frequency-dependent clones and the wild-type show mutation rates for rifampicin
significant different from those of the mutator strain (ANOVA: F11,24 = 16,267, P < 0.001;
Tukey HSD: P < 0.001). The same was assessed for mutation rates for nalidixic acid
(ANOVA: F2,6 = 58.843, P < 0.001; Tukey HSD: P < 0.001). Hence, frequency-dependent
clones and wild-type did not show a mutator phenotype.
III – RESULTS
27
3 TESTING IF ANOTHER MUTATION IS OCCURRING ELSEWHERE IN THE CHROMOSOME
As mentioned in 1.6 Section, clones presenting the same antibiotic resistance mutations,
nevertheless present different phenotypes. This suggests that other mutation occurred while
the mutants were isolated. I used a mutator strain (E. coli K12 MG1655 srl::Tn10 mutS- StrR)
and generated spontaneous rifampicin resistant mutants. The same procedure using a non-
mutator strain was performed. I isolated ten clones of each strain to initiate competition
against the wild-type. If another mutation, responsible for the frequency-dependent
phenotype, is occurring in the chromosome besides the mutation causing the antibiotic
resistance, then a mutator strain would probably generate more often frequency-dependent
mutants [relatively to the non-mutator one].
The results observed after competition showed no difference among clones generated
by the two different strains. Both generated five clones [mutator clones - 3, 5, 7, 8 and 10;
non-mutator clones - 1, 2, 3, 5 and 10] with a frequency-dependency phenotype. All those
frequency-dependent clones were characterized by a decrease in their frequency, followed
by a stable equilibrium (Figures 11 and 12). Hence, I did not find a correlation between
increased mutational rate and appearance of a frequency-dependent phenotype.
Table 5: Mutation frequencies of wild-type (wt), mutator strain (mutS-) and frequency-dependent
clones for rifampicin or nalidixic acid resistance.
Clone Resistant cfu/ml Total cfu/ml Mutation Frequency †
Mutator 7800.00; 8118.33* 1.17 x 109 6.67 x 10⁻⁶; 6.94 x 10⁻⁶*
Rif3 28.33* 1.12 x 109 2.42 x 10⁻⁸*
Rif4 33.33* 1.25 x 109 2.85 x 10⁻⁸*
Str36 6.67 1.31 x 10⁹ 5.09 x 10⁻⁹
Nal43 30.00 1.09 x 10⁹ 2.75 x 10⁻⁸
Nal45 26.67 1.47 x 10⁹ 1.81 x 10⁻⁸
Nal48 43.33 1.39 x 10⁹ 3.12 x 10⁻⁸
Nal50 38.33 1.52 x 10⁹ 2.52 x 10⁻⁸
Nal51 23.33 1.22 x 10⁹ 1.91 x 10⁻⁸
Nal54 43.33 1.65 x 10⁹ 2.63 x 10⁻⁸
Nal56 18.33 1.39 x 10⁹ 1.32 x 10⁻⁸
Nal58 30.00 1.46 x 10⁹ 2.05 x 10⁻⁸
Nal59 43.33 1.76 x 10⁹ 2.46 x 10⁻⁸
wt 42.50 1.38 x 10⁹ 3.08 x 10⁻⁸
† Mutation frequency is the ratio of resistant bacteria divided by the total number of bacteria in the
population.
(*) Nalidixic acid resistance.
III – RESULTS
28
4 TESTING THE OCCURRENCE OF CROSS-FEEDING INTERACTION
Why would 10 out of 10 NalR clones, two out of 10 RifR and one out of 10 StrR present an
advantage when rare in competition with the wild-type strain? Is wild-type strain producing or
excreting some metabolite useful to these antibiotic resistant strains? To answer these
questions I seek to explore if stable coexistence between the rare frequency-dependent
clones and the wild-type is due to a cross-feeding interaction. I tested this idea with clone
Nal48. For that, I grew Nal48 frequency-dependent clone, independently, in the supernatant
of wild-type (Swt) and supernatant of Nal48 (SNal) (Figure 13). I expected to observe a
higher growth rate of Nal48 growing in Swt than in SNal. I performed a Student’s t-test to
assess differences between exponential growth in both supernatants. However, I did not find
differences (Student’s t-test, t = 2.477, d.f. = 3, P = 0.089). The end-point of both was similar
(Student’s t-test, t = 0.931, d.f. = 4, P = 0.404).
5 EVALUATION OF RESISTANT CLONES SELECTION METHOD
Such a high incidence of resistant clones with fitness frequency-dependent raised the
question of whether the resistant bacteria selection method favored the selection of clones
with advantage when rare. I isolated new spontaneous nalidixic acid mutants by a different
method. Besides growth of wild-type in LB medium I added another stage for growth
[structured environment] before selecting the resistant clones. I obtained 12 NalR clones from
each method (A and B). Mixture was performed, in method B, only for the first 10 hours. This
period of time refers to the exponential growth phase (when cells are replicating the
emergence of mutants is more likely). I measured the fitness of 24 NalR clones by a 1:1
competition assay against the wild-type.
I expected that clones generated by method B would show a higher incidence rate of
frequency-dependency than clones generated by method A. Clones from method B were
allowed to compete (by mixing) in a heterogeneous environment. If one frequency-dependent
clone appears, it will be in rarity [so, it will have a higher fitness] and will divide more
frequently. Nevertheless, when I mix the environment those „daughter-clones‟ will spread.
Those clones will possibly be again in rarity and will divide more frequently. Hence, every
mixture will result on the spread of the clones. At the time I select clones the probability to
find frequency-dependent clones will be higher.
Results do not support the hypothesis, indicating the opposite. For method A, four of the
12 clones showed a fitness superior to the wild-type (Student’s t-test, P < 0.05). Clones A11
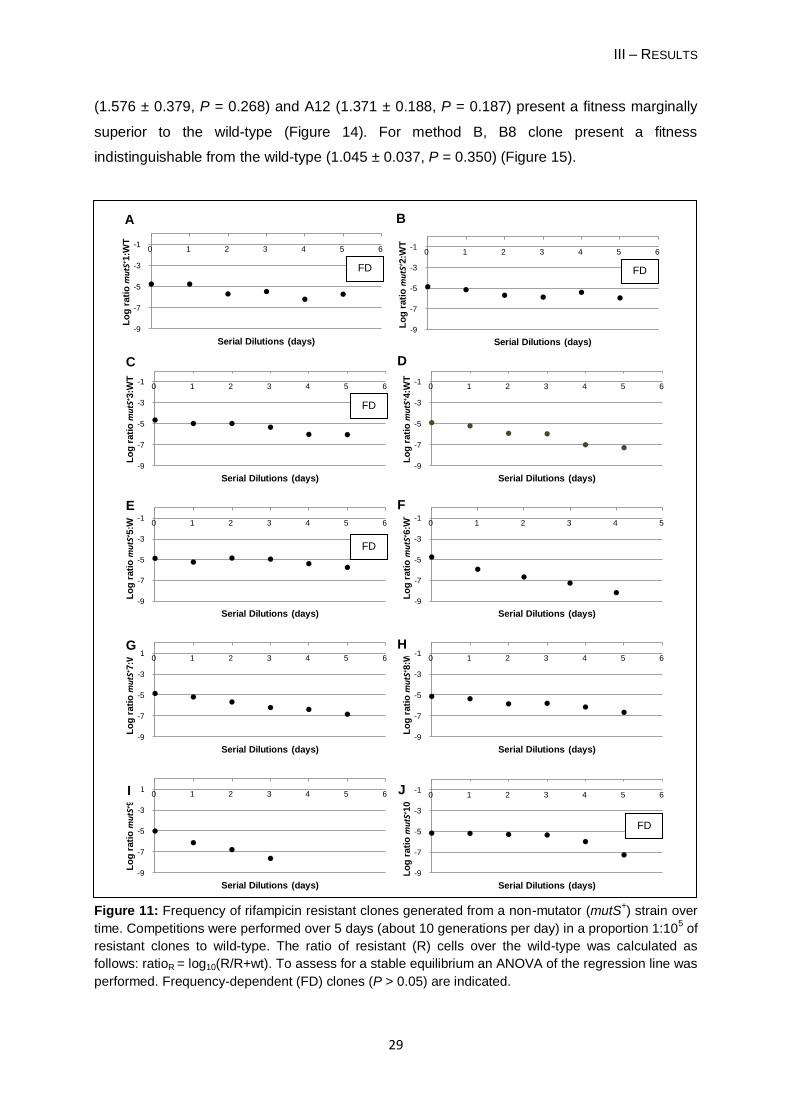
III – RESULTS
29
(1.576 ± 0.379, P = 0.268) and A12 (1.371 ± 0.188, P = 0.187) present a fitness marginally
superior to the wild-type (Figure 14). For method B, B8 clone present a fitness
indistinguishable from the wild-type (1.045 ± 0.037, P = 0.350) (Figure 15).
Figure 11: Frequency of rifampicin resistant clones generated from a non-mutator (mutS+) strain over
time. Competitions were performed over 5 days (about 10 generations per day) in a proportion 1:105 of
resistant clones to wild-type. The ratio of resistant (R) cells over the wild-type was calculated as
follows: ratioR = log10(R/R+wt). To assess for a stable equilibrium an ANOVA of the regression line was
performed. Frequency-dependent (FD) clones (P > 0.05) are indicated.
-9
-7
-5
-3
-10 1 2 3 4 5 6
Lo
g r
ati
o m
utS
+ 1:W
T
Serial Dilutions (days)
-9
-7
-5
-3
-10 1 2 3 4 5 6
Lo
g r
ati
o m
utS
+ 2:W
T
Serial Dilutions (days)
-9
-7
-5
-3
-10 1 2 3 4 5 6
Lo
g r
ati
o m
utS
+ 3:W
T
Serial Dilutions (days)
-9
-7
-5
-3
-10 1 2 3 4 5 6
Lo
g r
ati
o m
utS
+ 4:W
T
Serial Dilutions (days)
-9
-7
-5
-3
-10 1 2 3 4 5 6
Lo
g r
ati
o m
utS
+ 5:W
T
Serial Dilutions (days)
-9
-7
-5
-3
-10 1 2 3 4 5
Lo
g r
ati
o m
utS
+ 6:W
T
Serial Dilutions (days)
-9
-7
-5
-3
-10 1 2 3 4 5 6
Lo
g r
ati
o m
utS
+ 7:W
T
Serial Dilutions (days)
-9
-7
-5
-3
-10 1 2 3 4 5 6
Lo
g r
ati
o m
utS
+ 8:W
T
Serial Dilutions (days)
-9
-7
-5
-3
-10 1 2 3 4 5 6
Lo
g r
ati
o m
utS
+ 9:W
T
Serial Dilutions (days)
-9
-7
-5
-3
-10 1 2 3 4 5 6
Lo
g r
ati
o m
utS
+ 10:W
T
Serial Dilutions (days)
A B
C D
E F
G H
I J
FD
FD
FD FD
FD
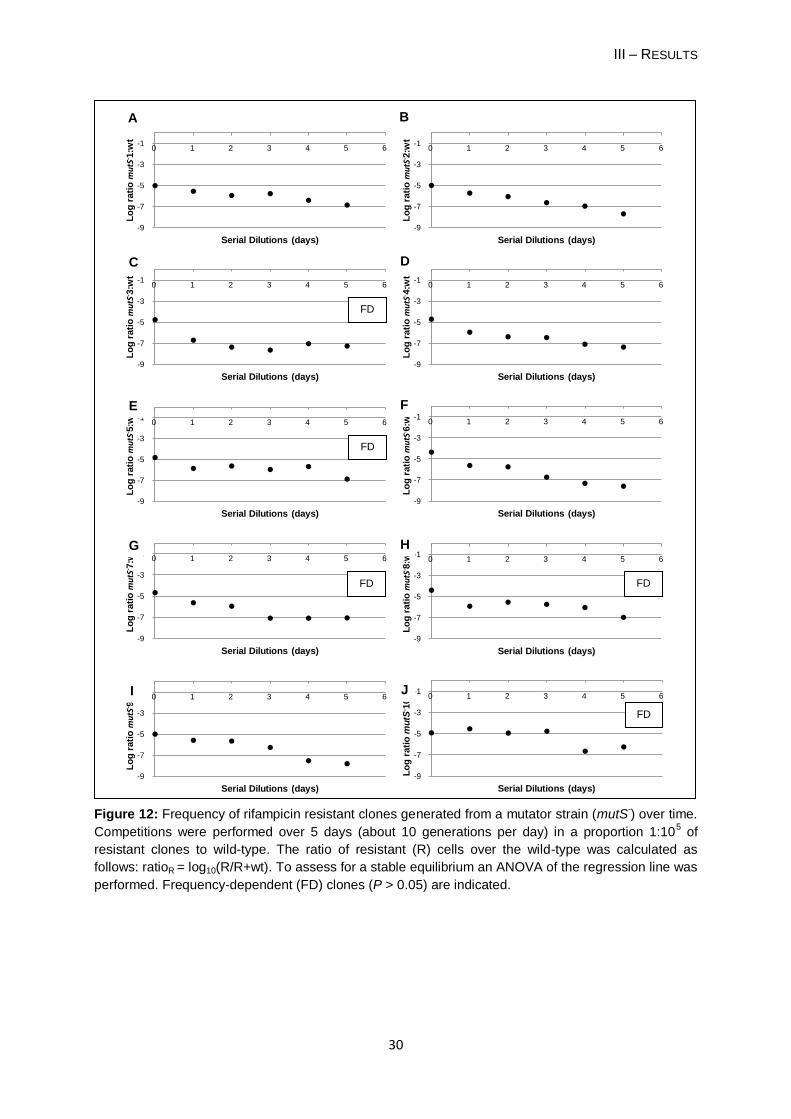
III – RESULTS
30
Figure 12: Frequency of rifampicin resistant clones generated from a mutator strain (mutS-) over time.
Competitions were performed over 5 days (about 10 generations per day) in a proportion 1:105 of
resistant clones to wild-type. The ratio of resistant (R) cells over the wild-type was calculated as
follows: ratioR = log10(R/R+wt). To assess for a stable equilibrium an ANOVA of the regression line was
performed. Frequency-dependent (FD) clones (P > 0.05) are indicated.
-9
-7
-5
-3
-10 1 2 3 4 5 6
Lo
g r
ati
o m
utS
- 1:w
t
Serial Dilutions (days)
-9
-7
-5
-3
-10 1 2 3 4 5 6
Lo
g r
ati
o m
utS
- 2:w
t
Serial Dilutions (days)
-9
-7
-5
-3
-10 1 2 3 4 5 6
Lo
g r
ati
o m
utS
- 3:w
t
Serial Dilutions (days)
-9
-7
-5
-3
-10 1 2 3 4 5 6
Lo
g r
ati
o m
utS
- 4:w
t
Serial Dilutions (days)
-9
-7
-5
-3
-10 1 2 3 4 5 6
Lo
g r
ati
o m
utS
- 5:w
t
Serial Dilutions (days)
-9
-7
-5
-3
-10 1 2 3 4 5 6
Lo
g r
ati
o m
utS
- 6:w
t
Serial Dilutions (days)
-9
-7
-5
-3
-10 1 2 3 4 5 6
Lo
g r
ati
o m
utS
- 7:w
t
Serial Dilutions (days)
-9
-7
-5
-3
-10 1 2 3 4 5 6
Lo
g r
ati
o m
utS
- 8:w
t
Serial Dilutions (days)
-9
-7
-5
-3
-10 1 2 3 4 5 6
Lo
g r
ati
o m
utS
- 9:w
t
Serial Dilutions (days)
-9
-7
-5
-3
-10 1 2 3 4 5 6
Lo
g r
ati
o m
utS
- 10:w
t
Serial Dilutions (days)
A B
C D
E F
G H
I J
FD
FD
FD
FD
FD
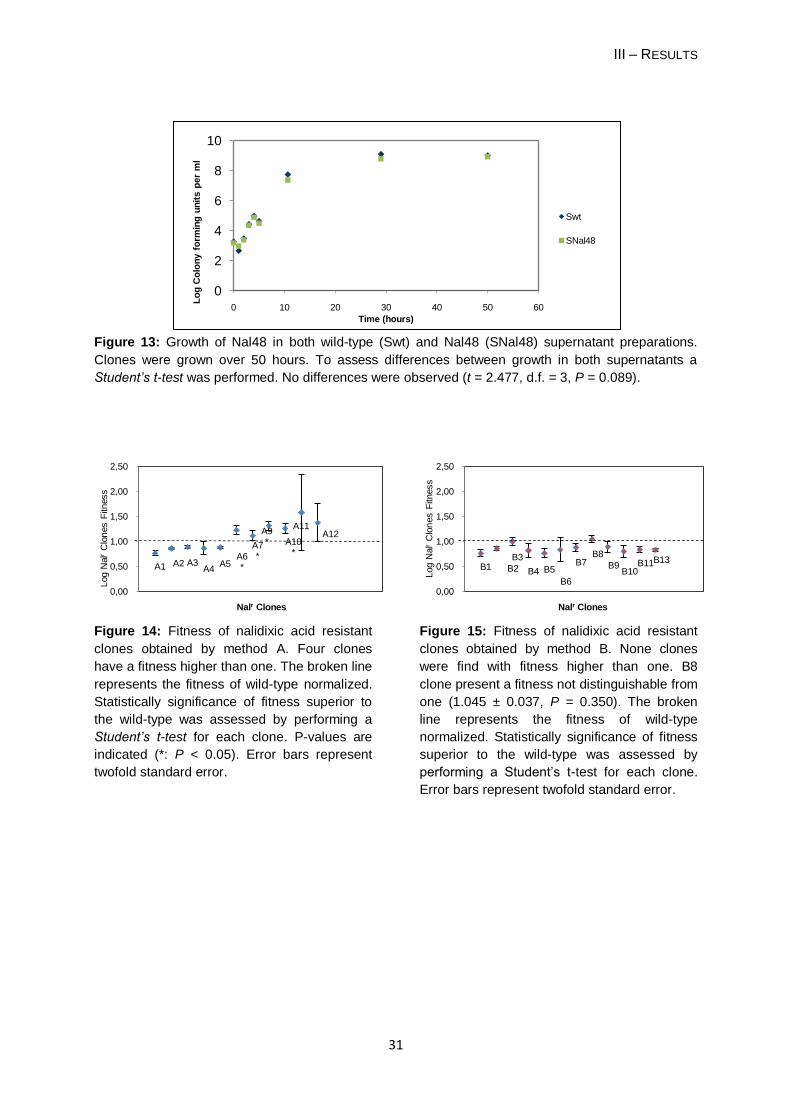
III – RESULTS
31
Figure 13: Growth of Nal48 in both wild-type (Swt) and Nal48 (SNal48) supernatant preparations.
Clones were grown over 50 hours. To assess differences between growth in both supernatants a
Student’s t-test was performed. No differences were observed (t = 2.477, d.f. = 3, P = 0.089).
Figure 14: Fitness of nalidixic acid resistant
clones obtained by method A. Four clones
have a fitness higher than one. The broken line
represents the fitness of wild-type normalized.
Statistically significance of fitness superior to
the wild-type was assessed by performing a
Student’s t-test for each clone. P-values are
indicated (*: P < 0.05). Error bars represent
twofold standard error.
Figure 15: Fitness of nalidixic acid resistant
clones obtained by method B. None clones
were find with fitness higher than one. B8
clone present a fitness not distinguishable from
one (1.045 ± 0.037, P = 0.350). The broken
line represents the fitness of wild-type
normalized. Statistically significance of fitness
superior to the wild-type was assessed by
performing a Student‟s t-test for each clone.
Error bars represent twofold standard error.
0
2
4
6
8
10
0 10 20 30 40 50 60
Lo
g C
olo
ny
fo
rmin
g u
nit
s p
er
ml
Time (hours)
Swt
SNal48
A1 A2 A3A4
A5A6*
A7*
A9* A10
*
A11A12
0,00
0,50
1,00
1,50
2,00
2,50
Log N
alr
Clo
nes F
itness
Nalr Clones
B1 B2
B3
B4 B5
B6
B7B8
B9B10
B11B13
0,00
0,50
1,00
1,50
2,00
2,50
Log N
alr
Clo
nes F
itness
Nalr Clones
IV – DISCUSSION
32
IV – DISCUSSION
This thesis shows that the fitness of 13 out of 30 (43%) spontaneous antibiotic resistant
strains is dependent on their frequency. This means that, if one competes the wild-type strain
with one of these 13 strains, their fitness changes with their frequency in the population. In
particular, when in rarity (competitions 1:10-5), the fitness of our antibiotic resistant clones is
higher than the fitness of the wild-type strain. When common (competition 1:100) the fitness
of antibiotic resistant clones is smaller than the fitness of the wild-type strain. At the stable
equilibrium their fitness equals the wild-type fitness, that is, the fitness of both strains is equal
to one (Figure 10). Such a scenario, where a strain varies its fitness until reaching a stable
coexistence with another one, is defined as “stabilizing frequency-dependent selection”
(Levin, 1988).
The 17 clones of this study that did not show a behavior suggestive of frequency-
dependent selection present a constant disadvantage. In other words, irrespective of their
initial frequency in the competition, their fitness is always smaller than that of the wild-type
clone. In fact, such behavior is not surprising (for example Andersson, 2006, Trindade, et al.,
2009) and would be expected given that mutations to antibiotic resistance are coupled to
cellular physiologic changes. One would expect that these physiological changes impose a
growth cost (Kurland, et al., 1996, Reynolds, 2000, Marcusson, et al., 2009) at all
frequencies.
The set of 13 strains with frequency-dependent fitness is composed of: 10 out of 10 NalR
clones, two out of 10 RifR clones (Rif3 and Rif4) and one out of 10 StrR clone (Str36).
The mutators screening of frequent-dependent clones allows me to demonstrate that the
advantage in rarity is not due to advantageous mutations emerging as the result of a mutator
phenotype.
For competitions 1:1 I expected to observe the loss of the fitness advantage for
frequency-dependent clones. This was confirmed, indeed, as none of those clones showed
an increase in their frequency. Four clones (Rif3, Rif4, Str36 and Nal51) present a fitness
cost shown by a decrease in their frequency. For 8 NalR clones I did not observe a drop of
their frequency over 7 days of competition (~70 generations). In others words, these eight
resistant clones do not present a growth cost. Recently, another study demonstrated that
mutations in gyrA gene conferring resistance to fluoroquinolones did not impose a growth
disadvantage for the bacteria in the absence of antibiotic (Luo, et al., 2005). Therefore, the
same is apparently happening with these 8 clones resistant to the quinolone nalidixic acid.
One to one competitions were performed in parallel in two ways: either the sensitive
strain was a wild-type strain, or the sensitive strain was unable to use arabinose as carbon
source. The two methods gave similar results. Therefore, one may conclude that the two
IV – DISCUSSION
33
methods are equivalent. In fact, the Δara strain has been used as reference for competition
assays in several works (see for example Lenski, et al., 1991, Trindade, et al., 2009).
This fact enabled us to use the Δara strain to perform 1:100 competitions. This time the
sensitive strain is the rare strain. By performing competitions between the wild-type and
resistant cells (in which resistant cells are the majority) I would be unable to discriminate the
two clones. Hence, using the marked strain Δara the discrimination was possible.
I tried to understand why I obtained such a high number of antibiotic resistant clones
having a frequency-dependent fitness. At first, one could think that the phenotype would be
associated or caused by the antibiotic resistance point mutations. Yet, when analyzing the
sequences of genes involved in each antibiotic resistance one can see that similar mutations
result, in most cases, in different behaviors. For example, for the same mutation, one clone
showing a frequency-dependent phenotype, but the other not. Consequently, other mutations
may have occurred elsewhere on the chromosome. This other mutation should explain and
be responsible for the frequency-dependent phenotype. During bacteria replication there are
functions in the cell responsible for keeping mutation rates low [for example, proofreading by
DNA polymerases and DNA repair systems]. Even so, the probability for an error to occur
and consequently a mutation, is in the order of 10-8 in natural isolates (Matic, et al., 1997).
Since frequency-dependent clones already had a mutation responsible for resistance, the
probability that another error in the replication system has occurred is extremely low. The
appearance of another mutation could be explained if bacteria enter in a “transitory mutator
period”, when inhibited by a given antibiotic [when I isolated the resistant clones]. Bacteria
under antibiotic stress are able to produce increased genetic variation (Foster, 1995). In that
period mutations will eventually emerge, for example an antibiotic resistance mutation along
with one responsible for the frequency-dependent phenotype.
Of the three antibiotics used to select resistant clones, one can see that nalidixic acid
resistant clones show the higher incidence of frequency-dependence – all ten clones tested.
It is known that pleiotropic interactions occur between gyrA gene and many other genes
(Jeong, et al., 2006, Drlica, et al., 2009). Hence, if another mutation responsible for the
frequency-dependent phenotype is occurring elsewhere in the chromosome, its effect could
be enhanced by mutations in the gyrA gene.
A chromosomal mutation, besides the one for antibiotic resistance, could be the genetic
cause of occurrence of frequency-dependent phenotype in resistant clones. When I
generated resistant clones, from a mutator strain, I was expecting clones with a higher
number of mutations. Hence, it would be more likely to be frequency-dependent than the
clones generated from the non-mutator strain. Nevertheless, such hypothesis was not
confirmed. Results showed the same number of frequency-dependent clones generated from
both strains (see in this thesis Figures 11 and 12). One possible explanation is the fact that
IV – DISCUSSION
34
mutator organisms, having a higher mutation rate (Matic, et al., 1997), will generate a high
proportion of deleterious mutations (Giraud, et al., 2001). Hence, a mutation for frequency-
dependent phenotype may indeed arise in the population. However, it could be masked due
to deleterious mutations that cause a cost to the bacterial cell.
Frequency-dependent selection in asexual populations was first reported by Levin
(1972). He observed a stable equilibrium between E. coli B and K12 genotypes in a glucose
minimal medium. Nevertheless, the ecological mechanisms underlying the coexistence were
not clarified (Levin, 1972). In this study, I used a rich and density-limiting culture medium.
The role played by a mutation responsible for the frequency-dependent phenotype was
investigated. I analyzed two hypotheses: a cross-feeding interaction and an antagonistic
interaction.
The extra mutation may enable the rare resistant cells to be efficient in consuming some
extracellular compound released by the wild-type cells. Such extracellular compound could
be a result of cell metabolism or dead of wild-type cells. Hence, when wild-type cells are the
majority in the population there is a large density of that putative compound in the
environment. Resistant clones at a low frequency are all able to exploit it, accelerating their
growth. With the increase in the resistant cells‟ frequency [consequently, wild-type cells
decrease] the extracellular compound will be shared by a higher number of cells. Hence, it
will not be available for all, which is reflected in a reduction in the resistant cells growth and
frequency. Several studies suggest the existence of such a cross-feeding interaction in the
maintenance of coexistence in populations (Turner, et al., 1996, Rozen & Lenski, 2000). In
most of these cases, cross-feeding interaction is coupled with a demographic trade-off,
where the genotypes are more efficient to use different compounds from the environment.
Rosenzweig and colleagues demonstrated that in a long-term experiment, stable
polymorphisms emerge as a result of bacterial evolution of an acetate cross-feeding
interaction. One genotype secretes acetate coupled with a high rate of glucose uptake and
the other harbors a mutation that causes semiconstitutive overexpression of acetyl CoA
synthetase (Rosenzweig, et al., 1994). However, in the present work I did not find differences
between Nal48 growth in both wild-type and Nal48 supernatants.
The occurrence of a demographic trade-off was not considered. A rich medium is
composed by several sugars for bacterial growth. Resistant and susceptible bacteria could
be using different sugars, therefore not being in a direct competition. However, if the
competitions were to be performed in minimal medium, which is composed only of one sugar
[for example, glucose], the stable coexistence should disappear. Nevertheless, competitions
between frequency-dependent clones and wild-type in minimal medium were performed and
stable coexistence was still observed (Dionisio, et al., unpublished results).
IV – DISCUSSION
35
Secondly, the mutation could lead to expression of some membrane protein that
somehow inhibits the maximum growth rate of common wild-type cells. This inhibition would
be possible only through cell-to-cell contact. As a result, rare resistant clones would be able
to increase in frequency. A previous study found such an antagonistic interaction, defined as
“stationary phase contact-dependent inhibition”, between ancestral and inhibitory evolved
bacteria (Lemonnier, et al., 2008). This study suggests that the inhibition is caused by
mutations in glgC gene, involved in the glycogen synthesis pathway. However, the
mechanism underlying the contact inhibition was not clarified. They also refer that bacteria
harboring such mutations may engender some fitness costs that will not enable them to
increase in frequency when in rarity (Chao & Levin, 1981). Yet, Lemonier et al. (2008)
assume that it is possible that rare bacteria increase in frequency if their costs were
compensated by a higher rate of mortality of inhibited bacteria. This hypothesis deserves
further research. For future studies, I propose the “U-tubes” experimental protocol carried out
by Lemonnier et al. (2008) to find if a cell-cell contact for inhibition takes place. If rare,
frequency-dependent clones have a higher probability to form cellular aggregates (contact)
with sensitive bacteria. Therefore, I would observe an advantage for resistant clones. When I
compete the clones in similar proportions (1:1), resistant clones will have a smaller
probability to form aggregates with susceptible ones. Resistant cells will probably form
aggregates more easily with “sister-cells” than before (1:10-5 competition). Thus, resistant
clones will not gain enough advantage and will decrease its frequency as a result of the
fitness cost of harboring such a mutation. I believe that cell-cell contact takes place only at
(or close to) stationary-phase, when there is a high cell density.
I do not think the scenario where frequency-dependent clones have an advantage by
releasing a toxin into the environment. If this happened, when I performed competitions in
equal proportions (1:1) of resistant and susceptible clones I should still observe an
advantage for resistant clones, and consequently, a frequency decrease of susceptible one.
Yet, in those competitions resistant clones did not show an advantage. Moreover, in
competitions 1:10-5, one would have to postulate an extremely high amount of toxin produced
by the resistant clones (see also Chao & Levin, 1981).
Some studies assume that stable coexistence may be also influenced by extrinsic
factors (Ayala, 1969, Icenhour, et al., 2006). Ayala (1969) showed that the resultant stable
equilibrium between two species of Drosophila was temperature dependent by mediating the
fitness of the larval and adult forms. Frequency-dependency and stable coexistence of
bacterial populations may be under laboratory dependence. Laboratory dependence occurs
when organisms cultured in different locations behave in a different way. In another study, a
stable equilibrium between two strains of E. coli was modified depending on which laboratory
the strains were cultured. In this study, O‟Keefe and colleagues found that differences in the
IV – DISCUSSION
36
stable equilibrium were not due to bacterial changes. Instead, differences were owing to
differences in the growth culture medium, in particular the composition of deionized water
(O'Keefe, et al., 2006).
Upon the observation of such a high incidence of frequency-dependency, a question
arose. Frequency-dependent clones appear naturally so often in LB medium or, on the
contrary, they appear more scarcely but, due to their growth advantage in rarity, the clones
show up more frequently? If the latter happens, frequency-dependent clones will have higher
probability of being selected when resistant clones are isolated. I tested this hypothesis.
However, the outcomes of the experiments did not corroborate the hypothesis. Indeed,
results were the opposite of what I was expecting. Perhaps I did not undergo an efficient
mixture for frequency-dependent clones competition. In addition, I performed the mixture
(method B) only during exponential phase (first 10 hours). However, it has been described
that in stationary-phase and under stress [caused by starvation] bacteria increase
mutagenesis as a strategy for bacterial adaptive evolution (Bjedov, et al., 2003). The
experimental protocols could be further improved along with a larger sample to allow
comparisons.
Let's hypothesize that this phenomenon was not confined only to resistant bacteria, but
could exist in other bacteria that establish a stable equilibrium with others. For example,
regarding an infectious bacterial disease, a genotype that is at a low frequency would better
escape from host response. The explanation will be that the immune system will respond
only to the most common genotype. Indeed, in a very recent study regarding the dynamics of
commensal bacteria that typically colonize humans, it was observed that different strains of
some species seem to stable coexist. If one of these strains is pathogenic and is at low
frequency, it could trigger an infectious disease without opposition from the immune system.
Indeed, some species are able to colonize and increase their infectious load when other
species pre-colonize (Margolis, et al., 2010).
V – CONCLUSION
37
V – CONCLUSION I reported here the pervasive occurrence of stabilizing frequency-dependent selection in
bacterial populations. Such phenomenon contributes to maintenance of genetic
polymorphisms and is one of several other mechanisms driving the genetic diversity of
bacterial populations. Furthermore, I reported here that frequency-dependent selection
occurs in antibiotic resistant bacteria. This phenomenon could counteract antibiotic
resistance eradication in the absence of antibiotic selective pressure, in addition to other well
studied phenomena: compensatory mutations, epistasis, no cost-mutations and co-selection.
This thesis reinforces the idea that the avoidance of antibiotics for a certain period of
time will not reverse the antibiotic resistance clinical problem (Levin, 2001). The
reintroduction of the antibiotic to treat the infectious disease will allow rare resistant bacteria
to have a selective advantage over the sensitive ones, reaching high frequencies at a much
faster rate (De Gelder, et al., 2004). Highlighting the above, in United Kingdom between
1991 and 1999 consumption of cotrimoxazole [a combination of trimethoprim and
sulfamethoxazole] was reduced by 97%, but even that did not result in a reduction in
sulfamethoxazole resistance. An update in 2004 showed that sulfamethoxazole resistance in
E. coli had remained stable (Bean, et al., 2005), perhaps by frequency-dependent selection
or one of the others mechanisms maintaining resistance in the environment.
Further investigation is required concerning the role of frequency-dependent selection in
the dynamics of bacterial populations and more importantly in antibiotic resistant bacteria.
Thus, it is necessary to develop new therapeutics that replace antibiotics in treating bacterial
infections. This need is the basis of the recent development of prophylactic therapeutics,
such as bacterial interference, bacterial vaccines and phage therapy.
VI – REFERENCES
38
VI – REFERENCES Andersson DI (2006) The biological cost of mutational antibiotic resistance: any practical conclusions?
Curr Opin Microbiol 9: 461-465.
Andersson DI & Levin BR (1999) The biological cost of antibiotic resistance. Curr Opin Microbiol 2:
489-493.
Andersson DI & Hughes D (2010) Antibiotic resistance and its cost: is it possible to reverse resistance? Nat Rev Microbiol 8: 260-271.
Atwood KC, Schneider LK & Ryan FJ (1951) Periodic selection in Escherichia coli. Proc Natl Acad Sci U S A 37: 146-155.
Ayala FG & Campbell CA (1974) Frequency-dependent selection. Annual Review of Ecology and Systematics 5: 115-138.
Ayala FJ (1969) Experimental invalidation of the principle of competitive exclusion. Nature 224: 1076-
1079.
Ayala FJ (1971) Competition between Species: Frequency Dependence. Science 171: 820-824.
Ballicora MA, Iglesias AA & Preiss J (2003) ADP-glucose pyrophosphorylase, a regulatory enzyme for bacterial glycogen synthesis. Microbiol Mol Biol Rev 67: 213-225, table of contents.
Bean DC, Livermore DM, Papa I & Hall LM (2005) Resistance among Escherichia coli to sulphonamides and other antimicrobials now little used in man. J Antimicrob Chemother 56:
962-964.
Bennett PM (2008) Plasmid encoded antibiotic resistance: acquisition and transfer of antibiotic resistance genes in bacteria. Br J Pharmacol 153 Suppl 1: S347-357.
Bjedov I, Tenaillon O, Gerard B, et al. (2003) Stress-induced mutagenesis in bacteria. Science 300:
1404-1409.
Bjorkman J & Andersson DI (2000) The cost of antibiotic resistance from a bacterial perspective. Drug Resist Updat 3: 237-245.
Bjorkman J, Hughes D & Andersson DI (1998) Virulence of antibiotic-resistant Salmonella typhimurium. Proc Natl Acad Sci U S A 95: 3949-3953.
Bouma JE & Lenski RE (1988) Evolution of a bacteria/plasmid association. Nature 335: 351-352.
Chao L & Levin BR (1981) Structured habitats and the evolution of anticompetitor toxins in bacteria. Proc Natl Acad Sci U S A 78: 6324-6328.
Chao L, Levin BR & Stewart FM (1977) Complex Community in a Simple Habitat - Experimental-Study with Bacteria and Phage. Ecology 58: 369-378.
Cooper TF & Heinemann JA (2000) Postsegregational killing does not increase plasmid stability but acts to mediate the exclusion of competing plasmids. Proc Natl Acad Sci U S A 97: 12643-
12648.
Cooper TF & Heinemann JA (2005) Selection for plasmid post-segregational killing depends on multiple infection: evidence for the selection of more virulent parasites through parasite-level competition. Proc Biol Sci 272: 403-410.
Criswell D, Tobiason VL, Lodmell JS & Samuels DS (2006) Mutations conferring aminoglycoside and spectinomycin resistance in Borrelia burgdorferi. Antimicrob Agents Chemother 50: 445-452.
Dahlberg C & Chao L (2003) Amelioration of the cost of conjugative plasmid carriage in Eschericha coli K12. Genetics 165: 1641-1649.
VI – REFERENCES
39
De Gelder L, Ponciano JM, Abdo Z, Joyce P, Forney LJ & Top EM (2004) Combining mathematical models and statistical methods to understand and predict the dynamics of antibiotic-sensitive mutants in a population of resistant bacteria during experimental evolution. Genetics 168: 1131-
1144.
Dionisio F, Conceicao IC, Marques AC, Fernandes L & Gordo I (2005) The evolution of a conjugative plasmid and its ability to increase bacterial fitness. Biol Lett 1: 250-252.
Domingues I (2010) Comportamento social em populações bacterianas. MSc thesis Thesis, Faculdade de Ciências da Universidade de Lisboa.
Drlica K, Hiasa H, Kerns R, Malik M, Mustaev A & Zhao X (2009) Quinolones: action and resistance updated. Curr Top Med Chem 9: 981-998.
Elena SF, Miralles R & Moya A (1997) Frequency-dependent selection in a mammalian RNA virus. Evolution 51: 984-987.
Enne VI, Bennett PM, Livermore DM & Hall LM (2004) Enhancement of host fitness by the sul2-coding plasmid p9123 in the absence of selective pressure. J Antimicrob Chemother 53: 958-963.
Foster P (1995) Adaptive mutation. Population genetics of bacteria,(Baumberg S, Young JPW, Wellington EMH & Saunders JR, ed.^eds.), p.^pp. 13 - 30. Cambridge University Press, Cambridge.
Frost LS, Leplae R, Summers AO & Toussaint A (2005) Mobile genetic elements: the agents of open source evolution. Nat Rev Microbiol 3: 722-732.
Gagneux S, Long CD, Small PM, Van T, Schoolnik GK & Bohannan BJ (2006) The competitive cost of antibiotic resistance in Mycobacterium tuberculosis. Science 312: 1944-1946.
Gerdes K (2000) Toxin-antitoxin modules may regulate synthesis of macromolecules during nutritional stress. J Bacteriol 182: 561-572.
Gerdes K, Christensen SK & Lobner-Olesen A (2005) Prokaryotic toxin-antitoxin stress response loci. Nat Rev Microbiol 3: 371-382.
Gillespie SH (2001) Antibiotic resistance in the absence of selective pressure. Int J Antimicrob Agents 17: 171-176.
Giraud A, Matic I, Tenaillon O, Clara A, Radman M, Fons M & Taddei F (2001) Costs and benefits of high mutation rates: adaptive evolution of bacteria in the mouse gut. Science 291: 2606-2608.
Hanson DK, Tiede DM, Nance SL, Chang CH & Schiffer M (1993) Site-specific and compensatory mutations imply unexpected pathways for proton delivery to the QB binding site of the photosynthetic reaction center. Proc Natl Acad Sci U S A 90: 8929-8933.
Hardin G (1960) The competitive exclusion principle. Science 131: 1292-1297.
Helling RB, Vargas CN & Adams J (1987) Evolution of Escherichia coli during growth in a constant environment. Genetics 116: 349-358.
Hori M (1993) Frequency-dependent natural selection in the handedness of scale-eating cichlid fish. Science 260: 216-219.
Icenhour CR, Arnold J, Medvedovic M & Cushion MT (2006) Competitive coexistence of two Pneumocystis species. Infect Genet Evol 6: 177-186.
Jaffe A, Ogura T & Hiraga S (1985) Effects of the ccd function of the F plasmid on bacterial growth. J Bacteriol 163: 841-849.
Jeong KS, Xie Y, Hiasa H & Khodursky AB (2006) Analysis of pleiotropic transcriptional profiles: a case study of DNA gyrase inhibition. PLoS Genet 2: e152.
VI – REFERENCES
40
Johnsen PJ, Townsend JP, Bohn T, Simonsen GS, Sundsfjord A & Nielsen KM (2009) Factors affecting the reversal of antimicrobial-drug resistance. Lancet Infect Dis 9: 357-364.
Kugelberg E, Lofmark S, Wretlind B & Andersson DI (2005) Reduction of the fitness burden of quinolone resistance in Pseudomonas aeruginosa. J Antimicrob Chemother 55: 22-30.
Kurland CG, Hughes D & Ehrenberg M (1996) Escherichia Coli and Salmonella: Cellular and Molecular. American Society for Microbiology, Washington DC.
LeClerc JE, Li B, Payne WL & Cebula TA (1996) High mutation frequencies among Escherichia coli and Salmonella pathogens. Science 274: 1208-1211.
Lederberg J & Lederberg EM (1952) Replica plating and indirect selection of bacterial mutants. J Bacteriol 63: 399-406.
Lemonnier M, Levin BR, Romeo T, et al. (2008) The evolution of contact-dependent inhibition in non-growing populations of Escherichia coli. Proc Biol Sci 275: 3-10.
Lenski RE (1991) Quantifying fitness and gene stability in microorganisms. Biotechnology 15: 173-
192.
Lenski RE (1998) Bacterial evolution and the cost of antibiotic resistance. Int Microbiol 1: 265-270.
Lenski RE & Hattingh SE (1986) Coexistence of two competitors on one resource and one inhibitor: a chemostat model based on bacteria and antibiotics. J Theor Biol 122: 83-93.
Lenski RE, Rose MR, Simpson SC & Tadler SC (1991) Long-term Experimental Evolution in Escherichia coli. I. Adaptation and divergence during 2,000 generations. American Naturalist 138: 1315 - 1341.
Levin BR (1972) Coexistence of two asexual strains on a single resource. Science 175: 1272-1274.
Levin BR (1981) Periodic selection, infectious gene exchange and the genetic structure of E. coli populations. Genetics 99: 1-23.
Levin BR (1988) Frequency-dependent selection in bacterial populations. Philos Trans R Soc Lond B Biol Sci 319: 459-472.
Levin BR (2001) Minimizing potential resistance: a population dynamics view. Clin Infect Dis 33 Suppl 3: S161-169.
Levin BR & Lenski RE (1983) Coevolution in bacteria and their viruses and plasmids. Sunderland, Massachusetts: Sinauer Associates.
Lipsitch M & Levin BR (1997) The population dynamics of antimicrobial chemotherapy. Antimicrob Agents Chemother 41: 363-373.
Luo N, Pereira S, Sahin O, Lin J, Huang S, Michel L & Zhang Q (2005) Enhanced in vivo fitness of fluoroquinolone-resistant Campylobacter jejuni in the absence of antibiotic selection pressure. Proc Natl Acad Sci U S A 102: 541-546.
Maisnier-Patin S, Paulander W, Pennhag A & Andersson DI (2007) Compensatory evolution reveals functional interactions between ribosomal proteins S12, L14 and L19. J Mol Biol 366: 207-215.
Marcusson LL, Frimodt-Moller N & Hughes D (2009) Interplay in the selection of fluoroquinolone resistance and bacterial fitness. PLoS Pathog 5: e1000541.
Margolis E, Yates A & Levin BR (2010) The ecology of nasal colonization of Streptococcus pneumoniae, Haemophilus influenzae and Staphylococcus aureus: the role of competition and interactions with host's immune response. BMC Microbiol 10: 59.
Martinez JL, Fajardo A, Garmendia L, Hernandez A, Linares JF, Martinez-Solano L & Sanchez MB (2009) A global view of antibiotic resistance. FEMS Microbiol Rev 33: 44-65.
VI – REFERENCES
41
Matic I, Rayssiguier C & Radman M (1995) Interspecies gene exchange in bacteria: the role of SOS and mismatch repair systems in evolution of species. Cell 80: 507-515.
Matic I, Radman M, Taddei F, et al. (1997) Highly variable mutation rates in commensal and pathogenic Escherichia coli. Science 277: 1833-1834.
Mulvey M & Simon A (2009) Antimicrobial resistance in hospitals: How concerned should we be? Canadian Medical Association Journal 180: 408-415.
Nagaev I, Bjorkman J, Andersson DI & Hughes D (2001) Biological cost and compensatory evolution in fusidic acid-resistant Staphylococcus aureus. Mol Microbiol 40: 433-439.
O'Keefe KJ, Morales NM, Ernstberger H, Benoit G & Turner PE (2006) Laboratory-dependent bacterial ecology: a cautionary tale. Appl Environ Microbiol 72: 3032-3035.
Oliver A, Canton R, Campo P, Baquero F & Blazquez J (2000) High frequency of hypermutable Pseudomonas aeruginosa in cystic fibrosis lung infection. Science 288: 1251-1254.
Pandey DP & Gerdes K (2005) Toxin-antitoxin loci are highly abundant in free-living but lost from host-associated prokaryotes. Nucleic Acids Res 33: 966-976.
Picard B, Duriez P, Gouriou S, Matic I, Denamur E & Taddei F (2001) Mutator natural Escherichia coli isolates have an unusual virulence phenotype. Infect Immun 69: 9-14.
Ramadhan AA & Hegedus E (2005) Survivability of vancomycin resistant enterococci and fitness cost of vancomycin resistance acquisition. J Clin Pathol 58: 744-746.
Reeves P (1972) The Bacteriocins. Springer-Verlag, New York.
Reichler MR, Allphin AA, Breiman RF, et al. (1992) The spread of multiply resistant Streptococcus pneumoniae at a day care center in Ohio. J Infect Dis 166: 1346-1353.
Reynolds MG (2000) Compensatory evolution in rifampin-resistant Escherichia coli. Genetics 156: 1471-1481.
Rodriguez-Noriega E, Seas C, Guzman-Blanco M, et al. (2010) Evolution of methicillin-resistant Staphylococcus aureus clones in Latin America. Int J Infect Dis 14: e560-566.
Rosenzweig RF, Sharp RR, Treves DS & Adams J (1994) Microbial evolution in a simple unstructured environment: genetic differentiation in Escherichia coli. Genetics 137: 903-917.
Rozen DE & Lenski RE (2000) Long-Term Experimental Evolution in Escherichia coli. VIII. Dynamics of a Balanced Polymorphism. Am Nat 155: 24-35.
Santos LC, Bousquet Hde M, Pereira AM, Junqueira-Kipnis AP & Kipnis A (2010) A high prevalence of resistance in new tuberculosis cases of midwestern Brazil. Infect Genet Evol 10: 1052-1057.
Schrag SJ & Perrot V (1996) Reducing antibiotic resistance. Nature 381: 120-121.
Schrag SJ, Perrot V & Levin BR (1997) Adaptation to the fitness costs of antibiotic resistance in Escherichia coli. Proc Biol Sci 264: 1287-1291.
Silva R (2010) Study of the biological cost of antibiotic resistance: interaction between conjugative plasmids and resistance mutations. MSc Thesis, Faculdade de Ciências da Universidade de Lisboa.
Stewart FM & Levin BR (1984) The population biology of bacterial viruses: why be temperate. Theor Popul Biol 26: 93-117.
Trindade S, Sousa A, Xavier KB, Dionisio F, Ferreira MG & Gordo I (2009) Positive epistasis drives the acquisition of multidrug resistance. PLoS Genet 5: e1000578.
Tubulekas I & Hughes D (1993) Suppression of rpsL phenotypes by tuf mutations reveals a unique relationship between translation elongation and growth rate. Mol Microbiol 7: 275-284.
VI – REFERENCES
42
Turner PE, Souza V & Lenski RE (1996) Tests of ecological mechanisms promoting the stable coexistence of two bacterial genotypes. Ecology 77: 2119-2129.
Van Melderen L & Saavedra De Bast M (2009) Bacterial toxin-antitoxin systems: more than selfish entities? PLoS Genet 5: e1000437.
Walsh C (2000) Molecular mechanisms that confer antibacterial drug resistance. Nature 406: 775-781.
Ward H, Perron GG & Maclean RC (2009) The cost of multiple drug resistance in Pseudomonas aeruginosa. J Evol Biol 22: 997-1003.
Whittle G, Shoemaker NB & Salyers AA (2002) The role of Bacteroides conjugative transposons in the dissemination of antibiotic resistance genes. Cell Mol Life Sci 59: 2044-2054.
Woodford N & Livermore DM (2009) Infections caused by Gram-positive bacteria: a review of the global challenge. J Infect 59 Suppl 1: S4-16.
Wright S & Dobzhansky T (1946) Genetics of Natural Populations. Xii. Experimental Reproduction of Some of the Changes Caused by Natural Selection in Certain Populations of Drosophila Pseudoobscura. Genetics 31: 125-156.
Yuste E, Moya A & Lopez-Galindez C (2002) Frequency-dependent selection in human immunodeficiency virus type 1. J Gen Virol 83: 103-106.