tratamento atual do cÂncer renal metastÁtico · declaração sobre potenciais conflitos de...
TRANSCRIPT
TRATAMENTO ATUAL DO
CÂNCER RENAL
METASTÁTICO
Andrey SoaresOncologista Clínico Centro Paulista de Oncologia e
Hospital Israelita Albert Einstein – SP
Chair LACOG – GU
@SoaresAndrey
Declaração sobre Potenciais Conflitos de
InteresseDe acordo com a Resolução 1931/2009 do Conselho Federal de Medicina e com a RDC 96 / 2008 da ANVISA, declaro que:
• Apresentações: como palestrante convidado, participo dos eventos de: Janssen, Pfizer, Bayer, Novartis, Astra Zeneca, Astellas, Pierre-Fabre, Merck-Serono, Sanofi, Roche.
• Consultoria: como membro de advisory boards, participo de reuniões com: Astellas, Janssen, Roche, Bayer, Lilly, Astra Zeneca, Novartis, MSD, BMS.
Não possuo ações de quaisquer destas companhias farmacêuticas.
Os meus pré-requisitos para participar destas atividades são a autonomia do pensamento científico, a independência de opiniões e a liberdade de expressão, aspectos que esta empresa respeita.

Câncer Renal: Epidemiologia
• 3 a 4% das neoplasias
• 80 a 85% das neoplasias renais são carcinoma de células
claras
• 4170 casos novos no Brasil em 2008
• Incidência dos tumores renais vem aumentando
• Idade média de diagnóstico – 65 anos.
• No Brasil 45% dos pacientes apresentam-se com
• doença localizada, 25% com doença localmente
• avançada e 30% com doença metastática
• Até 40% desenvolve metástase após nefrectomia

What Clinical Prognostic
Factors Influence Patient
Outcome? MSKCC Prognostic Factors
Karnofsky performance status (<80%)
LDH >1.5 ULN
Low hemoglobin (<LLN)
High calcium (>10 mg/dL)
Time from diagnosis to treatment
(<1 year)
Prognostic Groups
Favorable risk: 0 risk factors
Intermediate risk: 1–2 risk factors
Poor risk: ≥3 risk factors
LDH, lactate dehydrogenase; ULN, upper limit of normal; LLN, lower limit of normal.
Motzer RJ, et al. J Clin Oncol. 2002;20:289−296.

IL-2
Fyfe G, et al. J Clin Oncol. 1995 Mar;13(3):688-96.

Phase III Trial of Sunitinib vs IFN-α
as First-line Treatment in Pts With
mRCC: PFS
J Clin Oncol. 2009;27:3584–3590
PF
S (
%)
Mos
Sunitinib (n = 375)
IFN-α (n = 375)
HR: 0.538 (95% CI: 0.439-0.658; P <
.000001)
Median PFS,
Mos (95% CI)
11.0 (10.7-13.4)
5.1 (3.9-5.6)
100
90
80
70
60
50
40
30
20
10
00 5 10 15 20 25 30
A randomized phase III trial in previously untreated metastatic RCC with clear cell component
ORR 47% vs 12%, p<.001

Motzer RJ, et al. N Engl J Med. 2013;369:722-731.
Phase III COMPARZ Trial: No
Difference in PFS With First-line
Sunitinib vs Pazopanib in mRCC
Sunitinib (n = 553)
Pazopanib (n = 557)
Median PFS,
Mos (95% CI)
9.5 (8.3-11.1)
8.4 (8.3-10.9)
6
0
0 4 8 12 16 20 24 28 32 36 40
10
0
PF
S (
%)
Mos
80
40
20
0
HR: 1.05 (95% CI: 0.90-1.22)
A randomized phase III trial in patients with previously untreated clear-cell, metastatic RCC

First-line treatment landscape
Study N ORR (%) Median PFS (months) Final Median OS (months)
Phase III
Sunitinib vs. IFN-α1 750 47 vs. 12 11 vs. 5; p<0.001 26.4 vs. 21.8; p=0.051
Bev + IFN-α vs. IFN-α2 649 31 vs. 12 10.4 vs. 5.5; p<.001 23.3 vs. 21.3; p=0.1291
Bev + IFN-α vs. IFN-α3 732 25.5 vs. 13.1
8.4 vs. 4.9; p<0.0001 18.3 vs. 17.4; p=0.069
Pazopanib vs. placebo4 233 32 vs. 3 11.1 vs. 2.8;
p<0.0000001
22.9 vs. 23.55; p=0.525
Temsirolimus vs. IFN-α5 626 8.6 vs. 4.8 5.5 vs. 3.1; p<0.001 10.9 vs. 7.3; p=0.0069
Pazopanib vs. sunitinib6 1110 31 vs. 25 8.4 vs. 9.5; Non-
inferior
28.4 vs. 29.3; Non-inferior
Phase II
Sorafenib vs. IFN-α7 189 5.2 vs. 8.7 5.7 vs. 5.6; p=0.504 NA
1. Motzer RJ, et al. J Clin Oncol. 2009;27:3584–3590; 2. Escudier B, et al. J Clin Oncol. 2009;27(Suppl 15S):5020 (Abstract);
3. Rini B, et al. J Clin Oncol. 2009;27(Suppl 15S):LBA5019 (Abstract); 4. Sternberg C, et al. J Clin Oncol. 2010;28:1061–1068;
5. Hudes G, et al. N Engl J Med. 2007;356:2271–2281;
6. Motzer RJ et al. N Engl J Med. 2013;369:722–731; 7. Escudier B, et al. J Clin Oncol. 2009;27:1280–1289;
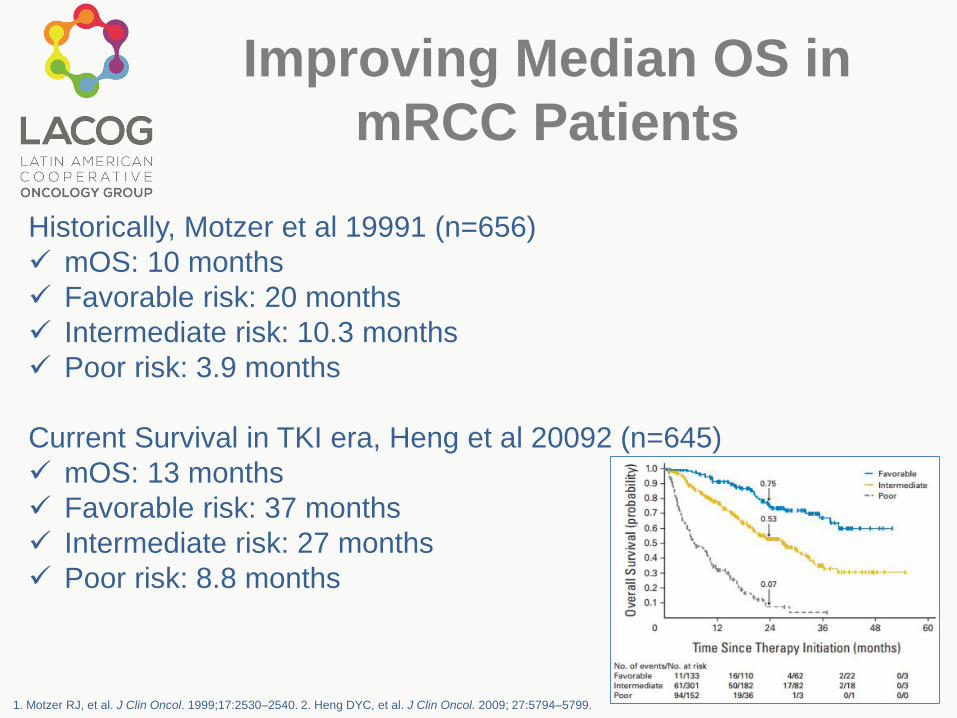
Improving Median OS in
mRCC Patients
Historically, Motzer et al 19991 (n=656)
mOS: 10 months
Favorable risk: 20 months
Intermediate risk: 10.3 months
Poor risk: 3.9 months
Current Survival in TKI era, Heng et al 20092 (n=645)
mOS: 13 months
Favorable risk: 37 months
Intermediate risk: 27 months
Poor risk: 8.8 months
1. Motzer RJ, et al. J Clin Oncol. 1999;17:2530–2540. 2. Heng DYC, et al. J Clin Oncol. 2009; 27:5794–5799.
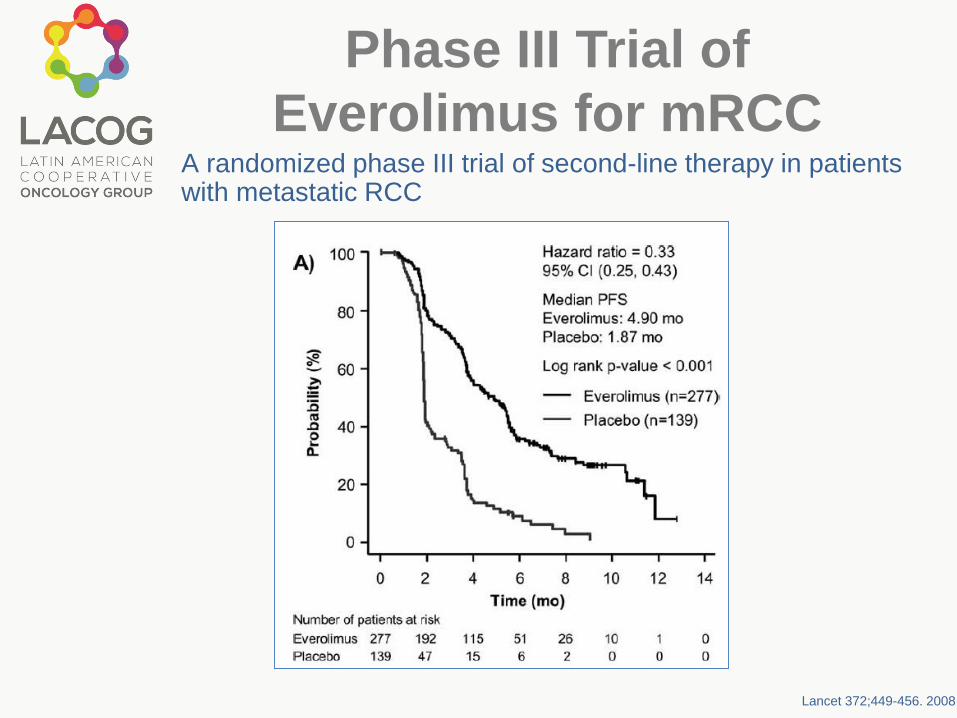
Phase III Trial of
Everolimus for mRCCA randomized phase III trial of second-line therapy in patients with metastatic RCC
Lancet 372;449-456. 2008
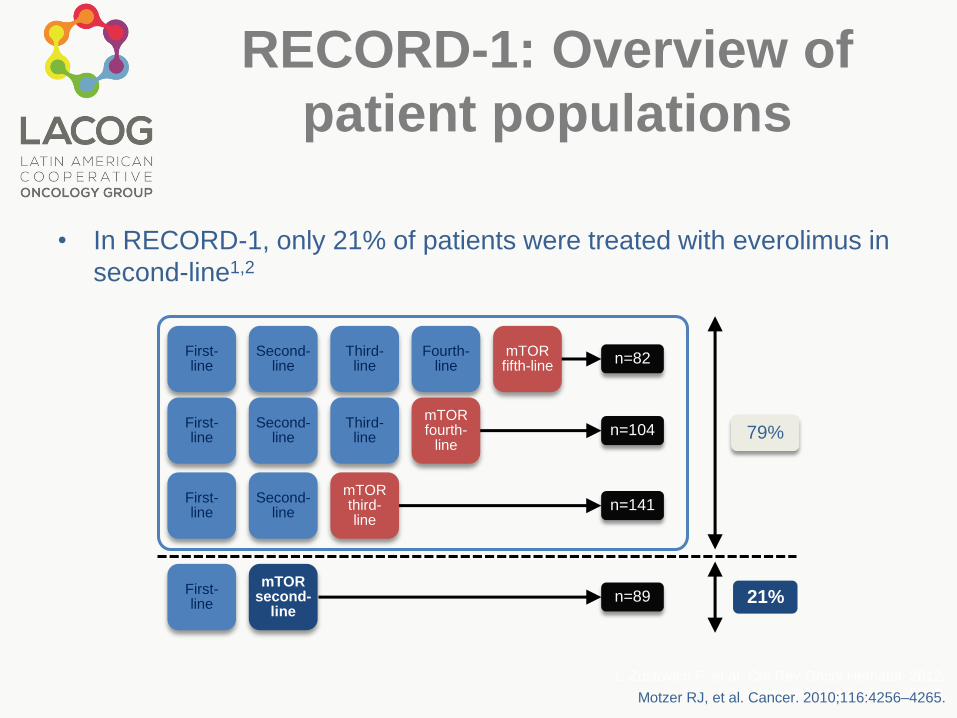
RECORD-1: Overview of
patient populations
• In RECORD-1, only 21% of patients were treated with everolimus in
second-line1,2
First-line
Second-line
Third-line
Fourth-line
n=82
n=104
n=141
n=89
First-line
Second-line
Third-line
First-line
Second-line
First-line
79%
21%
mTORfifth-line
mTORfourth-
line
mTORthird-line
mTORsecond-
line
1. Zustovich F, et al. Crit Rev Oncol Hematol. 2012;
2. Motzer RJ, et al. Cancer. 2010.Motzer RJ, et al. Cancer. 2010;116:4256–4265.
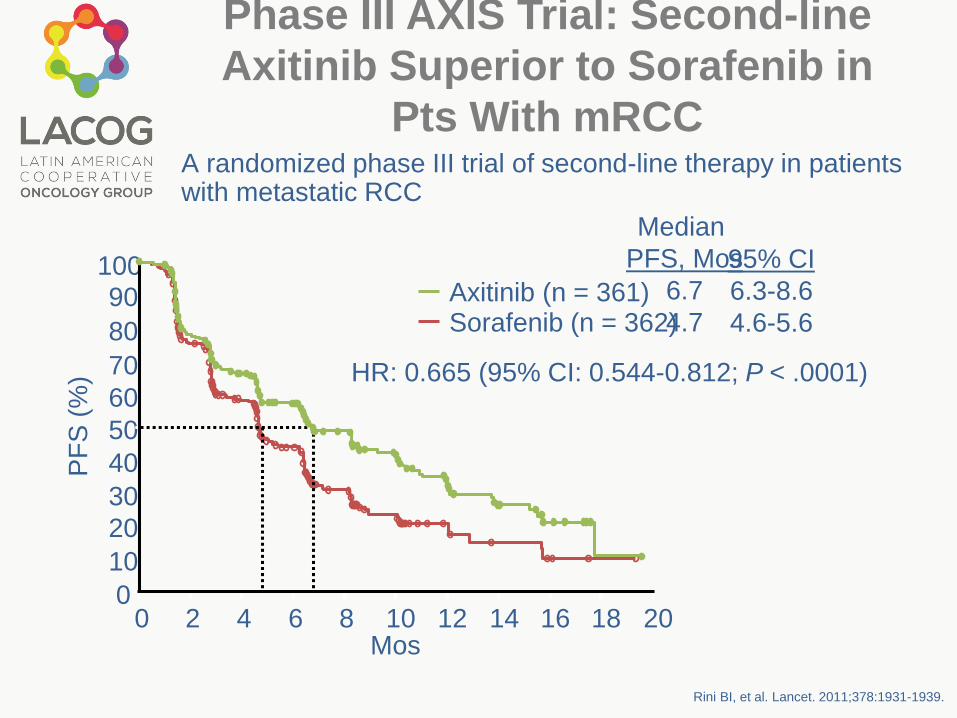
Phase III AXIS Trial: Second-line
Axitinib Superior to Sorafenib in
Pts With mRCC
Rini BI, et al. Lancet. 2011;378:1931-1939.
10090
80
70
60
50
40
30
20
10
00 2 4 6 8 10
Mos
HR: 0.665 (95% CI: 0.544-0.812; P < .0001)
12 14 16 18 20
Axitinib (n = 361)Sorafenib (n = 362)
Median
PFS, Mos
6.7
4.7
95% CI
6.3-8.6
4.6-5.6
PF
S (
%)
A randomized phase III trial of second-line therapy in patients with metastatic RCC

Mortalidade

Switch to mTOR or
continue TKI?
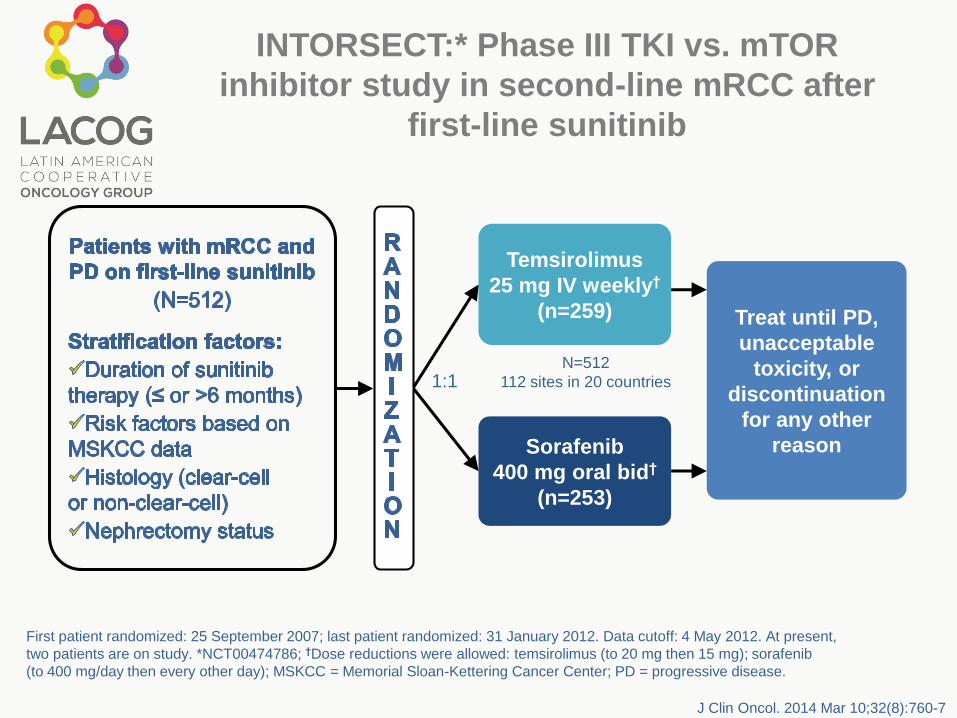
Temsirolimus
25 mg IV weekly†
(n=259)
Sorafenib
400 mg oral bid†
(n=253)
Treat until PD,
unacceptable
toxicity, or
discontinuation
for any other
reason
N=512
112 sites in 20 countries
First patient randomized: 25 September 2007; last patient randomized: 31 January 2012. Data cutoff: 4 May 2012. At present,
two patients are on study. *NCT00474786; †Dose reductions were allowed: temsirolimus (to 20 mg then 15 mg); sorafenib
(to 400 mg/day then every other day); MSKCC = Memorial Sloan-Kettering Cancer Center; PD = progressive disease.
INTORSECT:* Phase III TKI vs. mTOR
inhibitor study in second-line mRCC after
first-line sunitinib
1:1
J Clin Oncol. 2014 Mar 10;32(8):760-7

CI = confidence interval; HR = hazard ratio; IRC = Independent Review Committee; PFS = progression-free survival.
PF
S (
pro
ba
bilit
y)
252 72 22 11 6 0
259 96 28 9 5 0
Sorafenib
Temsirolimus
Time (months)
0 5 10 15 20 25
INTORSECT: Progression-free survival
(IRC Assessment)
p=0.1933 (log-rank)
Stratified HR: 0.87
(95% CI: 0.71, 1.07)
TemsirolimusSorafenib
Median PFS,months 95% CI
4.33.9
4.01, 5.432.80, 4.21
Patients at risk, n
1.0
0.9
0.8
0.7
0.6
0.5
0.4
0.3
0.2
0.1
0.0
Hutson, et al. ESMO 2012; Abstract LBA22;
Hutson TE et al. J Clin Oncol. 2013 [Epub ahead of print].

INTORSECT trial: OS significantly
longer with sorafenib than with
temsirolimusO
vera
ll S
urv
iva
l (p
rob
ab
ilit
y)
253 158 74 34 13 0
259 132 54 22 8 0
Sorafenib
Temsirolimus
0 10 20 30 40 50
TemsirolimusSorafenib
Patients at risk, nTime (months)
p=0.014 (log-rank)
Stratified HR: 1.31(95% CI: 1.05, 1.63)
12.2716.64
10.13, 14.8013.55, 18.72
1.0
0.9
0.8
0.7
0.6
0.5
0.4
0.3
0.2
0.1
0.0
CI = confidence interval; HR = hazard ratio; OS = overall survival.
Median OS,months 95% CI
Hutson, et al. ESMO 2012; Abstract LBA22;
Hutson TE et al. J Clin Oncol. 2013 [Epub ahead of print].

Sequencing
Sunitinib
50 mg/day**
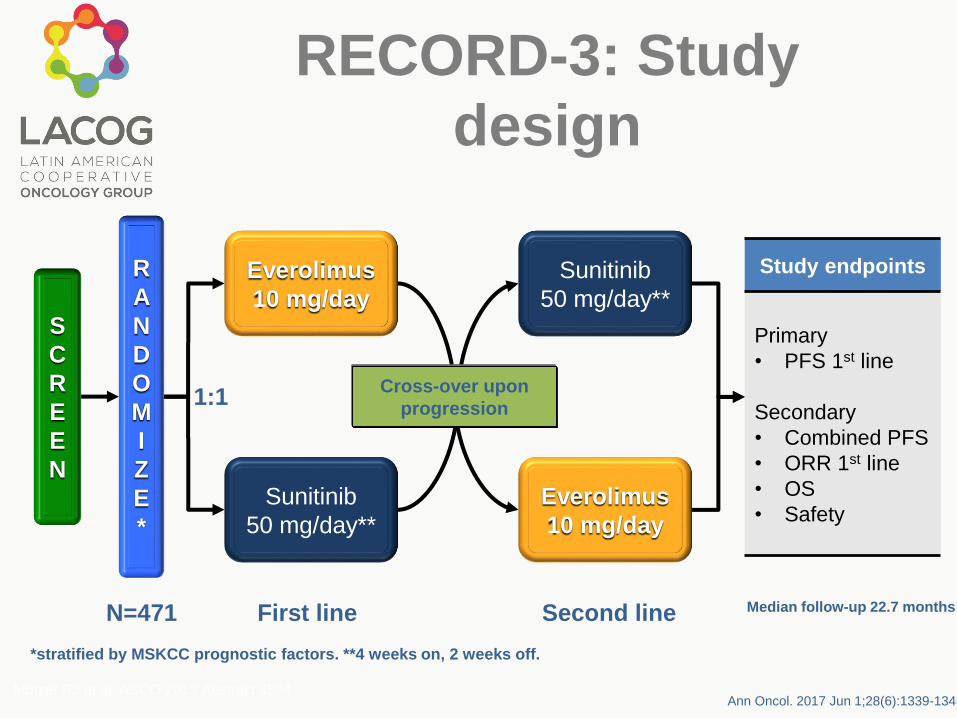
RECORD-3: Study
design
S
C
R
E
E
N
R
A
N
D
O
M
I
Z
E
*
Everolimus
10 mg/day
Sunitinib
50 mg/day**
Everolimus
10 mg/day
Study endpoints
Primary
• PFS 1st line
Secondary
• Combined PFS
• ORR 1st line
• OS
• Safety
1:1Cross-over upon
progression
N=471 First line Second line
*stratified by MSKCC prognostic factors. **4 weeks on, 2 weeks off.
Motzer RJ et al. ASCO 2013 Abstract 4504
Median follow-up 22.7 months
Ann Oncol. 2017 Jun 1;28(6):1339-1345

Primary endpoint: First-line
PFS
0 3 6 9 12 15 18 21 24 27 30 33
0
10
20
30
40
50
60
70
80
90
100
Cu
mu
lati
ve
eve
nt-
fre
e p
rob
ab
ilit
y (
%)
Time (months)
Everolimus
Sunitinib
164238 118 88 68 44 31 23 12 5 0 0
181233 145 108 84 55 42 28 15 9 3 0
Number of patients still at risk
Everolimus (events/N=182/238)
Sunitinib (events/N=158/233)
K-M Median PFS (mo)
Everolimus Suntinib
7.85 10.71
Hazard ratio=1.43
Two-sided 95% CI [1.15, 1.77]
Ann Oncol. 2017 Jun 1;28(6):1339-1345
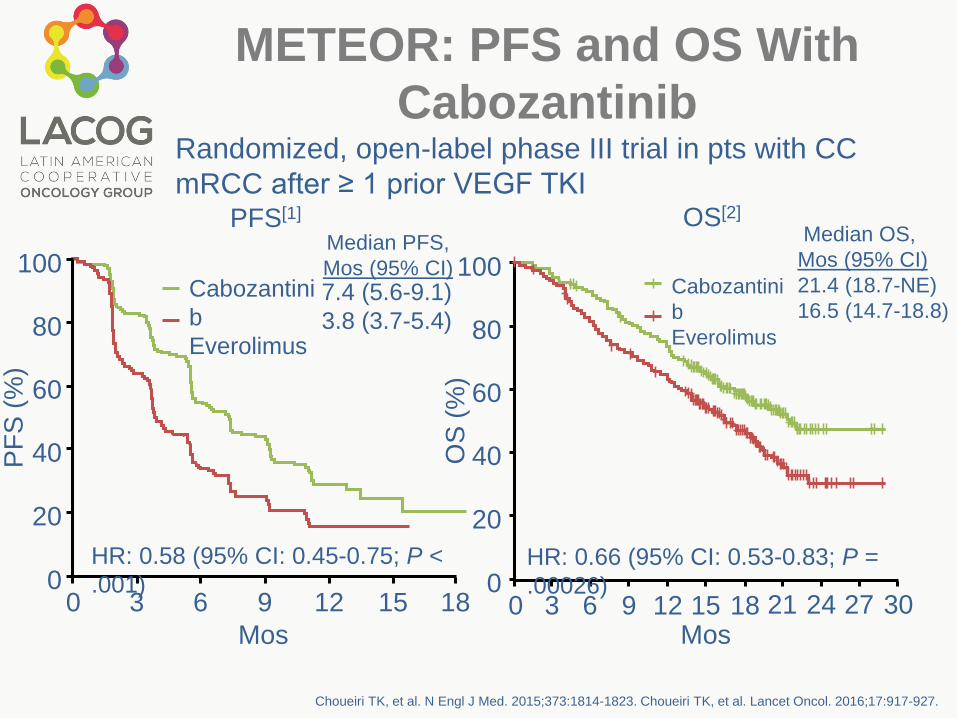
METEOR: PFS and OS With
CabozantinibRandomized, open-label phase III trial in pts with CC
mRCC after ≥ 1 prior VEGF TKI
Choueiri TK, et al. N Engl J Med. 2015;373:1814-1823. Choueiri TK, et al. Lancet Oncol. 2016;17:917-927.
100
80
60
40
20
00 3 6 9 12 15 18
Mos
PF
S (
%)
Cabozantini
b
Everolimus
7.4 (5.6-9.1)
3.8 (3.7-5.4)
Median PFS,
Mos (95% CI)
HR: 0.58 (95% CI: 0.45-0.75; P <
.001)
PFS[1] OS[2]
Median OS,
Mos (95% CI)
21.4 (18.7-NE)
16.5 (14.7-18.8)
100
80
60
40
20
00 3 6 9 12 15 18
Mos
OS
(%
)
Cabozantini
b
Everolimus
HR: 0.66 (95% CI: 0.53-0.83; P =
.00026)21 24 27 30

Len + eve vs eve: HR: 0.40 (95% CI: 0.24-0.68; P
= .0005) Len vs eve: HR: 0.61 (95% CI: 0.38-0.98;
P = .048)
Randomized, open-label registrational trial in pts with CC mRCCafter ≥ 1 prior VEGF TKI
Lenvatinib ± Everolimus in mRCC:
PFS (Primary Endpoint) and
Updated OS
Motzer R, et al. Lancet Oncol. 2015;16:1473-1482.
Len + eve
Len
Eve
Mos
8
0
100
6
04
02
0
0
PF
S (
%)
0 3 6 9 1
2
1
5
1
8
2
1
2
4
Median PFS, Mos
14.6
7.4
5.5 80
100
60
40
20
0
OS
(%
)
Mos3 6 9 12151821240 273033363942
Len + Eve 25.5
Len 19.1
Eve 15.4
Len + Eve vs Eve: HR: 0.59 (95% CI: 0.36-0.97; P = .065)Len vs Eve: HR: 0.75 (95% CI: 0.47-1.20; P = .130)Len + Eve vs Len: HR: 0.79 (95% CI: 0.48-1.30; P = .309)
Median OS,
Mos
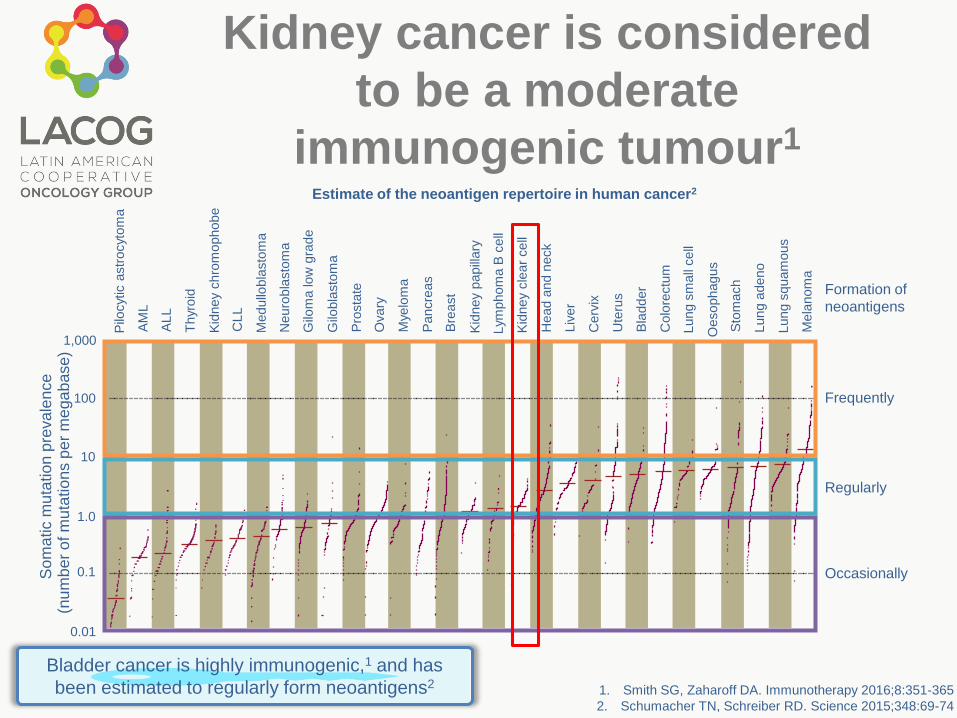
1. Smith SG, Zaharoff DA. Immunotherapy 2016;8:351-365
2. Schumacher TN, Schreiber RD. Science 2015;348:69-74
So
ma
tic m
uta
tio
n p
reva
len
ce
(nu
mb
er
of m
uta
tio
ns p
er
me
ga
base)
Frequently
Formation of
neoantigens
100
1,000
Pilo
cytic a
str
ocyto
ma
AL
L
Thyr
oid
Kid
ney
chro
mophobe
CL
L
Medullo
bla
sto
ma
Neuro
bla
sto
ma
Gilo
ma low
gra
de
Gilo
bla
sto
ma
Pro
sta
te
Ovary
Mye
lom
a
Pancre
as
Bre
ast
Kid
ney
papill
ary
Lym
phom
a B
cell
Kid
ney
cle
ar
cell
Head a
nd n
eck
Liv
er
Cerv
ix
Ute
rus
Bla
dder
Colo
rectu
m
Lung s
mall
cell
Sto
mach
Oesophagus
Lung a
deno
Lung s
quam
ous
Mela
nom
a
AM
L
10
1.0
0.1
0.01
Regularly
Occasionally
Estimate of the neoantigen repertoire in human cancer2
Bladder cancer is highly immunogenic,1 and has
been estimated to regularly form neoantigens2
Kidney cancer is considered
to be a moderate
immunogenic tumour1
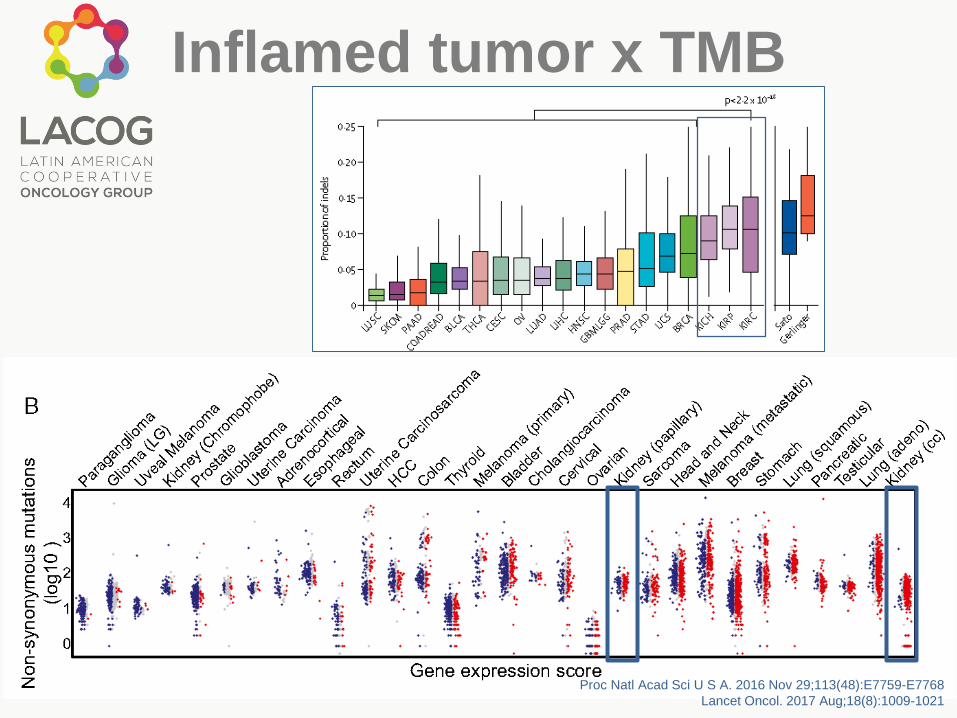
Inflamed tumor x TMB
Proc Natl Acad Sci U S A. 2016 Nov 29;113(48):E7759-E7768
Lancet Oncol. 2017 Aug;18(8):1009-1021

High Dose IL-2 = Accepting
Short PFS
Clin Cancer Res. 2015;21:561–568

CheckMate 025: OS
Motzer RJ, et al. N Engl J Med. 2015;373:1803-1813.
Nivolumab
Everolimus
HR: 0.73 (98.5% CI: 0.57-0.93; P = .0018)
25.0 (21.8-NE)
19.6 (17.6-23.1)
Minimum follow-up: 14 mos
0 3 6 129 15
Mos
18 21 24 27 30 33
Pts at Risk, nNivolumab410 389 359 337 305 275 213 139 73 29 3 0
411 366 324 287 265 241 187 115 61 20 2 0Everolimus
0
30
10
20
40
50
60
70
80
90
100O
S (
%)
Median OS,
Mos (95% CI)
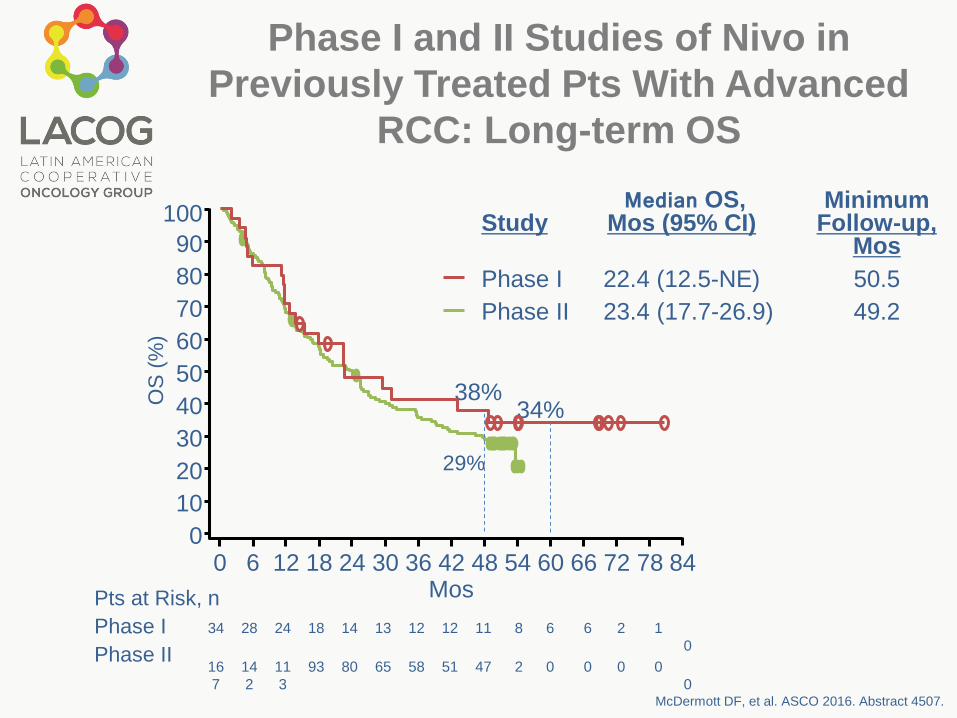
Phase I and II Studies of Nivo in
Previously Treated Pts With Advanced
RCC: Long-term OS
McDermott DF, et al. ASCO 2016. Abstract 4507.
34 28 24 18 14 13 12 12 11 8 6 6 2 1
0
16
7
14
2
11
3
93 80 65 58 51 47 2 0 0 0 0
0
StudyMedian OS,
Mos (95% CI) Minimum
Follow-up, Mos
Phase I 22.4 (12.5-NE) 50.5
Phase II 23.4 (17.7-26.9) 49.2
0
10
20
30
40
50
60
70
80
90
100
0 6 12 18 24 30 36 42 48 54 60 66 72 78 84
Pts at Risk, n
Phase I
Phase II
OS
(%
)
Mos
38%
29%
34%
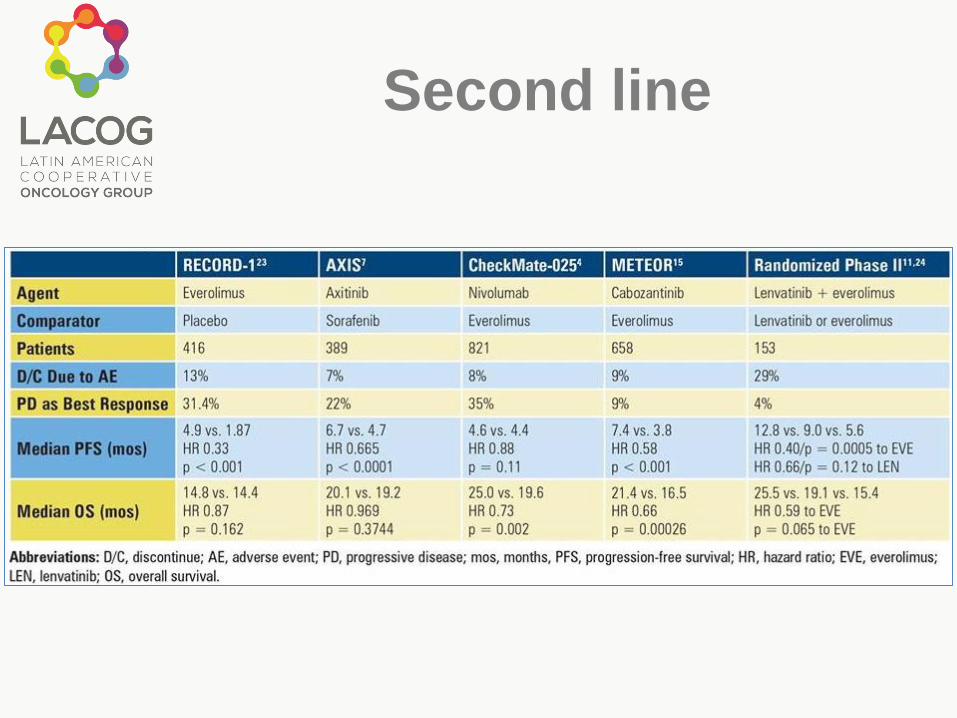
Second line

Novas estratégias
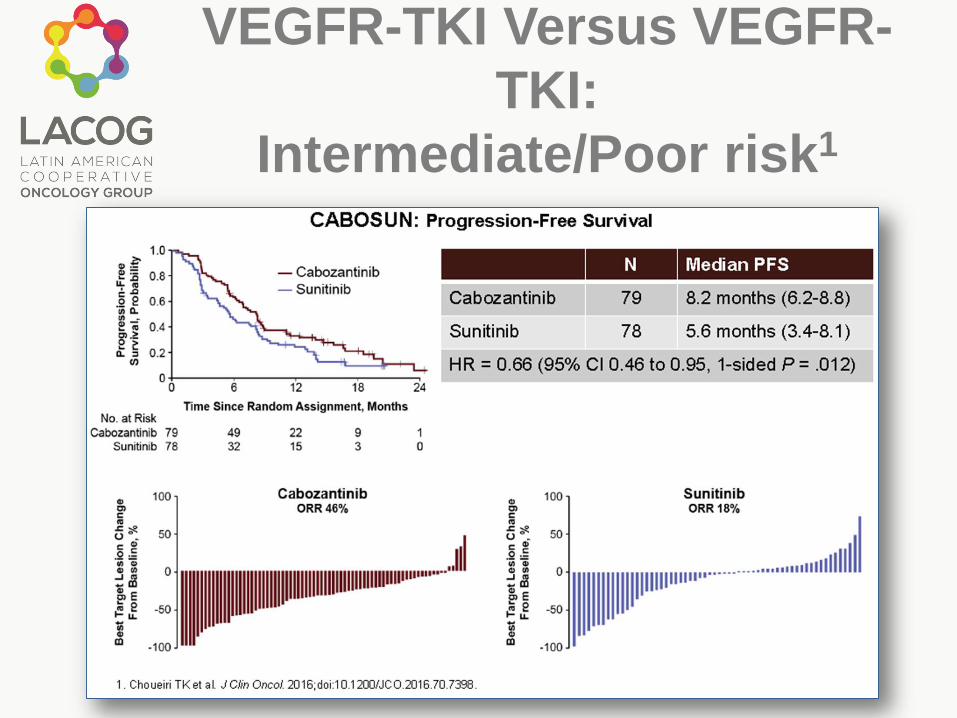
VEGFR-TKI Versus VEGFR-
TKI:
Intermediate/Poor risk1

First-Line Therapy:
Significant Changes
Expected
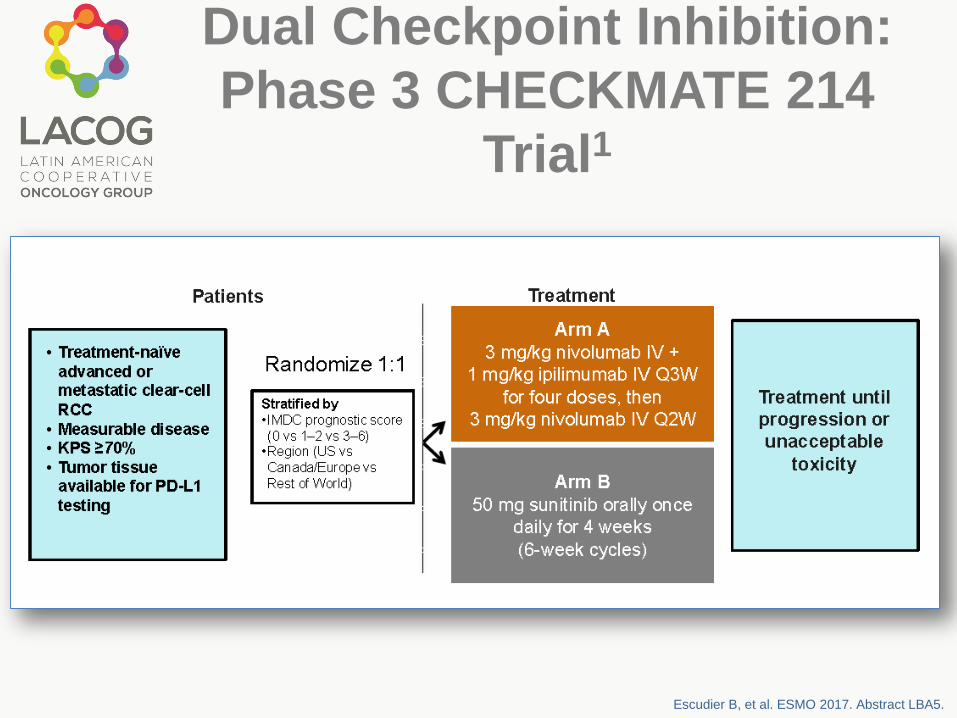
Dual Checkpoint Inhibition:
Phase 3 CHECKMATE 214
Trial1
Escudier B, et al. ESMO 2017. Abstract LBA5.

CheckMate 214: Response and Survival
Outcomes in IDMC Intermediate-/Poor-
Risk Pts
Significantly improved ORR and CR rates (both P < .0001) with nivo + ipi vs sun in IDMC intermediate-/poor-risk pts
ORR most improved in pts with tumor PD-L1 ≥ 1% (58% vs 22%; P < .0001)
Escudier B, et al. ESMO 2017. Abstract LBA5.
Response per
IRRC,* %
Nivo +
Ipi
(n = 425)
Sun
(n =
422)
ORR 42 27
CR 9 1
PR 32 25
SD 31 45
PD 20 17
NR/Unable to
determine8 12
*By RECIST v1.1.
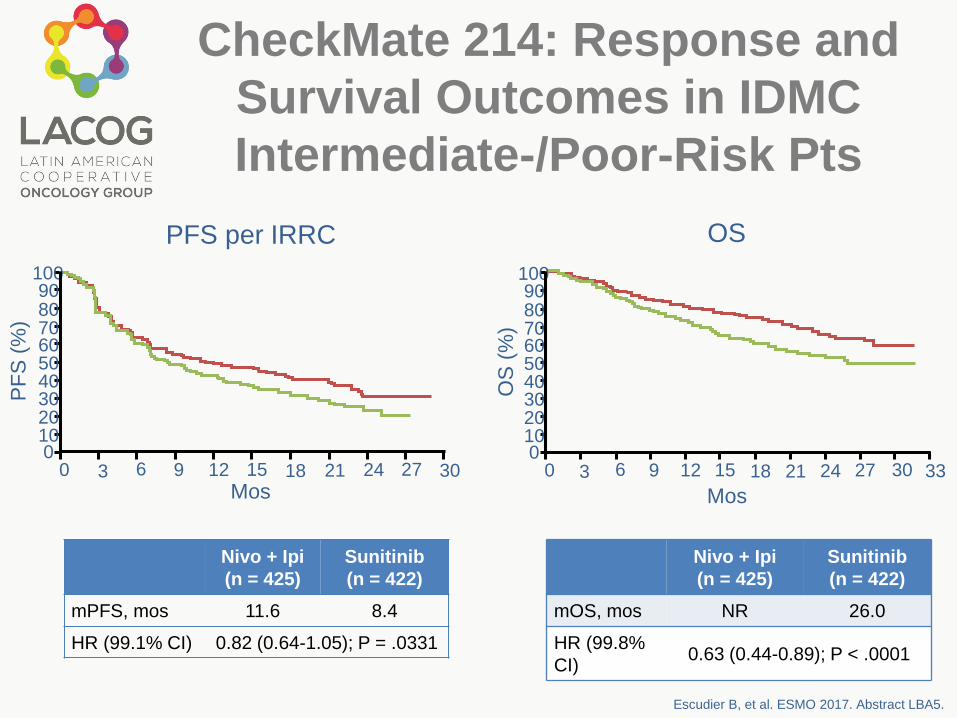
CheckMate 214: Response and
Survival Outcomes in IDMC
Intermediate-/Poor-Risk Pts
Escudier B, et al. ESMO 2017. Abstract LBA5.
OS
(%
)
Nivo + Ipi
(n = 425)
Sunitinib
(n = 422)
mPFS, mos 11.6 8.4
HR (99.1% CI) 0.82 (0.64-1.05); P = .0331
Nivo + Ipi
(n = 425)
Sunitinib
(n = 422)
mOS, mos NR 26.0
HR (99.8%
CI)0.63 (0.44-0.89); P < .0001
1009080706050403020100
0 9 2412 15 30276
PF
S (
%)
PFS per IRRC
Mos Mos
OS
3 18 21
1009080706050403020100
0 9 2712 15 333063 18 2421
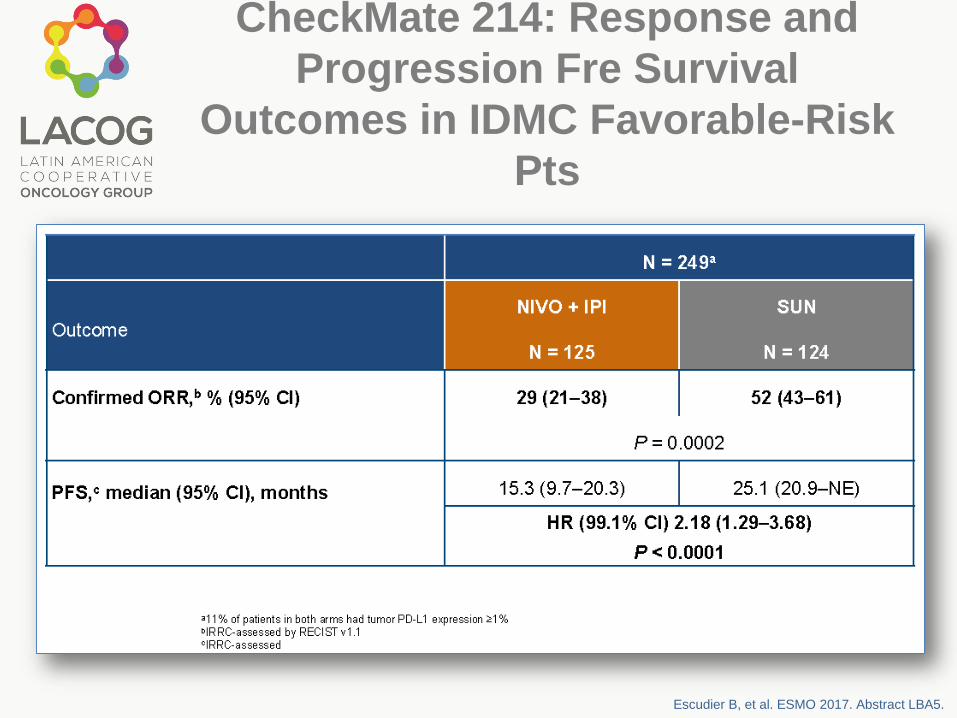
CheckMate 214: Response and
Progression Fre Survival
Outcomes in IDMC Favorable-Risk
Pts
Escudier B, et al. ESMO 2017. Abstract LBA5.

CheckMate 214: Safety in
All Treated PtsTx-related deaths: nivo + ipi, n = 7; sun, n = 4
TRAE leading to d/c: nivo + ipi, 22%; sun, 12%TRAE, %
Nivo + Ipi
(n = 547)
Sun
(n = 535)
An
y
Gr 3-
5
An
y
Gr 3-
5
TRAE in ≥ 25% of pts 93 46 97 63
Fatigue 37 4 49 9
Pruritus 28 < 1 9 0
Diarrhea 27 4 52 5
Nausea 20 2 38 1
Hypothyroidism 16 < 1 25 < 1
Decreased
appetite14 1 25 1
Dysgeusia 6 0 33 < 1
Stomatitis 4 0 28 3
Hypertension 2 < 1 40 16
Mucosal
inflammation2 0 28 3
Hand–foot
syndrome1 0 43 9
irAE,* %Nivo + Ipi (n = 547)
Any Gr 3-4
Rash 17 3
Diarrhea/colitis 10 5
Hepatitis 7 6
Nephritis & renal
dysfunction5 2
Pneumonitis 4 2
Hypersensitivity/infusio
n rxn1 0
Hypothyroidism 19 < 1
Hyperthyroidism 12 < 1
Adrenal insufficiency 8 3
*Additional irAE in ≤ 5% of pts: hypophysitis,
thyroiditis, diabetes mellitus.
Escudier B, et al. ESMO 2017. Abstract LBA5.

Health-Related Quality of
Life: ITT
Escudier B, et al. ESMO 2017. Abstract LBA5.
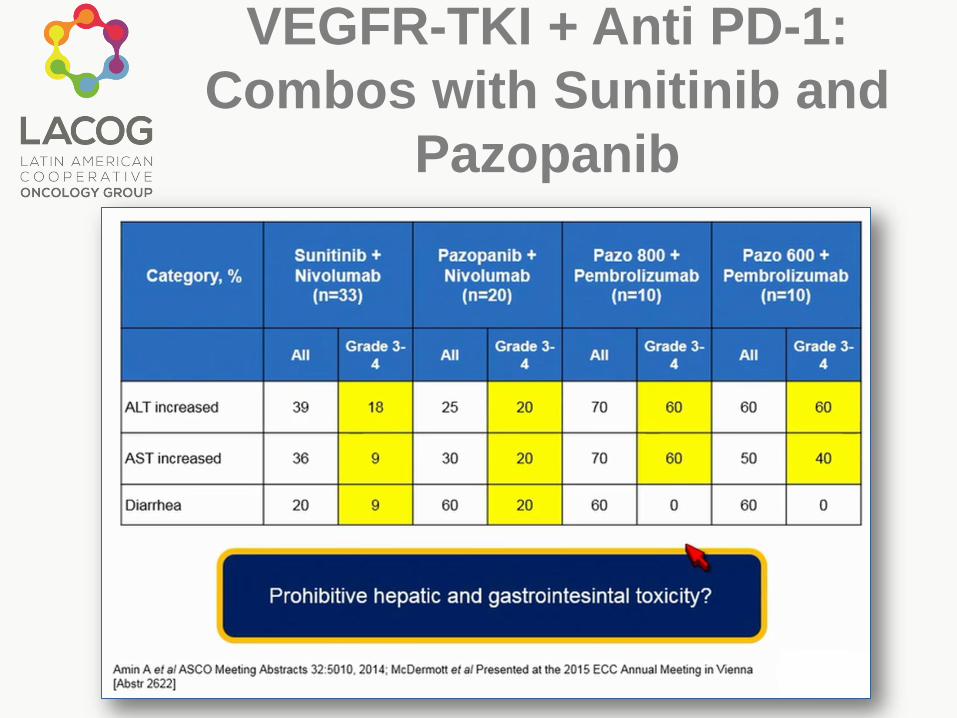
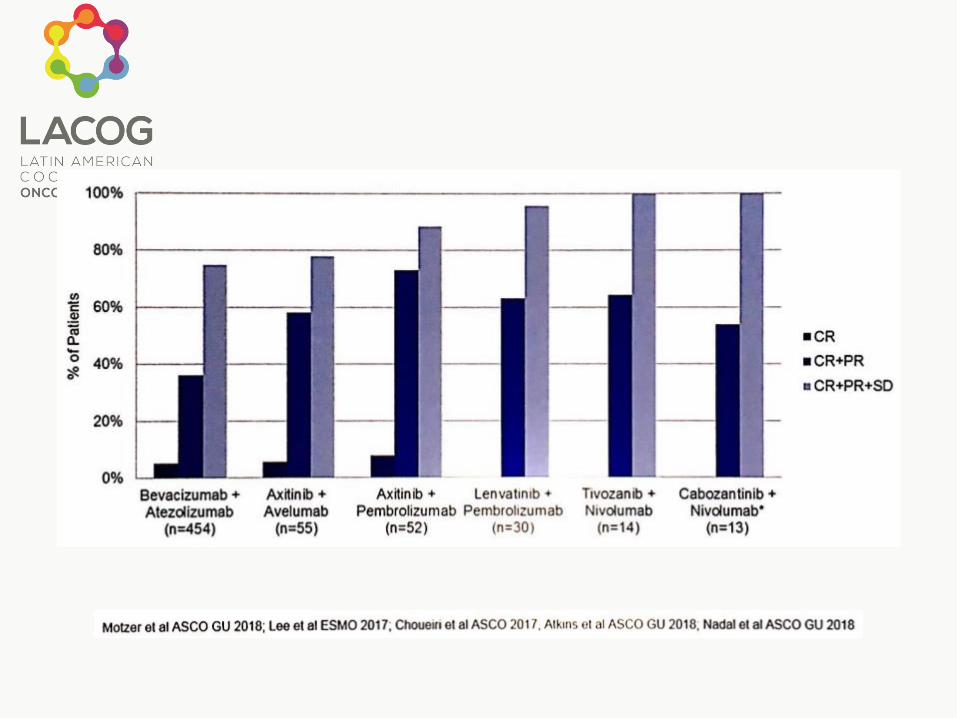
VEGFR-TKI + Anti PD-1:
Combos with Sunitinib and
Pazopanib

VEGFR-TKI + Anti PD-1:
Axitinib + Pembrolizumab:
Efficacy1
J Clin Oncol 36, 2018 (suppl 6S; abstr 579)
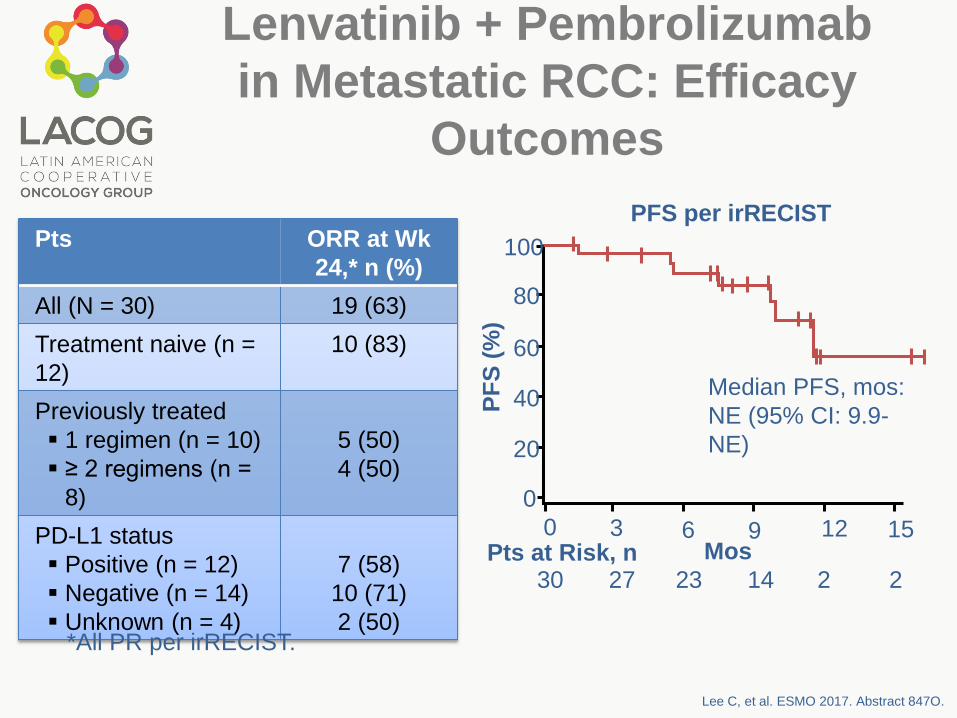
Lenvatinib + Pembrolizumab
in Metastatic RCC: Efficacy
Outcomes
Pts ORR at Wk
24,* n (%)
All (N = 30) 19 (63)
Treatment naive (n =
12)
10 (83)
Previously treated
1 regimen (n = 10)
≥ 2 regimens (n =
8)
5 (50)
4 (50)
PD-L1 status
Positive (n = 12)
Negative (n = 14)
Unknown (n = 4)
7 (58)
10 (71)
2 (50)
Lee C, et al. ESMO 2017. Abstract 847O.
PFS per irRECIST
*All PR per irRECIST.
100
80
60
40
20
0P
FS
(%
)
0 3 6 9 12 15MosPts at Risk, n
30 27 23 14 2 2
Median PFS, mos:
NE (95% CI: 9.9-
NE)
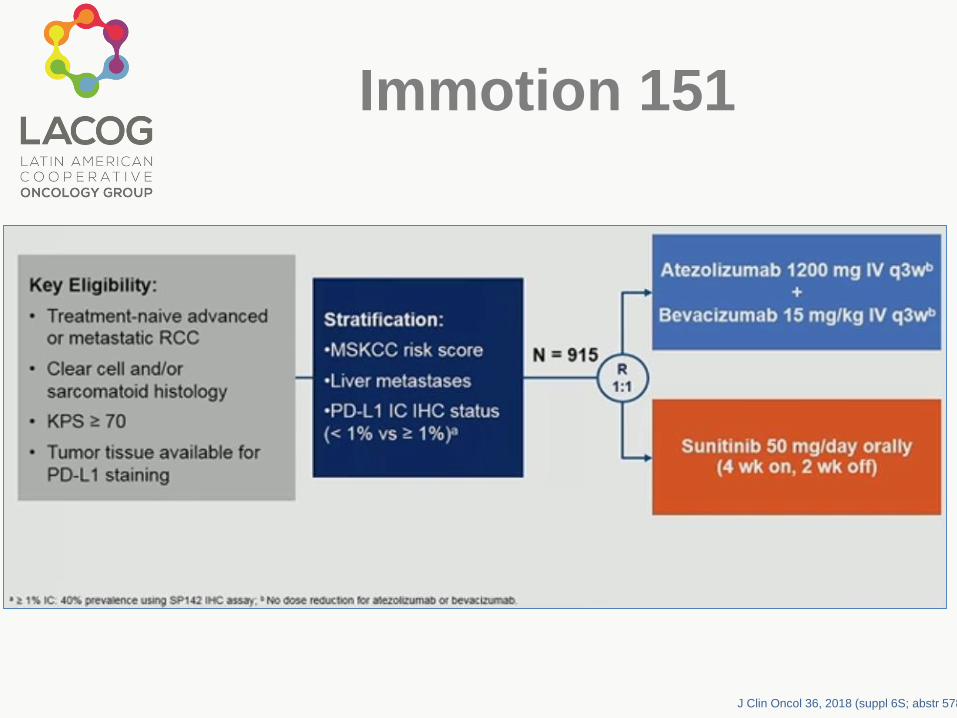
Immotion 151
J Clin Oncol 36, 2018 (suppl 6S; abstr 578)
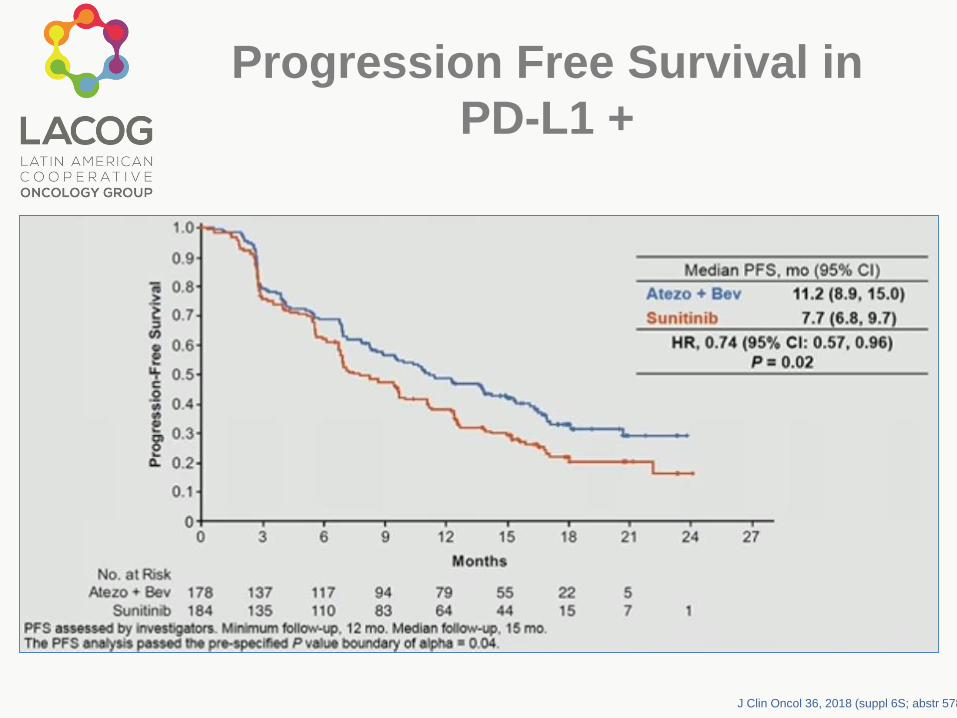
Progression Free Survival in
PD-L1 +
J Clin Oncol 36, 2018 (suppl 6S; abstr 578)
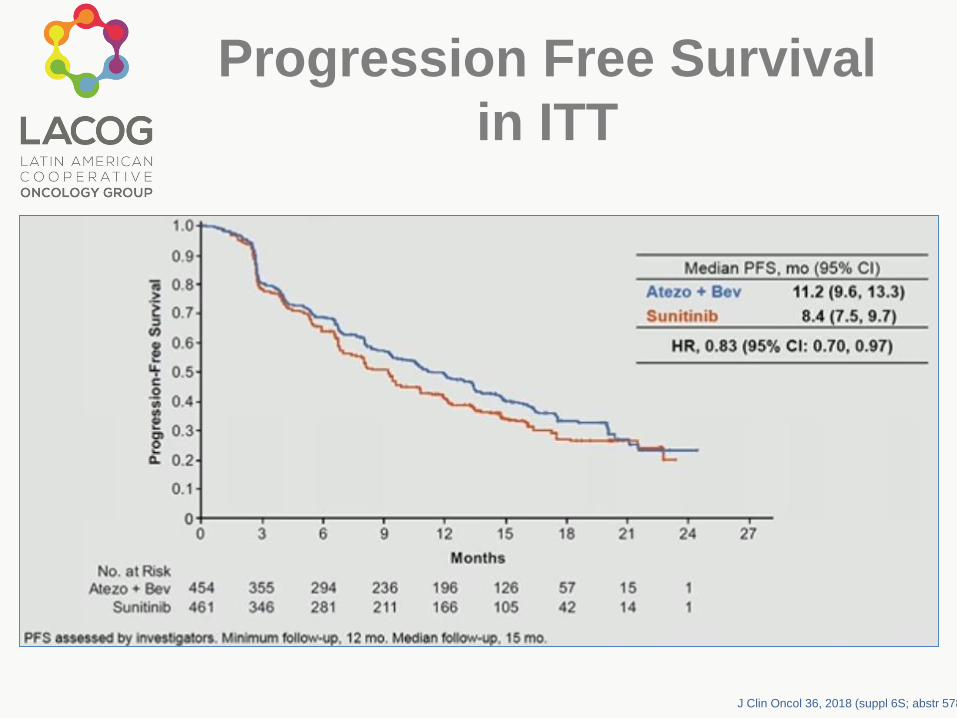
Progression Free Survival
in ITT
J Clin Oncol 36, 2018 (suppl 6S; abstr 578)
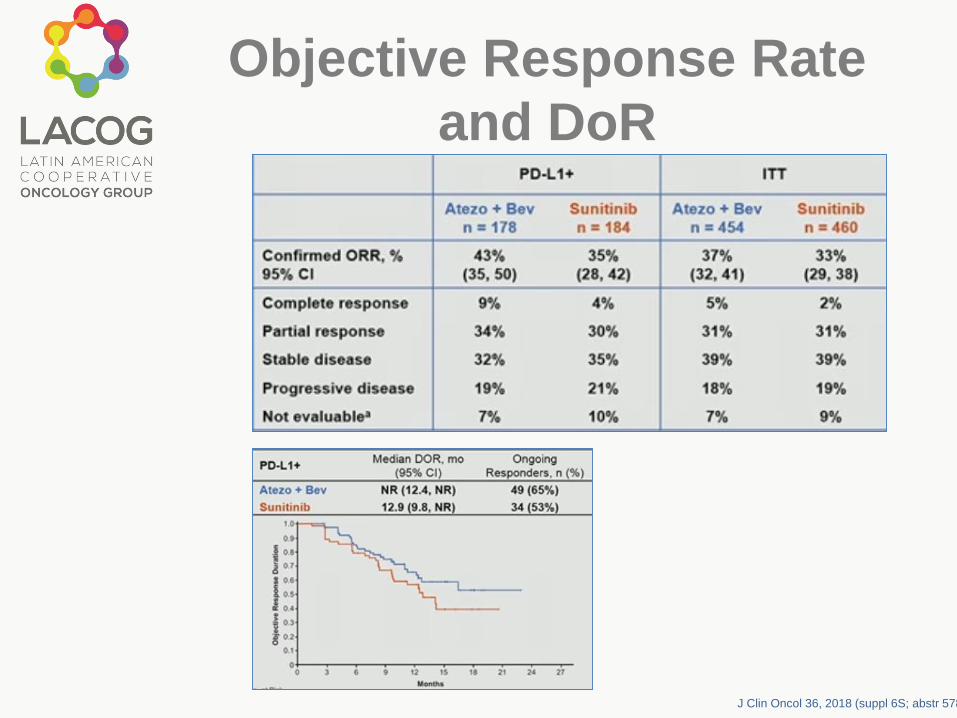
Objective Response Rate
and DoR
J Clin Oncol 36, 2018 (suppl 6S; abstr 578)

PFS and ORR by IRC
J Clin Oncol 36, 2018 (suppl 6S; abstr 578)
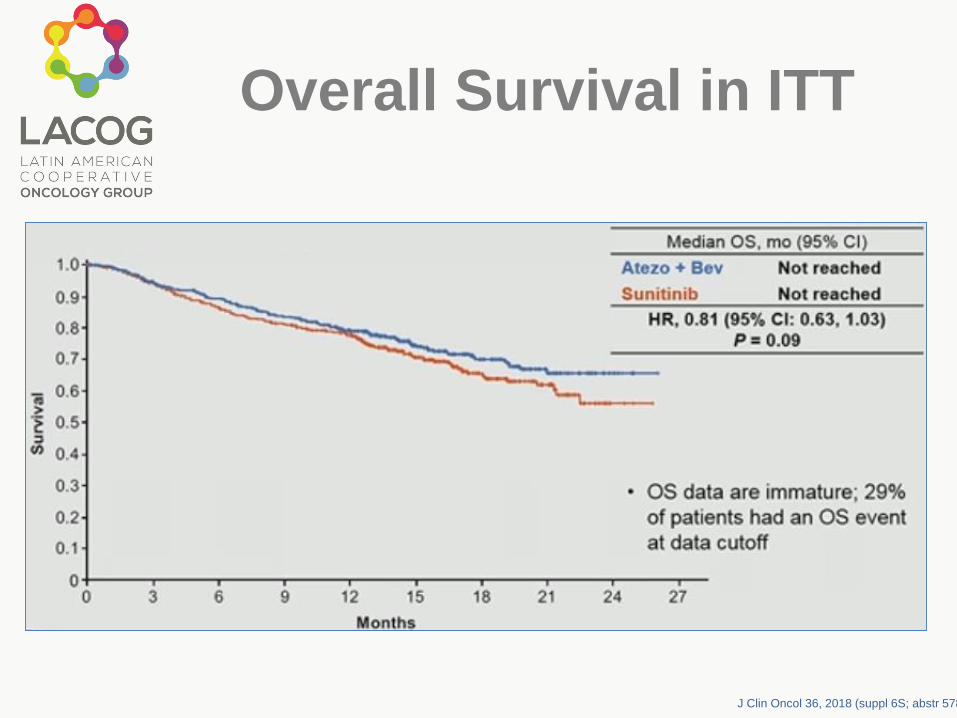
Overall Survival in ITT
J Clin Oncol 36, 2018 (suppl 6S; abstr 578)
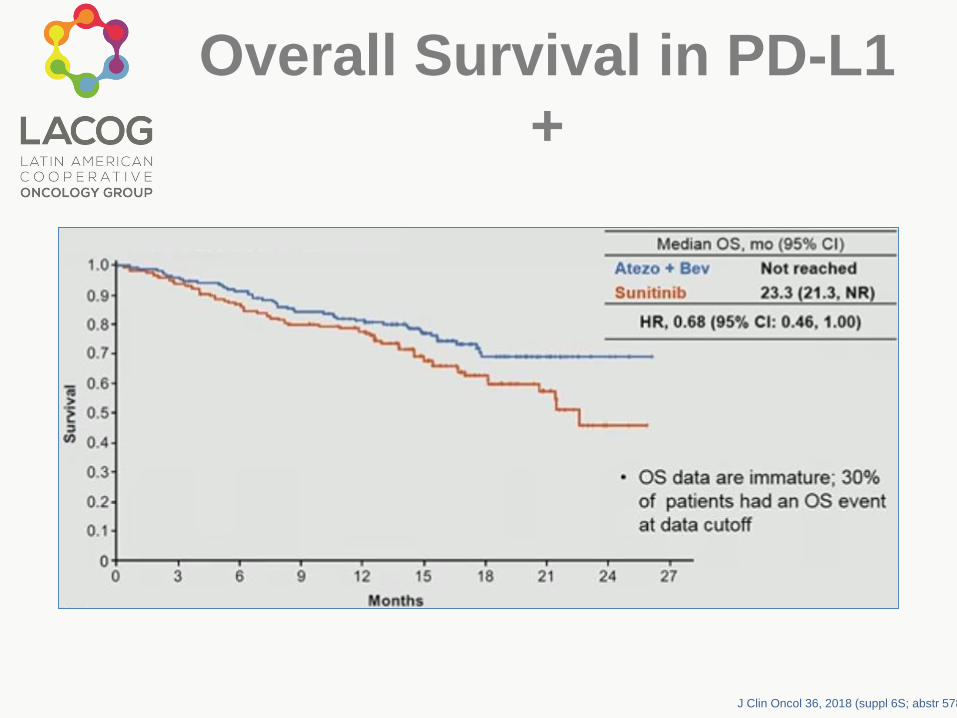
Overall Survival in PD-L1
+
J Clin Oncol 36, 2018 (suppl 6S; abstr 578)
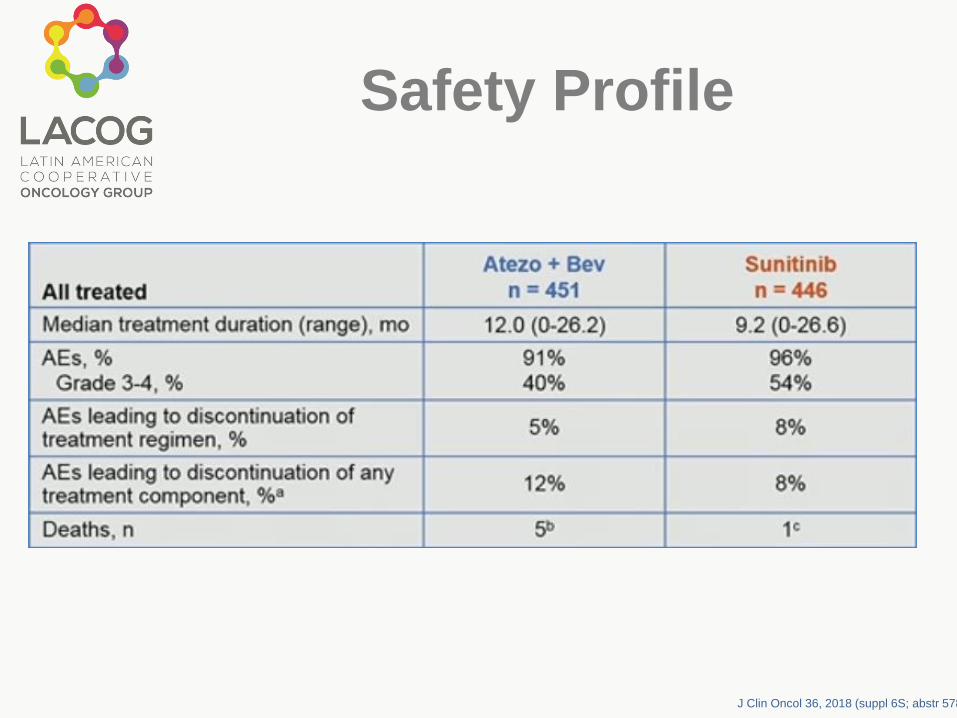
Safety Profile
J Clin Oncol 36, 2018 (suppl 6S; abstr 578)
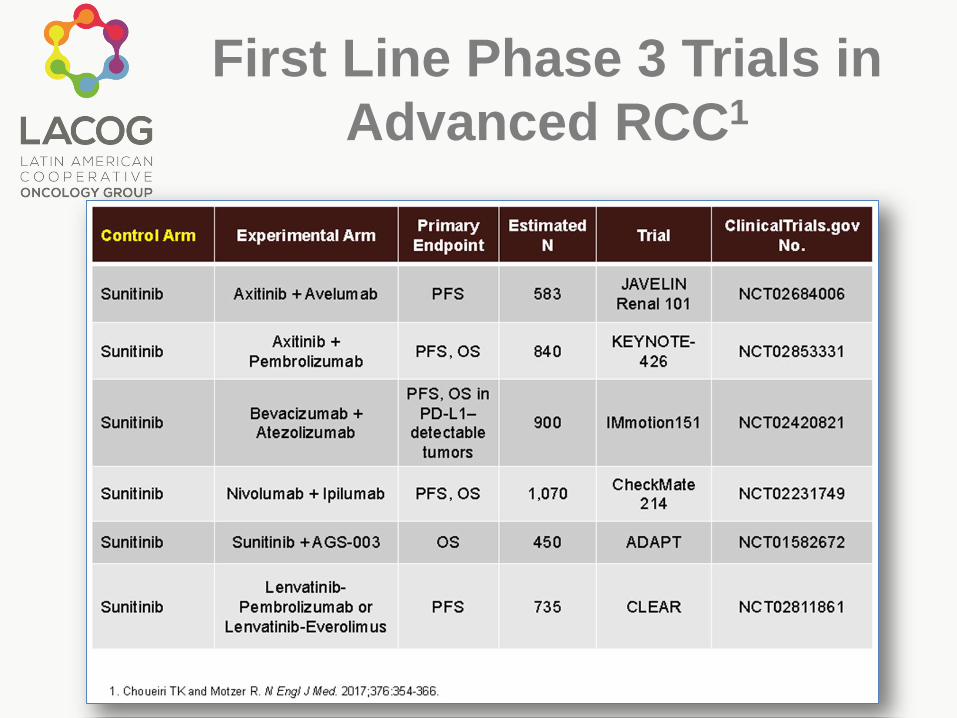
First Line Phase 3 Trials in
Advanced RCC1