tic microempresas - cetic.br · tic microempresas 2010 pesquisa sobre o uso das tecnologias de...
TRANSCRIPT
PESQUISA SOBRE O USO DAS TECNOLOGIAS DE INFORMAÇÃO E COMUNICAÇÃO NAS MICROEMPRESAS BRASILEIRAS
ICT MICROENTERPRISES 2010 SURVEY ON THE USE OF INFORMATION AND COMMUNICATION
TECHNOLOGIES IN BRAZILIAN MICROENTERPRISES
MICROEMPRESAS2010TIC
Comitê Gestor da Internet no BrasilBrazilian Internet Steering Committee
www.cgi.br
ATRIBUIÇÃO USO NÃO COMERCIAL VEDADA A CRIAÇÃO DE OBRAS DERIVADAS 2.5 BRASIL
ATTRIBUTION NONCOMMERCIAL NO DERIVATIVE WORKS 2.5 BRAZIL
VOCÊ PODE:YOU ARE FREE:
copiar, distribuir, exibir e executar a obra sob as seguintes condições:to copy, distribute and transmit the work under the following conditions:
ATRIBUIÇÃO: Você deve creditar a obra da forma especi!cada pelo autor ou licenciante (mas não de maneira que sugira que estes concedem qualquer aval a você ou ao seu uso da obra).ATTRIBUTION: You must attribute the work in the manner speci!ed by the author or licensor (but not in any way that suggests that they endorse you or your use of the work).
USO NÃO COMERCIAL: Você não pode utilizar esta obra com !nalidades comerciais.NONCOMMERCIAL: You may not use this work for commercial purposes.
VEDADA A CRIAÇÃO DE OBRAS DERIVADAS: Você não pode alterar, transformar ou criar outra obra com base nesta.NO DERIVATE WORKS: You may not alter, transform, or build upon this work.
Núcleo de Informação e Coordenação do Ponto BRBrazilian Network Information Center
Comitê Gestor da Internet no BrasilBrazilian Internet Steering Committee
São Paulo2011
PESQUISA SOBRE O USO DAS TECNOLOGIAS DE INFORMAÇÃO E COMUNICAÇÃO NAS MICROEMPRESAS BRASILEIRAS
ICT MICROENTERPRISES 2010 SURVEY ON THE USE OF INFORMATION AND COMMUNICATION
TECHNOLOGIES IN BRAZILIAN MICROENTERPRISES
MICROEMPRESAS2010TIC
Núcleo de Informação e Coordenação do Ponto BRBrazilian Network Information Center
Diretor Presidente / CEODemi Getschko
Diretor Administrativo / CFORicardo Narchi
Diretor de Serviços e Tecnologia / CTOFrederico Neves
Diretor de Projetos Especiais e de Desenvolvimento / Director of Special Projects and DevelopmentMilton Kaoru Kashiwakura
Centro de Estudos sobre as Tecnologias da Informação e da Comunicação – Cetic.br Center of Studies on Information and Communication Technologies (Cetic.br)
Coordenação Executiva e Editorial / Executive and Editorial CoordinationAlexandre F. Barbosa
Coordenação Técnica / Technical Coordination Juliano Cappi e Emerson Santos
Equipe Técnica / Technical TeamCamila Garroux, Erik Gomes, Fabio Senne, Isabela Coelho, Luiza Mesquita, Suzana Jaíze Alves, Tatiana Jereissati e Winston Oyadomari
Edição / Editing Comunicação NIC.br: Caroline D’Avo, Everton Teles Rodrigues, Fabiana Araujo
Apoio Editorial / Editorial Support Projeto grá!co / Graphic Design : Suzana De Bonis / DB ComunicaçãoPreparação de texto / Proof reading : Pedro BarrosTradução para o inglês / Translation into English : Karen Brito-Sexton Revisão / Revision : Anthony Sean Cleaver e Leandro RodriguesComposição / Desktop publishing : Alvaro T. De Bonis
Esta publicação está disponível também em formato digital em www.cetic.brThis publication is also available in digital format at www.cetic.br
Dados Internacionais de Catalogação na Publicação (CIP)(Câmara Brasileira do Livro, SP, Brasil)
Pesquisa sobre o uso das tecnologias da informação e da comunicação nas microempresas brasileiras 2010 : TIC Microempresas 2010 – Survey on the use of information and communication technologies in brazilian microenterprises : ICT Microenterprises 2010 / [coordenação executiva e editorial/executive and editorial coordination, Alexandre F. Barbosa ; tradução para o inglês / translation into English Karen Brito-Sexton]. -- São Paulo : Comitê Gestor da Internet no Brasil, 2012.
Edição bilíngue: português/inglês.
ISBN 978-85-60062-50-8
1. Internet (Rede de computadores) – Brasil 2. Microempresas – Brasil 3. Tecnologia da informação e da comunicação – Brasil – Pesquisa I. Barbosa, Alexandre F. II. Título: Survey on the use of information and communication technologies in brazilian microenterprises.
12-00344 CDD- 004.6072081
Índices para catálogo sistemático:
1. Brasil : Tecnologias de informação e da comunicação : Uso : Pesquisa 004.60720812. Pesquisa : Tecnologia da informação e comunicação : Uso : Brasil 004.6072081
TIC Microempresas 2010Pesquisa sobre o Uso das Tecnologias de Informação
e Comunicação nas Microempresas Brasileiras
ICT Microenterprises 2010 Survey on the Use of Information and Communication
Technologies in Brazilian Microenterprises
COMITÊ GESTOR DA INTERNET NO BRASIL – CGI.brBRAZILIAN INTERNET STEERING COMMITTEE (CGI.br)
Virgílio Augusto Fernandes Almeida Coordenador / Coordinator
Conselheiros / Counselors
Adriano Silva MotaCarlos Alberto Afonso
Cássio Jordão Motta Vecchiatti Del!no Natal de Souza
Demi GetschkoEduardo Fumes Parajo
Eduardo Levy Cardoso Moreira Ernesto Costa de Paula
Flávio Rech WagnerHenrique Faulhaber
Ivo da Motta Azevedo CorreaJosé Luiz Ribeiro Filho
Lisandro Zambenedetti GranvilleLuiz Antônio de Souza Cordeiro
Odenildo Teixeira Sena Paulo Bernardo Silva
Percival Henriques de Souza NetoRonaldo Mota SardenbergSergio Amadeu da Silveira
Veridiana Alimonti
Diretor Executivo / Executive DirectorHartmut Richard Glaser

77
AGRADECIMENTOS
Embora não seja realizada anualmente, a pesquisa TIC Microempresas – conduzida pelo Centro de Estudos sobre as Tecnologias da Informação e da Comunicação (Cetic.br) –, devido a seu universo de análise muito particular, enriquece os resultados obtidos nas pesquisas TIC Empresas, dando um panorama completo da realidade das empresas brasileiras na adoção das tecnologias da informação e comunicação. Esta é a segunda edição da pesquisa – a primeira foi em 2007 –, e desde o início contou-se com o apoio e a colaboração de um valioso grupo de pessoas, renomadas pela compe-tência e conhecimento na investigação do desenvolvimento das TIC no Brasil. A importância des-sas tecnologias para o ambiente empresarial brasileiro, bem como a relevância do projeto de cons-trução de indicadores conduzido pelo CGI.br, serviu como fonte de estímulo e motivação para que esse grupo de especialistas colaborasse voluntariamente, em um esforço coletivo, com críticas e opiniões ao longo do processo.
Dessa forma, o Cetic.br agradece especialmente a:
Agência Nacional de Telecomunicações (Anatel)
André Garcia Pena
Centro de Estudos, Resposta e Tratamento de Incidentes de Segurança no Brasil (Cert.br)
Cristine Hoepers e Klaus Steding-Jessen
Federação das Indústrias do Estado de São Paulo (Fiesp)
Robert William Velásquez Salvador
Fundação Getulio Vargas de São Paulo (FGV-SP)
Clovis Bueno de Azevedo, Eduardo Henrique Diniz, Fernando de Souza Meirelles e Wilton Bussab (in memorian)
Instituto Brasileiro de Geografia e Estatística (IBGE)
Fernanda Vilhena e Roberto Sant’anna
Instituto de Pesquisa Econômica Aplicada (Ipea)
Luis Claudio Kubota
MVTL Soluções em Tecnologia
Pedro Nascimento Silva
Secretaria de Logística e Tecnologia da Informação (SLTI), do Ministério do Planejamento, Orçamento e Gestão
Everson Lopes de Aguiar e João Batista Ferri de Oliveira
Serviço Brasileiro de Apoio às Micro e Pequenas Empresas (Sebrae)
Marco Aurélio Bedê
Tribunal de Contas do Estado de São Paulo
Maria Luiza Costa Pascale
Universidade de São Paulo (USP)
César Alexandre Souza e Nicolau Reinhard
World Wide Web Consortium (W3C)
Vagner Diniz
88
ACKNOWLEDGMENTS
Even though it is not published annually, the ICT Microenterprises survey – produced by the Center of Studies on Information and Communication Technologies (Cetic.br) –, due to its very specific uni-verse, enriches the results obtained by the ICT Enterprises survey, giving a complete picture of the reality of Brazilian companies in the adoption of information and communication technologies. This is the second edition of the survey – the first was in 2007 –, and since the beginning it relied on the support and collaboration of a valuable group of people, renowned for their expertise and knowl-edge in researches on ICT development in Brazil. The importance of these technologies to the busi-ness environment in Brazil, as well as the relevance of the project of constructing indicators led by CGI.br, served as a source of encouragement and motivation for this group of experts to collaborate voluntarily, in a collective effort, with criticism and opinions throughout the process.
Therefore, Cetic.br wishes to acknowledge:
National Telecommunications Agency (Anatel)
André Garcia Pena
Brazilian National Computer Emergency Response Team (Cert.br)
Cristine Hoepers and Klaus Steding-Jessen
Federation of Industries of the State of São Paulo (Fiesp)
Robert William Velásquez Salvador
Getulio Vargas Foundation in São Paulo (FGV-SP)
Clovis Bueno de Azevedo, Eduardo Henrique Diniz, Fernando de Souza Meirelles and Wilton Bussab (in memorian)
Brazilian Institute of Geography and Statistics (IBGE)
Fernanda Vilhena and Roberto Sant’anna
Institute for Applied Economic Research (Ipea)
Luis Claudio Kubota
MVTL Soluções em Tecnologia
Pedro Nascimento Silva
Department of Logistics and Information Technology (SLTI) of the Ministry of Planning, Budget and Management
Everson Lopes de Aguiar and João Batista Ferri de Oliveira
Brazilian Service of Support for Micro and Small Enterprises (Sebrae)
Marco Aurélio Bedê
Federal Accountability Office of the State of São Paulo
Maria Luiza Costa Pascale
University of São Paulo (USP)
César Alexandre Souza and Nicolau Reinhard
World Wide Web Consortium (W3C)
Vagner Diniz
99
PO
RTU
GU
ÊS ENGLISH
SUMÁRIO / CONTENTS
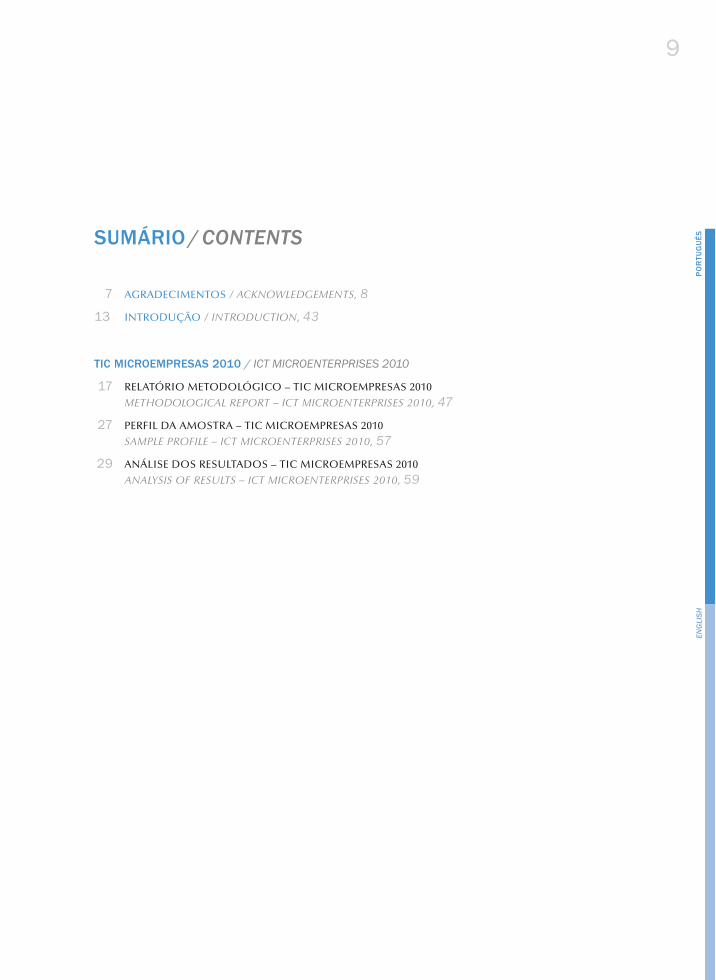
7 AGRADECIMENTOS / ACKNOWLEDGEMENTS, 8
13 INTRODUÇÃO / INTRODUCTION, 43
TIC MICROEMPRESAS 2010 / ICT MICROENTERPRISES 2010
17 RELATÓRIO METODOLÓGICO – TIC MICROEMPRESAS 2010 METHODOLOGICAL REPORT – ICT MICROENTERPRISES 2010, 47
27 PERFIL DA AMOSTRA – TIC MICROEMPRESAS 2010SAMPLE PROFILE – ICT MICROENTERPRISES 2010, 57
29 ANÁLISE DOS RESULTADOS – TIC MICROEMPRESAS 2010ANALYSIS OF RESULTS – ICT MICROENTERPRISES 2010, 59
Survey on ICT Microenterprises 2010CONTENTS 10
PO
RTU
GU
ÊS ENGLISH
LISTA DE GRÁFICOS / CHART LIST
PERFIL DA AMOSTRA / SAMPLE PROFILE
27 PERFIL DA AMOSTRA, POR PORTE DA EMPRESA SEGUNDO O NÚMERO DE FUNCIONÁRIOSSAMPLE PROFILE, PER COMPANY SIZE ACCORDING TO THE NUMBER OF EMPLOYEES, 57
27 PERFIL DA AMOSTRA, POR REGIÃOSAMPLE PROFILE, PER REGION, 57
28 PERFIL DA AMOSTRA, POR MERCADO DE ATUAÇÃO – CNAE 2.0SAMPLE PROFILE, PER MARKET SEGMENT – NACE 2.0, 58
ANÁLISE DOS RESULTADOS / ANALYSIS OF RESULTS
31 PROPORÇÃO DE MICROEMPRESAS QUE TÊM ACESSO À INTERNET, POR PORTE E REGIÃO – 2010PROPORTION OF MICROENTERPRISES WITH INTERNET ACCESS, PER SIZE AND REGION – 2010, 61
32 PROPORÇÃO DE EMPRESAS QUE UTILIZAM CELULARES CORPORATIVOS, POR PORTE – 2010PROPORTION OF ENTERPRISES THAT USE CORPORATE MOBILE PHONES, PER SIZE – 2010, 62
33 PROPORÇÃO DE MICROEMPRESAS COM REDE (LAN, INTRANET, EXTRANET)PROPORTION OF MICROENTERPRISES WITH NETWORKS (LAN, INTRANET, EXTRANET), 63
33 PROPORÇÃO DE MICROEMPRESAS COM ACESSO À INTERNET, POR TIPO DE ACESSOPROPORTION OF MICROENTERPRISES WITH ACCESS TO THE INTERNET, PER TYPE OF CONNECTION, 63
34 PROPORÇÃO DE EMPRESAS USANDO A INTERNET, POR TIPO DE ATIVIDADE – 2010PROPORTION OF ENTERPRISES USING THE INTERNET, PER TYPE OF ACTIVITY – 2010, 64
35 PROPORÇÃO DE MICROEMPRESAS QUE POSSUEM WEBSITE, POR PORTE, REGIÃO E MERCADO DE ATUAÇÃO – 2010
PROPORTION OF MICROENTERPRISES WITH WEBSITES, PER SIZE, REGION AND MARKET SEGMENT – 2010, 65
36 PROPORÇÃO DE MICROEMPRESAS QUE COMERCIALIZAM VIA INTERNETPROPORTION OF MICROENTERPRISES TRADING THROUGH THE INTERNET, 66
37 PROPORÇÃO DE EMPRESAS QUE UTILIZAM ALGUM SERVIÇO DE GOVERNO ELETRÔNICO – TRANSAÇÕES E CONSULTAS – 2010
PROPORTION OF ENTERPRISES THAT USE ELECTRONIC GOVERNMENT SERVICES – TRANSACTIONS AND SEARCHES – 2010, 67
38 PROPORÇÃO DE EMPRESAS QUE IDENTIFICARAM PROBLEMAS DE SEGURANÇA, POR TIPO DE PROBLEMA – 2010
PROPORTION OF ENTERPRISES WHICH HAVE IDENTIFIED SECURITY ISSUES, PER TYPE OF ISSUE – 2010, 68
2010 Pesquisa TIC MicroempresasSUMÁRIO 11
PO
RTU
GU
ÊS ENGLISH
LISTA DE FIGURAS / FIGURE LIST
RELATÓRIO METODOLÓGICO / METHODOLOGICAL REPORT
20 PLANO AMOSTRAL DA PESQUISA TIC MICROEMPRESAS 2010ICT MICROENTERPRISES 2010 SURVEY SAMPLE DESIGN, 50
22 UNIVERSO DAS MICROEMPRESAS INCLUÍDAS NO PLANO AMOSTRAL DA PESQUISA TIC MICROEMPRESAS 2010
UNIVERSE OF MICROENTERPRISES IN THE SAMPLE PLAN OF THE ICT MICROENTERPRISES 2010 SURVEY, 52
LISTA DE TABELAS / TABLE LIST
RELATÓRIO METODOLÓGICO / METHODOLOGICAL REPORT
23 DISTRIBUIÇÃO DA AMOSTRA, POR ESTRATODISTRIBUTION OF SAMPLES, PER STRATUM, 53
24 MARGEM DE ERRO, POR ESTRATOMARGIN OF ERROR, PER STRATUM, 54
25 DISPOSIÇÃO DE CONTATOS NA TIC MICROEMPRESAS 2010CONTACTS MADE IN THE ICT MICROENTERPRISES 2010, 55

13
PO
RTU
GU
ÊS
2010 Pesquisa TIC MicroempresasINTRODUÇÃO
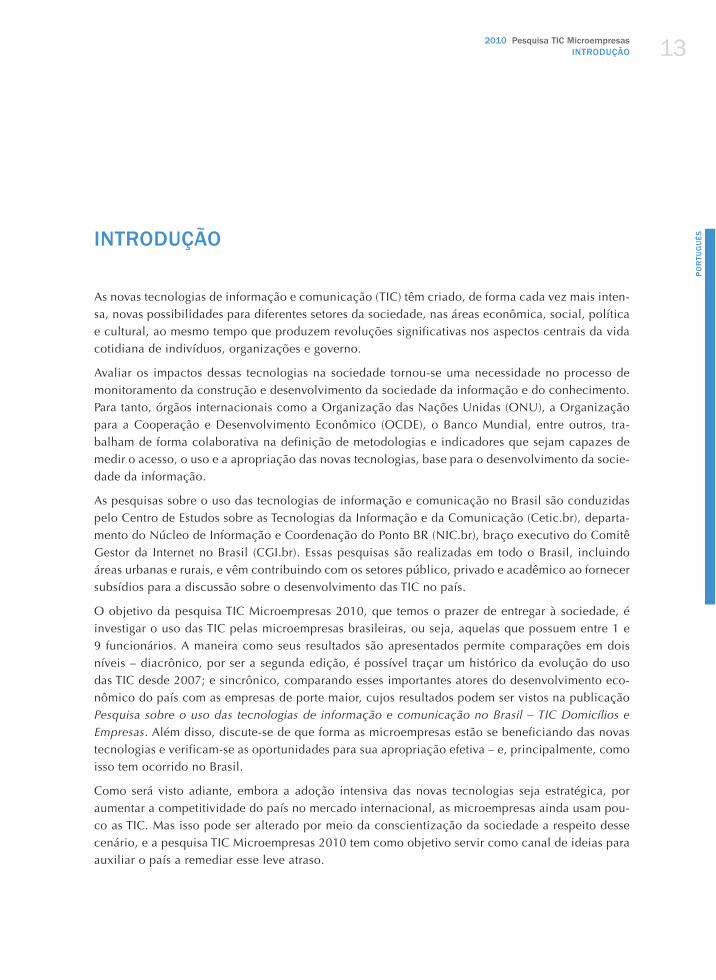
INTRODUÇÃO
As novas tecnologias de informação e comunicação (TIC) têm criado, de forma cada vez mais inten-sa, novas possibilidades para diferentes setores da sociedade, nas áreas econômica, social, política e cultural, ao mesmo tempo que produzem revoluções significativas nos aspectos centrais da vida cotidiana de indivíduos, organizações e governo.
Avaliar os impactos dessas tecnologias na sociedade tornou-se uma necessidade no processo de monitoramento da construção e desenvolvimento da sociedade da informação e do conhecimento. Para tanto, órgãos internacionais como a Organização das Nações Unidas (ONU), a Organização para a Cooperação e Desenvolvimento Econômico (OCDE), o Banco Mundial, entre outros, tra-balham de forma colaborativa na definição de metodologias e indicadores que sejam capazes de medir o acesso, o uso e a apropriação das novas tecnologias, base para o desenvolvimento da socie-dade da informação.
As pesquisas sobre o uso das tecnologias de informação e comunicação no Brasil são conduzidas pelo Centro de Estudos sobre as Tecnologias da Informação e da Comunicação (Cetic.br), departa-mento do Núcleo de Informação e Coordenação do Ponto BR (NIC.br), braço executivo do Comitê Gestor da Internet no Brasil (CGI.br). Essas pesquisas são realizadas em todo o Brasil, incluindo áreas urbanas e rurais, e vêm contribuindo com os setores público, privado e acadêmico ao fornecer subsídios para a discussão sobre o desenvolvimento das TIC no país.
O objetivo da pesquisa TIC Microempresas 2010, que temos o prazer de entregar à sociedade, é investigar o uso das TIC pelas microempresas brasileiras, ou seja, aquelas que possuem entre 1 e 9 funcionários. A maneira como seus resultados são apresentados permite comparações em dois níveis – diacrônico, por ser a segunda edição, é possível traçar um histórico da evolução do uso das TIC desde 2007; e sincrônico, comparando esses importantes atores do desenvolvimento eco-nômico do país com as empresas de porte maior, cujos resultados podem ser vistos na publicação Pesquisa sobre o uso das tecnologias de informação e comunicação no Brasil – TIC Domicílios e Empresas. Além disso, discute-se de que forma as microempresas estão se beneficiando das novas tecnologias e verificam-se as oportunidades para sua apropriação efetiva – e, principalmente, como isso tem ocorrido no Brasil.
Como será visto adiante, embora a adoção intensiva das novas tecnologias seja estratégica, por aumentar a competitividade do país no mercado internacional, as microempresas ainda usam pou-co as TIC. Mas isso pode ser alterado por meio da conscientização da sociedade a respeito desse cenário, e a pesquisa TIC Microempresas 2010 tem como objetivo servir como canal de ideias para auxiliar o país a remediar esse leve atraso.

14 P
OR
TUG
UÊS
Pesquisa TIC MIcroempresas 2010INTRODUÇÃO
Assim, esperamos que os dados e análises dessa segunda edição promovam importantes reflexões e debates e que sejam amplamente utilizados pelos gestores públicos para desenhar o futuro da sociedade da informação e do conhecimento no Brasil, que possam continuar sendo insumo para trabalhos científicos e acadêmicos e que possam seguir ajudando empresas do setor privado e do terceiro setor no monitoramento de tendências de mercado.
TIC MICROEMPRESAS 2010

2010 Pesquisa TIC MicroempresasRELATÓRIO METODOLÓGICO 17
PO
RTU
GU
ÊSRELATÓRIO METODOLÓGICO TIC MICROEMPRESAS 2010
INTRODUÇÃO
O Centro de Estudos sobre as Tecnologias da Informação e da Comunicação (Cetic.br), do Núcleo de Informação e Coordenação do Ponto BR (NIC.br) – braço executivo do Comitê Gestor da Internet no Brasil (CGI.br) –, executou em 2010 a segunda edição do estudo TIC Microempresas. No mesmo contexto da pesquisa sobre o uso das tecnologias de informação e comunicação no Brasil 2010 – TIC Empresas,1 a TIC Microempresas 2010 foi realizada entre os meses de setembro e novembro de 2010, em todo o território nacional, tendo como objetivo investigar a penetração e o uso da Internet nas microempresas brasileiras que possuem entre 1 e 9 funcionários, abordando os seguintes temas:
MÓDULO A – Informações gerais sobre os sistemas TIC;
MÓDULO B – Uso da Internet;
MÓDULO C – Governo eletrônico (e-Gov);
MÓDULO D – Segurança na rede;
MÓDULO E – Comércio eletrônico;
MÓDULO F – Habilidades no uso das TIC.
Assim como a primeira edição, de 2007, esta pesquisa busca traçar o perfil do uso das TIC nas microempresas e identificar as principais diferenças desse uso entre as empresas com 1 a 9 funcio-nários (microempresas) e as empresas com 10 ou mais funcionários no Brasil.
O estudo foi desenvolvido com base nos padrões metodológicos propostos pelo manual da Conferência das Nações Unidas sobre Comércio e Desenvolvimento (UNCTAD, 2009), elabora-do pela parceria entre a Organização para a Cooperação e Desenvolvimento Econômico (OCDE), o Instituto de Estatísticas da Comissão Europeia (Eurostat) e o Partnership on Measuring ICT for Development, uma coalizão de diversas organizações internacionais visando à harmonização de indicadores-chave em pesquisas sobre TIC.
1 Veja os resultados completos da TIC Empresas 2010 em http://www.cetic.br/empresas/2010/. Acesso em 2 dez. 2011.
Pesquisa TIC Microempresas 2010RELATÓRIO METODOLÓGICO 18
PO
RTU
GU
ÊS
CONCEITOS, CLASSIFICAÇÕES E DEFINIÇÕES
A Classificação Nacional das Atividades Econômicas (CNAE) pode ser definida como uma estru-tura-base sobre a qual as pessoas jurídicas no Brasil são categorizadas com relação ao exercício de suas atividades econômicas.
Entre 2004 e 2006, a Comissão Nacional das Classificações (Concla) realizou estudos para a atua-lização da CNAE 1.0, criando uma nova versão, a 2.0. A mudança teve como objetivo principal melhorar o entendimento da dinâmica e das transformações inerentes à própria atividade econô-mica ocorridas ao longo dos anos no país. Assim, em abril de 2007, foi divulgada pelo IBGE a CNAE 2.0, que trouxe um ganho substancial para o entendimento dos fluxos econômicos ocorridos no universo das empresas brasileiras. Os impactos dessa atualização foram analisados na pesquisa TIC Empresas 2009, e tal variável de estratificação permaneceu no plano amostral de 2010, tanto na TIC Empresas quanto na TIC Microempresas.
Para a leitura e a análise dos dados da pesquisa, fizeram-se alguns agrupamentos de região (Norte, Nordeste e Centro-Oeste) e de alguns segmentos de atividade:
Indústria de transformação; Construção; Transporte, armazenagem e correio; Alojamento e alimentação; Informação e comunicação; Artes, cultura, esporte e recreação; Outras ativida-des de serviços.
Comércio; Reparação de veículos automotores e motocicletas.
Atividades imobiliárias; Atividades profissionais, científicas e técnicas; Atividades administra-tivas e serviços complementares.
Neste estudo, faremos referência às microempresas usando o termo “micro”; às empresas com 10 a 49 funcionários, como “pequenas”; às de 50 a 249 funcionários, como “médias”; e àquelas com mais de 250 funcionários, como “grandes”.
Note-se que o critério utilizado para classificar as empresas quanto ao porte, segundo o número de funcionários, foi definido a partir das recomendações internacionais dispostas acima, enquanto a legislação brasileira prevê outro critério, baseado na renda bruta auferida em cada ano-calendário, como descrito no artigo 3º, II, da Lei Complementar nº 123, de 14 de dezembro de 2006, também conhecida por Estatuto das Microempresas e Empresas de Pequeno Porte.
QUESTIONÁRIO
O questionário utilizado nesta segunda edição da TIC Microempresas é baseado no da pesquisa TIC Empresas 2010. Considerando o contexto das empresas com 1 a 9 funcionários, não foram investi-gados alguns indicadores da TIC Empresas – por estarem mais associados ao contexto das grandes empresas –, o que reduz a complexidade da coleta e o tempo de aplicação do questionário (exem-plos: acesso remoto, tecnologias de conexão, softwares, segurança, habilidades em TI, entre outros).
2010 Pesquisa TIC MicroempresasRELATÓRIO METODOLÓGICO 19
PO
RTU
GU
ÊS
As primeiras perguntas do instrumento de coleta de dados fazem um levantamento do perfil do res-pondente e da microempresa. Para as informações gerais sobre os sistemas TIC, o módulo A mede a utilização e o número de computadores, os tipos de tecnologia, a utilização de sistemas operacio-nais gratuitos e a utilização de celulares corporativos.
O uso da Internet é levantando no módulo B por meio de perguntas sobre a utilização e a finalida-de do uso, sobre os tipos de serviço e tecnologia, a velocidade de conexão contratada, a existência de website, medidas de restrição ao usuário, entre outras.
O módulo C busca conhecer o relacionamento das microempresas com órgãos governamentais por meio da Internet na realização de transações e consultas ou buscas de informações diretamente em sites do governo.
No módulo D, segurança na rede, questiona-se o uso de algumas tecnologias de segurança e se foi identificado algum problema de segurança.
O comércio eletrônico, abordado no módulo E, faz referência aos pedidos de produtos ou serviços realizados ou recebidos via Internet.
O módulo F pergunta se alguma das funções que exigem especialistas em TI foi desempenhada por fornecedores externos.
CRITÉRIOS PARA A COLETA DE DADOS
As entrevistas com as empresas foram feitas por telefone e tiveram duração média de 25 minutos.
Em todas as empresas pesquisadas, buscou-se entrevistar o responsável pela área de informática, de tecnologia da informação, de gerenciamento da rede de computadores ou por uma área equi-valente, ou seja:
Diretor da divisão de informática e tecnologia;
Gerente de negócios (vice-presidente sênior, vice-presidente de linha de negócios, diretor);
Gerente ou comprador do departamento de tecnologia;
Influenciador tecnológico (funcionário do departamento comercial ou do departamento de operações de TI com influência sobre as decisões a respeito de questões tecnológicas);
Coordenador de projetos e sistemas;
Diretor de outros departamentos ou divisões (exceto o de informática);
Gerente de desenvolvimento de sistemas;
Gerente de informática;
Gerente de projetos;
Dono ou sócio da empresa.
Pesquisa TIC Microempresas 2010RELATÓRIO METODOLÓGICO 20
PO
RTU
GU
ÊS
CADASTROS E FONTES DE INFORMAÇÃO UTILIZADAS
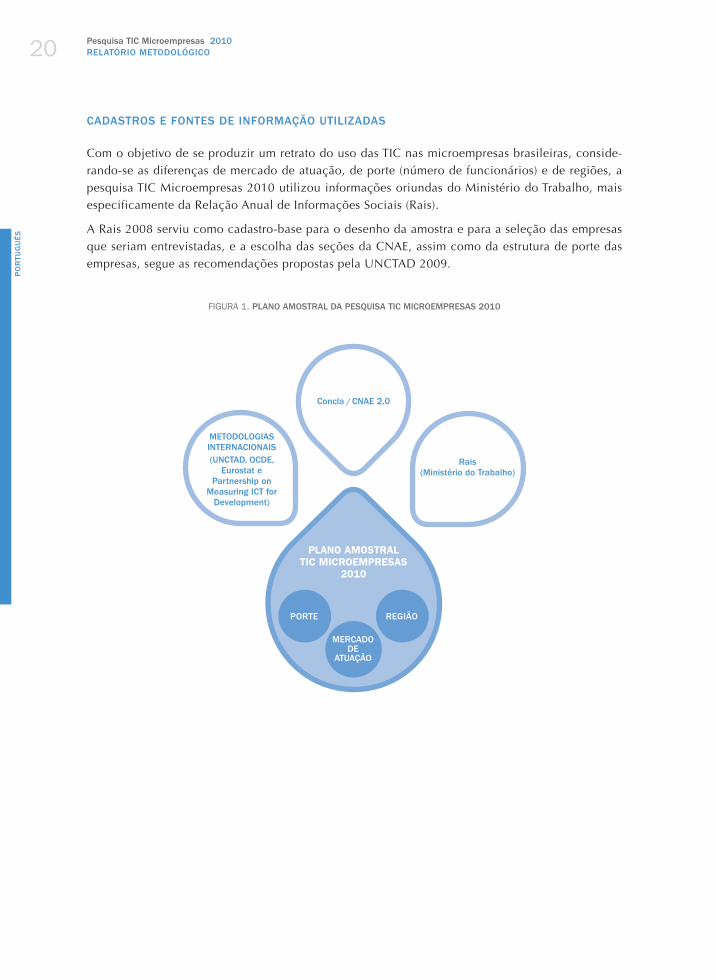
Com o objetivo de se produzir um retrato do uso das TIC nas microempresas brasileiras, conside-rando-se as diferenças de mercado de atuação, de porte (número de funcionários) e de regiões, a pesquisa TIC Microempresas 2010 utilizou informações oriundas do Ministério do Trabalho, mais especificamente da Relação Anual de Informações Sociais (Rais).
A Rais 2008 serviu como cadastro-base para o desenho da amostra e para a seleção das empresas que seriam entrevistadas, e a escolha das seções da CNAE, assim como da estrutura de porte das empresas, segue as recomendações propostas pela UNCTAD 2009.
FIGURA 1. PLANO AMOSTRAL DA PESQUISA TIC MICROEMPRESAS 2010
METODOLOGIAS INTERNACIONAIS(UNCTAD, OCDE,
Eurostat e Partnership on
Measuring ICT for Development)
Rais (Ministério do Trabalho)
Concla / CNAE 2.0
PLANO AMOSTRAL TIC MICROEMPRESAS
2010
PORTE REGIÃO
MERCADO DE
ATUAÇÃO
2010 Pesquisa TIC MicroempresasRELATÓRIO METODOLÓGICO 21
PO
RTU
GU
ÊS
UNIVERSO
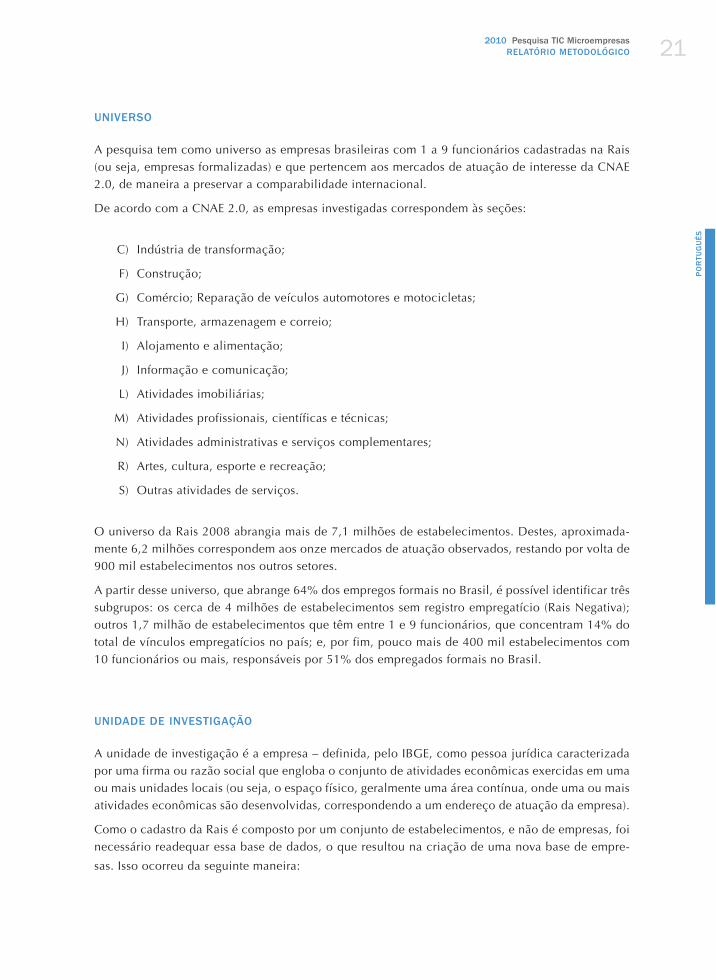
A pesquisa tem como universo as empresas brasileiras com 1 a 9 funcionários cadastradas na Rais (ou seja, empresas formalizadas) e que pertencem aos mercados de atuação de interesse da CNAE 2.0, de maneira a preservar a comparabilidade internacional.
De acordo com a CNAE 2.0, as empresas investigadas correspondem às seções:
C) Indústria de transformação;
F) Construção;
G) Comércio; Reparação de veículos automotores e motocicletas;
H) Transporte, armazenagem e correio;
I) Alojamento e alimentação;
J) Informação e comunicação;
L) Atividades imobiliárias;
M) Atividades profissionais, científicas e técnicas;
N) Atividades administrativas e serviços complementares;
R) Artes, cultura, esporte e recreação;
S) Outras atividades de serviços.
O universo da Rais 2008 abrangia mais de 7,1 milhões de estabelecimentos. Destes, aproximada-mente 6,2 milhões correspondem aos onze mercados de atuação observados, restando por volta de 900 mil estabelecimentos nos outros setores.
A partir desse universo, que abrange 64% dos empregos formais no Brasil, é possível identificar três subgrupos: os cerca de 4 milhões de estabelecimentos sem registro empregatício (Rais Negativa); outros 1,7 milhão de estabelecimentos que têm entre 1 e 9 funcionários, que concentram 14% do total de vínculos empregatícios no país; e, por fim, pouco mais de 400 mil estabelecimentos com 10 funcionários ou mais, responsáveis por 51% dos empregados formais no Brasil.
UNIDADE DE INVESTIGAÇÃO
A unidade de investigação é a empresa – definida, pelo IBGE, como pessoa jurídica caracterizada por uma firma ou razão social que engloba o conjunto de atividades econômicas exercidas em uma ou mais unidades locais (ou seja, o espaço físico, geralmente uma área contínua, onde uma ou mais atividades econômicas são desenvolvidas, correspondendo a um endereço de atuação da empresa).
Como o cadastro da Rais é composto por um conjunto de estabelecimentos, e não de empresas, foi necessário readequar essa base de dados, o que resultou na criação de uma nova base de empre-
sas. Isso ocorreu da seguinte maneira:
Pesquisa TIC Microempresas 2010RELATÓRIO METODOLÓGICO 22
PO
RTU
GU
ÊS
1. Inicialmente, o número do CNPJ do estabelecimento foi completado com zeros à esquerda, até atingir quatorze dígitos.
2. Ordenaram-se as empresas por número de CNPJ.
3. Os estabelecimentos foram agrupados pelos oito primeiros dígitos do CNPJ, e somaram-se os dados do campo “número de empregados” em um único registro.
4. Eliminaram-se as duplicidades, mantendo-se apenas o primeiro registro (matriz).
5. Foram mantidas as informações de mercado de atuação CNAE e a região da matriz da empresa.
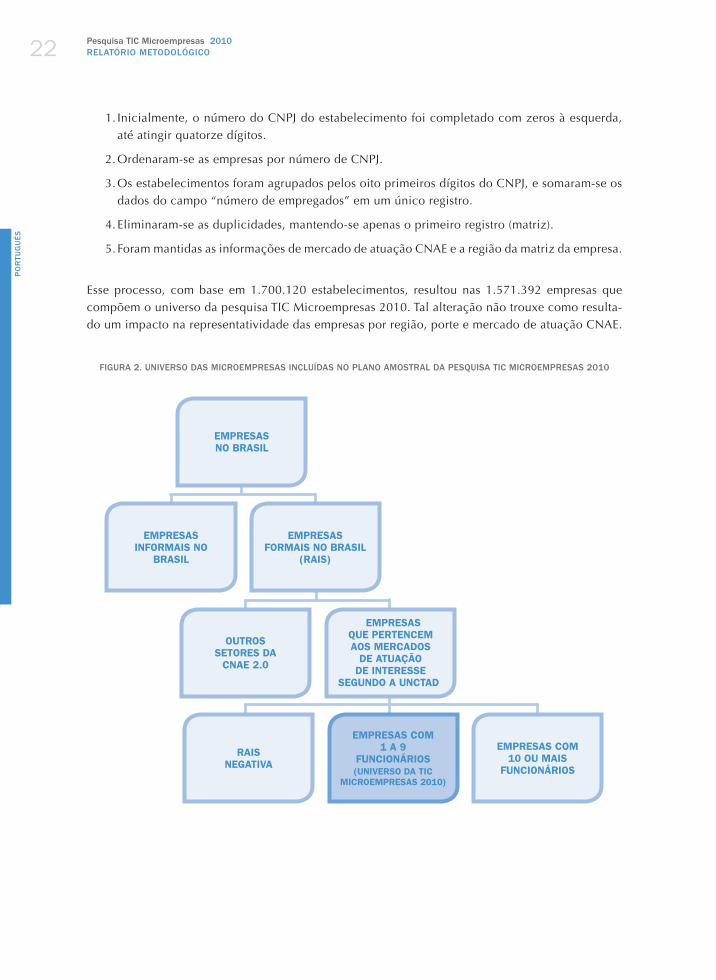
Esse processo, com base em 1.700.120 estabelecimentos, resultou nas 1.571.392 empresas que compõem o universo da pesquisa TIC Microempresas 2010. Tal alteração não trouxe como resulta-do um impacto na representatividade das empresas por região, porte e mercado de atuação CNAE.
FIGURA 2. UNIVERSO DAS MICROEMPRESAS INCLUÍDAS NO PLANO AMOSTRAL DA PESQUISA TIC MICROEMPRESAS 2010
EMPRESAS NO BRASIL
EMPRESAS INFORMAIS NO
BRASIL
EMPRESAS FORMAIS NO BRASIL
(RAIS)
OUTROS SETORES DA
CNAE 2.0
EMPRESAS QUE PERTENCEM AOS MERCADOS
DE ATUAÇÃO DE INTERESSE
SEGUNDO A UNCTAD
RAIS NEGATIVA
EMPRESAS COM 1 A 9
FUNCIONÁRIOS(UNIVERSO DA TIC
MICROEMPRESAS 2010)
EMPRESAS COM 10 OU MAIS
FUNCIONÁRIOS
2010 Pesquisa TIC MicroempresasRELATÓRIO METODOLÓGICO 23
PO
RTU
GU
ÊS
DESCRIÇÃO DO PLANO AMOSTRAL E PROCEDIMENTOS DE PONDERAÇÃO
A amostra da pesquisa foi desenhada pelo Ibope Inteligência. A técnica utilizada na seleção foi a amostragem estratificada não proporcional.
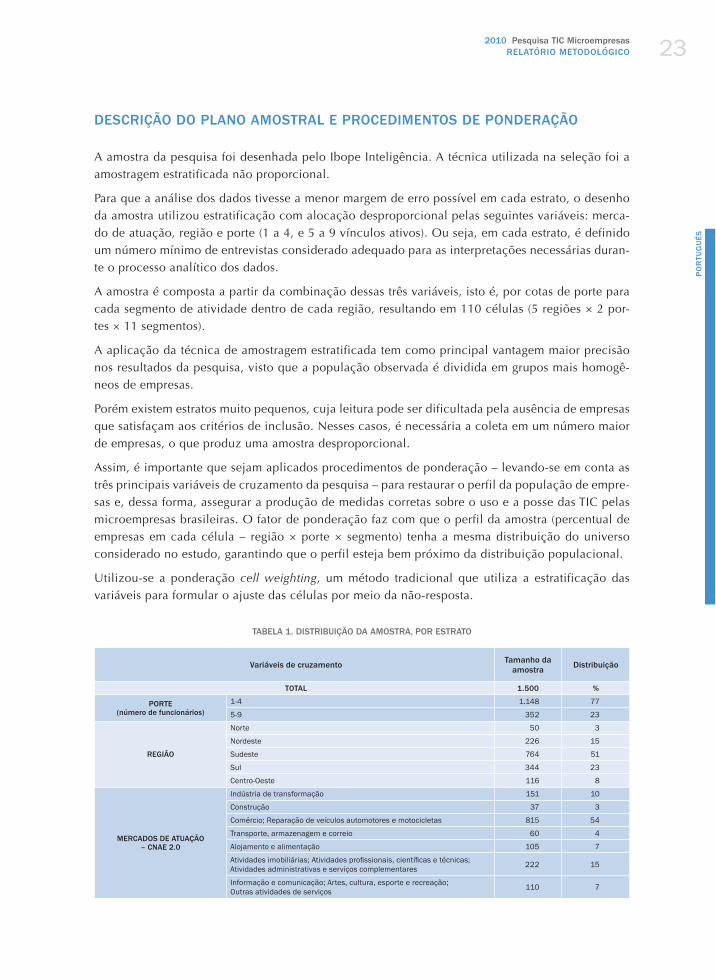
Para que a análise dos dados tivesse a menor margem de erro possível em cada estrato, o desenho da amostra utilizou estratificação com alocação desproporcional pelas seguintes variáveis: merca-do de atuação, região e porte (1 a 4, e 5 a 9 vínculos ativos). Ou seja, em cada estrato, é definido um número mínimo de entrevistas considerado adequado para as interpretações necessárias duran-te o processo analítico dos dados.
A amostra é composta a partir da combinação dessas três variáveis, isto é, por cotas de porte para cada segmento de atividade dentro de cada região, resultando em 110 células (5 regiões ! 2 por-tes ! 11 segmentos).
A aplicação da técnica de amostragem estratificada tem como principal vantagem maior precisão nos resultados da pesquisa, visto que a população observada é dividida em grupos mais homogê-neos de empresas.
Porém existem estratos muito pequenos, cuja leitura pode ser dificultada pela ausência de empresas que satisfaçam aos critérios de inclusão. Nesses casos, é necessária a coleta em um número maior de empresas, o que produz uma amostra desproporcional.
Assim, é importante que sejam aplicados procedimentos de ponderação – levando-se em conta as três principais variáveis de cruzamento da pesquisa – para restaurar o perfil da população de empre-sas e, dessa forma, assegurar a produção de medidas corretas sobre o uso e a posse das TIC pelas microempresas brasileiras. O fator de ponderação faz com que o perfil da amostra (percentual de empresas em cada célula – região ! porte ! segmento) tenha a mesma distribuição do universo considerado no estudo, garantindo que o perfil esteja bem próximo da distribuição populacional.
Utilizou-se a ponderação cell weighting, um método tradicional que utiliza a estratificação das variá veis para formular o ajuste das células por meio da não-resposta.
TABELA 1. DISTRIBUIÇÃO DA AMOSTRA, POR ESTRATO
Variáveis de cruzamentoTamanho da
amostraDistribuição
TOTAL 1.500 %
PORTE
(número de funcionários)
1-4 1.148 77
5-9 352 23
REGIÃO
Norte 50 3
Nordeste 226 15
Sudeste 764 51
Sul 344 23
Centro-Oeste 116 8
MERCADOS DE ATUAÇÃO
– CNAE 2.0
Indústria de transformação 151 10
Construção 37 3
Comércio; Reparação de veículos automotores e motocicletas 815 54
Transporte, armazenagem e correio 60 4
Alojamento e alimentação 105 7
$WLYLGDGHV�LPRELOLiULDV��$WLYLGDGHV�SURÀVVLRQDLV��FLHQWtÀFDV�H�WpFQLFDV�� Atividades administrativas e serviços complementares 222 15
Informação e comunicação; Artes, cultura, esporte e recreação; Outras atividades de serviços 110 7
Pesquisa TIC Microempresas 2010RELATÓRIO METODOLÓGICO 24
PO
RTU
GU
ÊS
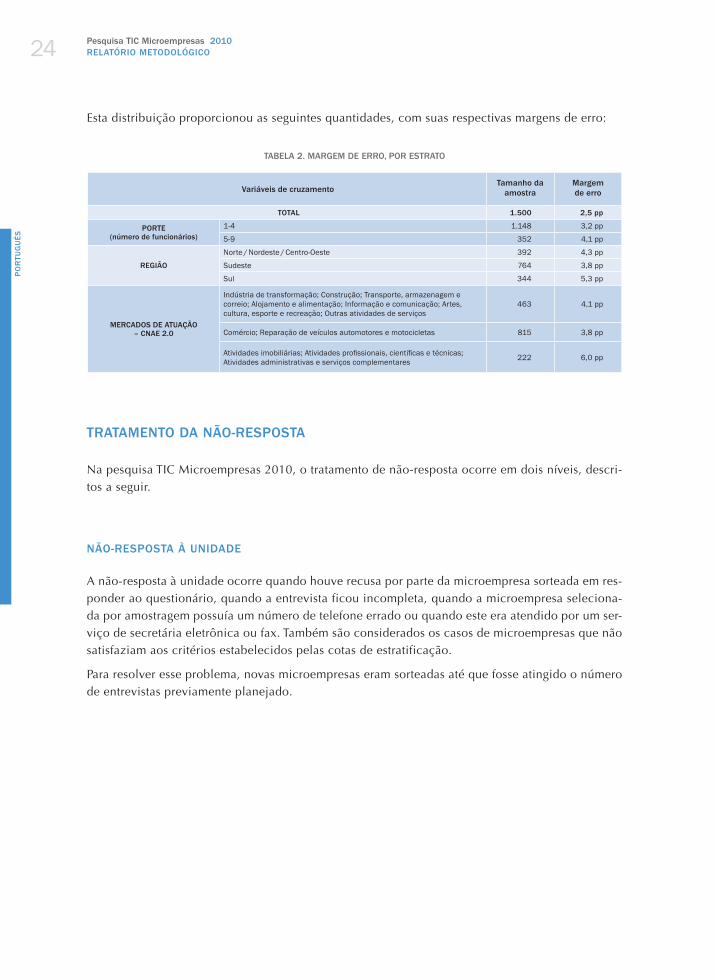
Esta distribuição proporcionou as seguintes quantidades, com suas respectivas margens de erro:
TABELA 2. MARGEM DE ERRO, POR ESTRATO
Variáveis de cruzamentoTamanho da
amostra
Margem
de erro
TOTAL 1.500 2,5 pp
PORTE
(número de funcionários)
1-4 1.148 3,2 pp
5-9 352 4,1 pp
REGIÃO
Norte / Nordeste / Centro-Oeste 392 4,3 pp
Sudeste 764 3,8 pp
Sul 344 5,3 pp
MERCADOS DE ATUAÇÃO
– CNAE 2.0
Indústria de transformação; Construção; Transporte, armazenagem e correio; Alojamento e alimentação; Informação e comunicação; Artes, cultura, esporte e recreação; Outras atividades de serviços
463 4,1 pp
Comércio; Reparação de veículos automotores e motocicletas 815 3,8 pp
$WLYLGDGHV�LPRELOLiULDV��$WLYLGDGHV�SURÀVVLRQDLV��FLHQWtÀFDV�H�WpFQLFDV�� Atividades administrativas e serviços complementares 222 6,0 pp
TRATAMENTO DA NÃO-RESPOSTA
Na pesquisa TIC Microempresas 2010, o tratamento de não-resposta ocorre em dois níveis, descri-tos a seguir.
NÃO-RESPOSTA À UNIDADE
A não-resposta à unidade ocorre quando houve recusa por parte da microempresa sorteada em res-ponder ao questionário, quando a entrevista ficou incompleta, quando a microempresa seleciona-da por amostragem possuía um número de telefone errado ou quando este era atendido por um ser-viço de secretária eletrônica ou fax. Também são considerados os casos de microempresas que não satisfaziam aos critérios estabelecidos pelas cotas de estratificação.
Para resolver esse problema, novas microempresas eram sorteadas até que fosse atingido o número de entrevistas previamente planejado.
2010 Pesquisa TIC MicroempresasRELATÓRIO METODOLÓGICO 25
PO
RTU
GU
ÊS
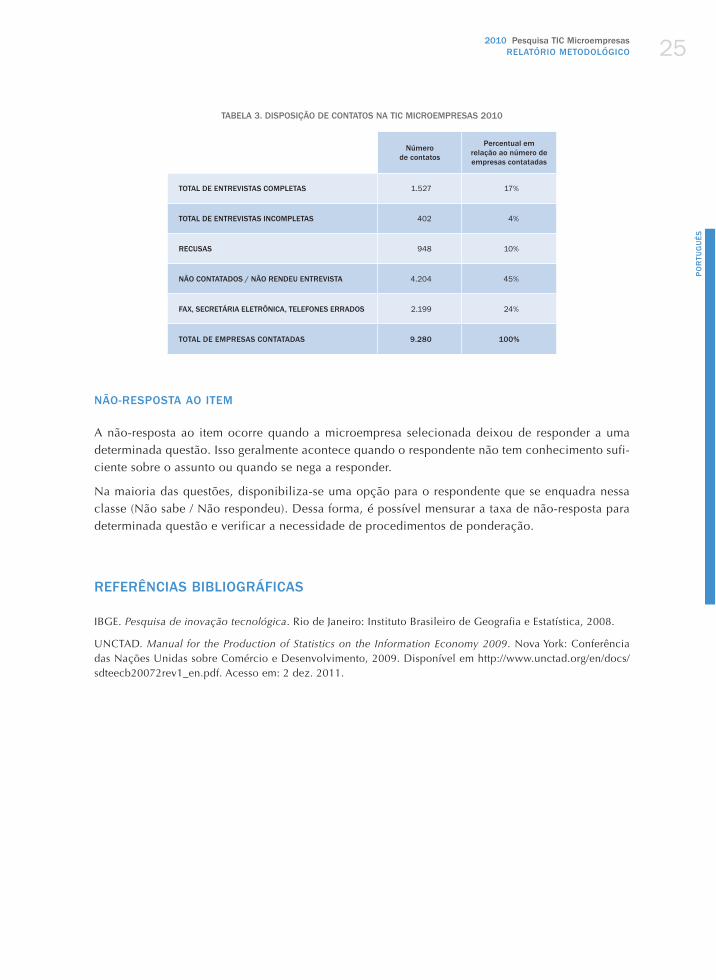
TABELA 3. DISPOSIÇÃO DE CONTATOS NA TIC MICROEMPRESAS 2010
Número
de contatos
Percentual em
relação ao número de
empresas contatadas
TOTAL DE ENTREVISTAS COMPLETAS 1.527 17%
TOTAL DE ENTREVISTAS INCOMPLETAS 402 4%
RECUSAS 948 10%
NÃO CONTATADOS / NÃO RENDEU ENTREVISTA 4.204 45%
FAX, SECRETÁRIA ELETRÔNICA, TELEFONES ERRADOS 2.199 24%
TOTAL DE EMPRESAS CONTATADAS 9.280 100%
NÃO-RESPOSTA AO ITEM
A não-resposta ao item ocorre quando a microempresa selecionada deixou de responder a uma determinada questão. Isso geralmente acontece quando o respondente não tem conhecimento sufi-ciente sobre o assunto ou quando se nega a responder.
Na maioria das questões, disponibiliza-se uma opção para o respondente que se enquadra nessa classe (Não sabe / Não respondeu). Dessa forma, é possível mensurar a taxa de não-resposta para determinada questão e verificar a necessidade de procedimentos de ponderação.
REFERÊNCIAS BIBLIOGRÁFICAS
IBGE. Pesquisa de inovação tecnológica. Rio de Janeiro: Instituto Brasileiro de Geografia e Estatística, 2008.
UNCTAD. Manual for the Production of Statistics on the Information Economy 2009. Nova York: Conferência das Nações Unidas sobre Comércio e Desenvolvimento, 2009. Disponível em http://www.unctad.org/en/docs/sdteecb20072rev1_en.pdf. Acesso em: 2 dez. 2011.

2010 Pesquisa TIC MicroempresasPERFIL DA AMOSTRA 27
PO
RTU
GU
ÊSPERFIL DA AMOSTRA TIC MICROEMPRESAS 2010
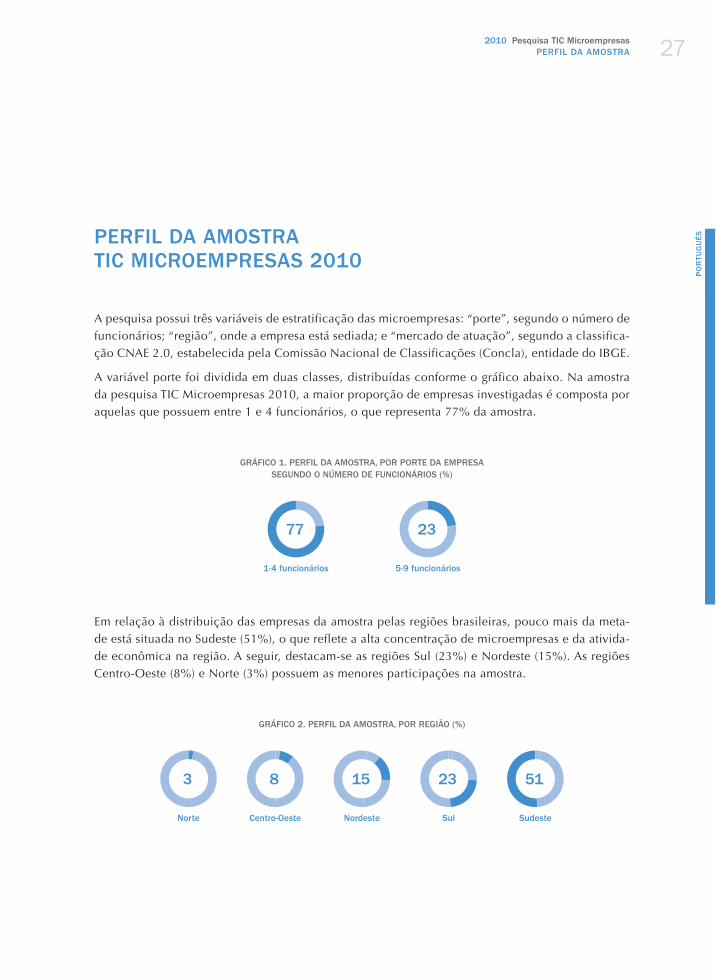
A pesquisa possui três variáveis de estratificação das microempresas: “porte”, segundo o número de funcionários; “região”, onde a empresa está sediada; e “mercado de atuação”, segundo a classifica-ção CNAE 2.0, estabelecida pela Comissão Nacional de Classificações (Concla), entidade do IBGE.
A variável porte foi dividida em duas classes, distribuídas conforme o gráfico abaixo. Na amostra da pesquisa TIC Microempresas 2010, a maior proporção de empresas investigadas é composta por aquelas que possuem entre 1 e 4 funcionários, o que representa 77% da amostra.
GRÁFICO 1. PERFIL DA AMOSTRA, POR PORTE DA EMPRESA SEGUNDO O NÚMERO DE FUNCIONÁRIOS (%)
77 23
1-4 funcionários 5-9 funcionários
Em relação à distribuição das empresas da amostra pelas regiões brasileiras, pouco mais da meta-de está situada no Sudeste (51%), o que reflete a alta concentração de microempresas e da ativida-de econômica na região. A seguir, destacam-se as regiões Sul (23%) e Nordeste (15%). As regiões Centro-Oeste (8%) e Norte (3%) possuem as menores participações na amostra.
GRÁFICO 2. PERFIL DA AMOSTRA, POR REGIÃO (%)
3 8 15 23 51
Norte Centro-Oeste Nordeste Sul Sudeste
Pesquisa TIC Microempresas 2010PERFIL DA AMOSTRA 28
PO
RTU
GU
ÊS
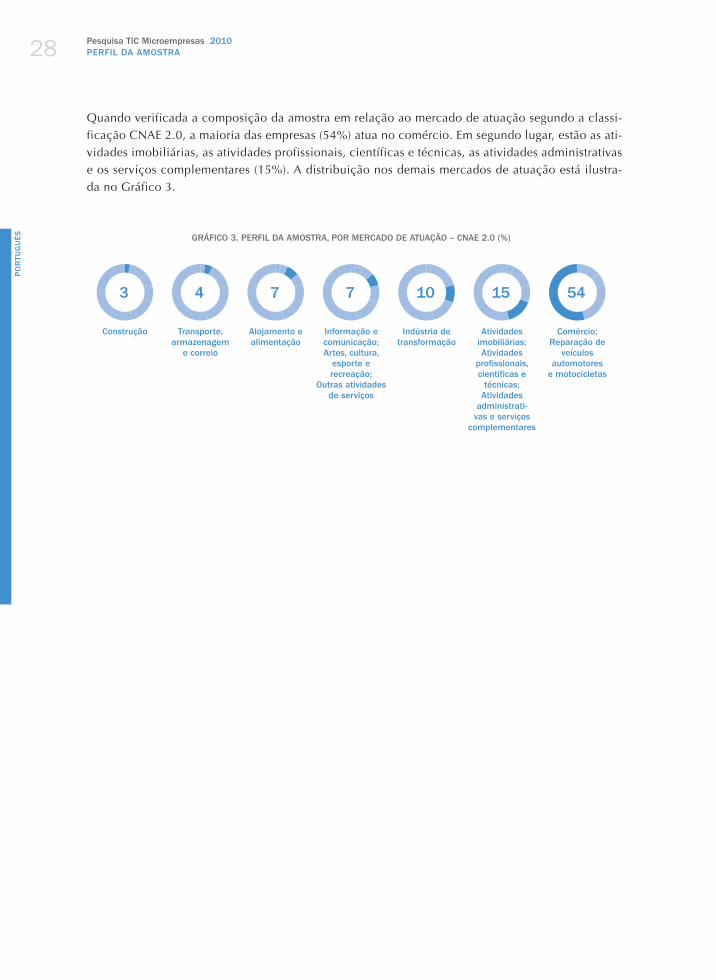
Quando verificada a composição da amostra em relação ao mercado de atuação segundo a classi-ficação CNAE 2.0, a maioria das empresas (54%) atua no comércio. Em segundo lugar, estão as ati-vidades imobiliárias, as atividades profissionais, científicas e técnicas, as atividades administrativas e os serviços complementares (15%). A distribuição nos demais mercados de atuação está ilustra-da no Gráfico 3.
GRÁFICO 3. PERFIL DA AMOSTRA, POR MERCADO DE ATUAÇÃO – CNAE 2.0 (%)
3 4 7 7 10 15 54
Construção Transporte, armazenagem
e correio
Alojamento e alimentação
Informação e comunicação; Artes, cultura,
esporte e recreação;
Outras atividades de serviços
Indústria de transformação
Atividades imobiliárias; Atividades
profissionais, científicas e
técnicas; Atividades
administrati-vas e serviços
complementares
Comércio; Reparação de
veículos automotores
e motocicletas
2010 Pesquisa TIC MicroempresasANÁLISE DOS RESULTADOS 29
PO
RTU
GU
ÊSANÁLISE DOS RESULTADOS TIC MICROEMPRESAS 2010
INTRODUÇÃO
A pesquisa TIC Microempresas 2010 tem como objetivo investigar o uso das tecnologias de infor-mação e comunicação pelas microempresas brasileiras que possuem entre 1 e 9 funcionários. É possível comparar os resultados desta edição com os do estudo realizado em 2007. Além disso, esta análise de resultados traz uma comparação entre os números das microempresas e os das empresas que possuem 10 ou mais funcionários. Discute-se também como as microempresas estão se benefi-ciando das novas tecnologias e quais são as oportunidades para sua apropriação efetiva.
O critério utilizado na pesquisa para classificar as empresas quanto ao porte é o mesmo adota-do na primeira edição, seguindo a lógica do número de funcionários a partir das recomendações da Organização para a Cooperação e o Desenvolvimento Econômico (OCDE) e do Gabinete de Estatísticas da União Europeia (Eurostat).1
No Brasil, atualmente existem 1,5 milhão de microempresas,2 o que representa em torno de 14% da mão de obra ativa no mercado de trabalho.3 Tal panorama expõe a importância deste estrato da economia, que tem grandes desafios para se estabelecer de forma consistente. Embora sejam funda-mentais para o desenvolvimento econômico e social do Brasil, as microempresas enfrentam dificul-dades na sua relação com o governo, em função da burocracia administrativa. Problemas para con-seguir financiamento, para participar de programas de desenvolvimento e inovação, burocracia no registro de patentes e nas solicitações de alvarás de funcionamento são exemplos de entraves que dificultam sua sobrevivência. Além disso, a estrutura tributária vigente no país, extremamente com-
1 No Brasil, a legislação prevê outro critério, definido pela receita bruta anual das empresas. De acordo com o artigo 3o da Lei Complementar no 123, de 14 de dezembro de 2006 (conhecida como Estatuto das Microempresas e Empresas de Pequeno Porte), microempresas são pessoas jurídicas ou firmas mercantis individuais com receita bruta anual igual ou inferior a R$ 240.000,00 (duzentos e quarenta mil reais); e empresas de pequeno porte são pessoas jurídicas ou firmas mercantis individuais que têm receita bruta anual superior a R$ 240.000,00 (duzentos e quarenta mil reais) e inferior a R$ 2.400.000,00 (dois milhões e quatrocentos mil reais). Entretanto, por se tratar de um dado sensível às empresas, esta pesquisa utiliza para a definição de porte o número de funcionários.
2 O dado corresponde às empresas brasileiras que possuem entre 1 e 9 funcionários cadastradas na Rais (ou seja, empresas for-malizadas) e que pertencem aos setores de interesse da CNAE 2.0.
3 De acordo com http://www.fecomercio.com.br/?option=com_eventos&view=interna&Itemid=20&id=3697. Acesso em 2 dez. 2011.
Pesquisa TIC Microempresas 2010ANÁLISE DOS RESULTADOS 30
PO
RTU
GU
ÊS
plexa e que impõe uma alta carga tributária a essas organizações, é também um obstáculo para o desenvolvimento e para a consolidação das microempresas.
Ciente de sua importância para o desenvolvimento do país, o governo vem implementando impor-tantes políticas de fomento às microempresas. As mudanças nos programas de financiamento e incentivo, como o Supersimples 4 e o Microempreendedor Individual (MEI),5 por exemplo, amplia-ram o limite de faturamento para a entrada de empresas no programa, aumentando, assim, o núme-ro de empresas beneficiárias.
Foi lançado também, em 2010, o Programa Crescer, que facilita o acesso a microcréditos para financiamento de operações ou investimentos realizados por empreendedores individuais ou micro e pequenas empresas com faturamento anual de até R$ 120 mil. Como destaque, o programa garan-te a redução da taxa de juros, de 60% para 8% ao ano.
Iniciativas no campo da inovação também estão sendo realizadas, como o Sebraetec,6 programa que irá mobilizar R$ 787 milhões durante os próximos três anos para auxílio a projetos de inova-ção (R$ 85 milhões em 2011; R$ 134,6 milhões em 2012; R$ 189,5 milhões em 2013; e o restante é proveniente das empresas beneficiadas, do Sebrae nos estados e de parceiros).
É importante, nesse sentido, trazer à tona o tema das TIC e sua contribuição para o ambiente empre-sarial e, consequentemente, para o desenvolvimento das microempresas no Brasil. O relatório da Conferência das Nações Unidas sobre Comércio e Desenvolvimento (UNCTAD) sobre a economia da informação, publicado em outubro de 2011, destaca a importância do setor privado – em espe-cial, micro e pequenas empresas – e sua contribuição para o crescimento econômico e social dos países em desenvolvimento. Segundo o relatório, as TIC são fundamentais para garantir esse desen-volvimento, apontando ainda que os países que já vêm adotando e investindo no uso das TIC para o fortalecimento do setor privado obtêm importantes vantagens sobre os demais, à medida que a utilização eficaz das TIC tem impacto na produtividade das empresas, tanto nas grandes quanto nas pequenas. O relatório observa que as empresas dos países em desenvolvimento que utilizam TIC têm desempenho melhor do que as que não o fazem, apresentando resultados notáveis com relação a crescimento, melhoria da rentabilidade e retorno do investimento.
Nesse contexto, o celular, por exemplo – uma tecnologia mais acessível –, é essencial, uma vez que promove uma melhor comunicação ao longo da cadeia de valor, tanto nacional como inter-nacionalmente, de acordo com a abrangência de atuação de cada empresa. O mesmo ocorre com outras tecnologias, como o computador e o acesso à Internet em banda larga, e sua aplicação ade-quada pode aumentar consideravelmente a competitividade do setor empresarial como um todo (UNCTAD, 2011).
Propõe-se aqui uma análise do uso e da apropriação que as microempresas brasileiras fazem des-sas tecnologias, oferecendo subsídios para a discussão sobre seu papel no estabelecimento e na
4 Disponível em http://www.sebrae.com.br/uf/paraiba/sites-especiais/simples-nacional. Acesso em 31 out. 2011.5 Disponível em http://cafe.ebc.com.br/cafe/arquivo/incentivos-as-micro-e-pequenas-empresas-vao-gerar-mais-renda-e-mais-
-empregos. Acesso em 31 out. 2011.6 Disponível em http://www.sebrae.com.br/integra_noticia?noticia=10812970. Acesso em 31 out. 2011.
2010 Pesquisa TIC MicroempresasANÁLISE DOS RESULTADOS 31
PO
RTU
GU
ÊS
expansão de um estrato da economia brasileira cada vez mais importante para o crescimento eco-nômico e social do país.
Como se verá adiante, a utilização que as microempresas fazem das TIC é ainda incipiente, mas sua adoção intensiva e estratégica pode aumentar a competitividade do país no mercado internacional.
USO DO COMPUTADOR
O pesquisa TIC Microempresas 2010 apresentou estabilidade com relação ao uso de computadores e acesso à Internet. 77% das microempresas declararam utilizar computadores, sendo 74% entre microempresas de 1 a 4 funcionários, e 85% entre as de 5 a 9 empregados.
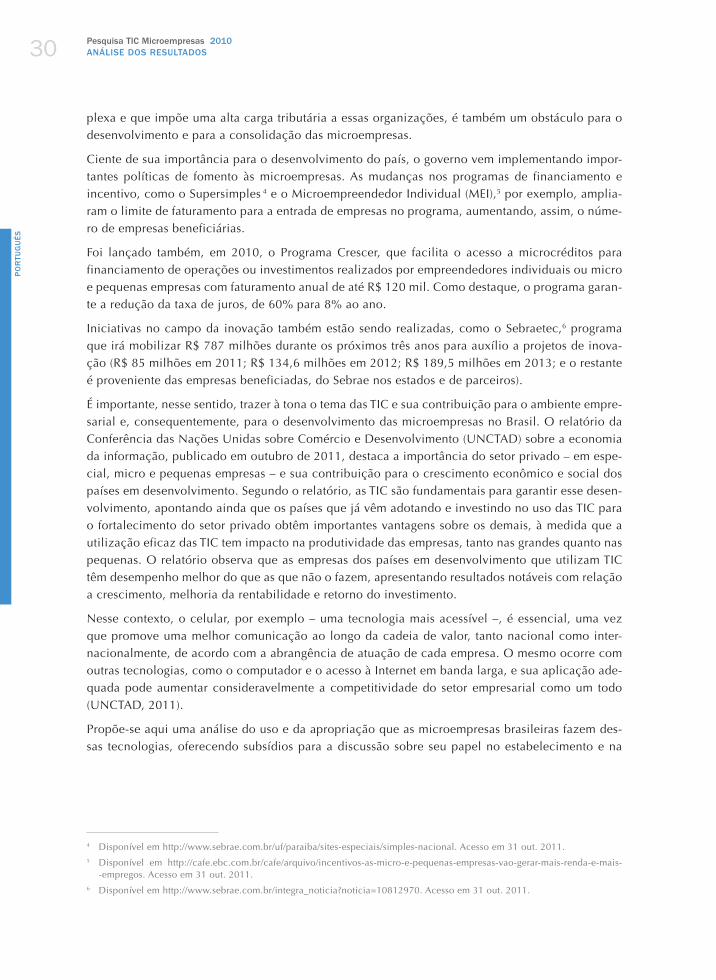
E mais, 69% das empresas declararam ter acesso à Internet, mesma proporção de 2007. Existem diferenças regionais: no Sul, 73% das microempresas acessam a Internet, enquanto nas demais regiões a proporção acompanha a média do país (no Sudeste, 68%; e nas regiões Norte, Nordeste e Centro-Oeste, 67%). Quando se analisa por porte, a diferença é mais acentuada: das microempre-sas com 1 a 4 funcionários, 65% acessam a Internet, e entre as com 5 a 9 funcionários a proporção chega a 81% (Gráfico 1).
GRÁFICO 1. PROPORÇÃO DE MICROEMPRESAS QUE TÊM ACESSO À INTERNET, POR PORTE E REGIÃO – 2010 (%) Percentual sobre o total de microempresas
Norte, Nordeste,Centro-OesteSulSudeste5-9 funcionários1-4 funcionáriosMicroempresas
69 65
81
6873
67
Entre os motivos para não utilizar computador e Internet, a maioria das empresas que não possuem essas tecnologias declarou considerá-las inapropriadas para seu tipo de negócio. 72% das micro-empresas que não utilizam computador e 64% das microempresas que não utilizam Internet disse-ram que seu “tipo de negócio não necessita” das TIC.
Dado o potencial das TIC em termos de aumento de produtividade, organização, inovação e acesso a informações para as empresas, é possível que as microempresas que ainda não adotaram as novas tecnologias não percebam a utilidade do computador e da Internet para suas atividades, ou talvez exista uma lacuna na aquisição de habilidades para o uso efetivo dessas ferramentas.
Em 2010, investigou-se pela primeira vez o uso de celulares corporativos pelas microempresas, e o resultado demonstrou que aproximadamente um terço (36%) delas faz uso dessa tecnologia.
Pesquisa TIC Microempresas 2010ANÁLISE DOS RESULTADOS 32
PO
RTU
GU
ÊS
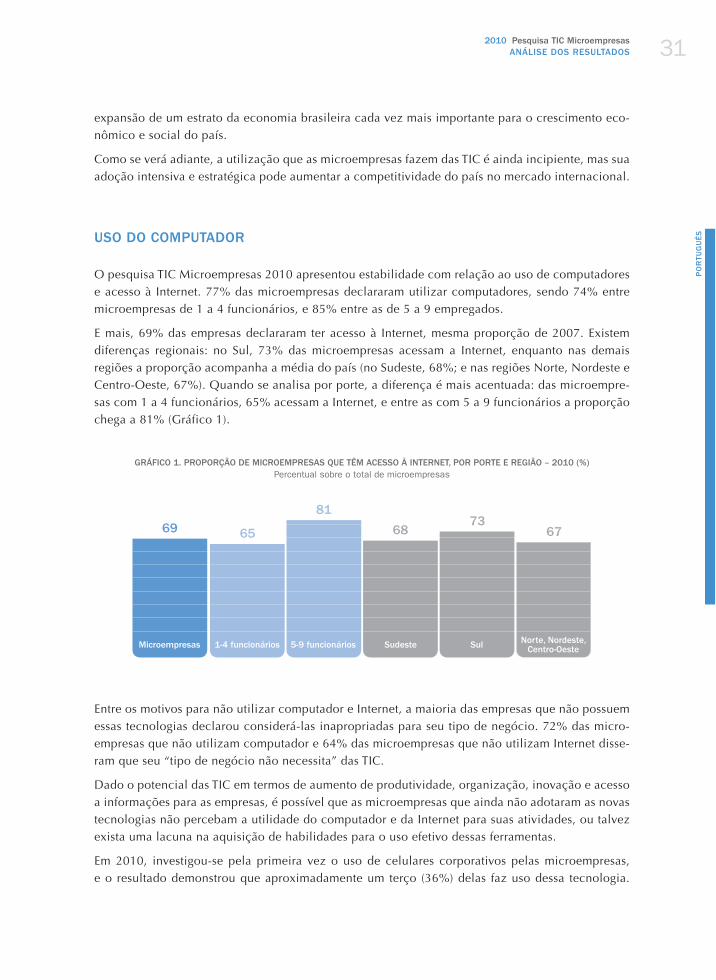
Comparando esse dado com os resultados das empresas com 10 funcionários ou mais, observa-se que o uso do celular cresce de acordo com o porte da empresa. Entre as empresas com 10 a 49 fun-cionários, 61% usam celular corporativo; de 50 a 249, são 82%; e com 250 ou mais empregados, 93% (Gráfico 2). Quanto ao uso da Internet pelo celular, entre as microempresas a proporção (14%) é metade da de empresas maiores (28%).
Uma provável barreira para a adoção da Internet móvel entre as microempresas é o custo desse ser-viço. Segundo dados da ITU, considerando-se 165 países, o Brasil ocupa a 96ª posição no ranking mundial de acessibilidade de preço da cesta geral de serviços TIC, e a 125ª posição em cesta de TIC móvel.
GRÁFICO 2. PROPORÇÃO DE EMPRESAS QUE UTILIZAM CELULARES CORPORATIVOS, POR PORTE – 2010 (%) Percentual sobre o total de empresas que utilizam computador
SIM NÃO
718
39
64
9382
61
36
MICROEMPRESAS
MÉDIAS GRANDESPEQUENAS
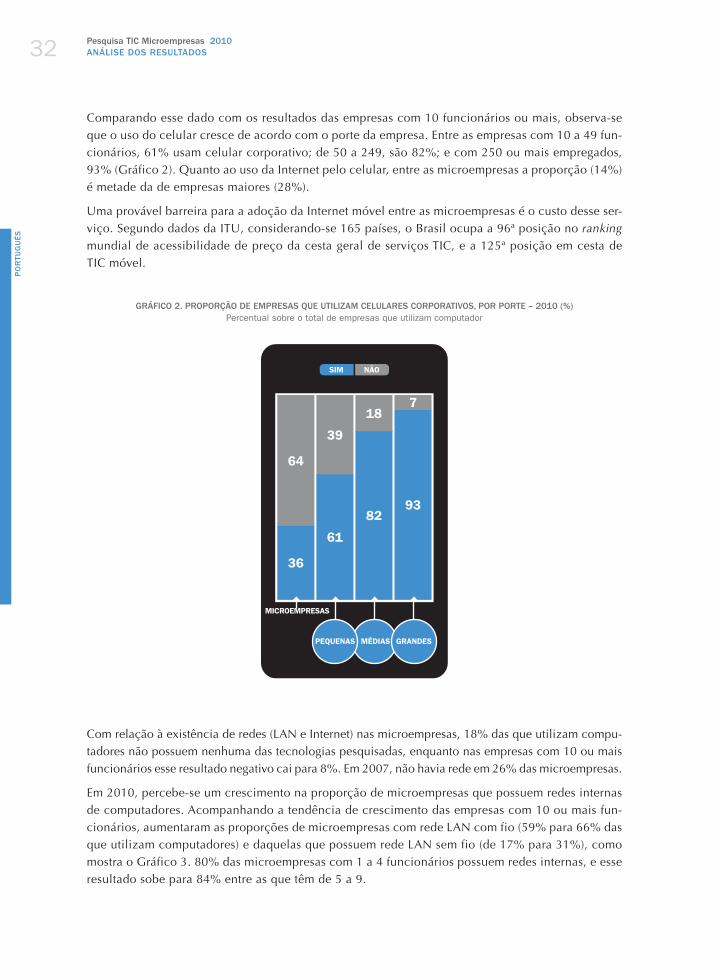
Com relação à existência de redes (LAN e Internet) nas microempresas, 18% das que utilizam compu-tadores não possuem nenhuma das tecnologias pesquisadas, enquanto nas empresas com 10 ou mais funcionários esse resultado negativo cai para 8%. Em 2007, não havia rede em 26% das microempresas.
Em 2010, percebe-se um crescimento na proporção de microempresas que possuem redes internas de computadores. Acompanhando a tendência de crescimento das empresas com 10 ou mais fun-cionários, aumentaram as proporções de microempresas com rede LAN com fio (59% para 66% das que utilizam computadores) e daquelas que possuem rede LAN sem fio (de 17% para 31%), como mostra o Gráfico 3. 80% das microempresas com 1 a 4 funcionários possuem redes internas, e esse resultado sobe para 84% entre as que têm de 5 a 9.
2010 Pesquisa TIC MicroempresasANÁLISE DOS RESULTADOS 33
PO
RTU
GU
ÊS
GRÁFICO 3. PROPORÇÃO DE MICROEMPRESAS COM REDE (LAN, INTRANET, EXTRANET) (%) Percentual sobre o total de microempresas que utilizam computador
20102007
LAN / Rede com fio
LAN / Rede sem fio Intranet Extranet
Nenhuma dessas
tecnologias
66
31
1813
18
59
17 1711
26
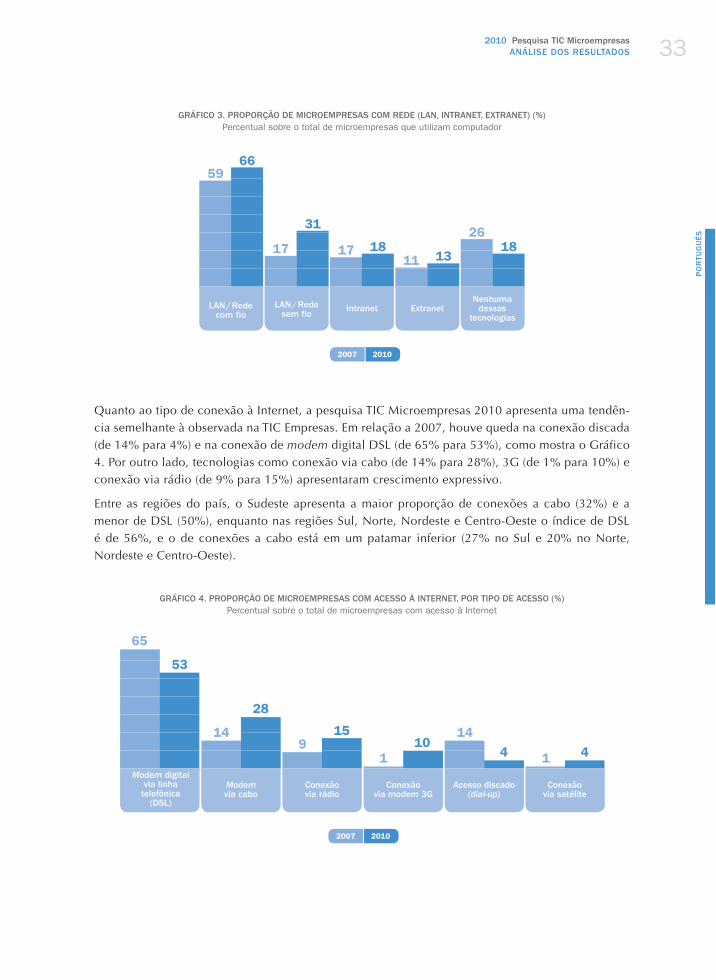
Quanto ao tipo de conexão à Internet, a pesquisa TIC Microempresas 2010 apresenta uma tendên-cia semelhante à observada na TIC Empresas. Em relação a 2007, houve queda na conexão discada (de 14% para 4%) e na conexão de modem digital DSL (de 65% para 53%), como mostra o Gráfico 4. Por outro lado, tecnologias como conexão via cabo (de 14% para 28%), 3G (de 1% para 10%) e conexão via rádio (de 9% para 15%) apresentaram crescimento expressivo.
Entre as regiões do país, o Sudeste apresenta a maior proporção de conexões a cabo (32%) e a menor de DSL (50%), enquanto nas regiões Sul, Norte, Nordeste e Centro-Oeste o índice de DSL é de 56%, e o de conexões a cabo está em um patamar inferior (27% no Sul e 20% no Norte, Nordeste e Centro-Oeste).
GRÁFICO 4. PROPORÇÃO DE MICROEMPRESAS COM ACESSO À INTERNET, POR TIPO DE ACESSO (%)Percentual sobre o total de microempresas com acesso à Internet
20102007
Modem via cabo
Conexão via rádio
Conexão via modem 3G
Acesso discado (dial-up)
Conexão via satélite
65
149
1
14
1
53
28
1510
4 4
Modem digitalvia linha
telefônica (DSL)
Pesquisa TIC Microempresas 2010ANÁLISE DOS RESULTADOS 34
PO
RTU
GU
ÊS
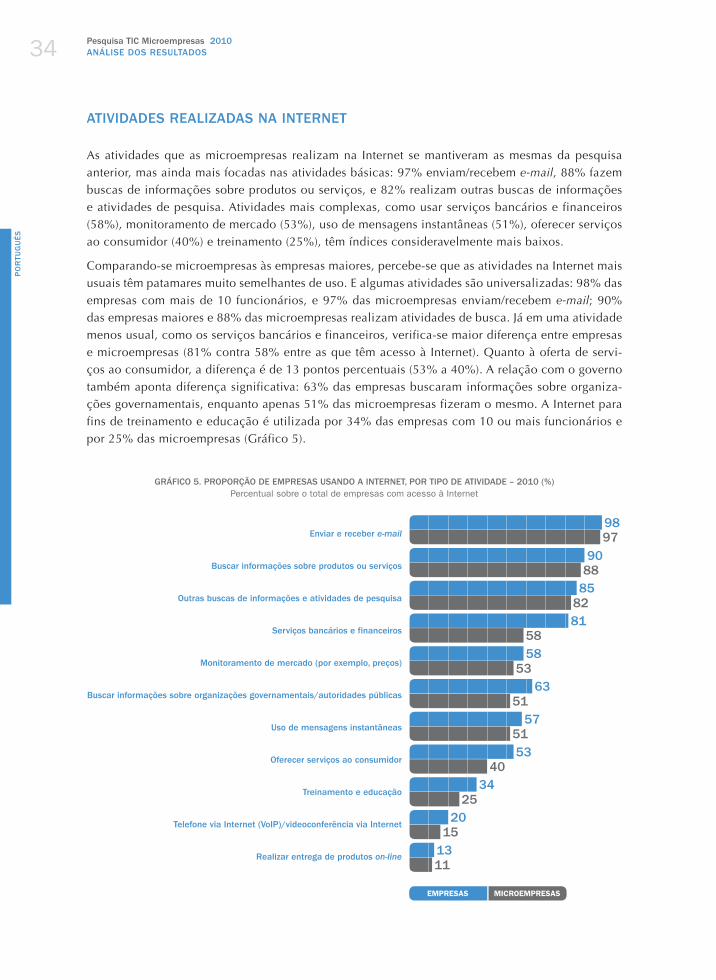
ATIVIDADES REALIZADAS NA INTERNET
As atividades que as microempresas realizam na Internet se mantiveram as mesmas da pesquisa anterior, mas ainda mais focadas nas atividades básicas: 97% enviam/recebem e-mail, 88% fazem buscas de informações sobre produtos ou serviços, e 82% realizam outras buscas de informações e atividades de pesquisa. Atividades mais complexas, como usar serviços bancários e financeiros (58%), monitoramento de mercado (53%), uso de mensagens instantâneas (51%), oferecer serviços ao consumidor (40%) e treinamento (25%), têm índices consideravelmente mais baixos.
Comparando-se microempresas às empresas maiores, percebe-se que as atividades na Internet mais usuais têm patamares muito semelhantes de uso. E algumas atividades são universalizadas: 98% das empresas com mais de 10 funcionários, e 97% das microempresas enviam/recebem e-mail; 90% das empresas maiores e 88% das microempresas realizam atividades de busca. Já em uma atividade menos usual, como os serviços bancários e financeiros, verifica-se maior diferença entre empresas e microempresas (81% contra 58% entre as que têm acesso à Internet). Quanto à oferta de servi-ços ao consumidor, a diferença é de 13 pontos percentuais (53% a 40%). A relação com o governo também aponta diferença significativa: 63% das empresas buscaram informações sobre organiza-ções governamentais, enquanto apenas 51% das microempresas fizeram o mesmo. A Internet para fins de treinamento e educação é utilizada por 34% das empresas com 10 ou mais funcionários e por 25% das microempresas (Gráfico 5).
GRÁFICO 5. PROPORÇÃO DE EMPRESAS USANDO A INTERNET, POR TIPO DE ATIVIDADE – 2010 (%)Percentual sobre o total de empresas com acesso à Internet
Enviar e receber e-mail
Buscar informações sobre produtos ou serviços
Outras buscas de informações e atividades de pesquisa
Serviços bancários e financeiros
Monitoramento de mercado (por exemplo, preços)
Buscar informações sobre organizações governamentais/autoridades públicas
Uso de mensagens instantâneas
Oferecer serviços ao consumidor
Treinamento e educação
Telefone via Internet (VoIP)/videoconferência via Internet
Realizar entrega de produtos on-line
EMPRESAS MICROEMPRESAS
98
85
58
63
57
53
34
20
13
81
9097
82
53
51
51
40
25
15
11
58
88
2010 Pesquisa TIC MicroempresasANÁLISE DOS RESULTADOS 35
PO
RTU
GU
ÊS
Quanto maior é o porte da empresa, maior é o controle sobre o acesso a sites específicos. 82% das empresas com 50 a 249 funcionários restringem o acesso, como por exemplo a páginas pornográ-ficas; nas empresas de grande porte, com 250 ou mais funcionários, este índice é de 95%; já entre as microempresas, isso ocorre em apenas 48% dos casos. Em relação aos sites de relacionamento, 71% das empresas com 50 a 249 funcionários e 86% daquelas com 250 ou mais restringem o aces-so, frente a somente 33% das microempresas. Quanto ao e-mail pessoal, 39% das empresas com 50 a 249 funcionários e 54% daquelas com 250 ou mais restringem seu acesso, mas, entre as micro-empresas, essa proporção é de 27%.
WEBSITES
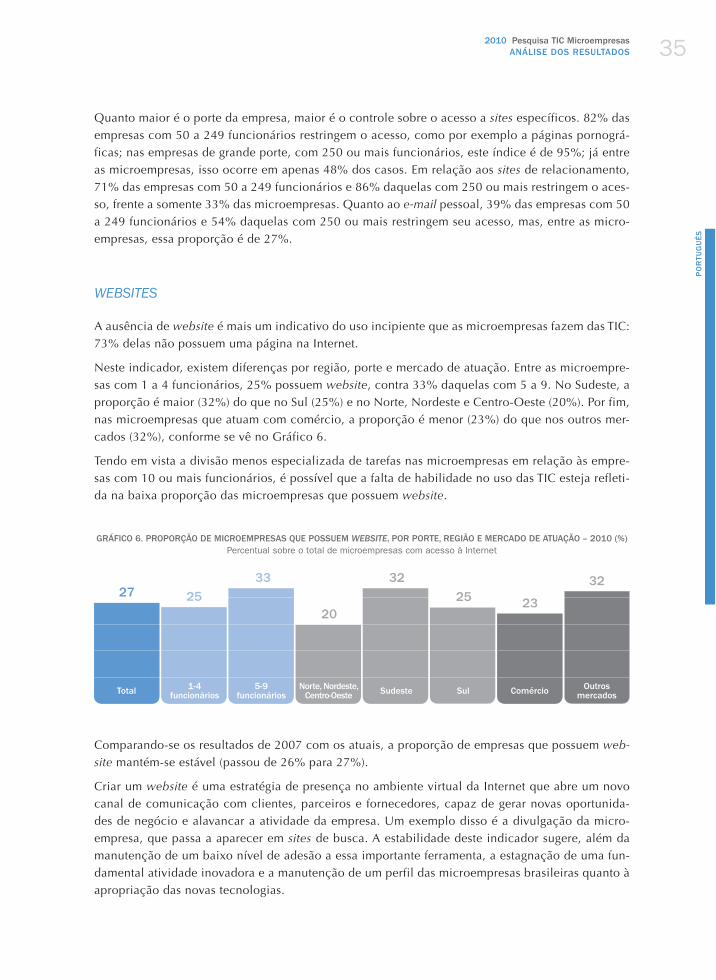
A ausência de website é mais um indicativo do uso incipiente que as microempresas fazem das TIC: 73% delas não possuem uma página na Internet.
Neste indicador, existem diferenças por região, porte e mercado de atuação. Entre as microempre-sas com 1 a 4 funcionários, 25% possuem website, contra 33% daquelas com 5 a 9. No Sudeste, a proporção é maior (32%) do que no Sul (25%) e no Norte, Nordeste e Centro-Oeste (20%). Por fim, nas microempresas que atuam com comércio, a proporção é menor (23%) do que nos outros mer-cados (32%), conforme se vê no Gráfico 6.
Tendo em vista a divisão menos especializada de tarefas nas microempresas em relação às empre-sas com 10 ou mais funcionários, é possível que a falta de habilidade no uso das TIC esteja refleti-da na baixa proporção das microempresas que possuem website.
GRÁFICO 6. PROPORÇÃO DE MICROEMPRESAS QUE POSSUEM WEBSITE, POR PORTE, REGIÃO E MERCADO DE ATUAÇÃO – 2010 (%) Percentual sobre o total de microempresas com acesso à Internet
Norte, Nordeste,Centro-Oeste
Outros mercadosSul ComércioSudeste5-9
funcionários1-4
funcionáriosTotal
27 2533
20
32
232532
Comparando-se os resultados de 2007 com os atuais, a proporção de empresas que possuem web-site mantém-se estável (passou de 26% para 27%).
Criar um website é uma estratégia de presença no ambiente virtual da Internet que abre um novo canal de comunicação com clientes, parceiros e fornecedores, capaz de gerar novas oportunida-des de negócio e alavancar a atividade da empresa. Um exemplo disso é a divulgação da micro-empresa, que passa a aparecer em sites de busca. A estabilidade deste indicador sugere, além da manutenção de um baixo nível de adesão a essa importante ferramenta, a estagnação de uma fun-damental atividade inovadora e a manutenção de um perfil das microempresas brasileiras quanto à apropriação das novas tecnologias.
Pesquisa TIC Microempresas 2010ANÁLISE DOS RESULTADOS 36
PO
RTU
GU
ÊS
COMÉRCIO ELETRÔNICO E GOVERNO ELETRÔNICO
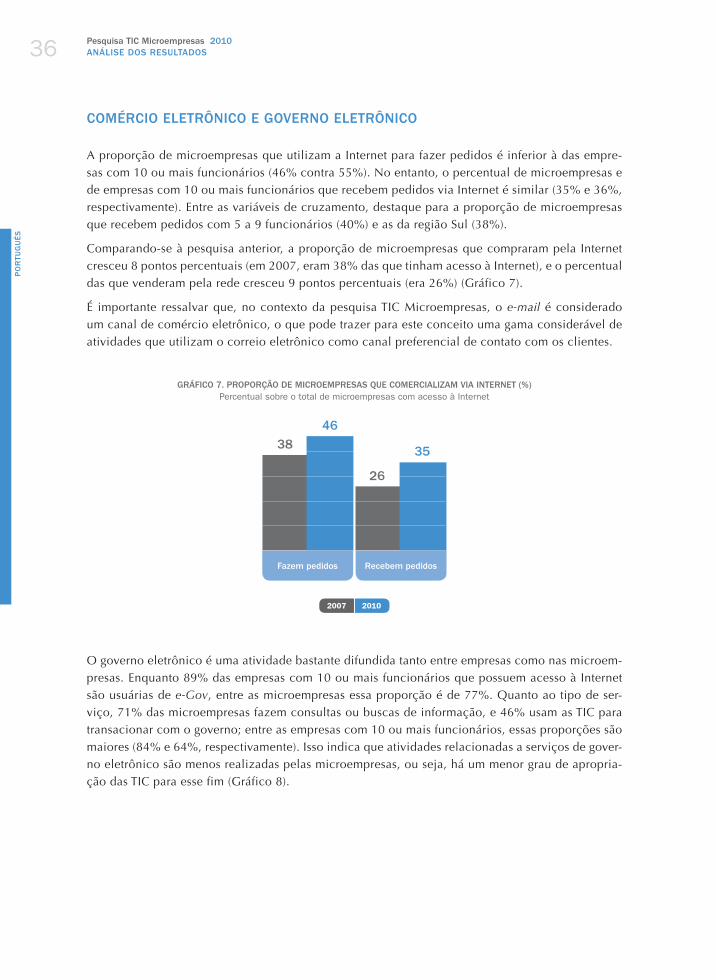
A proporção de microempresas que utilizam a Internet para fazer pedidos é inferior à das empre-sas com 10 ou mais funcionários (46% contra 55%). No entanto, o percentual de microempresas e de empresas com 10 ou mais funcionários que recebem pedidos via Internet é similar (35% e 36%, respectivamente). Entre as variáveis de cruzamento, destaque para a proporção de microempresas que recebem pedidos com 5 a 9 funcionários (40%) e as da região Sul (38%).
Comparando-se à pesquisa anterior, a proporção de microempresas que compraram pela Internet cresceu 8 pontos percentuais (em 2007, eram 38% das que tinham acesso à Internet), e o percentual das que venderam pela rede cresceu 9 pontos percentuais (era 26%) (Gráfico 7).
É importante ressalvar que, no contexto da pesquisa TIC Microempresas, o e-mail é considerado um canal de comércio eletrônico, o que pode trazer para este conceito uma gama considerável de atividades que utilizam o correio eletrônico como canal preferencial de contato com os clientes.
GRÁFICO 7. PROPORÇÃO DE MICROEMPRESAS QUE COMERCIALIZAM VIA INTERNET (%)Percentual sobre o total de microempresas com acesso à Internet
Recebem pedidosFazem pedidos
26
353846
20102007
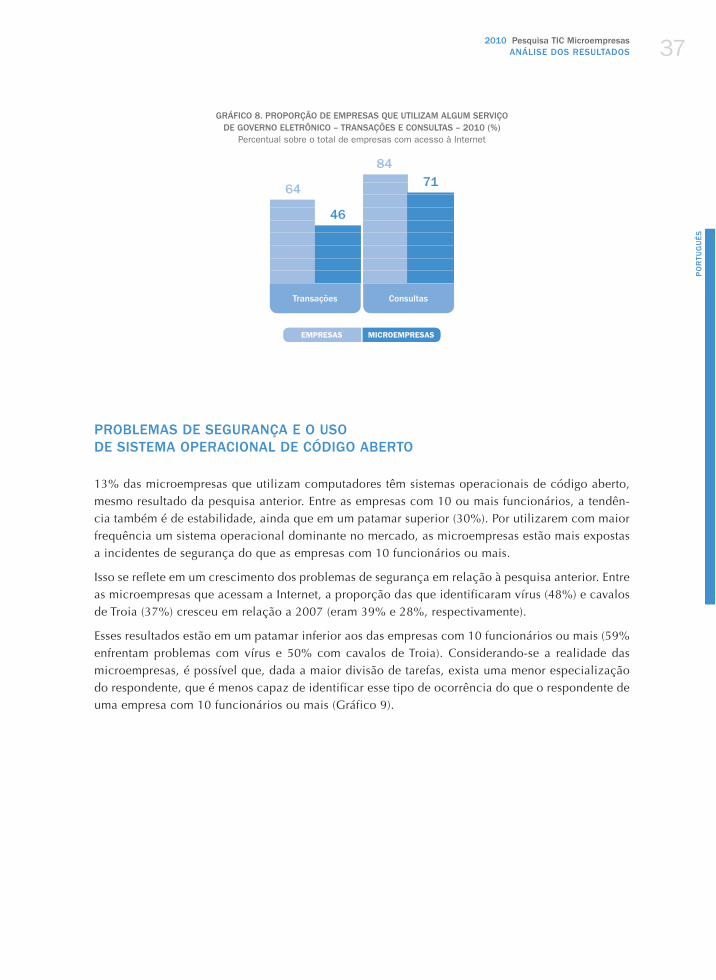
O governo eletrônico é uma atividade bastante difundida tanto entre empresas como nas microem-presas. Enquanto 89% das empresas com 10 ou mais funcionários que possuem acesso à Internet são usuárias de e-Gov, entre as microempresas essa proporção é de 77%. Quanto ao tipo de ser-viço, 71% das microempresas fazem consultas ou buscas de informação, e 46% usam as TIC para transacionar com o governo; entre as empresas com 10 ou mais funcionários, essas proporções são maiores (84% e 64%, respectivamente). Isso indica que atividades relacionadas a serviços de gover-no eletrônico são menos realizadas pelas microempresas, ou seja, há um menor grau de apropria-ção das TIC para esse fim (Gráfico 8).
2010 Pesquisa TIC MicroempresasANÁLISE DOS RESULTADOS 37
PO
RTU
GU
ÊS
GRÁFICO 8. PROPORÇÃO DE EMPRESAS QUE UTILIZAM ALGUM SERVIÇO DE GOVERNO ELETRÔNICO – TRANSAÇÕES E CONSULTAS – 2010 (%)
Percentual sobre o total de empresas com acesso à Internet
ConsultasTransações
847164
46
EMPRESAS MICROEMPRESAS
PROBLEMAS DE SEGURANÇA E O USO DE SISTEMA OPERACIONAL DE CÓDIGO ABERTO
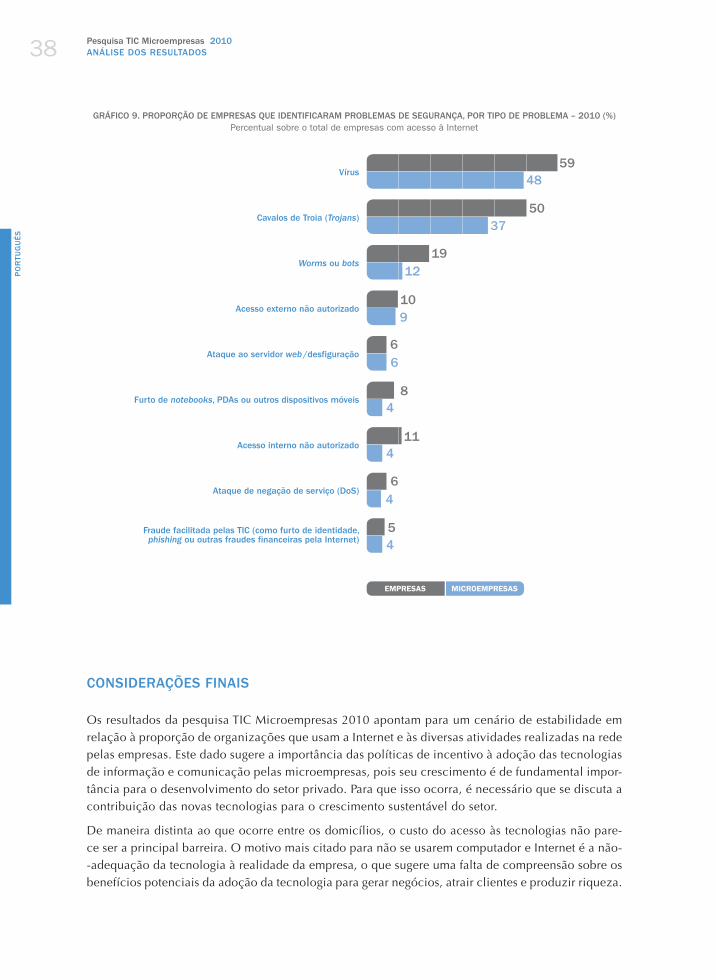
13% das microempresas que utilizam computadores têm sistemas operacionais de código aberto, mesmo resultado da pesquisa anterior. Entre as empresas com 10 ou mais funcionários, a tendên-cia também é de estabilidade, ainda que em um patamar superior (30%). Por utilizarem com maior frequência um sistema operacional dominante no mercado, as microempresas estão mais expostas a incidentes de segurança do que as empresas com 10 funcionários ou mais.
Isso se reflete em um crescimento dos problemas de segurança em relação à pesquisa anterior. Entre as microempresas que acessam a Internet, a proporção das que identificaram vírus (48%) e cavalos de Troia (37%) cresceu em relação a 2007 (eram 39% e 28%, respectivamente).
Esses resultados estão em um patamar inferior aos das empresas com 10 funcionários ou mais (59% enfrentam problemas com vírus e 50% com cavalos de Troia). Considerando-se a realidade das microempresas, é possível que, dada a maior divisão de tarefas, exista uma menor especialização do respondente, que é menos capaz de identificar esse tipo de ocorrência do que o respondente de uma empresa com 10 funcionários ou mais (Gráfico 9).
Pesquisa TIC Microempresas 2010ANÁLISE DOS RESULTADOS 38
PO
RTU
GU
ÊS
GRÁFICO 9. PROPORÇÃO DE EMPRESAS QUE IDENTIFICARAM PROBLEMAS DE SEGURANÇA, POR TIPO DE PROBLEMA – 2010 (%)Percentual sobre o total de empresas com acesso à Internet
Vírus
Cavalos de Troia (Trojans)
Worms ou bots
Acesso externo não autorizado
Ataque ao servidor web /desfiguração
Furto de notebooks, PDAs ou outros dispositivos móveis
Acesso interno não autorizado
Ataque de negação de serviço (DoS)
Fraude facilitada pelas TIC (como furto de identidade, phishing ou outras fraudes financeiras pela Internet)
EMPRESAS MICROEMPRESAS
48
37
12
9
6
4
4
4
4
59
50
19
10
6
8
11
6
5
CONSIDERAÇÕES FINAIS
Os resultados da pesquisa TIC Microempresas 2010 apontam para um cenário de estabilidade em relação à proporção de organizações que usam a Internet e às diversas atividades realizadas na rede pelas empresas. Este dado sugere a importância das políticas de incentivo à adoção das tecnologias de informação e comunicação pelas microempresas, pois seu crescimento é de fundamental impor-tância para o desenvolvimento do setor privado. Para que isso ocorra, é necessário que se discuta a contribuição das novas tecnologias para o crescimento sustentável do setor.
De maneira distinta ao que ocorre entre os domicílios, o custo do acesso às tecnologias não pare-ce ser a principal barreira. O motivo mais citado para não se usarem computador e Internet é a não--adequação da tecnologia à realidade da empresa, o que sugere uma falta de compreensão sobre os benefícios potenciais da adoção da tecnologia para gerar negócios, atrair clientes e produzir riqueza.
2010 Pesquisa TIC MicroempresasANÁLISE DOS RESULTADOS 39
PO
RTU
GU
ÊS
Uma das hipóteses para isso está relacionada à questão das habilidades, da capacitação para o empre-go das TIC nos processos das microempresas brasileiras. Por meio do uso habitual ou da compreensão de determinada tecnologia, é possível vislumbrar sua contribuição potencial para o negócio. Além disso, o conhecimento sobre as TIC permite que microempreendedores identifiquem novas oportuni-dades para o uso das tecnologias, o que possibilitaria a incorporação de inovações a seus processos.
Alguns aspectos da realidade brasileira, como a baixa penetração domiciliar e a incipiente incor-poração das tecnologias aos processos educacionais, podem ajudar a compreender algumas das razões pelas quais ainda não é amplamente difundido o simples uso do computador e da Internet nas microempresas.
Entre as microempresas que utilizam TIC, os resultados de indicadores como o uso de governo eletrônico, a existência de websites, o uso de sistemas de código aberto e a exposição a proble-mas de segurança reforçam um cenário de baixa apropriação tecnológica entre as microempresas. Nesse sentido, os desafios para as políticas públicas vão além de facilitar o acesso às TIC, como ocorre na realidade domiciliar, e estão relacionados a formação e capacitação do empreendedor brasileiro, o que realça o papel de organizações não governamentais cujo objetivo seja o fomen-to de microempresas.
Afora as dificuldades já mencionadas, o microempresário sofre também certa insuficiência em rela-ção a sua capacidade de planejamento, organização e gestão, que se agrava de acordo com as dis-paridades das regiões onde se encontram seus negócios. Alguns dados relacionados às diferenças regionais confirmam o fato: a maior concentração e as maiores taxas de sobrevivência das micro-empresas estão no Sul e no Sudeste (71% e 76%, respectivamente). Por isso, tornam-se cada vez mais relevantes ações que levem aos microempresários os recursos oferecidos pelas TIC.
As TIC podem ser grandes aliadas dos pequenos empreendedores, oferecendo oportunidades que hoje, talvez, não estejam disponíveis por outros meios. A neutralidade da rede garante que cada empresa possa participar da Internet e ser encontrada por clientes e parceiros, sem diferença ou privilégio.
As principais conclusões deste estudo apontam para a importância da capacitação do microem-preendedor para que sejam exploradas as oportunidades oferecidas pela rede mundial de computa-dores. Esse desafio passa necessariamente pela formulação de políticas que tenham em seu escopo a compreensão das particularidades do microempreendedor.
REFERÊNCIAS BIBLIOGRÁFICAS
BRASIL. Governo fortalece a pequena empresa. Brasília: Portal Brasil, 1 abr. 2011. Disponível em http://www.brasil.gov.br/noticias/arquivos/2011/04/01/governo-encaminha-ao-congresso-projeto-de-lei-que-cria-secreta-ria-de-micro-e-pequena-empresa. Acesso em 31 out. 2011.
CGI.BR. Pesquisa sobre o uso das tecnologias de informação e comunicação no Brasil – TIC Domicílios e Empresas 2010 / Survey on the use of information and communication technologies in Brazil – ICT Households and Enterprises 2010. Coord. Alexandre F. Barbosa. Trad. Karen Brito-Sexton. São Paulo: CGI.br, 2011.
FIGUEIREDO, Ana Luiza Ferrete Garcia. Situação jurídica das microempresas e empresas de pequeno porte no Brasil. Disponível em http://www.franca.unesp.br/Ana_Luiza_Ferrete_Garcia_de_Figueiredo.pdf. Acesso em 31 out. 2011.

Pesquisa TIC Microempresas 2010ANÁLISE DOS RESULTADOS 40
PO
RTU
GU
ÊS
MONTEIRO, Carolina Mantovani. Microempresas e empresas de pequeno porte: uma visão generalista. Disponível em http://www.franca.unesp.br/Carolina_Mantovani_Monteiro.pdf. Acesso em 31 out. 2011.
SEBRAE. Taxa de sobrevivência das empresas no Brasil. Brasília, out/2011. Disponível em http://www.biblio-teca.sebrae.com.br/bds/BDS.nsf/45465B1C66A6772D832579300051816C/$File/NT00046582.pdf. Acesso em 31 out. 2011.
UNCTAD. Information Economy Report 2011.

ENGLISH

2010 Survey on ICT MicroenterprisesINTRODUCTION 43
ENGLISH
INTRODUCTION
The new information and communication technologies (ICT) have lately created, with increasing intensity, new possibilities for different sectors of society, in the economic, social, political and cultural fields. Furthermore, they are revolutionizing key aspects of the routine of individuals, organizations and governments.
Assessing how these technologies affect society is a requirement for monitoring the progress and development of the information and knowledge society. For this, international organizations, such as the United Nations (UN), the Organization for Economic Cooperation and Development (OECD), and the World Bank, among others, work collaboratively to produce methodologies and indicators to measure access, use and appropriation of new technologies, essential for the development of the information society.
The surveys on the use of information and communication technologies are conducted by the Center of Studies on Information and Communication Technologies (Cetic.br), department of the Brazilian Network Information Center (NIC.br), executive body of the Brazilian Internet Steering Committee (CGI.br). These surveys are carried out throughout the country, including urban and rural areas, and have been contributing to the public, private and academic sectors by providing subsidy for discussions on the development of ICT in the country.
The purpose of the ICT Microenterprises 2010 survey, that we are pleased to deliver to the society, is to investigate the ICT use by Brazilian microenterprises, i.e., those that have between 1 and 9 employees. The way results are presented allow for comparison in two levels – diachronic, since it is the second edition, you can trace a history of the evolution of ICT use since 2007; and synchronic, by comparing these important players for the country’s economic development with companies of larger scale, whose results can be seen in the publication Survey on the Use of Information and Communication Technologies in Brazil – ICT Households and Enterprises. In addition, there is a discussion on how the microenterprises are benefiting from new technologies and which are the opportunities for their effective appropriation – and especially how it has occurred in Brazil.
As shown ahead, even though the intensive adoption of new technologies is strategic for increasing the country’s competitiveness in the international market, microenterprises still have an incipient use of ICT. But this can be changed through the awareness of the society about this scenario, and the ICT Microenterprises 2010 survey aims to serve as a conduit for ideas to help the country to remedy this slight delay.
Hence, we hope the data and analyzes in this second edition prompt relevant reflection and debate, which shall be largely used by public managers in charge of designing the future of the information and knowledge society in Brazil. Furthermore, we hope they continue to function as a basis for scientific and academic studies, and to enable private sector companies to monitor market trends.

2010 Survey on ICT Microenterprises METHODOLOGICAL REPORT 45
ENGLISH
ICT MICROENTERPRISES 2010

Pesquisa TIC Microempresas 2010ANÁLISE DOS RESULTADOS 46
PO
RTU
GU
ÊS
2010 Survey on ICT Microenterprises METHODOLOGICAL REPORT 47
ENGLISH
METHODOLOGICAL REPORT ICT MICROENTERPRISES 2010
INTRODUCTION
The Center of Studies on Information and Communication Technologies (Cetic.br), of the Brazilian Network Information Center (NIC.br) – the executive body of the Brazilian Internet Steering Committee (CGI.br) – conducted the second edition of the ICT Microenterprises survey in 2010. In the same context of the survey on the use of information and communication technologies in Brazil 2010 – ICT Enterprises,1 the ICT Microenterprises 2010 was carried out between September and November 2010 nationwide to assess the penetration and the use of the Internet by Brazilian microenterprises with 1 to 9 employees, addressing the following subjects:
MODULE A – General information on ICT systems;
MODULE B – Use of the Internet;
MODULE C – Electronic government (e-Gov);
MODULE D – Network security;
MODULE E – Electronic commerce;
MODULE F – ICT skills.
In line with the first edition in 2007, the survey aims to outline the profile of ICT use by microenterprises and identify the main differences between this use by enterprises with 1 to 9 employees (microenterprises) and enterprises with 10 or more employees in Brazil.
This study was based on the methodological standards set forth by the manual of the United Nations Conference on Trade and Development (UNCTAD, 2009), prepared by the Organization for Economic Cooperation and Development (OECD), the Statistical Office of the European Commission (Eurostat) and the Partnership on Measuring ICT for Development – a coalition of several international organizations aimed at homogenizing key indicators in ICT research.
1 See the full results of the ICT Enterprises 2010 at http://www.cetic.br/empresas/2010/. Accessed on Dec. 2nd, 2011.
Survey on ICT Microenterprises 2010METHODOLOGICAL REPORT48
ENGLISH
CONCEPTS, CATEGORIES AND DEFINITIONS
The National Classification of Economic Activities (NACE) may be defined as a base-structure used to categorize enterprises in Brazil according to their market segment.
From 2004 to 2006, the National Classification Committee (Concla) conducted studies to update the NACE 1.0 and to create a new version, namely the NACE 2.0. This upgrade was primarily aimed at better understanding the natural dynamics and transformations in market segments in the country over the years. NACE 2.0 was released by IBGE in April 2007, which contributed significantly to the understanding of economic flow across Brazilian enterprises. The impacts of this update were analyzed in the ICT Enterprises 2009, and this stratification variable remained unaltered for the 2010 sample plan, both for the ICT Enterprises and the ICT Microenterprises surveys.
For better reading and analysis of the survey data, we have grouped a few regions – North, Northeast and Center-West – and market segments together:
Manufacturing; Construction; Transportation, storage and mail; Accommodation and food ser-vice activities; Information and communication; Arts, entertainment and recreation; Other ser-vices activities.
Wholesale and retail; Repair of motor vehicles and motorcycles.
Real estate activities; Professional, scientific and technical activities; Administrative and sup-port services activities.
In this study we will refer to microenterprises as “micro”, enterprises with 10 to 49 employees as “small”, enterprises with 50 to 249 employees as “medium”, and enterprises with more than 250 employees as “large”.
It is worth noting that the criterion used to classify enterprises by size based on the number of employees is in line with the aforementioned international standards, even though the Brazilian legislation sets forth a different criterion based on gross income per calendar year, as described in article 3, II, of Supplementary Law no. 123, from December 14, 2006, also known as Statute of Micro and Small Enterprises.
QUESTIONNAIRE
The questionnaire used in this second edition of the ICT Microenterprises is based on the ICT Enterprises 2010 questionnaire. Nonetheless, a few of the ICT Enterprises indicators have not been investigated in the context of enterprises with 1 to 9 employees, as they are more closely related to the context of large enterprises. This reduces the complexity of data collection and the time it takes to apply the questionnaire; among these indicators are remote access, connection technologies, software, security, IT skills, and others.
2010 Survey on ICT Microenterprises METHODOLOGICAL REPORT 49
ENGLISH
The initial questions of the data collection instrument aim to determine the profile of respondents and microenterprises. For general information on ICT systems, module A assesses usage and number of computers, technologies, use of open source operating systems and corporate mobile phones.
Internet use is assessed in module B, through questions on use and purpose of usage, types of services and technologies, speed of connection contracted, existence of websites, user restriction measures, among others.
Module C aims to determine the relationship between microenterprises and governmental bodies, through Internet transactions and queries or information searches directly on governmental websites.
Module D, network security, asks about the use of certain security technologies, and whether there have been any security issues.
Electronic commerce is assessed in module E, addressing orders placed or received, and products or services available on the Internet.
Module F asks if any roles that require IT experts have been performed by outsourcers.
DATA COLLECTION CRITERIA
Interviews with enterprises were conducted over the phone, with an average duration of 25 minutes.
In all enterprises interviewed, it was sought to interview the person in charge of IT, computing, computer network management or related areas, i.e:
Director of the information and technology division;
Business manager (senior vice-president, business vice-president, director);
Manager or buyer of the IT department;
Technology influencer (sales / IT department employee who gives advice on decisions regar-ding technology-related issues);
Project and system coordinator;
Director of other divisions/departments (other than IT);
System development manager;
IT manager;
Project manager;
Company owner or partner.
Survey on ICT Microenterprises 2010METHODOLOGICAL REPORT50
ENGLISH
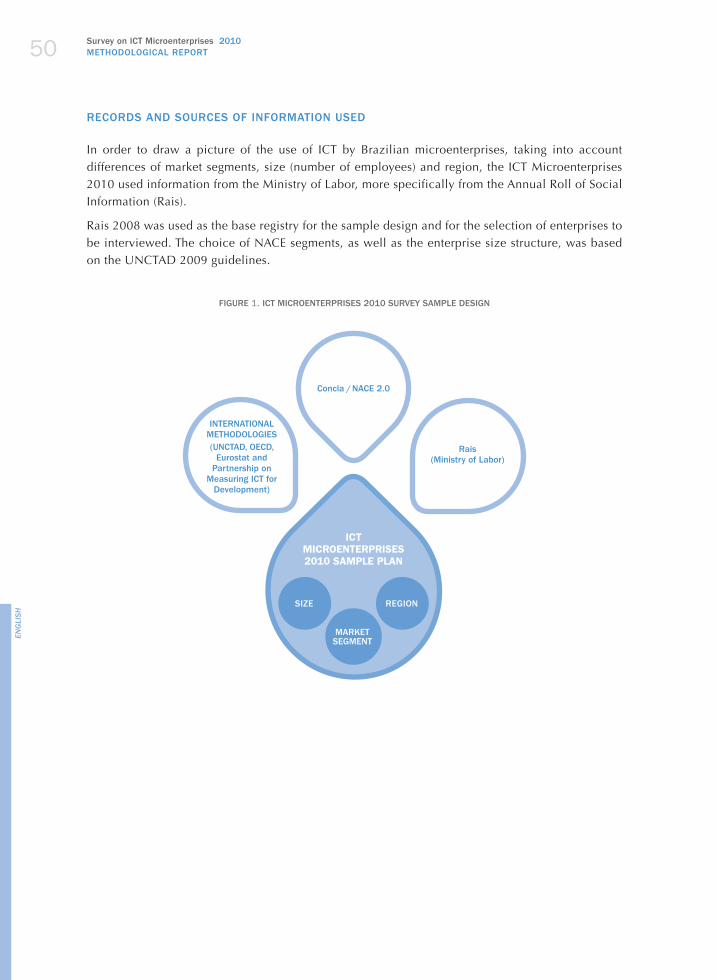
RECORDS AND SOURCES OF INFORMATION USED
In order to draw a picture of the use of ICT by Brazilian microenterprises, taking into account differences of market segments, size (number of employees) and region, the ICT Microenterprises 2010 used information from the Ministry of Labor, more specifically from the Annual Roll of Social Information (Rais).
Rais 2008 was used as the base registry for the sample design and for the selection of enterprises to be interviewed. The choice of NACE segments, as well as the enterprise size structure, was based on the UNCTAD 2009 guidelines.
FIGURE 1. ICT MICROENTERPRISES 2010 SURVEY SAMPLE DESIGN
INTERNATIONAL METHODOLOGIES(UNCTAD, OECD,
Eurostat and Partnership on
Measuring ICT for Development)
Rais (Ministry of Labor)
Concla / NACE 2.0
ICT MICROENTERPRISES 2010 SAMPLE PLAN
SIZE REGION
MARKET SEGMENT
2010 Survey on ICT Microenterprises METHODOLOGICAL REPORT 51
ENGLISH
UNIVERSE
The universe of the survey comprises all Brazilian enterprises with 1 to 9 employees, registered by Rais – i.e., officially incorporated – and featured within the NACE 2.0’s market segments in order to maintain international comparability.
According to the NACE 2.0, enterprises surveyed operate in the following industries:
C) Manufacturing;
F) Construction;
G) Wholesale and retail trade; Repair of motor vehicles and motorcycles;
H) Transportation and storage;
I) Accommodation and food service activities;
J) Information and communication;
L) Real estate activities;
M) Professional, scientific and technical activities;
N) Administrative and support service activities;
R) Arts, entertainment and recreation;
S) Other service activities.
The universe of the Rais 2008 comprised over 7.1 million establishments. Among these, approximately 6.2 million are classified under the market segments assessed, and approximately 900 thousand belong to other market segments.
In this universe of segments of interest, which accounts for 64% of the official jobs in Brazil, three subgroups may be identified: businesses with no registered employees (Negative Rais), with nearly 4 million establishments; 1.7 million businesses with between 1 and 9 employees, accounting for 14% of overall employment in the country; and, finally, just over 400,000 businesses with 10 employees or more, i.e., 51% of Brazilian registered employees.
RESEARCH UNIT
Our research units are enterprises – defined by the Brazilian Institute of Geography and Statistics (IBGE) as registered legal entities, firms or enterprises that concentrate all of their economic activities in one or more local units (i.e., physical spaces, usually continuous areas, where one or more economic activities are carried out, thus constituting a registered address of the enterprise).
The Rais registry comprises establishments, not enterprises; therefore we had to adapt this database, creating a new database of enterprises. The creation of the new database was as follows:
1. Initially, zeros were added to the left of enterprises’ registry numbers (CNPJ) to create a 14-digit sequence.
Survey on ICT Microenterprises 2010METHODOLOGICAL REPORT52
ENGLISH
2. Enterprises were then ordered by their CNPJ.
3. Establishments were grouped based on the first 8 digits of their CNPJ, and data from the variable “number of employees” were added in a single registry.
4. Duplicated entries were eliminated, and only the first records (headquarters) were kept.
5. NACE market segment information was maintained, as well as the region of the enterprise’s headquarters.
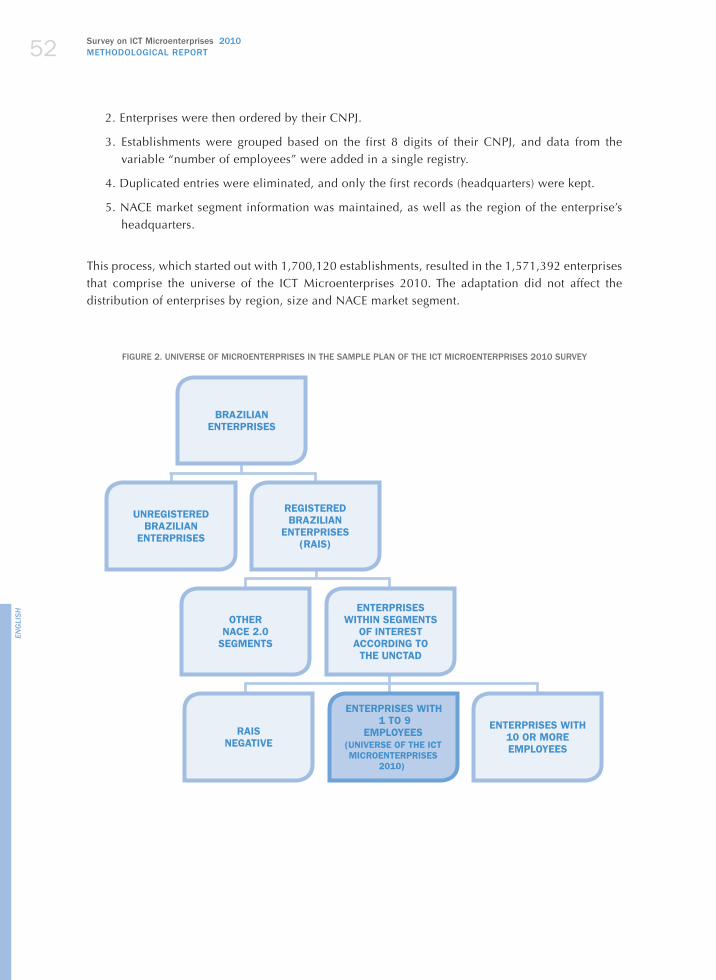
This process, which started out with 1,700,120 establishments, resulted in the 1,571,392 enterprises that comprise the universe of the ICT Microenterprises 2010. The adaptation did not affect the distribution of enterprises by region, size and NACE market segment.
FIGURE 2. UNIVERSE OF MICROENTERPRISES IN THE SAMPLE PLAN OF THE ICT MICROENTERPRISES 2010 SURVEY
BRAZILIAN ENTERPRISES
UNREGISTERED BRAZILIAN
ENTERPRISES
REGISTERED BRAZILIAN
ENTERPRISES (RAIS)
OTHER NACE 2.0
SEGMENTS
ENTERPRISES WITHIN SEGMENTS
OF INTEREST ACCORDING TO
THE UNCTAD
RAIS NEGATIVE
ENTERPRISES WITH 1 TO 9
EMPLOYEES(UNIVERSE OF THE ICT MICROENTERPRISES
2010)
ENTERPRISES WITH 10 OR MORE EMPLOYEES
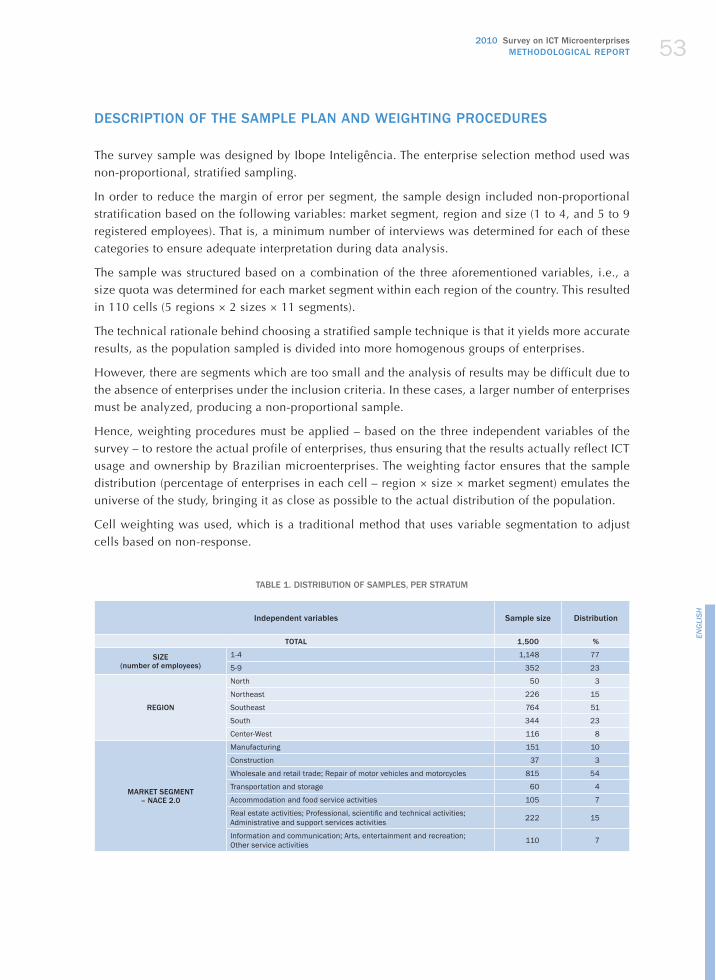
2010 Survey on ICT Microenterprises METHODOLOGICAL REPORT 53
ENGLISH
DESCRIPTION OF THE SAMPLE PLAN AND WEIGHTING PROCEDURES
The survey sample was designed by Ibope Inteligência. The enterprise selection method used was non-proportional, stratified sampling.
In order to reduce the margin of error per segment, the sample design included non-proportional stratification based on the following variables: market segment, region and size (1 to 4, and 5 to 9 registered employees). That is, a minimum number of interviews was determined for each of these categories to ensure adequate interpretation during data analysis.
The sample was structured based on a combination of the three aforementioned variables, i.e., a size quota was determined for each market segment within each region of the country. This resulted in 110 cells (5 regions ! 2 sizes ! 11 segments).
The technical rationale behind choosing a stratified sample technique is that it yields more accurate results, as the population sampled is divided into more homogenous groups of enterprises.
However, there are segments which are too small and the analysis of results may be difficult due to the absence of enterprises under the inclusion criteria. In these cases, a larger number of enterprises must be analyzed, producing a non-proportional sample.
Hence, weighting procedures must be applied – based on the three independent variables of the survey – to restore the actual profile of enterprises, thus ensuring that the results actually reflect ICT usage and ownership by Brazilian microenterprises. The weighting factor ensures that the sample distribution (percentage of enterprises in each cell – region ! size ! market segment) emulates the universe of the study, bringing it as close as possible to the actual distribution of the population.
Cell weighting was used, which is a traditional method that uses variable segmentation to adjust cells based on non-response.
TABLE 1. DISTRIBUTION OF SAMPLES, PER STRATUM
Independent variables Sample size Distribution
TOTAL 1,500 %
SIZE
(number of employees)
1-4 1,148 77
5-9 352 23
REGION
North 50 3
Northeast 226 15
Southeast 764 51
South 344 23
Center-West 116 8
MARKET SEGMENT
– NACE 2.0
Manufacturing 151 10
Construction 37 3
Wholesale and retail trade; Repair of motor vehicles and motorcycles 815 54
Transportation and storage 60 4
Accommodation and food service activities 105 7
5HDO�HVWDWH�DFWLYLWLHV��3URIHVVLRQDO��VFLHQWLÀF�DQG�WHFKQLFDO�DFWLYLWLHV��Administrative and support services activities 222 15
Information and communication; Arts, entertainment and recreation; Other service activities 110 7
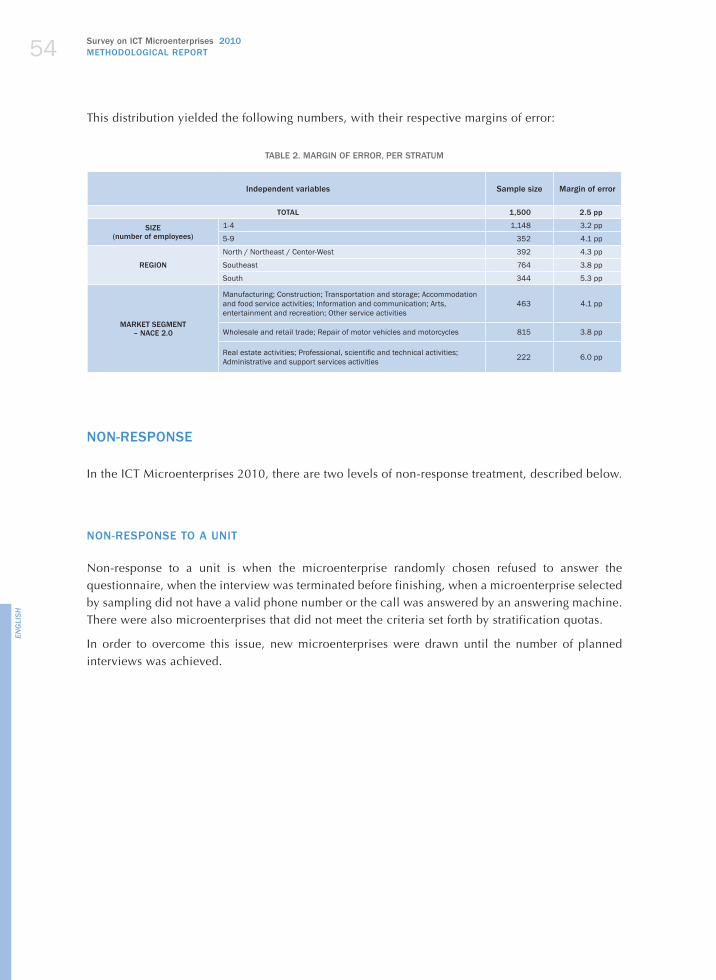
Survey on ICT Microenterprises 2010METHODOLOGICAL REPORT54
ENGLISH
This distribution yielded the following numbers, with their respective margins of error:
TABLE 2. MARGIN OF ERROR, PER STRATUM
Independent variables Sample size Margin of error
TOTAL 1,500 2.5 pp
SIZE
(number of employees)
1-4 1,148 3.2 pp
5-9 352 4.1 pp
REGION
North / Northeast / Center-West 392 4.3 pp
Southeast 764 3.8 pp
South 344 5.3 pp
MARKET SEGMENT
– NACE 2.0
Manufacturing; Construction; Transportation and storage; Accommodation and food service activities; Information and communication; Arts, entertainment and recreation; Other service activities
463 4.1 pp
Wholesale and retail trade; Repair of motor vehicles and motorcycles 815 3.8 pp
5HDO�HVWDWH�DFWLYLWLHV��3URIHVVLRQDO��VFLHQWLÀF�DQG�WHFKQLFDO�DFWLYLWLHV��Administrative and support services activities 222 6.0 pp
NON-RESPONSE
In the ICT Microenterprises 2010, there are two levels of non-response treatment, described below.
NON-RESPONSE TO A UNIT
Non-response to a unit is when the microenterprise randomly chosen refused to answer the questionnaire, when the interview was terminated before finishing, when a microenterprise selected by sampling did not have a valid phone number or the call was answered by an answering machine. There were also microenterprises that did not meet the criteria set forth by stratification quotas.
In order to overcome this issue, new microenterprises were drawn until the number of planned interviews was achieved.
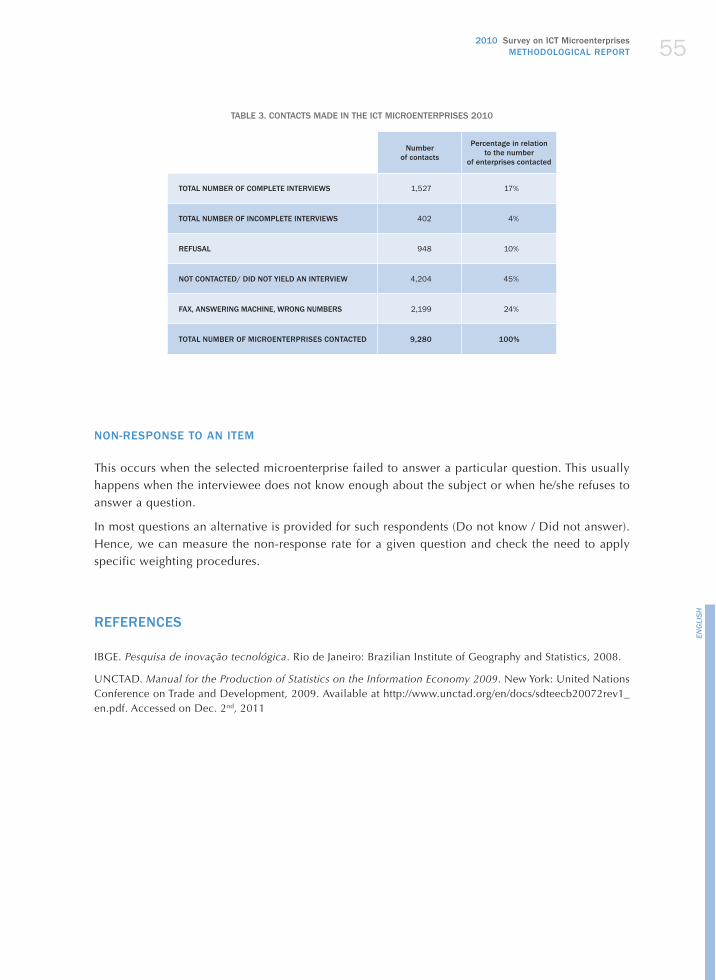
2010 Survey on ICT Microenterprises METHODOLOGICAL REPORT 55
ENGLISH
TABLE 3. CONTACTS MADE IN THE ICT MICROENTERPRISES 2010
Number
of contacts
Percentage in relation
to the number
of enterprises contacted
TOTAL NUMBER OF COMPLETE INTERVIEWS 1,527 17%
TOTAL NUMBER OF INCOMPLETE INTERVIEWS 402 4%
REFUSAL 948 10%
NOT CONTACTED/ DID NOT YIELD AN INTERVIEW 4,204 45%
FAX, ANSWERING MACHINE, WRONG NUMBERS 2,199 24%
TOTAL NUMBER OF MICROENTERPRISES CONTACTED 9,280 100%
NON-RESPONSE TO AN ITEM
This occurs when the selected microenterprise failed to answer a particular question. This usually happens when the interviewee does not know enough about the subject or when he/she refuses to answer a question.
In most questions an alternative is provided for such respondents (Do not know / Did not answer). Hence, we can measure the non-response rate for a given question and check the need to apply specific weighting procedures.
REFERENCES
IBGE. Pesquisa de inovação tecnológica. Rio de Janeiro: Brazilian Institute of Geography and Statistics, 2008.
UNCTAD. Manual for the Production of Statistics on the Information Economy 2009. New York: United Nations Conference on Trade and Development, 2009. Available at http://www.unctad.org/en/docs/sdteecb20072rev1_en.pdf. Accessed on Dec. 2nd, 2011

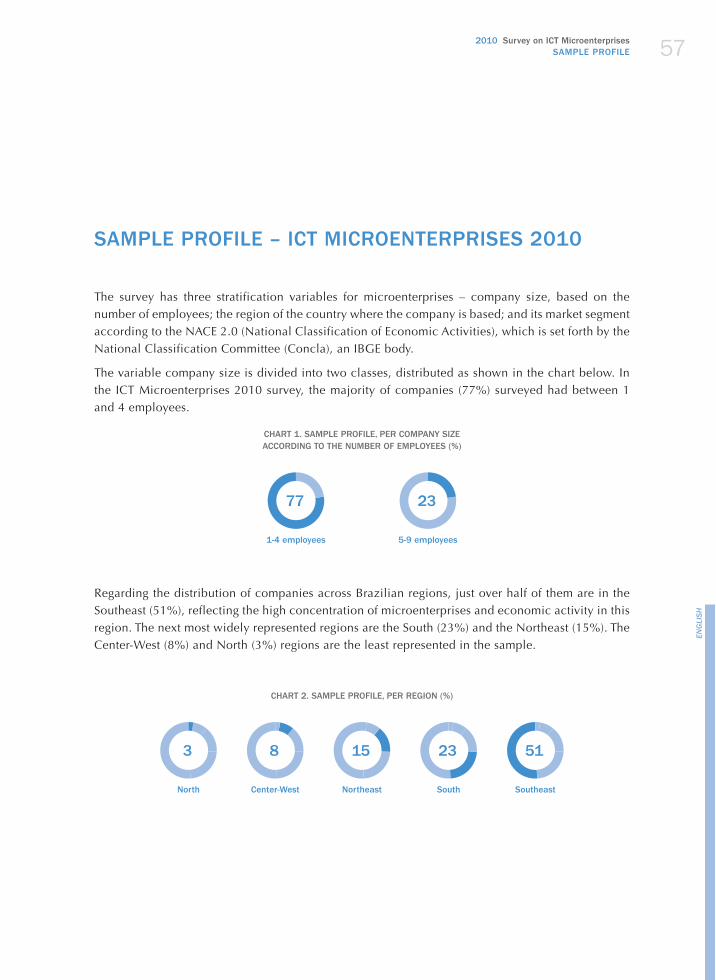
2010 Survey on ICT Microenterprises SAMPLE PROFILE 57
ENGLISH
SAMPLE PROFILE – ICT MICROENTERPRISES 2010
The survey has three stratification variables for microenterprises – company size, based on the number of employees; the region of the country where the company is based; and its market segment according to the NACE 2.0 (National Classification of Economic Activities), which is set forth by the National Classification Committee (Concla), an IBGE body.
The variable company size is divided into two classes, distributed as shown in the chart below. In the ICT Microenterprises 2010 survey, the majority of companies (77%) surveyed had between 1 and 4 employees.
CHART 1. SAMPLE PROFILE, PER COMPANY SIZE ACCORDING TO THE NUMBER OF EMPLOYEES (%)
77 23
1-4 employees 5-9 employees
Regarding the distribution of companies across Brazilian regions, just over half of them are in the Southeast (51%), reflecting the high concentration of microenterprises and economic activity in this region. The next most widely represented regions are the South (23%) and the Northeast (15%). The Center-West (8%) and North (3%) regions are the least represented in the sample.
CHART 2. SAMPLE PROFILE, PER REGION (%)
3 8 15 23 51
North Center-West Northeast South Southeast
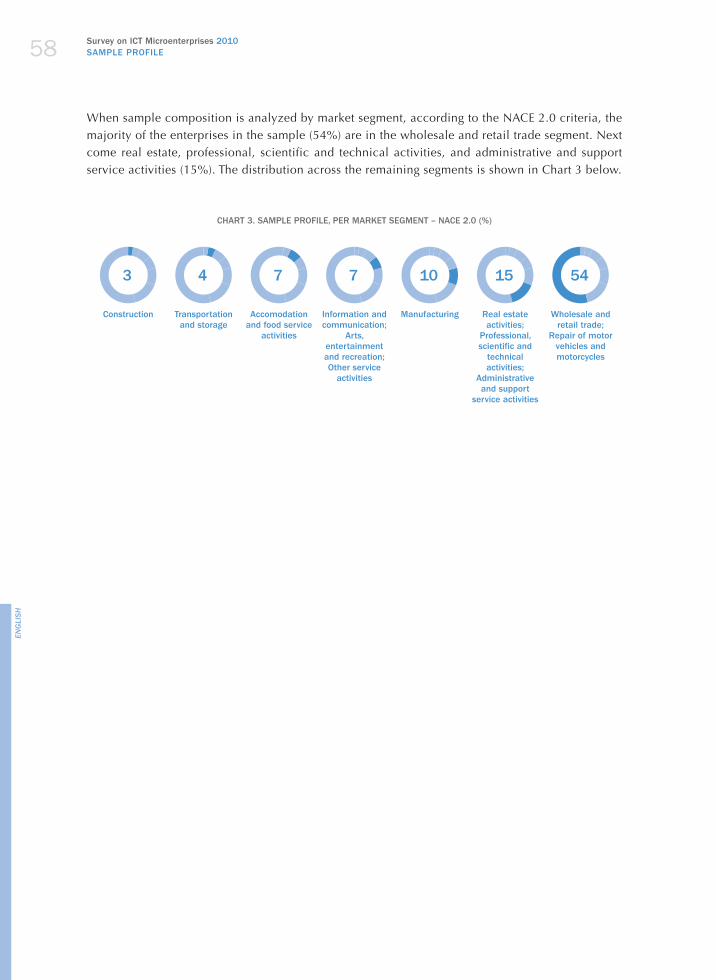
Survey on ICT Microenterprises 2010SAMPLE PROFILE58
ENGLISH
When sample composition is analyzed by market segment, according to the NACE 2.0 criteria, the majority of the enterprises in the sample (54%) are in the wholesale and retail trade segment. Next come real estate, professional, scientific and technical activities, and administrative and support service activities (15%). The distribution across the remaining segments is shown in Chart 3 below.
CHART 3. SAMPLE PROFILE, PER MARKET SEGMENT – NACE 2.0 (%)
3 4 7 7 10 15 54
Construction Transportation and storage
Accomodation and food service
activities
Information and communication;
Arts, entertainment and recreation; Other service
activities
Manufacturing Real estate activities;
Professional, scientific and
technical activities;
Administrative and support
service activities
Wholesale and retail trade;
Repair of motor vehicles and motorcycles
2010 Survey on ICT Microenterprises ANALYSIS OF RESULTS 59
ENGLISH
ANALYSIS OF RESULTS ICT MICROENTERPRISES 2010
INTRODUCTION
The goal of the ICT Microenterprises 2010 survey is to research the use of information and communication technologies by Brazilian enterprises with 1 to 9 employees and, thus, compare results with those of the study carried out in 2007. Furthermore, the differences of use by microenterprises and enterprises will be analyzed. It also sheds light on how microenterprises are benefiting from new technologies and shows which are the opportunities for their effective appropriation.
The standard used to classify enterprises by size is the same used in the first edition, i.e., based on the number of employees, according to the Organization for Economic Cooperation and Development (OECD) and to the Statistical Office of the European Commission (Eurostat).1
Currently in Brazil there are 1.5 million microenterprises,2 which represents about 14% of the active labor force on the work market.3 This scenario reveals the importance of this sector of the economy, which faces significant challenges to establishing itself in a consistent way. Despite being paramount for the Brazilian economic and social development, these companies struggle with government bureaucracy. Difficulties to obtaining financing, to taking part in development and innovation programs, and excessive regulations in registering patents and requesting operation licenses are some examples of the obstacles they have to face. In addition, the current tax structure of the country, which is extremely complex, imposes heavy burdens on these organizations, and is also an obstacle to the development and establishment of microenterprises.
1 In Brazil, the legislation provides for a different criterion, based on the annual gross revenue of enterprises. According to article 3 of Complimentary Law no. 123, from December 14th 2006 (known as the Statute of Microenterprises and Small Enterprises), microenterprises are legal entities or individual trading companies with an annual gross revenue of or under BRL 240,000.00 (two hundred and forty thousand Brazilian Reais); and small enterprises are legal entities or individual trading companies with an annual gross revenue over BRL 240,000.00 (two hundred and forty thousand Brazilian Reais) and up to BRL 2,400,000.00 (two million and four hundred thousand Brazilian Reais). Nevertheless, due to the fact that this is a sensitive issue for enterprises, this survey uses the size and the number of employees to define company size.
2 The figure corresponds to Brazilian enterprises with 1 to 9 employees registered with the Rais - i.e., official companies - and within the NACE 2.0 market segments.
3 According to http://www.fecomercio.com.br/?option=com_eventos&view=interna&Itemid=20&id=3697. Accessed on Dec. 2nd, 2011.

Survey on ICT Microenterprises 2010ANALYSIS OF RESULTS60
ENGLISH
Aware of their importance for the country development, the government has been implementing key policies to promote microenterprises. The changes in financing and incentive programs, such as the Supersimples (“Super simple”) 4 and the Microempreendedor Individual (“Individual Microentrepreneur” – MEI) 5 have extended the revenue standard to include more enterprises in the programs, thereby increasing the number of companies that are benefited.
The Crescer (“Grow”) Program was also launched in 2010 to promote access to small loans to finance operations or investments conducted by individual entrepreneurs or micro and small enterprises with an annual revenue of up to BRL 120,000. One of the highlights of the program is the reduction of the tax rates from 60% to 8% a year.
Innovation initiatives are also being implemented, such as Sebraetec,6 a program expected to provide BRL 787 million in the next three years to support innovation projects (BRL 85 million in 2011, BRL 134.6 million in 2012, BRL 189.5 million in 2013; and the remainder shall come from the benefited enterprises, from state Sebrae units and partners).
In this context, it is worth debating the subject of ICT and their contribution to the corporate environment and, consequently, to the development of microenterprises in Brazil. The United Nations Conference on Trade and Development (UNCTAD) Report on the Information Economy, published in October 2011, highlights the importance of the private sector, particularly micro and small enterprises, and its contribution to economic and social growth in developing countries. According to the report, ICT play a key role in ensuring countries development, and they also indicate that countries that have been implementing and investing in the use of ICT to strengthen the private sector have competitive advantage over other countries, since the effective use of ICT has an impact on the productivity of enterprises, both large and small. The report also indicates that enterprises in developing countries that use ICT perform better than those that do not, presenting significant results in terms of growth, profitability and return on investments.
In this sense, mobile phones, for instance, which are a more accessible technology, are essential because they are able to promote better communication across the value chain, both nationally and internationally, according to the scope of activity of each company. This also occurs with other technologies, such as computers and access to broadband Internet, and they may also considerably increase competitiveness in the corporate sector when used adequately (UNCTAD, 2011).
We propose an analysis of how Brazilian microenterprises use these technologies, providing subsidy for the debate on their role in establishing and expanding an increasingly important sector of the Brazilian economy for the economic and social growth of the country.
As shown below, the use of ICT by microenterprises is still incipient, but its implementation and strategy may increase the country’s competitive edge in the international market.
4 Available at http://www.sebrae.com.br/uf/paraiba/sites-especiais/simples-nacional. Accessed on Oct. 31st, 2011.5 Available at http://cafe.ebc.com.br/cafe/arquivo/incentivos-as-micro-e-pequenas-empresas-vao-gerar-mais-renda-e-mais-
empregos. Accessed on Oct. 31st, 2011.6 Available at http://www.sebrae.com.br/integra_noticia?noticia=10812970. Accessed in Oct. 31st, 2011.
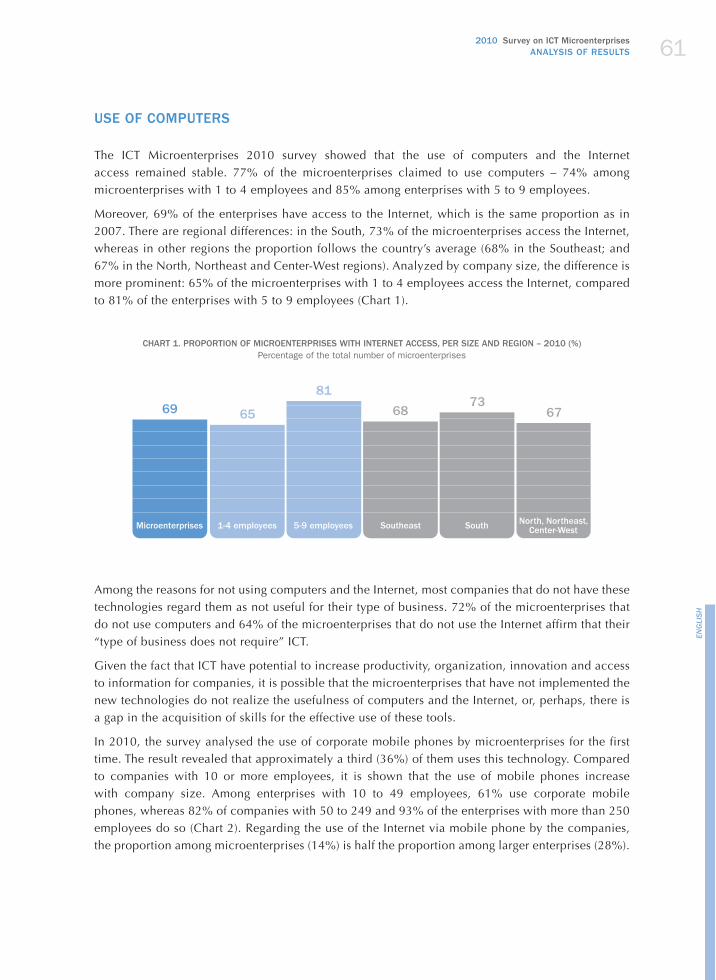
2010 Survey on ICT Microenterprises ANALYSIS OF RESULTS 61
ENGLISH
USE OF COMPUTERS
The ICT Microenterprises 2010 survey showed that the use of computers and the Internet access remained stable. 77% of the microenterprises claimed to use computers – 74% among microenterprises with 1 to 4 employees and 85% among enterprises with 5 to 9 employees.
Moreover, 69% of the enterprises have access to the Internet, which is the same proportion as in 2007. There are regional differences: in the South, 73% of the microenterprises access the Internet, whereas in other regions the proportion follows the country’s average (68% in the Southeast; and 67% in the North, Northeast and Center-West regions). Analyzed by company size, the difference is more prominent: 65% of the microenterprises with 1 to 4 employees access the Internet, compared to 81% of the enterprises with 5 to 9 employees (Chart 1).
CHART 1. PROPORTION OF MICROENTERPRISES WITH INTERNET ACCESS, PER SIZE AND REGION – 2010 (%) Percentage of the total number of microenterprises
North, Northeast, Center-WestSouthSoutheast5-9 employees1-4 employeesMicroenterprises
69 65
81
6873
67
Among the reasons for not using computers and the Internet, most companies that do not have these technologies regard them as not useful for their type of business. 72% of the microenterprises that do not use computers and 64% of the microenterprises that do not use the Internet affirm that their “type of business does not require” ICT.
Given the fact that ICT have potential to increase productivity, organization, innovation and access to information for companies, it is possible that the microenterprises that have not implemented the new technologies do not realize the usefulness of computers and the Internet, or, perhaps, there is a gap in the acquisition of skills for the effective use of these tools.
In 2010, the survey analysed the use of corporate mobile phones by microenterprises for the first time. The result revealed that approximately a third (36%) of them uses this technology. Compared to companies with 10 or more employees, it is shown that the use of mobile phones increase with company size. Among enterprises with 10 to 49 employees, 61% use corporate mobile phones, whereas 82% of companies with 50 to 249 and 93% of the enterprises with more than 250 employees do so (Chart 2). Regarding the use of the Internet via mobile phone by the companies, the proportion among microenterprises (14%) is half the proportion among larger enterprises (28%).
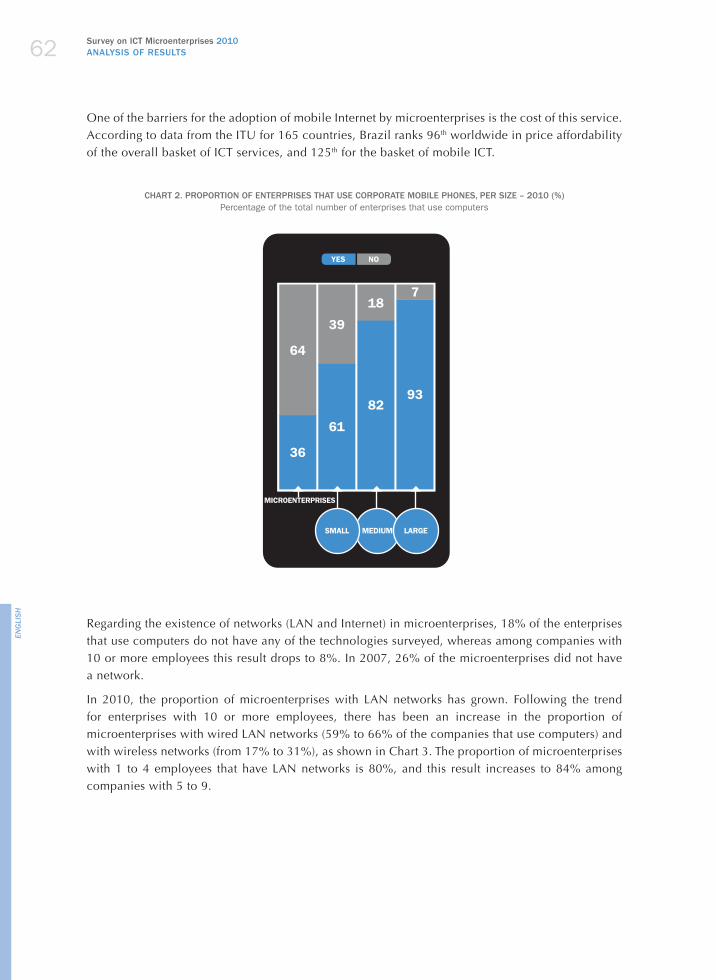
Survey on ICT Microenterprises 2010ANALYSIS OF RESULTS62
ENGLISH
One of the barriers for the adoption of mobile Internet by microenterprises is the cost of this service. According to data from the ITU for 165 countries, Brazil ranks 96th worldwide in price affordability of the overall basket of ICT services, and 125th for the basket of mobile ICT.
CHART 2. PROPORTION OF ENTERPRISES THAT USE CORPORATE MOBILE PHONES, PER SIZE – 2010 (%) Percentage of the total number of enterprises that use computers
YES NO
718
39
64
9382
61
36
MICROENTERPRISES
MEDIUM LARGESMALL
Regarding the existence of networks (LAN and Internet) in microenterprises, 18% of the enterprises that use computers do not have any of the technologies surveyed, whereas among companies with 10 or more employees this result drops to 8%. In 2007, 26% of the microenterprises did not have a network.
In 2010, the proportion of microenterprises with LAN networks has grown. Following the trend for enterprises with 10 or more employees, there has been an increase in the proportion of microenterprises with wired LAN networks (59% to 66% of the companies that use computers) and with wireless networks (from 17% to 31%), as shown in Chart 3. The proportion of microenterprises with 1 to 4 employees that have LAN networks is 80%, and this result increases to 84% among companies with 5 to 9.
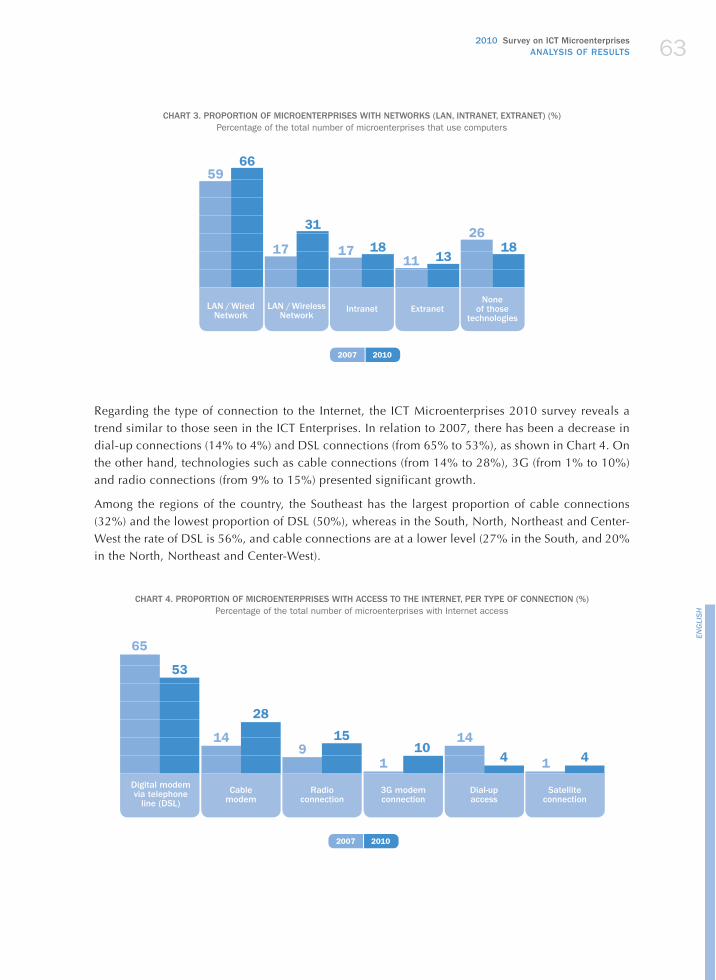
2010 Survey on ICT Microenterprises ANALYSIS OF RESULTS 63
ENGLISH
CHART 3. PROPORTION OF MICROENTERPRISES WITH NETWORKS (LAN, INTRANET, EXTRANET) (%) Percentage of the total number of microenterprises that use computers
20102007
LAN / Wired Network
LAN / Wireless Network
Intranet ExtranetNone
of those technologies
66
31
1813
18
59
17 1711
26
Regarding the type of connection to the Internet, the ICT Microenterprises 2010 survey reveals a trend similar to those seen in the ICT Enterprises. In relation to 2007, there has been a decrease in dial-up connections (14% to 4%) and DSL connections (from 65% to 53%), as shown in Chart 4. On the other hand, technologies such as cable connections (from 14% to 28%), 3G (from 1% to 10%) and radio connections (from 9% to 15%) presented significant growth.
Among the regions of the country, the Southeast has the largest proportion of cable connections (32%) and the lowest proportion of DSL (50%), whereas in the South, North, Northeast and Center-West the rate of DSL is 56%, and cable connections are at a lower level (27% in the South, and 20% in the North, Northeast and Center-West).
CHART 4. PROPORTION OF MICROENTERPRISES WITH ACCESS TO THE INTERNET, PER TYPE OF CONNECTION (%)Percentage of the total number of microenterprises with Internet access
20102007
Cable modem
Radio connection
3G modem connection
Dial-up access
Satelliteconnection
65
149
1
14
1
53
28
1510
4 4
Digital modem via telephone
line (DSL)
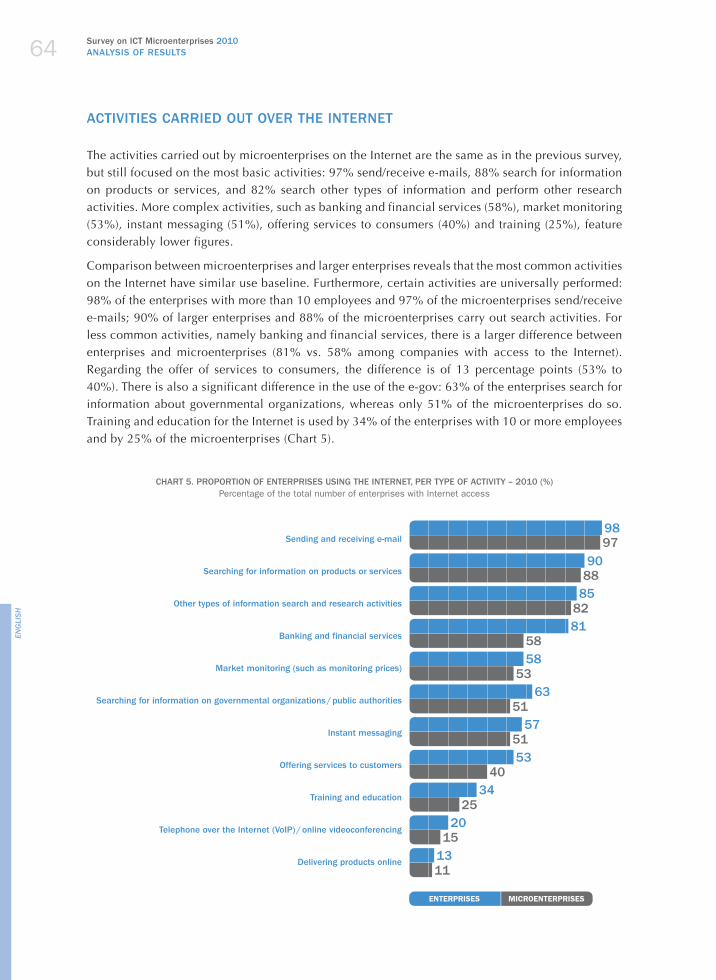
Survey on ICT Microenterprises 2010ANALYSIS OF RESULTS64
ENGLISH
ACTIVITIES CARRIED OUT OVER THE INTERNET
The activities carried out by microenterprises on the Internet are the same as in the previous survey, but still focused on the most basic activities: 97% send/receive e-mails, 88% search for information on products or services, and 82% search other types of information and perform other research activities. More complex activities, such as banking and financial services (58%), market monitoring (53%), instant messaging (51%), offering services to consumers (40%) and training (25%), feature considerably lower figures.
Comparison between microenterprises and larger enterprises reveals that the most common activities on the Internet have similar use baseline. Furthermore, certain activities are universally performed: 98% of the enterprises with more than 10 employees and 97% of the microenterprises send/receive e-mails; 90% of larger enterprises and 88% of the microenterprises carry out search activities. For less common activities, namely banking and financial services, there is a larger difference between enterprises and microenterprises (81% vs. 58% among companies with access to the Internet). Regarding the offer of services to consumers, the difference is of 13 percentage points (53% to 40%). There is also a significant difference in the use of the e-gov: 63% of the enterprises search for information about governmental organizations, whereas only 51% of the microenterprises do so. Training and education for the Internet is used by 34% of the enterprises with 10 or more employees and by 25% of the microenterprises (Chart 5).
CHART 5. PROPORTION OF ENTERPRISES USING THE INTERNET, PER TYPE OF ACTIVITY – 2010 (%)Percentage of the total number of enterprises with Internet access
Sending and receiving e-mail
Searching for information on products or services
Other types of information search and research activities
Banking and financial services
Market monitoring (such as monitoring prices)
Searching for information on governmental organizations / public authorities
Instant messaging
Offering services to customers
Training and education
Telephone over the Internet (VoIP) / online videoconferencing
Delivering products online
ENTERPRISES MICROENTERPRISES
98
85
58
63
57
53
34
20
13
81
9097
82
53
51
51
40
25
15
11
58
88
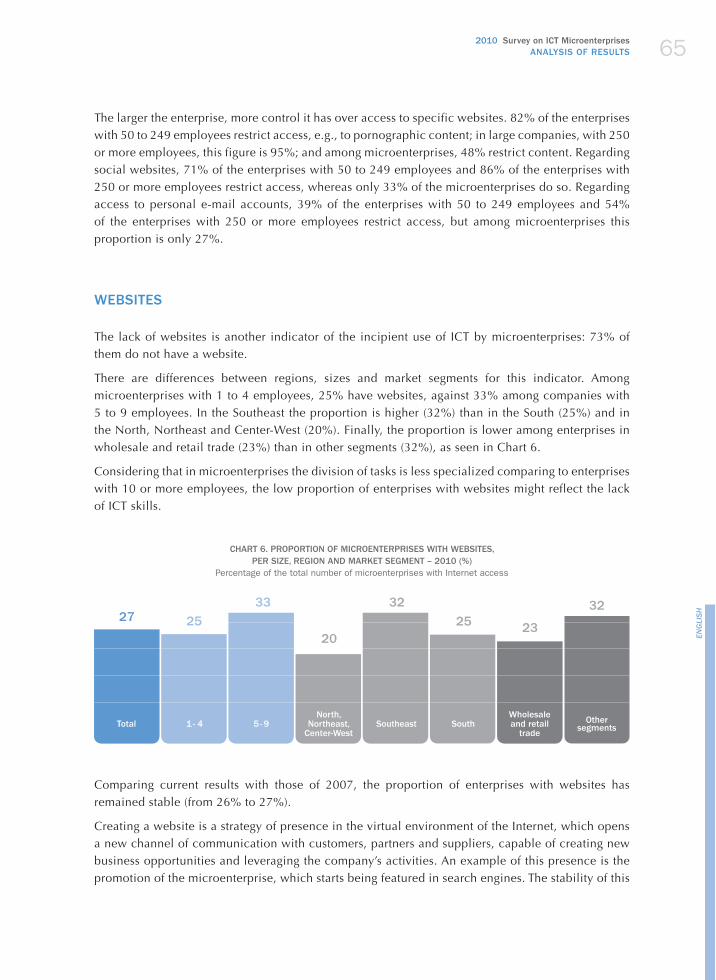
2010 Survey on ICT Microenterprises ANALYSIS OF RESULTS 65
ENGLISH
The larger the enterprise, more control it has over access to specific websites. 82% of the enterprises with 50 to 249 employees restrict access, e.g., to pornographic content; in large companies, with 250 or more employees, this figure is 95%; and among microenterprises, 48% restrict content. Regarding social websites, 71% of the enterprises with 50 to 249 employees and 86% of the enterprises with 250 or more employees restrict access, whereas only 33% of the microenterprises do so. Regarding access to personal e-mail accounts, 39% of the enterprises with 50 to 249 employees and 54% of the enterprises with 250 or more employees restrict access, but among microenterprises this proportion is only 27%.
WEBSITES
The lack of websites is another indicator of the incipient use of ICT by microenterprises: 73% of them do not have a website.
There are differences between regions, sizes and market segments for this indicator. Among microenterprises with 1 to 4 employees, 25% have websites, against 33% among companies with 5 to 9 employees. In the Southeast the proportion is higher (32%) than in the South (25%) and in the North, Northeast and Center-West (20%). Finally, the proportion is lower among enterprises in wholesale and retail trade (23%) than in other segments (32%), as seen in Chart 6.
Considering that in microenterprises the division of tasks is less specialized comparing to enterprises with 10 or more employees, the low proportion of enterprises with websites might reflect the lack of ICT skills.
CHART 6. PROPORTION OF MICROENTERPRISES WITH WEBSITES, PER SIZE, REGION AND MARKET SEGMENT – 2010 (%)
Percentage of the total number of microenterprises with Internet access
North, Northeast,
Center-WestOther
segmentsSouthWholesale and retail
tradeSoutheast5 - 91 - 4Total
27 2533
20
32
232532
Comparing current results with those of 2007, the proportion of enterprises with websites has remained stable (from 26% to 27%).
Creating a website is a strategy of presence in the virtual environment of the Internet, which opens a new channel of communication with customers, partners and suppliers, capable of creating new business opportunities and leveraging the company’s activities. An example of this presence is the promotion of the microenterprise, which starts being featured in search engines. The stability of this
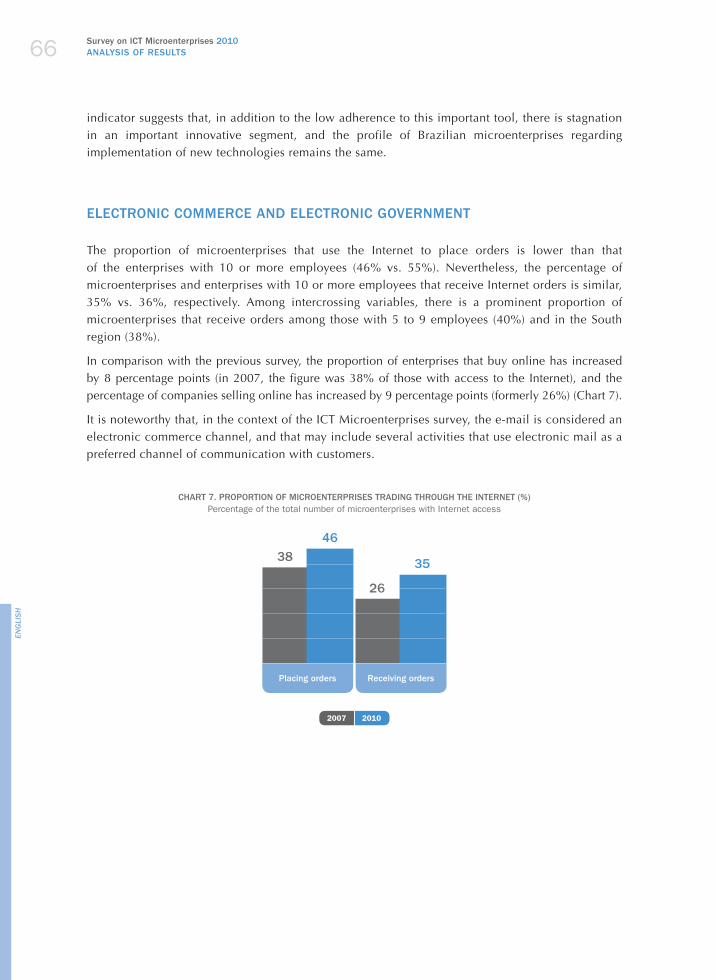
Survey on ICT Microenterprises 2010ANALYSIS OF RESULTS66
ENGLISH
indicator suggests that, in addition to the low adherence to this important tool, there is stagnation in an important innovative segment, and the profile of Brazilian microenterprises regarding implementation of new technologies remains the same.
ELECTRONIC COMMERCE AND ELECTRONIC GOVERNMENT
The proportion of microenterprises that use the Internet to place orders is lower than that of the enterprises with 10 or more employees (46% vs. 55%). Nevertheless, the percentage of microenterprises and enterprises with 10 or more employees that receive Internet orders is similar, 35% vs. 36%, respectively. Among intercrossing variables, there is a prominent proportion of microenterprises that receive orders among those with 5 to 9 employees (40%) and in the South region (38%).
In comparison with the previous survey, the proportion of enterprises that buy online has increased by 8 percentage points (in 2007, the figure was 38% of those with access to the Internet), and the percentage of companies selling online has increased by 9 percentage points (formerly 26%) (Chart 7).
It is noteworthy that, in the context of the ICT Microenterprises survey, the e-mail is considered an electronic commerce channel, and that may include several activities that use electronic mail as a preferred channel of communication with customers.
CHART 7. PROPORTION OF MICROENTERPRISES TRADING THROUGH THE INTERNET (%)Percentage of the total number of microenterprises with Internet access
Receiving ordersPlacing orders
26
353846
20102007
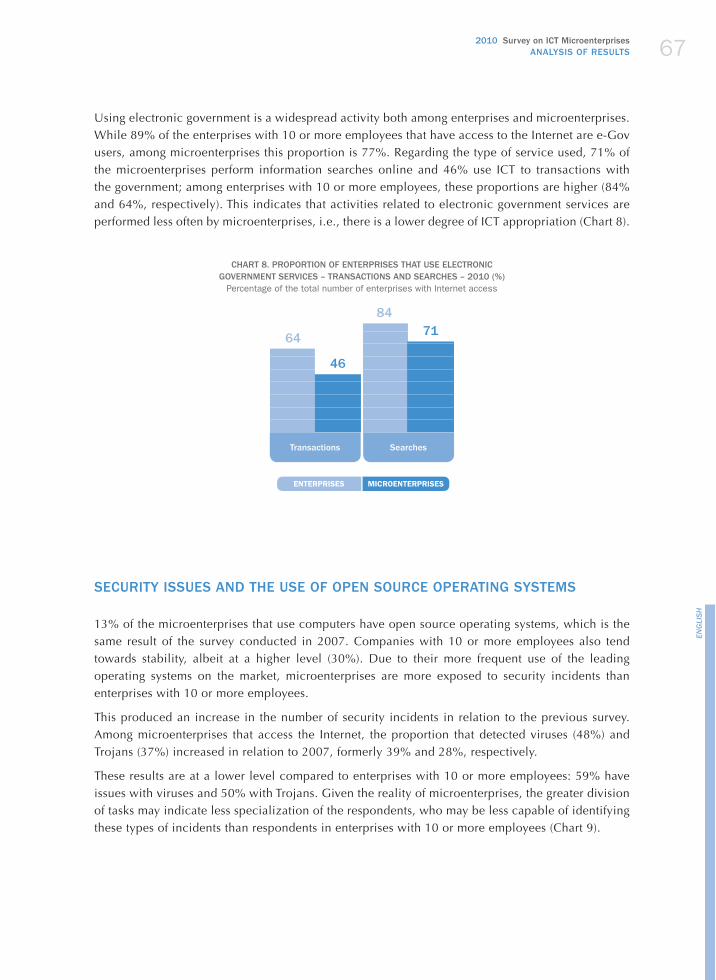
2010 Survey on ICT Microenterprises ANALYSIS OF RESULTS 67
ENGLISH
Using electronic government is a widespread activity both among enterprises and microenterprises. While 89% of the enterprises with 10 or more employees that have access to the Internet are e-Gov users, among microenterprises this proportion is 77%. Regarding the type of service used, 71% of the microenterprises perform information searches online and 46% use ICT to transactions with the government; among enterprises with 10 or more employees, these proportions are higher (84% and 64%, respectively). This indicates that activities related to electronic government services are performed less often by microenterprises, i.e., there is a lower degree of ICT appropriation (Chart 8).
CHART 8. PROPORTION OF ENTERPRISES THAT USE ELECTRONIC GOVERNMENT SERVICES – TRANSACTIONS AND SEARCHES – 2010 (%)
Percentage of the total number of enterprises with Internet access
SearchesTransactions
847164
46
ENTERPRISES MICROENTERPRISES
SECURITY ISSUES AND THE USE OF OPEN SOURCE OPERATING SYSTEMS
13% of the microenterprises that use computers have open source operating systems, which is the same result of the survey conducted in 2007. Companies with 10 or more employees also tend towards stability, albeit at a higher level (30%). Due to their more frequent use of the leading operating systems on the market, microenterprises are more exposed to security incidents than enterprises with 10 or more employees.
This produced an increase in the number of security incidents in relation to the previous survey. Among microenterprises that access the Internet, the proportion that detected viruses (48%) and Trojans (37%) increased in relation to 2007, formerly 39% and 28%, respectively.
These results are at a lower level compared to enterprises with 10 or more employees: 59% have issues with viruses and 50% with Trojans. Given the reality of microenterprises, the greater division of tasks may indicate less specialization of the respondents, who may be less capable of identifying these types of incidents than respondents in enterprises with 10 or more employees (Chart 9).
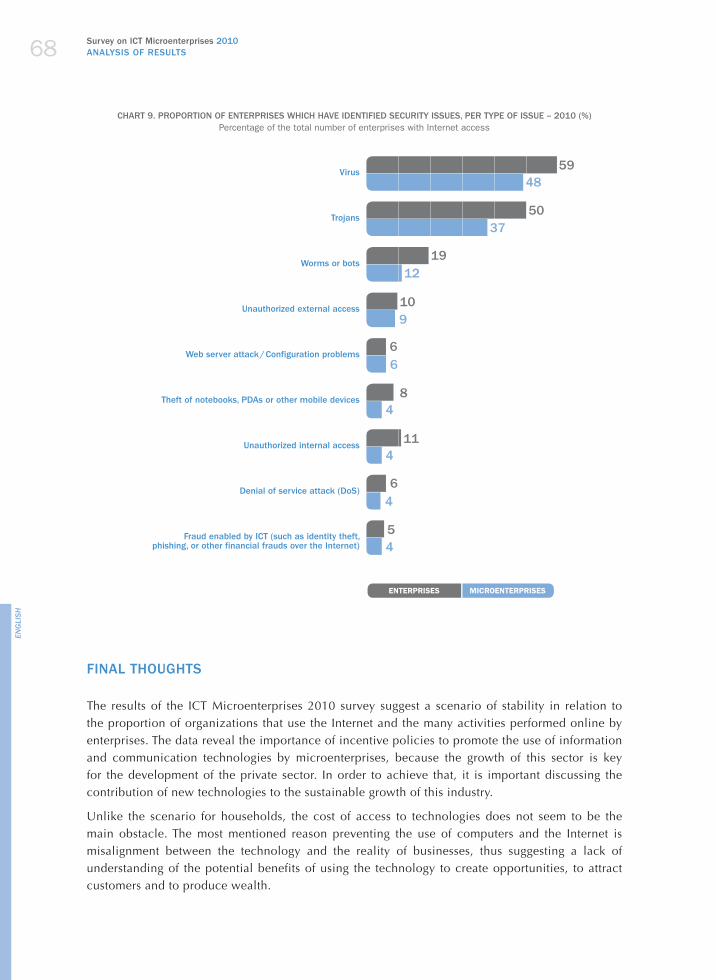
Survey on ICT Microenterprises 2010ANALYSIS OF RESULTS68
ENGLISH
CHART 9. PROPORTION OF ENTERPRISES WHICH HAVE IDENTIFIED SECURITY ISSUES, PER TYPE OF ISSUE – 2010 (%)Percentage of the total number of enterprises with Internet access
ENTERPRISES MICROENTERPRISES
48
37
12
9
6
4
4
4
4
59
50
19
10
6
8
11
6
5
Virus
Trojans
Worms or bots
Unauthorized external access
Web server attack / Configuration problems
Theft of notebooks, PDAs or other mobile devices
Unauthorized internal access
Denial of service attack (DoS)
Fraud enabled by ICT (such as identity theft, phishing, or other financial frauds over the Internet)
FINAL THOUGHTS
The results of the ICT Microenterprises 2010 survey suggest a scenario of stability in relation to the proportion of organizations that use the Internet and the many activities performed online by enterprises. The data reveal the importance of incentive policies to promote the use of information and communication technologies by microenterprises, because the growth of this sector is key for the development of the private sector. In order to achieve that, it is important discussing the contribution of new technologies to the sustainable growth of this industry.
Unlike the scenario for households, the cost of access to technologies does not seem to be the main obstacle. The most mentioned reason preventing the use of computers and the Internet is misalignment between the technology and the reality of businesses, thus suggesting a lack of understanding of the potential benefits of using the technology to create opportunities, to attract customers and to produce wealth.
2010 Survey on ICT Microenterprises ANALYSIS OF RESULTS 69
ENGLISH
A potential explanation for that is the level of skills and qualifications necessary for the use of ICT in the activities of Brazilian microenterprises. With routine use and the understanding of a technology enable, it is possible to foresee its potential contribution to businesses. Furthermore, knowledge of ICT enables microenterprises to detect new opportunities for the use of technologies, which would enable them to incorporate innovation into their processes.
Certain aspects of the Brazilian reality, such as low penetration of household access and incipient incorporation of technologies in educational processes, may contribute to understand why the use of computers and Internet is still not widely spread among companies.
Among the microenterprises that use ICT, results of indicators such as the use of electronic government, ownership of websites, the use of open source systems and exposure to security issues are further evidence of a scenario of low appropriation of ICT by microenterprises. In view of this, the challenges for public policies are not just to facilitate access to ICT, but, similarly to the situation with households, to train and qualify Brazilian entrepreneurs. This further stresses the importance of the role of nongovernmental organizations that aim at promoting microenterprises.
In addition to the aforementioned results, microentrepreneurs also struggle in terms of their ability to plan, organize and manage, which is further evidenced by the regional differences depending on where these businesses are based. Certain data related to regional differences corroborate this finding: the largest concentration and higher survival rates of microenterprises are in the South and Southeast regions (71% and 76%, respectively). Hence, actions to promote the access of microentrepreneurs to ICT resources are becoming increasingly relevant.
ICT may be key partners for small entrepreneurs, creating opportunities that are currently not available through other means. The impartiality of the network ensures that every company is able to participate on the Internet and may be found by customers and partners, without any differences or privileges.
The main conclusions of this study suggest the importance of training microentrepreneurs to explore the opportunities created by the worldwide computer network. This challenge also necessarily involves policies that allow for the particularities of microentrepreneurs.
REFERENCES
BRAZIL. Governo fortalece a pequena empresa. Brasília: Portal Brasil, April 1st, 2011. Available at http://www.brasil.gov.br/noticias/arquivos/2011/04/01/governo-encaminha-ao-congresso-projeto-de-lei-que-cria-secretaria-de-micro-e-pequena-empresa. Accessed on Oct. 31st, 2011.
CGI.BR. Pesquisa sobre o uso das tecnologias de informação e comunicação no Brasil – TIC Domicílios e Empresas 2010 / Survey on the use of information and communication technologies in Brazil – ICT Households and Enterprises 2010. Coord. Alexandre F. Barbosa. Trad. Karen Brito-Sexton. São Paulo: CGI.br, 2011.
FIGUEIREDO, Ana Luiza Ferrete Garcia. Situação jurídica das microempresas e empresas de pequeno porte no Brasil. Available at http://www.franca.unesp.br/Ana_Luiza_Ferrete_Garcia_de_Figueiredo.pdf. Accessed on Oct. 31st, 2011.
MONTEIRO, Carolina Mantovani. Microempresas e empresas de pequeno porte: uma visão generalista. Available at http://www.franca.unesp.br/Carolina_Mantovani_Monteiro.pdf. Accessed on Oct. 31st, 2011.
SEBRAE. Taxa de sobrevivência das empresas no Brasil. Brasília, Oct/2011. Available at http://www.biblioteca.sebrae.com.br/bds/BDS.nsf/45465B1C66A6772D832579300051816C/$File/NT00046582.pdf. Accessed on Oct. 31st, 2011.
UNCTAD. Information Economy Report 2011.


www.cetic.br
Núcleo de Informação e Coordenação do Ponto BRBrazilian Network Information Center
Tel 55 11 5509 3511Fax 55 11 5509 3512
www.nic.br