role of ctf18-rfc complex in human dna...
TRANSCRIPT

Universidade de lisboa
Faculdade de ciências
Departamento de biologia vegetal
ROLE OF CTF18-RFC COMPLEX
IN HUMAN DNA REPLICATION
PROGRAMS
Maria João Rodrigues da Silva
Mestrado em Biologia Molecular e Genética
2010

- 1 -
Universidade de lisboa
Faculdade de ciências
Departamento de biologia vegetal
ROLE OF CTF18-RFC COMPLEX
IN HUMAN DNA REPLICATION
PROGRAMS
Maria João Rodrigues da Silva
Mestrado em Biologia Molecular e Genética
2010
Dissertation directed by Professors Júlio Duarte and
Philippe Pasero

- 2 -
ACKNOWLEDGMENTS
I would like to express my sincere thankfulness to
Philippe Pasero for welcoming me in the team
“Maintien de l’intégrité du genome au cours de la
réplication”. Many thanks for your careful reading
of this report and your suggestions for its
improvement. I thank for his care and all help
during my staying in his laboratory and mostly in
a foreign country.
I would like to express my special gratitude to
Hélène Tourrière for her scientific guidance,
helpful suggestions, for her patience, support and
critically reading the manuscript.
I am also grateful to Laure Crabbé for her support
and introducing me to this project, I still miss the
long talks with her.
I would like to thank Julien Bianco, Jérôme Poli,
Armelle Lengronne, Ana-Maria Poveda and other
colleagues from the laboratory for their help and
encouraging me in difficult moments.
Just a final thank for every person whom I met in
the different laboratories for the nice scientifical
and personal talks in the corridor, for all the
reagents I needed on the rush and the several
explanations about different techniques.
- 3 -
RESUMO
A instabilidade genética é uma propriedade constitutiva das células tumorais que
contribui para a progressão do processo de cancerigénese. Trabalhos recentes indicam que
esta instabilidade surge num estado bastante precoce da tumorigénese como consequência
de defeitos de replicação (Halazonetis et al., 2008). Contudo, os mecanismos moleculares
envolvidos não se encontram ainda bem esclarecidos.
Os garfos de replicação são estruturas muito frágeis que encontram frequentemente
obstáculos como complexos proteicos ou lesões de ADN. A paragem não controlada destes
garfos pode provocar a formação de quebras cromossómicas (Tourrière et al., 2005) devido
à acumulação de ADN de cadeia simples. Com o propósito de limitar esta instabilidade
genómica durante a fase S, as células desenvolveram sistemas de vigilância chamados
checkpoints da fase S, vias de transdução de sinal conservadas na evolução que estão
frequentemente desreguladas nos cancros.
Um conhecimento mais aprofundado destes mecanismos deverá permitir-nos
compreender melhor a origem da instabilidade genética das células tumorais e, também, de
potenciar o efeito de agentes genotóxicos que têm como alvo os garfos de replicação.
Os mecanismos de replicação são altamente conservados entre os eucariotas, portanto
a estratégia abordada no nosso laboratório é monitorizar as respostas a stress replicativo
num modelo simples, a levedura de gemulação S. cerevisiae, e então realizar estes estudos
em células humanas. Recentemente, iniciámos um estudo em grande escala que visa
identificar novos factores implicados na detecção de paragens dos garfos de replicação em
S. cerevisiae. Este estudo permitiu-nos identificar a proteína CTF18 como um novo
mediador do checkpoint de replicação, essencial para a sua activação, implicado na
manutenção da integridade dos garfos de replicação (Crabbé et al., in press). CTF18
(Chromosome Transmission Fidelity Factor 18 homolog) faz parte de um complexo RFC
alternativo que realiza o loading da proteína PCNA, factor de processividade das
polimerases e para o ADN. O complexo proteico heteropentamérico RFC é composto
por uma subunidade grande (RFC1) e quatro pequenas subunidades (RFC2 a 5). Em
eucariotas, foram identificados três complexos loaders de PCNA envolvidos em respostas
checkpoint (Rad17-RFC), coesão entre cromatídios irmãos (CTF18-RFC) e manutenção da
estabilidade genética (Elg1-RFC). CTF18 é necessário para a transmissão cromossómica
precisa em leveduras e é altamente conservado em eucariotas. Ao contrário de outros
complexos RFC, CTF18-RFC também se associa com os factores de coesão da cromatina
Dcc1 e CTF8 para formar um complexo heteroheptamérico e é necessário para o
estabelecimento da coesão entre cromatídios irmãos durante a fase S (Lengronne et al.,
- 4 -
2006). Este complexo deposita também PCNA no ADN de cadeia simples numa reacção
dependente de ATP.
O objectivo do meu trabalho foi caracterizar a função de CTF18 na resposta ao stress
replicativo em células humanas normais e tumorais. Em primeiro lugar mostrei que, como
em S. Cerevisiae, CTF18 humano está associado à cromatina apenas na fase S. De
seguida, procurei determinar em que medida esta proteína contribui para a activação do
checkpoint de replicação. Para isto, utilizei diferentes siRNAs e shRNAs que permitem uma
depleção parcial ou completa de CTF18 em diferentes linhas tumorais (HCT116, HeLa,
HEK293T and U20S) assim como em fibroblastos primários (IMR90).
A activação do checkpoint de replicação foi analisada em presença ou em ausência de
HU (um inibidor da síntese de dNTPs) em células controle ou células com depleção de
CTF18 através da análise de CHK1 fosforilada/activa. CHK1 é a cinase efectora do
checkpoint de replicação de ADN que fosforila a fosfatase Cdc25 de forma a bloquear a
progressão do ciclo celular em resposta a stress replicativo. Aquando da depleção de
CTF18 com siRNAs e com a linha celular estável induzindo shRNAs, tanto na ausência
como na presença de stress, não consegui detectar diferenças significativas na activação do
checkpoint. Surpreendentemente, observei uma indução mais rápida do checkpoint de
replicação de ADN em células deficientes em CTF18 expostas a HU, o que poderia indicar
um aumento do colapso dos garfos de replicação nestas células sob stress replicativo. Para
testar esta possibilidade, tenho utilizado a técnica de Combing Molecular de ADN para
determinar se CTF18 é necessário na progressão normal dos garfos de replicação e/ou para
recuperação após um stress genotóxico. Este método utiliza um menisco de ar/água para
alongar e alinhar moléculas individuais de ADN de uma maneira uniforme. Neste processo,
o ADN liga-se a lamelas silanizadas pelas extremidades e as moléculas alinhadas são
estendidas a 150% do seu comprimento cristalográfico pelo menisco de ar que recua com
uma velocidade constante exercendo assim uma força constante nas moléculas aderidas.
Uma vez que o ADN adere às lamelas, é irreversivelmente fixado e não se separa mesmo
quando é rehidratado (Bensimon et al., 1994). O Combing Molecular permite a análise dos
parâmetros de replicação (velocidade dos garfos, taxa de início de replicação) quando o
ADN é extraído de células que foram marcadas com análogos halogenados de timidina
como BrdU, CldU e IdU. Em experiências típicas, culturas celulares assíncronas são
marcadas com pulsos de IdU e CldU de forma a determinar a orientação dos garfos de
replicação. Os nucleótidos halogenados são detectados ao longo das fibras de ADN
utilizando anti-corpos fluorescentes e visualizados por imunofluorescência. As distâncias
percorridas pelos garfos durante as marcações são medidas usando o software MetaMorph.
Neste estudo, mais de 100 moléculas individuais de ADN foram analisadas relativamente à
velocidade de progressão dos garfos de replicação para cada condição experimental.
- 5 -
Nas células transfectadas com siRNAs contra CTF18, verifiquei que os garfos de
replicação se movem mais lentamente na presença de HU, que é uma reminiscência do que
foi observado nos mutantes de levedura ctf18 (Crabbé et al., in press). Estes dados
sugerem que CTF18 humano poderá estar implicado na manutenção dos garfos de
replicação retidos durante a replicação. Visto que os mutantes ctf18 de levedura acumulam
sinais de dano de ADN nos garfos retidos por HU, verifiquei, de seguida, se é também o
caso em células humanas deficientes em CTF18. Para este fim, utilizei a forma fosforilada
da variante de histona H2AX (γH2AX), como marcador de quebras simples e duplas no
ADN. γH2AX foi quantificada por Western blotting em ausência e presença de stress
replicativo. Um ligeiro mas reprodutível aumento de γH2AX foi observado na presença de
stress em células transfectadas com siRNA CTF18, o que é consistente com os meus
resultados de Combing. Estes dados sugerem que os garfos de replicação são menos
estáveis nas células deficientes em CTF18 expostas a HU e que os garfos danificados
induzem uma activação do checkpoint mais rápida.
Em conjunto, os meus dados sugerem que CTF18 tem uma função no replissoma para
conservar os garfos de replicação retidos na presença de stress, mas não tem o mesmo
papel na activação do checkpoint como nas leveduras. Várias razões podem ser invocadas
para explicar esta diferença. Por exemplo, a quantidade de CTF18 restante após RNA de
interferência poderá ser suficiente para desempenhar a sua função no checkpoint.
Tentativas têm sido feitas para melhorar a depleção de CTF18 com construções de shRNA
induzíveis mas não tiveram êxito. Para além disso, em células primárias, que têm menos
CTF18, a maior a depleção obtida provoca um aumento da mortalidade celular e não
permitiu uma análise adicional do checkpoint. Uma outra explicação poderia ser que CTF18
humano está de facto envolvido na resposta do checkpoint da replicação de ADN, mas o
defeito deste checkpoint em células deficientes em CTF18 é mascarado pela resposta do
dano de ADN induzida pelo colapso dos garfos em HU. Estudos em leveduras de
gemulação têm mostrado que é realmente o caso (Crabbé et al., in press). No entanto, esta
possibilidade é difícil de abordar em células humanas visto que, ao contrário das leveduras,
as vias dos checkpoint do dano e da replicação de ADN são altamente interdependentes e
não podem ser funcionalmente separadas. Experiências adicionais são, portanto,
necessárias para concluir definitivamente se CTF18 medeia ou não a resposta da replicação
do ADN em células humanas, como acontece nas leveduras de gemulação.
Palavras-chave: CTF18, checkpoint da replicação de ADN, tumorigénese, instabilidade
genómica, stress replicativo.
- 6 -
Abstract
Replication fork progression is frequently challenged by DNA lesions and by natural
pause sites. Arrested forks are unstable structures, which represent a major threat for the
genome integrity if they are not promptly stabilized and restarted. In response to replicative
stress, cells activate the replication checkpoint to prevent collapse of stalled forks and
promote fork recovery. Recent evidence indicates that spontaneous replication stress occurs
in precancerous lesions and promotes the development of cancer. Understanding how DNA
replication stress arises in normal cells and contributes to tumorigenesis is a major challenge
in cancer research.
The human Chromosome Transmission Fidelity Factor 18 homolog is part of an
alternative RFC complex that loads into DNA the clamp protein PCNA, the processivity factor
of DNA polymerase and . In the yeast S. cerevisiae, our group has shown that CTF18 is
essential for the activation of the DNA replication checkpoint (Crabbé et al., in press). We
checked whether this function is conserved in human cells. To address this question, we
depleted CTF18 in human cells by RNA interference and we monitored their ability to
activate the DNA replication checkpoint. We were unable to detect a significant difference in
cells ability to activate the replication checkpoint when depleting CTF18, except for very early
activation.
We next used DNA combing to check whether CTF18 is required for replication fork
progression, as it is the case in yeast. Forks moved slower in absence of CTF18 in presence
of stress, suggesting that CTF18 could be implicated in the maintenance of stalled forks. In
the same way, we also observed a slight increase of DNA damage in CTF18 depleted cells.
Altogether, these experiments suggest that CTF18 has a function at the replisome to
maintain stalled forks in presence of stress but does not play the same role in checkpoint
activation as in yeast.
Key words: CTF18, DNA replication checkpoint, tumorigenesis, genomic instability,
replicative stress.
- 7 -
LIST OF ABBREVIATIONS
2D
ATM
ATP
ATR
bp
BrdU
BSA
C
CDK
Chk1
Chk2
CIN
CKI
CldU
CTF18/RFCCtf18
cyc
DDC
DMEM
DMSO
dox
DPBS
DRC
DSB
DTT
ECL
EDTA
EGTA
FACS
FCS
FITC
GIN
HEK
HU
Two-dimensional
Ataxia Telangiectasia Mutated
Adenosine Triphosphate
Ataxia Telangiectasia and Rad3 related
base pair
Bromodeoxyuridine
Bovine Serum Albumin
Control
Cyclin-dependent Kinase
Checkpoint homolog kinase 1
Checkpoint homolog kinase 2
Chromosomal instability
CDK Inhibitor
Chlorodeoxyuridine
Chromosome Transmission Fidelity Factor 18 homolog
Cyclin
DNA damage checkpoint
Dulbecco's Modified Eagle Medium
Dimethyl Sulfoxide
Doxycycline
Dulbecco's Phosphate-buffered Saline
DNA Replication Checkpoint
Double Strand Break
Dithiothreitol
Enzymatic Chemiluminescent
Ethylenediaminetetraacetic Acid
Ethylene Glycol Tetraacetic Acid
Fluorescence-activated cell sorting
Fetal Calf Serum
Fluorescein Isotiocyanate
Genetic Instability
Human Embryonic Kidney
Hydroxyurea
- 8 -
IdU
IgG
LMP
MES
MOI
NT
O/N
ORC
ORI
PBS
PCNA
PI
PK
pol
RFC
RPA
rpm
pRb
pre-RC
R-point
RT
SDS
ssDNA
TBS
Iododeoxyuridine
Immunoglobulin G
Low Melting Point
2-(N-morpholino) Ethanesulfonic acid
Multiplicity of Infection
Non-transfected
Over Night
Origin Recognition Complex
Origin
1X Phosphate-buffered Saline
Proliferating Cell Nuclear Antigen
Propidium iodide
Proteinase K
polymerase
Replication Factor C
Single-stranded-DNA-binding Protein A
rotations per minute
Retinoblastoma protein
pre-replication complex
Restriction point
Room Temperature
Sodium Dodecylsulfate
single stranded DNA
Tris-buffered Saline
- 9 -
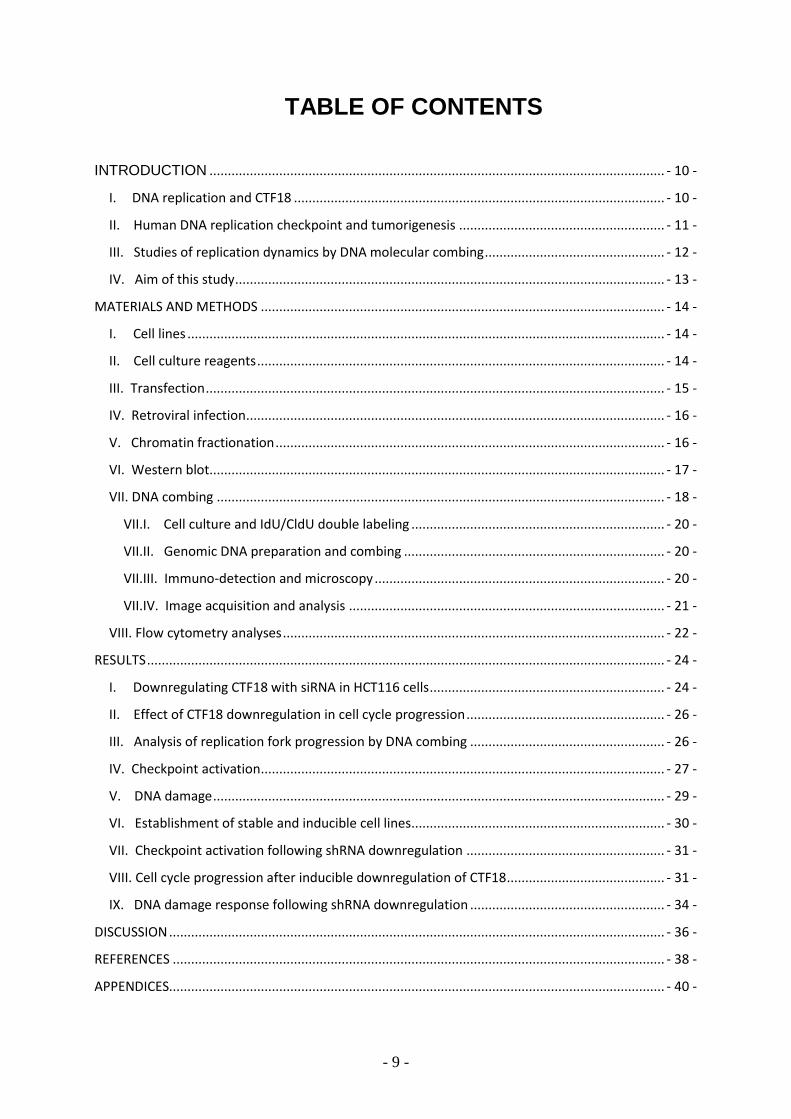
TABLE OF CONTENTS
INTRODUCTION ............................................................................................................................ - 10 -
I. DNA replication and CTF18 ..................................................................................................... - 10 -
II. Human DNA replication checkpoint and tumorigenesis ........................................................ - 11 -
III. Studies of replication dynamics by DNA molecular combing ................................................. - 12 -
IV. Aim of this study ..................................................................................................................... - 13 -
MATERIALS AND METHODS .............................................................................................................. - 14 -
I. Cell lines .................................................................................................................................. - 14 -
II. Cell culture reagents ............................................................................................................... - 14 -
III. Transfection ............................................................................................................................. - 15 -
IV. Retroviral infection .................................................................................................................. - 16 -
V. Chromatin fractionation .......................................................................................................... - 16 -
VI. Western blot............................................................................................................................ - 17 -
VII. DNA combing .......................................................................................................................... - 18 -
VII.I. Cell culture and IdU/CldU double labeling ..................................................................... - 20 -
VII.II. Genomic DNA preparation and combing ....................................................................... - 20 -
VII.III. Immuno-detection and microscopy ............................................................................... - 20 -
VII.IV. Image acquisition and analysis ...................................................................................... - 21 -
VIII. Flow cytometry analyses ........................................................................................................ - 22 -
RESULTS ............................................................................................................................................. - 24 -
I. Downregulating CTF18 with siRNA in HCT116 cells ................................................................ - 24 -
II. Effect of CTF18 downregulation in cell cycle progression ...................................................... - 26 -
III. Analysis of replication fork progression by DNA combing ..................................................... - 26 -
IV. Checkpoint activation .............................................................................................................. - 27 -
V. DNA damage ........................................................................................................................... - 29 -
VI. Establishment of stable and inducible cell lines ..................................................................... - 30 -
VII. Checkpoint activation following shRNA downregulation ...................................................... - 31 -
VIII. Cell cycle progression after inducible downregulation of CTF18 ........................................... - 31 -
IX. DNA damage response following shRNA downregulation ..................................................... - 34 -
DISCUSSION ....................................................................................................................................... - 36 -
REFERENCES ...................................................................................................................................... - 38 -
APPENDICES....................................................................................................................................... - 40 -

- 10 -
INTRODUCTION
The efficient and accurate duplication of eukaryotic genomes depends on the
sequential firing of thousands of replication origins distributed along the chromosomes.
Origin activation follows a temporal program that is imposed by the chromosomal context
and is controlled by complex surveillance pathways called S-phase checkpoints (Aguilera
and Gomez-Gonzalez, 2008; Branzei and Foiani, 2007; Tourriere and Pasero, 2007). The
correct execution of this replication program is essential for the maintenance of genome
integrity during DNA replication. Indeed, it has been recently reported that genomic instability
arises spontaneously at early stages of the cancer process as a consequence of oncogene-
induced alterations of DNA replication (Halazonetis et al., 2008). Understanding how DNA
replication stress arises in normal cells and contributes to tumorigenesis is a major challenge
in cancer research.
Replication mechanisms are highly conserved among the eukaryotes so the strategy
followed in our lab is to monitor replication stress responses in a simple model system, the
budding yeast S. cerevisiae, and then to perform these studies in human cells. We also take
advantage of a powerful technique, DNA combing, to monitor DNA replication at the level of
single molecules.
I. DNA replication and CTF18
The basic principles underlying the regulation of eukaryotic DNA replication are now
well established (Bell and Dutta, 2002; Machida et al., 2005). Pre-replication complexes (pre-
RCs) assemble on replication origins during the G1 phase of the cell cycle and are activated
in S phase through the coordinated action of cyclin-dependent kinases (CDKs) and Dbf4-
dependent kinases (DDKs) (Pasero and Schwob, 2000). The subsequent unwinding of the
DNA duplex at origins by the Mcm2-7 helicases allows the engagement of DNA polymerases
(Diffley, 2004). Upon initiation, the MCM complex promotes the bidirectional progression of
replication forks, together with Cdc45, GINS and other components of the replisome
(Gambus et al., 2006; Johnson and O'Donnell, 2005) and forks progress along parental DNA
until they encounter forks progressing from neighboring origins. Converging replisomes are
disassembled through a poorly-defined process referred to as termination of DNA replication
(Holm, 1994). The processive DNA synthesis requires DNA pol and DNA pol to associate
with the ring-shaped processivity factor PCNA (Mollenbeck et al., 2003); (Mossi et al., 1998)
that encircles DNA and topologically links the polymerase to DNA. PCNA is loaded onto the

- 11 -
primed DNA template (Takisawa et al., 2000) by the clamp loader, RFC. RFC is a
heteropentameric protein complex composed of a large subunit (RFC1) and four small
subunits (RFC2 to 5). Three other clamp loader complexes that are involved in checkpoint
responses (Rad17-RFC), sister chromatids cohesion (CTF18-RFC), and maintenance of
genome stability (Elg1-RFC) have been identified in eukaryotes. Ctf18 is required for precise
chromosome transmission in yeast and is highly conserved in eukaryotes. Unlike other
loader complexes, RFCCtf18 also associates with the chromosome cohesion factors Dcc1 and
Ctf8 to form a heteroheptameric complex. RFCCtf18 is required for the establishment of sister-
chromatid cohesion (SCC) during S phase (Lengronne et al., 2006). This complex loads also
the clamp protein PCNA in an ATP-dependent reaction onto single-stranded and primed
DNA. It was shown in human cells, through single-molecule analysis, that the RFCCtf18 clamp
loader controls the velocity, spacing and restart activity of replication forks and is required for
robust acetylation of the cohesin subunit SMC3 and for sister chromatid cohesion (Terret et
al., 2009). So this complex seems to link chromatin cohesion with DNA replication in human
cells.
II. Human DNA replication checkpoint and tumorigenesis
Replication fork progression is frequently challenged by DNA lesions and by a variety of
natural pause sites, including condensed chromatin structures, non-histone nucleoprotein
complexes and highly-expressed genes (Ivessa et al., 2003; Tourriere and Pasero, 2007).
Arrested forks are unstable structures, which represent a major threat for the integrity of the
genome if they are not promptly stabilized and restarted.
Arrested forks accumulate single-stranded DNA (ssDNA) and are therefore prone to
breakage and inappropriate recombination events. To prevent genomic instability during S
phase, cells have evolved complex surveillance pathways called intra-S checkpoints. These
checkpoints are signal transduction pathways that are conserved across evolution. RPA-
coated ssDNA produced at the lesion site serves to recruit the sensor kinase ATR/ATRIP
and RAD17. RAD17, complexed with RFC2-5, loads the 9-1-1 complex. Next, binding of
TopBP1 to RAD9, places TopBP1 in the proximity of ATR and allows it to activate ATR
kinase activity. ATR then phosphorylates RAD17. Claspin localizes at the replication forks
and, together with phosphorylated RAD17, is required for ATR-mediated CHK1 (effector
kinase) phosphorylation and activation. Activated CHK1 is then released from arrested forks
to regulate multiple cellular events. Known targets of this so-called DNA replication
checkpoint (DRC) pathway include the stabilization of stalled forks, the induction of DNA
repair genes, the upregulation of nucleotide pools and the repression of late-firing origins.
- 12 -
However, the molecular mechanisms of the replication checkpoint activation and the
mechanism by which ATR coordinates origin activation, fork progression and fork recovery
remains poorly understood.
It is now well established that the overexpression of oncogenes such as cyclin E,
Cdc25A or E2F1 is sufficient to alter cell-cycle controls over DNA replication and to induce
genomic instability (Bartkova et al., 2005). This stress, through the formation of DNA double-
strand breaks, activates DNA damage checkpoint (DDC), which induces cell cycle arrest or
p53-dependent apoptosis. It has been proposed that this constitutive activation of the DDC
acts as a selective pressure to inactivate p53 and escape senescence. This will enable cells
to bypass the DNA damage checkpoint and facilitate tumor progression (Bartkova et al.,
2005)(Gorgoulis et al., 2005). However, the molecular mechanisms linking altered S phase
progression to genetic instability remain elusive. How tumor cells manage to proliferate
despite the presence of constitutive replication stress is another important question that
remains to be addressed.
III. Studies of replication dynamics by DNA molecular combing
Studying DNA replication in human cells using biochemical assays is particularly tedious
because of the large size of their genome. In contrast, single-molecule techniques have
proven to be powerful approaches to monitor DNA replication in a variety of organisms,
including human cells (Tuduri et al., 2009). In this project, we will use the more advanced
version of these techniques, which is called DNA combing (Michalet et al., 1997). In this
assay, newly-replicated DNA is substituted with halogenated nucleotide derivatives, such as
bromo- (Br), chloro- (Cl) or iododeoxyuridine (IdU). Chromosomal DNA is then purified and
stretched on silanized coverslips. This procedure generates long, parallel DNA fibers, with a
uniform extension of 2 kb/μm. The sites of DNA synthesis are detected along individual DNA
fibers by indirect immunofluorescence using specific antibodies against BrdU, CldU, IdU and
DNA fibers can be counterstained with anti-ssDNA antibodies.
With DNA combing, a large number of replication parameters can be analyzed, such as
the rates of initiation and elongation and the percentage of replication for individual DNA
fibers. DNA combing can also be used to monitor fork recovery after a replication stress and
define replication fork asymmetry in normal cell cycle; application of two different nucleotide
analogs enables us to notice the orientation of forks.
- 13 -
IV. Aim of this study
In a simple model system, the budding yeast S. cerevisiae, our lab identified the CTF18
protein as a new player for the activation of the DNA replication checkpoint and for the
maintenance of arrested forks. It plays a role in the replication checkpoint activation that is
not shared by other RFC-like complexes or by factors involved in sister-chromatid cohesion.
RFCCtf18 also maintains fork integrity in HU (Crabbé et al., in press). The mechanism by
which RFCCtf18 executes this checkpoint function is currently unclear.
The main purpose of this study is to determine whether human RFCCtf18 is essential for
the replication checkpoint activation like in yeast and could participate to the maintenance of
genome stability via its checkpoint function.
The strategy applied to study RFCCtf18 function is to downregulate CTF18 expression by
siRNA and shRNA in human cells and to analyze checkpoint activation, the cell cycle
progression, replication fork speed and DNA damage in CTF18 depleted cells in presence of
replication stress.
- 14 -
MATERIALS AND METHODS
I. Cell lines
293T cells
Human Embryonic Kidney (HEK) cells, also called HEK 293 are a cell line originally
derived from human embryonic kidney and transformed with sheared adenovirus 5 DNA
(Graham et al., 1977). 293T HEKs are known to be easily cultured and transfected and are
p53 positive.
IMR90 cells
Human diploid fibroblast-like cell line established from lung tissue of a female fetus
(Nichols et al., 1976). The cells have been reported to be capable of attaining 58 population
doublings before the onset of senescence.
HCT116 cells
Human epithelial colon carcinoma cell line established in 1981. This adherent cell line
has a mutation in codon 13 of the ras proto-oncogene but is p53 wild type.
HeLa cells
Human epithelial adenocarcinoma cell line established from cervix. HeLa cells have been
reported to contain human papilloma virus 18 (HPV-18) sequences. P53 expression was
reported to be low, and normal levels of pRB (retinoblastoma suppressor) were found.
U2OS cells
Human osteosarcoma cell line expressing wild type p53 and Rb, but lacking p16. The
U2OS cell line, originally known as the 2T line, was cultivated from the bone tissue of a
fifteen-year-old human female suffering from osteosarcoma of the tibia.
II. Cell culture reagents
All of these cells lines were cultivated with this same culture conditions:
DMEM (Dulbecco's Modified Eagle Medium), +4.5g/L D-glucose, + Pyruvate, +
GlutaMAXTM-l (Gibco Invitrogen), supplemented with:
- 15 -
Non essential Amino Acid Glutamine (Gibco Invitrogen), penicillin/streptomycin
(100μg/ml) and 10% FCS (Fetal Calf Serum) (Lonza)
DPBS (Dulbecco's Phosphate Buffered Saline) -CaCl2, -MgCl2 (Lonza)
0.05% Trypsin - EDTA (Invitrogen)
Incubator allowing CO2 at 4.5%
III. Transfection
Transfection is a method of introducing nucleic acids into animal cells in a non-viral way.
In my studies, HCT116, IMR90, U2OS, HEK293T and HeLa cells were transfected with
control and CTF18 siRNA and HEK293T were transfected with control and CTF18 plasmid
DNA shRNA.
HCT116 were transfected with HiPerFect Transfection Reagent (Quiagen) to test its
efficiency and with INTERFERin™ (Polyplus). INTERFERin™ is a new generation of cationic
lipid based transfection reagent. It was developed for the delivery of siRNA into mammalian
cells in culture and the transfection efficiency was better than with HiPerFect in the type of
cells used.
To test the downregulation using HiPerFect Transfection Reagent, 3x10⁶ of HCT116 cells
were split on 6 well plates with 2300μL of complete medium. The next day, transfection was
performed: for one well, a mix of 12μL of HiPerFect solution with 10 nM final concentration of
siRNA in 100μL final volume of serum-free medium was prepared in a sterile microcentrifuge
tube, vortexed and incubated for 5-10 min. 100μL of the mix were added dropwise and the
plate was swirled and incubated at 370C.
With INTERFERin™ transfection reagent, 3x10⁶ of HCT116, U2OS, IMR90, HEK293T
and HeLa cells were split on 6 well plate in 2mL of complete medium in each well and
transfected at the same time with a mix of 11μL of INTERFERin™ reagent and 10 nM siRNA
in 200μL final volume of serum-free medium previously incubated for 10 min.
The second day after seeding cells, the second round of transfection was performed as
described for the first round.
For plasmid DNA shRNA transfection, HEK293T cells were plated at a density of 2x10⁵
cells per well in a 6 well plate with medium without antibiotics. The day after, for each well,
10μL of Lipofectamine™2000 were diluted in 190μL of serum free medium, incubated for 5
min and then combined with 2000ng of DNA diluted in 200μL of medium without serum. The
solution was mixed gently and incubated for 20 min at room temperature. The 400μL of
complexes were added to each well containing cells and medium and the plate was rocked
back and forth gently, to mix. Transgene expression was induced with 2μg/mL of doxycycline

- 16 -
the following days and the best constructions (with higher CTF18 downregulation) were
chosen.
IV. Retroviral infection
HCT116 cells were plated at a density of 7x10⁵ for well in a 6 well plate. The next day,
medium was replaced by medium with Hexadimethrine bromide – final concentration of
8μg/mL and the lentiviral particles were added at different MOIs. The medium was changed
the following day and also 2 days after transduction, adding puromycin to select infected
cells. Doxycycline was added to induce expression.
Transfection and retroviral infection materials
RNaseDNase-free water
HiPerFect Transfection Reagent (Quiagen)
INTERFERin™ (Polyplus)
Hexadimethrine bromide
siRNA directed against CTF18 (number 1, 2, 3 and 4 – catalogue n° 1027416) and
control siRNA (catalogue n° 1027284) from QUIAGEN
Human TRIPZ lentiviral inducible shRNAmir directed against CTF18 (number 1 and 2)
and empty retroviral vector from Thermo Scientific Open Biosystems
Figure 1. pTRIPZ lentiviral inducible shRNAmir. The pTRIPZ transactivator, known as the
reverse tetracycline transactivator 3 (rtTA3) binds to and activates expression from TRE promoters in
the presence of doxycycline.
V. Chromatin fractionation
To localize proteins in the cell, cytoplasmic, nuclear and chromatin extracts were
prepared. Approximately 3 x 10⁶ cells were washed in PBS and resuspended in 200µL of
- 17 -
solution A. Triton X-100 was added to a final concentration of 0.1%, cells were incubated on
ice for 5 min and cytoplasmic and nuclear fractions were harvested by centrifugation at 1,300
x g for 4 min. Isolated nuclei were then washed in solution A, lysed in 150µL solution B and
incubated on ice for 10 min. The soluble nuclear and chromatin fractions were harvested by
centrifugation at 1,700 x g for 4 min. Isolated chromatin was then washed in solution B, spun
down at 10,000 x g and resuspended in 150µL Laemmli buffer.
Chromatin fractionation materials
Solution A: 10 mM Hepes [pH 7.9], 10 mM KCl, 1.5 mM MgCl2, 0.34 M sucrose, 10%
glycerol, 1 mM DTT, protease and phosphatase inhibitors.
Solution B: 3 mM EDTA, 0.2 mM EGTA, 1 mM DTT, protease and phosphatase
inhibitors.
VI. Western blot
Western blot is a method that allows detecting a target protein in a sample after proteins
have been separated according to their molecular weight in a gel electrophoresis (commonly
SDS-PAGE). The polyacrylamide gel constitutes a cross linked polymer matrix and the
percentage of acrylamide gel determines its resolution. The lower the concentration of
acrylamide, the better the resolution for higher molecular weight proteins. Proteins can be
separated due to their molecular weight by preceding denaturation and exposure to SDS that
charges proteins negatively. In such conditions, proteins migrate through the gel in the
direction of positively charged electrode. Separated proteins form bands in a molecular
weight-dependent way. The lower molecular weight proteins migrate, the fastest, therefore,
they are present in the lower bands. To identify proteins of interest, molecular weight marker
that produces bands of known size is used. Separated proteins are transferred to a PVDF or
a nitrocellulose membrane by application of electric current. Once bound, they can be
detected and visualized by using specific antibodies (Gallagher, 2006).
Cell lysates were prepared as follows: cells were counted and washed once with DPBS.
Next, the pellet obtained after centrifugation for 5 min. at 1300rpm was resuspended in 2x
concentrated Laemmli buffer (100 μL Laemmli to 1x10⁶ cells). Then lysates were stored at -
20oC. In order to perform SDS-PAGE electrophoresis, DNA molecules were lysed by
benzonase, samples were boiled for 10 min and loaded on NuPAGE® 4-12% Bis-Tris Gel
with MES SDS running buffer or 3-8% Tris-Acetate with Tris-Acetate running buffer. The gel
ran for 35 minutes at 200V for the first case and 1h at 150V for Tris-Acetate gel.
The proteins were transferred to a nitrocellulose membrane in a transfer apparatus using
transfer buffer (for 75 min at 100V or 2h for γH2AX gel). After the transfer, the membrane
- 18 -
was blocked with 5% skimmed milk in TBS-T for 30 min at RT. The membrane was
incubated with the primary antibodies.
Subsequently, the membrane was washed 3x in TBS-Tween and incubated for 45 min at
RT with secondary antibodies. Afterwards, the membrane was washed 3x in TBS-T and
incubated in ECL solution for 5 min at RT. Finally, the membrane was exposed to ECL
Hyperfilm and the film was developed.
Western blot materials
TBS-T [20 mM Tris pH 7.5; 0.1% Tween, 150 mM NaCl]
NuPAGE® MES SDS Running Buffer [50 mM MES hydrate; 50 mM Tris base; 0.1% SDS;
1 mM EDTA]
Tris-acetate Running Buffer
Laemmli buffer (2x) [0.5 M Tris pH 6.8; 10% SDS; 25% glycerol, 5% β-mercaptoethanol,
bromophenol blue and water]
Transfer buffer [Tris 25 mM, pH 8.6; glycine 192 mM; 20% ethyl alcohol]
Complete protease inhibitor cocktail tablets (Roche)
SeeBlue® Plus 2 Prestained Protein Ladder (Invitrogen)
ECL solution: Super Signal® WestPico/Fento Chemiluminescent Substrate (Thermo
Scientific)
Ethyl alcohol 96% (API)
NuPAGE 4-12% Bis-Tris or 3-8% Tris-acetate Gel (Invitrogen)
Primary antibodies: mouse monoclonal IgG1 anti-phospho-Histone H2A.X (upstate),
rabbit anti-CTF18 (Bethyl), mouse anti-actin (Sigma), rabbit anti-Phospho-Chk1 serine 317
(Cell Signaling technology), rabbit polyclonal anti H3 (Abcam), rat monoclonal anti-tubulin
(Abcam), mouse monoclonal [DCS-310] to Chk1 (Abcam)
Secondary antibodies: anti-mouse IgG conjugated with HRP (Horse Radish Peroxidase),
anti-rabbit IgG-HRP (GE) and anti-rat.
VII. DNA combing
DNA combing is a method that uses an air/water meniscus to stretch and align individual
DNA molecules in a uniform way. In this process, DNA is bound to silanized glass surface by
its extremities. The method was invented by Bensimon in 1994 (Bensimon et al., 1994) and
involves two steps. In the first step DNA that is partially bound to the hydrophobic surface of
the silanized glass, with exposed vinylic groups (-CH=CH2). This attachment is possible due
to partial pH dependent denaturation of the DNA molecules at the extremities that expose
- 19 -
hydrophobic domains of the bases and promotes interaction with silanized surface
(Bensimon et al., 1994).
The second step is uniform stretching of DNA molecules. Bound and aligned molecules
are extended to 150% of its crystallographic length (extension factor 2 kb/μm), (Bensimon et
al., 1995). All DNA molecules are uniformly extended by being stretched by the water-air
meniscus that recedes with a constant speed of 200 μm/s and therefore exerts a constant
force on bound DNA molecules. Once DNA is attached to the glass, it is irreversibly fixed and
it doesn’t detach, even when rehydrated (Bensimon et al., 1994).
Silane/DNA binding is pH-dependent (Bensimon et al., 1994). At low pH, DNA bases
undergo intensive protonation which induces DNA melting that exposes the hydrophobic core
of DNA molecules. As a consequence, DNA molecules adsorb strongly and non-specifically,
and they are not extended by water-air meniscus. When pH increases, denaturation
becomes restricted to DNA extremities. The best pH at which DNA binds strongly and
specifically by its extremities is near 5.5 (Bensimon et al., 1994) .
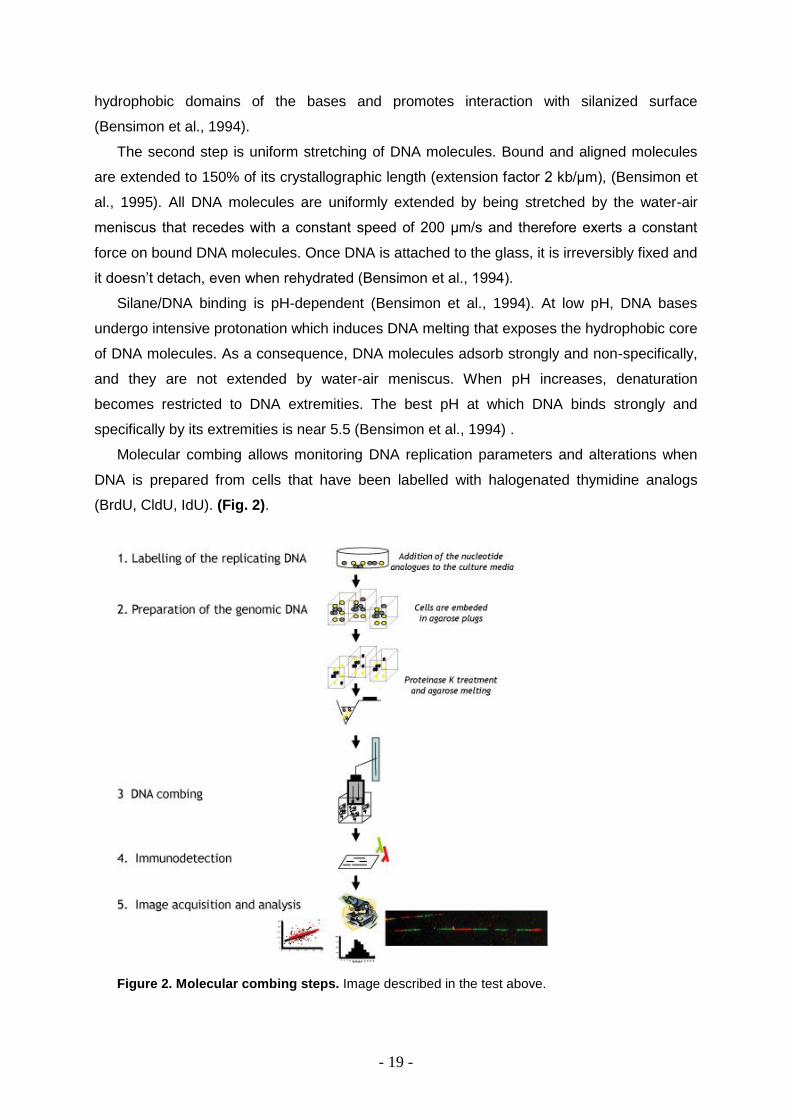
Molecular combing allows monitoring DNA replication parameters and alterations when
DNA is prepared from cells that have been labelled with halogenated thymidine analogs
(BrdU, CldU, IdU). (Fig. 2).
Figure 2. Molecular combing steps. Image described in the test above.
- 20 -
VII.I. Cell culture and IdU/CldU double labeling
Approximately three million cells per well containing 2 mL of supplemented DMEM
medium were plated in 6 well plate. 3 days later, when cells were approximately 70%
confluent, 10 μL of IdU (25 μM final) were added directly to the cells and cells were put back
in the incubator. After 10 min, 10 μL of CldU (200 μM final) were added for 20 min (at 37oC)
in asynchronous cells or for 2h in presence of HU.
Next, cells were trypsinized at 37oC, centrifuged with medium to inactivate trypsin and
resuspended in cold DPBS. Subsequently, cells were spun 3 min at 400 g and resuspended
in 1mL of cold DPBS. Cells were counted and adjusted to 2x10⁶ cells/mL, always on ice.
VII.II. Genomic DNA preparation and combing
Same volumes of 1% LMP agarose in DPBS and prewarmed cells (42oC) were gently
mixed. 100 μL of mix/plug was put into a casting mould and left for 25 min at room
temperature and for 5 min at 4o C to solidify. Next, plugs were transferred into a 15 mL
Falcon tube containing 0.5 mL/plug of PK buffer and incubated overnight at 50oC. As a result
of incubation in PK buffer, cells were lysed and DNA was released. Afterwards, plugs were
rinsed 5 times for 10 min each with TE50 and stored in TE50 at 4°C or processed for DNA
combing.
One plug was transferred in a 12 mL round-bottom tube and 100 μl of TE50 and 1.5 μl of
YOYO-1 (DNA staining agent with high signal to noise ratio) were added, keeping in the dark
for 30 min. Plug was washed 3 times for 5 min with TE50 with gentle shaking. TE50 was
removed and replaced for 3 mL of prewarmed 50 mM MES pH 5.7 at 65oC and incubated 30
min at 65oC in order to thaw the plug. Afterwards, the DNA solution was kept for 10 min at
RT to let the solution cool down. Subsequently, 3 μL of β-agarase (3 units) were added to the
solution, incubated overnight at 42oC and, after, at 65o for additional 10 min.
After cooling at RT, the DNA solution was transferred into a Teflon reservoir. A silanized
coverslip was incubated for 15 min in the DNA solution and then removed by a specialized
apparatus from the solution at the controlled, constant speed of 200 μm/s. DNA fibers were
checked under the microscope using a 40x objective and a FITC filter cube.
Next, the silanized coverslip with combed DNA was dried for 2 hours at 60o C and glued
with superglue on a microscope slide.
VII.III. Immuno-detection and microscopy
Slides were dehydrated for 3 min in successive baths of 70%, 90% and 100% EtOH in
Coplin jars. Combed DNA was denatured for 25 min in freshly prepared 1M NaOH and
subsequently washed 5 times for 1 min in PBS. Next, the coverslip was blocked for 15 min in

- 21 -
PBS-T-BSA. Afterwards, 18 μL of the primary antibody mix in PBS-T-BSA containing
SeraLab rat IgG anti-BrdU (1:20) for CldU detection and the Becton-Dickinson mouse IgG
anti-BrdU (1:20) for IdU detection was put on the coverslip with combed DNA, covered with a
clean coverslip and incubated for 45 min at 37o C in a humid chamber. After incubation, the
coverslip was removed and combed DNA was washed 5 times for 2 min with PBS-T. Then, a
mix of secondary antibodies in PBS-T-BSA containing chicken Anti-rat-Alexa488 (diluted
1:50) and the goat anti-mouse-Alexa546 (diluted 1:50) was put on the coverslip with combed
DNA, covered with a clean (naked) coverslip and incubated for 30 min at 37o C in humid
chamber. The naked coverslip was removed and the sample was washed 5 times for 2 min
in PBS-T. Afterwards, a mouse antibody against ssDNA was diluted 1:500 in PBS-T-BSA,
put on the sample and incubated for 30 min at 37o C. The sample was washed 5 times for 2
min in PBS-T. Goat anti-mouse IgG2a-Alexa647 was diluted 1:50 in PBS-T-BSA and
incubated with combed DNA for 30 min at 37o C. The sample was washed 5 times for 2 min
in PBS-T, mounted with 20 μL of anti-fade reagent and let to polymerize O/N at RT.
VII.IV. Image acquisition and analysis
Combed DNA was observed on a fluorescence microscope with 40x immersion objective,
using FITC, Cy3 and Cy5 filters. Slides were scanned for long, single DNA molecules and
then images were acquired.
Images were acquired in FITC/Cy3/Cy5 channels and were merged to generate RGB 16
bit images using MetaMorph software. Approximately 100 images per sample were taken.
Afterwards, pictures were analyzed by manual, onscreen measures to identify replication
patterns as well as forks velocity. For images acquired with Photometrics CoolSnap fx (1300
x 1030) CCD Camera (no binning) and 40x objective, one pixel corresponds to 340 bp of
DNA, owing to the constant stretching factor of 2 kb/μm.
DNA combing materials
25 mM IdU (Sigma) in DMSO
200 mM CldU (ICN) in water
Low Melting Point Agarose 1% in water (Sigma)
PK buffer: 10 mM Tris-HCl pH 7.5, 50 mM EDTA, 1% Sarkosyl, 2 mg/mL Proteinase K
Proteinase K (Roche) 20 mg/ml in water
TE50: 10 mM Tris-HCl pH 7.5, 50 mM EDTA
MES: 50 mM MES, pH 5.7; filtered
β-agarase I (1U/μl, New England Biolabs)
0.5 M NaOH freshly made
- 22 -
Phosphate-Buffered Saline (PBS) pH 7.5; filtered
PBS-T: PBS containing 0.1% Triton X-100
PBS-T-BSA: 1% Fraction V BSA (Roche) dissolved in PBS-T and filtered
YOYO-1 (Invitrogen)
Primary antibodies:
Rat anti-BrdU IgG (clone BU-75, AbCys OBT0030, for CldU)
Mouse anti-BrdU IgG (clone BD44, Becton Dickinson 347580, for IdU)
Mouse anti-ssDNA IgG (Chemicon, MAB3034)
Secondary antibodies:
Alexa488 Goat IgG anti-rat IgG (Molecular Probes)
Alexa546 Goat IgG anti-mouse IgG (Molecular Probes)
Alexa647 Goat IgG anti-mouse IgG2a (Molecular Probes)
Silanized coverslips
Microscope slides
Combing Apparatus (Pasteur Instruments)
Cyanoacrylate Glue (SuperGlue)
Round-bottom polypropylene tubes (14 ml, Falcon)
PFGE plug moulds (100 μL, Amersham Pharmacia)
Upright fluorescence microscope (Leica DMR 6000B) with FITC, Cy3 and Cy5 filter
blocks, equipped with a 40x objective (HCX PL APO 1.25-0.75) and a Photometrics
CoolSnap fx (1300 x 1030) CCD Camera
MetaMorph 7.1 software (Molecular Devices)
VIII. Flow cytometry analyses
This method allows simultaneous multiparametric analysis of the physical and/or
chemical characteristics of up to thousands of particles per second.
In this study, BrdU was added directly to the culture medium to achieve a final
concentration of 10 μM and the cells were incubated for 30 min in the CO2 incubator at 37oC.
After trypsinization, cells were washed twice in 1% BSA/PBS, spin at 1000rpm for 5 min and
resuspended in 200μl of DPBS on ice. 5 mL of 70% ethanol were slowly added to fix the
cells, a few drops at a time while maintaining the vortex. Next day, cells were centrifuged at
1000rpm for 5 min at 10oC and the supernatant was loosen by vortexing. 1 mL of 2N
HCl/Triton X-100 was added to the cells, a few drops at a time, while maintaining a vortex
and samples incubated at room temperature for 30 min, denaturing the DNA to produce

- 23 -
single-stranded molecules. Cells were centrifuged at 1000 rpm for 5 min, resuspended in
1mL of 0.1M Na2B4O7 .10H2O, pH 8.5, to neutralize the acid, centrifuged for 5 min and
resuspended in 1mL of 0.5% Tween 20/1%BSA/PBS. Cells were counted and the
concentration adjusted to achieve 1x10⁶cells/test. Cells were centrifuged for 5 min,
resuspended in 50 μL of Tween 20/BSA/PBS with the antibody Mouse anti-BrdU 1:10 for 30
min at room temperature, centrifuged again and incubated with the secondary antibody 1:200
goat anti-mouse FITC conjugated for 30 min at room temperature. Cells were centrifuged for
5 min at 500 x g and resuspended in 1mL of PBS containing 10μg/mL of propidium iodide.
Data were acquired both on a FACSCalibur (Becton Dickinson) as on FACS Coulter and
analyzed with Cell Quest software (Becton Dickinson).
Flow cytometry materials
BrdU (Sigma)
Mouse IgG1 anti-Human BrdU (BD biosciences)
FITC-conjugated anti-Mouse (BD biosciences)
FITC-conjugated anti-phospho-Histone H2A.X (Ser 139) (Millipore)

- 24 -
RESULTS
I. Downregulating CTF18 with siRNA in HCT116 cells
To characterize the role of CTF18 in DNA replication and checkpoint activation, the
strategy was to compare the phenotypes of control cells and CTF18-depleted cells. To
achieve the best CTF18 downregulation, cells were collected 1, 2 and 3 days after
transfection and analyzed by Western blotting (Figure 3). Four different CTF18 siRNAs
available on the market were tested using HiPerFect as transfection reagent. Different siRNA
concentrations (1, 5 and 10 nM) were also tested. The best CTF18 downregulation was
obtained with 10 nM and was used in the following experiments.
Day 1 Day 2 Day 3 KDa Day 1 Day 2 Day 3
Figure 3. Maximum downregulation of CTF18 is obtained at day 3 with si2 and si3. Cellular
extracts of non-transfected (NT) cells and cells transfected with Control (C) and CTF18 siRNAs 24h
after plating, were prepared and collected at different times as indicated (first, second and third day
after transfection) and the expression of CTF18 was analyzed by Western blotting and quantified
using β-actin to normalize.
CTF18 siRNAs 1, 2 and 3 were used to select the transfection reagent (HiPerFect or
INTERFERinTM) allowing the strongest downregulation with the lower rate of cell mortality.
The most suitable reagent was INTERFERinTM (Figure 4).
HiPerFect INTERFERinTM
Figure 4. Higher CTF18 downregulation is obtained with INTERFERinTM
and with si1 and 2.
CTF18 expression was analyzed by Western blotting and si2 was the most efficient, followed by si1 in
INTERFERinTM
mediated downregulation. Transfections were performed 24h after plating.
Lower exposure
C si2 si3 C si1 si2 si3
CTF18
β-actin
CTF18
β-actin
NT C si1 si2 NT C si1 si2 NT C si1 si2 NT C si3 si4 NT C si3 si4 NT C si3 si4
107
45

- 25 -
To increase CTF18 downregulation, a double transfection was performed (0h and 24h
after plating) in the same conditions, either with the same siRNA (n°2), or with the two most
efficient siRNAs (n°1 and 2). Transfection with the same siRNA was more successful (Figure
5).
C si2+2 si2+1
Figure 5. Double transfection with different siRNAs is not more efficient than with the same.
Proteins expression was analyzed by Western blot with cellular extracts obtained after 3 days of cell
culture and cells transfected with control siRNA were also transfected twice with INTERFERinTM
.
The optimal conditions of transfection, which were used for the subsequent experiments,
are then the double transfection with the same siRNA (n°2) and the use of INTERFERinTM as
transfection reagent.
Studies in yeast have shown that the bulk of CTF18 protein associates with chromatin
even in the absence of replication stress. To test whether it is also the case in human cells,
control cells were treated with HU. Cytoplasmic, soluble nuclear and chromatin fractions
were extracted and analyzed by Western blotting (Figure 6). Hydroxyurea selectively inhibits
ribonucleoside diphosphate reductase, an enzyme required to convert ribonucleoside
diphosphates into deoxyribonucleoside diphosphates, thereby slowing down replication forks
by depleting dNTP pools. This analysis revealed that CTF18 is essentially found in the
chromatin fraction, even in unchallenged growth conditions. Importantly, our siRNA approach
is able to deplete CTF18 from the chromatin fraction, even in the presence of HU (Figure 6).
Figure 6. Predominant chromatin localization of CTF18; chromatin depletion is efficient
with and without replicative stress (HU). A: total cell extract; C: control siRNA; si: CTF18 siRNA.
Tubulin and histone H3 were used to verify purity of fractions and 2mM of HU were added to test and
exclude possible differences in CTF18 depletion in the presence of replicative stress.
CTF18
Tubulin
H3
KDa
107
~ 55
20
Ctf18
β-actin
Cytoplasm Nuclear Chromatin
A C si C si C si HU - + - + - + - + - + - +

- 26 -
II. Effect of CTF18 downregulation in cell cycle progression
Cell cycle analysis by flow cytometry allows us to detect differences in replication profiles
by analyzing thymidine analogs and propidium iodide incorporations. In this study, BrdU
incorporation was measured in Control and CTF18-depleted cells to determine the
percentage of replicating cells. No significant differences in cell cycle profiles were observed
(Figure 7), indicating that cells with less CTF18 have a normal cell cycle in the absence of
exogenous replication stress.
Control siRNA CTF18 siRNA
Figure 7. Flow cytometry analysis of cell cycle distribution in control and CTF18-depeleted
cells. The cell cycle was analyzed by flow cytometry after 3 days of cell culture for control and siRNA.
The DNA amount is measured by propidium incorporation – G0/G1 (2n) and G2/M (4n) – and the cells
that replicate are BrdU positive (orange). I: S phase; J: G2 phase; L: G1 phase
III. Analysis of replication fork progression by DNA combing
Next, we checked whether CTF18 depletion affects the progression of replication forks in
the presence or the absence of replication stress. To this end, we pulse-labeled control and
CTF18-depleted cells with BrdU analogues and we used the DNA combing technique to
measure the distance covered by individual forks along stretched DNA fibers, as described in
Materials and Methods. This analysis revealed that without replicative stress, replication rate
is approximately the same after CTF18 depletion, being 1.26 kb/min, compared to 1.20
kb/min in non depleted cells; the difference is not statistically significant. In presence of HU
PI
Brd
U

- 27 -
(replicative stress), the speed of the forks is slower in CTF18 depleted cells, being this
difference significant. (Figure 8).
(a)
(b)
(c) (d)
0 10 20 30 40
si
C
CldU tracks (kb)
0 10 20 30 40
si HU
C HU
CldU tracks (kb)
Figure 8. Replication fork progression is slower in cells treated with CTF18 siRNA and HU.
a) Bidirectional replication forks. Cells were incubated first with IdU (red) than with CldU (green). At
the time of the first incubation, the replication origin was fired and IdU was incorporated. b) Inter-origin
distances. IdU was added to the cell culture medium for 10 min to mark origins of replication before
adding CldU for 20 minutes in non-treated cells (c) and for 2h together with 1mM HU in treated cells
(d). DNA fibers were analyzed by DNA combing. Box plots represent the distribution of CldU tracks
length in kb and median CldU length is indicated on the right. ns: non-significant; **: P<0.001.
IV. Checkpoint activation
In budding yeast, CTF18 is essential for the activation of the DNA replication checkpoint
in response to HU. To check whether it is also the case in human cells, HCT116 cells were
transfected with siRNAs as described previously and extracts were analyzed by Western
blotting after HU exposure (Figure 9). As read-out for checkpoint activation, phosphorylation
of the protein kinase CHK1 on serine 317 was used in the following experiments. For both
Control and CTF18 depleted cells, the same extent of CHK1 phosphorylation was detected in
the presence of HU, indicating complete checkpoint activation (Figure 9). In IMR90 cells, the
same results were observed (data not shown).
(kb)
12
12.6
**
ns
(kb)
20
15.5
ns

- 28 -
Ø HU
C si C si
Figure 9. CHK1 is efficiently phosphorylated in HU-treated CTF18-depleted cells. HCT116
cells were treated with 1 mM HU for 2h to achieve a full activation of the replication checkpoint. C:
Control siRNA; si: CTF18 siRNA. β-actin is used as loading control.
Next, we reasoned that CTF18 could be dispensable for checkpoint activation with a high
dose and long exposure to HU, but could be required at lower doses. To test this possibility,
we next tested the kinetics of CHK1 phosphorylation with a lower HU concentration (Figure
10). Intriguingly, we found that CHK1 is more rapidly phosphorylated in CTF18 siRNA cells
than in control cells. After 15 minutes, checkpoint activation is similar in both conditions.
Since fork progression is affected in HU-treated cells depleted for CTF18 (Figure 8), this
faster checkpoint activation could reflect an increased rate of fork collapse in these cells.
C CTF18 siRNA
Figure 10: The replication checkpoint is more rapidly activated in CTF18 depleted cells.
HCT116 cells were treated with 0.1 mM HU for 5, 10 and 15 minutes and CHK1 phosphorylation on
S317 was monitored by western blot as indicated above.
The absence of checkpoint defect in human cells depleted in CTF18 contrasts with the
critical role of yeast CTF18 in the DRC pathway (Crabbé et al., in press). To check whether
this difference is due to residual levels of CTF18 in siRNA-treated cells, we monitored CFT18
levels and checkpoint activation in different cell types, with different p53 status, before or
after siRNA treatment (Figure 11). This analysis revealed that although CTF18 levels are
60% lower in HeLa cells than in other cell lines, CTF18 depletion was less efficient in HeLa
cells. Consequently CHK1 phosphorylation was roughly identical in the various cell types
with 0.1 mM HU for 5, 10 and 15 minutes (data not shown) or without HU treatment (Figure
11).
γH2AX
β-actin
Ø 5’ 10’ 15’ Ø 5’ 10’ 15’
Chk1-P
β-actin
KDa
~55
Ctf18
Chk1-P
Chk1
β-actin

- 29 -
(a)
(b) CTF18 levels before and after transfection
Figure 11. CTF18 amount is slighter in HeLa cells, but its downregulation is more efficient
in HCT116 cell line. No differences in checkpoint activation without HU are observed in the
range of cell types. Cells were transfected one day after plating because the mortality when
transfected at the same time as plating was very high (except for HCT116) and cellular extracts were
analyzed by Western blotting. (a) CTF18 and Chk1-P expressions; normalization was done to β-actin.
(b) Blue bars: quantification of CTF18 having as reference HCT116 cell line (compared to 1.0); violet
bars: CTF18 percentage left after transfection - smaller in HCT116 cell line, followed by HeLa, U2OS
and HEK293T cells. Graphics are based in (a).
V. DNA damage
As CTF18-depleted cells show a delay in fork progression (Figure 8 d) and premature
checkpoint activation (Figure 10) in presence of HU, we next checked whether CTF18
depletion increases DNA damage at forks. If it is the case, this would suggest that CTF18
acts at the replisome to prevent fork collapse in presence of HU.
As a marker of DNA damage, we monitored the levels of γ-H2AX, a histone variant that is
phosphorylated by ATR at chromosome breaks. Quantification of γ-H2AX levels by Western
blotting revealed a slight but reproducible increase in the presence of HU in CTF18-depleted
cells (Figure 12), supporting the view that CTF18 prevents fork collapse induced by HU.
HCT116 HeLa HEK U2OS C si C si C si C si
CTF18
Chk1-P
β-actin
HCT116 HeLa HEK U2OS C si C si C si C si
0,00
0,20
0,40
0,60
0,80
1,00
1,20
1 2 3 4
Série1
Série2
HCT116 HeLa HEK293T U2OS
- 30 -
Ø HU
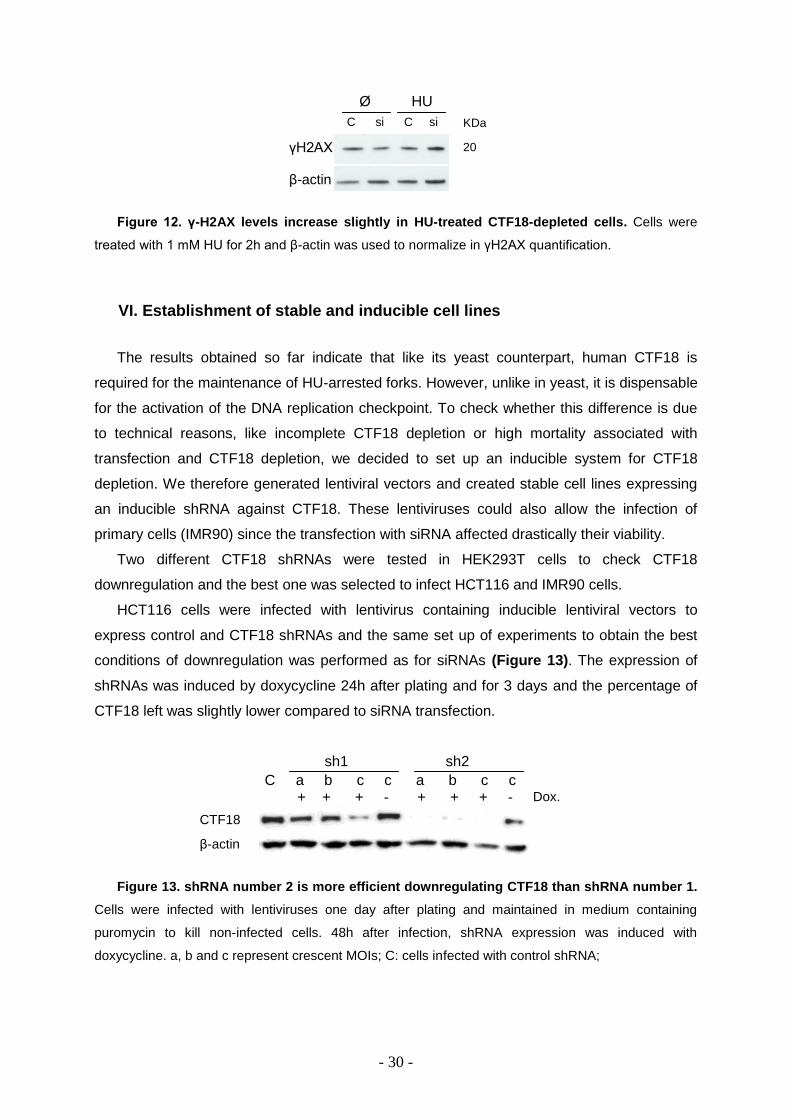
Figure 12. γ-H2AX levels increase slightly in HU-treated CTF18-depleted cells. Cells were
treated with 1 mM HU for 2h and β-actin was used to normalize in γH2AX quantification.
VI. Establishment of stable and inducible cell lines
The results obtained so far indicate that like its yeast counterpart, human CTF18 is
required for the maintenance of HU-arrested forks. However, unlike in yeast, it is dispensable
for the activation of the DNA replication checkpoint. To check whether this difference is due
to technical reasons, like incomplete CTF18 depletion or high mortality associated with
transfection and CTF18 depletion, we decided to set up an inducible system for CTF18
depletion. We therefore generated lentiviral vectors and created stable cell lines expressing
an inducible shRNA against CTF18. These lentiviruses could also allow the infection of
primary cells (IMR90) since the transfection with siRNA affected drastically their viability.
Two different CTF18 shRNAs were tested in HEK293T cells to check CTF18
downregulation and the best one was selected to infect HCT116 and IMR90 cells.
HCT116 cells were infected with lentivirus containing inducible lentiviral vectors to
express control and CTF18 shRNAs and the same set up of experiments to obtain the best
conditions of downregulation was performed as for siRNAs (Figure 13). The expression of
shRNAs was induced by doxycycline 24h after plating and for 3 days and the percentage of
CTF18 left was slightly lower compared to siRNA transfection.
sh1 sh2
Figure 13. shRNA number 2 is more efficient downregulating CTF18 than shRNA number 1.
Cells were infected with lentiviruses one day after plating and maintained in medium containing
puromycin to kill non-infected cells. 48h after infection, shRNA expression was induced with
doxycycline. a, b and c represent crescent MOIs; C: cells infected with control shRNA;
γH2AX
β-actin
KDa
20
C a b c c a b c c + + + - + + + -
CTF18
β-actin
γH2AX β-actin
C si C si
Dox.

- 31 -
VII. Checkpoint activation following shRNA downregulation
To check whether CTF18 is required for the activation of the DNA replication checkpoint,
cellular extracts were analyzed by Western blotting and amount of CHK1 phosphorylated on
serine 317 was measured as read-out. No significant difference was observed between
control and CTF18-depleted cells (Figure 17).
C sh C sh
Figure 17. No significant differences between Control and CTF18 depleted cells in
checkpoint activation with or without HU treatment. Cells were treated with 1 mM HU for 2h. C:
Control shRNA; sh: CTF18 shRNA. β-actin was used to normalize. We can see accumulation of Chk1
phosphorylated in presence of HU (activation of checkpoint) for both Control and CTF18 depleted cells
in approximately the same amount. Similarly, no significant differences are observed for Chk1-P
amount without HU treatment (Ø).
These data recapitulate the results obtained with siRNA-transfected cells and indicate
that a severe depletion of CTF18 induced either by transient siRNA transfection or by
induction of shRNA using lentiviral vectors does not significantly affect CHK1 activation with
and without replication stress.
VIII. Cell cycle progression after inducible downregulation of CTF18
Like for siRNA, cell cycle profiles were analyzed by flow cytometry firstly without applying
stress (Figure 14) and additionally, after HU (Figure 15) and mimosine (Figure 16) arrests.
Treatment with mimosine, as performed, results in a population synchronized in late G1
phase (Krude, 1999). Thus, we can observe if cells restart their cycle the same way when
CTF18 is depleted after the synchronization.
The differences in the cell cycle phases between Control and CTF18 depleted cells are
not substantial, showing that, probably, without any replicative stress, cells with less CTF18
progress normally through the cell cycle (Figure 14).
CTF18
Chk1-P
β-actin
Ø HU

- 32 -
0 200 400 600 800 1000FL3-H
si brdu
R3R4
R5
0 200 400 600 800 1000FL3-H
C 20h HU
R3
0 200 400 600 800 1000FL3-H
sh 20h HU
R3
Control shRNA CTF18 shRNA
Figure 14. CTF18 depletion induced by lentiviral vectors does not affect cell cycle
progression. The cell cycle was analyzed by flow cytometry for Control and CTF18 shRNAs. The
DNA amount is measured by propidium incorporation – G0/G1 (2n) and G2/M (4n) – FL3-H; The cells
that replicate are BrdU positive (Y-axis). R3: G1 phase; R4: G2 phase; R5: S phase.
To test whether CTF18 depletion affects recovery after an HU arrest, control and CTF18-
deficient cells were arrested in HU for 20h and released for a time course experiment
(Figure 15). The beginning of the release seems to be similar for both cases, but differences
are observed around 4h and 6h. CTF18-depleted samples show more cells in late S and
G2/M. One day after release, we observed an accumulation in G1 of CTF18-depleted cells,
suggesting that they have problems to enter the following cell cycle.
C 20h HU sh 20h HU
0 200 400 600 800 1000FL3-H
C 20h HU
150
120
90
60
30
0 200 400 600 800 1000FL3-H
sh 20h HU 140
120
100
80
60
40
20
BrdU
14%
23%
62%
77% 76%
0 200 400 600 800 1000FL3-H
cont brdu
R3R4
R522%
15%
63%
22%
16%
62%
- 33 -
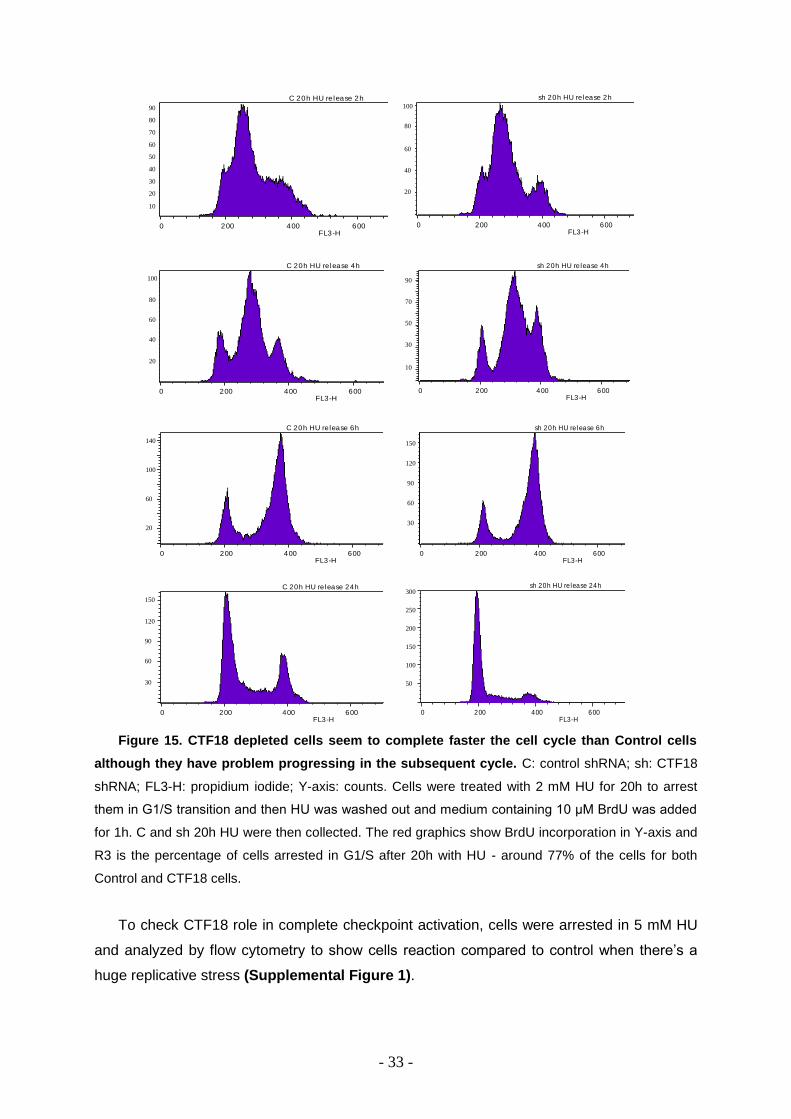
Figure 15. CTF18 depleted cells seem to complete faster the cell cycle than Control cells
although they have problem progressing in the subsequent cycle. C: control shRNA; sh: CTF18
shRNA; FL3-H: propidium iodide; Y-axis: counts. Cells were treated with 2 mM HU for 20h to arrest
them in G1/S transition and then HU was washed out and medium containing 10 μM BrdU was added
for 1h. C and sh 20h HU were then collected. The red graphics show BrdU incorporation in Y-axis and
R3 is the percentage of cells arrested in G1/S after 20h with HU - around 77% of the cells for both
Control and CTF18 cells.
To check CTF18 role in complete checkpoint activation, cells were arrested in 5 mM HU
and analyzed by flow cytometry to show cells reaction compared to control when there’s a
huge replicative stress (Supplemental Figure 1).
0 200 400 600 800 1000FL3-H
C 20h HU release 2h
90
80
70
60
50
40
30
20
10
0 200 400 600 800 1000FL3-H
sh 20h HU release 2h
100
80
60
40
20
0 200 400 600 800 1000FL3-H
C 20h HU release 4h
100
80
60
40
20
0 200 400 600 800 1000FL3-H
sh 20h HU release 4h
90
70
50
30
10
0 200 400 600 800 1000FL3-H
C 20h HU release 24h
150
120
90
60
30
0 200 400 600 800 1000FL3-H
sh 20h HU release 24h300
250
200
150
100
50
0 200 400 600 800 1000FL3-H
C 20h HU release 6h
140
100
60
20
0 200 400 600 800 1000FL3-H
sh 20h HU release 6h
150
120
90
60
30
- 34 -
The plant amino acid and iron chelator mimosine can induce a cell cycle arrest of human
somatic cells in late G1 phase, before establishment of active DNA replication. Treatment of
asynchronously proliferating cells for 24h with 0.5 mM mimosine, as performed, results in a
population synchronized in late G1 phase.
The mimosine arrest allowed to see a slight increase in G2 phase in depleted cells at 6h
after release but then the kinetics of the cell cycle seemed to be as in control cells
(Supplemental Figure 2).
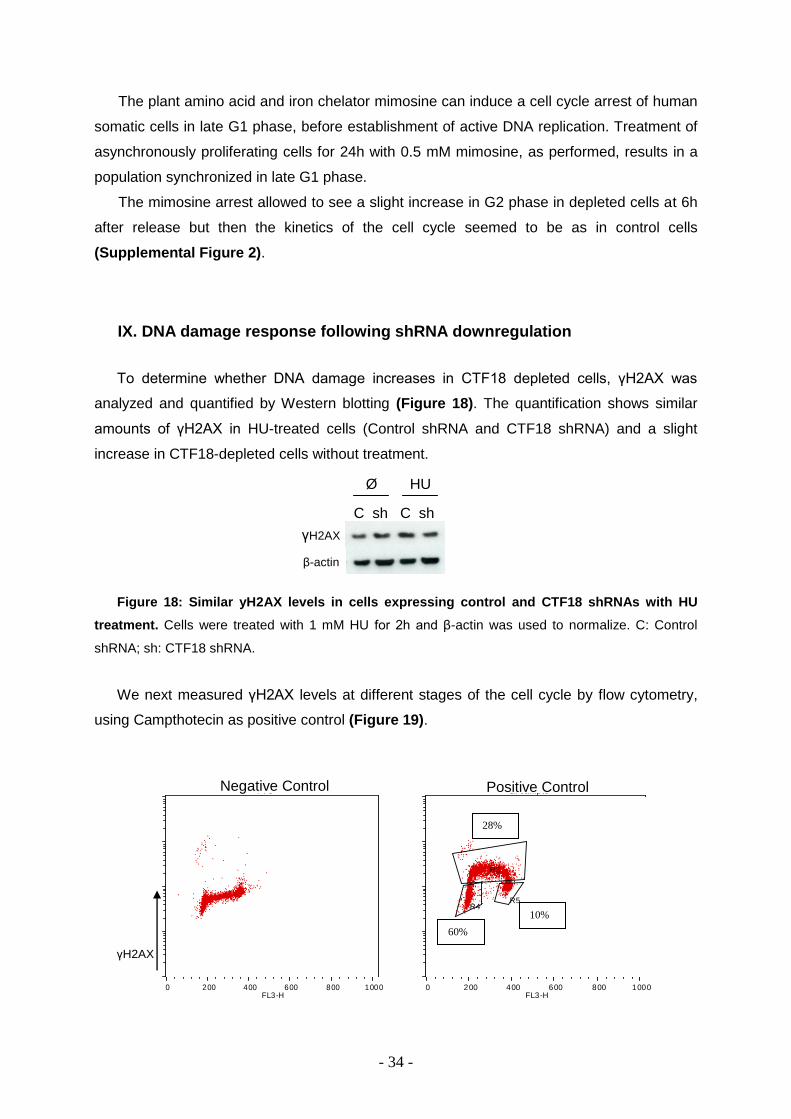
IX. DNA damage response following shRNA downregulation
To determine whether DNA damage increases in CTF18 depleted cells, γH2AX was
analyzed and quantified by Western blotting (Figure 18). The quantification shows similar
amounts of γH2AX in HU-treated cells (Control shRNA and CTF18 shRNA) and a slight
increase in CTF18-depleted cells without treatment.
Figure 18: Similar yH2AX levels in cells expressing control and CTF18 shRNAs with HU
treatment. Cells were treated with 1 mM HU for 2h and β-actin was used to normalize. C: Control
shRNA; sh: CTF18 shRNA.
We next measured γH2AX levels at different stages of the cell cycle by flow cytometry,
using Campthotecin as positive control (Figure 19).
Ø HU
C sh C sh
γH2AX
β-actin
γH2AX
0 200 400 600 800 1000FL3-H
PI CNegative Control
0 200 400 600 800 1000FL3-H
sh campto
R3
R4R5
Positive Control
28%
10%
60%
- 35 -
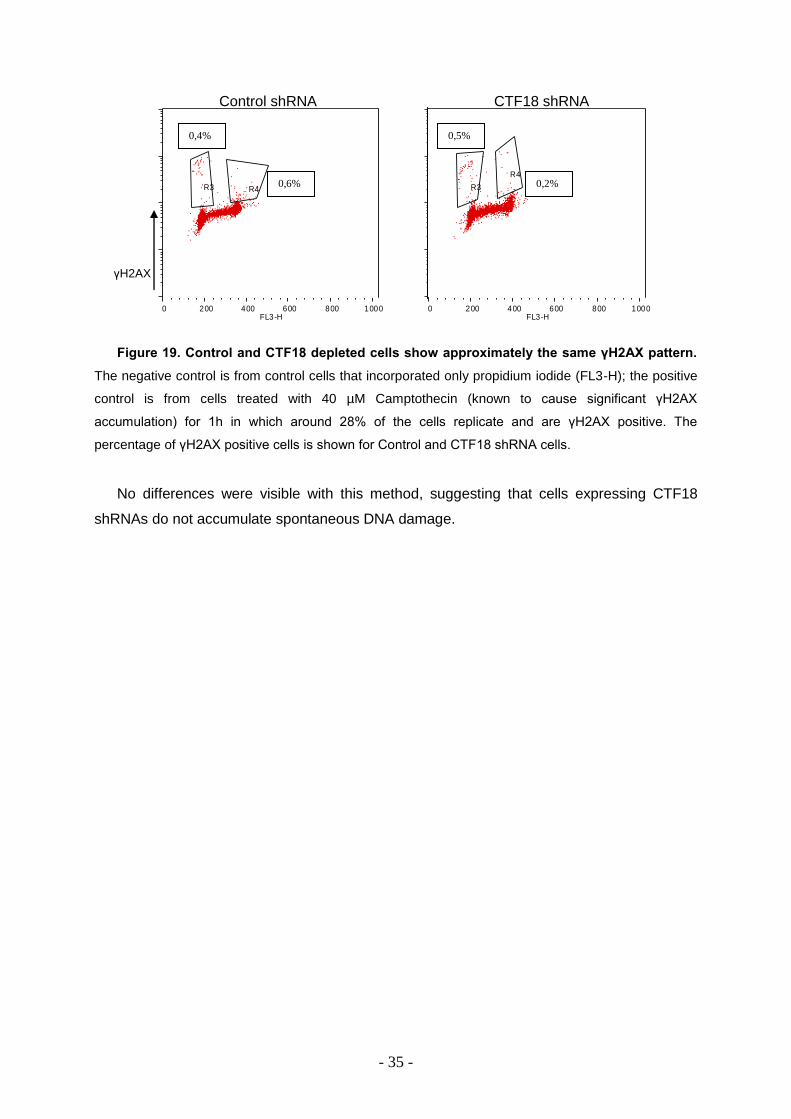
Figure 19. Control and CTF18 depleted cells show approximately the same γH2AX pattern.
The negative control is from control cells that incorporated only propidium iodide (FL3-H); the positive
control is from cells treated with 40 µM Camptothecin (known to cause significant γH2AX
accumulation) for 1h in which around 28% of the cells replicate and are γH2AX positive. The
percentage of γH2AX positive cells is shown for Control and CTF18 shRNA cells.
No differences were visible with this method, suggesting that cells expressing CTF18
shRNAs do not accumulate spontaneous DNA damage.
0 200 400 600 800 1000FL3-H
gh2ax cont
R3 R4
0 200 400 600 800 1000FL3-H
gh2ax sh
R3
R4
γH2AX
Control shRNA CTF18 shRNA
0,4%
0,6%
0,5%
0,2%
- 36 -
DISCUSSION
RFC-CTF18 is a RFC-like complex involved in the establishment of sister-chromatid
cohesion. Recent results from our lab indicate that CTF18 also plays a key role in the
activation of the DNA replication checkpoint and in the maintenance of stalled forks. In this
study, I have tested whether these novel functions are conserved in human cells. I have
shown that, like in yeast, human CTF18 is associated with chromatin even in the absence of
replication stress imposed by HU and is required for normal fork progression in the presence
of HU (see below). However, unlike in yeast, I was unable to detect significant differences in
checkpoint activation when depleting CTF18 with siRNAs. These data suggest either that
CTF18 does not play the same checkpoint function in human cells. Alternatively, the
experimental conditions used could be inappropriate to reveal this function. For instance, it
could be that the amount of CTF18 left after RNA interference is sufficient to perform its
checkpoint function. Full CTF18 depletion is more difficult to achieve in human cells than in
budding yeast. Indeed, unlike in yeast, the human CTF18 gene is essential for viability and
cannot be deleted. Although I was able to largely deplete CTF18 using RNA interference, I
was unable to fully deplete the protein, with the exception of primary cells in which CFT18
depletion was highly toxic. Moreover, the stable and inducible cell lines containing shRNA
vectors obtained after lentivirus production did not appear to be more efficient in
downregulating CTF18 than siRNA transfections.
Another explanation could be that human CTF18 is indeed involved in the DNA
replication checkpoint response, but DRC defect in CTF18-depleted cells is masked by the
DNA damage response induced by fork collapse. Indeed, studies in budding yeast have
shown that ctf18 cells accumulate DNA damage in HU and elicit a robust DNA damage
checkpoint response (Crabbé et al., in press). Whether it is also the case in human cells is
difficult to demonstrate as, unlike in yeast, the DDC and DRC pathways are highly
intertwined and cannot be functionally separated. Further experiments are therefore required
to determine whether or not CTF18 mediates the DNA replication response in human cells,
as it does in budding yeast. For instance, depleting another member of the CTF18-RFC
complex (DCC1 or CTF8) could help answer some of these questions. The Jallepali lab has
recently shown that with CTF18, cells completely depleted for DCC1 are viable (Terret et al.,
2009). These data also suggest that the proteins of this complex have distinct roles in the
cell.
Interestingly, I observed a faster induction of the DRC in CTF18-deficient HCT116 cells
(in which the higher efficiency of transfection is achieved) exposed to HU, which could reflect

- 37 -
increased replication fork collapse under replication stress. To test this possibility, I have
used the DNA combing technique to determine whether CTF18 is required for normal fork
progression and/or for fork recovery after a genotoxic stress. In cells transfected with siRNAs
against CTF18, I found that forks are slower in the presence of HU, which is reminiscent of
what was observed for yeast ctf18 mutants (Crabbé et al, in press). These data suggest
that human CTF18 could be implicated in the maintenance of stalled forks. I also observed a
slight but reproducible increase of γH2AX in the presence of stress in cells transfected with
CTF18 siRNA, which is consistent with my DNA combing results. These data suggest that
replication forks are less stable in CTF18-deficient cells exposed to HU and that damaged
forks induce a faster checkpoint activation.
Recently, our lab was involved in a large-scale study aiming at identifying DNA replication
genes whose expression is altered in lung cancer cells. This analysis revealed a lower
expression of CTF18 in >60% of the patients, which could mean that CTF18 downregulation
contributes to cancer development. Another way to address this possibility is to downregulate
CTF18 in a cell line overexpressing the ras oncogene (already established in our lab) and
check whether or not CTF18 is required to prevent genomic instability during oncogene-
induced hyperproliferation.
The fact that CTF18 is not equally expressed in the various cancer cells and primary cells
can enlighten some of the differences observed in CHK1 and γH2AX expressions. The ratio
between CTF18 and other proteins in the cell can also interfere with its task in the cell, which
can alternate between, for instance, its other role in the cell on sister-chromatid cohesion or
the role mentioned above in maintaining stability of replicative forks.
Altogether, these results suggest that, as in yeast, human CTF18 plays a key role at the
replication fork in the presence of replicative stress. Further experiments are required to
define this function more precisely.
- 38 -
REFERENCES
Aguilera, A., and Gomez-Gonzalez, B. (2008). Genome instability: a mechanistic view of
its causes and consequences. Nat Rev Genet 9, 204-217.
Bartkova, J., Horejsi, Z., Koed, K., Kramer, A., Tort, F., Zieger, K., Guldberg, P.,
Sehested, M., Nesland, J. M., Lukas, C., et al. (2005). DNA damage response as a candidate
anti-cancer barrier in early human tumorigenesis. Nature 434, 864-870.
Bell, S. P., and Dutta, A. (2002). DNA REPLICATION IN EUKARYOTIC CELLS.
Annu Rev Biochem 71, 333-374.
Bensimon, A., Simon, A., Chiffaudel, A., Croquette, V., Heslot, F., and Bensimon, D.
(1994). Alignment and sensitive detection of DNA by a moving interface. Science 265, 2096-
2098.
Bensimon, D., Simon, A. J., Croquette, V. V., and Bensimon, A. (1995). Stretching DNA
with a receding meniscus: Experiments and models. Physical Review Letters 74, 4754-4757.
Branzei, D., and Foiani, M. (2007). Interplay of replication checkpoints and repair
proteins at stalled replication forks. DNA Repair 6, 994-1003.
Diffley, J. F. (2004). Regulation of early events in chromosome replication. Curr Biol 14,
R778-786.
Gambus, A., Jones, R. C., Sanchez-Diaz, A., Kanemaki, M., van Deursen, F., Edmondson,
R. D., and Labib, K. (2006). GINS maintains association of Cdc45 with MCM in replisome
progression complexes at eukaryotic DNA replication forks. Nat Cell Biol 8, 358-366.
Gorgoulis, V. G., Vassiliou, L. V., Karakaidos, P., Zacharatos, P., Kotsinas, A., Liloglou,
T., Venere, M., Ditullio, R. A., Jr., Kastrinakis, N. G., Levy, B., et al. (2005). Activation of
the DNA damage checkpoint and genomic instability in human precancerous lesions. Nature
434, 907-913.
Halazonetis, T. D., Gorgoulis, V. G., and Bartek, J. (2008). An Oncogene-Induced DNA
Damage Model for Cancer Development. Science 319, 1352-1355.
Holm, C. (1994). Coming undone: how to untangle a chromosome. Cell 77, 955-957.
Ivessa, A. S., Lenzmeier, B. A., Bessler, J. B., Goudsouzian, L. K., Schnakenberg, S. L.,
and Zakian, V. A. (2003). The Saccharomyces cerevisiae helicase Rrm3p facilitates
replication past nonhistone protein-DNA complexes. Mol Cell 12, 1525-1536.
- 39 -
Johnson, A., and O'Donnell, M. (2005). CELLULAR DNA REPLICASES: Components
and Dynamics at the Replication Fork. Annual Review of Biochemistry 74, 283-315.
Krude, T. (1999). Mimosine arrests proliferating human cells before onset of DNA
replication in a dose-dependent manner. Exp Cell Res 247, 148-159.
Lengronne, A., McIntyre, J., Katou, Y., Kanoh, Y., Hopfner, K. P., Shirahige, K., and
Uhlmann, F. (2006). Establishment of Sister Chromatid Cohesion at the S. cerevisiae
Replication Fork. Mol Cell 23, 787-799.
Machida, Y. J., Hamlin, J. L., and Dutta, A. (2005). Right Place, Right Time, and Only
Once: Replication Initiation in Metazoans. Cell 123, 13-24.
Michalet, X., Ekong, R., Fougerousse, F., Rousseaux, S., Schurra, C., Hornigold, N., van
Slegtenhorst, M., Wolfe, J., Povey, S., Beckmann, J. S., and Bensimon, A. (1997). Dynamic
molecular combing: stretching the whole human genome for high- resolution studies. Science
277, 1518-1523.
Mollenbeck, M., Postberg, J., Paeschke, K., Rossbach, M., Jonsson, F., and Lipps, H. J.
(2003). The telomerase-associated protein p43 is involved in anchoring telomerase in the
nucleus. J Cell Sci 116, 1757-1761.
Mossi, R., Ferrari, E., and Hubscher, U. (1998). DNA ligase I selectively affects DNA
synthesis by DNA polymerases delta and epsilon suggesting differential functions in DNA
replication and repair. J Biol Chem 273, 14322-14330.
Pasero, P., and Schwob, E. (2000). Think global, act local--how to regulate S phase from
individual replication origins. Curr Opin Genet Dev 10, 178-186.
Takisawa, H., Mimura, S., and Kubota, Y. (2000). Eukaryotic DNA replication: from pre-
replication complex to initiation complex. Curr Opin Cell Biol 12, 690-696.
Terret, M. E., Sherwood, R., Rahman, S., Qin, J., and Jallepalli, P. V. (2009). Cohesin
acetylation speeds the replication fork. Nature 462, 231-234.
Tourriere, H., and Pasero, P. (2007). Maintenance of fork integrity at damaged DNA and
natural pause sites. DNA Repair 6, 900-913.
Tourriere, H., Versini, G., Cordon-Preciado, V., Alabert, C., and Pasero, P. (2005). Mrc1
and tof1 promote replication fork progression and recovery independently of Rad53. Mol Cell
19, 699-706.
Tuduri, S., Crabbe, L., Conti, C., Tourriere, H., Holtgreve-Grez, H., Jauch, A., Pantesco,
V., De Vos, J., Theillet, C., Pommier, Y., et al. (2009). Topoisomerase 1 suppresses
replication stress and genomic instability by preventing interference between replication and
transcription. Nat Cell Biol 11, 1315-1324.
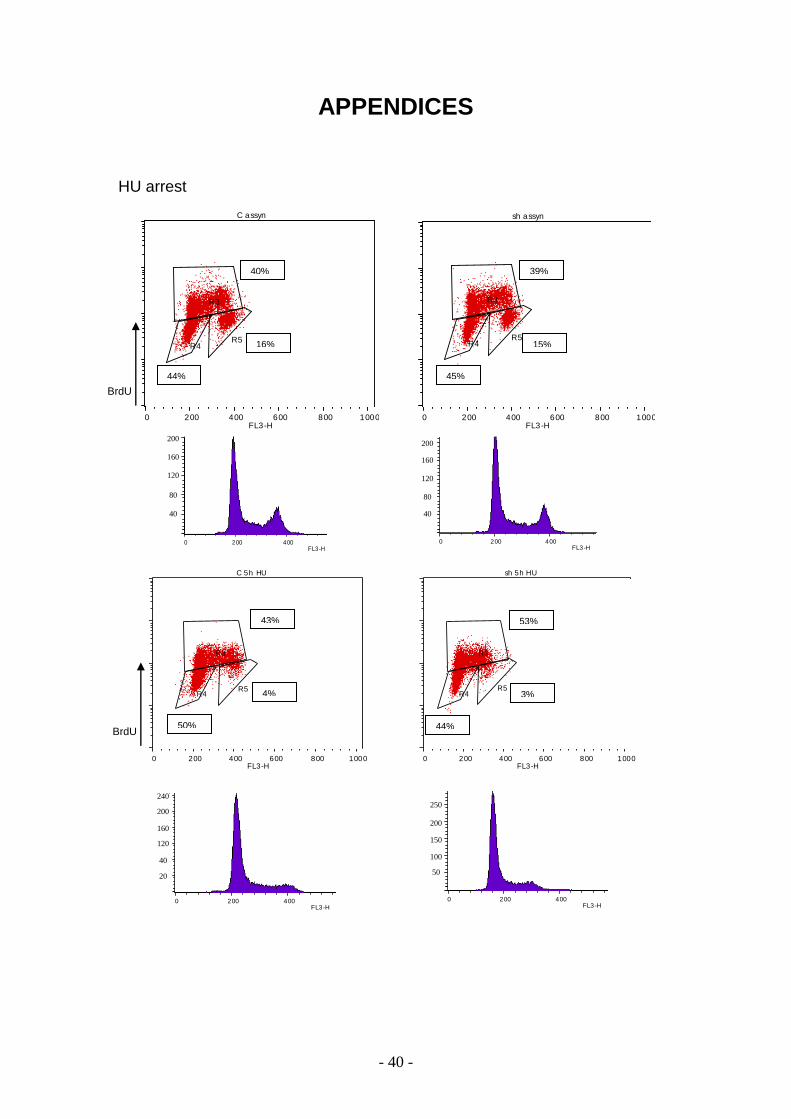
- 40 -
0 200 400 600 800 1000FL3-H
sh assyn
APPENDICES
HU arrest
0 200 400 600 800 1000FL3-H
sh 5h HU
R3
R4R5
0 200 400 600 800 1000FL3-H
C 5h HU
R3
R4R5
43%
4%
50%
53%
3%
44%
0 200 400 600 800 1000FSC-H
C assyn
0 200 400 600 800 1000FL3-W
C assyn
R1
0 200 400 600 800 1000FL3-H
C assyn
0 200 400 600 800 1000FL3-H
C assyn
R3
R4R5
Region Statistics
Fi le : C assyn Log Data Uni ts: L inear Values
Sam ple ID: cont 0 Patient ID:
T ube: Unti tled Panel: Unti tled Acquisi tion Tube L ist
Acquisi tion Date: 18-Aug-10 Gate: G1
Gated Events: 10000 T ota l Events: 14497
X Param eter: FL3-H (Linear) Y Param eter: FL1-H (Log)
Region Events % Gated % T ota l X M ean X Geo M ean
R2 10000 100.00 68.98 249.39 240.01
R1 10000 100.00 68.98 249.39 240.01
R3 3985 39.85 27.49 264.00 257.81
R4 4242 42.42 29.26 193.29 192.66
R5 1452 14.52 10.02 365.08 364.49
200
160
120
80
40
200
160
120
80
40
0 200 400 600 800 1000FL3-H
C 5h HU
0 200 400 600 800 1000FL3-H
sh 5h HU
240
200
160
120
40
20
250
200
150
100
50
BrdU
BrdU
0 200 400 600 800 1000FL3-H
C assyn
R3
R4R5
40%
16%
44%
0 200 400 600 800 1000FL3-H
sh assyn
R3
R4R5
39%
15%
45%
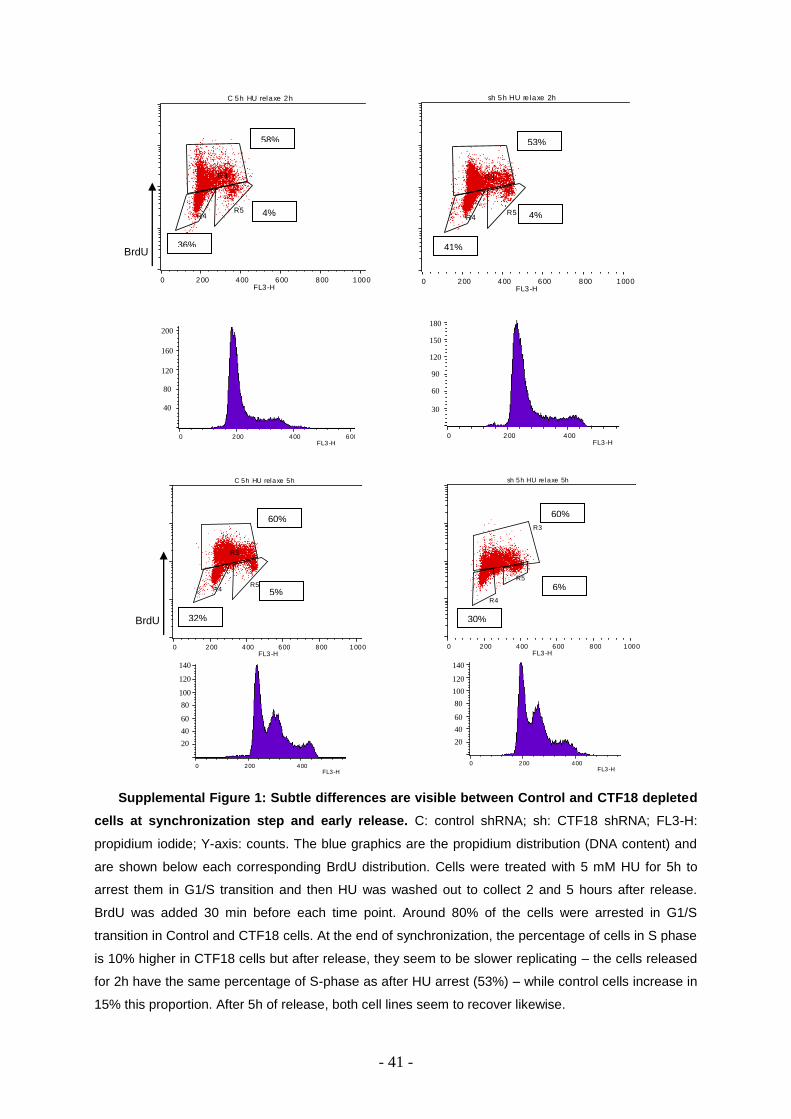
- 41 -
Supplemental Figure 1: Subtle differences are visible between Control and CTF18 depleted
cells at synchronization step and early release. C: control shRNA; sh: CTF18 shRNA; FL3-H:
propidium iodide; Y-axis: counts. The blue graphics are the propidium distribution (DNA content) and
are shown below each corresponding BrdU distribution. Cells were treated with 5 mM HU for 5h to
arrest them in G1/S transition and then HU was washed out to collect 2 and 5 hours after release.
BrdU was added 30 min before each time point. Around 80% of the cells were arrested in G1/S
transition in Control and CTF18 cells. At the end of synchronization, the percentage of cells in S phase
is 10% higher in CTF18 cells but after release, they seem to be slower replicating – the cells released
for 2h have the same percentage of S-phase as after HU arrest (53%) – while control cells increase in
15% this proportion. After 5h of release, both cell lines seem to recover likewise.
0 200 400 600 800 1000FL3-H
C 5h HU relaxe 2h
R3
R4R5
0 200 400 600 800 1000FL3-H
sh 5h HU re laxe 2h
R3
R4R5
53%
4%
41% 36%
58%
4%
200
160
120
80
40
0 200 400 600 800 1000FL3-H
C 5h HU relaxe 2h
0 200 400 600 800 1000FL3-H
sh 5h HU re laxe 2h
180
150
120
90
60
30
0 200 400 600 800 1000FL3-H
C 5h HU relaxe 5h
0 200 400 600 800 1000FL3-H
sh 5h HU re laxe 5h
140
120
100
80
60
40
20
140
120
100
80
60
40
20
BrdU
BrdU
0 200 400 600 800 1000FL3-H
C 5h HU relaxe 5h
R3
R4R5
60%
5%
32%
0 200 400 600 800 1000FL3-H
sh 5h HU re laxe 5h
R3
R4
R5
60%
6%
30%
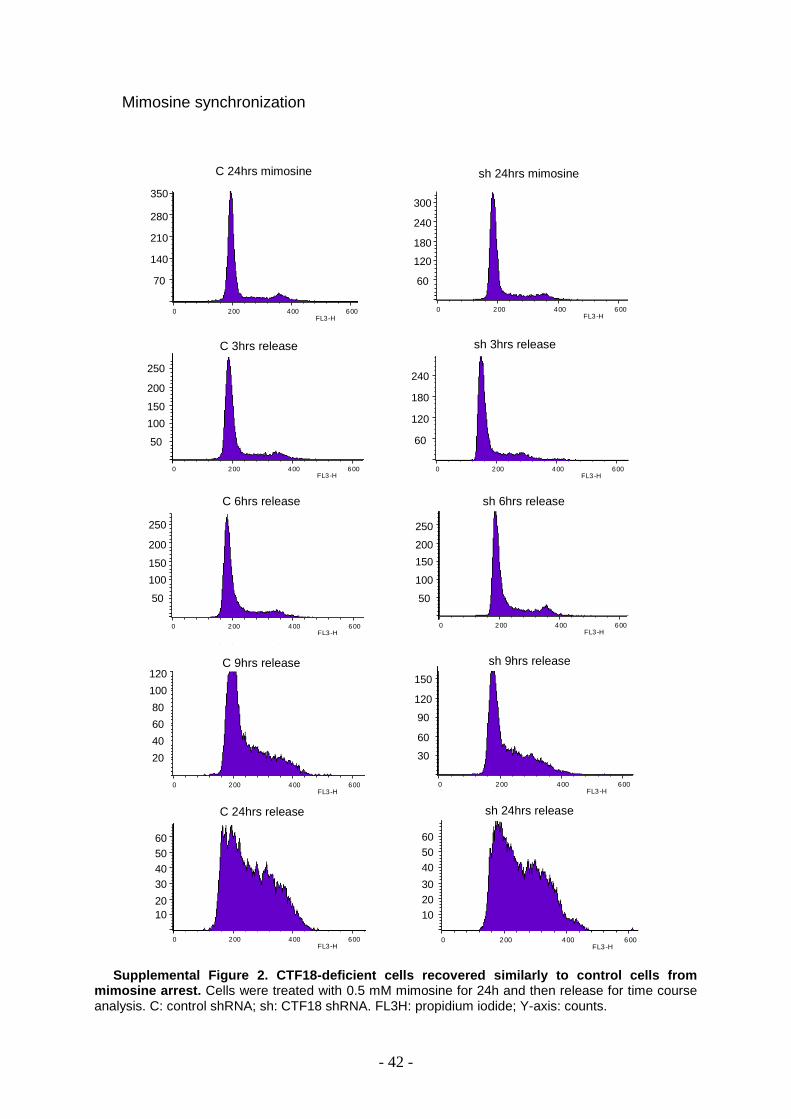
- 42 -
Mimosine synchronization
Supplemental Figure 2. CTF18-deficient cells recovered similarly to control cells from mimosine arrest. Cells were treated with 0.5 mM mimosine for 24h and then release for time course analysis. C: control shRNA; sh: CTF18 shRNA. FL3H: propidium iodide; Y-axis: counts.
0 200 400 600 800 1000FL3-H
ctrl 24h mim osine
0 200 400 600 800 1000FSC-H
sh 24h m im osine
0 200 400 600 800 1000FL3-W
sh 24h m im osine
R1
0 200 400 600 800 1000FL3-H
sh 24h m im osine
0 200 400 600 800 1000FL3-H
sh 24h m im osine
350
280
210
140
70
300
240
180
120
60
C 24hrs mimosine sh 24hrs mimosine
0 200 400 600 800 1000FSC-H
sh 24h m im osine 3h re laxe
0 200 400 600 800 1000FL3-W
sh 24h m im osine 3h re laxe
R1
0 200 400 600 800 1000FL3-H
sh 24h m im osine 3h re laxe
0 200 400 600 800 1000FL3-H
sh 24h m im osine 3h re laxe
240
180
120
60
sh 3hrs release C 3hrs release
0 200 400 600 800 1000FSC-H
ctrl 24h mim osine 3h re laxe
0 200 400 600 800 1000FL3-W
ctrl 24h mim osine 3h re laxe
R1
0 200 400 600 800 1000FL3-H
ctrl 24h mim osine 3h re laxe
0 200 400 600 800 1000FL3-H
ctrl 24h mim osine 3h re laxe
250
200
150
100
50
0 200 400 600 800 1000
FSC-H
ctrl 24h mim osine 6h re laxe
0 200 400 600 800 1000FL3-W
ctrl 24h mim osine 6h re laxe
R1
0 200 400 600 800 1000FL3-H
ctrl 24h mim osine 6h re laxe
0 200 400 600 800 1000FL3-H
ctrl 24h mim osine 6h re laxe
250
200
150
100
50
C 6hrs release
0 200 400 600 800 1000FSC-H
sh 24h m im osine 6h re laxe
0 200 400 600 800 1000FL3-W
sh 24h m im osine 6h re laxe
R1
0 200 400 600 800 1000FL3-H
sh 24h m im osine 6h re laxe
0 200 400 600 800 1000FL3-H
sh 24h m im osine 6h re laxe
250
200
150
100
50
sh 6hrs release
C 9hrs release
0 200 400 600 800 1000FSC-H
sh 24h M im osine 9h re lease
0 200 400 600 800 1000FL3-H
sh 24h M im osine 9h re lease
0 200 400 600 800 1000FL3-W
sh 24h M im osine 9h re lease
R1
Region Statistics
Fi le : sh 24h Mim osine 9h re lease Log Data Uni ts: L inear Values
Sam ple ID: cont 0 Patient ID:
T ube: Unti tled Panel: Unti tled Acquisi tion T ube L ist
Acquisi tion Date: 15-Jun-10 Gate: G1
Gated Events: 10242 T ota l Events: 19128
X Param eter: FL3-H (Linear) Y Param eter: FL1-H (Log)
Region Events % Gated % T ota l X M ean X Geo M eanY M ean
R2 10242 100.00 53.54 223.69 215.89 76.44
R1 10242 100.00 53.54 223.69 215.89 76.44
R3 2572 25.11 13.45 256.64 251.24 175.69
0 200 400 600 800 1000FL3-H
sh 24h M im osine 9h re lease
R3
150
120
90
60
30
sh 9hrs release
0 200 400 600 800 1000FSC-H
C 24h M imosine 9h release
0 200 400 600 800 1000FL3-H
C 24h M imosine 9h release
0 200 400 600 800 1000FL3-W
C 24h M imosine 9h release
R1
Region Statistics
Fi le : C 24h Mim osine 9h re lease Log Data Uni ts: L inear Values
Sam ple ID: cont 0 Patient ID:
T ube: Unti tled Panel: Unti tled Acquisi tion T ube L ist
Acquisi tion Date: 15-Jun-10 Gate: G1
Gated Events: 10190 T ota l Events: 22916
X Param eter: FL3-H (Linear) Y Param eter: FL1-H (Log)
Region Events % Gated % T ota l X M ean X Geo M eanY M ean
R2 10190 100.00 44.47 242.27 234.04 98.90
R1 10190 100.00 44.47 242.27 234.04 98.90
R3 2869 28.16 12.52 275.03 269.49 221.05
0 200 400 600 800 1000FL3-H
C 24h M imosine 9h release
R3
120
100
80
60
40
20
C 24hrs release
0 200 400 600 800 1000FSC-H
C 24h M imosine 24h re lease
0 200 400 600 800 1000FL3-H
C 24h M imosine 24h re lease
0 200 400 600 800 1000FL3-W
C 24h M imosine 24h re lease
R1
Region Statistics
Fi le : C 24h Mim osine 24h re lease Log Data Uni ts: L inear Values
Sam ple ID: cont 0 Patient ID:
T ube: Unti tled Panel: Unti tled Acquisi tion T ube L ist
Acquisi tion Date: 15-Jun-10 Gate: G1
Gated Events: 10038 T ota l Events: 19840
X Param eter: FL3-H (Linear) Y Param eter: FL1-H (Log)
Region Events % Gated % T ota l X M ean X Geo M eanY M ean
R2 10038 100.00 50.59 255.91 245.55 92.64
R1 10038 100.00 50.59 255.91 245.55 92.64
R3 3447 34.34 17.37 270.19 262.81 164.19
0 200 400 600 800 1000FL3-H
C 24h M imosine 24h re lease
R3
60
50
40
30
20
10
0 200 400 600 800 1000FSC-H
sh 24h M im osine 24h re lease
0 200 400 600 800 1000FL3-H
sh 24h M im osine 24h re lease
0 200 400 600 800 1000FL3-W
sh 24h M im osine 24h re lease
R1
Region Statistics
Fi le : sh 24h Mim osine 24h release Log Data Uni ts: L inear Values
Sam ple ID: cont 0 Patient ID:
T ube: Unti tled Panel: Unti tled Acquisi tion T ube L ist
Acquisi tion Date: 15-Jun-10 Gate: G1
Gated Events: 10075 T ota l Events: 23663
X Param eter: FL3-H (Linear) Y Param eter: FL1-H (Log)
Region Events % Gated % T ota l X M ean X Geo M eanY M ean
R2 10075 100.00 42.58 249.77 240.05 103.92
R1 10075 100.00 42.58 249.77 240.05 103.92
R3 3911 38.82 16.53 264.98 257.41 173.76
0 200 400 600 800 1000FL3-H
sh 24h M im osine 24h re lease
R3
60
50
40
30
20
10
sh 24hrs release