perceção do consumidor sobre a qualidade do serviço em ... · importância foi atribuída ao...
TRANSCRIPT


i

ii
Perceção do consumidor sobre a qualidade do serviço em restaurantes da
cidade do Porto
Consumer perception of service quality in restaurants from the city of
Porto
Ana Rita dos Santos Pacheco, Licenciada em Ciência Alimentar
Faculdade de Ciências da Nutrição e Alimentação da Universidade do Porto
Professora Dr.ª Ada Rocha, FCNAUP
Dissertação de candidatura ao grau de Mestre em Alimentação Coletiva
apresentada à Faculdade de Ciências da Nutrição e Alimentação da Universidade
do Porto
2013

iii
Agradecimentos
Agradeço ao Prof. Doutora Ada Rocha como minha orientadora em todos os
momentos durante a dissertação, com toda a sua atenção e paciência. Um
obrigado sincero.
Agradeço ao Mestre Rui Poinhos pela forma, como quase que, em ultimato me
ajudou em todo o tratamento estatístico, com toda a sua boa disposição.
A toda a minha família, por todo o incentivo e paciência. Mãe, Pai, Mano, sem
vocês nada disto seria possível, foram a minha base para que atingisse este
patamar, são eles quem mais merecem os meus agradecimentos.
Aos meus tios e padrinhos Mário e Amância, que sempre considerei uns
segundos pais, por todo o apoio que sempre me deram e pelo seu exemplar e
orgulhoso percurso académico e profissional, graças a eles tive vontade e
coragem de chegar até ao fim desta etapa.
À Fátima Fidalgo, à Teresa Moreira, à Sara Miranda, à Sara Lages e à Nádia
Faria um imenso obrigada pelos ótimos momentos partilhados e pela força que
me transmitiram até ao último minuto.
Aos meus amigos que sempre me apoiaram e que sempre estiveram presentes
ao longo deste percurso.
Ao meu namorado, Rui, com toda sua paciência e dedicação, para a minha má
disposição, intensa ao longo do último mês, que nunca me deixou desistir. Um
enorme obrigado.

iv
Resumo
A mudança no estilo e ritmo de vida das famílias conduziram a um aumento
drástico na necessidade de fazer refeições fora de casa. Por outro lado as
preocupações com a segurança dos locais de refeição são uma característica do
consumidor moderno, mais informado e mais exigente.
Este estudo aborda a perceção dos consumidores sobre a qualidade do serviço
em restaurantes e as razões que condicionam sua intenção de revisitar o local.
Este estudo foi efetuado na cidade do Porto, através da aplicação um questionário
estruturado. Os aspetos percecionados pelo consumidor com maior importância
para avaliação da qualidade do serviço são o Conforto à mesa e as Instalações
Sanitárias. Relativamente à intenção de revisitar o estabelecimento a maior
importância foi atribuída ao atendimento e à qualidade alimentar.
Palavras-Chave: Perceção do consumidor, Qualidade do serviço, Fidelização do
cliente

v
Abstract
The change in the style and rhythm of family’s lifes drove to a drastic increase to
have their meals outside their houses. In the other hand the concerns with the
safety of the dining spots are a feature of modern consumer, more informed and
demanding.
This study deals with the perception of consumers about the quality of
restaurants’ service and the reasons that affect their intention to revisit the
establishment.
This thesis study was carried on the city of Oporto, through the application of a
structured questionnaire.
The most relevant aspects that influence consumers in their evaluations of the
services quality are the comfort in the room and sanitary facilities.
Regarding the intention to revisit the establishment the most important
classification was given to the quality of the attendance and food quality.
Keywords: Consumer Perception, Quality of Service, Customer Loyalty

vi
Índice
Agradecimentos .................................................................................................. iii
Resumo ............................................................................................................. iv
Abstract .............................................................................................................. v
Lista de Tabelas ................................................................................................ vii
Introdução........................................................................................................... 1
Objetivos............................................................................................................. 6
Material e Métodos ............................................................................................. 7
Resultados .......................................................................................................... 9
3.1- Características demográficas ...................................................................... 9
3.2 – Infraestruturas ........................................................................................... 9
3.3 – Razão para revisitar o restaurante .......................................................... 17
Discussão ......................................................................................................... 24
Conclusões ....................................................................................................... 28
Referências Bibliográficas ................................................................................ 29
Anexos 1........................................................................................................... 32
Anexos 2........................................................................................................... 34

vii
Lista de Tabelas
Tabela 1 - Características demográficas dos inquiridos ......................................... 9
Tabela 2 - Perceção do consumidor sobre as infraestruturas e a sua influência na
qualidade do serviço num restaurante ................................................................. 10
Tabela 3 – Comparação entre pares de parâmetros nas infraestruturas ............. 10
Tabela 4 - Perceção dos consumidores quanto ao exterior do edifício e a sua
influência na qualidade do serviço num restaurante ............................................ 11
Tabela 5 – Comparação do parâmetro “exterior do edifício” entre pares de faixas
etárias .................................................................................................................. 12
Tabela 6 - Perceção dos consumidores quanto ao interior dos restaurantes e a
sua influência na qualidade do serviço num restaurante ...................................... 13
Tabela 7 - Comparação do parâmetro “interior do edifício” entre pares de faixas
etárias .................................................................................................................. 13
Tabela 8 - Perceção dos consumidores quanto ao layout dos restaurantes e a sua
influência na qualidade do serviço num restaurante ............................................ 14
Tabela 9 - Comparação do parâmetro “Layout” entre pares de faixas etárias ..... 15
Tabela 10 - Perceção dos consumidores quanto ao conforto à mesa e a sua
influência na qualidade do serviço num restaurante ............................................ 15
Tabela 11 - Comparação do parâmetro “conforto à mesa” entre pares de faixas
etárias .................................................................................................................. 16
Tabela 12 - Perceção dos consumidores quanto às instalações sanitárias e a sua
influência na qualidade do serviço de um restaurante ......................................... 16
Tabela 13 - Comparação do parâmetro “instalações sanitárias” entre pares de
faixas etárias ........................................................................................................ 17

viii
Tabela 14- Perceção do consumidor sobre as razões que o levam a revisitar o
restaurante e a importância atribuída pelos inquiridos a este aspeto a sua
influência na qualidade do serviço ........................................................................ 18
Tabela 15 - Comparação entre pares de parâmetros nas razões que levam a
revisitar o restaurante ........................................................................................... 18
Tabela 16 - Perceção do consumidor sobre o Atendimento, influenciado a
qualidade do serviço e a intenção de revisitar o restaurante ................................ 19
Tabela 17 - Comparação do parâmetro “Atendimento” entre pares de faixas
etárias ................................................................................................................... 19
Tabela 18 - Perceção do consumidor sobre a qualidade alimentar, influenciado a
qualidade do serviço e a intenção de revisitar o restaurante ................................ 20
Tabela 19 - Comparação do parâmetro “qualidade alimentar” entre pares de faixas
etárias ................................................................................................................... 20
Tabela 20 - Perceção do consumidor sobre os Conceitos dos inquiridos sobre
segurança alimentar num estabelecimento e a sua intenção de revisitar o
restaurante ........................................................................................................... 21
Tabela 21 - Comparação do parâmetro “conceitos dos inquiridos sobre segurança
alimentar” entre pares de faixas etárias ............................................................... 22
Tabela 22 – Perceção do consumidor sobre a Fidelização dos inquiridos sobre
segurança alimentar num estabelecimento e a sua intenção de revisitar o
restaurante ........................................................................................................... 23
Tabela 23 - Comparação do parâmetro “fidelização” entre pares de faixas etárias
............................................................................................................................. 23

1
Introdução
Em Portugal, segundo a Organização Mundial de Turismo (OMT) e o Turismo de
Portugal, em 2011, o setor dos restaurantes e similares é um dos setores com
maior importância no turismo, com uma quota acima dos 23%, dividindo essa
importância com o setor dos transportes e alojamento (1, 2).
As alterações que se tem vindo a verificar na última década no quotidiano da
população, nomeadamente a inserção da mulher no mercado de trabalho, maior
número de horas de laboração, diminuição do agregado familiar, o crescimento da
esperança média de vida e o aumento do turismo, leva a que o tempo para a
preparação de refeições seja cada vez mais reduzido, levando ao aumento da
procura pelos serviços de restauração(3, 4).
Fazer refeições fora de casa, foi a alternativa encontrada pelos consumidores
para satisfazer as suas necessidades alimentares e de conveniência, conferi-lhes
prazer, entretenimento, economia de tempo e interação social (5).
Esta tendência tem-se vindo a verificar em muitos países, e considerando que
hoje mais do que nunca os consumidores estão mais informados e exigentes nas
suas escolhas, procuram estabelecimentos que garantam a qualidade e a
segurança alimentar(6, 7).
A preocupação com a segurança e a salubridade dos produtos alimentares tem
surgido cada vez mais entre os consumidores, independentemente do seu nível
socioeconómico(8).
Assim, é cada vez mais importante a consciência da higiene nos
estabelecimentos, tanto por parte dos consumidores, bem como pelos gestores,
não só pelas crescentes reclamações sobre a higiene no setor de restauração,

2
mas também pelo incremento do número de empresas que prestam serviços de
restauração(8, 9) assim como pelo aumento do número de refeições servidas.
Tendo como objetivo alcançar a fidelização, é necessário um alto nível de
satisfação por parte do cliente, nível este, que é também essencial para melhorar
a competitividade na restauração, independentemente do seu tipo(10).
Anderson et al (1994) (11), afirmaram que a melhoria da qualidade do serviço irá
aumentar a satisfação do consumidor, portanto, o reconhecimento do consumidor
da qualidade do serviço vai refletir-se sobre a sua intenção de revisitar(12).
No entanto é muito difícil para o consumidor, formar uma opinião, ou seja, saber o
que se passa dentro de uma cozinha, a única forma de garantia que este tem é a
sua avaliação subjetiva quando se desloca ao local(8). Ao recorrer a este tipo de
estabelecimentos o cliente irá percecionar diverso aspetos, baseados na
abordagem por parte dos funcionários, e do ambiente envolvente,
independentemente das expetativas pré-estabelecidas(13, 14).
No entanto, a informação captada nem sempre é suficiente para que o cliente
forme uma opinião, recorrendo a outro tipo informação relacionada com o sexo, a
idade, o cargo e a atratividade física dos funcionários(13).
Nos estabelecimentos de restauração a qualidade relaciona-se com vários fatores
como: a qualidade das matérias-primas utilizadas, as estruturas físicas, os
equipamentos, os recursos humanos (empregados e gestão), a correta
manipulação de alimentos, bem como a adoção de sistemas de controlo de
qualidade(6).
Estudos anteriores revelam que a perceção do cliente em relação à qualidade do
serviço em estabelecimentos de restauração prende-se com atributos como o

3
preço, a qualidade dos alimentos (sabor dos alimentos e propriedades
nutricionais), o serviço, a localização, a marca, e a imagem.
São indicadores de avaliação aspetos como o estado higio-sanitário de uma
cozinha, quando é possível a sua visualização, a higiene das instalações
sanitários, a limpeza dos utensílios e equipamentos, a higiene pessoal dos
colaboradores e a forma de confeção e apresentação da refeição(15).
Compreender e controlar esses indicadores é crucial para a sobrevivência de um
restaurante(16).
Kotler (1973), afirmou que os clientes percecionam o ambiente relativamente à
qualidade do serviço através de uma combinação visual (cores, iluminação e
proximidade aos elementos número de elementos visuais); auditiva (tipo de
música, o nível de som), tátil (limpeza) e olfativa (cheiro)(17).
Dois estudos realizados por (Milliman 1982, 1986)(18, 19), demonstraram que o
ritmo da música em restaurantes e supermercados influencia o tempo de
compras, o tempo de permanência e os gastos dos clientes.
Wall and Berry (2007) (20), afirmaram que, embora a qualidade dos alimentos seja
fundamental, o desempenho, o ambiente e o serviço influenciam altamente a
avaliação de um estabelecimento por parte do consumidor.
De acordo com Han e Ryu (2009) (21), a fidelidade do cliente depende em grande
parte da sua satisfação. A mesma ideia é compartilhada por Fornell et al
(1996)(22), Ladhari, Brun e Morales (2008)(23) e McDougall e Levesque (2000)(24).
Venetis e Ghauri (2004), que constataram que a qualidade do serviço influência a
intenção do cliente em revisitar o estabelecimento(25).

4
Barber (2008)(26) e Kim et al. (2009)(27), afirmaram que a perceção do serviço pelo
consumidor pode estar diretamente associado com características demográficas,
tais como o sexo, escolaridade, poder socioeconómico e idade.
Outros autores também afirmaram que tal como o sexo, também a idade é uma
importante variável demográfica que tem influência na perceção obtida da
qualidade do serviço (28, 29).
Uma potencial estratégia para influenciar os clientes na forma como percecionam
a qualidade do serviço, influenciando uma eventual revisita, pode consistir, na
afixação da informação relativa a inspeções/auditorias realizadas e a sua
respetiva classificação (13,14).
A qualidade do serviço percecionada pelo consumidor e a sua intenção de
revisitar o estabelecimento é afetada por vários fatores conforme descrito por Kim
and Moon(30) (Fig.1).
A avaliação da perceção do consumidor sobre a qualidade do serviço bem como
o seu comportamento devem ser estudadas pois são determinantes para a
fidelização do cliente(31).
Este estudo foi desenvolvido para identificar os fatores que mais afetam a
perceção dos consumidores e a importância atribuída à relação com a qualidade
do serviço, e as razões que o levam a revisitar um estabelecimento de
restauração.
Este estudo, insere-se num projeto em curso em mais três cidades europeias
(Manchester, Belgrado e Thessaloniki), com o mesmo objetivo (32).

5
Figura 1- Qualidade do serviço percecionada pelo consumidor e a intenção de revisitar,
Adaptado do Modelo Conceitual(30)
Estéticas das Instalações
Layout
Equipamento
Conforto à mesa
Condições Ambientais
Mobilidade
Sensação de Prazer
Perceção da qualidade do serviço
Intenção de revisitar

6
Objetivos
Perceção dos consumidores sobre a qualidade do serviço em restaurantes e as
razões que condicionam sua intenção de revisitar o local

7
Material e Métodos
Este estudo realizou-se, na cidade do Porto entre Setembro de 2012 e Fevereiro
de 2013. Inicialmente foi aplicado um questionário piloto, previamente traduzido
de um questionário desenvolvido com base em estudos similares em outros
países (30, 33-35) (Anexo 1 e 2), a 10 pessoas, utilizadoras habituais de
restaurantes, com o intuito de melhorar em termos de linguagem, formulação de
frases e estruturação. Seguidamente, foram aplicados 200 questionários aos
consumidores, frequentadores habituais de restaurantes, os inquiridos foram
abordados aleatoriamente em locais públicos.
O questionário encontrava-se dividido em três partes, numa primeira parte
começou-se por recolher características demográficas como o sexo e a idade, e
escolaridade e o número de vistas anuais a restaurantes. De acordo com a
metodologia pré-definida 50% da população inquirida eram homens e 50% eram
mulheres. Definiu-se ainda a divisão equitativa por faixas etárias, no total de 5
faixas, cada uma das faixas, respondeu a 20% dos inquéritos, num total de 40 por
cada faixa e 20 por cada sexo. Os autores reconhecem que este método não
evidencia uma verdadeira amostra aleatória, mas apresenta uma amostra
conveniente para posterior tratamento estatístico (33-35).
Na segunda parte do questionário foram apresentadas várias afirmações ao
consumidor relativo à qualidade do serviço, tendo por base as infraestruturas, a
estética, o “Layout”, as condições de conforto à mesa, bem como as instalações
sanitárias dos estabelecimentos. Foi solicitado aos inquiridos que classificassem
numa escala de 1 a 5, em que 1 corresponde a -“discordo totalmente” 2-“discordo”
e 3-“ sem opinião” 4-“ concordo” 5-“concordo totalmente”, as diferentes

8
afirmações. Na terceira e última parte do questionário foram avaliadas as razões
pelas quais os indivíduos potencialmente revisitariam os estabelecimentos, tendo
por base afirmações apresentadas aos inquiridos relativas ao Atendimento, à
Qualidade Alimentar, Conceitos sobre a segurança alimentar do estabelecimento
e por fim a fidelização, que foram igualmente classificadas numa escala de 1 a 5
(Anexos 1).
No total o questionário consistiu em 49 afirmações e foram necessários
aproximadamente dez minutos para cada inquirido responder ao questionário.
A análise dos resultados foi efetuada no programa SPSS versão 20.0 para
Windows. A análise estatística descritiva consistiu no cálculo de médias e
desvios-padrão. Para comparação de [variáveis analisadas] em função de [grupos
comparados] foi utilizada análise de variância (ANOVA), com testes post hoc com
correção de Bonferroni. Rejeitou-se a hipótese nula quando o nível de
significância crítico para a sua rejeição foi inferior a 0,05.

9
Resultados
3.1- Características demográficas
Relativamente às características demográficas verificou-se que 50% (N=100) da
população inquirida eram homens e 50% (N=100) eram mulheres. Inquiriu-se o
mesmo número de indivíduos de cada faixa etária (N=20) (Tabela 1).
Tabela 1 - Características demográficas dos inquiridos
Faixa Etária Homens Mulheres
N % N %
≤24 20 10 20 10
25-34 20 10 20 10
35-44 20 10 20 10
45-54 20 10 20 10
≥55 20 10 20 10
3.2 – Infraestruturas
A perceção do consumidor sobre as infraestruturas, tendo por base, o Exterior
das Instalações, o Interior, o Layout, o Conforto à mesa e as Instalações
Sanitárias são significativamente diferente entre elas (Tabela 2).
Verificou-se que a perceção do consumidor sobre as Instalações Sanitárias e o
Conforto à mesa são os motivos que mais influenciam a sua opinião sobre a
qualidade do serviço (Tabela 2).

10
Tabela 2 - Perceção do consumidor sobre as infraestruturas e a sua influência na qualidade
do serviço num restaurante
Total Homens Mulheres
Média Desvio Padrão
Média Desvio Padrão
Média Desvio Padrão
N (Amostra) 200 200 100 100 100 100
Exterior Edifício 3,7 0,7 3,7 0,7 3,7 0,8
Interior Edifício 3,4 0,9 3,3 0,9 3,6 0,8
Layout 3,8 0,8 3,7 0,7 3,8 0,8
Conforto à mesa
4,1 0,6 4,1 0,7 4 0,6
Sanitários 4,3 0,7 4,1 0,7 4,4 0,7
Os valores apresentados são referentes à Média e ao Desvio padrão (Classificados numa escala de 1 = “Discordo totalmente”, 3 = “Sem Opinião”, 5 = Concordo totalmente”); p< 0,001 para todos os parâmetros
Tabela 3 – Comparação entre pares de parâmetros nas infraestruturas
Infraestruturas Diferença de médias P
Exterior do edifício Interior do Edifício 0,264 0,002
Layout
-0,063 1,000
Conforto à mesa -0,353 0,000
Instalações Sanitárias -0,554 0,000
Interior do edifício Layout -0,327 0,000
Conforto à mesa -0,616 0,000
Instalações Sanitárias -0,818 0,000
Layout Conforto à mesa -0,289 0,000
Instalações Sanitárias -0,491 0,008
Conforto à mesa Instalações Sanitárias -0,491 0,008

11
3.2.1- Exterior do Edifício
Verificou-se que a perceção dos clientes sobre o exterior do edifício apresentava
diferenças significativas, relativamente às restantes infraestruturas, excetuando, o
“Layout” (Tabela 3).
Verificou-se que a idade afeta a perceção do consumidor sobre o exterior do
edifício e a associação com a qualidade do serviço, encontram-se diferenças
entre as faixas: ≤24 e ≥55 anos, 25-34 e 35-44, 25-34 e ≥55 anos (Tabela 5).
Verificou-se ainda que, os inquiridos, de ambos os sexos mais velhos são os que
atribuem maior importância ao exterior do edifício e à sua influência na qualidade
do serviço (Tabela).
Tabela 4 - Perceção dos consumidores quanto ao exterior do edifício e a sua influência na
qualidade do serviço num restaurante
Sexo N Faixa Etária Média Desvio Padrão
20 ≤24 3,6 0,6
20 25-34 3,5 1
Feminino 20 35-44 3,7 0,6
20 45-54 3,7 0,6
Exterior do Edifício 20 ≥55 4,1 0,9
20 ≤24 3,5 0,5
20 25-34 3,2 0,6
Masculino 20 35-44 4 0,8
20 45-54 3,8 0,7
20 ≥55 4,1 0,7
Os valores apresentados são referentes à Média e ao Desvio padrão (Classificados numa escala de 1 = “Discordo totalmente”, 3 = “Sem Opinião”, 5 = Concordo totalmente”)

12
Tabela 5 – Comparação do parâmetro “exterior do edifício” entre pares de faixas etárias
Faixa Etária (anos) Diferença de médias p
≤ 24 anos 25-34 0,217 1,000
35-44 -0,342 0,320
45-54 -0,183 1,000
≥55 -0,550* 0,006
25-34 anos 35-44 -0,558* 0,005
45-54 -0,400 0,122
≥55 -0,767* 0,000
35-44 anos 45-54 0,158 1,000
≥55 1,000 1,000
45-54 anos ≥55 -0,367 0,215
*
3.2.2 – Interior do Edifício
Encontraram-se diferenças significativas entre a perceção do consumidor sobre o
Interior do Edifício e a sua influência na qualidade quando comparado com as
restantes infraestruturas (Tabela 3). Quando consideramos a variável sexo,
também verificamos diferenças significativas na perceção sobre o interior do
edifício e a sua influência na qualidade do serviço, sendo os homens (Tabela 6) a
atribuírem a menor importância ao interior do estabelecimento e a sua relação
com a qualidade do serviço (Tabela 6). Não se verificou influência da idade na
importância atribuída ao interior do edifício e à relação com a qualidade do serviço
(Tabela 7).

13
Tabela 6 - Perceção dos consumidores quanto ao interior dos restaurantes e a sua
influência na qualidade do serviço num restaurante
Sexo N Faixa Etária Média Desvio Padrão
20 ≤24 3,8 0,8
20 25-34 3,5 0,6
Feminino 20 35-44
3,1 0,7
20 45-54 3,7 1
Interior do Edifício 20 ≥55 3,9 0,8
20 ≤24 2,8 0,7
20 25-34 2,9 0,7
Masculino 20 35-44
3,6 0,9
20 45-54 3,4 0,8
20 ≥55 3,7 1
Os valores apresentados são referentes à Média e ao Desvio padrão (Classificados numa escala de 1 = “Discordo totalmente”, 3 = “Sem Opinião”, 5 = Concordo totalmente”)
Tabela 7 - Comparação do parâmetro “interior do edifício” entre pares de faixas etárias
Faixa Etária (anos) Diferença de médias p
≤ 24 anos 25-34 0,113 1,000
35-44 -0,013 1,000
45-54 -0,238 1,000
≥55 -0,444 0,136
25-34 anos 35-44 -0,125 1,000
45-54 -0,350 0,509
≥55 -0,556* 0,021
35-44 anos 45-54 -0,225 1,000
≥55 -0,431 0,164
45-54 anos ≥55 -0,206 1,000

14
3.2.3- “Layout” do estabelecimento
A importância que os consumidores atribuem ao “layout” do estabelecimento e a
sua influência na qualidade do serviço é significativamente diferente relativamente
ao atribuído às outras infraestruturas, excetuando o Exterior de Edifício (Tabela
3).
A idade e o sexo dos inquiridos não afetam a importância atribuída ao Layout na
perceção do consumidor e a sua relação com a qualidade do serviço de um
restaurante (Tabela 8 e 9).
Tabela 8 - Perceção dos consumidores quanto ao layout dos restaurantes e a sua influência
na qualidade do serviço num restaurante
Sexo N Faixa Etária Média Desvio Padrão
20 ≤24 3,7 0,7
20 25-34 3,8 1
Feminino 20 35-44
4 0,8
20 45-54 4 0,6
Layout 20 ≥55 3,6 0,9
20 ≤24 3,6 0,7
20 25-34 3,5 0,8
Masculino 20 35-44
4 0,8
20 45-54 3,8 0,7
20 ≥55 3,7 0,7
Os valores apresentados são referentes à Média e ao Desvio padrão (Classificados numa escala de 1 = “Discordo totalmente”, 3 = “Sem Opinião”, 5 = Concordo totalmente”)

15
Tabela 9 - Comparação do parâmetro “Layout” entre pares de faixas etárias
Faixa Etária (anos) Diferença de médias p
≤ 24 anos 25-34 0,025 1,000
35-44
-0,308 0,786
45-54
-0,192 1,000
≥55 0,008 1,000
25-34 anos 35-44 -0,333 0,574
45-54
-0,217 1,000
≥55 -0,0017 1,000
35-44 anos 45-54 0,333 1,000
≥55 0,117 0,709
45-54 anos ≥55 0,200 1,000
3.2.4- Conforto à mesa
A importância atribuída pelos consumidores às condições de Conforto à Mesa e a
sua influência na qualidade do serviço é significativamente diferente dos restantes
aspetos das infraestruturas (Tabela 3).
A idade e o sexo dos inquiridos não influenciam a importância atribuída à
influência do conforto à mesa sobre a perceção da qualidade do serviço (Tabela
10 e 11).
Tabela 10 - Perceção dos consumidores quanto ao conforto à mesa e a sua influência na
qualidade do serviço num restaurante
Sexo N
Faixa Etária Média Desvio Padrão
20 ≤24 4 0,6
20 25-34 3,9 0,7
Feminino 20 35-44 4 0,7
20 45-54 4,1 0,6
Conforto à Mesa 20 ≥55 4,1 0,6
20 ≤24 3,7 0,7
20 25-34 4,1 0,7
Masculino 20 35-44 4,3 0,6
20 45-54 4 0,5
20 ≥55 4,3 0,6
Os valores apresentados são referentes à Média e ao Desvio padrão (Classificados numa escala de 1 = “Discordo totalmente”, 3 = “Sem Opinião”, 5 = Concordo totalmente”)

16
Tabela 11 - Comparação do parâmetro “conforto à mesa” entre pares de faixas etárias
Faixa Etária (anos) Diferença de médias p
≤ 24 anos 25-34 -0,150 1,000
35-44 -0,300 ,364
45-54 -0,175 1,000
≥55 -0,288 ,449
25-34 anos 35-44 -0,150 1,000
45-54 -0,025 1,000
≥55 0,138 1,000
35-44 anos 45-54 0,1250 1,000
≥55 0,013 1,000
45-54 anos ≥55 -0,011 1,000
3.2.5 – Instalações Sanitárias
A importância atribuída pelos consumidores às Instalações Sanitárias e a sua
influência na qualidade do serviço é significativamente diferente dos restantes
aspetos das infraestruturas (Tabela 3).
Verificou-se que as mulheres mais jovens atribuem maior importância às
Instalações Sanitárias e à sua relação com a qualidade do serviço (Tabela 12).
A idade não afeta a importância atribuída pelos inquiridos a este aspeto (Tabela
13).
Tabela 12 - Perceção dos consumidores quanto às instalações sanitárias e a sua influência na qualidade do serviço de um restaurante
Sexo
N Faixa Etária Média Desvio Padrão
20 ≤24 4,7 0,3
20 25-34 4,3 0,7
Feminino 20 35-44 4,3 0,7
20 45-54 4,2 0,8
20 ≥55 4,4 0,7
Instalações Sanitárias
20 ≤24 4,3 0,6
20 25-34 4,2 0,7
Masculino 20 35-44 4 0,7
20 45-54 4 0,8
20 ≥55 4,1 0,8
Os valores apresentados são referentes à Média e ao Desvio padrão (Classificados numa escala de 1 = “Discordo totalmente”, 3 = “Sem Opinião”, 5 = Concordo totalmente)

17
Tabela 13 - Comparação do parâmetro “instalações sanitárias” entre pares de faixas etárias
Faixa Etária (anos) Diferença de médias p
≤ 24 anos 25-34 0,270 0,714
35-44 0,370 0,156
45-54 0,410 0,075
≥55 0,300 0,494
25-34 anos 35-44 0,090 1,000
45-54 0,130 1,000
≥55 0,020 1,000
35-44 anos 45-54 0,040 1,000
≥55 -0,070 1,000
45-54 anos ≥55 -,0110 1,000
3.3 – Razão para revisitar o restaurante
As razões que afetam as intenções do consumidor voltar ao estabelecimento são
influenciadas pelo Atendimento, a Qualidade Alimentar, os Conceitos relativos à
segurança alimentar e por questões de fidelização.
Verificou-se que existem diferenças significativas entre a perceção dos
consumidores sobre o atendimento e os restantes aspetos (qualidade alimentar,
conceitos e fidelização) relativamente à qualidade do serviço e à sua intenção de
revisitar (Tabela 14).
Verificou-se que a perceção do consumidor sobre o atendimento é o motivo que
mais influencia a qualidade do serviço e que o leva a revisitar o estabelecimento
(Tabela 14).

18
Tabela 14- Perceção do consumidor sobre as razões que o levam a revisitar o restaurante e
a importância atribuída pelos inquiridos a este aspeto a sua influência na qualidade do
serviço
Total Homens
Mulheres
Média Desvio- Padrão
Média Desvio- Padrão
Média Desvio Padrão
N (Amostra)
200 200 100 100 100 100
Atendimento
4,4
0,6
4,5
0,6
4,3
0,6
Qualidade alimentar
4,3
0,7
4,2
0,7
4,4
0,7
Conceitos
4,2
0,4
4,2
0,4
4,2
0,5
Fidelização
3,8
0,6
3,8
0,5
3,9
0,5
Os valores apresentados são referentes à Média e ao Desvio padrão (Classificados numa escala de 1 = “Discordo totalmente”, 3 = “Sem Opinião”, 5 = Concordo totalmente”); p< 0,001 para todos os parâmetros
Tabela 15 - Comparação entre pares de parâmetros nas razões que levam a revisitar o
restaurante
Razão para revisitar o
estabelecimento Diferença de
médias p
Atendimento Qualidade Alimentar
0,070
1,000
Conceitos Seg.Alimentar
0,164
*
0,008
Fidelização
,539*
0,000
Qualidade Alimentar Conceitos Seg.Alimentar
0,094
0,590
Fidelização
0,469*
0,000
Conceitos Seg. Alimentar Fidelização
0,375
*
0,000
3.3.1 – Atendimento
Verificaram-se diferenças significativas entre a perceção da importância do
atendimento, os conceitos relativos à segurança alimentar e a Fidelização na sua
intenção de revisitar (Tabela 15).
Verificou-se também que foram os Homens a atribuir uma maior importância ao
atendimento, à qualidade do atendimento e à sua influência na intenção de
revisitar o estabelecimento (Tabela 16).

19
Tabela 16 - Perceção do consumidor sobre o Atendimento, influenciado a qualidade do
serviço e a intenção de revisitar o restaurante
Sexo N Faixa Etária Média Desvio Padrão
20 ≤24 4,3 0,4
20 25-34 4,4 0,5
Feminino 20 35-44 4,3 0,8
20 45-54 4,2 0,6
20 ≥55 4,2 0,7
Atendimento 20 ≤24 4,7 0,5
20 25-34 4,3 0,5
Masculino 20 35-44 4,5 0,7
20 45-54 4,4 0,6
20 ≥55 4,5 0,6
Os valores apresentados são referentes à Média e ao Desvio padrão (Classificados numa escala de 1 = “Discordo totalmente”, 3 = “Sem Opinião”, 5 = Concordo totalmente”)
Não se verificou influência da idade na perceção do atendimento pelo
consumidor, a sua influência na qualidade e na intenção de revisitar o restaurante
(Tabela 17).
Tabela 17 - Comparação do parâmetro “Atendimento” entre pares de faixas etárias
Faixa Etária (anos) Diferença de médias p
≤ 24 anos 25-34 0,200 1,000
35-44
0,140 1,000
45-54
0,210 1,000
≥55 0,190 1,000
25-34 anos 35-44 -0,060 1,000
45-54
0,010 1,000
≥55 -0,010 1,000
35-44 anos 45-54 0,070 1,000
≥55 0,050 1,000
45-54 anos ≥55 -0,020 1,000

20
3.3.2 – Qualidade Alimentar
Verificaram-se diferenças significativas entre perceção da importância da
qualidade alimentar e a fidelização na intenção de revisitar o estabelecimento
(Tabela 15).
A idade não afeta a forma como o consumidor avalia a qualidade nem a sua
intenção de revisitar o estabelecimento (Tabela 19).
Tabela 18 - Perceção do consumidor sobre a qualidade alimentar, influenciado a qualidade
do serviço e a intenção de revisitar o restaurante
Sexo N Faixa
Etária Média Desvio Padrão
20 ≤24 4,4 0,7
20 25-34 4,5 0,6
Feminino 20 35-44 4 1,1
20 45-54 4,6 0,4
20 ≥55 4,3 0,6
20 ≤24 3,8 0,7
20 25-34 4,4 0,6
Masculino 20 35-44 4,3 0,7
20 45-54 4,4 0,8
20 ≥55 4,4 0,5
Os valores apresentados são referentes à Média e ao Desvio padrão (Classificados numa escala de 1 = “Discordo totalmente”, 3 = “Sem Opinião”, 5 = Concordo totalmente”)
Tabela 19 - Comparação do parâmetro “qualidade alimentar” entre pares de faixas etárias
Faixa Etária (anos) Diferença de médias p
≤ 24 anos 25-34 -0,375 0,174
35-44 -0,081 1,000
45-54 -0,394 0,126
≥55 -0,269 0,871
25-34 anos 35-44 0,293 0,616
45-54 -0,019 1,000
≥55 0,106 1,000
35-44 anos 45-54 -0,313 0,469
≥55 -0,188 1,000
45-54 anos ≥55
0,125
1,000
Qualidade
Alimentar

21
3.3.3 – Conceitos relativamente à segurança alimentar do estabelecimento
Os inquiridos atribuem uma importância significativa aos conceitos relativos à
segurança alimentar em relação aos outros aspetos considerados (Atendimento e
Fidelização), que afetam a intenção de revisitar o estabelecimento (Tabela 15).
Verificou-se também que os conceitos de segurança alimentar relativamente à
intenção de revisitar foram influenciados pela idade, nomeadamente entre as
faixas etárias ≤24 anos e 25-34 anos, 25-34 e 35-44, 25-34 e ≥55 anos (Tabela
21).
Tabela 20 - Perceção do consumidor sobre os Conceitos dos inquiridos sobre segurança
alimentar num estabelecimento e a sua intenção de revisitar o restaurante
Sexo N
Faixa Etária Média Desvio Padrão
20 ≤24 4,4 0,4
20 25-34 3,9 0,4
Feminino 20 35-44 4,4 0,4
20 45-54 4 0,5
20 ≥55 4,2 0,5
20 ≤24 4,3 0,4
20 25-34 4 0,4
Masculino 20 35-44 4,2 0,4
20 45-54 4,3 0,4
20 ≥55 4,3 0,3
Os valores apresentados são referentes à Média e ao Desvio padrão (Classificados numa escala de 1 = “Discordo totalmente”, 3 = “Sem Opinião”, 5 = Concordo totalmente”)
Conceitos dos inquiridos sobre segurança alimentar

22
Tabela 21 - Comparação do parâmetro “conceitos dos inquiridos sobre segurança
alimentar” entre pares de faixas etárias
Faixa Etária (anos) Diferença de médias p
≤ 24 anos 25-34 0,341* 0,004
35-44 0,023 1,000
45-54 0,166 0,824
≥55 0,025 1,000
25-34 anos 35-44 -0,318* 0,010
45-54 -0,175 0,670
≥55 -0,315* 0,011
35-44 anos 45-54 0,143 1,000
≥55 0,002 1,000
45-54 anos ≥55 -0,141 1,000
3.3.4 – Fidelização
Verificaram-se diferenças significativas entre a perceção da importância da
fidelização, o Atendimento, os Conceitos sobre segurança alimentar, a qualidade
alimentar na intenção de revisitar o estabelecimento (Tabela 15).
Verificou-se que a idade influencia de forma significativa a fidelização do
consumidor e a sua intenção de revisitar o estabelecimento, nomeadamente, nos
inquiridos com idades compreendidas entre ≤ 24 e ≥55 anos de idade, entre os
25-34 e ≥55 anos de idade, 45-54 e ≥55 anos de idade (Tabela 23).

23
Tabela 22 – Perceção do consumidor sobre a Fidelização dos inquiridos sobre segurança
alimentar num estabelecimento e a sua intenção de revisitar o restaurante
Sexo N Faixa Etária Média Desvio Padrão
20 ≤24 3,7 0,6
20 25-34 3,8 0,5
Feminino 20 35-44 3,8 0,6
20 45-54 3,9 0,4
Fidelidade 20 ≥55 4,2 0,4
20 ≤24 3,8 0,3
20 25-34 3,5 0,3
Masculino 20 35-44 3,9 0,6
20 45-54 3,5 0,5
20 ≥55 4,2 0,5
Os valores apresentados são referentes à Média e ao Desvio padrão (Classificados numa escala de 1 = “Discordo totalmente”, 3 = “Sem Opinião”, 5 = Concordo totalmente”)
Tabela 23 - Comparação do parâmetro “fidelização” entre pares de faixas etárias
Faixa Etária (anos) Diferença de médias P
≤ 24 anos 25-34 0,093 1,000
35-44
-0,118 1,000
45-54 0,018 1,000
≥55 -0,410
* 0,002
25-34 anos 35-44 -0,210 0,568
45-54 -0,075 1,000
≥55 -0,503
* 0,000
35-44 anos 45-54 0,135 1,000
≥55 -0,293 0,083
45-54 anos ≥55 -0,428* 0,001

24
Discussão
Este estudo incidiu na avaliação dos aspetos que afetam a perceção do
consumidor relativamente à qualidade do serviço de um restaurante. O método de
amostragem utilizado não representa uma amostra aleatória, mas sim uma
amostra de conveniência (30, 33-35).
Relativamente às infraestruturas, foi notória a diferença da importância atribuída
pelos inquiridos às “Instalações Sanitárias”, seguindo-se o “Conforto à mesa”, o
“Layout”, o “Exterior do edifício” e por último o “Interior do Edifício”.
De acordo com Holbrook (1995)(36), o ambiente exterior possuiu grande
importância na perceção sobre a qualidade do serviço, influenciando a decisão de
revisitar o restaurante, tal como verificado neste estudo.
Verificou-se que foram os inquiridos mais velhos a atribuírem uma maior
importância ao “Exterior do Edifício” e à relação com a qualidade do serviço,
verificou-se também que foram os mais velhos a atribuírem uma maior
importância, este facto pode dever-se à dificuldade que a população mais velha
tem em deslocar-se e movimentar-se, uma vez que ao “Exterior das instalações”
estão associados aspetos como os acessos e o estacionamento (Anexos 1).
A associação encontrada no presente estudo entre a perceção do “Interior do
Edifício” e a qualidade do serviço, também foi descrita por Arrifin et al (2012)(31)
que afirmaram que o ambiente interior do restaurante possui uma grande
importância na criação de uma perceção positiva sobre a qualidade do serviço e
na sua intenção de o revisitar. Igualmente (Dube, Johnson e Renaghan(37), 1999;
Knutson e Patton, 1995(38); Ryu, 2005(39); Varkie Colgate, 2001(40)) evidenciaram
que satisfação do cliente é fortemente influenciada pelo ambiente envolvente.
Dados relatados em diversos estudos(40-44) concluíram que do ponto de vista da

25
prestação de serviços, os dois aspetos mais relevantes são o interior do
estabelecimento e o preço, neste estudo conclui-se o inverso pois foi ao aspeto
“Interior do Edifício” ao qual os consumidores atribuíram menor importância.
Apesar da discordância verificada, conclui-se que mulheres valorizam mais os
aspetos relacionados com o “Interior do Edifício” e a sua influência na qualidade
do serviço, provavelmente, porque as mulheres apreciam mais questões
relacionadas com o interior do estabelecimento, como a decoração, a arquitetura,
as cores, etc.
Os consumidores atribuíram grande importância à relação entre o “Layout” e a
qualidade do serviço em concordância com o descrito por (Reimer e Kuehn,
2005)(43).
As “Condições de conforto à mesa” num restaurante, foram associadas à
qualidade do serviço, sendo que este aspeto foi considerado um dos mais
importantes.
Os consumidores atribuíram a maior importância às “Instalações Sanitárias”
quando comparado com as restantes infraestruturas.
Norsworthy (1997)(45) concluiu igualmente que os consumidores frequentam 25%
mais vezes um estabelecimento onde possam utilizar confortavelmente as
Instalações sanitárias.
No entanto, Barber N. e Scarcelli J. M. (2009)(16) concluíram que a população
mais velha atribui uma maior importância às Instalações Sanitárias, ao contrário
do que se verificou neste estudo.
Quando abordados sobre as razões que levam o consumidor a revisitar o
estabelecimento verificou-se uma diferença significativa entre todos os aspetos
26
considerados (Atendimento, Qualidade alimentar, Conceitos relativas à segurança
alimentar e a Fidelização).
Hau-siu Chow et al (2007)(46) afirmaram que as habilitações dos funcionários são
cruciais para um serviço de alta qualidade. Hartline e Ferrell, (1996)(47) ; Iglesias e
Guillen, (2004)(48) afirmam que a avaliação da qualidade é influenciada pela
interação estabelecida entre o cliente e o funcionário. Este aspeto também se
verificou neste estudo em que os consumidores atribuíram a maior importância à
perceção do atendimento na qualidade do serviço e na intenção de revisitar, ao
contrário de Voon et al (2007), constataram que a qualidade do atendimento teve
um impacto relativamente pequeno sobre a satisfação e fidelização dos clientes
ao restaurante(49).
Os Homens atribuíram mais importância à qualidade do atendimento e a sua
influência na intenção de revisitar.
Relativamente à perceção da qualidade alimentar e à sua importância na
qualidade do serviço e à sua intenção de revisitar foram encontradas diferenças
significativas relativamente à fidelização, ao contrário do observado no estudo de
Hau-siu Chow et al, (2007)(46) onde não encontraram relação entre as mesmas.
Globalmente este aspeto foi o que obteve uma importância mais elevada
comparado com as outros aspetos considerados.
Tal como afirmou (Voon, 2012)(10) os clientes mais jovens são os mais satisfeitos
com a qualidade alimentar quando falamos na sua interação com a qualidade do
serviço, atribuindo-lhe uma maior pontuação, tal como verificado neste estudo,
nomeadamente no sexo feminino.
27
Assim como os restantes aspetos também os “Conceitos relativas à segurança
alimentar” afetam significativamente a intenção de revisitar o restaurante, tal como
afirmaram Lee et al, 2012)(35).
Nos Canadá vários estudos consideram a limpeza de um restaurante como um
bom indicador de segurança alimentar (Macaskill et al., 2000)(50) e Scarcelli
(2007)(51), tal como observámos neste estudo em que um dos pontos a classificar
nos conceitos (Anexos) foi a limpeza do restaurante.
Blackistone e Evans (2004)(52) afirmaram, ainda, que as Instalações sanitárias e
as cozinhas de um restaurante são um forte indicador da segurança alimentar.
Relativamente aos conceitos de segurança alimentar foi a população mais jovem
a atribuir maior importância a este aspeto e à sua influência na intenção de
revisitar o estabelecimento, como previamente referido por Scarcelli (2007)(51).
De acordo com Han e Ryu (2009)(21), a fidelização do cliente depende em grande
parte da satisfação do mesmo. Neste estudo conclui-se que a Fidelização afeta
significativamente a intenção de revisitar um restaurante.
Conclui-se ainda que foram os mais velhos a atribuir a maior classificação à
fidelização, ou seja tem uma tendência aumentada de revisitar o estabelecimento,
tal como, (Hau-siu Chow et al, 2007)(46) afirmaram, que pessoas com mais idade
apresentam maior fidelidade ao estabelecimento como resultado da inércia ou
hábito(46).

28
Conclusões
Com este estudo conclui-se que os aspetos percecionados pelo consumidor que
mais fortemente influenciam a sua avaliação da qualidade do serviço de um
restaurante são as “Instalações Sanitárias” e as “Condições de conforto à mesa”.
As mulheres mais jovens foram as que atribuíram maior importância às
“Instalações Sanitárias” e a sua associação com a qualidade de serviço. Já os
homens atribuíram às “Condições de conforto” um maior impacto na avaliação da
qualidade do serviço de num restaurante.
Globalmente os consumidores consideraram pouco importante na classificação da
qualidade do serviço, o “Interior das instalações”, aspeto mais evidente no sexo
masculino.
Os aspetos que os consumidores consideraram mais importantes na avaliação da
qualidade do serviço quando confrontados com a intenção de o revisitar foram, o
“Atendimento” e a “Qualidade Alimentar”.
Os homens mais jovens, são os mais exigentes, atribuindo maior classificação
relativa à qualidade do serviço e à sua intenção de revisitar, já no que diz respeito
à “Qualidade Alimentar” são as mulheres a valorizar mais este aspeto.
A fidelização foi o aspeto menos valorizado pelo consumidor, relativamente à
intenção de revisitar o estabelecimento.

29
Referências Bibliográficas
1. World Tourism Organization (UNWTO). "UNWTO Tourism Highights”. 2011. 2. Portugal Td. O Turimo na Economia - Evolução do contributo do Turismo para a economia portuguesa. 2011. 3. Costa C GC, Martins I, Mendes J, Brás M, Lopes N, Ventura T. Restaurant of the future. 2011. Disponível em: http://www.restaurantedofuturo.com/newsletter_final.pdf. 4. Akbay C, Tiryaki GY, Gul A. Consumer characteristics influencing fast food consumption in Turkey. Food Control. 2007; 18(8):904-13. 5. C. P. Efficient or enjoyable? Consumer values of eating-out and fast restaurant consumption in Korea. International Journal of Hospitality Management. 2004; 24 6. Medeiros CO, Cavalli SB, da Costa Proença RP. Human resources administration processes in commercial restaurants and food safety: The actions of administrators. International Journal of Hospitality Management. 2012; 31(3):667-74. 7. FAO/WHO. FAO/WHO regional conference on food safety for the Americas and the Caribbean—practical actions to promote food safety. Nations FaAOotU. Rome; 2006. 8. Ungku Fatimah UZA, Boo HC, Sambasivan M, Salleh R. Foodservice hygiene factors—The consumer perspective. International Journal of Hospitality Management. 2011; 30(1):38-45. 9. Shahid NSM, Whisson J. Effectiveness of the Tees Valley Food Hygiene Award Scheme towards Food Business Operators and Consumers in the Middleborough District. Procedia - Social and Behavioral Sciences. 2012; 49(0):368-80. 10. Voon BH. Role of Service Environment for Restaurants: The Youth Customers’ Perspective. Procedia - Social and Behavioral Sciences. 2012; 38(0):388-95. 11. Anderson E.W. FC, Lehmann D.R. Customer satisfaction, market share, and profitability: findings from Sweden. Journal of Marketing. 1994; 58(3):53-66. 12. Cheng C-C, Chen C-T, Hsu F-S, Hu H-Y. Enhancing service quality improvement strategies of fine-dining restaurants: New insights from integrating a two-phase decision-making model of IPGA and DEMATEL analysis. International Journal of Hospitality Management. 2012; 31(4):1155-66. 13. Luoh H-F, Tsaur S-H. Customers’ perceptions of service quality: Do servers’ age stereotypes matter? International Journal of Hospitality Management. 2011; 30(2):283-89. 14. Lockwood A, Jones P. Creating positive service encounters. The Cornell Hotel and Restaurant Administration Quarterly. 1989; 29(4):44-50. 15. Doménech E, Amorós JA, Pérez-Gonzalvo M, Escriche I. Implementation and effectiveness of the HACCP and pre-requisites in food establishments. Food Control. 2011; 22(8):1419-23. 16. Barber N. SJM. Clean restrooms: how important are they to restaurant consumers? Journal of Foodservice. 2009; 20(6):309-20. 17. P K. Atmospherics as a marketing tool. Journal of Retailing. 1973; 49(4):48-64.

30
18. R. M. Using background music to affect the behavior of supermarket shoppers. Journal of Marketing. 1982; 46(Summer):86-91. 19. R. M. The influence of background music on the behavior of restaurant patrons. Journal of Consumer Research 1986:286-89. 20. Wall E. A. BLL. The combined effects of the physical environment and employee behavior on customer perception of restaurant service quality. Cornell Hotel and Restaurant Administration Quarterly. 2007; 48:59. 21. Han H. RK. The roles of the physical environment, price perception, and customer satisfaction in determining customer loyalty in the restaurant industry. Journal of Hospitality & Tourism Research. 2009; 33:487. 22. C. Fornell C. JMD, Anderson E., Cha J., Bryant B.E. The American customer satisfaction index: Nature, purpose, and findings. Journal of Marketing. 1996; 60:7-18. 23. Ladhari R. BI, Morales M. Determinants of dining satisfaction and post-dining behavioral intentions. International Journal of Hospitality Management. 2008; 27:563-73. 24. McDougall G. LT. Customer satisfaction and future intentions: The role of perceived value and service quality. Journal of Services Marketing. 2000; 14:392-410. 25. Venetis K A GPN. Service quality and customer retention: building long-term relationships. European Journal of Marketing. 2004; 38(11/12):1577-98. 26. N. B. How self-confidence and knowledgeeffects the sources of information selected during purchase situations [Unpublished doctoral dissertation]. Lubbock, TX: Texas Tech University; 2008. 27. Kim W. NY, Kim Y. Influence of institutionalDINSERV on customer satisfaction, return intention, and word-of-mouth. International Journal of Hospitality Management. 2009; 28:10-7. 28. Ganesan-Lim C. R-BR, Dager T.,. The impact of the service contact type and demographic characteristics on service quality perceptions. Journal of Service Marketing. 2008; 22(7):550-61. 29. Al-Tamimi H.A.H. A-AA. Analysing service quality in the UAE Islamic banks. Journal of Financial Services Marketing. 2003; 8(2):119-32. 30. Kim WG, Moon YJ. Customers’ cognitive, emotional, and actionable response to the servicescape: A test of the moderating effect of the restaurant type. International Journal of Hospitality Management. 2009; 28(1):144-56. 31. Ariffin HF, Bibon MF, Abdullah RPSR. Restaurant's Atmospheric Elements: What the Customer Wants. Procedia - Social and Behavioral Sciences. 2012; 38(0):380-87. 32. Djekic I, Kane K., Tomic N., Kalogianni E., Rocha A., Zamioudi L., Pacheco R. Consumer perceptions of service quality in restaurants in four European cities. Belgrade: University of Belgrade – Faculty of Agriculture; 2013. 33. Barber N, Goodman RJ, Goh BK. Restaurant consumers repeat patronage: A service quality concern. International Journal of Hospitality Management. 2011; 30(2):329-36. 34. Ha J, Jang S. Effects of service quality and food quality: The moderating role of atmospherics in an ethnic restaurant segment. International Journal of Hospitality Management. 2010; 29(3):520-29. 35. Lee LE, Niode O, Simonne AH, Bruhn CM. Consumer perceptions on food safety in Asian and Mexican restaurants. Food Control. 2012; 26(2):531-38.

31
36. M.B. H. Consumer Research: Introspective Essays on the Study of Consumption. London; 1995. 37. Dube L. JMD, Renaghan L. M. Adapting the QFD approach to extended service transactions. Production and Operations Management. 1999; 8:301-17. 38. Knutson B. J. PME. Restaurants can find gold among silver hair: Opportunities in the 55+ market. Journal of Hospitality & Leisure Marketing. 1995; 1(3):79-90. 39. K. R. DINESCAPE, emotions, and behavioral intentions in upscale restaurants [Unpublished doctoral dissertation]. Manhattan, KS: Kansas State University; 2005. 40. Varki S. C, M. The role of price perceptions in an integrated model of behavioral intentions. Journal of Service Research. 2001; 3:232-40. 41. Bolton R. N. LKN. A dynamic model of customers’ usage of services: Usage as an antecedent and consequence of satisfaction. Journal of Marketing Research. 1999; 36:171-86. 42. Nguyen N. LG. Contact personnel, physical environment and the perceived corporate image of intangible services by new clients. International Journal of Service Industry Management. 2002; 13:242-62. 43. Reimer A. KR. The impact of servicescape on quality perception. European Journal of Marketing. 2005; 39:785-808. 44. Ryu K. JS. The effect of environmental perceptions on behavioral intentions through emotions: The case of upscale restaurants. Journal of Hospitality & Tourism Research. 2007; 31:56-72. 45. E N. Service suffers when yourrestroom is a toilet. Nation’s Restaurant News. 1997; 31:32. 46. Hau-siu Chow I, Lau VP, Wing-chun Lo T, Sha Z, Yun H. Service quality in restaurant operations in China: Decision- and experiential-oriented perspectives. International Journal of Hospitality Management. 2007; 26(3):698-710. 47. Hartline M. FO. The management of customer-contact service employees: an empirical investigation. Journal of Marketing. 1996; 20(4):52-70. 48. Iglesias M.P. GJY. Perceived quality and price: their impact on the satisfaction of restaurant customers. International Journal of Contemporary Hospitality Management. 2004; 16(6):373-79. 49. H. VB. Service environments of restaurants: Findings from the youth customers. Journal of Asian Behavioural Studies. 2011; 1(2):45-56. 50. al. MLe. An evaluability assessment to develop a restaurant health promotion program in Canada. Health Promotion International. 2000; 15:57-69. 51. J S. Clean restaurant restrooms: do they indicate a clean kitchen? West Lafayette, Indiana: Published Masters Thesis, Purdue University; 2007. 52. Blackiston H. EC. The lavatory laboratory. Restaurant Hospitality. 2004; 88:142-4.

32
Anexos 1

33

34
Anexos 2
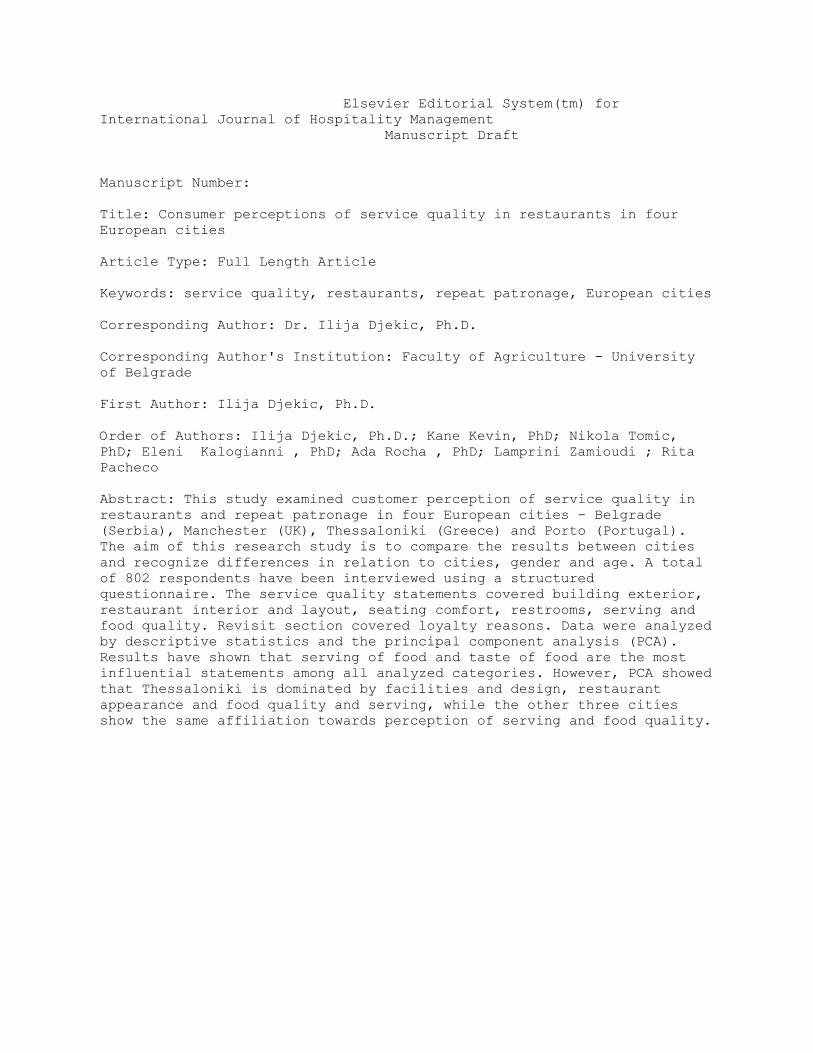
Artigo submetido à revista “International Journal of Hospitality Management” em Março 2013
Elsevier Editorial System(tm) for
International Journal of Hospitality Management
Manuscript Draft
Manuscript Number:
Title: Consumer perceptions of service quality in restaurants in four
European cities
Article Type: Full Length Article
Keywords: service quality, restaurants, repeat patronage, European cities
Corresponding Author: Dr. Ilija Djekic, Ph.D.
Corresponding Author's Institution: Faculty of Agriculture - University
of Belgrade
First Author: Ilija Djekic, Ph.D.
Order of Authors: Ilija Djekic, Ph.D.; Kane Kevin, PhD; Nikola Tomic,
PhD; Eleni Kalogianni , PhD; Ada Rocha , PhD; Lamprini Zamioudi ; Rita
Pacheco
Abstract: This study examined customer perception of service quality in
restaurants and repeat patronage in four European cities - Belgrade
(Serbia), Manchester (UK), Thessaloniki (Greece) and Porto (Portugal).
The aim of this research study is to compare the results between cities
and recognize differences in relation to cities, gender and age. A total
of 802 respondents have been interviewed using a structured
questionnaire. The service quality statements covered building exterior,
restaurant interior and layout, seating comfort, restrooms, serving and
food quality. Revisit section covered loyalty reasons. Data were analyzed
by descriptive statistics and the principal component analysis (PCA).
Results have shown that serving of food and taste of food are the most
influential statements among all analyzed categories. However, PCA showed
that Thessaloniki is dominated by facilities and design, restaurant
appearance and food quality and serving, while the other three cities
show the same affiliation towards perception of serving and food quality.

Dear Editor,
In cooperation with universities of Manchester, Thessaloniki and Porto we have performed a survey on
customer perception of service quality in restaurants and repeat patronage in four European cities –
Belgrade (Serbia), Manchester (UK), Thessaloniki (Greece) and Porto (Portugal). The aim of this
research study is to compare the results between cities and recognize differences in relation to cities,
gender and age. A total of 802 respondents have been interviewed using a structured questionnaire.
To the best of our knowledge this is the first paper that covers this type of survey in four different cities in
Europe.
On behalf of the co-authors, I am submitting the enclosed article titled: “Consumer perceptions of service
quality in restaurants in four European cities”, for possible publication in the International Journal of
Hospitality Management. It has not been submitted for publication nor has it been published in whole or
in part elsewhere.
Ilija Djekic, Ph.D.
Department of Food Safety and Quality Management
University of Belgrade – Faculty of Agriculture
Nemanjina 6, 11080 Belgrade, Republic of Serbia
Tel: + 381 65 512 78 48; fax: + 381 11 2199 711;
e-mail: [email protected]
Cover Letter

Title: Consumer perceptions of service quality in restaurants in four European
cities
Authors: Djekic Ilijaa, Kevin Kane
b, Tomic Nikola
a, Kalogianni Eleni P.
c, Rocha Ada
d,
Zamioudi Lamprinic, Pacheco Rita
d
Affiliation: a)
Department of Food Safety and Quality Management, Faculty of Agriculture,
University of Belgrade, Belgrade, Serbia
b)
Salford Business School, University of Salford, Manchester, UK
c)
Department of Food Technology, Alexander Technological Education
Institution of Thessaloniki, Thessaloniki, Greece
d)
Faculty of Nutrition and Food Science, University of Porto, Porto, Portugal
Corresponding author:
Name: Ilija Djekic
Address: Department of Food Safety and Quality Management
Faculty of Agriculture, University of Belgrade
Nemanjina 6
11080 Belgrade
Republic of Serbia
Email: [email protected]
Title Page, including Author Details

Highlights
- Survey on customer perception of service quality in restaurants and revisit
- Survey was performed in four European cities with 802 respondents
- Service quality statements covered exterior, interior, serving and food quality
- Revisit section covered loyalty reasons
- Serving of food and taste of food are the most influential statements
Highlights (for review)

Title: Consumer perceptions of service quality in restaurants in four European
cities
Abstract: This study examined customer perception of service quality in restaurants and
repeat patronage in four European cities – Belgrade (Serbia), Manchester (UK), Thessaloniki
(Greece) and Porto (Portugal). The aim of this research study is to compare the results between
cities and recognize differences in relation to cities, gender and age. A total of 802 respondents
have been interviewed using a structured questionnaire. The service quality statements covered
building exterior, restaurant interior and layout, seating comfort, restrooms, serving and food
quality. Revisit section covered loyalty reasons. Data were analyzed by descriptive statistics and
the principal component analysis (PCA). Results have shown that serving of food and taste of
food are the most influential statements among all analyzed categories. However, PCA showed
that Thessaloniki is dominated by facilities and design, restaurant appearance and food quality
and serving, while the other three cities show the same affiliation towards perception of serving
and food quality.
Key words: service quality, restaurants, repeat patronage, European cities
*Manuscript, excluding Author DetailsClick here to view linked References

1.0 Introduction
In a competitive environment, restaurants have to be customer oriented by identifying customer
needs that lead to their satisfaction and increased retention. Considering restaurant customers
there are three key attributes that contribute to overall satisfaction and leading to repeat patronage
– food (both quality and safety), setting (external and internal physical environment), and service
(Barber et al., 2011).
Several authors examined customers‟ demographic characteristics and found patterns in
behaviour, expectation and satisfaction (Barber and Scarcelli, 2009; Brady and Cronin, 2001;
Kim et al., 2009). Also several authors analyzed customer perceptions in various ethnic
restaurants through various factors and criterion (Ha and Jang, 2010; Jang et al., 2012; Lee et al.,
2012; Liu and Jang, 2009; Mueller et al., 2003; Nam and Lee, 2011). However, perception on
service quality in different cultures with different eating habits have not been analysed and
compared. Jensen assumes different ratings relative to restaurant meal consumption in
Scandinavian and Mediterranean countries (Jensen and Hansen, 2007).
Very little, if any, research has been undertaken to measure service quality of restaurants in
different cities (Table 1). Several authors confirmed that various components of restaurant service
quality function differently in terms of improving satisfaction and behavioral intentions (Ha and
Jang, 2010; Liu and Jang, 2009; Namkung, 2007). Also there have been identified some
differences between customers noting that differences in cultural attitudes and expectations exist
(Mueller et al., 2003). The aim of this research study is to discover and analyze, whether there is
any correlation between the consumer perception and customer repeat patronage in four different
European cities with the same samples and similar demographic characteristics in order to: (1)
compare the results and (2) recognize differences in relation to cities, gender and age.

1.1 City demographics
Belgrade is the capital city of the Republic of Serbia with the average estimated population of
1,775,000 in 2011. Land area of Belgrade covers 322,268 ha. In 2011, slightly over 600,000
tourists visited the capital, out of which 71% were foreigners. Unemployment rate is 14.4% with
the average salary of 430€. Belgrade offers 4,101 eating place with 172,127 seats at tables
structured as follows: pubs and bars (31.77%), restaurants (22.53%), buffets (9.68%), pizzerias
(9.22%), taverns (7.58%), hotels and other accommodation establishments (3,51%) and other
eating places (15,7%). Serbian restaurants had a turnover of 31.5 million € in 2011 (Belgrade,
2011).
Manchester is the largest city in the North West of England with a population of 503,000 (it is
part of the Greater Manchester conurbation which had a population of 2,682,000 in 2011). The
land area of the City of Manchester is 115 square kilometers. Manchester had 936,000 foreign
visitors in 2011. The Unemployment rate is approximately 5%; average pay is £19,992 per
annum or £400 per week. There are 4700 food service businesses in the City split 60% restaurant
and 40% take-away (Manchester, 2013).
Thessaloniki is the second biggest city in Greece with a population of 1,104,460 in 2011.
Average unemployment rate in Greece for 2012 was 24.7 %, while in Thessaloniki the rate is
estimated at 28.6% (Greece, 2013; OAED, 2013). The average gross annual salary for 2011 was
25,470 € (GSEE, 2013). According to estimations, Thessaloniki has 3,100 establishments
offering food excluding hotels and bars. Out of these eating places 41.8 % are different kinds of
restaurants and taverns (23.5 % are restaurants and taverns, 12.9 % are grills and 5.4 % ouzo and
mezze places), 9.2 % pizzerias, 41.8 % food deliveries and 7.2 % fast foods. Furthermore,

according to the same source and in addition to pure eating places Thessaloniki has 1,175 cafes
and bars many of them offering food (from snacks to full courses).
O Porto is a Portuguese city located in the northeast of Portugal, with an area of 41.66 km² with a
population of about 237,584 inhabitants (Portugal, 2011). In the north region of the country the
number of employees decreased 4.7% compared to the 3rd semester of 2011 (79.8 thousand
people) and the number of unemployed increased (25.6%; 71.3 mil). The association of these
figures determined an increase of the unemployment rate from 14.1% in the 4th trimester of 2011
to 17.8% in the same period of 2012. There are neither official data nor clear estimation of eating
places in Porto.
2.0 Materials and methods
Four European cities have been chosen in order to gain insights on consumer perception of
service quality in restaurants. The survey has been conducted from May 2012 until December
2012. A total of 802 respondents have been interviewed in the survey (Belgrade, Porto and
Thessaloniki 200 in each, and Manchester 202). The respondents were chosen to represent the
population that visits restaurants. The authors recognize that this method does not provide a truly
random sample, but instead, represents a „convenience sample‟ for further statistical processing.
A structured questionnaire was developed considering similar research realized in other countries
(Barber et al., 2011; Ha and Jang, 2010; Kim and Moon, 2009; Lee et al., 2012). This
questionnaire consists of two sections. First section included general demographic information
about respondents (gender and age) (Table 2). Second section explored statements divided into
two subsections covering perception on service quality and customer loyalty. The service quality
statements consisted of seven factors as follows: building exterior, restaurant interior, layout,

seating comfort, restrooms, serving and food quality. Revisit section covered loyalty reasons.
Grouped into separate segments, the statements are listed in Tables 3-6. Servicescape has been
defined as a quality indicator by several authors (Barber et al., 2011; Barber and Scarcelli, 2009;
Ha and Jang, 2010; Kim and Moon, 2009), and attributes of servicescape dimensions were used
as outlined in these articles.
In total, the questionnaire consisted of 49 statements and it took approximately seven minutes to
interview respondents. All statements gave the respondents the opportunity to rate their degree of
agreement with their perception on service quality according to a five-point Likert scale from 1
„strongly disagree‟, 2 „disagree‟, 3 „no opinion‟, 4 „agree‟ to 5 „strongly agree‟.
Main statistical processing considered calculation of means and standard deviations (Tables 3 –
6). Further, the data obtained were grouped into a matrix with the respondents as rows and the
statements as columns, and were averaged across the first seven segments of statements
(Exterior-Ex; Interior-In; Layout-La; Comfort-Co; Restrooms-Rr; Servicing-Se; and Food
quality-Fq). The last segment “reasons to revisit” was considered separately. The matrix of
calculated data, with 802 rows and 7 columns, was analyzed by the principal component analysis
method (PCA) using correlation matrix with Direct Oblimin rotation method with Kaiser
Normalization (SPSS Statistics 17.0). Bartlett‟s test of sphericity was significant (p < 0.000) and
also Kaiser-Meyer-Olkin measure of sampling adequacy was satisfactory (0.793). The first three
extracted principal components (PC), representing 67 % of total variance explained, were taken
into consideration in further analysis. Although the scree plot of the eigenvalues (not shown)
suggested the first two components (the second one was the point where eigenvalues stopped
decreasing rapidly), the third component was retained because of the strong correlation between
the component and the statements Se and Fq. In order to separate the groups of people with

similar attitude toward service quality in restaurants, hierarchical cluster analysis (HCA) by
Ward‟s method (SPSS Statistics 17.0) was applied to scores plots (Figures 1 – 3).
3.0 Results and Discussion
3.1 Exterior and interior
Results in Table 3 show that all statements regarding the exterior and interior influence the
perception of service quality. This holds for all four examined cities since averages are above 3.
Although in many cases standard deviations overlap, there is a trend for Thessaloniki showing
higher averages regarding the interior and exterior compared to the other cities. Analysis of
answers from all respondents shows that in Belgrade and Manchester overall appearance of
building exterior has a higher influence on perception of service quality than the other two
statements while in Porto and Thessaloniki, parking lot is the most important exterior factor
(Table 3). Gender appears to influence consumers‟ perception since females appreciate building
exterior while males point parking as the most important exterior factor. Younger visitors
consider parking more important than the older visitors pointing building exterior.
Restaurant interior analysis shows highest influence of decoration in restaurants and interior
decor (Table 3). Gender and age do not show any differentiation in the statement that interior
décor of the restaurant has the highest influence on perception of service quality in restaurants.
However, analysis by cities shows that in Manchester and Thessaloniki, decoration in the
restaurant is the most important factor, while in Porto the use of color in the décor scheme adds
excitement to restaurant environment.
3.2 Design and facilities
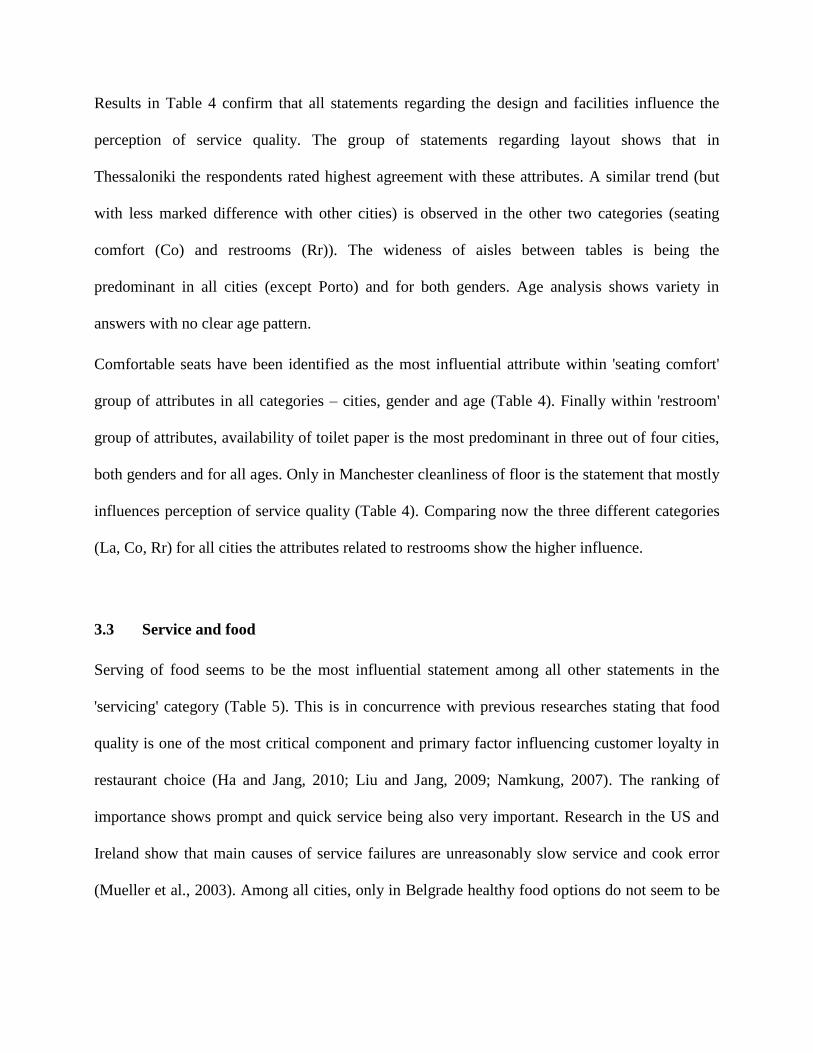
Results in Table 4 confirm that all statements regarding the design and facilities influence the
perception of service quality. The group of statements regarding layout shows that in
Thessaloniki the respondents rated highest agreement with these attributes. A similar trend (but
with less marked difference with other cities) is observed in the other two categories (seating
comfort (Co) and restrooms (Rr)). The wideness of aisles between tables is being the
predominant in all cities (except Porto) and for both genders. Age analysis shows variety in
answers with no clear age pattern.
Comfortable seats have been identified as the most influential attribute within 'seating comfort'
group of attributes in all categories – cities, gender and age (Table 4). Finally within 'restroom'
group of attributes, availability of toilet paper is the most predominant in three out of four cities,
both genders and for all ages. Only in Manchester cleanliness of floor is the statement that mostly
influences perception of service quality (Table 4). Comparing now the three different categories
(La, Co, Rr) for all cities the attributes related to restrooms show the higher influence.
3.3 Service and food
Serving of food seems to be the most influential statement among all other statements in the
'servicing' category (Table 5). This is in concurrence with previous researches stating that food
quality is one of the most critical component and primary factor influencing customer loyalty in
restaurant choice (Ha and Jang, 2010; Liu and Jang, 2009; Namkung, 2007). The ranking of
importance shows prompt and quick service being also very important. Research in the US and
Ireland show that main causes of service failures are unreasonably slow service and cook error
(Mueller et al., 2003). Among all cities, only in Belgrade healthy food options do not seem to be

of great influence on perception of service quality. Healthy options are significant predictors of
behavioral intention and revisits (Kim et al., 2012; Liu and Jang, 2009; Namkung, 2007).
Group of attributes within 'food quality' shows no difference in rating the statements in all cities.
They all agree that tasty food is the most influential attribute in all cities, for both genders and all
ages. All other attributes have the highest scores in Thessaloniki, with food portion being second
best (Table 5).
3.4 Re-visits
In order to evaluate customer loyalty, re-visits have been defined as the key trigger. According to
some authors, loyalty is defined as a commitment to repurchase or re-patronize a preferred
product or service (Evanschitzky et al., 2006; Ha and Jang, 2010; Oliver, 1999). Except in
Thessaloniki where serving is the most influential category and reason for re-visiting a restaurant,
all other cities, both genders and all ages agree that food quality seems to be the most influential
category, with all statements above 4.5 (Table 6).
Layout of the restaurant seems to be a category with the least influence for re-visiting restaurants,
among the respondents in Belgrade (as a city), among females and among people under 45 years
of age. Building exterior is the category with the least influence among the respondents in
Manchester, among men and among people above 45 years of age. Cities of Porto and
Thessaloniki ranked the lowest facility aesthetics‟ category as reasons for revisit (Table 6). This
can be supported by results from Jang stating that atmospherics (including interior and exterior
and facility aesthetics‟) lead to positive emotions only and do not contribute to perceived value
(Jang et al., 2012). On the other side, Ryu confirmed that there is a difference in behavior pattern
between first timers‟ and repeaters‟ concerning facility aesthetics (Ryu and Han, 2011).
3.5 Principal component analysis
PCA outputs for the experimental data matrix are shown in Figures 1 to 3. Dimension reduction
by PCA separated the observed factors into three distinct directions: facilities and design in
restaurant; restaurant appearance (exterior and interior); and food quality and serving. PC1 has
high positive loadings (> 0.7) on La, Co and Rr, PC3 (≥ 0.8) on Fq and Se, while PC2 has high
negative loadings (< -0.8) on Ex and In (Figure 1). There is a positive correlation between the
attributes within each of the three groups and virtually no correlation between the attributes from
different groups.
Comparing the scores plots (Figures 2 and 3) with the loadings plots (Figure 1) it is clear that the
most of observed demographic groups from Thessaloniki are dominated by all three extracted
components, which means that their perception of service quality in restaurants and all of the
observed factors are in direct variation, i.e. all of the observed parameters influence their
perception of service quality. On the other side, city of Porto (younger male citizens) is not
dominated by Ex and In, and also have small values of La, Co and Rr. This analysis has shown
that the cities of Manchester and Belgrade have similar characteristics (Figures 2a and 3a).
Taking into account serving and food quality, three of the cities Belgrade, Manchester and Porto
show the same affiliation towards perception of this category of service quality in restaurants,
Figures 2b and 3b.
4.0 Conclusion

Basic statistical analysis has shown that serving of food and taste of food are the most influential
statement among all analysed categories – city, gender, age. Also, all three categories identify
comfortable seats as the most influential attribute within 'seating comfort' group of attributes.
Three cities (except Porto) with similar level of agreement are identified in 'layout' category with
wideness of aisles between tables. Availability of toilet paper is the most predominant in three
out of four cities with Manchester identifying cleanliness of floor as the most important attribute
within 'restrooms' category. In Belgrade, healthy food doesn‟t have a great influence on
perception of service quality. In Thessaloniki, serving is the most influential reason for re-visit
while in all other cities food quality seems to be the most influential category.
Divided opinion on the most influential attributes is seen in Belgrade and Manchester where
overall building exterior has a higher influence on perception of service quality compared to
parking lot in Porto and Thessaloniki. In Manchester and Thessaloniki, restaurant decoration is a
more important 'interior' attribute than in Porto where it is the use of colour in the décor scheme.
Gender and age do not show much differences, except in the case of 'exterior' category where
females appreciate building exterior while males point parking as the most important attribute.
Younger visitors consider parking lot more important than the older visitors that point building
exterior while in 'layout' age analysis shows greatest variety in answers.
PCA and its deployment through scores plots show that Thessaloniki is dominated by the three
extracted components - facilities and design, restaurant appearance and food quality and serving.
City of Porto is not dominated by restaurant appearance, and has small values of facilities and
design. Taking into account serving and food quality, three of the cities Belgrade, Manchester
and Porto show the same affiliation towards perception of this category of service quality in
restaurants.

Limitations of the research stem from the use of a convenience sample. Since the data were
collected from four cities, the current result should not be generalized. Given the great cultural
and other differences within four cities, more research is necessary to determine if similar results
would be derived from different samples across various other continental and Mediterranean
European cities. This study did not attempt to specify hypothesis regarding profile of an average
European restaurant customer because of the lack of theoretical support in the previous literature.
References
Akbay, C., Tiryaki, G.Y., Gul, A., 2007. Consumer characteristics influencing fast food consumption in
Turkey. Food Control 18, 904-913.
Ariffin, H.F., Bibon, M.F., Abdullah, R.P.S.R., 2012. Restaurant's Atmospheric Elements: What the
Customer Wants. Procedia - Social and Behavioral Sciences 38, 380-387.
Barber, N., Goodman, R.J., Goh, B.K., 2011. Restaurant consumers repeat patronage: A service quality
concern. International Journal of Hospitality Management 30, 329-336.
Barber, N., Scarcelli, J.M., 2009. Clean restrooms: how important are they to restaurant consumers?
Journal of Foodservice 20, 309-320.
Belgrade, 2011. Statistical yearbook of Belgrade. The City of Belgrade - City Administration, Institute for
Informatics and Statistics, Belgrade.
Brady, M.K., Cronin, J.J., Jr., 2001. Some new thoughts on conceptualizing perceived service quality: A
hierarchical approach. Journal of Marketing 65, 34-49.
Cheng, C.-C., Chen, C.-T., Hsu, F.-S., Hu, H.-Y., 2012. Enhancing service quality improvement strategies
of fine-dining restaurants: New insights from integrating a two-phase decision-making model of IPGA and
DEMATEL analysis. International Journal of Hospitality Management 31, 1155-1166.

Evanschitzky, H., Iyer, G.R., Plassmann, H., Niessing, J., Meffert, H., 2006. The relative strength of
affective commitment in securing loyalty in service relationships. Journal of Business Research 59, 1207-
1213.
Greece, 2013. Statistical data of the Hellenic Republic Hellenic Statistical Authority, Athens.
GSEE, 2013. Greek economy and employment, annual report 2012. Intitute of Employment of GSEE.
Ha, J., Jang, S., 2010. Effects of service quality and food quality: The moderating role of atmospherics in
an ethnic restaurant segment. International Journal of Hospitality Management 29, 520-529.
Hau-siu Chow, I., Lau, V.P., Wing-chun Lo, T., Sha, Z., Yun, H., 2007. Service quality in restaurant
operations in China: Decision- and experiential-oriented perspectives. International Journal of Hospitality
Management 26, 698-710.
Heung, V.C.S., Gu, T., 2012. Influence of restaurant atmospherics on patron satisfaction and behavioral
intentions. International Journal of Hospitality Management 31, 1167-1177.
Jang, S., Ha, J., Park, K., 2012. Effects of ethnic authenticity: Investigating Korean restaurant customers
in the U.S. International Journal of Hospitality Management 31, 990-1003.
Jang, S., Namkung, Y., 2009. Perceived quality, emotions, and behavioral intentions: Application of an
extended Mehrabian–Russell model to restaurants. Journal of Business Research 62, 451-460.
Jensen, Ø., Hansen, K.V., 2007. Consumer values among restaurant customers. International Journal of
Hospitality Management 26, 603-622.
Kim, H.J., Park, J., Kim, M.-J., Ryu, K., 2012. Does perceived restaurant food healthiness matter? Its
influence on value, satisfaction and revisit intentions in restaurant operations in South Korea. International
Journal of Hospitality Management.

Kim, W.G., Moon, Y.J., 2009. Customers‟ cognitive, emotional, and actionable response to the
servicescape: A test of the moderating effect of the restaurant type. International Journal of Hospitality
Management 28, 144-156.
Kim, W.G., Ng, C.Y.N., Kim, Y.-s., 2009. Influence of institutional DINESERV on customer satisfaction,
return intention, and word-of-mouth. International Journal of Hospitality Management 28, 10-17.
Lee, L.E., Niode, O., Simonne, A.H., Bruhn, C.M., 2012. Consumer perceptions on food safety in Asian
and Mexican restaurants. Food Control 26, 531-538.
Liu, Y., Jang, S., 2009. Perceptions of Chinese restaurants in the U.S.: What affects customer satisfaction
and behavioral intentions? International Journal of Hospitality Management 28, 338-348.
Luoh, H.-F., Tsaur, S.-H., 2011. Customers‟ perceptions of service quality: Do servers‟ age stereotypes
matter? International Journal of Hospitality Management 30, 283-289.
Manchester, 2013. Manchester city Council official web site.
Mueller, R.D., Palmer, A., Mack, R., McMullan, R., 2003. Service in the restaurant industry: an American
and Irish comparison of service failures and recovery strategies. International Journal of Hospitality
Management 22, 395-418.
Nam, J.-H., Lee, T.J., 2011. Foreign travelers‟ satisfaction with traditional Korean restaurants.
International Journal of Hospitality Management 30, 982-989.
Namkung, Y., Jang, S., 2007. Does food quality really matter in restaurant: its impact of customer
satisfaction and behavioral intentions? Journal of Hospitality and Tourism Research 31, 387–410.
OAED, 2013. Report on employment and unemployment. Manpower Employment Organization of
Greece Athens.
Oliver, R.L., 1999. Whence consumer loyalty? Journal of Marketing 63, 33-44.
Portugal, 2011. Cenzus 2011. Instituto Nacional de Estatística, Portugal Lisabon.

Qin, H., Prybutok, V.R., 2009. Service quality, customer satisfaction, and behavioral intentions in fast-
food restaurants. International Journal of Quality and Service Sciences 1, 78-95.
Ryu, K., Han, H., 2011. New or repeat customers: How does physical environment influence their
restaurant experience? International Journal of Hospitality Management 30, 599-611.
Tse, A.C.B., Sin, L., Yim, F.H.K., 2002. How a crowded restaurant affects consumers‟ attribution
behavior. International Journal of Hospitality Management 21, 449-454.
Voon, B.H., 2012. Role of Service Environment for Restaurants: The Youth Customers‟ Perspective.
Procedia - Social and Behavioral Sciences 38, 388-395.

Figure 1. Principal component analysis loadings plots for the seven segments of parameters influencing perception of service quality in restaurants in four European cities. Rotation method: Direct Oblimin with Kaiser Normalization. The three extracted components explain 67 % of total variance. (a): PC1-PC2 projected space; (b): PC1-PC3 projected space. Ex: Exterior; In: Interior; La: Layout; Co: Comfort; Rr: Restrooms; Se: Servicing; Fq: Food quality.
Figure

Figure 2. Principal component analysis scores plots for the 40 demographic groups of respondents in four European cities. Regression factor scores were averaged across presented demographic groups and then plotted in the charts. Rotation method: Direct Oblimin with Kaiser Normalization. The three extracted components explain 67 % of total variance. (a): PC1-PC2 projected space; (b): PC1-PC3 projected space. The first label digit (city): B: Belgrade, M: Manchester, P: Porto, T: Thessaloniki; the second label digit (gender): F: Female, M: Male; the third label digit (age): 1: ≤24, 2: 25-34, 3: 35-44, 4: 45-54, 5: ≥55. Cluster analysis: Ward’s HCA method.

Figure 3. Principal component analysis scores plots for the 11 demographic groups of respondents in four European cities. Regression factor scores were averaged across presented demographic groups and then plotted in the charts. Rotation method: Direct Oblimin with Kaiser Normalization. The three extracted components explain 67 % of total variance. (a): PC1-PC2 projected space; (b): PC1-PC3 projected space. Age1: ≤24, Age2: 25-34, Age3: 35-44, Age4: 45-54, Age5: ≥55. Cluster analysis: Ward’s HCA method.

Table 1 – Summary of studies covering perception of various categories of service quality in restaurants
Authors Type of research Sample
(Lee et al., 2012) Food safety perception in Asian and
Mexican restaurants in the US On-line survey - 994 responses
(Ariffin et al., 2012) Customer perception on restaurant’s
atmospheric elements 300 respondents from Malasia
(Jang et al., 2012) Perception of service quality of Korean
restaurant customers in the US 517 respondents
(Heung and Gu, 2012) Influence of restaurant atmospherics 118 respondents from 10 restaurants
in Hong Kong
(Voon, 2012) Youth Customers’ Perspective 407 respondents from Malasia
(Cheng et al., 2012) Service quality in fine-dining
restaurants
502 respondents from eight
restaurants in Taiwan
(Kim et al., 2012)
Influence of food healthiness on value,
satisfaction and revisit intentions in
restaurants in South Korea
405 respondents from six local
restaurants in South Korea.
(Barber et al., 2011)
Consumers repeat patronage related to
restaurant cleanliness in three region in
the US
280 respondents
(Ryu and Han, 2011) Influence of physical environment on
satisfaction and loyalty 310 respondents from South Korea
(Luoh and Tsaur, 2011) Customers’ perceptions of service
quality related to servers’ age 406 respondents from Taiwan
(Nam and Lee, 2011) Foreign travelers’ satisfaction with
Korean restaurants 181 respondents
(Ha and Jang, 2010) Role of atmospherics in Korean
restaurants in the US On-line survey – 607 responses
(Liu and Jang, 2009)
Customer satisfaction and behavioral
intentions in Chinese restaurants in the
US
284 respondents from three Chinese
restaurants
(Kim and Moon, 2009) Customers’ perception on servicescape
in Canada 220 respondents
(Qin and Prybutok, 2009) Service quality in fast-food restaurants
in the US 282 respondents
(Jang and Namkung, 2009) Perceived quality, emotions, and
behavioral intentions in restaurants 290 respondents
(Jensen and Hansen, 2007) Consumer values in restaurants Seven interviews in Norwegian a` la
Carte restaurants
(Hau-siu Chow et al., 2007) Service quality in Chinese restaurants 284 respondents from two
restaurants in China
(Akbay et al., 2007) Service quality in fast-food restaurants
in Turkey 384 respondents
(Mueller et al., 2003) Service failures and recovery strategies
in the US and Ireland
392 US and 327 Irish restaurant
patrons
(Tse et al., 2002) Consumers’ attribution behavior in
crowded restaurant
300 respondents from four districts
in Hong Kong
Table

Table 2. Demographic characteristics of samples
Characteristic Category Belgrade Manchester Thessaloniki Porto Total
Gender Male 86 (43.0%) 94 (46.5%) 100 (50.0%) 103 (52.5%) 383 (47.8%)
Female 114 (57.0%) 108 (53.5%) 100 (50.0%) 97 (48.5%) 419 (52.2%)
Age 24 or younger 44 (22.0%) 45 (22.3%) 40 (20.0%) 18 (9%) 147 (18.3%)
25 - 34 50 (25.0%) 40 (19.8%) 40 (20.0%) 75 (37.5%) 205 (25.6%)
35 – 44 50 (25.0%) 35 (17.3%) 40 (20.0%) 57 (28.5%) 182 (22.7%)
45 – 54 32 (16.0%) 38 (18.8%) 40 (20.0%) 25 (12.5%) 135 (16.8%)
55 or older 24 (12.0%) 44 (21.8%) 40 (20.0%) 25 (12.5%) 133 (16.6%)
Average annual restaurant visit 1 – 2 20 (10.0%) 12 (5.9%) 2 (1.0%) 13 (6.5%) 47 (5.9%)
3 – 4 18 (9.0%) 10 (5.0%) 10 (5.0%) 66 (33.0%) 104 (13.0%)
5 – 6 30 (15.0%) 39 (19.3%) 30 (15.0%) 12 (6.0%) 111 (13.8%)
7 – 8 15 (7.5%) 31 (15.3%) 16 (8.0%) 13 (6.5%) 75 (9.4%)
9 - 10 28 (14.0%) 14 (6.9%) 39 (19.5%) 18 (9.0%) 99 (12.3%)
Over 10 89 (44.5%) 96 (47.5%) 103 (51.5%) 78 (39.0%) 366 (45.6%)
Expressed values represent the sample (N) and [%]

Table 3. Perception of service quality in restaurants in four European cities influenced by exterior and interior
Statements Belgrade Manchester Porto
Thessaloni
ki Female Male
Age
≤ 24 25 – 34 35 – 44 45 – 54 ≥ 55
Sample size: 200 202 200 200 419 383 147 205 182 135 133
1. Building exterior has influence on
customer's perception of service quality
(Ex):
Landscaping and driveway 4.01±0.73 3.83±0.87 3.56±0.92 4.40±0.65 3.96±0.83 3.94±0.88 3.77±0.74 4.05±0.91 3.97±0.78 3.80±0.90 4.11±0.89
Overall appearance of building exterior
(paint, age, etc.) 4.26±0.73 4.02±0.86 3.61±0.92 4.37±0.64 4.09±0.81 4.04±0.89 3.89±0.81 4.13±0.94 4.10±0.76 3.91±0.88 4.26±0.76
Parking lot 3.92±0.77 3.59±1.09 3.95±0.99 4.67±0.64 3.96±1.00 4.10±0.94 3.94±0.85 4.15±1.03 4.09±0.92 3.96±1.02 3.93±1.02
2. Facility aesthetics’ has influence on
customer's perception of service quality
(In):
The restaurant’s architecture 3.77±0.90 3.63±0.87 3.35±1.04 4.07±0.56 3.74±0.91 3.67±0.88 3.59±0.97 3.77±0.77 3.73±0.83 3.53±0.91 3.86±1.03
Decoration in the restaurant 4.02±0.83 3.95±0.82 3.34±0.98 4.20±0.69 3.97±0.90 3.77±0.88 3.86±0.95 4.01±0.90 3.72±0.87 3.74±0.82 4.03±0.90
The use of color in the décor scheme adds
excitement to restaurant environment 3.98±0.74 3.61±0.92 3.56±1.04 4.04±0.65 3.88±0.87 3.70±0.87 3.80±0.88 3.97±0.81 3.70±0.78 3.61±0.91 3.85±1.00
The interior décor of the restaurant 4.13±0.78 3.92±0.82 3.52±1.00 4.17±0.72 4.05±0.85 3.81±0.89 3.94±0.89 4.01±0.88 3.84±0.83 3.82±0.90 4.05±0.87
The calculated values present the mean value ± standard deviation (five-point Likert scale: 1 = “strongly disagree”, 3 = “no opinion”, 5 = “strongly agree”)

Table 4. Perception of service quality in restaurants in four European cities influenced by design and facilities
Statements Belgrade Manchester Porto Thessaloni
ki
Female Male Age
≤ 24 25 – 34 35 – 44 45 – 54 ≥ 55
Sample size: 200 202 200 200 419 383 147 205 182 135 133
3. Layout impact has influence on
customer's perception of service quality
(La):
The wideness of aisles between the tables 3.82±0.91 3.80±1.10 3.61±0.92 4.48±0.57 3.97±0.94 3.88±0.97 3.84±1.03 3.89±0.94 4.05±0.77 3.84±1.03 4.00±1.02
The signs in restaurant's environment
providing adequate direction 3.79±0.91 3.45±0.86 3.98±0.93 4.33±0.64 3.89±0.88 3.87±0.93 3.85±0.92 3.91±0.90 3.93±0.84 3.85±0.91 3.84±0.95
The number of tables does not make the
environment difficult to navigate 3.77±1.01 3.64±0.82 3.73±1.07 4.38±0.55 3.89±0.92 3.87±0.95 3.65±1.02 3.94±0.92 3.90±0.89 3.94±0.93 3.95±0.89
4. Seating comfort has influence on
customer's perception of service quality
(Co):
Chairs enabling comfortable distance from
the table 3.93±0.78 3.82±0.82 4.07±0.87 4.46±0.56 4.02±0.79 4.12±0.81 3.86±0.84 4.17±0.78 3.96±0.79 4.11±0.75 4.26±0.79
Comfortable seats 4.22±0.68 4.08±0.76 4.37±0.77 4.69±0.47 4.31±0.73 4.38±0.70 4.28±0.74 4.41±0.73 4.29±0.76 4.30±0.68 4.41±0.65
Easy get in and out of the seats 3.76±0.87 3.92±0.87 3.86±0.99 4.48±0.50 3.99±0.86 4.02±0.89 3.86±0.96 4.11±0.82 3.95±0.80 3.96±0.89 4.11±0.92
The seat arrangements providing plenty of
space 3.83±0.81 3.99±0.91 3.93±1.02 4.52±0.57 4.04±0.91 4.09±0.85 3.86±0.93 4.14±0.93 3.99±0.77 4.04±0.87 4.29±0.86
5. Restrooms have influence on customer's
perception of service quality (Rr):
Availability of toilet paper 4.7±0.52 4.31±1.03 4.79±0.48 4.97±0.17 4.72±0.68 4.66±0.67 4.63±0.80 4.73±0.65 4.72±0.59 4.69±0.67 4.66±0.68
Availability of hot water 4.46±0.76 4.19±0.94 3.82±1.19 4.36±0.71 4.30±0.93 4.10±0.97 4.12±0.94 4.34±0.89 4.19±0.98 3.99±1.05 4.33±0.88
Availability of hand washing soap 4.63±0.59 4.46±0.94 4.22±1.02 4.91±0.29 4.59±0.81 4.51±0.80 4.49±0.86 4.64±0.80 4.57±0.69 4.52±0.90 4.50±0.79
Availability of paper towel/drying devices 4.66±0.54 4.37±0.92 4.41±0.85 4.88±0.33 4.63±0.72 4.52±0.73 4.56±0.71 4.66±0.73 4.51±0.68 4.56±0.81 4.57±0.71
Condition of trash bin (full, dirty, clean,
etc.) 4.55±0.63 4.38±0.90 4.07±1.02 4.74±0.51 4.53±0.81 4.33±0.84 4.45±0.80 4.53±0.75 4.36±0.86 4.35±0.93 4.45±0.81
Cleanliness of floor (slipper, dirty, etc.) 4.59±0.59 4.54±0.75 4.12±1.04 4.62±0.56 4.56±0.78 4.36±0.78 4.48±0.66 4.56±0.72 4.31±0.85 4.42±0.93 4.56±0.73
The calculated values present the mean value ± standard deviation (five-point Likert scale: 1 = “strongly disagree”, 3 = “no opinion”, 5 = “strongly agree”)

Table 5. Perception of service quality in restaurants in four European cities influenced by service and food
Statements Belgrade Manchester Porto Thessaloni
ki
Female Male Age
≤ 24 25 – 34 35 – 44 45 – 54 ≥ 55
Sample size: 200 202 200 200 419 383 147 205 182 135 133
6. Servicing has influence on customer's
perception of service quality (Se)
Serving food exactly as I ordered 4.51±0.65 4.68±0.70 4.66±0.60 5.00±0.00 4.65±0.66 4.78±0.49 4.71±0.56 4.78±0.58 4.70±0.59 4.64±0.60 4.70±0.60
Prompt and quick service 4.47±0.65 4.30±0.74 4.30±0.80 5.00±0.00 4.47±0.72 4.56±0.66 4.41±0.70 4.64±0.64 4.53±0.74 4.47±0.74 4.47±0.63
Healthy food options 3.66±0.98 4.11±0.84 4.18±0.85 4.74±0.57 4.16±0.86 4.18±0.96 4.05±0.93 4.18±0.84 4.23±0.92 4.16±0.99 4.22±0.88
Variety of menu 4.01±0.92 4.23±0.83 4.31±0.82 4.90±0.30 4.29±0.88 4.44±0.76 4.32±0.80 4.46±0.72 4.36±0.89 4.26±0.94 4.35±0.81
7. Food quality has influence on customer's
perception of service quality (Fq):
Tasty food 4.85±0.36 4.55±0.75 4.73±0.58 5.00±0.00 4.77±0.58 4.79±0.48 4.76±0.56 4.82±0.50 4.74±0.61 4.79±0.51 4.77±0.45
Smell of food 4.58±0.58 4.29±0.80 4.18±1.07 4.86±0.35 4.49±0.76 4.46±0.83 4.33±0.93 4.55±0.64 4.53±0.78 4.50±0.83 4.44±0.82
Visual appearance of food on the plate 4.24±0.77 4.26±0.85 4.10±1.08 4.84±0.46 4.38±0.83 4.33±0.91 4.23±0.90 4.43±0.85 4.31±0.96 4.29±0.85 4.52±0.71
Food portion (enough, satisfying my
hunger)
4.03±0.89 4.22±0.76 4.17±1.00 4.97±0.18 4.29±0.88 4.41±0.83 4.22±0.81 4.49±0.80 4.26±0.97 4.41±0.86 4.31±0.79
The calculated values present the mean value ± standard deviation (five-point Likert scale: 1 = “strongly disagree”, 3 = “no opinion”, 5 = “strongly agree”)

Table 6. Respondents attitudes toward decision to re-visit
Statements Belgrade Manchester Porto Thessaloni
ki
Female Male Age
≤ 24 25 – 34 35 – 44 45 – 54 ≥ 55
Sample size: 200 202 200 200 419 383 147 205 182 135 133
8. Re-visit reasons (loyalty)
I will re-visit because of building exterior 3.27±1.01 3.19±1.05 3.11±1.11 3.45±1.09 3.33±1.06 3.17±1.08 3.22±0.96 3.04±1.05 3.53±1.1 2.97±1.04 3.51±1.08
I will re-visit because of facility aesthetics’ 3.40±1.01 3.48±1.05 3.08±1.05 3.38±1.01 3.45±1.00 3.20±1.07 3.27±1.01 3.06±1.01 3.50±1.02 3.17±1.02 3.75±1.02
I will re-visit because of layout 2.91±0.96 3.34±1.01 3.39±1.07 3.44±1.02 3.33±1.02 3.20±1.05 3.19±0.94 2.94±0.94 3.41±1.05 3.22±0.98 3.71±1.14
I will re-visit because of seating comfort 3.10±0.96 3.39±0.96 3.99±0.91 3.53±0.99 3.49±0.97 3.50±1.05 3.42±0.97 3.16±0.99 3.73±0.94 3.47±0.98 3.83±1.01
I will re-visit because of restroom 3.28±1.06 3.46±1.02 3.04±1.30 3.59±1.05 3.39±1.09 3.28±1.18 3.31±1.11 3.02±1.07 3.62±1.18 3.27±1.09 3.56±1.09
I will re-visit because of server 3.43±1.05 3.80±0.95 3.80±1.19 4.18±0.87 3.79±1.05 3.81±1.06 3.69±1.13 3.67±1.06 3.94±1.02 3.76±1.06 3.98±0.95
I will re-visit because of serving 3.93±0.80 4.03±0.87 4.38±0.87 4.88±0.33 4.29±0.83 4.32±0.85 4.25±0.91 4.30±0.88 4.40±0.81 4.16±0.87 4.38±0.65
I will re-visit because of food quality 4.73±0.51 4.56±0.79 4.60±0.69 4.85±0.36 4.67±0.64 4.70±0.60 4.75±0.55 4.72±0.57 4.71±0.58 4.54±0.82 4.65±0.58
I will re-visit because of food safety 4.39±0.73 4.29±0.76 4.41±0.72 4.62±0.56 4.42±0.72 4.43±0.69 4.50±0.57 4.37±0.82 4.46±0.64 4.34±0.82 4.47±0.60
I will re-visit because of the price 4.07±0.94 3.94±0.95 4.46±0.84 4.81±0.40 4.30±0.90 4.34±0.86 4.24±0.91 4.53±0.79 4.36±0.85 4.28±0.93 4.05±0.89
The calculated values present the mean value ± standard deviation (five-point Likert scale: 1 = “strongly disagree”, 3 = “no opinion”, 5 = “strongly agree”)