ministério de minas e energia consulta pública 004/2017...
TRANSCRIPT

Página 1 de 5
Consulta Pública 004/2017/DDE/SPE/MME Ministério de Minas e Energia
FICHA DE CONTRIBUIÇÃO
Portaria Interministerial
“Regulamentação Específica e Programa de Metas para Condicionadores de Ar”
Proponente Gilberto De Martino Jannuzzi E-mail [email protected]
Instituição International Energy Initiative – IEI Brasil Telefone (19) 3397-5200
Data 25/11/2017
Referência
(artigo)
ALTERAÇÃO / INCLUSÃO
Texto atual Nova redação proposta Justificativa
Art. 8° do Anexo
Até as datas estabelecidas no art. 5º, os referidos Equipamentos ficam sujeitos aos níveis mínimos de eficiência energética estabelecidos pela Portaria Interministerial MME/MCTIC/MDIC nº 323, de 26 de maio de 2011.
Até as datas estabelecidas no art. 4º, os referidos Equipamentos ficam sujeitos aos níveis mínimos de eficiência energética estabelecidos pela Portaria Interministerial MME/MCTIC/MDIC nº 323, de 26 de maio de 2011.
O Art. 5°, tal como está no texto original, não faz referência alguma a datas. A lógica são as datas constantes no Art. 4°, quando então passam a valer os níveis mínimos estabelecidos no Art. 3° da minuta de Portaria ora em Consulta Pública.
Arts. 8º e 9º do Anexo
Acrescentar artigo entre os artigos 8º e 9º: Art. ** Novos níveis mínimos de eficiência energética serão estabelecidos para entrada em vigor no máximo a cada quatro anos para os mencionados Condicionadores de Ar a partir de 1° de janeiro de 2018.
O novo Programa de Metas, que é o Anexo da minuta de Portaria objeto da atual Consulta Pública, retirou do texto diversos dispositivos importantes que haviam no Anexo (Programa de Metas) atualmente vigente (Portaria MME/MCT/MDIC n° 323, de 26 de maio de 2011), a ser substituído por este ora em Consulta. Portanto, é importante reintroduzi-los.
Um desses dispositivos importantes retirados é o que garante a periodicidade de 4 anos para entrada em vigor de novos níveis

Página 2 de 5
Consulta Pública 004/2017/DDE/SPE/MME Ministério de Minas e Energia
§ 1º. Especificamente para a próxima revisão, o prazo máximo para a entrada em vigor dos novos níveis mínimos de eficiência energética será 1° de janeiro de 2020. § 2º. Para subsidiar o estabelecimento dos níveis mínimos das próximas revisões, serão desenvolvidos estudos de impacto regulatório. § 3º. Ficam previstos como novos níveis mínimos de eficiência energética pelo menos os valores mínimos da penúltima faixa de classificação do Programa Brasileiro de Etiquetagem - PBE, vigentes à data da revisão.
mínimos de eficiência energética a partir de 1° de janeiro de 2012 (Art. 6° da Portaria MME/MCT/MDIC n° 323/2011). O ideal seria que essa periodicidade estivesse contida em um novo artigo da própria Portaria em Consulta, não dentro de seu Anexo (Programa de Metas), pois este é substituído ao longo do tempo. Porém, nesse atual momento, apenas trazer de volta a periodicidade tal como se encontra na acima mencionada Portaria n° 323/2011 é por ora suficiente. Sendo assim, propõe-se reintroduzir a periodicidade nesse novo artigo proposto.
Também se permite acelerar o processo de inovação dos equipamentos, se necessário, ao se acrescentar o termo “no máximo”.
A proposição desse § 1º advém do atraso que houve no estabelecimento dos novos níveis mínimos de eficiência energética, que deveriam ter entrado em vigor em 1° de janeiro de 2016 conforme a mencionada Portaria n° 323/2011. Sendo assim, para que não haja prejuízo da data para entrada em vigor dos próximos níveis mínimos, ou seja, em 1º de janeiro de 2020 (a cada quatro anos a partir de 1° de janeiro de 2012), este parágrafo primeiro estabelece esse prazo.
A proposição desse § 2º parte do fato de que não fica claro se inovações importantes que já estão disponíveis estão sendo incorporadas por esses níveis mínimos propostos a custos compatíveis com a realidade tanto da indústria nacional como dos consumidores (incluindo os custos evitados com a economia de eletricidade). Sendo assim, para que fique claro para a sociedade como um todo e para os agentes interessados, é fundamental que a partir da revisão dos próximos níveis mínimos sejam realizados estudos de impacto regulatório.
Neste documento, ao final, encontra-se um artigo publicado analisando um procedimento para escolha de nível mínimo de eficiência energética para geladeiras baseado em metodologia desenvolvida pela CLASP – “Collaborative Labeling & Appliance Standards Program” (VENDRUSCULO et al, 2009). Este é um procedimento no qual se demonstra de forma clara os custos e

Página 3 de 5
Consulta Pública 004/2017/DDE/SPE/MME Ministério de Minas e Energia
benefícios de novos índices ao longo da vida útil dos novos equipamentos e que torna o processo mais transparente para toda a sociedade. O artigo ilustra o caso de se escolher nível mínimo de eficiência energética para refrigeradores a partir de um conjunto de inovações técnicas, seus custos e potencial de economias. Esse tipo de impacto regulatório foi realizado para a Portaria que está nessa consulta?
A proposição do § 3º é reintroduzir outro dispositivo que havia na mencionada Portaria n° 323/2011 e que foi retirado da minuta ora em Consulta Pública. Esse parágrafo é importante porque caso não seja obedecido o prazo máximo de entrada em vigor dos níveis mínimos de eficiência energética, ao menos automaticamente será dado um incremento. Sem esse parágrafo, essa garantia mínima é retirada, o que seria um prejuízo do ponto de vista de um mínimo de trajetória crescente na eficiência energética dos equipamentos no país.
Art. 9º do Anexo
Art. 9º Cada revisão dos níveis mínimos de eficiência energética será precedida de Consulta Pública e terá sua aplicação condicionada a aprovação prévia do Comitê Gestor de Indicadores e Níveis de Eficiência Energética - CGIEE.
Acrescentar parágrafo único ao artigo 9º: Parágrafo único. O estudo de impacto regulatório deverá ser disponibilizado juntamente com a minuta de proposta de Portaria para consulta pública.
Em linha com a proposição de inclusão do § 2º feita acima, que justifica ser fundamental que a partir da revisão dos próximos níveis mínimos sejam realizados estudos de impacto regulatório, sua publicidade e colocação em consulta para aprimoramento também deve ser garantido mediante o parágrafo único aqui proposto.
Art. 10 do Anexo
Art. 10. O Ministério de Minas e Energia publicara Portaria informando o resultado de cada decisão do CGIEE, prevista no art. 9º, e os novos níveis mínimos de eficiência energética.
Acrescentar parágrafo único ao artigo 10: Parágrafo único. No prazo máximo de noventa dias, após a publicação da Portaria referida no caput, o Inmetro publicará as novas Faixas de Classificação do PBE para os
O parágrafo único aqui proposto é outro caso de reintroduzir dispositivo existente tal como escrito na mencionada Portaria n° 323/2011.
Sua importância é garantir prazo máximo para que a política de etiquetagem representada pelo PBE seja substancialmente coerente e temporalmente aderente à política de níveis mínimos de eficiência energética.

Página 4 de 5
Consulta Pública 004/2017/DDE/SPE/MME Ministério de Minas e Energia
Condicionadores de Ar objeto deste Programa de Metas.
Art. 11 (caput) e seu § 1°
Art. 11. Os fabricantes ou importadores deverao informar, quando solicitado pelo Inmetro, as quantidades relativas a producao e comercializacao dos Equipamentos discriminados por Faixa de Classificacao do PBE.
§ 1º Os fabricantes ou importadores terao prazo de sessenta dias para enviar ao Instituto as informacoes apos a efetivacao da referida solicitacao pelo Inmetro.
Art. 11. Os fabricantes ou importadores deverao informar ao INMETRO, até 31 de março de cada ano, as quantidades relativas a producao e comercializacao dos Equipamentos discriminados por Faixa de Classificacao do PBE referentes ao ano anterior.
§ 1o Os fabricantes ou importadores
terao prazo de sessenta dias para
enviar ao Instituto as informacoes
apos a efetivacao da referida
solicitacao pelo Inmetro.
Para que haja uma política de padrões mínimos de eficiência energética efetiva, é necessário que seja fundamentada em informações de mercado (asseguradas seu sigilo e confidencialidade de forma desagregada) para uma permanente e fundamental ação de monitoramento, avaliação (M&A) e observância (“enforcement”) da política como recomendam as melhores práticas internacionais de programas dessa natureza e de governança da eficiência energética.
Da forma como atualmente se encontra o seu caput, as informações de fabricantes e importadores possuem um caráter condicionado extemporaneamente sob solicitação, quando deveria ser periódico como “input” crucialmente necessário para o monitoramento e avaliação da política e sua observância legal.
Para tanto, propõe-se nova redação do caput e, por consequência, a retirada do seu § 1°, mantendo os demais parágrafos como estão.
A título de exemplo para mostrar a importância desse ponto e também do estudo de impacto regulatório, tem-se que para os novos níveis mínimos sendo propostos no Art. 5° da minuta da Portaria os atuais equipamentos fabricados e comercializados no país enquadrados nas faixas C e D (vide figuras abaixo) do PBE, tanto do tipo janela quanto do tipo Split seriam retirados do mercado. No entanto, não fica claro se essa mudança terá impactos no mercado de ar-condicionado nacional com as informações disponíveis. Quais serão as economias de energia para os consumidores e para o setor?

Página 5 de 5
Consulta Pública 004/2017/DDE/SPE/MME Ministério de Minas e Energia

Contribuição para a Consulta Pública International Energy Initiative – IEI Brasil
Gilberto De Martino Jannuzzi, Fernando Costa e Rodolfo Gomes
Dada a proposta da consulta pública realizada em 18 de outubro de 2017 pelo CGIEE em conjunto com o MME no intuito de se obter novos níveis mínimos de eficiência energética para equipamentos de condicionamento de ar tipo Janela e Split, o IEI contribui analisando dois tópicos:
1. Metodologia para a escolha de novos índices mínimos de eficiência. Qual é a metodologia utilizada no Brasil para se estabelecer esse índice? E quais são os impactos no mercado de equipamentos?
2. Análise dos níveis mínimos de eficiência energética nos países desenvolvidos e em desenvolvimento;
METODOLOGIA PARA A ESCOLHA DE NOVOS ÍNDICES MÍNIMOS DE EFICIÊNCIA
Segundo ABRAVA 2014, no Brasil os condicionadores de ar tipo Split dominam o mercado com 74% das vendas, seguido pelos condicionadores de ar tipo janela, que, embora venham apresentando declínio nas vendas, elas ainda representam uma parte significativa (14%).
Os novos índices propostos pela nova resolução, que deveriam ter entrado em vigor no início de 2016 (Portaria Interministerial Nº 323/2011, Artigo 6º)1, estabelece para os condicionadores de ar:
● Tipo Janela: São dispostos por categorias onde cada categoria deverá ter o índice mínimo de eficiência energética, conforme Tabela 1.
1 A rigor, a Portaria Interministerial N° 323/2011 que estabelece o Programa de Metas para condicionadores de ar deveria ter sido publicada em até um ano após a Regulamentação Específica para esses equipamentos (Portaria Interministerial Nº 364, de 24 de dezembro de 2007) conforme estabelece a Lei Nº 10.295/2001, ou seja, cerca de dois anos e meio antes: “Em até 1 (um) ano a partir da publicação destes níveis [máximos de consumo específico de energia, ou mínimos de eficiência energética], será estabelecido um Programa de Metas para sua progressiva evolução.” (Artigo 2º, parágrafo 2).

Tabela 1. Índices mínimos do coeficiente de eficiência energética (W/W) para condicionadores de ar tipo janela.
Categoria 1 Categoria 2 Categoria 3 Categoria 4
W/W ≥ , ≥ , ≥ , ≥ ,
.
● Tipo Split: São indiferentes no tocante às categorias. O nível mínimo do coeficiente de eficiência energética para este tipo de equipamentos deverá ser ≥ ,0 .
Para os novos índices são verificados que os atuais equipamentos fabricados e comercializados no país das classes C e D (ANEXO A), do tipo janela, e da classe D, do tipo Split, seriam eliminados. No entanto, não fica claro se essa mudança terá impactos no mercado de ar-condicionado (AC) nacional com as informações disponíveis. Quais serão as economias de energia para os consumidores e para o setor?
Além disso, não fica claro se inovações importantes que já estão disponíveis estão sendo incorporadas por esses índices propostos a custos compatíveis com a realidade tanto da indústria nacional como dos consumidores (incluindo os custos evitados com a economia de eletricidade).
Neste documento encontra-se um artigo publicado (ANEXO B) analisando um procedimento para escolha de índice mínimo de eficiência energética para geladeiras baseado em metodologia desenvolvida pela CLASP (VENDRUSCULO et
al, 2009). Este é um procedimento no qual se demonstra de forma clara os custos e benefícios de novos índices ao longo da vida útil dos novos equipamentos e que torna o processo mais transparente para toda a sociedade. O artigo ilustra o caso de se escolher MEP para refrigeradores a partir de um conjunto de inovações técnicas, seus custos e potencial de economias. Esse tipo de impacto regulatório foi realizado para a Portaria que está nessa consulta?
ANÁLISE DOS NÍVEIS MÍNIMOS DE EFICIÊNCIA ENERGÉTICA NOS PAÍSES DESENVOLVIDOS E EM DESENVOLVIMENTO
O desempenho energético dos sistemas de condicionamento de ar apresenta uma tendência global de melhoria devido às constantes preocupações com o aumento das demandas energéticas que influenciam os setores a investirem em equipamentos mais modernos e eficientes.

Vários fatores contribuem para o desenvolvimento de um programa de regulamentação de eficiência energética e isto depende do contexto de cada país onde são avaliados, da maturidade do programa, da existência de metas mais restritivas, dos valores exigidos como índices mínimos de eficiência energética, da certificação, dentre outros.
Em diversos países os índices mínimos para sistemas de condicionamento de ar tipo split (por apresentarem uma tendência maior de crescimento, em detrimento aos do tipo janela) se tornaram mais restritivos. O índice de eficiência energética é a razão entre a capacidade total de refrigeração (W) e a potência demandada (W) para seu funcionamento. Também conhecido como EER, da sigla “Energy Efficiency Ratio” ou como Coeficiente de Desempenho - COP, da sigla “Coefficient of Performance”.
A CLASP (Collaborative Labeling & Appliance Standards Program) apresentou informações sobre condicionadores de ar da Austrália, China, União Europeia, Japão, Índia, Coreia, Taiwan e Estados Unidos, com suas respectivas variações de eficiências energéticas, e foram observados acréscimos significativos no decorrer dos anos (Nihar Shar et al, 2017)
As variações da eficiência energética são diferentes entre os países, conforme pode ser verificado na Figura 1. Isto se deve ao contexto de cada país, como clima, horas de uso, mecanismos regulatórios entre outros.
Os piores equipamentos nestes dois últimos países apresentaram índices de eficiência energética de 2,9 W/W para o ano de 2010. A Tabela 2 mostra as variações de índices mínimos e máximos de eficiência energética de alguns países para o ano de 2011.
Os índices mínimos exigidos no Brasil são tímidos quando comparado aos índices praticados em grande parte com outros países. Devido ao panorama energético brasileiro e às tendências de aumento das vendas de condicionadores de ar para os próximos anos, nota-se que a elevação dos índices de eficiência energética faz-se necessária, embora com atraso no presente caso, e que os produtos brasileiros apresentam um grande potencial na redução de gastos energéticos. Vê-se também a necessidade da revisão das normas que traçam as diretrizes para as métricas de índices mínimos de eficiência energética em consonância com as melhores práticas procedimentais adotadas nos países desenvolvidos.
Deve-se levar em consideração que as condições de testes para cada país são divergentes, fato este que dificulta uma correlação adequada de índices de eficiência entre os países. No entanto, devido à globalização das indústrias, os fabricantes são praticamente os mesmos e os índices de eficiência obtidos em um

dado país pode ser aproximado para os demais países, uma vez que se adote políticas nacionais mais restritivas de índices mínimos de eficiência energética.
As variações climáticas e a recente adoção de medidas sazonais para análise de eficiência energética dificultam a comparação global das eficiências. Não existem dados comparativos que permitam a formulação de políticas em todo o mundo de forma a criar alvos de eficiência energética mais eficazes, bem como incentivos e regulamentos associados, ficando a cargo de cada país, em função da sua realidade e contexto, como o clima de cada local, características das edificações e horas de uso durante os anos, fatores que são levados em consideração para determinação dos índices mínimos de eficiência pertinentes.
Figura 1. Eficiência energética (W/W) para sistemas de AC para equipamentos mais ou menos eficiente, por país. Fonte: Econoler et al., 2011; Shan et al., 2013.

Tabela 2: Faixas mínimas e máximas de eficiência energética para equipamentos de ACs para alguns países.
País
EER Mínimo (W/W)
EER Máximo (W/W)
Austrália (Split) ≥ 2,67 ≥ 4,88
Canadá (Split) ≥ 2,14 ≥ 4,33
China (Split) ≥ 2,90 ≥ 6,14
União Européia (Split) ≥ 2,21 ≥ 5,51
União Européia (Janela) ≥ 2,30 ≥ 3,10
Estados Unidos (Split) - ≥ 4,60
Estados Unidos (Janela) ≥ 2,90 ≥ 4,00
India (Split) ≥ 2,35 ≥ 3,6
Japão (Split) ≥ 2,37 ≥ 6,67
Koréia (Split) ≥ 3,05 ≥ 5,73
México (Split) ≥ 2,42 ≥ 4,10
México (Janela) ≥ 2,30 ≥ 2,80
Rússia ≥ 2,50 ≥ 3,60
África do Sul (Split) ≥ 2,28 ≥ 5,00
BRASIL (Split) ≥ 2,60 ≥ 3,28
BRASIL (Janela) ≥ 2,48 ≥ 2,86
Fonte: Catalog Searches, IEA 4E M&B 2010, Baillargeon, 2011.

Os índices mínimos de eficiência energética utilizadas nos países asiáticos, como China, Índia, Japão e Coreia, são definidos pelo norma ISO 16358, exceto as que usam condições climáticas específicas da região e alguns países.
A China possui o maior mercado de sistemas de condicionamento de ar, cerca de 43% - 47% do mercado mundial. Os índices de eficiência energética para sistemas de condicionamento de ar com velocidade variável são obtidos pela metodologia SEER (Seasonal Energy Efficiency Ratio) para ar condicionado com função somente de resfriamento e a metodologia APF (Annual Performance Factor) para sistemas com ciclo reverso. Para sistemas com velocidades fixas, os índices de eficiência são obtidos pela metodologia EER (Energy Efficiency Ratio), definido pela norma nacional GB 12021.3-2010, baseada na ISO 5151.
Os índices mínimos de eficiência energética nos Estados Unidos e na Europa são obtidos com mais pontos de dados para as temperaturas externas e cargas parciais do que nos países asiáticos que utilizam a norma ISO 16358 e baseiam seus procedimentos de testes em adaptações da norma ISO 5151.
Várias revisões nos padrões de índices mínimos de eficiência energética foram realizadas nos Estados Unidos. A última revisão feita adotou os índices mínimos divididos em três regiões (Norte, Sudeste e Sudoeste) com base na aglomeração populacional e nos dias de graus de aquecimento. Como resultado, os condicionadores de ar instalados durante ou após 1° de janeiro de 2015 devem atender os índices mínimos na SEER e HSPF (Heat seasonal performance factor), para bombas de calor e para a região sudeste devem ser atender as metodologias SEER e EER.
Países como a Indonésia, Malásia, Filipinas, Cingapura, Tailândia e Vietnã utilizam método de teste baseado na ISO 5151:2010 e CSPF definido na ISO 16358-1:2013. As diferenças nas medidas de índices de eficiência energéticas devem-se principalmente aos perfis de temperaturas externas utilizadas para as avaliações estacionárias e cíclicas em um valor de eficiência sazonal e nas formas de calcular o desempenho energético na operação de carga parcial.
O Brasil utiliza a metodologia EER baseado na norma NBR 12010-90 (“MB 3341: Condicionador de ar doméstico: Determinação do coeficiente de eficiência energética”). Esta norma, de 1990, prescreve o método de ensaio utilizado para a determinação do coeficiente de eficiência energética para condicionadores de ar domésticos apenas para o ciclo de refrigeração, por ser a condição de maior consumo.
As condições padrões de ensaios realizados no Brasil são divididas por tipos (A e B), por faixas de temperaturas de bulbo úmido e de bulbo seco do ambiente interno

e por faixas de temperaturas de bulbo úmido e seco do ambiente externo, conforme Tabela 3.
Tabela 3. Condição padrão de ensaio para refrigeração
Phadke at al. (2017b) Alguns autores estabeleceram equações de regressão linear na tentativa de comparar as métricas de eficiência energética entre as seis principais economias mundiais (China, União Européia, Índia, Japão, Coréia do Sul e Estados Unidos) que baseiam seus procedimentos de testes em adaptações da ISO 5151. Os resultados da conversão mostraram que os fabricantes projetam seus produtos de alta eficiência especificamente para melhor desempenho no procedimento de teste local. Se um modelo de alta eficiência foi projetado para funcionar bem sob certas condições regionais, em outros locais seus desempenhos possivelmente seriam inferiores, levando à necessidade de maior otimização do desempenho para ser usado em regiões diferentes, principalmente em regiões onde os programas de normatização, incluindo procedimentos de testes para avaliar a eficiência sazonal, não estão aprimorados ou atualizados.
Recomenda-se fortemente a normatização das unidades de medidas e dos procedimentos em nível global. Países como Estados Unidos, Japão e China já desenvolveram normas para estes procedimentos e recomenda-se que o mesmo seja feito no restante do Globo. Verifica-se que normalmente os procedimentos adotados são baseados em normas internacionais, a ISO 5151 e a ISO 13253. Estes procedimentos apresentam variações entre os diferentes países, o que torna difícil a comparação entre os mesmos. Os testes mais utilizados para medição de EER são a de entalpia de ar interno do ambiente e o de calorímetro. Devido a sua maior precisão, deve-se priorizar o método de calorímetro. Atualmente este método é o adotado pelo INMETRO.
A determinação do índice de eficiência energética (EER) é realizada em laboratórios especializados com temperaturas controladas e submetendo o equipamento a plena carga. Durante o uso convencional destes equipamentos, as condições reais não

correspondem às condições reproduzidas nos laboratórios de testes. Desse modo, os índices de eficiência energética sofrem variações em função das condições externas, pois os condicionadores de ar só funcionam a plena carga algumas poucas horas durante o ano. No resto do tempo os condicionadores de ar funcionam com cargas parciais.
Nas condições reais de uso, alguns condicionadores submetidos a temperaturas menos extremas podem apresentar desempenho superior ao apresentado nas condições de testes.
Para ajustar esta deficiência metodológica, foi criado o Seasonal Energy Efficiency Ratio (SEER) que fornece uma medida mais representativa do desempenho energético submetido à demanda climática local. Neste método, o equipamento é testado e avaliado considerando-se o desempenho global previsto para o clima de um ano típico de uma certa localização.
O SEER é um método utilizado para medir a eficiência energética de um equipamento condicionador de ar. Quanto maior o SEER, mais eficiente é o sistema. O SEER mede quão eficiente um sistema de refrigeração e/ou aquecimento irá operar durante uma temporada (anual). É uma unidade que é calculada dividindo-se o número total de BTU (British Thermal Unit) removido do ar pela quantidade total de energia necessária para funcionamento da unidade.
O uso do SEER é favorável para equipamentos com tecnologia de compressores variáveis (tecnologia inverter). O compressor é o maior consumidor de energia dos sistemas de condicionamento de ar e na tecnologia inverter as velocidades de rotação do compressor se ajustam para atender a demanda térmica.
Em mercados maduros como a União Européia, China e Estados Unidos, os splits com tecnologia inverter estão amplamente disponíveis. No Japão o mercado é dominado por equipamentos com tecnologia inverter. Na maioria dos países, excetuando-se a Índia, os mercados são dominados por condicionadores de ar split e há uma forte tendência da migração dos splits com velocidades fixas para os de tecnologia inverter.
No Brasil nota-se uma redução no uso de condicionadores de ar tipo janela, porém ainda são utilizados, principalmente em ambientes críticos onde a renovação de ar externo é obrigatória (hospitais, clínicas, laboratórios, entre outros).
No Brasil, para condicionadores de ar tipo split torna-se evidente e necessária a determinação de novos níveis mínimos de eficiência energética, mesmo para os condicionadores de ar com tecnologia inverter, que vem apresentando uma larga aceitação no país. Para a avaliação desses novos índices, é importante adotar o método SEER como parâmetro na regulamentação brasileira.

REFERÊNCIAS
ABRAVA - Associação Brasileira de Refrigeração, Ar Condicionado, Ventilação e Aquecimento. Panorama HVAC-R, Brasil, 2014.
ECONOLER; NAVIGANT; CEIS; ACEE. Cooling Benchmarking Study. Estudo feito em colaboração com o Collaborative and Appliance Standards Program (CLASP), 2011.
ENCE - Etiqueta Nacional de Conservação de Energia: Selo Procel de Economia de
Energia - Condicionadores de ar tipo split, 2017.
ENCE - Etiqueta Nacional de Conservação de Energia: Selo Procel de Economia de
Energia - Condicionadores de ar de janela, 2017.
Ghisi E. Pessoa J. L. N. Estado da arte em eficiência energética: Sistemas de
condicionamento de ar. Centro Brasileiro de eficiência energética em
edificações.CB3E, 2015.
Ghisi E. Pessoa J. L. N. Donald C. P`. Nota técnica referente aos níveis míninos de
eficiência energética de condicionamento de ar no Brasil. Centro Brasileiro de
eficiência energética em edificações.CB3E, 2013.
Phadke, A W. Park N, Shah H. Kang J. and Choi. 2017b. rating the performance of
energy efficient air conditioners in various regional metrics. Draft reporte. Berkeley,
C. A: Lawrence Berkeley National Laboratory.
SHAN N.; PHADKE A.; WADE P. Cooling the Planet: Opportunitties for Deployment
of Super Efficient Room Air Conditioners. Super-efficient Equipment and Appliance
Deployment. Environmental Energy Technologies Division, International Energy
Studies Group, Lawrence Berkeley National Laboratory, 2013.
VENDRUSCULO, Edson Adriano et al. Life cycle cost analysis of energy efficiency
design options for refrigerators in Brazil. Energy Efficiency, v. 2, n. 3, p. 271–286, 1
ago. 2009. Disponível em: https://link.springer.com/article/10.1007/s12053-008-
9034-6. Acesso em: 26 out. 2017.
MB 3341. Condicionador de ar doméstico - Determinação do coeficiente de
eficiência energética, 1990.
Won Young Park, Nihar Shah, Brian Gerke. Assessemet of commercialy avalilable
energy efficient room air conditioners including models with low global warming

potencial (GWP) refrigerantes. Energy analysis and Environmental Impacts Division
Lawrence Berkeley National Laboratory, October, 2017.
ANEXO A - Selo Procel de economia de energia para condicionador de ar tipo split e hi-wall.
ANEXO B

Life cycle cost analysis of energy efficiency design optionsfor refrigerators in Brazil
Edson Adriano Vendrusculo &
Guilherme de Castilho Queiroz &
Gilberto De Martino Jannuzzi &
Herculano Xavier da Silva Júnior &
José Antenor Pomilio
Received: 3 October 2007 /Accepted: 17 November 2008 / Published online: 15 December 2008# Springer Science + Business Media B.V. 2008
Abstract The purpose of this paper was to present
the results of a life cycle cost analysis concerning the
purchase and operation of a more efficient popular
refrigerator model compared with a baseline design in
Brazil. The summarized results may be useful for
organizations working to promote sustainable energy
development. This paper specifically focuses on
refrigerators, since their energy consumption is
predicted to constitute over 30% of the total average
domestic electricity bill in Brazilian households. If all
new Brazilian refrigerators had an energy efficiency at
the level consistent with the least life cycle cost of
ownership, it would result in an annual savings of
2.8 billion dollars (US$) in electricity bills, 45 TWh
of electricity demand, and 18 Mt of CO2 emissions,
with a respective payback period of 7 years which is
less than half the average estimated lifetime of a
refrigerator. The analysis was conducted following the
guidelines of similar analyses available from the US
Department of Energy and the Collaborative Labeling
and Appliance Standards Program.
Keywords Electrical consumption .
Energy efficiency . Household refrigerator .
Life cycle cost analysis . Minimumenergy performance
standards . Payback period
Introduction
In the year 2001, the Brazilian National Congress
approved the “National Energy Conservation Policy
and Rational Use of Energy” law that requires minimum
energy efficiency standards for energy-consuming
equipment commercialized in Brazil (Brazilian law no.
10.295 2001). A first comparative analysis indicates
great opportunities for energy savings with refriger-
ators. For example, some Brazilian models consume
approximately 46% more energy than similar models
being commercialized in Europe (ENERGY +2002;
Energy Efficiency (2009) 2:271–286
DOI 10.1007/s12053-008-9034-6
E. A. Vendrusculo (*) : J. A. Pomilio
School of Electrical and Computer Engineering,
State University of Campinas,
Avenida Albert Einstein 400, PO box 6101,
13083-970 Campinas, São Paulo, Brazil
e-mail: [email protected]
G. d. C. Queiroz
Packaging Technology Center (CETEA),
Avenida Brasil 2880, Jardim Brasil,
13070-178 Campinas, Sao Paulo, Brazil
G. D. M. Jannuzzi :H. X. da Silva Júnior
School of Mechanical Engineering,
State University of Campinas,
Rua Mendeielev s/n,
13083-970 Campinas, São Paulo, Brazil
G. D. M. Jannuzzi
International Energy Initiative–Latin American Office,
PO box 6163, 13083 970 Campinas, São Paulo, Brazil
PROCEL 2002a). The models compared1 are the same
type of appliance belonging to the one-star category
(R4 category), which defines temperature of the frozen
food compartment to be ≤6°C in accordance with
specifications, found in Table 2, of the commission
directive 2003/66/EC published by the official journal
of the European Union (CLASP 2003).
Energy efficiency methodologies made accessible by
the US Department of Energy (DOE) and Collaborative
Labeling Standard Program (CLASP) were used in the
following analysis. An engineering analysis was used to
determine the range of potential energy efficiency
improvements and their costs. This analysis considers
new designs or combinations of designs and technolo-
gies that are not commercially available and can,
therefore, result in products with higher efficiencies
than those available on the market at this time.
The statistical analysis of a set of energy use data
for one-star refrigerator models available in Brazil in
2004 was used to establish a study scenario in this
paper. For each model, energy use is plotted as a
function of adjusted volume. Adjusted volume (AV)
accounts for the different temperatures in the fresh
food and freezer compartments of refrigerators,
refrigerator freezers, and freezers.
To analyze the economic impact of potential
efficiency improvements on consumers, the consumer
payback period and life cycle cost (LCC) have been
used. Analyses of payback periods and LCCs illustrate
the trade-off and help identify policies that will have
net benefits for consumers.
Many inputs are needed for economic analyses of
quantities, such as LCC and payback period. For
example, to calculate LCC, several pieces of data are
needed, including the incremental purchase price for
the more efficient product, energy savings, fuel price,
appliance lifetime, and consumer discount rate. To
calculate the payback period, only the first three terms
are needed (Wiel and McMahon 2001).
However, like other developing countries, it is also
difficult to get complete statistical and technical data for
analysis. Therefore, a different scenario building meth-
odologywas used. The authors have also provided a brief
appendix containing the results of statistical and LCC
analysis for refrigerators in the European Union and
USA, which served as reference material. Appendix 1
refers to the guidebook provided by CLASP, as it was
available at the time of this paper’s writing. However,
nowadays, a revised version (the “COLD II” study) is
available and should be preferred for future studies of
energy labeling and minimum energy efficiency stand-
ards for domestic refrigeration appliances.
Cost-effective technical improvements (or design
options) were considered in the analysis and their
energy, economic, and environmental impacts through
the LCC approach were evaluated. Simulation results
allowed estimates of the impacts on consumers,
manufacturers, and the environment over a long-term
period of up to 16 years (2005 to 2020), starting from
the moment of adoption of more efficient refrigerators.
The present study analyzes the opportunities of
establishing minimum energy performance standards
(MEPS) for the class of “popular” refrigerators sold in
Brazil. These are very simple domestic appliances
having only basic technical elements; therefore, a brief
technical description is presented below.
Target refrigerator technology overview
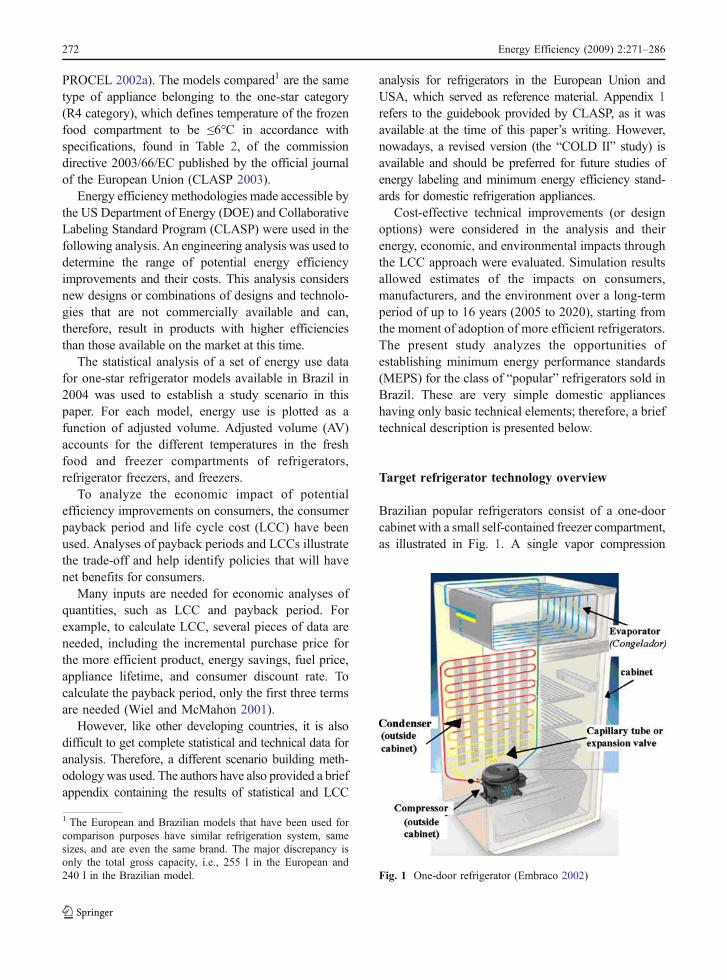
Brazilian popular refrigerators consist of a one-door
cabinet with a small self-contained freezer compartment,
as illustrated in Fig. 1. A single vapor compression
Fig. 1 One-door refrigerator (Embraco 2002)
1 The European and Brazilian models that have been used for
comparison purposes have similar refrigeration system, same
sizes, and are even the same brand. The major discrepancy is
only the total gross capacity, i.e., 255 l in the European and
240 l in the Brazilian model.
272 Energy Efficiency (2009) 2:271–286

cycle that operates at the freezer evaporating saturation
temperature provides refrigeration for both the fresh
food and freezer compartments. The refrigeration
circuit comprises four simple elements: a compressor,
capillary tube (expansion valve), an evaporator, and a
condenser. The distribution of cool air within the
cabinet is via natural convection from the evaporator,
meaning that there is no fan to distribute air within the
cabinet. In general, most of these simple models do not
have complex controls or accessories.
The one-door household refrigerator belongs to the
one-star classification according to Technical Standard
(ISO 7371 1995). In compliance with the standards, it
is designed to maintain an internal temperature of 5°C
within the fresh food compartment and −6°C within
the frozen food compartment. A thermostat located at
the evaporator, which switches the compressor on and
off, provides the temperature control in the cooling
process. For this study, the most commonly sold
refrigerator in the Brazilian market was used as the
reference for the technical and economical analysis.
The baseline refrigerator has a total gross capacity of
330 l and has an average 31 l of net volume within the
frozen food compartment.2
Energy efficiency standards in Brazil
Brazil has introduced voluntary efficiency labels for
refrigerators and other appliances since the late 1980s.
These labels have been developed via a process of
consensus arrangement between the government and
manufacturers. More recently, the “National Energy
Conservation Policy and Rational Use of Energy” law
(Brazilian law no. 10.295 2001) was established under
supervision of the Ministry of Mines and Energy,
which leads a steering committee (CGIEE) composed
of seven members, made up of representatives of the
Ministry of Science and Technology, Ministry of
Development, Industry and External Commerce, Na-
tional Agency of Electrical Energy, National Agency
of Petroleum, Brazilian universities, and Brazilian
citizens, in order to set new mandatory efficiency
standards. The public National Institute of Metrology,
Standards, and Industry Quality (INMETRO) inspects
the laboratories that are certified to measure the energy
consumption of households, such as refrigerators, and
the National Energy Conservation Program (PRO-
CEL3) supports the steering committee (CGIEE),
provides information, and helps people to find the
most efficient energy appliance (PROCEL 2002b).
As of 2005, only electrical motors were subject to
mandatory minimum energy efficiency standards.
Information to consumers on the energy consumption
of household refrigerators is provided through two
labels displayed on refrigerators available on the retail
market: a comparative energy information label (energy
rating label) and an endorsement label. Figure 2 shows
both Brazilian energy efficiency information and
endorsement labels. The former follows the appearance
of the European energy label design and shows the
comparative energy efficiency class of the appliance on
a scale rated from A to G, where A is for the best
performing appliances. Note that the formula used to
delineate the energy label class are not the same in the
Brazilian and EU labeling schemes nor are the test
procedures identical, as Brazilian appliances are tested
at an ambient temperature of 32°C as compared to
25°C in Europe. Appliances that reach a class A level,
according to INMETRO, may be awarded with the
PROCEL’s endorsement label, shown in Fig. 2b.
A technical committee, led by a representative of
PROCEL and seven representatives of several tech-
nical associations, decides which manufacturer will
receive the label. The following are the technical
associations involved: Electrical Energy Research
Center (CEPEL), INMETRO, Customer Support
National Institute (IDEC), Brazilian Electrical and
Electronic Industry Association (ABINEE), National
Association for Electro-electronic Products Industries
(ELETROS), Brazilian Association of Manufacturers
of Refrigeration, Heating, Air Conditioning and
2 Some physical dimensions of the base case are 1,528-mmheight,
619-mm width, and 691-mm depth. A hermetic compressor is
used, which has a cooling capacity of 425 Btu/h (125 W), a
displacement of 4.23 cc/rev, and an energy efficiency rate of
1.07 kcal/Wh, assembled for low back pressure applications. The
electrical specification comprises an operating voltage range of
90–140 V supplied by a single-phase 60-Hz grid.
3 PROCEL operates by funding or co-funding energy efficiency
projects, such as, research and development (R&D), education
and training, testing, labeling, standards, demonstration, and
others. The program works on both increasing end-use
efficiency and reducing losses in electricity generation, trans-
mission, and distribution systems, though the latter diminished
greatly after the liberalizing reforms of the 1990s. PROCEL
cooperates with state and local utilities, state agencies, private
companies, universities, and research institutes.
Energy Efficiency (2009) 2:271–286 273

Ventilation Equipment (ABRAVA), and Brazilian
Lighting Industry Association (ABILUX).
The endorsement label is displayed exclusively on
the most efficient appliance and, in order to carry this
label, the appliance’s manufacturer is required to be
approved in an eventual audit done by a labeling
inspection committee. This committee chooses a sample
taken directly from the refrigerator production line to be
tested in a certified laboratory. The inspection commit-
tee has representatives from the associations INMETRO
and PROCEL, as well as from the certified laboratory.
Electrical consumption of appliances in Brazil
In 2003, Brazil consumed approximately 325 TWh of
electrical energy, of which 46% was used by the
industrial sector and about 27% was consumed by the
residential sector (BEN 2004). Figure 3 shows
the estimated share of household electricity consump-
tion by appliance types (Chade 2004).
As seen in Fig. 3, refrigerator electricity consump-
tion represents a large share in all surveyed houses.
As a consequence, the refrigerator was preferred by
PROCEL and INMETRO to establish the energy
conservation standards. Table 1 shows the refrigerator
features taken into account by the INMETRO labeling
program (INMETRO 2002). Each model is analyzed
according to its AV, where the label class A is
awarded to the more energy-efficient equipment using
a formula established by INMETRO. A technical
committee, composed of representatives from industry
and government, uses a statistical analysis to define
this index. INMETRO sets up the maximum allowable
Fig. 2 Brazilian labels (PROCEL 2002b)
Fig. 3 End-use electricity consumption in Brazilian households
274 Energy Efficiency (2009) 2:271–286

energy consumption per label class as a function of the
adjusted volume, as is done in most other countries
applying mandatory refrigerator standards and labeling
schemes. The adjusted volume accounts for the
different temperatures in the fresh food and freezer
compartments of the refrigerator. In Brazil, the tem-
perature and relative humidity are respectively set to
32°C and 50% according to the standardized test
methods. Brazilian refrigerators are classified as
Tropical (climate class T) appliances.
Scenario building methodology
The analysis hereafter takes into account a hypothetical
scenario based on the market share of Brazilian manu-
facturers. The leading brand manufacturer had 53% of
the wholesale refrigerator market in 2002 and his prod-
ucts were technologically more advanced compared to
the other models on the market. The second largest
refrigerator manufacturer had 29% of the market, but his
product had a lower energy performance as compared to
the market leader. Thus, the second manufacturer allows
for more improvements to be targeted. Lastly, the
remaining manufacturers shared the outstanding 18%
of the wholesale market (Datamark 2002).
The authors emphasize that they had no data
available for one specific refrigerator model, listed
in Table 1. Thus, the market share percentage in the
last paragraph refers to all refrigerator models
belonging to a brand owner (e.g., market share is
53% for sales of all models CRA23, CRA24, CRA32,
and CRA36 in Table 1).
This study estimates an “average refrigerator
model” so that the analysis for the Brazilian market
could be performed. This model results from weighted
Table 1 Refrigerator features account to the INMETRO/PROCEL labeling program
Brand Model Volume Consumption
(kWh/month)
INMETRO
labelFresh food
compartment
Small freezer
compartment
Adjusted
volumea (AV)
BOSCH RB 31 297 00 297 24.5 A
BOSCH RB 38 367 00 367 27.0 A
BRASTEMP BRA31A 253 33 300 32.0 C
BRASTEMP BRA35A 296 33 343 36.0 C
BRASTEMP BRB35A 329 00 329 36.5 D
BRASTEMP BRF36A 330 00 330 29.5 A
CCE R31L 263 30 306 30.0 B
CCE R32SL 268 30 311 30.0 B
CCE R26L 224 30 267 32.0 D
BLUE SKY R31L 263 30 306 30.0 B
HOUSTON R31L 263 30 306 30.0 B
CONSUL CRB23B 223 00 223 32.0 F
CONSUL CRC24B 191 22 222 30.5 F
CONSUL CRA32A 272 31 316 26.6 A
CONSUL CRA32B 272 30 315 24.9 A
CONSUL CRC32A 272 31 316 28.8 A
CONSUL CRA36A 312 30 355 31.5 A
CONTINENTAL RC 27 223 29 264 23.7 A
CONTINENTAL RC 30 257 29 298 27.0 A
CONTINENTAL RC 37 324 33 371 33.0 A
ELECTROLUX R250 214 26 251 24.6 B
ELECTROLUX R280 237 26 274 25.0 A
ELECTROLUX R310 263 31 307 30.0 B
ELECTROLUX R330 286 31 330 30.2 A
ELECTROLUX R360 312 31 356 32.4 A
ESMALTEC RG3100E 283 27 321 34.8 B
GE GE310A 263 31 307 30.0 B
aAV = fresh compartment + 1.42 small freezer compartment
Energy Efficiency (2009) 2:271–286 275

averages of retail market parameters of the two chosen
refrigerators, respectively indicated as X and Y in Fig. 4,
which shows the linear regression of the consumption
for data in Table 1. The weights chosen corresponded
to the 53% of market share for the most sold
refrigerator (X), and the remaining 47% was taken as
the weight for the second model (Y). For simplicity
purposes, this arrangement essentially takes into
account two brands, which by far hold the highest
share of the market, while other brands have minor
market share percentages. These two brands have an
adjusted volume of 316 liters (319.2 kWh/year) and
330 l (354 kWh/year) as indicated in Fig. 4,
respectively. Therefore, the energy consumption for
the “average refrigerator model” is given by:
ECwavg ¼ 0:53� Xcption þ 0:47� Ycption
¼ 335:5 kWh=year½ � ð1Þ
where, Xcption and Ycption are the energy consumption
for X and Y models, respectively.
Based on the aforementioned considerations, the
effort is applied hereafter to assess this scenario.
Energy consumption resulting from technical
improvements
Design options (or technical improvements) represent
changes in the design of a baseline model that
improve its efficiency. Several technical improve-
ments may be applied in order to reduce the energy
consumption of refrigerators, but laboratory facilities
and time limited the number of improvements that could
be simulated in this study. Simulations of improved
designs were conducted using the ERA4 software tools
(E.P.A. Refrigeration Analysis) distributed by the US
Environmental Protection Agency (Merriam et al.
2002). The results of the technical improvement
simulations, shown in Table 2, consider two major
groups of improved designs: those using more efficient
compressors and those derived from an increase of
insulation thickness. Simulations were carried out for
both brands, X and Y, and then the results were
weighted, taking into account the respective market
share, as shown in Eq. 1, to get the final energy
efficiency.
A new compressor with about 20% higher efficiency
was used instead of the original. The compressor
efficiency is declared in the compressor datasheet
through the EER (energy efficiency ratio) acronym.
This technical option is self-explanatory, since the more
efficient compressor had EER=1.49 W/W comparative
to 1.22 W/W of the original in the baseline refrigerator.
Alternatively, the insulation thickness was in-
creased for both refrigerator door and wall. Between
75% and 90% of the energy required by refrigeration
unit may be attributed to the thermal performance of
the insulated shell. Hence, by improving the perfor-
mance of the shell, significant savings are possible. A
common way of improving the overall thermal
resistance of the shell is to increase its thickness.
Adding from 1.27 to 2.54 cm (0.5 to 1.0 in.) of extra
insulation results in an energy savings range from a
few percent to over 10% relative to the previous
design level (Hakim and Turiel 2002). Furthermore,
results using modern compressors are also very
impressive. As such, the set of all design options
may expect savings of 44%, as shown in Table 2. In
fact, it is a primary test, since material improvements
and electronically commuted motor (including per-
manent magnet rotor) advances have pushed up the
overall compressor efficiency very rapidly.
Analytical elements of the standards setting
process
This section applies the life cycle cost analysis
(LCCA) to consider the ambition and impacts of
prospective energy efficiency standards. The LCCA
performed comprised an engineering analysis (which
analyzes potential technical improvements), a LCC,
and a payback period analysis.
These analyses were performed in accordance with
CLASP recommendations; hence, gathering data was
4 The validation of the ERA refrigerator model (one door) was done
by comparing the electricity consumption of 28.14 kWh/month
obtained from ERA with the consumption of 28.1 kWh/month
declared by the refrigerator manufacturer. As seen, the error for
electricity consumption from simulation and manufacturer was
within 1%. An experimental test in a specialized laboratory was also
carried out in accordance with the ISO7371 test procedures and the
measured consumption was with 28.35 kWh/month. The technical
input data table for ERA is based on overall information about the
cabinet and the main elements’ dimensions such as, evaporator and
condenser. Specific data on characteristics of materials, insulation
thermal resistivities, in addition to internal temperatures and
refrigeration cycle information, were also necessary.
276 Energy Efficiency (2009) 2:271–286

the main constraint. Therefore, underlying assump-
tions and approximations are highlighted along with
its use hereafter.
Engineering analysis
Technical improvements, listed in Table 2, and their
respective results were used to formulate hypothetical
energy efficiency standards. Various approaches were
considered for evaluating the feasibility of energy
standards. The first approach considers the case where
all existing refrigerator markets in 2001, referring to
models in Table 1, are required to conform to a
mandatory standard determined by the reference line
C0, shown in Fig. 5. Such an approach implies that all
refrigerators should be improved according to the
regression line C0, expressed as follows:
C0cption ¼ 254:0þ 0:33� AV kWh=year½ � ð2Þ
where C0cption is the energy consumption.
In this case, which only considers a change in
average energy use of those refrigerator models above
the C0 line, it was found that market average
refrigerator energy consumption might be reduced
by 4% overall. Note that it was assumed that all
models had equal sales, as the true market share data
were not available.
Once all models in the market were imagined to
satisfy the “C0 standard” line, new simulations were
performed considering innovation C1 (Table 2), and
the resulting data points were used to derive the new
regression line C1, shown in Fig. 5. Based on this
new situation, an estimated energy saving of 16.1% is
obtained (see Table 2).
This procedure was repeatedly applied to define
additional hypothetical standards C2 to C5, and their
respective associated energy savings are listed in Table 2.
Each time increased efficiency standards are pro-
posed, it is essential to assess the potential consumer,
national industry, and environmental impacts that they
would subsequently be expected to produce.
Table 2 Simulation results (Vendrusculo et al. 2003): one-door refrigerator energy efficiency
Technical improvements Percent energy efficiency increase
Refrigerator Assumed scenario
X (%) Y (%) Weighted average energy efficiency increase (%)
Compressor C1—more efficient EER=1.49W/W 12.1 20.7 16.1
Insulation thickness increase C2—at door=1/2 in. 3.9 3.8 3.9
C3—at wall=1/2 in. 10.2 14.1 12.0
C4—at door=1 in. 2.9 2.9 2.9
C5—at wall=1 in. 8.4 10.0 9.2
C
C
B
D
B
FF
AA
A
A
A
A
B A
B
A
B
A
A
D
ABB
X YB
100
150
200
250
300
350
400
450
500
200 250 300 350 400
Adjusted Volume (liters)
En
erg
y C
on
su
mp
tio
n (
kW
h/y
r)
316 330
Fig. 4 Linear regression
Energy Efficiency (2009) 2:271–286 277

Life cycle cost
The LCC analysis takes into account the lifetime
of the appliance and the consumer discount rate. LCC
is the total consumer expense over the lifetime of the
appliance, including purchase expense and operating
costs (also including energy expenditures). Future
operating costs are discounted to the time of purchase
and summed over the lifetime of the appliance. LCC
is expressed in Eq. 3 as a function of the retail price
(P), annual operating cost (Ot), lifetime (N) in years,
and the discount rate (r; Wiel and McMahon 2001;
Biermayer 2001):
LCC ¼ P þX
N
t¼1
Ot
1þ rð Þtð3Þ
whereP
N
t¼1
means the sum over the lifetime, from year
1 to year N, where N = lifetime of appliance (years)and t is the year for which operating cost is being
determined.
Equation 3 shows two main inputs to the LCC
analysis: the appliance retail price (P) and the appliance
operating cost (O). To set the final retail (selling) price
of a more energy-efficient refrigerator, the cost of each
design option, incorporated in the commercial equip-
ment, is added to the baseline retail price.
The increase in manufacturing costs associated with
each design change was estimated based on the
Technical Support Document: Energy Efficiency
Standards (US Department of Energy) for refrigerators,
refrigerators–freezers, and freezers (DOE 1995).
It is very important to clarify that in Brazil, the
appliance manufacturers evaluate design options and
estimate developing cost with no commitment to the
appliance standards steering committee and also there
are no tax incentives for advanced energy-saving
technologies. As a consequence, it is not a trivial
issue to get data from manufacturers5 about the
aforementioned refrigerator design options (i.e., man-
ufacturing cost, efficiency gain) to proceed with the
LCC calculations.
The cost of each more efficient design option, which
includes the overall markup, is shown in Table 3. The
percentage by which the sales price exceeds the
manufacturer’s cost of the equipment is the overall
markup, which comprised the manufacturer markup,
distributor or wholesaler markup, dealer markup, and
sales tax (local and state governments apply sales
taxes to refrigerator purchases). In this study, an
overall markup of 2.42 was used based on informa-
tion gathered by the authors from retailers and one
manufacturer. A Brazilian appliance manufacturer
supplied the manufacturer’s cost of his baseline model
and the retail price was derived from a survey of the
Brazilian commercial actors. The purpose of the
survey was to find out the average retail price of
the baseline model. The “average refrigerator” used in
the study had a retail price of R$699.00 (US$ 211.81)
which yielded a baseline manufacturing cost of
R$288.81 (US$87.52).
In view of the fact that no data was available from
appliance manufacturers and component suppliers,
5 Tax incentives for these technologies could encourage
manufacturers to introduce new products and stimulate them
to convey technical data for the appliance standards steering
committee.
Energy Efficiency Standards
C
AB
D
B
FF
A
A
X
A
A
A
A
B A
B
B
B
A
A
C
D
BB Y
A
C0= 254,0+0,33*VA
C1=202,9+0,26*VA
C2=193,0+0,25*VA C3= 162,5+0,21*VA
C4= 155,2+0,24*VA
C5=131,8+0,17*VA
100
150
200
250
300
350
400
450
500
220 270 320 370
Adjusted Volume (liters)
En
erg
y C
on
su
mp
tio
n (
kW
h/y
r)
,
Fig. 5 Application of an
engineering approach to
setting standards for
Brazilian refrigerators
278 Energy Efficiency (2009) 2:271–286

estimates of technical improvement costs in Table 3
were extrapolated from the Department of Energy
report Technical Support Document: Energy Efficiency
Standards for consumer products: refrigerators, refriger-
ators–freezers, and freezers (DOE 1995). The exchange
rate of 3.3 was applied in conversion to local currency
(R$ = reals), i.e., US$1.00=R$3.30.
The operating cost in Eq. 3 is the sum of the
energy cost and repair cost. The primary inputs for
establishing the energy cost are the annual energy
consumption and the average electricity price. The
scenario assumed yielded an annual energy consumption
of 338.80 kWh/year through Eq. 1. The average
electricity price is the mean price paid for all electricity,
which at the time of this study was R$0.252/kWh
(US$0.0763/kWh; ANEEL 2002a). Also, an average
value of 18% for all state and federal tax charged in the
electricity price was taken into account. This tax is
considered constant over time for the analysis performed
in this work. The repair cost is the cost to the consumer
for replacing or repairing components that have failed in
the equipment. However, it was assumed that no repair
work is done throughout lifetime. Furthermore, it was
assumed that operating cost is constant over time. As a
result, the expression for LCC in Eq. 3 reduces to:
LCC ¼ P þ PWF� Ot ð4Þ
where the present worth factor (PWF) is:
PWF ¼X
N
t¼1
1
1þ rð Þt¼
1
r1�
1
1þ rð ÞN
" #
: ð5Þ
The discount rate is the rate at which future
expenditures are discounted to establish their present
value (ANEEL 2002a). The nominal discount rate
r=14% was assumed as recommended by the Brazilian
Electricity Regulatory Agency (ANEEL). In Brazil, the
overall electrical energy market is under ANEEL
regulations. The minimum recommended to make a
profit on energy efficiency programs is 12% (ANEEL
2002b). Note that compared to international practice,
this figure is very high; however, discount rates even
as high as 15.25% per year (inflation of 4.5% per
year) have been recently practiced in Brazil (3CEE
Report 2006). The expected return on investment in a
more energy-efficient equipment can be asserted
through the analysis of payback period.
Payback period (PAY)
The economic impact on consumers resulting from the
potential efficiency improvements can be analyzed
through a payback analysis approach. For example, for
the target standard C1 in Fig. 5, the amount of time
needed to recover the additional consumer investment
on purchasing an efficient model through the lower
operating costs is the payback period.
Data on the incremental purchase price for the
more efficient product (ΔP), energy savings, and
electricity price is required for the calculation of the
payback. Equation 6 summarizes the payback (Wiel
and McMahon 2001; Biermayer 2001):
ΔP þX
PAY
1
ΔOt ¼ 0 ð6Þ
where ΔOt is the variation in operating costs.
However, operating costs were considered constant
over time t so that Eq. 7 could be applied:
PAY ¼ �ΔP
ΔO: ð7Þ
LCCA results
The hypothetical MEPS levels derived from the
LCCA analyses are highlighted in Fig. 6, which
depicts the results according to the consumer’s
perspective. The LCC analysis suggests that setting
MEPS at the C2 level will result in models that are
24% more efficient and have an average energy
consumption of 266 kWh/year, as shown in Table 2.
As a consequence, respective increases of 3.7% and
8.9% in the manufacturer cost and retail price are
expected, as seen in Fig. 6.
The sensitivity of the LCCA to the variation in the
electricity price was also evaluated. Increasing elec-
Table 3 Expected incremental costs in the refrigerator retail
price of each design option
Design option Expected cost R$ (US$)
C1 60 (18.18)
C2 20 (6.06)
C3 67 (20.3)
C4 18 (5.45)
C5 16.06 (53)
Energy Efficiency (2009) 2:271–286 279

tricity prices by 10% would imply C2 MEPS
corresponding to an average refrigerator energy
consumption of 234 kWh/year (improvement III in
Fig. 6). Alternatively lowering the electricity price by
10% results in an average C2 energy consumption
level of 276 kWh/year (improvement I in Fig. 6).
Analyzing the payback period enables the time it would
take for consumers to earn a return on an investment in
a more efficient refrigerator to be assessed.
Assuming a refrigerator lifetime of 16 years in
Brazil6, consumers would recover their investments
under all the standard cases considered as the
maximum payback period of 12 years for the most
ambitious case of C5. Figure 7 shows the payback
period in regard to the standards C0, C1, and so on. In
summary, the payback analysis illustrates the trade-off
and helps identify policies that will have net benefit
for consumers (Wiel and McMahon 2001). The
sensitivity analysis was also used to gain insights
regarding the influence of electricity prices on the
payback period. Considering set MEPS at the im-
provement level III in Fig. 6 (+10% sensitivity), the
corresponding payback is about 10.5 years, which is
still lower than the average refrigerator’s useful life
expectancy.
Suggested energy efficiency standards based
on the LCCA results
Table 4 summarizes the results in terms of energy
savings, payback period, and customer’s electricity
bill savings for two hypothetical standards regimes.
Under the first scenario, it is assumed that energy
efficiency standards (MEPS) become effective in
2005 and savings are estimated for the 2005 to 2020
period. Remember that the MEPS aims to improve
efficiency of the refrigerators belonging to all classes,
i.e., A to G in the energy efficiency label (Fig. 2a).
The results given in Table 4 show that the technical
improvements in the refrigerator would save 46 TWh
of energy and R$8.49 billion in the customer’s
electricity bill during the period of 16 years, from
2005 to 2020. It may be worth noticing that these
standards were not implemented in 2005. Thus,
anyone reading this paper could infer that these
savings estimates are out of date, but it is not quite
true due to the slow technical improvement in
Brazilian refrigerators over time. The MEPS sug-
gested in Fig. 6 of 266 kWh/year is still lower than
the energy consumption of a 2008 year refrigerator
found in the retail market which is of 294 kWh/year
(adjusted volume of 314.6 l—class A). The contrast
between the energy consumption of a refrigerator in
2001 and 2008 may help to visualize the slow
progress in the energy efficiency index of Brazilian
refrigerators over time. For example, the energy
consumption of the refrigerator found in Table 1 with
adjusted volume of 316 l (net capacity of 272 and
31 l, respectively, for the fresh food and frozen food
Baseline (C0)
Impro
vem
ent I
(C1
+ C0)
Impro
vem
ent I
I (C2
+ C1)
Impro
vem
ent I
II (C
3 +
C2)
Impro
vem
ent I
V (C4
+ C3)
Impro
vem
ent V
(C5
+ C4)
MEPS
(266 kWh/yr)
1200
1250
1300
1350
1400
1450
1500
180210240270300330
Consumption (kWh/yr)
LC
C (
R$)
Electricity Price (r= 14% e N= 16)
Sensitivity (+ 10 %, r=14% e N= 16)
Sensitivity (- 10 %, r=14% e N= 16)
MEPS (266 kWh/yr)
Fig. 6 Scenario results:
LCC analysis
6 This is an assumption made by the authors based on life
expectancy of appliances as reported in the 23rd annual portrait
of the US appliance industry. The life expectancy for standard
refrigerators is within the range of 10 to 18 years (MrAppliance
2003).
280 Energy Efficiency (2009) 2:271–286

compartments) was 319 kWh/year (26.6 kWh/month).
In 2008, practically the same refrigerator was found in
the retail market (net capacity of 272 and 30 l,
respectively, for the fresh food and frozen food
compartments), and the energy consumption was
294 kWh/year (24.5 kWh/month; INMETRO 2008).
This refrigerator was always of an A class level. As
seen, the energy consumption of a class A refrigerator
has decreased 7.8% in the period of 7 years, which is
not very ambitious progress for the energy efficiency
index. Furthermore, a striking discrepancy is noticed
between the energy consumption of the European and
the Brazilian models; for example, a European model
(267+35=302 l—A+ class) has an energy consump-
tion of 237 kWh/year (ENERGY+ 2008), whereas in
Brazil, an equivalent model (272+30=302 l—same
manufacturer—A class) demands 294 kWh/year. It
points toward a commercialized model 20% more
efficient in Europe. These considerations still main-
tain that the estimates (MEPS in Fig. 6) are feasible.
For the second scenario, it is assumed that two
energy efficiency standards are enforced, first in 2005
at the C2 level and another in 2010 at the C5 level,
which takes into account all the higher energy
efficiency design options considered in this analysis.
The period of 16 years is computed from 2005 to
2020. The results given in Table 4 shows that in this
scenario, 66 TWh of energy could be saved for
corresponding R$8.48 billion in the customer’s
electricity bill. The customer’s electricity saving are
very close for both standards in Table 4. It is a
noteworthy performance since, despite being the more
energy-efficient refrigerator (66.68 TWh of energy
savings), the refrigerator having all design options has
a higher life cycle cost (as seen in Fig. 6). The
electricity savings for the 24% standard and the 48%
standard are, respectively, R$11.63 billion and
R$16.80 billion (if not taking into account the life
cycle cost).
Table 4 shows that refrigerators are expected to
reach an average sale of 1.2 million units per year
over the next 20 years in Brazil. This expectancy was
taken into account in the estimation of the savings in
Table 4. The sales rate was calculated using the linear
Baseline (C0)
Improvement I (C1 + C0)
Improvement II (C2 + I)
Improvement III (C3 + II)
Improvement IV (C4 + III)
Improvement V (C5 + IV)
0,0
2,5
5,0
7,5
10,0
12,5
15,0
150200250300350400
Consumption (kWh/yr)
Payb
ack P
eri
od
(yr)
Electricity Price
Sensitivity (+ 10%)
Sensitivity (- 10%)
Fig. 7 Estimated payback
periods
Table 4 Standards effective in 2005 (MEPS) and in 2010 (all design options): energy and economic impacts for the period from 2005
to 2020
Improved refrigerator energy efficiency
(compared to refrigerator features
of 2000 year)
24% (standard from 2005 to 2020;
design options C0+C1+C2 provided
in Table 2)
48% (standard from 2010 to 2020; design
option C3+C4+C5 added to standard 2005 ones)
Payback period 7 years 12 years
Energy savings 46.18 TWh 66.68 TWh
Saving in the customer’s electricity bill R$ 8.49 billions (US$2.57 billions) R$8.48 billions (US$2.56 billions)
Energy Efficiency (2009) 2:271–286 281
regression method based on the database of the last
12 years reported. This database is made available by
Brazilian Institute of National Statistics and Geography
(IBGE), which carries on an annual public program
called National Research by Home Sampling (PNAD
2004).
Environmental impacts
In this paper, the environmental effects (or impacts)
were also evaluated in terms of changes in emissions
of pollutants such as carbon dioxide (CO2) that would
occur as a result of reduced energy consumption. The
energy savings, as listed in Table 4, are typically
converted to emission reductions using conversion
factors (e.g., grams of emission per unit energy
saved). Table 5 shows the reduction of 18.56 and
26.80 Mtons in emissions of carbon dioxide
corresponding to the energy savings of 46.18 and
66.68 TWh, as pointed out in Table 4.
The avoided emissions of CO2 may be traded in
the global carbon credit market. Carbon credits are a
key component of national and international emis-
sions trading schemes that have been implemented to
mitigate global warming. They provide a way to
reduce greenhouse effect7 emissions on an industrial
scale by capping total annual emissions and letting the
market assign a monetary value to any shortfall
through trading. Credits can be exchanged between
businesses or bought and sold in international markets
at the prevailing market price.
From the results in Table 5, it can be seen that
R$442.2 million (US$134 million) could be earned by
capping CO2 emissions in the 16-year period of
suggested MEPS. The carbon unit was quoted at US
$5.00/tCO2 according to the variation of US$5.50+
50%/tCO2 found in the literature (Haites 2004).
Conversion factor for greenhouse gas8
The emissions of CO2 listed in Table 5 were
calculated from energy savings (Table 4) using a
conversion factor of EF=0.402 tCO2/MWh. This
factor gives the grams or tons of emission per
megawatt hour of energy saved. This emission factor
is calculated according to the type of fuel used in the
generation of electric power by a power plant (or
generating station). In this paper, the emission factor
was obtained for a natural gas combined cycle power
plant (Natural Gas 2003). This is a thermal power
plant that generates electric power from a gas turbine.
Considerations in accordance with the guidelines of
the National Greenhouse Gas Inventories Programme
through the Intergovernmental Panel on Climate
Change (IPCC) were used to calculate the emission
factor (IPCC 1996). The aforementioned emission
factor (EF) was calculated by:
EF ¼CEF� OCF � 44
12� SF
htCO2=MWh½ � ð8Þ
where CEF=15.3 is expressed in tC/TJ (tons of C/
terajoules; IPCC 1996). This is the carbon equivalent
emission factor, which converts natural gas energy to
net carbon emitted by the fuel burning process. OCF
represents the fraction of carbon oxidized during the
combustion, usually equal to 0.995 for natural gas
(IUEP 2005). SF=0.0036 is a scaling factor to
convert energy units, expressed in terajoules, to
electric units of megawatt hour (MWh). The symbol
η represents the thermal efficiency of natural gas
combined cycle power plant, which is within the
range of 47% to 56%. In this work η=50% was
considered. Finally, the 44/12 fraction converts
greenhouse gases from an atomic weight basis (C)
to full molecular weight (CO2; IPCC 1996).
Conclusion
The analysis described in this article may give support
and help discussions for establishment of MEPS for
one-door refrigerators in Brazil. The summarized
results represent important inputs to subsidy further
discussion with manufacturers in the process of
setting up efficiency standards and may be used as
reference for organizations working to promote
sustainable energy development.
It is shown that the Brazilian refrigerator can be
technically improved, allowing significant savings of
electricity consumption in Brazilian households.
From LCC analysis, the increase of 11.44% in the
refrigerator retail price is expected for a standard
7 The greenhouse effect is the process in which the emission of
infrared radiation by the atmosphere warms a planet’s surface.8 Greenhouse gases are the gases present in the atmosphere that
reduce the loss of heat into space and therefore contribute to
global temperatures through the greenhouse effect.
282 Energy Efficiency (2009) 2:271–286

establishment of 24% higher efficiency from 2005 to
2020 and a corresponding payback of 7 years. It also
represents R$8.49 billion (US$2.57 billion) of savings
in the customer’s electricity bill. It is a noteworthy
result for Brazil, since the estimated 46.18 TWh of
saved energy is the equivalent of the operation of 35
Brazilian natural gas thermoelectric power plants
during 6 months. Moreover, results show that
R$306.24 million (US$92.80 million) can be earned
in the carbon market by capping CO2 emissions in
18.56 megatons.
Finally, if strict MEPS are enforced (48% in Table 4)
during the period from 2010 to 2020, the results are
44.44% more attractive with regard to energy savings,
avoided CO2 emissions, and carbon market trading.
Acknowledgments The authors would like to thank the
International Energy Agency/Climate Technology Initiative
(IEA/CTI), the International Energy Initiative (IEI), the Envi-
ronmental Protection Agency (EPA), and the São Paulo
Research Council (FAPESP) for their financial support.
Appendix 1
This appendix is provided for background purposes and
is based on the CLASP—Energy-Efficiency Labels and
Standards: A Guidebook for Appliances, Equipment,
and Lighting (Wiel and McMahon 2001). It is a EU
analysis done in 1993. However, a more complete and
up-to-date one done in 2001 (the “Cold II” study) is
available and should be preferred (Waide 2001).
Energy efficiency standards
Three types of energy efficiency standards are
described in the CLASP—Energy-Efficiency Labels
and Standards: A Guidebook for Appliances, Equip-
ment, and Lighting (Wiel and McMahon 2001):
prescriptive standards, minimum energy performance
standards (MEPS), and class average standards, any
of which could be either mandatory or voluntary.
& Performance standards prescribe minimum effi-
ciencies (or maximum energy consumption) that
manufacturers must achieve in all products man-
ufactured after a certain date. These standards
specify the energy performance, but not the
technology or design specifications of the energy-
efficient product.
The two most widely used analytical approaches
for standards setting are: statistical analysis of current
products and engineering/economic analysis of future
possibilities. These approaches, and others, can be
used in combination and are not mutually exclusive.
Statistical approach
Figure 8 shows a statistical analysis performed by the
Group for Efficient Appliances (GEA) for three-star
refrigerator–freezer models available in EU countries.
Four lines are shown in this figure; they represent the
average energy use obtained through a regression
analysis of all of the data points, a 10% energy
savings line, a 15% energy savings line, and a long-
term standards line.9 After the regression line is
calculated, the least energy-efficient model is found
and replaced with a model of higher efficiency. The
number of models stays constant. The energy savings
for the higher efficiency model is calculated, and
energy savings are aggregated until the total reaches
the goal (10%, 15%, etc.). Then, the resulting data
points are used to derive a new regression line.
Economic/engineering approach
An engineering analysis is first carried out for each
product class within a product type to estimate
manufacturing costs for improving efficiency com-
pared to a baseline model. Installation and mainte-
Table 5 Standards effective in 2005 (MEPS) and in 2010 (all design options): environmental impacts for the period from 2005 to 2020
Improved refrigerator
energy efficiency
24% (from 2005 to 2020; design options
C0+C1+C2 provided in Table 2)
48% (from 2010 to 2020; design option
C3+C4+C5 added to standard 2005 ones)
Emissions of carbon dioxide (CO2) 18.56 Mtons 26.80 Mtons
Carbon credit market R$306.24 millions (US$92.80 millions) R$442.2 millions (US$134 millions)
9 The fourth line was obtained through an engineering/
economic approach.
Energy Efficiency (2009) 2:271–286 283

nance costs are also calculated. The engineering
analysis can be described in seven steps: (1) select
appliance classes; (2) select baseline units; (3) select
design options for each class; (4) calculate efficiency
improvement for each design option; (5) combine
design options and calculate efficiency improvements;
(6) develop cost estimates (include installation and
maintenance) for each design option; (7) generate cost
efficiency curves.
The expected costs of manufacturing, installing,
and maintaining each design option must be estimat-
ed, including the ability of the after-market service
sector to effectively maintain the performance of high
efficiency equipment. In some cases, manufacturer
costs are very difficult to obtain and it may be
necessary to go directly to retail prices; this is a
feasible approach if all the designs under consider-
ation already exist in the marketplace.
Fig. 8 Statistical approach
as applied to European
Union refrigerator–freezers
Fig. 9 LCC analysis results
for two sets of US standards
for a top-mount, auto-
defrost refrigerator–freezer
(Wiel and McMahon 2001)
284 Energy Efficiency (2009) 2:271–286

Energy efficiency standard in North America
Once the engineering analysis is complete, it is
customary to analyze the economic impact of potential
efficiency improvements on consumers by analyzing
consumer payback period and LCC. Figure 9 shows
the LCC analysis results for two sets of US standards
for a top-mount, auto-defrost refrigerator–freezer.
The minimum LCC (where the consumer receives
the most benefit) occurs around 450 kWh/annum.
The minimum LCC is not always chosen for a new
standard because many other factors must be
considered. For instance, options below 470 kWh/
annum were rejected for use in a proposed standard
because increased insulation thickness would make
these refrigerators too wide to fit into fixed spaces in
some existing kitchens, assuming that internal
volume remains constant as insulation thickness
increases.
References
3CEE Report (2006). The 3 Country Energy Efficiency Project—
United Nations Environment Programme—UNEP. Developing
Financial Intermediation Mechanisms for Energy Efficiency
Projects in Brazil, China and India. Brazil Country Report.
2006 (see also http://www.3countryee.org/reports.htm).
ANEEL. (2002a). Brazilian Electricity Regulatory Agency.
Tariff rates in use. See also www.aneel.gov.br/341.htm.
ANEEL. (2002b). Brazilian Electricity Regulatory Agency.
Discount Rate. (n. d.). Retrieved in 2002 from http://www.
aneel.gov.br/cedoc/res2002492.pdf.
BEN. (2004). National Energetic Balance (Balanço Energético
Nacional). Mines and Energy Ministry. (n. d.). Retrieved
2004 from http://www.mme.gov.br/site/menu/select_
main_menu_item.do?channelId=1432&pageId=1589.
Biermayer (2001). Life-cycle cost analysis: Refrigerators.
Buenos Aires: Ernest Orlando Lawrence Berkeley National
Laboratory (LBNL), IRAM, (March 2001).
Brazilian Law no. 10.295. (2001). National Energy Conservation
Policy and Rational Use of Energy (Dispõe sobre a Política
Nacional de Conservação e Uso Racional de Energia e dá
outras providências). Federal Senate Decree no. 4059 of 10/
17/2001. Regulated law of 12/19/2001.
Chade, J. F. (2004) Electric energy management as seen by
consumers and energy distributors (Estudos do Sistema de
Gerenciamento pelo Lado da Demanda para Consumidores
e Distribuidores de Energia Elétrica). In Proceeding of XVI
National Symposium of Electric Energy Distributors. (XVI
Seminário Nacional de Distribuidores de Energia Elétrica–
SENDI). Brasília. Brazil. 2004. no. 583 (in Portuguese).
CLASP (2003). Commission Directive 2003/66/EC. Energy
labeling of household electric refrigerators, freezers and
their combinations. Collaborative Labeling and Appliance
Standards Program. (n. d.). Retrieved 2003 from http://
www.clasponline.org/disdoc.php?no=72.
Datamark. (2002). Sao Paulo, Brazil. See also: http://www.
datamark.com.br.
DOE. (1995). Technical Support Document: Energy Efficiency
Standards for consumer products: Refrigerators, Refrigerators-
Freezers, & Freezers. US Department of Energy, 391 pp.,
July 1995.
Embraco. (2002). Brazilian Compressor Company. Learn how a
refrigeration system works. (n. d.). Retrieved 2002 from
http://www.embraco.com/ingles/familia_vcc.htm.
ENERGY+. (2002). Europe’s most energy-efficient refrigerators &
freezers. (n. d.). Retrieved 2002 from http://www.energy-plus.
org/english/products/available/product_sheet?rid=661332625.
ENERGY+. (2008). Find the most energy-efficient appliance
which fits your needs. 2008 (see also http://www.energy-
plus.org/english/products/available/.
Haites, E. (2004). Estimating the market potential for the clean
development mechanism: Review of models and lessons
learned. IEA—International Energy Agency, PCFplus
Report 19, Washington DC, 2004, 102 pages. See also
http://www.iea.org/textbase/papers/2004/cdm.pdf.
Hakim, S. H., Turiel, I. (2002). Cost-efficiency analysis in
support of the energy conservation standards for refrigerator/
freezers. Energy Efficiency Standards Activity. See also
http://eappc76.lbl.gov/tmacal/ees.cfm.
PNAD. (2004). Brazilian Institute of National Statistics and
Geography (IBGE). National Research by Home Sam-
pling (PNAD). http://www.ibge.gov.br/home/estatistica/
populacao/trabalhoerendimento/pnad2004/default.shtm
INMETRO. (2002). National Institute of Metrology, Standards and
Industry Quality (Instituto Nacional de Metrologia, Normal-
ização e Qualidade Industrial). See also www.inmetro.gov.br/
consumidor/prodEtiquetados.asp#pbe (in Portuguese).
INMETRO. (2008). National Institute of Metrology, Standards and
Industry Quality—INMETRO. 2008. See also www.inmetro.
gov.br/consumidor/pbe/refrigeradores.pdf (in Portuguese).
IPCC. (1996). Intergovernmental Panel on Climate Change/National
Greenhouse Gas Inventories Programme (IPCC/NGGIP).
Revised 1996 IPCC Guidelines for National Greenhouse Gas
Inventories: Workbook (Volume 2). See also http://www.ipcc-
nggip.iges.or.jp/public/gl/guidelin/ch1wb1.pdf.
ISO 7371. (1995). Household refrigerating appliances—Refrigerators
with or without low-temperature compartment—Charac-
teristics and tests methods. ISO—International Organiza-
tion for Standardization.
IUEP. (2005). Common conversion factors. International Utility
Efficiency Partnerships, Inc. (IUEP). (n. d.). Retrieved 2005
from http://www.ji.org/RFP2005/CommonConversion
Factors.htm.
Merrian, Verone, Feng. (2002). EPA refrigerator Analysis
(ERA) program: User’s manual, version 1.2E. Cambridge,
Massachusetts. Arthur D. Little, Inc.
MrAppliance. (2003). Expert Appliance Repair. Life expectancy
of appliances—23rd annual portrait of the US appliance
industry. See also http://www.mrappliance.com/expert/
appliance_guide.aspx.
Natural Gas Website (2003). (n. d.) Retrieved 2003 from http://
www.gasnet.com.br/gasnet_br/termeletricas/ciclo.asp.
PROCEL (2002a). National Energy Conservation Program
(Programa Nacional de Conservação de Energia Elétrica).
Energy Efficiency (2009) 2:271–286 285

Energy Consumption Catalogue. (n. d.). Retrieved 2002
from http://www.eletrobras.gov.br/procel/site/seloprocel/
equipamentoscomselo_948.asp.
PROCEL (2002b). National Energy Conservation Program
(Programa Nacional de Conservação de Energia Elétrica).
Brazilian Energy Efficiency and Endorsement Labels.
(n. d.). Retrieved 2002 from http://www.eletrobras.com/
procel/site/seloprocel/apresentacao.asp.
Vendrusculo, E. A., Queiroz, G. C., Jannuzzi, G. M., Mendes, N.,
Borges, T., Pomilio, J. A. (2003). “Technical improvement of
residential refrigerator in Brazil: Energy efficiency analysis”. In:
3rd International Conference on Energy Efficiency in Domestic
Appliances and Lighting (EEDAL’03) Turin, Italy. 2003.
Waide, P. (2001). Findings of the Cold-II SAVE study to revise
cold appliances energy labeling and standards in the EU,
ECEEE Summer Study, Mandelieu, June 2001, paper no.
5,175. Available from www.eceee.org.
Wiel, S., McMahon, J. E. (2001). The S&L guidebook—Energy-
efficiency labels and standards: A guidebook for appliances,
equipment, and lighting. Collaborative Labeling and Appliance
Standards Program (CLASP). See also http://clasponline.org/
standard-label/toolkit/guidebook/index.php3.
286 Energy Efficiency (2009) 2:271–286