m-cep final
TRANSCRIPT
GOVERNING FOR GROWTH (G4G) IN GEORGIA
5 AUGUST 2016
MARKET-CENTERED ENERGY PLANNING (M-CEP)

THE REVOLUTION IN THE ENERGY SECTOR IS UPON US
The extent to which energy planners take the revolution into
consideration will dictate the potential risk of overbuilding large
or incorrect infrastructure projects.
An estimated $40 trillion (IEA World Investment Outlook) is
planned for new transmission and large generation plants in the
next 20 years worldwide. Emerging markets cannot afford to
make the mistake of building the wrong infrastructure.
2
INTRODUCTION TO M-CEP
Market-Centered Energy Planning (M-CEP) is an innovative
approach to energy planning that focuses on the rapidly
changing energy markets and the increasing involvement of
energy consumers in dictating the type and level of energy they
will consume.
3

M-CEP KEY CONCEPTS
• The number of electricity customers with their own energy generation sources is increasing rapidly
• Advances in technology are changing the way energy consumers interact with energy companies
‒ Solar PVs
‒ Other renewable energy sources
‒ Electric Vehicles
‒ Batteries
‒ Smart Meters
‒ Advanced Metering Infrastructure
‒ Data acquisition and communications
4
M-CEP KEY CONCEPTS
• Competitive energy markets have created options that place
more control over energy consumption, energy production and
system services in the hands of consumers
‒ High competitive prices during high price periods provide
consumers economic justification for energy efficiency
programs
‒ Lower prices, sometimes negative prices, encourage
shifting of demand to low price periods
‒ Large consumers with controllable load, own-generation
and/or battery banks are providing operating reserves
at lower costs than grid-connected generating plants.
5
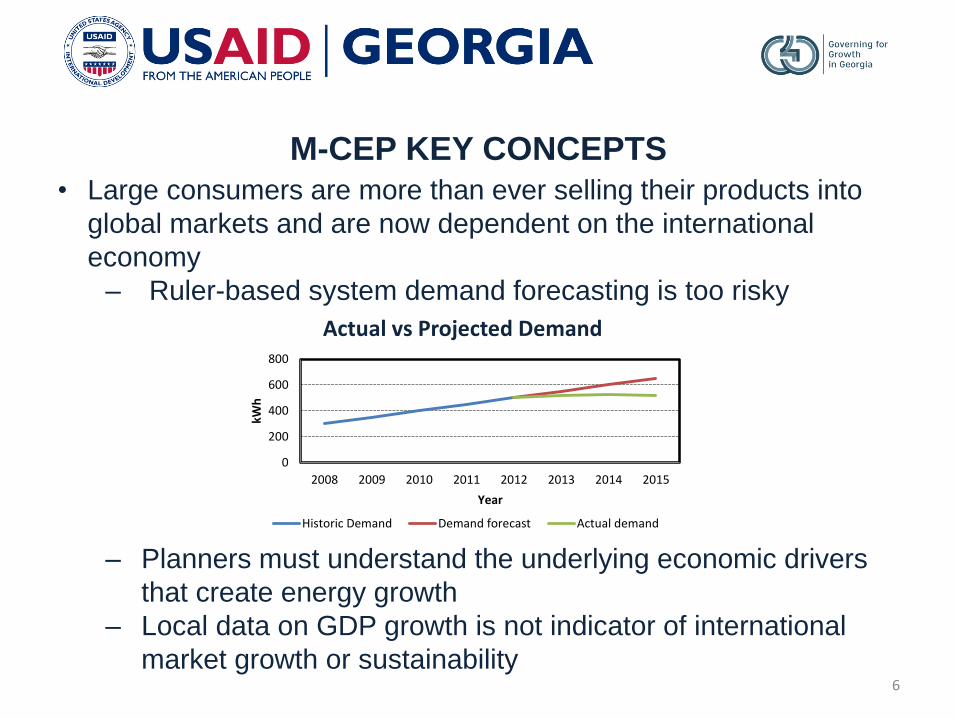
M-CEP KEY CONCEPTS
• Large consumers are more than ever selling their products into
global markets and are now dependent on the international
economy
‒ Ruler-based system demand forecasting is too risky
‒ Planners must understand the underlying economic drivers
that create energy growth
‒ Local data on GDP growth is not indicator of international
market growth or sustainability
0
200
400
600
800
2008 2009 2010 2011 2012 2013 2014 2015
kWh
Year
Actual vs Projected Demand
Historic Demand Demand forecast Actual demand
6
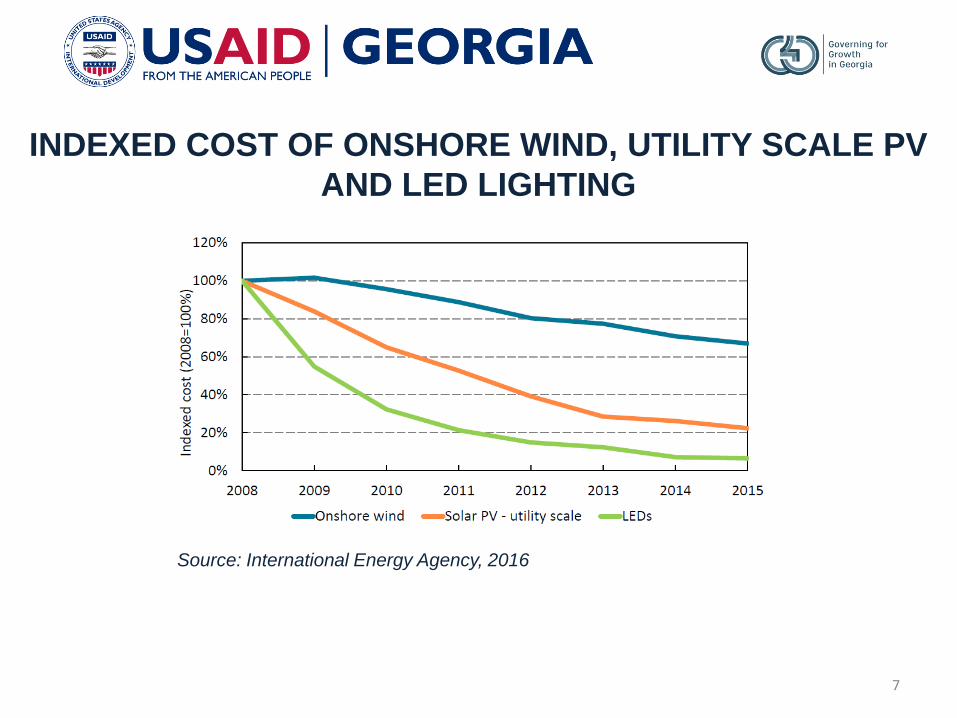
INDEXED COST OF ONSHORE WIND, UTILITY SCALE PV
AND LED LIGHTING
Source: International Energy Agency, 2016
7

BATTERY TECHNOLOGY
Tesla’s Gigafactory – by 2020 will produce 35 105 GW of batteries annually X
8

USA CALIFORNIA
• When scheduled generation exceeds scheduled demand in the
hour-ahead market, the price of energy falls below zero in an
attempt to balance supply and demand
Effect on Net Load and Spot Prices
9
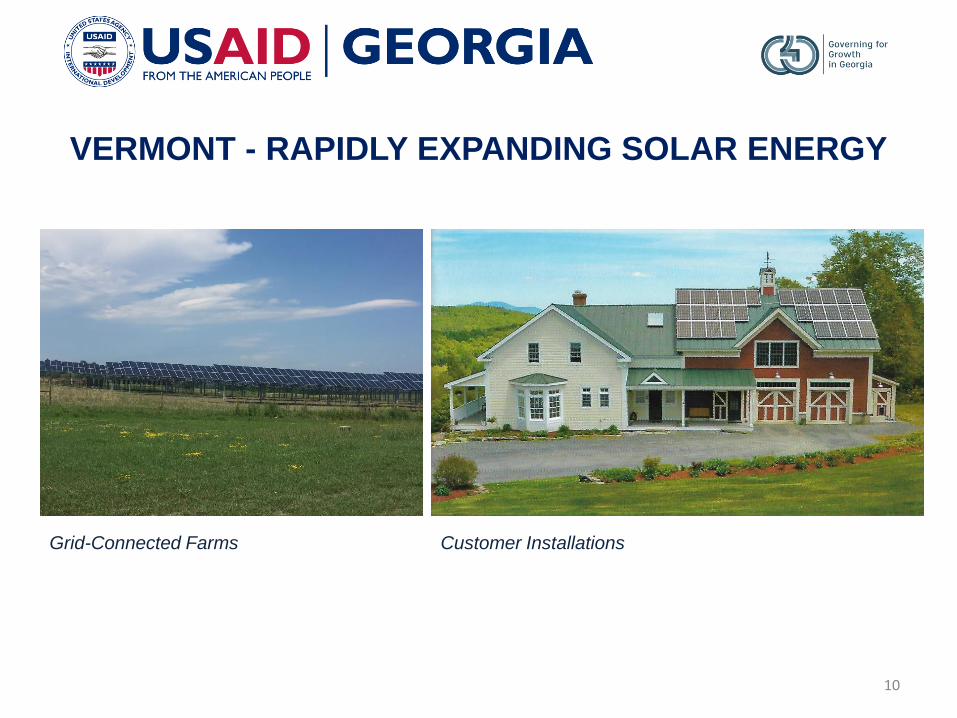
VERMONT - RAPIDLY EXPANDING SOLAR ENERGY
Grid-Connected Farms Customer Installations
10
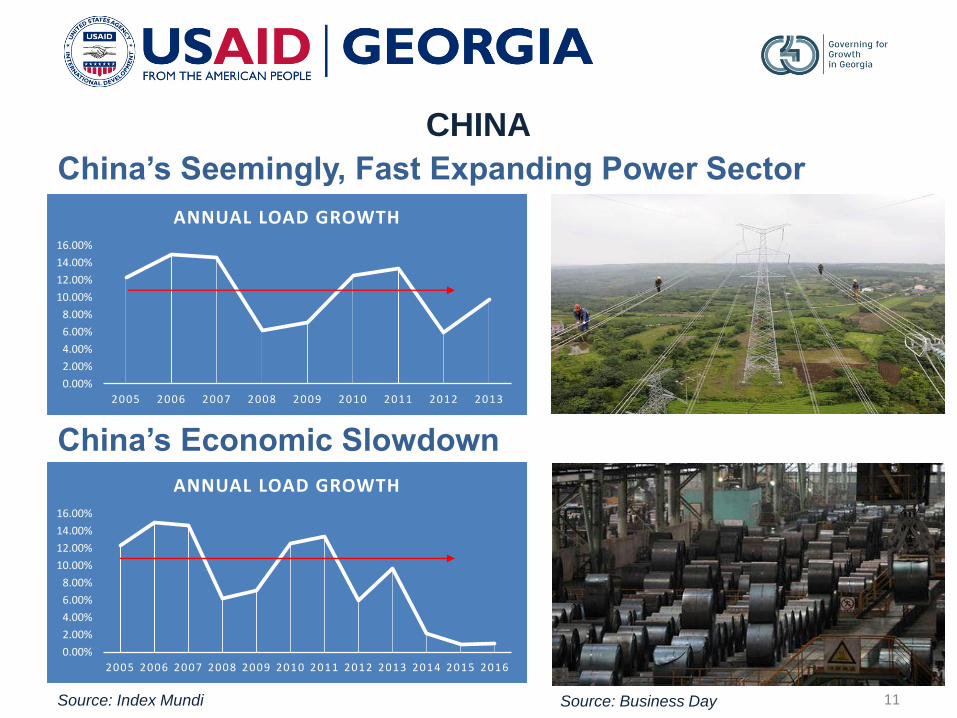
CHINA
0.00%
2.00%
4.00%
6.00%
8.00%
10.00%
12.00%
14.00%
16.00%
2005 2006 2007 2008 2009 2010 2011 2012 2013
ANNUAL LOAD GROWTH
China’s Seemingly, Fast Expanding Power Sector
0.00%
2.00%
4.00%
6.00%
8.00%
10.00%
12.00%
14.00%
16.00%
2005 2006 2007 2008 2009 2010 2011 2012 2013 2014 2015 2016
ANNUAL LOAD GROWTH
China’s Economic Slowdown
Source: Index Mundi Source: Business Day 11
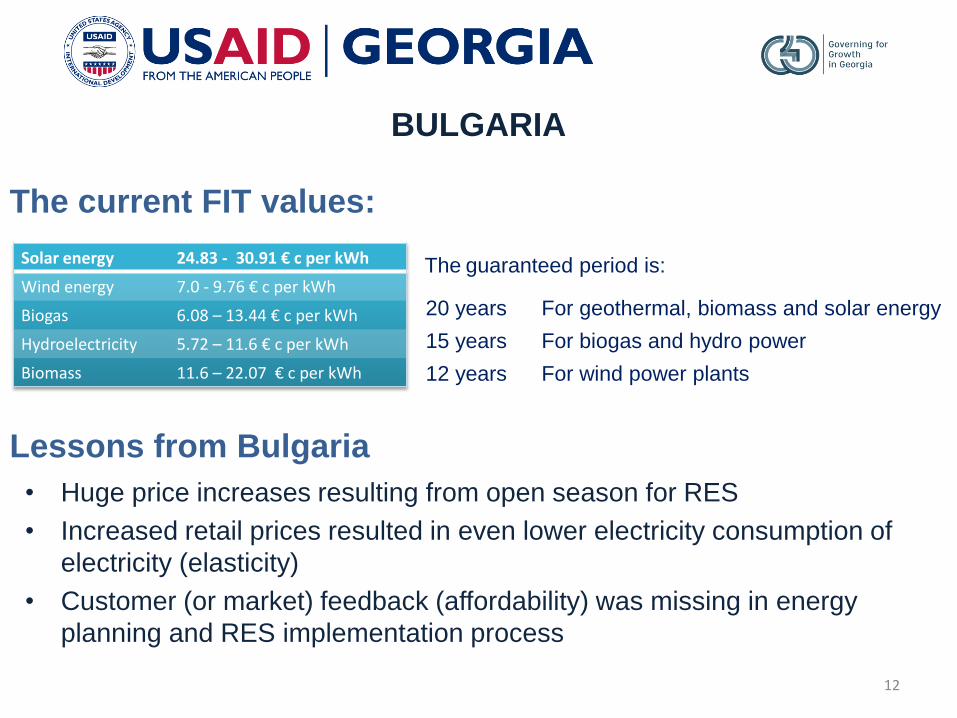
BULGARIA
The current FIT values:
Solar energy 24.83 - 30.91 € c per kWh
Wind energy 7.0 - 9.76 € c per kWh
Biogas 6.08 – 13.44 € c per kWh
Hydroelectricity 5.72 – 11.6 € c per kWh
Biomass 11.6 – 22.07 € c per kWh
The guaranteed period is:
20 years For geothermal, biomass and solar energy
15 years For biogas and hydro power
12 years For wind power plants
Lessons from Bulgaria
• Huge price increases resulting from open season for RES
• Increased retail prices resulted in even lower electricity consumption of
electricity (elasticity)
• Customer (or market) feedback (affordability) was missing in energy
planning and RES implementation process
12
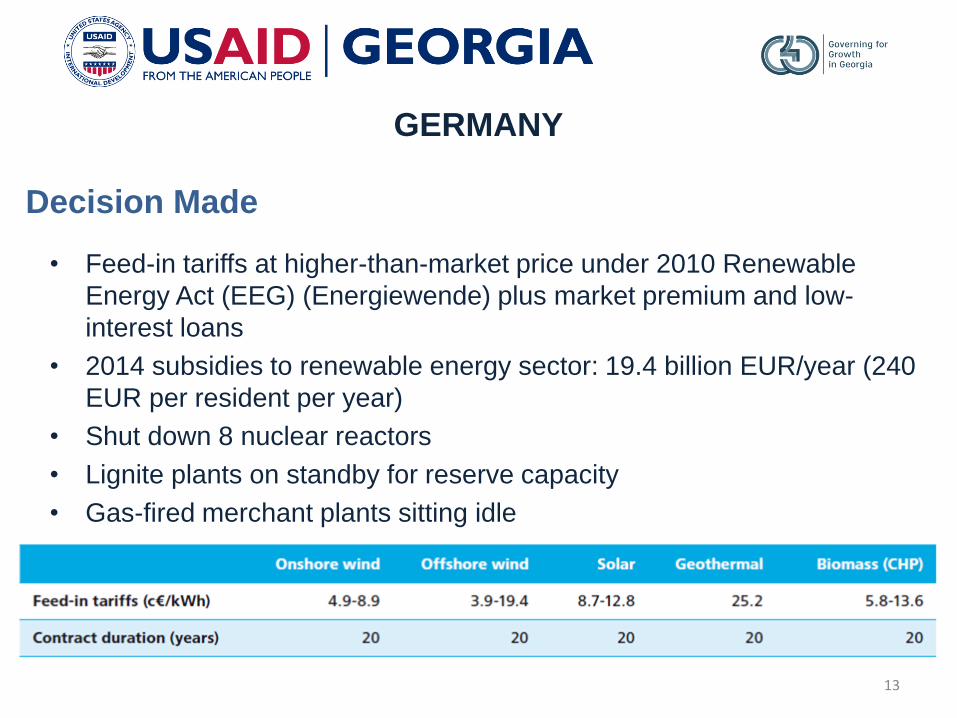
GERMANY
• Feed-in tariffs at higher-than-market price under 2010 Renewable
Energy Act (EEG) (Energiewende) plus market premium and low-
interest loans
• 2014 subsidies to renewable energy sector: 19.4 billion EUR/year (240
EUR per resident per year)
• Shut down 8 nuclear reactors
• Lignite plants on standby for reserve capacity
• Gas-fired merchant plants sitting idle
Decision Made
13
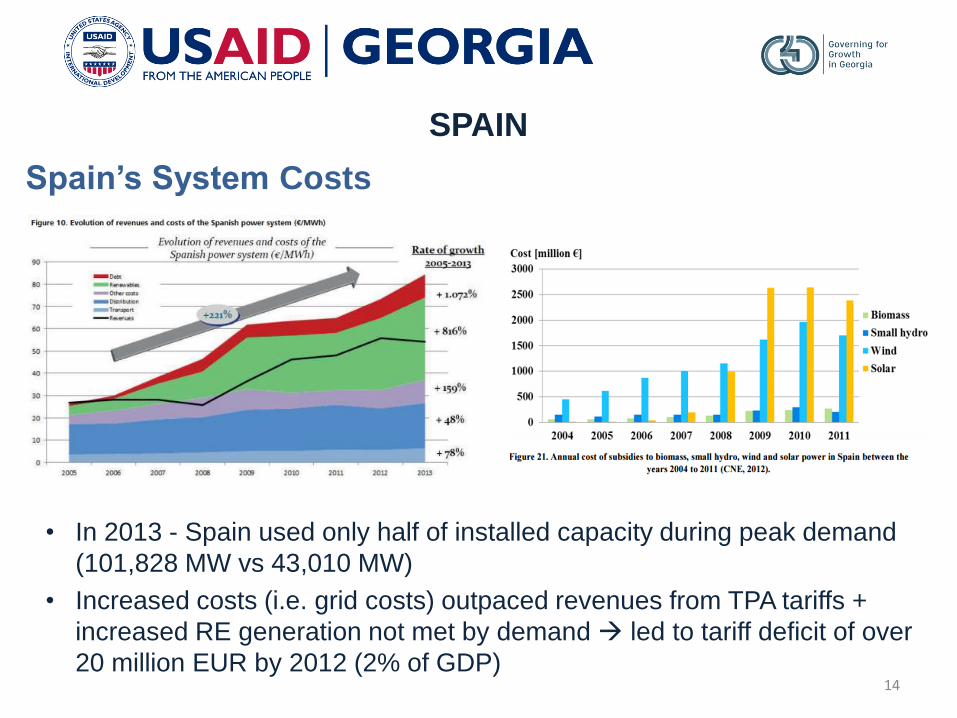
SPAIN
Spain’s System Costs
• In 2013 - Spain used only half of installed capacity during peak demand
(101,828 MW vs 43,010 MW)
• Increased costs (i.e. grid costs) outpaced revenues from TPA tariffs +
increased RE generation not met by demand led to tariff deficit of over
20 million EUR by 2012 (2% of GDP)14

THAILAND
“Chartist” Demand Projection
• EGAT overestimated demand, signed contracts assuming strong
growth, not accounting for a host of other factors
‒ Industrial demand growth evaporated w/ 1997 Asian Financial
Crisis, made worse by Baht-denoted PPAs
15
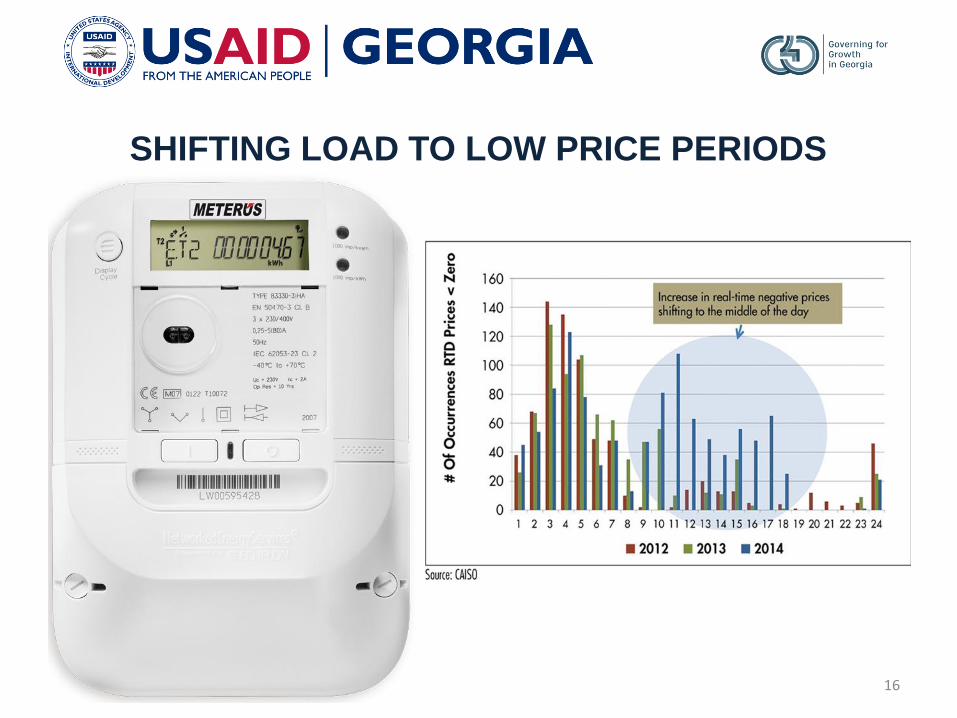
SHIFTING LOAD TO LOW PRICE PERIODS
16
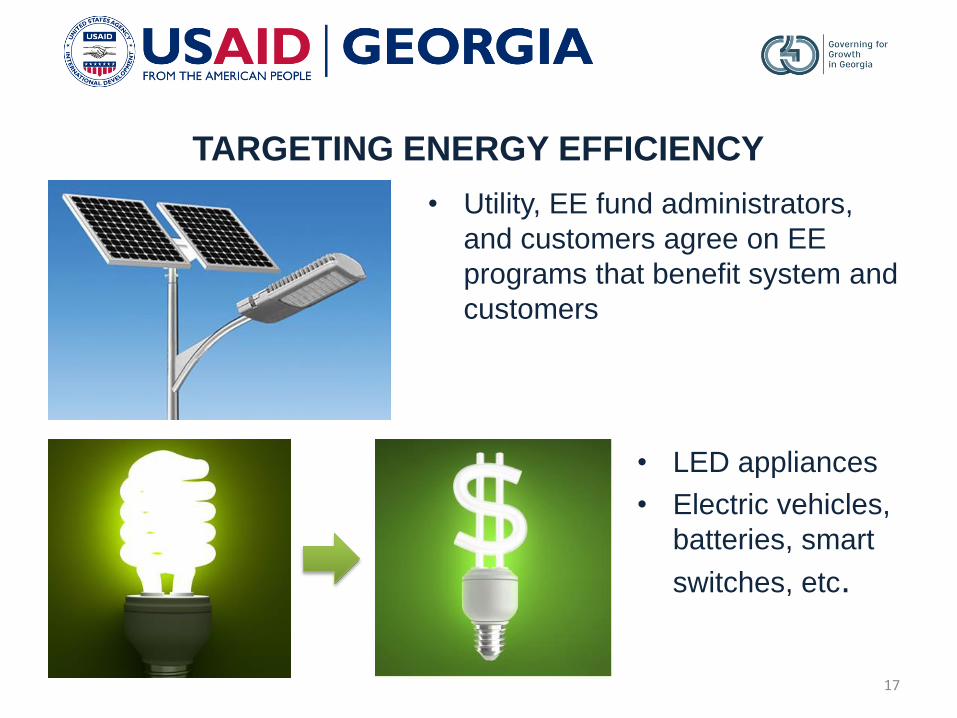
TARGETING ENERGY EFFICIENCY
• Utility, EE fund administrators,
and customers agree on EE
programs that benefit system and
customers
• LED appliances
• Electric vehicles,
batteries, smart
switches, etc.
17
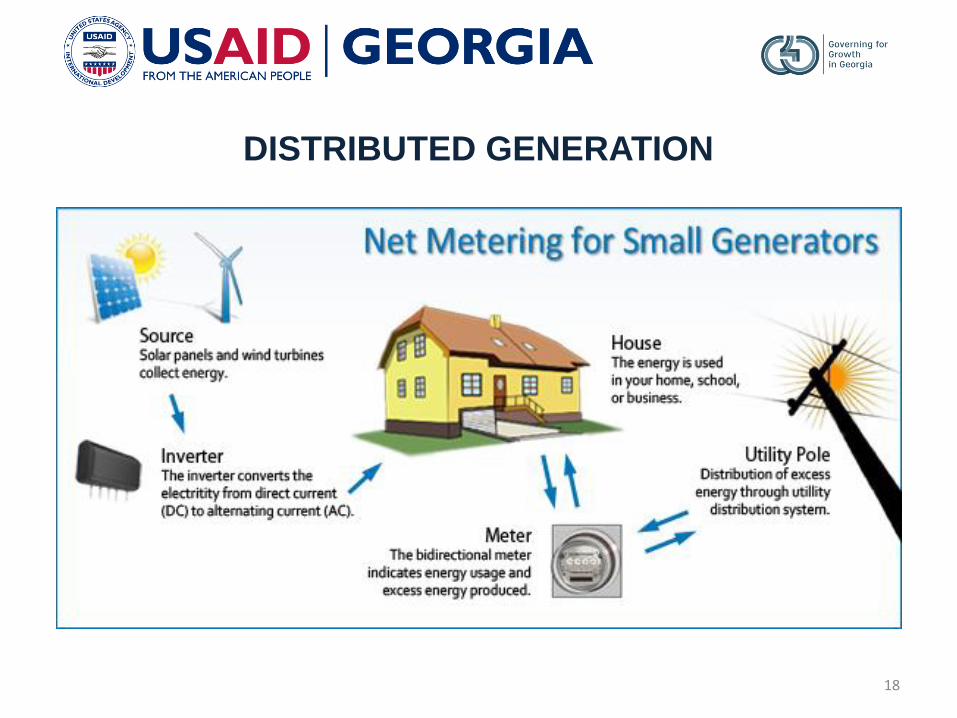
DISTRIBUTED GENERATION
18

THE REVOLUTIONARY DESIGN
Solar Panels
Battery Pack
Substation
19
Utility
Retail
Customer

FUEL SWITCHING
• Complimented by
modern equipment
upgrades, fuel
switching is a simple
approach to
reducing energy
consumption and
costs for end-users
20
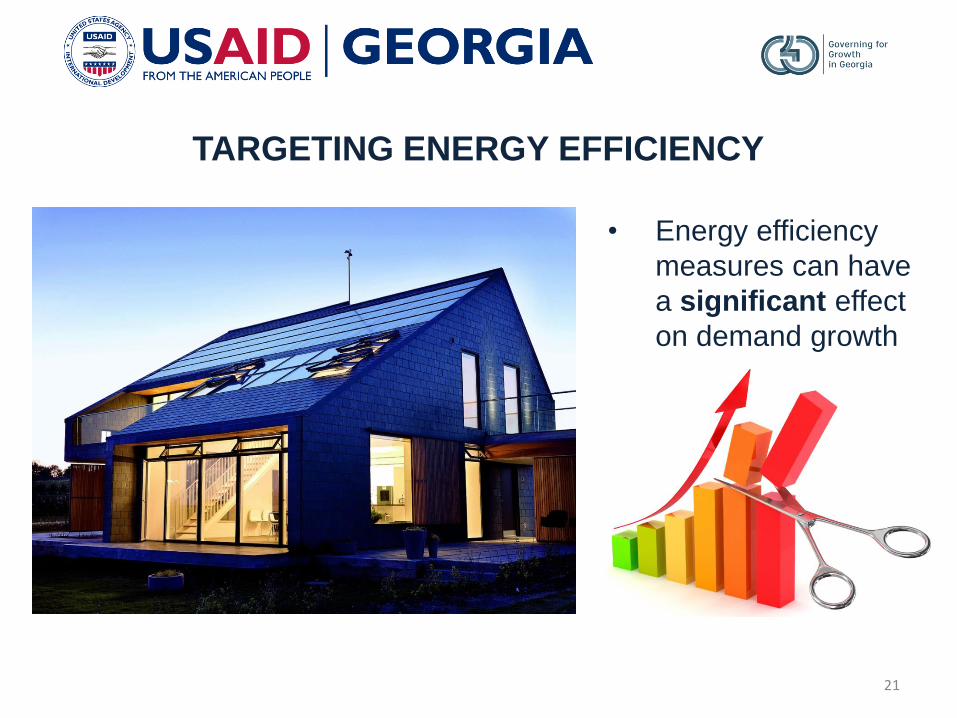
TARGETING ENERGY EFFICIENCY
• Energy efficiency
measures can have
a significant effect
on demand growth
21
• Big potential of fuel switching
• Lack of energy efficiency programs
• Load growth is low that could be caused by several factors,
such as low economic growth or electricity price increase
Source: World Experience for Georgia (WEG)
SURVEY RESULTS IN INDUSTRIAL AND COMMERCIAL SECTORS
22
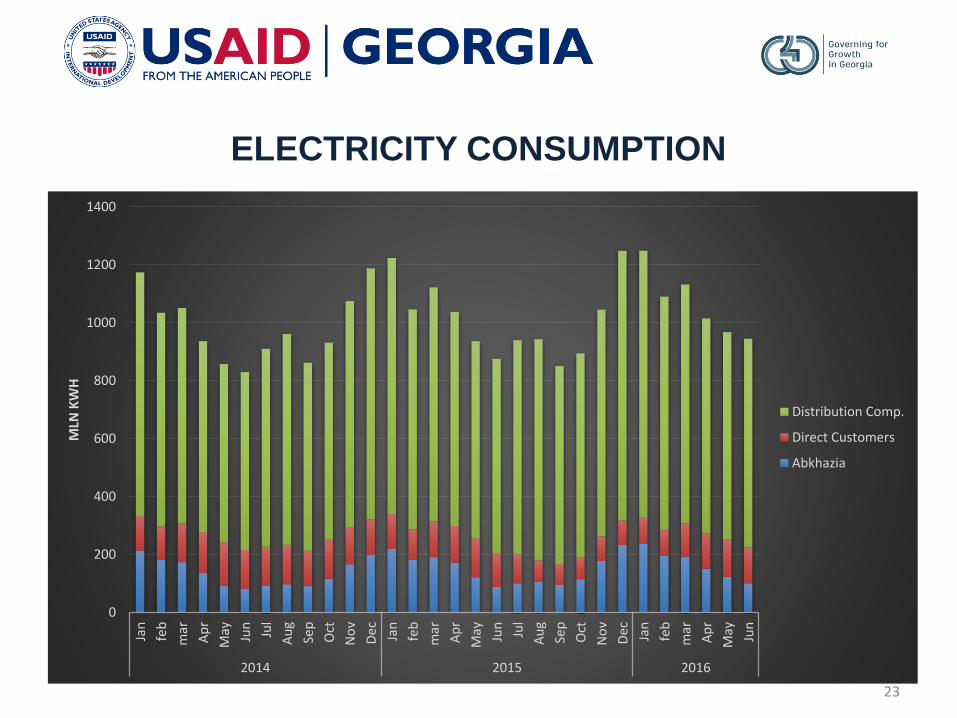
ELECTRICITY CONSUMPTION
0
200
400
600
800
1000
1200
1400
Jan
feb
mar
Ap
r
May Jun
Jul
Au
g
Sep
Oct
No
v
Dec Jan
feb
mar
Ap
r
May Jun
Jul
Au
g
Sep
Oct
No
v
Dec Jan
feb
mar
Ap
r
May Jun
2014 2015 2016
MLN
KW
H
Distribution Comp.
Direct Customers
Abkhazia
23

M-CEP PROCESS
24
Customer
Analysis
Supply OptionsDemand-Side
Options
Define IRP Objectives
Economic Drivers of
Consumer
Scenario Analysis
Market
Transformation
Research
Long-term Energy
Plan
Energy Demand
Growth ForecastFuel Forecast
• Affordable
• Environmental
• Etc.
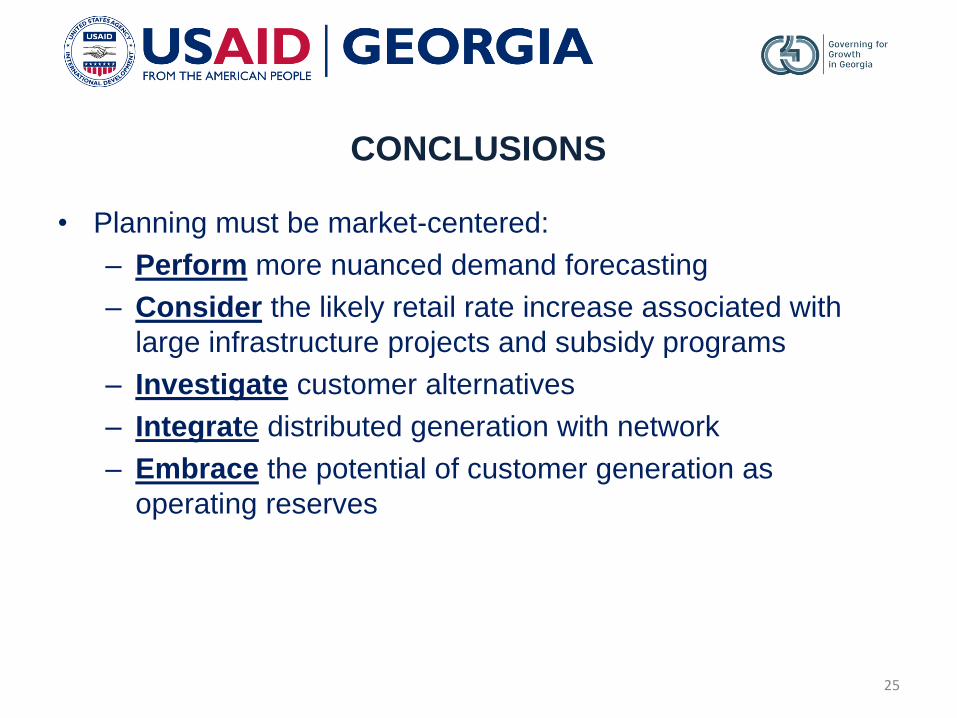
CONCLUSIONS
• Planning must be market-centered:
– Perform more nuanced demand forecasting
– Consider the likely retail rate increase associated with
large infrastructure projects and subsidy programs
– Investigate customer alternatives
– Integrate distributed generation with network
– Embrace the potential of customer generation as
operating reserves
25
THANK YOU!
Presentation was prepared by:
JAKE DELPHIA
Senior Energy Expert
USAID – Governing for Growth (G4G) in Georgia
26