jo£o ricardo cerqueira pinto production of cellulose-binding
TRANSCRIPT
Novembro de 2006
Tese de DoutoramentoDoutoramento em Engenharia Quimica e Biológica
Trabalho efectuado sob a orientação dosDoutor Miguel GamaProfessor Doutor Manuel Mota
João Ricardo Cerqueira Pinto
Production of Cellulose-Binding Domains byProteolysis; Studies on the Adsorption andModification of Cellulose Fibres

Ricardo Pinto Production of CBDs and adsorption to cellulose fibres
ii
Autor João Ricardo Cerqueira Pinto
e-mail [email protected]
Telf. +351 253604400
BI 10399488
Título da tese
Production of Cellulose-Binding Domains by Proteolysis; Studies on the Adsorption and
Modification of Cellulose Fibres
Orientadores
Doutor Miguel Gama
Professor Doutor Manuel Mota
Ano de conclusão 2006
Doutoramento em Engenharia Química e Biológica
É AUTORIZADA A REPRODUÇÃO PARCIAL DESTA TESE, APENAS PARA EFEITOS
DE INVESTIGAÇÃO, MEDIANTE DECLARAÇÃO ESCRITA DO INTERESSADO, QUE A
TAL SE COMPROMETE.
Universidade do Minho, 3 de Novembro de 2006
Ricardo Pinto Production of CBDs and adsorption to cellulose fibres
iii
Agradecimentos
Gostaria de agradecer em primeiro lugar ao meu orientador, Doutor Miguel Gama, por
todo o apoio e paciência durante a execução experimental deste trabalho, assim como durante as
diversas correcções dos artigos e desta tese.
Ao Professor Doutor Manuel Mota pelo apoio e correcções pertinentes do texto dos
diversos artigos.
A todas as pessoas do Departamento de Ciências e Tecnologias do Papel, em particular à
Professora Ana Paula Duarte, por toda a ajuda e apoio disponibilizados durante as minhas
estadias na Covilhã.
À Engª Teresa Ferrete e aos técnicos do laboratório de análise da Portucel Viana, pela
disponibilidade e apoio dados ao trabalho aí efectuado.
A todos os meus amigo que, de uma forma ou de outra, contribuiram para a realização
desta tese.
A la Jacqueline que, con todo su apoyo, cariño y amor, me ayudó a realizar más esta
etapa de mi vida.
À Fundação para a Ciência e Tecnologia (FCT) pelo apoio financeiro através da bolsa de
investigação SFRH/BD/6934/2001.
Ricardo Pinto Production of CBDs and adsorption to cellulose fibres
iv
Abstract
Most cellulose degrading enzymes are composed of modular structures. In the case of
fungi, cellulases are formed by a catalytic domain (CD) and by a cellulose-binding domain
(CBD), interconnected through a highly glycosylated protein linker. These enzymes are used for
paper production, either to allow a more efficient refinement or to improve the paper sheet
production.
This work aimed at implementing a procedure to produce significant amounts of purified
CDBs. The purified CBDs coating of the fibers surface was assessed by a method based on
fluorescence microscopy. Finally, the application of CBDs in paper production was evaluated.
The CBDs production was achieved by proteolysis, with papain, of the commercial
preparation Celluclast® (cellulases from Trichoderma reesei). Afterwards, the CBDs were
separated by ultrafiltration and further purified by ion exchange chromatography. The obtained
CBDs is part of cellobiohydrolase I, as demonstrated by N-terminal peptide sequencing and
MALDI-TOF. The isolated proteins kept the highly glycosylated peptide linker, as verified by
sugar analysis, that demonstrated the existence of 30% (w/w) of carbohydrates, most of which
mannose (85%). It was shown that these CBDs, as expected, have a high cellulose affinity,
desorbing very slowly. Using CBDs conjugated with fluorescein isothiocyanate (FITC), it was
verified that the adsorption is not uniform, being higher on the fibre extremities and defects, due
either to a higher specific surface area (amorphous regions) or to a higher affinity of CBDs to
these regions.
To quantify the CBDs coating of the fibres’ surface, a MATLAB program was
developed. This program allows for the correlation between the fluorescence signal intensity
produced by the adsorbed CBF-FITC, and its surface concentration. The FITC photobleaching
was verified to be only significant for CBD-FITC in solution, being negligible for the protein
adsorbed on cellulose. The adsorption of CBDs to cellulose films (made from cellulose acetate),
in saturation concentrations, resulted in the equivalent to 1.6 to 2 layer of protein. In the case of
cellulose fibres (Whatman CF11), this value increased to the equivalent of roughly 4 layers.
These high values are due to the protein penetration into the fibers, as was demonstrated by
confocal microscopy and immunolabelling with colloidal gold and transmision electron
microscopy, but also to the increased surface irregularities of Whatman CF11 that would
increase the surface area.
Ricardo Pinto Production of CBDs and adsorption to cellulose fibres
v
The CBD adsorption onto primary and secondary fibres implied a reduction of the
Schopper-Riegler index (increase in water flow between the fibres) and an increase of both the
water retention value (WRV) and air permeability of the handsheets. The strength properties did
not suffer a significant variation with adsorbed CBDs, except for the non-refined virgin fibres. In
this case, a slight improvement was observed, probably due to the lower surface area. The effect
of CBDs on the surface properties was analysed by measuring the ZETA-potencial and contact
angles. The adsorption of CBDs chemically conjugated to lysozyme (protein with a positive
charge) did not significantly change the papersheet properties. The ZETA-potential was only
significantly altered in the case of low surface area fibres (non-refined virgin fibres), as noticed
by the reduction of the fibres negative charge. As expected, the variation was more significant
with lysozyme conjugated CBD. This higher variation was also confirmed by contact angles
measurement. The presence of conjugates made the cellulose film hydrophobic, due to the
reduction of the negative polar component of the fibres.
Ricardo Pinto Production of CBDs and adsorption to cellulose fibres
vi
Resumo
As enzimas que degradam a celulose são maioritariamente constituídas por estruturas
modulares. No caso dos fungos, as celulases são constituídas por um domínio catalítico (CD) e
um domínio de ligação à celulose (CBD), interligados por uma cadeia proteica altamente
glicosilada. As enzimas têm sido amplamente utilizadas na produção de papel, para permitir uma
mais eficiente refinação, e melhorar a formação das folhas de papel.
Neste trabalho pretendeu-se inicialmente implementar um processo laboratorial de
produção de CBDs, em larga escala (grama). Para quantificar a taxa de cobertura dos CBDs
sobre a superfície das fibras de celulose, foi desenvolvido um método baseado em microscopia
de fluorescência. Posteriormente, avaliou-se o potencial de aplicação dos CBDs na produção de
papel.
A produção de CBDs foi realizada por hidrólise, usando proteases (papaina), do
preparado comercial Celluclast® (celulases do fungo Trichoderma reesei). Posteriormente, os
CBDs foram separados por ultrafiltração e posteriormente purificados numa coluna de troca
iónica. Os CBDs isolados pertencem à enzima celobiohidrolase I, como foi demonstrado por
sequenciação peptídica N-terminal e MALDI-TOF. A proteína purificada inclui a região de
ligação altamente glicosilada, como foi verificado pela análise dos açúcares totais, que
demonstrou a existência de 30% (m/m) de carbohidratos nas proteínas, em particular de manose
(85%). Verificou-se que estes CBDs possuem, como esperado, uma elevada afinidade por
celulose. A adsorção a fibras de celulose pura (Whatman CF11) não é irreversível, sendo a
desorção muito lenta. Recorrendo à conjugação dos CBDs com isotiocianato de fluoresceina
(FITC) verificou-se que a adsorção nas fibras não é uniforme, sendo superior nas extremidades e
irregularidades das fibras, devido a um aumento da área superficial disponível para os CBDs
(regiões amorfas) ou a uma maior afinidade para estes locais.
Para quantificar a taxa de cobertura das fibras pelos CBDs, foi desenvolvido um método
baseado em microscopia de fluorescência. Este método passou pelo desenvolvimento de um
programa em MATLAB para calibrar o sinal produzido pelos CBDs, permitindo efectuar uma
correspondência entre o sinal produzido por fibras com CBD-FITC e a densidade de proteína na
superfície das fibras. No desenvolvimento do método tomou-se em consideração a
fotoinstabilidade (photobleaching) do FITC, tendo-se verificado que este apenas é significativo
para CBD-FITC em solução, mas negligenciável quando adsorvido em celulose. Os CBDs
adsorvidos em filmes de celulose (preparados a partir de acetato de celulose), em concentrações

Ricardo Pinto Production of CBDs and adsorption to cellulose fibres
vii
saturantes, corresponderam a um revestimento equivalente a 1.6 a 2 camadas de proteína. No
caso das fibras de celulose, estes valores aumentaram para o equivalente a cerca de 4 camadas,
no caso da Whatman CF11. Estes valores elevados resultam da penetração das proteínas no
interior das fibras, como pôde ser demonstrado tanto por microscopia confocal como por
microscopia electrónica de transmissão (por imunomarcação com ouro coloidal). A
irregularidade da superfície das fibras poderá também aumentar a taxa de cobertura dos CBDs.
A adsorção de CBD a fibras de papel, primárias e secundárias, implica uma diminuição
do índice de Shopper-Riegler (aumento do escoamento de água das fibras), assim como um
aumento do índice de retenção de água (WRV) e da permeabilidade à passagem de ar nas folhas
de papel produzidas no laboratório. As propriedades físicas das folhas não sofreram alterações
significativas com a adsorção dos CBDs, excepto no caso das fibras virgens não refinadas. Neste
caso, os parâmetros mecânicos aumentaram ligeiramente, devido muito provavelmente à menor
área superficial destas fibras e logo a uma maior influência dos CBDs adsorvidos. A adsorção de
CBDs conjugados com lisozima (proteína com carga positiva) não modificou significativamente
as propriedades das folhas. O efeito dos CBDs nas propriedades de superfície das fibras foi
analisado através da medição do potencial ZETA e dos ângulos de contacto. O potencial ZETA
só variou significativamente no caso das fibras com menor área superficial (fibras virgens não
refinadas), traduzindo-se numa diminuição da carga negativa com a adsorção dos CBDs. Esta
variação foi também observada com partículas de celulose pura, nos casos em que se usou uma
elevada carga proteica. Como esperado, a variação foi mais significativa quando foram utilizados
os CBDs conjugados com lisozima. Esta maior variação também foi observada nos ângulos de
contacto, onde a presença dos conjugados tornou o filme de celulose hidrofóbico, devido à
diminuição do carácter polar negativo das fibras.
Ricardo Pinto Production of CBDs and adsorption to cellulose fibres
viii
Table of Contents
LIST OF ABBREVIATIONS ........................................................................................................X
LIST OF FIGURES.......................................................................................................................XI
LIST OF GENERAL NOMENCLATURE................................................................................XVI
LIST OF TABLES ................................................................................................................... XVII
INTRODUCTION...........................................................................................................................1
1. CELLULOSE ..............................................................................................................................1
2. CELLULOLYTIC ENZYMES .........................................................................................................2
3. CELLULOSE BINDING DOMAINS................................................................................................9
RESULTS OVERVIEW AND CONCLUSIONS.........................................................................16
Production of CBD by proteolysis ........................................................................................16
Studies using conjugates CBD-FITC ....................................................................................17
Studies of CBDs on fibre modification..................................................................................18
Conclusions ...........................................................................................................................20
MANUSCRIPTS...........................................................................................................................31
M1. LARGE SCALE PRODUCTION OF CELLULOSE-BINDING DOMAINS. ADSORPTION STUDIES
USING CBD-FITC CONJUGATES................................................................................................32
Abstract .................................................................................................................................32
Introduction...........................................................................................................................33
Materials and Methods..........................................................................................................34
Results and Discussion..........................................................................................................37
Conclusions ...........................................................................................................................42
Acknowledgements ................................................................................................................42
Bibliography..........................................................................................................................43
Figures ..................................................................................................................................47
M2. DEVELOPMENT OF A METHOD USING IMAGE ANALYSIS AND CBD-FITC CONJUGATES FOR
THE MEASUREMENT OF CBDS ADSORBED ONTO CELLULOSE FIBERS ..........................................54
Abstract .................................................................................................................................54
Introduction...........................................................................................................................55
Materials and Methods..........................................................................................................56

Ricardo Pinto Production of CBDs and adsorption to cellulose fibres
ix
Results and Discussion..........................................................................................................60
Conclusion.............................................................................................................................63
Acknowledgments ..................................................................................................................63
References .............................................................................................................................63
Figures ..................................................................................................................................66
Tables ....................................................................................................................................73
M3. QUANTIFICATION OF THE CBD-FITC CONJUGATES SURFACE COATING ON CELLULOSE
FIBERS 74
Abstract .................................................................................................................................75
Background ...........................................................................................................................75
Results and Discussion..........................................................................................................76
Conclusions ...........................................................................................................................78
Methods .................................................................................................................................78
Authors' contributions ...........................................................................................................81
Acknowledgements ................................................................................................................82
References .............................................................................................................................82
Figures ..................................................................................................................................85
M4. EFFECT OF CELLULOSE-BINDING DOMAINS ON PULP PAPER PROPERTIES..........................90
Abstract .................................................................................................................................90
Introduction...........................................................................................................................91
Materials and Methods..........................................................................................................92
Results and Discussion..........................................................................................................94
Conclusion.............................................................................................................................98
Acknowledgments ..................................................................................................................98
Bibliography..........................................................................................................................98
Figures ................................................................................................................................101
Tables ..................................................................................................................................104
Ricardo Pinto Production of CBDs and adsorption to cellulose fibres
x
List of Abbreviations
AFM Atomic force microscopy
BET Brunauer-Emmett-Teller equation
BSA Bovine serum albumin
CBD Cellulose-binding domain
CBH Cellobiohydrolase
CBHI Cellobiohydrolase I
CBHII Cellobiohydrolase II
CBM Cellulose-binding module
CD Catalytic domain
DMSO Dimethyl sulfoxide
DNS Dinitro-salicylic acid
EG Endoglucanase
FITC Fluorescein isothiocyanate
FPU Filter paper units
GC Gas chromatography
HEPES 4-(2-hydroxyethyl)-1-piperazineethanesulfonic acid
HSAB N-hydroxysuccinimidyl 4-azidobenzoate
IEC Ion exchange column
MALDI-TOF Matrix-assisted laser desorption/ionisation-time of flight
PBS Phosphate Buffered Saline
pI Isoelectric point
TC Terminal complexes
TEM Transmission Electron Microscopy
TFMS Trifluoromethanesulfonic acid
UV Ultraviolet radiation

Ricardo Pinto Production of CBDs and adsorption to cellulose fibres
xi
List of Figures
Figure 1. Detail of a cellulose chain, highlighting the repetitive unit cellobiose (n). .....................1
Figure 2. Structure of the rosette terminal complexes, and microfibre formation (adapted
from Doblin et al., 2002). ........................................................................................................2
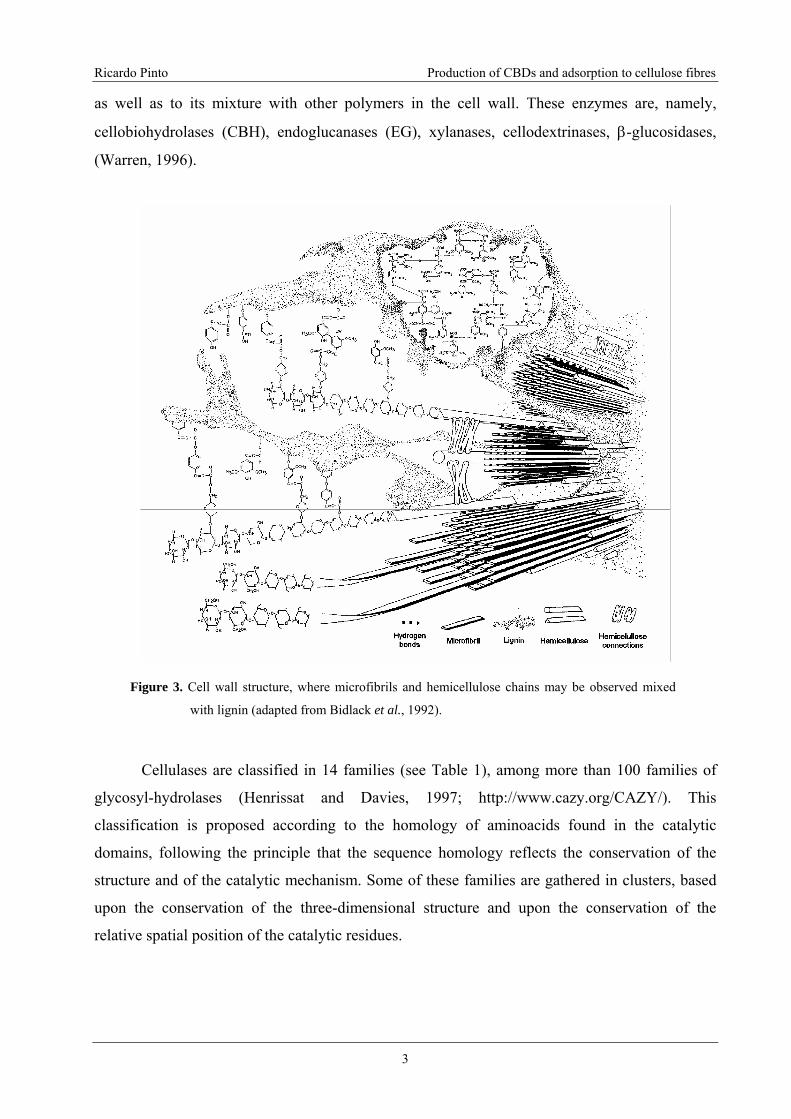
Figure 3. Cell wall structure, where microfibrils and hemicellulose chains may be observed
mixed with lignin (adapted from Bidlack et al., 1992)............................................................3
Figure 4. Scheme showing the two mechanisms of enzymatic hydrolysis (Schulein, 2000;
Sinnott, 1990). .........................................................................................................................5
Figure 5. Simplified scheme of the Clostridium thermocellum cellulosome, interacting with
the cell surface. CBM – Cellulose Binding Module (adapted from Shoham et al.,
1999). .......................................................................................................................................6
Figure 6. Schematic representation of the cellulose fibre organization, with crystalline and
amorphous areas. The enzyme CBHI (Cel7A) act on the fibre from the reducing end
(symbolized as full circles in the figure, ‘R’), while CBHII (Cel6A) acts from the non-
reducing ends (open circles, ‘NR’). Endoglucanases (EG) act on the middle of the
cellulose chains, leading to an increase of the chain ends, wherefrom the CBHs may
act (Teeri, 1997).......................................................................................................................7
Figure 7. Active sites found in cellulases: a – cleft (endoglucanase from Trichoderma
fusca); b – tunnel (cellobiohydrolase from Trichoderma reesei). The catalytic residues
are shown in orange (adapted from Davies and Henrissat, 1995). ..........................................8
Figure 8. Structural models of CBDs from cellobiohydrolase I (left) and endoglucanase I
(right), from Trichoderma reesei. Cel7A has three β−sheets shown by the arrows. The
tyrosine (a) and tryptophan (b) residues define an almost plane surface on the CBDs
(adapted from Carrard and Linder, 1999, and Mattinen et al., 1998)....................................12
Figure 9. Perspective of the structures representative of the CBDs from EGI (left) and
CBHI (right). The aromatic residues aligned at the inferior face are highlighted
(adapted from Mattinen et al., 1998). ....................................................................................14

Ricardo Pinto Production of CBDs and adsorption to cellulose fibres
xii
Figure 10. Model of the interaction between the CBDs from cellobiohydrolase I (Cel7A)
and endoglucanase I (Cel7B) and the glucose residues present in cellulosic fibres
(adapted from Mattinen et al., 1997). ....................................................................................15
Figure M1.1. Electropherogram of Celluclast (Cell.), hydrolyzed Celluclast (Hyd. Cell.)
and Cellulose-Binding Domains (CBD). Both time and signal are normalized....................47
Figure M1.2. Electropherogram of Celluclast hydrolyzed with different amounts of papain
by protein weight (the dilution factor of the commercial enzyme is shown). Time is
normalized. ............................................................................................................................48
Figure M1.3. MALDI-TOF analysis of the purified CBD peptides..............................................48
Figure M1.4. Fluorescence Spectrums of CBD after ultra filtration and the subsequent Ion
Exchange purification. Signals are normalized to the highest value obtained on each
measurement. .........................................................................................................................49
Figure M1.5. Chromatogram of the first amino acid detected on the N-terminal peptide
sequencing of the purified CBD. This chromatogram reveals that the isolated CBD is
rather pure..............................................................................................................................49
Figure M1.6. MALDI-TOF analysis of the deglycosylated CBD peptides. The
heterogeneous peak observed in Figure 3 (8.43kDa) is replaced by a main peak at 5.84
kDa. The complete removal of the glycosidic fraction with TFMS leads to some
proteolysis, several peaks not observed prior to TFMS treatment (nor when the
treatment is performed under milder conditions) being detected (1700-4000Da). ...............50
Figure M1.7. Adsorption isotherm of CBDs purified by ion exchange chromatography.............51
Figure M1.8. Fluorescence microscopy of Whatman CF11 (upper row) and Avicel (lower
row) cellulose fibers treated with labeled CBDs, with different initial concentrations
(0, 50, 100 and 300 μg/mL). In the control fibers (left column), as expected, no
fluorescence was detected. The micrographs were obtained using the same exposure
time. .......................................................................................................................................51
Figure M1.9. Images of a mixture of treated and untreated CF11 cellulose fibers with
labeled CBD, under fluorescent (first and third column) and bright field (second and

Ricardo Pinto Production of CBDs and adsorption to cellulose fibres
xiii
fourth column) microscopy, with 400 milliseconds of exposure time, put in contact for
0, 24, 48, 98 and 192 hours....................................................................................................52
Figure M1.10. Comparison of the crystalline (top row) and phosphoric acid swollen
(amorphous – bottom row) Whatman CF11 fibers, both treated with FITC-labeled
CBD, at bright field (left) and fluorescent (right) microscopy. The probably
amorphous sites of the microfibril (left side of the upper images) have attracted more
FITC-labeled CBD.................................................................................................................53
Figure M2.1. Values of fluorescence intensity (IA) versus exposure time, obtained using a
CBD-FITC concentration of 10.14×10⁻¹³ μmol·mm-2 (or 85.5 μg·mL-1), and the
corresponding non-linear regression fitting. Inset: photobleaching curve of a mono-
exponential correlation, the model used in the calculation of IA. ..........................................66
Figure M2.2. Values of fluorescence intensity as a function of the CBD-FITC
concentration..........................................................................................................................67
Figure M2.3. Intensity and sensitivity factors variation with CBD concentration for the
studied capture times, obtained by averaging a 10×10 pixel area at the centre of each
original images (continuous lines connect the values used for the calibration model).
Legend: ◊ – Red channel; ■ – Green channel; ▲ – Blue channel.........................................68
Figure M2.4. Calibration images obtained at capture time of 300 ms; each surface
represents a different CBD-FITC concentration. The inset shows, as an example, the
CBD concentration versus pixel intensity, obtained approximately at the center of the
images. ...................................................................................................................................69
Figure M2.5. Estimated CBD-FITC per unit area, for three different protein solutions
volumes. The labeling classes (TL – top left; TR – top right; C – centre; BL – bottom
left; BR – bottom right) refer to average values obtained at different selected regions
in the image. The black line corresponds to the expected value. Duplicate values are
shown for each volume used..................................................................................................70
Figure M2.6. Cellulose film images obtained, for 400 ms of exposure time, at 0 (a) and 20
seconds (b) of exposure to the fluorescence light. The black squares indicate the
positions where the measurements were carried out. ............................................................70
Ricardo Pinto Production of CBDs and adsorption to cellulose fibres
xiv
Figure M2.7. Images of cellulose films with adsorbed CBD-FITC: (a) and (c) correspond
to grey scale images of the films, produced by the fluorescent light emitted by the
CBD linked FITC; (b) and (d) correspond to the program treated images, where black
color corresponds to 0 μmol·mm-2 and white color to the maximum concentration used
in the corresponding calibration procedure. ..........................................................................71
Figure M2.8. Adsorption isotherm of CBD on Whatman CF11 fibers, for 2 hours contact.
The line was obtained by nonlinear regression of the Langmuir isotherm, resulting in
the constants: CBDMax = 2.42 μmol·g-1 and ka = 0.209 μM-1. The grey circle
corresponds to the equilibrium position of samples put in contact with an initial CBD
concentration of 400 μg·mL-1. ...............................................................................................72
Figure M2.9. AFM surface image of cellulose film, obtained in the air. The upper image
corresponds to the xx side view. ............................................................................................72
Figure M3.1. Portucel and Whatman CF11 fibres treated with CBD-FITC. The fibres
treated with a concentration of 60 μg/mL (or 2 mgCBD/gfibres). The images were
acquired with an exposure time of 600 ms. The white squares identify the areas
selected for analysis. The more fluorescent parts (black regions on the analyzed
images) are out of range (calibration shown elsewhere), and were therefore excluded
from the analysis....................................................................................................................85
Figure M3.2. Whatman CF11 images. The characteristic curled structure of the fibres
(circle)....................................................................................................................................85
Figure M3.3. Estimated surface concentration of adsorbed CBD. The estimated fraction of
surface coverage is indicated in the figure bars. The values shown are based on the
assumption that the protein is adsorbed on the external surface of the fibres only. The
values are shown with 95% confidence intervals error bars..................................................86
Figure M3.4. Images obtained by fluorescence microscopy of Whatman CF11, amorphous
and Sigmacell 20 fibres. The images were obtained before – 1st and 3rd column – and
after – 2nd and 4th column – the image analysis of fibres treated with a CBD-FITC
concentration of 400 μg/mL. The black areas on the treated images correspond to the
fluorescence emission, which is higher than the one used in the calibration.

Ricardo Pinto Production of CBDs and adsorption to cellulose fibres
xv
Fluorescence images acquired for 100 ms (CF11) and 80 ms (Amorphous and
Sigmacell). .............................................................................................................................87
Figure M3.5. Images from confocal microscopy. Three plans of a CF11 fibre are presented,
as schematized in the right insertion of figure c. The insertions d, e and f correspond to
the pixels intensity (256 grey levels) obtained at the position indicated by the line
(white circle), at different depths. The adsorption conditions were 20 mgCBD/gFibre, for
30 minutes of contact. Each image corresponds to an acquisition thickness of 1 μm...........88
Figure M3.6. Electron microscopy image of immunolabeling of CBD-treated Whatman
CF11 fibers. ...........................................................................................................................89
Figure M4.1. Schopper-Riegler index obtained for the several paper fibers studied..................101
Figure M4.2. Physical properties variation between the CBD treated and untreated
(control), at three different beating revolutions (0, 1000 and 3000), of virgin (primary)
fibers, with the respective confidence interval at 95%. The stars (*) indicates a statistic
meaningful variation (p<0.05). ............................................................................................101
Figure M4.3. Physical properties variation between the CBD treated and untreated
(control), at three different beating revolutions (0, 1000 and 3000), of recycled
(secondary) fibers, with the respective confidence interval at 95%. The stars (*)
indicates a statistic meaningful variation (p<0.05)..............................................................102
Figure M4.4. Size exclusion chromatography of the CBD-lysozyme conjugate and of a
mixture of the two proteins..................................................................................................102
Figure M4.5. Adsorption, on Whatman CF11, of CBD in mixture or conjugated with
lysozyme, using the same CBD to lysozyme molar ratio. ...................................................103
Ricardo Pinto Production of CBDs and adsorption to cellulose fibres
xvi
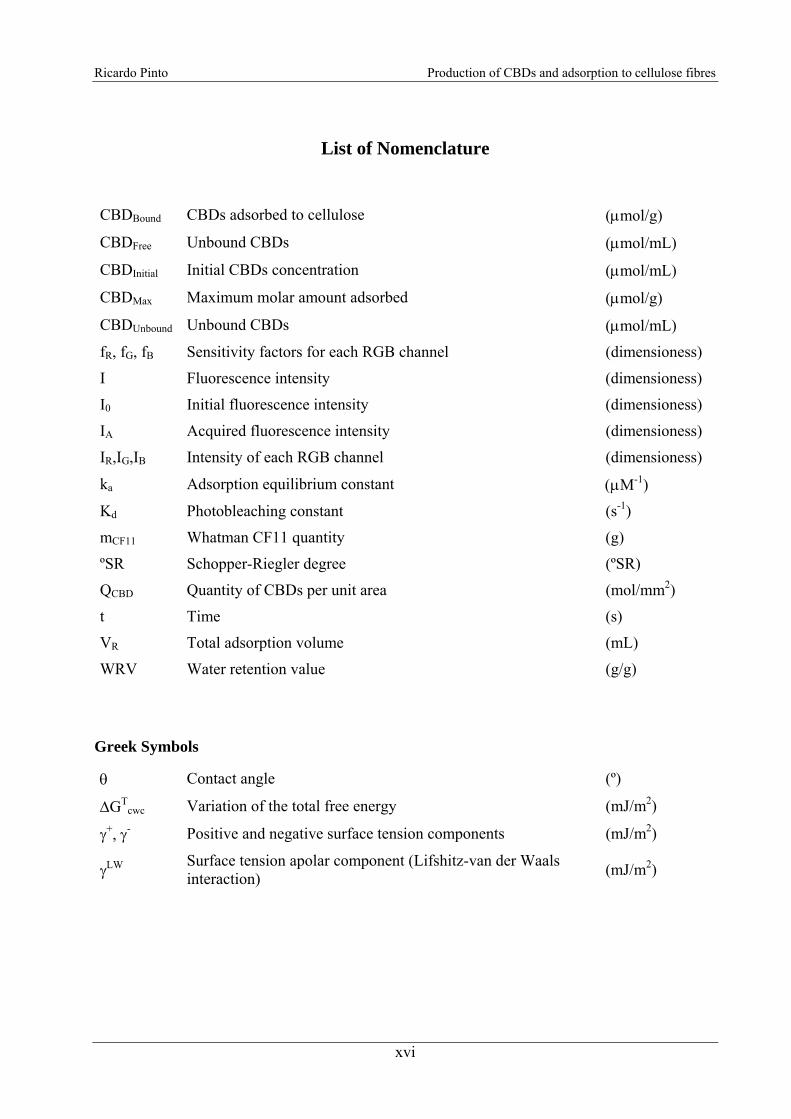
List of Nomenclature
CBDBound CBDs adsorbed to cellulose (μmol/g)
CBDFree Unbound CBDs (μmol/mL)
CBDInitial Initial CBDs concentration (μmol/mL)
CBDMax Maximum molar amount adsorbed (μmol/g)
CBDUnbound Unbound CBDs (μmol/mL)
fR, fG, fB Sensitivity factors for each RGB channel (dimensioness)
I Fluorescence intensity (dimensioness)
I0 Initial fluorescence intensity (dimensioness)
IA Acquired fluorescence intensity (dimensioness)
IR,IG,IB Intensity of each RGB channel (dimensioness)
ka Adsorption equilibrium constant (μM-1)
Kd Photobleaching constant (s-1)
mCF11 Whatman CF11 quantity (g)
ºSR Schopper-Riegler degree (ºSR)
QCBD Quantity of CBDs per unit area (mol/mm2)
t Time (s)
VR Total adsorption volume (mL)
WRV Water retention value (g/g)
Greek Symbols
θ Contact angle (º)
ΔGTcwc Variation of the total free energy (mJ/m2)
γ+, γ- Positive and negative surface tension components (mJ/m2)
γLW Surface tension apolar component (Lifshitz-van der Waals interaction) (mJ/m2)
Ricardo Pinto Production of CBDs and adsorption to cellulose fibres
xvii
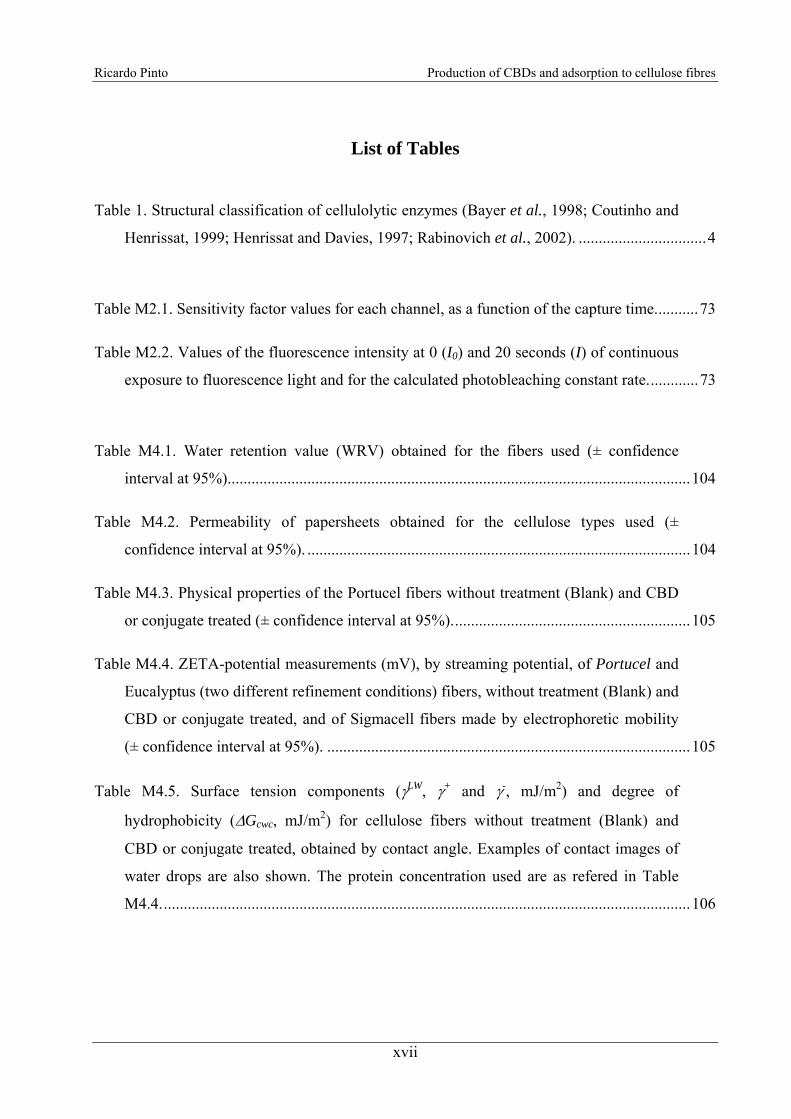
List of Tables
Table 1. Structural classification of cellulolytic enzymes (Bayer et al., 1998; Coutinho and
Henrissat, 1999; Henrissat and Davies, 1997; Rabinovich et al., 2002). ................................4
Table M2.1. Sensitivity factor values for each channel, as a function of the capture time...........73
Table M2.2. Values of the fluorescence intensity at 0 (I0) and 20 seconds (I) of continuous
exposure to fluorescence light and for the calculated photobleaching constant rate.............73
Table M4.1. Water retention value (WRV) obtained for the fibers used (± confidence
interval at 95%)....................................................................................................................104
Table M4.2. Permeability of papersheets obtained for the cellulose types used (±
confidence interval at 95%). ................................................................................................104
Table M4.3. Physical properties of the Portucel fibers without treatment (Blank) and CBD
or conjugate treated (± confidence interval at 95%)............................................................105
Table M4.4. ZETA-potential measurements (mV), by streaming potential, of Portucel and
Eucalyptus (two different refinement conditions) fibers, without treatment (Blank) and
CBD or conjugate treated, and of Sigmacell fibers made by electrophoretic mobility
(± confidence interval at 95%). ...........................................................................................105
Table M4.5. Surface tension components (γLW, γ+ and γ-, mJ/m2) and degree of
hydrophobicity (ΔGcwc, mJ/m2) for cellulose fibers without treatment (Blank) and
CBD or conjugate treated, obtained by contact angle. Examples of contact images of
water drops are also shown. The protein concentration used are as refered in Table
M4.4.....................................................................................................................................106

Ricardo Pinto Production of CBDs and adsorption to cellulose fibres
1
INTRODUCTION
1. Cellulose
Cellulose is the most abundant polymer in nature: it is the main constituent of plants,
where it plays a structural role, but is also present in bacteria, algae and even in animals (Kimura
and Itoh, 2004; Tamai et al., 2004). Cellulose is a material with properties convenient for quite
different applications and industries (Belgacem et al., 1995): excellent mechanical properties,
availability in huge amounts, both from vegetable and microbial sources, varied morphology,
geometry and surface properties, recycling possibility, low cost.
The fibres are constituted by linear chains of anhydrous glucose, linked by covalent β-1,4
bonds (Srisodsuk, 1994). The glucose residues are twisted by 180º in the polymeric chain (Figure
1), taking different conformations. The repetitive unit is the dimer cellobiose, and not glucose as
in starch.
Figure 1. Detail of a cellulose chain, highlighting the repetitive unit cellobiose (n).
The cellulose chains are formed at the plasmatic membrane, through the addition of
UDP-Glucose units by enzymatic structures called Terminal Complexes, TC (Kimura et al.,
1999). These complexes are constituted by linear aggregates, in the case of bacteria and algae, or
rosettes, in the case of vascular plants (Brown et al., 1996; Kimura et al., 1999). The rosettes
(complexes CelS) are formed by aggregates of the polypeptide CesA (Figure 2), each producing a
polymer with about 2000 to 25000 glucose units (Doblin et al., 2002). Upon its formation, the
chains gather to form a cellulose microfibril, stabilized by intermolecular hydrogen bonds.

Ricardo Pinto Production of CBDs and adsorption to cellulose fibres
2
Cellulose chains type I are then formed, with parallel glucose chains. This kind of structure is
meta-stable, that is, it is not the most favourable thermodynamically. Cellulose type II – the more
stable one – displays cellulose chains with anti-parallel orientation. Type I is much more
frequent than type II, and is sub-divided in two kinds of crystalline structures, Iα e Iβ,
distinguished by the pattern of intermolecular hydrogen bonds (O'Sullivan, 1997). These two
kinds of cellulose are found, in nature, in different ratios, with Iα predominant in the more
primate plants and Iβ more commo in superior plants. The rare animal cellulose belongs also to
the second kind. There are another 3 kinds of cellulose structure (III, IV e V) but these are
produced only by chemical processes, and are not found in nature.
Figure 2. Structure of the rosette terminal complexes, and microfibre formation (adapted from Doblin
et al., 2002).
The cellulose microfibres interact and associate, giving rise either to highly crystalline
regions as well as to more amorphous ones. Associated to lignin and hemicellulose (Figure 3),
complex super-structures such as fibres, cell walls and pellicles are formed (Bayer et al., 1998).
2. Cellulolytic enzymes
Due to the cellulose structural complexity, microorganisms developed different strategies
for its breakdown and utilization as a carbon source. Various enzymes are produced exhibiting
different kinds of activity, all necessary due the heterogeneous physical properties of cellulose,
Ricardo Pinto Production of CBDs and adsorption to cellulose fibres
3
as well as to its mixture with other polymers in the cell wall. These enzymes are, namely,
cellobiohydrolases (CBH), endoglucanases (EG), xylanases, cellodextrinases, β-glucosidases,
(Warren, 1996).
Figure 3. Cell wall structure, where microfibrils and hemicellulose chains may be observed mixed
with lignin (adapted from Bidlack et al., 1992).
Cellulases are classified in 14 families (see Table 1), among more than 100 families of
glycosyl-hydrolases (Henrissat and Davies, 1997; http://www.cazy.org/CAZY/). This
classification is proposed according to the homology of aminoacids found in the catalytic
domains, following the principle that the sequence homology reflects the conservation of the
structure and of the catalytic mechanism. Some of these families are gathered in clusters, based
upon the conservation of the three-dimensional structure and upon the conservation of the
relative spatial position of the catalytic residues.
Ricardo Pinto Production of CBDs and adsorption to cellulose fibres
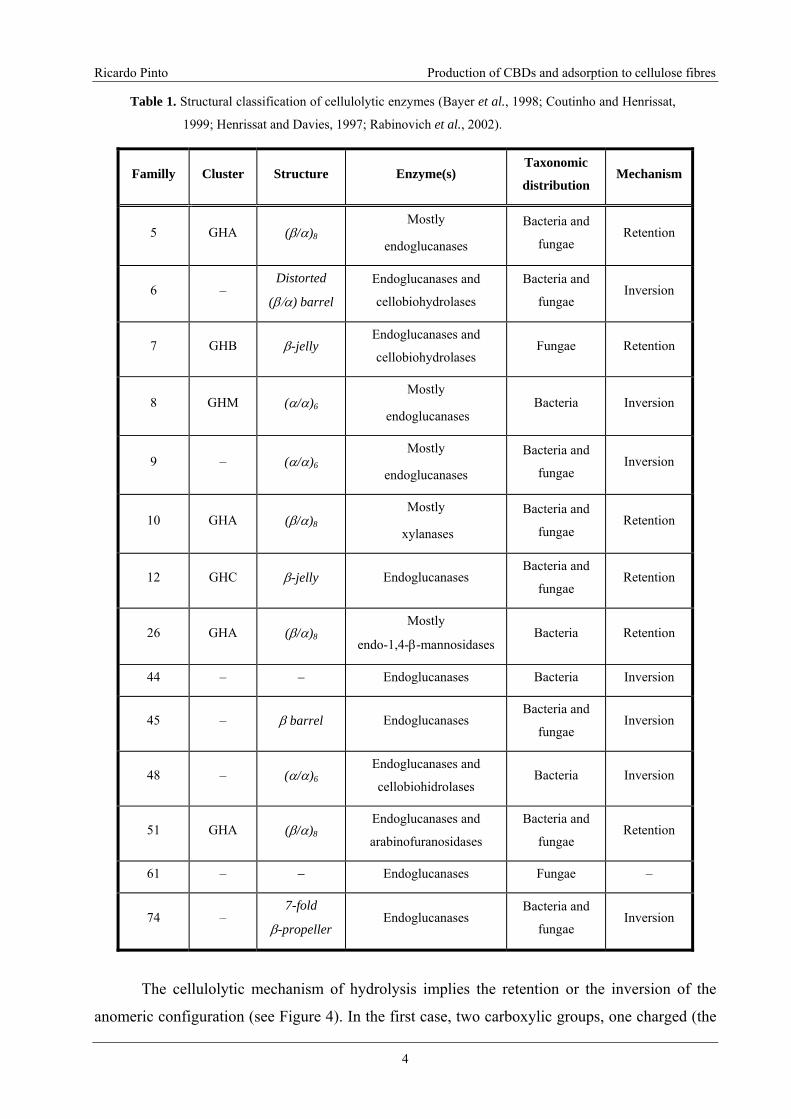
4
Table 1. Structural classification of cellulolytic enzymes (Bayer et al., 1998; Coutinho and Henrissat,
1999; Henrissat and Davies, 1997; Rabinovich et al., 2002).
Familly Cluster Structure Enzyme(s) Taxonomic
distribution Mechanism
5 GHA (β/α)8 Mostly
endoglucanases
Bacteria and
fungae Retention
6 – Distorted
(β/α) barrel
Endoglucanases and
cellobiohydrolases
Bacteria and
fungae Inversion
7 GHB β-jelly Endoglucanases and
cellobiohydrolases Fungae Retention
8 GHM (α/α)6 Mostly
endoglucanases Bacteria Inversion
9 – (α/α)6 Mostly
endoglucanases
Bacteria and
fungae Inversion
10 GHA (β/α)8 Mostly
xylanases
Bacteria and
fungae Retention
12 GHC β-jelly Endoglucanases Bacteria and
fungae Retention
26 GHA (β/α)8 Mostly
endo-1,4-β-mannosidases Bacteria Retention
44 – – Endoglucanases Bacteria Inversion
45 – β barrel Endoglucanases Bacteria and
fungae Inversion
48 – (α/α)6 Endoglucanases and
cellobiohidrolases Bacteria Inversion
51 GHA (β/α)8 Endoglucanases and
arabinofuranosidases
Bacteria and
fungae Retention
61 – – Endoglucanases Fungae –
74 – 7-fold
β-propeller Endoglucanases
Bacteria and
fungae Inversion
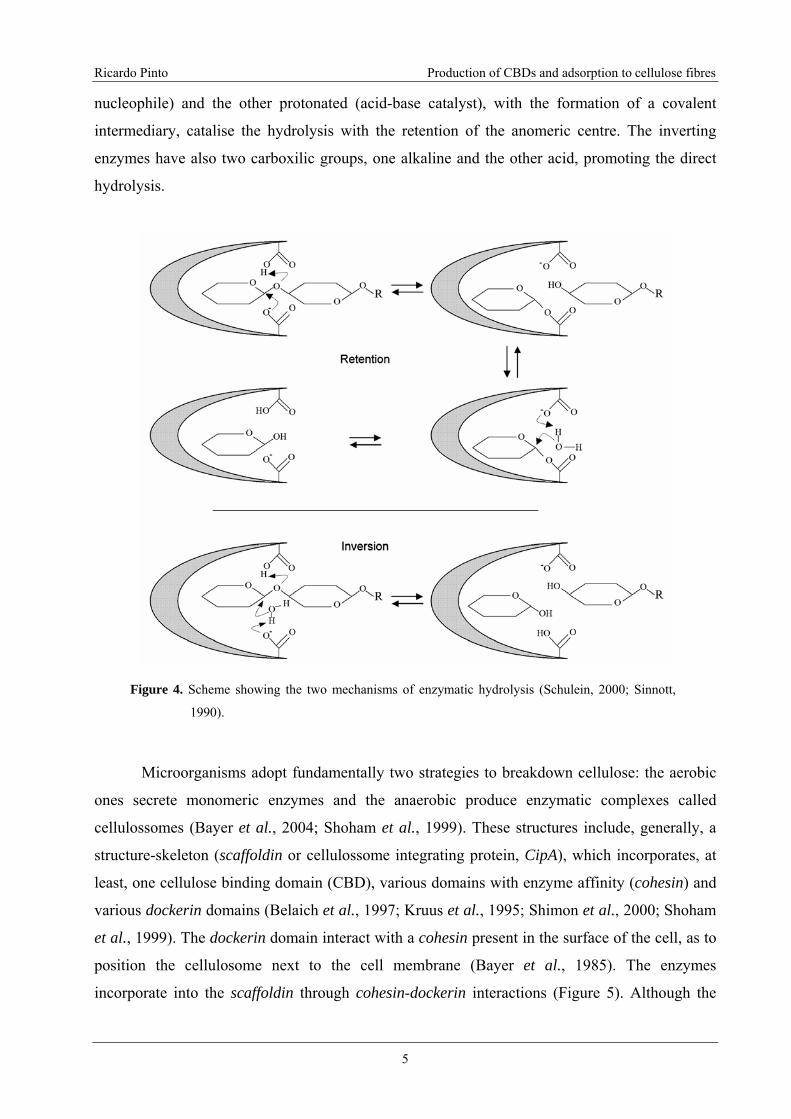
The cellulolytic mechanism of hydrolysis implies the retention or the inversion of the
anomeric configuration (see Figure 4). In the first case, two carboxylic groups, one charged (the
Ricardo Pinto Production of CBDs and adsorption to cellulose fibres
5
nucleophile) and the other protonated (acid-base catalyst), with the formation of a covalent
intermediary, catalise the hydrolysis with the retention of the anomeric centre. The inverting
enzymes have also two carboxilic groups, one alkaline and the other acid, promoting the direct
hydrolysis.
Figure 4. Scheme showing the two mechanisms of enzymatic hydrolysis (Schulein, 2000; Sinnott,
1990).
Microorganisms adopt fundamentally two strategies to breakdown cellulose: the aerobic
ones secrete monomeric enzymes and the anaerobic produce enzymatic complexes called
cellulossomes (Bayer et al., 2004; Shoham et al., 1999). These structures include, generally, a
structure-skeleton (scaffoldin or cellulossome integrating protein, CipA), which incorporates, at
least, one cellulose binding domain (CBD), various domains with enzyme affinity (cohesin) and
various dockerin domains (Belaich et al., 1997; Kruus et al., 1995; Shimon et al., 2000; Shoham
et al., 1999). The dockerin domain interact with a cohesin present in the surface of the cell, as to
position the cellulosome next to the cell membrane (Bayer et al., 1985). The enzymes
incorporate into the scaffoldin through cohesin-dockerin interactions (Figure 5). Although the

Ricardo Pinto Production of CBDs and adsorption to cellulose fibres
6
cellulosomes are, generically, intimately connected with the cell-walls, cases are where the
microorganism segregate the complexes into the culture medium (Ponpium et al., 2000).
The fact that cellulosomes are typically expressed by anaerobic microorganisms may be
metabolically advantageous. Being positioned close to the cell surface, there is a higher
absorption efficacy of the degradation products (Shoham et al., 1999). Another advantage may
be that, this way, cells adsorb all of the degradation products, that otherwise would also be used
by other cells. On the other hand, the close proximity of enzymes and cells allow for a better
control of the enzymatic activity (by inhibition), such that the substrate flow would be
proportional to the cell metabolic needs, and therefore allowing a better degradation efficacy
(Boisset et al., 1999).
Figure 5. Simplified scheme of the Clostridium thermocellum cellulosome, interacting with the cell
surface. CBM – Cellulose Binding Module (adapted from Shoham et al., 1999).
Cellulases are sub-divided in two groups, endo- and exo-, according to the type of
reaction (Teeri, 1997). Endoglucanases (EG) are enzymes that hydrolyse the glycosidic bond
indiscriminately along the cellulose chain. In turn, exoglucanases act from the chain end (Figure
6). In the specific case of crystalline cellulose, to make possible an effective cellulose
degradation, it is mandatory the presence of a mixture of both kinds of enzyme. The cellulose
fibres are long chains and endoglucanases, by creating new chain ends, promote the action of
Ricardo Pinto Production of CBDs and adsorption to cellulose fibres
7
exoglucanases. Various authors (Irwin et al., 1993; Walker et al., 1992) showed that enzyme
mixtures exhibit an hydrolysis potential higher than the sum of the individual enzyme activities,
meaning that they act synergistically. In the case of amorphous cellulose, the presence of
endoglucanases is not essential for the complete hydrolysis to be carried out.
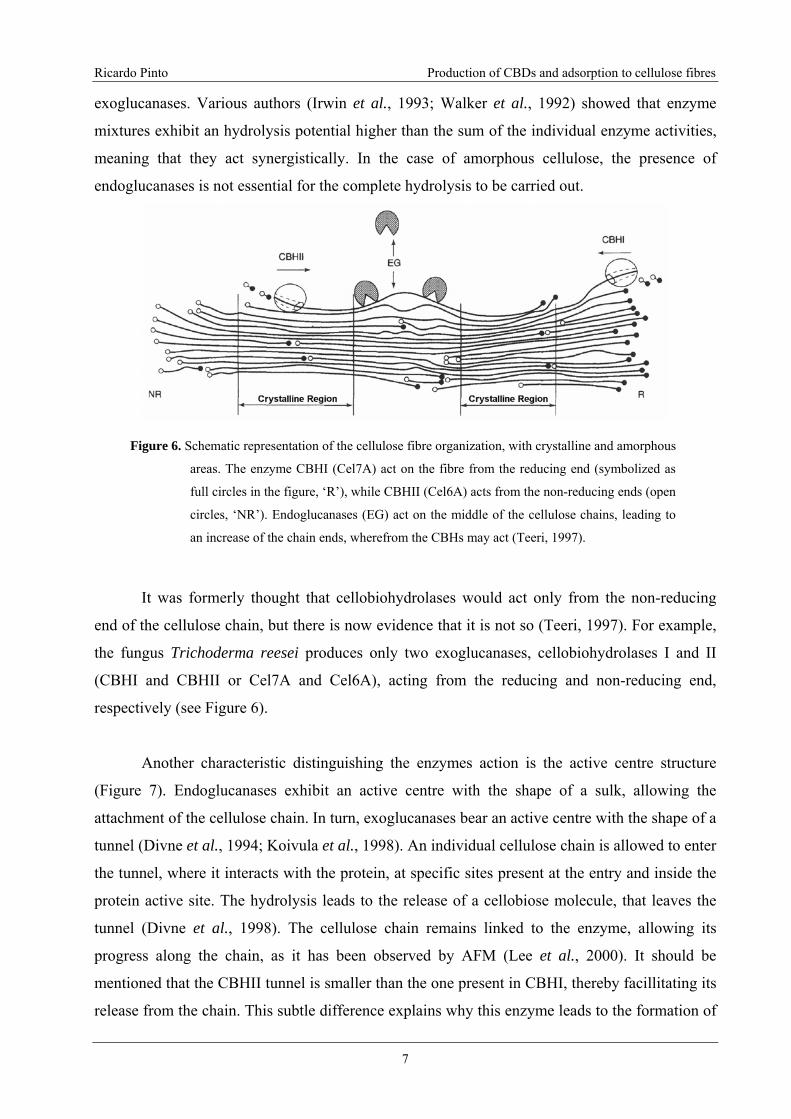
Figure 6. Schematic representation of the cellulose fibre organization, with crystalline and amorphous
areas. The enzyme CBHI (Cel7A) act on the fibre from the reducing end (symbolized as
full circles in the figure, ‘R’), while CBHII (Cel6A) acts from the non-reducing ends (open
circles, ‘NR’). Endoglucanases (EG) act on the middle of the cellulose chains, leading to
an increase of the chain ends, wherefrom the CBHs may act (Teeri, 1997).
It was formerly thought that cellobiohydrolases would act only from the non-reducing
end of the cellulose chain, but there is now evidence that it is not so (Teeri, 1997). For example,
the fungus Trichoderma reesei produces only two exoglucanases, cellobiohydrolases I and II
(CBHI and CBHII or Cel7A and Cel6A), acting from the reducing and non-reducing end,
respectively (see Figure 6).
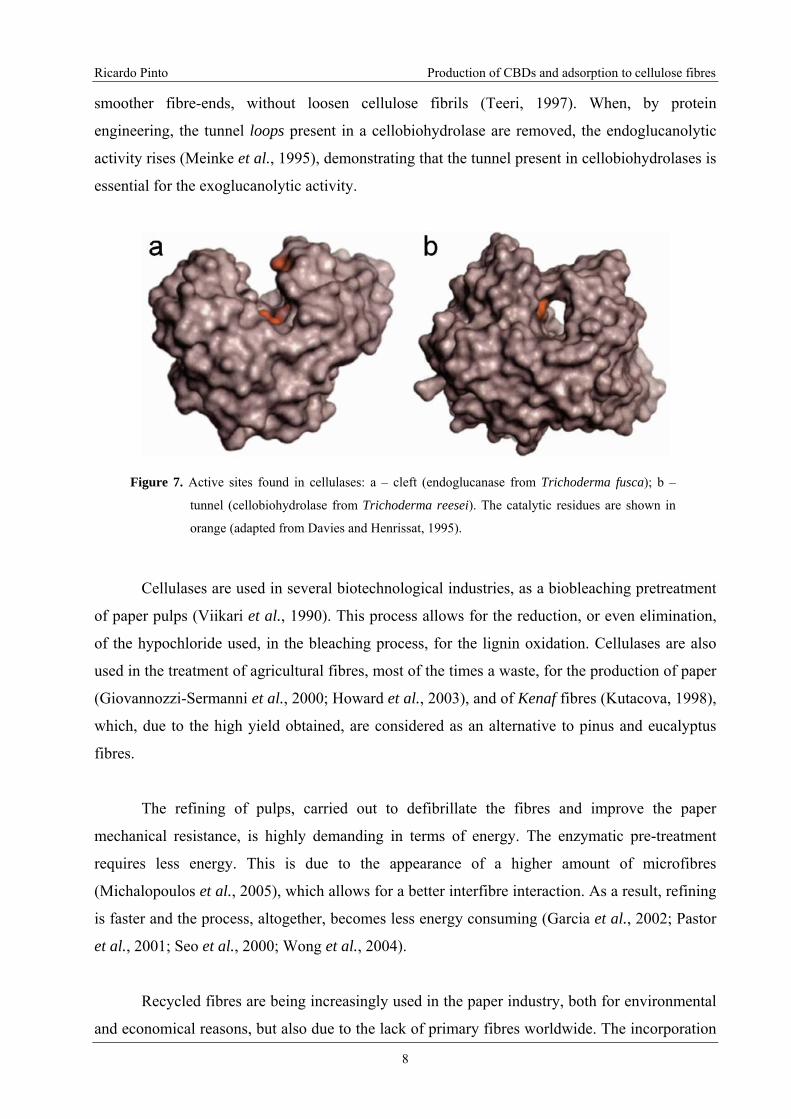
Another characteristic distinguishing the enzymes action is the active centre structure
(Figure 7). Endoglucanases exhibit an active centre with the shape of a sulk, allowing the
attachment of the cellulose chain. In turn, exoglucanases bear an active centre with the shape of a
tunnel (Divne et al., 1994; Koivula et al., 1998). An individual cellulose chain is allowed to enter
the tunnel, where it interacts with the protein, at specific sites present at the entry and inside the
protein active site. The hydrolysis leads to the release of a cellobiose molecule, that leaves the
tunnel (Divne et al., 1998). The cellulose chain remains linked to the enzyme, allowing its
progress along the chain, as it has been observed by AFM (Lee et al., 2000). It should be
mentioned that the CBHII tunnel is smaller than the one present in CBHI, thereby facillitating its
release from the chain. This subtle difference explains why this enzyme leads to the formation of
Ricardo Pinto Production of CBDs and adsorption to cellulose fibres
8
smoother fibre-ends, without loosen cellulose fibrils (Teeri, 1997). When, by protein
engineering, the tunnel loops present in a cellobiohydrolase are removed, the endoglucanolytic
activity rises (Meinke et al., 1995), demonstrating that the tunnel present in cellobiohydrolases is
essential for the exoglucanolytic activity.
Figure 7. Active sites found in cellulases: a – cleft (endoglucanase from Trichoderma fusca); b –
tunnel (cellobiohydrolase from Trichoderma reesei). The catalytic residues are shown in
orange (adapted from Davies and Henrissat, 1995).
Cellulases are used in several biotechnological industries, as a biobleaching pretreatment
of paper pulps (Viikari et al., 1990). This process allows for the reduction, or even elimination,
of the hypochloride used, in the bleaching process, for the lignin oxidation. Cellulases are also
used in the treatment of agricultural fibres, most of the times a waste, for the production of paper
(Giovannozzi-Sermanni et al., 2000; Howard et al., 2003), and of Kenaf fibres (Kutacova, 1998),
which, due to the high yield obtained, are considered as an alternative to pinus and eucalyptus
fibres.
The refining of pulps, carried out to defibrillate the fibres and improve the paper
mechanical resistance, is highly demanding in terms of energy. The enzymatic pre-treatment
requires less energy. This is due to the appearance of a higher amount of microfibres
(Michalopoulos et al., 2005), which allows for a better interfibre interaction. As a result, refining
is faster and the process, altogether, becomes less energy consuming (Garcia et al., 2002; Pastor
et al., 2001; Seo et al., 2000; Wong et al., 2004).
Recycled fibres are being increasingly used in the paper industry, both for environmental
and economical reasons, but also due to the lack of primary fibres worldwide. The incorporation
Ricardo Pinto Production of CBDs and adsorption to cellulose fibres
9
of recycled fibres in papermaking leads to worse mechanical properties, which may be partially
overcome by refining the fibres. In turn, a more intensive refining results in worse drainability
during the paper sheet formation, and hence to a lower productivity. Several authors have shown
that cellulases – selected ones, operating under controlled conditions - do effectively improve the
fibres drainability, without affecting significantly the paper strength (Dienes et al., 2004; Jackson
et al., 1993). This effect has been explained as a result of the degradation of amorphous fibres,
present in the surface of the fibres (Stork et al., 1995), and of the fines formed during refining
(Oksanen et al., 2000).
Another drawback associated to secondary fibres is the presence of contaminants such as
pigments, inks and glues. Enzymes may be useful also in solving this problem (Geng and Li,
2003; Viesturs et al., 1999). Enzymes not only remove pigments but they also improve bleaching
(Sykes et al., 1996), reduce the level of refining needed (Pelach et al., 2003) and improve the
pulps drainibility (Jeffries et al., 1996). The use of cellulases for glues removal has proved to be
effective and superior to the conventional use of alkaline chemicals (Sykes and Klungness,
1997).
Cellulases are used both in the treatment of paper and of cotton fibres. Cellulases
revolutionized the stone washing process, by substituting the stones used in the washing process
that was used to produce the fashionable used-like aspect of the garments. (Miettinen-Oinonen,
2004). They are also used for the removal of small fibres – pills – present in the surface of cotton
fabrics, such that they prevent pilling formation (Heikinheimo, 2002). Another industrial
application relates to food oil extraction. By acting upon the seed cell walls, cellulases elicit
higher oil extraction yields (Concha et al., 2004; Soto et al., 2004).
3. Cellulose Binding Domains
The enzymes (not only cellulases, but most enzymes that act on polysaccharides) that are
segregated to the culture medium (as opposed to cellulases in cellulosomes) have a simplified
modular structure (Srisodsuk, 1994): a catalytic domain – CD – linked to a carbohydrate binding
module (with affinity for cellulose, starch, chitin,…) – CBM – through a peptide chain highly
glycosylated – linker. Some enzymes have more than one binding module, for instance the
endoglucanase E4 from Thermomonospora fusca (Irwin et al., 1998), which have an internal
CBD and an external one linked through a fibronectin like domain, and the enzyme Xyn10A

Ricardo Pinto Production of CBDs and adsorption to cellulose fibres
10
from Rhodothermus marinus, with two N-terminal CBMs (Abou Hachem et al., 2000), or
endoglucanase C from Cellulomonas fimi, which have also two N-terminal CBMs (Kormos et
al., 2000).
CBMs may be either C- or N-terminal. As mentioned previously, the catalytic and the
binding modules are linked through a highly glycosylated peptide sequence (rich in serine,
threonine, proline and glycine),. In fungi, the linker is 31 to 44 aminoacids long. When this chain
is truncated, or eliminated, the fibre affinity/activity of the enzymes is modified. When the linker
was partially eliminated in the enzyme cellobiohydrolase I (Srisodsuk et al., 1993), from
Trichoderma reesei, the enzymatic activity was not significantly reduced, although the cellulose
affinity was slightly reduced. The complete elimination of the linker, in turn, resulted in the
significant reduction of the activity on crystalline substrate (Black et al., 1997; Shen et al., 1991;
Srisodsuk et al., 1993). This effect is explained as arising from the lack of mobility of the
catalytic domain, which consequently cannot position conveniently on the substrate.
The carbohydrate binding modules are organized in 45 families (CAZY server,
http://afmb.cnrs-mrs.fr/CAZY/), according to the sequence homology of the aminoacids in the
three-dimensional structure. This classification was formerly used only for the cellulose binding
domains, but has been extended to other carbohydrates binding proteins. The following list
describes shortly the thirteen families which have a least one cellulose binding domain, CBD
(Tomme et al., 1998):
Family 1 – With between 33 and 36 aminoacids (aa); its a family with more than 200
members, all – exception made to a CBD from the algae Colletotrichum
gloeosporioides f. sp. Malvae – belonging to fungae. The structure of the CBDs
from the enzymes Cel6A e Cel7A (Trichoderma reesei), and of Cel7D
(Phanerochaete chrysosporium) have been solved.
Family 2 – With more than 100 aa; more than 190 members belong to this family, some
with affinity for chitin and xylan; the structure of two CBD, from Cellulomonas
fimi xylanases and of one chitosanase from Pyrococcus furiosus have been
solved.
Family 3 – With between 130 and 170 aa; currently have 97 members, one with chitin
binding ability; the structure of four of these CBDs is known.

Ricardo Pinto Production of CBDs and adsorption to cellulose fibres
11
Family 4 – With between 125 and 170 aa; currently have 29 members, none binding
crystalline cellulose. These CBDs preferably bind to amorphous cellulose, xylan,
glucan; the structure of three of these CBDs is known.
Family 5 – With about 60 aa; more than 200 members have been recognized; the structure
of one endoglucanase and of two chitinases have been solved.
Family 6 – With about 120 aa; more than 100 members have been recognized, with low
affinity for crystalline cellulose; the structure of five of these CBDs is known.
Family 7 – No entries.
Family 8 – With about 152 aa; currently only four members are registered in this family,
none with known structure.
Family 9 – With about 170 aa; 40 members have been recognized, mostly xylanases;
cellulose binding ability was demonstrated in one case.
Family 10 – With about 50 aa; 25 members have been recognized, one binding to cellulose.
The structure of CBMs from a xylanase (Cellvibrio japonicus) has been
determined.
Family 11 – With between 180 and 200 aa; five members belong to this family, one a
cellulose binding domain.
Family 12 – With between 40 and 50 aa; has 66 members, most are chitinases; the structure
of a CBD from Bacillus circulans has been solved.
Family 13 – With about 150 aa; this family possesses 341 members, CBMs present in
triplets, exception made to xylanase II from Actinomadura sp. FC7; The
structure of 15 CBMs has been solved.
The presence of CBDs is essential for the enzyme activity on insoluble substrates. Indeed,
when the catalytic domains alone are used – as demonstrated for instance with Ces and Cena,
from Cellulomonas fimi, or Cel7A and Cel7B, from Trichoderma reesei – the adsorption to
crystalline cellulose is drastically reduced, which parallels with the lower hydrolytic activity
(Gilkes et al., 1988; Gilkes et al., 1992; Srisodsuk et al., 1997; Tomme et al., 1995). However,
the activity on soluble substrates does not vary significantly in those cases (Black et al., 1997;
Hamada et al., 2001). The reverse was also demonstrated: when a CBD is fused to an enzyme
that does not have one naturally, its activity upon insoluble substrates is improved (Limon et al.,
Ricardo Pinto Production of CBDs and adsorption to cellulose fibres
12
2001). It becomes clear that CBDs act by increasing the enzyme concentration on the surface of
the insoluble substrate, thereby improving the catalytic efficiency. Another kind of activity, the
disruption of fibres, has been reported by several authors, although the details of this activity
remain unclear. It was demonstrated that the CBD from CenA, an enzyme from the bacteria
Cellulomonas fimi, disrupts the fibres in a non-catalytic process (Din et al., 1991).
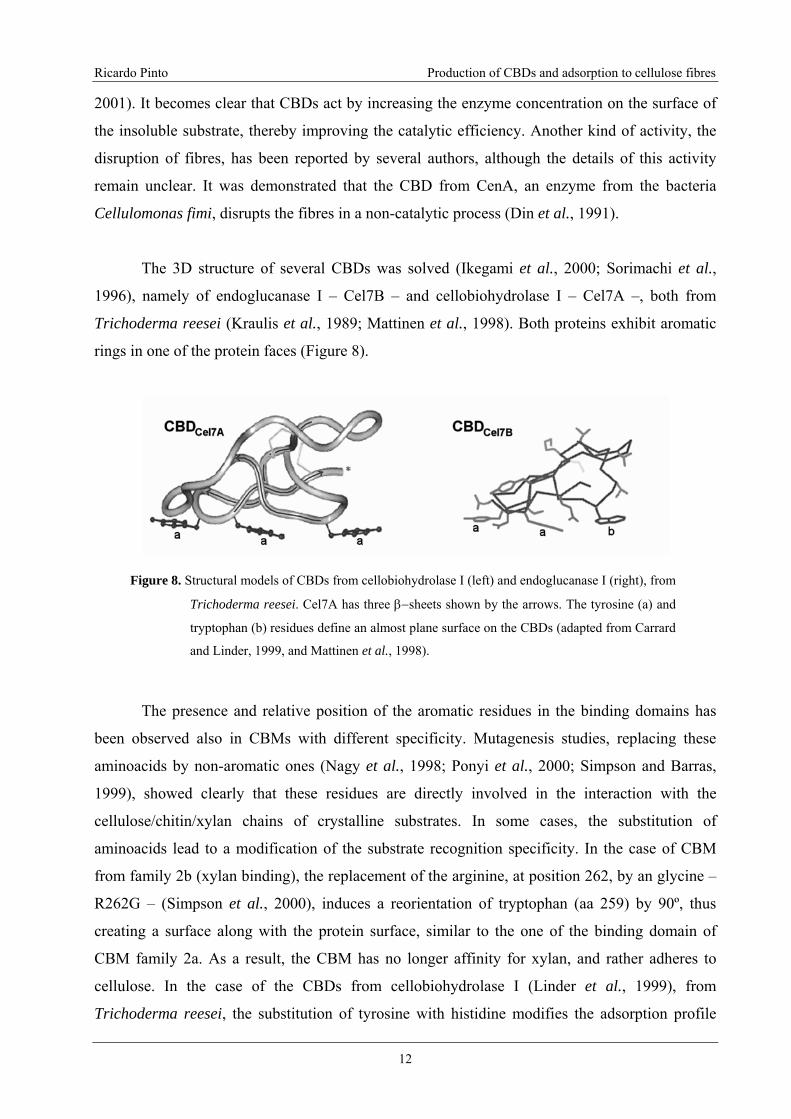
The 3D structure of several CBDs was solved (Ikegami et al., 2000; Sorimachi et al.,
1996), namely of endoglucanase I – Cel7B – and cellobiohydrolase I – Cel7A –, both from
Trichoderma reesei (Kraulis et al., 1989; Mattinen et al., 1998). Both proteins exhibit aromatic
rings in one of the protein faces (Figure 8).
Figure 8. Structural models of CBDs from cellobiohydrolase I (left) and endoglucanase I (right), from
Trichoderma reesei. Cel7A has three β−sheets shown by the arrows. The tyrosine (a) and
tryptophan (b) residues define an almost plane surface on the CBDs (adapted from Carrard
and Linder, 1999, and Mattinen et al., 1998).
The presence and relative position of the aromatic residues in the binding domains has
been observed also in CBMs with different specificity. Mutagenesis studies, replacing these
aminoacids by non-aromatic ones (Nagy et al., 1998; Ponyi et al., 2000; Simpson and Barras,
1999), showed clearly that these residues are directly involved in the interaction with the
cellulose/chitin/xylan chains of crystalline substrates. In some cases, the substitution of
aminoacids lead to a modification of the substrate recognition specificity. In the case of CBM
from family 2b (xylan binding), the replacement of the arginine, at position 262, by an glycine –
R262G – (Simpson et al., 2000), induces a reorientation of tryptophan (aa 259) by 90º, thus
creating a surface along with the protein surface, similar to the one of the binding domain of
CBM family 2a. As a result, the CBM has no longer affinity for xylan, and rather adheres to
cellulose. In the case of the CBDs from cellobiohydrolase I (Linder et al., 1999), from
Trichoderma reesei, the substitution of tyrosine with histidine modifies the adsorption profile
Ricardo Pinto Production of CBDs and adsorption to cellulose fibres
13
with pH. This observation leads to the design of binding domains where the adsorption may be
switched by pH control.
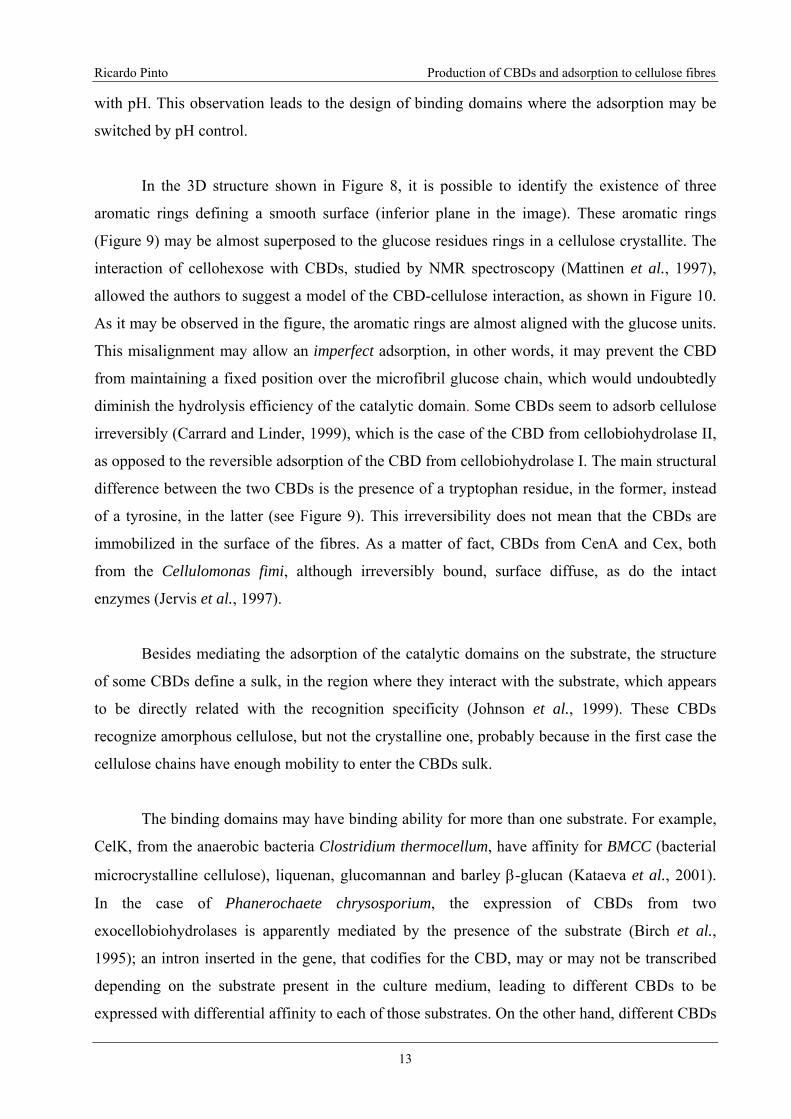
In the 3D structure shown in Figure 8, it is possible to identify the existence of three
aromatic rings defining a smooth surface (inferior plane in the image). These aromatic rings
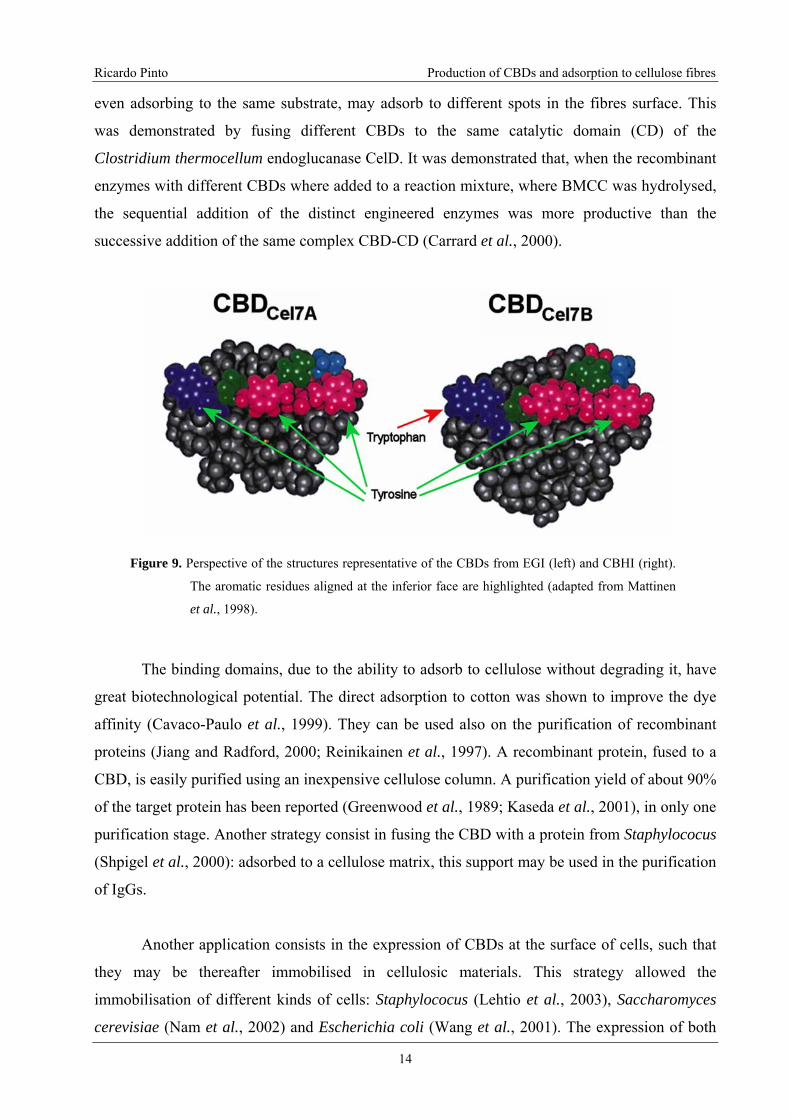
(Figure 9) may be almost superposed to the glucose residues rings in a cellulose crystallite. The
interaction of cellohexose with CBDs, studied by NMR spectroscopy (Mattinen et al., 1997),
allowed the authors to suggest a model of the CBD-cellulose interaction, as shown in Figure 10.
As it may be observed in the figure, the aromatic rings are almost aligned with the glucose units.
This misalignment may allow an imperfect adsorption, in other words, it may prevent the CBD
from maintaining a fixed position over the microfibril glucose chain, which would undoubtedly
diminish the hydrolysis efficiency of the catalytic domain. Some CBDs seem to adsorb cellulose
irreversibly (Carrard and Linder, 1999), which is the case of the CBD from cellobiohydrolase II,
as opposed to the reversible adsorption of the CBD from cellobiohydrolase I. The main structural
difference between the two CBDs is the presence of a tryptophan residue, in the former, instead
of a tyrosine, in the latter (see Figure 9). This irreversibility does not mean that the CBDs are
immobilized in the surface of the fibres. As a matter of fact, CBDs from CenA and Cex, both
from the Cellulomonas fimi, although irreversibly bound, surface diffuse, as do the intact
enzymes (Jervis et al., 1997).
Besides mediating the adsorption of the catalytic domains on the substrate, the structure
of some CBDs define a sulk, in the region where they interact with the substrate, which appears
to be directly related with the recognition specificity (Johnson et al., 1999). These CBDs
recognize amorphous cellulose, but not the crystalline one, probably because in the first case the
cellulose chains have enough mobility to enter the CBDs sulk.
The binding domains may have binding ability for more than one substrate. For example,
CelK, from the anaerobic bacteria Clostridium thermocellum, have affinity for BMCC (bacterial
microcrystalline cellulose), liquenan, glucomannan and barley β-glucan (Kataeva et al., 2001).
In the case of Phanerochaete chrysosporium, the expression of CBDs from two
exocellobiohydrolases is apparently mediated by the presence of the substrate (Birch et al.,
1995); an intron inserted in the gene, that codifies for the CBD, may or may not be transcribed
depending on the substrate present in the culture medium, leading to different CBDs to be
expressed with differential affinity to each of those substrates. On the other hand, different CBDs
Ricardo Pinto Production of CBDs and adsorption to cellulose fibres
14
even adsorbing to the same substrate, may adsorb to different spots in the fibres surface. This
was demonstrated by fusing different CBDs to the same catalytic domain (CD) of the
Clostridium thermocellum endoglucanase CelD. It was demonstrated that, when the recombinant
enzymes with different CBDs where added to a reaction mixture, where BMCC was hydrolysed,
the sequential addition of the distinct engineered enzymes was more productive than the
successive addition of the same complex CBD-CD (Carrard et al., 2000).
Figure 9. Perspective of the structures representative of the CBDs from EGI (left) and CBHI (right).
The aromatic residues aligned at the inferior face are highlighted (adapted from Mattinen
et al., 1998).
The binding domains, due to the ability to adsorb to cellulose without degrading it, have
great biotechnological potential. The direct adsorption to cotton was shown to improve the dye
affinity (Cavaco-Paulo et al., 1999). They can be used also on the purification of recombinant
proteins (Jiang and Radford, 2000; Reinikainen et al., 1997). A recombinant protein, fused to a
CBD, is easily purified using an inexpensive cellulose column. A purification yield of about 90%
of the target protein has been reported (Greenwood et al., 1989; Kaseda et al., 2001), in only one
purification stage. Another strategy consist in fusing the CBD with a protein from Staphylococus
(Shpigel et al., 2000): adsorbed to a cellulose matrix, this support may be used in the purification
of IgGs.
Another application consists in the expression of CBDs at the surface of cells, such that
they may be thereafter immobilised in cellulosic materials. This strategy allowed the
immobilisation of different kinds of cells: Staphylococus (Lehtio et al., 2003), Saccharomyces
cerevisiae (Nam et al., 2002) and Escherichia coli (Wang et al., 2001). The expression of both
Ricardo Pinto Production of CBDs and adsorption to cellulose fibres
15
CBDs and an organophosphorous hydrolase, in the surface of Escherichia coli (Wang et al.,
2002), allowed the cells immobilisation on a cellulose material. The cells performed the fast and
steady degradation of paraoxon, at near 100%, for 45 days. In this way, the immobilisation of
cells in inexpensive materials is easily carried out.
Figure 10. Model of the interaction between the CBDs from cellobiohydrolase I (Cel7A) and
endoglucanase I (Cel7B) and the glucose residues present in cellulosic fibres (adapted
from Mattinen et al., 1997).
The simple presence of CBDs, in solution during pollen germination, lead to elongation
of the pollen tubes and also to the length increase of Arabidopsis roots (Shpigel et al., 1998).
Another surprising finding was that the CBDs induced an increase, of up to 5 times, of the
cellulose production in Acetobacter xylinum. This effect was explained as arising from the
interference of the CBDs in the crystallization step, during the microfibril assembly.
Ricardo Pinto Production of CBDs and adsorption to cellulose fibres
16
RESULTS OVERVIEW AND CONCLUSIONS
Production of CBD by proteolysis
One of the goals of this thesis was to develop a method to produce a high amount of
cellulose-binding domains (CBD), making possible experiments requiring such large quantities.
The protein source chosen was the commercial preparation Celluclast®, due to its availability in
large volume. This preparation was obtained from the fermentation of the fungus Trichoderma
reesei, which produces mainly two exocellulases (cellobiohydrolases I and II) and three
endocellulases (endoglucanases I, II and V). Following this previous work, the preparation was
firstly filtered using an ultrafiltration membrane (30 kDa cutoff), which retains the exocellulases
present in the preparation (~50 kDa), in order to clean it from low molecular weight material
(preservatives and other proteins). Afterwards, the protease Papain was added, in order to cleave
the linker between the catalytic and the binding domains. To achieve an optimum reaction, a
ratio of 1 gram of Papain to 1200 grams of the ultrafiltered cellulase was used. A higher ratio
leads to extensive hydrolysis, as accessed by capillary electrophoresis analysis.
The CBD were then isolated by ultrafiltration, with a 10 kDa cutoff membrane. To
further purify the CBD, the concentrated protein obtained (by precipitation with ammonium
sulphate) was purified in an ion exchange column (IEC). The obtained CBDs (unbound peak)
present around 30% (w/w) of carbohydrates, mainly mannose (85%). The correct size was
assessed by MALDI-TOF (~8.4 kDa). Glycosylation of the protein is responsible for the
appearance of several peaks in the MALDI spectrum, due to heterogeneity of the carbohydrates
(the difference between the peaks is 162 Da, corresponding to one sugar residue). The purified
CBDs belong to cellobiohydrolase I, as confirmed by N-terminal protein sequencing. Indeed, the
sequence (-GNPPG-) is only present between the catalytic domain and the linker sequence of
cellobiohydrolase I. The analysis also showed that the obtained CBD is highly pure.
The purified protein has, as expected, high affinity for cellulose, as demonstrated by the
adsorption isotherm. The Langmuir adsorption constants CBDMax (maximum molar amount
adsorbed per mass unit) and ka (adsorption equilibrium constant) are 2.42 μmol/g and 0.209 μM-
1, respectively.
Ricardo Pinto Production of CBDs and adsorption to cellulose fibres
17
Studies using conjugates CBD-FITC
To analyse the adsorption of CBDs on the cellulose surface, conjugates of CBD with a
fluorescence probe, fluorescein isothiocyanate (FITC), were produced. The observation by light
microscopy of the adsorbed CBD-FITC reveals that the adsorption on the fibre surface is not
uniform. The fibre ends and surface spots display a much higher fluorescent emission. These
regions are less ordered (amorphous regions), and probably more accessible, enabling a higher
CBD adsorption. When the CBDs are adsorbed on amorphous fibres (phosphoric acid swollen
cellulose), the adsorption is apparently homogenous. These results demonstrate the interest of
using CBD-FITC to visualize/identify the amorphous/crystalline (bright/darker) regions on the
fibres, as to evaluate its physical conditions (low/high damage).
Another aspect evaluated, with the use of CBD-FITC, was the reversibility of the CBD
adsorption to the cellulose fibres. For that purpose, fibres with and without adsorbed CBD-FITC
were mixed. The reversibility of the CBD adsorption would expectedly lead to the fibres
becoming uniformly fluorescent, due to desorption/re-adsorption of CBD. Indeed, this was
observed, but very slowly. After 192 hours, it was still possible to observe less bright fibres in
the mixture. This shows that the adsorption of CBDs onto Whatman CF11 fibres is reversible,
but also that desorption is a rather slow process.
When increasing concentrations of CBD-FITC are used, it is possible to observe an
increase in the fluorescent emission intensity of the fibres. This indicates that it may be possible
to measure the quantity of adsorbed protein on the fibres’ surface. Having this in mind, a Matlab
script was developed, in order to produce a calibration routine, allowing the conversion of the
fluorescence emission of the adsorbed FITC-CBD into an estimation of the CBD fibre surface
coating.
To carry out the calibration, the fluorescent emission of CBD-FITC was measured, using
solutions with different concentrations in an Improved Neubauer chamber. This expeditious
approach showed to have a high accuracy. Since the emission of FITC is in the green spectrum
(three colour channels), a merging function was developed in order to maximize the sensitivity to
small fluorescence variations. This equation is valid for non-saturating levels (close to 255) on
any of the three colour channels. Also, due to virtual memory restrictions, the images were
downsized to 260x206 pixels. Another aspect that was taken into consideration was the
photobleaching of the FITC fluorophore. A mono-exponential equation, that describes the
photobleaching, was integrated in function of time, in order to correlate the total fluorescence
emission during each exposure time period. From the non-linear regression of these values, the
initial fluorescence intensity values for each CBD-FITC concentration are then multiplied by the
Ricardo Pinto Production of CBDs and adsorption to cellulose fibres
18
exposure time of the images to be quantified, and a linear regression is applied. The regression
parameters are then saved in a Matlab native format as to be used in the later quantification. The
regression was performed at each pixel position due to the non-uniform background illumination
acquired by the image sensor.
From the assays made with adsorbed CBD-FITC on cellulose films, it was shown that the
photobleaching effect could be neglected. The excitation of FITC for twenty seconds, a much
higher acquisition time than the used in the fibres quantification, implied only 0.42% decrease in
the measured fluorescent intensity.
When a solution of CBD-FITC with a concentration of 400 μg/mL (expected to saturate
the surface) was left in contact with a cellulose film (obtained from cellulose acetate), the
quantified surface concentration of CBD was equivalent to 1.6 to 2 protein layers. This figure is
higher than the theorically expected, that is, one layer at saturation. This may be explained as
arising from the penetration of the CBDs into inner layers of the film.
The estimation of CBD surface concentration was also carried out using cellulose fibres.
Two different initial CBD-FITC concentrations were used: 2 and 20 mg of protein per gram of
fibres. The lower amount was chosen since it is the range of concentration used in paper fibres
treatment; the higher amount was used to assess the maximum coverage that could be obtained at
saturation. For the lower concentration, a coverage of 77% was found for the secondary fibres
(Portucel) and of 110% for pure cellulose fibres (Whatman CF11). These values are higher than
expected, showing that with a relatively low concentration of protein a high coverage is possible,
subsequently implying a change in the fibres’ surface properties. For the higher concentration,
the number of estimated layers of CBDs was 4, 6 and 5.3 for Whatman CF11, Amorphous CF11
and Sigmacel 20, respectively. The adsorption isotherms do not suggest the existence of several
protein layers at saturation. Rather, the apparent high surface coating is probably associated with
both surface irregularities and penetration of CBDs in the fibres structure. Indeed, confocal
microscopy showed that the surface of a fibre is not perfectly smooth, but rather irregular, which
will increase the real surface area (as compared to the assumed flat surface). Also confocal
microscopy showed the presence of CBD-FITC in the inner core of the fibres. This evidence was
confirmed by TEM-immunolabeling, which revealed black spots (presence of CBDs) in the
middle of the Whatman CF11 fibres.
Studies of CBDs on fibre modification
The effect of CBDs on the pulp and paper properties was analysed, using primary (virgin)
and secondary (recycled) cellulose fibres. As a general trend, the CBDs both decreased the
Ricardo Pinto Production of CBDs and adsorption to cellulose fibres
19
Schopper-Riegler index (ºSR) and increased the water retention value (WRV). Similar results
were described by other authors, using cellulases, an effect that was associated to the hydrolytic
activity toward the amorphous regions on fibres’ surface. In the present work, no activity was
detected by DNS analysis (reducing sugar quantification). Then, it is possible to associate these
results mainly to the presence of adsorbed CBDs, due to stabilisation of fines or to steric effects
due to the oligosaccharides present in the linker peptide.
The air permeability of the papersheets increases with the CBDs adsorption, especially
for the secondary fibres without refining and for the Pine fibres at PFI of 3000 revolutions. This
may allow a faster production rate and/or lower heat consumption. The strength parameters
decreased, with adsorbed CBDs, as the PFI revolutions were increased.
To study the influence of the protein electric charge on the fibres properties, a conjugate
of CBD with lysozyme (a protein with a high isoelectric point, 11.3) was produced. The
conjugate have a high positive charge, at the adsorption assay conditions. To conjugate the
proteins, the chemical N-hydroxysuccinimidyl 4-azidobenzoate (HSAB) was used. HSAB firstly
reacts with a free amine in the linker’s terminal (the only free amine present on CBDs), and then
with lysozyme. This strategy allows the coupling of CBD to lysozyme molecules (one or more,
as shown by size exclusion chromatography), excluding the possibility of homoconjugates to be
formed. The effect of the conjugates on the papersheets was similar to the obtained with CBDs,
except for the permeability, that was enhanced.
In relation to the surface properties, only the ZETA potential of unrefined Eucalyptus
fibres presented a significant variation with both CBD and conjugates (CBD with lysozyme)
adsorption. This is explained by the lower surface area of the unrefined fibres, thus higher
surface coverage by the proteins. With pure cellulose, at high protein content, the electric charge
of the fibres turned from negative to positive with CBD, an effect even more evident with the
conjugates. This trend was also observed with the other fibres, but not so extensively, because of
the lower surface coverage. From the contact angle measurements, no significant variation was
observed with adsorbed CBD, only a small increment of hydrophilicity in the primary and pure
cellulose fibres. The secondary fibres showed a decrease of the negative polar component after
the adsorption of both CBDs and conjugates. The conjugates significantly changed the surface
energy of pure cellulose. The fibres had their negative polar component highly reduced, which
induced the fibres to become hydrophobic.

Ricardo Pinto Production of CBDs and adsorption to cellulose fibres
20
Conclusions
Cellulases have been widely used in industrial processes, including paper properties
enhancement, garments treatment, etc. However, the hydrolytic activity is responsible for an
elevated mass loss of the treated products. Carbohydrates-binding modules (CBM), on the other
hand, even though not showing hydrolytic activity, are able to produce equivalent effects as the
whole enzymes counterparts, as was demonstrated by the Schopper-Riegler index (ºSR) and by
water retention values (WRV) measurements on handsheets production. These effects are
probably due to the CBDs adsorption on the fibres, with a high surface coating, as measured by
fluorescence microscopy. The demonstration that CBMs penetrate deep in the fibres suggest that
the properties of these fibres may be modified not only through surface properties modification.
CBMs may also be used to target different molecules to the cellulose surface. As shown
with lysozyme, it was possible in this work to modify the cellulose surface properties, from
hydrophilic to hydrophobic. This demonstrates the feasibility of engineering conjugates that
would allow the manufacturing of new cellulose based materials.
The CBMs used in this work are highly glycosylated, and are in this regard different from
the recombinant proteins obtained by expression in a bacterial host. However, the use of
recombinant CBMs (bearing attached functional proteins) is recommended for future work. A
better understanding of the effects of CBMs on the surface and structural properties of cellulosic
fibres is required (surface coating and modification, adsorption reversibility, CBMs competition
and affinity for different sites in the surface, surface diffusion, penetration of the fibres). The
techniques developed in this work may contribute to those studies.

Ricardo Pinto Production of CBDs and adsorption to cellulose fibres
21
Bibliography
Abou Hachem M., Karlsson E.N., Bartonek-Roxa E., Raghothama S., Simpson P.J., Gilbert H.J.,
Williamson M.P., Holst O. 2000. Carbohydrate-binding modules from a thermostable
Rhodothermus marinus xylanase: cloning, expression and binding studies. Biochemical Journal
345: 53-60
Bayer E.A., Belaich J.P., Shoham Y., Lamed R. 2004. The cellulosomes: Multienzyme machines
for degradation of plant cell wall polysaccharides. Annual Review of Microbiology 58: 521-554
Bayer E.A., Chanzy H., Lamed R., Shoham Y. 1998. Cellulose, cellulases and cellulosomes.
Current Opinion in Structural Biology 8: 548-557
Bayer E.A., Setter E., Lamed R. 1985. Organization and distribution of the cellulosome in
Clostridium thermocellum. The Journal of Bacteriology 163: 552-559
Belaich J.P., Tardif C., Belaich A., Gaudin C. 1997. The cellulolytic system of Clostridium
cellulolyticum. Journal of Biotechnology 57: 3-14
Belgacem M.N., Czeremuszkin G., Sapieha S., Gandini A. 1995. Surface characterization of
cellulose fibres by XPS and inverse gas chromatography. Cellulose 2: 145-157
Bidlack J., Malone M., Benson R. 1992. Molecular Structure and Component Integration of
Secondary Cell Walls in Plants. Proceedings of the Oklahoma Academy of Science 72: 51-56
Birch P.R.J., Sims P.F.G., Broda P. 1995. Substrate-Dependent Differential Splicing of Introns
in the Regions Encoding the Cellulose-Binding Domains of two Exocellobiohydrolase-I-Like
Genes in Phanerochaete-Chrysosporium. Applied and Environmental Microbiology 61: 3741-
3744
Black G.W., Rixon J.E., Clarke J.H., Hazlewood G.P., Ferreira L.M.A., Bolam D.N., Gilbert
H.J. 1997. Cellulose binding domains and linker sequences potentiate the activity of
hemicellulases against complex substrates. Journal of Biotechnology 57: 59-69

Ricardo Pinto Production of CBDs and adsorption to cellulose fibres
22
Boisset C., Chanzy H., Henrissat B., Lamed R., Shoham Y., Bayer E.A. 1999. Digestion of
crystalline cellulose substrates by the Clostridium thermocellum cellulosome: structural and
morphological aspects. Biochemical Journal 340: 829-835
Brown R.M., Saxena I.M., Kudlicka K. 1996. Cellulose biosynthesis in higher plants. Trends in
Plant Science 1: 149-156
Carrard G., Koivula A., Soderlund H., Beguin P. 2000. Cellulose-binding domains promote
hydrolysis of different sites on crystalline cellulose. Proceedings of the National Academy of
Sciences of the United States of America 97: 10342-10347
Carrard G., Linder M. 1999. Widely different off rates of two closely related cellulose-binding
domains from Trichoderma reesei. European Journal of Biochemistry 262: 637-643
Cavaco-Paulo A., Morgado J., Andreaus J., Kilburn D. 1999. Interactions of cotton with CBD
peptides. Enzyme and Microbial Technology 25: 639-643
Concha J., Soto C., Chamy R., Zuniga M.E. 2004. Enzymatic pretreatment on rose-hip oil
extraction: Hydrolysis and, pressing conditions. Journal of the American Oil Chemists Society
81: 549-552
Coutinho P.M., Henrissat B. 1999. Carbohydrate-active enzymes: an integrated database
approach. In: Recent Advances in Carbohydrate Bioengineering (Ed. Gilbert H.J., Davies G.,
Henrisat B., and Svensson B.). The Royal Society of Chemistry, Cambridge
Davies G., Henrissat B. 1995. Structures and Mechanisms of Glycosyl Hydrolases. Structure 3:
853-859
Dienes D., Egyhazi A., Reczey K. 2004. Treatment of recycled fiber with Trichoderma
cellulases. Industrial Crops and Products 20: 11-21
Din N., Gilkes N.R., Tekant B., Miller R.C., Warren A.J., Kilburn D.G. 1991. Non-Hydrolytic
Disruption of Cellulose Fibers by the Binding Domain of A Bacterial Cellulase. Bio-Technology
9: 1096-1099

Ricardo Pinto Production of CBDs and adsorption to cellulose fibres
23
Divne C., Stahlberg J., Reinikainen T., Ruohonen L., Pettersson G., Knowles J.K.C., Teeri T.T.,
Jones T.A. 1994. The 3-Dimensional Crystal-Structure of the Catalytic Core of
Cellobiohydrolase-I from Trichoderma-Reesei. Science 265: 524-528
Divne C., Stahlberg J., Teeri T.T., Jones T.A. 1998. High-resolution crystal structures reveal
how a cellulose chain is bound in the 50 angstrom long tunnel of cellobiohydrolase I from
Trichoderma reesei. Journal of Molecular Biology 275: 309-325
Doblin M.S., Kurek I., Jacob-Wilk D., Delmer D.P. 2002. Cellulose biosynthesis in plants: from
genes to rosettes. Plant and Cell Physiology 43: 1407-1420
Garcia O., Torres A.L., Colom J.F., Pastor F.I.J., Diaz P., Vidal T. 2002. Effect of cellulase-
assisted refining on the properties of dried and never-dried eucalyptus pulp. Cellulose 9: 115-125
Geng X.L., Li K.C. 2003. Deinking of recycled mixed office paper using two endo-glucanases,
CelB and CelE, from the anaerobic fungus orpinomyces PC-2. Tappi Journal 2: 29-32
Gilkes N.R., Jervis E., Henrissat B., Tekant B., Miller R.C., Warren R.A.J., Kilburn D.G. 1992.
The Adsorption of A Bacterial Cellulase and Its two Isolated Domains to Crystalline Cellulose.
Journal of Biological Chemistry 267: 6743-6749
Gilkes N.R., Warren R.A.J., Miller R.C., Kilburn D.G. 1988. Precise Excision of the Cellulose
Binding Domains from two Cellulomonas fimi Cellulases by A Homologous Protease and the
Effect on Catalysis. Journal of Biological Chemistry 263: 10401-10407
Giovannozzi-Sermanni G., Cappelletto P., Mongardini F., Brizzi M., D'Annibale A. 2000. Paper
pulp by enzymatic treatment of agricultural residues and waste paper.
Greenwood J.M., Gilkes N.R., Kilburn D.G., Miller R.C., Warren R.A.J. 1989. Fusion to An
Endoglucanase Allows Alkaline-Phosphatase to Bind to Cellulose. Febs Letters 244: 127-131
Hamada N., Kodaira R., Nogawa M., Shinji K., Ito R., Amano Y., Shimosaka M., Kanda T.,
Okazaki M. 2001. Role of cellulose-binding domain of exocellulase I from white rot
basidiomycete Irpex lacteus. Journal of Bioscience and Bioengineering 91: 359-362
Ricardo Pinto Production of CBDs and adsorption to cellulose fibres
24
Heikinheimo L. Trichoderma reesei cellulases in processing of cotton. 2002. Tampere University
of Technology. 82p.
Henrissat B., Davies G. 1997. Structural and sequence-based classification of glycoside
hydrolases. Current Opinion in Structural Biology 7: 637-644
Howard R.L., Abotsi E., Jansen van Rensburg E.L., Howard S. 2003. Lignocellulose
biotechnology: issues of bioconversion and enzyme production. African Journal of
Biotechnology 2: 602-619
Ikegami T., Okada T., Hashimoto M., Seino S., Watanabe T., Shirakawa M. 2000. Solution
structure of the chitin-binding domain of Bacillus circulans WL-12 chitinase A1. Journal of
Biological Chemistry 275: 13654-13661
Irwin D., Shin D.H., Zhang S., Barr B.K., Sakon J., Karplus P.A., Wilson D.B. 1998. Roles of
the catalytic domain and two cellulose binding domains of Thermomonospora fusca E4 in
cellulose hydrolysis. Journal of Bacteriology 180: 1709-1714
Irwin D.C., Spezio M., Walker L.P., Wilson D.B. 1993. Activity Studies of 8 Purified Cellulases
- Specificity, Synergism, and Binding Domain Effects. Biotechnology and Bioengineering 42:
1002-1013
Jackson L.S., Heitmann J.A., Joyce T.W. 1993. Enzymatic Modifications of Secondary Fiber.
Tappi Journal 76: 147-154
Jeffries T.W., Sykes MS., Rutledge-Cropsey K., Klungness J.H., Abubakr S. 1996. Enhanced
removal of toners from office waste papers by microbial cellulases. 141-144
Jervis E.J., Haynes C.A., Kilburn D.G. 1997. Surface diffusion of cellulases and their isolated
binding domains on cellulose. Journal of Biological Chemistry 272: 24016-24023
Jiang M., Radford A. 2000. Exploitation of a cellulose-binding domain from Neurospora crassa.
Enzyme and Microbial Technology 27: 434-442
Ricardo Pinto Production of CBDs and adsorption to cellulose fibres
25
Johnson P.E., Brun E., MacKenzie L.F., Withers S.G., McIntosh L.P. 1999. The cellulose-
binding domains from Cellulomonas fimi beta-1,4-glucanase CenC bind nitroxide spin-labeled
cellooligosaccharides in multiple orientations. Journal of Molecular Biology 287: 609-625
Kaseda K., Kodama T., Fukui K., Hirose K. 2001. A novel approach for purification of
recombinant proteins using the dextran-binding domain. Febs Letters 500: 141-144
Kataeva I.A., Seidel R.D., Li X.L., Ljungdahl L.G. 2001. Properties and mutation analysis of the
CelK cellulose-binding domain from the Clostridium thermocellum cellulosome. Journal of
Bacteriology 183: 1552-1559
Kimura S., Itoh T. 2004. Cellulose synthesizing terminal complexes in the ascidians. Cellulose
11: 377-383
Kimura S., Laosinchai W., Itoh T., Cui X., Linder C.R., Brown R.M. 1999. Immunogold
Labeling of Rosette Terminal Cellulose-Synthesizing Complexes in the Vascular Plant Vigna
angularis. THE PLANT CELL 11: 2075-2086
Koivula A., Kinnari T., Harjunpaa V., Ruohonen L., Teleman A., Drakenberg T., Rouvinen J.,
Jones T.A., Teeri T.T. 1998. Tryptophan 272: an essential determinant of crystalline cellulose
degradation by Trichoderma reesei cellobiohydrolase Cel6A. Febs Letters 429: 341-346
Kormos J., Johnson P.E., Brun E., Tomme P., McIntosh L.P., Haynes C.A., Kilburn D.G. 2000.
Binding site analysis of cellulose binding domain CBDN1 from endoglucanse C of
Cellulomonas fimi by site-directed mutagenesis. Biochemistry 39: 8844-8852
Kraulis P.J., Clore G.M., Nilges M., Jones T.A., Pettersson G., Knowles J., Gronenborn A.M.
1989. Determination of the 3-Dimensional Solution Structure of the C-Terminal Domain of
Cellobiohydrolase-I from Trichoderma-Reesei - A Study Using Nuclear Magnetic-Resonance
and Hybrid Distance Geometry Dynamical Simulated Annealing. Biochemistry 28: 7241-7257
Kruus K., Lua A.C., Demain A.L., Wu J.H.D. 1995. The Anchorage Function of Cipa (Cell), A
Scaffolding Protein of the Clostridium-Thermocellum Cellulosome. Proceedings of the National
Academy of Sciences of the United States of America 92: 9254-9258
Ricardo Pinto Production of CBDs and adsorption to cellulose fibres
26
Kutacova P. Enzymatic Modification Of Kenaf Pulp. 1998. University of Toronto. 138p.
Lee I., Evans B.R., Woodward J. 2000. The mechanism of cellulase action on cotton fibers:
evidence from atomic force microscopy. Ultramicroscopy 82: 213-221
Lehtio J., Sugiyama J., Gustavsson M., Fransson L., Linder M., Teeri T.T. 2003. The binding
specificity and affinity determinants of family 1 and family 3 cellulose binding modules.
Proceedings of the National Academy of Sciences of the United States of America 100: 484-489
Limon M.C., Margolles-Clark E., Benitez T., Penttila M. 2001. Addition of substrate-binding
domains increases substrate-binding capacity and specific activity of a chitinase from
Trichoderma harzianum. Fems Microbiology Letters 198: 57-63
Linder M., Nevanen T., Teeri T.T. 1999. Design of a pH-dependent cellulose-binding domain.
Febs Letters 447: 13-16
Mattinen M.L., Linder M., Drakenberg T., Annila A. 1998. Solution structure of the cellulose-
binding domain of endoglucanase I from Trichoderma reesei and its interaction with cello-
oligosaccharides. European Journal of Biochemistry 256: 279-286
Mattinen M.L., Linder M., Teleman A., Annila A. 1997. Interaction between cellohexaose and
cellulose binding domains from Trichoderma reesei cellulases. Febs Letters 407: 291-296
Meinke A., Damude H.G., Tomme P., Kwan E., Kilburn D.G., Miller R.C., Warren R.A.J.,
Gilkes N.R. 1995. Enhancement of the Endo-Beta-1,4-Glucanase Activity of An
Exocellobiohydrolase by Deletion of A Surface Loop. Journal of Biological Chemistry 270:
4383-4386
Michalopoulos D.L., Ghosh D., Murdoch B. 2005. Enhancement of Wood Pulps by Cellulase
Treatment.
Miettinen-Oinonen A. Trichoderma reesei strains for production of cellulases for the textile
industry. 2004. University of Helsinki. 100p.
Ricardo Pinto Production of CBDs and adsorption to cellulose fibres
27
Nagy T., Simpson P., Williamson M.P., Hazlewood G.P., Gilbert H.J., Orosz L. 1998. All three
surface tryptophans in Type IIa cellulose binding domains play a pivotal role in binding both
soluble and insoluble ligands. Febs Letters 429: 312-316
Nam J.M., Fujita Y., Arai T., Kondo A., Morikawa Y., Okada H., Ueda M., Tanaka A. 2002.
Construction of engineered yeast with the ability of binding to cellulose. Journal of Molecular
Catalysis B-Enzymatic 17: 197-202
O'Sullivan A.C. 1997. Cellulose: the structure slowly unravels. Cellulose 4: 173-207
Oksanen T., Pere J., Paavilainen L., Buchert J., Viikari L. 2000. Treatment of recycled kraft
pulps with Trichoderma reesei hemicellulases and cellulases. Journal of Biotechnology 78: 39-48
Pastor F.I.J., Pujol X., Blanco A., Vidal T., Torres A.L., Diaz P. 2001. Molecular cloning and
characterization of a multidomain endoglucanase from Paenibacillus sp BP-23: evaluation of its
performance in pulp refining. Applied Microbiology and Biotechnology 55: 61-68
Pelach M.A., Pastor F.J., Puig J., Vilaseca F., Mutje P. 2003. Enzymic deinking of old
newspapers with cellulase. Process Biochemistry 38: 1063-1067
Ponpium P., Ratanakhanokchai K., Kyu K.L. 2000. Isolation and properties of a cellulosome-
type multienzyme complex of the thermophilic Bacteroides sp strain P-1. Enzyme and Microbial
Technology 26: 459-465
Ponyi T., Szabo L., Nagy T., Orosz L., Simpson P.J., Williamson M.P., Gilbert H.J. 2000. Trp22,
Trp24, and Tyr8 play a pivotal role in the binding of the family 10 cellulose-binding module
from Pseudomonas xylanase A to insoluble ligands. Biochemistry 39: 985-991
Rabinovich M.L., Melnick M.S., Bolobova A.V. 2002. The structure and mechanism of action of
cellulolytic enzymes. Biochemistry-Moscow 67: 850-871
Reinikainen T., Takkinen K., Teeri T.T. 1997. Comparison of the adsorption properties of a
single-chain antibody fragment fused to a fungal or bacterial cellulose-binding domain. Enzyme
and Microbial Technology 20: 143-149
Ricardo Pinto Production of CBDs and adsorption to cellulose fibres
28
Schulein M. 2000. Protein engineering of cellulases. Biochimica et Biophysica Acta-Protein
Structure and Molecular Enzymology 1543: 239-252
Seo Y.B., Shin Y.C., Jeon Y. 2000. Enzymatic and mechanical treatment of chemical pulp.
Tappi Journal 83: 64-64
Shen H., Schmuck M., Pilz I., Gilkes N.R., Kilburn D.G., Miller R.C., Warren R.A.J. 1991.
Deletion of the Linker Connecting the Catalytic and Cellulose-Binding Domains of
Endoglucanase-A (Cena) of Cellulomonas-Fimi Alters Its Conformation and Catalytic Activity.
Journal of Biological Chemistry 266: 11335-11340
Shimon L.J.W., Pages S., Belaich A., Belaich J.P., Bayer E.A., Lamed R., Shoham Y., Frolow F.
2000. Structure of a family IIIa scaffoldin CBD from the cellulosome of Clostridium
cellulolyticum at 2.2 angstrom resolution. Acta Crystallographica Section D-Biological
Crystallography 56: 1560-1568
Shoham Y., Lamed R., Bayer E.A. 1999. The cellulosome concept as an efficient microbial
strategy for the degradation of insoluble polysaccharides. Trends in Microbiology 7: 275-281
Shpigel E., Goldlust A., Eshel A., Ber I.K., Efroni G., Singer Y., Levy I., Dekel M., Shoseyov O.
2000. Expression, purification and applications of staphylococcal Protein A fused to cellulose-
binding domain. Biotechnology and Applied Biochemistry 31: 197-203
Shpigel E., Roiz L., Goren R., Shoseyov O. 1998. Bacterial cellulose-binding domain modulates
in vitro elongation of different plant cells. Plant Physiology 117: 1185-1194
Simpson H.D., Barras F. 1999. Functional analysis of the carbohydrate-binding domains of
Erwinia chrysanthemi Cel5 (endoglucanase Z) and an Escherichia coli putative chitinase.
Journal of Bacteriology 181: 4611-4616
Simpson P.J., Xie H.F., Bolam D.N., Gilbert H.J., Williamson M.P. 2000. The structural basis
for the ligand specificity of family 2 carbohydrate-binding modules. Journal of Biological
Chemistry 275: 41137-41142
Ricardo Pinto Production of CBDs and adsorption to cellulose fibres
29
Sinnott M.L. 1990. Catalytic Mechanisms of Enzymatic Glycosyl Transfer. Chemical Reviews
90: 1171-1202
Sorimachi K., Jacks A.J., LeGalCoeffet M.F., Williamson G., Archer D.B., Williamson M.P.
1996. Solution structure of the granular starch binding domain of glucoamylase from Aspergillus
niger by nuclear magnetic resonance spectroscopy. Journal of Molecular Biology 259: 970-987
Soto C.G., Chamy R., Zuniga M.E. 2004. Effect of enzymatic application on borage (Borago
officinalis) oil extraction by cold pressing. Journal of Chemical Engineering of Japan 37: 326-
331
Srisodsuk M. Mode of action of Trichoderma reesei cellobiohydrolase I on crystalline cellulose.
1994. VTT Publications 188. 107p.
Srisodsuk M., Lehtio J., Linder M., MargollesClark E., Reinikainen T., Teeri T.T. 1997.
Trichoderma reesei cellobiohydrolase I with an endoglucanase cellulose-binding domain: action
on bacterial microcrystalline cellulose. Journal of Biotechnology 57: 49-57
Srisodsuk M., Reinikainen T., Penttila M., Teeri T.T. 1993. Role of the Interdomain Linker
Peptide of Trichoderma-Reesei Cellobiohydrolase-I in Its Interaction with Crystalline Cellulose.
Journal of Biological Chemistry 268: 20756-20761
Stork G., Pereira H., Wood T.M., Dusterhoft E.M., Toft A., Puls J. 1995. Upgrading Recycled
Pulps Using Enzymatic Treatment. Tappi Journal 78: 79-88
Sykes M., Klungness J.H., Abubakr S., Tan F. 1996. Upgrading Recovered Paper With Enzyme
Pretreatment and Pressurized Peroxide Bleaching. Progress in Paper Recycling 6: 39-46
Sykes MS., Klungness J.H. 1997. Enzymatic Removal of Stickie Contaminants. 687-691
Tamai N., Tatsumi D., Matsumoto T. 2004. Rheological properties and molecular structure of
tunicate cellulose in LiCl/1,3-dimethyl-2-imidazolidinone. Biomacromolecules 5: 422-432
Teeri T.T. 1997. Crystalline cellulose degradation: New insight into the function of
cellobiohydrolases. Trends in Biotechnology 15: 160-167
Ricardo Pinto Production of CBDs and adsorption to cellulose fibres
30
Tomme P., Boraston A., McLean B., Kormos J., Creagh A.L., Sturch K., Gilkes N.R., Haynes
C.A., Warren R.A.J., Kilburn D.G. 1998. Characterization and affinity applications of cellulose-
binding domains. Journal of Chromatography B 715: 283-296
Tomme P., Driver D.P., Amandoron E.A., Miller R.C., Antony R., Warren J., Kilburn D.G.
1995. Comparison of A Fungal (Family-I) and Bacterial (Family-Ii) Cellulose-Binding Domain.
Journal of Bacteriology 177: 4356-4363
Viesturs U., Leite M., Eisimonte M., Eremeeva T., Treimanis A. 1999. Biological deinking
technology for the recycling of office waste papers. Bioresource Technology 67: 255-265
Viikari L., Kantelinen A., Poutanen K., Ranua M. 1990. Characterization of pulps treated with
hemicellulolytic enzymes prior to bleaching. In: Biotechnology in pulp and paper manufacture
(Ed. Kirk T.K. and Chang H.). Butterworth-Heinemann, Boston
Walker L.P., Wilson D.B., Irwin D.C., Mcquire C., Price M. 1992. Fragmentation of Cellulose
by the Major Thermomonospora-Fusca Cellulases, Trichoderma-Reesei Cbhi, and Their
Mixtures. Biotechnology and Bioengineering 40: 1019-1026
Wang A.A., Mulchandani A., Chen W. 2001. Whole-cell immobilization using cell surface-
exposed cellulose-binding domain. Biotechnology Progress 17: 407-411
Wang A.J.A., Mulchandani A., Chen W. 2002. Specific adhesion to cellulose and hydrolysis of
organophosphate nerve agents by a genetically engineered Escherichia coli strain with a surface-
expressed cellulose-binding domain and organophosphorus hydrolase. Applied and
Environmental Microbiology 68: 1684-1689
Warren R.A.J. 1996. Microbial hydrolysis of polysaccharides. Annual Review of Microbiology
50: 183-212
Wong K.K.Y., Hamilton N.T., Signal F.A., Campion S.H. 2004. High-humidity performance of
paperboard after treatment with xylanase, endoglucanse, and their combination. Biotechnology
and Bioengineering 85: 516-523
Ricardo Pinto Production of CBDs and adsorption to cellulose fibres
31
MANUSCRIPTS

Ricardo Pinto Production of CBDs and adsorption to cellulose fibres
32
M1. Large Scale Production of Cellulose-Binding Domains.
Adsorption Studies Using CBD-FITC Conjugates
(Published in Cellulose 13, 557-569)
Ricardo Pinto, Joana Carvalho, Manuel Mota and Miguel Gama*
Centro de Engenharia Biológica, Universidade do Minho, Campus de Gualtar, 4710-057 Braga,
Portugal
* Author for Correspondence (e-mail: [email protected]; phone: +351 253604400; fax:
+351 253678986)
Abstract
A method for the gram-scale production of Cellulose-Binding Domains (CBD) by
proteolytic digestion of a commercial enzymatic preparation (Celluclast®), was developed. The
CBD obtained, isolated from Trichoderma reesei cellobiohydrolase I, is highly pure and heavily
glycosylated. The purified peptide has a molecular weight of 8.43 kDa, comprising the binding
module, a part of the linker, and about 30% of glycosidic moiety. Its properties may thus be
different from recombinant ones, expressed in bacteria. CBD-fluorescein isothiocyanate
conjugates were used to study the CBD-cellulose interaction. The observation of the fluorescent
peptides adsorbed on crystalline and amorphous cellulose fibers suggest that amorphous regions
have a higher concentration of binding sites. It is also shown that the adsorption is reversible, but
also that desorption is a very slowly process.
Key Words: Cellulose-Binding Domains, Proteolysis, Adsorption, FITC
Abbreviations: CBHI, cellobiohydrolase I; CBHII, cellobiohydrolase II; CBD, cellulose-binding
domain; CBDCBHI, cellulose-binding domain of cellobiohydrolase I; FITC, fluorescein
isothiocyanate
Ricardo Pinto Production of CBDs and adsorption to cellulose fibres
33
Introduction
Cellulose is a polymer formed by chains of thousands of glucose molecules linked by β-
1,4-glycosidic bonds. These chains pack together through hydrogen bonds, forming microfibrils,
which in turn gather to form fibers with a predominantly crystalline character. Microorganisms
use a consortium of enzymes to degrade this insoluble material efficiently.
One of these microorganisms is Trichoderma reesei, a fungus that produces mainly (80-
90%) two exoglucanases (cellobiohidrolase I and II), and several endoglucanases (I, II and V)
(Srisodsuk 1994). These two types of enzyme either act from the loose ends of the microfibrils
(exoglucanases) or randomly in the macromolecular chain (endoglucanases). One common
feature in many of these enzymes is their modular assembly, formed by a catalytic domain, a
cellulose-binding domain (CBD) and a highly glycosilated linker (Hui et al. 2001).
CBDs greatly contribute to the enzymes function, by endowing the proteins with
cellulose affinity (Srisodsuk et al. 1993). CBDs have highly conserved sequences, namely a three
aromatic residue strip that appears to be implicated in the binding process (Mattinen et al. 1997).
Two features differentiates CBDs from cellobiohydrolases I and II: one of the CBH II residues in
the hydrophobic strip is a tryptophan instead of tyrosine; and the number of disulfide bridges is
different (three in CBH II, only two in CBH I). These differences appear to have a major impact
in the adsorption behavior: CBDCBH II irreversibly binds BMCC, whereas CBDCBH I adsorption is
reversible (Carrard and Linder 1999; Linder et al. 1999).
Xiao et al. (2001) showed that CBD from endoglucanase III has the ability to disrupt the
crystalline structure of cellulose fibers. A similar result was observed with a CBD from
Penicillium janthinellum, in the treatment of cotton fibers (Gao et al. 2001). Another interesting
work (Carrard et al. 2000) showed that different CBDs adsorb to different sites in the surface of
crystalline cellulose. These results strongly suggest that CBDs may be functionally more
sophisticated than just a tool for the enzyme adsorption.
Limited proteolysis of cellulases as been used by other authors to isolate the catalytic
domain (Tilbeurgh et al. 1986; Harrison et al. 2002; Lemos et al. 2000), but not the large scale
production of binding modules, as described in this work. In order to study the interaction with
cellulose, the CBDs obtained were used to analyze the FITC-labeled CBD adsorption and
distribution on different cellulose materials.
Ricardo Pinto Production of CBDs and adsorption to cellulose fibres
34
Materials and Methods
Chemicals
FITC was obtained from Sigma. The cellulose samples used were obtained from Fluka
(Avicel PH-101) and Sigma-Aldrich (Whatman CF11). All chemicals were of the highest purity
available.
CBD Production
The commercial enzymatic preparation Celluclast 1.5L (Novozymes A/S, Denmark),
produced by the fungus Trichoderma reesei, was firstly diluted 1:4 with acetate buffer (pH 5.0,
25 mM) and dia-filtered through a 30 kDa ultra filtration membrane, using a Pellicon 2 TFF
System (Millipore, USA). The papain activation was carried out mixing a diluted solution
(1:1000 v/v) of β-Mercaptoethanol with papain (1:10) for 15 minutes. After 4 hours of
proteolysis at room temperature, the solution was filtered through a 10 kDa membrane and the
permeate recovered. Ammonium sulphate was then added (700 g/L) to the permeate solution in
order to precipitate the peptides, which were recovered by centrifugation at 12225 RCF (relative
centrifugal acceleration) for 40 minutes (Sigma 4K10, B. Braun). This concentrated solution was
finally dialyzed against phosphate buffer (pH 7.5, 20 mM), using a 1 kDa cutoff membrane.
Deglycosylated CBD were prepared as described elsewhere (Edge at al. 1981). Treatment with
trifluoromethanesulfonic acid (TFMS) was carried out for 30 minutes. Longer periods lead to
fragmentation of the protein, while shorter periods were insufficient for the complete sugar
removal (as monitored by sugar and protein quantification of the dialysed material).
Ion Exchange Chromatography
The peptides were further purified using a column packed with DEAE Sepharose Fast-
Flow gel (Amersham Pharmacia Biotech AB, Sweden), using phosphate buffer (pH 7.5, 20 mM)
as eluent and a flow rate of 3 mL/min. The first peak (non adsorbed protein) was recovered and
lyophilized.
N-terminal Peptide Sequencing
Purified CBDs were sequenced on an Applied Biosystems Procise 491 HT, according to
manufacturer’s specifications.
Ricardo Pinto Production of CBDs and adsorption to cellulose fibres
35
Capillary Electrophoresis
A BioFocus 2000 Cappilary Electrophoresis System (Bio-Rad) was used. All the
solutions used were purchased from Bio-Rad (CE-SDS Protein Kit). An uncoated fused-silica
(Bio-Rad) capillary, with an internal diameter of 50 μm and a length of 24 cm, was used. The
electrophoresis run conditions were as follows: capillary temperature of 20 ºC, CE-SDS Protein
Run Buffer, 15 kV constant run voltage, on-line detection at 220 nm and electrophoretic
injection by application of 15 kV for 10 seconds. Calibration was performed with three proteins
(Sigma-Aldrich) of known molecular sizes: BSA (66 kDa), Pepsin (35 kDa) and Lysozyme (14.5
kDa).
Sugar analysis
The monosaccharides in the CBD glycosidic fraction were released by Saeman hydrolysis
(Selvendran et al. 1979) and analyzed as their alditol acetates by gas chromatography (Blakeney
et al. 1983; Harris et al. 1988), using a Chrompack CP9001 equipped with a Flame Ionization
Detector and a Varian CP-Sil 88 column. Total sugars were also measured using the phenol-
sulfuric method (Dubois et al. 1956), with mannose as standard.
MALDI-TOF
The measurements were made on a Voyager-DE™ STR (Applied Biosystems). The
sample was diluted on the matrix reagent, sinapinic acid. Calibration was performed using the
Pepmix 3 (LaserBio Labs, France) peptide mix.
CBD Affinity and Binding Reversibility
Suspensions of Whatman CF11 fibers, with a concentration of 10 mg per mL in Sodium
Acetate buffer (50 mM, pH 5.0) were incubated for 16 hours at 5 ºC, with magnetic agitation, in
the presence of different CBD concentrations (CBDInicial). Afterwards, the fibers were
centrifuged at 4000 rpm for 10 minutes, and the CBD concentration in the supernatant
(CBDUnbound) was measured in a Jasco FP6200 spectrofluorimeter, operated at an emission and
excitation wavelengths of 341 and 275 nm, respectively. The apparatus was calibrated using
CBD solutions with determined concentration using BCA Protein Assay, from Pierce. The bound
CBD was calculated using the following equation:
[ ] [ ]R
CF
UnboundInitialBound V
mCBDCBDCBD ⋅
−=
11
(μmolCBD/gCF11)

Ricardo Pinto Production of CBDs and adsorption to cellulose fibres
36
where VR corresponds to the volume of buffer used, [CBD x] to the molar concentration of CBD
and mCF11 to the fibers mass.
Fluorescence Spectroscopy
A FP-6200 Spectrofluorimeter apparatus (Jasco Corporation, Japan) was used. The band
width of excitation and emission was 5 nm and the scan speed was 1000 nm/min. A constant
excitation at 275 nm was used.
Amorphous Cellulose Preparation
Amorphous cellulose was prepared treating Whatman CF11 fibers with phosphoric acid.
Briefly, 0.17 g of Whatman CF11 were slowly mixed with 10 mL of cold (4 ºC) phosphoric acid
(85%) and left in contact for 5 minutes. Then, 600 mL of cold water were added and the
suspension was filtered through a test sieve (mesh width 71 µm according to DIN 4188). Finally,
the fibers were extensively washed, firstly in tap water and afterwards with distilled water. The
obtained material was lyophilized and stored.
CBD-FITC Conjugation and Adsorption
Fluorescein isothiocyanate (FITC) is a fluorescent probe widely used to attach a
fluorescent label to proteins, by reacting with amine groups. CBD were labeled by standard
procedures. Briefly, 20 µg of FITC was added per mg of CBD (in a concentration of 2 mg
protein/mL in 0.1 M HEPES buffer, pH 9.0). This solution was incubated overnight in the dark,
at room temperature, with magnetic stirring. To separate unbound FITC from FITC-CBD, the
mixture was filtered through a BIO-GEL P-4 (BIO-RAD) column, previously equilibrated with
50 mM sodium acetate buffer (pH 5.0). Fractions containing significant amounts of FITC-CBD
were pooled. The fluorescence at an excitation/emission of 275/310 nm and 495/525 nm was
measured, to determine CBD concentration and FITC fluorescence, respectively.
Adsorption assays were carried out at 4 ºC. FITC-labeled CBD solutions with different
concentrations were mixed in the dark with cellulose fibers (20 g/L), in 50 mM sodium acetate
buffer, to a final volume of 4 mL. The suspension was continuously stirred. After 2 hours
reaction, cellulose fibers with bound CBD were removed by centrifugation at 3219 RCF for 10
minutes (Heraeus Megafuge 1.0R). The difference between the initial amount of CBD and that
of the supernatant allowed the calculation of the bound CBD, gained from the fluorescence
emission at 310 nm with an excitation of 275 nm.

Ricardo Pinto Production of CBDs and adsorption to cellulose fibres
37
Fluorescence microscopy observations were performed in a Zeiss AxiosKop microscope.
The images were acquired with a Zeiss AxioCam HRc camera and analyzed with the AxioVision
3.1 software.
Results and Discussion
Large scale production of CBDs
The main enzymes produced by Trichoderma reesei have an average size of
approximately 50 kDa, as obtained from Swiss-Prot database (Gasteiger et al. 2003). The
capillary electrophoresis analysis (Figure M1.1) of the Celluclast proteins provides an estimation
of the apparent molecular weight, of approximately 90 kDa, according to the calibration
performed with protein standards. This overestimation may be due to the glycosidic moiety of
the enzymes, which may affect the migration time by changing the overall protein charge (Leach
et al. 1980; Legaz et al. 1998). These authors showed that the glycosidic moiety may increase the
negative charge of an anionic protein, since the hydroxyl groups in the sugar structure behave as
weak acids. Consequently, migration of glycosilated proteins in CE is affected by the glycosidic
moiety, therefore this technique herein used to monitor, qualitatively, the relative size of the
peptides obtained by papain proteolysis.
The proteolysis of Celluclast using several dilutions of the activated papain was
performed. As can be seen in the electropherogram shown in Figure M1.2, heavier loads of
papain results in a more dramatic reduction of the main peak corresponding to higher molecular
weight proteins, with the concomitant increase of the peaks corresponding to lower molecular
weight material. Based on these studies, the relative amounts of papain/cellulase were selected
for the production of CBDs (1 g of activated papain for each 1200 g of protein in the 30 kDa
ultrafiltered Celluclast). With higher papain concentration, hydrolysis is too extensive. The
production of a mixture of fragments with low molecular weight was avoided, using the selected
concentration of papain, as it is shown ahead. Finally, the electropherogram obtained with the
purified CBDs (Figure M1.1) reveals a low molecular weight peptide, with no apparent
contamination from higher molecular weight material. Again, the migration time of this peptide
was higher than the expected for a CBD, corresponding to a mass of about 20-30 kDa. This high
apparent molecular weight may be explained by the glycosidic moiety present on the linker (rich
in threonin and serine residues), since CBD has no potencial sites for glycosylation (Harrison et
al. 1998; Hui et al. 2001). Indeed, the obtained peptide have 30% (w/w) of carbohydrates, as
Ricardo Pinto Production of CBDs and adsorption to cellulose fibres
38
determined by total sugars analysis, with a monosaccharide composition of 85% mannose, 12%
galactose and minor amounts of other sugars, as determined by GC.
The MALDI-TOF analysis of the purified CBD is shown in Figure M1.3. The sample is
highly micro-heterogeneous in size, a main peak being detected at 8.43 kDa. The several satellite
peaks have an almost constant difference from one another of 162(±1) mass units (8106, 8267,
8430, 8591, 8755, 8917, 9080 Da) that presumably arises from differential glycosilation
(Letourneur et al. 2001; Hui et al. 2001). A lower molecular weight group of peaks, at 4.21 kDa,
corresponds to the same peptide, with a charge of +2. Indeed, a series of peaks with half the mass
of the ones listed above are detected (4053, 4134, 4215, 4296, 4379, 4459, 4539, 4622 Da), with
a difference between peaks of 81(±1) mass units. This pattern, in our view, can be attributed only
to a protein with heterogeneous glycosilation. The concentration of fragments with a very narrow
size distribution (from 8 to 9 kDa) means that proteolysis was quite mild, otherwise a scattered
size distribution of low molecular weight peptides would be observed, in spite of the fact that
papain is a proteolytic enzyme with a broad specificity (Price and Johnson 1990). The MALDI
spectra furthermore suggests (as demonstrated ahead by sequential analysis) that the peptide is
highly pure, since no high molecular weight peaks were detected.
Proteolysis of Celluclast allowed the production of over 2 g of CBD, starting from 50 g
of protein. This material was further purified by ion exchange chromatography. The obtained
chromatogram revealed a mais peak of non-adsorbed material (uncharged, corresponding to
CBDs) and a second peak, eluted with a NaCl gradient, corresponding to charged material
(cellulases and catalic domains with acidic pI). To further characterize this purified peptides, the
fluorescence spectra of the CBD samples were analyzed, before and after ion exchange
chromatography. Tyrosine and tryptophan residues have a maximum emission at, respectively,
305 and 340 nm. According to spectra in Figure M1.4, the chromatography step removed a
substantial part of the tryptophan residues present in the solution. The CDB from
cellobiohidrolase I (CBHI) is, among the enzymes produced by Trichoderma reesei, the only one
missing tryptophan (Kraulis et al. 1989; Gasteiger et al. 2003). Consequently, it appears that the
CBDs obtained are mostly from CBHI, as expected, since this is the most abundant enzyme
secreted from T. reesei. N-terminal sequence analysis confirms this hypothesis. Indeed, the
sequence obtained, GNPPG, is present only in CBHI, between the catalytic domain and the
linker (Gasteiger et al. 2003). Since the isolated peptides are produced by papain cleavage, the
presence of N-terminal blocked peptides in the mixture is rather unlikely. Thus, the result in
Figure M1.5 demonstrates that the CBD purified by Ion Exchange chromatography is rather
pure, since only one amino acid is released in each step of the N-terminal sequence analysis.
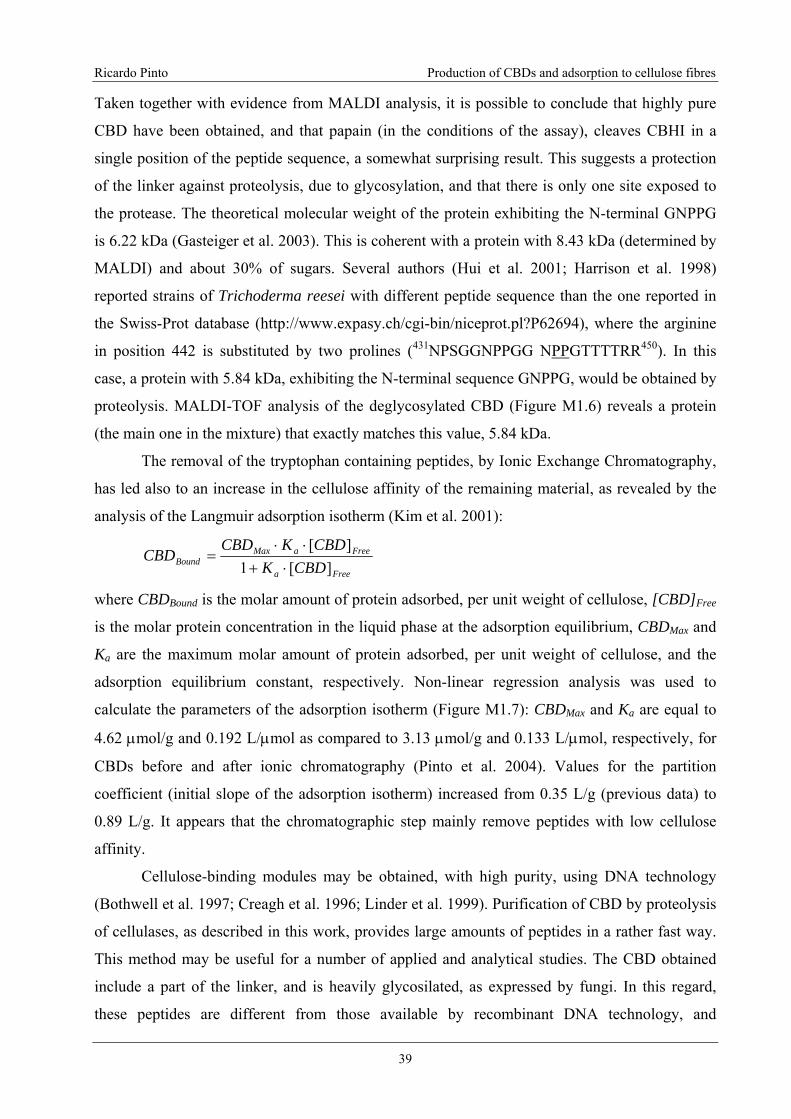
Ricardo Pinto Production of CBDs and adsorption to cellulose fibres
39
Taken together with evidence from MALDI analysis, it is possible to conclude that highly pure
CBD have been obtained, and that papain (in the conditions of the assay), cleaves CBHI in a
single position of the peptide sequence, a somewhat surprising result. This suggests a protection
of the linker against proteolysis, due to glycosylation, and that there is only one site exposed to
the protease. The theoretical molecular weight of the protein exhibiting the N-terminal GNPPG
is 6.22 kDa (Gasteiger et al. 2003). This is coherent with a protein with 8.43 kDa (determined by
MALDI) and about 30% of sugars. Several authors (Hui et al. 2001; Harrison et al. 1998)
reported strains of Trichoderma reesei with different peptide sequence than the one reported in
the Swiss-Prot database (http://www.expasy.ch/cgi-bin/niceprot.pl?P62694), where the arginine
in position 442 is substituted by two prolines (431NPSGGNPPGG NPPGTTTTRR450). In this
case, a protein with 5.84 kDa, exhibiting the N-terminal sequence GNPPG, would be obtained by
proteolysis. MALDI-TOF analysis of the deglycosylated CBD (Figure M1.6) reveals a protein
(the main one in the mixture) that exactly matches this value, 5.84 kDa.
The removal of the tryptophan containing peptides, by Ionic Exchange Chromatography,
has led also to an increase in the cellulose affinity of the remaining material, as revealed by the
analysis of the Langmuir adsorption isotherm (Kim et al. 2001):
Freea
FreeaMaxBound CBDK
CBDKCBDCBD
][1][
⋅+⋅⋅
=
where CBDBound is the molar amount of protein adsorbed, per unit weight of cellulose, [CBD]Free
is the molar protein concentration in the liquid phase at the adsorption equilibrium, CBDMax and
Ka are the maximum molar amount of protein adsorbed, per unit weight of cellulose, and the
adsorption equilibrium constant, respectively. Non-linear regression analysis was used to
calculate the parameters of the adsorption isotherm (Figure M1.7): CBDMax and Ka are equal to
4.62 μmol/g and 0.192 L/μmol as compared to 3.13 μmol/g and 0.133 L/μmol, respectively, for
CBDs before and after ionic chromatography (Pinto et al. 2004). Values for the partition
coefficient (initial slope of the adsorption isotherm) increased from 0.35 L/g (previous data) to
0.89 L/g. It appears that the chromatographic step mainly remove peptides with low cellulose
affinity.
Cellulose-binding modules may be obtained, with high purity, using DNA technology
(Bothwell et al. 1997; Creagh et al. 1996; Linder et al. 1999). Purification of CBD by proteolysis
of cellulases, as described in this work, provides large amounts of peptides in a rather fast way.
This method may be useful for a number of applied and analytical studies. The CBD obtained
include a part of the linker, and is heavily glycosilated, as expressed by fungi. In this regard,
these peptides are different from those available by recombinant DNA technology, and
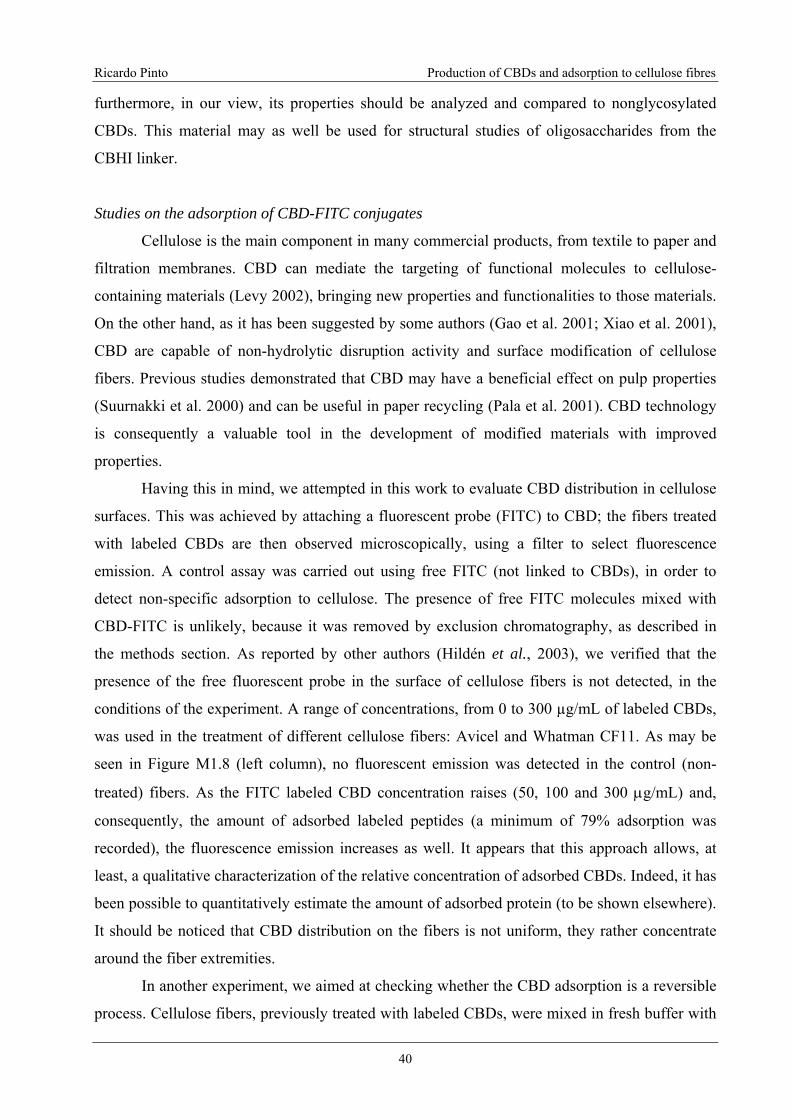
Ricardo Pinto Production of CBDs and adsorption to cellulose fibres
40
furthermore, in our view, its properties should be analyzed and compared to nonglycosylated
CBDs. This material may as well be used for structural studies of oligosaccharides from the
CBHI linker.
Studies on the adsorption of CBD-FITC conjugates
Cellulose is the main component in many commercial products, from textile to paper and
filtration membranes. CBD can mediate the targeting of functional molecules to cellulose-
containing materials (Levy 2002), bringing new properties and functionalities to those materials.
On the other hand, as it has been suggested by some authors (Gao et al. 2001; Xiao et al. 2001),
CBD are capable of non-hydrolytic disruption activity and surface modification of cellulose
fibers. Previous studies demonstrated that CBD may have a beneficial effect on pulp properties
(Suurnakki et al. 2000) and can be useful in paper recycling (Pala et al. 2001). CBD technology
is consequently a valuable tool in the development of modified materials with improved
properties.
Having this in mind, we attempted in this work to evaluate CBD distribution in cellulose
surfaces. This was achieved by attaching a fluorescent probe (FITC) to CBD; the fibers treated
with labeled CBDs are then observed microscopically, using a filter to select fluorescence
emission. A control assay was carried out using free FITC (not linked to CBDs), in order to
detect non-specific adsorption to cellulose. The presence of free FITC molecules mixed with
CBD-FITC is unlikely, because it was removed by exclusion chromatography, as described in
the methods section. As reported by other authors (Hildén et al., 2003), we verified that the
presence of the free fluorescent probe in the surface of cellulose fibers is not detected, in the
conditions of the experiment. A range of concentrations, from 0 to 300 µg/mL of labeled CBDs,
was used in the treatment of different cellulose fibers: Avicel and Whatman CF11. As may be
seen in Figure M1.8 (left column), no fluorescent emission was detected in the control (non-
treated) fibers. As the FITC labeled CBD concentration raises (50, 100 and 300 μg/mL) and,
consequently, the amount of adsorbed labeled peptides (a minimum of 79% adsorption was
recorded), the fluorescence emission increases as well. It appears that this approach allows, at
least, a qualitative characterization of the relative concentration of adsorbed CBDs. Indeed, it has
been possible to quantitatively estimate the amount of adsorbed protein (to be shown elsewhere).
It should be noticed that CBD distribution on the fibers is not uniform, they rather concentrate
around the fiber extremities.
In another experiment, we aimed at checking whether the CBD adsorption is a reversible
process. Cellulose fibers, previously treated with labeled CBDs, were mixed in fresh buffer with
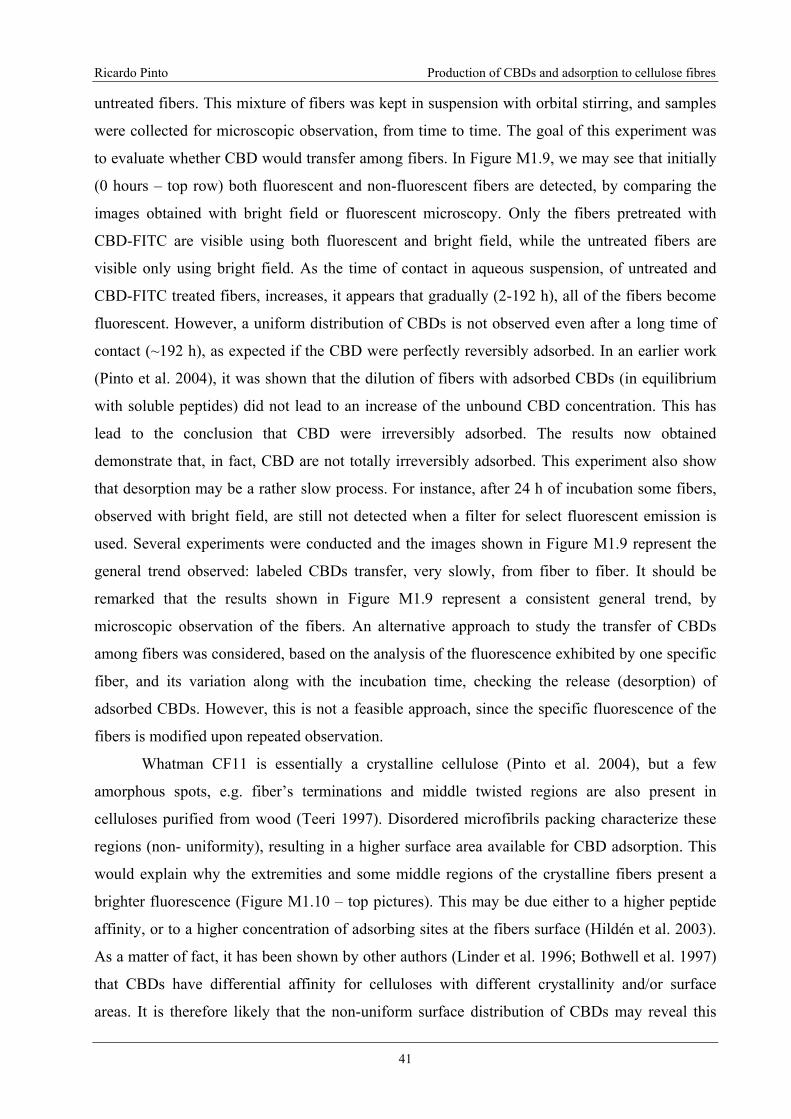
Ricardo Pinto Production of CBDs and adsorption to cellulose fibres
41
untreated fibers. This mixture of fibers was kept in suspension with orbital stirring, and samples
were collected for microscopic observation, from time to time. The goal of this experiment was
to evaluate whether CBD would transfer among fibers. In Figure M1.9, we may see that initially
(0 hours – top row) both fluorescent and non-fluorescent fibers are detected, by comparing the
images obtained with bright field or fluorescent microscopy. Only the fibers pretreated with
CBD-FITC are visible using both fluorescent and bright field, while the untreated fibers are
visible only using bright field. As the time of contact in aqueous suspension, of untreated and
CBD-FITC treated fibers, increases, it appears that gradually (2-192 h), all of the fibers become
fluorescent. However, a uniform distribution of CBDs is not observed even after a long time of
contact (~192 h), as expected if the CBD were perfectly reversibly adsorbed. In an earlier work
(Pinto et al. 2004), it was shown that the dilution of fibers with adsorbed CBDs (in equilibrium
with soluble peptides) did not lead to an increase of the unbound CBD concentration. This has
lead to the conclusion that CBD were irreversibly adsorbed. The results now obtained
demonstrate that, in fact, CBD are not totally irreversibly adsorbed. This experiment also show
that desorption may be a rather slow process. For instance, after 24 h of incubation some fibers,
observed with bright field, are still not detected when a filter for select fluorescent emission is
used. Several experiments were conducted and the images shown in Figure M1.9 represent the
general trend observed: labeled CBDs transfer, very slowly, from fiber to fiber. It should be
remarked that the results shown in Figure M1.9 represent a consistent general trend, by
microscopic observation of the fibers. An alternative approach to study the transfer of CBDs
among fibers was considered, based on the analysis of the fluorescence exhibited by one specific
fiber, and its variation along with the incubation time, checking the release (desorption) of
adsorbed CBDs. However, this is not a feasible approach, since the specific fluorescence of the
fibers is modified upon repeated observation.
Whatman CF11 is essentially a crystalline cellulose (Pinto et al. 2004), but a few
amorphous spots, e.g. fiber’s terminations and middle twisted regions are also present in
celluloses purified from wood (Teeri 1997). Disordered microfibrils packing characterize these
regions (non- uniformity), resulting in a higher surface area available for CBD adsorption. This
would explain why the extremities and some middle regions of the crystalline fibers present a
brighter fluorescence (Figure M1.10 – top pictures). This may be due either to a higher peptide
affinity, or to a higher concentration of adsorbing sites at the fibers surface (Hildén et al. 2003).
As a matter of fact, it has been shown by other authors (Linder et al. 1996; Bothwell et al. 1997)
that CBDs have differential affinity for celluloses with different crystallinity and/or surface
areas. It is therefore likely that the non-uniform surface distribution of CBDs may reveal this
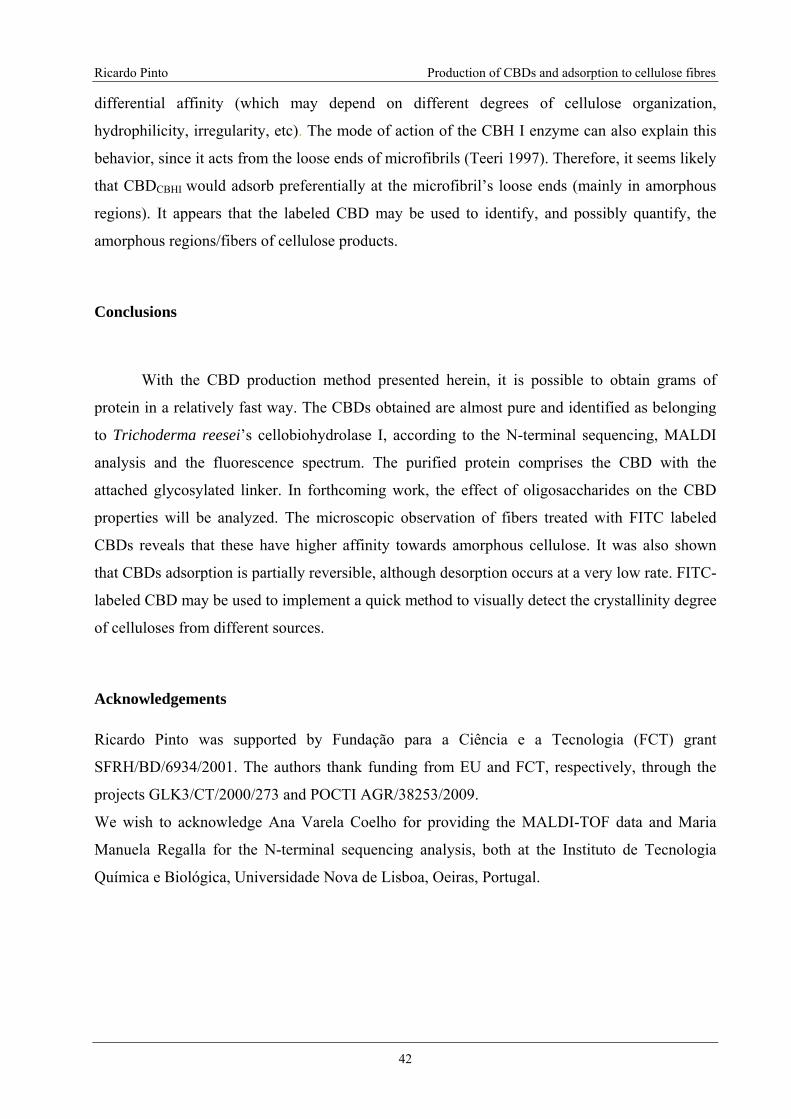
Ricardo Pinto Production of CBDs and adsorption to cellulose fibres
42
differential affinity (which may depend on different degrees of cellulose organization,
hydrophilicity, irregularity, etc). The mode of action of the CBH I enzyme can also explain this
behavior, since it acts from the loose ends of microfibrils (Teeri 1997). Therefore, it seems likely
that CBDCBHI would adsorb preferentially at the microfibril’s loose ends (mainly in amorphous
regions). It appears that the labeled CBD may be used to identify, and possibly quantify, the
amorphous regions/fibers of cellulose products.
Conclusions
With the CBD production method presented herein, it is possible to obtain grams of
protein in a relatively fast way. The CBDs obtained are almost pure and identified as belonging
to Trichoderma reesei’s cellobiohydrolase I, according to the N-terminal sequencing, MALDI
analysis and the fluorescence spectrum. The purified protein comprises the CBD with the
attached glycosylated linker. In forthcoming work, the effect of oligosaccharides on the CBD
properties will be analyzed. The microscopic observation of fibers treated with FITC labeled
CBDs reveals that these have higher affinity towards amorphous cellulose. It was also shown
that CBDs adsorption is partially reversible, although desorption occurs at a very low rate. FITC-
labeled CBD may be used to implement a quick method to visually detect the crystallinity degree
of celluloses from different sources.
Acknowledgements
Ricardo Pinto was supported by Fundação para a Ciência e a Tecnologia (FCT) grant
SFRH/BD/6934/2001. The authors thank funding from EU and FCT, respectively, through the
projects GLK3/CT/2000/273 and POCTI AGR/38253/2009.
We wish to acknowledge Ana Varela Coelho for providing the MALDI-TOF data and Maria
Manuela Regalla for the N-terminal sequencing analysis, both at the Instituto de Tecnologia
Química e Biológica, Universidade Nova de Lisboa, Oeiras, Portugal.

Ricardo Pinto Production of CBDs and adsorption to cellulose fibres
43
Bibliography
Blakeney A.B., Harris P.J., Henry R.J. and Stone B.A. 1983. A simple and rapid preparation of
alditol acetates for monosaccharide analysis. Carbohydr Res 113: 291–299.
Bothwell M. K., Daughhetee S. D., Chaua G. Y., Wilson D. B. and Walker L. P. 1997. Binding
capacities for Thermomonospora fusca E3, E4 and E5, the E3 binding domain, and Thichoderma
reesei CBHI on avicel and bacterial microcrystalline cellulose. Bioresource Tech 60: 169–178.
Carrard G. and Linder M. 1999. Widely different off rates of two closely related cellulose-
binding domains from Trichoderma reesei. Eur J Biochem 262: 637–643.
Carrard G., Koivula A., Söderlund H. and Béguin P. 2000. Cellulose-binding domains promote
hydrolysis of different sites on crystalline cellulose. PNAS 97: 10342–10347.
Creagh A., Ong E., Jervis E., Kilburn D. Haynes C. 1996. Binding of the cellulose-binding
domain of exoglucanase Cex from Cellulomonas fimi to insoluble microcrystalline cellulose is
entropically driven. Proc Natl Acad Sci USA 93: 12229–12234.
Dubois M., Gilles K. A., Hamilton J. K., Rebers P. A., Smith F. 1956. Colorimetric method for
determination of sugars and related substances. Analyt Chem 28: 350–356.
Edge A.S.B., Connie R.F., Hof L., Reichert L.E. and Weber P. 1981. Deglycosylation of
glycoproteins by trifluoromethanesulfonic acid. Anal Biochem 118: 131–137.
Gao P.-J., Chen G.-J., Wang T.-H., Zhang Y.-S. and Liu J. 2001. Non-hydrolytic disruption of
crystalline structure of cellulose by cellulose binding domain and linker sequence of
cellobiohydrolase I from Penicillium janthinellum. Acta Biochimica et Biophysica Sinica 33:
13–18.
Gasteiger E., Gattiker A., Hoogland C., Ivanyi I., Appel R.D. and Bairoch A. 2003. ExPASy: the
proteomics server for in-depth protein knowledge and analysis. Nucleic Acids Res 31: 3784–
3788.

Ricardo Pinto Production of CBDs and adsorption to cellulose fibres
44
Harris P.J., Blakeney A.B., Henry R.J. and Stone B.A. 1988. Gas chromatographic determination
of the monosaccharide composition of plant cell wall preparations. J Assoc Off Anal Chem 71:
272–275.
Harrison M.J., Nouwens A.S., Jardine D.R., Zachara N.E., Gooley A.A., Nevalainen H. and
Packer N.H. 1998. Modified glycosylation of cellobiohydrolase I from a high cellulase-
producing mutant strain of Trichoderma reesei. Eur. J. Biochem. 256: 119–127.
Harrison M.J., Wathugala I.M., Tenkanen M., Packer N.H. and Nevalainen K.M.H 2002.
Glycosylation of acetylxylan esterase from Trichoderma reesei. Glycobiol 12: 291–298.
Hildén L., Daniel G. and Johansson G. 2003. Use of a fluorescence labelled, carbohydrate-
binding module from Phanerochaete chrysosporium Cel7D for studying wood cell wall
ultrastructure. Biotech Lett 25: 553–558.
Hui J.P.M., Lanthier P., White T.C., McHugh S.G., Yaguchi M., Roy R. and Thibault P, 2001.
Characterization of cellobiohydrolase I (Cel7A) glycoforms from extracts of Trichoderma reesei
using capillary isoelectric focusing and electrospray mass spectrometry. J Chromatogr B 752:
349–368.
Kim D. W., Jang Y. H., Kim C. S. and Lee N.-S. 2001. Effect of metal ions on the degradation
and adsorption of two cellobiohydrolases on microcrystalline cellulose. Bull Korean Chem Soc
22: 716–720.
Kraulis P.J., Clare G.M., Nilges M., Jones T.A., Pettersson G., Knowles J. and Gronenborn
A.M. 1989. Determination of the three-dimensional solution structure of the C-terminal domain
of cellobiohydrolase I from Trichoderma reesei. A study using nuclear magnetic resonance and
hybrid distance geometry-dynamical simulated annealing. Biochemistry 28: 7241–7257.
Leach B. S., Collawn J. F. and Fish W. W. 1980. Behavior of glycopeptides with empirical
molecular weight estimation methods. Biochemistry 19: 5734–5741.

Ricardo Pinto Production of CBDs and adsorption to cellulose fibres
45
Legaz M.E., Pedrosa M.M., Armas R., Rodríguez C.W., Rios V. and Vicente C. 1998.
Separation of soluble glycoproteins from sugarcane juice by capillary electrophoresis. Anal
Chim Acta 372: 201–208.
Lemos M.A., Teixeira J.A., Mota M. and Gama F.M. 2000. A simple method to separate
cellulose-binding domains of fungal cellulases after digestion by a protease. Biotech Lett 22:
703–707.
Letourneur O., Gervasi G., Gaia S., Pages J., Watelet B. and Jolivet M. 2001. Characterization of
Toxoplasma gondii surface antigen 1 (SAG1) secreted from Pichia pastoris: evidence of hyper
O-glycosylation. Biotechnol Appl Biochem 33: 35–45.
Levy I., Shani Z. and Shoseyov O. 2002. Modification of polysaccharides and plant cell wall by
endo-1,4-β-glucanase and cellulose-binding domains. Biomol Eng 19: 17–30.
Linder M., Salovuori I., Ruohonen L. and Teeri T.T. 1996. Characterization of a Double
Cellulose-binding Domain. Synergistic High Affinity Binding To Crystalline Cellulose. J Biol
Chem 271: 21268–21272.
Linder I., Nevanen T. and Teeri T.T. 1999. Design of a pH-dependent cellulose-binding domain.
FEBS Lett 447: 13–16.
Mattinen M.-L., Linder M., Teleman A. and Annila A. 1997. Interaction between cellohexaose
and cellulose binding domains from Trichoderma reesei cellulases. FEBS Lett 407: 291–296.
Pala H., Lemos M.A., Mota M. and Gama F.M. 2001. Enzymatic upgrade of old paperboard
containers. Enzyme Microb Technol 29: 274–279.
Pinto R., Moreira S., Mota M. and Gama M. 2004. Studies on the cellulose-binding domains
adsorption to cellulose. Langmuir 20: 1409–1413.
Price N.C., Johnson C.M. 1990. Proteinases as probes of conformation of soluble proteins. In
R.J. Beynon and Bond J.S (eds.) Proteolytic enzymes: A practical approach. IRL Press, Oxford,
pp. 163–180.
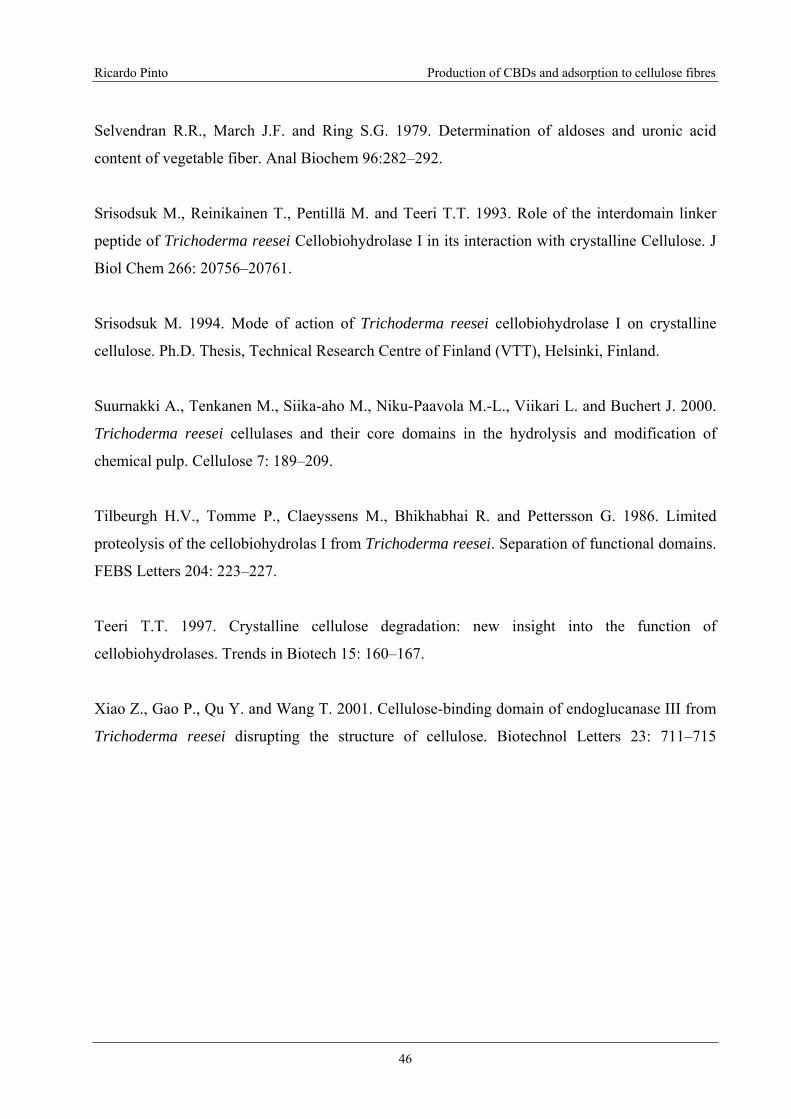
Ricardo Pinto Production of CBDs and adsorption to cellulose fibres
46
Selvendran R.R., March J.F. and Ring S.G. 1979. Determination of aldoses and uronic acid
content of vegetable fiber. Anal Biochem 96:282–292.
Srisodsuk M., Reinikainen T., Pentillä M. and Teeri T.T. 1993. Role of the interdomain linker
peptide of Trichoderma reesei Cellobiohydrolase I in its interaction with crystalline Cellulose. J
Biol Chem 266: 20756–20761.
Srisodsuk M. 1994. Mode of action of Trichoderma reesei cellobiohydrolase I on crystalline
cellulose. Ph.D. Thesis, Technical Research Centre of Finland (VTT), Helsinki, Finland.
Suurnakki A., Tenkanen M., Siika-aho M., Niku-Paavola M.-L., Viikari L. and Buchert J. 2000.
Trichoderma reesei cellulases and their core domains in the hydrolysis and modification of
chemical pulp. Cellulose 7: 189–209.
Tilbeurgh H.V., Tomme P., Claeyssens M., Bhikhabhai R. and Pettersson G. 1986. Limited
proteolysis of the cellobiohydrolas I from Trichoderma reesei. Separation of functional domains.
FEBS Letters 204: 223–227.
Teeri T.T. 1997. Crystalline cellulose degradation: new insight into the function of
cellobiohydrolases. Trends in Biotech 15: 160–167.
Xiao Z., Gao P., Qu Y. and Wang T. 2001. Cellulose-binding domain of endoglucanase III from
Trichoderma reesei disrupting the structure of cellulose. Biotechnol Letters 23: 711–715

Ricardo Pinto Production of CBDs and adsorption to cellulose fibres
47
Figures
Figure M1.1. Electropherogram of Celluclast (Cell.), hydrolyzed Celluclast (Hyd. Cell.) and
Cellulose-Binding Domains (CBD). Both time and signal are normalized.

Ricardo Pinto Production of CBDs and adsorption to cellulose fibres
48
Figure M1.2. Electropherogram of Celluclast hydrolyzed with different amounts of papain by
protein weight (the dilution factor of the commercial enzyme is shown). Time is
normalized.
Figure M1.3. MALDI-TOF analysis of the purified CBD peptides.

Ricardo Pinto Production of CBDs and adsorption to cellulose fibres
49
Figure M1.4. Fluorescence Spectrums of CBD after ultra filtration and the subsequent Ion
Exchange purification. Signals are normalized to the highest value obtained on each
measurement.
Figure M1.5. Chromatogram of the first amino acid detected on the N-terminal peptide
sequencing of the purified CBD. This chromatogram reveals that the isolated CBD is rather
pure.
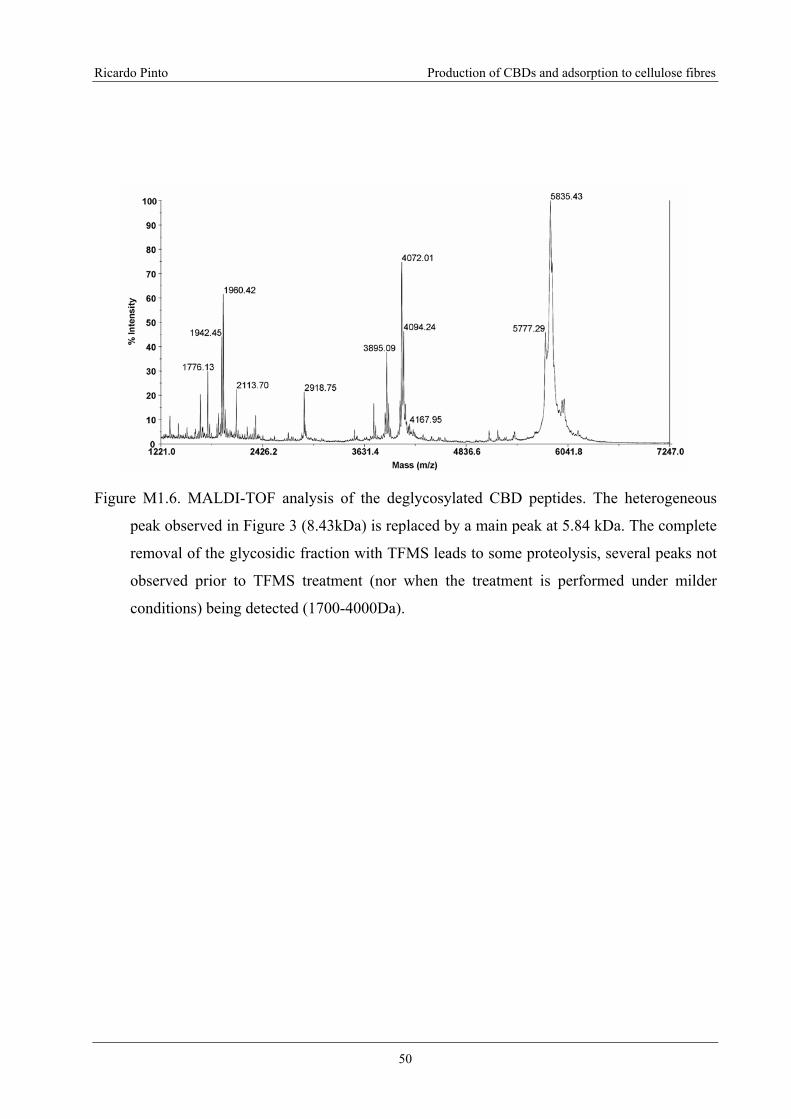
Ricardo Pinto Production of CBDs and adsorption to cellulose fibres
50
Figure M1.6. MALDI-TOF analysis of the deglycosylated CBD peptides. The heterogeneous
peak observed in Figure 3 (8.43kDa) is replaced by a main peak at 5.84 kDa. The complete
removal of the glycosidic fraction with TFMS leads to some proteolysis, several peaks not
observed prior to TFMS treatment (nor when the treatment is performed under milder
conditions) being detected (1700-4000Da).
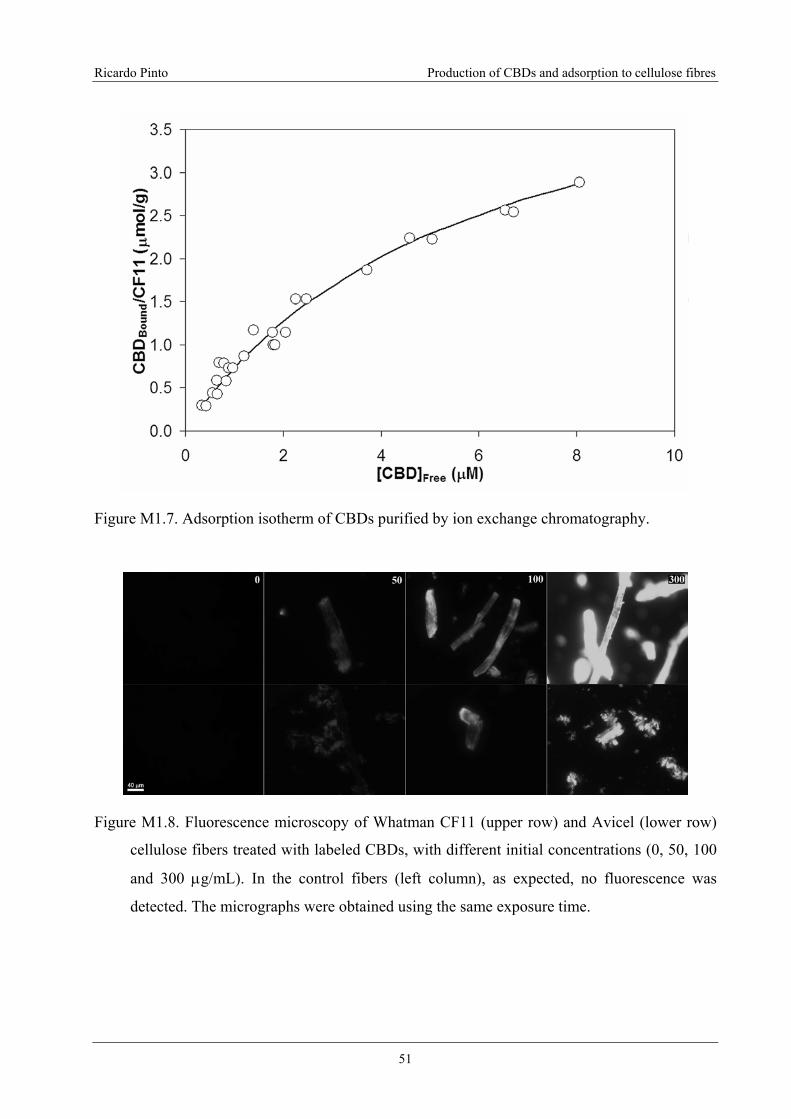
Ricardo Pinto Production of CBDs and adsorption to cellulose fibres
51
Figure M1.7. Adsorption isotherm of CBDs purified by ion exchange chromatography.
Figure M1.8. Fluorescence microscopy of Whatman CF11 (upper row) and Avicel (lower row)
cellulose fibers treated with labeled CBDs, with different initial concentrations (0, 50, 100
and 300 μg/mL). In the control fibers (left column), as expected, no fluorescence was
detected. The micrographs were obtained using the same exposure time.

Ricardo Pinto Production of CBDs and adsorption to cellulose fibres
52
Figure M1.9. Images of a mixture of treated and untreated CF11 cellulose fibers with labeled
CBD, under fluorescent (first and third column) and bright field (second and fourth
column) microscopy, with 400 milliseconds of exposure time, put in contact for 0, 24, 48,
98 and 192 hours.
Ricardo Pinto Production of CBDs and adsorption to cellulose fibres
53
Figure M1.10. Comparison of the crystalline (top row) and phosphoric acid swollen (amorphous
– bottom row) Whatman CF11 fibers, both treated with FITC-labeled CBD, at bright field
(left) and fluorescent (right) microscopy. The probably amorphous sites of the microfibril
(left side of the upper images) have attracted more FITC-labeled CBD.

Ricardo Pinto Production of CBDs and adsorption to cellulose fibres
54
M2. Development of a method using image analysis and CBD-FITC
conjugates for the measurement of CBDs adsorbed onto
cellulose fibers
(Submitted to Journal of Biotechnology)
Ricardo Pinto1, António Luís Amaral1,2, Joana Carvalho1, Eugénio Campos Ferreira1,
Manuel Mota1, Miguel Gama1,*
1Centro de Engenharia Biológica, Universidade do Minho
4710-057 Braga, Portugal. 2Departamento de Tecnologia Química, ESTIG, IPB
Apartado 1038, 5301-854 Bragança, Portugal.
*e-mail: [email protected]; phone: +351253604400; fax: +351253678986.
Abstract
The surface concentration of CBD-FITC conjugates, adsorbed on cellulose fibers, was
determined by image analysis. The program consists of two scripts, the first dedicated to the
elaboration of the calibration curve. The emission of fluorescent light, detected by image
analysis, is correlated with the concentration of CBD solutions. This calibration is then used
(second script) to determine the concentration of CBDs adsorbed on cellulosic fibers. This
method allows the direct estimation of the surface concentration of adsorbed CBDs, which
usually is not accurately calculated from depletion studies, since the surface area is hardly
known. By observing different spots in the surface of the fibers, site specific information is
obtained. It was verified that the physically heterogeneous fibers exhibit different amounts of
adsorbed CBDs.
Keywords: Cellulose-binding domain, fluorescein, adsorption, cellulose, fiber
Ricardo Pinto Production of CBDs and adsorption to cellulose fibres
55
Abbreviations: AFM, atomic force microscopy; BSA, bovine serum albumin; CBD, cellulose-
binding domain; CBHI, cellobiohydrolases I; f, sensitivity factor; FITC, fluorescein
isothiocyanate; HEPES, 4-(2-hydroxyethyl)-1-piperazineethanesulfonic acid; I, fluorescence
intensity; IA, acquired fluorescence intensity; I0, initial fluorescence intensity; Kd,
photobleaching constant; t, time
Introduction
The majority of cellulases has a modular assembly, formed by a catalytic domain, a
Cellulose-Binding Domain (CBD) and a highly glycosilated linker (Srisodsuk et al., 1993).
CBDs have the ability of enhancing the enzyme catalytic activity, by increasing its concentration
on the insoluble cellulose surface (Black et al., 1997; Limón et al., 2001; Sridsodsuk M., 1994).
The CBD from Cellobiohydrolase I (Trichoderma reesei) has an amino acid sequence that
includes three aromatic residues (tyrosine) which seem to be implicated in the adsorption to
cellulose (Mattinen et al., 1997). Carrard et al. (2000) showed that different CBDs adsorb to
different sites on the surface of crystalline cellulose. The direct measurement of CBDs adsorbed
on fibers with different properties, such as crystallinity or surface area, would therefore be very
useful in the characterization of biochemical properties of CBDs.
Pala et al. (2001) showed that the presence of CBD, during paper production, modified
the technological properties of the pulp and paper. In the present work, having in mind its
biotechnological relevance, we aim at quantifying the CBD adsorbed on cellulosic surfaces, with
the help of the fluorescent complex CBD-FITC. The use of image analysis methodologies was
then validated as a means to quantify the adsorbed CBD-FITC.
Image processing and analysis techniques have been shown to be an extremely useful tool
in a vast number of applications, since they allow the elimination of human analysis subjectivity
and also the extraction of quantitative data that would be very difficult or even impossible to
acquire by other means. As a matter of fact, there is a stepwise increment in the use of image
analysis methodologies in processes that involve identification or even fluorescence
quantification, both in microorganisms and fluorescent probes (Wiersba et al., 1995; Levy,
2001).
Ricardo Pinto Production of CBDs and adsorption to cellulose fibres
56
Materials and Methods
Chemicals
Fluorescein isothiocyanate (FITC) was obtained from Sigma, cellulosic fibers CF11 from
Whatman (pure cellulose). All chemicals were of the highest purity available.
CBD Production
The CBDs were prepared according to the following methodology: the Celluclast®
commercial enzymatic preparation (Novozymes A/S, Denmark) was digested with Papain
(1:1200, on a protein basis). The resulting CBDs were separated by ultrafiltration through a 10
kDa membrane (Pellicon 2 TFF System from Millipore, USA) and concentrated by precipitation
with ammonium sulphate (Merck, Darmstadt, Germany). After dialysis, CBDs were further
purified on a Sepharose Fast-Flow gel (Amersham Pharmacia Biotech AB, Sweden); the non-
adsorbed protein (CBD) was collected and lyophilized. Although produced by proteolysis, the
obtained CBD is rather pure (Pinto et al., 2006). It is the CBD from Trichoderma reesei CBHI,
with a heavily glycosilated linker attached. The purity of this protein has been demonstrated by
N-terminal sequencing and MALDI-TOF.
CBD-FITC production
The conjugation of CBD with the labeling probe was carried out by mixing 20 µg of
FITC per mg of CBD (in a concentration of 2 mg protein/mL in 0.1 M HEPES buffer, pH 9.0).
This solution was incubated overnight in the dark, at room temperature, with magnetic stirring.
To eliminate the unbound FITC, the labeled CBD mixture was filtered through a column packed
with BIO-GEL P-4 (BIO-RAD, Hercules, USA), previously equilibrated with 50 mM sodium
acetate buffer (Panreac, Barcelona, Spain).
CBD Adsorption Isotherm
Suspensions of Whatman CF11 fibers, with a concentration of 10 mg per mL in Sodium
Acetate buffer (50 mM, pH 5.0), were incubated for 2 hours at 5ºC, with magnetic stirring, in the
presence of different CBD concentrations (CBDInitial, μmol·mL-1). The fibers were then
centrifuged at 4000 rpm for 10 minutes. The CBD concentration in the supernatant (CBDFree,
μmol·mL-1) was measured in a Jasco FP6200 spectrofluorimeter, operated at an emission and
excitation wavelengths of 341 and 275 nm, respectively. The apparatus was calibrated using

Ricardo Pinto Production of CBDs and adsorption to cellulose fibres
57
CBD solutions with known concentrations (BCA Protein Assay – Pierce – using BSA as protein
standard). The bound CBD (μmol·g-1) was calculated using the following equation:
[ ] [ ]R
CF
FreeInitialBound V
mCBDCBDCBD ⋅
−=
11
(1)
where VR (L) correspond to the volume of buffer used and mCF11 (g) the fibers mass.
The values of the adsorbed versus free CBDs where correlated, by non-linear regression
analysis, with the Langmuir adsorption isotherm (Kim et al., 2001):
Freea
FreeaMaxBound CBDk
CBDkCBDCBD⋅+
⋅⋅=
1 (2)
where CBDMax is the maximum molar amount of adsorbed protein (μmol·g-1) and ka the
adsorption equilibrium constant (μM-1).
Production of cellulose films and CBD Adsorption
Cellulose films were obtained by evaporation, on a glass surface, of a solution of
cellulose acetate in acetone. Then, the films were saponified in 0.1 M ethanolic solution of
sodium hydroxide, at 40 ºC, for 2 hours. After saponification, the films were rinsed in ultrapure
water.
AFM topography images (512×512 pixels) of a cellulose film were obtained in tapping
mode using a MultiMode™ SPM (Digital Instruments) apparatus.
Adsorption assays of FITC-labeled CBD were carried out at 4 ºC. The conjugates (400
μg·mL-1) were allowed to adsorb on the cellulose film (circles with ø 2 mm), in 50 mM sodium
acetate buffer (final volume of 4 mL), with continuous magnetic stirring, in the dark, for 2 hours.
The cellulose films with bound CBD were then washed with sodium acetate buffer, to remove
the non-adsorbed CBD-FITC.
Adsorption on a single side of the cellulose films was achieved by placing a drop of the
CBD-FITC solution on the surface of the film. After 30 minutes, the film was washed with
sodium acetate buffer and fluorescent images were taken from both sides, using an Axioskop
microscope (Zeiss, Oberkochen, Germany), with an AxioCam HRc attached camera (Zeiss,
Oberkochen, Germany). This experiment was carried out to compare the fluorescent intensity
observed, depending on whether the radiation has to cross (or not) the cellulose film (according
to the side of the film, with and without CBDs, exposed to the camera).
Image Analysis – Calibration
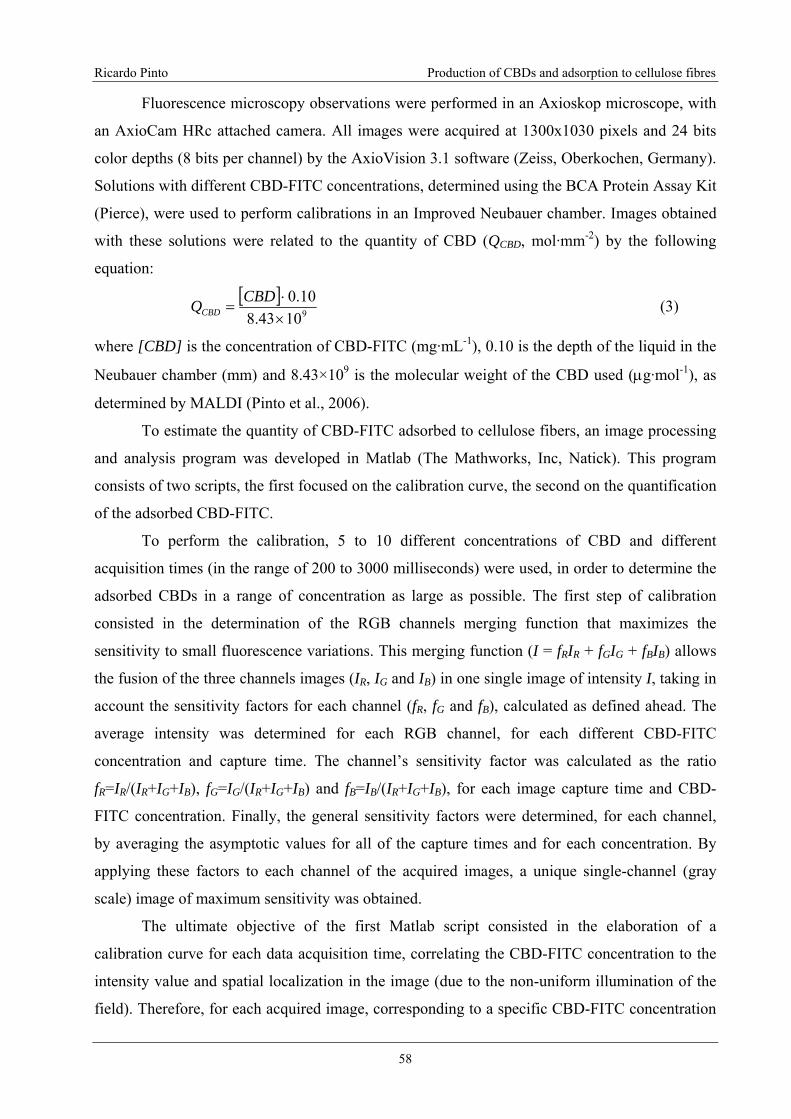
Ricardo Pinto Production of CBDs and adsorption to cellulose fibres
58
Fluorescence microscopy observations were performed in an Axioskop microscope, with
an AxioCam HRc attached camera. All images were acquired at 1300x1030 pixels and 24 bits
color depths (8 bits per channel) by the AxioVision 3.1 software (Zeiss, Oberkochen, Germany).
Solutions with different CBD-FITC concentrations, determined using the BCA Protein Assay Kit
(Pierce), were used to perform calibrations in an Improved Neubauer chamber. Images obtained
with these solutions were related to the quantity of CBD (QCBD, mol·mm-2) by the following
equation:
[ ]91043.810.0
×⋅
=CBDQCBD (3)
where [CBD] is the concentration of CBD-FITC (mg·mL-1), 0.10 is the depth of the liquid in the
Neubauer chamber (mm) and 8.43×10⁹ is the molecular weight of the CBD used (μg·mol-1), as
determined by MALDI (Pinto et al., 2006).
To estimate the quantity of CBD-FITC adsorbed to cellulose fibers, an image processing
and analysis program was developed in Matlab (The Mathworks, Inc, Natick). This program
consists of two scripts, the first focused on the calibration curve, the second on the quantification
of the adsorbed CBD-FITC.
To perform the calibration, 5 to 10 different concentrations of CBD and different
acquisition times (in the range of 200 to 3000 milliseconds) were used, in order to determine the
adsorbed CBDs in a range of concentration as large as possible. The first step of calibration
consisted in the determination of the RGB channels merging function that maximizes the
sensitivity to small fluorescence variations. This merging function (I = fRIR + fGIG + fBIB) allows
the fusion of the three channels images (IR, IG and IB) in one single image of intensity I, taking in
account the sensitivity factors for each channel (fR, fG and fB), calculated as defined ahead. The
average intensity was determined for each RGB channel, for each different CBD-FITC
concentration and capture time. The channel’s sensitivity factor was calculated as the ratio
fR=IR/(IR+IG+IB), fG=IG/(IR+IG+IB) and fB=IB/(IR+IG+IB), for each image capture time and CBD-
FITC concentration. Finally, the general sensitivity factors were determined, for each channel,
by averaging the asymptotic values for all of the capture times and for each concentration. By
applying these factors to each channel of the acquired images, a unique single-channel (gray
scale) image of maximum sensitivity was obtained.
The ultimate objective of the first Matlab script consisted in the elaboration of a
calibration curve for each data acquisition time, correlating the CBD-FITC concentration to the
intensity value and spatial localization in the image (due to the non-uniform illumination of the
field). Therefore, for each acquired image, corresponding to a specific CBD-FITC concentration
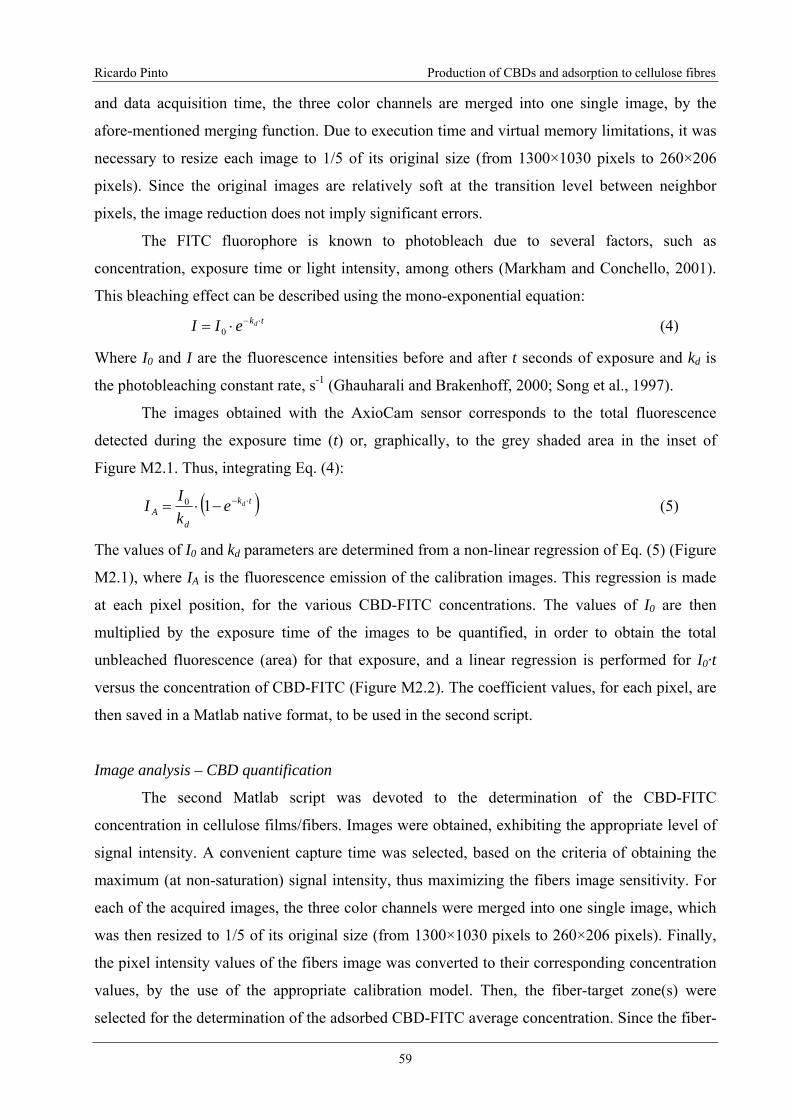
Ricardo Pinto Production of CBDs and adsorption to cellulose fibres
59
and data acquisition time, the three color channels are merged into one single image, by the
afore-mentioned merging function. Due to execution time and virtual memory limitations, it was
necessary to resize each image to 1/5 of its original size (from 1300×1030 pixels to 260×206
pixels). Since the original images are relatively soft at the transition level between neighbor
pixels, the image reduction does not imply significant errors.
The FITC fluorophore is known to photobleach due to several factors, such as
concentration, exposure time or light intensity, among others (Markham and Conchello, 2001).
This bleaching effect can be described using the mono-exponential equation: tkdeII ⋅−⋅= 0 (4)
Where I0 and I are the fluorescence intensities before and after t seconds of exposure and kd is
the photobleaching constant rate, s-1 (Ghauharali and Brakenhoff, 2000; Song et al., 1997).
The images obtained with the AxioCam sensor corresponds to the total fluorescence
detected during the exposure time (t) or, graphically, to the grey shaded area in the inset of
Figure M2.1. Thus, integrating Eq. (4):
( )tk
dA
dekII ⋅−−⋅= 10 (5)
The values of I0 and kd parameters are determined from a non-linear regression of Eq. (5) (Figure
M2.1), where IA is the fluorescence emission of the calibration images. This regression is made
at each pixel position, for the various CBD-FITC concentrations. The values of I0 are then
multiplied by the exposure time of the images to be quantified, in order to obtain the total
unbleached fluorescence (area) for that exposure, and a linear regression is performed for I0·t
versus the concentration of CBD-FITC (Figure M2.2). The coefficient values, for each pixel, are
then saved in a Matlab native format, to be used in the second script.
Image analysis – CBD quantification
The second Matlab script was devoted to the determination of the CBD-FITC
concentration in cellulose films/fibers. Images were obtained, exhibiting the appropriate level of
signal intensity. A convenient capture time was selected, based on the criteria of obtaining the
maximum (at non-saturation) signal intensity, thus maximizing the fibers image sensitivity. For
each of the acquired images, the three color channels were merged into one single image, which
was then resized to 1/5 of its original size (from 1300×1030 pixels to 260×206 pixels). Finally,
the pixel intensity values of the fibers image was converted to their corresponding concentration
values, by the use of the appropriate calibration model. Then, the fiber-target zone(s) were
selected for the determination of the adsorbed CBD-FITC average concentration. Since the fiber-
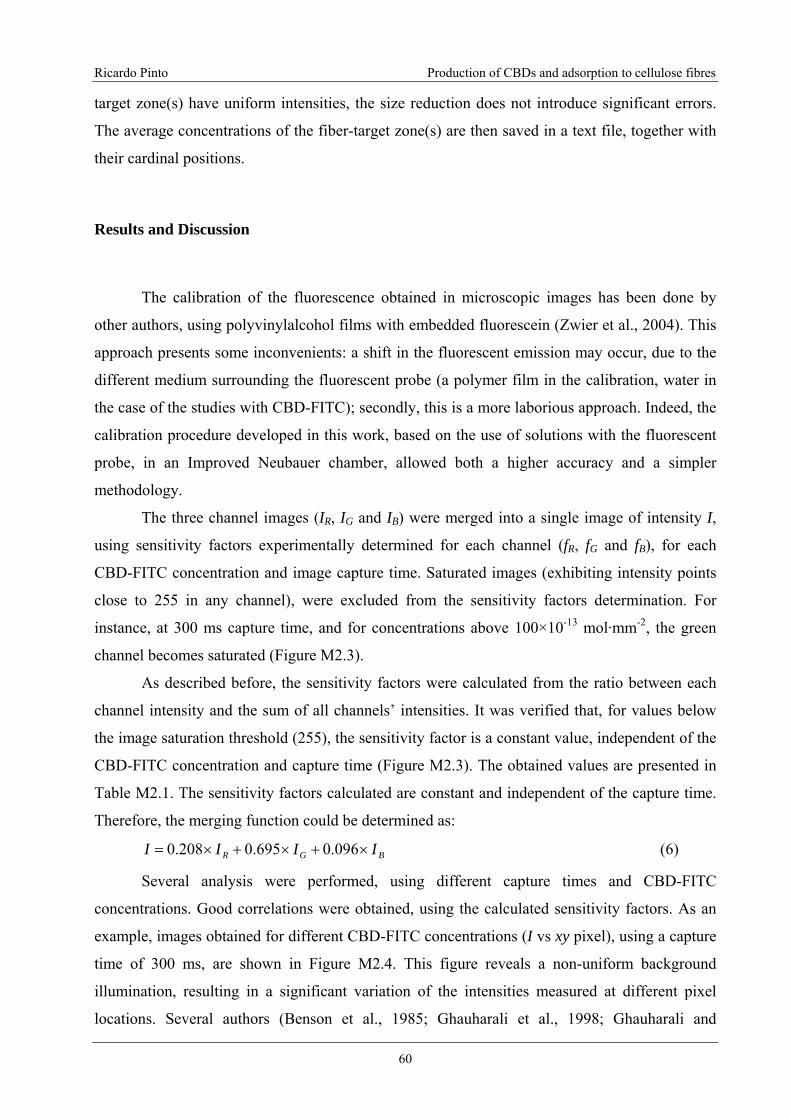
Ricardo Pinto Production of CBDs and adsorption to cellulose fibres
60
target zone(s) have uniform intensities, the size reduction does not introduce significant errors.
The average concentrations of the fiber-target zone(s) are then saved in a text file, together with
their cardinal positions.
Results and Discussion
The calibration of the fluorescence obtained in microscopic images has been done by
other authors, using polyvinylalcohol films with embedded fluorescein (Zwier et al., 2004). This
approach presents some inconvenients: a shift in the fluorescent emission may occur, due to the
different medium surrounding the fluorescent probe (a polymer film in the calibration, water in
the case of the studies with CBD-FITC); secondly, this is a more laborious approach. Indeed, the
calibration procedure developed in this work, based on the use of solutions with the fluorescent
probe, in an Improved Neubauer chamber, allowed both a higher accuracy and a simpler
methodology.
The three channel images (IR, IG and IB) were merged into a single image of intensity I,
using sensitivity factors experimentally determined for each channel (fR, fG and fB), for each
CBD-FITC concentration and image capture time. Saturated images (exhibiting intensity points
close to 255 in any channel), were excluded from the sensitivity factors determination. For
instance, at 300 ms capture time, and for concentrations above 100×10-13 mol·mm-2, the green
channel becomes saturated (Figure M2.3).
As described before, the sensitivity factors were calculated from the ratio between each
channel intensity and the sum of all channels’ intensities. It was verified that, for values below
the image saturation threshold (255), the sensitivity factor is a constant value, independent of the
CBD-FITC concentration and capture time (Figure M2.3). The obtained values are presented in
Table M2.1. The sensitivity factors calculated are constant and independent of the capture time.
Therefore, the merging function could be determined as:
BGR IIII ×+×+×= 096.0695.0208.0 (6)
Several analysis were performed, using different capture times and CBD-FITC
concentrations. Good correlations were obtained, using the calculated sensitivity factors. As an
example, images obtained for different CBD-FITC concentrations (I vs xy pixel), using a capture
time of 300 ms, are shown in Figure M2.4. This figure reveals a non-uniform background
illumination, resulting in a significant variation of the intensities measured at different pixel
locations. Several authors (Benson et al., 1985; Ghauharali et al., 1998; Ghauharali and
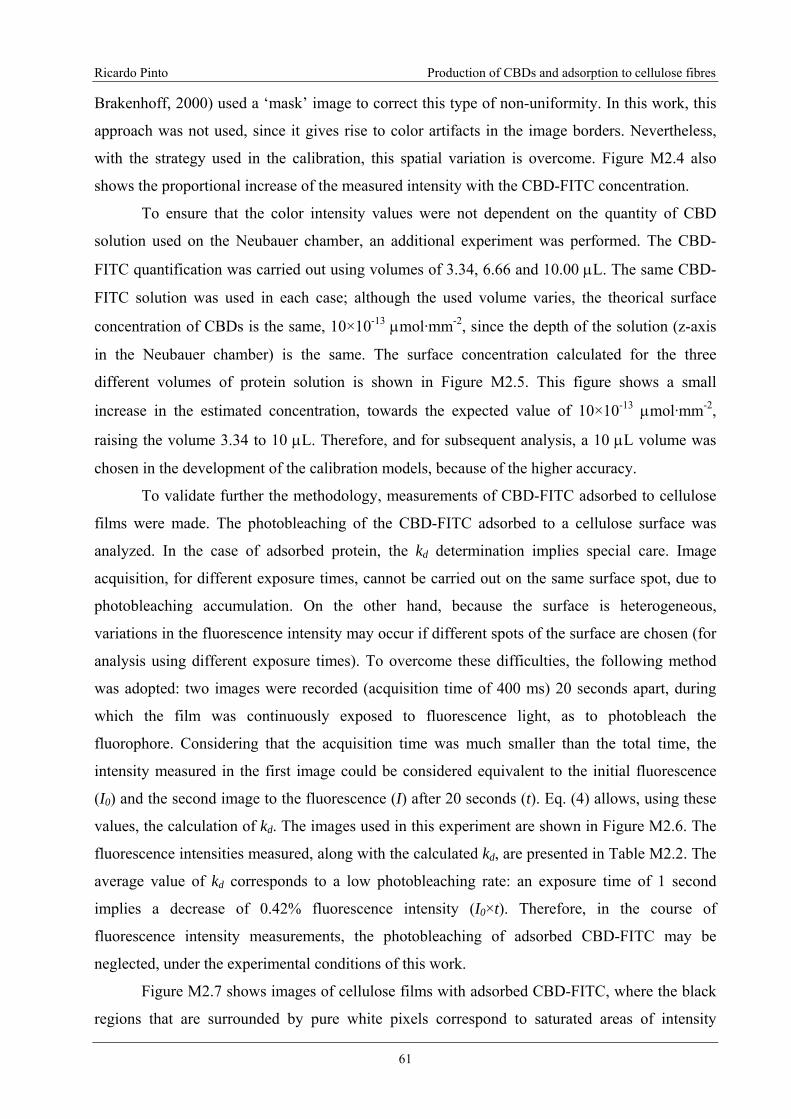
Ricardo Pinto Production of CBDs and adsorption to cellulose fibres
61
Brakenhoff, 2000) used a ‘mask’ image to correct this type of non-uniformity. In this work, this
approach was not used, since it gives rise to color artifacts in the image borders. Nevertheless,
with the strategy used in the calibration, this spatial variation is overcome. Figure M2.4 also
shows the proportional increase of the measured intensity with the CBD-FITC concentration.
To ensure that the color intensity values were not dependent on the quantity of CBD
solution used on the Neubauer chamber, an additional experiment was performed. The CBD-
FITC quantification was carried out using volumes of 3.34, 6.66 and 10.00 μL. The same CBD-
FITC solution was used in each case; although the used volume varies, the theorical surface
concentration of CBDs is the same, 10×10-13 μmol·mm-2, since the depth of the solution (z-axis
in the Neubauer chamber) is the same. The surface concentration calculated for the three
different volumes of protein solution is shown in Figure M2.5. This figure shows a small
increase in the estimated concentration, towards the expected value of 10×10-13 μmol·mm-2,
raising the volume 3.34 to 10 μL. Therefore, and for subsequent analysis, a 10 μL volume was
chosen in the development of the calibration models, because of the higher accuracy.
To validate further the methodology, measurements of CBD-FITC adsorbed to cellulose
films were made. The photobleaching of the CBD-FITC adsorbed to a cellulose surface was
analyzed. In the case of adsorbed protein, the kd determination implies special care. Image
acquisition, for different exposure times, cannot be carried out on the same surface spot, due to
photobleaching accumulation. On the other hand, because the surface is heterogeneous,
variations in the fluorescence intensity may occur if different spots of the surface are chosen (for
analysis using different exposure times). To overcome these difficulties, the following method
was adopted: two images were recorded (acquisition time of 400 ms) 20 seconds apart, during
which the film was continuously exposed to fluorescence light, as to photobleach the
fluorophore. Considering that the acquisition time was much smaller than the total time, the
intensity measured in the first image could be considered equivalent to the initial fluorescence
(I0) and the second image to the fluorescence (I) after 20 seconds (t). Eq. (4) allows, using these
values, the calculation of kd. The images used in this experiment are shown in Figure M2.6. The
fluorescence intensities measured, along with the calculated kd, are presented in Table M2.2. The
average value of kd corresponds to a low photobleaching rate: an exposure time of 1 second
implies a decrease of 0.42% fluorescence intensity (I0×t). Therefore, in the course of
fluorescence intensity measurements, the photobleaching of adsorbed CBD-FITC may be
neglected, under the experimental conditions of this work.
Figure M2.7 shows images of cellulose films with adsorbed CBD-FITC, where the black
regions that are surrounded by pure white pixels correspond to saturated areas of intensity
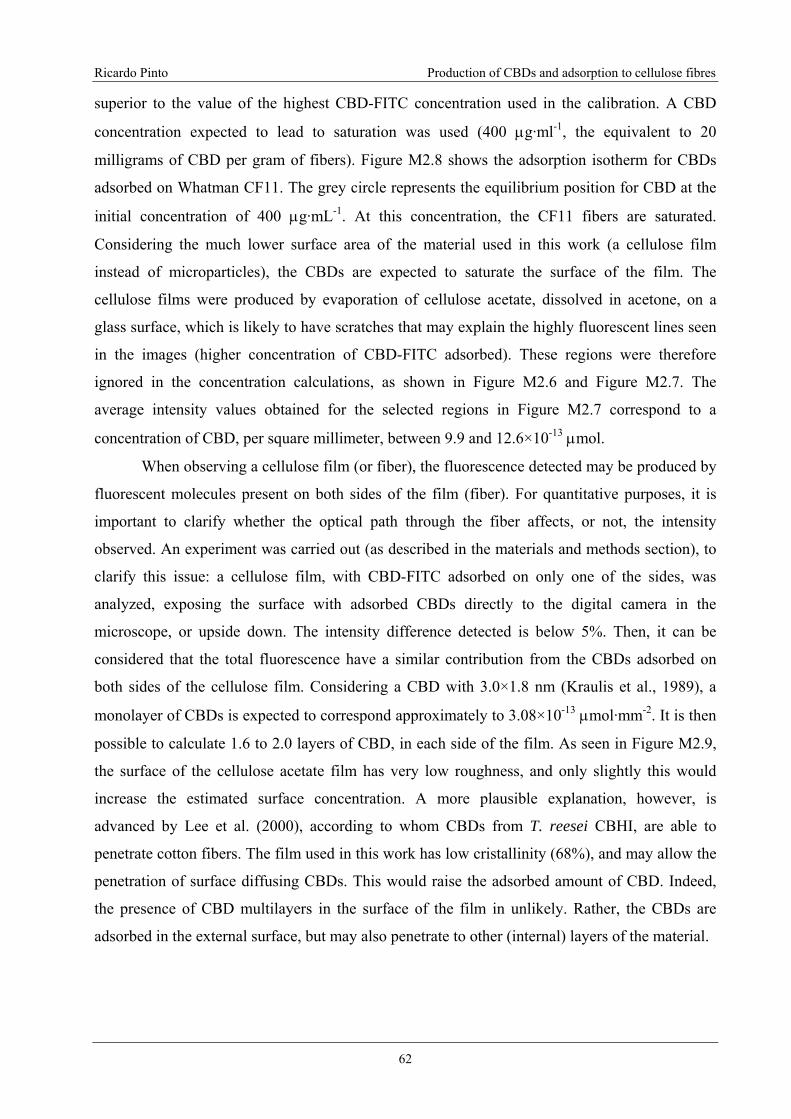
Ricardo Pinto Production of CBDs and adsorption to cellulose fibres
62
superior to the value of the highest CBD-FITC concentration used in the calibration. A CBD
concentration expected to lead to saturation was used (400 μg·ml-1, the equivalent to 20
milligrams of CBD per gram of fibers). Figure M2.8 shows the adsorption isotherm for CBDs
adsorbed on Whatman CF11. The grey circle represents the equilibrium position for CBD at the
initial concentration of 400 μg·mL-1. At this concentration, the CF11 fibers are saturated.
Considering the much lower surface area of the material used in this work (a cellulose film
instead of microparticles), the CBDs are expected to saturate the surface of the film. The
cellulose films were produced by evaporation of cellulose acetate, dissolved in acetone, on a
glass surface, which is likely to have scratches that may explain the highly fluorescent lines seen
in the images (higher concentration of CBD-FITC adsorbed). These regions were therefore
ignored in the concentration calculations, as shown in Figure M2.6 and Figure M2.7. The
average intensity values obtained for the selected regions in Figure M2.7 correspond to a
concentration of CBD, per square millimeter, between 9.9 and 12.6×10⁻¹³ μmol.
When observing a cellulose film (or fiber), the fluorescence detected may be produced by
fluorescent molecules present on both sides of the film (fiber). For quantitative purposes, it is
important to clarify whether the optical path through the fiber affects, or not, the intensity
observed. An experiment was carried out (as described in the materials and methods section), to
clarify this issue: a cellulose film, with CBD-FITC adsorbed on only one of the sides, was
analyzed, exposing the surface with adsorbed CBDs directly to the digital camera in the
microscope, or upside down. The intensity difference detected is below 5%. Then, it can be
considered that the total fluorescence have a similar contribution from the CBDs adsorbed on
both sides of the cellulose film. Considering a CBD with 3.0×1.8 nm (Kraulis et al., 1989), a
monolayer of CBDs is expected to correspond approximately to 3.08×10⁻¹³ μmol·mm-2. It is then
possible to calculate 1.6 to 2.0 layers of CBD, in each side of the film. As seen in Figure M2.9,
the surface of the cellulose acetate film has very low roughness, and only slightly this would
increase the estimated surface concentration. A more plausible explanation, however, is
advanced by Lee et al. (2000), according to whom CBDs from T. reesei CBHI, are able to
penetrate cotton fibers. The film used in this work has low cristallinity (68%), and may allow the
penetration of surface diffusing CBDs. This would raise the adsorbed amount of CBD. Indeed,
the presence of CBD multilayers in the surface of the film in unlikely. Rather, the CBDs are
adsorbed in the external surface, but may also penetrate to other (internal) layers of the material.
Ricardo Pinto Production of CBDs and adsorption to cellulose fibres
63
Conclusion
A methodology was developed, based on the image analysis of adsorbed CBD-FITC
conjugates, which allow the estimation of the protein surface concentration. This method is
based on the production of a grey scale image, obtained using the merging function I = 0.208×IR
+ 0.695×IG + 0.096×IB. The calculated value of intensity is correlated with CBD-FITC
concentration in a xy plane. This correlation elicits the estimation of CBDs adsorbed in any kind
of cellulosic material (particle, fiber, etc). It has been shown that the photobleaching of adsorbed
CBD-FITC is not relevant in the assay conditions. Preliminary results suggest that, at saturation,
the CBDs adsorbed in a cellulose film accumulate in multiple layers. Other hypothesis to explain
the high CBD concentration may be the protein penetration of the cellulose fibers. These issues
will be studied in a future investigation.
Acknowledgments
Ricardo Pinto was supported by Fundação para a Ciência e a Tecnologia (FCT) grant
SFRH/BD/6934/2001.
References
Benson, D.M., Bryan, J., Plant, A.L., Gotto, A.M., Smith, L.C., 1985. Digital imaging
fluorescence microscopy: spatial heterogeneity of photobleaching rate constants in individual
cells. J. Cell Biol. 100, 1309–1323.
Black, G.W., Rixon, J.E., Clarke, J.H., Hazlewood, G.P., Ferreira, L.M.A., Bolam, D.N., Gilbert,
H.J., 1997. Cellulose binding domains and linker sequences potentiate the activity of
hemicellulases against complex substrates. J. Biotechnol. 57, 59–69.
Ghauharali, R.I., Hofstraat, J.W., Brakenhoff, G.J., 1998. Fluorescence photobleaching-based
shading correction for fluorescence microscopy. J. Microsc.-Oxford 192, 99–113.

Ricardo Pinto Production of CBDs and adsorption to cellulose fibres
64
Ghauharali, R.I., Brakenhoff, G.J., 2000. Fluorescence photobleaching-based image
standardization for fluorescence microscopy. J. Microsc.-Oxford 198, 88–100.
Kraulis, P.J., Clore, G.M., Nilges, M., Jones, T.A., Petterson, G., Knowles, J., Gronenborn,
A.M., 1989. Determination of the three-dimensional solution structure of the C-terminal domain
of cellobiohydrolase I from Trichoderma reesei. A study using nuclear magnetic resonance and
hybrid distance geometrydynamical simulated annealing. Biochemistry 28, 7241–7257.
Kim, D.W., Jang, Y.H., Kim, C.S., Lee, N.-S., 2001. Effect of metal ions on the degradation and
adsorption of two cellobiohydrolases on microcrystalline cellulose. Bull. Korean Chem. Soc. 22,
716–720.
Lee, I., Evans, B.R., Woodward, J., 2000. The mechanism of cellulase action on cotton fibres:
evidence from atomic force microscopy. Ultramicroscopy 82, 213–221.
Levy, I., Shoseyov, O., 2001. Expression, refolding and indirect immobilization of horseradish
peroxidase (HRP) to cellulose via a phage-selected peptide and cellulose-binding domain (CBD).
J. Pept. Sci. 7, 50–57.
Limón, M.C., Margolles-Clark, E., Benítez, T., Penttilä, M., 2001. Addition of substrate-binding
domains increases substrate-binding capacity and specific activity of a chitinase from
Trichoderma harzianum. FEMS Microbiol. Lett. 198, 57–63.
Markham, J., Conchello, J.-A., 2001. Artefacts in restored images due to intensity loss in three-
dimensional fluorescence microscopy. J. Microsc.-Oxford 204, 93–98.
Mattinen, M.-L., Linder, M., Teleman, A., Annila, A., 1997. Interaction between cellohexaose
and cellulose binding domains from Trichoderma reesei cellulases. FEBS Lett. 407, 291–296.
Pala, H., Lemos, M.A., Mota, M., Gama, F.M., 2001. Enzymatic upgrade of old paperboard
containers. Enzyme Microb. Tech. 29, 274–279.
Pinto, R., Carvalho, J., Mota, M., Gama, M., 2006. "Large-scale production of cellulose-binding
domains. Adsorption studies using CBD-FITC conjugates," Cellulose 13, 557-569.

Ricardo Pinto Production of CBDs and adsorption to cellulose fibres
65
Song, L., van Gijlswijk, R.P.M., Young, I.T., Tanke, H.J., 1997. Influence of fluorochrome
labeling density on the photobleaching kinetics of fluorescein in microscopy. Cytometry 27,
213–223.
Srisodsuk, M., Reinikainen, T., Pentillä, M., Teeri, T.T., 1993. Role of the interdomain linker
peptide of Trichoderma reesei cellobiohydrolase I in its interaction with crystalline Cellulose. J.
Biol. Chem. 266, 20756–20761.
Srisodsuk, M., 1994. Mode of action of Trichoderma reesei cellobiohydrolase I on crystalline
cellulose. Ph.D. Thesis, VTT Publications 188, Helsinki, Finland.
Wierzba, A., Reichl, U., Turner, R.F.B., Warren, R.A.J., Kilburn, D.G., 1995. Adhesion of
mammalian cells to a recombinant attachment factor, CBD/RGD, analyzed by image analysis.
Biotech. Bioeng. 46, 185–193.
Zwier, J.M., Van Rooij, G.J., Hofstraat, J.W., Brakenhoff, G.J., 2004. Image calibration in
fluorescence microscopy. J. Microsc.-Oxford 216, 15–24.
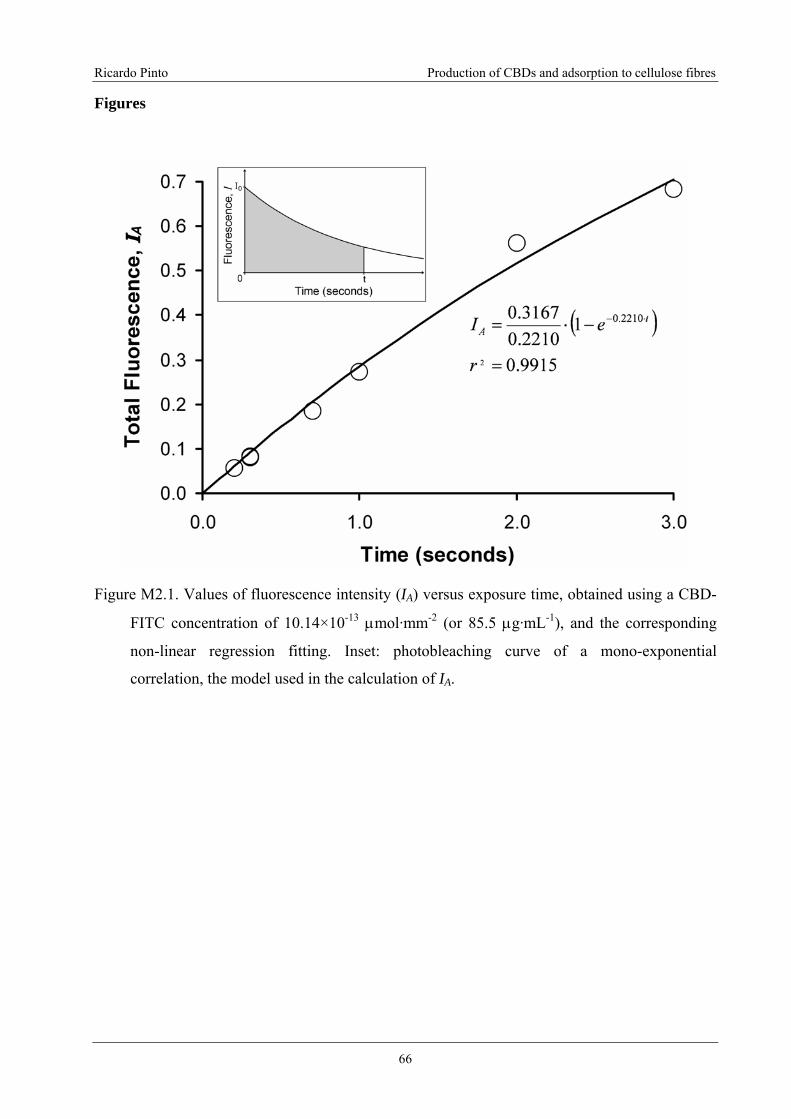
Ricardo Pinto Production of CBDs and adsorption to cellulose fibres
66
Figures
Figure M2.1. Values of fluorescence intensity (IA) versus exposure time, obtained using a CBD-
FITC concentration of 10.14×10⁻¹³ μmol·mm-2 (or 85.5 μg·mL-1), and the corresponding
non-linear regression fitting. Inset: photobleaching curve of a mono-exponential
correlation, the model used in the calculation of IA.
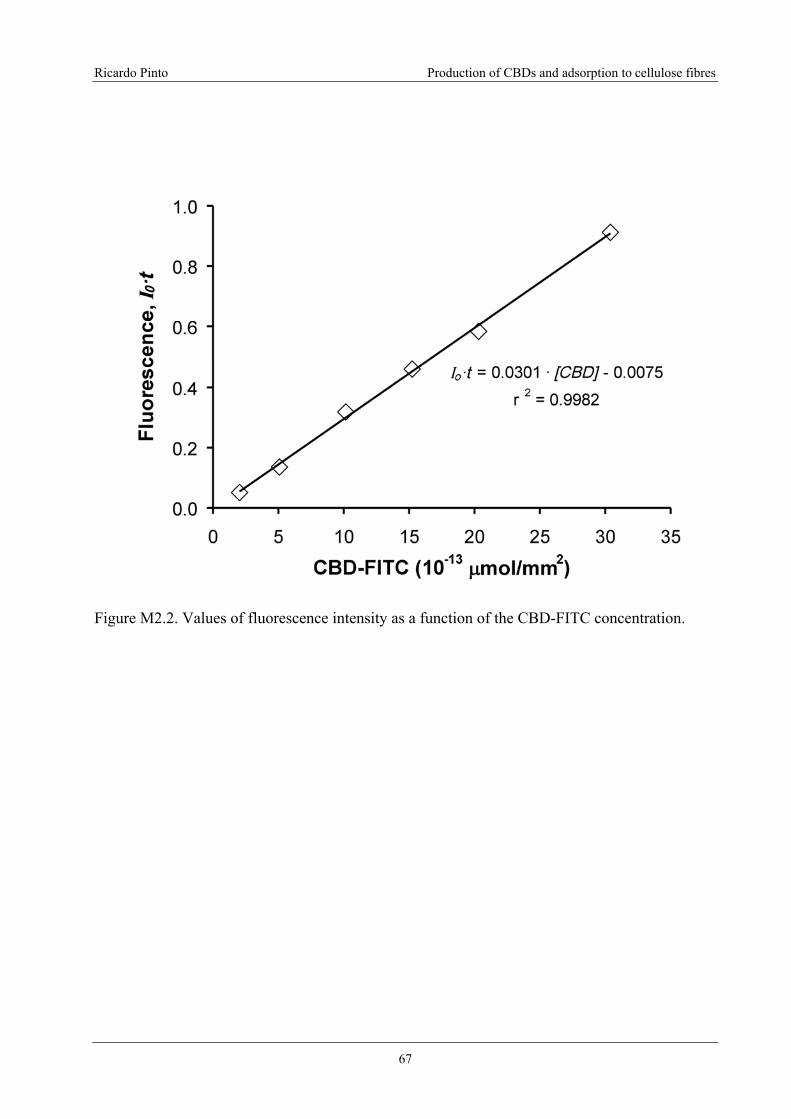
Ricardo Pinto Production of CBDs and adsorption to cellulose fibres
67
Figure M2.2. Values of fluorescence intensity as a function of the CBD-FITC concentration.

Ricardo Pinto Production of CBDs and adsorption to cellulose fibres
68
Figure M2.3. Intensity and sensitivity factors variation with CBD concentration for the studied
capture times, obtained by averaging a 10×10 pixel area at the centre of each original
images (continuous lines connect the values used for the calibration model). Legend: ◊ –
Red channel; ■ – Green channel; ▲ – Blue channel.

Ricardo Pinto Production of CBDs and adsorption to cellulose fibres
69
Figure M2.4. Calibration images obtained at capture time of 300 ms; each surface represents a
different CBD-FITC concentration. The inset shows, as an example, the CBD
concentration versus pixel intensity, obtained approximately at the center of the images.

Ricardo Pinto Production of CBDs and adsorption to cellulose fibres
70
Figure M2.5. Estimated CBD-FITC per unit area, for three different protein solutions volumes.
The labeling classes (TL – top left; TR – top right; C – centre; BL – bottom left; BR –
bottom right) refer to average values obtained at different selected regions in the image.
The black line corresponds to the expected value. Duplicate values are shown for each
volume used.
Figure M2.6. Cellulose film images obtained, for 400 ms of exposure time, at 0 (a) and 20
seconds (b) of exposure to the fluorescence light. The black squares indicate the positions
where the measurements were carried out.
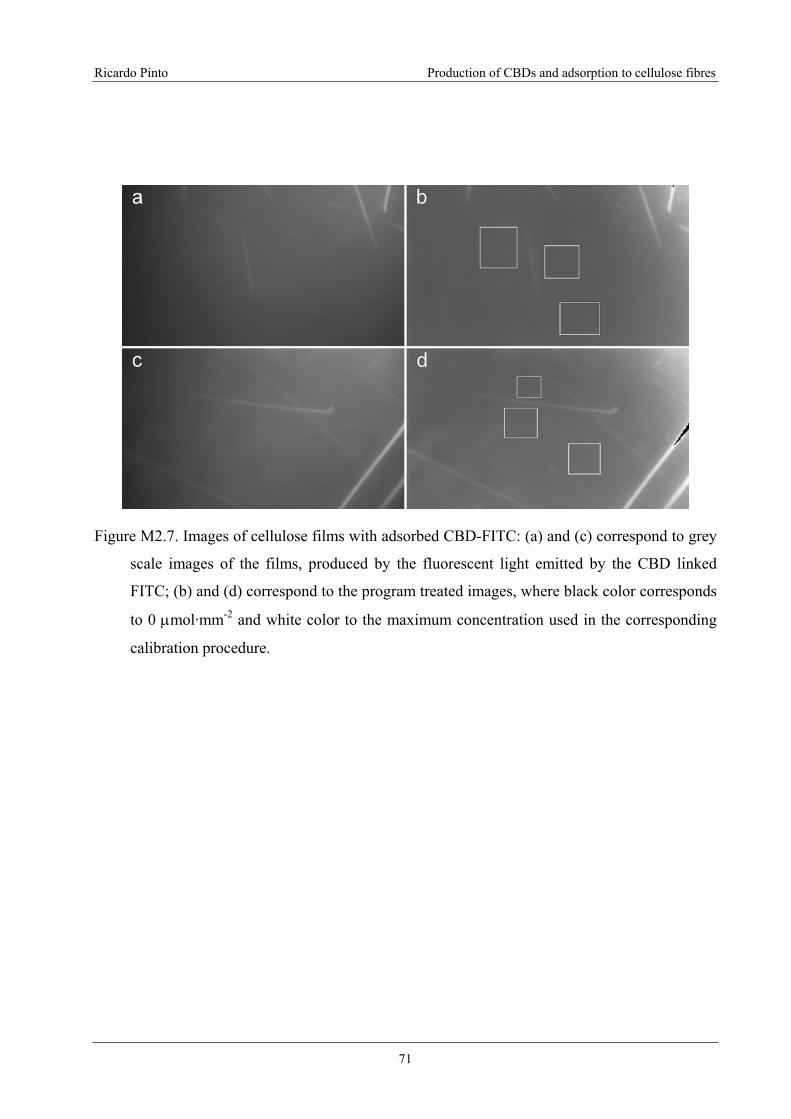
Ricardo Pinto Production of CBDs and adsorption to cellulose fibres
71
Figure M2.7. Images of cellulose films with adsorbed CBD-FITC: (a) and (c) correspond to grey
scale images of the films, produced by the fluorescent light emitted by the CBD linked
FITC; (b) and (d) correspond to the program treated images, where black color corresponds
to 0 μmol·mm-2 and white color to the maximum concentration used in the corresponding
calibration procedure.
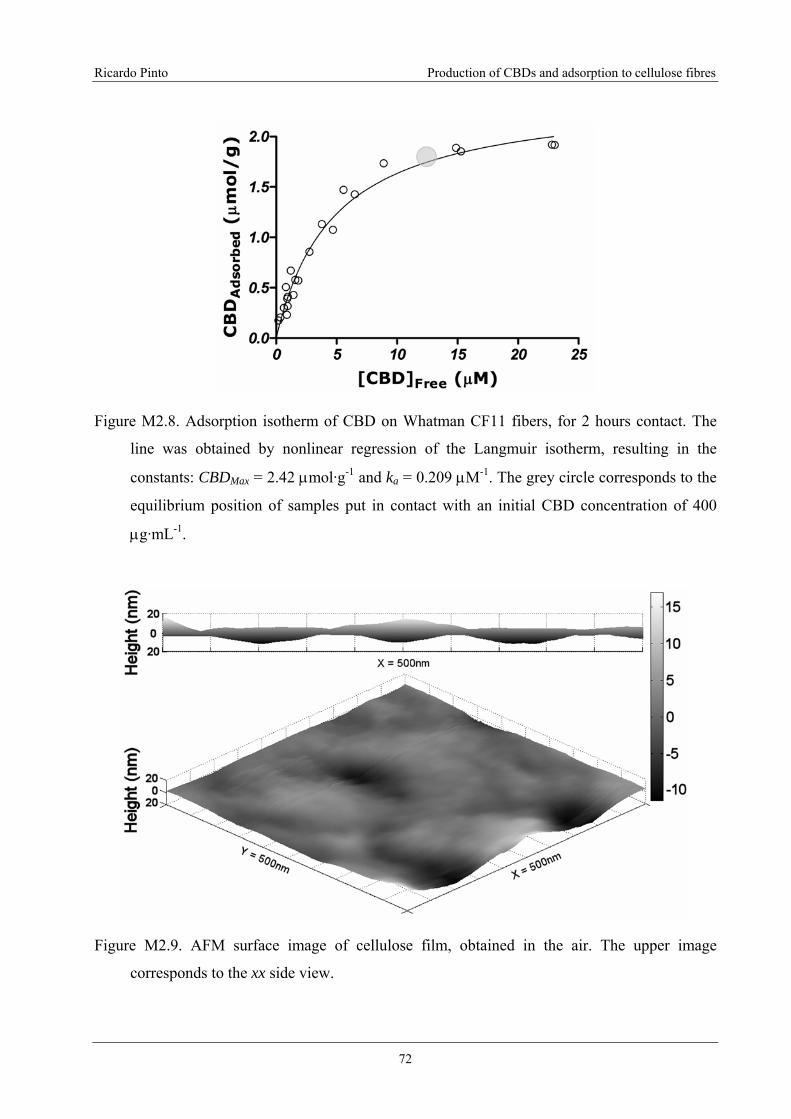
Ricardo Pinto Production of CBDs and adsorption to cellulose fibres
72
Figure M2.8. Adsorption isotherm of CBD on Whatman CF11 fibers, for 2 hours contact. The
line was obtained by nonlinear regression of the Langmuir isotherm, resulting in the
constants: CBDMax = 2.42 μmol·g-1 and ka = 0.209 μM-1. The grey circle corresponds to the
equilibrium position of samples put in contact with an initial CBD concentration of 400
μg·mL-1.
Figure M2.9. AFM surface image of cellulose film, obtained in the air. The upper image
corresponds to the xx side view.
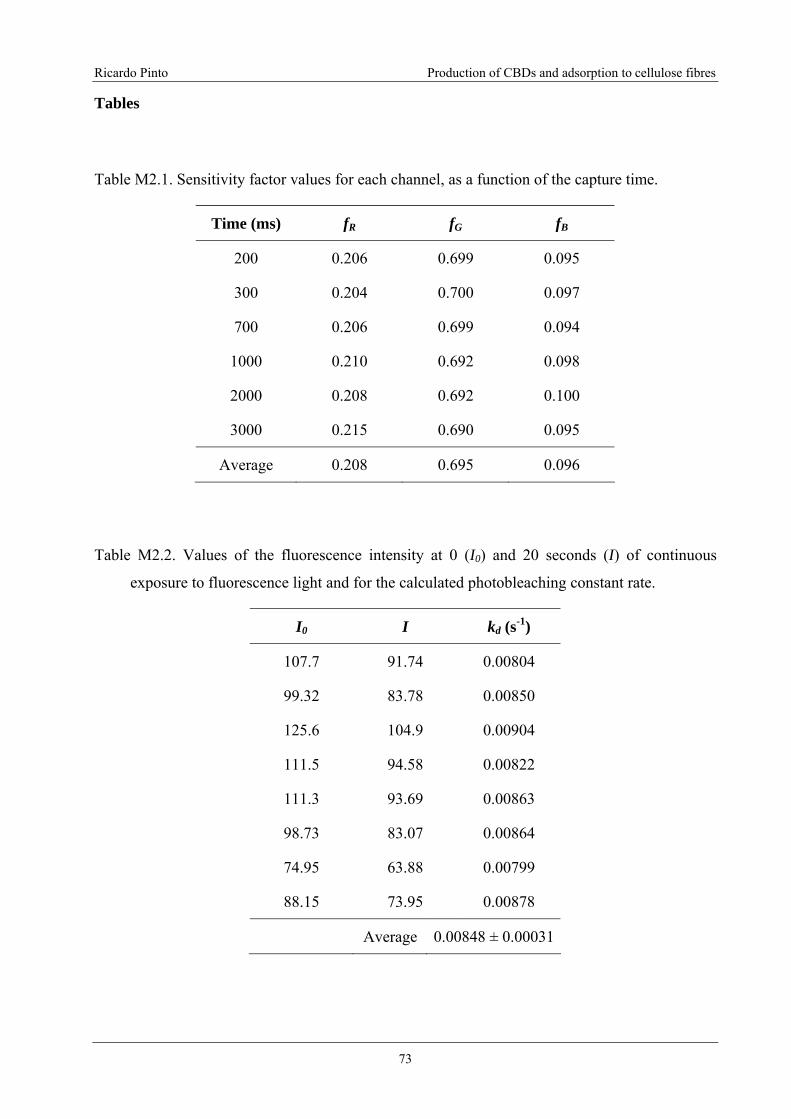
Ricardo Pinto Production of CBDs and adsorption to cellulose fibres
73
Tables
Table M2.1. Sensitivity factor values for each channel, as a function of the capture time.
Time (ms) fR fG fB
200 0.206 0.699 0.095
300 0.204 0.700 0.097
700 0.206 0.699 0.094
1000 0.210 0.692 0.098
2000 0.208 0.692 0.100
3000 0.215 0.690 0.095
Average 0.208 0.695 0.096
Table M2.2. Values of the fluorescence intensity at 0 (I0) and 20 seconds (I) of continuous
exposure to fluorescence light and for the calculated photobleaching constant rate.
I0 I kd (s-1)
107.7 91.74 0.00804
99.32 83.78 0.00850
125.6 104.9 0.00904
111.5 94.58 0.00822
111.3 93.69 0.00863
98.73 83.07 0.00864
74.95 63.88 0.00799
88.15 73.95 0.00878
Average 0.00848 ± 0.00031

Ricardo Pinto Production of CBDs and adsorption to cellulose fibres
74
M3. Quantification of the CBD-FITC conjugates surface coating on
cellulose fibers
(To be submitted to BMC Biotechnology)
Ricardo Pinto1, António Luís Amaral1,2, Eugénio Campos Ferreira1, Manuel Mota1, Manuel
Vilanova3,4, Katia Ruel5, Miguel Gama1,*
1Centro de Engenharia Biológica, Universidade do Minho, 4710-057 Braga, Portugal. 2Departamento de Tecnologia Química, ESTIG, IPB, Apartado 1038, 5301-854 Bragança,
Portugal. 3ICBAS - Instituto de Ciências Biomédicas de Abel Salazar, Largo do Professor Abel Salazar 2,
4099-003, Porto, Portugal 4IBMC - Instituto de Biologia Molecular e Celular, Rua do Campo Alegre, 823, 4150-180 Porto,
Portugal 5Centre de Recherches sur les Macromolécules Végétales (CERMAV)-UPR CNRS 5301, BP 53,
38041 Grenoble cedex 9 France
*Corresponding author
Email addresses:
ALA: [email protected]
ECF: [email protected]
Ricardo Pinto Production of CBDs and adsorption to cellulose fibres
75
Abstract
Background
Cellulose Binding Domains (CBD) were conjugated with fluorescein isothiocyanate (FITC). The
surface concentration of the Binding Domains adsorbed on cellulose fibres was determined by
fluorescence image analysis.
Results
For a CBD-FITC concentration of 60 μg/mL, a coating fraction of 78% and 110% was estimated
for Portucel and Whatman fibres, respectively. For a saturating CBD concentration, using
Whatman CF11 fibres, a surface concentration of 25.2×10⁻¹³ mol/mm2 was estimated, the
equivalent to 4 protein monolayers. This result does not imply the existence of several adsorbed
protein layers.
Conclusions
It was verified that CBDs were able to penetrate the fibres, according to confocal microscopy
and TEM-immunolabelling analysis. The surface concentration of adsorbed CBDs was greater
on amorphous fibres (phosphoric acid swollen) than on more crystalline ones (Whatman CF11
and Sigmacell 20).
Background
Due to its high sensitivity and specificity, fluorescence analysis has been extensively
used in microarray technology [1], gene expression monitoring [2], protein diffusion [3] or in
vivo chemical elements uptake and localization studies [4]. Another area to benefit from
fluorescence based techniques is protein quantification. The use of either non-covalent [5] or
covalent labelling [6,7] increased the detection sensitivity to as low as 40 ng/mL.
Cellulose-Binding Domains (CBD) are modules present in most celulases, being
responsible for their high affinity to cellulose crystalline surfaces [8,9]. The CBD used in this
work, produced by limited proteolysis, belongs to cellobiohydrolase I (CBHI) of Trichoderma
reesei, as shown in a previous work [10]. Three tyrosine residues define a flat surface, which
may be responsible for the affinity to cellulose [11]. This protein has a single amine, the N-
terminal of the linker region, which allows a specific reaction with fluorescein isothiocyanate
(FITC). The conjugation with FITC does not affect the CBD interaction with cellulose, since the
Ricardo Pinto Production of CBDs and adsorption to cellulose fibres
76
N-terminal is isolated from the cellulose interacting part of the protein. Indeed, the conjugation
of FITC does not modify the CBD adsorption isotherms [12,13]. Since there is only one amine
group present in the CBD, the stoichiometry of the conjugation reaction is 1:1. The FITC
fluorophore has been attached to antibodies [14,15], to microparticles [16] or to other binding
domains [12,17].
Cellulose-Binding Domains (CBD) have been used to target functional molecules to
cellulose-containing materials [18], to improve pulp properties [19] or as an additive for paper
recycling [20]. Bearing in mind that these applications are related to surface effects, in this work
we attempted to quantify the CBD surface coverage of cellulose fibres, using the approach based
on the use of CBD-FITC previously developed. Our aim was to quantify the protein adsorbed on
cellulose fibres and, more specifically, the surface concentration of CBD. This value could,
alternatively, be estimated by measuring the specific surface area, by means of the BET isotherm
[21]. However, the BET approach is not ideal for porous materials [22]. The presence of CBDs
in the interior of the fibres was also investigated.
Results and Discussion
In a previous work [20], we have shown that CBDs affect the technical properties of
paper fibres (secondary fibres from the paper mill Portucel). The concentration of CBDs, used in
those experiments, was in the range of 1-2 mg of CBD per gram of fibres. It is arguable whether
this relatively low amount of protein is sufficient to cause modifications in the fibres’ interfacial
properties. This would probably imply a substantial coating of the fibres by CBDs. In this work,
we analyzed fibres from Portucel treated with CBDs conjugated to FITC, and attempted to
estimate the percentage of surface coverage. As may be observed in Figure 1, the fibres do not
display a uniform distribution of fluorescence. This may be due to the chemical heterogeneity
(lignin/hemicellulose) and/or to the variable crystallinity [23]. The regions with less intense
fluorescence in the picture were selected for CBD-FITC quantification, since these regions are
expected to be more crystalline (Pinto et al., unpublished). The detected fluorescence is
produced by CBDs adsorbed on both sides of the fibres (top and bottom). Indeed, the fluorescent
radiation crosses the fibres with just a slight reduction in intensity (results to be published).
Figure 2 shows a Whatman CF11 fibre, both on bright field and fluorescence microscopy. As it
can be observed in the circled area, this cellulose has a rather smooth surface. The extremities of
the fibres are expected to have a higher number of fissures and loosen microfibrils, increasing
the available area, and consequently the adsorbing sites for CBDs [12], as indicated by the higher
Ricardo Pinto Production of CBDs and adsorption to cellulose fibres
77
fluorescence emission (Fig. 2). The adsorption of CBDs on Whatman CF11 fibres was analyzed,
using a protein concentration of 2 mg/gfibres. The estimated surface concentrations of CBDs
adsorbed on Portucel and Whatman CF11 fibres (Fig. 1) are shown in Figure 3.
In another experiment, Whatman CF11, amorphous cellulose and Sigmacell 20 fibres
were allowed to adsorb CBDs from a much more concentrated CBD solution (400 μg/mL),
corresponding to 20 mg/gFibres (Fig. 4). This concentration is expected to saturate the fibres
according to the adsorption isotherm.
Considering the size [24] of a cellobiohydrolase I CBD (3.0×1.8 nm), the density of a
CBD monolayer corresponds to 3.08×10⁻¹³ mol/mm2. It is also considered that the fluorescent
signal is produced by CBDs adsorbed on the two sides of the fibres’ external surface. Indeed, the
accessible area may be much larger than the one corresponding to a flat, impenetrable fibre.
Therefore, an estimate of about 4 layers of CBDs adsorbed in the Whatman CF11 surface results
from this reasoning, when the larger concentration of CBDs is used; for a lower CBD
concentration, a surface coverage of 77% and 110% is estimated, respectively, for Portucel and
Whatman fibres (Fig. 3), dividing the calculated surface concentration by the theoretical
monolayer of CBDs. This is much higher than the expected maximum of one layer of adsorbed
CBD, at saturation. Although the surface is apparently smooth, the fibres may have irregularities,
such as microfissures or holes created by CBDs [25]. The presence of more or less loose
microfibrils, large pores or fissures may substantially increase the surface area and the amount of
bound proteins, thus leading to a higher fluorescence emission than the theorized monolayer.
Indeed, confocal microscopy reveals that the surface has many irregularities (Fig. 5-c), while the
inner region presents a homogeneous structure (Fig. 5-a). Another important observation
provided by confocal microscopy was that fluorescence in the inner core of the fibres was always
superior to the background intensity (Fig. 5-d and Fig. 5-e), indicating that CBDs may have
penetrated into the fibre. As a matter of fact, as shown in Figure 5-d, fluorescent material (CBD-
FITC) was detected at all depths of the fibre. This observation is supported by immunolabelling
of CBD-treated CF11 fibres (Fig. 6). This analysis revealed the presence of CBDs (black spots)
in the interior of the fibre. Considering this, we may now explain that the surface concentration
of CBDs in Figure 3 arises from the CBDs penetration deep inside the fibres. Another aspect to
take into account is that CBDs may not adsorb as a single and well ordered monolayer, but rather
as agglomerates [26], thereby increasing the average fluorescence per unit area. Nevertheless, it
is quite probable that the CBD coating of the external surface is rather significant.
Amorphous cellulose was prepared, by treating Whatman CF11 with phosphoric acid,
which induces the swelling of fibres. As it can be seen in Figure 4, the fibres are larger than the
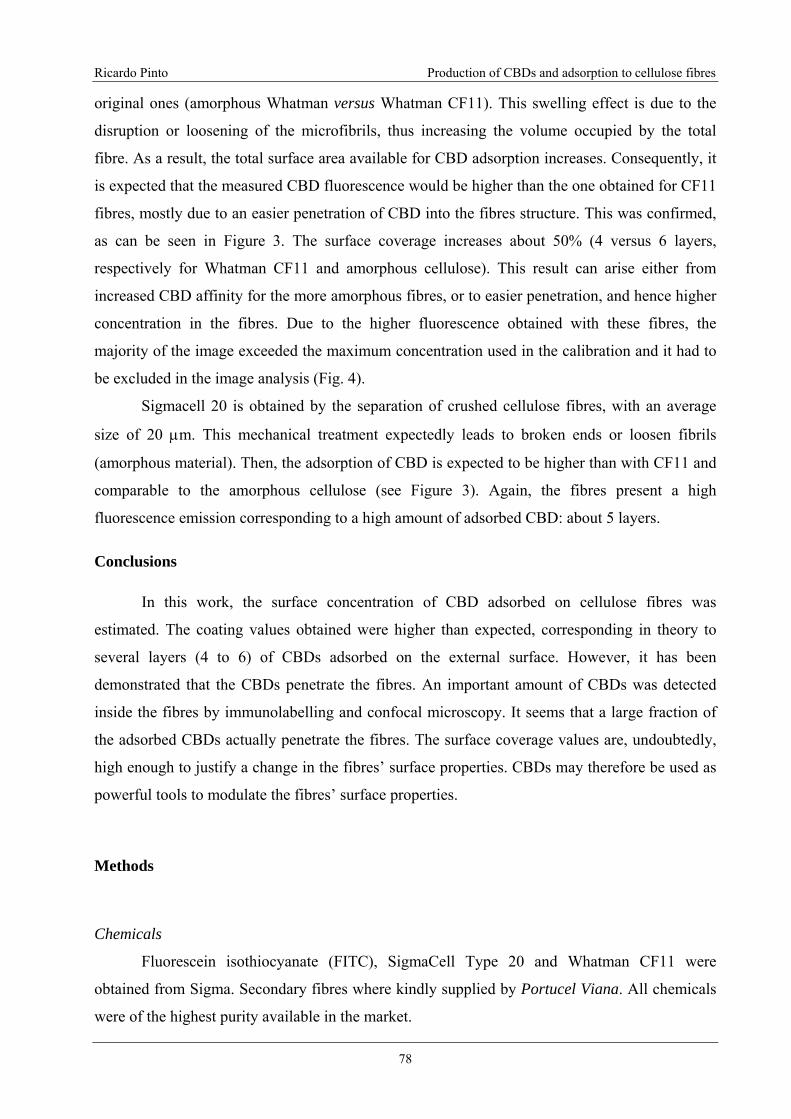
Ricardo Pinto Production of CBDs and adsorption to cellulose fibres
78
original ones (amorphous Whatman versus Whatman CF11). This swelling effect is due to the
disruption or loosening of the microfibrils, thus increasing the volume occupied by the total
fibre. As a result, the total surface area available for CBD adsorption increases. Consequently, it
is expected that the measured CBD fluorescence would be higher than the one obtained for CF11
fibres, mostly due to an easier penetration of CBD into the fibres structure. This was confirmed,
as can be seen in Figure 3. The surface coverage increases about 50% (4 versus 6 layers,
respectively for Whatman CF11 and amorphous cellulose). This result can arise either from
increased CBD affinity for the more amorphous fibres, or to easier penetration, and hence higher
concentration in the fibres. Due to the higher fluorescence obtained with these fibres, the
majority of the image exceeded the maximum concentration used in the calibration and it had to
be excluded in the image analysis (Fig. 4).
Sigmacell 20 is obtained by the separation of crushed cellulose fibres, with an average
size of 20 μm. This mechanical treatment expectedly leads to broken ends or loosen fibrils
(amorphous material). Then, the adsorption of CBD is expected to be higher than with CF11 and
comparable to the amorphous cellulose (see Figure 3). Again, the fibres present a high
fluorescence emission corresponding to a high amount of adsorbed CBD: about 5 layers.
Conclusions
In this work, the surface concentration of CBD adsorbed on cellulose fibres was
estimated. The coating values obtained were higher than expected, corresponding in theory to
several layers (4 to 6) of CBDs adsorbed on the external surface. However, it has been
demonstrated that the CBDs penetrate the fibres. An important amount of CBDs was detected
inside the fibres by immunolabelling and confocal microscopy. It seems that a large fraction of
the adsorbed CBDs actually penetrate the fibres. The surface coverage values are, undoubtedly,
high enough to justify a change in the fibres’ surface properties. CBDs may therefore be used as
powerful tools to modulate the fibres’ surface properties.
Methods
Chemicals
Fluorescein isothiocyanate (FITC), SigmaCell Type 20 and Whatman CF11 were
obtained from Sigma. Secondary fibres where kindly supplied by Portucel Viana. All chemicals
were of the highest purity available in the market.
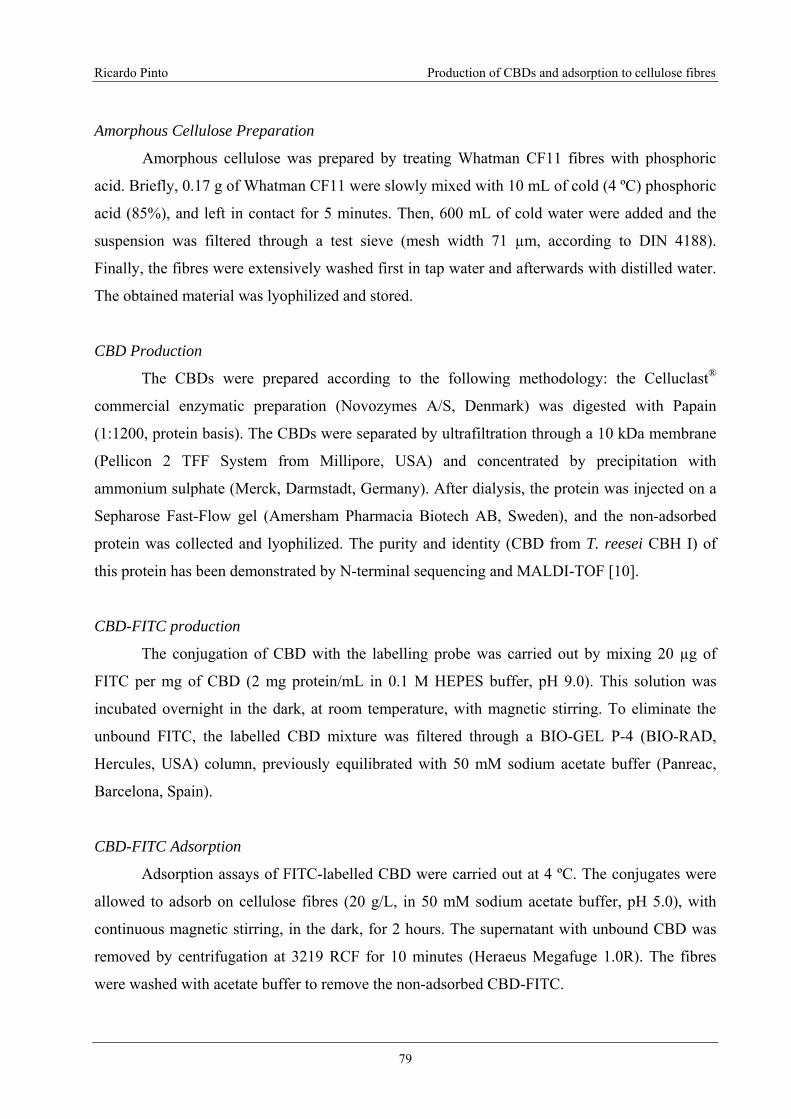
Ricardo Pinto Production of CBDs and adsorption to cellulose fibres
79
Amorphous Cellulose Preparation
Amorphous cellulose was prepared by treating Whatman CF11 fibres with phosphoric
acid. Briefly, 0.17 g of Whatman CF11 were slowly mixed with 10 mL of cold (4 ºC) phosphoric
acid (85%), and left in contact for 5 minutes. Then, 600 mL of cold water were added and the
suspension was filtered through a test sieve (mesh width 71 µm, according to DIN 4188).
Finally, the fibres were extensively washed first in tap water and afterwards with distilled water.
The obtained material was lyophilized and stored.
CBD Production
The CBDs were prepared according to the following methodology: the Celluclast®
commercial enzymatic preparation (Novozymes A/S, Denmark) was digested with Papain
(1:1200, protein basis). The CBDs were separated by ultrafiltration through a 10 kDa membrane
(Pellicon 2 TFF System from Millipore, USA) and concentrated by precipitation with
ammonium sulphate (Merck, Darmstadt, Germany). After dialysis, the protein was injected on a
Sepharose Fast-Flow gel (Amersham Pharmacia Biotech AB, Sweden), and the non-adsorbed
protein was collected and lyophilized. The purity and identity (CBD from T. reesei CBH I) of
this protein has been demonstrated by N-terminal sequencing and MALDI-TOF [10].
CBD-FITC production
The conjugation of CBD with the labelling probe was carried out by mixing 20 µg of
FITC per mg of CBD (2 mg protein/mL in 0.1 M HEPES buffer, pH 9.0). This solution was
incubated overnight in the dark, at room temperature, with magnetic stirring. To eliminate the
unbound FITC, the labelled CBD mixture was filtered through a BIO-GEL P-4 (BIO-RAD,
Hercules, USA) column, previously equilibrated with 50 mM sodium acetate buffer (Panreac,
Barcelona, Spain).
CBD-FITC Adsorption
Adsorption assays of FITC-labelled CBD were carried out at 4 ºC. The conjugates were
allowed to adsorb on cellulose fibres (20 g/L, in 50 mM sodium acetate buffer, pH 5.0), with
continuous magnetic stirring, in the dark, for 2 hours. The supernatant with unbound CBD was
removed by centrifugation at 3219 RCF for 10 minutes (Heraeus Megafuge 1.0R). The fibres
were washed with acetate buffer to remove the non-adsorbed CBD-FITC.
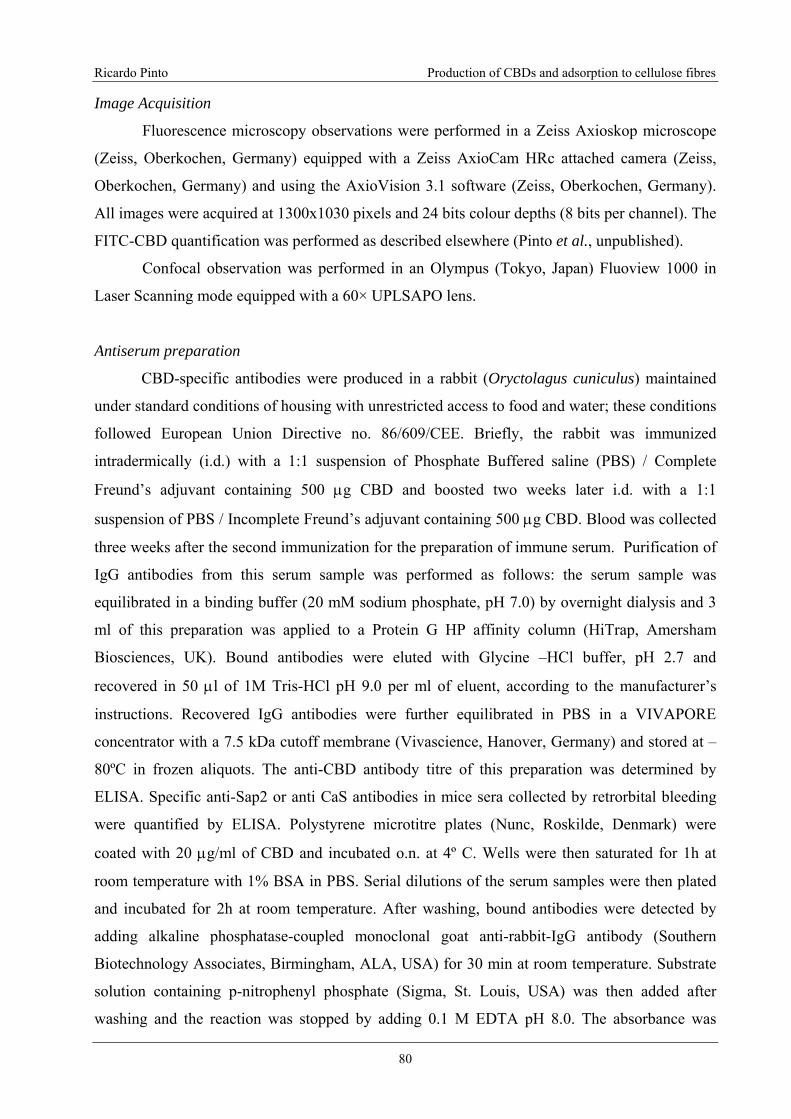
Ricardo Pinto Production of CBDs and adsorption to cellulose fibres
80
Image Acquisition
Fluorescence microscopy observations were performed in a Zeiss Axioskop microscope
(Zeiss, Oberkochen, Germany) equipped with a Zeiss AxioCam HRc attached camera (Zeiss,
Oberkochen, Germany) and using the AxioVision 3.1 software (Zeiss, Oberkochen, Germany).
All images were acquired at 1300x1030 pixels and 24 bits colour depths (8 bits per channel). The
FITC-CBD quantification was performed as described elsewhere (Pinto et al., unpublished).
Confocal observation was performed in an Olympus (Tokyo, Japan) Fluoview 1000 in
Laser Scanning mode equipped with a 60× UPLSAPO lens.
Antiserum preparation
CBD-specific antibodies were produced in a rabbit (Oryctolagus cuniculus) maintained
under standard conditions of housing with unrestricted access to food and water; these conditions
followed European Union Directive no. 86/609/CEE. Briefly, the rabbit was immunized
intradermically (i.d.) with a 1:1 suspension of Phosphate Buffered saline (PBS) / Complete
Freund’s adjuvant containing 500 μg CBD and boosted two weeks later i.d. with a 1:1
suspension of PBS / Incomplete Freund’s adjuvant containing 500 μg CBD. Blood was collected
three weeks after the second immunization for the preparation of immune serum. Purification of
IgG antibodies from this serum sample was performed as follows: the serum sample was
equilibrated in a binding buffer (20 mM sodium phosphate, pH 7.0) by overnight dialysis and 3
ml of this preparation was applied to a Protein G HP affinity column (HiTrap, Amersham
Biosciences, UK). Bound antibodies were eluted with Glycine –HCl buffer, pH 2.7 and
recovered in 50 μl of 1M Tris-HCl pH 9.0 per ml of eluent, according to the manufacturer’s
instructions. Recovered IgG antibodies were further equilibrated in PBS in a VIVAPORE
concentrator with a 7.5 kDa cutoff membrane (Vivascience, Hanover, Germany) and stored at –
80ºC in frozen aliquots. The anti-CBD antibody titre of this preparation was determined by
ELISA. Specific anti-Sap2 or anti CaS antibodies in mice sera collected by retrorbital bleeding
were quantified by ELISA. Polystyrene microtitre plates (Nunc, Roskilde, Denmark) were
coated with 20 μg/ml of CBD and incubated o.n. at 4º C. Wells were then saturated for 1h at
room temperature with 1% BSA in PBS. Serial dilutions of the serum samples were then plated
and incubated for 2h at room temperature. After washing, bound antibodies were detected by
adding alkaline phosphatase-coupled monoclonal goat anti-rabbit-IgG antibody (Southern
Biotechnology Associates, Birmingham, ALA, USA) for 30 min at room temperature. Substrate
solution containing p-nitrophenyl phosphate (Sigma, St. Louis, USA) was then added after
washing and the reaction was stopped by adding 0.1 M EDTA pH 8.0. The absorbance was
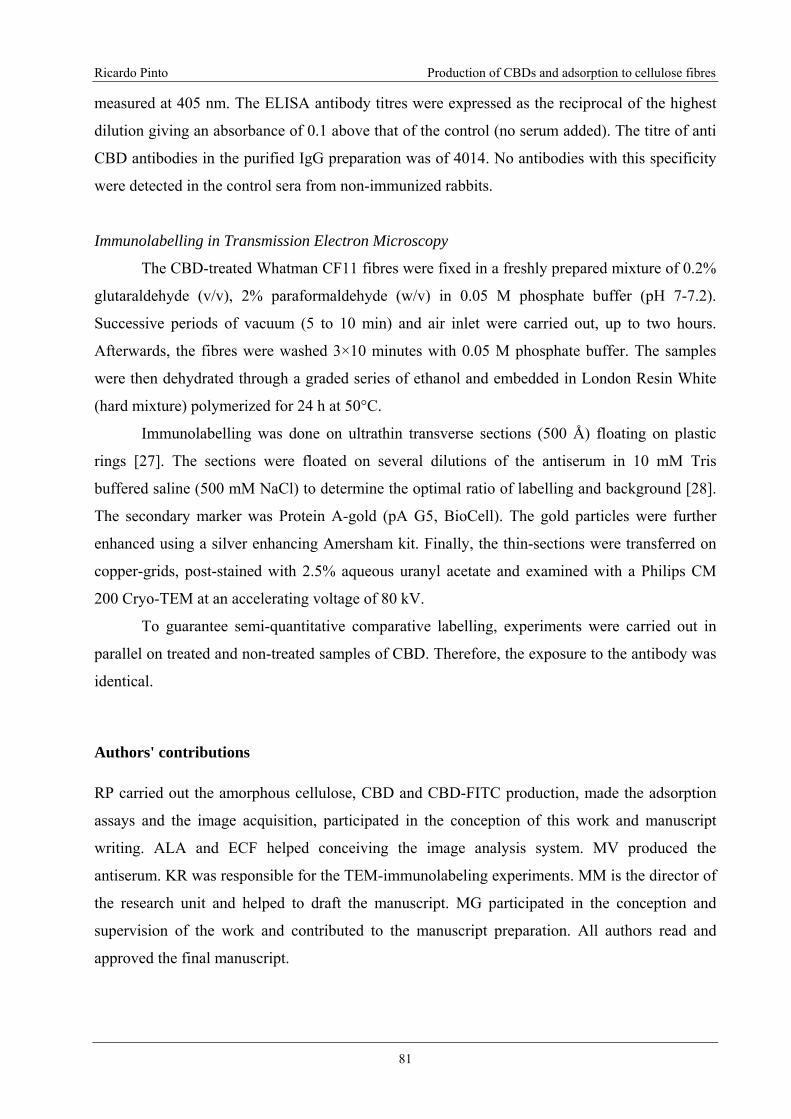
Ricardo Pinto Production of CBDs and adsorption to cellulose fibres
81
measured at 405 nm. The ELISA antibody titres were expressed as the reciprocal of the highest
dilution giving an absorbance of 0.1 above that of the control (no serum added). The titre of anti
CBD antibodies in the purified IgG preparation was of 4014. No antibodies with this specificity
were detected in the control sera from non-immunized rabbits.
Immunolabelling in Transmission Electron Microscopy
The CBD-treated Whatman CF11 fibres were fixed in a freshly prepared mixture of 0.2%
glutaraldehyde (v/v), 2% paraformaldehyde (w/v) in 0.05 M phosphate buffer (pH 7-7.2).
Successive periods of vacuum (5 to 10 min) and air inlet were carried out, up to two hours.
Afterwards, the fibres were washed 3×10 minutes with 0.05 M phosphate buffer. The samples
were then dehydrated through a graded series of ethanol and embedded in London Resin White
(hard mixture) polymerized for 24 h at 50°C.
Immunolabelling was done on ultrathin transverse sections (500 Å) floating on plastic
rings [27]. The sections were floated on several dilutions of the antiserum in 10 mM Tris
buffered saline (500 mM NaCl) to determine the optimal ratio of labelling and background [28].
The secondary marker was Protein A-gold (pA G5, BioCell). The gold particles were further
enhanced using a silver enhancing Amersham kit. Finally, the thin-sections were transferred on
copper-grids, post-stained with 2.5% aqueous uranyl acetate and examined with a Philips CM
200 Cryo-TEM at an accelerating voltage of 80 kV.
To guarantee semi-quantitative comparative labelling, experiments were carried out in
parallel on treated and non-treated samples of CBD. Therefore, the exposure to the antibody was
identical.
Authors' contributions
RP carried out the amorphous cellulose, CBD and CBD-FITC production, made the adsorption
assays and the image acquisition, participated in the conception of this work and manuscript
writing. ALA and ECF helped conceiving the image analysis system. MV produced the
antiserum. KR was responsible for the TEM-immunolabeling experiments. MM is the director of
the research unit and helped to draft the manuscript. MG participated in the conception and
supervision of the work and contributed to the manuscript preparation. All authors read and
approved the final manuscript.
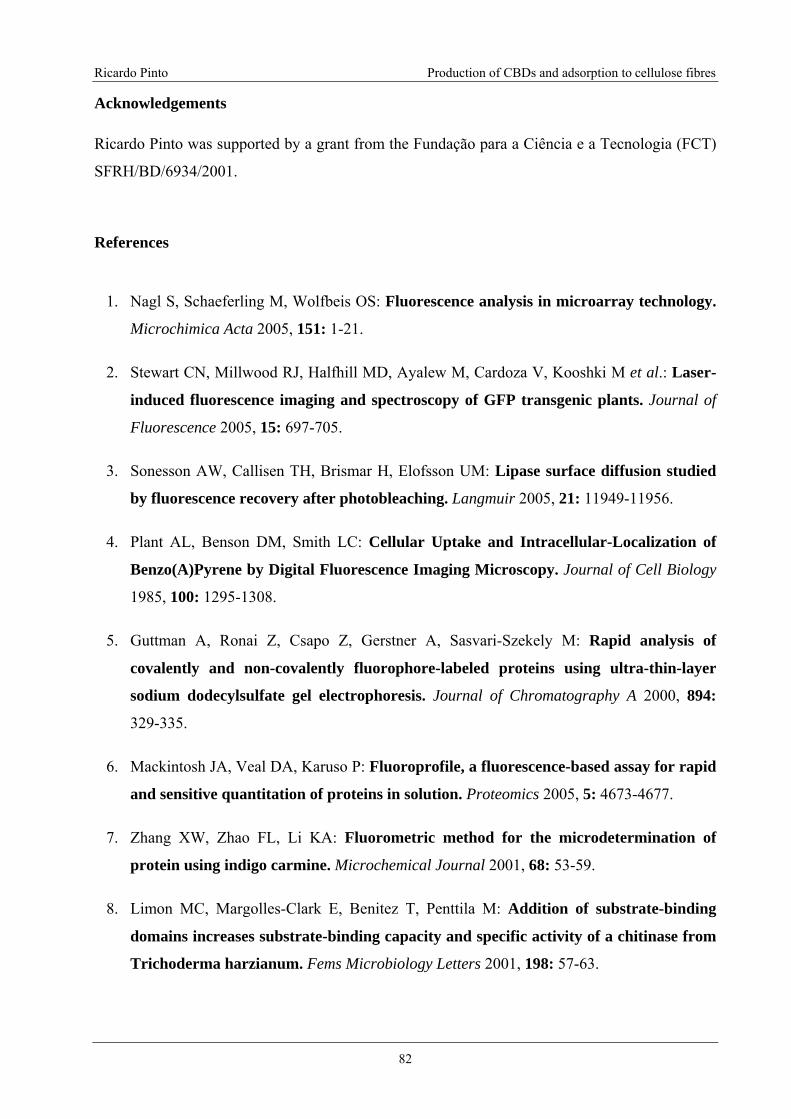
Ricardo Pinto Production of CBDs and adsorption to cellulose fibres
82
Acknowledgements
Ricardo Pinto was supported by a grant from the Fundação para a Ciência e a Tecnologia (FCT)
SFRH/BD/6934/2001.
References
1. Nagl S, Schaeferling M, Wolfbeis OS: Fluorescence analysis in microarray technology.
Microchimica Acta 2005, 151: 1-21.
2. Stewart CN, Millwood RJ, Halfhill MD, Ayalew M, Cardoza V, Kooshki M et al.: Laser-
induced fluorescence imaging and spectroscopy of GFP transgenic plants. Journal of
Fluorescence 2005, 15: 697-705.
3. Sonesson AW, Callisen TH, Brismar H, Elofsson UM: Lipase surface diffusion studied
by fluorescence recovery after photobleaching. Langmuir 2005, 21: 11949-11956.
4. Plant AL, Benson DM, Smith LC: Cellular Uptake and Intracellular-Localization of
Benzo(A)Pyrene by Digital Fluorescence Imaging Microscopy. Journal of Cell Biology
1985, 100: 1295-1308.
5. Guttman A, Ronai Z, Csapo Z, Gerstner A, Sasvari-Szekely M: Rapid analysis of
covalently and non-covalently fluorophore-labeled proteins using ultra-thin-layer
sodium dodecylsulfate gel electrophoresis. Journal of Chromatography A 2000, 894:
329-335.
6. Mackintosh JA, Veal DA, Karuso P: Fluoroprofile, a fluorescence-based assay for rapid
and sensitive quantitation of proteins in solution. Proteomics 2005, 5: 4673-4677.
7. Zhang XW, Zhao FL, Li KA: Fluorometric method for the microdetermination of
protein using indigo carmine. Microchemical Journal 2001, 68: 53-59.
8. Limon MC, Margolles-Clark E, Benitez T, Penttila M: Addition of substrate-binding
domains increases substrate-binding capacity and specific activity of a chitinase from
Trichoderma harzianum. Fems Microbiology Letters 2001, 198: 57-63.
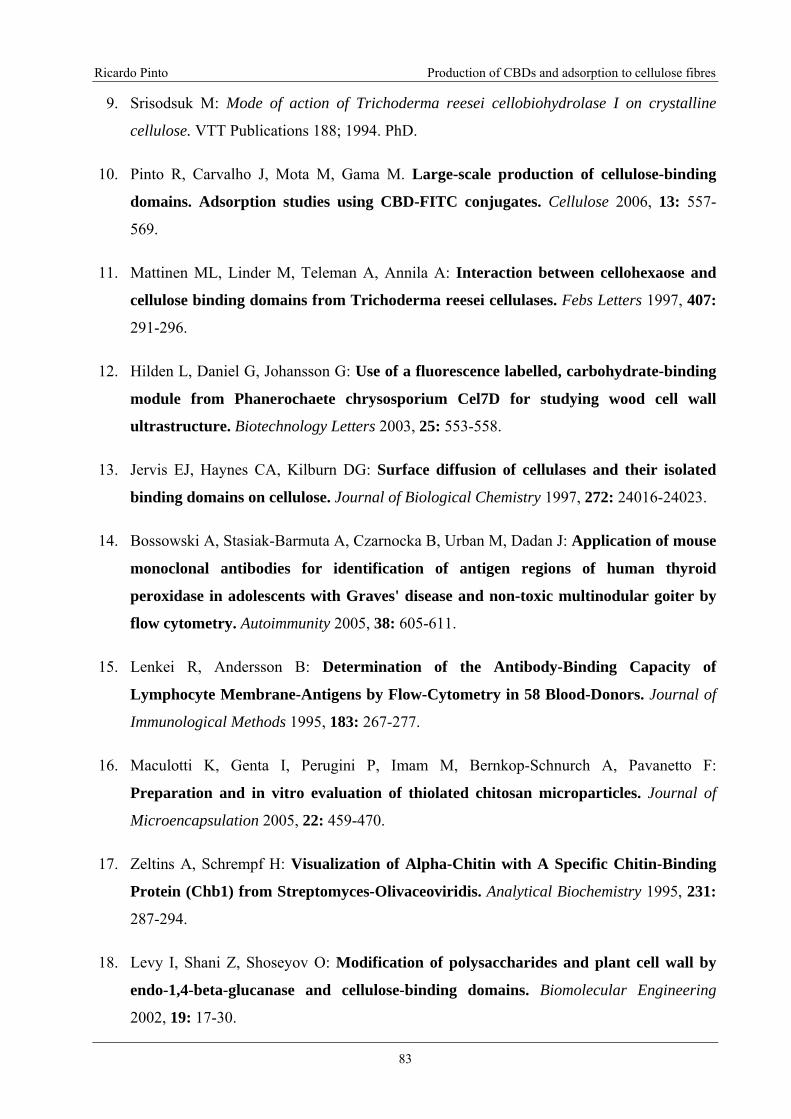
Ricardo Pinto Production of CBDs and adsorption to cellulose fibres
83
9. Srisodsuk M: Mode of action of Trichoderma reesei cellobiohydrolase I on crystalline
cellulose. VTT Publications 188; 1994. PhD.
10. Pinto R, Carvalho J, Mota M, Gama M. Large-scale production of cellulose-binding
domains. Adsorption studies using CBD-FITC conjugates. Cellulose 2006, 13: 557-
569.
11. Mattinen ML, Linder M, Teleman A, Annila A: Interaction between cellohexaose and
cellulose binding domains from Trichoderma reesei cellulases. Febs Letters 1997, 407:
291-296.
12. Hilden L, Daniel G, Johansson G: Use of a fluorescence labelled, carbohydrate-binding
module from Phanerochaete chrysosporium Cel7D for studying wood cell wall
ultrastructure. Biotechnology Letters 2003, 25: 553-558.
13. Jervis EJ, Haynes CA, Kilburn DG: Surface diffusion of cellulases and their isolated
binding domains on cellulose. Journal of Biological Chemistry 1997, 272: 24016-24023.
14. Bossowski A, Stasiak-Barmuta A, Czarnocka B, Urban M, Dadan J: Application of mouse
monoclonal antibodies for identification of antigen regions of human thyroid
peroxidase in adolescents with Graves' disease and non-toxic multinodular goiter by
flow cytometry. Autoimmunity 2005, 38: 605-611.
15. Lenkei R, Andersson B: Determination of the Antibody-Binding Capacity of
Lymphocyte Membrane-Antigens by Flow-Cytometry in 58 Blood-Donors. Journal of
Immunological Methods 1995, 183: 267-277.
16. Maculotti K, Genta I, Perugini P, Imam M, Bernkop-Schnurch A, Pavanetto F:
Preparation and in vitro evaluation of thiolated chitosan microparticles. Journal of
Microencapsulation 2005, 22: 459-470.
17. Zeltins A, Schrempf H: Visualization of Alpha-Chitin with A Specific Chitin-Binding
Protein (Chb1) from Streptomyces-Olivaceoviridis. Analytical Biochemistry 1995, 231:
287-294.
18. Levy I, Shani Z, Shoseyov O: Modification of polysaccharides and plant cell wall by
endo-1,4-beta-glucanase and cellulose-binding domains. Biomolecular Engineering
2002, 19: 17-30.
Ricardo Pinto Production of CBDs and adsorption to cellulose fibres
84
19. Suurnakki A, Tenkanen M, Siika-aho M, Niku-Paavola ML, Viikari L, Buchert J:
Trichoderma reesei cellulases and their core domains in the hydrolysis and
modification of chemical pulp. Cellulose 2000, 7: 189-209.
20. Pala H, Lemos MA, Mota M, Gama FM: Enzymatic upgrade of old paperboard
containers. Enzyme and Microbial Technology 2001, 29: 274-279.
21. Brunauer S, Emmett PH, Teller E: Adsorption of Gases in Multimolecular Layers.
Journal of the American Chemical Society 1938, 60: 309-319.
22. Sing K: The use of nitrogen adsorption for the characterisation of porous materials.
Colloids and Surfaces A-Physicochemical and Engineering Aspects 2001, 187: 3-9.
23. Teeri TT: Crystalline cellulose degradation: New insight into the function of
cellobiohydrolases. Trends in Biotechnology 1997, 15: 160-167.
24. Kraulis PJ, Clore GM, Nilges M, Jones TA, Pettersson G, Knowles J et al.: Determination
of the 3-Dimensional Solution Structure of the C-Terminal Domain of
Cellobiohydrolase-I from Trichoderma-Reesei - A Study Using Nuclear Magnetic-
Resonance and Hybrid Distance Geometry Dynamical Simulated Annealing.
Biochemistry 1989, 28: 7241-7257.
25. Gao PJ, Chen GJ, Wang TH, Zhang YS, Liu J: Non-hydrolytic disruption of crystalline
structure of cellulose by cellulose binding domain and linker sequence of
cellobiohydrolase I from Penicillium janthinellum. Acta Biochimica et Biophysica
Sinica 2001, 33: 13-18.
26. Nigmatullin R, Lovitt R, Wright C, Linder M, Nakari-Setala T, Gama A: Atomic force
microscopy study of cellulose surface interaction controlled by cellulose binding
domains. Colloids and Surfaces B-Biointerfaces 2004, 35: 125-135.
27. Ruel K, Ambert K, Joseleau JP: Influence of the enzyme equipment of white-rot fungi
on the patterns of wood degradation. Fems Microbiology Reviews 1994, 13: 241-254.
28. Ruel K, Faix O, Joseleau J-P: New immunogold probes for studying the distribution of
the different lignin types during plant cell wall biogenesis. Journal of Trace and
Microprobe Techniques 1994, 12: 247-265.
Ricardo Pinto Production of CBDs and adsorption to cellulose fibres
85
Figures
Figure M3.1. Portucel and Whatman CF11 fibres treated with CBD-FITC. The fibres treated
with a concentration of 60 μg/mL (or 2 mgCBD/gfibres). The images were acquired with an
exposure time of 600 ms. The white squares identify the areas selected for analysis. The
more fluorescent parts (black regions on the analyzed images) are out of range (calibration
shown elsewhere), and were therefore excluded from the analysis.
Figure M3.2. Whatman CF11 images. The characteristic curled structure of the fibres (circle).
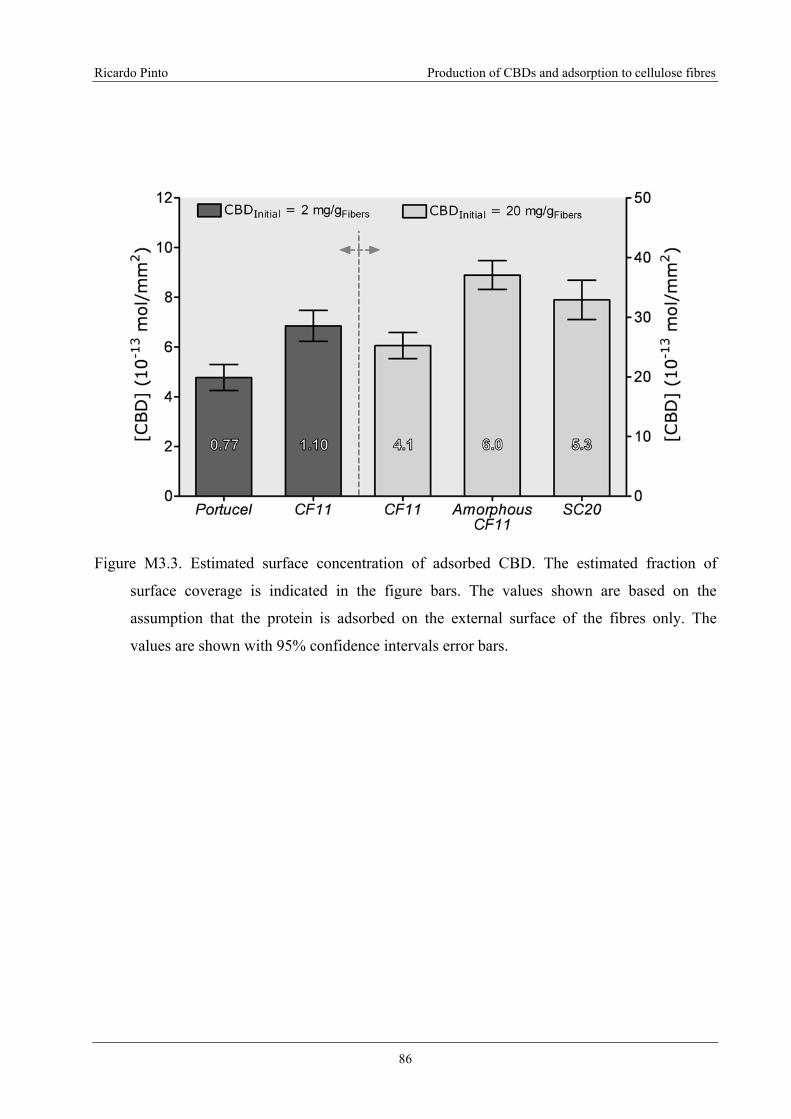
Ricardo Pinto Production of CBDs and adsorption to cellulose fibres
86
Figure M3.3. Estimated surface concentration of adsorbed CBD. The estimated fraction of
surface coverage is indicated in the figure bars. The values shown are based on the
assumption that the protein is adsorbed on the external surface of the fibres only. The
values are shown with 95% confidence intervals error bars.
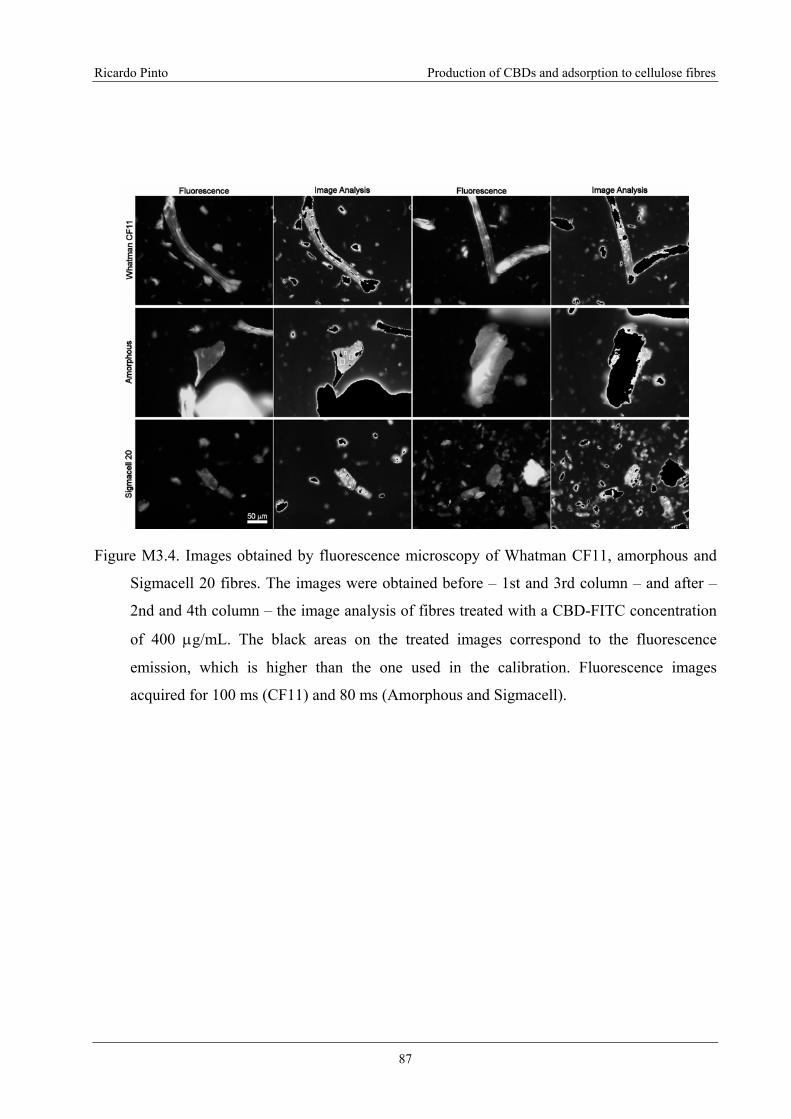
Ricardo Pinto Production of CBDs and adsorption to cellulose fibres
87
Figure M3.4. Images obtained by fluorescence microscopy of Whatman CF11, amorphous and
Sigmacell 20 fibres. The images were obtained before – 1st and 3rd column – and after –
2nd and 4th column – the image analysis of fibres treated with a CBD-FITC concentration
of 400 μg/mL. The black areas on the treated images correspond to the fluorescence
emission, which is higher than the one used in the calibration. Fluorescence images
acquired for 100 ms (CF11) and 80 ms (Amorphous and Sigmacell).
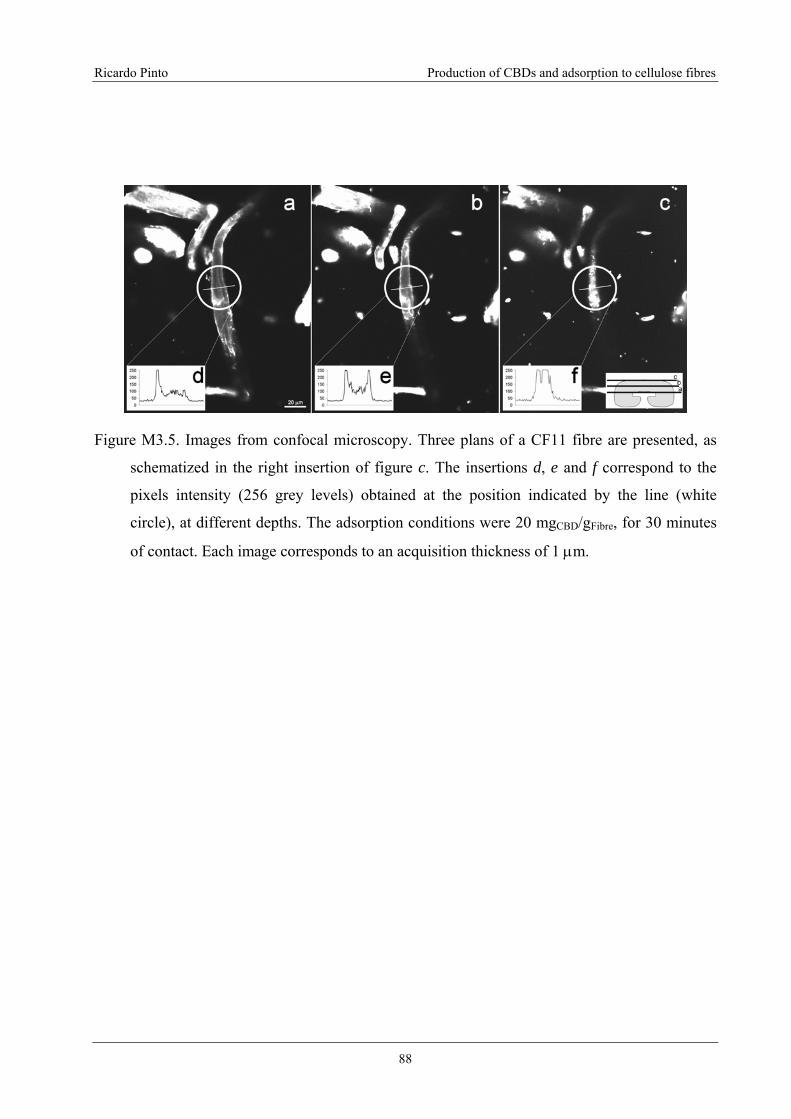
Ricardo Pinto Production of CBDs and adsorption to cellulose fibres
88
Figure M3.5. Images from confocal microscopy. Three plans of a CF11 fibre are presented, as
schematized in the right insertion of figure c. The insertions d, e and f correspond to the
pixels intensity (256 grey levels) obtained at the position indicated by the line (white
circle), at different depths. The adsorption conditions were 20 mgCBD/gFibre, for 30 minutes
of contact. Each image corresponds to an acquisition thickness of 1 μm.
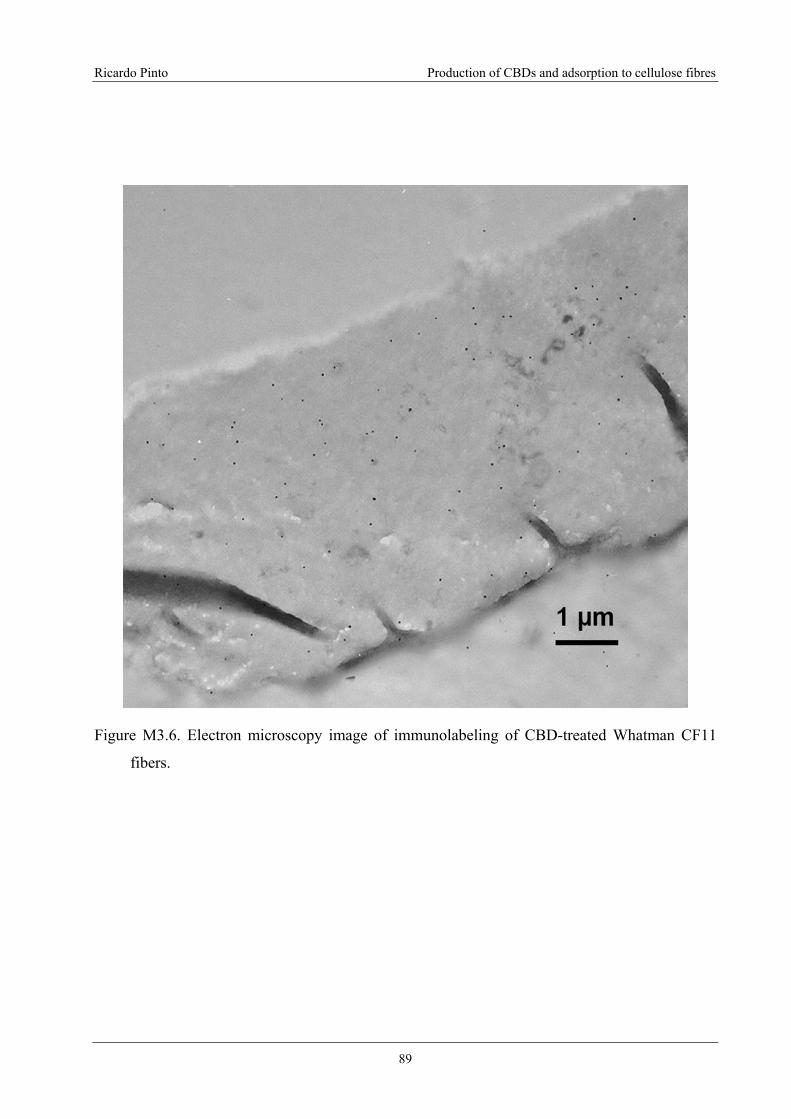
Ricardo Pinto Production of CBDs and adsorption to cellulose fibres
89
Figure M3.6. Electron microscopy image of immunolabeling of CBD-treated Whatman CF11
fibers.
Ricardo Pinto Production of CBDs and adsorption to cellulose fibres
90
M4. Effect of Cellulose-Binding Domains on Pulp Paper Properties
(Submited to Journal of Biotechnology)
Ricardo Pinto1, Ana Paula Duarte2, Manuel Mota1, Miguel Gama1,*
1Centro de Engenharia Biológica, Universidade do Minho
4710-057 Braga, Portugal. 2Departamento de Ciências e Tecnologia Papel, Universidade da Beira Interior
Rua Marquês d'Ávila e Bolama, 6201-001 Covilhã
*e-mail: [email protected]; phone: +351253604400; fax: +351253678986.
Abstract
The effect of Cellulose-Binding Domains (CBD) on the properties of different kinds of
paper fibers is analyzed. Eucalyptus, pine and secondary fibers, submitted to different degrees of
refining, were treated with CBDs. The pulp and paper properties were analyzed. CBDs
conjugated chemically with Lysozyme were also used, to study the effect of the adsorbed protein
electric charge on the fibers modification. The surface properties of paper and fibers were also
analyzed by ZETA-potential and contact angle measurements. Both CBDs and CBD-Lysozyme
conjugates improve the pulp drainability and air permeability of the papersheets. The use of
CBD conjugates allows the control of the cellulosic fibers surface properties, such as
hydrophobicity and electric charge.
Keywords: Cellulose-binding domain, fiber properties, ZETA-potencial, contact angle

Ricardo Pinto Production of CBDs and adsorption to cellulose fibres
91
Abbreviations: BSA, bovine serum albumin; CBD, cellulose-binding domains; DMSO, dimethyl
sulfoxide; DNS, dinitro-salicylic acid; FPU, filter paper units; HSAB, N-hydroxysuccinimidyl 4-
azidobenzoate; MALDI-TOF, Matrix-assisted laser desorption/ionisation-time of flight; pI,
isoelectric point; ºSR, Schopper-Riegler degree; UV, ultraviolet radiation; WRV, water retention
value; ΔGTcwc, variation of the total free energy; γLW, surface tension apolar component (Lifshitz-
van der Waals interaction); γ+ and γ-, positive and negative surface tension components; θ,
contact angle
Introduction
Enzymes have been applied in paper production, for the modification of fiber/paper
properties. Xylanases have been used in the treatment of softwood kraft pulps, allowing the
reduction of bleaching chemical requirements (Suurnäkki et al., 1994; Senior and Hamilton,
1993). Endo-glucanases have been used in deinking of recycled paper (Geng and Li, 2003).
Cellulases and hemicellulases have been used to improve fibers refining (Seo et al., 2000) and
freeness/drainage (Jackson et al., 1993; Pala et al., 2001; Stork et al., 1995). Enzymes hydrolyze
the polysaccharides, leading to reduction of both fiber strength and mass.
Cellulose-binding domains (CBDs) are proteins that exhibit high cellulose affinity (Black
et al., 1997). They are produced by a large number of fungi and bacteria, associated to the
cellulases catalytic modules (Irwin et al., 1998; Mattinen et al., 1998). DNA recombinant
technology may be used to fuse CBDs with other proteins with different size, charge,
hydrophobicity, catalytic activity, bioactivity, etc (Reinikainen et al., 1997). CBDs are,
therefore, potentially very useful in the activation and modification of cellulosic fibers (Kitaoka
and Tanaka, 2001).
In a previous work we have shown that CBDs, obtained by proteolysis of Trichoderma
reesei cellulases, have the ability to modify the drainability of recycled paper pulps (Pala et al.,
2001). In the present work, we analyze the potential of CBDs to modify different types of fibers,
submitted to various degrees of refining. Fibers from Eucalyptus and Pine, as well as secondary
fibers, were used. Furthermore, CBDs were chemically conjugated with lysozyme, as this protein
has a pI of 11.4, hence being expected to positively charge the fibers. The surface and technical
properties of the fibers, treated with the lysozyme conjugated CBDs, were also analyzed..
Ricardo Pinto Production of CBDs and adsorption to cellulose fibres
92
Materials and Methods
Chemicals
Sodium acetate was obtained from Panreac (Barcelona, Spain), ammonium sulphate from
Merck (Darmstadt, Germany), and the other from Sigma-Aldrich (St. Louis, USA). Primary
fibers were from industrial bleached kraft pulp of Eucalyptus globulus and industrial unbleached
kraft pulp of Pinus pinaster (Pine). Secondary fibers were gently supplied by Portucel Viana
(Kraftliner paper) and Nisa companies (tissue paper). All chemicals were of the highest purity
available.
CBD Production
The CBDs were prepared according to the following methodology: the commercial
enzymatic preparation Celluclast® (Novozymes A/S, Denmark) was digested with Papain
(1:1200, protein basis). CBDs were separated by ultrafiltration through a 10 kDa membrane
(Pellicon 2 TFF System from Millipore, USA) and concentrated by precipitation with
ammonium sulphate. After dialysis, the protein was injected in a Sepharose Fast-Flow gel
(Amersham Pharmacia Biotech AB, Sweden), and the non-adsorbed protein was collected and
lyophilized. The purity of this protein was demonstrated by N-terminal sequencing and MALDI-
TOF, as described in Pinto et al. (2006).
Protein Conjugation
The chemical N-hydroxysuccinimidyl 4-azidobenzoate (HSAB) was used to conjugate
CBD with lysozyme. This molecule is a well known heterobifunctional reticulating agent
(Johnson et al., 1981). One of its structural groups reacts with a free amine, and the other is,
under UV irradiation, highly reactive, preferably also with a free amine. HSAB was dissolved in
dry DMSO (150 mg·mL-1). Then it was added (10×8 μL aliquots, with 20 minutes interval) to 40
mg of CBD in 4 mL phosphate buffer (20 mM, pH 7.5), and the mixture was kept at room
temperature in the dark, for 20 hours. The unreacted HSAB was separated by thoroughly
dialyzing the reaction mixture in a 1 kDa Cellu·Sep H1 membrane (Membrane Filtration
Products, Inc., Texas, USA), against acetate buffer (50 mM, pH 5.0), always in the dark. The
activated CBD was then mixed with lysozyme (at a molar ratio of 3 to 1 mol, respectively) and
Ricardo Pinto Production of CBDs and adsorption to cellulose fibres
93
photo-conjugated for 30 minutes, on ice, by direct exposure to an 8W UV lamp (254 nm), in a
Camag UV-Cabinet II (Muttenz, Switzerland).
The conjugate obtained was analyzed by size exclusion chromatography, using a Bio-Gel
P-60 (Bio-Rad, California, USA) column, packed according to the manufacture instructions,
using acetate buffer (50 mM, pH 5.0) as eluent.
Adsorption assays, using Whatman CF11 cellulose, were carried out by mixing the CBDs
and lysozyme, conjugated or not (at a molar ratio of 3 to 1 mol, respectively), in acetate buffer
(50 mM, pH 5.0), at 5ºC. After 2 hours, the supernatants were separated by centrifugation (12225
RCF, Sigma 4K10, B. Braun) and the protein content in the supernatant was assessed by
spectrofluorimetry (model FP6200, Jasco Corporation, Japan).
Treatment with CBD and CBD-lysozyme conjugates
Cellulose fibers, at 10% (w/w) consistency, were beated in a PFI mill for 0, 1000 or 3000
revolutions. Afterwards, CBDs were adsorbed by mixing the protein (2 mg per gram of fibers,
dry weight) with 30 g of fibers (dry weight) in acetate buffer (50 mM, pH 5.0 and final volume
of 2 L) for 30 minutes at 22-25ºC. Control experiments were performed by adding buffer without
the protein. Fibers were filtered and the fines were recovered by refiltering the permeate through
the fibers cake. The fibers were finally re-suspended with demineralized water to 2% (w/v)
consistency.
Fibers were also treated with 4 mg of CBD-lysozyme or 2.24 mg of CBDs (equivalent to
the amount of CBD present in the conjugates), per gram of cellulose, in the same conditions as
stated above for CBDs adsorption.
Analysis of the Pulp and Paper Properties
The pulp and handsheet properties were analyzed using standard procedures: ISO 5267/1
(Schopper-Riegler); ISO 5636/3 1992(F) (permeability); ISO 1924/2 1985(F) (tensile strength
and break length); ISO 1974(F) (tearing); ISO 2758 1983(E) (bursting strength). The water
retention value (WRV) was determined according to the method reported by Silvy et al. (1968).
Contact Angle Measurement
Sigmacell 20 fibers (pure cellulose), after CBD or CBD-lysozyme conjugates adsorption
(10 mg per gram of fiber, for 30 minutes at 5ºC), were filtered on a 0.45 μm membrane and air
dried. The Sigmacell 20 membrane film obtained, and stripes of Portucel papersheets, were
analyzed by contact angle measurements. The samples were held in an OCA20 apparatus

Ricardo Pinto Production of CBDs and adsorption to cellulose fibres
94
(Dataphysics, Filderstadt, Germany), using a double coated tape. The contact angles were
measured with the SCA20 software (Dataphysics, Filderstadt, Germany), using 3 μL of each
liquid probe (water, 1-bromonaphthalene and formamide). The surface tension components
(γLWc, γ+
c and γ-c, mJ·m-2) of cellulose fibers were obtained by resolving the Good-van Oss-
Chaudhury equation for each liquid (van Oss et al., 1988a):
( ) ( )+−−+ ⋅+⋅+⋅⋅=⋅+ LcLcLWL
LWcL γγγγγγγθ 2cos1 (1)
Where γL, γLWL, γ+
L and γ-L are the surface tension, Lifshitz-van der Waals interaction (apolar
component) and the positive and negative surface tension components, respectively, of the liquid
(L). The degree of hydrophobicity can be assessed by calculating the variation of the total free
energy (ΔGTcwc, mJ·m-2) between two moieties of cellulose immersed in water (van Oss et al.,
1988a):
( ) ( )−+−++−−+ ⋅−⋅−⋅+⋅⋅+−⋅−=Δ wwccwcwcLWw
LWc
TcwcG γγγγγγγγγγ 42
2 (2)
Where the subscripts c and w stand for cellulose and water, respectively.
ZETA-Potential
The ZETA-potential of Portucel and Eucalyptus fibers was assessed by measuring the
streaming potential across a fiber pad, by Mütek SZP-06 (Herrsching, Germany) apparatus,
according to the device instructions.
The Sigmacell 20 fibers where allowed to adsorb either CBDs or conjugates (13 mg per
gram of dry fibers) at 5ºC in acetate buffer (20 mM, pH 5.0). After 2 hours of contact, the fibers
where centrifuged and the supernatant discarded. The fibers were then diluted in 30mL of
ultrapure water and the ZETA-potential was measured by electrophoretic mobility, in a Zeta-
Meter 3.0+ apparatus.
Results and Discussion
CBD Treatment of Paper Fibers
The pulp drainability is the capacity of the pulp for water drainage and is measured by the
Schopper-Riegler degree (ºSR). The effect of CBD treatment on the drainability of different
pulps was analyzed (Figure M4.1). As can be seen, pulp drainability decreases with the refining
process (ºSR increases), because the fiber becomes more hydrated and fibrillated. The adsorption
of CBD implied a reduction of the ºSR values, as compared to the blank samples, to a maximum
Ricardo Pinto Production of CBDs and adsorption to cellulose fibres
95
of 15%, for each of the pulps used. This result has been described in a previous paper (Pala et al.,
2001) for secondary fibers. The drainage improvement has also been observed when using
cellulases (Oksanen et al., 2000; Pala et al., 2001; Stork et al., 1995). It has been theorized that
this improvement, when obtained with cellulases, is due to the hydrolysis of the amorphous
cellulose on the fibers surface and/or of the fines in the solution. The CBD sample used in this
work has a reduced ability to hydrolyze cellulose (as estimated by FPU measurement). As a
matter of fact, the release of sugars is not detected by DNS method, after the CBD treatment,
since the CBD used is almost pure, as shown elsewhere (Pinto et al., 2006). In this case, the
improved drainability may be explained by dispersion of fines, which allows the water to flow
more freely between the fibers. The stabilization of fines/fibers in aqueous medium has been
observed (Pinto et al., 2004) by SEM analysis of Whatman CF11 fibers with and without
adsorbed CBD. The stabilization may be the result of either (or both) improved fibers hydration
and steric effects.
Table M4.1 presents the water retention values (WRV) for the four kinds of fibers used.
As can be seen, the CBD adsorption increases, in most cases, the WRV value. As expected,
refining also increases WRV. It can also be seen that secondary fibers have higher WRV. These
values are in agreement with differential scanning calorimetry results, reported by Dourado et al.
(1999). In that work, it was shown that CBD adsorption increases both the bound water and the
specific heat of dehydration. In our view, the higher WRV is due to the presence of
oligosaccharides (30%, w/w) attached to the CBDs (Pinto et al., 2006), with high water affinity.
This value has been related to the fibers ability to form hydrogen bonds during paper making,
and thus, to paper strength. However, it is probable that the CBDs with linked oligosaccharides
will stabilize the fibers due to steric effects and thus reduce the interfiber interactions, in water
suspensions.
Table M4.2 presents the air permeability of the papersheets. As a general trend, the CBDs
treatment increases the air permeability. The increase is more significant for the secondary
fibers, not refined, and for the Pine fibers, at the highest refinement. The air permeability is an
important parameter, since it is related to the ability to remove water during the paper drying
step. A higher permeability implies lower drying times, thus lower heat consumption and a faster
production rate.
Figure M4.2 and Figure M4.3 show the variation induced by the CBDs adsorptions on the
physical parameters of the handsheets prepared with each kind of fiber. As can be observed, the
variation is less favorable with increasing refining. Another aspect to be retained is that for the
non-refined virgin fibers, the CBDs slightly increase the paper strength. This effect is statistically
Ricardo Pinto Production of CBDs and adsorption to cellulose fibres
96
significant for the Eucalyptus fibers. This improvement may be explained by variations on the
surface properties induced by adsorbed CBDs. The non-refined fibers have a lower overall
surface area, and hence the effect of CBD is expected to be more important in this case, since the
specific coverage of the fibers must be higher. On the other hand, by increasing the water
retention value, CBDs stabilizes the fibers, allowing for a better water drainage, hence lower
Schopper-Riegler values.
CBD Conjugation with Lysozyme
Figure M4.4 presents the size exclusion chromatogram of the obtained conjugates. As can
be observed, after the conjugation reaction, the lysozyme peak (elution time ~150 minutes) is
much lower. Moreover, the reaction leads to the appearance of higher molecular weight peaks,
which should correspond to conjugates of one molecule of lysozyme with one or more CBDs.
The CBDs obtained by proteolysis are a module from the Trichoderma reesei cellobiohydrolase I
enzyme (Pinto et al., 2006), and have only one free amine, the N-terminal one. Thus, a single
connection between each CBD and lysozyme molecules is possible. This conjugation induces a
higher cellulose affinity of the protein, as shown in Figure M4.5. The conjugates adsorption
reveals higher affinity than the one exhibited by a mixture of CBD and lysozyme, at the same
molar ratio as the conjugates. The higher affinity may result from both the presence of
multimeric proteins with several CBDs and to the lysozyme positive charge: the cellulose fibers,
being negatively charged, induce an electrostatic favorable interaction with the conjugates.
Table M4.3 shows that the conjugates do not reduce the Schopper-Riegler index as much
as CBD. In turn, the permeability is enhanced by the conjugates adsorption (Table M4.3), maybe
due to the fact that lysozyme as a high isoelectric point, and thus a high positive charge at the
used pH. Consequently, an electrostatic repulsion may yield more porous paper sheets. In terms
of the paper strength parameters, a reduction is observed, although not statistically significant
(p>0.05). Probably, the presence of the protein on the fibers/fines surface impairs the interfiber
hydrogen bonding.
Surface Properties
Table M4.4 present the ZETA-potential values, measured for the Eucalyptus and Portucel
fibers. With adsorbed CBDs (2.24 mg·gcellulose) or conjugates (4 mg·gcellulose), only the unrefined
Eucalyptus fibers present a significant variation of the measured ZETA-potential, probably due
to its lower surface area and fines content, as compared to the refined fibers. Paquot et al. (1994)
have shown that the ZETA-potential of cellulose fibers treated with proteins (BSA and
Ricardo Pinto Production of CBDs and adsorption to cellulose fibres
97
lysozyme) only for high protein surface coverage varies significantly. This may explain the
negligible ZETA-potential variation observed with the refined pulps. Due to high fines content,
thus high surface area, the ZETA-potential values of Portucel remain invariable. With Sigmacell
fibers, a much higher concentration of protein was used (13 mg·g-1 versus 2 mg·g-1 used with the
paper fibers) and, consequently, the values of ZETA-potential vary significantly as expected,
exhibiting a much higher positive value when conjugates are used.
Table M4.5 shows the apolar (γLW) and polar (γ + and γ -) surface tension components,
along with the variation of the total free energy for the interaction of fibers in water (ΔGcwc). The
ΔGcwc is a parameter indicative of the hydrophilicity (positive values) or hydrophobicity
(negative values) of the fibers (van Oss et al., 1988a). The adsorption of CBD slightly increased
the hydrophilicity of pure cellulose (Sigmacell) and of primary fibers (Eucalyptus), despite the
ZETA-potential (determined by electrophoretic mobility) increased for Sigmacell fibers after
adsorption of CBDs (Table M4.4), shifting from negative to positive values. The surface
properties of virgin Eucalyptus fibers and of Sigmacell (pure cellulose) are quite similar. The
secondary fibers (Portucel) contain print pigments, glues, etc. This may explain the different
values obtained for the polar surface tension components of the untreated fibers (higher γ+ and a
significantly lower γ -) and hydrophobic paper surface (negative ΔGcwc). Thus, a different effect
of the CBD adsorption may be expected. As seen in Table M4.5, the CBD adsorption reduces the
negative component (γ -), an effect not observed with the other studied fibers (virgin Eucalyptus
fibers and the pure cellulose Sigmacell). The ΔGcwc does not account for steric and hydration
forces, that may be quite relevant when analyzing the effect of adsorbed proteins on the surface
properties. The results (Table M4.5) show that CBDs adsorption did not change the polar and
apolar surface properties dramatically. Nevertheless, the effect in the hydration and interfiber
interaction is relevant, as revealed by WRV and the higher value of ΔGcwc.
The adsorption of conjugates to pure cellulose (Sigmacell) increased the ZETA potential
more than the CBDs (Table M4.4), as expected from their positive charge at pH 5.0. The
adsorption of the positively charged conjugates strongly reduces the fibers γ - (negative polar
component), as may be observed on Table M4.5. Consequently, due to the reduction of polarity,
the fibers surface becomes hydrophobic (negative ΔGcwc). This effect is also a consequence of
the properties of dry lysozyme, which has a hydrophobic character (Van Oss et al., 1988b). It
should be mentioned that even after 10 seconds of the first contact of the water drop with the
Sigmacell with adsorbed conjugates, virtually no absorption of water was observed, as opposed
to the other fibers. Since the Portucel fibers are hydrophobic, the conjugate adsorption did not
produce any major modification of the surface tension components. Due to the much higher
Ricardo Pinto Production of CBDs and adsorption to cellulose fibres
98
protein concentration (13 mg/gcellulose) used in the assays with Sigmacell, a dramatic effect is
observed; in the case of Portucel fibers, the protein concentration (2 mg/gcellulose) was insufficient
to induce a similar effect.
Conclusion
The CBD adsorption leads to a change on the surface properties of fibers, as revealed by
the change in the pulp drainage and air permeability of the papersheets. When conjugated to
other proteins, CDBs may be used to drive other proteins/molecules, with different properties, to
the fibers surface, enhancing the paper functionality. It is possible, with this strategy, to modify
both the technical properties of pulp and paper and the fibers surface properties, such as electric
charge and hydrophobicity.
Acknowledgments
Ricardo Pinto was supported by Fundação para a Ciência e a Tecnologia (FCT) grant
SFRH/BD/6934/2001.
Bibliography
Black, G.W., Rixon, J.E., Clarke, J.H., Hazlewood, G.P., Ferreira, L.M. A., Bolam, D.N.,
Gilbert, H.J., 1997. Cellulose binding domains and linker sequences potentiate the activity of
hemicellulases against complex substrates. J. Biotechnol. 57, 59-69.
Dourado, F., Mota, M., Pala, H., Gama, F.M., 1999. Effect of cellulase adsorption on the surface
and interfacial properties of cellulose. Cellulose 6, 265-282.
Geng, X., Li, K., 2003. Deinking of recycled mixed office paper using two endo-glucanases,
CelB and CelE, from the anaerobic fungus Orpinomyces PC-2. TAPPI J. 2, 29-32.

Ricardo Pinto Production of CBDs and adsorption to cellulose fibres
99
Irwin, D., Shin, D.-H., Zhang, S., Barr, B.K., Sakon, J., Karplus, P.A., Wilson, D.B., 1998. Roles
of the Catalytic Domain and Two Cellulose Binding Domains of Thermomonospora fusca E4 in
Cellulose Hydrolysis. J. Bacteriol. 180, 1709-1714.
Jackson, L.S., Heitmann, J.A., Joyce, T.W., 1993. Enzymatic modifications of secondary fiber.
TAPPI J. 76, 147-154.
Johnson, G.L., Macandrew, V.I., Pilch, P.F., 1981. Identification of the glucagon receptor in rat
liver membranes by photoaffinity crosslinking. Proc. Natl. Acad. Sci. USA 78, 875-878.
Kitaoka, T., Tanaka, H., 2001. Novel paper strength additive containing cellulose-binding
domain of cellulose. J. Wood Sci. 47, 322-324.
Mattinen, M.-L., Linder, M., Drakenberg, T., Annila, A., 1998. Solution structure of the
cellulose-binding domain of endoglucanase I from Trichoderma reesei and its interaction with
cello-oligosaccharides. Eur. J. Biochem. 256, 279-286.
Oksanen, T., Pere, J., Paavilainen, L., Buchert, J., Viikari, L., 2000. Treatment of recycled kraft
pulps with Trichoderma reesei hemicellulases and cellulases. J. Biotechnol. 78, 39–48.
Paquot, M., Godin, F., Dumont de Chassart, Q., 1994. Effects of electrokinetic characteristics on
the formation of a protein-microcrystalline cellulose complex. Lebensm. Wiss. u. Technol. 27,
11-15.
Pala, H., Lemos, M.A., Mota, M., Gama, F.M., 2001. Enzymatic upgrade of old paperboard
containers. Enzyme Microb. Technol. 29, 274–279.
Pinto, R., Moreira, S., Mota, M., Gama, M., 2004. Studies on the Cellulose-Binding Domains
Adsorption to Cellulose. Langmuir 20, 1409-1413.
Pinto, R., Carvalho, J., Mota, M., Gama, M., 2006. Large Scale Production of Cellulose-Binding
Domains. Adsorption Studies Using CBD-FITC Conjugates. Cellulose (Accepted for
publication), (Available: http://www.springerlink.com/link.asp?id=6107175714463362).

Ricardo Pinto Production of CBDs and adsorption to cellulose fibres
100
Reinikainen, T., Takkinen, K., Teeri, T.T., 1997. Comparison of the adsorption properties of a
single-chain antibody fragment fused to a fungal or bacterial cellulose-binding domain. Enzyme
Microb. Technol. 20, 143-149.
Senior, D.J., Hamilton, J., 1993. Xylanase treatment for the bleaching of softwood kraft pulps:
the effect of chlorine dioxide substitution. TAPPI J. 76, 200-206.
Seo, Y.B., Shin, Y.C., Jeon, Y., 2000. Enzymatic and mechanical treatment on chemical pulp.
TAPPI J. 83, 1-9.
Silvy, J., Romatier, G., Chiodi, R., 1968. Méthodes pratiques de contrôle du raffinage. Revue
A.T.I.P. 22, 31-53.
Stork, G., Pereira, H., Wood, T.M., Düsterhöft, E.M., Toft, A., Puls, J., 1995. Upgrading
recycled pulps using enzymatic treatment. TAPPI J. 78, 79-88.
Suurnäkki, A., Kantelinen, A., Buchert, J., Viikari, L., 1994. Enzyme-aided bleaching of
industrial softwood kraft pulps. TAPPI J. 77, 111-116.
van Oss, C.J., Chaudhury, M.K., Good, R.J., 1988a. Interfacial Lifshitz-van der Waals and Polar
Interactions in Macroscopic Systems. Chem. Rev. 88, 927-941.
van Oss, C.J., Good, R.J., Chaudhury, M.K., 1988b. Additive and nonadditive surface tension
components and the interpretation of contact angles. Langmuir 4, 884-891.

Ricardo Pinto Production of CBDs and adsorption to cellulose fibres
101
Figures
Figure M4.1. Schopper-Riegler index obtained for the several paper fibers studied.
Figure M4.2. Physical properties variation between the CBD treated and untreated (control), at
three different beating revolutions (0, 1000 and 3000), of virgin (primary) fibers, with the
respective confidence interval at 95%. The stars (*) indicates a statistic meaningful
variation (p<0.05).

Ricardo Pinto Production of CBDs and adsorption to cellulose fibres
102
Figure M4.3. Physical properties variation between the CBD treated and untreated (control), at
three different beating revolutions (0, 1000 and 3000), of recycled (secondary) fibers, with
the respective confidence interval at 95%. The stars (*) indicates a statistic meaningful
variation (p<0.05).
Figure M4.4. Size exclusion chromatography of the CBD-lysozyme conjugate and of a mixture
of the two proteins.
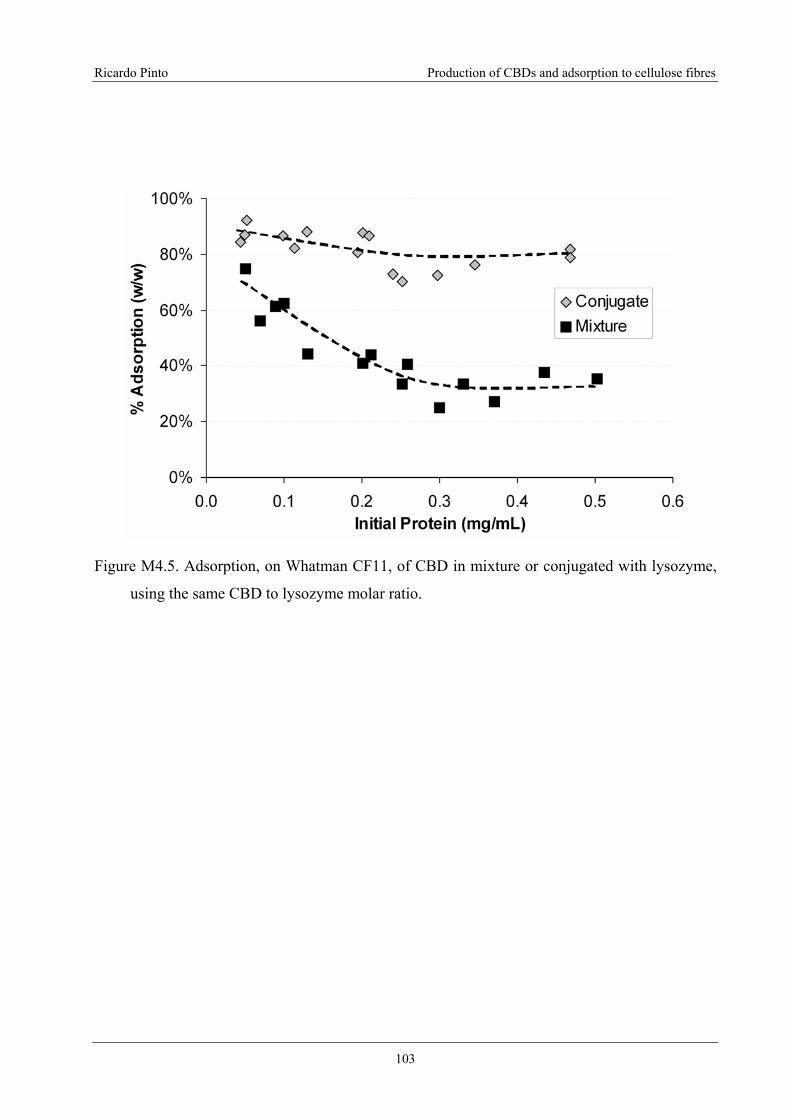
Ricardo Pinto Production of CBDs and adsorption to cellulose fibres
103
Figure M4.5. Adsorption, on Whatman CF11, of CBD in mixture or conjugated with lysozyme,
using the same CBD to lysozyme molar ratio.

Ricardo Pinto Production of CBDs and adsorption to cellulose fibres
104
Tables
Table M4.1. Water retention value (WRV) obtained for the fibers used (± confidence interval at
95%).
WRV (g/g) 0 1000 3000
Blank 0.78 ± 0.01 1.12 ± 0.02 1.38 ± 0.02 a Eucalyptus
CBD 0.78 ± 0.01 1.14 ± 0.01 1.44 ± 0.02 a
Blank 0.91 ± 0.01a 1.21 ± 0.01 a 1.46 ± 0.01 Pine
CBD 0.93 ± 0.01a 1.24 ± 0.01 a 1.47 ± 0.02
Blank 1.19 ± 0.01 a 1.41 ± 0.02 1.55 ± 0.01 a Portucel
CBD 1.22 ± 0.01 a 1.40 ± 0.02 1.62 ± 0.01 a
Blank 1.08 ± 0.02 a 1.30 ± 0.02 a 1.59 ± 0.02 a Niza
CBD 1.11 ± 0.01 a 1.33 ± 0.01 a 1.49 ± 0.01 a
a Means statistically different (p<0.05)
Table M4.2. Permeability of papersheets obtained for the cellulose types used (± confidence
interval at 95%).
Permeability (μm/Pa/s) 0 1000 3000
Blank 53.4 ± 0.7 a 40.4 ± 1.2 a 12.3 ± 1.4 Eucalyptus
CBD 54.4 ± 0.4 a 43.7 ± 1.9 a 12.2 ± 1.3
Blank 60.9 ± 0.2 a 54.5 ± 1.0 32.4 ± 1.5 a Pine
CBD 60.4 ± 0.1 a 54.1 ± 0.6 37.0 ± 1.8 a
Blank 10.7 ± 0.5 a 1.88 ± 0.12 0.62 ± 0.02 a Portucel
CBD 16.2 ± 1.4 a 1.80 ± 0.10 0.43 ± 0.03 a
Blank 11.6 ± 0.3 a 3.18 ± 0.10 a 1.16 ± 0.02 b Niza
CBD 13.6 ± 0.3 a 3.53 ± 0.12 a 1.94 ± 0.09 b
a Means statistically different (p<0.05); b Means with different variances

Ricardo Pinto Production of CBDs and adsorption to cellulose fibres
105
Table M4.3. Physical properties of the Portucel fibers without treatment (Blank) and CBD or
conjugate treated (± confidence interval at 95%).
Blank CBD Conjugate
Schopper-Riegler Index
(ºSR) 48.4 ± 5.1 a 40.5 ± 5.1 a 43.6 ± 5.7 a
Permeability
(μm/Pa/s) 6.78 ± 0.25 a 8.12 ± 0.19 a 9.27 ± 0.29 a
Tensile Strength Index
(N·m/g) 38.1 ± 0.9 38.3 ± 0.7 36.7 ± 0.6
Breaking Length
(mm) 2.49 ± 0.13 2.42 ± 0.11 2.36 ± 0.12
Tear Index
(mN·m2/g) 2.78 ± 0.37 2.56 ± 0.38 2.94 ± 0.46
a Means statically different (p<0.05)
Table M4.4. ZETA-potential measurements (mV), by streaming potential, of Portucel and
Eucalyptus (two different refinement conditions) fibers, without treatment (Blank) and
CBD or conjugate treated, and of Sigmacell fibers made by electrophoretic mobility (±
confidence interval at 95%).
Fiber batch 1 Fiber batch 2
Blank CBD Blank CBD Conjugate
Portucel 0 PFI -60.3 ± 0.5 -58.5 ± 0.8(a) -40.5 ± 1.1 -38.3 ± 0.5(b) -38.1 ± 0.5(c)
0 PFI -81.2 ± 1.2 -59.7 ± 0.6(a) -71.3 ± 1.0 -65.2 ± 0.6(b) -57.8 ± 0.7(c) Eucalyptus
3000 PFI – – -52.7 ± 0.6 -53.6 ± 1.0(b) -54.3 ± 0.2(c)
Sigmacell – – – -11 ± 1 10 ± 1(d) 40 ± 1(d) Assays made with a mass of protein per gram of dry cellulose of (a) 2 mg, (b) 2.24 mg, (c) 4 mg and (d) 13 mg.

Ricardo Pinto Production of CBDs and adsorption to cellulose fibres
106
Table M4.5. Surface tension components (γLW, γ+ and γ-, mJ/m2) and degree of hydrophobicity
(ΔGcwc, mJ/m2) for cellulose fibers without treatment (Blank) and CBD or conjugate
treated, obtained by contact angle. Examples of contact images of water drops are also
shown. The protein concentration used are as refered in Table M4.4.
Blank CBD Conjugate
γLW 39.8 39.8 –
γ + 0.82 0.83 –
γ - 44.3 46.5 –
Euc
alyp
tus
ΔGcwc 21.2 23.9
–
γLW 38.7 39.7 40.0
γ + 0.91 0.69 1.10
γ - 45.5 49.4 11.9
Sigm
acel
l
ΔGcwc 22.9 28.0
-31.1
γLW 41.3 41.7 41.2
γ + 3.03 4.61 3.90
γ - 1.52 0.04 0.23
Port
ucel
ΔGcwc -56.7 -62.7
-62.3