immunophenotypic, genetic and molecular characterization ... chronic... · sempre presente! muito...
TRANSCRIPT

Ana Filipa Parreira Carvalheira dos Santos Henriques
Immunophenotypic, genetic and molecular characterization of B-cell chroniclymphoproliferative disorders: multiclonal versus monoclonal nature
Tese de Doutoramento em Biociências, ramo de especialização em Biologia Celular e Molecular, orientada pelo ProfessorDoutor Alberto Órfão e pelo Professor Doutor Carlos Faro e apresentada ao Departamento de Ciências da Vida
da Faculdade de Ciências e Tecnologia da Universidade de Coimbra
Julho 2014

Ana Filipa Parreira Carvalheira dos Santos Henriques
Immunophenotypic, genetic and molecular characterization of B-cell chronic lymphoproliferative disorders: multiclonal versus
monoclonal nature
Tese de Doutoramento em Biociências, ramo de especialização em Biologia Celular e Molecular, orientada pelo Professor
Doutor Alberto Órfão e pelo Professor Doutor Carlos Faro e apresentada ao Departamento de Ciências da Vida da Faculdade de Ciências e Tecnologia da Universidade de Coimbra
Julho 2014


This thesis was developed with the support of:
PhD grant attributed to Ana Henriques
(SFRH/BD/31609/2006)
Department of Life Sciences, Faculty of Sciences and
Technology (FCTUC)
Cancer Research Center, University of Salamanca (Spain)
Blood and Transplantation Center of Coimbra/
Portuguese Institute of Blood and Transplantation


Aos meus avós,
Aos meus pais,
À minha irmã


Acknowledgements
“O valor das coisas não está no tempo que
elas duram, mas na intensidade com que
acontecem. Por isso existem momentos
inesquecíveis, coisas inexplicáveis e pessoas
incomparáveis.”
Fernando Pessoa
Algum dia a tão aguardada meta teria de ser avistada no horizonte… longe vai o
primeiro dia em que iniciei tão longa jornada, vivida ao sabor de tantos sorrisos e lágrimas
alimentadas por pessoas extraordinárias! E agora que o grande momento chegou, o tão
desejado “prémio” é finalmente entregue. Desta forma, e para deixar de lado o cansaço e a
emoção da chegada, e visto que os anos galoparam no tempo, desejo expressar os meus
sinceros agradecimentos a todos os que, de uma forma ou outra, contribuíram para a
realização desta tese. Porque sem vocês até poderia ser possível…mas não era a mesma coisa!
O “prémio” também é vosso!
Em primeiro lugar, queria expressar o meu mais sincero agradecimento ao Professor
Doutor Alberto Órfão, meu orientador científico, pelos seus ensinamentos, dedicação, apoio,
paciência e confiança durante a realização desta tese. Foi um privilégio enorme poder
acompanhar tão de perto o seu rigor científico, objectividade, inteligência e entusiasmo com
que sempre me transmitiu os seus infinitos ensinamentos com os quais me motivou a
enveredar pelo mundo encantado da citometria ainda alguns anos antes de iniciar a minha
“aventura”. Um agradecimento especial dirigido ao seu grupo de trabalho, pela partilha de
experiência e conhecimento, por sempre me receberem de braços abertos e me motivarem a
seguir em frente! A mis compañeros del Centro de Investigación del Cáncer, especialmente del
laboratorio 11, gracias por todo el apoyo e inestimable amistad que me habéis dado a lo largo
de estos años. A la Doctora Julia Almeida, por toda su colaboración y disponibilidad constante;
a María Jara por los primeros pasos en las purificaciones de ADN; a Sergio por la buena
disposición (siempre), a Guillermo por su ayuda hasta en esta última etapa; a Quentin, el
“mago”, al cual cualquier problema sin solución terrenal se resuelve en un “pispás” (nuestros
artículos no serían tan bonitos sin ti); a Nacho (facilitándome siempre el trabajo); a Lourdes,

Martín, Manuel, Carmen, Raquel, María Campos, Andrea, Paula, Noelia, MariLuz (la pionera de
los multiclonales) y Paloma. A mi dear coworker Arancha… ¡Que haría sin ti! Has sido mi mano
derecha pero también un hombro amigo donde apoyar la cabeza! Muchas gracias por lo
muchísimo que he aprendido contigo, por tu ayuda, confianza, colaboración, apoyo (pierdo la
cuenta a las veces que me has dicho ÁNIMO!) y por supuesto por tu amistad! Y hoy soy yo que
te dejo una cita: “Una alegría compartida se transforma en doble alegría; una pena
compartida, en media pena." ¡Te deseo lo mejor!
A mis compañeros del Hospital Universitario de Salamanca: el equipo de Citometría
(Toño, Carlos, Susana, Juana, Rosana, Juan); el equipo de Biologia Molecular (al Doctor Marcos
González y a la Doctora Ana Balanzategui, así como tantos otros) por el buen ambiente de
trabajo, los buenos ratos, por toda la ayuda y apoyo; el equipo de la FISH (Ana Rasillo, Chema,
Maria GG y Laura), por vuestra disponibilidad y ayuda por el mundo oscuro que florece a
través de las lentes del microscopio de fluorescencia.
A todos los compañer@s/amig@s que han pasado por el laboratorio y/o hospital y
que, de una u otra forma, han tenido un impacto en esta etapa de mi vida: Carlos, Elaine,
Francesco, Teresas, Bruno, Evan, Inês, Nicole, Paula (pelas horas intermináveis na biblioteca e
pelos jantares e viagens bem animadas) entre muchos otros... Un agradecimiento muy especial
a mi amiga Wendy por todas las risas (y lágrimas) que llenaron nuestros días y noches, por tu
alegría y fuerza (Salamanca no ha sido la misma sin ti!). Ao meu companheiro e amigo Leandro
Thiago que encheu os nossos dias de histórias inesquecíveis repletas de gargalhadas… foi
muito gostoso, meu “brother”!
Um agradecimento muito especial à Cristina que me acompanhou desde os meus
primeiros passos… nem sei bem onde te colocar na história, porque na verdade estiveste
sempre presente! Muito obrigada pelos teus ensinamentos e por todo o apoio e amizade que
partilhamos ao longo de tantos anos!
A todas as Unidades de Saúde e médicos envolvidos, um agradecimento pelo empenho
e disponibilidade na cedência das amostras e dados clínicos dos doentes.
Ao Professor Doutor José António Pereira da Silva que apesar de não ter contribuído
directamente para o meu trabalho, agradeço por toda a ajuda que me prestou na sua
conclusão.
Ao já extinto Centro de Histocompatibilidade do Centro de Coimbra, um
agradecimento muito especial, por ter sido a minha segunda casa (a marquesa a minha
segunda cama), onde encontrei a amizade, simpatia e boa disposição que me permitiu aliar a
ciência à amizade. Ao Doutor Artur Paiva, que apesar de não o ser oficialmente, foi o meu
orientador em todos os trabalhos que desenvolvi (mas também me conseguiu desorientar

algumas vezes). Um agradecimento especial por desde cedo me ter entusiasmado pela ciência.
Por todo o sentido crítico, inteligência, bom humor e apoio que sempre me transmitiu ao
longo destes anos, que tanto contribuíram para o meu crescimento científico e pessoal,
constituindo para mim uma referência. No fundo, é tudo isto que faz dele não só um bom
orientador mas também um amigo. Uma palavra de apreço ao Doutor Martinho, pela
oportunidade de poder desenvolver este trabalho num grupo de excelência, quer em termos
humanos quer científicos, que vi crescer e ao qual sempre me orgulhei de pertencer. Foram
tantas as amizades que nasceram ao longo de 10 anos… desde aqueles que marcaram os
primeiros anos: Zé Mário (o Grande Senhor das ideias), João Duarte, Anabela Almeida, Joana
Caetano; àqueles que marcaram presença constante e sempre mostraram capacidade de
interajuda: Isabel Silva (a minha professora de laboratório e minha mão direita no estudo
imunofenotípico por citometria de fluxo), Ju (ninguém se compara a Jesus… está sempre em
todo o lado e tudo lhe toca fazer!), Faria (sempre bem disposto e pronto a dar o braço pela
ciência), Eng. André (companheiro de longas noites de trabalho), Susana Pedreiro, Olivia,
Rosário, Jeanette, Albertina, Ana Sofia, Ana Gonçalves, Cristina, Zé Manel; e muitos que
permaneceram por períodos variados mas que independentemente da duração gravaram com
muito carinho na minha memória a sua presença: Alice (as coisas que se faziam quando
estavas por perto, Rosa Alice!), Tiago (Tiaguinho, meu parceiro e minha vítima preferida), Ana
Lopes (apresentações mais lindas que as tuas não há!), Manel e Catarina (os meus queridos
estagiários), Sandrine, Mónica (saudades das tuas massagens…), Dona Celeste e Dona Glória
(as minhas mãezinhas e vitimas de tantas partidas), Dra. Carla, André Mozes, Sara, Sandra,
Andreia Ribeiro, Sofia Ramos, Micaela, Sónia Oliveira, João Marrão, Andreia Neves, Maria
João… a lista é longa! A todos um Obrigado saudoso, por terem feito parte da minha
construção.
Agradeço ainda, com especial carinho aos meus amigos, uns mais antigos e outros
mais recentes (Cristiana, Clara, Rita, Hélder, Inês Oliveira, Paulo, Ivone, Paula), que sempre me
apoiaram e que nunca desistiram de me perguntar: “Então, já és Doutora?”
Ao Humberto por acreditar em mim, me apoiar e por ter a capacidade de me fazer rir e
chorar ao mesmo tempo; por toda a paciência nesta conturbada fase que é escrever a tese.
Por gostar de mim como sou.
Às minhas meninas do coração… Andreia e Patrícia! Minhas companheiras de jornadas
que marcaram para sempre a minha vida. Obrigada por me entenderem até quando nem eu
me entendo e aturarem as minhas loucuras, os meus stresses infinitos… pelas conversas
longas, pelas risadas e parvoeiras mas principalmente pela nossa amizade que nos permite que
nunca nos separemos mesmo seguindo caminhos diferentes.

Por fim, e o mais importante agradecimento sincero e eterno aos meus pais. Por tudo
o que me têm proporcionado ao longo dos anos e que me permitiu chegar aqui, por todos os
valores que me transmitiram e dos quais me orgulho, por todo o carinho, compreensão,
paciência e ajuda constante ao longo dos anos. Por acreditarem em mim e me incentivarem
mesmo quando as forças não chegam. Muito Obrigado! À minha irmã, agradeço por toda a
paciência e carinho que sempre me dedicou e principalmente pela nossa amizade que nos
permite ultrapassar as nossas diferenças e superar qualquer distância! Aos meus avós, por
todo o amor e carinho que sempre me transmitiram, em especial ao avô Silvestre (que tanto
orgulho teria na sua Aninhas) e à avó Bia e ao avô Carvalheira, que me viram começar esta
viagem mas que, infelizmente, não puderam ver‐me terminar…
MUITO OBRIGADO POR TUDO!

TABLE OF CONTENTS


XIII
Abbreviations XIX
ABSTRACT/RESUMO 1
Abstract 3
Resumo 5
Key-words/Palavras-chave 9
CHAPTER 1. GENERAL INTRODUCTION 11
1. B-CELL ANTIGEN RECEPTOR 15
1.1. Basic structure of the B-cell receptor 15
1.2. The B-cell receptor repertoire 16 11
1.2.1. Germline immunoglobulin genes and lymphocyte diversity 16
1.2.2. Biases in combinatorial and junctional diversity and shaping 17
of the BCR repertoire
2. B-CELL ONTOGENY 19
2.1. Antigen independent B-cell differentiation in the bone marrow 20
2.2. Antigen dependent B-cell maturation in the periphery 22
2.2.1. Peripheral distribution and maturation of immature to naïve B cells 22
2.2.2. T-cell dependent and T-cell independent B-cell responses to antigen 23
2.2.3. Somatic hypermutation and Ig class-switch recombination 23
2.2.4. Circulating human memory B cells and their diversity 24
2.2.5. Terminal B-cell differentiation to plasmablasts and plasma cells 27
3. B-CELL CHRONIC LYMPHOPROLIFERATIVE DISORDERS 27
3.1. Monoclonal B-cell lymphocytosis 31
3.1.1. Diagnostic criteria for MBL and its subtypes 31
3.1.2. Prevalence of MBL 32
3.1.3. Risk factors for progression from CLL-like monoclonal B-cell 33
lymphocytosis to chronic lymphocytic leukemia
3.2. Chronic lymphocytic leukemia 37
3.2.1. Definition and diagnostic criteria for CLL 37

XIV
3.2.2. Immunophenotypic features of CLL cells 38
3.2.3. Molecular features of CLL cells 38
3.2.3.1. Immunoglobulin heavy chain variable region gene usage in CLL 38
3.2.3.2. Stereotyped B-cell receptors in CLL 39
3.2.3.3. Recognition of conserved epitopes by CLL cells 40
3.2.4. Genomic aberrations in CLL 41
3.2.5. Outcome and prognosis of CLL patients 42
3.2.5.1. Clinical and biologic prognostic factors 42
3.2.5.2. Immunogenetic parameters and profiles with prognostic impact 45
in CLL
3.2.6. The cell of origin of CLL-like MBL and CLL 46
3.2.6.1. Multistep models for human CLL development 47
3.2.6.2. Stepwise model of development of MBL into CLL from early HSC 51
3.3. B-cell lymphoproliferative disorders (B-CLPD) other than chronic 52
lymphocytic leukemia (CLL)
3.3.1. Peripheral/mature B-cell chronic lymphoid leukemias other than CLL 54
3.3.1.1. B-cell prolymphocytic leukemia 54
3.3.1.2. Hairy cell leukemia 54
3.3.2. Peripheral/mature B-cell lymphomas other than SLL 56
3.3.2.1. Marginal zone lymphoma 56
3.3.2.1.1. Extranodal marginal zone lymphoma of mucosa-associated 56
lymphoid tissue or MALT lymphoma
3.3.2.1.2. Splenic marginal zone lymphoma 57
3.3.2.1.3. Nodal marginal zone lymphoma 57
3.3.2.1.4. Primary bone marrow marginal zone lymphoma 58
3.3.2.2. Follicular lymphoma 59
3.3.2.3. Mantle cell lymphoma 60
3.3.2.4. Diffuse large B-cell lymphoma 61
3.3.2.5. Burkitt lymphoma 62
3.3.2.6. Lymphoplasmacytic lymphoma / Waldenström macroglobulinemia 63
3.3.3. Multiclonal lymphoproliferative disorders 64
3.3.3.1. Composite lymphomas 64
3.3.3.2. Intraclonal evolution versus multiclonality in B-cell chronic 65
lymphoproliferative disorders

XV
3.3.3.3. Criteria for multiclonality 65
3.3.3.4. Multiclonality in chronic lymphocytic leukemia 67
4. HYPOTHESIS AND OBJECTIVES 67
CHAPTER 2. COMBINED PATTERNS OF IGHV REPERTOIRE AND
CYTOGENETIC/ MOLECULAR ALTERATIONS IN MONOCLONAL B
LYMPHOCYTOSIS VERSUS CHRONIC LYMPHOCYTIC LEUKEMIA 71
2.1. Abstract 73
2.2. Materials and Methods 73
2.2.1. Patients and samples 73
2.2.2. Immunophenotypic analyses 75
2.2.3. Fluorescence-activated cell sorting (FACS) purification of B-cell 76
populations (FACSorting)
2.2.4. Cytogenetic and molecular studies 76
2.2.5. Statistical methods 78
2.3. Results 79
2.3.1. Overall size and BCR features of CLL-like MBL and CLL B-cell clones 79
2.3.2. Cytogenetic features and NOTCH1 mutation in CLL-like MBL and 79
CLL B-cell clones
2.3.3. Molecular characteristics of CLL-like MBL and CLL B-cell clones 81
2.3.4. Relationship between the most frequently used IGHV genes and 83
the cytogenetic profile of CLL-like MBL and CLL B-cell clones
2.4. Discussion 86
CHAPTER 3. MOLECULAR AND CYTOGENETIC CHARACTERIZATION OF
EXPANDED B-CELL CLONES FROM MULTICLONAL VERSUS
MONOCLONAL B-CELL CHRONIC LYMPHOPROLIFERATIVE DISORDERS 91
3.1. Abstract 93
3.2. Materials and Methods 93
3.2.1. Patients and samples 93
XVI
3.2.2. Immunophenotypic analyses 94
3.2.3. Cytogenetic and molecular studies 95
3.2.4. Statistical methods 96
3.3. Results 96
3.3.1. Distribution and immunophenotypic features of B-cell clones 96
3.3.2. Overall size and BCR features of B-cell clones from multiclonal 97
versus monoclonal MBL, CLL and other B-CLPD cases
3.3.3. Cytogenetic features of B-cell clones from multiclonal versus 99
monoclonal MBL and B-CLPD cases
3.3.4. Molecular characteristics of the BCR of B-cell clones from 102
multiclonal versus monoclonal MBL and B-CLPD cases
3.3.5. Molecular features of phylogenetically related BCRs of B-cell clones 106
from multiclonal cases
3.3.6. Homology of the HCDR3 region between B-cell clones coexisting 107
in multiclonal cases versus non-coexisting (monoclonal) B-cell clones
3.4. Discussion 109
CHAPTER 4. SUBJECTS WITH CHRONIC LYMPHOCYTIC LEUKEMIA-LIKE
B-CELL CLONES WITH STEREOTYPED B-CELL RECEPTORS FREQUENTLY
SHOW MYELODYSPLASIA-ASSOCIATED PHENOTYPES ON MYELOID CELLS 113
4.1. Abstract 115
4.2. Materials and Methods 115
4.2.1. CLL patients and MBL subjects 115
4.2.2. Cytogenetic and molecular studies 116
4.2.3. Immunophenotypic analyses of PB myeloid cells 117
4.2.4. Statistical methods 117
4.3. Results 117
4.3.1. Molecular and cytogenetic features of CLL and MBL B-cell clones 117
with stereotyped versus non-stereotyped IGHV amino acid sequences
4.3.2. Haematological features of CLL and CLL-like MBL B-cell clones with 121
stereotyped versus non-stereotyped IGHV amino acid sequences
4.4. Discussion 122

XVII
CHAPTER 6. REFERENCES 131
SUPPORTING INFORMATION 159
Supplemental Table 1. Informative parameters of the CLL-like/CLL B-cell clones 161
included in the three major groups graphically visualized with APS view of the
InfinicytTM software
Supplemental Table 2. IGHV sequences of CLL-like MBL and CLL B-cell clones 164
analyzed by the IMGT-V-QUEST tool
Supplemental Table 3. Diagnosis, differential immunophenotypic/IGHV features 171
and cytogenetic alterations of the coexisting aberrant B-cell populations from
multiclonal MBL, CLL and other B-CLPD cases (n=41)
Supplemental Table 4. Peripheral blood B-cell counts and BCR features of 174
multiclonal versus monoclonal CLL-like and non-CLL-like B-cell clones
Supplemental Table 5. Cytogenetic features of non-CLL like B-cell clones from 175
monoclonal cases
Supplemental Table 6. Monoclonal cases with B-cell clones sharing HCDR3 176
sequences of the same length (± 1 amino acid) and belonging to identical or
evolutionary highly-related VH families
Supplemental Table 7. Haematological features of B-CLPD cases who received 178
chemotherapy
CHAPTER 5. CONCLUDING REMARKS 127


Abbreviations


XXI
A A: Adenine aa: Amino acid ADCC: Antibody-dependent cell-mediated cytotoxicity
AF700: AlexaFluor 700
Ag: Antigen
AID: Activation-induced cytidine deaminase ALK: Anaplastic lymphoma kinase AML: Acute myeloid leukemia
APC: Allophycocyanin
APRIL: Proliferation-inducing ligand
APS: Automated population separator ATM: Ataxia telangiectasia mutated
B BAFF: B-cell activating factor
BCL2: B-cell lymphoma/leukemia 2
B-CLPD: B-cell chronic lymphoproliferative disorders
BCR: B-cell receptor
BDB: Becton/Dickinson Biosciences
BM: Bone marrow
B-NHL: Non-Hodgkin B-cell lymphoma
BSAP: B-cell-specific activator protein
C C: Cytosine CDK4: Cyclin-dependent kinase 4 CDR: Complementary-determining region
CLL: Chronic lymphocytic leukemia
CMV: Cytomegalovirus
CSR: Class switch recombination
CTLA-4: Cytotoxic T-lymphocyte antigen 4
Cy: Intracellular
D D: Diversity
DLBCL: Diffuse large B-cell lymphoma
DNA: Deoxyribonucleic acid
ds: Double stranded
E EBF: Early B-cell factor
EBV: Epstein–Barr vírus
F FBXW7: F-box and WD repeat domain containing 7 FITC: Fluorescein isothiocyanate
FL: Follicular lymphoma
FR: Framework region
FSC: Forward light scatter
G G: Guanine
GC: Germinal center
GEP: Gene expression profile
H H: Heavy chain
HC: Hairy cell HCDR3: Heavy chain complementary-determining region 3
HCL: Hairy cell leukemia
HCLv: Hairy cell leukemia variant HCV: Hepatitis C virus HHV8: Human herpes virus 8
HIV: Human immunodeficiency virus
HL: Hodgkin lymphoma HLA: Human leukocyte antigen HS1: Specific Lyn substrate 1 HSA: Heat stable antigen HSC: Hematopoietic stem cell
I iFISH: Interphase fluorescence in situ hybridization
Ig: Immunoglobulin
IGHV: Immunoglobulin heavy chain variable region
IGHC: Immunoglobulin heavy chain constant region IL: Interleukin
IMGT: ImMunoGeneTics (data base)
J J: Joining K KLHL6: Kelch-like family member 6
L L: Light chains
LDL: low-density lipoprotein
LN: Lymph nodes
LPL: Lymphoplasmacytic lymphoma
M mAb: Monoclonal antibody
MALT: Mucosa-associated lymphoid tissue
MBL: Monoclonal B-cell lymphocytosis
MBLhigh
: MBL with absolute B-lymphocytosis or high count MBL MBL
low: MBL without absolute B-lymphocytosis or low
count MBL MCL: Mantle cell lymphoma MDM2: E3 ubiquitin-protein ligase
MDS: Myelodysplastic syndrome
MEAC: Myosin-exposed apoptotic cell
MFC: Multiparameter flow cytometry

XXII
MGUS: Monoclonal gammopathy of undetermined significance
miRNA: Micro ribonucleic acid
MM: Multiple myeloma
mRNA: Messenger ribonucleic acid MYD88: Myeloid differentiation primary response gene 88
MYHIIA: Non-muscle myosin heavy chain IIA
MZL: Marginal zone lymphoma
N NLR: Nucleotide oligomerization domain-like receptors
NMZL: Nodal marginal zone lymphoma
O ORF: Open reading frame
P PacB: Pacific blue
PacO: Pacific orange
PB: Peripheral blood
PBM-MZL: Primary bone marrow marginal zone lymphoma
PC: Principal component
PCA: Principal component analysis
PCR: Polymerase chain reaction
PE: Phycoerythrin
PE-Cy7: PE–cyanin 7 PerCPCy5.5: Peridinin chlorophyll protein-cyanin 5.5 PLL: B-cell prolymphocytic leukemia
R R: Replacement mutations
RAG: Recombinase activating gene protein
RB: Retinoblastoma gene
RF: Reading frame
RSS: Recombination signal sequence
S S: Silent mutation SF3B1: Splicing factor 3b subunit 1
SHM: Somatic hypermutation
SLL: Small lymphocytic lymphoma
Sm: Surface membrane
SMZL: Splenic marginal zone lymphoma
SO: Spectrum orange
SpA: Staphylococcus aureus protein A
ss: Single‐stranded
SSC: Sideward light scatter
SSCb: Sodium chloride citrate buffer
T T: Thymine
TD: T cell-dependent
TdT: Terminal deoxynucleotidyl transferase TI: T cell-independent TIR8: Toll IL-1R 8 TLR: Toll‐like receptor TP53: tumor protein p53
U U: Uracil
V V: Variable
W WBC: White blood cell
WHO: World Health Organization
WGS: Whole-genome sequencing
WM: Waldenström macroglobulinemia
X XPO1: Exportin 1

Abstract / Resumo


3
Increasing knowledge exists about the mechanisms involved in the pathogenesis of B-
cell chronic lymphoproliferative disorders (B-CLPD). Generally, tumor cell survival and/or
proliferation depend both on the genetic abnormalities of neoplastic cells and the tumor
microenvironment. Therefore, the development and widespread of molecular techniques for
the characterization of both tumor cell genetic alterations and B-cell receptor (BCR) features,
have been pivotal in the understanding of B-CLPD. As a consequence, chronic lymphocytic
leukemia (CLL) is now considered as the prototype for several B-cell diseases where
microenvironmental interactions, rather than a specific genetic abnormality, are critical in the
onset, expansion and even progression of the disease, in at least a fraction of cases. Thus, a
biased repertoire of the immunoglobulin heavy chain variable region (IGHV) genes with a
particular mutational status, or even closely homologous antigen (Ag) binding sites among
otherwise unrelated cases (“stereotyped” BCR), is generally considered as evidence for the
involvement of a limited set of Ags, superantigens or both, in the development of CLL,
fostering research about the early phases of the disease, e.g. monoclonal B-cell lymphocytosis
(MBL). In this regard, flow cytometry has facilitated the identification of MBL cases with
(MBLhigh) or without (MBLlow) absolute B-lymphocytosis which precedes most CLL cases,
allowing the investigation of potential mechanisms involved in the transition from such MBL
precursor states to overt CLL. Since tumorigenesis is a multi-step process, the first
transforming events may occur at earlier stages, either directly in the normal counterpart of a
CLL cell or perhaps, even in the hematopoietic stem cell compartment of CLL patients.
In order to address this issue, in the present doctoral thesis we investigated multiple
phenotypic and BCR features of clonal B-cells and their microenvironment in a relatively large
series of MBL, CLL/B-CLPD clones, from both monoclonal and multiclonal cases. In order to
explore whether particular Ag could be involved in specific cytogenetic pathways during early
oncogenesis, we first investigated the potential association between unique cytogenetic
profiles and specific IGHV repertoires. In a second step, we compared the BCR and cytogenetic
features of B-cell clones from monoclonal vs. multiclonal cases to determine whether or not
the latter were associated with a higher BCR homology, potentially reflecting occurrence of B-
cell mediated immune responses. Finally, we compared the features of stereotyped vs. non-
stereotyped MBL and CLL cases.
Overall, we detected three major groups of clones with distinct but partially
overlapping patterns of IGHV gene usage, mutational status and cytogenetic alterations: 1) a
group enriched in MBLlow clones expressing specific IGHV genes (e.g. VH3-23) with no or
isolated good-prognosis cytogenetic alterations; 2) a group which mainly consisted of MBLhigh
and advanced stage CLL with a skewed, but different, IGHV gene repertoire (e.g. VH1-69),
Abstract

4
often associated with complex karyotypes and poor-prognosis cytogenetic alterations, and; 3)
a group with intermediate features, prevalence of mutated IGHV genes and higher numbers of
del(13q)+ clonal B-cells. Altogether, these results suggest that BCR features of CLL-like B-cell
clones may modulate the type of cytogenetic alterations acquired by the transformed cell,
their rate of acquisition, and potentially also, their clinical consequences.
As referred above, recent findings support the existence of underlying chronic B-cell
stimulation by a restricted set of epitopes in CLL. In line with this, expansion of ≥2 B-cell clones
has been frequently reported in B-CLPD, mainly in MBL, which could be an epiphenomenon of
a chronic and persistent antigenic stimulation. Thus, we hypothesized that multiclonality could
be associated with particular BCR features indicating a greater probability of interaction with
shared immunological determinants. Comparative analysis of CLL-like and non-CLL-like B-cell
clones from multiclonal vs. monoclonal MBL, CLL/B-CLPD cases showed clonotypic BCR of
multiclonal cases have a slightly higher degree of HCDR3 homology, together with unique
hematological and cytogenetic features, which are typically associated with earlier disease
stages. Among these cases a subgroup of phylogenetically related (coexisting) B-cell clones
which displayed unique molecular and cytogenetic features, was identified. Altogether, these
results would support the Ag-driven nature of such multiclonal B-cell expansions and the
potential involvement of multiple epitopes in promoting the development of MBL and favor
their progression into full disease (e.g. CLL). However, the scenario in which these events
occur, remains unknown.
In order to gain insight into the above scenario in the last part of our work we further
investigated the potential relationship between an altered/clonal hematopoiesis and antigenic
driving forces, during the expansion of stereotyped vs. non-stereotyped CLL and CLL-like MBL
clones. Overall, former cases more frequently used IGHV1 rather than IGHV3 genes, together
with longer HCDR3 and unmutated IGHV sequences. The overall size of the stereotyped B-cell
clones in peripheral blood (PB) did not appear to be associated with their cytogenetic profile
but it was more closely related to presence of myelodysplasia-associated immunophenotypes
on PB myeloid cells. Such unique association suggests that the emergence and/or expansion of
CLL-like B-cell clones in these stereotyped cases could be favored by an underlying altered
hematopoiesis.
In conclusion, our results highlight the potential involvement of different Ag-driven
pathways in the early stages of development of MBL and transformation to CLL, where BCR
recognition of multiple epitopes together with the co-existence or not of an underlying altered
hematopoiesis, would modulate further patterns of acquisition of cytogenetic alterations in
the pathway to CLL, through different transitional stages from multiclonal MBL to monoclonal
CLL clones carrying more complex cytogenetic profiles.
5
Hoje o conhecimento dos mecanismos envolvidos na patogenia das doenças
linfoproliferativas crónicas de célula-B (B-CLPD) assume uma importância crescente. De forma
geral, a sobrevivência e/ou proliferação da célula tumoral depende tanto das anomalias
genéticas das células neoplásicas como do microambiente tumoral. Neste sentido, o
desenvolvimento generalizado de técnicas moleculares para a caracterização quer das
alterações genéticas presentes nas células tumorais, quer das características do recetor das
células B (BCR), mostrou-se fundamental. Como consequência, a leucemia linfocítica crónica
(CLL) é hoje considerada como o protótipo para várias doenças de células B em que as
interações com o microambiente, mais que a presença de uma anomalia genética específica,
são cruciais no surgimento, expansão ou mesmo na progressão da doença, em pelo menos
uma fração dos casos. Neste sentido, a existência de um repertório de genes da região variável
da cadeia pesada da imunoglobulina (IGHV) tendencioso juntamente com um estado
mutacional particular e a recente identificação em casos não relacionados de locais de ligação
ao antigénio (Ag) praticamente homólogos (BCR “estereotipados") é, regra geral, indicativo do
envolvimento de um conjunto limitado de Ags, superantigénios ou ambos, no
desenvolvimento da doença, fomentando a investigação das fases iniciais da mesma, p.e.,
através do estudo da linfocitose monoclonal de células B (MBL). Por isso, a citometria de fluxo
veio facilitar a identificação de casos de MBL com (MBLhigh) ou sem (MBLlow) linfocitose B
absoluta, a qual precede a maioria dos casos de CLL, permitindo assim a investigação de
potenciais mecanismos envolvidos na transição de tais estados precursores tipo MBL, para CLL.
Uma vez que a tumorigénese consiste num processo em várias etapas, os primeiros eventos
transformantes podem ainda ocorrer em etapas mais precoces, quer diretamente na
contrapartida normal da célula de CLL ou talvez, mesmo no compartimento de células
estaminais hematopoiéticas de doentes com CLL.
Para resolver esta questão, na presente tese de doutoramento investigámos múltiplas
características fenotípicas e do BCR de células B clonais assim como do seu microambiente,
numa série relativamente ampla de clones MBL, CLL/B-CLPD, tanto de casos monoclonais
como multiclonais. De forma a explorar se determinados Ags poderão estar envolvidos em vias
citogenéticas específicas durante as fases inicias do processo oncogénico, na primeira parte do
estudo, focámos o nosso interesse na potencial associação entre determinados perfis
citogenéticos e repertórios IGHV específicos. Num segundo passo, foram comparadas as
características do BCR e as alterações citogenéticas dos clones de células B de casos
monoclonais vs. casos multiclonais para determinar neste último grupo de doentes, a possível
existência de uma maior homologia nos BCR que fosse potencialmente indicadora da
Resumo

6
ocorrência de respostas imunes mediadas por células B. Por fim, comparámos as
características dos casos com clones MBL e CLL estereotipados vs. não estereotipados.
De uma forma geral, foram detetados três grupos principais de clones com padrões
distintos, mas parcialmente sobrepostos, relativamente ao uso dos genes IGHV, ao estado
mutacional desses genes e às alterações citogenéticas: 1) um grupo enriquecido em clones
MBLlow expressando genes IGHV específicos (p.e. VH3-23) sem alterações citogenéticas ou com
alterações isoladas de bom prognóstico; 2) um grupo principalmente constituído por clones
MBLhigh e estágios avançados de CLL com um repertório IGHV restrito, mas diferente (p.e.,
VH1-69), muitas vezes associado com cariótipos complexos e alterações citogenéticas de mau
prognóstico, e; 3) um grupo com características intermédias, com prevalência de genes IGHV
mutados e com números mais elevados de células clonais B del(13q)+. Estes resultados
sugerem que as características do BCR de clones de células B com fenótipo de CLL podem
modular o tipo de alterações citogenéticas adquiridas pela célula transformada, a sua taxa de
aquisição, e eventualmente também, as suas consequências clínicas.
Tal como referido anteriormente, os resultados recentes apoiam a existência em
doentes com CLL, de uma estimulação crónica subjacente das células B por um conjunto
restrito de epítopos. Neste sentido, expansões de ≥ 2 clones de células B têm sido
frequentemente relatadas em B-CLPD, principalmente na MBL, a qual parece constituir um
epifenómeno de estimulação antigénica crónica e persistente. Assim, foi colocada a hipótese
de a multiclonalidade se encontrar associada com características particulares do BCR indicando
uma maior probabilidade de interação com determinantes imunológicos partilhados. A análise
comparativa de clones de células B com fenótipo de CLL e com fenótipo não-CLL de casos de
MBL, CLL/B-CLPD multiclonais vs. monoclonais mostrou que, nos casos multiclonais o BCR
clonotípico apresenta um grau ligeiramente maior de homologia de HCDR3, juntamente com
características hematológicas e citogenéticas únicas, que estão tipicamente associadas com os
estágios iniciais da doença. De entre estes casos foi ainda identificado um subgrupo de clones
de células B (coexistentes) filogeneticamente relacionados que exibiam características
moleculares e citogenéticas únicas. No seu conjunto, esses resultados apoiariam a natureza de
tais expansões de células B multiclonais associada ao Ag e o potencial envolvimento de
múltiplos epítopos em promover o desenvolvimento da MBL e favorecer a sua progressão para
doença (p.e., LLC). No entanto, o cenário no qual podem ocorrer esses eventos permanece
desconhecido.
De forma a ganhar um maior conhecimento acerca deste cenário, na última parte do
nosso trabalho, investigamos ainda a potencial relação entre uma hematopoiese alterada/
clonal e o estímulo antigénico durante a expansão dos clones de CLL e MBL estereotipados vs.
não estereotipados. No geral, os casos estereotipados exibiam mais frequentemente genes
IGHV1 em vez de IGHV3, juntamente com sequências HCDR3 mais longas e genes IGHV não
mutados. O tamanho dos clones de células B estereotipados no sangue periférico (PB) não

7
mostrou estar relacionado com o seu perfil citogenético, mas sim com a presença de
imunofenótipos associados com mielodisplasia em células mielóides do PB. Tal associação
particular sugere que o surgimento e/ou expansão de clones de células B de CLL nestes casos
estereotipados pode ser favorecido por uma hematopoiese alterada subjacente.
Em conclusão, os nossos resultados destacam o potencial envolvimento de diferentes
vias induzidas pelo Ag nos estágios iniciais de desenvolvimento da MBL e de transformação
para CLL, onde o reconhecimento de múltiplos epítopos pelo BCR, juntamente com a
coexistência ou não de uma hematopoiese alterada subjacente, poderão modular os padrões
de aquisição de alterações citogenéticas na patogénese da CLL, através de diferentes vias de
transição desde os estágios de MBL multiclonal até aos clones de CLL monoclonal com perfis
citogenéticos mais complexos.


9
Key-words: B-cells, B-cell chronic lymphoproliferative disorders, monoclonal B-cell
lymphocytosis, chronic lymphocytic leukemia, multiclonality, immunogenetics, cytogenetics,
immunophenotyping.
Palavras-chave: células B, doenças linfoproliferativas crónicas de célula B, linfocitose
monoclonal de células B, leucemia linfocítica crónica, multiclonalidade, imunogenética,
citogenética, imunofenotipagem.
Key-words / Palavras-chave


Chapter 1 | GENERAL INTRODUCTION


13
Chapter 1 INTRODUCTION
B-cell chronic lymphoproliferative disorders (B-CLPD) are a heterogeneous group of
diseases with a highly variable clinical course.1 Despite the well-defined clinical, biological and
histopathological features of the distinct World Health Organization (WHO) clinical entities, the
specific factors associated with the ontogeny of these disorders still remain largely elusive.
As in other tumors, chromosomal and molecular/genetic alterations, particularly those
genetic mutations and chromosomal translocations involving the immunoglobulin (Ig) heavy
chain genes and to a lower extent also the light chain gene loci, and their distinct partnering
proto-oncogenes, are a hallmark of many types of B-cell lymphoma.2 In recent years,
important progress has been made as regards the identification of oncogenic mutations – e.g.
BRAF and MyD88 gene mutations in hairy cell leukemia (HCL)3 and lymphoplasmacytic
lymphoma (LPL),4 respectively – and chromosomal translocations – e.g. t(11;14) in mantle cell
lymphoma (MCL)5 –. However, for other B-CLPD such as B-cell chronic lymphocytic leukemia
(CLL), despite extensive research has been done, no universal oncogenic alteration has been
identified thus far.6 In this regard, several factors other than genetic/chromosomal alterations
have also been associated with the ontogenesis of specific subtypes of B-CLPD. Concerning
this, tumor cells from most chronic B-cell leukemias and non-Hodgkin B-cell lymphomas (B-
NHL) express a unique B-cell receptor (BCR) molecule and in several B-cell malignancies,
antigen (Ag) activation of tumor cells through BCR signaling seems to be an important factor in
the pathogenesis of the disease.7 For example, It has been hypothesized that chronic antigenic
stimulation could drive CLL development,8,9 as it has also been proposed for indolent B-cell
lymphomas that are supposed to derive from the marginal zone – e.g. gastric lymphomas of
mucosa-associated lymphoid tissue (MALT) –. The latter lymphomas are commonly associated
with chronic antigenic stimulation either as a result of infection (e.g. Helicobacter pylori in the
stomach) or autoimmune responses/disease in other MALT lymphomas (e.g. Sjögren syndrome
and salivary glands lymphoma).10
Immunogenetic analyses of the tumor cell BCR have provided new insights into the
ontogenic relationship between B cell malignancies and Ags that they might interact with
within their tissue of origin.11,12 Thus, a biased IG gene repertoire is seen as evidence for an
underlying selection of progenitor cells by Ag in diseases such as CLL or marginal zone
lymphoma (MZL). Additional evidence is provided by the differential prognosis of cases with
distinct mutational status of the clonotypic BCR in CLL, and the existence of subsets of patients
with highly-selected or even quasi-identical (e.g stereotyped) BCR, which account for up to
around one-third of all CLL cases.13 These observations have been instrumental in shaping the
notion that the ontogeny and progression of CLL are functionally driven and dynamic, rather
than a simple stochastic process.

14
Chapter 1 INTRODUCTION
Interestingly, a precursor condition for B-CLPD, particularly for CLL, has been identified
as a premalignant state: monoclonal B-cell lymphocytosis (MBL) with (MBLhigh; high count MBL)
or without (MBLlow; low count MBL) absolute B-lymphocytosis in PB.14 Extensive research
performed in recent years in MBL has also contributed to a better understanding of the
mechanisms involved in the genesis of lymphoma/leukemia and the identification of those
factors involved in the transition from a B-cell lymphoma/leukemia precursor state to an overt
lymphoproliferative disorder. Thus, most MBL cases are characterized by the presence of
circulating monoclonal B-cells, which have an immunophenotypic profile that fully overlaps
with that of CLL (CLL-like MBL).15,16 At present, the precise factors and the likelihood of MBL to
progress to CLL over time are still largely unknown. In this regard, the overall prevalence of
MBL, which is significantly greater than that of CLL, is consistent with the expectation that
most MBL will not progress to CLL; even more, for MBLlow, progression appears very unlikely,17
while for MBLhigh the risk of progression to CLL requiring therapy is of approximately 1% per
year.16,18 In turn, it has also been shown that many MBL are oligoclonal based on interphase
fluorescence in situ hybridization (iFISH) but also on single cell Ig sequence analyses;15,19 in
contrast, only around 5% of the B-CLPD display two phenotypically distinct populations of
clonally unrelated B lymphocytes coexisting in the same patient, either simultaneously or at
different time points during follow-up.20,21 Such particularly high prevalence of multiclonality at
the earliest stages of MBL (≥20% vs. 5%), would further support the potential reactive nature
of MBL among individuals with normal lymphocyte counts, prior to stepwise acquisition of
genetic alterations and progression to MBLhigh and CLL;22-24 such a model could be similar to
that occurring in other cancers, indicating that development of CLL might be initiated at a
polyclonal B-cell population, one clone progressively taking over. Consequently, the evolution
from a reactive to a neoplastic expansion of MBL clones, and their transformation to CLL,
might provide a model for the development of CLL, where analyses of IG genes and the
associated cytogenetic profiles can assist in better understanding the precise mechanisms
leading to the genesis of the tumor and its malignant transformation.
In this section, we will first review the BCR structure and repertoire, along the B-cell
differentiation; afterward, we will focus on the major features of distinct WHO subtypes of B-
CLPD, particularly of CLL and MBL, and their monoclonal vs. multiclonal nature.

15
Chapter 1 INTRODUCTION
1. B-CELL ANTIGEN RECEPTOR
1.1. Basic structure of the B-cell receptor
The BCR for Ags consists of two monomeric molecules: the Ig responsible for Ag
binding and CD79 which delivers intracellular signals for B-cell activation. Igs are heterodimer
molecules composed of two heavy (H) and two light (L) chains (Figure 1).25,26 Each H and L
chain consists of a variable (V) domain, which binds to the Ag, and between one and four
constant (C) domains, which carry out the effector function of that chain. Diversity is
asymmetrically distributed within the V domain, each V domain containing three segments of
higher variability which form those loops recognizing the Ag termed complementarity
determining regions (CDR); CDR are separate one from each other and from the external
sequences by four conserved sequences, known as the framework regions (FR) (Figure 1).27
Two of the CDR loops are encoded by the V genes (CDR1 and CDR2) whereas the third, and
most polymorphic one, is encoded by the junction between the rearranged V, (D) and J genes.
The four FR of both the H and L Ig chains fold to form the scaffold that brings together the
three H chain and the three L chain CDRs to create the Ag binding site in the 3-dimensional
structure.26
Through the transmembrane and intracellular domains of their H chains, Igs are linked
in the B-cell membrane to CD79a and CD79b, to form the functional BCR. CD79 is a disulphide-
linked transmembrane heterodimer which belongs to the immunoglobulin superfamily and
that is responsible for the transduction of BCR signals, upon Ag recognition by B cells.
Figure 1. Schematic diagram of the structure of the genetic loci of the immunoglobulin heavy and light (λ and κ)
chain genes [adapted from Zakharova et al.28
].

16
Chapter 1 INTRODUCTION
1.2. The B-cell receptor repertoire
Signaling through the BCR is required throughout B cell development, as well as during
peripheral B-cell maturation and for the selection of the B-cell repertoire. Additionally, the
avidity and the context in which Ag is encountered will determine both cell fate and
differentiation in the periphery, once the Ig genes are further diversified during immune
responses.29,30 Consequently, the study of the BCR repertoire by sequence analysis of Ig heavy
and light chain gene transcripts can refine the categorization of B cell subpopulations and can
shed light on the selective forces that act during aging, immune responses (e.g. infections) or
immune dysregulation that result from B-CLPD.31,32 In contrast to nearly all other proteins, the
components of Ig molecules are not encoded by germline DNA. The genetic elements in the Ig
loci, the Variable (V), Diversity (D) and Joining (J) genes, need to be rearranged to encode a
functional protein essentially through processes of V(D)J recombination, exonuclease trimming
of germline genes, and the random addition of nucleotides that are not encoded in a DNA
template. In the IGH locus, one of each V, D and J genes are randomly coupled to form a
functional exon while similar rearrangements are initiated between one V and one J gene
segment in the IGK and IGL loci.33,34
While somatic point mutations have given B cell studies a major focus on variable
(IGHV, IGLV, and IGKV) genes, D genes identified in BCR VDJ rearrangements allowed the
processes and elements that contribute to the incredible diversity of the Ig heavy chain CDR3
(HCDR3) to be analyzed in detail. Such diversity is in contrast with that of the light chain where
a small number of polypeptide sequences dominate the repertoire.35
1.2.1. Germline immunoglobulin genes and lymphocyte diversity
The variable locus of the IG gene consists of multiple genes which have evolved
through gene duplication in order to generate a diverse germline repertoire.36 Analysis of
homology among the V gene segments has revealed that these can be grouped in discrete V
gene families,37,38 which can further be regrouped in clans39 which reflect the earliest events of
gene duplication in the evolution of the IG locus.40,41 The organization in multiple copies of
variable genes, plus the somatic processes of recombination and hypermutation, allow the
immune system to generate an antibody repertoire of great diversity. Moreover, selective
pressures have shaped the evolution of the germline genes of the Ig. The nature of these
selective forces is still a matter of controversy.42
17
Chapter 1 INTRODUCTION
Analysis of nucleotide and amino acid (aa) substitutions at the coding region of the V
genes has shown that the regions involved in the interaction with the Ag present high
variability, in contrast to the remaining relatively conserved FRs, pointing out that different
selective forces act over these two regions.36,42,43 Evaluation of other aspects like
polymorphisms,36,44,45 sequence variability46,47 and phylogeny39,40,48 has provided additional
evidence of selective forces acting over V genes in order to shape their variability. In fact,
current knowledge about the germline genes is far from being complete; this is due in part, to
the complexity of the loci, where numerous highly similar genes are thought to have evolved
via gene conversion,49 duplication and divergence,50 and further interspersed with many
pseudogenes and repetitive elements.
IGHV genes are by far the longest of the recombining IGH genes, and they are the main
targets of the mutational machinery.51,52 As it is necessary to be certain of the germline origin
of mutated sequences, the complete and accurate definition of the set of germline IGHV genes
and allelic variants should remain clear. The official human IGHV germline gene dataset,
created by the ImMunoGeneTics (IMGT) group (www.imgt.org), includes 129 functional genes,
open reading frames (ORF), and pseudogenes, as well as over 200 allelic variants which have
increased in recent years, as 40 new allelic variants have been reported since 2005.53-56 In turn,
the 27 human IGHD genes include 25 functional genes, 23 of which are unique.57 The IGHJ
locus includes 6 functional genes, which are all found downstream of the IGHD locus in a single
cluster.
1.2.2. Biases in combinatorial and junctional diversity and shaping of the BCR
repertoire
Many BCR repertoire studies which have utilized different sets of primers, and
amplified different source materials, are surprisingly consistent with the occurrence of strong
gene utilization biases. Some data show that segments in the V3 family are most frequently
used (namely the IGHV3-23 gene), followed in descending order by V4, V1, V5, V2, V6, and
lastly V7.58 Different IGHV genes are used at frequencies that range from 0.1% to more than
10% of all rearrangements in an individual’s naïve B-cell repertoire, their relatively frequency
also varying between alleles.59,60
Frequencies of usage of some IGHV families are surprisingly constant among different
individuals (e.g. IGHV1-46, IGHV3-21 and IGHV3-49),61 while IGHV1-69 varies at frequencies
that range from 3.1 to 9.1% (average 6.2%).59 Biased gene usage is not confined to the IGHV
genes since IGHD gene usage also varies from < 1% (e.g. IGHD4-4/11) to > 15% (e.g. IGHD3-22)

18
Chapter 1 INTRODUCTION
of total rearrangements.62 For each D segment, there is one reading frame (RF) encoding
predominantly hydrophilic aa residues (specially tyrosine and serine; RF1), followed by a
hydrophobic RF (RF2), and lastly, a third RF that often encodes a stop codon (RF3). Thus, the
RF3 can be used only if either somatic mutations or nucleotide losses during VDJ
recombination delete the germline stop codon. Finally, there is also considerable variation
between the frequencies of usage of IGHJ genes (e.g. IGHJ4 gene is present in approximately
45–50% of rearrangements, IGHJ6 accounts for 20–25% of VDJ rearrangements63,64 and IGHJ1
is only used by 1% of all rearrangements).65
In a similar way, analysis of IGK rearrangements from sequence databases also showed
a preferential gene usage with under- and over-utilization of the different JK gene segments,66
while the IGLV usage is strongly skewed toward a limited number of the functional V segments
with 3 of the 30 IGLV accounting for > 50% of the expressed rearrangements.67 Only four of the
seven IGLJ are considered functional68 and their frequencies range from almost 55% of the
expressed B-cell repertoire for IGLJ7, to just 5.5% for IGLJ1.69
On the other hand, variations in the recombination signal sequences (RSS) also
influence the frequencies of BCR gene usage, while they cannot explain all differences in allele
utilization.70-72 In addition to the underlying biases in utilization of germline genes, a final bias
has been identified that affects the contribution of recombination frequencies to repertoire
diversity. For reasons that still remain unclear, the analysis of 6,500 IGH VDJ sequences
collected from public databases appears to confirm pairing preferences for some IGHD and
IGHJ genes that increase the frequency of particular IGHD-IGHJ pairs within the repertoire (i.e.
IGHD2-2 and IGHD3-3 with IGHJ6, and of IGHD3-22 with IGHJ3).64,73 In addition, biases in the
pairing of germline heavy and light chain genes have been also described in early studies;74
however, such germline heavy and light chain gene pairing preferences were not supported by
later studies,75,76 including a recent study that applied high-throughput sequencing to generate
thousands of linked heavy and light chain gene sequences.77
On top of all the above, at present it is also well established that N (non-germline
encoded) nucleotides contribute significantly to the diversity of the BCR repertoire.78 Non-
template encoded N-additions are intrinsically biased owing to the nucleotide preferences of
the terminal deoxynucleotidyl transferase (TdT) enzyme toward the incorporation of guanine
(G) nucleotides; such TdT preference by G nucleotides ensures that the germline gene-
encoded regions of the CDR3 are frequently flanked by small aa encoded by G-rich codons
such as glycine, that promote flexibility of the CDR3 loop.79 Exonuclease trimming which
results in the loss of nucleotides from the coding ends of the genes during rearrangement is
perhaps the least understood process that contributes to the BCR repertoire, but a number of
19
Chapter 1 INTRODUCTION
features of the process have been described, and intrinsic biases have been identified.80 In this
regard, it seems that sequences enriched in adenine (A)/thymine (T) might be more
susceptible to nucleotide loss, while G/cytosine (C) enriched sequences would be more
resistant to processing.81-84 The gene sequence ends that remain after exonuclease processing
provide a final bias that shapes the repertoire.
Without the added diversity that comes from D genes, the kappa and lambda
repertoires would be strongly shaped by biased gene usage and minimal processing giving rise
to repertoires with a surprisingly limited diversity.
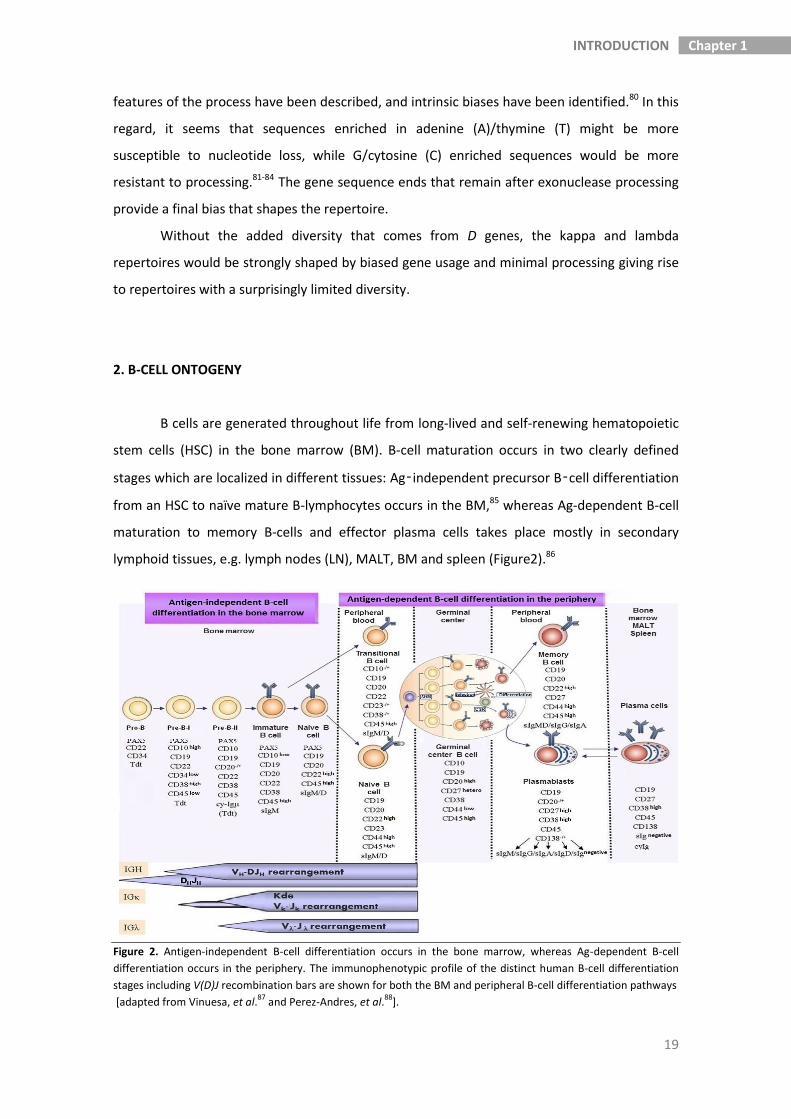
2. B-CELL ONTOGENY
B cells are generated throughout life from long-lived and self-renewing hematopoietic
stem cells (HSC) in the bone marrow (BM). B-cell maturation occurs in two clearly defined
stages which are localized in different tissues: Ag‑independent precursor B‑cell differentiation
from an HSC to naïve mature B-lymphocytes occurs in the BM,85 whereas Ag-dependent B-cell
maturation to memory B-cells and effector plasma cells takes place mostly in secondary
lymphoid tissues, e.g. lymph nodes (LN), MALT, BM and spleen (Figure2).86
Figure 2. Antigen-independent B-cell differentiation occurs in the bone marrow, whereas Ag-dependent B-cell
differentiation occurs in the periphery. The immunophenotypic profile of the distinct human B-cell differentiation
stages including V(D)J recombination bars are shown for both the BM and peripheral B-cell differentiation pathways
[adapted from Vinuesa, et al.87
and Perez-Andres, et al.88
].

20
Chapter 1 INTRODUCTION
2.1. Antigen independent B-cell differentiation in the bone marrow
Differentiation of B cells from early committed progenitors to mature B-lymphocytes is
a multistep maturation process that can be monitored by the coordinated acquisition and loss
of leukocyte differentiation Ags and the status of rearrangement of the IGH and IGL genes
(Figure 2). The major goal of precursor B-cell differentiation to mature B-lymphocytes is to
generate a functional Ig receptor via an ordered V(D)J recombination of the genes encoding
the Ig heavy (IgH) and the Ig light (Igk or Igʎ) chains. Double stranded (ds)DNA breaks at the V,
D and J gene segments are induced by the recombinase activating gene proteins products 1
and 2 (RAG1 and RAG2) that specifically recognize short conserved DNA sequences termed
RSS.89 The first gene rearrangements that occur during precursor B-cell differentiation involve
D to J rearrangements in the IGH locus.90,91 These rearrangements are generally initiated in
parallel on both IGH alleles.92 Subsequently, only one of the alleles starts complete V to DJ
rearrangements, whereas the second one only rearranges V to DJ when the first allele is not
successful, e.g. if there is no functional IgH protein. In the majority of precursor B cells, V to J
gene rearrangements in the IGK and IGL loci are initiated only after a functional IgH protein is
formed. Still, it has been demonstrated that a minor fraction of pro-B cells can rearrange IGL
genes before the assembly of a productive IGH.93,94
Based on the order of IG gene rearrangements, precursor B-cells are classified into
distinct stages of maturity (Figure 2). Thus, pro-B-cells represent the first committed B-cell
precursors,95,96 which can be distinguished from pre-pro-B-cells by surface expression of CD19,
upon expression of Pax5.97 In these cells, the Igα–Igβ heterodimer (CD79a/CD79b) is expressed
on the cell surface in association with calnexin and potentially also other chaperone
molecules.98
D to J rearrangement in the IGH locus is initiated in the pre-pro-B-cells and continues
with V to DJ rearrangement at the pro-B cell stage. The pre-BCR is not required for lineage
commitment and the initiation of recombination but, this is rather dependent upon the
intrinsic expression of two main transcription factors, E12 and E47,99 and the transcription
factor EBF (early B-cell factor),100 which have been shown to up-regulate expression of the B-
cell-specific genes λ5, VpreB, Igα/CD79a and Igβ/CD79b, as well as of the lymphoid-specific
RAG-1 and RAG-2, and the B-cell-specific transcription factor Pax5 or BSAP (B-cell-specific
activator protein).101-103 Lineage commitment is enforced at the pro-B-cell stage by Pax5, which
both activates B-cell-specific genes (including BLNK, CD19 and Igα/CD79a) and represses the
expression of other non-B-lineage genes (including Notch1).104,105

21
Chapter 1 INTRODUCTION
Early B-cell development is not entirely intrinsically regulated by the future B-cell
precursor, as signalling through the interleukin-7 (IL-7) receptor is required to generate pro-B-
cells.106 IL-7 signalling also induces pro-B-cells to proliferate and expand, and it has been
shown to up-regulate expression of CD19 and Pax5.107,108
Surface expression of a signalling-competent pre-BCR, containing an in-frame V(D)J
rearrangement of the Ig heavy chain, allows progression from the pro-B-cell to the pre-B-cell
stage; the pre-B cell stage is the first stage at which BCR signalling becomes required.
Appropriate pre-BCR signalling results in allelic exclusion at the heavy-chain locus, at the same
time it leads to parallel changes in the phenotype of developing B-cells;109 cells become larger
as they undergo a proliferative burst of two to five cycles and become more responsive to IL-
7.110,111 After proliferation, cells enter the small pre-B stage, where they down-regulate HSA
(heat stable Ag), CD43 and IL-7R, becoming IL-7 unresponsive. Then, they begin the process of
light chain rearrangement, first at the kappa locus and then at the lambda locus.112
Upon light-chain rearrangement, heavy and light chains are co-expressed on the cell
surface, in association with Igα/CD79a and Igβ/CD79b, to form a functional Ig receptor;
subsequently, the new B cell will be positively selected and will become an immature B-
lymphocyte. The new IgM+ IgD– immature B-lymphocytes frequently carry autoreactive or
polyreactive receptors, which need to be removed from the immune repertoire through a BCR
receptor-mediated negative selection process. These cells are assumed to either undergo
apoptosis/deletion in response to high-avidity ligands, to become anergic if they encounter
lower-avidity ligands and unresponsive to Ig receptor crosslinking, or to modify the reactivity
of the Ig receptor by initiation of a secondary Ig gene rearrangement (receptor editing).113-115
Of note, short-lived anergic cells down-regulate surface IgM expression and exhibit a
characteristic intracellular signalling signature in association with a unique gene expression
profile116 that appears to be maintained throughout chronic engagement of the BCR with low-
avidity ligands. Which of these three tolerance mechanisms is invoked depends on many
different factors, including receptor affinity, receptor expression levels, developmental stage
and site of encounter (e.g. ligation of the immature BCR in a BM environment results in
receptor editing, whereas ligation in a splenic environment induces B-cell deletion).117,118
Negative selection of cells with polyreactive and autoreactive BCR takes place during
two checkpoints. Thus, a central checkpoint occurs in the BM and results in the removal of
cells with both autoreactive and polyreactive BCR. Consequently, the frequencies of
autoreactive (≈75%) and polyreactive (≈55%) BCR in early immature B-cells decrease to ≈45%
and <10% among immature B-cells, respectively.119 In turn, a second peripheral checkpoint
occurs upon B cell migration from the BM to the periphery, and it is mainly directed against

22
Chapter 1 INTRODUCTION
the remaining autoreactive BCR which often display long (>20 aa) and positively charged IGH-
CDR3 regions,119 reducing their frequency to ≈20% among naïve mature B-cells.
2.2. Antigen dependent B-cell maturation in the periphery
Following successful Ag-independent differentiation in the BM, B cells migrate to
peripheral lymphoid organs and recirculate in blood. The cells require external signals for
survival, which thereby ensure stable homeostasis of the total B-cell pool.86,120 Only those cells
that recognize their cognate Ag initiate further differentiation and generate memory B-cells
and antibody-producing plasma cells.86 The maturation pathways will differ depending on the
anatomic localization of the response (e.g. LN vs. gut, lung or splenic marginal zone) and the
type of Ag (e.g. protein vs. polysaccharide).
2.2.1. Peripheral distribution and maturation of immature to naïve B cells
Recent BM emigrants are functionally immature, i.e. they do not respond to BCR
stimulation. Immature B-lymphocytes, also referred as transitional B cells, represent ≈5–10%
of all B cells in blood of healthy adults and have a characteristic phenotype which includes
expression of surface membrane (Sm)IgM and SmIgD, CD21, CD22, CD5 and high expression
levels of CD24 and CD38.121-123 Of note, B lymphocytes leaving the BM consist of cells at
different maturation stages between the immature and naïve mature B-cell compartments;
therefore, they typically show heterogeneous features; these cells have unmutated IGHV
genes, express phenotypic features of immature B-cells, show a lower ability to proliferate and
differentiate to Ab-secreting cells after in vitro stimulation when compared to naïve mature B-
cells together with a higher κ/λ ratio vs. other PB B-cell subsets.121-124 Of note, the frequency of
these immature B-lymphocytes in PB seems to increase in autoimmune diseases and other
immunological diseases (e.g. systemic lupus erythematosus, common variable
immunodeficiency, X-linked lymphoproliferative disease), as well as during BM regeneration
after transplantation,125 in parallel to decreased numbers of memory B-cells.121-123
Maturation into pre-naïve B-cells is accompanied by downregulation of CD38 and CD24
which makes them partially responsive to BCR stimulation and CD40 ligation. Upon subsequent
downregulation of CD5, pre-naïve B cells finally become naïve B-cells, which are fully
responsive to Ag. Naïve B-cells are a relatively frequent B cell compartment in the PB and
comprise about 60–70% of circulating B-cells; they simultaneously co-express IgM and IgD and
display unmutated IGV sequences.

23
Chapter 1 INTRODUCTION
2.2.2. T-cell dependent and T-cell independent B-cell responses to antigen
B cells respond to Ags which are specifically recognized by their BCR. Upon binding to
its cognate Ag, the BCR induces downstream signaling through the same pathways as the pre-
BCR, to initiate target gene transcription. The CD19-complex, consisting of CD19, CD21, CD81
and CD225, is necessary for sufficiently strong signaling.126,127
In addition to Ag recognition via the BCR and CD19 signaling, B cells require a second
signal to become activated. Activated T cells can provide such a signal via CD40L that interacts
with CD40 on B cells. T cell-dependent (TD) B-cell responses are characterized by germinal
center (GC) formation. In the GC, B lymphocytes undergo extensive proliferation, affinity
maturation and Ig class switch recombination (CSR).128 Thus, after the GC reaction, high-affinity
memory B-cells and Ig-producing plasma cells are formed.
Alternatively, B cells can respond to T cell-independent (TI) Ags that either activate
them via the BCR and another (innate) receptor (TI type 1 response) or via extensive cross-
linking of the BCR due to the repetitive nature of the Ag (TI type 2 response). The Ags
triggering TI B-cell responses can be both lipid and carbohydrate structures;129 similarly, the co-
stimulatory receptors include various types of receptors particularly pattern recognition
receptors, such as Toll-like receptors (TLR) and nucleotide oligomerization domain-like
receptors (NLR) that have been implicated in TI responses.130,131 Usually, TI responses are
directed against blood-borne pathogens in the splenic marginal zone and in mucosal tissues
(reviewed in 132,133). Among other proteins and molecules, the B-cell activating factor (BAFF)
and the proliferation-inducing ligand (APRIL) protein must likely support TD and TI, as well as
induction of affinity maturation and Ig CSR.134,135
2.2.3. Somatic hypermutation and Ig class-switch recombination
The Ig variable regions of activated B cells are targets for somatic hypermutation
(SHM). In this process of SHM, the activation-induced cytidine deaminase (AID) enzyme is a key
player. AID initiates deamination of cytidine to uracil (U) on single-stranded (ss)DNA through
preferentially targeting of RGYW and WRCY DNA motifs where R are purine nucleotides, Y are
pyrimidines, and W is either A or T.136,137 Although SHM can be introduced through the entire
Ig variable regions, mutations in post-GC cells are preferentially found in the CDR sequences. In
part, this is due to overrepresentation of AID-targeted RGYW and WRCY DNA motifs in the Ig
CDR138,139 vs. the FR and other Ig regions,140,141 and results on selection of GC B-cells with higher
affinity for the target Ag, which will therefore have preferentially mutated CDR3. AID-

24
Chapter 1 INTRODUCTION
associated mutations in the DNA sequence of the IG gene can either be silent (S) mutations
with no effect on the aa composition, or replacement (R) mutations which lead to aa
substitutions. R mutations in the FR regions are likely to impair the Ig structure, and cells that
acquired these mutations are most frequently removed from the repertoire. In turn, R
mutations in the CDR regions can have either positive or negative effects on the recognition
and affinity of the BCR for the Ag. Hypermutated B cells that cannot recognize the Ag undergo
apoptosis, while those that carry mutations which increase their affinity for the Ag will survive
and proliferate. In general, a high ratio of R vs. S mutations (R/S ratio) in the IGHV CDR is
regarded as a molecular sign of an underlying affinity maturation.142
AID does not only play a crucial role in the generation of SHM, but it is also involved in
the process of CSR, which leads to changes in the Ig receptor effector functions.136 In this
regard, it should be noted that the IGH locus contains multiple constant region-encoding genes
downstream of IGHM. In precursor and naïve mature B-cells, these regions are not used, and
rearranged VDJ exons are spliced to the IGHM and IGHD exons. During the GC response, the B
cell is capable of rearranging the Ig switch region upstream of IGHM with one of the switch
regions upstream, resulting in the deletion of the intervening DNA and splicing of VDJ exons to
the exons of an IGHC other than IGHM.
The process of CSR does not affect the Ag specificity and/or the affinity of the BCR, but
it influences the effector functions of the antibodies the cell will eventually produce, due to
differential recognition of Ig subclasses (e.g. isotypes) by Fc receptors on immune cells and by
soluble proteins (e.g. complement proteins). Also the type of Ig subclasses has an impact on
the avidity of the Ig, since the ability of IgM and IgA antibodies to form polymers also increases
their avidity.143,144
IgG is the predominant Ig class in human serum, and can act locally in the tissues. All
IgG subclasses are involved in neutralization of pathogens, but only IgG1 and IgG3 are potent
activators of the complement system and inducers of antibody-dependent cell-mediated
cytotoxicity (ADCC).145 Complement activation is also the predominant function of IgM, while
the two IgA subclasses act as neutralizing antibodies with different susceptibility to digestion
by bacterial proteases.146,147 Finally, IgE is involved in mast cell and basophil sensitization and it
is the mediator of allergic responses and of responses to parasitic infections.148
2.2.4. Circulating human memory B cells and their diversity
A substantial fraction of B cells in adults (≈20–30% of all PB B-cells) are Ag-experienced
and shows hallmarks of memory B-cell. One of these hallmarks is an increased responsiveness

25
Chapter 1 INTRODUCTION
which results from upregulation of co-stimulatory and activation molecules (i.e. CD80, CD86,
CD180, TACI), and downregulation of Ig signaling inhibitors (i.e. CD72, LAIR1).149-151 Moreover,
these Ag-experienced cells may display SHM within their IGHV and IGLV regions and around
half of them have also undergone Ig CSR,152,153 as reflected by surface membrane expression of
a switched IgH (e.g. to SmIgG or SmIgA); (23% ± 10% and 21% ± 9% of adult PB memory B-cells
express SmIgG and SmIgA, respectively). Meanwhile, the other half of memory B-cells still
coexpress SmIgM and SmIgD (52% ± 15% of memory B-cells), or potentially SmIgM or SmIgD
only. Even considering that Ig class switching specializes the future effector function of the
antibodies that will be produced by Ag-specific B-cells, through replacement of the IgM and
IgD gene exons (Cµ and Cδ) by the IgG (Cγ), IgA (Cα), or IgE (Cε) exons via genetic
recombination, it should be noted that a small percentage of B-cells (1%–3%) actually class
switch from Cµ to Cδ at the genetic level using cryptic switch regions between the Cµ and Cδ
exons; this results in an SmIgM–SmIgD+ memory B-cell phenotype. Recently the presence of
very low numbers of SmIgE+ memory B-cells has also been described in PB;154 murine studies
suggest that IgE-secreting plasma cells could be generated both indirectly via CSR to memory
SmIgE+ B-cells and directly from IgG1 memory B-cells,155 although the latter possibility remains
controversial.156
Until recently, human memory B-cells have been defined based on the expression of
the CD27 protein on their surface membrane.157 However, recent studies have demonstrated
that memory B-cells are a more complex and heterogeneous group of B cells than originally
thought, and that they can also be CD27–; such heterogeneity of memory B-cells probably
reflects the fact that they consist of multiple different and diverse subsets originated from
functionally distinct types of immune responses.154,158
The majority of circulating memory B-cells in healthy adult PB derives from TD
responses in the GC. Thus, CD27+SmIgG+ and CD27+SmIgA+ GC-derived memory B-cells have
typically undergone the highest rate of proliferation and SHM; this supports the notion that at
least part of the CD27+SmIgG+ and CD27+SmIgA+ B-cell subsets in healthy adults, occur later in
the course of an immune response and/or have undergone multiple immune responses.128,159
Interestingly, despite these two memory B-cell subsets share selection mechanisms,
CD27+SmIgA+ B-cells display a clearly higher frequency of IGHV gene mutation vs. CD27+SmIgG+
B-cells. A potential explanation for such difference might be the different localization of the
immune responses which generate most of the CD27+SmIgA+ vs. CD27+SmIgG+ memory B-cells,
since IgA class switching mostly occurs in MALT, while IgG is typically predominant in other
lymphoid tissues such as the LN.160 Compared to CD27+SmIgA+ and CD27+SmIgG+ memory B-
cells, CD27+SmIgM+ memory B-cells contain less SHM but show molecular footprints of (early)

26
Chapter 1 INTRODUCTION
GC emigrants that did not undergo CSR161 and participate in IgM responses initiated early in
primary infection. Interestingly, in contrast to these CD27+(SmIgM+SmIgD−) “IgM-only” cells,
CD27+SmIgM+SmIgD+ “natural effector” B-cells are present in patients with CD40 or CD40L
deficiency, indicating that at least part of this subset can be generated independently of T cell
help outside of the GC.131,159 Furthermore, natural effector B-cells resemble prediversified
marginal zone populations that can be generated independently of functional GC and that
have a limited replication history compared to GC B-cells (both centroblasts and centrocytes)
and CD27+SmIgD− memory B-cells.128,159 Thus, CD27+SmIgM+SmIgD+ natural effector B-cells
probably consist of a mixed population of GC-derived and splenic marginal zone-derived
memory B-cells. Moreover, these cells more frequently use a subset of Ig variable region genes
which have long been associated with autoreactivity, at the same time, they also show
evidences of receptor editing during B-cell development,162-164 which suggests that these
memory B-cells are either generated by a mechanism of immune tolerance or that they evade
immune tolerance.
Regarding IgD-only B-cells, at present it is known that these cells have undergone a Cμ
deletion due to a non-canonical CSR event, they typically express Igλ, contain extremely high
levels of SHM and show a strongly biased IGHV3-30 gene usage that can be also seen in some
malignant B-cell disorders.165
In addition to all above subsets of memory B-cells, there are three other minor
populations of IgG, IgA and IgE class-switched B-cells which lack CD27 expression (21% ± 10%,
9% ± 6% and <1% of all memory B-cells, respectively), which are present in the PB of healthy
individuals.166 The specific origin of these cells and their relationship to the CD27+ memory B-
cell subsets remain currently unknown; overall, these CD27– memory B-cells show a lower
frequency of SHM.154,158 In addition, CD27−SmIgG+ B-cells are derived from primary GC-
dependent responses and compared to their CD27+ counterparts, they show dominant usage
(> 90%) of the IGHM-proximal IGHG1 and IGHG3 genes, which are potent activators of the
complement system and inducers of ADCC, revealing their potential role in autoimmunity.167
The CD27−SmIgA+ memory B-cell subset is a smaller population and can be derived
independently from T cell help, through TI IgA responses in the splenic marginal zone and
locally in the gastrointestinal system.135 The nature of CD27−SmIgE+ memory B-cells still
remains to be elucidated.154
Taking all these findings in consideration, 8 different subsets of antigen-experienced B
cells have been described. They all exhibit an activated phenotype but different molecular
signs of Ag experience (i.e. levels of SHM of rearranged Ig genes and participation in primary
vs. secondary phases of GC responses).

27
Chapter 1 INTRODUCTION
2.2.5. Terminal B-cell differentiation to plasmablasts and plasma cells
Very low numbers of CD20-/+ SmIg+ CD19+ CD27high CD38high CD43+ CD138– CD45+ HLA-
class II+ plasmablasts/plasma cells newly generated in the LN and which are derived from
activated B cells following a different transcriptional program than memory B-cells, are found
in steady state PB of healthy adults.168 These circulating plasmablasts/plasma cells are induced
to circulate for a short period until they reach a niche in the BM, spleen, MALT, LN or
chronically inflamed tissues. They ensure regulation of normal Ig production in view of the
competition of newborn plasmablasts generated after Ag immunization with older plasma cells
for binding to a niche, inducing the old plasma cells to recirculate.168 In the plasma cells niches,
early plasma cells encounter all factors they require to survive and further differentiate into
long-living mature (CD20− SmIg− CD138+) plasma cells. Overall, circulating plasmablasts/plasma
cells only represent about 1–3% (1–5 cells/μL) of all PB B-cells in healthy adults under steady
state conditions, although they can be found at higher frequencies of all circulating B-cells in
specific disease conditions associated with active immune responses (e.g. acute infection).88
Since plasma cells progressively loose membrane BCR expression while maturing, they depend
on other mechanisms for long-term antibody production and survival in the BM.169
In contrast to memory B-cells, the most represented subset of plasmablasts/plasma
cells in PB is that of circulating SmIgA+ plasmablasts/plasma cells (49% ± 12% of all PB
plasmablasts/plasma cells); SmIgM-only plasmablasts/plasma cells represent around 18% ±
12% and SmIgG+ cells are about 13% ± 11% of all PB plasmablasts/plasma cells. The remaining
14% ± 12% of circulating plasmablasts/plasma cells do not express any SmIg.168,170
Interestingly, presence of circulating IgD+IgM- plasmablasts/plasma cells (<5% of
plasmablasts/plasma cells) has been recently reported in the PB of healthy adults,168 being
specifically associated with immune responses involving the upper respiratory tract.171,172
3. B-CELL CHRONIC LYMPHOPROLIFERATIVE DISORDERS
B-CLPD consist of a heterogeneous group of clonal/neoplastic conditions associated
with the accumulation of variable numbers of mature-appearing clonal B-lymphocytes blocked
at distinct stages of B-cell differentiation from transitional/immature B-lymphocytes to plasma
cells. The expanded neoplastic B-cells typically combine features of their normal B-cell
counterpart, with aberrant characteristics. Whereas the former features reflect the maturation
stage and tissue homming profile of equivalent normal B-cells, the latter are frequently related

28
Chapter 1 INTRODUCTION
to primary genetic and molecular alterations occurring during either the early stages of
malignant B-cell transformation (e.g. derailment and oncogenic V(D)J gene rearrangements) or
during antigen-driven GC reactions in lymphoid tissues,173-175 and/or to secondary genetic
events associated with disease progression.
Since expanded B-CLPD lymphocytes are clonal and (frequently) aberrant, at the same
time they accumulate in one or more “easily” accessible tissues, such as PB, BM and lymphoid
tissues, morphologic and multiparameter flow cytometry (MFC) analyses of B-CLPD have
emerged with the years as the most well-suited approaches for the specific identification,
enumeration and phenotypic characterization of the expanded tumor cells. In this regard, in
recent years, MFC has become particularly relevant because it has proven to be a highly
sensitive and specific method for discriminating between normal and leukemic B-cells and the
recognition of B-CLPD-phenotypes associated with distinct disease categories, even when the
neoplastic B-cells are present at very low frequencies among a major population of normal
hematopoietic cells and therefore, may go undetected with conventional microscopic-based
morphologic and histologic techniques. Furthermore, MFC requires single cell suspensions,
which can be easily obtained from PB samples, LN biopsies and fine needle aspirates, as well as
BM aspirated samples.
In contrast to most normal and reactive B-cell populations, expanded mature B-cells
from B-CLPD typically display (mono)clonal features including identical V(D)J gene
rearrangements and Ig light chain expression restricted to Igk or Igʎ.176 In addition, these cells
also display aberrant cell Sm and/or intracellular (Cy) protein expression profiles.177 Altogether,
these features allow for a highly specific and sensitive identification of mature neoplastic B-
cells and their distinction from normal cells by MFC.
In the above sections of this introduction chapter we have already described in detail
the normal B-cell phenotypes. In turn, in B-CLPD four major types of aberrant phenotypes have
been described so far, which include: i) crosslineage Ag expression (e.g. expression of T-/NK-
cell-associated markers such as CD2 on neoplastic B-cells); ii) asynchronous expression of
markers associated with distinct maturation stages (e.g. Bcl2 high expression on CD10+ GC-like
B-cells); and expression of either iii) abnormally high amounts (e.g overexpression of CD305 on
hairy cells) or; iv) abnormally low levels – e.g. decreased intensity of staining for CD19 and
CD20 in follicular lymphoma (FL) and CLL B-cells, respectively – of B-lineage associated
markers.178 In practice, detailed characterization of mature B-cell-associated aberrant
phenotypes, contributes both to the discrimination between normal and neoplastic B-cells, as
well as to a more accurate classification of the disease, including the screening for specific
genetic alterations for fast subsequent molecular studies.179

29
Chapter 1 INTRODUCTION
The current WHO classification of B-CLPD is based on combined assessment of
cytomorphological/histopathological, immunophenotypic, and genetic/molecular features of
tumor B-cells, together with the clinical characteristics of the disease.180,181 Thus, in the WHO
2008 classification of hematopoietic and lymphoid neoplasias, B-CLPD are identified as
neoplastic conditions of mature lymphoid B-cells, and they are stratified into three major
groups of diseases which are mostly related to the pattern of tissue infiltration, including: i)
peripheral blood involvement (peripheral/mature chronic B-cell leukemias); ii) infiltration of
secondary lymphoid tissues (peripheral/mature B-cell lymphomas) and; iii) BM (and also other
non-lymphoid tissues) involvement (neoplastic plasma cell disorders) (Table 1).181 Of note,
within each multiple diagnostic disease categories of these three groups of B-CLPD, those
showing common genetic events – e.g. t(11;14) in MCL or CMYC gene rearrangements in
Burkitt lymphoma – are included together with other genetically heterogeneous disorders that
display either a uniform immunophenotype (e.g. CLL) or a similar pattern of tissue involvement
(e.g. MZL). In addition, the WHO 2008 classification has also drawn attention for the first time
to pre-malignant B-cell neoplasias related to peripheral/mature lymphoid leukemias/
lymphomas, such as MBL14,182 and both in situ FL183,184 and in situ MCL (Table 1).5 Although such
cases might share many biologic features with their malignant counterparts, they usually
display a benign clinical course with relatively low rates of malignant transformation.

30
Chapter 1 INTRODUCTION
Table 1. List of the distinct subgroups of mature B-cell neoplasias and their major features, as
defined in the WHO 2008 classification [adapted from Campo et al.181].
MATURE B-CELL NEOPLASMS
Peripheral / Mature chronic B-cell leukemias
Monoclonal B-cell lymphocytosis (MBL)
Chronic lymphocytic leukemia/small lymphocytic lymphoma (CLL/SLL)
B-cell prolymphocytic leukemia (PLL)
Hairy cell leukemia (HCL)
Peripheral / Mature B-cell lymphomas
In situ follicular lymphoma
In situ mantle cell lymphoma
Splenic marginal zone lymphoma (SMZL)
Splenic lymphoma/leukemia, unclassifiable*
Lymphoplasmacytic lymphoma (LPL)
Extranodal marginal zone B-cell lymphoma of mucosa-associated lymphoid tissue (MALT lymphoma)
Nodal marginal zone B-cell lymphoma (NMZL)
Follicular lymphoma (FL)
Primary cutaneous follicle center lymphoma
Mantle cell lymphoma (MCL)
Diffuse large B-cell lymphoma (DLBCL), not otherwise specified (NOS)
DLBCL associated with chronic inflammation
Lymphomatoid granulomatosis
Primary mediastinal (thymic) large B-cell lymphoma
Intravascular large B-cell lymphoma
Primary cutaneous DLBCL, leg type
ALK+ large B-cell lymphoma
Plasmablastic lymphoma
Primary effusion lymphoma
Burkitt lymphoma (BL)
Large B-cell lymphoma arising in HHV8-associated multicentric Castleman disease
B-cell lymphoma, unclassifiable, with features intermediate between diffuse large B-cell lymphoma and Burkitt
lymphoma
B-cell lymphoma, unclassifiable, with features intermediate between diffuse large B-cell lymphoma and classical
Hodgkin lymphoma
Neoplastic plasma cell disorders
Heavy chain disease
Monoclonal gammopathy of undetermined significance (MGUS)
Plasma cell myeloma
Solitary plasmacytoma of bone
Extraosseous plasmacytoma
ALK, anaplastic lymphoma kinase; HHV8, human herpes virus 8.*This histologic type is a provisional entity for which the WHO
Working Group felt there was insufficient evidence to recognize as distinct diseases at this time.

31
Chapter 1 INTRODUCTION
In the following sections of the introduction chapter we will review the most relevant
biological as well as clinical features of the major subtypes of B-CLPD, particularly focusing on
CLL-like MBL and CLL.
3.1. Monoclonal B-cell lymphocytosis
3.1.1. Diagnostic criteria for MBL and its subtypes
Several hospital-based and population-based flow cytometry immunophenotypic
studies have been reported, in which the presence of relatively small (usually CLL-like) B-cell
clones has been demonstrated in PB from a substantial fraction of otherwise healthy adults
classified as with or without increased B-cell counts; MBLlow or MBLhigh, respectively.15,16,185
In most MBL cases (85%), clonal B-cells display an immunophenotype which is similar
to that of CLL cells (CLL-like MBL) consisting of CD5+, CD19+, CD20low, CD23+, SmIglow and
CD79blow clonal B-lymphocytes (Table 2).14,182,186 In turn, in a small fraction of CD5+ MBL cases
(atypical-CLL-like MBL) and in a minor proportion of cases corresponding to CD5– MBL (non-
CLL-like MBL), clonal B-cells display variable phenotypes which are distinct from those typically
found on CLL cells (e.g. CD23+, CD20low, CD79blow and SmIglow); such phenotypes frequently
overlap with those of MZL cells (Table 2).14 Since clonal B cells of individuals with CLL-like
MBLlow, CLL-like MBLhigh, and CLL share an identical immunophenotypic profile and overlapping
cytogenetic alterations, at present the distinction between the two MBL subgroups and CLL is
mostly based on the absolute count of B-lymphocytes in PB. Therefore, while diagnosis of CLL
requires the presence of ≥ 5,000 B-cells/µl, MBL includes only those cases with < 5,000 B-
cells/µl in the absence of organ infiltration (Table 2).14 Among MBL cases, there is consensus as
regards the usage of a threshold of 500 B-cells/µl to distinguish between MBLlow (< 500 B-
cells/µl) and MBLhigh (≥ 500 B-cells/µl) cases. However, it should be noted that such cutoff for
the definition of MBLlow vs. MBLhigh still deserves confirmatory approval in the coming WHO
classifications of mature B lymphoid neoplasias. Despite this, in all cases it is mandatory to
actively exclude an underlying (e.g. BM, LN, splenic) mature-B-cell neoplasm other than MBL,
particularly among non-CLL-like subjects and in atypical CLL-like MBL cases with circulating
CD5– or CD5+CD23– monoclonal B-cells at levels below 5x10⁹/L clonal B-cells, through e.g. BM
cytomorphological/histopathological and imaging techniques (e.g. computerized tomography
and/or magnetic resonance imaging).
At present, the precise significance of MBL B-cell clones, particularly of the MBLlow
ones, still remains controversial. Thus, it has been hypothesized that expanded clonal B-cells

32
Chapter 1 INTRODUCTION
circulating in the PB of MBL subjects might either result from a transient and/or chronic
activation of the immune system during e.g. infection,187 or they may represent premalignant
states of CLL and NHL.5,184 So far, most reported data has focused on CLL-like MBL, while there
is very limited information concerning individuals with CD5– non-CLL-like MBL.188
Table 2.Diagnostic criteria and nomenclature for MBL [adapted from Shanafelt et al.185]
Diagnostic criteria for MBL
1. Documentation of one or more clonal B-cell population1 by ≥1 of the following criteria:
a) Light chain restriction: kappa: lambda ratio >3:1 or <0.3:1, or
> 25% B-cells lacking SmIg or expressing SmIglow
b) Monoclonal IGHV gene rearrangement
2. Presence of a B-CLPD disease-specific immunophenotype2
3. Absolute B-cell lymphocyte count <5x10⁹/L
4. No other clinical features compatible with a lymphoproliferative disorder: a) absence of B
symptoms, b) normal physical examination (no lymphadenopathy or organomegaly), c) no
autoimmune/infectious disease
Subclassification of MBL:
CLL-like MBL
● CLL phenotype: CD5+CD19
+CD20
lowCD23
+sIg
lowCD79b
low
● Light chain restriction with SmIglow
3
Atypical CLL-like MBL
● CD5+CD19
+, but CD23
- or low and/or CD20
high, and/or SmIg
high and/or CD79b
high
● Light chain restriction with moderate to bright SmIg expression3
● Exclude t(11;14) to rule out mantle cell lymphoma
Non-CLL-like MBL
● CD5-CD19
+CD20
+ B-cells
● Light chain restriction with moderate to bright SmIg expression3
1Where possible, repeated assessment(s) should also demonstrate that the monoclonal B-cell population is stable
over a 3-month period. 2In the absence of a disease-specific immunophenotype, a highly skewed kappa:lambda ratio may result from a
reactive process/immune response. 3Very small MBL clones may be oligoclonal and thus not light chain restricted.
3.1.2. Prevalence of MBL
The prevalence of MBL in the general population varies substantially (from 0.6% to up
to 20% of cases) depending on the population-cohorts investigated and the sensitivity of the
MFC immunophenotypic approach used.15,16,185 Thus, in the general population, MBL is more
commonly detected among males, its frequency increasing with age, similarly to what is
observed in CLL.15,189 Reports on more limited series of first degree relatives of CLL patients
also suggest familial aggregation and consequently, a genetic predisposition/ inheritance.190,191

33
Chapter 1 INTRODUCTION
The prevalence of MBL in the general population appears to be very rare under the age
of 40.16,186 Thereafter, it increases from 5.1% of adults with 40–49 years and 5.3% of adults
aged 50 to 59 years, to much higher rates: 17.5%, 21.7%, 27.3% and 75% among the 60–69,
70–79, 80–89 years and >89 years age groups, respectively.15 In turn, the risk for MBL appears
to be increased by 4-fold in first-degree relatives of CLL patients.190,191 Conversely, there is
almost no data about the prevalence of MBL among first-degree relatives of individuals with
MBL.
Regarding non-CLL-like MBL, controversial results have been reported in the literature
with respect to the age at onset of the underlying B-cell clones. Ghia et al.186 suggested that
non-CLL-like MBL clones are already detectable in the general population in sizeable amounts
among individuals younger than 40 years and that their frequency is only marginally affected
by age. Thus, based on the observations of Ghia et al.186 it could be hypothesized that while
CLL-like MBL could be related to physiologic immune senescence-associated mechanisms, this
would not explain the observation of other non-CLL-like MBL cases. However, it should be
noted that, in contrast to what occurs in CLL-like MBL, currently there are no highly sensitive
assays for the identification of non-CLL-like B-cells in PB, which weaknesses the potential
conclusions about the exact prevalence (and even phenotypes) of non-CLL MBL. In addition,
Nieto et al.192 found a progressively higher frequency of non-CLL-like MBL cases in the general
population with increasing age, the frequencies observed ranging from 0.4% among subjects
aged 40–59 years to 5.4% among individuals over 80 years; such findings, suggest a similar
behavior in the general population for non-CLL-like and CLL-like MBL, as regards its prevalence
and distribution per age.
3.1.3. Risk factors for progression from CLL-like monoclonal B-cell lymphocytosis to
chronic lymphocytic leukemia
The strong association reported between CLL-like MBL and increasing age, has
promoted the hypothesis that MBL could be one of many signs of “immunosenescence”.193
Immunosenescence is a physiological process which involves an impaired function of immune
cells. Among B-cells, immunosenescence is associated with accumulation of B cell populations
producing polyreactive and autoreactive antibodies, lower incidence of SHM, and a more
limited IGHV gene usage together with the emergence of oligo and even (mono)clonality,
including the presence of detectable (mono)clonal component peaks in the serum.194-196
Actually, presence of tiny numbers of clinically indolent (mono)clonal B cells with a CLL or
other B-CLPD associated phenotype, is a rather common finding at the very early phases of

34
Chapter 1 INTRODUCTION
most mature B-cell neoplasms. The most well-recognized example of such early events is
monoclonal gammopathy of undetermined significance (MGUS), which shows an incidence of
around 1% in the general population older than 50 years, such frequency increasing thereafter
to up to 10% among subjects older than 75 years.197 Of note independent studies198,199 have
demonstrated that in most multiple myeloma (MM) patients, the disease is preceded by MGUS
with a malignant transformation rate of MGUS to MM of between 1% and 2% cases per
year.200 More recently, a similar behavior and relationship has been identified for CLL-like MBL
and CLL5,184 as discussed below.
Population-based screening for CLL-like MBL has shown that MBLlow is more commonly
associated with oligoclonality than CLL (20% of MBL vs. 5% of CLL) and MBLlow is enriched for
lower risk CLL markers, such as mutated IGHV sequences (around 87% of MBLlow clones have
mutated Ig genes vs. around 50% of CLL cases).20 These findings suggest that the acquisition of
a CLL-like cell surface immunophenotype does not necessarily go along with the emergence of
a single clone, but it might more likely reflect a functional state potentially associated with
prolonged/chronic B-cell stimulation, activation and/or immunesenescence, similarly to what
has been previously described for T cells in the aging population, where chronic and persistent
viral infections induce the emergence of oligoclonal and even monoclonal expansions of
CD4+CD8+ T lymphocytes, under the influence of a specific genetic background (e.g. HLA-class II
haplotypes).201,202 In this regard, it should be noted that preliminary investigations of IGHV
gene usage in CLL-like MBLlow based on highly-sensitive single cell purification techniques, have
shown that clonal B-cells from MBLlow cases less frequently use VH CDR3 stereotypes (see
definition in section 3.2.3.2.), their restricted IGHV repertoire (e.g. the IGHV4–59 and IGHV4–
61 families are more frequently used than others) being also distinct from that detected in
both mutated and unmutated CLL cases.15,20,203 Overall, the above biological differences
observed between expanded clonal B-cells in CLL-like MBLlow vs. CLL suggest that detection of
CLL-like MBL in an otherwise healthy subject is not always equivalent to a preleukemic state,
because specific BCR configurations are more prone than others for disease transformation. In
line with this hypothesis, it has been recently shown in a cross-sectional epidemiological study
that in the general population, MBLlow is significantly associated with a personal history of
pneumonia and meningitis and infectious diseases among their children, while it was less
commonly observed among subjects vaccinated against pneumococcus and influenza; these
results suggest that exposure to infectious agents leads to serious clinical manifestations in
the patients or their relatives and that they may more frequently trigger immune events
leading to MBL.204

35
Chapter 1 INTRODUCTION
In contrast to what has been described for MBLlow, in MBLhigh cases the biology of the
expanded CLL-like B-cell clone more closely mimicks what is also seen in good-risk CLL: it
shows molecular features similar to good-prognosis CLL (e.g. a bias toward mutated and
clinically favorable BCR) different from those that are more frequently found in MBLlow.16 For
example, recent investigations203,205 indicate that Ig genes commonly expressed in CLL (IGVH1–
69 and IGVH4–34) are also frequently used in CLL-like MBLhigh (IGVH4–34 and IGVH3–23), but
rarely observed in MBLlow.
In line with what has been described above for the IGHV repertoire of MBL,
cytogenetic analysis of clonal B-cells from CLL-like MBL subjects has also demonstrated
alterations – typically restricted to del(13q) and trisomy 12 – in about 40% of cases vs. >50% of
CLL patients.16,206 These abnormalities are usually seen in only a fraction of all abnormal cells,
such fraction increasing from MBLlow cases to CLL.20 Despite MBLlow does not show poor-
prognosis cytogenetic/molecular alterations – e.g. del(17p), del(11q) or NOTCH1 mutations –
currently there is no cytogenetic marker which identifies MBL individuals who are likely to
develop progressive disease.203,206 Of note, in some MBLlow cases, cytogenetic alterations are
observed even when the number of circulating MBL cells is extremely small, once again, in the
absence of any evidence of progression to MBLhigh and CLL.187 Overall, these findings mimick
what has been previously reported also for most MGUS cases, where the (mono)clonal plasma
cells frequently bear overlapping chromosomal abnormalities and cytogenetic profiles with
symptomatic MM;207,208 at the same time, it may also contribute to explain why cells carrying
the t(14;18) translocation (the cytogenetic hallmark of FL) can be found in the PB of
approximately 50% of healthy persons in the absence of evidence for disease progression.209 In
more detail, del(13q14) can be detected in approximately an equal proportion of CLL-like MBL
and CLL, particularly among IGHV mutated clones, independent of the absolute number of
circulating CLL cells.210,211 Once again, these observations highlight the fact that development
of very small CLL clones with “good risk” cytogenetic and biological features is a common
finding in the elderly and it may be a consequence of the ageing of immune system more than
an actual oncogenic event; at the same time, they indicate that additional factors are required
to drive small CLL clones to expand. In contrast to del(13q) cytogenetic abnormalities which
are associated with poor prognosis CLL, such as del(17p13), del(11q22) and NOTCH1
mutations, have not been reported in MBLlow and they are only occasionally seen in CLL-like
MBLhigh.15,16,18 These observations, together with the restricted but different, IGHV repertoire
detected in MBLlow vs. MBLhigh, suggest that in addition to the occurrence of specific genetic
alterations, specific BCR signaling would be also required for the expansion of CLL-like MBL
cells and for the transformation of MBL to symptomatic CLL, at least in a fraction of the cases.

36
Chapter 1 INTRODUCTION
In this regard, it has been recently shown that CLL is always preceded by an MBL
state,212 similarly to what occurs with MM and MGUS. In turn, this is also consistent with the
fact that most MBL cases will not progress to CLL, particularly among MBLlow subjects, where
progression appears to be very unlikely.213 Due to the arbitrary cutoffs used for the distinction
between MBL and CLL Rai stage 0, at present it is well-accepted that it is more appropriate to
define the risk of MBL progression as the risk for developing CLL requiring treatment, than just
the risk to develop CLL. Based on such criteria, follow-up studies of large series of MBLhigh cases
have found an annual risk of progression of MBLhigh to CLL requiring treatment of between 1
and 2% vs. 5 to 7% for CLL Rai stage 0 patients.16,18,214 Today, the only prognostic factor known
to predict progression of MBL to CLL is the actual number of clonal B lymphocytes in PB.16,18
However, other prognostic markers that are informative within CLL might also be applied to
CLL-like MBL, to predict which cases might progress to CLL and eventually require treatment.
Therefore, established risk factors for CLL, such as the IGHV mutational status,
cytogenetic/molecular aberrations, expression of specific phenotypic markers (e.g. ZAP-70,
CD38 and CD49d), are potentially also adverse prognostic factors among CLL-like MBL subjects,
their precise value deserving further investigations.
Other factors that might contribute to understand the pathogenesis of MBL and
predict transformation of MBL into CLL include an altered homeostasis and functionality of
both NK- and/or T-cells, which have been suggested to influence survival of CLL B-cells and
progression of the disease.19,215 In this regard, recent studies have shown that in MBL subjects,
CD4+CD8+ double-positive T-cells are significantly reduced in absolute numbers while CD8+CD4–
T-cells are increased, supporting the notion that an impaired immunosurveillance function may
favor the emergence of MBL clones.216 Moreover, presence of MBL clones in healthy subjects
is associated with reduced counts of normal circulating PB B-cells, mainly at the expense of
immature and naive B-cells, such decrease being more pronounced as the number of MBL cells
increases.216 Based on these observations, it could be hypothesized that the reduced PB counts
of normal B-cells at the expenses of recently produced B-cell subsets in MBLlow, could depend
on the size of the B-cell clone in the BM, suggesting a potential suppressive effect of the MBL
clone on normal B-lymphopoiesis. Whether these abnormalities occur before or after the
emergence of the MBL clone(s), and whether this reduction derives from immune-suppression
or it may reflect a decrease in B-cell production at BM niches due to MBL-cell competition,
requires further investigations.
Altogether, the above observations raise the question about whether there is a time-
dependent pipeline of unavoidable events leading from MBLlow to MBLhigh and also to CLL, or
MBLlow simply represents one of many features of immunesenescence, while (clinical) MBLhigh

37
Chapter 1 INTRODUCTION
is already a pre-malignant CLL state. At present, further research is still required to elucidate
this question. However it should be noted that the understanding of the molecular and
biological features underlying the risk of progression of MBL to CLL may significantly modify
the currently used strategies for the follow-up of MBL, leading to a more refined management
of CLL premalignant states and a better follow-up of MBL cases at risk of progression, for early
adoption of measures that would potentially block or delay malignant transformation.
3.2. Chronic lymphocytic leukemia
3.2.1. Definition and diagnostic criteria for CLL
CLL is the most common leukemia in adults in the Western world.217,218 It is a chronic
incurable disease which is characterized by progressive accumulation of B cells in the PB, BM,
and/or lymphoid tissues.219 When the disease mostly involves the PB and BM, it is called CLL,
while when LN or other tissues are preferentially infiltrated by tumor cells with identical
morphologic and immunophenotypic features to CLL, in the absence of the typical leukemic
manifestations of the disease, it is called small lymphocytic lymphoma (SLL). In the WHO 2008
classification,180,181 these two entities (CLL and SLL) are simply considered as different clinical
manifestations of the same disease. Current diagnostic criteria for typical CLL requires the
presence of at least 5,000 B lymphocytes/µl of PB with a CLL immunophenotype, or LN
involvement by CLL cells in case of SLL.220 BM involvement is typically present, infiltrating CLL
cells usually represent more than 30% of all nucleated cells in the aspirated BM sample.
Despite a remarkable phenotypic homogeneity, CLL is characterized by an extremely
variable clinical course with very heterogeneous responses to treatment; thus, while some
patients do not require therapy for rather long periods of time after diagnosis or they reach
complete and prolonged remissions after treatment, others relapse early and need several
lines of treatment and frequently die from the disease.221 Such clinical heterogeneity most
likely reflects the underlying molecular and cellular heterogeneity of the disease.22 In fact,
several lines of research have demonstrated that CLL can be subdivided into multiple
subgroups with distinct biological features, based on underlying genomic features,
cytogenetic/molecular aberrations and/or the immune signaling pathways that can be
activated via cell surface and/or intracellular receptor molecules of both the innate (e.g. TLRs)
and adaptive (e.g. BCR) immune system.22,222,223

38
Chapter 1 INTRODUCTION
3.2.2. Immunophenotypic features of CLL cells
The typical immunophenotypic profile of CLL small lymphocytes includes coexpression
of CD5 and CD23 in the absence of FMC7 and low expression levels of SmIg (often IgM with or
without IgD);224 in addition, the levels of expression of several other B-cell-associated cell
surface membrane molecules like CD20, CD22, CD79b and CD81 are also significantly
decreased compared to those found on normal mature B-lymphocytes.225 CLL cells also
coexpress CD43 and CD200 which may provide further information in differentiating CLL from
other B-cell NHL and chronic lymphoid leukemias such as FL (e.g. CD43 is positive in CLL but
usually negative in FL) and MCL (e.g. CD200 is consistently expressed in CLL whilst it is negative
or very weakly expressed in MCL).226 Moreover, CLL cells are usually positive for CD21, CD24,
CD25, CD27, CD39, CD40, CD45RA, CD62L and CXCR5 (CD185). In turn, CD11c, CD38, CD45RO,
CD49d, CD80, CD95, CD124, CD126, CD130, ZAP-70 and other markers that recognize adhesion
molecules, are expressed at variable levels in a fraction of all CLL/SLL cases.
3.2.3. Molecular features of CLL cells
3.2.3.1. Immunoglobulin heavy chain variable region gene usage in CLL
In recent years, several studies have confirmed that the IGHV gene repertoire of CLL is
restricted and different from that of normal IgM+ B-cells;227-229 thus, several IGHV genes are
clearly over-represented in CLL (e.g. the IGHV1-69, IGHV4-34, and IGHV3-7 genes).227 Similarly,
a restricted usage of specific IGHD and IGHJ genes has also been described in CLL.13 In this
regard, only five IGHD genes are used by almost half of all CLL cases, the IGHD3-3 gene being
the most frequently selected; in turn, the IGHJ gene repertoire of CLL cells is characterized by a
preferential usage of the IGHJ4 and IGHJ6 genes.230,231 Such restricted IGH gene repertoire
leads to the predominant usage of specific IGHV, IGHD and IGHJ gene combinations. For
example, IGHV1-69 gene rearrangements are strongly biased toward the usage of the IGHD3-3
and the IGHJ6 genes; in contrast, no significant (or minor) biases are noted for cases
expressing other IGHV genes, particularly IGHV4-34, IGHV3-7 and IGHV3-23.230,232
Furthermore, the imprint of SHM is not uniform across different IGHV genes in CLL; thus, the
IGHV1-69 gene most frequently carries very few or no mutations, as opposed to the IGHV3-7,
IGHV3-23 and IGHV4-34 genes, which are mutated in a relatively significant proportion of
cases.227
39
Chapter 1 INTRODUCTION
3.2.3.2. Stereotyped B-cell receptors in CLL
Immunogenetic studies of the BCR repertoire of CLL cells has revealed the presence of
homologous BCR in a significant proportion of cases, suggesting that recognition of common
epitopes or classes of structurally similar epitopes is likely involved in the selection of CLL
clones.233-235 Overall, different types of homologous BCR have been defined, enabling different
cases to be grouped into subsets based on common sequence features of the BCR, particularly
the homology of their VH CDR3 sequences. These highly similar BCR have been referred as
“stereotyped” BCR.233 So far, more than 200 different subsets of cases carrying stereotyped
BCR have been defined, 8 of such subsets accounting for ≈30% of all stereotyped CLL cases.236
In 2007, a set of criteria was proposed for the definition of stereotyped BCR based on
the specific underlying IGH V(D)J gene rearrangements;237 these criteria include: 1) a VH CDR3
aa identity ≥60%, in line with established bioinformatic concepts for evaluating sequence
conservation in protein sequences; 2) usage of the same IGHV/IGHD/IGHJ germline genes or
different IGHV genes, as long as the above criterion for VH CDR3 sequence conservation is
met; 3) usage of the same IGHD gene RF.
Based on this clustering approach for stereotyped BCR in CLL, it has been shown that
the frequency of BCR Ig stereotypes in CLL can exceed 25% of the entire CLL patient cohort;13
although BCR Ig stereotypes exist among both mutated and unmutated CLL, they are
significantly more frequently observed in the latter group.233,238 Of note, different versions of
BCR Ig stereotypes can be defined based on shared VH CDR3 aa sequence patterns, which are
distinct for each subset.239 Interestingly, the relative size of each subset differs markedly, from
just two to large numbers of cases with homologous BCR, since individual genes show a
markedly different susceptibility to be used in stereotyped rearrangements in CLL. Hence,
while the frequency of stereotyped rearrangements has been shown to exceed 30% of the
cases for some IGHV genes (e.g. IGHV3-21, IGHV1-69, IGHV1-2, IGHV1-3, IGHV4-39, IGHV3-48),
it is rather low (<5%) for other IGHV genes (e.g. IGHV3-7, IGHV3-74).237 In addition, individual
subsets of cases with stereotyped VH CDR3 are often characterized by restricted Ig light chain
gene usage and CDR3 features.237,240,241 On top of all the above, specific subsets of stereotyped
CLL cases may be also associated with distinct clinical/phenotypic features including a different
outcome (see section 3.2.5.2. below), raising the possibility that a particular Ag binding site can
be critical in determining clinical presentation and potentially also even disease
prognosis.237,242 Finally, although BCR stereotypes have also been found in other B-CLPD, those
observed in CLL are frequently different from the ones reported in other B-cell malignancies

40
Chapter 1 INTRODUCTION
such as splenic MZL (SMZL) and MCL, alluding to distinct disease-biased, selective and
ontogenetic processes.243,244
Based on the above observations it might be concluded that depending on the BCR
repertoire, CLL actually consists of two major different categories which show important
biological and ontogenetic differences;13 the first includes cases with heterogeneous BCR (non-
clustered cases), while the second is characterized by a remarkably high frequency of BCR
stereotypy (clustered cases). The biological significance of BCR stereotypy still remains to be
fully understood.
3.2.3.3. Recognition of conserved epitopes by CLL cells
Detailed dissection of the potentially relevant antigenic epitopes recognized by the
BCR in CLL, indicates that these might probably correspond to molecular structures usually
involved in eliminating cellular debris, scavenging apoptotic cells and apoptotic bodies, and/or
providing a first line of defense against pathogenic bacteria.245-247 For instance, non-muscle
myosin heavy chain IIA (MYHIIA), which is expressed on a subpopulation of apoptotic cells
(called myosin-exposed apoptotic cells or MEAC), emerged as the antigenic target of CLL
monoclonal antibodies (mAbs) from a subset of cases expressing IGHV1-69/IGHD3-16/IGHJ3
stereotyped BCR, as well as of several other CLL mAbs.246 Other Ags recognized by CLL cells
have been functionally associated with specific bacterial infections – e.g. molecular mimicry
driven by Streptococcus pneumoniae capsular polysaccharides, Gram-positive, Gram-negative
bacterial strains and oxidized low-density lipoprotein (LDL) –.248 Viral infections have also been
suggested to drive subgroups of BCR stereotyped CLL cases; accordingly, persistent infection
by Epstein–Barr virus (EBV) and cytomegalovirus (CMV) has been correlated with a
stereotyped IGHV4-34 subset249 and hepatitis C virus (HCV) has been recently associated with
stereotyped IGHV4-59/IGKV3-20 CLL mAbs, albeit indirectly, since such CLL mAbs can exhibit
rheumatoid factor activity.250 Interestingly, the existence of rheumatoid factor with restricted
Ig gene sequences in various conditions (e.g. CLL, SMZL, myoepithelial sialadenitis in primary
Sjogren’s syndrome, mixed cryoglobulinemia type II) may allude to cross-reactivity or
molecular mimicry of the antigenic elements which are involved in the selection of the
clonogenic B-cell progenitors involved in distinct pathologic conditions.250

41
Chapter 1 INTRODUCTION
3.2.4. Genomic aberrations in CLL
Genomic aberrations can be identified in around 50-80% of CLL cases by iFISH analysis
of CLL cell nuclei with a disease-specific probe set.251,252 The most common chromosomal
abnormalities in CLL are del(13)(q14), trisomy 12, del(11)(q22–23), del(17)(p13) and
del(6)(q21).222 Del(13q14) followed by trisomy 12 are the two most frequent cytogenetic
alterations in CLL, being present in between 8% and 60% and between 10% and 25% of all
cases, respectively.222,252,253 In turn, del(17p13) and del(11q23.3-q23.1) are detected in a
significantly lower proportion of cases, ranging between 5% and 16% and between 5% and
15% of all CLL cases, respectively.222,252,253 In common, these cytogenetic abnormalities, and a
number of other chromosomal defects, are known to target genes that play a key role in the
regulation of cell proliferation, survival, and/or DNA repair, such as the tumor protein p53
(TP53), retinoblastoma (RB), ataxia telangiectasia mutated (ATM), CYCLIN D2, cyclin-dependent
kinase 4 (CDK4), and E3 ubiquitin-protein ligase (MDM2) genes. Despite the high frequency of
both del(13q14) and trisomy 12 and the fact that they have been suggested to play a primary
and central role in the transformation process in CLL,254 the pathogenic role of del(13q) and
trisomy 12 in CLL is not fully understood. In this regard, at present it is known that the deleted
chromosome 13q region, always comprises the locus coding for two microRNA (miRNA),
miRNA-16-1 and miRNA-15a, which have been suggested to act as tumor suppressor genes in
the pathogenesis of CLL via down-regulation of expression of the antiapoptotic Bcl2
protein;255,256 in turn, in a fraction of cases carrying del(13q), larger deletions that include the
region coding for the RB1 gene occur, such larger deletions being associated with a poorer
clinical outcome, potentially due to an altered control of cell proliferation and survival.257-259
Besides its relevance in the pathogenesis of CLL, miRNA expression profiles may also
be relevant prognostic markers in CLL. In this regard, it should be noted that critical processes
of the B-cell physiology, including immune signaling through the BCR and/or TLR, are targeted
by miRNA and, changes on the expression of specific miRNA (e.g. upregulation of miRNA-150,
miRNA-29c, miRNA-143 and miRNA-223 and downregulation of miRNA-15a) which are
differentially expressed among mutated vs. unmutated CLL cases and in certain CLL
stereotypes (e.g downregulation of miRNA-101 in subset 1), may also modulate the biological
and clinical behavior of CLL clones.260 As an example, miRNA-101 regulates the expression
levels of the enhancer of zeste homolog 2 (EZH2) protein; consequently, its overexpression is
associated with more aggressive CLL.260
Recent studies devoted to whole CLL genome sequencing have shown the presence of
more than one thousand distinct mutations across CLL patients. However, the frequency at

42
Chapter 1 INTRODUCTION
which such mutations were found in CLL was relatively low, except for a few genes.6,261,262 The
recently identified genes, included the Notch 1 (NOTCH1, 12.3%), splicing factor 3b subunit 1
(SF3B1, 9.0%), TP53 (7.1%), exportin 1 (XPO1, 3.4%), F-box and WD repeat domain containing 7
(FBXW7, 2.5%), myeloid differentiation primary response gene 88 (MyD88, 1.5%) and the
kelch-like family member 6 (KLHL6, 1.8%) genes, apart from those that had been previously
described.6,263 Since, some of these mutations can also emerge during the clinical course of
CLL,264 future studies are required to clarify how this might influence treatment strategies, as
data suggest that therapy may disrupt the interclonal equilibrium and lead to evolution of
subclones with driver mutations such as SF3B1, NOTCH1 or TP53 mutations.265 Furthermore, a
recent cohort study has shown that different subgroups of CLL can be defined according to co-
occurrence of distinct patterns of genetic alterations for some of these mutations: 1)
mutations in SF3B1 gene are frequently associated with del(11q); 2) mutations in the NOTCH1
and the FBXW7 genes are associated with trisomy 12, whereas these two mutations and SF3B1
mutations were nearly mutually exclusive, and; 3) mutations in the MYD88 gene are mainly
found in combination with isolated del(13q), while NOTCH1, FBXW7 and SF3B1 mutations are
rarely found in this cytogenetic subgroup of CLL.263 Thus, the combination of molecular
markers with discrete cytogenetic subgroups may hint at distinct ways of CLL pathogenesis and
may explain the clinical heterogeneity of the disease.
3.2.5. Outcome and prognosis of CLL patients
As discussed above, CLL is a clinically and biologically heterogeneous disease, with a
highly variable outcome. During the last decades, several clinical and biological variables,
including the immunogenetic profiles of CLL cells, have been related with the prognosis of the
disease.
3.2.5.1. Clinical and biological prognostic factors
The standard clinical procedures to estimate prognosis in CLL are based on the staging
systems developed by Rai et al.266 and reformulated latter on by Binet et al..267 These systems
(Table 3) define early (Rai 0, Binet A), intermediate (Rai I/II, Binet B) and advanced (Rai III/IV,
Binet C) stage disease with, median estimated overall survival rates of >10 years, 5-7 years,
and only 1-3 years, respectively. Because most patients present early or intermediate stage
disease and a heterogeneous course of disease occurs for individual patients within the same

43
Chapter 1 INTRODUCTION
disease stage, additional markers are needed to stratify patients who are at increased risk of
disease progression with a potentially decreased survival, within individual disease stages.
A relatively high number of prognostically relevant markers have long been identified
in CLL. Among other, these include clinical characteristics (e.g. patient age, gender, and
performance status) in addition to the stage of the disease, as well as laboratory parameters
reflecting the tumor burden and/or activity of the disease, (e.g. lymphocyte count, BM
infiltration pattern or lymphocyte doubling time) (Table 4).268 More recently, prognostic
markers related to the biology of the tumor have been also identified, including serum
parameters, immunophenotypic markers and cytogenetic/molecular characteristics of CLL
cells, such as the mutational status of the IGHV genes (Table 4) that will be specifically
discussed in the following section of this chapter.222,269-271
Table 3. Rai et al. and Binet et al. staging systems for the prognostic classification of CLL.
At present, it is widely accepted that chromosomal aberrations are one of the most
relevant prognostic factors in CLL, being associated with different clinical and prognostic
features of the disease. Thus, in general a normal karyotype and presence of isolated del(13q)
are both associated with a significantly better outcome, whereas trisomy 12 confers an
intermediate prognosis associated with atypical CLL, and both del(11q) and del(17p) are
associated with a particularly poorer outcome.222,252,272 Despite this, recent studies have shown
that there is a significant heterogeneity in the outcome of patients with isolated del(13q),273-276
Staging
System Stage Definition Median survival
Rai et al.
staging
system
0 (low risk) Lymphocytosis only 11.5 years
I (intermediate risk) Lymphocytosis and lymphadenopathy 11.0 years
II (intermediate risk) Lymphocytosis in blood and marrow with
splenomegaly and/or hepatomegaly ( with or
without lymphadenopathies)
7.8 years
III (high risk) Lymphocytosis and anemia (hemoglobin
<110g/L or a hematocrit <33%)
5.3 years
IV (high risk) Lymphocytosis and thrombocytopenia
(platelet count <100x109/L)
7.0 years
Binet et al.
staging
A Enlargement of <3 lymphoid areas (cervical,
axillary, inguinal, spleen, liver); no anemia or
thrombocytopenia
11.5 years
B Enlargement of ≥3 lymphoid areas 8.6 years
C Anemia (hemoglobin <100 g/L) or
thrombocytopenia (platelet count
<100x109/L), or both
7.0 years

44
Chapter 1 INTRODUCTION
the clinical impact of biallelic vs. monoallelic del(13q) still remaning controversial. In this
regard, it should be noted that while biallelic loss of chromosome 13q is frequently seen as a
secondary cytogenetic event with a limited impact on prognosis, the progressive accumulation
of high percentages of cells (>90%) carrying del(13q) has been described as an independent
prognostic factor for risk stratification of patients with del(13q).277
TP53 and SF3B1 mutations emerge among the strongest biological markers with an
independent prognostic value in CLL patients receiving current standard first-line therapy.278
CLL patients with TP53 mutation have a poor prognosis when treated with fludarabine (F)-
based chemotherapeutic regimens regardless of the presence of del(17p) and should be
considered for alternative treatment approaches.279 In turn, SF3B1 mutations have a lower
incidence in early CLL stages, and they are more commonly observed in advanced disease,
tending to be associated with a poorer prognosis.16,280 NOTCH1, XPO1 and MYD88 are other
three genes that are recurrently mutated in CLL, being associated with a better (e.g. MYD88)
or a poorer outcome (NOTCH1, XPO1).
In addition to tumor cytogenetics, several immunophenotypic markers of CLL cells,
have also been associated with the prognosis of the disease. Thus, both CD38 and ZAP70
expression have been shown to be associated with a poorer outcome in CLL.281,282 Similarly,
increased expression of the CD49d integrin has consistently been identified as an independent
negative prognosticator for CLL, particularly among IGHV unmutated cases, defining a subset
of CLL patients characterized by an aggressive and accelerated clinical course;271,283,284 in
contrast, preliminary data also suggests that CD305 (LAIR1), an inhibitory B-cell signaling
molecule, appears to confer a better prognosis in CLL.285 Other markers that have been also
associated with adverse prognostic features of CLL include: higher expression of CD74286 and
absence of CTLA4 expression.287 Of note, specific polymorphic variants of CTLA4 have been
associated with advanced Rai stages and an increased risk of progression of CLL.288
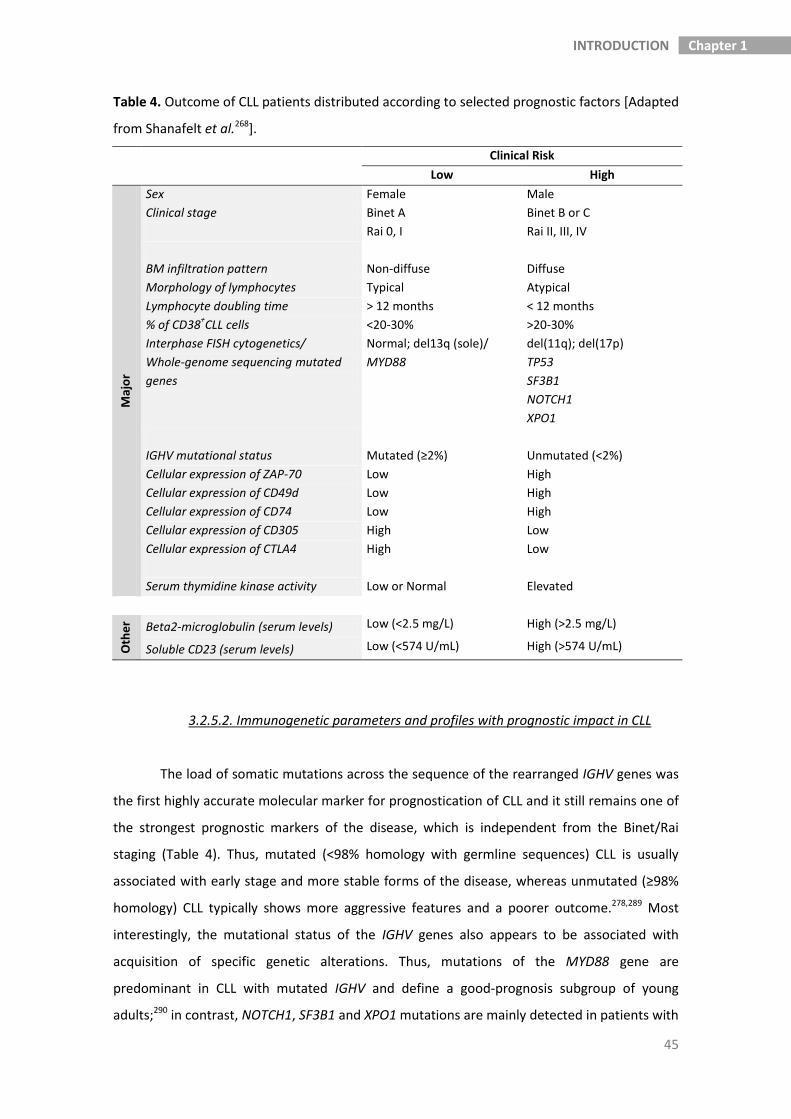
45
Chapter 1 INTRODUCTION
Table 4. Outcome of CLL patients distributed according to selected prognostic factors [Adapted
from Shanafelt et al.268].
Clinical Risk
Low High
Maj
or
Sex Female Male
Clinical stage Binet A Binet B or C
Rai 0, I Rai II, III, IV
BM infiltration pattern Non-diffuse Diffuse
Morphology of lymphocytes Typical Atypical
Lymphocyte doubling time > 12 months < 12 months
% of CD38+CLL cells <20-30% >20-30%
Interphase FISH cytogenetics/
Whole-genome sequencing mutated
genes
Normal; del13q (sole)/
MYD88
del(11q); del(17p)
TP53
SF3B1
NOTCH1
XPO1
IGHV mutational status Mutated (≥2%) Unmutated (<2%)
Cellular expression of ZAP-70
Cellular expression of CD49d
Cellular expression of CD74
Low
Low
Low
High
High
High
Cellular expression of CD305 High Low
Cellular expression of CTLA4 High Low
Serum thymidine kinase activity Low or Normal Elevated
Oth
er Beta2-microglobulin (serum levels) Low (<2.5 mg/L) High (>2.5 mg/L)
Soluble CD23 (serum levels) Low (<574 U/mL) High (>574 U/mL)
3.2.5.2. Immunogenetic parameters and profiles with prognostic impact in CLL
The load of somatic mutations across the sequence of the rearranged IGHV genes was
the first highly accurate molecular marker for prognostication of CLL and it still remains one of
the strongest prognostic markers of the disease, which is independent from the Binet/Rai
staging (Table 4). Thus, mutated (<98% homology with germline sequences) CLL is usually
associated with early stage and more stable forms of the disease, whereas unmutated (≥98%
homology) CLL typically shows more aggressive features and a poorer outcome.278,289 Most
interestingly, the mutational status of the IGHV genes also appears to be associated with
acquisition of specific genetic alterations. Thus, mutations of the MYD88 gene are
predominant in CLL with mutated IGHV and define a good-prognosis subgroup of young
adults;290 in contrast, NOTCH1, SF3B1 and XPO1 mutations are mainly detected in patients with

46
Chapter 1 INTRODUCTION
unmutated Igs.263 These patterns of association between the IGHV somatic mutation profile
and specific genetic changes, support the notion that recurrent mutations of the NOTCH1,
MYD88, SF3B1 and XPO1 genes are oncogenic changes that contribute to the clinical evolution
of specific subsets of CLL patients defined by their IGHV gene status.6
In addition to the IGHV mutational status, specific IGHV genes have been also
associated with the prognosis of CLL. The first hints suggesting that not only the mutational
status of the IGHV genes, but also other BCR features could be prognostically relevant in CLL,
came more than 10 years ago, in 2002. At that time, it was already found that usage of the
IGHV3-21 gene was associated with an adverse prognosis, regardless of the SHM load.291
Afterward, other reports confirmed the association between specific IGHV genes and
prognosis of CLL; while some IGHV genes confer an adverse prognosis (e.g. IGHV3-23)292 others
are associated with a more favorable outcome (e.g. IGHV3-30 and IGHV3-72) of CLL.293
However, except for the data on the prognostic impact of the IGHV3-21 gene, for which there
is strong evidence,294,295 the prognostic association of other IGHV gene usage profiles is based
on retrospective analyses of rather small patient series, hence requiring definitive
confirmation in prospective studies including larger numbers of patients.
In parallel, specific associations have also been reported in CLL between subsets of
cases with (quasi-identical) 'stereotyped' BCR and several clinical features of the disease.238,296
As an example, CLL cases expressing stereotyped IGHV4-39/IGHD6-13/IGHJ5 BCR more
frequently experience aggressive disease complicated by severe recurrent infections, Richter’s
transformation and/or the occurrence of secondary neoplasias (e.g. solid tumors).238 Another
clinically relevant example of such association, relies on cases showing expression of
stereotyped IGHV4-34/IGKV2-30 BCR of the IgG isotype together with unique patterns of SHM,
occurring in younger CLL patients237,297,298 presenting a more indolent disease.237,297 Also, the
cooperative association between IGHV4-39 gene usage and specific BCR stereotypes, NOTCH1
mutation and trisomy 12, more frequently leads to CLL transformation into Richter
syndrome;236 similarly, coexistence of SF3B1 mutations and specific BCR stereotypes
associated to the IGHV3-21 gene, invariably leads to disease progression among such CLL
cases.236
3.2.6. The cell of origin of CLL-like MBL and CLL
In human hematopoietic cells, genetic alterations which are responsible for oncogenic
transformation should in principle accumulate in cells that already have (or will acquire) self-
renewing proprieties, such as HSCs. Such cells can continuously produce a number of

47
Chapter 1 INTRODUCTION
progenitors which carry the same genetic alteration and that are potential targets for
additional mutations,299 which might become leukemia stem cells with self-renewal capacity
and a limited ability to differentiate normally.300,301
While myeloproliferative neoplasms and myelodysplastic syndromes are known to
arise at the HSC stage in hematopoiesis, many other hematologic malignancies have been
linked to later stages in the hematopoietic hierarchy.302-304 For example, aggressive acute
leukemias are generally believed to arise from early progenitors, with some initial
leukemogenic events occurring in the HSC themselves.303,304 In turn, most mature B cell
lymphomas and leukemias are classified according to their presumed cell of origin along the
continuum of B cell development and differentiation, early oncogenic events potentially
targeting long living pre-GC B-cells, memory B-cells and/or plasma cells.7
In recent years, the focus of research in CLL has moved towards the molecular genetic
level. This is due to the fact that there is a general believe that the identification and the
understanding of those genetic and molecular mechanisms directly responsible for the course
of the disease, such as clinical progression, response to treatment and overall survival, will
contribute to accelerate the cure of the disease, at the same time they will provide insight into
those events leading to the development and malignant transformation, in CLL. Consequently,
an increasing number of studies have been reported which provide useful information to
delineate part of the history of the malignant CLL clone, particularly during the period that
precedes malignant transformation, e.g. at the stage of MBL.
3.2.6.1. Multistep models for human CLL development
The precise B-cell subset targeted at the initial stages of CLL, still remains a matter of
debate, and current knowledge about the history of the cell of origin of CLL, prior to leukemic
transformation, is incomplete. Consistent expression of CD5 on CLL cells led to initial
speculations that CLL might be a malignancy of CD5+ B-cells,305,306 a subset of B-lymphocytes
that represent a distinct B cell lineage (B1 B-cells) in mice where they are capable of self-
renewing, producing natural/polyspecific antibodies and responding to T-independent Ags;
based on this hypothesis, CLL cells were claimed to be potentially stimulated in vivo in a
continued way by self-antigens.307,308 Recently, human PB CD5+ B cells have been shown to
correspond to the so called immature/transitional B cells,121 as confirmed by unsupervised
analysis of gene expression profile (GEP) for >10,000 transcripts of CLL cells vs. distinct subsets
of normal mature B-lymphocytes.309,310 However, despite most CD5+ B-lymphocytes are
regarded as pre-GC B-lymphocytes with unmutated IGHV genes, around half of all CLL cases

48
Chapter 1 INTRODUCTION
harbor mutated IGHV genes.270,311,312 In line with these findings, a small fraction of CD5+ B-cells
(4–17%) that coexpress the memory B-cell associated CD27 marker has also been described in
healthy subsets.152 Moreover, a small subpopulation of all CD5+ B-cells (between 0.5 and 2% of
all CD5+ PB B cells), appears to be class-switched to IgG or IgA.309
In fact, not only unmutated CLL but also mutated CLL appears to be highly similar to
normal CD5+ B-lymphocytes.311-313 Thus, transcriptome analyses revealed that IGHV gene
unmutated CLL might derive from unmutated mature CD5+ B lymphocytes, while mutated CLL
would most likely derive from a distinct CD5+CD27+ post-GC B cell subset.309 Notably, these
CD5+ B cell populations appear to be enriched in stereotyped IGHV gene rearrangements, at
the same time they also include oligoclonal expansions already among young healthy adults.
Therefore, these CD5+ PB B-cells may potentially already represent an early phase in CLL
development, prior even to the CLL-like MBL precursor cell. Alternatively, it has also been
proposed that CLL cells could derive from splenic marginal zone B-cells, based on the
functional similarities between CLL and this subset of normal B-lymphocytes (Figure 3A).22 In
this regard, it should be noted that several studies which have focused on IGHV/IGLV gene
usage by CLL cells, including analysis of the IGHV mutational status and the IGHV repertoire,
gene expression profiling and cellular phenotypes (e.g. CD27, ZAP-70 or CD38 expression) have
found that CLL cells are more similar to memory than to naïve B-lymphocytes; consequently,
CLL cells appear to potentially have a past history that would include Ag
stimulation.227,228,237,292,314-316
Interestingly, the Ag reactivity profile of the BCR of CLL cells appears to overlap with
that of natural antibodies produced in the absence of exogenous Ag stimulation, and that play
a crucial role in immediate host defense against a wide range of pathogens.247,317 Further
studies have demonstrated that both self-reactive and polyreactive BCR profiles are inversely
related to the mutational load of the BCR.318 These apparently discrepant findings could be
related to the fact that BCR-dependent transductional signaling pathways are still efficient in
unmutated CLL, while deficient in mutated CLL cells.319 Since unmutated IGVH/IGVL genes
generally encode for antibodies with a natural/polyspecific profile, it has been proposed that
the neoplastic B-cells using these genes would be continuously stimulated in vivo by self-
antigens that have the capacity to react with their SmIg.320 Thus, neoplastic transformation
might potentially occur when these B cells are expanding in response to T-independent Ags,
and they may continue to do so, also after neoplastic transformation. This would explain, at
least in part, the expression of activation markers like ZAP-70 and/or CD38 on such stimulated
and transformed cells, which occurs less frequently among those cases where the neoplastic
cells used mutated IGHV genes.321 These latter cases typically express surface Ig which do not

49
Chapter 1 INTRODUCTION
show a natural/polyspecific reactivity profile.322 Although such IGHV mutated CLL cells may
have expanded in response to antigenic stimuli acting before (or during) transformation they
do not appear to be affected by antigenic stimulation thereafter, once the transformation
process had been completed.323
Based on all the above, it could be hypothesized that unmutated CLL would derive
from marginal zone B-cells, while mutated CLL cases would have their origin on memory B-cells
that have exited the GCs at the end of their selection process.8 However, several features of
these two groups of CLL (unmutated and mutated CLL) do not seem to confirm such
hypothesis. Firstly, most memory B-cells that transit through the GC and undergo isotype
switch, express surface IgG or IgA, rather than IgM;324 secondly, CLL cells from both unmutated
and mutated cases present rather similar gene expression profiles as assessed by high-density
microarrays.315,325,326 An alternative possibility would be that both subsets of CLL originate from
the same type of cell (e.g. from marginal zone B-cells), IGHV mutations potentially occurring in
mutated CLL cases, while the cells respond to a particular TI Ag, either prior to or during
neoplastic transformation in the marginal zone (Figure 3A).327 As a result of these mutations,
the polyspecificity of the antibody itself is lost and the cells are no longer susceptible to in vivo
stimulation by self-antigens. Hence, without this important promoting factor in
leukemogenesis, B-cells which had undergone SHM would expand less rapidly and would
exhibit a more benign clinical course than the unmutated CLL cases. In line with this latter
hypothesis, site-directed mutagenesis tests on the IGHV/IGLV genes have demonstrated that
elimination of the mutated spots and reversion to the unmutated IGVH/IGVL gene
configuration, results in the synthesis of antibodies with natural/polyspecific activity;318 these
observations reinforce the concept that the same cells that initially had natural/polyspecific
activity had given origin to both the mutated and the unmutated CLL cases.318 If this hypothesis
holds true, then, it would also contribute to explain their similar surface phenotype and GEP,
as well as the shared biological features of CLL cells from these two groups of CLL cases.

50
Chapter 1 INTRODUCTION
Figure 3. Schematic representation of "multistep" models for human CLL development. Panel A: Encounter of naive
B-cells with antigen may proceed either through a T cell–dependent reaction occurring in the germinal center (GC),
leading to the generation of memory B-cells that have undergone somatic hypermutation of the IGHV genes, or in T
cell–independent immune responses, it may lead to the formation of antigen-experienced B cells harboring
unmutated IGHV genes. CLL, and the preceding MBL phase, may originate from either of these subsets of antigen-
experienced B cells. Two distinct CD5+ B cell subsets (unmutated mature CD5
+ B cells and CD5
+CD27
+ post–GC B
cells) and marginal zone (MZ) B cells have been identified as the potential cell compartment in which CLL originates.
Panel B: alternatively, based on a xenogeneic transplantation model, it has been shown that genetic abnormalities
can accumulate on CLL hematopoietic stem cells (HSC) that might amplify B cell differentiation and produce a high
number of polyclonal B cells carrying the same genetic aberrations. B cell clones would be then selected and they
would expand in response to BCR signaling, presumably driven by autoantigens, simulating progression of MBL.
Additional abnormalities such as aberrant karyotypes might play a role in progression from MBL into CLL in humans
[Adapted from: Gaidano, G et al. 328
and Kikushige, Y et al.329
].

51
Chapter 1 INTRODUCTION
3.2.6.2. Stepwise model of development of MBL into CLL from early HSC
In order to trace the origin of CLL B cells, it should be noted that CLL cells from
individual patients are not always monoclonal, and that two or more coexisting CLL clones are
found in up to ≈5% of CLL patients.21 Furthermore, a recent cohort study has shown that 44/45
patients with CLL had a precursor MBL state which had been identified between 6 months and
7 years in advance.212 Of note, MBL is more frequently composed of two or more coexisting B
cell clones (20%–70% of total cases) than CLL, this being a particularly frequent finding among
MBLlow and in familial CLL cases.15,20,203 These findings strongly support a model for stepwise
development of CLL from an MBL oligoclonal precursor state, similarly to what has been
described for other human cancers. Thus, stepwise development of MBL into CLL could have
its onset in a mixture of polyclonal cells with one single dominant clone progressively taking
over, such expanded B-cell clone either obscuring or eliminating other MBL clones. Recent
evidences suggest that in such model, the first oncogenic event could be traced back at least
up to the progenitor or HSC that has not rearranged the IGHV genes (Figure 3B).329 In parallel,
signaling through receptors on the expanded cells, particularly BCR signaling, would play a
critical role in the pathogenesis of CLL, through its contribution to further oligoclonal and/or
monoclonal expansion of B cells from the initial pool of (precursor) polyclonal B-cells.
In line with this hypothesis, recent studies by Kikushige et al.329 in a xenogeneic mouse
model, reported that HSC from CLL patients have an increased susceptibility to generate
expansions of (oligo-mono)clonal B cells carrying V(D)J gene rearrangements which are always
unrelated to those of the original CLL cells. These findings, suggest that aberrant CLL-HSC have
already intrinsic abnormalities that cause their skewing towards the B-cell lineage, supporting
early involvement of HSC in the pathogenesis of the disease, as aberrant preleukemic cells that
produce an increased number of polyclonal (altered) pro-B cells (Figure 3B). The resulting
mature B cells could be then selected most likely via the recognition of autoantigen(s),
resulting in expanded mono- and/or oligoclonal B cell populations. Later on, along the B-cell
differentiation pathway, additional genomic abnormalities would develop, eventually resulting
in a typical clonal MBL and/or CLL disorder. Despite all the above, it should be noted that the
role of such genetic abnormalities of HSC may be very limited (or even nonexisting) in the early
phases of development of MBL, whenever the microenvironmental stimuli would play a more
prominent role. Subsequently, genetic abnormalities disrupting the control of cell growth and
survival may cooperate with microenvironment triggered events, mainly represented by
antigen-mediated BCR and coreceptor stimulation, to trigger and fuel clonal B-cell expansion.
In line with this, whole-genome sequencing (WGS) approaches have contributed to the

52
Chapter 1 INTRODUCTION
identification of multiple recurrent somatic mutations (e.g. NOTCH1, MYD88 and XPO1), which
appear to contribute to determine or modulate the clinical evolution of CLL.6 In this regard,
integrated mutational and cytogenetic analyses, have shown that clonal evolution from lower
to higher risk CLL is associated with the emergence of molecular alterations (e.g. mutations) of
the NOTCH1, SF3B1, and BIRC3 genes in addition to those of the TP53 and ATM genes;264
moreover, SF3B1 mutations primarily occur in CLL cases with del(11q)330 and NOTCH1
mutations are frequently associated with trisomy 12.331 In addition, other altered genes such
as BAFF, specific Lyn substrate 1 (HS1) and Toll IL-1R 8 (TIR8) appear to influence the natural
history of the disease.332 Most interestingly, previous studies indicate that virtually all
recurrent mutations described so far in CLL appear to emerge and act only at relatively late
stages of MBL and/or CLL; some of them may even underlie CLL transformation to Richter
syndrome.333 Therefore, such molecular/genetic alterations appear to contribute more to
elucidate the genetic basis of CLL progression, rather than of MBL evolution, the potential
initiating genetic alterations still remaining to be identified. The only exception relies on a
recent report which is based on a model where deletion of the entire minimal deleted region
at 13q14 chromosome, encoding for the DLEU2/miR-15a/16-1 gene cluster, which suggests
that del(13q) could lead to the development of low penetrance indolent B-cell clonal
lymphoproliferative disorders that appear to recapitulate the whole spectrum of human CLL-
associated phenotypes from MBL to Richter syndrome.334 This approach underlines the critical
importance of the deleted region, which appears to harbor gene(s) involved also in the first
steps of leukemogenesis in CLL, but it would not explain the origin of cases which have
unaltered chromosome 13q14 sequences.
3.3. B-cell lymphoproliferative disorders (B-CLPD) other than chronic lymphocytic
leukemia (CLL)
Classification of B-CLPD other than CLL relies to a significant extent on the relationship
between the expanded B-cells and the GC reaction within secondary lymphoid organs. Thus, B-
CLPD other than CLL are currently classified as pre-GC, GC and post-GC neoplasms since these
WHO 2008 categories of ‘‘mature’’ B-cell tumors are considered to arise from B cells, that have
already undergone V(D)J recombination at the IGH and IGL loci and that are independent of
early hematopoiesis and HSC.181 However, it should be noted that most evidences supporting a
model of cell-of-origin that links these mature B cell tumors to post-VDJ recombination stages
of the B-lymphoid ontogeny and the GC reaction, are indirect evidences, based on shared
phenotypes by normal and tumor B-cells such as the pattern of expression of cell surface

53
Chapter 1 INTRODUCTION
markers and the capacity for ongoing SHM of the tumor cells and their “normal” counterparts
(Figure 4).7
Figure 4. Cellular origin and immunophenotypic profile of human B-cell lymphoproliferative disorders (B-CLPD).
Human B-CLPD are assigned to their potential normal B-cell counterpart, despite they also display aberrant patterns
of protein expression which are presumably related to the cytogenetic abnormalities carried by the tumor cells
and/or the altered microenvironment. ABC DLBCL, activated B-cell diffuse large B-cell lymphoma; GC DLBCL,
germinal center derived DLBCL [adapted from Sagaert, et al.324
and Zenz, et al.335
].

54
Chapter 1 INTRODUCTION
3.3.1. Peripheral/mature B-cell chronic lymphoid leukemias other than CLL
Peripheral/mature B-cell chronic lymphoid leukemias other than CLL, traditionally
include two major WHO 2008 disease categories: B-cell prolymphocytic leukemia (B-PLL) and
hairy cell leukemia (HCL).
3.3.1.1. B-cell prolymphocytic leukemia
B-PLL is a rare and aggressive mature/peripheral lymphoid malignancy. For its
diagnosis, the presence of prolymphocytes which account for more than 55% of all PB
lymphoid cells on morphological grounds (usually > 90%), is required.181 Of note, mature B-cell
leukemias, such as CLL (particularly CLL/PLL), MCL or SMZL, and HCL variant (HCLv) share
similar features at presentation to those of PLL, and recent studies indicate that most PLL cases
could in fact represent a unique subgroup of MCL.336 Despite its similarity to both SMZL and
HCLv in terms of its clinical presentation, no cytoplasmic hairy projections or “villi ” are seen in
PLL, and the presence of B symptoms, a very high white blood cell (WBC) count (> 100 × 109/L),
and an aggressive clinical course, are much more characteristic of PLL than of SMZL or
HCLv.337,338 In comparison to CLL/SLL, PLL has been described as having strong Ig, CD20/FMC7
and CD79b expression, in association with CD23low/– and decreased staining for CD5 in a
fraction of the patients (Figure 4).
The most common cytogenetic abnormality seen in PLL is del(17p) involving loss of the
TP53 gene339 and t(11;14) associated with expression of cyclin D1 and/or SOX11, the latter
supporting the close relationship between PLL and MCL with a leukemic presentation.340,341
Regarding their molecular features, PLL leukemic cells express a skewed repertoire
characterized by predominant usage of distinct members of the IGHV3 gene family (73%),
preferentially of the IGHV3–23 gene (50% of the IGHV3 genes).342 The type and distribution of
IGHV mutations clearly indicates that in some cases the tumor cells have undergone through
an Ag selection process.
3.3.1.2. Hairy cell leukemia
HCL is a rare type of leukemia characterized by the presence of large mature-appearing
B cells, with an abundant cytoplasm and characteristic micro-filamentous (“hairy”) projections
– hairy cells (HC) –.343 HC typically infiltrate the BM, the spleen, and to a lesser extent also the
liver, LN and the skin.

55
Chapter 1 INTRODUCTION
Studies about the GEP of B cells from discrete subsets of normal B-cells vs. HCL cells
have shown that HC are related to memory B-cells, although with an altered pattern of
expression of genes controlling cell adhesion and expression of chemokine receptors.344
Moreover, several phenotypic features of HC can be explained in the context of a highly
activated B-cell that appears to have undergone the sequence of reactions that during normal
immune responses occur upon stimulation by Ag, accessory cells and cytokines. Therefore, HCL
is typically associated with an increased expression of activation-associated markers at
intermediate to bright intensity, such as CD25, CD11c, FMC7, and CD103.345 Other unique
immunophenotypic features of HC that contribute to the diagnosis of the disease include:
overexpression of CD20, CD22, CD19, CD72 and CD305 (LAIR1); intermediate intensity of
expression of CD79b, CD123, T-bet, anexin A1 and HC2; intermediate to bright positivity for
SmIg (generally SmIgM or SmIgD but also SmIgG or SmIgA), and; lack of expression of CD23
and CD24.346-350 In addition, CD5 and CD10 are expressed on HC from a minority of cases
(Figure 4).177,345 Although, AID is expressed in HCL, HC fail to express GC-associated markers
such as CD38, CD10 and Bcl6, at the same time they lack the CD27 memory B-cell marker in
the great majority of cases.351
For many years, no recurrent chromosomal translocations and molecular alterations
had been identified in HCL. More recently, the BRAF V600E mutation has been reported in the
classic forms of HCL only, as the first genetic alteration recurrently associated with this
disease.352 Some cytogenetic alterations involving monoallelic deletions of TP53 and BCL6 have
also been reported in a subset of cases.353
Due to the rarity of the disease, analysis of the IGHV gene has been only performed in
small series of cases.354 Despite this, results show that most HCL carry mutated IGHV genes
with low levels of intraclonal heterogeneity, unmutated IGHV genes occurring only in a minor
subset of patients who are refractory to (single-agent) cladribine and have a more aggressive
behavior.351,355 In turn, HCL is characterized by biased usage of the IGHV3-21, IGHV3-30 and
IGHV3-33 genes which are highly homologous gene segments; thus, the BCR of HCL patients
may share the ability to bind identical or highly similar Ags, and potentially react with common
bacterial superantigens, such as modified staphylococcus aureus protein A or the natural
staphylococcus aureus enterotoxin A.356 In line with this hypothesis, IGHV3-30 has been
reportedly involved in the immune response against Toxoplasma.356 Clearly, the pressure on
IGHV selection in HCL appears to be different from that potentially occurring in other B-cell
neoplasms, particularly in CLL. For example, IGHV4-34 is used predominantly in a mutated
conformation by CLL cells, while it is preferentially unmutated in HCL cases.357,358 Interestingly,

56
Chapter 1 INTRODUCTION
the apparent lack of HCDR3 stereotypy in HCL is another distinctive feature of HCL vs. CLL and
suggests that Ag driving in HCL may not rely on HCDR3-mediated interactions.
3.3.2. Peripheral/mature B-cell lymphomas other than SLL
3.3.2.1. Marginal zone lymphoma
MZL represents about 8-10% of all lymphomas and the third most frequent type of
lymphoma, just after diffuse large B-cell lymphoma (DLBCL) and FL. At present it is widely
accepted that MZL comprises distinct lymphoma types, which are considered to originate from
marginal zone B cells. Depending (mainly) on the organ in which the lymphoma arises, the
current WHO 2008 classification recognizes three distinct types of MZL: nodal (NMZL),
extranodal MZL of MALT type (or MALT lymphoma) and splenic marginal zone lymphoma
(SMZL), depending on whether the disease arises in the LN, mucosal sites and the spleen,
respectively.180 MZL shares some common immunophenotypic features, but the clinical course
and molecular characteristics are different for each of the distinct subtypes of the disease.
More recently, a fourth subtype of MZL named “primary BM MZL” (PBM-MZL) has also been
described as a provisional entity that still deserves full recognition prior to inclusion into the
new WHO classification.359
3.3.2.1.1. Extranodal marginal zone lymphoma of mucosa-associated lymphoid
tissue or MALT lymphoma
MALT lymphoma is the most common type of MZL. It is a clinically indolent disease
which preferentially arises in the stomach and small intestine, but that can occur in almost all
mucosal tissues and in the skin. MALT lymphoma is therefore thought to arise from peripheral
lymphoid tissues by long-standing (auto)antigenic stimulation, such as that observed during
chronic infection and inflammatory disorders.360,361 Several infectious agents and inflammatory
disorders have been associated with MALT lymphomas, among which the association between
gastric MALT lymphoma and Helicobacter pylori infection (up to 90% of cases) is the best
characterized.361
MALT lymphoma cells express CD19, CD20, CD22, CD25, CD79b and CXCR3, typically in
the absence of CD5, CD10 and CD45RO, and they show variable patterns of expression of CD23
and CD27 (Figure 4).362 From the genetic/molecular point of view, it presents with several
recurrent genomic lesions, including chromosomal translocations and unbalanced

57
Chapter 1 INTRODUCTION
alterations.10 Thus, MALT lymphomas frequently have translocations involving the API2,
MALT1, BCL10, and FOXP1 genes.363 T(11;18)(q21;q21) involving the API2 gene at chromosome
11q21 and the MALT1 gene at 18q21 chromosome, is the most common structural
chromosomal abnormality in MALT lymphoma and its presence is usually correlated with the
lack of any further genetic instability or chromosomal imbalances; in turn, t(3;14) and t(14;18)
fuse the BCL10 and MALT1 genes to the heavy chain of the Ig locus, respectively.364 Of note,
the above mentioned chromosomal translocations are mutually exclusive and they typically
show a different anatomic distribution.365
3.3.2.1.2. Splenic marginal zone lymphoma
SMZL is a relatively rare disease comprising 1-2% of all NHL and roughly 20% of MZL. It
is mostly, but not always, a clinically indolent lymphoma.180 The lymphoma originates in the
spleen, and spreads in most cases to the BM; in addition, it is also detectable in the PB in a
variable number of cases. SMZL is assumed to arise from the splenic marginal zone B-cells and
it has a concordant CD20high, CD19+, CD79bhigh, CD20/FMC7+, CD22+, CD43+/–, CD11c+,
SmIgMhigh, SmIgDlow, CD27+, CD5–/+, CD103–, HC2–, CD25–, CD10– and CD23– immunophenotype
(Figure 4).366
Skewed VH gene usage is pronounced in SMZL, with about 30% of cases using the
IGHV1-2 genes.244 Also highly homologous CDR3 regions are observed among the latter cases,
which may indicate Ag stimulation as part of SMZL lymphomagenesis.367,368 In geographic areas
where HCV and malaria infections are endemic, SMZL cases associated with these infections
are frequently observed.369
In the largest series of SMZL (n=330 cases) in which cytogenetic analyses have been
performed, it has been shown that 72% of cases exhibit chromosomal aberrations, of which
53% include complex genetic changes.370 However, none of these cytogenetic abnormalities is
considered to be characteristic of SMZL, with the exception of del(7q32) that occurs in 39% of
the cases.370 Other cytogenetic alterations involving chromosomes 8, 9p34, 12q23-24, 18q, and
17p have been reported.370 In contrast to what occurs in MALT lymphoma, chromosomal
translocations involving the Ig loci are rarely found in SMZL.
3.3.2.1.3. Nodal marginal zone lymphoma
NMZL, also called monocytoid B-cell lymphoma, is a primary nodal B-cell MZL in the
absence of evidence for splenic or extra-nodal involvement; it represents 1.5–1.8% of all

58
Chapter 1 INTRODUCTION
lymphoid neoplasms.181,371,372 Most NMZL cells express pan-B-cell markers including CD20,
CD79a and PAX5, together with CD43 in around half of the cases.373 NMZL cells typically lack
expression of CD5, CD23, CD10, Bcl6, anexin A1, and cyclin D1, whereas Bcl2 is positive in most
cases.181,367,373
As for other types of MZL, NMZL cases have been reported in association with
infections (e.g. HCV)374,375 and autoimmune disorders (e.g. rheumatoid arthritis, systemic
lupus erythematosus, Sjögren’s syndrome).376 However, this evidence remains far from
sufficient to establish a definitive role for these stimuli in lymphomagenesis. In turn, multiple
studies have shown that in the majority of NMZL patients, SHM of rearranged Ig genes and
preferential usage of IGHV3 and IGHV4 (particularly of IGHV4-34) occurs, further suggesting
that antigenic stimulation is involved in the ontogenesis of this type of MZL.377 Despite
preferential usage of IGHV4-34, no association with EBV and CMV has been established, as for
CLL.249 However, in NMZL patients with HCV, IGHV1-69 seems to be preferentially used.378,379
Finally, no unique and/or characteristic cytogenetic abnormality of NMZL has been
reported so far. The cytogenetic alterations reported in this subtype of MZL include trisomy 3
(present in about 20-25% of cases),380 7, 12, and trisomy 18, plus structural rearrangements of
chromosome 1 with breakpoints at the 1q21 or 1p34 chromosomal regions;381,382 in contrast,
SMZL-related 7q losses have not been reported among NMZL cases.383
3.3.2.1.4. Primary bone marrow marginal zone lymphoma
Among MBL cases with <5,000 B-cells/µl of PB and a CD5– non-CLL-like
immunophenotype in the absence of LN, spleen and extranodal involvement, a new B-CLPD
entity showing clonal B-cell lymphocytosis with marginal zone features, has been identified.359
These cases usually correspond to adults between the 4th and 8th decades of life with a similar
distribution per sex, and variable levels of PB infiltration by small B-lymphocytes with a
monocytoid-like morphology, mixed with villous lymphocytes and lymphocytes with
plasmacytoid features and a MZL phenotype; presence of serum paraproteinemia is observed
in one third of the cases359 and BM infiltration with a mixed nodular-interstitial pattern that
varies from 10% to 70% of the whole BM cellularity, is also usually present. From the
cytogenetic point of view, most cases show a normal karyotype (≈70% of cases) while others
have complex cytogenetic profiles, where chromosomes 3, 12, 17 and 7 are those
chromosomes more frequently involved, with e.g. del(7q) and iso17q in 13% and 17% of the
cases, respectively. Most PBM-MZL patients show mutated IGHV genes with a clear
predominance of the IGHV4-34 gene.

59
Chapter 1 INTRODUCTION
From the clinical point of view, most PBM-MZL display an indolent and stable (clinical)
course of the disease, although in some cases (particularly those with complex karyotypes)
progression to symptomatic MZL, usually to a splenic MZL, is observed.384
3.3.2.2. Follicular lymphoma
FL accounts for 20%–30% of all lymphoid tumors, with the highest incidence in the
Western countries.385 From a biological point of view, FL represents the neoplastic equivalent
of the reactive GC B-cell, presenting with varying and abnormal ratios of centroblasts and
centrocytes. Tumor cells may leave and (re)enter the GC; consequently, they may periodically
acquire novel SHM in their IGH and IGL genes. Indeed, either analysis of individual tumor cells
or molecular cloning of IGH gene rearrangements from a pool of tumor cells, have both
demonstrated that not all tumor cells share the same SHM within each individual lymphoma,
as a result of subclonal evolution associated with distinct patterns of ongoing SHM of the IG
loci.386,387
The t(14;18)(q32;q21) chromosomal translocation represents the cytogenetic hallmark
of FL and it is detected in 80%–90% of cases. Its molecular consequence is the juxtaposition of
the BCL2 protooncogene close to the enhancer sequences of the IGH promoter region;388,389
this leads to deregulated expression of Bcl2, resulting in overexpression of the Bcl2 protein in
the neoplastic follicles.390 Less frequently, variant translocations of t(14;18) also occur, such as
t(2;18) or t(18;22), in which the BCL2 gene is juxtaposed to the loci of the Ig light chains genes
(κ or λ, respectively). All these events lead to accumulation of inappropriately rescued GC B-
cells with a prolonged life span, allowing for the occurrence of additional genetic hits that are
required for the establishment of an overt FL. Consequently, a relatively high number of
secondary chromosomal alterations have been described in FL including structural and
numerical changes. Of note, it has long been recognized that these alterations occur in a non-
random fashion, and a temporal order in the emergence of these aberrations has been
described, some occurring early in the course of the disease, whereas others usually represent
late genetic events.391-394 In addition, some of the reported alterations are mutually exclusive,
while others frequently cluster together, potentially leading to coordinated deregulation of
specific genetic pathways.395 From the clinical point of view, such secondary genetic hits are
crucial to distinguish different subgroups of FL with distinct biological behavior, risk of
transformation to aggressive lymphoma, prognosis and overall survival (e.g. BCL2 plus CMYC
double hit transformed FL).396

60
Chapter 1 INTRODUCTION
Phenotypically, tumor cells from FL are most frequently characterized by
overexpression of Bcl2, strong reactivity for SmIgM, CD20/FMC7, CD22 and CD79b. As normal
GC B-cells, FL cells also express intermediate intensity CD10, Bcl6 and CD38 (Figure 4).397,398
Conversely, these cells usually lack CD5, CD11c, CD23, CD43, CD103, CD200, CD305 and HC2
expression. CD19 is frequently underexpressed, or even negative in some FL cases (Figure
4).397,398 Ki-67 is typically recommended for the assessment of the proliferation index of FL
which is highly variable.
3.3.2.3. Mantle cell lymphoma
MCL is a relatively rare subtype of B-cell lymphoma, comprising 5%–7% of all
lymphomas.399 Typically, MCL is a very aggressive disease with a poor outcome,400 that has
specific genetic lesions and a characteristic CD5+ immunophenotype. This phenotype differs
from that of typical CLL/SLL in that MCL cells express CD20, CD22, CD79b and SmIg at
moderate to bright intensity, and they are usually CD23 and CD200 negative while FMC7+
(Figure 4).397,401 Both CD38 and the proliferation marker Ki-67 show variable levels of
expression.402 Recently, an indolent variant of MCL termed asymptomatic B cell lymphocytosis
with cyclin D1 expression has been described with a unique CD38– CD200low vs. CD38low/+
CD200– immunophenotype.403
The genetic lesion typical of MCL is the t(11;14)(q13;q32) translocation which
juxtaposes the CCND-1 gene (also known as BCL-1 or PRAD-1 gene) encoded at chromosome
11q13 with an enhancer of the IGH gene at chromosome 14q32.404 As a consequence, this
translocation leads to an enhanced/continuous cell proliferation due to constitutive activation
of the CCND1 proto-oncogene and overexpression of cyclin D1 mRNA and protein.404 In rare
cases, MCL is cyclin D1–; when this happens, cyclin D2 or cyclin D3 can be overexpressed.405
The t(11;14)(q13;q32) translocation most likely occurs as an initial oncogenic event at
the pre–B-cell stage of differentiation in the BM, during recombination of the V(D)J segments
of the IGHV. However, the tumor is composed of a unique population of mature-appearing B
lymphocytes, indicating that the full neoplastic phenotype is acquired at later stages of the B-
cell differentiation process.406 Based on the pattern of expression of SmIgM/SmIgD and CD5 by
the tumor cells, their topographic distribution in the mantle zones, and the predominant usage
of unmutated IGHV genes, naive B-cells have been generally considered the normal
counterpart of MCL tumor cells.407 However, analysis of BCR diversity in MCL has shifted this
view to a more complex ontogenetic model, in which Ag selection would play also an
important role in the pathogenesis of the disease, at least in a subset of the cases. For

61
Chapter 1 INTRODUCTION
example, some studies have shown that 15%–40% of MCL carry IGHV hypermutation, with
around 10% of MCL showing stereotyped Ig heavy chain CDR3 sequences and a restricted VH
gene repertoire, associated with predominant usage of the IGHV3-21, IGHV4-34, and IGHV5-51
genes.408 Of note, the two former VH genes have a strong association with autoimmunity and
the VH3-21 gene seems to be also overrepresented in CLL with mutated IGHV genes, and
associated with a significantly poorer overall survival than that found for CLL cases with other
mutated IGHV genes.357,409 Moreover, IGHV3-21+ MCL patients appear to almost exclusively
show usage of the IGVλ3-19 gene.357 In contrast to CLL, the IGHV gene mutation status is not
prognostically informative among MCL patients.
3.3.2.4. Diffuse large B-cell lymphoma
DLBCL is the most common subtype of NHL, accounting for approximately one-third of
all adult lymphomas.410 It is characterized by a diffuse proliferation of large mature B-cells that
mainly occurs in LN, although involvement of extranodal sites is observed in up to 40% of the
cases.362 BM involvement is found in 11% to 27% of all cases, whereas PB is rarely (5%-10%)
infiltrated.180 DLBCL is a heterogeneous lymphoma which may arise either as primary (de
novo), or may result from a transformation of an indolent lymphoma.
The great morphological, clinical and biological heterogeneity of DLBCL confirms the
existence of several subtypes of the disease with different clinical outcomes. According to the
WHO 2008 classification, DLBCL may be subdivided into several morphological variants (Table
1).180,411,412 Similarly, GEP studies grouped DLBCL into three subtypes which are
morphologically indistinguishable; these three GEP subgroups of DLBCL are associated with
different pathogenetic mechanisms and they include activated B-cell DLBCL, germinal center
DLBCL and primary mediastinal DLBCL (Table 1).413 Consistent with this heterogeneity, the
genetic lesions associated with DLBCL are also diverse and include balanced reciprocal
translocations deregulating the expression of BCL6, BCL2 and MYC, gene amplifications,
nonrandom chromosomal deletions (e.g. 6q) and aberrant somatic hypermutation.414-418
Nonetheless, in a significant fraction of DLBCL, no specific genetic changes have been
identified which could potentially contribute to the pathogenesis of the disease.
The BCL6 gene is one of the most frequently affected genes in DLBCL. BCL6 promotes a
higher cell survival and genetic instability, which both contribute to malignant
transformation.419 In turn, t(14;18) results in overexpression of the Bcl2 protein in an identical
way as in FL, this cytogenetic alteration being found in 15% to 30% of all DLBCL cases and
virtually all GC-associated DLBCL patients.419,420 Genetic recombination of the MYC gene can be

62
Chapter 1 INTRODUCTION
found in 2% to 16% of DLBCL cases being specially frequent among extranodal DLBCL cases;
MYC gene rearrangements are associated with a great rate of central nervous system
involvement, lower complete remission rates and a poorer overall survival.421
There is no specific DLBCL immunophenotype. Large neoplastic B-cells have strikingly
higher forward light scatter (FSC) and sideward light scatter (SSC), once compared to normal B
lymphocytes, and they express variable patterns of pan-B-cell markers (CD19, CD20, CD22 and
CD79b) (Figure 4); despite a mature B-cell phenotype, a subset of these lymphomas does not
demonstrate SmIg or CyIg expression.422 A proportion of cases express CD5 and/or CD10, the
former marker being associated with an unfavorable clinical course.423 Indeed, CD5+ DLBCL
may consist of a large cell lymphoma transformed from a lower-grade CD5+ B-cell neoplasm
such as CLL/SLL (Richter syndrome) or de novo CD5+ DLBCL, including extremely rare cases of
CD5+ intravascular large B-cell lymphoma (Table 1).424
3.3.2.5. Burkitt lymphoma
Three different clinical variants of BL have been described so far: EBV-associated
endemic and sporadic BL, and immunodeficiency (HIV)-associated BL.180,181 Although all three
variants share many morphologic and immunophenotypic features, they have distinct clinical
and geographical presentations.181 Regarding cytogenetics, there is considerable overlap
among the three subtypes of BL, but unique genetic features have also been described among
these variants, potentially reflecting distinct pathogenetic mechanisms.425
BL cells express SmIgM, Bcl6, CD19, CD20, CD22, and CD79a, and they are negative for
CD5, CD23, and TdT, in association with a characteristic CD38high, CD81high, CD10+ GC-
phenotypic profile (Figure 4). Since CD10 is positive in nearly all cases, the typical absence of
Bcl2 expression in association with very high levels of CD81 is helpful in ruling out “double-hit”
lymphomas with dual translocations affecting MYC and BCL2.426,427 Translocations involving the
CMYC oncogene are the molecular hallmark of BL, and they are seen in virtually all cases in
association with a high proliferation rate. In most cases, CMYC gene rearrangements involve
the IGHV gene on chromosome 14; less commonly, the light chain genes on chromosomes 2
and 22 are involved in the CMYC translocation.426,427 Sometimes, CMYC translocations may also
involve a non-IG partner gene.428,429

63
Chapter 1 INTRODUCTION
3.3.2.6. Lymphoplasmacytic lymphoma / Waldenström macroglobulinemia
LPL/WM is a B-cell lymphoproliferative disorder characterized by IgM paraproteinemia
and the accumulation of clonally related lymphocytes, lymphoplasmacytic cells and plasma
cells in the BM.362,430 Some patients suffer from hyperviscosity caused by exceeding levels of
the IgM paraprotein, which may be useful in differentiating LPL/WM from other neoplasms
with plasmacytoid differentiation.362,431
Morphologically, LPL/WM is characterized by proliferation of small B-cells,
plasmacytoid cells and also plasma cells. The plasma cell component expresses the same Ig
light chain as the lymphocytic component, it is positive for CD138 and shows low expression of
B cell–associated Ags such as CD20, Pax5 and SmIg.432 The lymphoma cells typically express
CD19, CD20, CD22 and CD79b, CD27 and Bcl2, while they usually lack CD5, CD10 and CD23,
which helps to discriminate LPL/WM from FL, CLL and MCL (Figure 4).432,433 However,
expression of these latter markers may be found in 10–20% of cases, often at weak and
variable levels.434 The distinction between LPL/WM and other CD5- small B-cell lymphomas is
more difficult, and it often requires detailed evaluation of a combination of
immunophenotypic, genetic, morphologic and clinical features.
At the molecular level, the neoplastic clone from most LPL/WM cases has undergone
IGHV somatic hypermutation, but not isotype class switching, retaining the capability for
plasma cell differentiation.431 The lack of a unique molecular/genetic hallmark of the disease
has complicated the distinction between LPL/WM and other B-cell lymphomas presenting a
monoclonal serum component.435 Recently, the MYD88 L265P mutation has been found in
>90% of cases of LPL/WM, pointing out the utility of this molecular marker to distinguish
LPL/WM from other entities,431 and the potential involvement of e.g. TLR-signaling in the
pathogenesis of this disease.
In the WHO 2008 classification it is stated that t(9;14) would be present in at least 50%
of cases. However, translocations involving the IGH genes are actually rare in LPL/WM.436 The
t(9;14)(p13;q32) translocation results in up-regulation of PAX5, implicating this gene as a
putative oncogene in the pathogenesis of a subset of LPL.437,438 Overexpression of PAX5 seems
to prevent expression of high levels of Ig that result in paraproteinemia, supporting the
absence of t(9;14)(p13;q32) in typical LPL/WM cases associated with a serum monoclonal
component.439 In turn, there are sporadic reports of WM tumors with IGH gene
rearrangement, t(11;18)(q21;q21) and chromosome 6q abnormalities, which may also occur in
other B-cell lymphomas types.439

64
Chapter 1 INTRODUCTION
On immunophenotypic grounds, both the lymphoid and the plasma cell compartments
of LPL/WM neoplastic cells, show an immunophenotype that largely overlaps with their
normal counterparts with expression of CD25 on the B lymphocyte compartment and positivity
for immature markers (e.g. CD20+ and SmIg+) on plasma cells, usually associated with
expression of SmIgK light chains (≈80% of cases).
3.3.3. Multiclonal lymphoproliferative disorders
Generally, neoplastic B-cells from B-CLPD are believed to result from the expansion of
a single B-cell clone within which all cells share an original transforming mutation, identical
V(D)J gene segments of the IGH gene, and a restricted expression of the rearranged Ig light
chain (e.g. kappa or lambda). Additional genetic alterations in association also with different
phenotypic features, may be gained during the evolution of the disease. However, presence of
two or more morphologically and/or phenotypically different populations of neoplastic
lymphocytes in the same patient, detected either simultaneously or at different time points
during follow-up, has been reported in the literature440-443 at an overall frequency of around
5% of all B-CLPD.21 Actually, once the prevalence of B-cell neoplasias in elderly patients is
considered, simultaneous emergence of two distinct clones turns out to be not that
uncommon. Usually the presence of such coexisting ≥ 2 B-cell populations is interpreted as a
result of either two completely different (apparently) unrelated B-cell populations –
multiclonality – or subclone formation within the original malignant tumor stem cell line –
intraclonal evolution/heterogeneity –.
3.3.3.1. Composite lymphomas
Composite lymphomas are defined by the coexistence of two or rarely, more than two
morphologically and/or immunophenotypically different types of lymphoid neoplasms in the
same patient, which arise synchronously or metachronously within the same anatomic site.444
Although these lymphomas can be clonally related or unrelated, and they may comprise many
different combinations of mature B-cell subtypes,445 they are broadly categorized as follows: 1)
cases where distinct types of NHL of the same lineage, mostly B-cell lymphomas, coexist; 2)
coexistence of a B-NHL and a Hodgkin lymphoma (HL);446 3) distinct types of NHL of different
lineages, e.g. B- and T-NHL,447 and; 4) colocalization of a T-NHL and a HL.448 Most cases in the
first category represent tumor progression and transformation from an indolent B-cell
lymphoma, with two or more abnormal B-cell populations usually showing distinct

65
Chapter 1 INTRODUCTION
morphological features, light scatter characteristics and/or DNA cell contents, but an identical
phenotype; for example, Richter transformation of CLL/SLL or transformation of a FL to
DLBCL.449 In contrast, in a few cases, simultaneous occurrence of two distinct small B-cell
lymphomas is demonstrated which may involve any specific B-NHL subtype, e.g. MCL and/or
SMZL. A recent report, about composite lymphoma cases included patients diagnosed with
MCL and FL, MCL with Hodgkin lymphoma (HL), and MCL with plasmacytoma or SLL, together
with a case of composite FL with SLL; of note, in none of these patients, the two neoplastic B-
cell compartments were found to be clonally related, based on molecular analysis of the Ig
gene rearrangement profile.450 Rare cases of composite lymphomas involving SMZL include
cases associated with HL,451 DLBCL,452 BL,453 or CLL,454 and also, cases of T-cell large granular
lymphocyte leukemia associated with SMZL.455,456
3.3.3.2. Intraclonal evolution versus multiclonality in B-cell chronic
lymphoproliferative disorders
Coexistence of two apparently distinct hematological malignancies always raises the
question about whether or not they share a common cell of origin. As mentioned above, the
detection of two different, apparently unrelated B-cell clones – already at diagnosis or during
follow up –, is usually interpreted as the emergence of two clonal populations arising from a
single primary tumor (intraclonal evolution),457,458 rather than coexistence of two distinct
lymphoid tumors (true multiclonality).459 Intraclonal evolution and conversion between two
histological subtypes of B-cell lymphoma is commonly interpreted as being associated with
differentiation of neoplastic B-cells towards more aggressive disease leading to a shortened
survival. Conversely, multiclonality appears to be rare. However, multiclonality might have
been underestimated, since the precise diagnosis of these cases usually requires a
multidisciplinary approach encompassing histopathology, cytomorphology,
immunophenotypic, cytogenetic and molecular analyses in each of the cell populations, and
such studies have frequently not been performed in a substantial fraction of the composite
lymphomas reported in literature, the potential clonal relationship between the two tumoral
components, being therefore disregarded.
3.3.3.3. Criteria for multiclonality
Documentation of multiclonality greatly depends on the type of diagnostic methods
used for the characterization of the co-existing tumor cell populations. Histopathological and

66
Chapter 1 INTRODUCTION
immunophenotypic studies, usually reveal this situation – e.g. coexistence of two or more
distinct and expanded abnormal lymphoid populations –, but neither of the two approaches
guarantees the nature of the clonal relationship that exists among the coexisting tumor cell
populations from most cases. Only the genetic rearrangements of the IGHV and/or the
cytogenetic abnormalities of the coexisting B-cell populations may provide definitive evidence
to distinguish between a potentially common vs. distinct origin of the involved tumor cell
populations.460 Hence, multiclonality can only be clearly demonstrated through the
combination of these techniques (i.e., histopathology and/or flow cytometry plus molecular
and cytogenetic characterization of each individual population) (Figure 5).
Regarding MFC immunophenotyping, usage of multicolor gating strategies, involving
the combined evaluation of the patterns of expression of both Ig heavy and light chains,
together with maturation-associated markers, is mandatory for precise identification and
definition of such coexisting cell populations and the identification of distinctive features that
might be used for their purification, for subsequent molecular/cytogenetic analyses. Physical
isolation of each individual pathological cell populations through high-throughput cell sorting
procedures or laser microdissection techniques, allows for a better characterization of the
coexisting B-CLPD (sub)clones by other methods, such as PCR analysis of IGH gene
rearrangements and/or the assessment of different genetic abnormalities by iFISH procedures.
Figure 5. Illustrating example of a gating strategy based on the definition of CD19+ cells (Panel A) for the
immunophenotypic identification and characterization of multiclonal B-CLPD using multiparameter flow cytometry.
Panels B to E show the gating strategy used for the identification of the two coexisting pathologic B-cell populations

67
Chapter 1 INTRODUCTION
(pink dots) and their phenotypic discrimination from the remaining normal B-cells (blue dots) coexisting in the same
peripheral blood sample. After cell sorting the purified B-cell populations can be evaluated by e.g. PCR analysis of
IGH gene rearrangements and iFISH (upper right panels) which demonstrated the presence of different IGHV gene
rearrangements in the two B-cell clones and trisomy 12 retricted to only one of them. SSC, sideward light scatter;
APC, allophycocyanin; Cy, cytoplasmic; FITC, fluorescein isothiocyanate; PE, phycoerythrin; PerCPCy5.5, peridinin
chlorophyll protein-cyanin 5.5.
3.3.3.4. Multiclonality in chronic lymphocytic leukemia
So far, multiclonal CLL has not been fully characterized since only rare cases of CLL with
>2 CLL-like or non-CLL-like clones have been reported in the literature.21,441,459,461,462 Reported
cases include multiclonal CLL associated with MCL,443 HCL,463 FL,464 and another CLL.462
Therefore, the occurrence of multiclonal CLL is currently viewed as unusual and raises
questions about whether these patients are particularly susceptible to develop B-CLPD in
general, particularly CLL, and their actual clinical significance. Despite all the above,
preliminary studies indicate that the frequency of multiclonality among CLL ranges between
5% and 10% of cases, and it may appear already at diagnosis (≈ 5% of cases) or during follow-
up, sometimes even more than ten years after the initial diagnosis.465 From the clinical point of
view, CLL patients who present ≥2 B-cell clones, particularly when the CLL clone coexists with a
non-CLL B-cell clone, seem to have a poorer outcome, as regards the requirement for early
treatment (treatment-free survival).21 In turn, no data about the impact of multiclonality on
the final outcome (overall survival) of CLL patients followed for long periods of time (≥ 5-10
years), is currently available.
4. HYPOTHESIS AND OBJECTIVES
B-CLPD are a heterogeneous group of diseases that usually show (mono)clonal
expansion of a single mature-appearing and aberrant population of B-lymphocytes, arrested at
a given stage of differentiation. Despite this, patients diagnosed with composite lymphomas
and other B-cell chronic lymphocytic leukemias – e.g. CLL – have been occasionally reported in
the literature for decades, particularly among immunocompromised subjects.21,441,461 Although
early reports considered this phenomenon to be a rare event, current data suggests that it
might have been underestimated due to the need for sophisticated multidisciplinary
approaches encompassing combined histopathology, cytomorphology, immunophenotypic
and cytogenetic techniques, and/or molecular analyses of purified cell populations. Actually, B-
CLPD consisting of two or more phenotypically distinct populations which are clonally

68
Chapter 1 INTRODUCTION
unrelated, but that coexist in the same patient (detected either simultaneously or at different
time points during follow-up), have been reported in the literature (e.g. multiclonal B-CLPD) at
an overall incidence of around 5% of all B-CLPD.21 Interestingly, presence of different unrelated
B-cell clones in individual subjects has been shown to be particularly higher (>20%) in
premalignant B-cell states such as MBL.20,22 In this regard, preliminary data based on a
relatively small series of subjects also demonstrated that the frequency of multiclonality could
be particularly high among CLL-like MBL cases from CLL relatives.20 Altogether, these findings
suggest that, similarly to what occurs in other types of cancer, the development of CLL and
potentially also of other B-CLPD, at the earliest steps, may involve a mixture of polyclonal cells,
with one to a few clones progressively taking over. However, the immunobiology of such
abnormally expanded B cell clones in multiclonal MBL and CLL, remains largely unknown.
In parallel to the above findings, it has been demonstrated that the SHM status of the
IGHV genes can divide CLL into two subgroups and that these subgroups experience markedly
distinct clinical outcomes; at the same time, the identification of these IGHV subgroups of CLL
also represented an important advance in the understanding of the disease and its
pathogenesis. Thus, at present it is well-established that CLL B cells, as well as tumor B-cells
from other B-CLPD, express a distinct restricted BCR repertoire, which suggests a selection
process driven by specific Ags. Moreover, recent identification of quasi-identical (stereotyped)
BCR expressed by different CLL patients, reinforces the notion that BCR reactivity may play an
important role in the B-cell transformation process leading to CLL, although the specific Ags
recognized by CLL antibodies still remain largely elusive.
Altogether, these observations indicate that CLL and potentially also other B-CLPD,
could represent antigen-driven expansions of specific subsets of normal B cells which have
undergone neoplastic transformation from a multiclonal phase to a monoclonal state, in
association with stepwise acquisition of genetic alterations and potentially also BCR-
independent growth stimulation, MBL representing an intermediate stage in this oncogenic
process. Despite this and the already recognized risk factors, it should be noted that at
present, very limited knowledge exists about the transformation events that select individual
normal B-cells to become first CLL-like MBL and then, CLL B cells.
Based on the above background, the general objective of this study aimed at gaining
insight into the early stages of development of B-CLPD through detailed analysis of the
immunophenotypic, genetic and molecular characteristics of clonal B-cells, paying special
attention to the role and features of the BCR in both CLL-like MBL and CLL, and their subsets of

69
Chapter 1 INTRODUCTION
monoclonal vs. multiclonal cases, as different stages of a putative model of disease
progression and malignant transformation.
In order to accomplish this goal, we addressed the following three specific objectives:
- To investigate whether specific IGHV repertoires are associated with unique cytogenetic
profiles, as the basis for stepwise transformation pathways from MBL to CLL;
- To analyze the molecular and cytogenetic features of the expanded B-cell clones from
multiclonal vs. monoclonal B-cell lymphoproliferative disorders (particularly CLL-like MBL
and CLL cells) in order to determine whether multiclonality is associated with molecular
features indicating a greater probability of interaction with shared/common immunological
determinants, and;
- To investigate the potential relationship between an altered/clonal hematopoiesis and
antigenic driving forces acting during the expansion of stereotyped vs non-stereotyped CLL
and CLL-like MBL clones.
In the following sections of this doctoral thesis, a detailed description of the patients
from whom samples were obtained and studied, the materials and methods used for such
studies, as well as the results obtained are presented and discussed separately for each of the
proposed three specific objectives.


*both authors contributed equally to this work and they should both be considered as first authors.
Ana Henriques*, Arancha Rodríguez-Caballero*, Wendy G. Nieto, Anton W. Langerak, Ignacio
Criado, Quentin Lécrevisse, Marcos González, Maria L. Pais, Artur Paiva, Julia Almeida, Alberto
Orfao.
PLoS One 2013; 8(7):e67751.
Chapter 2 | Combined patterns of IGHV repertoire and
cytogenetic/molecular alterations in monoclonal B lymphocytosis
versus chronic lymphocytic leukemia

73
Chapter 2 Combined patterns of IGHV repertoire and cytogenetic/molecular alterations in MBL vs. CLL
2.1. Abstract
CLL-like MBL with (MBLhigh) or without (MBLlow) absolute B-lymphocytosis precedes
most CLL cases, the specific determinants for malignant progression remaining unknown. For
this purpose, simultaneous iFISH and molecular analysis of well-established cytogenetic
alterations of chromosomes 11, 12, 13, 14 and 17 together with the pattern of rearrangement
of the IGHV genes were performed in CLL-like cells from MBL and CLL cases. Our results based
on 78 CLL-like MBL and 117 CLL clones from 166 subjects living in the same geographical area,
show the existence of three major groups of clones with distinct but partially overlapping
patterns of IGHV gene usage, IGHV mutational status and cytogenetic alterations. These
included a group enriched in MBLlow clones expressing specific IGHV genes (e.g. VH3-23) with
no or isolated good-prognosis cytogenetic alterations, a second group which mainly consisted
of clinical MBLhigh and advanced stage CLL with a skewed but different CLL-associated IGHV
gene repertoire (e.g. VH1-69), frequently associated with complex karyotypes and poor-
prognosis cytogenetic alterations, and a third group of clones with intermediate features, with
prevalence of mutated IGHV genes, and higher numbers of del(13q)+ clonal B-cells. These
findings suggest that the specific IGHV repertoire and IGHV mutational status of CLL-like B-cell
clones may modulate the type of cytogenetic alterations acquired, their rate of acquisition
and/or potentially also their clinical consequences. Further long-term follow-up studies
investigating the IGHV gene repertoire of MBLlow clones in distinct geographic areas and
microenvironments are required to confirm our findings and shed light on the potential role of
some antigen-binding BCR specificities contributing to clonal evolution.
2.2. Materials and Methods
2.2.1. Patients and samples
A total of 166 subjects presenting one or more CLL-like MBL and/or CLL clonal B-cell
populations were included in this study: 15 cases (9%) corresponded to healthy individuals
with MBLlow – <200 clonal B-cells/µL in peripheral blood (PB); 5 males and 10 females; mean
age of 68±13 years; range: 49-84 years, –33 (20%) were MBLhigh – ≥200 and <5,000 clonal CLL-
like B-cells/µL of PB – (20 males and 13 females; mean age of 72±12 years; range: 37-89 years),
–114 (69%) had newly-diagnosed untreated CLL (66 males and 48 females; mean age of 70±13
years; range: 35-89 years) and 4 (2%) had other B-cell lymphoproliferative disorders (B-CLPD)
with coexistence of one or two CLL-like MBL B-cell population(s) (Table 5). From the 33 MBLhigh

74
Chapter 2 Combined patterns of IGHV repertoire and cytogenetic/molecular alterations in MBL vs. CLL
cases, 20 (61%) showed clinical MBL (>2,000 clonal B-cells/µl of PB). Individuals corresponded
to consecutive MBL and CLL subjects from Salamanca (Spain) and Coimbra (Portugal) in the
western area of the Iberian Peninsula.
PB samples were obtained from each subject after written informed consent was
given, and the study was approved by the local ethics committees of the two participating
centres (University Hospital of Salamanca and Histocompatibility Centre of Coimbra). Diagnosis
of MBL and CLL was based on the WHO 2008 criteria.466 Clinical staging of CLL subjects
according to Binet classification466 was collected retrospectively; 46/77 (60%) CLL cases were
diagnosed as stage A and the remaining cases (31/77, 40%) as stage B/C. Overall, 37/166
subjects (22%) showed co-existence of two or three phenotypically different aberrant B-cell
populations (multiclonal cases; 25 males and 12 females with a mean age of 76±8 years; range:
57-89 years), while the remaining 129 individuals showed one single phenotypically aberrant
monoclonal B-cell population (monoclonal cases; 69 males and 60 females with a mean age of
68±12 years; range: 35-89 years). In 26/37 multiclonal cases, all different B-cell populations
showed a typical CLL-like phenotype, while in the remaining 11 cases only one B-cell
population displayed a typical CLL-like phenotype co-existing with population(s) phenotypically
compatible with other B-CLPD.192 For this study, analysis was focused only on those aberrant B-
cell populations displaying a typical CLL-like and CLL phenotype (n=195 B-cell clones). The
distribution of all CLL-like and CLL clonal populations analyzed in the distinct diagnostic
categories was as follows: 27 corresponded to CLL-like MBLlow, 51 to CLL-like MBLhigh and 117
to CLL (Table 5).
Table 5. Distribution of subjects included in the study and the corresponding CLL and CLL-like
MBL clones, according to diagnosis.
Diagnostic subgroups
No. of cases MBLlow
MBLhigh
CLL Other B-CLPD
Subjects Monoclonal 129 13 (87%) 25 (76%) 91 (80%) -
Multiclonal 37† 2 (13%)* 8 (23%)* 23 (20%)* 4 (100%)*
Total 166 15 33 114 4
B-cell clones
From monoclonal cases 129 13 (48%) 25 (49%) 91 (78%) -
From multiclonal cases 66 14 (52%) 26 (51%) 26 (22%) -
Total 195 27 51 117 - *For multiclonal CLL and CLL-like MBL cases as well as for other B-CLPD cases other than CLL, only CLL-like clones
were considered; the later B-CLPD cases included the following diagnoses: HCL, hairy cell leukemia; SMZL/MALT,
splenic marginal zone B-cell lymphoma/ extranodal marginal zone B-cell lymphoma of mucosa-associated lymphoid
tissue lymphoma. CLL, chronic lymphocytic leukemia; MBL, monoclonal B-cell lymphocytosis; B-CLPD, B-cell chronic
lymphoproliferative disorders. †The number of clones per multiclonal case was of two in all diagnostic subgroups,
except in three tri-clonal subjects corresponding to one CLL patient, one MBLhigh
case and one patient with a B-CLPD
other than CLL.

75
Chapter 2 Combined patterns of IGHV repertoire and cytogenetic/molecular alterations in MBL vs. CLL
2.2.2. Immunophenotypic analyses
Immunophenotypic studies to screen for the presence and full characterization of
clonal B-cell populations were performed on erythrocyte-lysed PB samples according to
procedures which have been previously described in detail.192,467,468 PB white blood cells (WBC)
were systematically stained with the following monoclonal antibody (mAb) combinations
following the EuroFlow recommendations:469,470 1) CD20-pacific blue (PacB)/ CD45-pacific
orange (PacO)/ CD8-fluorescein isothiocyanate (FITC)+ anti-SmIgλ-FITC / CD56-phycoerythrin
(PE) +anti-SmIgκ-PE/ CD4-peridinin chlorophyll protein-cyanin 5.5 (PerCPCy5.5)/ CD19-PE–
cyanin 7 (PE-Cy7)/ CD3-allophycocyanin (APC)/ CD38-AlexaFluor 700 (AF700); 2) CD20-PacB/
CD45-PacO/ Cybcl2-FITC/ CD23-PE/ CD19-PerCPCy5.5/ CD10/-PE-Cy7 CD5-APC/ CD38-AF700
and 3) CD20-PB/ anti-sIgλ-FITC/ anti-SmIgκ-PE/ CD19-PerCPCy5.5/ CD10-PE-Cy7/ CD5-APC. All
cases showed a clonal (imbalanced SmIgκ:SmIgλ ratio of >3:1 or <1:3) and/or an aberrant CD5+
B-cell population for the above mAb combinations, as reported elsewhere;15 in every case, the
phenotypic study was extended with the following additional 5- and 6-color stainings
(PacB/FITC/PE/PerCPCy5.5/PECy7/APC): 1) CD20/ CD22/ CCR6/ -/ CD19/ CD5; 2) CD20/ CD103/
CD25/ CD5/ CD19/ CD11c; 3) CD20/ CD43/ CD79b/ CD5/ CD19/ CD49d; 4) CD20/ SmIgM/
CD27/ -/ CD19/ CD5; 5) CD20/ FMC7/ CD24/ - / CD19/ CD5; and 6) CD20/ CD3/ Cyzap70/ -/
CD19/ CD5. For the staining of Cybcl2 and Cyzap70, the Fix & Perm reagent kit (Invitrogen,
Carlsbad, CA, USA) was used, following the recommendations of the manufacturer. All
reagents were purchased from Becton/Dickinson Biosciences (BDB; San Jose, CA, USA), except
for CD19-PECy7 (Beckman/Coulter, Miami, FL), CD20-PacB (e-Biosciences, San Diego, CA, USA),
CD38-AF700 (Exbio, Prague, Czech Republic), CD45-PacO (Invitrogen, Carlsbad, CA, USA),
CD79bPE, CD24PE and CD43FITC (Immunotech, Marseille, France), and bcl2-FITC, anti-IgM-
FITC, anti-SmIgλ-FITC and anti-SmIgκ-PE (DAKO, Glostrup, Denmark).
Data acquisition was performed on a FACSCanto II flow cytometer (BDB) using the
FACSDiva software (v6.1; BDB); in MBLlow cases, acquisition was done using a double-step
procedure: firstly, information on 1x10⁵ events corresponding to the whole sample cellularity
was stored; in the second step, information was stored on CD19+ and/or CD20+ gated events,
containing a minimum of 5x10⁶ leucocytes/tube.
Instrument setup and calibration were performed according to well-established
protocols, and a daily quality control program was followed, using the Cytometer Setup and
Tracking (CST)TM Beads and CST Module (BDB).
Data analysis was performed using the INFINICITYTM software program (Cytognos SL,
Salamanca, Spain). B lymphocytes were identified according to their SSC/CD19+ distribution

76
Chapter 2 Combined patterns of IGHV repertoire and cytogenetic/molecular alterations in MBL vs. CLL
and their numbers were calculated after excluding cell debris and platelets. The definition of a
CLL-like/CLL phenotype was based on the presence of a CD19+, CD5+, CD20low, CD23+, CD79blow,
FMC7-/low, Cybcl2high and SmIgκlow or SmIgλlow, in the absence of CD10 expression. The minimum
number of cellular events required to define the presence of a CLL-like/CLL B-cell cluster was
of 50 cells.
The frequency of distribution of sIgκ+ vs. sIgλ+ populations within the CLL-like/CLL B
cells were visually analyzed by superimposing the two fluorescence profiles in a double
exposed picture (κ/λ distribution). An imbalanced sIgκ/sIgλ ratio of >3:1 or <1:3 was
considered abnormal.
2.2.3. Fluorescence-activated cell sorting (FACS) purification of B-cell populations
(FACSorting)
For all individuals studied, each CLL-like CD5+ B-cell population identified was purified
in a FACSAria III flow cytometer (BDB). In those samples with more than one aberrant B-cell
population (n=37), discrimination among them was based on their distinct patterns of
expression for ≥1 of the B-cell markers analyzed, as described elsewhere.467 The clonal nature
of each FACS-purified B-cell population (purity: 98%±0.8%) was assessed by both cytogenetic
and molecular techniques, as described below.
2.2.4. Cytogenetic and molecular studies
The presence of the most common cytogenetic abnormalities associated with CLL was
investigated by multicolour iFISH on slides containing FACS-purified and fixed CLL-like and CLL
cells, as previously described.253 Analysis of trisomy 12, del(11q23), del(17p13.1), and
del(13q14), as well as structural abnormalities involving the IgH gene were systematically
investigated using the following DNA probes purchased from Vysis (Downers Grove, IL): CEP12
DNA probe conjugated with spectrum orange (SO), LSI ATM (11q22.3), LSI MLL (11q23.3) dual-
color probe, LSI p53 (17p13.1) conjugated with SO, LSI13/RB1 gene (13q14) conjugated with
SO, LSI D13S25 (13q14.3) conjugated with SO, and LSI IgH/bcl2 t(14;18)(q32;q21) dual color
probe, respectively. FISH studies were then performed on purified CLL-like/CLL B-cells fixed in
3/1 (vol/vol) methanol/acetic and hybridized. Briefly, pepsin-digested slides containing both
the cells´ DNA and the probes´ DNA were denatured at 75°C for 1 min and immediately
hybridized (overnight at 37°C), in a Hybrite thermocycler (Vysis). Then, slides were sequentially
washed (5 min at 46°C) in 50% formamide/2X saline sodium chloride citrate buffer (SSCb) and

77
Chapter 2 Combined patterns of IGHV repertoire and cytogenetic/molecular alterations in MBL vs. CLL
PBS with 1% Tween-20 (vol/vol), and counterstained with 35 µl of a mounting medium
containing 75 ng/ml of DAPI (Sigma, St Louis, MO); Vectashield (Vector Laboratories,
Burlingame, CA) was used as antifading agent.
Analysis of the patterns of rearrangement of the IGHV genes was performed for each
FACS-purified CLL and CLL-like B-cell population. Genomic DNA preparation, PCR amplification,
sequencing and analysis of V, (D), J genes were performed following well-established
protocols.471,472
High molecular weight DNA from sorted CLL-like/CLL B-cells was isolated by standard
proteinase K digestion, and isopropanol precipitation in the presence of glycogen to increase
the DNA yield; final washing of the DNA pellet was performed in ice cold 70% ethanol. For
amplification of complete IGH VDJ rearrangements, six different family-specific VH primers and
one JH consensus primer were used in one multiplex PCR reaction covering framework region
(FR) 1. The primers were produced in scale (0.02 µM) and they were purified by standard HPLC
(InvivoScribe Technologies, La Ciotat, France). The BIOMED-2 consortium has developed and
clinically validated these primers for immune receptor amplification and their sequences were
as follows: Primer name VH1/7-FR1 (5´ GGCCTCAGTGAAGGTCTCCTGCAAG-3´), Primer name
VH2-FR1 (5´ GTCTGGTCCTACGCTGGTGAAACCC-3´), Primer name VH3-FR1 (5´
CTGGGGGGTCCCTGAGACTCTCCTG-3´), Primer name VH4-FR1 (5´
CTTCGGAGACCCTGTCCCTCACCTG-3´), Primer name VH5-FR1 (5´
CGGGGAGTCTCTGAAGATCTCCTGT-3´), Primer name VH6-FR1 (5´
TCGCAGACCCTCTCACTCACCTGTG-3´) and Primer name JH consensus-FR1 (5´
CTTACCTGAGGAGACGGTGACC-3´). PCR amplifications were performed using 50 or 100 ng of
template genomic DNA, 10 pmol of each primer, and 0.2 µl of AmpliTaq Gold enzyme (Applied
Biosystems, Foster City, CA) per 35 µl reaction. The PCR amplification used was as follows:
denaturation at 95°C for 7 min; 40 cycles at (94°C for 30s, 59.8 °C for 45s, 72°C for 90s); and a
final extension at 72°C for 10 min. To obtain high-quality sequencing results, efficient post-PCR
amplicon purification using ExoSAP-IT reagent (USB products, Affymetrix, Santa Clara, CA) was
carried out. After ExoSAP-IT PCR clean up, the DNA was sequenced in an Applied Biosystems
3130xl Genetic Analyzer.
The IgBLAST algorithm (National Center for Biotechnology Information) was used to
localize those sequences which show a perfect match between forward (F) and reverse (R)
reads. For each B-cell clone, we generated a consensus IGHV-D-J sequence with the matched
F-R region and the correct base reads found before and after such region in the original
chromatograms. Alignment of rearranged IGHV-D-J sequences to germ line V, D and J
segments and determination of V-D and D-J junctions were performed using the IMGT

78
Chapter 2 Combined patterns of IGHV repertoire and cytogenetic/molecular alterations in MBL vs. CLL
database and tools (http://imgt.org). For MBLlow clones, whole genomic amplification (WGA)
was performed prior to analysis, using the RepligRUltraFast Mini kit (Qiagen, Valencia, CA) as
per the recommendations of the manufacturer. Those MBLlow cases showing more than one
productive rearrangement corresponding to different IGHV genes within each purified CLL-like
B-cell population were excluded from this study, because in such cases we could not establish
the precise association between each IGHV gene and the underlying cytogenetic alterations
detected. For each FACS-sorted B-cell population, only in-frame rearrangements were
evaluated. Sequences containing >2% deviation from the germline sequence were considered
as being somatically mutated.
Analysis of CLL-associated NOTCH1 mutations331 was performed via PCR of previously
amplified genomic DNA from each FACS-purified CLL-like B-cell population for a total of 70
clones (5 MBLlow, 14 MBLhigh and 51 CLL clones).
2.2.5. Statistical methods
Conventional descriptive and comparative statistics – the nonparametric Kruskal-Wallis
and Mann-Whitney U tests (for continuous variables), or the Pearson’s 2 and Fisher exact
tests (for categorical variables) – were performed using the SPSS software program (SPSS 15.0
Inc. Chicago, IL). P values <0.05 were considered to be associated with statistical significance.
For multivariate comparisons among MBLlow, MBLhigh and CLL clones, based on the
count of clonal B cells/µL and the percentage of aberrant/clonal cells carrying the different
cytogenetic profiles, principal component analysis (PCA) was applied, and graphically visualized
with the 3D Automated Population Separator (APS) view – Principal Component 1 (PC1) vs PC2
vs PC3 – of the InfinicytTM software (Cytognos SL, Salamanca, Spain). As previously described in
detail, in this APS view, each axis of a plot is represented by a different PC as a linear
combination of parameters with distinct statistical weights.473
For the assignment of MBLlow, MBLhigh and CLL clones to different groups, the size of
the clone and the percentage of altered cells for each cytogenetic abnormality were the
continuous variables included in the PCA-based assay performed with the Infinicyt softwareTM,
while IGHV gene usage, IGHV mutational status and clinical staging of CLL subjects according to
the Binet classification were treated as categorical variables, used only for labelling the
different clones within each group, after applying the PCA.

79
Chapter 2 Combined patterns of IGHV repertoire and cytogenetic/molecular alterations in MBL vs. CLL
2.3. Results
2.3.1. Overall size and BCR features of CLL-like MBL and CLL B-cell clones
The median relative percentage and absolute count of CLL-like and CLL B-cells
progressively increased from MBLlow (0.6% and 20 cells/μl), to MBLhigh (14% and 2,000 cells/μl)
and CLL clones (57% and 17,400 cells/μl) (P <0.0001) (Table 6).
Of note, around half of all MBLlow and MBLhigh cell populations (52% and 51%,
respectively) derived from multiclonal cases, whereas only 22% of CLL clones were identified in
multiclonal cases (P ≤0.03; Table 6). In addition, CLL clones less frequently showed mutated
IGHV genes (53%) compared to both MBLhigh (73%) and MBLlow (67%) clones (P ≤0.02) (Table 6).
Table 6. Peripheral blood B-cell counts and BCR features of clonal MBLlow, MBLhigh and CLL B
cells.
MBL
low
n= 27 MBL
high
n=51 CLL
n=117 P value
No. of PB clonal B cells
(x106/L)*
20 (0. 09-200) 2,000 (350-4,900) 17,400 (1,300†-369,000) P < 0.0001
a,b,c,d,e
% of PB clonal B cells
from WBC*
0.6% (0.001%-7.5%) 14% (0.7%-45%) 57% (17%-97%) P < 0.0001a,b,c,d,e
No. of B-cell clones
from multiclonal cases
14/27 (52%) 26/51 (51%) 26/117(22%) P ≤ 0.002a,b,d
;
P = 0.03e
No. of IGHV mutated
clones
18/27 (67%) 37/51 (73%) 60/113 (53%) P ≤ 0.02a,d
Results expressed as number of B-cell clones and percentage between brackets or as *median value (range).
Statistically significant differences (P< 0.05) found between aMBL
high vs CLL,
bMBL
low vs CLL,
cMBL
low vs MBL
high,
dMBL
low plus MBL
high vs CLL and
eMBL
low vs MBL
high plus CLL. BCR, B-cell receptor; CLL, chronic lymphocytic leukemia;
MBL, monoclonal B-cell lymphocytosis; SmIg, surface membrane immunoglobulin; IGHV, immunoglobulin heavy
chain variable region genes.†Includes 6/117 cases with <5,000 clonal CLL B-cells/µL of PB, diagnosed with small
lymphocytic lymphoma (SLL).
2.3.2. Cytogenetic features and NOTCH1 mutation in CLL-like MBL and CLL B-cell
clones
Overall, MBLlow B-cell clones showed a significantly lower frequency of genetic
alterations associated with CLL (33%) than MBLhigh (51%) and CLL (62%) B-cells (P ≤0.02) (Table
7). Furthermore, only a small proportion of MBLlow (7%) and MBLhigh clones (14%) showed
coexistence of ≥ 2 cytogenetic alterations, while this was found in 33% of all CLL clones (P
≤0.04).

80
Chapter 2 Combined patterns of IGHV repertoire and cytogenetic/molecular alterations in MBL vs. CLL
Table 7. Cytogenetic and molecular features of MBLlow, MBLhigh and CLL B-cell clones.
Cytogenetic/molecular alterations MBLlow
N= 27
MBLhigh
N=51
CLL
N=117
P value
No. of genetically altered CLL-like/ CLL
clones 9/27 (33%) 26/51 (51%) 72/117 (62%) P ≤ 0.02
b,e
No. of clones with ≥2 genetic
alterations 2/27 (7%) 7/51 (14%) 38/117 (33%)
† P≤ 0.04
a,b,d
Type of cytogenetic/molecular changes
No. of del(13q)+ clones (%)
% del(13q)+cells *
7/27 (26%)
73% (19%-96%)
16/51 (31%)
56% (15%-99%)
46/117 (39%)
87% (10%-99%)
NS
NS
No. of del(13q14.3)+ clones (%)
% del(13q14.3)+cells *
5/27 (19%)
70% (19%-96%)
16/51 (31%)
46% (15%-99%)
45/117 (39%)
75% (5%-99%)
NS
NS
No. of del(13q14)+ clones (%)
% del(13q14)+cells *
1/26 (4%)
86% (86%-86%)
3/51 (6%)
96% (15%-98%)
18/117 (15%)
79% (10%-99%)
P= 0.04d
NS
No. of trisomy 12
+ clones (%)
% trisomy 12+ cells *
2/27 (7%)
50% (41%-59%)
10/51 (20%)
87% (66%-95%)
20/117 (17%)
77% (33%-97%)
NS
P≤ 0.04b,e
No. of t(14q32)
+ clones (%)
% t(14q32)+ cells *
0/17 (0%)
-
2/51 (4%)
42% (31%-52%)
12/116 (10%)
82% (18%-98%)
NS
NS
No. of del(11q)
+ clones (%)
% del(11q)+cells *
0/23 (0%)
-
2/51 (4%)
57% (20%-93%)
9/116 (8%)
58% (21%-98%)
NS
NS
No. of del(11q22.3)+ clones (%)
% del(11q22.3)+cells *
0/23 (0%)
-
2/51 (4%)
57% (20%-93%)
7/116 (6%)
71% (24%-98%)
NS
NS
No. of del(11q23)+ clones (%)
% del(11q23)+cells *
0/15 (0%)
-
0/51 (0%)
-
4/116 (3%)
32% (21%-64%)
NS
-
No. of del(17p13.1)+ clones (%)
% del(17p13.1)+cells *
0/24 (0%)
-
0/51 (0%)
-
5/117 (4%)
44% (33%-88%)
NS
-
No. of NOTCH1 mutated clones (%) 0/5 (0%) 0/14 (0%) 5/52 (10%) NS
Results expressed as number of B-cell clones with cytogenetic abnormalities from all clones in the corresponding
group (percentage) or as *median values of altered cells/clone (range). In 9 clones (1 MBLlow
,1 MBLhigh
and 7 CLL)
biallelic del(13q14.3) was detected and hyperdiploidy was found in one MBLlow
clone. aMBL
high vs CLL,
bMBL
low vs CLL,
dMBL
low plus MBL
high vs CLL and
eMBL
low vs MBL
high plus CLL. NS, no statistically significant differences observed (P ≥
0.05); CLL, chronic lymphocytic leukemia; MBL, monoclonal B-cell lymphocytosis.†Includes the 5/66 cases with
NOTCH1 mutation associated to trisomy 12 in 3 cases, to biallelic del(13q14.3) in one and to both mono allelic
del(13q14.3) and del(17p) in the remaining cases.
Regarding each specific cytogenetic/molecular alteration, a tendency towards a
greater frequency of del(13q) and trisomy 12 was observed from MBLlow to MBLhigh and CLL
clones, although differences only reached statistical significance for the frequency of
del(13q14) involving the RB1 gene (P =0.04). In addition, presence of t(14q32) and

81
Chapter 2 Combined patterns of IGHV repertoire and cytogenetic/molecular alterations in MBL vs. CLL
del(11q22.3) were exclusively found among MBLhigh and CLL, while del(17p), del(11q23) and
NOTCH1 mutations were only present in CLL clones (Table 7). Of note, among the
cytogenetically altered clones, no significant differences were observed in the percentage of
altered cells, except for a greater proportion of B-cells with trisomy 12 among both MBLhigh and
CLL vs MBLlow B-cell clones (P ≤0.04) (Table 7).
NOTCH1 mutations occurred in 5/52 CLL cases (10%), in which a preferential
association with IGHV unmutated clones (80%, P =0.02) and a high frequency of cases (3/5,
60%) harbouring trisomy 12 as an additional isolated chromosomal abnormality (P =0.007) was
observed; in the remaining two CLL cases, the presence of NOTCH1 mutation was associated
with del(13q14) involving the RB1 gene and to both del(13q14.3) and del(17p), respectively.
None of the 19 MBL cases investigated showed NOTCH1 mutations (Table 7).
2.3.3. Molecular characteristics of CLL-like MBL and CLL B-cell clones
Analysis of the IGHV gene revealed single in frame gene rearrangements for each
clonal B-cell population analyzed. Interestingly, shorter CDR3 sequences of the IGHV gene
were found among MBLlow versus CLL clones. So, the frequency of CLL clones with CDR3
sequences coding for >20 aa became significantly higher than that observed among MBLlow and
MBLhigh clones (P =0.02) (Table 8).
Regarding IGHV, DH and JH gene usage, no significant differences were found between
the three groups of CLL-like B-cell clones, except for the VH3 and DH3 IGHV genes (Table 8):
CLL showed lower frequency of VH3 usage and a greater proportion of DH3+clones vs MBLlow
and MBLhigh (P ≤0.04) (Table 8).

82
Chapter 2 Combined patterns of IGHV repertoire and cytogenetic/molecular alterations in MBL vs. CLL
Table 8. Molecular characteristics of the BCR of CLL-like MBLlow, MBLhigh and CLL B-cell clones.
Results expressed as number of B-cell clones from all clones in the corresponding group (percentage) or or as
*median (range). Statistically significant differences were found between aMBL
high vs. CLL,
bMBL
low vs. CLL,
cMBL
low
vs. MBLhigh
, d
MBLlow
plus MBLhigh
vs. CLL and eMBL
low vs. MBL
high plus CLL; NS, no statistically significant differences
observed (P ≥0.05); BCR, B-cell receptor; CLL, chronic lymphocytic leukemia; MBL, monoclonal B-cell lymphocytosis;
aa, amino acids; HCDR3,heavy chain complementarity-determining region 3.
Of note, a significant percentage of all CLL (72%), MBLhigh (74%) and MBLlow (85%)
clones corresponded to only 12 IGHV genes, namely V3-23, V3-11, V5-51, V3-21, V1-2, V1-3,
V4-39, V3-7, V3-30, V4-34, V3-48 and V1-69 (Figure 6). Among these, preferential usage (P
<0.04) of the VH3-23 gene was observed in both MBLlow (7/27, 26%) and MBLhigh (10/51, 20%)
vs. CLL (5/113, 4%) clones (Figure 6).
MBL
low
N= 27 MBL
high
N=51 CLL
N=113 P value
HCDR3 length* 13 (6-22) 17 (8-26) 18 (8-32) P≤0.02b,d,e
HCDR3> 20 aa 3/27 (11%) 8/51 (16%) 38/113 (34%) P = 0.02a,b,d
VH subgroups VH1 4/27 (15%) 7/51 (15%) 28/113 (25%) NS
VH2 0/27 (0%) 1/51 (2%) 2/113 (2%) NS
VH3 18/27 (66%) 31/51 (60%) 47/113 (42%) P≤ 0.04a,b,d
VH4 4/27 (15%) 9/51 (17%) 32/113 (28%) NS
VH5 1/27 (4%) 3/51 (6%) 2/113 (2%) NS
VH6 0/27 (0%) 0/51 (0%) 1/113 (1%) NS
DH subgroups DH1,4,7 5/27 (18.5%) 7/50 (14%) 15/109 (14%) NS
DH2 5/27 (18.5%) 12/50 (24%) 19/109 (17%) NS
DH3 5/27 (18.5%) 16/50 (32%) 48/109 (44%) P≤ 0.03b,d,e
DH5 5/27 (18.5%) 8/50 (16%) 12/109 (11%) NS
DH6 7/27 (26%) 7/50 (14%) 15/109 (14%) NS
JH genes JH1,2,3,5 4/27 (15%) 14/50 (28%) 23/113 (20%) NS
JH4 13/27 (48%) 21/50 (42%) 45/113 (40%) NS
JH6 10/27 (37%) 15/50 (30%) 45/113 (40%) NS

83
Chapter 2 Combined patterns of IGHV repertoire and cytogenetic/molecular alterations in MBL vs. CLL
Figure 6. Frequency of CLL-associated cytogenetic alterations (A) and the cytogenetic profile (B) for those IGHV
genes most commonly detected in MBLlow
, MBLhigh
and CLL B-cell clones, as assessed by iFISH. The three diagnostic
categories studied are depicted by different colors (green, MBLlow
; red, MBLhigh
; blue, CLL B-cell clones) and the
absence vs. presence of one vs≥2 chromosomal alterations per clone, is indicated by empty circles, light colored and
dark colored circles, respectively. For each IGHV subgroup, the clones are represented in the Y-axis according to the
absolute number of clonal B cells per µL of PB (A) and the percentage of cells genetically altered, by iFISH (B).
Different FISH patterns are defined by the following symbols in panel B: , del(13q14.3); , biallelic del(13q14.3); ,
del(13q14); , trisomy 12; Δ, del(11q);,del(17p) and; , t(14q32); dotted contour lines in panel A highlight those
clones phenotypically classified as SLL(small lymphocytic lymphoma); dotted blue lines in panel B indicate cells from
the same B-cell clone showing different cytogenetic abnormalities; U = unmutated clones; a = clones with NOTCH1
mutation.
2.3.4. Relationship between the most frequently used IGHV genes and the
cytogenetic profile of CLL-like MBL and CLL B-cell clones
As mentioned above, preferential usage of the VH3-23 gene was observed in both
MBLlow and MBLhigh vs. CLL clones (Figure 6A). VH3-23+ MBL clones typically showed no
cytogenetic alterations (8/17) or they carried an isolated cytogenetic alteration which
corresponded either to trisomy 12 (3/17) or deletion of 13q (3/17) (Figure 6B). Nevertheless,

84
Chapter 2 Combined patterns of IGHV repertoire and cytogenetic/molecular alterations in MBL vs. CLL
two MBLhigh clones showed co-existence of trisomy 12 and del(11q22.3) and one MBLlow clone
showed del(13q) including both the 13q14.3 and 13q14 (RB1) chromosomal regions (Figure
6B). From the five VH3-23+ CLL clones only one carried genetic alterations – trisomy 12 and
del(13q) –. Most interestingly, VH3-23+ MBLlow clones frequently showed unmutated IGHV
genes, including most unmutated MBLlow clones, with <10 CLL-like cells/µl (5/8; 63%), which
contrasts to the much lower frequency of unmutated VH3-23 CLL clones.
A similar frequency of usage of the VH3-11, VH5-51, VH3-21 and VH1-2 genes was
observed in both MBLlow and MBLhigh vs. CLL (Figure 6). In none of the clones expressing these
IGHV genes, cytogenetic alterations associated with a poor disease outcome – e.g. del(17p)
and/or del(11q) – were found; in addition, most MBL and CLL clones expressing these IGHV
genes showed no cytogenetic alteration, or they just had a single abnormality. Despite this,
NOTCH1 mutations were more frequently observed among cytogenetically altered, IGHV
unmutated CLL clones expressing these IGHV genes (one VH3-11+, one VH3-21+ and one VH1-
2+ clones). Noteworthy, 4/6 CLL cases classified as small lymphocytic lymphoma (SLL) variants
were also included among cases with a VH3-11 (n=2), VH3-21 (n=1) and VH1-2 (n=1) repertoire
in this group.
Finally, among those clonal B-cell populations which expressed the VH1-3, VH4-39,
VH3-7, VH3-30, VH4-34, VH3-48 and VH1-69 genes, CLL clones were overrepresented (61/113,
54%) vs. both MBLlow (10/27, 37%) and MBLhigh (18/51, 35%) clones. Notably, a high number of
CLL clones carrying these IGHV genes in association with one or more cytogenetic alterations,
including poor prognosis cytogenetic alterations, was found among these cases (44/61, 72%).
In this regard, del(13q) including both the 13q14.3 and 13q14 (RB1) chromosomal regions was
frequently detected (single or combined lesion) in these CLL and also MBLhigh clones,
particularly among those cases expressing the VH3-30 and VH4-34 gene genes; presence of
trisomy 12, del(11q) and t(14q32) were also common among these CLL cases (16%, 13% and
18%, respectively) while being infrequent in MBL cases (only 2 MBLhigh clones showed isolated
trisomy 12). Moreover, del(17p) alone and complex karyotypes with ≥3 cytogenetic/molecular
alterations were also found in 4 of the CLL clones which expressed the VH1-3, VH4-39, VH3-30,
VH3-48, VH4-34 and VH1-69 IGH genes, respectively (Figure 6B). Remarkably, ≥1 genetic
alteration was systematically detected in a major fraction of the VH1-69+ clonal cells (Figure
6A) while being absent in the few MBL clones which expressed this specific IGHV gene. Of
note, unmutated IGHV genes were a hallmark of both VH1-69+ (12/14 clones; 86%) and VH4-
39+ (9/10 clones; 90%), independently of their MBL vs CLL nature (Figure 6A).
Based on the observation of the above described associations, we performed a
multivariate analysis based on PCA, in searching for unique patterns of association between

85
Chapter 2 Combined patterns of IGHV repertoire and cytogenetic/molecular alterations in MBL vs. CLL
cytogenetic alterations and IGHV repertoires among MBL vs. CLL clones. Three major groups of
CLL-like MBL and CLL clones were identified, according to the absolute number of clonal B
cells/µL and the percentage of cells carrying cytogenetic alterations (Figure 7) and then
labelled according to their pattern of IGHV gene usage and the VH mutational status. Of note,
the most homogeneous group (Group 1) included virtually all MBLlow clones (77%) and half of
the MBLhigh clones (54%), but only around one fourth of Binet stage B/C CLL (28%); by contrast,
no MBLlow clones were included in Group 3 (Figure 7D). Group 2 showed a more
heterogeneous distribution with an intermediate pattern. In detail, Group 1 was mainly
characterized by cases with a normal karyotype (83%) and lower numbers of cytogenetically
altered cells mostly displaying the VH1-2, VH3-23 and VH4-34 IGHV genes (Supplemental Table
1); in turn, Group 2 typically showed a higher number of cases with mutated IGHV genes, and
higher numbers of del(13q)+ clonal B cells, while Group 3 included high numbers of cases with
unmutated IGHV genes, trisomy 12 and an IGHV repertoire enriched in unmutated VH1-69+ CLL
clones (Supplemental Table 1).
Figure 7. Principal component analysis (3-dimensionalX-Y-Z axis view of PC1 vs. PC2 vs. PC3, respectively) for
comparison of MBLlow
, MBLhigh
and CLL B-cell clones according to the absolute number of clonal B cells/µL and the
pattern of cytogenetic alterations (including the percentage of altered cells), using the InfinicytTM
software. Overall,
MBLlow
, MBLhigh
and CLL cases are clustered into groups distinguished by different colors in A: magenta, gray, and
black circles (A). The distribution of MBLlow
, MBLhigh
, CLL-stage A and CLL-stage B/C clones are coloured differently in

86
Chapter 2 Combined patterns of IGHV repertoire and cytogenetic/molecular alterations in MBL vs. CLL
B: MBLlow
, green; MBLhigh
, red, CLL stage A and B/C light blue and dark blue, respectively (B). The most informative
parameters contributing to the best discrimination between 1 x 1 comparisons of the three groups are displayed in
a decreasing order of percentage contribution to each of the principal component (C); Distribution of MBLlow
,
MBLhigh
and CLL clones among the three major groups defined in panel A by principal component analysis (D); CLL,
chronic lymphocytic leukemia; MBL, monoclonal B lymphocytosis; PC: principal component.
2.4. Discussion
It is now well established that emergence of CLL is typically preceded by MBL.212
However, only a fraction of all MBLhigh will evolve to CLL, at a rate of 1.1% persons/year,474
while the outcome of MBLlow remains unknown. Despite this, general consensus exists in that
stepwise acquisition of specific genetic alterations may determine the rate of progression, not
only from MBLhigh to CLL, but potentially also from MBLlow to MBLhigh and eventually to CLL.
Concurrence of chronic Ag stimulation through specific BCRs may further support and
accelerate the expansion of MBL clones, facilitate acquisition of new genetic alterations and
therefore contribute to progression to CLL.20,218 Although data has accumulated in the last
decade about the cytogenetic alterations and the IGHV gene repertoire of CLL-like clonal B-
cells in both MBL and CLL, to our knowledge, this is the first report about the combined
patterns of cytogenetic alterations and IGHV gene repertoire in MBLlow vs. MBLhigh vs. CLL
clones.
In recent years, more than a thousand different molecular/genetic alterations
reflected in multiple distinct and complex cytogenetic/molecular profiles in individual CLL
patients, have been described through high-throughput WGS approaches.475,476 However, only
a relatively small number of cytogenetic/molecular alterations recurrently occur at relatively
high frequencies (e.g. >5% cases).333,477 Such alterations include del(13q14), reported in around
half of all CLL cases, trisomy 12, present in about one third of the patients and del(11q),
del(17p), t(14q32) and NOTCH1 mutations, which occur in between 5-15% of all CLL
cases.253,333,477 In around half of CLL cases, unmutated IGH genes associated with preferential
usage of specific IGHV genes (i.e. VH1-69 and VH4-34) and the above described cytogenetic
alterations have also been reported in CLL. In turn, MBLhigh cases share molecular features with
good-prognosis CLL in terms of both the IGHV gene repertoire and chromosomal
alterations,206,478 with a greater frequency of IGHV mutated cases. By contrast, preliminary
data indicates that the IGHV repertoire expressed by MBLlow could be strikingly different from
that of both typical CLL and MBLhigh cases;479 in addition, such MBLlow clones appear to display a
much lower frequency of chromosomal alterations, restricted to del(13q14.3) and trisomy 12,
with a high prevalence of IGHV mutated cases (similar to that of MBLhigh cases),20 and no poor-
prognosis cytogenetic alterations.203,206

87
Chapter 2 Combined patterns of IGHV repertoire and cytogenetic/molecular alterations in MBL vs. CLL
In line with such observations, we also found a lower frequency of both cytogenetically
altered and IGHV unmutated CLL-like clones in MBLlow vs. both MBLhigh and CLL and vs. CLL
clones, respectively. Interestingly, the proportion of B-cell clones carrying ≥2 alterations
significantly increased from MBLhigh to CLL. On top of the progressively higher number of
cytogenetic/molecular alterations found in MBLlow vs. MBLhigh and CLL, the cytogenetic profile
of clonal B-cells also became significantly more heterogeneous among the latter two groups.
Accordingly, while del(13q14.3) and to a much lesser extent, del(13q14) involving the RB1
gene and trisomy 12, were already detected in a small fraction of MBLlow clones, del(11q) and
t(14q32) emerged at an MBLhigh stage, whereas del(17p), del(11q23) and NOTCH1 mutations
were only found in CLL. These latter three alterations typically involved CLL clones that already
had other cytogenetic alterations and therefore, had more complex cytogenetic/molecular
profiles. In line with these findings, the altered CLL-like MBL and CLL clones showed
progressively increasing percentages of cells carrying del(13q14.3), del(13q14), trisomy 12,
t(14q32),del(11q)and del(17p13.1),respectively. In accordance with previous observations,480
NOTCH1 mutations were exclusively detected in CLL (preferentially among unmutated CLL
clones) which also had other cytogenetic alterations – e.g., trisomy 12, del(13q14) and/or
del(17p).
The overall increased frequency of all cytogenetic alterations, together with the more
complex cytogenetic/molecular profiles, observed from MBLlow to MBLhigh and CLL would
support the notion that evolution from MBLlow to MBLhigh and CLL is paralleled by progressive
acquisition of recurrent cytogenetic alterations, each of which appears to emerge at specific
MBL and CLL stages, in line with previous data from our and other groups.15,481 Accordingly,
del(13q), and to a lesser extent trisomy 12, are relatively early cytogenetic events which may
frequently occur at an MBLlow stage, whereas del(17p), NOTCH1 mutations, and to a lesser
extent also del(11q) and t(14q32), would typically arise later, as secondary cytogenetic events
occurring at an MBLhigh or CLL stage. Acquisition of these and other genetic changes may
potentially be associated with an increased proliferation and/or survival of the altered CLL-like
cells. At the earliest stages of development of MBL, proliferation and/or survival signals could
be provided to the MBL clone by chronically sustained BCR stimulation. If this holds true, the
BCR features could also play a critical role in determining the probability of cytogenetic
progression. Unfortunately, our series of MBL – particularly of MBLlow – is quite short at this
time to further confirm this hypothesis, due to the difficulty in collecting cases with enough
number of CLL-like B-cells, to perform in parallel reliable iFISH and molecular analyses. In this
regard, the limited number of MBLlow cases included in our series may predominantly present
with the genetic/molecular patterns of a low risk MBL cohort, which may not be related to CLL

88
Chapter 2 Combined patterns of IGHV repertoire and cytogenetic/molecular alterations in MBL vs. CLL
progression. Despite this, in accordance with other recent reports,16,185,482 non-random usage
of IGHV genes with clearly different IGHV gene repertoires was found in our series in MBL vs.
CLL. As expected, the most frequently used IGHV genes in CLL were the VH4-34, VH3-30, VH1-
69, VH3-48, VH4-39, VH1-2 and VH3-7 genes, accounting for around half of the CLL clones.
Interestingly, also half of the CLL clones showed unmutated IGHV genes, strikingly high
frequencies of unmutated clones being detected among cells expressing VH1-69, VH4-39 and
VH1-2. By contrast, VH3-23+ B-cells predominated among the MBLlow and MBLhigh clones, most
VH3-23+ MBLlow cases showing very low counts of IGHV unmutated clonal B-cells. Of note, the
IGHV genes used by the MBLhigh clones were commonly observed in either CLL (e.g. VH4–34,
VH1-2, VH3–48 and VH4–39) or MBLlow (e.g. VH3-23 and VH4-34), but usually at lower
frequencies. The fact that these particular IGHV genes have been associated with previously
reported stereotypic B-cell receptors in CLL clones,13 together with our own results which show
that the CDR3 of the IGHV genes are highly homologous in around one fifth of the B-cell clones
from our short cohort (Supplemental Table 2), would reinforce the role of some antigen-
binding BCR specificities in clonal evolution.
Based on the overall patterns of cytogenetic alterations and IGHV gene usage together
with the BCR mutational status, it could be concluded that while some unmutated IGHV genes
appear to be associated with the acquisition of complex cytogenetic profiles, rapid expansion
of clonal CLL-like B-cells and progression to CLL (e.g. IGHV1-69), others would not (e.g. IGHV3-
23); the latter clones would show a more benign behaviour. This could potentially be due to a
lower binding affinity of the unmutated BCR for the antigen, the recognition of specific
subtypes of low concentrated antigens and/or unique immune response profiles. In line with
this hypothesis, IGHV genes over-represented among CLL clones (e.g.VH4-39 and VH1-69)
frequently corresponded to IGHV genes enriched in genes encoding for antibodies that
recognise a broad variety of relatively common and abundant (auto)antigens, including low-
affinity BCR, e.g. myoglobulin, thyroglobulin, actin, and ssDNA296,483 associated with T-
independent, type II autoimmune responses.235 In contrast, the unmutated IGHV3-23 BCR was
over-represented among our MBLlow cases, normal peripheral blood IGHV3-23+ IgM+ B-cells
being associated with recognition of superantigens.24,484,485 Thus, the association between
MBLlow and unmutated IGHV3-23 could be potentially due to a low affinity of this particular
BCR for low concentrated/prevalent (super)antigens, which would limit the development of
repetitive immune responses associated with the expansion of MBL clones and/or their
cytogenetic progression. A recent study203 also reported MBLlow cases to display an IGHV gene
repertoire different from that of CLL patients (e.g. absence of IGHV1-69+ MBLlow clones,
together with a low frequency of the IGHV4-34 gene and overrepresentation of the IGHV4-
89
Chapter 2 Combined patterns of IGHV repertoire and cytogenetic/molecular alterations in MBL vs. CLL
59/61 genes); however, no preferential usage of the IGHV3-23 gene was found among MBLlow
cells in this series. Further studies investigating the IGHV gene repertoire of MBLlow clones in
distinct geographic areas and microenvironments, may shed light on those factors accounting
for such apparent discrepancies, as an association between MBLlow and previous history of
infections has been recently reported in this setting.204
Taken together, these results would support the notion that antigen-driven BCR-
stimulation could be a triggering factor in driving CLL-like B-cells to expand, in line with recent
data showing a significant association between MBL in the general population and the
individual history of infectious diseases and vaccination,204 whilst depending on the nature of
the antigenic stimuli, distinct patterns of cytogenetic changes might then occur. Thus, the
specific combination of cytogenetic alterations acquired by the CLL-like B-cells may determine,
for distinct antigenic stimuli, and specific BCR repertoires, the outcome of the genetically-
targeted cell. Long-term longitudinal studies, ideally of the same cases at different time-points
and at different stages of the disease, would be crucial to definitively confirm these
hypotheses, although based on our preliminary follow-up date19 this may require decades due
to the stable nature of most MBLlow clones in the short-term.
In summary, MBL and CLL clones appear to display a distinct but partially overlapping
pattern of IGHV gene usage, IGHV mutational status and cytogenetic alterations, which may
translate into distinct groups of clones with different genetic/molecular features associated
with a distinct clinical behavior. Sequential studies in larger series of cases followed for long
periods of time are ongoing to investigate the risk of progression and outcome of MBL clones
with specific IGHV and iFISH cytogenetic profiles.


*both authors contributed equally to this work and they should both be considered as first authors.
Ana Henriques*, Arancha Rodríguez-Caballero*, Ignacio Criado, Anton W. Langerak, Wendy G.
Nieto, Quentin Lécrevisse, Marcos González, Emília Cortesão, Maria L. Pais, Artur Paiva, Julia
Almeida, Alberto Orfao.
Haematologica 2014; 99(5):897-907.
Chapter 3 | Molecular and cytogenetic
characterization of expanded B-cell clones from multiclonal versus
monoclonal B-cell chronic lymphoproliferative disorders


93
Chapter 3 Molecular and cytogenetic characterization of B-cell clones from multiclonal vs. monoclonal B-CLPD
3.1. Abstract
Chronic antigen-stimulation has been recurrently involved in the earlier stages of MBL,
CLL and other B-CLPD. Among these individuals, expansion of ≥2 B-cell clones has been
frequently reported; potentially, such coexisting clones have a greater probability of
interaction with common immunological determinants. Here, we comparatively analyzed the
BCR repertoire and the molecular profile, as well as the phenotypic, cytogenetic and
hematological features of 228 CLL-like and non-CLL-like clones between multiclonal (n=85
clones from 41 cases) vs. monoclonal (n=143 clones) MBL, CLL and other B-CLPD. The BCR of B-
cell clones from multiclonal cases showed a slightly higher degree of HCDR3 homology than B-
cell clones from monoclonal cases, in association with unique hematological (e.g. lower B-
lymphocyte counts) and cytogenetic (e.g. lower frequency of cytogenetically altered clones)
features usually related to earlier stages of the disease. Moreover, a subgroup of coexisting B-
cell clones from individual multiclonal cases which were found to be phylogenetically related,
showed unique molecular and cytogenetic features: they more frequently shared IGHV3 gene
usage, shorter HCDR3 sequences with a greater proportion of IGHV mutations and
del(13q14.3), than other unrelated B-cell clones. These results would support the antigen-
driven nature of such multiclonal B-cell expansions, with potential involvement of multiple
antigens/epitopes.
3.2. Materials and Methods
3.2.1. Patients and samples
A total of 184 subjects with one (n=143 monoclonal cases) or ≥2 (n=41 multiclonal
cases) CLL/non-CLL B-CLPD (n=140) and/or CLL-like/non-CLL-like MBL (n=88) B-cell clones – as
defined by the WHO criteria 2008486 – were included. Binet staging466 of CLL subjects was
retrospectively collected.
From the 41 multiclonal cases, 2 (5%) corresponded to healthy individuals with CLL-
like MBLlow, 8 (19.5%) were CLL-like MBLhigh cases, 23 (56%) had CLL and 8 (19.5%) had B-CLPD
other than CLL; 4 of these latter cases showed coexistence of either one or two CLL-like MBL B-
cell population(s). In 3/41 multiclonal cases, three coexisting B-cell populations were detected.
From the 143 monoclonal cases, 13 (9%) corresponded to healthy adults with CLL-like MBLlow,
26 (18%) were CLL-like MBLhigh, 89 (62%) had CLL, 2 (1%) were non-CLL-like MBLlow, 2 (1%) non-
CLL-like MBLhigh cases and 11 (8%) had other B-CLPD. MBL was defined by the presence of

94
Chapter 3 Molecular and cytogenetic characterization of B-cell clones from multiclonal vs. monoclonal B-CLPD
small clones of aberrant B-cells in the PB, with a clonal B-cell count below the threshold for
diagnosis of CLL (< 5.0 × 10⁹ cells/L).14 A MBL case was subclassified as MBLlow when the
absolute number of clonal B-lymphocytes was less than 200 cells/µL in PB and as MBLhigh when
this number ranged between ≥200 and <5,000 clonal CLL-like B-cells/µL of PB.468 The
age/gender distribution for each diagnostic group, is detailed in Table 9.
Peripheral blood samples were obtained from each subject after written informed
consent was given, and the study was approved by the local ethics committees of the
University Hospital of Salamanca and the Blood and Transplantation Center of
Coimbra/Portuguese Institute of Blood and Transplantation, in accordance with the Helsinki
Declaration of 1975, as revised in 2008.
Table 9. Age and gender features of subjects included in the study.
Diagnostic subgroups
CLL and CLL-like MBL Non-CLL B-CLPD and non-CLL MBL
Age/Gender Features
MBLlow
MBLhigh
CLL MBLlow
MBLhigh
Non-CLL
Cases Monoclonal (n=143) 13 (9%) 26 (18%) 89 (62%) 2 (1%) 2 (1%) 11 (8%)
Age (years)* 66±13 (49-84) 69±13 (37-89) 69±13 (35-89) 65 & 95 79 & 80 71±9 (53-84)
Male/Female 4/9 15/11 50/39 1/1 0/2 7/4
Multiclonal (n=41) 2 (5%) 8 (19.5%) 23 (56%) - (0%) - (0%) 8 (19.5%)
Age (years)* 77 & 83 76±6 (65-82) 75±9 (57-89) - - 74±9 (56-81)
Male/Female 1/1 5/3 16/7 - - 6/2
Age values expressed as *media ± one standard deviation (range) when n>2. MBL, monoclonal B-cell lymphocytosis;
CLL, chronic lymphocytic leukemia/small lymphocytic lymphoma; B-CLPD, B-cell chronic lymphoproliferative
disorders other than CLL or MBL.
3.2.2. Immunophenotypic analyses
Immunophenotypic studies to screen for the presence and full characterization of
clonal B-cell populations were performed by high-sensitive MFC on erythrocyte-lysed
peripheral blood samples, according to previously described procedures (see the Materials and
Methods section of Chapter 2 for detailed descriptions). In all cases studied, each SmIg light
chain restricted and phenotypically aberrant B-cell population identified was purified in a
FACSAria II flow cytometer (BDB). In those samples (n=41) containing ≥2 aberrant B-cell
populations, discrimination among them was based on their distinct patterns of expression for
≥1 of the B-cell markers analyzed, as described elsewhere.467 The clonal nature of each FACS-
purified B-cell population (purity: 98%±0.8%) was assessed by both cytogenetic and molecular
techniques.

95
Chapter 3 Molecular and cytogenetic characterization of B-cell clones from multiclonal vs. monoclonal B-CLPD
3.2.3. Cytogenetic and molecular studies
Cytogenetic analyses were performed by multicolor iFISH on slides containing FACS-
purified and fixed aberrant B-cells, as previously described in detail (see the Materials and
Methods section of Chapter 2 for detailed descriptions).253,468 In parallel, analysis of the
patterns of rearrangement of the IGHV and IGKV and IGʎV genes was performed for each
FACS-purified B-cell clone (see the Materials and Methods section of Chapter 2 for detailed
descriptions).468,471,472 Each deduced "IMGT/V-QUEST aa sequence" corresponding to individual
IGHV gene sequences from purified B-cell clones from both monoclonal and multiclonal cases
was aligned using the bioinformatic tools available at the web services of the European
Bioinformatics Institute (EMBL-EBI Cambridge, UK). More than 12,400 alignments of IGHV aa
sequences, with a coverage ranging from framework region (FR) 1 to the HCDR3 region (both
regions included) were obtained for all B-cell clones (a total of 8,891 alignments within the
monoclonal and 3,560 alignments within the multiclonal groups of cases). Then, the
percentage of alignment of IGHV aa sequences obtained after two-by-two comparisons
between the distinct B-cell clones, was calculated for every pair of B-cell clones. Finally, each
single paired-alignment obtained – 8,891 and 3,560 in monoclonal vs. multiclonal cases,
respectively – was included in a final database, to calculate the median and range of the total
IGHV aa alignment percentages and to calculate the statistical significance of their differences
observed between the two groups (P-values).
To investigate the level of phylogenetic relationship among IGHV aa sequences
corresponding to distinct clones from multiclonal cases, as well as monoclonal cases, a
sequence distance tree was built using the neighbor-joining method implemented in the freely
available Molecular Evolutionary Genetic Analysis (MEGA) software (version 5.2,
http://www.megasoftware.net). Examination of the different branches of the sequence
distance tree allowed the distinction of multiclonal cases whose clones had IGHV aa sequences
phylogenetically closer than others. Thus, sequences in the same major branch were
guaranteed to exhibit ≥50% aa identity (from FR1 to HCDR3, both regions included).239 As
might be expected, sequences in sub-branches emerging from the same major branch exhibit
even more aa identity, ranging from 60% to 99%. In our analysis, those co-existing B-cell clones
with IGHV aa sequences that belonged to the same major branch with >60% aa identity or
belonged to close located sub-branches were assumed to be “phylogenetically” related
sequences. This “identity” threshold was based on previously published concepts about the
phylogeny of human IGHV genes based on their aa sequences,239 and on the minimum identity

96
Chapter 3 Molecular and cytogenetic characterization of B-cell clones from multiclonal vs. monoclonal B-CLPD
percentage observed in colocalized sub-branches (presumably with the highest evolutionary
relationship239) of the sequence distance tree built in this study.
HCDR3-alignments were carried out for each multiclonal case whose co-existing B-cell
clones showed HCDR3 regions with identical or one aa differing lengths using the bioinformatic
tools available at the web services of the European Bioinformatics Institute (EMBL-EBI
Cambridge, UK). Through the EMBL-EBI tools, the identical aa or those with analogous side-
chain polarity per case-paired HCDR3 alignments were highlighted taking into account their
conserved composition in terms of "hydropathy", "volume" and "chemical characteristics" as
outlined in the IMGT classification of aa".
3.2.4. Statistical methods
Comparisons between groups were performed with either the nonparametric Kruskal-
Wallis and Mann-Whitney U tests (for continuous variables) or the Pearson’s2 and Fisher
exact tests (for categorical variables) using the SPSS software/version 20.0 (IBM SPSS Statistics,
IBM, Armonk, NY, USA). P values <0.05 were considered to be associated with statistical
significance.
3.3. Results
3.3.1. Distribution and immunophenotypic features of B-cell clones
A total of 228 B-cell clones were identified. These corresponded to 143 B-cell clones
(89 CLL, 11 non-CLL, 39 CLL-like MBL and 4 non-CLL-like MBL clones) from monoclonal cases
and 85 B-cell clones (26 CLL, 14 non-CLL, 40 CLL-like MBL and 5 non-CLL-like MBL clones) from
multiclonal cases (Table 10). The complete immunophenotypic and cytogenetic features of the
individual clones of multiclonal cases are summarized in Supplemental Table 3.
In 26/41 multiclonal cases, all coexisting B-cell clones showed a CLL-like phenotype,
while in 11 of the remaining 15 cases, at least one CLL-like B-cell population coexisting with
another non-CLL aberrant B-cell population was identified. In the remaining 4 cases, two
distinct non-CLL-like B-cell clones were found (Supplemental Table 3). The distribution of all
CLL/non-CLL and CLL-like MBL/non-CLL-like MBL clones analyzed (from all monoclonal and
multiclonal cases considered together) in the distinct diagnostic categories was as follows: 27
B-cell clones corresponded to CLL-like MBLlow, 52 to CLL-like MBLhigh, 115 to CLL, 5 to non-CLL-
like MBLlow, 4 to non-CLL-like MBLhigh and 25 to non-CLL B-CLPD (Table 10). The precise

97
Chapter 3 Molecular and cytogenetic characterization of B-cell clones from multiclonal vs. monoclonal B-CLPD
diagnoses of the B-cell clones from B-CLPD patients other than CLL are specified in the
footnote of Table 10.
Table 10. Distribution of subjects included in the study and their corresponding CLL and non-
CLL like B cell clones, according to diagnosis.
Diagnostic subgroups
CLL and CLL-like MBL Non-CLL B-CLPD and non-CLL MBL*
MBLlow MBLhigh CLL MBLlow MBLhigh Non-CLL
Cases Monoclonal (n=143)
13 (87%) 26 (76.5%) 89 (80%) 2 (100%) 2 (100%) 11 (58%)
Multiclonal (n=41) 2 (13%) 8 (23.5%) 23 (20%) - (0%) - (0%) 8 (42%)
Total (n=184) 15 34 112 2 2 19
B cell clones Monoclonal (n=143)
13 (48%) 26 (50%) 89 (77%) 2 (40%) 2 (50%) 11 (44%)
Multiclonal (n=85) 14 (52%) 26 (50%) 26 (23%) 3 (60%) 2 (50%) 14 (56%)
Total (n=228) 27 52 115 5 4 25
CLL, chronic lymphocytic leukemia/small lymphocytic lymphoma (n=115 clones); MBL, monoclonal B-cell
lymphocytosis (n=88 clones: 79 CLL-like MBL clones and 9 non-CLL-like MBL clones); B-CLPD, B-cell chronic
lymphoproliferative disorders other than CLL (n=25 clones). *Patients other than CLL included the following
diagnoses: HCL, hairy cell leukemia (n=1 clone); MZL, marginal zone lymphoma (n=17 clones); MALT, lymphoma of
mucosa-associated lymphoid tissue (n=7); MCL, mantle cell lymphoma (n=3 clones); FL, follicular lymphoma (n=4
clones); DLBCL, diffuse large B-cell lymphoma (n=1 clones); LPL, lymphoplasmacytic lymphoma (n=1 clone).
The precise diagnosis of multiclonal cases (CLL vs. non-CLL) were based on consistent clinic-biological features,
according to the WHO 2008 criteria 486
.
3.3.2. Overall size and BCR features of B-cell clones from multiclonal versus
monoclonal MBL, CLL and other B-CLPD cases
The relative and absolute median number of PB clonal B-cells was significantly lower
in multiclonal than in monoclonal cases (13% vs. 45% and 2,692 cells/µL vs. 9,115 cells/µL,
respectively; P =0.001). Of note, the absolute median number of CLL-like MBLhigh and CLL B-cell
clones were also significantly lower in multiclonal than in monoclonal cases (1,254 vs. 2,464
cells/µL and 9,113 vs. 18,600 cells/µL, respectively; P =0.004 and P =0.02) (Figure 8). In
contrast, the absolute median number of PB CLL-like MBLlow B-cell clones was significantly
higher in multiclonal than in monoclonal cases (79 vs. 1 cells/ µL, P =0.002). No significant
differences were found in the clone size between non-CLL like and non-CLL B-cell clones in
multiclonal vs. monoclonal cases (Figure 8). In addition, the frequency of CLL-like MBL B-cell
clones was significantly higher in multiclonal than in monoclonal cases (47% vs. 27%,
respectively; P =0.002), whereas the frequency of CLL B-cell clones was higher in monoclonal
vs. multiclonal subjects (62% vs. 31%, respectively; P =0.001). CLL B-cell clones from
multiclonal and monoclonal CLL patients showed a similar distribution in Binet stage A vs.

98
Chapter 3 Molecular and cytogenetic characterization of B-cell clones from multiclonal vs. monoclonal B-CLPD
Binet stages B/C (P >0.05). Of note, non-CLL B-cell clones were present at higher frequencies in
multiclonal vs. monoclonal cases (17% vs. 8%, respectively; P =0.04) (Table 11).
Figure 8. Absolute number of CLL-like MBLlow
, CLL-like MBLhigh
, CLL, non-CLL MBL and non-CLL B-cell clones per µL of
peripheral blood in multiclonal vs monoclonal cases distributed according to diagnosis. Boxes extend from the 25th
to the 75th
percentiles, the lines in the middle represent median values (50th
percentile). Vertical lines represent the
highest and lowest values that are not outliers or extreme values (being outliers and extreme values those values
that lie more than 1.5- and 3- fold the length of the box). The adjacent table compiles the median number and
range of each subgroup of CLL-like and non-CLL like clonal B-cells/µL of peripheral blood and the exact P-values
obtained after comparing multiclonal vs. monoclonal cases (Mann-Whitney U test) for the MBLlow
, MBLhigh
and CLL
subgroups. NS: no statistical significant differences were detected (P ≥0.05).
Regarding BCR features, a similar distribution of IGHV mutated and IGHV unmutated B-
cell clones was found in multiclonal vs monoclonal cases − 51/85 (60%) vs. 84/139 (60%) and
34/85 (40%) vs. 55/139 (40%), respectively; Table 11 −. Despite this, the percentage of
alignment of IGHV aa sequences among B-cell clones from multiclonal cases (n =3,560 two by
two comparisons of clonal IGHV aa sequence) was slightly higher than that obtained among B-
cell clones from monoclonal cases (n =8,891 comparisons): median of 52% vs. 50%,
respectively; (P =0.001; Table 11).

99
Chapter 3 Molecular and cytogenetic characterization of B-cell clones from multiclonal vs. monoclonal B-CLPD
Table 11. Peripheral blood B-cell counts and BCR features of multiclonal vs. monoclonal B-cell
clones from B-CLPD and MBL cases.
Multiclonal B-cells
n=85 clones
Monoclonal B-cells
n=143 clones
TOTAL
n=228 clones
N. of PB clonal B cells(x106/L)* 2,692 (0.6-156,168)
a 9,115 (0.1-369,288) 5,530 (0.1-369,288)
% of PB clonal B cells from WBC* 13% (0.1%-89%)a
45% (0.002%-97%) 35% (0.001%-97%)
CLL like MBLlow
B-cell clones 14/85 (16%) 13/143 (9%) 27/228 (12%)
CLL like MBLhigh
B-cell clones 26/85 (31%)a
26/143 (18%) 52/228 (38%)
CLL B-cell clones 26/85 (31%)a
89/143 (62%) 113/228 (50%)
CLL-stage A clones 12/20 (60%) 53/89 (60%) 65/109 (60%)
CLL-stage B/C clones 8/20 (40%) 36/89 (40%) 44/109 (40%)
Non-CLL like MBL B-cell clones 5/85 (6%) 4/143 (3%) 9/228 (4%)
Non-CLL B-cell clones 14/85 (17%)a
11/143 (8%) 25/228 (11%)
IGHV mutated CLL-like B-cell clones 40/66 (61%) 76/128 (59%) 116/194 (60%)
IGHV mutated non-CLL-like B-cell
clones
11/19 (58%) 8/15 (53%) 19/34 (56%)
% alignment of IGHV aa sequences
between coexisting B-cell clones* 51% (38%-79%) NA 51% (38%-79%)
% alignment of IGHV aa sequences
between each B-cell clone and the
other clones*
52% (31%-100%)a
50% (29%-100%) 51% (29%-100%)
Results expressed as number of B-cell clones and percentage between brackets or as *median value (range). PB,
peripheral blood; WBC, white blood cells; CLL, chronic lymphocytic leukemia/small lymphocytic lymphoma;
MBLlow
, low count monoclonal B-cell lymphocytosis; IGHV, immunoglobulin heavy chain variable region genes;
CLL, chronic lymphocytic leukemia/small lymphocytic lymphoma; MBLhigh
, clinical monoclonal B-cell
lymphocytosis; aa, amino acids. NA, not appropriate. aStatistically significant differences (P <0.05) found
between clones from multiclonal vs. monoclonal cases. Information about the parameters included in this table is
separately displayed for CLL-like vs. non-CLL-like clones in Supplemental Table 4.
3.3.3. Cytogenetic features of B-cell clones from multiclonal versus monoclonal MBL
and B-CLPD cases
The frequency of CLL-like MBL and CLL clones from multiclonal cases that showed
cytogenetic alterations was significantly lower than that found among CLL-like MBL and CLL
clones from monoclonal cases: 27/66 (41%) vs. 77/128 (60%), respectively (P =0.02). Likewise,
the proportion of CLL-like B-cell clones showing coexistence of ≥2 cytogenetic alterations was
also significantly lower in multiclonal than in monoclonal cases − 8/66 (12%) vs. 32/128 (25%);
P =0.047 −; this was specially true among B-cell clones from CLL patients − 2/26 (8%) vs. 29/89
(33%), respectively; P =0.03 – (Table 12).

100
Chapter 3 Molecular and cytogenetic characterization of B-cell clones from multiclonal vs. monoclonal B-CLPD
Regarding each specific cytogenetic alteration, only a decreased frequency of CLL-like
B-cell clones with del(13q14) involving the RB1 gene and a lower percentage of del(13q14)+
cells was found in multiclonal vs monoclonal cases − frequency of del(13q14)+ clones − of 5%
vs. 15% with a median of del(13q14)+ cells of 55% vs. 86%, respectively; P =0.01) (Table 12). Of
note, these differences were mostly due to the lower frequency of B-cell clones with
del(13q14) (4% vs 19%, P =0.01) found among CLL clones from multiclonal vs. monoclonal
cases (Table 12).

Table 12. Cytogenetic features of CLL-like MBLlow, MBLhigh and CLL B-cell clones from monoclonal versus multiclonal cases.
Cytogenetic alterations
MBLlow
clones MBLhigh
clones CLL clones TOTAL
Multiclonal n=14
Monoclonal n=13
Multiclonal n=26
Monoclonal n=26
Multiclonal n=26
Monoclonal n=89
Multiclonal n=66
Monoclonal n=128
No. of cytogenetically altered clones 2/14 (14%) 6/13 (46%) 13/26 (50%) 13/26 (50%) 12/26 (46%) 58/89 (65%) 27/66 (41%)b 77/128 (60%)
No. of clones with ≥2 alterations 1/14 (7%) 1/13 (8%) 5/26 (19%) 2/26 (8%) 2/26 (8%)a 29/89 (33%) 8/66 (12%)
b 32/128 (25%)
Type of cytogenetic changes
No. of del(13q)+ clones (%)
% del(13q)+ cells *
2/14 (14%) 46% (19%-73%)
5/13 (38%) 86% (22%-96%)
7/26 (27%) 74% (15%-98%)
8/26 (31%) 38% (21%-99%)
8/26 (31%) 93% (30%-96%)
36/89 (40%) 80% (47%-99%)
17/66 (26%) 84% (10%-98%)
49/128 (38%) 79% (18%-99%)
No. of del(13q14.3)+ clones (%)
% del(13q14.3)+ cells *
2/14 (7%) (19%-73%)
4/13 (31%) 78% (22%-96%)
7/26 (27%) 65% (15%-98%)
8/26 (31%) 38% (21%-99%)
8/26 (31%) 81% (30%-96%)
35/89 (39%) 73% (5%-99%)
17/66 (26%) 80% (15%-98%)
47/128 (37%) 71% (5%-99%)
No. of del(13q14)+ clones (%)
% del(13q14)+ cells *
0/14 (0%) -
1/12 (8%) 86% (-)
2/26 (8%) 57% (15%-98%)
1/26 (4%) 96% (-)
1/26 (4%)a
95% (-) 17/89 (19%)
79% (47%-99%) 3/66 (5%)
b
55% (10%-98%)b
19/127 (15%)
86% (47%-99%)
No. of trisomy 12+ clones (%)
% trisomy 12+ cells *
0/14 (0%) -
1/13 (8%) 59% (-)
6/26 (23%) 87% (19%-95%)
5/26 (19%) 84% (80%-93%)
2/26 (8%) 84% (75%-93%)
17/89 (19%) 76% (33%-97%)
8/66 (12%) 87% (41%-95%)
23/128 (18%) 80% (33%-97%)
No. of t(14q32)+ clones (%)
% t(14q32)+ cells *
0/12 (0%) -
0/10 (0%) -
2/26 (8%) 42% (31%-52%)
0/26 (0%) -
1/26 (4%) 98% (-)
10/89 (11%) 82% (18%-94%)
3/64 (5%) 72% (28%-98%)
10/125 (8%) 59% (18%-94%)
No. of del(11q)+ clones (%)
% del(11q)+ cells *
0/12 (0%) -
0/11 (0%) -
1/26 (4%) 93% (-)
1/26 (4%) 20% (-)
1/26 (4%) 91% (-)
7/89 (8%) 57% (21%-98%)
2/64 (3%) 92% (91%-93%)
8/126 (6%) 57% (20%-98%)
No. of del(11q22.3)+ clones (%)
% del(11q22.3)+ cells *
0/12 (0%) -
0/11 (0%) -
1/26 (4%) 93% (-)
1/26 (4%) 20% (-)
1/26 (4%) 91% (-)
6/89 (7%) 70% (24%-98%)
2/64 (3%) 92% (91%-93%)
7/126 (6%) 68% (20%-98%)
No. of del(11q23)+ clones (%)
% del(11q23)+ cells *
0/12 (0%) -
0/11 (0%) -
0/26 (0%) -
0/26 (0%) -
0/26 (0%) -
3/89 (3%) 32% (21%-64%)
0/64 (0%) -
3/126 (2%) 40% (24%-64%)
No. of del(17p13.1)+ clones (%)
% del(17p13.1)+ cells *
0/13 (0%) -
0/12 (0%) -
0/26 (0%) -
0/26 (0%) -
0/26 (0%) -
5/89 (6%) 44% (33%-88%)
0/65 (0%) -
5/127 (4%) 44% (33%-88%)
Results expressed as number of clones with cytogenetic changes from all clones in the corresponding group (percentage) or as *median values of altered cells/clone (range). In seven clones (1 multiclonal
MBLlow
, 3 monoclonal and 3 multiclonal CLL clones) biallelic del(13q14.3) was detected, and polysomy was found in 1 multiclonal CLL clone. Statistically significant differences found between multiclonal vs.
monoclonal B-cell clone groups for aCLL clones (P =0.01) and
ball
(total) clones (P =0.01). CLL, chronic lymphocytic leukemia/small lymphocytic lymphoma; MBL, monoclonal B-cell lymphocytosis.
10
1

102
Chapter 3 Molecular and cytogenetic characterization of B-cell clones from multiclonal vs. monoclonal B-CLPD
No statistically significant differences were observed in the cytogenetic patterns of
non- CLL B-cell clones from multiclonal vs monoclonal cases, which is probably due to the
relatively low number of non-CLL clones included in the study; the precise cytogenetic
alterations found in non-CLL/non-CLL-like MBL cases are shown in Supplemental Table 3 and
Table 4. In turn, the overall cytogenetic features of non-CLL like B-cell clones from multiclonal
(n=19; 3 non-CLL MBLlow, 2 non-CLL MBLhigh, 14 non-CLL B-cell clones) vs. monoclonal (n=15; 2
non-CLL MBLlow, 2 non-CLL MBLhigh, 11 non-CLL B-cell clones) subjects were similar, as regards
both the frequency of cytogenetically altered clones (6/19, 32% and 6/15, 40%) and the
percentage of cases with ≥2 genetic alterations − 2/19 (11%) vs. 2/15 (13%) – (Supplemental
Table 3 and Table 5).
3.3.4. Molecular characteristics of the BCR of B-cell clones from multiclonal versus
monoclonal MBL and B-CLPD cases
The molecular profile of the BCR of CLL-like MBLlow, MBLhigh and CLL B-cell clones and of
B-cell clones other than CLL from multiclonal vs. monoclonal cases was very similar (Table 13
and Table 14).
No statistically significant differences in multiclonal vs monoclonal VH gene usage were
found for most groups. Despite this general behavior, CLL-like MBLhigh B-cell clones from
multiclonal cases less frequently showed usage of the DH1, DH4 and DH7 gene families than B-
cell clones from monoclonal cases; in addition, JH6 genes were also less frequently used by CLL
B-cell clones from multiclonal vs. monoclonal cases (Table 13). Overall, 33 functional IGHV
gene rearrangements were identified from which 12 (V4-34, V3-23, V3-48, V3-30, V1-69, V3-
21, V4-39, V3-33, V3-11, V3-53, V1-2, V3-7) were highly represented among the B-cell clones
(≥5% of all B-cell clones corresponding to ≥4 and ≥5 B-cell clones sharing the same IGHV gene
in multiclonal and monoclonal cases, respectively) (Figure 9A). Interestingly, 11 of these IGHV
genes were found at similar frequencies within the clones of multiclonal vs. monoclonal cases,
while the V3-33 gene was typically associated with multiclonal cases (6% vs. 1%, P =0.03).
Regarding IGHD genes, no significant differences were observed between B-cell clones from
multiclonal and monoclonal cases, the D3-3, D5-12, D3-10, D6-19, D2-15, and D2-2 genes being
the most frequently used and shared by both groups of B-cell clones (Figure 9B). Among IGHJ
genes, significant differences were only observed for the JH6 gene, which was more frequently
used in monoclonal cases (40% vs. 26%, P = 0.03) (Figure 9C).

103
Chapter 3 Molecular and cytogenetic characterization of B-cell clones from multiclonal vs. monoclonal B-CLPD
Table 13. Molecular characteristics of the BCR of CLL-like MBLlow, MBLhigh and CLL B-cell clones
from monoclonal versus multiclonal cases.
MBLlow clones MBLhigh clones CLL clones TOTAL
Multiclonal
n= 14 Monoclonal
n= 13 Multiclonal
n= 26 Monoclonal
n= 25 Multiclonal
n= 26 Monoclonal
n= 87 Multiclonal
n= 66 Monoclonal
n= 126
HCDR3 length* (N. of aa)
15 (6-22) 13 (11-20) 16 (8-23) 17 (9-26) 17 (11-26) 18 (8-32) 17 (6-26) 17 (8-32)
VH families
VH1 2/14 (14%) 2/13 (15%) 3/26 (12%) 4/25 (16%) 4/26 (15%) 25/87 (29%) 9/66 (14%) 31/125 (25%) VH3 9/14 (65%) 9/13 (69%) 15/26 (58%) 16/25 (64%) 11/26 (42%) 36/87 (41%) 35/66 (53%) 61/125 (49%) VH4 2/14 (14%) 2/13 (15%) 6/26 (23%) 3/25 (12%) 9/26 (35%) 23/87 (27%) 17/66 (26%) 28/125 (22%) VH2, VH5, VH6 1/14 (7%) 0/13 (0%) 2/26 (8%) 2/25(8%) 2/26 (8%) 3/87 (3%) 5/66 (7%) 5/125 (4%)
DH families DH1, DH4, DH7 3/14 (21%) 2/13 (15%) 1/26 (4%)a 6/24 (25%) 6/26 (23%) 11/86 (13%) 10/66 (15%) 19/123 (16%) DH2 2/14 (14%) 3/13 (23%) 5/26 (19%) 7/24 (29%) 4/26 (15%) 15/86 (17%) 11/66 (17%) 25/123 (20%) DH3 3/14 (21%) 2/13 (15%) 9/26 (35%) 7/24 (29%) 13/26 (50%) 36/86 (42%) 25/66 (38%) 45/123 (37%) DH5 2/14 (14%) 3/13 (23%) 6/26 (23%) 2/24 (8%) 3/26 (12%) 9/86 (11%) 11/66 (17%) 14/123 (11%) DH6 4/14 (29%) 3/13 (23%) 5/26 (19%) 2/24 (8%) 0/26 (0%) 15/86 (17%) 9/66 (13%) 20/123 (16%)
JH genes JH1, JH2, JH3, JH5 3/14 (21%) 2/13 (15%) 7/26 (27%) 7/24 (29%) 9/26 (35%) 14/86 (16%) 19/66 (29%) 23/123 (19%) JH4 6/14 (43%) 7/13 (54%) 13/26 (50%) 8/24 (33%) 10/26 (38%) 34/86 (40%) 29/66 (44%) 49/123 (40%) JH6 5/14 (36%) 4/13 (31%) 6/26 (23%) 9/24 (38%) 7/26 (27%)a 38/86 (44%) 18/66 (27%)a 51/123 (41%)
LCDR3 length* (N. of aa)
9 (8-13) 10 (8-10) 10 (8-12)a 9 (7-12) 10 (8-15) 9 (5-12) 10 (8-15)a 9 (5-12)
VK families
VK1 0/6 (0%) 1/4 (25%) 6/14 (43%) 3/12 (25%) 6/12 (50%) 23/48 (48%) 12/32 (38%) 27/64 (42%) VK2, VK5, VK6 1/6 (17%) 0/4 (0%) 1/14 (7%) 3/12 (25%) 2/12 (17%) 8/48 (17%) 4/32 (13%) 11/64 (17%) VK3, VK4 5/6 (83%) 3/4 (75%) 7/14 (50%) 6/12 (50%) 4/12 (33%) 17/48 (35%) 16/32 (50%) 26/64 (41%)
JK genes JK1, JK3, JK5 3/6 1/4 5/14 7/12 5/12 21/47 13/32 29/63
(50%) (25%) (36%) (58%) (42%) (45%) (40%) (46%) JK2 2/6 2/4 8/14 3/12 4/12 10/47 14/32 15/63 (33%) (50%) (57%) (25%) (33%) (21%) (44%) (24%) JK4 1/6 1/4 1/14 2/12 3/12 16/47 5/32 19/63 (17%) (25%) (7%) (17%) (25%) (34%) (16%) (30%)
Vλ families Vλ3 2/3 (67%) NA 1/7 (14%) 0/7 (0%) 2/7 (29%) 8/25 (32%) 5/17 (29%) 8/32 (25%) Other 1/3 (33%) NA 6/7 (86%) 7/7 (100%) 5/7 (71%) 17/25 (68%) 12/17 (71%) 24/32 (75%)
Jλ genes Jλ1 1/3 (33%) NA 0/7 (0%) 0/7 (0%) 4/7 (57%) 6/21 (71%) 5/17 (29%) 6/28 (21%) Other 2/3 (67%) NA 7/7 (100%) 7/7 (100%) 3/7 (43%) 15/21 (29%) 12/17 (71%) 22/28 (79%)
IGHV mutational status
Mutated IGHV 9/14 (64%) 8/11 (73%) 17/26 (65%) 20/25 (80%) 14/26 (54%) 46/86 (54%) 40/66 (61%) 74/122 (61%) Unmutated IGHV 5/14 (36%) 3/11 (27%) 9/26 (35%) 5/25 (20%) 12/26 (46%) 40/86 (47%) 26/66 (39%) 48/122 (39%)
Results expressed as number of B-cell clones from all clones in the corresponding group (percentage) or as *median
(range). CLL, chronic lymphocytic leukemia/small lymphocytic lymphoma; MBL, monoclonal B-cell lymphocytosis;
BCR, B-cell receptor; HCDR3, heavy chain complementarity-determining region 3; LCDR3, light chain
complementarity-determining region 3; aa, amino acid. NA, not analyzed; a statistically significant differences found
between groups of clones from multiclonal vs monoclonal cases (P ≤0.03).

104
Chapter 3 Molecular and cytogenetic characterization of B-cell clones from multiclonal vs. monoclonal B-CLPD
Table 14. Molecular characteristics of the BCR of non-CLL B-cell clones from both MBL and B-
CLPD other than CLL.
Non-CLL B-cell clones
n=34 clones
Multiclonal Monoclonal
HCDR3 length* (N. of aa) 14 (8-26) 16 (7-22)
VH families VH1 4/19 (21%) 3/15 (20%)
VH3 12/19 (63%) 8/15 (53%)
VH4 3/19 (16%) 2/15 (13%)
VH5 0/19 (0%) 1/15 (7%)
VH6 0/19 (0%) 1/15 (7%)
DH families DH1, DH4, DH7 5/19 (26%) 2/14 (14%)
DH2 3/19 (16%) 4/14 (29%)
DH3 4/19 (21%) 2/14 (14%)
DH5 2/19 (11%) 5/14 (36%)
DH6 5/19 (26%) 1/14 (7%)
JH genes JH1, JH2, JH3, JH5 7/19 (37%) 3/15 (20%)
JH4 8/19 (42%) 7/15 (47%)
JH6 4/19 (21%) 5/15 (33%)
LCDR3 length* (N. of aa) 9 (9-11) 9 (8-12)
VK families VK1 4/11 (36%) 3/12 (25%)
VK2 2/11 (18%) 1/12 (8%)
VK3-4 5/11 (46%) 8/12 (67%)
JK genes JK1, JK3, JK5 5/11 (42%) 5/11 (45%)
JK2 2/11 (33%) 2/11 (21%)
JK4 4/11 (25%) 4/11 (34%)
Vλ families Vλ3 1/3 (33%) 1/1 (100%)
Other 2/3 (67%) 0/1 (0%)
Jλ genes Jλ2 2/3 (67%) 1/1 (100%)
Jλ3 1/3 (33%) 0/1 (0%)
Results expressed as number of B-cell clones from all clones in the corresponding group (percentage) or as *median
(range). Non-CLL, clones mimicking or compatible with B-cell chronic lymphoproliferative disorders other than
chronic lymphocytic leukemia; BCR, B-cell receptor; HCDR3, heavy chain complementarity-determining region 3;
LCDR3, light chain complementarity-determining region 3; aa, amino acid.
Except for slightly longer LCDR3 sequences of the IGKV and IGLV genes found among B-
cell clones from multiclonal versus monoclonal cases, specially among CLL-like MBLhigh clones
(Table 13), no other significant differences were found in the molecular characteristics of the
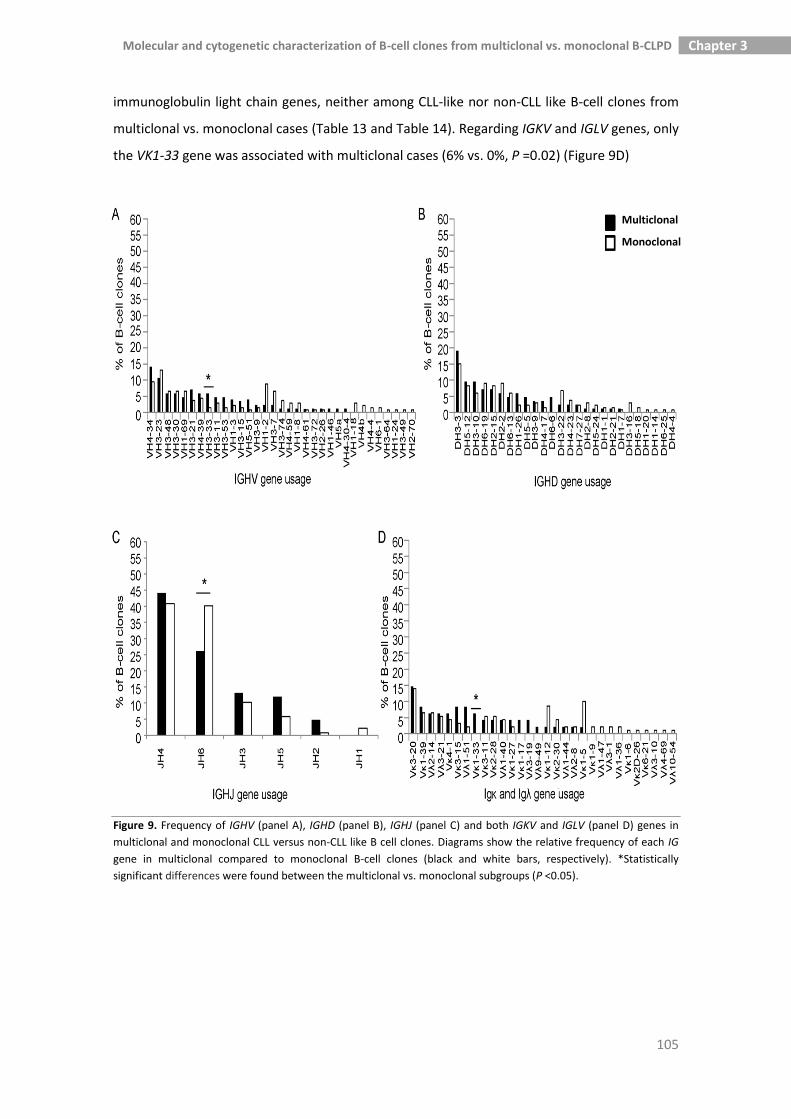
105
Chapter 3 Molecular and cytogenetic characterization of B-cell clones from multiclonal vs. monoclonal B-CLPD
immunoglobulin light chain genes, neither among CLL-like nor non-CLL like B-cell clones from
multiclonal vs. monoclonal cases (Table 13 and Table 14). Regarding IGKV and IGLV genes, only
the VK1-33 gene was associated with multiclonal cases (6% vs. 0%, P =0.02) (Figure 9D)
Figure 9. Frequency of IGHV (panel A), IGHD (panel B), IGHJ (panel C) and both IGKV and IGLV (panel D) genes in
multiclonal and monoclonal CLL versus non-CLL like B cell clones. Diagrams show the relative frequency of each IG
gene in multiclonal compared to monoclonal B-cell clones (black and white bars, respectively). *Statistically
significant differences were found between the multiclonal vs. monoclonal subgroups (P <0.05).
Multiclonal
Monoclonal

106
Chapter 3 Molecular and cytogenetic characterization of B-cell clones from multiclonal vs. monoclonal B-CLPD
3.3.5. Molecular features of phylogenetically related BCRs of B-cell clones from
multiclonal cases
Thirty-two of the 85 B-cell clones from individual multiclonal cases were
phylogenetically closely related and had exactly the same IGHV family (IGHV3 in 28 B-cell
clones and IGHV4 in 4 B-cell clones) (Figure 10). Of note, this subgroup of B-cell clones
frequently showed IGHV3 gene usage (28/85, 33%) and they displayed shorter HCDR3
sequences than other (multiclonal and monoclonal) B-cell clones − 13 (6-25) vs. 17(9-26) and
16 (8-32) aa; P =0.001 and P =0.004, respectively −; in addition, they also showed a higher
frequency of del(13q14.3) compared to B-cell clones from multiclonal cases expressing
phylogenetically unrelated IGHV families (41% vs. 17%, respectively; P =0.05). Moreover, a
slightly higher frequency of multiclonal cases whose coexisting clones were cytogenetically
altered was found among phylogenetically closely related clones vs phylogenetically unrelated
clones from multiclonal cases (53% vs. 34%, respectively; P =0.06). Interestingly, a trend
towards an increased percentage of IGHV mutated B-cell clones among phylogenetically
related B-cell clones from multiclonal cases compared to other B-cell clones from multiclonal
cases, was also found (70% vs. 54%, respectively; P =0.1). Interestingly, most of the co-existing
phylogenetically related clones had a CLL-like phenotype (10/16 cases, identified in
Supplemental Table 3 with the ¶ symbol), while in 4/16 multiclonal cases, one CLL-like B-cell
clone coexisted with one non-CLL B-cell clone, (2 MZL, 1 MALT lymphoma and 1 HCL clones
from cases 29, 32, 37 and 38, also identified in Supplemental Table 3 with the ¶ symbol). In a
minority of cases (2/16), the two co-existing phylogenetically related clones were both non-CLL
like, their phenotype being consistent with FL (case 16¶, in Supplemental Table 3) and MALT
lymphoma (case 34¶, in Supplemental Table 3), respectively.

107
Chapter 3 Molecular and cytogenetic characterization of B-cell clones from multiclonal vs. monoclonal B-CLPD
Figure 10. Sequence distance cladogram of IGHV gene usage in CLL-like and non-CLL like B-cell clones from
multiclonal (dark colored bars in the outside circle) and monoclonal (light colored bars in the outside circle) cases.
Five major branches were found in the sequence distance cladogram (i.e VH1, VH5, VH3, VH2-VH6, VH4). B-cell
clones from individual multiclonal cases are represented by numbers; from them, those phylogenetically closely
related B-cell clones, which share the same IGHV family, are specifically identified by bold numbers in the inner part
of the circle and the symbol ¶. Of note, B-cell clones from multiclonal cases 14¶, 16¶ and 35¶ belong to closely
located sub-branches of the cladogram, having their IGHV sequences an aa identity of 79%, 76% and 69%,
respectively. In turn, B-cell clones from the multiclonal case 32¶ belong to the VH4 major branch with IGHV
sequences whose aa identity is of 69%. Finally, the other B-cell clones from multiclonal cases – cases 2¶, 11¶, 15¶,
18¶, 19¶, 27¶, 29¶, 31¶, 34¶, 37¶, 38¶ and 40¶– belong to the VH3 major branch, having IGHV sequences with an
aa identity which is > 60% (–68%, 73%, 73.4%, 61%, 79%, 70%, 63%, 77%, 69.9%, 70%, 72% and 68.4%–,
respectively).
3.3.6. Homology of the HCDR3 region between B-cell clones coexisting in
multiclonal cases versus non-coexisting (monoclonal) B-cell clones
The HCDR3 aa sequence from coexisting B-cell clones had the same length or it just
differed in one aa in 8/41 multiclonal cases analyzed (19%) (Table 15A). The homology of all
these case-paired HCDR3 regions was calculated as the number of identical aa or aa with an
analogous side-chain polarity (excluding the anchor second-CYS104 (C_) and the J-TRP 118

108
Chapter 3 Molecular and cytogenetic characterization of B-cell clones from multiclonal vs. monoclonal B-CLPD
(_W) aa positions that delineate the HCDR3 region) divided by the corresponding HCDR3
length (Table 15A). It is worth noting that the aa composition of HCDR3 sequences of the same
length (±1 aa) that belonged to the same or evolutionary, highly-related, VH families (e.g. VH3-
48, VH3-21, VH3-11)239 (n=57) from monoclonal cases (Supplemental Table 6) showed a
tendency towards a lower homology than that of multiclonal cases: median of 37% (range:
11% to 71%) vs. 50% (range: 26% to 64%), respectively; (P =0.1). Since stereotyped sequences
are widely represented in CLL 487, we further analyzed the frequency of stereotyped HCDR3
sequences in multiclonal cases (Table 15B) vs. monoclonal cases (Table 15C). Interestingly, the
number of multiclonal cases showing the same or highly similar stereotyped HCDR3 sequences
was significantly higher than that of monoclonal cases: 8/41 (19%) vs. 11/143 (8%),
respectively, (P =0.001). Furthermore, the aa composition of HCDR3 sequences from
monoclonal cases with stereotyped HCDR3 sequences showed clearly less identical and/or
conserved positions than those found among multiclonal cases (underlined aa in Table 15B and
Table 15C).
Table 15. Multiclonal cases with coexisting B-cell clones sharing HCDR3 features (A).
Multiclonal (B) and monoclonal (C) cases with B-cell clones showing stereotyped HCDR3 aa
sequences.
A. Multiclonal cases with coexisting B-cell clones showing identical or one aa differing
length of HCDR3 regions, and analogous composition of aa in some parallel positions.
Multiclonal Case ID VH families aa composition of HCDR3 (length) % homology#
8A
8B
V1-3
V3-53
C_ARDRVVIIPDTTTINWFDP_W (19)
C_ATHPTNIYTRWPYVSDMDV_W (19) 26
11A
11B
V3-23
V3-48
C_ANRGETRGMDV_W (11)
C_VRDGFHYYGFDI_W (11) 54
14A
14B
V4-34
V4-34
C_ARGPDRLYSGSYTRFDY_W (17)
C_ARREDDNFWSGFYMDV_W (16) 47
22A
22B
V3-74
V4-59
C_ARDLDGSGSGVFDW_W (14)
C_ARGWRSTDSYYGMDV_W (15) 64
29A
29B
V3-48
V3-15
C_VRELWFGNGGDY_W (12)
C_ATAGQGSADFLY_W (12) 42
31A
31B
V3-33
V3-23
C_ARGELLHNWFDP_W (12)
C_AKDGFPYYGFDI_W (12) 58
32A
32B
V4-39
V4-34
C_ARQTGWLAPSDY_W (12)
C_ARRDSSGWYYFDY_W (13) 54
33A
33B
V2-26
V3-53
C_AGTNIPRQFDFWSGSSPNWFDP_W (22)
C_ARAGGYCNSGSCRGAPRWYFDL_W (22) 32
Amino acids (aa) with analogous side-chain polarity (highlighted in gray): case 8 (I, V and F, M), case 11 (A, V and M,
F), case 14 (L, F), case 22 (L, W; S, T and F, M), case 29 (A, V), case 31(L, F and H, Y), case 32 (T, S), case 33 (W, C)
(EMBL-EBI Cambridge, UK). All cases had coexisting B-cell clones with CLL-like phenotype, except case 29 (one B-cell
clone corresponded to a MALT lymphoma-like phenotype), cases 32 and 33 (both had one B-cell clone with a MZL-
like phenotype). MALT, lymphoma of mucosa-associated lymphoid tissue; MZL, marginal zone lymphoma. #Number
of aa with analogous side-chain polarity (excluding the delineating C_ and _W positions)/HCDR3 length*100.

109
Chapter 3 Molecular and cytogenetic characterization of B-cell clones from multiclonal vs. monoclonal B-CLPD
B. Multiclonal cases with B-cell clones showing stereotyped HCDR3 sequences.
Multiclonal Cases ID V(D)J rearrangement AA composition of HCDR3
1
2
V3-30(D3-9)J6
V3-30(D3-9)J6
C_AKYGGVKLRYFDWLLYGDYYYGMDV_W
C_AKYGGVKLRYFDWLLYGDYYYGMDV_W
9
15
V3-23(D5-12)J6
V3-23(D3-22)J6
C_ANRGETRGMDV_W
C_ANRGESWGMDV_W
21
35
V3-21(D2-2)J6
V3-21(D2-2)J6
C_ARDANGMDV_W
C_ARDANGMDV_W
22
40
V3-74(D3-10)J4
V3-21(D4-23)J4
C_ARDLDGSGSGVFDW_W
C_ARDLDGGNSVFDC_W
Cases 1 and 2; 9 and 15; 21 and 35; 22 and 40 showed a highly similar HCDR3 sequence; the
underlined aa were different. All the listed B-cell clones had a CLL-like phenotype.
C. Monoclonal cases with B-cell clones showing stereotyped HCDR3 sequences.
Monoclonal Cases ID V(D)J rearrangement AA composition of HCDR3
117
134
V3-7(D3-3)J4
V3-7(D3-3)J4
C_VRENELWSGGWGLDG_W
C_VRENEFWSGGWGLDG_W
207
208
210
V4-39(D2-2)J6
V4-39(D2-2)J6
V4-39(D2-2)J6
C_ARHRLGYCSSTSCYYYYYGMDV_W
C_ARHRLGYCSSTSCYYYYYGMDV_W
C_ARDRLGYCSSTSCYYYYYGMDV_W
187
215
V4-b(-)J4
V4-b(D5-5)J4
C_ARSWIQLWSEFDY_W
C_ARAWIQLWSDFDY_W
180
204
V1-2/D6-19/J4
V1-2/D6-19/J4
C_ARLQWLGISHFDY_W
C_ARAQWLVLENFDY_W
196
198
V4-34/D3-16/J6
V4-34/D4-23/J6
C_VRGYPSDYTERRYYYYGLDV_W
C_ARGYGSTGETRRYYYYGMDV_W
Cases 117 and 134; 207, 208 and 210; 187 and 215; 180 and 204; 196 and 198 showed a highly
similar HCDR3 region; the underlined aa were different. All the listed B-cell clones had a CLL-like
phenotype.
3.4. Discussion
Multiclonal expansions of phenotypically aberrant B-cell clones (MBLlow) have been
reported as frequently present in the general population;19 of note, multiclonal expansions of
immunophenotypically normal B-cells can also be found in non-malignant diseases, such as
autoimmune disorders and inflammatory responses against several infectious agents (e.g.
Helicobacter pylori, HCV).488,489 Whether clonal expansions of aberrant B-cells found in
otherwise healthy individuals (MBLlow) reflect a prominent reactive process against potent
antigenic stimuli with unknown clinical relevance, or they represent an early (multi)clonal
manifestation of a BCR-dependent neoplastic event, still remains to be established. In this
regard, it should be noted that between 30% and 40% of such cases show cytogenetic changes
shared by MBL and CLL, e.g. del(13q). Of note, among other large structural chromosomal
alterations, clonal mosaicism involving del(13q14) has also been recently found in peripheral
blood cell populations from otherwise healthy individuals, particularly among subjects with

110
Chapter 3 Molecular and cytogenetic characterization of B-cell clones from multiclonal vs. monoclonal B-CLPD
more advanced age (around 2-3% in the elderly), but its potential relationship with MBL and
CLL remains unknown.490,491 Compared to the typical (monoclonal) MBL and B-CLPD, coexisting
B-cell clones from multiclonal MBL and B-CLPD may potentially have a greater probability of
interacting with common immunological determinants. However, there is still little information
about the potential existence of shared BCR features in cases showing ≥2 coexisting B-cell
clones vs. monoclonal cases.
In the present study, we analyzed for the first time the molecular and cytogenetic
features of a large group (n=85) of coexisting, but unrelated, B-cell clones from a series of 41
multiclonal MBL and B-CLPD cases, in comparison to 143 monoclonal cases. Overall, the
former clones more frequently showed cytogenetic and hematological features which are
typical of the earliest MBL stages and/or initial phases of CLL.468,488,489 Accordingly, B-cell clones
from multiclonal cases more frequently corresponded to MBL cases, whereas B-cell clones
from monoclonal cases were more frequently found to correspond to overt CLL. Of note, these
findings do not contradict the apparent discrepancy between such association and our
previous observation among CLL patients of a worse clinical outcome for multiclonal cases
carrying non-CLL clones,21 as this latter study was restricted to overt CLL cases. In addition,
multiclonal cases were also associated with lower clonal B-cell counts in peripheral blood, a
lower number of cytogenetically altered clones, particularly of those carrying del(13q), and a
decreased frequency of clones with ≥2 alterations. Of note, clonal expansions of non-CLL like
B-cell clones were also more frequently observed in multiclonal than in monoclonal cases, such
expansions corresponding mainly to indolent lymphomas (e.g. MZL) which have been
associated with chronic immune responses.492,493
Altogether, these results support the notion that the presence of multiple B-cell clones
in the same individual more closely reflects the earlier stages of the disease. If this holds true
and chronic antigen stimulation is involved in the onset of MBL and B-CLPD – as it has been
recently suggested for MBL, based on epidemiological studies204 –, it could be hypothesized
that B-cell clones coexisting in multiclonal cases would show more closely related BCR features
than B-cell clones from monoclonal cases. In this regard, our results point out the existence of
a slightly higher level of HCDR3 homology among B-cell clones from multiclonal vs monoclonal
cases. In fact, in around one fifth of all multiclonal cases, the co-existing B-cell clones showed a
high homology in their HCDR3 aa sequences; this also hold true when we compared the
homology of the HCDR3 sequences of these multiclonal against those of monoclonal cases
whose B-cell receptors were restricted to the same and/or ontogenetically related IGHV
families. In addition, the frequency of stereotyped HCDR3 was also higher in multiclonal vs.
monoclonal cases. Such more closely related BCR features would be found independently of

111
Chapter 3 Molecular and cytogenetic characterization of B-cell clones from multiclonal vs. monoclonal B-CLPD
whether common antigens or superantigens are specifically involved, although the former
would potentially lead to a higher HCDR3 homology, whereas superantigens could contribute
to a greater frequency of usage of specific IGHV, IGHD and/or IGHJ genes.22,244
In the present study, we found a similar frequency of IGHV gene usage between
coexisting multiclonal and non-coexisting monoclonal B-cell clones in association with a lower
frequency of DH1, DH4 and DH7 as well as JH6 families in multiclonal vs. monoclonal B-cell
clones. Overall, these results suggest that no single Ag or superantigen is involved in common
in MBL and B-CLPD. This is further supported by the relatively low percentage of alignment
(≈50%) of the IGHV aa sequences observed among the different clonal B-cell populations
analyzed, since such potential antigens – including superantigens – would require interaction
with highly conserved sites at the IGHV/HCDR3 regions of the BCR.494 Interestingly however,
the higher representation of DH1, DH4, DH7 and JH6 IGH gene segments in monoclonal vs
multiclonal B-cell clones, together with the slightly higher levels of HCDR3 homology observed
among coexisting (multiclonal) vs non-coexisting (monoclonal) B-cell clones from MBL, CLL and
other B-CLPD cases, would indicate that still non-random selection of specific HCDR3, DH and
JH segments could exist in the MBL and CLL repertoire of both multiclonal and monoclonal
cases, which could reflect antigen-driven selection and expansion of specific B-cell clones, both
at the MBL and/or CLL stages.64
In this regard, based on the phylogenetic proximity of their BCR, we could further
identify within the B-cell clones from multiclonal cases, a considerably represented subgroup
of B-cell clones showing preferential usage of IGHV3 genes and shorter HCDR3 sequences
carrying a significantly higher number of IGHV mutations vs the unrelated clones. These results
further support the involvement of a common antigen, at least in this specific subset of
cases.495 Interestingly, these “phylogenetically-related” B-cell clones coexisting in multiclonal
cases showed a significantly higher frequency of del(13q) than B-cell clones expressing other
IGHV genes. These observations further suggest that the BCR features of this subset of
coexisting multiclonal B-cell clones could also contribute to determine the probability and/or
type of cytogenetic progression occurring at the earliest stages of the disease, as previously
suggested by our group468 and others.479,496 Further long-term, longitudinal studies are required
to confirm this hypothesis, since multiple productive IGHV gene rearrangements may also
underline clonal drift leading to selection for more aggressive clones whose proportions would
change over time.497
In summary, based on the molecular features of the BCR and the cytogenetic profile of
B-cell clones from the multiclonal vs monoclonal MBL, CLL and other B-CLPD cases here
analyzed, it may be concluded that multiclonality is typically associated with early stages of B-

112
Chapter 3 Molecular and cytogenetic characterization of B-cell clones from multiclonal vs. monoclonal B-CLPD
CLPD, at the same time it appears to more closely reflect an antigen-driven nature of MBL and
B-CLPD, with potential involvement of multiple and diverse antigenic determinants.

*both authors contributed equally to this work and they should both be considered as first authors.
Arancha Rodríguez-Caballero*, Ana Henriques*, Ignacio Criado, Anton W. Langerak, Sergio
Matarraz, Antonio López, Ana Balanzategui, Marcos González, Wendy G. Nieto, Emília Cortesão,
Artur Paiva, Julia Almeida and Alberto Orfao.
(accepted to the British Journal of Haematology, pending (minor) revision)
Chapter 4 | Subjects with chronic lymphocytic
leukemia-like B-cell clones with stereotyped B-cell receptors
frequently show MDS-associated phenotypes on myeloid cells


115
Chapter 4 Subjects with stereotyped CLL-like B-cell clones frequently show MAP on myeloid cells
4.1. Abstract
An increasing body of evidences suggests the potential occurrence of antigen
encounter by the cell of origin in CLL and CLL-like MBL. However, the scenario in which this
event might occur, remains unknown. In order to gain insight into this scenario we investigated
the molecular, cytogenetic and hematological features of 223 CLL-like (n=84) and CLL (n=139)
clones with stereotyped (n=32) vs. non-stereotyped (n=191) IGHV aa sequences. Overall,
stereotyped CLL-like MBL and CLL clones showed a unique IGHV profile, associated with higher
VH1 and lower VH3 gene usage (P =0.03), longer HCDR3 sequences (P =0.007) and unmutated
IGHV (P <0.001) vs. non-stereotyped clones. Whilst the overall size of the stereotyped B-cell
clones in PB did not appear to be associated with the CLL-related cytogenetic profile of B-cells
(P >0.05) it did show a significant association with the presence of myelodysplastic syndrome
(MDS)-associated immunophenotypes on PB neutrophils and/or monocytes (P =0.01).
Altogether these results, point to the potential involvement of different selection forces in the
expansion of stereotyped vs. non-stereotyped CLL and CLL-like MBL clones, the former being
potentially favored by an underlying altered hematopoiesis.
4.2. Materials and methods
4.2.1. CLL patients and MBL subjects
A total of 200 subjects (119 males and 81 females; mean age of 69±12 years; range:
35-89 years) presenting one or more CLL-like and/or CLL clonal B-cell populations, were
included in this study. Fifteen cases (7%) corresponded to healthy individuals with MBLlow
(<200 CLL-like B-cells/µL in PB), 41 (20%) were MBLhigh (≥200 and <5 000 CLL-like B-cells/µL in
PB), 131 (66%) had newly-diagnosed untreated CLL, 9 (4%) were CLL patients who had
previously received chemotherapy for CLL, and 4 (2%) had other B-CLPD in association with ≥1
CLL-like MBL B-cell population(s). PB samples were obtained from each subject after written
informed consent was given, and the study was approved by the local ethics committees of the
participating centres. Diagnosis of MBL and CLL was based on the WHO 2008 criteria466 and
clinical staging of CLL subjects was established according to the Binet classification.498
Immunophenotypic evaluation of the B-cell clones in MBL cases and both CLL and other B-
CLPD patients was performed as previously described.192,468,499

116
Chapter 4 Subjects with stereotyped CLL-like B-cell clones frequently show MAP on myeloid cells
Overall, 37/200 subjects (18%) showed co-existence of two or three phenotypically
different aberrant B-cell populations with a CLL-like (n=33) or other B-CLPD phenotype (n=4).
For this study, analysis was focused only on those aberrant B-cell populations displaying a
typical CLL-like MBL and CLL phenotype, for a total of 228 B-cell clones. The distribution of all
clonal B-cell populations analyzed in the distinct diagnostic categories was as follows: 27
corresponded to CLL-like MBLlow, 59 to CLL-like MBLhigh and 142 to CLL (see Table 16).
Table 16. Distribution according to diagnosis of subjects included in the study and the
corresponding CLL and CLL-like MBL clones.
Diagnostic subgroups
No. of cases MBLlow
MBLhigh
CLL Other B-CLPD
Subjects Monoclonal 163 13 (87%) 33 (80%) 117 (84%)# -
Multiclonal 37† 2 (13%)* 8 (19%)* 23 (16%)*
, # 4 (100%)*
, #
Total 200 15 41 140# 4
#
B-cell clones
From monoclonal cases 163 13 (48%) 33 (56%) 117 (82%) -
From multiclonal cases 65 14 (52%) 26 (44%) 25 (18%) -
Total 228 27 59 142 -
*For multiclonal CLL and CLL-like MBL cases as well as for B-CLPD cases other than CLL, only CLL-like clones were
considered; the later B-CLPD cases included the following diagnoses: HCL, hairy cell leukemia; SMZL/MALT, splenic
marginal zone B-cell lymphoma/ extranodal marginal zone B-cell lymphoma of mucosa-associated lymphoid tissue
lymphoma. CLL, chronic lymphocytic leukemia; MBL, monoclonal B-cell lymphocytosis; B-CLPD, B-cell chronic
lymphoproliferative disorders. †The number of clones per multiclonal case was of two in all diagnostic subgroups, except in three tri-clonal subjects
corresponding to one CLL patient, one MBLhigh
case and one patient with a B-CLPD other than CLL. #Six monoclonal and four multiclonal subjects had received conventional chemotherapy (see Supplemental Table 7).
4.2.2. Cytogenetic and molecular studies
Cytogenetic analyses were performed by multicolor interphase fluorescence in situ
hybridization on slides containing FACS-purified and fixed aberrant B-cells, as previously
described in detail.253,468,499 In parallel, analysis of the patterns of rearrangement of the IGHV
was performed for each FACS-purified B-cell clone.468,471,472,499 Forward and reverse sequences
were aligned into a single resolved sequence and then aligned with germline sequences using
the IMGT database and tools (http://imgt.org). Only B-cell clones showing in-frame
rearrangements were finally evaluated (n=223). Sequences containing >2% deviation from the
germline sequence were considered as being somatically mutated. Those IGHV-IGHD-IGHJ
rearrangements with HCDR3 sequences that matched stereotyped CLL subsets, as previously
defined by Agathangelidis13 and Stamatopoulos et al.,237 were classified as stereotyped IGHV
sequences; all other IGHV sequences were identified as being non-stereotyped.

117
Chapter 4 Subjects with stereotyped CLL-like B-cell clones frequently show MAP on myeloid cells
4.2.3. Immunophenotypic analyses of PB myeloid cells
Neutrophils were recognized as displaying MDS-associated phenotypes when they
lacked or expressed low levels of CD10 and/or showed low SSC properties (e.g. granularity) vs.
their normal counterpart;500 in turn, presence of CD56 expression on PB monocytes was also
defined as an MDS-associated phenotype.500
4.2.4. Statistical methods
Conventional descriptive and comparative statistics –nonparametric Kruskal-Wallis and
Mann-Whitney U tests (for continuous variables), or the Pearson’s 2 and Fisher exact tests
(for categorical variables) – were performed using the SPSS software program (SPSS, version
20.0; SPSS software, IBM, Armonk, NY, USA). P values <0.05 were considered to be associated
with statistical significance.
4.3. Results
4.3.1. Molecular and cytogenetic features of CLL and MBL B-cell clones with
stereotyped versus non-stereotyped IGHV amino acid sequences
Thirty-two of the 223 B-CLPD clones (14%) analyzed showed stereotyped HCDR3 aa
sequences. These stereotyped HCDR3 sequences corresponded to 19 different stereotyped CLL
subsets, as previously defined by Stamatopoulos and Agathangelidis et al..13,237 From the 32
stereotyped clones, 26 (81%) corresponded to B-cell clones from monoclonal B-CLPD, whereas
6 (19%) derived from multiclonal B-CLPD cases (Table 17 and Table 18), the latter representing
a slightly lower frequency than that found among non-stereotyped clones (19% vs. 30%, P
=0.2)(Table 18). Further analysis of the specific IGHV gene sequences revealed a higher VH1
gene usage in stereotyped vs. non-stereotyped B-cell clones; in contrast, the VH3 gene was
less frequently found among the stereotyped clones (P =0.03) (Table 19). Moreover,
stereotyped B-cell clones displayed longer median HCDR3 sequences and lower percentages of
IGHV mutated aa sequences than non-stereotyped B-cell clones (P =0.007 and P <0.001,
respectively) (Table 19).

Table 17. Phenotypic, haematological, molecular and cytogenetic features of B-CLPD cases whose CLL-like B-cell clones had stereotyped HCDR3
sequences defined according to previously reported stereotypic CLL profiles.13,237
Clone No
Subset No.
Clone Phenotype
% Clone
Abs. No. Clone (x106/L)
MAP Binet
Stage* IGHV MS
IGHV-D-J gene rearrangements
HCDR3 sequence (length) iFISH (% of altered cells)
1 1 CLL 88 120 102 No B U V1-2/D6-19/J4 CARAQWLVLENFDYW (13) ND
2 1 CLL-like MBLlow 3.1 112 No - U V1-2/D6-19/J4 CARLQWLGISHFDYW (13) ND
3 1 CLL 87.6 79 839 Yes B U V1-3/D6-19/J4 CARWQWLVPSRFDYW (13) -13q14.3 (94%)
4 1 CLL 35 5 085 No A U V1-18/D6-19/J4 CARKQWLGMYYFDYW (13) -13q14.3 (13%); t(14q32) (13%)
5B† 2 CLL-like MBLhigh 9.8 2 078 Yes - M V3-21/D2-15/J6 CARDANGMDVW (9) ND
6B 2 CLL-like MBLhigh 2.3 250 Yes - M V3-21/D2-15/J6 CARDANGMDVW (9) ND
7 2 CLL-like MBLhigh 33.2 4 424 No - M V3-21/D1-26/J6 CARDANGMDVW (9) ND
8 3 CLL 45.8 9 545 Yes NA U V4-34/D2-2/J6 CARADLLVVPAAIYYYYYGMDVW (21) -13q14 (90%);-13q14.3 (90%);-17p13.1 (83%)
9 6 CLL 87 20 880 No A U V1-69/D3-16/J3 CARGGNYDYIWGSYRPNDAFDIW (21) -11q23 (24%)
10 7 CLL 88 75 170 No A U V1-69/D3-3/J6 CARADGGYDFWSGYSTVNYYGMDVW (23) t(14q32) (91%)
11 7 CLL 72 71 516 No B U V1-69/D3-3/J6 CARGPSSYDFWSGYYTGRDYYYYMDVW (25) -13q14 (12%);-13q14.3 (12%); t(14q32) (60%)
12 7 CLL 43 8 544 Yes A U V1-69/D3-3/J6 CAREGGADKDYDFWSGYYPNYYYYGMDVW (27) ND
13 7 CLL 68.3 30 093 No A M V1-69/D3-3/J6 CARAEQYYDFWSGHKGVDYYYYMDVW (24) +12 (33%); -11q22.3 (24%)
14B 8 CLL-like MBLhigh 3 700 Yes - U V4-39/D6-13/J5 CASVQGYSSSWYGGDNWFDPW (19) +12 (93%)
15 8 CLL 62.7 24 647 No NA U V4-39/D6-13/J5 CATQTGYSSSWYAVNWFDPW (18) t(14q32) (94%)
16 10 CLL-like MBLhigh 44.6 4 594 Yes - U V4-39/D2-2/J6 CARHRLGYCSSTSCYYYYYGMDVW (22) ND
17 10 CLL 40.6 17 214 No A U V4-39/D2-2/J6 CARHRLGYCSSTSCYYYYYGMDVW (22) ND
18 10 CLL 86 22 704 No B U V4-39/D2-2/J6 CARDRLGYCSSTSCYLYYYGMDVW (22) ND
19A 11 CLL 33.7 6 807 No NA U V4-34/D3-10/J4 CARGLYYYGSGVYFDYW (15) t(14q32) (98%)
20 11 CLL 64.2 19 568 No C U V4-34/D3-10/J4 CARGLIGAYGSGSYYPFPFDYW (20) +12 (73%); t(14q32) (82%)
21 12 CLL-like MBLhigh 15.3 1 454 NA - M V1-2/D3-22/J4 CARDLARYDSGGSYKRKMFDYW (20) ND
22 16 CLL 90 186 012 Yes B M V4-34/D2-15/J6 CAGRFYCSGDTCHLPLYHYYYGLDVW (24) ND
23 21 CLL 42 11 147 NA A U V3-23/D3-3/J6 CAKHQLTYYDFWSGYYTEYYYYYGMDVW (26) -13q14.3 (99%)
24 22 CLL-like MBLhigh 18 2 531 No - U V3-11/D3-3/J6 CARDRRDDFWSGYRIYYYYYGMDVW (23) +12 (84%)
25 22 CLL 66.9 17 488 Yes A M V3-23/D3-3/J6 CARDLTHHNFWSAYYETSYCGMDVW (23) ND
26A† 23 CLL 62.9 49 600 Yes B U V3-30/D3-9/J6 CAKYGGVKLRYFDWLLYGDYYYGMDVW (25) ND
27 25 CLL 65.6 33 003 No A U V1-8/D3-3/J6 CARGPSYYDFWSGPFDNYGMDVW (21) -13q14.3 (97%)
28 31 CLL-like MBLhigh 19.5 1 661 No - U V3-48/D3-3/J6 CARSPGYDFWSGYPDYYGMDVW (20) +12 (84%)
29 34 CLL 24.9 5 578 Yes A U V1-18/D3-9/J6 CARGAYYDILTGYRYYYGMDVW (20) +12 (75%)
30A 38 CLL-like MBLhigh 23 3 174 Yes - U V4-39/D3-3/J5 CARHTSLYDFWSGYYRGWFDPW (20) -13q14 (15%);-13q14.3 (15%)
31 77 CLL 91 219 537 No A M V4-59/D6-19/J4 CARGPDISGWNGLDYW (14) -13q14.3 (82%)
32 201 CLL 65.4 11 523 No A M V4-34/D5-12/J3 CARREEDWKRSGRDSFDIW (17) Biallelic -13q14.3 (79%)
*Specified for CLL cases only. Gray shadowed lines correspond to stereotyped CLL-like B-cell clones derived from multiclonal B-CLPD cases. U, unmutated; M, mutated; CLL, chronic
lymphocytic leukemia; MBL, monoclonal B-cell lymphocytosis; B-CLPD, B-cell chronic lymphoproliferative disorders; MAP, myelodysplasia-associated phenotype; MS, mutational status. ND,
not detected. NA, not available. †Patients that received chemotherapy for CLL.
11
8

119
Chapter 4 Subjects with stereotyped CLL-like B-cell clones frequently show MAP on myeloid cells
Table 18. Peripheral blood B-cell counts, distribution of CLL-like MBLlow, MBLhigh and CLL B-cell
clones and of CLL clinical stages according to the expression of non-stereotyped vs.
stereotyped IGHV amino acid sequences.
Results expressed as number of B-cell clones and percentage between brackets or as *median value (range). PB,
peripheral blood; WBC, white blood cells; IGHV, immunoglobulin heavy chain variable region genes; CLL, chronic
lymphocytic leukemia; MBL, monoclonal B-cell lymphocytosis; MDS, myelodysplastic syndromes. **Statistically
significant differences (P <0.05).
The frequency of cytogenetically altered stereotyped B-cell clones (59%) was similar to
that found among non-stereotyped B-cell clones (58%). Likewise, the proportion of B-cell
clones showing coexistence of ≥2 cytogenetic alterations was also similar in both groups (22%
and 26%, respectively). Regarding each specific cytogenetic alteration, similar frequencies and
percentages of cytogenetically altered cells were observed in stereotyped vs. non-stereotyped
B-cell clones (Table 19).
Non-stereotyped B-cell clones
n=191
Stereotyped B-cell clones
n=32
N. of PB clonal B cells(x106/L)* 7,408 (0.09-369 289) 11,336 (112-219 537)
% of PB clonal B cells from WBC* 37% (0.001%-97%) 45% (2.3%-91%)
% of multiclonal B-cell clones 58/191 (30%) 6/32 (19%)
clones and CLL clones: cell-Blike -CLL
CLL-like MBLlow
B-cell clones 25/191 (13%) 2/32 (6%)
CLL-like MBLhigh
B-cell clones 49/191 (26%) 8/32 (25%)
CLL B-cell clones 117/191 (61%) 22/32 (69%)
CLL-stage A clones 62/106 (59%) 12/19 (63%)
CLL-stages B clones 27/106 (25%) 6/19 (32%)
CLL-stages C clones 17/106 (16%) 1/19 (5%)
% of cases with MAP (MDS-associated
phenotypes)
27/154 (17%) 12/30 (40%)**

120
Chapter 4 Subjects with stereotyped CLL-like B-cell clones frequently show MAP on myeloid cells
Table 19. Molecular and cytogenetic features of CLL-like MBL and CLL clones with non-
stereotyped versus stereotyped IGHV amino acid sequences.
Molecular and cytogenetic features Non-stereotyped clones Stereotyped clones
n=191 n=32
VH subgroups
VH1
VH3
VH4
VH2,VH5, VH6
37/191 (19%)
101/191 (53%)
43/191 (23%)
10/191 (5%)
12/32 (38%)**
8/32 (25%)**
12/32 (38%)
0/32 (0%)
HCDR3 length*, aa 16 (6-32) 20 (9-27)**
IgH mutated clones 122/191 (64%) 9/32 (28%)**
No. of genetically altered CLL-like clones 110/191 (58%) 19/32 (59%)
No. of CLL-like clones with ≥2 alterations 50/191 (26%) 7/32 (22%)
Type of cytogenetic alterations
No. of del(13q)+ clones (%)
% del(13q)+ cells *
74/191 (39%)
82% (10%-99%)
9/32 (28%)
79% (15%-90%)
No. of del(13q14.3)+ clones (%)
% del(13q14.3)+ cells *
71/191 (37%)
76% (5%-99%)
9/32 (28%)
82% (12%-99%)
No. of del(13q14)+ clones (%)
% del(13q14)+ cells *
28/190 (15%)
80% (7%-99%)
3/32 (9%)
15% (12%-90%)
No. of del(13q)+ clones with another alteration (%) 40/191 (21%) 5/32 (16%)
No. of trisomy 12
+ clones (%)
% trisomy 12+ cells *
30/191 (16%)
76% (8%-97%)
6/32 (19%)
80% (33%-93%)
No. of trisomy 12+ clones with another alteration (%) 14/191 (7%) 2/32 (6%)
No. of t(14q32)+ clones (%)
% t(14q32)+ cells *
20/180 (11%)
27% (6%-91%)
6/32 (19%)
87% (13%-98%)
No. of del(11q)+ clones (%)
% del(11q)+ cells *
8/186 (4%)
68% (20%-98%)
2/32 (6%)
24% (24%-24%)
No. of del(11q22.3)+ clones (%)
% del(11q22.3)+ cells *
8/186 (4%)
82% (20%-98%)
1/32 (3%)
24% (-)
No. of del(11q23)+ clones (%)
% del(11q23)+ cells *
3/176 (2%)
64% (40%-93%)
1/32 (3%)
24% (-)
No. of del(17p13.1)+ clones (%)
% del(17p13.1)+ cells *
6/188 (3%)
56% (33%-88%)
1/32 (3%)
83% (-)
Results expressed as number of CLL and CLL-like MBL clones with cytogenetic alterations from all CLL and CLL-like MBL clones in the
corresponding group (percentage) or as *median values (range). In eight clones, biallelic del(13q14.3) was detected and polysomy
was found in 1 (multiclonal) clone. **Statistically significant differences (P < 0.05).

121
Chapter 4 Subjects with stereotyped CLL-like B-cell clones frequently show MAP on myeloid cells
4.3.2. Haematological features of CLL and CLL-like MBL B-cell clones with
stereotyped versus non-stereotyped IGHV amino acid sequences
Within the two groups of B-cell clones classified according to the presence of
stereotyped vs non-stereotyped IGHV aa sequences, a similar distribution of CLL-like MBLlow,
MBLhigh and CLL B-cell clones was found, albeit the stereotyped group included a slightly
higher, but statistically not significant, ratio of CLL/CLL-like MBL B-cell clones (CLL/ CLL-like
MBL ratio of 2.2 vs. 1.6, respectively; P =0.3) (Table 18). Similarly, the overall distribution of CLL
B-cell clones per clinical stage showed a predominance of Binet stage A (63% and 59% of the
clones, respectively) vs. Binet stage B (32% and 25%, respectively) and Binet stage C (5% and
16%, respectively) among both the stereotyped and the non-stereotyped CLL clones. Of note,
the median PB percentage and absolute count of stereotyped B-cell clones showed a tendency
towards higher values than that of non-stereotyped B-cell clones: 45% vs. 37% of all white
blood cells (P =0.1) and 11,336 clonal B-cells/μl vs. 7,408 clonal B-cells/μl (P =0.1), respectively
(Table 18).
Despite all the above similarities, non-stereotyped B-cell clones which were IGHV
unmutated displayed significantly higher PB (clonal) B-cell counts than the IGHV mutated ones
(14,076 cells/µl vs. 5,354 cells/µl, P =0.006) (Figure 11A). Likewise, the non-stereotyped B-cell
clones which carried ≥2 cytogenetic alterations showed higher PB (clonal) B-cell counts than
the the cytogenetically unaltered or minimally altered (isolated cytogenetic alteration) non-
stereotyped B-cell clones (17,310 cells/µl vs 4,841 cells/µl and 6,701 cells/µl, respectively; P
≤0.007) (Figure 11B). In contrast, IGHV stereotyped B-cell clones did not show significant
differences in their overall size when grouped according to their IGHV mutational status or to
their cytogenetic profile (P >0.05; Figure 11).
Similarly to what has been recently reported for multiple myeloma patients,501 29 of
140 (21%) CLL and 10 of 41 (24%) MBLhigh cases, displayed MDS-associated immunophenotypic
profiles on PB neutrophils (97%) and/or monocytes (46%). Most interestingly, 40% of all CLL
and MBL cases carrying stereotyped B-cell clones showed MDS-associated phenotypic
alterations on PB neutrophils and/or monocytes, a frequency which was significantly higher
than that found among cases which had non-stereotyped B-cell clones (17%) (P =0.01) (Table
18).

122
Chapter 4 Subjects with stereotyped CLL-like B-cell clones frequently show MAP on myeloid cells
Figure 11. Number of clonal B-cells in the PB from IGHV stereotyped vs. non-stereotyped B-cell clones grouped
according to their IGHV mutational status (panel A) and cytogenetic profile (panel B). Diagrams show the number of
PB clonal B cells (x106/L) with both stereotyped and non-stereotyped IGHV sequences according to their mutational
status: unmutated (≤2% deviation from the germline sequence) vs. mutated (>2% deviation from the germline
sequence) and the absence versus the presence of one or more than one cytogenetic abnormalities. Circles
represent individual cases, and horizontal lines indicate median values.
4.4. Discussion
Despite increasing evidences about the potential occurrence of Ag encounter by the
cell of origin in CLL exist,319 the precise B-cell scenario in which this event might occur, remains
unknown. In order to gain insight into such potential scenario, here we investigated the
molecular and biological features of stereotyped vs. non-stereotyped CLL and CLL-like MBL
clones. Overall, stereotyped CLL and CLL-like MBL clones showed a unique IGHV profile,
associated with higher VH1 gene usage (an IGHV subgroup that is particularly related with
early stages in the evolution of the IGHV repertoire),40,502 longer HCDR3 sequences and
123
Chapter 4 Subjects with stereotyped CLL-like B-cell clones frequently show MAP on myeloid cells
unmutated IGHV as compared to non-stereotyped clones. More interestingly, the overall size
of the stereotyped B-cell clones in PB did not appear to be associated with the CLL-related
cytogenetic profile of B-cells, whereas it did show a significant association with the presence of
MDS-associated immunophenotypes on PB myeloid cells (neutrophils and monocytes).
In recent years, immunophenotyping has been progressively introduced in clinical
research and diagnostic laboratories for the identification of altered phenotypes in bone
marrow precursors and myeloid (e.g. neutrophil, monocytic and erythroid lineage) cells, being
currently considered in the WHO 2008 classification of hematological malignancies as a co-
criterion for the diagnosis of MDS.466 More recently, we have shown that altered MDS-like
immunophenotypes are frequently observed on residual maturing neutrophils and monocytes
(and to a lesser extent also on erythroid cells) from “de novo” AML and both MGUS and MM
patients, where such aberrant myeloid phenotypes can be detected in >80% 503 and around
15% 501 of de novo AML and MGUS/MM cases, respectively. Of note, in both groups of diseases
(“de novo” AML and MGUS/MM), the MDS-associated phenotypes predicted for MDS-
associated cytogenetic changes (but not e.g. MGUS/MM-related genetic alterations) and the
presence of an underlying clonal hematopoiesis.501 Based on these findings, we hypothesize
that in those CLL and MBL cases in which we here found PB neutrophils and monocytes
displaying the same MDS-associated phenotypes, an underlying clonal hematopoiesis,
potentially associated with specific genetic changes that still remain to be identified, might
also exist. Under these circumstances it could be speculated that, due to the close association
between the presence of such MDS-associated phenotypes on myeloid cells and stereotyped
B-cell clones, expansion of such stereotyped B-cell clones could more likely be favored by the
altered local BM microenvironment than by chronic antigen stimulation outside the BM. This
could also explain, at least in part, the greater rate of IGHV unmutated clones with longer
HCDR3 sequences among stereotyped vs non-stereotyped cases. Similarly, it might also explain
the lack of relationship observed between the presence and number of CLL-associated
cytogenetic changes and the size of the stereotyped CLL and MBL PB clones, in contrast to
what we observed among non-stereotyped cases. In line with these findings, it should be
noted that within non-stereotyped cases, the presence and number of CLL-associated
cytogenetic changes was significantly associated with the size of the B-cell clone in PB, only
among those cases that did not show MDS-associated phenotypes on myeloid cells (data not
shown).
Altogether, our results support the notion that selective genetic and/or BM
microenvironment forces may favor expansion of specific VDJ clones. This might occur already
at the HSC level, particularly among IGHV stereotyped cases; such forces could initially lead to

124
Chapter 4 Subjects with stereotyped CLL-like B-cell clones frequently show MAP on myeloid cells
the expansion of B-cell clones in an Ag-independent way, as recently proposed by Kikushige et
al. 329. These early expansions would therefore, more likely translate into an oligoclonal MBLlow
stable condition, in which clonality will not directly translate into malignancy;468,479 further
clonal B-cell expansion might depend on additional micro-environmental factors (e.g.
infections)204 and/or acquisition of specific (additional) genetic changes by the expanded B-
cells.468 Alternatively, chronic Ag-driven B-cell stimulation could act as the primary triggering
factor in other cases (e.g. non-stereotyped B-cell clones from subjects who have a normal
haematopoietic BM background/environment). However, due to the stable nature of most
MBLlow clones, very long-term longitudinal studies are required to determine the exact
pathways and factors involved in clonal CLL and CLL-like B-cell expansions potentially leading
to neoplastic transformation.468
In line with all the above, our study also revealed a greater VH1 and a lower VH3 gene
usage in stereotyped vs. non-stereotyped B-cell clones. These findings would further support
the existence of different ontogenic pathways for both categories of CLL-like and CLL clones.239
VH3 genes belong to the ancestral phylogenetic clan III, which shows the greatest nucleotide
conservation within the FR1 and FR3 intervals (versus IGHV1/5/7 and IGHV2/4/6 genes);
because of this, usage of VH3 genes has been more frequently associated with the production
of autoantibodies (e.g. anti-DNA antibodies) and direct FR3-ligand interaction with
superantigens or self-antigens recognized in a pattern-specific way;40 this is further supported
by the polyreactivity of some monoclonal antibodies produced by CLL cells247,318 which react
with molecular structures present on apoptotic cells and bacteria.245,247 Fully in line with this
hypothesis, we observed a lower incidence of multiclonality and a lower frequency of IGH
mutated clones with longer HCDR3 sequences among stereotyped vs. non-stereotyped B-cell
clones, pointing out the potential involvement of different types of BCR-triggers in stereotyped
(e.g. survival promoting antigens like vimentin and calreticulin found on stromal cells504 or
apoptotic cells245,246) vs. non-stereotyped clones (e.g. superantigens and autoantigens). Such
hypothesis would be supported by recent observations which show that coexistence of
phylogenetically-related B-cell clones that frequently share IGHV3 gene usage and that show
both shorter HCDR3 sequences and a greater proportion of IGHV mutations and del(13q14.3),
are more frequently seen in multiclonal MBL, CLL and other B-CLPD than in unrelated B-cell
clones from monoclonal cases.499 Altogether these findings suggest that non-stereotyped B-cell
clones with mostly mutated IGHV sequences and shorter HCDR3 sequences, could be more
closely associated with chronic expansions driven by antigens in the periphery, whereas
stereotyped B-cell clones with mostly unmutated IGHV sequences and longer HCDR3

125
Chapter 4 Subjects with stereotyped CLL-like B-cell clones frequently show MAP on myeloid cells
sequences could derive from B-cells which are specifically selected in the bone marrow
microenvironment.
The association between stereotypy and MDS-associated immunophenotypic features
of myeloid cells, further suggests the potential occurrence of increased cytokine-mediated
intramedullary apoptosis reported to occur in specific subtypes of MDS.505 The potential
contribution of intramedullary apoptosis to the expansion of stereotyped CLL and CLL-like MBL
clones carrying unmutated IGHV sequences reactive against molecular structures present on
apoptotic cells,245,247,296 would be in line with the highly-repetitive HCDR3 sequences of these
stereotyped B-cell clones selected in such BM microenvironment; further investigations are
required to confirm this hypothesis.
In summary, in this study we report for the first time a significant association between
stereotyped IGHV HCDR3 B-cell clones from both MBL subjects and CLL patients and
coexistence of phenotypically altered (MDS-like) myeloid cells, suggesting that the emergence
and/or expansion of CLL-like MBL and CLL clones in these cases could be favored by an
underlying altered hematopoiesis; the precise significance of the MDS-like altered myeloid
phenotypes, the potential underlying genetic lesions and the specific antigens involved, remain
to be defined.


Chapter 5 | CONCLUDING REMARKS


129
Chapter 5 CONCLUDING REMARKS
In general, detailed molecular analysis of the IGHV genes, has significantly contributed
to unravel the pathogenesis of human B-CLPD. Thus, immunogenetic analysis of the clonogenic
BCR offers valuable insight into both the ontogenesis of CLL and other B-CLPD and their
precursor (e.g. MBL) states, and the potential involvement of Ag selection in the onset and
development of the disease. In this regard, multiple studies have shown that CLL and other B-
CLPD exhibit a biased repertoire together with SHM patterns in their IGHV genes, both findings
being generally considered as evidence for the involvement of a limited set of Ags and/or
superantigens in the development of the disease. For CLL, the involvement of Ags in
leukemogenesis is further supported by the identification of closely homologous Ag binding
sites among unrelated cases (“stereotyped” BCR), which are characterized by a non-random
combination of specific IGHV genes and homologous HCDR3, also associated in some
instances, with a restricted selection of IGKV/IGLV light chains; of utmost relevance, such IGHV
profiles are strongly associated with the clinical course of the disease. Despite all the above
findings, at present it still remains unclear whether a single or multiple normal precursors are
stimulated in parallel to evolve into CLL and at what stage(s) this potentially occurs. The
recognition of MBL and particularly, the high frequency at which MBL cases show expansions
of multiple B-cell clones, highlight a potential scenario where some individuals develop
oligoclonal expansions of B-cells (e.g. CLL-like) from which only some will be selected to
progress to overt disease. The specific driving forces involved in the origin, expansion,
selection and malignant transformation of these B-cell clones, still remain largely unknown.
In order to gain insight into the precise mechanisms leading to the development and
progression of MBL into CLL and other B-CLPD, here we investigated the BCR features of a
relatively large series of MBL and B-CLPD cases, particularly focusing on CLL-like MBLlow, CLL-
like MBLhigh and CLL subjects. For the purpose of the study we focused on three major goals: 1)
the investigation of the potential associations between the specific IGHV repertoires and
unique cytogenetic and mutational profiles of MBL vs. CLL cases; 2) the comparison of the
immunogenetic, cytogenetic and hematological features of B-cell clones from monoclonal vs.
multiclonal MBL, CLL and other B-CLPD, and; 3) the molecular and cytogenetic characteristics
of MBL and CLL cases carrying stereotyped vs. non-stereotyped BCR. Based on the results of
the work performed during this doctoral thesis, the following major conclusions can be drawn:
‐ Regarding the potential existence of unique cytogenetic and mutational profiles associated
with specific IGHV repertoires in MBL versus CLL:
– MBLlow, MBLhigh and CLL B-cell clones display three major distinct, but partially
overlapping, patterns of IGHV gene usage, IGHV mutational status and cytogenetic

130
Chapter 5 CONCLUDING REMARKS
alterations, suggesting that the combination of specific IGHV genes and IGHV
mutational status of CLL-like B-cell clones may modulate the type of cytogenetic
alterations acquired, their rate of acquisition and/or potentially also the distinct
clinical behavior of such clones.
‐ With respect to the phenotypic, cytogenetic and molecular characterization of expanded B-
cell clones from multiclonal versus monoclonal B-CLPD:
– Multiclonal MBL, CLL and other B-CLPD display molecular, cytogenetic and
hematological features which are typically associated with early MBL stages
and/or initial phases of disease, at the same time they appear to more closely
reflect an antigen-driven nature of MBL and B-CLPD with potential involvement of
multiple and diverse antigenic determinants.
‐ Regarding the molecular and cytogenetic characteristics of stereotyped CLL and CLL-like
MBL clones and the potential coexistence of myelodysplasia-associated phenotypes on
myeloid cells:
– Stereotyped CLL and CLL-like MBL clones show unique IGHV profiles associated
with unmutated IGHV sequences, longer HCDR3 and preferential usage of the VH1
vs. VH3 genes; these BCR features may reflect a distinct origin for MBL and CLL B-
cells with stereotyped vs. non-stereotyped BCR. In line with this hypothesis,
stereotyped CLL and CLL-like MBL B-cell clones more frequently showed
myelodysplasia-associated immunophenotypes on PB myeloid cells. Altogether,
these results point out the coexistence of an underlying altered hematopoiesis
with potential involvement of HSC in the development and/or expansion of the CLL
and CLL-like MBL B-cell clones from a significant fraction of cases carrying
stereotyped BCR, the precise pathogenic role of such myelodysplasia-associated
alterations of hematopoiesis deserving further investigations.

Chapter 6 | REFERENCES


133
Chapter 6 REFERENCES
1. Dronca RS, Jevremovic D, Hanson CA, et al. CD5-positive chronic B-cell lymphoproliferative disorders: diagnosis and prognosis of a heterogeneous disease entity. Cytometry Part B, Clinical cytometry 2010;78 Suppl 1:S35-41. 2. Kuppers R, Dalla-Favera R. Mechanisms of chromosomal translocations in B cell lymphomas. Oncogene 2001;20:5580-94. 3. Tiacci E, Schiavoni G, Forconi F, et al. Simple genetic diagnosis of hairy cell leukemia by sensitive detection of the BRAF-V600E mutation. Blood 2012;119:192-5. 4. Gachard N, Parrens M, Soubeyran I, et al. IGHV gene features and MYD88 L265P mutation separate the three marginal zone lymphoma entities and Waldenstrom macroglobulinemia/lymphoplasmacytic lymphomas. Leukemia 2013;27:183-9. 5. Pileri SA, Falini B. Mantle cell lymphoma. Haematologica 2009;94:1488-92. 6. Puente XS, Pinyol M, Quesada V, et al. Whole-genome sequencing identifies recurrent mutations in chronic lymphocytic leukaemia. Nature 2011;475:101-5. 7. Kuppers R. Mechanisms of B-cell lymphoma pathogenesis. Nature reviews Cancer 2005;5:251-62. 8. Chiorazzi N, Ferrarini M. B cell chronic lymphocytic leukemia: lessons learned from studies of the B cell antigen receptor. Annual review of immunology 2003;21:841-94. 9. Chiorazzi N, Hatzi K, Albesiano E. B-cell chronic lymphocytic leukemia, a clonal disease of B lymphocytes with receptors that vary in specificity for (auto)antigens. Annals of the New York Academy of Sciences 2005;1062:1-12. 10. Zinzani PL. The many faces of marginal zone lymphoma. Hematology / the Education Program of the American Society of Hematology American Society of Hematology Education Program 2012;2012:426-32. 11. Stevenson FK, Sahota SS, Ottensmeier CH, Zhu D, Forconi F, Hamblin TJ. The occurrence and significance of V gene mutations in B cell-derived human malignancy. Advances in cancer research 2001;83:81-116. 12. Dunn-Walters D, Thiede C, Alpen B, Spencer J. Somatic hypermutation and B-cell lymphoma. Philosophical transactions of the Royal Society of London Series B, Biological sciences 2001;356:73-82. 13. Agathangelidis A, Darzentas N, Hadzidimitriou A, et al. Stereotyped B-cell receptors in one-third of chronic lymphocytic leukemia: a molecular classification with implications for targeted therapies. Blood 2012;119:4467-75. 14. Marti GE, Rawstron AC, Ghia P, et al. Diagnostic criteria for monoclonal B-cell lymphocytosis. Br J Haematol 2005;130:325-32. 15. Nieto WG, Almeida J, Romero A, et al. Increased frequency (12%) of circulating chronic lymphocytic leukemia-like B-cell clones in healthy subjects using a highly sensitive multicolor flow cytometry approach. Blood 2009;114:33-7. 16. Rawstron AC, Bennett FL, O'Connor SJ, et al. Monoclonal B-cell lymphocytosis and chronic lymphocytic leukemia. The New England journal of medicine 2008;359:575-83. 17. Rawstron AC, Shanafelt T, Lanasa MC, et al. Different biology and clinical outcome according to the absolute numbers of clonal B-cells in monoclonal B-cell lymphocytosis (MBL). Cytometry Part B, Clinical cytometry 2010;78 Suppl 1:S19-23. 18. Shanafelt TD, Kay NE, Rabe KG, et al. Brief report: natural history of individuals with clinically recognized monoclonal B-cell lymphocytosis compared with patients with Rai 0 chronic lymphocytic leukemia. Journal of clinical oncology : official journal of the American Society of Clinical Oncology 2009;27:3959-63. 19. Almeida J, Nieto WG, Teodosio C, et al. CLL-like B-lymphocytes are systematically present at very low numbers in peripheral blood of healthy adults. Leukemia 2011;25:718-22. 20. Lanasa MC, Allgood SD, Volkheimer AD, et al. Single-cell analysis reveals oligoclonality among 'low-count' monoclonal B-cell lymphocytosis. Leukemia 2010;24:133-40.

134
Chapter 6 REFERENCES
21. Sanchez ML, Almeida J, Gonzalez D, et al. Incidence and clinicobiologic characteristics of leukemic B-cell chronic lymphoproliferative disorders with more than one B-cell clone. Blood 2003;102:2994-3002. 22. Chiorazzi N, Ferrarini M. Cellular origin(s) of chronic lymphocytic leukemia: cautionary notes and additional considerations and possibilities. Blood 2011;117:1781-91. 23. Hadzidimitriou A, Agathangelidis A, Darzentas N, et al. Is there a role for antigen selection in mantle cell lymphoma? Immunogenetic support from a series of 807 cases. Blood 2011;118:3088-95. 24. Lenze D, Berg E, Volkmer-Engert R, et al. Influence of antigen on the development of MALT lymphoma. Blood 2006;107:1141-8. 25. Liu W, Sohn HW, Tolar P, Pierce SK. It's all about change: the antigen-driven initiation of B-cell receptor signaling. Cold Spring Harb Perspect Biol 2010;2:a002295. 26. Kirkham PM, Schroeder HW, Jr. Antibody structure and the evolution of immunoglobulin V gene segments. Semin Immunol 1994;6:347-60. 27. Gabrielli E, Pericolini E, Cenci E, et al. Antibody complementarity-determining regions (CDRs): a bridge between adaptive and innate immunity. PLoS One 2009;4:e8187. 28. Zakharova ES, Kazilo NA, Stefanov DN, Sinitsina MN, Kovrigina AM. [Genetic bases of diversity of the repertoire of immunoglobulins in application to diagnostics of clonality of B-cell lymphoid populations]. Genetika 2011;47:752-64. 29. Leavy O. B cells: Selecting the best, without BCR signalling. Nat Rev Immunol 2012;12:398-9. 30. Pierce SK, Liu W. The tipping points in the initiation of B cell signalling: how small changes make big differences. Nat Rev Immunol 2010;10:767-77. 31. Rickert RC. New insights into pre-BCR and BCR signalling with relevance to B cell malignancies. Nat Rev Immunol 2013;13:578-91. 32. Young RM, Staudt LM. Targeting pathological B cell receptor signalling in lymphoid malignancies. Nat Rev Drug Discov 2013;12:229-43. 33. Wang X, Wu D, Zheng S, et al. Ab-origin: an enhanced tool to identify the sourcing gene segments in germline for rearranged antibodies. BMC Bioinformatics 2008;9 Suppl 12:S20. 34. Schroeder HW, Jr., Cavacini L. Structure and function of immunoglobulins. J Allergy Clin Immunol 2010;125:S41-52. 35. Barak M, Eilat G, Unger R, Mehr R. Factors important in evolutionary shaping of immunoglobulin gene loci. Immunome Res 2010;6:13. 36. Pascual V, Capra JD. Human immunoglobulin heavy-chain variable region genes: organization, polymorphism, and expression. Advances in immunology 1991;49:1-74. 37. Kodaira M, Kinashi T, Umemura I, et al. Organization and evolution of variable region genes of the human immunoglobulin heavy chain. Journal of molecular biology 1986;190:529-41. 38. Lee KH, Matsuda F, Kinashi T, Kodaira M, Honjo T. A novel family of variable region genes of the human immunoglobulin heavy chain. Journal of molecular biology 1987;195:761-8. 39. Schroeder HW, Jr., Hillson JL, Perlmutter RM. Structure and evolution of mammalian VH families. International immunology 1990;2:41-50. 40. Kirkham PM, Mortari F, Newton JA, Schroeder HW, Jr. Immunoglobulin VH clan and family identity predicts variable domain structure and may influence antigen binding. The EMBO journal 1992;11:603-9. 41. Ota T, Nei M. Divergent evolution and evolution by the birth-and-death process in the immunoglobulin VH gene family. Molecular biology and evolution 1994;11:469-82. 42. Rothenfluh HS, Blanden RV, Steele EJ. Evolution of V genes: DNA sequence structure of functional germline genes and pseudogenes. Immunogenetics 1995;42:159-71. 43. Ghaffari SH, Lobb CJ. Heavy chain variable region gene families evolved early in phylogeny. Ig complexity in fish. Journal of immunology 1991;146:1037-46.

135
Chapter 6 REFERENCES
44. Perlmutter RM, Kearney JF, Chang SP, Hood LE. Developmentally controlled expression of immunoglobulin VH genes. Science 1985;227:1597-601. 45. Booker JK, Haughton G. Mechanisms that limit the diversity of antibodies. II. Evolutionary conservation of Ig variable region genes which encode naturally occurring autoantibodies. International immunology 1994;6:1427-36. 46. Vargas-Madrazo E, Lara-Ochoa F, Jimenez-Montano M. A skewed distribution of amino acids at recognition sites of the hypervariable region of immunoglobulins. Journal of molecular evolution 1994;38:100-4. 47. Tomlinson IM, Walter G, Jones PT, Dear PH, Sonnhammer EL, Winter G. The imprint of somatic hypermutation on the repertoire of human germline V genes. Journal of molecular biology 1996;256:813-17. 48. Andersson E, Matsunaga T. Evolution of immunoglobulin heavy chain variable region genes: a VH family can last for 150-200 million years or longer. Immunogenetics 1995;41:18-28. 49. Davies JM, Platts-Mills TA, Aalberse RC. The enigma of IgE+ B-cell memory in human subjects. J Allergy Clin Immunol 2013;131:972-6. 50. Hsu E, Pulham N, Rumfelt LL, Flajnik MF. The plasticity of immunoglobulin gene systems in evolution. Immunol Rev 2006;210:8-26. 51. Rada C, Milstein C. The intrinsic hypermutability of antibody heavy and light chain genes decays exponentially. EMBO J 2001;20:4570-6. 52. Odegard VH, Schatz DG. Targeting of somatic hypermutation. Nat Rev Immunol 2006;6:573-83. 53. Ohm-Laursen L, Larsen SR, Barington T. Identification of two new alleles, IGHV3-23*04 and IGHJ6*04, and the complete sequence of the IGHV3-h pseudogene in the human immunoglobulin locus and their prevalences in Danish Caucasians. Immunogenetics 2005;57:621-7. 54. Wang Y, Jackson KJ, Sewell WA, Collins AM. Many human immunoglobulin heavy-chain IGHV gene polymorphisms have been reported in error. Immunol Cell Biol 2008;86:111-5. 55. Wang Y, Jackson KJ, Gaeta B, et al. Genomic screening by 454 pyrosequencing identifies a new human IGHV gene and sixteen other new IGHV allelic variants. Immunogenetics 2011;63:259-65. 56. Watson CT, Steinberg KM, Huddleston J, et al. Complete haplotype sequence of the human immunoglobulin heavy-chain variable, diversity, and joining genes and characterization of allelic and copy-number variation. Am J Hum Genet 2013;92:530-46. 57. Corbett SJ, Tomlinson IM, Sonnhammer EL, Buck D, Winter G. Sequence of the human immunoglobulin diversity (D) segment locus: a systematic analysis provides no evidence for the use of DIR segments, inverted D segments, "minor" D segments or D-D recombination. J Mol Biol 1997;270:587-97. 58. Brezinschek HP, Brezinschek RI, Lipsky PE. Analysis of the heavy chain repertoire of human peripheral B cells using single-cell polymerase chain reaction. J Immunol 1995;155:190-202. 59. Boyd SD, Gaeta BA, Jackson KJ, et al. Individual variation in the germline Ig gene repertoire inferred from variable region gene rearrangements. J Immunol 2010;184:6986-92. 60. Glanville J, Kuo TC, von Budingen HC, et al. Naive antibody gene-segment frequencies are heritable and unaltered by chronic lymphocyte ablation. Proc Natl Acad Sci U S A 2011;108:20066-71. 61. Briney BS, Willis JR, McKinney BA, Crowe JE, Jr. High-throughput antibody sequencing reveals genetic evidence of global regulation of the naive and memory repertoires that extends across individuals. Genes Immun 2012;13:469-73. 62. Jackson KJ, Kidd MJ, Wang Y, Collins AM. The shape of the lymphocyte receptor repertoire: lessons from the B cell receptor. Frontiers in immunology 2013;4:263.

136
Chapter 6 REFERENCES
63. Yamada M, Wasserman R, Reichard BA, Shane S, Caton AJ, Rovera G. Preferential utilization of specific immunoglobulin heavy chain diversity and joining segments in adult human peripheral blood B lymphocytes. The Journal of experimental medicine 1991;173:395-407. 64. Volpe JM, Kepler TB. Large-scale analysis of human heavy chain V(D)J recombination patterns. Immunome research 2008;4:3. 65. Lee CE, Jackson KJ, Sewell WA, Collins AM. Use of IGHJ and IGHD gene mutations in analysis of immunoglobulin sequences for the prognosis of chronic lymphocytic leukemia. Leuk Res 2007;31:1247-52. 66. Stamatopoulos K, Belessi C, Hadzidimitriou A, et al. Immunoglobulin light chain repertoire in chronic lymphocytic leukemia. Blood 2005;106:3575-83. 67. Ignatovich O, Tomlinson IM, Jones PT, Winter G. The creation of diversity in the human immunoglobulin V(lambda) repertoire. Journal of molecular biology 1997;268:69-77. 68. Vasicek TJ, Leder P. Structure and expression of the human immunoglobulin lambda genes. J Exp Med 1990;172:609-20. 69. Farner NL, Dorner T, Lipsky PE. Molecular mechanisms and selection influence the generation of the human V lambda J lambda repertoire. Journal of immunology 1999;162:2137-45. 70. Nadel B, Tang A, Escuro G, Lugo G, Feeney AJ. Sequence of the spacer in the recombination signal sequence affects V(D)J rearrangement frequency and correlates with nonrandom Vkappa usage in vivo. J Exp Med 1998;187:1495-503. 71. Feeney AJ, Tang A, Ogwaro KM. B-cell repertoire formation: role of the recombination signal sequence in non-random V segment utilization. Immunol Rev 2000;175:59-69. 72. Wei Z, Lieber MR. Lymphoid V(D)J recombination. Functional analysis of the spacer sequence within the recombination signal. J Biol Chem 1993;268:3180-3. 73. Boyd SD, Marshall EL, Merker JD, et al. Measurement and clinical monitoring of human lymphocyte clonality by massively parallel VDJ pyrosequencing. Sci Transl Med 2009;1:12ra23. 74. De Preval C, Fougereau M. Specific interaction between VH and VL regions of human monoclonal immunoglobulins. J Mol Biol 1976;102:657-78. 75. Brezinschek HP, Foster SJ, Dorner T, Brezinschek RI, Lipsky PE. Pairing of variable heavy and variable kappa chains in individual naive and memory B cells. Journal of immunology 1998;160:4762-7. 76. de Wildt RM, Hoet RM, van Venrooij WJ, Tomlinson IM, Winter G. Analysis of heavy and light chain pairings indicates that receptor editing shapes the human antibody repertoire. Journal of molecular biology 1999;285:895-901. 77. DeKosky BJ, Ippolito GC, Deschner RP, et al. High-throughput sequencing of the paired human immunoglobulin heavy and light chain repertoire. Nat Biotechnol 2013;31:166-9. 78. Cabaniols JP, Fazilleau N, Casrouge A, Kourilsky P, Kanellopoulos JM. Most alpha/beta T cell receptor diversity is due to terminal deoxynucleotidyl transferase. J Exp Med 2001;194:1385-90. 79. Hofle M, Linthicum DS, Ioerger T. Analysis of diversity of nucleotide and amino acid distributions in the VD and DJ joining regions in Ig heavy chains. Mol Immunol 2000;37:827-35. 80. Murugan A, Mora T, Walczak AM, Callan CG, Jr. Statistical inference of the generation probability of T-cell receptors from sequence repertoires. Proc Natl Acad Sci U S A 2012;109:16161-6. 81. Gauss GH, Lieber MR. Mechanistic constraints on diversity in human V(D)J recombination. Mol Cell Biol 1996;16:258-69. 82. Jackson KJ, Gaeta B, Sewell W, Collins AM. Exonuclease activity and P nucleotide addition in the generation of the expressed immunoglobulin repertoire. BMC Immunol 2004;5:19. 83. Boubnov NV, Wills ZP, Weaver DT. V(D)J recombination coding junction formation without DNA homology: processing of coding termini. Mol Cell Biol 1993;13:6957-68.

137
Chapter 6 REFERENCES
84. Nadel B, Feeney AJ. Influence of coding-end sequence on coding-end processing in V(D)J recombination. J Immunol 1995;155:4322-9. 85. Nagasawa T. Microenvironmental niches in the bone marrow required for B-cell development. Nature reviews Immunology 2006;6:107-16. 86. Allen CD, Okada T, Cyster JG. Germinal-center organization and cellular dynamics. Immunity 2007;27:190-202. 87. Vinuesa CG, Sanz I, Cook MC. Dysregulation of germinal centres in autoimmune disease. Nat Rev Immunol 2009;9:845-57. 88. Perez-Andres M, Paiva B, Nieto WG, et al. Human peripheral blood B-cell compartments: a crossroad in B-cell traffic. Cytometry Part B, Clinical cytometry 2010;78 Suppl 1:S47-60. 89. Gellert M. V(D)J recombination: RAG proteins, repair factors, and regulation. Annu Rev Biochem 2002;71:101-32. 90. Ghia P, ten Boekel E, Sanz E, de la Hera A, Rolink A, Melchers F. Ordering of human bone marrow B lymphocyte precursors by single-cell polymerase chain reaction analyses of the rearrangement status of the immunoglobulin H and L chain gene loci. The Journal of experimental medicine 1996;184:2217-29. 91. Ghia P, ten Boekel E, Rolink AG, Melchers F. B-cell development: a comparison between mouse and man. Immunology today 1998;19:480-5. 92. Ehlich A, Schaal S, Gu H, Kitamura D, Muller W, Rajewsky K. Immunoglobulin heavy and light chain genes rearrange independently at early stages of B cell development. Cell 1993;72:695-704. 93. Novobrantseva TI, Martin VM, Pelanda R, Muller W, Rajewsky K, Ehlich A. Rearrangement and expression of immunoglobulin light chain genes can precede heavy chain expression during normal B cell development in mice. The Journal of experimental medicine 1999;189:75-88. 94. Meffre E, Milili M, Blanco-Betancourt C, Antunes H, Nussenzweig MC, Schiff C. Immunoglobulin heavy chain expression shapes the B cell receptor repertoire in human B cell development. The Journal of clinical investigation 2001;108:879-86. 95. Nutt SL, Heavey B, Rolink AG, Busslinger M. Commitment to the B-lymphoid lineage depends on the transcription factor Pax5. Nature 1999;401:556-62. 96. Allman D, Li J, Hardy RR. Commitment to the B lymphoid lineage occurs before DH-JH recombination. J Exp Med 1999;189:735-40. 97. Hardy RR, Carmack CE, Shinton SA, Kemp JD, Hayakawa K. Resolution and characterization of pro-B and pre-pro-B cell stages in normal mouse bone marrow. J Exp Med 1991;173:1213-25. 98. Nagata K, Nakamura T, Kitamura F, et al. The Ig alpha/Igbeta heterodimer on mu-negative proB cells is competent for transducing signals to induce early B cell differentiation. Immunity 1997;7:559-70. 99. Bain G, Maandag EC, Izon DJ, et al. E2A proteins are required for proper B cell development and initiation of immunoglobulin gene rearrangements. Cell 1994;79:885-92. 100. Lin H, Grosschedl R. Failure of B-cell differentiation in mice lacking the transcription factor EBF. Nature 1995;376:263-7. 101. Sigvardsson M, O'Riordan M, Grosschedl R. EBF and E47 collaborate to induce expression of the endogenous immunoglobulin surrogate light chain genes. Immunity 1997;7:25-36. 102. Kee BL, Murre C. Induction of early B cell factor (EBF) and multiple B lineage genes by the basic helix-loop-helix transcription factor E12. J Exp Med 1998;188:699-713. 103. O'Riordan M, Grosschedl R. Coordinate regulation of B cell differentiation by the transcription factors EBF and E2A. Immunity 1999;11:21-31. 104. Souabni A, Cobaleda C, Schebesta M, Busslinger M. Pax5 promotes B lymphopoiesis and blocks T cell development by repressing Notch1. Immunity 2002;17:781-93.

138
Chapter 6 REFERENCES
105. Schebesta M, Pfeffer PL, Busslinger M. Control of pre-BCR signaling by Pax5-dependent activation of the BLNK gene. Immunity 2002;17:473-85. 106. Miller JP, Izon D, DeMuth W, Gerstein R, Bhandoola A, Allman D. The earliest step in B lineage differentiation from common lymphoid progenitors is critically dependent upon interleukin 7. J Exp Med 2002;196:705-11. 107. Corcoran AE, Riddell A, Krooshoop D, Venkitaraman AR. Impaired immunoglobulin gene rearrangement in mice lacking the IL-7 receptor. Nature 1998;391:904-7. 108. Billips LG, Nunez CA, Bertrand FE, 3rd, et al. Immunoglobulin recombinase gene activity is modulated reciprocally by interleukin 7 and CD19 in B cell progenitors. J Exp Med 1995;182:973-82. 109. Papavasiliou F, Misulovin Z, Suh H, Nussenzweig MC. The role of Ig beta in precursor B cell transition and allelic exclusion. Science 1995;268:408-11. 110. Rolink AG, Winkler T, Melchers F, Andersson J. Precursor B cell receptor-dependent B cell proliferation and differentiation does not require the bone marrow or fetal liver environment. J Exp Med 2000;191:23-32. 111. Marshall AJ, Fleming HE, Wu GE, Paige CJ. Modulation of the IL-7 dose-response threshold during pro-B cell differentiation is dependent on pre-B cell receptor expression. J Immunol 1998;161:6038-45. 112. Stoddart A, Fleming HE, Paige CJ. The role of the preBCR, the interleukin-7 receptor, and homotypic interactions during B-cell development. Immunol Rev 2000;175:47-58. 113. Rajewsky K. Clonal selection and learning in the antibody system. Nature 1996;381:751-8. 114. Chen C, Radic MZ, Erikson J, et al. Deletion and editing of B cells that express antibodies to DNA. J Immunol 1994;152:1970-82. 115. Wang LD, Clark MR. B-cell antigen-receptor signalling in lymphocyte development. Immunology 2003;110:411-20. 116. Glynne R, Ghandour G, Rayner J, Mack DH, Goodnow CC. B-lymphocyte quiescence, tolerance and activation as viewed by global gene expression profiling on microarrays. Immunol Rev 2000;176:216-46. 117. Hardy RR, Hayakawa K. B cell development pathways. Annu Rev Immunol 2001;19:595-621. 118. Herzog S, Reth M, Jumaa H. Regulation of B-cell proliferation and differentiation by pre-B-cell receptor signalling. Nat Rev Immunol 2009;9:195-205. 119. Wardemann H, Yurasov S, Schaefer A, Young JW, Meffre E, Nussenzweig MC. Predominant autoantibody production by early human B cell precursors. Science 2003;301:1374-7. 120. Schmidlin H, Diehl SA, Blom B. New insights into the regulation of human B-cell differentiation. Trends Immunol 2009;30:277-85. 121. Sims GP, Ettinger R, Shirota Y, Yarboro CH, Illei GG, Lipsky PE. Identification and characterization of circulating human transitional B cells. Blood 2005;105:4390-8. 122. Cuss AK, Avery DT, Cannons JL, et al. Expansion of functionally immature transitional B cells is associated with human-immunodeficient states characterized by impaired humoral immunity. Journal of immunology 2006;176:1506-16. 123. Lee J, Kuchen S, Fischer R, Chang S, Lipsky PE. Identification and characterization of a human CD5+ pre-naive B cell population. Journal of immunology 2009;182:4116-26. 124. Suryani S, Fulcher DA, Santner-Nanan B, et al. Differential expression of CD21 identifies developmentally and functionally distinct subsets of human transitional B cells. Blood 2010;115:519-29. 125. Marie-Cardine A, Divay F, Dutot I, et al. Transitional B cells in humans: characterization and insight from B lymphocyte reconstitution after hematopoietic stem cell transplantation. Clin Immunol 2008;127:14-25.

139
Chapter 6 REFERENCES
126. Carter RH, Fearon DT. CD19: lowering the threshold for antigen receptor stimulation of B lymphocytes. Science 1992;256:105-7. 127. Fearon DT, Carroll MC. Regulation of B lymphocyte responses to foreign and self-antigens by the CD19/CD21 complex. Annual review of immunology 2000;18:393-422. 128. van Zelm MC, Szczepanski T, van der Burg M, van Dongen JJ. Replication history of B lymphocytes reveals homeostatic proliferation and extensive antigen-induced B cell expansion. The Journal of experimental medicine 2007;204:645-55. 129. Fagarasan S, Honjo T. T-Independent immune response: new aspects of B cell biology. Science 2000;290:89-92. 130. Delgado MF, Coviello S, Monsalvo AC, et al. Lack of antibody affinity maturation due to poor Toll-like receptor stimulation leads to enhanced respiratory syncytial virus disease. Nature medicine 2009;15:34-41. 131. Weller S, Faili A, Garcia C, et al. CD40-CD40L independent Ig gene hypermutation suggests a second B cell diversification pathway in humans. Proceedings of the National Academy of Sciences of the United States of America 2001;98:1166-70. 132. Cerutti A. The regulation of IgA class switching. Nature reviews Immunology 2008;8:421-34. 133. Weill JC, Weller S, Reynaud CA. Human marginal zone B cells. Annual review of immunology 2009;27:267-85. 134. He B, Santamaria R, Xu W, et al. The transmembrane activator TACI triggers immunoglobulin class switching by activating B cells through the adaptor MyD88. Nature immunology 2010;11:836-45. 135. He B, Xu W, Santini PA, et al. Intestinal bacteria trigger T cell-independent immunoglobulin A(2) class switching by inducing epithelial-cell secretion of the cytokine APRIL. Immunity 2007;26:812-26. 136. Muramatsu M, Kinoshita K, Fagarasan S, Yamada S, Shinkai Y, Honjo T. Class switch recombination and hypermutation require activation-induced cytidine deaminase (AID), a potential RNA editing enzyme. Cell 2000;102:553-63. 137. Dorner T, Foster SJ, Farner NL, Lipsky PE. Somatic hypermutation of human immunoglobulin heavy chain genes: targeting of RGYW motifs on both DNA strands. European journal of immunology 1998;28:3384-96. 138. Pham P, Bransteitter R, Petruska J, Goodman MF. Processive AID-catalysed cytosine deamination on single-stranded DNA simulates somatic hypermutation. Nature 2003;424:103-7. 139. Yu K, Huang FT, Lieber MR. DNA substrate length and surrounding sequence affect the activation-induced deaminase activity at cytidine. The Journal of biological chemistry 2004;279:6496-500. 140. Kepler TB. Codon bias and plasticity in immunoglobulins. Molecular biology and evolution 1997;14:637-43. 141. Shapiro GS, Wysocki LJ. DNA target motifs of somatic mutagenesis in antibody genes. Critical reviews in immunology 2002;22:183-200. 142. Bose B, Sinha S. Problems in using statistical analysis of replacement and silent mutations in antibody genes for determining antigen-driven affinity selection. Immunology 2005;116:172-83. 143. Hendrickson BA, Conner DA, Ladd DJ, et al. Altered hepatic transport of immunoglobulin A in mice lacking the J chain. The Journal of experimental medicine 1995;182:1905-11. 144. Brewer JW, Randall TD, Parkhouse RM, Corley RB. IgM hexamers? Immunology today 1994;15:165-8. 145. Bruggemann M, Williams GT, Bindon CI, et al. Comparison of the effector functions of human immunoglobulins using a matched set of chimeric antibodies. The Journal of experimental medicine 1987;166:1351-61.

140
Chapter 6 REFERENCES
146. Brewer JW, Randall TD, Parkhouse RM, Corley RB. Mechanism and subcellular localization of secretory IgM polymer assembly. The Journal of biological chemistry 1994;269:17338-48. 147. Mistry D, Stockley RA. IgA1 protease. The international journal of biochemistry & cell biology 2006;38:1244-8. 148. Kawakami T, Galli SJ. Regulation of mast-cell and basophil function and survival by IgE. Nature reviews Immunology 2002;2:773-86. 149. Pritchard NR, Smith KG. B cell inhibitory receptors and autoimmunity. Immunology 2003;108:263-73. 150. van der Vuurst de Vries AR, Clevers H, Logtenberg T, Meyaard L. Leukocyte-associated immunoglobulin-like receptor-1 (LAIR-1) is differentially expressed during human B cell differentiation and inhibits B cell receptor-mediated signaling. European journal of immunology 1999;29:3160-7. 151. Yamazaki T, Nagumo H, Hayashi T, Sugane K, Agematsu K. CD72-mediated suppression of human naive B cell differentiation by down-regulating X-box binding protein 1. European journal of immunology 2005;35:2325-34. 152. Klein U, Rajewsky K, Kuppers R. Human immunoglobulin (Ig)M+IgD+ peripheral blood B cells expressing the CD27 cell surface antigen carry somatically mutated variable region genes: CD27 as a general marker for somatically mutated (memory) B cells. The Journal of experimental medicine 1998;188:1679-89. 153. Tangye SG, Liu YJ, Aversa G, Phillips JH, de Vries JE. Identification of functional human splenic memory B cells by expression of CD148 and CD27. The Journal of experimental medicine 1998;188:1691-703. 154. Berkowska MA, Heeringa JJ, Hajdarbegovic E, et al. Human IgE B cells are derived from T cell-dependent and T cell-independent pathways. The Journal of allergy and clinical immunology 2014. 155. Erazo A, Kutchukhidze N, Leung M, et al. Unique maturation program of the IgE response in vivo. Immunity 2007;26:191-203. 156. Achatz-Straussberger G, Zaborsky N, Konigsberger S, et al. Limited humoral immunoglobulin E memory influences serum immunoglobulin E levels in blood. Clin Exp Allergy 2009;39:1307-13. 157. Weston-Bell N, Townsend M, Di Genova G, Forconi F, Sahota SS. Defining origins of malignant B cells: a new circulating normal human IgM(+)D(+) B-cell subset lacking CD27 expression and displaying somatically mutated IGHV genes as a relevant memory population. Leukemia 2009;23:2075-80. 158. Berkowska MA, Driessen GJ, Bikos V, et al. Human memory B cells originate from three distinct germinal center-dependent and -independent maturation pathways. Blood 2011;118:2150-8. 159. Weller S, Braun MC, Tan BK, et al. Human blood IgM "memory" B cells are circulating splenic marginal zone B cells harboring a prediversified immunoglobulin repertoire. Blood 2004;104:3647-54. 160. Berkowska MA, Driessen GJ, Bikos V, et al. Human memory B cells originate from three distinct germinal center-dependent and -independent maturation pathways. Blood;118:2150-8. 161. Seifert M, Kuppers R. Molecular footprints of a germinal center derivation of human IgM+(IgD+)CD27+ B cells and the dynamics of memory B cell generation. The Journal of experimental medicine 2009;206:2659-69. 162. Zheng NY, Wilson K, Wang X, et al. Human immunoglobulin selection associated with class switch and possible tolerogenic origins for C delta class-switched B cells. The Journal of clinical investigation 2004;113:1188-201.

141
Chapter 6 REFERENCES
163. Wilson PC, Wilson K, Liu YJ, Banchereau J, Pascual V, Capra JD. Receptor revision of immunoglobulin heavy chain variable region genes in normal human B lymphocytes. J Exp Med 2000;191:1881-94. 164. van der Burg M, Bende RJ, Aarts WM, Langerak AW, van Dongen JJ, van Noesel CJ. Biased Iglambda expression in hypermutated IgD multiple myelomas does not result from receptor revision. Leukemia 2002;16:1358-61. 165. Seifert M, Steimle-Grauer SA, Goossens T, Hansmann ML, Brauninger A, Kuppers R. A model for the development of human IgD-only B cells: Genotypic analyses suggest their generation in superantigen driven immune responses. Mol Immunol 2009;46:630-9. 166. Fecteau JF, Cote G, Neron S. A new memory CD27-IgG+ B cell population in peripheral blood expressing VH genes with low frequency of somatic mutation. Journal of immunology 2006;177:3728-36. 167. Wei C, Anolik J, Cappione A, et al. A new population of cells lacking expression of CD27 represents a notable component of the B cell memory compartment in systemic lupus erythematosus. Journal of immunology 2007;178:6624-33. 168. Caraux A, Klein B, Paiva B, et al. Circulating human B and plasma cells. Age-associated changes in counts and detailed characterization of circulating normal CD138- and CD138+ plasma cells. Haematologica 2010;95:1016-20. 169. Rozanski CH, Arens R, Carlson LM, et al. Sustained antibody responses depend on CD28 function in bone marrow-resident plasma cells. The Journal of experimental medicine 2011;208:1435-46. 170. Mei HE, Yoshida T, Sime W, et al. Blood-borne human plasma cells in steady state are derived from mucosal immune responses. Blood 2009;113:2461-9. 171. Brandtzaeg P, Johansen FE. Mucosal B cells: phenotypic characteristics, transcriptional regulation, and homing properties. Immunological reviews 2005;206:32-63. 172. Chen K, Xu W, Wilson M, et al. Immunoglobulin D enhances immune surveillance by activating antimicrobial, proinflammatory and B cell-stimulating programs in basophils. Nature immunology 2009;10:889-98. 173. Balague Ponz O, Ott G, Hasserjian RP, Elenitoba-Johnson KS, de Leval L, de Jong D. Commentary on the WHO classification of tumors of lymphoid tissues (2008): aggressive B-cell lymphomas. J Hematop 2009;2:83-7. 174. Seto M. Genetic and epigenetic factors involved in B-cell lymphomagenesis. Cancer Sci 2004;95:704-10. 175. Klein U, Dalla-Favera R. New insights into the pathogenesis of chronic lymphocytic leukemia. Semin Cancer Biol 2010;20:377-83. 176. Kroft SH. Role of flow cytometry in pediatric hematopathology. Am J Clin Pathol 2004;122 Suppl:S19-32. 177. Craig FE, Foon KA. Flow cytometric immunophenotyping for hematologic neoplasms. Blood 2008;111:3941-67. 178. Ray S, Craig FE, Swerdlow SH. Abnormal patterns of antigenic expression in follicular lymphoma: a flow cytometric study. Am J Clin Pathol 2005;124:576-83. 179. Heel K, Tabone T, Rohrig KJ, et al. Developments in the immunophenotypic analysis of haematological malignancies. Blood Rev 2013;27:193-207. 180. Swerdlow SHCE, Harris, N.L., Jaffe, E.S., Pileri, S.A., Stein, H., Thiele, J. et al. . WHO classidication of tumour of haematopoietic and lymphoid tissues 2008. 181. Campo E, Swerdlow SH, Harris NL, Pileri S, Stein H, Jaffe ES. The 2008 WHO classification of lymphoid neoplasms and beyond: evolving concepts and practical applications. Blood 2011;117:5019-32. 182. Rawstron AC, Green MJ, Kuzmicki A, et al. Monoclonal B lymphocytes with the characteristics of "indolent" chronic lymphocytic leukemia are present in 3.5% of adults with normal blood counts. Blood 2002;100:635-9.

142
Chapter 6 REFERENCES
183. Cong P, Raffeld M, Teruya-Feldstein J, Sorbara L, Pittaluga S, Jaffe ES. In situ localization of follicular lymphoma: description and analysis by laser capture microdissection. Blood 2002;99:3376-82. 184. Montes-Moreno S, Castro Y, Rodriguez-Pinilla SM, et al. Intrafollicular neoplasia/in situ follicular lymphoma: review of a series of 13 cases. Histopathology 2010;56:658-62. 185. Shanafelt TD, Ghia P, Lanasa MC, Landgren O, Rawstron AC. Monoclonal B-cell lymphocytosis (MBL): biology, natural history and clinical management. Leukemia 2010;24:512-20. 186. Ghia P, Prato G, Scielzo C, et al. Monoclonal CD5+ and CD5- B-lymphocyte expansions are frequent in the peripheral blood of the elderly. Blood 2004;103:2337-42. 187. Fazi C, Scarfo L, Pecciarini L, et al. General population low-count CLL-like MBL persists over time without clinical progression, although carrying the same cytogenetic abnormalities of CLL. Blood 2011;118:6618-25. 188. Amato D, Oscier DG, Davis Z, et al. Cytogenetic aberrations and immunoglobulin VH gene mutations in clinically benign CD5- monoclonal B-cell lymphocytosis. Am J Clin Pathol 2007;128:333-8. 189. Shim YK, Middleton DC, Caporaso NE, et al. Prevalence of monoclonal B-cell lymphocytosis: a systematic review. Cytometry Part B, Clinical cytometry 2010;78 Suppl 1:S10-8. 190. Marti GE, Carter P, Abbasi F, et al. B-cell monoclonal lymphocytosis and B-cell abnormalities in the setting of familial B-cell chronic lymphocytic leukemia. Cytometry Part B, Clinical cytometry 2003;52:1-12. 191. Rawstron AC, Yuille MR, Fuller J, et al. Inherited predisposition to CLL is detectable as subclinical monoclonal B-lymphocyte expansion. Blood 2002;100:2289-90. 192. Nieto WG, Teodosio C, Lopez A, et al. Non-CLL-like monoclonal B-cell lymphocytosis in the general population: prevalence and phenotypic/genetic characteristics. Cytometry Part B, Clinical cytometry 2010;78 Suppl 1:S24-34. 193. Nieto WG, Almeida J, Teodosio C, et al. Commentary: Comparison of current flow cytometry methods for monoclonal B cell lymphocytosis detection. Cytometry Part B, Clinical cytometry 2010;78 Suppl 1:S4-9. 194. Frasca D, Diaz A, Romero M, Landin AM, Blomberg BB. Age effects on B cells and humoral immunity in humans. Ageing Res Rev 2011;10:330-5. 195. Klinman NR, Kline GH. The B-cell biology of aging. Immunol Rev 1997;160:103-14. 196. LeMaoult J, Szabo P, Weksler ME. Effect of age on humoral immunity, selection of the B-cell repertoire and B-cell development. Immunol Rev 1997;160:115-26. 197. Korde N, Kristinsson SY, Landgren O. Monoclonal gammopathy of undetermined significance (MGUS) and smoldering multiple myeloma (SMM): novel biological insights and development of early treatment strategies. Blood 2011;117:5573-81. 198. Landgren O, Kyle RA, Pfeiffer RM, et al. Monoclonal gammopathy of undetermined significance (MGUS) consistently precedes multiple myeloma: a prospective study. Blood 2009;113:5412-7. 199. Weiss BM, Abadie J, Verma P, Howard RS, Kuehl WM. A monoclonal gammopathy precedes multiple myeloma in most patients. Blood 2009;113:5418-22. 200. Kyle RA, Therneau TM, Rajkumar SV, et al. Prevalence of monoclonal gammopathy of undetermined significance. The New England journal of medicine 2006;354:1362-9. 201. Colombatti A, Doliana R, Schiappacassi M, et al. Age-related persistent clonal expansions of CD28(-) cells: phenotypic and molecular TCR analysis reveals both CD4(+) and CD4(+)CD8(+) cells with identical CDR3 sequences. Clin Immunol Immunopathol 1998;89:61-70. 202. Ghia P, Prato G, Stella S, Scielzo C, Geuna M, Caligaris-Cappio F. Age-dependent accumulation of monoclonal CD4+CD8+ double positive T lymphocytes in the peripheral blood of the elderly. British journal of haematology 2007;139:780-90.

143
Chapter 6 REFERENCES
203. Dagklis A, Fazi C, Sala C, et al. The immunoglobulin gene repertoire of low-count chronic lymphocytic leukemia (CLL)-like monoclonal B lymphocytosis is different from CLL: diagnostic implications for clinical monitoring. Blood 2009;114:26-32. 204. Casabonne D, Almeida J, Nieto WG, et al. Common infectious agents and monoclonal B-cell lymphocytosis: a cross-sectional epidemiological study among healthy adults. PloS one 2012;7:e52808. 205. Scarfo L, Zibellini S, Tedeschi A, et al. Impact of B-cell count and imaging screening in cMBL: any need to revise the current guidelines? Leukemia 2012;26:1703-7. 206. Kern W, Bacher U, Haferlach C, et al. Monoclonal B-cell lymphocytosis is closely related to chronic lymphocytic leukaemia and may be better classified as early-stage CLL. British journal of haematology 2012;157:86-96. 207. Avet-Loiseau H, Facon T, Grosbois B, et al. Oncogenesis of multiple myeloma: 14q32 and 13q chromosomal abnormalities are not randomly distributed, but correlate with natural history, immunological features, and clinical presentation. Blood 2002;99:2185-91. 208. Fonseca R, Bailey RJ, Ahmann GJ, et al. Genomic abnormalities in monoclonal gammopathy of undetermined significance. Blood 2002;100:1417-24. 209. Schuler F, Dolken L, Hirt C, et al. Prevalence and frequency of circulating t(14;18)-MBR translocation carrying cells in healthy individuals. International journal of cancer Journal international du cancer 2009;124:958-63. 210. Weinberg JB, Volkheimer AD, Chen Y, et al. Clinical and molecular predictors of disease severity and survival in chronic lymphocytic leukemia. Am J Hematol 2007;82:1063-70. 211. Krober A, Seiler T, Benner A, et al. V(H) mutation status, CD38 expression level, genomic aberrations, and survival in chronic lymphocytic leukemia. Blood 2002;100:1410-6. 212. Landgren O, Albitar M, Ma W, et al. B-cell clones as early markers for chronic lymphocytic leukemia. The New England journal of medicine 2009;360:659-67. 213. Rawstron AC, Hillmen P. Clinical and diagnostic implications of monoclonal B-cell lymphocytosis. Best practice & research Clinical haematology 2010;23:61-9. 214. Rossi D, Sozzi E, Puma A, et al. The prognosis of clinical monoclonal B cell lymphocytosis differs from prognosis of Rai 0 chronic lymphocytic leukaemia and is recapitulated by biological risk factors. British journal of haematology 2009;146:64-75. 215. Palmer S, Hanson CA, Zent CS, et al. Prognostic importance of T and NK-cells in a consecutive series of newly diagnosed patients with chronic lymphocytic leukaemia. British journal of haematology 2008;141:607-14. 216. Hauswirth AW, Almeida J, Nieto WG, et al. Monoclonal B-cell lymphocytosis (MBL) with normal lymphocyte counts is associated with decreased numbers of normal circulating B-cell subsets. American journal of hematology 2012;87:721-4. 217. Palma M, Kokhaei P, Lundin J, Choudhury A, Mellstedt H, Osterborg A. The biology and treatment of chronic lymphocytic leukemia. Annals of oncology : official journal of the European Society for Medical Oncology / ESMO 2006;17 Suppl 10:x144-54. 218. Kostareli E, Smilevska T, Stamatopoulos K, Kouvatsi A, Anagnostopoulos A. Chronic lymphocytic leukaemia: an immunobiology approach. Srpski arhiv za celokupno lekarstvo 2008;136:319-23. 219. Caligaris-Cappio F, Hamblin TJ. B-cell chronic lymphocytic leukemia: a bird of a different feather. Journal of clinical oncology : official journal of the American Society of Clinical Oncology 1999;17:399-408. 220. Hallek M, Cheson BD, Catovsky D, et al. Guidelines for the diagnosis and treatment of chronic lymphocytic leukemia: a report from the International Workshop on Chronic Lymphocytic Leukemia updating the National Cancer Institute-Working Group 1996 guidelines. Blood 2008;111:5446-56. 221. Wierda WG, O'Brien S, Wang X, et al. Prognostic nomogram and index for overall survival in previously untreated patients with chronic lymphocytic leukemia. Blood 2007;109:4679-85.

144
Chapter 6 REFERENCES
222. Dohner H, Stilgenbauer S, Benner A, et al. Genomic aberrations and survival in chronic lymphocytic leukemia. The New England journal of medicine 2000;343:1910-6. 223. Stevenson FK, Krysov S, Davies AJ, Steele AJ, Packham G. B-cell receptor signaling in chronic lymphocytic leukemia. Blood 2011;118:4313-20. 224. Matutes E, Polliack A. Morphological and immunophenotypic features of chronic lymphocytic leukemia. Reviews in clinical and experimental hematology 2000;4:22-47. 225. Ginaldi L, De Martinis M, Matutes E, Farahat N, Morilla R, Catovsky D. Levels of expression of CD19 and CD20 in chronic B cell leukaemias. J Clin Pathol 1998;51:364-9. 226. Matutes E, Attygalle A, Wotherspoon A, Catovsky D. Diagnostic issues in chronic lymphocytic leukaemia (CLL). Best Pract Res Clin Haematol 2010;23:3-20. 227. Fais F, Ghiotto F, Hashimoto S, et al. Chronic lymphocytic leukemia B cells express restricted sets of mutated and unmutated antigen receptors. The Journal of clinical investigation 1998;102:1515-25. 228. Chiorazzi N, Rai KR, Ferrarini M. Chronic lymphocytic leukemia. The New England journal of medicine 2005;352:804-15. 229. Tobin G, Rosenquist R. Prognostic usage of V(H) gene mutation status and its surrogate markers and the role of antigen selection in chronic lymphocytic leukemia. Medical oncology 2005;22:217-28. 230. Duke VM, Gandini D, Sherrington PD, et al. V(H) gene usage differs in germline and mutated B-cell chronic lymphocytic leukemia. Haematologica 2003;88:1259-71. 231. Rene C, Prat N, Thuizat A, Broctawik M, Avinens O, Eliaou JF. Comprehensive characterization of immunoglobulin gene rearrangements in patients with chronic lymphocytic leukaemia. Journal of cellular and molecular medicine 2014. 232. Forconi F, Potter KN, Wheatley I, et al. The normal IGHV1-69-derived B-cell repertoire contains stereotypic patterns characteristic of unmutated CLL. Blood;115:71-7. 233. Messmer BT, Albesiano E, Efremov DG, et al. Multiple distinct sets of stereotyped antigen receptors indicate a role for antigen in promoting chronic lymphocytic leukemia. The Journal of experimental medicine 2004;200:519-25. 234. Widhopf GF, 2nd, Rassenti LZ, Toy TL, Gribben JG, Wierda WG, Kipps TJ. Chronic lymphocytic leukemia B cells of more than 1% of patients express virtually identical immunoglobulins. Blood 2004;104:2499-504. 235. Tobin G, Thunberg U, Karlsson K, et al. Subsets with restricted immunoglobulin gene rearrangement features indicate a role for antigen selection in the development of chronic lymphocytic leukemia. Blood 2004;104:2879-85. 236. Rossi D, Spina V, Bomben R, et al. Association between molecular lesions and specific B-cell receptor subsets in chronic lymphocytic leukemia. Blood 2013;121:4902-5. 237. Stamatopoulos K, Belessi C, Moreno C, et al. Over 20% of patients with chronic lymphocytic leukemia carry stereotyped receptors: Pathogenetic implications and clinical correlations. Blood 2007;109:259-70. 238. Ghiotto F, Fais F, Valetto A, et al. Remarkably similar antigen receptors among a subset of patients with chronic lymphocytic leukemia. The Journal of clinical investigation 2004;113:1008-16. 239. Darzentas N, Hadzidimitriou A, Murray F, et al. A different ontogenesis for chronic lymphocytic leukemia cases carrying stereotyped antigen receptors: molecular and computational evidence. Leukemia;24:125-32. 240. Widhopf GF, 2nd, Goldberg CJ, Toy TL, et al. Nonstochastic pairing of immunoglobulin heavy and light chains expressed by chronic lymphocytic leukemia B cells is predicated on the heavy chain CDR3. Blood 2008;111:3137-44. 241. Hadzidimitriou A, Darzentas N, Murray F, et al. Evidence for the significant role of immunoglobulin light chains in antigen recognition and selection in chronic lymphocytic leukemia. Blood 2009;113:403-11.

145
Chapter 6 REFERENCES
242. Bomben R, Dal Bo M, Capello D, et al. Molecular and clinical features of chronic lymphocytic leukaemia with stereotyped B cell receptors: results from an Italian multicentre study. British journal of haematology 2009;144:492-506. 243. Zibellini S, Capello D, Forconi F, et al. Stereotyped patterns of B-cell receptor in splenic marginal zone lymphoma. Haematologica 2010;95:1792-6. 244. Bikos V, Darzentas N, Hadzidimitriou A, et al. Over 30% of patients with splenic marginal zone lymphoma express the same immunoglobulin heavy variable gene: ontogenetic implications. Leukemia 2012;26:1638-46. 245. Catera R, Silverman GJ, Hatzi K, et al. Chronic lymphocytic leukemia cells recognize conserved epitopes associated with apoptosis and oxidation. Molecular medicine 2008;14:665-74. 246. Chu CC, Catera R, Zhang L, et al. Many chronic lymphocytic leukemia antibodies recognize apoptotic cells with exposed nonmuscle myosin heavy chain IIA: implications for patient outcome and cell of origin. Blood 2010;115:3907-15. 247. Lanemo Myhrinder A, Hellqvist E, Sidorova E, et al. A new perspective: molecular motifs on oxidized LDL, apoptotic cells, and bacteria are targets for chronic lymphocytic leukemia antibodies. Blood 2008;111:3838-48. 248. Landgren O, Rapkin JS, Caporaso NE, et al. Respiratory tract infections and subsequent risk of chronic lymphocytic leukemia. Blood 2007;109:2198-201. 249. Kostareli E, Hadzidimitriou A, Stavroyianni N, et al. Molecular evidence for EBV and CMV persistence in a subset of patients with chronic lymphocytic leukemia expressing stereotyped IGHV4-34 B-cell receptors. Leukemia 2009;23:919-24. 250. Kostareli E, Gounari M, Janus A, et al. Antigen receptor stereotypy across B-cell lymphoproliferations: the case of IGHV4-59/IGKV3-20 receptors with rheumatoid factor activity. Leukemia 2012;26:1127-31. 251. Aoun P, Blair HE, Smith LM, et al. Fluorescence in situ hybridization detection of cytogenetic abnormalities in B-cell chronic lymphocytic leukemia/small lymphocytic lymphoma. Leukemia & lymphoma 2004;45:1595-603. 252. Sindelarova L, Michalova K, Zemanova Z, et al. Incidence of chromosomal anomalies detected with FISH and their clinical correlations in B-chronic lymphocytic leukemia. Cancer Genet Cytogenet 2005;160:27-34. 253. Quijano S, Lopez A, Rasillo A, et al. Impact of trisomy 12, del(13q), del(17p), and del(11q) on the immunophenotype, DNA ploidy status, and proliferative rate of leukemic B-cells in chronic lymphocytic leukemia. Cytometry Part B, Clinical cytometry 2008;74:139-49. 254. Nicoloso MS, Kipps TJ, Croce CM, Calin GA. MicroRNAs in the pathogeny of chronic lymphocytic leukaemia. Br J Haematol 2007;139:709-16. 255. Calin GA, Dumitru CD, Shimizu M, et al. Frequent deletions and down-regulation of micro- RNA genes miR15 and miR16 at 13q14 in chronic lymphocytic leukemia. Proceedings of the National Academy of Sciences of the United States of America 2002;99:15524-9. 256. Cimmino A, Calin GA, Fabbri M, et al. miR-15 and miR-16 induce apoptosis by targeting BCL2. Proceedings of the National Academy of Sciences of the United States of America 2005;102:13944-9. 257. Ouillette P, Erba H, Kujawski L, Kaminski M, Shedden K, Malek SN. Integrated genomic profiling of chronic lymphocytic leukemia identifies subtypes of deletion 13q14. Cancer research 2008;68:1012-21. 258. Mosca L, Fabris S, Lionetti M, et al. Integrative genomics analyses reveal molecularly distinct subgroups of B-cell chronic lymphocytic leukemia patients with 13q14 deletion. Clinical cancer research : an official journal of the American Association for Cancer Research 2010;16:5641-53. 259. Mian M, Rinaldi A, Mensah AA, et al. Del(13q14.3) length matters: an integrated analysis of genomic, fluorescence in situ hybridization and clinical data in 169 chronic lymphocytic
146
Chapter 6 REFERENCES
leukaemia patients with 13q deletion alone or a normal karyotype. Hematological oncology 2012;30:46-9. 260. Papakonstantinou N, Ntoufa S, Chartomatsidou E, et al. Differential microRNA profiles and their functional implications in different immunogenetic subsets of chronic lymphocytic leukemia. Molecular medicine 2013;19:115-23. 261. Puente XS, Quesada V, Osorio FG, et al. Exome sequencing and functional analysis identifies BANF1 mutation as the cause of a hereditary progeroid syndrome. American journal of human genetics 2011;88:650-6. 262. Quesada V, Conde L, Villamor N, et al. Exome sequencing identifies recurrent mutations of the splicing factor SF3B1 gene in chronic lymphocytic leukemia. Nature genetics 2012;44:47-52. 263. Jeromin S, Weissmann S, Haferlach C, et al. SF3B1 mutations correlated to cytogenetics and mutations in NOTCH1, FBXW7, MYD88, XPO1 and TP53 in 1160 untreated CLL patients. Leukemia 2014;28:108-17. 264. Rossi D, Rasi S, Spina V, et al. Integrated mutational and cytogenetic analysis identifies new prognostic subgroups in chronic lymphocytic leukemia. Blood 2013;121:1403-12. 265. Landau DA, Carter SL, Stojanov P, et al. Evolution and impact of subclonal mutations in chronic lymphocytic leukemia. Cell 2013;152:714-26. 266. Rai KR, Sawitsky A, Cronkite EP, Chanana AD, Levy RN, Pasternack BS. Clinical staging of chronic lymphocytic leukemia. Blood 1975;46:219-34. 267. Sawitsky A, Rai KR, Glidewell O, Silver RT. Comparison of daily versus intermittent chlorambucil and prednisone therapy in the treatment of patients with chronic lymphocytic leukemia. Blood 1977;50:1049-59. 268. Shanafelt TD, Geyer SM, Kay NE. Prognosis at diagnosis: integrating molecular biologic insights into clinical practice for patients with CLL. Blood 2004;103:1202-10. 269. Moreno C, Montserrat E. New prognostic markers in chronic lymphocytic leukemia. Blood Rev 2008;22:211-9. 270. Degan M, Bomben R, Bo MD, et al. Analysis of IgV gene mutations in B cell chronic lymphocytic leukaemia according to antigen-driven selection identifies subgroups with different prognosis and usage of the canonical somatic hypermutation machinery. British journal of haematology 2004;126:29-42. 271. Gattei V, Bulian P, Del Principe MI, et al. Relevance of CD49d protein expression as overall survival and progressive disease prognosticator in chronic lymphocytic leukemia. Blood 2008;111:865-73. 272. Matutes E, Oscier D, Garcia-Marco J, et al. Trisomy 12 defines a group of CLL with atypical morphology: correlation between cytogenetic, clinical and laboratory features in 544 patients. British journal of haematology 1996;92:382-8. 273. Hernandez JA, Rodriguez AE, Gonzalez M, et al. A high number of losses in 13q14 chromosome band is associated with a worse outcome and biological differences in patients with B-cell chronic lymphoid leukemia. Haematologica 2009;94:364-71. 274. Van Dyke DL, Shanafelt TD, Call TG, et al. A comprehensive evaluation of the prognostic significance of 13q deletions in patients with B-chronic lymphocytic leukaemia. British journal of haematology 2010;148:544-50. 275. Orlandi EM, Bernasconi P, Pascutto C, et al. Chronic lymphocytic leukemia with del13q14 as the sole abnormality: dynamic prognostic estimate by interphase-FISH. Hematological oncology 2013;31:136-42. 276. Dal Bo M, Rossi FM, Rossi D, et al. 13q14 deletion size and number of deleted cells both influence prognosis in chronic lymphocytic leukemia. Genes, chromosomes & cancer 2011;50:633-43. 277. Puiggros A, Delgado J, Rodriguez-Vicente A, et al. Biallelic losses of 13q do not confer a poorer outcome in chronic lymphocytic leukaemia: analysis of 627 patients with isolated 13q deletion. British journal of haematology 2013;163:47-54.

147
Chapter 6 REFERENCES
278. Stilgenbauer S, Schnaiter A, Paschka P, et al. Gene mutations and treatment outcome in chronic lymphocytic leukemia: results from the CLL8 trial. Blood 2014;123:3247-54. 279. Zenz T, Vollmer D, Trbusek M, et al. TP53 mutation profile in chronic lymphocytic leukemia: evidence for a disease specific profile from a comprehensive analysis of 268 mutations. Leukemia 2010;24:2072-9. 280. Cazzola M, Rossi M, Malcovati L, Associazione Italiana per la Ricerca sul Cancro Gruppo Italiano Malattie M. Biologic and clinical significance of somatic mutations of SF3B1 in myeloid and lymphoid neoplasms. Blood 2013;121:260-9. 281. Hamblin TJ, Orchard JA, Ibbotson RE, et al. CD38 expression and immunoglobulin variable region mutations are independent prognostic variables in chronic lymphocytic leukemia, but CD38 expression may vary during the course of the disease. Blood 2002;99:1023-9. 282. Ibrahim S, Keating M, Do KA, et al. CD38 expression as an important prognostic factor in B-cell chronic lymphocytic leukemia. Blood 2001;98:181-6. 283. Damle RN, Wasil T, Fais F, et al. Ig V gene mutation status and CD38 expression as novel prognostic indicators in chronic lymphocytic leukemia. Blood 1999;94:1840-7. 284. Shanafelt TD, Geyer SM, Bone ND, et al. CD49d expression is an independent predictor of overall survival in patients with chronic lymphocytic leukaemia: a prognostic parameter with therapeutic potential. British journal of haematology 2008;140:537-46. 285. Huang PY, Best OG, Belov L, Mulligan SP, Christopherson RI. Surface profiles for subclassification of chronic lymphocytic leukemia. Leukemia & lymphoma 2012;53:1046-56. 286. Butrym A, Majewski M, Dzietczenia J, Kuliczkowski K, Mazur G. High CD74 expression correlates with ZAP70 expression in B cell chronic lymphocytic leukemia patients. Medical oncology 2013;30:560. 287. Joshi AD, Hegde GV, Dickinson JD, et al. ATM, CTLA4, MNDA, and HEM1 in high versus low CD38 expressing B-cell chronic lymphocytic leukemia. Clinical cancer research : an official journal of the American Association for Cancer Research 2007;13:5295-304. 288. Suwalska K, Pawlak E, Karabon L, et al. Association studies of CTLA-4, CD28, and ICOS gene polymorphisms with B-cell chronic lymphocytic leukemia in the Polish population. Human immunology 2008;69:193-201. 289. Stilgenbauer S, Bullinger L, Lichter P, Dohner H, German CLLSGCll. Genetics of chronic lymphocytic leukemia: genomic aberrations and V(H) gene mutation status in pathogenesis and clinical course. Leukemia 2002;16:993-1007. 290. Martinez-Trillos A, Pinyol M, Navarro A, et al. Mutations in TLR/MYD88 pathway identify a subset of young chronic lymphocytic leukemia patients with favorable outcome. Blood 2014;123:3790-6. 291. Tobin G, Thunberg U, Johnson A, et al. Somatically mutated Ig V(H)3-21 genes characterize a new subset of chronic lymphocytic leukemia. Blood 2002;99:2262-4. 292. Bomben R, Dal-Bo M, Benedetti D, et al. Expression of mutated IGHV3-23 genes in chronic lymphocytic leukemia identifies a disease subset with peculiar clinical and biological features. Clin Cancer Res 2010;16:620-8. 293. Dal-Bo M, Del Giudice I, Bomben R, et al. B-cell receptor, clinical course and prognosis in chronic lymphocytic leukaemia: the growing saga of the IGHV3 subgroup gene usage. Br J Haematol 2011;153:3-14. 294. Thorselius M, Krober A, Murray F, et al. Strikingly homologous immunoglobulin gene rearrangements and poor outcome in VH3-21-using chronic lymphocytic leukemia patients independent of geographic origin and mutational status. Blood 2006;107:2889-94. 295. Oscier D, Wade R, Davis Z, et al. Prognostic factors identified three risk groups in the LRF CLL4 trial, independent of treatment allocation. Haematologica 2010;95:1705-12. 296. Chu CC, Catera R, Hatzi K, et al. Chronic lymphocytic leukemia antibodies with a common stereotypic rearrangement recognize nonmuscle myosin heavy chain IIA. Blood 2008;112:5122-9.

148
Chapter 6 REFERENCES
297. Murray F, Darzentas N, Hadzidimitriou A, et al. Stereotyped patterns of somatic hypermutation in subsets of patients with chronic lymphocytic leukemia: implications for the role of antigen selection in leukemogenesis. Blood 2008;111:1524-33. 298. Sutton LA, Kostareli E, Hadzidimitriou A, et al. Extensive intraclonal diversification in a subgroup of chronic lymphocytic leukemia patients with stereotyped IGHV4-34 receptors: implications for ongoing interactions with antigen. Blood 2009;114:4460-8. 299. Rossi DJ, Jamieson CH, Weissman IL. Stems cells and the pathways to aging and cancer. Cell 2008;132:681-96. 300. Huntly BJ, Shigematsu H, Deguchi K, et al. MOZ-TIF2, but not BCR-ABL, confers properties of leukemic stem cells to committed murine hematopoietic progenitors. Cancer cell 2004;6:587-96. 301. So CW, Karsunky H, Passegue E, Cozzio A, Weissman IL, Cleary ML. MLL-GAS7 transforms multipotent hematopoietic progenitors and induces mixed lineage leukemias in mice. Cancer cell 2003;3:161-71. 302. Elias HK, Schinke C, Bhattacharyya S, Will B, Verma A, Steidl U. Stem cell origin of myelodysplastic syndromes. Oncogene 2013. 303. Jordan CT, Guzman ML. Mechanisms controlling pathogenesis and survival of leukemic stem cells. Oncogene 2004;23:7178-87. 304. Johnsen HE, Kjeldsen MK, Urup T, et al. Cancer stem cells and the cellular hierarchy in haematological malignancies. European journal of cancer 2009;45 Suppl 1:194-201. 305. Caligaris-Cappio F, Gobbi M, Bofill M, Janossy G. Infrequent normal B lymphocytes express features of B-chronic lymphocytic leukemia. The Journal of experimental medicine 1982;155:623-8. 306. Caligaris-Cappio F. B-chronic lymphocytic leukemia: a malignancy of anti-self B cells. Blood 1996;87:2615-20. 307. Berland R, Wortis HH. Origins and functions of B-1 cells with notes on the role of CD5. Annual review of immunology 2002;20:253-300. 308. Dorshkind K, Montecino-Rodriguez E. Fetal B-cell lymphopoiesis and the emergence of B-1-cell potential. Nature reviews Immunology 2007;7:213-9. 309. Seifert M, Sellmann L, Bloehdorn J, et al. Cellular origin and pathophysiology of chronic lymphocytic leukemia. The Journal of experimental medicine 2012;209:2183-98. 310. Negrini M, Cutrona G, Bassi C, et al. microRNAome Expression in Chronic Lymphocytic Leukemia: Comparison with Normal B-cell Subsets and Correlations with Prognostic and Clinical Parameters. Clinical cancer research : an official journal of the American Association for Cancer Research 2014. 311. Brezinschek HP, Foster SJ, Brezinschek RI, Dorner T, Domiati-Saad R, Lipsky PE. Analysis of the human VH gene repertoire. Differential effects of selection and somatic hypermutation on human peripheral CD5(+)/IgM+ and CD5(-)/IgM+ B cells. The Journal of clinical investigation 1997;99:2488-501. 312. Fischer M, Klein U, Kuppers R. Molecular single-cell analysis reveals that CD5-positive peripheral blood B cells in healthy humans are characterized by rearranged Vkappa genes lacking somatic mutation. The Journal of clinical investigation 1997;100:1667-76. 313. Dono M, Burgio VL, Colombo M, et al. CD5+ B cells with the features of subepithelial B cells found in human tonsils. European journal of immunology 2007;37:2138-47. 314. Damle RN, Ghiotto F, Valetto A, et al. B-cell chronic lymphocytic leukemia cells express a surface membrane phenotype of activated, antigen-experienced B lymphocytes. Blood 2002;99:4087-93. 315. Klein U, Tu Y, Stolovitzky GA, et al. Gene expression profiling of B cell chronic lymphocytic leukemia reveals a homogeneous phenotype related to memory B cells. The Journal of experimental medicine 2001;194:1625-38.

149
Chapter 6 REFERENCES
316. Tobin G, Thunberg U, Johnson A, et al. Chronic lymphocytic leukemias utilizing the VH3-21 gene display highly restricted Vlambda2-14 gene use and homologous CDR3s: implicating recognition of a common antigen epitope. Blood 2003;101:4952-7. 317. Schwartz-Albiez R, Monteiro RC, Rodriguez M, Binder CJ, Shoenfeld Y. Natural antibodies, intravenous immunoglobulin and their role in autoimmunity, cancer and inflammation. Clin Exp Immunol 2009;158 Suppl 1:43-50. 318. Herve M, Xu K, Ng YS, et al. Unmutated and mutated chronic lymphocytic leukemias derive from self-reactive B cell precursors despite expressing different antibody reactivity. The Journal of clinical investigation 2005;115:1636-43. 319. Stevenson FK, Caligaris-Cappio F. Chronic lymphocytic leukemia: revelations from the B-cell receptor. Blood 2004;103:4389-95. 320. Cutrona G, Colombo M, Matis S, et al. Clonal heterogeneity in chronic lymphocytic leukemia cells: superior response to surface IgM cross-linking in CD38, ZAP-70-positive cells. Haematologica 2008;93:413-22. 321. Lanham S, Hamblin T, Oscier D, Ibbotson R, Stevenson F, Packham G. Differential signaling via surface IgM is associated with VH gene mutational status and CD38 expression in chronic lymphocytic leukemia. Blood 2003;101:1087-93. 322. Chiorazzi N, Ferrarini M. Cellular origin(s) of chronic lymphocytic leukemia: cautionary notes and additional considerations and possibilities. Blood;117:1781-91. 323. Garcia-Munoz R, Galiacho VR, Llorente L. Immunological aspects in chronic lymphocytic leukemia (CLL) development. Ann Hematol 2012;91:981-96. 324. Sagaert X, Sprangers B, De Wolf-Peeters C. The dynamics of the B follicle: understanding the normal counterpart of B-cell-derived malignancies. Leukemia 2007;21:1378-86. 325. Rosenwald A, Alizadeh AA, Widhopf G, et al. Relation of gene expression phenotype to immunoglobulin mutation genotype in B cell chronic lymphocytic leukemia. The Journal of experimental medicine 2001;194:1639-47. 326. Haslinger C, Schweifer N, Stilgenbauer S, et al. Microarray gene expression profiling of B-cell chronic lymphocytic leukemia subgroups defined by genomic aberrations and VH mutation status. Journal of clinical oncology : official journal of the American Society of Clinical Oncology 2004;22:3937-49. 327. Klein U, Dalla-Favera R. New insights into the phenotype and cell derivation of B cell chronic lymphocytic leukemia. Curr Top Microbiol Immunol 2005;294:31-49. 328. Gaidano G, Foa R, Dalla-Favera R. Molecular pathogenesis of chronic lymphocytic leukemia. The Journal of clinical investigation 2012;122:3432-8. 329. Kikushige Y, Ishikawa F, Miyamoto T, et al. Self-renewing hematopoietic stem cell is the primary target in pathogenesis of human chronic lymphocytic leukemia. Cancer cell 2011;20:246-59. 330. Wang L, Lawrence MS, Wan Y, et al. SF3B1 and other novel cancer genes in chronic lymphocytic leukemia. The New England journal of medicine 2011;365:2497-506. 331. Rossi D, Rasi S, Fabbri G, et al. Mutations of NOTCH1 are an independent predictor of survival in chronic lymphocytic leukemia. Blood 2012;119:521-9. 332. Caligaris-Cappio F, Bertilaccio MT, Scielzo C. How the microenvironment wires the natural history of chronic lymphocytic leukemia. Seminars in cancer biology 2014;24:43-8. 333. Fabbri G, Rasi S, Rossi D, et al. Analysis of the chronic lymphocytic leukemia coding genome: role of NOTCH1 mutational activation. The Journal of experimental medicine 2011;208:1389-401. 334. Klein U, Lia M, Crespo M, et al. The DLEU2/miR-15a/16-1 cluster controls B cell proliferation and its deletion leads to chronic lymphocytic leukemia. Cancer cell 2010;17:28-40. 335. Zenz T, Mertens D, Kuppers R, Dohner H, Stilgenbauer S. From pathogenesis to treatment of chronic lymphocytic leukaemia. Nature reviews Cancer 2010;10:37-50.

150
Chapter 6 REFERENCES
336. van der Velden VH, Hoogeveen PG, de Ridder D, et al. B-cell prolymphocytic leukemia: a specific subgroup of mantle cell lymphoma. Blood 2014. 337. Traverse-Glehen A, Felman P, Callet-Bauchu E, et al. A clinicopathological study of nodal marginal zone B-cell lymphoma. A report on 21 cases. Histopathology 2006;48:162-73. 338. Dearden C. B- and T-cell prolymphocytic leukemia: antibody approaches. Hematology Am Soc Hematol Educ Program 2012;2012:645-51. 339. Lens D, De Schouwer PJ, Hamoudi RA, et al. p53 abnormalities in B-cell prolymphocytic leukemia. Blood 1997;89:2015-23. 340. Gustavsson E, Sernbo S, Andersson E, et al. SOX11 expression correlates to promoter methylation and regulates tumor growth in hematopoietic malignancies. Mol Cancer 2010;9:187. 341. Mozos A, Royo C, Hartmann E, et al. SOX11 expression is highly specific for mantle cell lymphoma and identifies the cyclin D1-negative subtype. Haematologica 2009;94:1555-62. 342. Davi F, Maloum K, Michel A, et al. High frequency of somatic mutations in the VH genes expressed in prolymphocytic leukemia. Blood 1996;88:3953-61. 343. Goodman GR, Bethel KJ, Saven A. Hairy cell leukemia: an update. Curr Opin Hematol 2003;10:258-66. 344. Basso K, Liso A, Tiacci E, et al. Gene expression profiling of hairy cell leukemia reveals a phenotype related to memory B cells with altered expression of chemokine and adhesion receptors. J Exp Med 2004;199:59-68. 345. Chen YH, Tallman MS, Goolsby C, Peterson L. Immunophenotypic variations in hairy cell leukemia. American journal of clinical pathology 2006;125:251-9. 346. Matutes E, Morilla R, Owusu-Ankomah K, Houliham A, Meeus P, Catovsky D. The immunophenotype of hairy cell leukemia (HCL). Proposal for a scoring system to distinguish HCL from B-cell disorders with hairy or villous lymphocytes. Leukemia & lymphoma 1994;14 Suppl 1:57-61. 347. DiGiuseppe JA, Borowitz MJ. Clinical utility of flow cytometry in the chronic lymphoid leukemias. Seminars in oncology 1998;25:6-10. 348. Frassoldati A, Lamparelli T, Federico M, et al. Hairy cell leukemia: a clinical review based on 725 cases of the Italian Cooperative Group (ICGHCL). Italian Cooperative Group for Hairy Cell Leukemia. Leukemia & lymphoma 1994;13:307-16. 349. Polliack A. Hairy cell leukemia and allied chronic lymphoid leukemias: current knowledge and new therapeutic options. Leukemia & lymphoma 1997;26 Suppl 1:41-51. 350. Ahmad E, Garcia D, Davis BH. Clinical utility of CD23 and FMC7 antigen coexistent expression in B-cell lymphoproliferative disorder subclassification. Cytometry 2002;50:1-7. 351. Forconi F, Sahota SS, Raspadori D, et al. Hairy cell leukemia: at the crossroad of somatic mutation and isotype switch. Blood 2004;104:3312-7. 352. Tiacci E, Trifonov V, Schiavoni G, et al. BRAF mutations in hairy-cell leukemia. N Engl J Med 2011;364:2305-15. 353. Haglund U, Juliusson G, Stellan B, Gahrton G. Hairy cell leukemia is characterized by clonal chromosome abnormalities clustered to specific regions. Blood 1994;83:2637-45. 354. Tiacci E, Liso A, Piris M, Falini B. Evolving concepts in the pathogenesis of hairy-cell leukaemia. Nature reviews Cancer 2006;6:437-48. 355. Thorselius M, Walsh SH, Thunberg U, Hagberg H, Sundstrom C, Rosenquist R. Heterogeneous somatic hypermutation status confounds the cell of origin in hairy cell leukemia. Leuk Res 2005;29:153-8. 356. Lazzi S, Bellan C, Tiacci E, et al. IRTA1+ monocytoid B cells in reactive lymphadenitis show a unique topographic distribution and immunophenotype and a peculiar usage and mutational pattern of IgVH genes. J Pathol 2006;209:56-66. 357. Walsh SH, Thorselius M, Johnson A, et al. Mutated VH genes and preferential VH3-21 use define new subsets of mantle cell lymphoma. Blood 2003;101:4047-54.

151
Chapter 6 REFERENCES
358. Arons E, Sunshine J, Suntum T, Kreitman RJ. Somatic hypermutation and VH gene usage in hairy cell leukaemia. Br J Haematol 2006;133:504-12. 359. Iwatani K, Takata K, Sato Y, et al. Low-grade B-cell lymphoma presenting primarily in the bone marrow. Human pathology 2014. 360. Morse HC, 3rd, Kearney JF, Isaacson PG, Carroll M, Fredrickson TN, Jaffe ES. Cells of the marginal zone--origins, function and neoplasia. Leuk Res 2001;25:169-78. 361. Kahl B, Yang D. Marginal zone lymphomas: management of nodal, splenic, and MALT NHL. Hematology Am Soc Hematol Educ Program 2008:359-64. 362. Harris NL, Jaffe ES, Stein H, et al. A revised European-American classification of lymphoid neoplasms: a proposal from the International Lymphoma Study Group. Blood 1994;84:1361-92. 363. Sjo LD, Heegaard S, Prause JU, Petersen BL, Pedersen S, Ralfkiaer E. Extranodal marginal zone lymphoma in the ocular region: clinical, immunophenotypical, and cytogenetical characteristics. Invest Ophthalmol Vis Sci 2009;50:516-22. 364. Isaacson PG, Du MQ. MALT lymphoma: from morphology to molecules. Nat Rev Cancer 2004;4:644-53. 365. Roggero E, Zucca E, Mainetti C, et al. Eradication of Borrelia burgdorferi infection in primary marginal zone B-cell lymphoma of the skin. Hum Pathol 2000;31:263-8. 366. Matutes E, Oscier D, Montalban C, et al. Splenic marginal zone lymphoma proposals for a revision of diagnostic, staging and therapeutic criteria. Leukemia 2008;22:487-95. 367. Arcaini L, Lucioni M, Boveri E, Paulli M. Nodal marginal zone lymphoma: current knowledge and future directions of an heterogeneous disease. Eur J Haematol 2009;83:165-74. 368. Tierens A, Delabie J, Malecka A, et al. Splenic marginal zone lymphoma with villous lymphocytes shows on-going immunoglobulin gene mutations. The American journal of pathology 2003;162:681-9. 369. Suarez F, Lefrere F, Besson C, Hermine O. Splenic lymphoma with villous lymphocytes, mixed cryoglobulinemia and HCV infection: deciphering the role of HCV in B-cell lymphomagenesis. Dig Liver Dis 2007;39 Suppl 1:S32-7. 370. Salido M, Baro C, Oscier D, et al. Cytogenetic aberrations and their prognostic value in a series of 330 splenic marginal zone B-cell lymphomas: a multicenter study of the Splenic B-Cell Lymphoma Group. Blood 2010;116:1479-88. 371. Berger F, Felman P, Thieblemont C, et al. Non-MALT marginal zone B-cell lymphomas: a description of clinical presentation and outcome in 124 patients. Blood 2000;95:1950-6. 372. Nathwani BN, Anderson JR, Armitage JO, et al. Marginal zone B-cell lymphoma: A clinical comparison of nodal and mucosa-associated lymphoid tissue types. Non-Hodgkin's Lymphoma Classification Project. J Clin Oncol 1999;17:2486-92. 373. van den Brand M, van Krieken JH. Recognizing nodal marginal zone lymphoma: recent advances and pitfalls. A systematic review. Haematologica 2013;98:1003-13. 374. Arcaini L, Paulli M, Boveri E, Magrini U, Lazzarino M. Marginal zone-related neoplasms of splenic and nodal origin. Haematologica 2003;88:80-93. 375. Arcaini L, Paulli M, Boveri E, et al. Splenic and nodal marginal zone lymphomas are indolent disorders at high hepatitis C virus seroprevalence with distinct presenting features but similar morphologic and phenotypic profiles. Cancer 2004;100:107-15. 376. Joshi M, Sheikh H, Abbi K, et al. Marginal zone lymphoma: old, new, targeted, and epigenetic therapies. Ther Adv Hematol 2012;3:275-90. 377. Traverse-Glehen A, Davi F, Ben Simon E, et al. Analysis of VH genes in marginal zone lymphoma reveals marked heterogeneity between splenic and nodal tumors and suggests the existence of clonal selection. Haematologica 2005;90:470-8. 378. Marasca R, Vaccari P, Luppi M, et al. Immunoglobulin gene mutations and frequent use of VH1-69 and VH4-34 segments in hepatitis C virus-positive and hepatitis C virus-negative nodal marginal zone B-cell lymphoma. Am J Pathol 2001;159:253-61.

152
Chapter 6 REFERENCES
379. Chan CH, Hadlock KG, Foung SK, Levy S. V(H)1-69 gene is preferentially used by hepatitis C virus-associated B cell lymphomas and by normal B cells responding to the E2 viral antigen. Blood 2001;97:1023-6. 380. Aamot HV, Micci F, Holte H, Delabie J, Heim S. G-banding and molecular cytogenetic analyses of marginal zone lymphoma. Br J Haematol 2005;130:890-901. 381. Dierlamm J, Michaux L, Wlodarska I, et al. Trisomy 3 in marginal zone B-cell lymphoma: a study based on cytogenetic analysis and fluorescence in situ hybridization. Br J Haematol 1996;93:242-9. 382. Brynes RK, Almaguer PD, Leathery KE, et al. Numerical cytogenetic abnormalities of chromosomes 3, 7, and 12 in marginal zone B-cell lymphomas. Mod Pathol 1996;9:995-1000. 383. Rinaldi A, Mian M, Chigrinova E, et al. Genome-wide DNA profiling of marginal zone lymphomas identifies subtype-specific lesions with an impact on the clinical outcome. Blood 2011;117:1595-604. 384. Xochelli A, Kalpadakis C, Gardiner A, et al. Clonal B-cell lymphocytosis exhibiting immunophenotypic features consistent with a marginal-zone origin: is this a distinct entity? Blood 2014;123:1199-206. 385. Anderson JR, Armitage JO, Weisenburger DD. Epidemiology of the non-Hodgkin's lymphomas: distributions of the major subtypes differ by geographic locations. Non-Hodgkin's Lymphoma Classification Project. Ann Oncol 1998;9:717-20. 386. Bende RJ, Smit LA, van Noesel CJ. Molecular pathways in follicular lymphoma. Leukemia 2007;21:18-29. 387. Zelenetz AD, Chen TT, Levy R. Clonal expansion in follicular lymphoma occurs subsequent to antigenic selection. The Journal of experimental medicine 1992;176:1137-48. 388. Bain BJ, Catovsky D. The leukaemic phase of non-Hodgkin's lymphoma. Journal of clinical pathology 1995;48:189-93. 389. Lopez-Guillermo A, Cabanillas F, McLaughlin P, et al. Molecular response assessed by PCR is the most important factor predicting failure-free survival in indolent follicular lymphoma: update of the MDACC series. Annals of oncology : official journal of the European Society for Medical Oncology / ESMO 2000;11 Suppl 1:137-40. 390. Menendez P, Vargas A, Bueno C, et al. Quantitative analysis of bcl-2 expression in normal and leukemic human B-cell differentiation. Leukemia 2004;18:491-8. 391. Ott G, Katzenberger T, Lohr A, et al. Cytomorphologic, immunohistochemical, and cytogenetic profiles of follicular lymphoma: 2 types of follicular lymphoma grade 3. Blood 2002;99:3806-12. 392. Cheung KJ, Shah SP, Steidl C, et al. Genome-wide profiling of follicular lymphoma by array comparative genomic hybridization reveals prognostically significant DNA copy number imbalances. Blood 2009;113:137-48. 393. Viardot A, Moller P, Hogel J, et al. Clinicopathologic correlations of genomic gains and losses in follicular lymphoma. J Clin Oncol 2002;20:4523-30. 394. Avet-Loiseau H, Vigier M, Moreau A, et al. Comparative genomic hybridization detects genomic abnormalities in 80% of follicular lymphomas. Br J Haematol 1997;97:119-22. 395. Hoglund M, Sehn L, Connors JM, et al. Identification of cytogenetic subgroups and karyotypic pathways of clonal evolution in follicular lymphomas. Genes Chromosomes Cancer 2004;39:195-204. 396. de Jong D. Molecular pathogenesis of follicular lymphoma: a cross talk of genetic and immunologic factors. J Clin Oncol 2005;23:6358-63. 397. Montserrat E. Chronic lymphoproliferative disorders. Current opinion in oncology 1997;9:34-41. 398. Catovsky D. Chronic lymphoproliferative disorders. Current opinion in oncology 1995;7:3-11.

153
Chapter 6 REFERENCES
399. A clinical evaluation of the International Lymphoma Study Group classification of non-Hodgkin's lymphoma. The Non-Hodgkin's Lymphoma Classification Project. Blood 1997;89:3909-18. 400. Herrmann A, Hoster E, Zwingers T, et al. Improvement of overall survival in advanced stage mantle cell lymphoma. J Clin Oncol 2009;27:511-8. 401. Deneys V, Mazzon AM, Marques JL, Benoit H, De Bruyere M. Reference values for peripheral blood B-lymphocyte subpopulations: a basis for multiparametric immunophenotyping of abnormal lymphocytes. Journal of immunological methods 2001;253:23-36. 402. Braylan RC, Orfao A, Borowitz MJ, Davis BH. Optimal number of reagents required to evaluate hematolymphoid neoplasias: results of an international consensus meeting. Cytometry 2001;46:23-7. 403. Espinet B, Ferrer A, Bellosillo B, et al. Distinction between asymptomatic monoclonal B-cell lymphocytosis with cyclin D1 overexpression and mantle cell lymphoma: from molecular profiling to flow cytometry. Clinical cancer research : an official journal of the American Association for Cancer Research 2014;20:1007-19. 404. Bosch F, Jares P, Campo E, et al. PRAD-1/cyclin D1 gene overexpression in chronic lymphoproliferative disorders: a highly specific marker of mantle cell lymphoma. Blood 1994;84:2726-32. 405. Fu K, Weisenburger DD, Greiner TC, et al. Cyclin D1-negative mantle cell lymphoma: a clinicopathologic study based on gene expression profiling. Blood 2005;106:4315-21. 406. Wiestner A, Tehrani M, Chiorazzi M, et al. Point mutations and genomic deletions in CCND1 create stable truncated cyclin D1 mRNAs that are associated with increased proliferation rate and shorter survival. Blood 2007;109:4599-606. 407. Jares P, Colomer D, Campo E. Molecular pathogenesis of mantle cell lymphoma. The Journal of clinical investigation 2012;122:3416-23. 408. Thorselius M, Walsh S, Eriksson I, et al. Somatic hypermutation and V(H) gene usage in mantle cell lymphoma. European journal of haematology 2002;68:217-24. 409. Kienle D, Krober A, Katzenberger T, et al. VH mutation status and VDJ rearrangement structure in mantle cell lymphoma: correlation with genomic aberrations, clinical characteristics, and outcome. Blood 2003;102:3003-9. 410. Nastoupil LJ, Sinha R, Flowers CR. Management Strategies for Elderly Patients with Diffuse Large B-Cell Lymphoma. Eur Oncol Haematol 2012;8:123-6. 411. Alizadeh AA, Eisen MB, Davis RE, et al. Distinct types of diffuse large B-cell lymphoma identified by gene expression profiling. Nature 2000;403:503-11. 412. Rosenwald A, Wright G, Chan WC, et al. The use of molecular profiling to predict survival after chemotherapy for diffuse large-B-cell lymphoma. The New England journal of medicine 2002;346:1937-47. 413. Vose JM. Relapsed diffuse large B-cell lymphoma: clinical utility of cell of origin. J Clin Oncol 2011;29:4065-6. 414. Bea S, Zettl A, Wright G, et al. Diffuse large B-cell lymphoma subgroups have distinct genetic profiles that influence tumor biology and improve gene-expression-based survival prediction. Blood 2005;106:3183-90. 415. Pasqualucci L, Bereshchenko O, Niu H, et al. Molecular pathogenesis of non-Hodgkin's lymphoma: the role of Bcl-6. Leuk Lymphoma 2003;44 Suppl 3:S5-12. 416. Pasqualucci L, Neumeister P, Goossens T, et al. Hypermutation of multiple proto-oncogenes in B-cell diffuse large-cell lymphomas. Nature 2001;412:341-6. 417. Rao PH, Houldsworth J, Dyomina K, et al. Chromosomal and gene amplification in diffuse large B-cell lymphoma. Blood 1998;92:234-40. 418. Offit K, Parsa NZ, Gaidano G, et al. 6q deletions define distinct clinico-pathologic subsets of non-Hodgkin's lymphoma. Blood 1993;82:2157-62.

154
Chapter 6 REFERENCES
419. Lossos IS. Molecular pathogenesis of diffuse large B-cell lymphoma. J Clin Oncol 2005;23:6351-7. 420. Kramer MH, Hermans J, Parker J, et al. Clinical significance of bcl2 and p53 protein expression in diffuse large B-cell lymphoma: a population-based study. J Clin Oncol 1996;14:2131-8. 421. Akasaka T, Akasaka H, Ueda C, et al. Molecular and clinical features of non-Burkitt's, diffuse large-cell lymphoma of B-cell type associated with the c-MYC/immunoglobulin heavy-chain fusion gene. Journal of clinical oncology : official journal of the American Society of Clinical Oncology 2000;18:510-18. 422. Szczepanski T, van der Velden VH, van Dongen JJ. Flow-cytometric immunophenotyping of normal and malignant lymphocytes. Clin Chem Lab Med 2006;44:775-96. 423. Murase T, Okubo M, Amemiya-Kudo M, et al. Impact of markedly elevated serum lipoprotein(a) levels (> or = 100 mg/dL) on the risk of coronary heart disease. Metabolism 2007;56:1187-91. 424. Yamaguchi M, Seto M, Okamoto M, et al. De novo CD5+ diffuse large B-cell lymphoma: a clinicopathologic study of 109 patients. Blood 2002;99:815-21. 425. Blum KA, Lozanski G, Byrd JC. Adult Burkitt leukemia and lymphoma. Blood 2004;104:3009-20. 426. Jaffe ES, Pittaluga S. Aggressive B-cell lymphomas: a review of new and old entities in the WHO classification. Hematology Am Soc Hematol Educ Program 2011;2011:506-14. 427. Boxer LM, Dang CV. Translocations involving c-myc and c-myc function. Oncogene 2001;20:5595-610. 428. Aukema SM, Kreuz M, Kohler CW, et al. Biological characterization of adult MYC-translocation-positive mature B-cell lymphomas other than molecular Burkitt lymphoma. Haematologica 2014;99:726-35. 429. Ohno H. Pathogenetic and clinical implications of non-immunoglobulin ; BCL6 translocations in B-cell non-Hodgkin's lymphoma. Journal of clinical and experimental hematopathology : JCEH 2006;46:43-53. 430. Harris NL. Principles of the revised European-American Lymphoma Classification (from the International Lymphoma Study Group). Annals of oncology : official journal of the European Society for Medical Oncology / ESMO 1997;8 Suppl 2:11-6. 431. Buske C, Leblond V. How to manage Waldenstrom's macroglobulinemia. Leukemia 2013;27:762-72. 432. San Miguel JF, Vidriales MB, Ocio E, et al. Immunophenotypic analysis of Waldenstrom's macroglobulinemia. Semin Oncol 2003;30:187-95. 433. Owen RG, Barrans SL, Richards SJ, et al. Waldenstrom macroglobulinemia. Development of diagnostic criteria and identification of prognostic factors. Am J Clin Pathol 2001;116:420-8. 434. Hunter ZR, Branagan AR, Manning R, et al. CD5, CD10, and CD23 expression in Waldenstrom's macroglobulinemia. Clin Lymphoma 2005;5:246-9. 435. Lin P, Medeiros LJ. Lymphoplasmacytic lymphoma/waldenstrom macroglobulinemia: an evolving concept. Adv Anat Pathol 2005;12:246-55. 436. Offit K, Parsa NZ, Filippa D, Jhanwar SC, Chaganti RS. t(9;14)(p13;q32) denotes a subset of low-grade non-Hodgkin's lymphoma with plasmacytoid differentiation. Blood 1992;80:2594-9. 437. Iida S, Rao PH, Ueda R, Chaganti RS, Dalla-Favera R. Chromosomal rearrangement of the PAX-5 locus in lymphoplasmacytic lymphoma with t(9;14)(p13;q32). Leuk Lymphoma 1999;34:25-33. 438. Ohno H, Ueda C, Akasaka T. The t(9;14)(p13;q32) translocation in B-cell non-Hodgkin's lymphoma. Leuk Lymphoma 2000;36:435-45. 439. Schop RF, Kuehl WM, Van Wier SA, et al. Waldenstrom macroglobulinemia neoplastic cells lack immunoglobulin heavy chain locus translocations but have frequent 6q deletions. Blood 2002;100:2996-3001.
155
Chapter 6 REFERENCES
440. Sklar J, Cleary ML, Thielemans K, Gralow J, Warnke R, Levy R. Biclonal B-cell lymphoma. The New England journal of medicine 1984;311:20-7. 441. Gonzalez-Campos J, Rios-Herranz E, De Blas-Orlando JM, Martin-Noya A, Parody-Ruiz-Berdejo R, Rodriguez-Fernandez JM. Chronic lymphocytic leukemia with two cellular populations: a biphenotypic or biclonal disease. Annals of hematology 1997;74:243-6. 442. Wong KF, So CC. Biclonal B-cell chronic lymphocytic leukemia with inv(14)(q11q32). Cancer Genet Cytogenet 1997;94:135-7. 443. Fend F, Quintanilla-Martinez L, Kumar S, et al. Composite low grade B-cell lymphomas with two immunophenotypically distinct cell populations are true biclonal lymphomas. A molecular analysis using laser capture microdissection. The American journal of pathology 1999;154:1857-66. 444. Kim H. Composite lymphoma and related disorders. American journal of clinical pathology 1993;99:445-51. 445. Ilgenfritz RB, Le Tourneau A, Arborio M, et al. Composite mantle cell and follicular lymphoma. A case report. Hum Pathol 2009;40:259-63. 446. Hayes SJ, Banerjee SS, Cook Y, Houghton JB, Menasce LP. Composite mantle-cell lymphoma and classical Hodgkin lymphoma. Histopathology 2006;48:621-3. 447. Yun WK, Ko YH, Kim DS, et al. Composite marginal zone B cell lymphoma and enteropathy-type T cell lymphoma of the stomach: a case report. Eur J Gastroenterol Hepatol 2008;20:791-5. 448. Steinhoff M, Hummel M, Assaf C, et al. Cutaneous T cell lymphoma and classic Hodgkin lymphoma of the B cell type within a single lymph node: composite lymphoma. J Clin Pathol 2004;57:329-31. 449. Carlotti E, Wrench D, Matthews J, et al. Transformation of follicular lymphoma to diffuse large B-cell lymphoma may occur by divergent evolution from a common progenitor cell or by direct evolution from the follicular lymphoma clone. Blood 2009;113:3553-7. 450. Papathomas TG, Venizelos I, Dunphy CH, et al. Mantle cell lymphoma as a component of composite lymphoma: clinicopathologic parameters and biologic implications. Hum Pathol 2012;43:467-80. 451. Rosenquist R, Roos G, Erlanson M, Kuppers R, Brauninger A, Hansmann ML. Clonally related splenic marginal zone lymphoma and Hodgkin lymphoma with unmutated V gene rearrangements and a 15-yr time gap between diagnoses. Eur J Haematol 2004;73:210-4. 452. Wang SA, Olson N, Zukerberg L, Harris NL. Splenic marginal zone lymphoma with micronodular T-cell rich B-cell lymphoma. Am J Surg Pathol 2006;30:128-32. 453. Heintel D, Streubel B, Welzel N, et al. Burkitt lymphoma following splenic marginal zone lymphoma. evidence for two independent B-cell clones. Cancer Genet Cytogenet 2003;141:86-8. 454. Baseggio L, Gazzo S, Callet-Bauchu E, et al. An unusual case of indolent B-cell lymphoma with distinct chronic lymphocytic leukemia and marginal zone differentiation according to the site of involvement. Leuk Lymphoma 2005;46:1369-74. 455. Lima M, Goncalves C, Marques L, et al. Association of CD4+/CD56+/CD57+/CD8+(dim) large granular lymphocytic leukemia, splenic B-cell lymphoma with circulating villous lymphocytes, and idiopathic erythrocytosis. Ann Hematol 2001;80:685-90. 456. Papadaki T, Stamatopoulos K, Kosmas C, Kapsimali V, Economopoulos T. A unique case of splenic marginal zone-cell lymphoma with synchronous clonal T-cell large granular lymphocyte proliferation: an immunologic, immunohistochemical and genotypic study. Leuk Res 2003;27:85-7. 457. Bagnara D, Callea V, Stelitano C, et al. IgV gene intraclonal diversification and clonal evolution in B-cell chronic lymphocytic leukaemia. Br J Haematol 2006;133:50-8. 458. Volkheimer AD, Weinberg JB, Beasley BE, et al. Progressive immunoglobulin gene mutations in chronic lymphocytic leukemia: evidence for antigen-driven intraclonal diversification. Blood 2007;109:1559-67.

156
Chapter 6 REFERENCES
459. Sanchez ML, Almeida J, Lopez A, et al. Heterogeneity of neoplastic cells in B-cell chronic lymphoproliferative disorders: biclonality versus intraclonal evolution of a single tumor cell clone. Haematologica 2006;91:331-9. 460. Rabiller F, Belaud-Rotureau MA, Fitoussi O, et al. [Composite lymphoma: association of a follicular lymphoma and a chronic lymphocytic leukemia]. Ann Pathol 2008;28:41-4. 461. Hsi ED, Hoeltge G, Tubbs RR. Biclonal chronic lymphocytic leukemia. American journal of clinical pathology 2000;113:798-804. 462. Chang H, Cerny J. Molecular characterization of chronic lymphocytic leukemia with two distinct cell populations: Evidence for separate clonal origins. Am J Clin Pathol 2006;126:23-8. 463. Gine E, Bosch F, Villamor N, et al. Simultaneous diagnosis of hairy cell leukemia and chronic lymphocytic leukemia/small lymphocytic lymphoma: a frequent association? Leukemia 2002;16:1454-9. 464. Boiocchi L, Witter RE, He B, et al. Composite chronic lymphocytic leukemia/small lymphocytic lymphoma and follicular lymphoma are biclonal lymphomas: a report of two cases. Am J Clin Pathol 2012;137:647-59. 465. Travis LB, Curtis RE, Hankey BF, Fraumeni JF, Jr. Second cancers in patients with chronic lymphocytic leukemia. J Natl Cancer Inst 1992;84:1422-7. 466. Swerdlow S CE, Harris NL, Jaffe ES, Pileri SA, Stein H, et al. (eds). WHO Classification of Tumours of Haematopoietic and Lymphoid Tissues.2008. 467. Sanchez ML, Almeida J, Vidriales B, et al. Incidence of phenotypic aberrations in a series of 467 patients with B chronic lymphoproliferative disorders: basis for the design of specific four-color stainings to be used for minimal residual disease investigation. Leukemia 2002;16:1460-9. 468. Henriques A, Rodriguez-Caballero A, Nieto WG, et al. Combined patterns of IGHV repertoire and cytogenetic/molecular alterations in monoclonal B lymphocytosis versus chronic lymphocytic leukemia. PloS one 2013;8:e67751. 469. Kalina T, Flores-Montero J, van der Velden VH, et al. EuroFlow standardization of flow cytometer instrument settings and immunophenotyping protocols. Leukemia 2012;26:1986-2010. 470. van Dongen JJ, Lhermitte L, Bottcher S, et al. EuroFlow antibody panels for standardized n-dimensional flow cytometric immunophenotyping of normal, reactive and malignant leukocytes. Leukemia 2012;26:1908-75. 471. Gonzalez D, Balanzategui A, Garcia-Sanz R, et al. Incomplete DJH rearrangements of the IgH gene are frequent in multiple myeloma patients: immunobiological characteristics and clinical implications. Leukemia 2003;17:1398-403. 472. van Dongen JJ, Langerak AW, Bruggemann M, et al. Design and standardization of PCR primers and protocols for detection of clonal immunoglobulin and T-cell receptor gene recombinations in suspect lymphoproliferations: report of the BIOMED-2 Concerted Action BMH4-CT98-3936. Leukemia 2003;17:2257-317. 473. Costa ES, Pedreira CE, Barrena S, et al. Automated pattern-guided principal component analysis vs expert-based immunophenotypic classification of B-cell chronic lymphoproliferative disorders: a step forward in the standardization of clinical immunophenotyping. Leukemia 2010;24:1927-33. 474. Rawstron AC. Monoclonal B-cell lymphocytosis. Hematology / the Education Program of the American Society of Hematology American Society of Hematology Education Program 2009:430-9. 475. Calin GA, Ferracin M, Cimmino A, et al. A MicroRNA signature associated with prognosis and progression in chronic lymphocytic leukemia. The New England journal of medicine 2005;353:1793-801. 476. Schwaenen C, Nessling M, Wessendorf S, et al. Automated array-based genomic profiling in chronic lymphocytic leukemia: development of a clinical tool and discovery of

157
Chapter 6 REFERENCES
recurrent genomic alterations. Proceedings of the National Academy of Sciences of the United States of America 2004;101:1039-44. 477. Zenz T, Mertens D, Dohner H, Stilgenbauer S. Importance of genetics in chronic lymphocytic leukemia. Blood reviews 2011;25:131-7. 478. Lanasa MC, Allgood SD, Slager SL, et al. Immunophenotypic and gene expression analysis of monoclonal B-cell lymphocytosis shows biologic characteristics associated with good prognosis CLL. Leukemia 2011;25:1459-66. 479. Vardi A, Dagklis A, Scarfo L, et al. Immunogenetics shows that not all MBL are equal: the larger the clone, the more similar to CLL. Blood 2013;121:4521-8. 480. Del Giudice I, Rossi D, Chiaretti S, et al. NOTCH1 mutations in +12 chronic lymphocytic leukemia (CLL) confer an unfavorable prognosis, induce a distinctive transcriptional profiling and refine the intermediate prognosis of +12 CLL. Haematologica 2012;97:437-41. 481. Rawstron AC, Bennett F, Hillmen P. The biological and clinical relationship between CD5+23+ monoclonal B-cell lymphocytosis and chronic lymphocytic leukaemia. British journal of haematology 2007;139:724-9. 482. Shanafelt TD, Kay NE, Call TG, et al. MBL or CLL: which classification best categorizes the clinical course of patients with an absolute lymphocyte count >or= 5 x 10(9) L(-1) but a B-cell lymphocyte count <5 x 10(9) L(-1)? Leukemia research 2008;32:1458-61. 483. Martin T, Duffy SF, Carson DA, Kipps TJ. Evidence for somatic selection of natural autoantibodies. The Journal of experimental medicine 1992;175:983-91. 484. Arcaini L, Zibellini S, Passamonti F, et al. Splenic marginal zone lymphoma: Clinical clustering of immunoglobulin heavy chain repertoires. Blood cells, molecules & diseases 2009;42:286-91. 485. Buhler A, Zenz T, Stilgenbauer S. Immunoglobulin heavy chain variable gene usage and (super)-antigen drive in chronic lymphocytic leukemia. Clinical cancer research : an official journal of the American Association for Cancer Research 2010;16:373-5. 486. Sabattini E, Bacci F, Sagramoso C, Pileri SA. WHO classification of tumours of haematopoietic and lymphoid tissues in 2008: an overview. Pathologica 2010;102:83-7. 487. Tsakou E, Agathagelidis A, Boudjoghra M, et al. Partial versus productive immunoglobulin heavy locus rearrangements in chronic lymphocytic leukemia: implications for B-cell receptor stereotypy. Molecular medicine 2012;18:138-45. 488. Dolcetti R, Boiocchi M. Cellular and molecular bases of B-cell clonal expansions. Clinical and experimental rheumatology 1996;14 Suppl 14:S3-13. 489. Racanelli V, Sansonno D, Piccoli C, D'Amore FP, Tucci FA, Dammacco F. Molecular characterization of B cell clonal expansions in the liver of chronically hepatitis C virus-infected patients. Journal of immunology 2001;167:21-9. 490. Laurie CC, Laurie CA, Rice K, et al. Detectable clonal mosaicism from birth to old age and its relationship to cancer. Nature genetics 2012;44:642-50. 491. Jacobs KB, Yeager M, Zhou W, et al. Detectable clonal mosaicism and its relationship to aging and cancer. Nature genetics 2012;44:651-8. 492. Arcaini L, Merli M, Volpetti S, Rattotti S, Gotti M, Zaja F. Indolent B-cell lymphomas associated with HCV infection: clinical and virological features and role of antiviral therapy. Clinical & developmental immunology 2012;2012:638185. 493. Isaacson PG. Mucosa-associated lymphoid tissue lymphoma. Seminars in hematology 1999;36:139-47. 494. Silverman GJ. B cell superantigens: possible roles in immunodeficiency and autoimmunity. Seminars in immunology 1998;10:43-55. 495. Rosner K, Winter DB, Tarone RE, Skovgaard GL, Bohr VA, Gearhart PJ. Third complementarity-determining region of mutated VH immunoglobulin genes contains shorter V, D, J, P, and N components than non-mutated genes. Immunology 2001;103:179-87. 496. Stamatopoulos K. CLL: promiscuity leads to risks. Blood 2009;114:3508-9.

158
Chapter 6 REFERENCES
497. Plevova K, Francova HS, Burckova K, et al. Multiple productive immunoglobulin heavy chain gene rearrangements in chronic lymphocytic leukemia are mostly derived from independent clones. Haematologica 2014;99:329-38. 498. Binet JL. [New data on the prognosis of chronic lymphoid leukemia ; anatomo-clinical classification]. Acquisitions medicales recentes 1981;198:191-200. 499. Henriques A, Rodriguez-Caballero A, Criado I, et al. Molecular and cytogenetic characterization of expanded B-cell clones from multiclonal versus monoclonal B-cell chronic lymphoproliferative disorders. Haematologica 2014;99:897-907. 500. Westers TM, Ireland R, Kern W, et al. Standardization of flow cytometry in myelodysplastic syndromes: a report from an international consortium and the European LeukemiaNet Working Group. Leukemia 2012;26:1730-41. 501. Matarraz S, Paiva B, Diez-Campelo M, et al. Immunophenotypic alterations of bone marrow myeloid cell compartments in multiple myeloma patients predict for myelodysplasia-associated cytogenetic alterations. Leukemia 2014. 502. Vargas-Madrazo E, Lara-Ochoa F, Ramirez-Benites MC, Almagro JC. Evolution of the structural repertoire of the human V(H) and Vkappa germline genes. International immunology 1997;9:1801-15. 503. Fernandez C, Santos-Silva MC, Lopez A, et al. Newly diagnosed adult AML and MPAL patients frequently show clonal residual hematopoiesis. Leukemia 2013;27:2149-56. 504. Binder M, Lechenne B, Ummanni R, et al. Stereotypical chronic lymphocytic leukemia B-cell receptors recognize survival promoting antigens on stromal cells. PloS one 2010;5:e15992. 505. Saba HI. Myelodysplastic syndromes in the elderly. Cancer control : journal of the Moffitt Cancer Center 2001;8:79-102.

SUPPORTING INFORMATION


161
SUPPORTING INFORMATION
Supplemental Table 1. Informative parameters of the CLL-like/CLL B-cell clones included in the three
major groups graphically visualized with APS view of the InfinicytTM software.
Continuous parameters included for multivariate
analysis based on PCA
Groups ID Pe
rce
nta
ge o
f d
el(
13q
14
.3)+
ce
lls
Pe
rce
nta
ge o
f b
ialle
lic d
el(
13
q1
4.3
)+ c
ells
Pe
rce
nta
ge o
f d
el(
13q
14)
+ ce
lls
Pe
rce
nta
ge o
f tr
iso
my
12+ c
ells
Pe
rce
nta
ge o
f t(
14
q3
2)+
ce
lls
Pe
rce
nta
ge o
f d
el(
11q
22
.3)+
ce
lls
Pe
rce
nta
ge o
f d
el(
11q
23
.3)+
ce
lls
Pe
rce
nta
ge o
f d
el(
17p
13
.1)+
ce
lls
Ab
solu
te n
um
ber
of
clo
nal
B c
ells
/µL
IGH
V g
en
e r
epe
rto
ire
IGH
V m
uta
tio
nal
sta
tus*
Bin
et
Stag
e**
1 127_MBLlow_V3-23_UM_del13q.xlsx 0 73 0 0 0 0 0 0 54 3-23 >98%
1 134_ MBLlow_V3-23_UM_0 0 0 0 0 0 0 0 0 0.11 3-23 >98%
1 135_ MBLlow_V3-23_UM_0 0 0 0 0 0 0 0 0 0.17 3-23 >98%
1 136_ MBLlow_V3-23_UM_0 0 0 0 0 0 0 0 0 0.47 3-23 >98%
1 137_ MBLlow_V3-23_UM_0 0 0 0 0 0 0 0 0 0.57 3-23 >98%
1 41_ MBLlow_V3-21_UM_0.xlsx 0 0 0 0 0 0 0 0 80 3-21 >98%
1 42_ MBLlow_V3-21_M_0.xlsx 0 0 0 0 0 0 0 0 250 3-21 <98%
1 138_ MBLlow_V3-21_M_0 0 0 0 0 0 0 0 0 3.05 3-21 <98%
1 77_ MBLlow_V4-34_M_0.xlsx 0 0 0 0 0 0 0 0 39 4-34 <98%
1 140_ MBLlow_V4-34_M_bidel13q 0 91 0 0 0 0 0 0 9.31 4-34 <98%
1 35_ MBLlow_V3-11_M_0.xlsx 0 0 0 0 0 0 0 0 10 3-11 <98%
1 36_ MBLlow_V3-11_M_0.xlsx 0 0 0 0 0 0 0 0 200 3-11 <98%
1 93_ MBLlow_V1-69_M_0.xlsx 0 0 0 0 0 0 0 0 115 1-69 <98%
1 94_ MBLlow_V1-69_UM_0.xlsx 0 0 0 0 0 0 0 0 158 1-69 >98%
1 48_ MBLlow_V1-2_UM_0.xlsx 0 0 0 0 0 0 0 0 112 1-2 >98%
1 69_ MBLlow_V3-7_M_0.xlsx 0 0 0 0 0 0 0 0 0.09 3-7 <98%
1 72_ MBLlow_V3-30_M_0.xlsx 0 0 0 0 0 0 0 0 3 3-30 <98%
1 26_MBLhigh_V3-23_M_0.xlsx 0 0 0 0 0 0 0 0 986 3-23 <98%
1 27multi_ MBLhigh_V3-23_UM_0.xlsx 0 0 0 0 0 0 0 0 2900 3-23 >98%
1 28_ MBLhigh_V3-23_M_0.xlsx 0 0 0 0 0 0 0 0 3281 3-23 <98%
1 43multi_ MBLhigh_V3_21_M_0.xlsx 0 0 0 0 0 0 0 0 2078 3-21 <98%
1 44_ MBLhigh_V3-21_M_0.xlsx 0 0 0 0 0 0 0 0 4424 3-21 <98%
1 78multi_ MBLhigh_V4-34_M_0.xlsx 0 0 0 0 0 0 0 0 346 4-34 <98%
1 79_ MBLhigh_V4-34_M_0.xlsx 0 0 0 0 0 0 0 0 1352 4-34 <98%
1 80multi_ MBLhigh_V4-34_M_0.xlsx 0 0 0 0 0 0 0 0 2047 4-34 <98%
1 81_ MBLhigh_V4-34_M_0.xlsx 0 0 0 0 0 0 0 0 2311 4-34 <98%
1 95multi_ MBLhigh_V1-69_UM_0.xlsx 0 0 0 0 0 0 0 0 430 1-69 >98%
1 96multi_ MBLhigh_V1-69_UM_0.xlsx 0 0 0 0 0 0 0 0 511 1-69 >98%
1 49_ MBLhigh_V1-2_M_0.xlsx 0 0 0 0 0 0 0 0 999 1-2 <98%
1 50_ MBLhigh_V1-2_M_0.xlsx 0 0 0 0 0 0 0 0 1454 1-2 <98%
1 70_ MBLhigh_V3-7_M_0.xlsx 0 0 0 0 0 0 0 0 1264 3-7 <98%
1 73_ MBLhigh_V3-30_M_0.xlsx 0 0 0 0 0 0 0 0 3986 3-30 <98%
1 128multi_ MBLhigh_V3-30_M_del13q.xlsx 0 95 0 0 0 0 0 0 914 3-30 <98%
1 57multi_ MBLhigh_V1-3_UM_0.xlsx 0 0 0 0 0 0 0 0 3458 1-3 >98%
1 89_ MBLhigh_V3-48_UM_0.xlsx 0 0 0 0 0 0 0 0 1170 3-48 >98%
1 63_ MBLhigh_V4-39_UM_0.xlsx 0 0 0 0 0 0 0 0 4594 4-39 >98%
1 39_ MBLhigh_V5-51_UM_0.xlsx 0 0 0 0 0 0 0 0 2000 5-51 >98%
1 31_CLL_V3-23_UM_0_A.xlsx 0 0 0 0 0 0 0 0 5200 3-23 >98%
1 32multi_CLL_V3-23_M_0_A.xlsx 0 0 0 0 0 0 0 0 5680 3-23 <98%
1 33_CLL_V3-23_M_0_A.xlsx 0 0 0 0 0 0 0 0 17488 3-23 <98%
1 34_CLL_V3-23_M_0_A.xlsx 0 0 0 0 0 0 0 0 28710 3-23 <98%

162
SUPPORTING INFORMATION
Continuous parameters included for multivariate
analysis based on PCA
Groups ID Pe
rce
nta
ge o
f d
el(
13q
14
.3)+ c
ells
Pe
rce
nta
ge o
f b
ialle
lic d
el(
13
q1
4.3
)+ ce
lls
Pe
rce
nta
ge o
f d
el(
13q
14)
+ c
ells
Pe
rce
nta
ge o
f tr
iso
my
12+ c
ells
Pe
rce
nta
ge o
f t(
14
q3
2)+ c
ells
Pe
rce
nta
ge o
f d
el(
11q
22
.3)+ c
ells
Pe
rce
nta
ge o
f d
el(
11q
23
.3)+ c
ells
Pe
rce
nta
ge o
f d
el(
17p
13
.1)+ c
ells
Ab
solu
te n
um
ber
of
clo
nal
B c
ells
/µL
IGH
V g
en
e r
epe
rto
ire
IGH
V m
uta
tio
nal
sta
tus*
Bin
et
Stag
e**
1 47_CLL_V3-21_M_0_A.xlsx 0 0 0 0 0 0 0 0 37985 3-21 <98% A
1 83_CLL_V4-34_M_0_A.xlsx 0 0 0 0 0 0 0 0 7103 4-34 <98% A
1 84multi_CLL_V4-34_M_0_A.xlsx 0 0 0 0 0 0 0 0 7597 4-34 <98% A
1 85_CLL_V4-34_M_0_A.xlsx 0 0 0 0 0 0 0 0 8653 4-34 <98% A
1 130multi_CLL_V4-34_M_del13q_A.xlsx 0 96 0 0 0 0 0 0 8382 4-34 <98% A
1 131multi_CLL_V4-34_M_del13q_A.xlsx 0 91 0 0 0 0 0 0 8398 4-34 <98% A
1 132_CLL_V4-34_M_2del13q_A.xlsx 14 79 0 0 0 0 0 0 11523 4-34 <98% A
1 37_SLL_V3-11_UM_0_A.xlsx 0 0 0 0 0 0 0 0 2404 3-11 >98% A
1 38_CLL_V3-11_UM_0_A.xlsx 0 0 0 0 0 0 0 0 14076 3-11 >98% A
1 98_CLL_V1-69_UM_del11q_A.xlsx 0 0 0 0 0 0 24 0 20880 1-69 >98% A
1 56_CLL_V1-2_M_0_A.xlsx 0 0 0 0 0 0 0 0 9524 1-2 <98% A
1 71_CLL_V3-7_M_t14q_del17p_A.xlsx 0 0 0 0 18 0 0 33 3055 3-7 <98% A
1 58_CLL_V1-3_M_0_A.xlsx 0 0 0 0 0 0 0 0 7220 1-3 <98% A
1 59multi_CLL_V1-3_M_0_A.xlsx 0 0 0 0 0 0 0 0 7833 1-3 <98% A
1 61_CLL_V1-3_UM_0_A.xlsx 0 0 0 0 0 0 0 0 20229 1-3 >98% A
1 92_CLL_V3-48_M_t14q_A.xlsx 0 0 0 0 22 0 0 0 64726 3-48 <98% A
1 64multi_CLL_V4-39_UM_0_A.xlsx 0 0 0 0 0 0 0 0 6800 4-39 >98% A
1 65_CLL_V4-39_UM_0_A.xlsx 0 0 0 0 0 0 0 0 17214 4-39 >98% A
1 68multi_CLL_V4-39_UM_0_A.xlsx 0 0 0 0 0 0 0 0 71485 4-39 >98% A
1 87_CLL_V4-34_M_0_B.xlsx 0 0 0 0 0 0 0 0 186012 4-34 <98% B
1 133multi_CLL_V4-34_UM_del13q_C.xlsx 0 85 0 0 0 0 0 0 66142 4-34 >98% C
1 53_CLL_V1-2_UM_0_B.xlsx 0 0 0 0 0 0 0 0 45081 1-2 >98% B
1 54_CLL_V1-2_UM_0_B.xlsx 0 0 0 0 0 0 0 0 120102 1-2 >98% B
1 74_SLL_V3-30_UM_0_B.xlsx 0 0 0 0 0 0 0 0 3509 3-30 >98% B
1 76multi_CLL_V3-30_UM_0_B.xlsx 0 0 0 0 0 0 0 0 49600 3-30 >98% B
1 129_CLL_V3-30_M_2del13q_C.xlsx 5 95 0 0 0 0 0 0 17175 3-30 <98% C
1 66_CLL_V4-39_UM_0_B.xlsx 0 0 0 0 0 0 0 0 22704 4-39 >98% B
2 24_ MBLlow_V3-23_M_2del13q.xlsx 86 0 86 0 0 0 0 0 1 3-23 <98%
2 115_ MBLlow_V4-34_M_del13q.xlsx 96 0 0 0 0 0 0 0 26 4-34 <98%
2 139_ MBLlow_V3-7_M_del13q 22 0 0 0 0 0 0 0 0.4 3-7 <98%
2 141_ MBLlow_V3-48_M_del13q_tris12 19 0 0 41 0 0 0 0 0.57 3-48 <98%
2 142_ MBLlow_V3-48_M_del13q 70 0 0 0 0 0 0 0 0.57 3-48 <98%
2 29_ MBLhigh_V3-23_M_del13q.xlsx 21 0 0 0 0 0 0 0 4040 3-23 <98%
2 101_ MBLhigh_V3-23_M_del13q.xlsx 88 0 0 0 0 0 0 0 3044 3-23 <98%
2 116multi_ MBLhigh_V4-34_M_del13q.xlsx 83 0 0 0 0 0 0 0 551 4-34 <98%
2 102multi_ MBLhigh_V3-11_M_del13q.xlsx 87 0 0 0 0 0 0 0 2692 3-11 <98%
2 51_ MBLhigh_V1-2_M_del13q.xlsx 23 0 0 0 0 0 0 0 4623 1-2 <98%
2 103_ MBLhigh_V1-2_M_2del13q.xlsx 96 0 96 0 0 0 0 0 4371 1-2 <98%
2 107multi_ MBLhigh_V3-7_M_2del13q.xlsx 98 0 98 0 0 0 0 0 2750 3-7 <98%
2 88multi_ MBLhigh_V3-48_M_del13q.xlsx 18 0 0 0 0 0 0 0 680 3-48 <98%
2 62multi_ MBLhigh_V4-39_UM_2del13q.xlsx 15 0 15 0 0 0 0 0 3174 4-39 >98%
2 118_CLL_V4-34_M_del13q_A.xlsx 99 0 0 0 0 0 0 0 13167 4-34 <98% A
2 119_CLL_V4-34_M_2del13q_A.xlsx 97 0 95 0 0 0 0 0 105594 4-34 <98% A
2 104_CLL_V1-2_UM_2del13q_A.xlsx 84 0 93 0 0 0 0 0 7683 1-2 >98% A
2 111multi_CLL_V3-30_M_del13q_A.xlsx 80 0 0 0 0 0 0 0 7920 3-30 <98% A
(Supplemental Table 1, continued)

163
SUPPORTING INFORMATION
(Supplemental Table 1, continued)
Continuous parameters included for multivariate
analysis based on PCA
Groups ID Pe
rce
nta
ge o
f d
el(
13q
14
.3)+ c
ells
Pe
rce
nta
ge o
f b
ialle
lic d
el(
13
q1
4.3
)+ ce
lls
Pe
rce
nta
ge o
f d
el(
13q
14)
+ c
ells
Pe
rce
nta
ge o
f tr
iso
my
12+ c
ells
Pe
rce
nta
ge o
f t(
14
q3
2)+
ce
lls
Pe
rce
nta
ge o
f d
el(
11q
22
.3)+ c
ells
Pe
rce
nta
ge o
f d
el(
11q
23
.3)+ c
ells
Pe
rce
nta
ge o
f d
el(
17p
13
.1)+ c
ells
Ab
solu
te n
um
ber
of
clo
nal
B c
ells
/µL
IGH
V g
en
e r
epe
rto
ire
IGH
V m
uta
tio
nal
sta
tus*
Bin
et
Stag
e**
2 112_CLL_V3-30_M_del13q_A.xlsx 53 0 0 0 0 0 0 0 13524 3-30 <98% A
2 113_CLL_V3-30_UM_2del13q_del11q_A.xlsx 60 0 60 0 0 98 0 0 32063 3-30 >98% A
2 114_CLL_V3-30_M_del13q_A.xlsx 88 0 0 0 0 0 0 0 33146 3-30 <98% A
2 105_CLL_V1-3_UM_2del13q_t14q_del11q_A.xlsx 73 0 58 0 86 0 21 0 11419 1-3 >98% A
2 123_CLL_V3-48_UM_2del13q_2del11q_A.xlsx 19 0 55 0 0 51 64 0 369289 3-48 >98% A
2 45_CLL_V3-21_M_del13q_B.xlsx 0 0 61 0 0 0 0 0 5314 3-21 <98% B
2 46multi_CLL_V3-21_M_del13q_C.xlsx 30 0 0 0 0 0 0 0 15309 3-21 <98% C
2 97_CLL_V1-69_UM_del13q_del11q_B.xlsx 25 0 0 0 0 95 0 0 17445 1-69 >98% B
2 125_CLL_V1-69_UM_2del13q_del17p_C.xlsx 91 0 93 0 0 0 0 44 23134 1-69 >98% C
2 126_CLL_V1-69_M_del13q_C.xlsx 40 0 0 0 0 0 0 0 45737 1-69 <98% C
2 110_CLL_V3-7_M_2del13q_B.xlsx 81 0 81 0 0 0 0 0 237817 3-7 <98% B
2 120_CLL_V3-48_M_del13q_t14q_C.xlsx 64 0 0 0 19 0 0 0 16670 3-48 <98% C
2 121_CLL_V3-48_M_2del13q_C.xlsx 77 0 66 0 0 0 0 0 26880 3-48 <98% C
2 122multi_CLL_V3-48_M_2del13q_C.xlsx 87 0 95 0 0 0 0 0 27200 3-48 <98% C
2 106_CLL_V4-39_M_2del13q_del11q_C.xlsx 51 0 47 0 0 68 0 0 190555 4-39 <98% C
3 2_ MBLhigh_V3-23_M_tris12.xlsx 0 0 0 91 0 0 0 0 1358 3-23 <98%
3 3multi_ MBLhigh_V3-23_UM_tris12.xlsx 0 0 0 87 0 0 0 0 3360 3-23 >98%
3 4multi_ MBLhigh_V3-23_M_tris12_del11q.xlsx 0 0 0 95 0 93 0 0 3443 3-23 <98%
3 5_ MBLhigh_V3-23_M_tris12_del11q.xlsx 0 0 0 93 0 20 0 0 4851 3-23 <98%
3 19_ MBLhigh_V3-48_UM_tris12.xlsx 0 0 0 84 0 0 0 0 1661 3-48 >98%
3 11multi_ MBLhigh_V4-39_UM_del13q.xlsx 0 0 0 93 0 0 0 0 700 4-39 >98%
3 7multi_ MBLhigh_V5-51_UM_tris12_t14q.xlsx 0 0 0 76 52 0 0 0 1900 5-51 >98%
3 8multi_ MBLhigh_V5-51_M_tris12.xlsx 0 0 0 93 0 0 0 0 2659 5-51 <98%
3 10_CLL_V3-21_UM_tris12_A.xlsx 0 0 0 75 0 0 0 0 30739 3-21 >98% A
3 17multi_CLL_V4-34_M_tris12_A.xlsx 0 0 0 75 0 0 0 0 5482 4-34 <98% A
3 21_CLL_V1-69_UM_tris12_A.xlsx 0 0 0 87 0 0 0 0 14470 1-69 >98% A
3 99_CLL_V1-69_UM_tris12_del11q_A.xlsx 0 0 0 33 0 24 0 0 30093 1-69 >98% A
3 100_CLL_V1-69_UM_t14q_A.xlsx 0 0 0 0 91 0 0 0 75170 1-69 >98% A
3 22_CLL_V1-69_UM_tris12_t14q_B.xlsx 0 0 0 73 82 0 0 0 46393 1-69 >98% B
3 23_CLL_V1-69_UM_tris12_t14q_B.xlsx 0 0 0 97 30 0 0 0 119647 1-69 >98% B
3 6_SLL_V3-11_UM_tris12_B.xlsx 0 0 0 84 0 0 0 0 2531 3-11 >98% B
3 18_CLL_V4-34_UM_tris_t14q_C.xlsx 0 0 0 73 82 0 0 0 19568 4-34 >98% C
3 13_CLL_V3-7_M_tris12_C.xlsx 0 0 0 78 0 0 0 0 9093 3-7 <98% C
3 14_CLL_V3-7_M_tris12_C.xlsx 0 0 0 85 0 0 0 0 15257 3-7 <98% C
3 15multi_CLL_V3-30_UM_tris12_del11q_B.xlsx 0 0 0 93 0 91 0 0 5412 3-30 >98% B
3 20_CLL_V3-48_M_tris12_t14q_B.xlsx 0 0 0 82 91 0 0 0 10807 3-48 <98% B
3 12_CLL_V4-39_UM_tris12_del17p_B.xlsx 0 0 0 80 0 0 0 35 22028 4-39 >98% B
3 9_CLL_V5-51_UM_tris12_B.xlsx 0 0 0 76 0 0 0 0 175686 5-51 >98% B
*The unmutated status of the IGHV genes (U) was defined as those with >98% identity with the most similar germline gene,
while mutated one (M) was those in which CLL-like B cell clones displayed IGHV genes with <98% identity with the most
similar germline gene. **only applicable to CLL cases.

Supplemental Table 2. IGHV sequences of CLL-like MBL and CLL B-cell clones analyzed by the IMGT-V-QUEST tool.
B-cell clon from #case number V-GENE and
allele Functionality
% Identity
V-REGION
J-GENE and
allele
D-GENE and
allele
D-REGION
reading
frame
CDR3
length AA JUNCTION
MBLlow from (monoclonal) #1 IGHV4-34*01 Productive 91.84% IGHJ4*02 IGHD2-15*01 2 20 CARGPPYCSGDSCSWGGILDYW
MBLlow from (monoclonal) #2 IGHV3-23*01 Productive 100.00% IGHJ6*02 IGHD3-10*01 1 11 CANRGETRGMDVW
MBLlow from (monoclonal) #3 IGHV3-7*01 Productive 96.39% IGHJ4*02 IGHD6-19*01 1 12 CVRDKYDSGSMDYW
MBLlow from (monoclonal) #4 IGHV3-21*01 Productive 92.34% IGHJ6*02 IGHD6-25*01 1 20 CARHHPVRESSATGHYYGMDVW
MBLlow from (monoclonal) #5 IGHV3-23*01 Productive 98.42% IGHJ6*02 IGHD5-12*01 1 11 CANRGETRGMDVW
MBLlow from (monoclonal) #6 IGHV3-48*03 Productive 90.36% IGHJ3*02 IGHD5-12*01 3 12 CVRDGFHYYGFDIW
MBLlow from (monoclonal) #7 IGHV3-23*01 Productive 95.98% IGHJ4*02 IGHD2-15*01 2 15 CAKHGSYSPDPYYFDYW
MBLlow from (monoclonal) #8 IGHV1-8*01 Productive 97.86% IGHJ4*02 IGHD2-21*02 2 13 CARGLGSASQSRDSW
MBLlow from (monoclonal) #9 IGHV4-34*01 Productive 96.57% IGHJ4*02 IGHD4-11*01 2 13 CARLGGDDSDYGFYW
MBLlow from (monoclonal) #10 IGHV3-7*03 Productive 85.54% IGHJ4*03 IGHD3-3*01 2 15 CVRENEFWSGGWGLDGW
MBLlow from (monoclonal) #11 IGHV3-23*01 Productive 99.6% IGHJ6*02 IGHD5-12*01 1 11 CANRGETRGMDVW
MBLlow from (monoclonal) #12 IGHV3-30*02 Productive 88.54% IGHJ3*02 IGHD1-26*01 3 20 CANLGESRGGGSYPAPDTFDIW
MBLlow from (monoclonal) #13 IGHV1-2*02 Productive 100.00% IGHJ4*02 IGHD6-19*01 3 13 CARLQWLGISHFDYW
MBLlow from (multiclonal) #14A IGHV3-23*01 Productive 99.6% IGHJ6*02 IGHD5-12*01 1 11 CANRGETRGMDVW
MBLlow from (multiclonal) #14B IGHV3-48*03 Productive 90.76% IGHJ3*02 IGHD5-12*01 3 12 CVRDGFHYYGFDIW
MBLlow from (multiclonal) #15B IGHV3-23*01 Productive 97.99% IGHJ6*02 IGHD6-19*01 1 22 CANAPTPYSSGWNPWDYYYGMDVW
MBLlow from (multiclonal) #16B IGHV3-11*03 Productive 96.79% IGHJ4*02 IGHD2-15*01 2 17 CAREEYCDGGTCYRLFDYW
MBLlow from (multiclonal) #17A IGHV3-74*01 Productive 90.32% IGHJ4*02 IGHD3-10*01 2 14 CARDLDGSGSGVFDWW
MBLlow from (multiclonal) #17B IGHV4-59*03 Productive 91.8% IGHJ6*01 IGHD3-10*01 2 15 CARGWRSTDSYYGMDVW
MBLlow from (multiclonal) #18B IGHV5-a*01 Productive 100.00% IGHJ6*03 IGHD6-19*01 2 21 CARHVAVAGTTWGPYYYYYMDVW
MBLlow from (multiclonal) #19B IGHV3-23*01 Productive 100.00% IGHJ4*02 IGHD2-2*01 2 15 CAKDHGEQFIGGCFDYW
MBLlow from (multiclonal) #20B IGHV1-69*01 Productive 100.00% IGHJ3*02 IGHD3-3*01 2 22 CARDNPKYYDFWSGYYAPPAFDIW
MBLlow from (multiclonal) #21C IGHV1-69*13 Productive 94.84% IGHJ4*02 IGHD4-11*01 2 15 CAREGKSRDNSNPFDYW
MBLlow from (multiclonal) #22B IGHV3-21*04 Productive 94.98% IGHJ6*02 IGHD2-15*01 3 9 CARDANGMDVW
MBLlow from (multiclonal) #23B IGHV4-34*01 Productive 96.68% IGHJ4*02 IGHD7-27*01 1 6 CAHLSGYW
MBLlow from (multiclonal) #23C IGHV3-11*04 Productive 97.57% IGHJ6*03 IGHD2-21*01 2 18 CARKTCASITNYYYYYMDVW
MBLlow from (multiclonal) #24B IGHV3-21*01 Productive 99.6% IGHJ4*02 IGHD6-13*01 2 11 CARVGAATGMDYW
MBLhigh from (monoclonal) #25 IGHV3-23*01 Productive 94.76% IGHJ3*02 IGHD1-7*01 3 18 CAKDLPSTYNWNSGGAFDIW
MBLhigh from (monoclonal) #26 IGHV3-23*01 Productive 90.36% IGHJ4*02 IGHD5-12*01 3 16 CTKDPRDTGYGGDAFDYW
MBLhigh from (monoclonal) #27 IGHV3-23*01 Productive 99.58% IGHJ6*02 IGHD3-3*01 2 22 CAKDNKYYDFWSGYYPVGTGMDVW
MBLhigh from (monoclonal) #28 IGHV3-53*01 Productive 92.31% IGHJ3*02 IGHD3-10*01 3 16 CARGPPQSRPVGDTFEIW
16
4

(Supplemental Table 2, continued)
B-cell clon from #case number V-GENE and
allele Functionality
% Identity
V-REGION
J-GENE and
allele
D-GENE and
allele
D-REGION
reading
frame
CDR3
length AA JUNCTION
MBLhigh from (monoclonal) #29 IGHV2-26*01 Productive 91.64% IGHJ4*03 IGHD5-18*01 3 15 CTRTRGYPYGDRYFDSW
MBLhigh from (monoclonal) #30 IGHV1-2*02 Productive 94.44% IGHJ3*02 IGHD4-17*01 2 13 CARGLNTDYGAFDIW
MBLhigh from (monoclonal) #31 IGHV1-2*02 Productive 91.88% IGHJ3*02 IGHD2-21*02 3 18 CARDRSVIVVTYILDAFDMW
MBLhigh from (monoclonal) #32 IGHV3-23*01 Productive 91.97% IGHJ5*01 IGHD6-13*01 1 8 CSKGGWGDSW
MBLhigh from (monoclonal) #33 IGHV3-74*01 Productive 94.51% IGHJ5*02 IGHD2-8*02 3 9 CARQLDMYSLW
MBLhigh from (monoclonal) #34 IGHV4-34*01 Productive 92.68% IGHJ6*02 IGHD3-16*01 2 20 CVRGYPSDYTERRYYYYGLDVW
MBLhigh from (monoclonal) #35 IGHV3-30*04 Productive 90.76% IGHJ3*02 IGHD2-2*01 2 18 CTRPHCSMSSCSWNDAFAIW
MBLhigh from (monoclonal) #36 IGHV3-23*01 Productive 91.94% IGHJ3*02 IGHD3-22*01 2 14 CAKFYDDIQPNAFDIW
MBLhigh from (monoclonal) #37 IGHV1-2*02 Productive 91.7% IGHJ4*02 IGHD5-18*01 3 15 CARDLEMRYSQGSFDSW
MBLhigh from (monoclonal) #38 IGHV3-11*01 Productive 99.2% IGHJ6*02 IGHD3-3*01 2 23 CARDRRDDFWSGYRIYYYYYGMDVW
MBLhigh from (monoclonal) #39 IGHV3-21*01 Productive 97.88% IGHJ6*02 IGHD1-26*01 3 9 CARDANGMDVW
MBLhigh from (monoclonal) #40 IGHV3-7*03 Productive 97.19% IGHJ4*02 IGHD6-19*01 1 9 CARGGWYGDYW
MBLhigh from (monoclonal) #41 IGHV4-39*01 Productive 100.00% IGHJ6*02 IGHD2-2*01 2 22 CARHRLGYCSSTSCYYYYYGMDVW
MBLhigh from (monoclonal) #42 IGHV3-15*01 Productive 91.39% IGHJ4*02 IGHD2-8*01 3 12 CTTDSMVYVDMDYW
MBLhigh from (monoclonal) #43 IGHV3-48*02 Productive 100.00% IGHJ6*02 IGHD2-2*01 3 23 CARDNTANDIVVVPADYYYYGMDVW
MBLhigh from (monoclonal) #44 IGHV3-23*01 Productive 90.76% IGHJ3*02 IGHD4-17*01 3 17 CAKDRTLATVIQKDTFDIW
MBLhigh from (monoclonal) #45 IGHV5-51*01 Productive 100.00% IGHJ6*02 IGHD3-3*01 2 19 CARRDFRGDFWSGYYYGMDVW
MBLhigh from (monoclonal) #46 IGHV3-23*01 Productive 95.32% IGHJ6*02 IGHD2-2*01 2 14 CAFHCCRISCYGVDFW
MBLhigh from (monoclonal) #47 IGHV4-34*01 Productive 93.67% IGHJ4*01 IGHD1-1*01 3 14 CARVIGDKGGYYLTYW
MBLhigh from (monoclonal) #48 IGHV3-48*01 Productive 99.59% IGHJ6*02 IGHD3-3*01 2 20 CARSPGYDFWSGYPDYYGMDVW
MBLhigh from (monoclonal) #49 IGHV1-2*02 Productive 96.02% IGHJ4*02 IGHD3-22*01 2 20 CARDLARYDSGGSYKRKMFDYW
MBLhigh from (multiclonal) #50B IGHV3-11*03 Productive 95.32% IGHJ4*02 IGHD6-19*01 1 10 CAKVRSHYFDYW
MBLhigh from (multiclonal) #51B IGHV3-21*04 Productive 96.65% IGHJ6*02 IGHD2-15*01 3 9 CARDANGMDVW
MBLhigh from (multiclonal) #52B IGHV3-33*01 Productive 99.6% IGHJ4*02 IGHD3-9*01 1 21 CARDPRVLRYFDWLLSPPPFDYW
MBLhigh from (multiclonal) #53A IGHV3-15*01 Productive 89.03% IGHJ4*02 IGHD2-21*01 2 12 CTTESGWYSASDHW
MBLhigh from (multiclonal) #53B IGHV3-30*03 Productive 94.27% IGHJ4*02 IGHD2-15*01 2 18 CAKDTWGHCSGGFCSHFDSW
MBLhigh from (multiclonal) #54B IGHV3-48*03 Productive 90.95% IGHJ3*02 IGHD3-3*01 2 20 CVRDDRSCSSNNCHALRSFDMW
MBLhigh from (multiclonal) #55B IGHV3-53*01 Productive 92.55% IGHJ6*02 IGHD2-8*01 1 19 CATHPTNIYTRWPYVSDMDVW
MBLhigh from (multiclonal) #56A IGHV3-23*01 Productive 100.00% IGHJ6*02 IGHD3-3*01 1 11 CAKDWESWGMDVW
MBLhigh from (multiclonal) #57A IGHV4-39*01 Productive 100.00% IGHJ5*02 IGHD6-13*01 1 19 CASVQGYSSSWYGGDNWFDPW
MBLhigh from (multiclonal) #57B IGHV3-23*01 Productive 100.00% IGHJ6*02 IGHD3-10*01 1 11 CANRGETRGMDVW
16
5

(Supplemental Table 2, continued)
B-cell clon from #case number V-GENE and
allele Functionality
% Identity
V-REGION
J-GENE and
allele
D-GENE and
allele
D-REGION
reading
frame
CDR3
length AA JUNCTION
MBLhigh from (multiclonal) #58A IGHV4-39*01 Productive 100.00% IGHJ5*02 IGHD3-3*01 2 20 CARHTSLYDFWSGYYRGWFDPW
MBLhigh from (multiclonal) #58B IGHV1-69*01 Productive 100.00% IGHJ4*02 IGHD5-18*01 2 17 CAREAGSIQLWPPGFFDYW
MBLhigh from (multiclonal) #59A IGHV3-7*01 Productive 93.57% IGHJ3*02 IGHD5-12*01 2 9 CARGRYVYDIW
MBLhigh from (multiclonal) #60A IGHV4-34*01 Productive 96.48% IGHJ4*02 IGHD5-24*01 1 19 CARAEGQATLLSVWEYYFDSW
MBLhigh from (multiclonal) #60B IGHV3-33*01 Productive 96.67% IGHJ2*01 IGHD6-19*01 1 17 CARDILITGGRGDWYFDLW
MBLhigh from (multiclonal) #61B IGHV3-72*01 Productive 95.92% IGHJ5*02 IGHD2-2*01 2 13 CVRSSTGWTDWFDPW
MBLhigh from (multiclonal) #62B IGHV4-34*01 Productive 96.81% IGHJ6*03 IGHD3-3*01 2 16 CARREDDNFWSGFYMDVW
MBLhigh from (multiclonal) #63B IGHV3-23*01 Productive 95.16% IGHJ4*02 IGHD2-15*01 2 18 CAKLSTPCGGGSCYSSLDYW
MBLhigh from (multiclonal) #64B IGHV4-34*01 Productive 95.12% IGHJ4*02 IGHD6-19*01 1 13 CARRDSSGWYYFDYW
MBLhigh from (multiclonal) #65A IGHV5-51*01 Productive 92.2% IGHJ4*01 IGHD5-18*01 3 14 CGRRRTGYNDGEIDYW
MBLhigh from (multiclonal) #65B IGHV4-30-4*01 Productive 97.81% IGHJ4*01 IGHD2-2*01 2 16 CARHPSCSRTSCYFFDYW
MBLhigh from (multiclonal) #66A IGHV5-51*01 Productive 100.00% IGHJ4*02 IGHD3-3*01 2 21 CARHGTYYDFWSGYYLPGFFDYW
MBLhigh from (multiclonal) #66B IGHV1-69*01 Productive 100.00% IGHJ6*02 IGHD6-13*01 1 26 CARQGAGSSWYGIVKGWFEYYYYGMDVW
MBLhigh from (multiclonal) #66C IGHV3-33*01 Productive 98.81% IGHJ3*02 IGHD3-3*01 1 22 CARGNGGALRFLEWLLYHDAFDIW
MBLhigh from (multiclonal) #67A IGHV1-3*01 Productive 97.96% IGHJ6*02 IGHD3-3*01 2 23 CARADGGYDFWSGYSTVNYYGMDVW
MBLhigh from (multiclonal) #67B IGHV3-9*01 Productive 93.57% IGHJ4*02 IGHD1-26*01 3 14 CARVESGSYFWPSDYW
CLL from (monoclonal) #68 IGHV3-23*01 Productive 93.57% IGHJ4*02 IGHD4-23*01 1 12 CAKGRQLWSYLDYW
CLL from (monoclonal) #69 IGHV1-2*02 Productive 99.59% IGHJ3*02 IGHD5-12*01 3 12 CARDGDYFDAFDIW
CLL from (monoclonal) #70 IGHV3-11*01 Productive 98.8% IGHJ4*02 IGHD3-3*01 2 22 CARDPRYYDFWSGYYLPDDKFDYW
CLL from (monoclonal) #71 IGHV3-7*01 Productive 93.98% IGHJ4*02 - - 8 CASGSHVDYY (TRP 118 not identified)
CLL from (monoclonal) #72 IGHV4-b*02 Productive 100.00% IGHJ4*02 IGHD5-18*01 2 13 CARSWIQLWSEFDYW
CLL from (monoclonal) #73 IGHV4-4*02 Productive 91.57% IGHJ6*02 IGHD5-12*01 1 25 CARGSRNVDIVATITFIGFYYYGMDVW
CLL from (monoclonal) #74 IGHV1-69*06 Productive 97.96% IGHJ6*03 IGHD3-3*01 2 24 CARAEQYYDFWSGHKGVDYYYYMDVW
CLL from (monoclonal) #75 IGHV3-11*01 Productive 97.91% IGHJ4*02 IGHD3-10*01 2 16 CARGPDPYYYGSGTPSYW
CLL from (monoclonal) #76 IGHV3-21*01 Productive 97.21% IGHJ5*02 IGHD3-9*01 1 22 CARDRRNGNFDWLEDPLYNWFDPW
CLL from (monoclonal) #77 IGHV3-9*01 Productive 90.91% IGHJ6*02 IGHD4-23*01 1 16 CAKDRSNTWPLWGGMDVW
CLL from (monoclonal) #78* IGHV1-2*02 Productive 99.57% IGHJ4*02 IGHD6-19*01 3 13 CARAQWLVLENFDYW
CLL from (monoclonal) #79 IGHV4-34*01 Productive 85.43% IGHJ3*02 IGHD5-12*01 2 17 CARREEDWKRSGRDSFDIW
CLL from (monoclonal) #80 IGHV1-69*01 Productive 95.1% IGHJ4*02 IGHD3-3*01 2 13 CAKGPYYDFWSGDYW
CLL from (monoclonal) #81 IGHV4-39*01 Productive 99.21% IGHJ4*02 IGHD3-16*02 2 19 CARHTYYDYVWGSYRTPFDYW
CLL from (monoclonal) #82 IGHV3-21*01 Productive 100.00% IGHJ4*02 IGHD2-2*02 2 21 CAREGGLGYCSSTSCYTTLFDYW
16
6

(Supplemental Table 2, continued)
B-cell clon from #case number V-GENE and
allele Functionality
% Identity
V-REGION
J-GENE and
allele
D-GENE and
allele
D-REGION
reading
frame
CDR3
length AA JUNCTION
CLL from (monoclonal) #83 IGHV3-72*01 Productive 89.41% IGHJ4*02 IGHD6-13*01 3 15 CVRSSMGAEQTIACDYW
CLL from (monoclonal) #84 IGHV3-30*01 Productive 95.2% IGHJ4*02 IGHD6-19*01 1 15 CARDDYSSGVGTRLSYW
CLL from (monoclonal) #85 IGHV4-4*03 Productive 92.77% IGHJ6*02 IGHD2-2*01 2 21 CARAPYCGSNTCYSYYYYGMDVW
CLL from (monoclonal) #86 IGHV4-34*01 Productive 89.72% IGHJ6*02 IGHD2-15*01 2 24 CAGRFYCSGDTCHLPLYHYYYGLDVW
CLL from (monoclonal) #87 IGHV3-23*01 Productive 94.78% IGHJ6*04 IGHD3-3*01 2 23 CARDLTHHNFWSAYYETSYCGMDVW
CLL from (monoclonal) #88 IGHV3-48*02 Productive 95.58% IGHJ6*03 IGHD5-24*01 3 18 CARQGEDYNNRGYYCYMDVW
CLL from (monoclonal) #89 IGHV1-2*02 Productive 98.29% IGHJ6*02 IGHD3-10*01 2 17 CARDPGGGDYYYYYGMDVW
CLL from (monoclonal) #90 IGHV4-39*01 Productive 92.97% IGHJ4*02 IGHD6-13*01 3 10 CARHEQQLADYW
CLL from (monoclonal) #91 IGHV4-34*01 Productive 95.98% IGHJ6*02 IGHD4-23*01 3 20 CARGYGSTGETRRYYYYGMDVW
CLL from (monoclonal) #92 IGHV4-59*01 Productive 100.00% IGHJ4*02 IGHD3-3*01 2 19 CARVVHYLDFWSGYTYYFDYW
CLL from (monoclonal) #93 IGHV3-64*01 Productive 95.58% IGHJ6*02 IGHD6-19*01 2 9 CAVDRTGMDVW
CLL from (monoclonal) #94 IGHV6-1*01 Productive 92.19% IGHJ4*02 IGHD6-19*01 1 18 CARSPSRYSNGWYERDFDCW
CLL from (monoclonal) #95 IGHV1-69*01 Productive 100.00% IGHJ6*02 IGHD6-19*01 2 21 CAREVVYGVAGTYYYYYYGMDVW
CLL from (monoclonal) #96 IGHV4-34*08 Productive 85.96% IGHJ4*02 IGHD3-22*01 2 13 CARGFHWGGYYLDFW
CLL from (monoclonal) #97 IGHV3-23*01 Productive 94.4% IGHJ4*02 IGHD2-15*01 2 18 CAKLSTPCGGGSCYSSLDYW
CLL from (monoclonal) #98 IGHV1-8*01 Productive 87.5% IGHJ6*02 IGHD3-3*01 2 21 CARGPSYYDFWSGPFDNYGMDVW
CLL from (monoclonal) #99* IGHV1-2*02 Productive 100.00% IGHJ4*02 IGHD6-19*01 3 13 CARAQWLVLENFDYW
CLL from (monoclonal) #100 IGHV3-7*01 Productive 94.38% IGHJ3*01 IGHD3-16*01 1 16 CASALRYLPYADTAFDLW
CLL from (monoclonal) #101 IGHV3-7*03 Productive 85.77% IGHJ4*03 IGHD3-3*01 2 15 CVRENEFWSGGWGLDGW
CLL from (monoclonal) #102 IGHV1-69*13 Productive 99.59% IGHJ6*02 IGHD3-3*01 3 22 CATTTITIFGVVTVYYYYYGMDVW
CLL from (monoclonal) #103 IGHV4-34*01 Productive 100.00% IGHJ4*02 IGHD3-10*01 2 20 CARGLIGAYGSGSYYPFPFDYW
CLL from (monoclonal) #104 IGHV1-69*01 Productive 100.00% IGHJ6*02 IGHD3-3*01 2 23 CARADGGYDFWSGYSTVNYYGMDVW
CLL from (monoclonal) #105 IGHV3-48*03 Productive 91.06% IGHJ3*02 IGHD5-12*01 3 12 CVRDGFHYYGFDIW
CLL from (monoclonal) #106 IGHV3-30*03 Productive 97.93% IGHJ6*03 IGHD3-3*01 2 30 CAKDQEQGPRPRYYDFWSAPPPWYYYYYMDVW
CLL from (monoclonal) #107 IGHV1-69*01 Productive 98.29% IGHJ5*02 IGHD3-3*01 2 15 CATDKKYYDFWSGYYLW
CLL from (monoclonal) #108 IGHV4-59*02 Productive 91.5% IGHJ4*02 IGHD1-14*01 3 13 CARHLRNDKYYLDFW
CLL from (monoclonal) #109 IGHV3-48*03 Productive 100.00% IGHJ6*02 IGHD3-3*01 2 21 CARDYDFWSGYYSYYYYYGMDVW
CLL from (monoclonal) #110 IGHV5-51*01 Productive 99.6% IGHJ6*03 IGHD2-2*01 2 23 CARYCSSTSCMTGTMGYYYYYMDVW
CLL from (monoclonal) #111 IGHV3-48*02 Productive 92.34% IGHJ4*02 IGHD6-13*01 1 14 CARDLGGNSWPTFDFW
CLL from (monoclonal) #112 IGHV3-30*03 Productive 89.56% IGHJ6*02 IGHD6-19*01 2 19 CAKIGMAGDFLEFRYYGMDVW
CLL from (monoclonal) #113 IGHV1-3*01 Productive 99.18% IGHJ6*02 IGHD3-22*01 2 25 CARDLTYYYDSSGYYYFNYYYYGMDVW
16
7

(Supplemental Table 2, continued)
B-cell clon from #case number V-GENE and
allele Functionality
% Identity
V-REGION
J-GENE and
allele
D-GENE and
allele
D-REGION
reading
frame
CDR3
length AA JUNCTION
CLL from (monoclonal) #114 IGHV3-7*03 Productive 85.54% IGHJ4*03 IGHD3-3*01 2 15 CVRENEFWSGGWGLDGW
CLL from (monoclonal) #115 IGHV4-59*01 Productive 91.94% IGHJ4*02 IGHD6-19*01 1 14 CARGPDISGWNGLDYW
CLL from (monoclonal) #116 IGHV4-34*01 Productive 91.46% IGHJ5*02 IGHD6-13*01 3 13 CATNSRESQGWFDPW
CLL from (monoclonal) #117 IGHV3-15*01 Productive 91.32% IGHJ6*02 IGHD2-15*01 2 23 CVTGPGYCSGGGCSSRGYYYGMDVW
CLL from (monoclonal) #118 IGHV3-30*04 Productive 100.00% IGHJ6*02 IGHD3-3*01 2 22 CARDLKTAYYDFWSGYYGDGMDVW
CLL from (monoclonal) #119 IGHV3-9*01 Productive 98.8% IGHJ6*02 IGHD3-3*01 2 26 CAKDKYYDFWSGYSHLGVLYYYYGMDVW
CLL from (monoclonal) #120 IGHV1-3*01 Productive 97.94% IGHJ6*02 IGHD3-3*01 2 23 CARADGGYDFWSGYSTVNYYGMDVW
CLL from (monoclonal) #121 IGHV1-18*01 Productive 100.00% IGHJ6*02 IGHD2-15*01 3 9 CARDANGMDVW
CLL from (monoclonal) #122 IGHV1-69*01 Productive 100.00% IGHJ3*02 IGHD3-16*02 2 21 CARGGNYDYIWGSYRPNDAFDIW
CLL from (monoclonal) #123 IGHV1-69*02 Productive 100.00% IGHJ6*03 IGHD2-15*01 3 22 CARSQAHIVVVVAATYYYYYMDVW
CLL from (monoclonal) #124 IGHV1-18*01 Productive 100.00% IGHJ4*02 IGHD7-27*01 3 13 CARKNWGPDYYFDYW
CLL from (monoclonal) #125 IGHV4-39*01 Productive 100.00% IGHJ6*01 IGHD2-2*01 2 22 CARHRLGYCSSTSCYYYYYGMDVW
CLL from (monoclonal) #126 IGHV1-69*01 Productive 98.76% IGHJ1*01 IGHD3-22*01 2 22 CARGSSTYYYDSSVYGVAEYFQHW
CLL from (monoclonal) #127 IGHV3-30*03 Productive 98.39% IGHJ4*02 IGHD3-22*01 2 21 CARGPNVSHTYYYDNSGSHFDYW
CLL from (monoclonal) #128 IGHV3-74*01 Productive 92.98% IGHJ4*02 IGHD2-2*01 3 15 CARVDIEVDGGGHFDNW
CLL from (monoclonal) #129 IGHV1-2*02 Productive 96.97% IGHJ4*02 IGHD2-8*01 1 15 CGRDVELRYWQGYFDLW
CLL from (monoclonal) #130 IGHV1-18*01 Productive 100.00% IGHJ6*02 IGHD6-13*01 1 19 CARDLSLSSNWFTPPYGMDVW
CLL from (monoclonal) #131 IGHV1-2*02 Productive 100.00% IGHJ5*01 IGHD3-3*01 2 32 CARAPRGDYDTEAGGAYSYGLEVWRLRRNRFDSW
CLL from (monoclonal) #132 IGHV4-39*07 Productive 100.00% IGHJ6*02 IGHD2-2*01 2 22 CARDRLGYCSSTSCYLYYYGMDVW
CLL from (monoclonal) #133 IGHV4-b*01 Productive 94.14% IGHJ1*01 IGHD2-15*01 2 20 CARLPHCTASRCYGGGRYVDQW
CLL from (monoclonal) #134 IGHV1-18*01 Productive 99.57% IGHJ6*02 IGHD3-9*01 2 20 CARGAYYDILTGYRYYYGMDVW
CLL from (monoclonal) #135 IGHV4-34*01 Productive 95.49% IGHJ4*02 IGHD2-15*01 2 11 CARGSAGSRLDYW
CLL from (monoclonal) #136 IGHV3-21*01 Productive 94.63% IGHJ6*02 - - 9 RTKDANGMDVW (2nd-CYS 104 not identified)
CLL from (monoclonal) #137 IGHV3-7*01 Productive 95.98% IGHJ4*02 IGHD2-2*01 2 16 CGSQCSTTSCPSSISEYW
CLL from (monoclonal) #138 IGHV1-69*01 Productive 100.00% IGHJ6*03 IGHD7-27*01 3 21 CARDTGLMTNWGYYYYYYYMDVW
CLL from (monoclonal) #139 IGHV3-7*03 Productive 92.59% IGHJ4*02 IGHD3-22*01 2 15 CARVSDETTGYGNFDYW
CLL from (monoclonal) #140 IGHV4-b*01 Productive 99.59% IGHJ4*02 IGHD5-18*01 2 13 CARAWIQLWSDFDYW
CLL from (monoclonal) #141 IGHV4-34*01 Productive 99.19% IGHJ6*02 IGHD2-2*01 3 21 CARADLLVVPAAIYYYYYGMDVW
CLL from (monoclonal) #142 IGHV3-48*03 Productive 91.13% IGHJ6*02 IGHD6-19*01 1 8 CSRRGRLDIW
CLL from (monoclonal) #143 IGHV3-30*03 Productive 96.37% IGHJ4*02 IGHD3-10*01 2 19 CANRGDTSGLGTCCQGIGDSW
CLL from (monoclonal) #144 IGHV4-61*02 Productive 91.63% IGHJ5*02 IGHD5-12*01 3 14 CAKRYGDHGEGWFDPW
16
8

(Supplemental Table 2, continued)
B-cell clon from #case number V-GENE and
allele Functionality
% Identity
V-REGION
J-GENE and
allele
D-GENE and
allele
D-REGION
reading
frame
CDR3
length AA JUNCTION
CLL from (monoclonal) #145 IGHV3-30*01 Productive 93.15% IGHJ4*02 IGHD3-10*01 3 17 CASGSMIGGVILPPGFDYW
CLL from (monoclonal) #146 IGHV3-53*01 Productive 100.00% IGHJ6*02 IGHD3-22*01 2 25 CAREGYYDSSGYSEAPHYYYYYGMDVW
CLL from (monoclonal) #147 IGHV2-70*11 Productive 96.21% IGHJ4*02 IGHD1-20*01 3 14 CARMQHRYHWNDSDSW
CLL from (monoclonal) #148 IGHV1-3*01 Productive 90.2% IGHJ5*01 IGHD3-9*01 1 19 CARGIRYSGWLLYGSDWYDSW
CLL from (monoclonal) #149 IGHV3-23*01 Productive 99.58% IGHJ6*02 IGHD5-12*01 1 11 CANRGETRGMDVW
CLL from (monoclonal) #150 IGHV4-39*01 Productive 100.00% IGHJ5*02 IGHD6-13*01 1 18 CATQTGYSSSWYAVNWFDPW
CLL from (monoclonal) #151 IGHV1-24*01 Productive 100.00% IGHJ6*02 IGHD3-9*01 2 24 CATDGYDILTGYYKGPGAYYYGMDVW
CLL from (monoclonal) #152 IGHV3-48*03 Productive 99.16% IGHJ3*02 IGHD5-12*01 3 12 CARDGFHYYGFDIW
CLL from (monoclonal) #153 IGHV4-61*02 Productive 92.65% IGHJ4*02 IGHD7-27*01 3 12 CARDNWGFEGFDSW
CLL from (monoclonal) #154 IGHV3-74*01 Productive 93.15% IGHJ3*01 IGHD4-23*01 3 14 CARGHKVVNPGSFDLW
CLL from (multiclonal) #155A IGHV4-34*01 Productive 93.06% IGHJ4*02 IGHD3-3*01 3 11 CARPNVGAVFVFW
CLL from (multiclonal) #156A IGHV4-34*01 Productive 96.69% IGHJ2*01 IGHD4-23*01 2 13 CARAGGYSDWYFDLW
CLL from (multiclonal) #157A IGHV3-9*01 Productive 100.00% IGHJ3*02 IGHD3-3*01 2 19 CAKDRYYDFWSGYYTAAFDIW
CLL from (multiclonal) #158A IGHV4-39*01 Productive 98.47% IGHJ6*02 IGHD3-3*01 1 18 CGILGEWLSFYFFFYGMDVW
CLL from (multiclonal) #159A IGHV3-30-3*01 Productive 91.13% IGHJ4*02 IGHD5-12*01 3 16 CARGKGRNSGYDYLLHYW
CLL from (multiclonal) #160A IGHV1-3*01 Productive 94.03% IGHJ5*02 IGHD5-18*01 1 19 CARDRVVIIPDTTTINWFDPW
CLL from (multiclonal) #161A IGHV3-48*02 Productive 96.34% IGHJ4*02 IGHD4-17*01 2 12 CARSSGDDSLIDYW
CLL from (multiclonal) #162A IGHV4-34*01 Productive 97.56% IGHJ6*02 IGHD3-10*01 2 17 CARGFDYYGSGSANGLDVW
CLL from (multiclonal) #163A IGHV1-46*01 Productive 100.00% IGHJ4*01 IGHD3-3*01 2 21 CARAHYYDFWSGYVYPRLAFDYW
CLL from (multiclonal) #164A IGHV3-53*01 Productive 100.00% IGHJ6*02 IGHD3-22*01 2 25 CAREGYYDSSGYSEAPHYYYYYGMDVW
CLL from (multiclonal) #165A IGHV1-3*01 Productive 96.2% IGHJ3*01 IGHD1-26*01 3 17 CARGLRSGTFYGADAFDFW
CLL from (multiclonal) #165B IGHV4-34*01 Productive 92.93% IGHJ3*02 IGHD2-15*01 3 26 TARGGLFVETEIAGVGYRSGTGTLFDSW (2nd-CYS 104 not identified)
CLL from (multiclonal) #166A IGHV3-33*01 Productive 91.5% IGHJ6*02 IGHD3-10*01 2 18 CARDDNRDGSGNYKGGMDFW
CLL from (multiclonal) #166B IGHV3-21*01 Productive 94.8% IGHJ4*02 IGHD4-23*01 2 13 CARDLDGGNSVFDYW
CLL from (multiclonal) #167A IGHV3-52*01(P) Productive** 96.06% IGHJ3*02 IGHD2-21*02 2 19 CMTVLWANRGGDCPGDAFDIW
CLL from (multiclonal) #168A IGHV4-34*01 Productive 98.78% IGHJ4*02 IGHD1-26*01 3 17 CARGPDRLYSGSYTRFDYW
CLL from (multiclonal) #169A IGHV3-48*02 Productive 93.6% IGHJ4*02 IGHD3-10*01 1 12 CVRELWFGNGGDYW
CLL from (multiclonal) #170A IGHV3-30*03 Productive 99.22% IGHJ6*02 IGHD3-9*01 1 25 CAKYGGVKLRYFDWLLYGDYYYGMDVW
CLL from (multiclonal) #171A IGHV3-33*01 Productive 99.61% IGHJ5*02 IGHD1-26*01 2 12 CARGELLHNWFDPW
CLL from (multiclonal) #171B IGHV3-23*01 Productive 99.18% IGHJ3*02 IGHD5-12*01 3 12 CAKDGFPYYGFDIW
CLL from (multiclonal) #172A IGHV2-26*01 Productive 91.91% IGHJ5*02 IGHD3-3*01 2 22 CAGTNIPRQFDFWSGSSPNWFDPW
16
9

(Supplemental Table 2, continued)
B-cell clon from #case number V-GENE and
allele Functionality
% Identity
V-REGION
J-GENE and
allele
D-GENE and
allele
D-REGION
reading
frame
CDR3
length AA JUNCTION
CLL from (multiclonal) #173A IGHV3-30*03 Productive 99.6% IGHJ6*02 IGHD3-9*01 1 25 CAKYGGVKLRYFDWLLYGDYYYGMDVW
CLL from (multiclonal) #174A IGHV4-39*01 Productive 98.76% IGHJ3*01 IGHD1-14*01 3 17 CASHRNTQTYNNRAAFDVW
CLL from (multiclonal) #175A IGHV5-51*01 Productive 100.00% IGHJ4*02 IGHD2-15*01 2 19 CARIPVAGYCRGGSCYPFDYW
CLL from (multiclonal) #175B IGHV4-34*01 Productive 99.16% IGHJ4*02 IGHD3-10*01 2 14 CARTKTYGSGPPGKYW
CLL from (multiclonal) #176A IGHV4-34*01 Productive 99.59% IGHJ4*02 IGHD3-10*01 2 15 CARGLYYYGSGVYFDYW
*B-cell clones from #78 and #99 corresponded to the same untreated CLL patient at recruitment and after 1-year evaluation, respectively; **however the closest V is a pseudogene.
Grey shadowed cells highlight those CDR3 of the IGHV genes identical or highly homologous. Scripts in cells indicate IMGT/JunctionAnalysis giving no results for that JUNCTION.
17
0

171
SUPPORTING INFORMATION
Supplemental Table 3. Diagnosis, differential immunophenotypic/IGHV features and cytogenetic
alterations of the coexisting aberrant B-cell populations from multiclonal MBL, CLL and other B-
CLPD cases (n=41).
Case ID
Phenotype of population 1 (% from WBC; compatible
diagnosis)
V(D)J rearrangement-MS†
iFISH
Phenotype of population 2 (% from WBC; compatible
diagnosis)
V(D)J rearrangement-MS†
iFISH*
1 FSC/SSClo CD19++ CD5+ CD20lo (62.9%; CLL)
V3-30(D3-9)J6-UM
ND FSC/SSCint CD19+hi CD5- CD20+ (4.1%; Non-CLL-like MBLhigh MZL)
V1-2(D5-5)J4-UM
ND
2¶ FSC/SSClo
lo FMC7lo CD23+ CD5+ CD43lo CD11clo (33%; CLL)
V3-30(D3-9)J6-UM
+12 (93%) del(11q22.3) (91%)
FSC/SSClo
lo FMC7lo CD23+ CD5+ CD43+ CD11c+ (21%; CLL-like MBLhigh)
V3-23(D2-15)J4-M
+12 (95%) del(11q22.3) (93%)
3 FSC/SSClo CD19+ lo CD5+ CD79blo
FMC7- (26.5%; CLL)
V1-3(D1-26)J3-M
ND FSC/SSCint CD19lo+ CD5het CD79b-
FMC7+ (25.7%; CLL)
V4-34(D2-15)J3-M
ND
4 FSC/SSCint
lo CD20lo CD79bloCD5+ (20.6%; CLL)
V3-53(D3-22)J6-UM
+12 (49%) polysomy
FSC/SSClo
lo CD20lo CD79bloCD5+ (0.6%; CLL-like MBLlow)
V1-69(D3-3)J3-UM
NDª
5 FSC/SSClo
loCD20lo CD5+ CD43+ CD23+ (44.2%; CLL)
V4-34(D3-3)J4-M
biallelic del(13q14.3) (99%)
FSC/SSClo
hiCD20+ CD5- CD43- CD23- (1.4%; Non-CLL-like MBLlow
MZL)
V1-8(D3-3)J5-UM
ND
6 FSC/SSClo
lo CD20lo FMC7- CD5+ CD23+ (33%; CLL)
V4-34(D4-23)J2-M
del(13q14.3) (96%) FSC/SSClo
lo CD20lo FMC7- CD5+ CD23+ (10.6%; CLL-likeMBLhigh)
V3-11(D6-19)J4-M
del(13q14.3) (96%)
7 FSC/SSCloCD19+ lo CD20lo CD5+ (34.6%; CLL)
V4-39(D3-3)J6-UM
ND FSC/SSCloCD19+ lo CD20lo CD5+ (9.4%; CLL-likeMBLhigh)
V3-33(D3-9)J4-M
ND
8 FSC/SSClo CD19lo CD43- CD5+ CD25+ IgM+ CD27+ CD11c+/het (50.2% CLL)
V1-3(D5-5)J5-M
ND FSC/SSClo CD19+ CD43+ CD5hi
CD25hi IgMhi CD27hi CD11c+ (5% CLL-like MBLhigh)
V3-53(D2-8)J6-M
ND
9 FSC/SSClo+ CD5+ CD20lo CD43-
(12.6%; CLL-like MBLhigh)
V3-23(D5-12)J6-UM
+12 (87%) FSC/SSClo+ CD5+ CD20lo CD43+
(3%; CLL-like MBLhigh)
V4-39(D6-13)J5-UM
+12 (93%)
10 FSC/SSClo
lo CD22lo CD23+ CD5+ (54.6%; CLL)
Not found
del(13q14.3) (96%) FSC/SSClo
lo CD22lo CD23+ CD5+ (4.1%; CLL-like MBLhigh)
V3-72(D2-2)J5-M
ND
11¶ FSC/SSClo CD19+ lo CD5+ CD79blo FMC7- (0.6%; CLL-like MBLlow)
V3-23(D5-12)J6-UM
ND FSC/SSClo CD19+ + CD5+ CD79blo FMC7- (1.6%; CLL-like MBLlow)
V3-48(D5-12)J6-M
del(13q14.3)(19%) +12 (41%)
12 FSC/SSCloCD19+lo CD5+ CD20lo (89%; CLL)
V4-39(D1-7)J3-UM
ND FSC/SSCloCD19+ lo CD5+ CD20lo (0.1%; CLL-like MBLlow)
V3-21(D6-13)J4-UM
ND
13 FSC/SSCloCD19+ lo CD20lo FMC7- CD5+ (49.9%; CLL)
V5-51(D2-15)J4-UM
ND FSC/SSCloCD19+ lo CD20lo FMC7- CD5+ (40.8%; CLL)
V4-34(D3-10)J4-UM
ND
14¶ FSC/SSClo+d CD20lo CD5+ CD22lo
CD23+ FMC7- (84%; CLL)
V4-34(D1-26)J4-UM
biallelic del(13q14.3) (85%);
FSC/SSClo
loCD20lo/het CD5+ CD22lo CD23+ FMC7- (0.7%; CLL-like MBLhigh)
V4-34(D3-3)J6-M
del(13q14.3) (83%)
15¶ FSC/SSCloCD19lo+ CD5- (11%;
CLL-like MBLhi)
V3-23(D3-22)J6-UM
ND FSC/SSCloCD19+ loCD5+ (1.1%; CLL-like MBLlow)
V3-11(D2-15)J4-M
NDª
16¶ FSC/SSChi CD19loCD38++CD10+
cBcl2+ sIg- c+ (20.6%; Non-CLL FL)
V3-11(D1-1)J3-M
t(14q32)(95%); t(14;18) (96%); +18q21 (95%) +8q24 (92%)
FSC/SSClo CD19+CD38-CD10-+ (2.5%; Non-CLL FL)
V3-23(D5-12)J6-UM
t(14;18) (90%); +8q21 (90%) +18q21 (87%)
17 FSC/SSCloCD19+ + CD5+ CD20lo CD11c- (59.3%; CLL)
V1-46(D3-3)J4-UM
ND FSC/SSClo CD19+ Ig- CD5- CD20hi CD11chi (0.5%; Non-CLL-like MBLlow MZL)
V3-53(D1-26)J4-M
ND

172
SUPPORTING INFORMATION
(Supplemental Table 3, continued)
Case
ID
Phenotype of population 1
(% from WBC; compatible
diagnosis)
V(D)J rearrangement-MS†
iFISH
Phenotype of population 2
(% from WBC; compatible
diagnosis)
V(D)J rearrangement-MS†
iFISH*
18¶ FSC/SSCloCD19+ CD5+ lo (15.6%; CLL-like MBLhigh)
V3-15(D3-3)J4-M
ND FSC/SSCloCD19+ CD5+ lo (10.1%; CLL-like MBLhigh)
V3-30(D5-12)J4-M
+12 (19%); del(13q14.3) (32%)
19¶ FSC/SSCloCD19+lo CD20lo CD5+ (44%; CLL)
V3-30(D5-12)J4-M
del(13q14.3) (80%) FSC/SSCloCD19+ loCD20lo CD5+ (0.3%; CLL-like MBLlow)
V3-23(D6-19)J6-UM
biallelic del(13q14.3) (73%)
20 FSC/SSCloCD19+ loCD20lo CD5+ (35.6%; CLL)
V4-34(D3-10)J6-M
+12 (75%);
FSC/SSCloCD19+ lo CD20lo CD5+ (0.5%; CLL-like MBLlow)
V5-a(D6-19)J6-UM
NDª
21 FSC/SSClo
hi FMC7+ CD5- CD23- CD43- (5.2%; Non-CLLMZL)
V4-61(D7-27)J4-M
ND FSC/SSClo
lo FMC7- CD5+ CD23+ CD43+ (2.3%; CLL-like MBLlow)
V3-21(D2-2)J6-M
ND
22 FSC/SSClo+ CD5+ CD20lo CD79blo
(6.4%; CLL-like MBLlow)
V3-74(D3-10)J4-M
NDª FSC/SSClo
loCD5+ CD20lo CD79b- (0.6%; CLL-like MBLlow)
V4-59(D3-10)J6-M
ND
23 FSC/SSCloCD19+ lo CD22lo CD23+ CD5+ (11.5%; CLL-like MBLhigh)
V4-34(D5-24)J4-M
ND FSC/SSCloCD19+ lo CD22lo CD23+ CD5+ (3.8%; CLL-like MBLhigh)
V3-33(D6-19)J2-M
ND
24 FSC/SSClo
lo CD20lo FMC7- CD5+ CD23+ (21.1%; CLL-like MBLhigh)
V5-51(D5-5)J4-M
+12 (93%) FSC/SSClo
lo CD20lo FMC7- CD5+ CD23+ (8.7%; CLL-like MBLhigh)
V4-30-4(D2-2)J4-M
ND
25 FSC/SSCloCD19+ lo CD5het CD20lo (17.8%; CLL-like MBLhigh)
V5-51(D3-3)J4-UM
+12(76%); t(14q32) (52%)
FSC/SSCloCD19+ lo CD5lo CD20lo (2.6%; CLL-like MBLhigh)
V1-69(D6-13)J6-UM
ND
26 FSC/SSClo+ CD5+ CD20lo CD43+
(23%; CLL-like MBLhigh)
V4-39(D3-3)J5-UM
del(13q14) (15%); del(13q14.3) (15%)
FSC/SSClo
lo CD5+ CD20lo CD43- (3.7%; CLL-like MBLhigh)
V1-69(D5-5)J4-UM
ND
27¶ FSC/SSClo
loCD20lo CD79blo CD5+ (10%; CLL-like MBLhigh)
V3-7(D5-12)J3-M
del(13q14) (98%); del(13q14.3) (98%)
FSC/SSClo
loCD20lo CD79blo CD5+ (0.6%; CLL-like MBLlow)
V3-23(D6-6)J4-M
ND
28 FSC/SSCloCD19+ + CD5+ CD20lo CD22- (68%; CLL)
V3-48(D4-17)J4-M
del(13q14) (95%); del(13q14.3) (87%)
FSC/SSCloCD19+ + CD11c+ CD5het CD20hi CD22+ (1.1%; Non-CLL-like MBLhigh MZL)
V1-69(D6-6)J4-M
ND
29¶ FSC/SSClo
lo CD19lo, CD20lo CD79b- CD43+ (36.4%; CLL)
V3-48(D3-10)J4-M
ND FSC/SSClo
hi CD19+, CD20hi
CD79b+ CD43- (16.7%; Non-CLL MALT)
V3-15(D4-17)J4-M
del(17p13) (91%)
30 FSC/SSClo
loFMC7lo CD5+ CD79b- CD23+ CD43+ (33.7%; CLL)
V4-34(D3-10)J4-UM
t(14q32) (98%) FSC/SSClo+ CD5- CD11c-
FMC7hiCD79bhet CD23- CD43- (8.4%; Non-CLL MALT)
V3-15(D6-6)J6-M
ND
31¶ FSC/SSCint
lo CD23+ CD5+ CD11c+ (24%; CLL)
V3-33(D2-15)J5-UM
ND FSC/SSClo
lo CD5+ CD23het CD11clo (20%; CLL)
V3-23(D5-12)J3-M
ND
32¶ FSC/SSCintCD19+ + CD20+ CD5- (17.7% Non-CLL MZL)
V4-39(D6-19)J4-M
ND FSC/SSCloCD19+ lo CD5+ CD20lo (3.2%; CLL-like MBLhigh)
V4-34(D6-19)J4-M
ND
33 FSC/SSCloCD19+dlo CD5+ CD20lo (65.3%; CLL)
V2-26(D3-3)J5-M
del(13q14.3) (81%) FSC/SSCloCD19hi+ CD5+ CD20hi
(12.5%; Non-CLL MZL)
V3-53(D2-15)J2-M
t(14q32) (28%)
34¶ FSC/SSClo+ CD19+ CD20hi CD22+
CD38- CD11c- CD25+ (65.8%; Non-CLL MALT)
V3-7(D2-21)J4-M
ND FSC/SSClo+ CD19+ CD20hi CD22+
CD38- CD11c- CD25+ (13.2%; Non-CLL MALT)
V3-23(D2-2)J2-M
ND
35¶ FSC/SSClo
lo CD20lo FMC7- CD5+ CD23+ (55.3%; CLL)
V3-9(D3-3)J3-UM
ND FSC/SSClo
lo CD20lo FMC7- CD5+ CD23+ (9.8%; CLL-likeMBLhigh)
V3-21(D2-2)J6-M
ND

173
SUPPORTING INFORMATION
(Supplemental Table 3, continued)
Case
ID
Phenotype of population 1
(% from WBC; compatible
diagnosis)
V(D)J rearrangement-MS†
iFISH
Phenotype of population 2
(% from WBC; compatible
diagnosis)
V(D)J rearrangement-MS†
iFISH*
36 FSC/SSCint
hiCD5+ CD11c+ FMC7lo (46%; Non-CLL MZL)
V1-2(D6-6)J5-UM
ND FSC/SSClo
hi CD5- CD11c- FMC7hi (40.9%; Non-CLL MALT)
V3-48(D1-26)J4-UM
ND
37¶ FSC/SSChi CD103+ CD25+ CD11c+ (21%; Non-CLL HCL)
V3-30(D3-3)J5-UM
NA FSC/SSClo
loCD5+ (0.8%; CLL-like MBLlow)
V3-11(D4-17)J6-M
NDª
38¶ FSC/SSCloCD19lo+ CD5+ CD20+
CD23- (38.6%; Non-CLL MZL)
V3-21(D6-13)J6-UM
+3q27 (89%) FSC/SSCloCD19hi
lo CD5+ CD20lo CD23+ (6.3%; CLL-likeMBLhigh)
V3-48(D3-3)J3-M
del(13q14.3) (18%)
39 FSC/SSClo
lo CD19+, CD20lo CD79b- CD43+ (24%; CLL-like MBLhigh)
V1-3(D3-3)J6-UM
ND FSC/SSClo
lo CD19+ CD20lo FMC7- CD5+ CD23+ (14%; CLL-like MBLhigh)
V3-9(D1-26)J4-M
del(13q14.3) (65%); t(14q32) (31%)
40¶ FSC/SSClo
loCD20lo CD5+ CD22lo CD23+ FMC7- (46.7%; CLL)
V3-33(D3-10)J6-M
biallelic del(13q14.3) (95%)
FSC/SSClo
loCD20lo/het CD5+ CD22lo CD23+ FMC7- (43.1%; CLL)
V3-21(D4-23)J4-M
del(13q14.3) (30%)
41 FSC/SSCint
lo CD5+ CD19+ CD11c- (87.1%; Non-CLL MCL)
V3-21(D3-3)J6-UM
t(11;14) (97%) FSC/SSClo+ CD11chi CD19hi
(1.3%; Non-CLL-like MBLlow MZL)
V4-34/D3-10/J5-M
ND
CLL, chronic lymphocytic leukemia/small lymphocytic lymphoma; HCL, hairy cell leukemia; LPL, lymphoplasmacytic
lymphoma; MZL, marginal zone lymphoma; FL, follicular lymphoma; MCL, mantle cell lymphoma; MALT, B-cell
lymphoma of mucosa-associated lymphoid tissue. + indicates antigen expression at normal levels; -, absence of
expression; het, heterogeneous antigen expression; hi, high antigen expression; lo, low antigen expression; int,
intermediate scatter; c, cytoplasmatic antigen expression. †MS, mutational status (UM, unmutated; M, mutated),
*FISH was performed on interphase nuclei from FACS-purified cells; ND: no chromosomal alterations detected by
iFISH for the probes studied; NA: not analyzed. An additional B-cell clone (population 3) was detected by interphase
FISH in case 2 (FSC/SSClo
lo CD23
lo CD5
lo CD43
lo CD11c
lo; 0.7%, CLL-like MBL
low; ND
a), case 25 (FSC/SSC
loCD19+ +
CD5hi
CD20lo
; 2.4%, CLL-like MBLhigh
; +12(66%)) and case 37 (FSC/SSClo
lo CD5+; 0.2%, CLL-like MBL
low; NDª)
aThe
percentage of B-cells from this subpopulation was very low and only allowed analysis for some iFISH probes (13q14,
13q14.3, 17p13.1 and 11q22.3). Genetic abnormalities present in one population were always evaluated also in the
other coexisting population.
¶Cases whose clones had IGHV aa sequences phylogenetically closer than those found in the rest of multiclonal
cases.

174
SUPPORTING INFORMATION
Supplemental Table 4. Peripheral blood B-cell counts and BCR features of multiclonal versus
monoclonal CLL-like and non-CLL-like B-cell clones.
CLL-like B-cells Non-CLL-like B-cells
Multiclonal B-cells
n=66 clones
Monoclonal B-cells
n=128 clones
Multiclonal B-cells
n=19 clones
Monoclonal B-cells
n=15 clones
N. of PB clonal B cells (x106/L)* 2,675 (0.6-71,485)a 10,956 (0.1-369,288) 4,375 (85-156,168) 4,771 (54-41,221)
% of PB clonal B cells from WBC* 13% (0.1%-89%)a 45% (0.001%-97%) 13% (0.5%-87%) 41% (1%-73%)
MBLlow
B-cell clones 14/66 (21%)a 13/128 (10%) 3/19 (16%) 2/15 (13%)
MBLhigh
B-cell clones 26/66 (39%)a 26/128 (20%) 2/19 (10%) 2/15 (13%)
CLL B-cell clones 26/66 (39%)a 89/128 (69%) NA NA
CLL-stage A clones 12/66 (18%)a 53/128 (41%) NA NA
CLL-stage B/C clones 8/66 (12%)a 36/128 (28%) NA NA
Non-CLL B-cell clones NA NA 14/19 (74%) 11/15 (73%)
IGHV mutated B-cell clones 40/66 (61%) 76/124 (61%) 11/19 (58%) 8/15 (53%)
% alignment of IGHV aa
sequences between coexisting
B-cell clones
51% (38%-79%) NA 62% (46%-76%)# NA
% alignment of IGHV aa
sequences between each B-cell
clone and the other clones
52% (31%-100%)a 50% (29%-100%) 51% (32%-89%)a 49% (33%-86%)
Results expressed as number of B-cell clones and percentage between brackets or as *median value (range).
PB, peripheral blood; WBC, white blood cells; CLL, chronic lymphocytic leukemia/small lymphocytic lymphoma;
MBLlow
, low count monoclonal B-cell lymphocytosis; IGHV, immunoglobulin heavy chain variable region genes;
CLL, chronic lymphocytic leukemia/small lymphocytic lymphoma; MBLhigh
, clinical monoclonal B-cell
lymphocytosis; aa, amino acids. NA, not appropriate.#Both coexisting B-cell clones showed Non-CLL-like
phenotype (n=4 cases) or the majority B-cell clone showed Non-CLL-like phenotype (n=4 cases). aStatistically
significant differences (P <0.05) found between clones from multiclonal vs. monoclonal cases.

175
SUPPORTING INFORMATION
Supplemental Table 5. Cytogenetic features of non-CLL like B-cell clones from monoclonal cases.
Clone type Type of cytogenetic changes / % aberrant B-cells analyzed by iFISH
Non-CLL-like MBLhigh
(MZL) trisomy 12+ (80%); and t(14q32)
+ (35%)
Non-CLL (FL) del(13q14.3)+ (18%); 3 copies of IGH gene (85%)*
Non-CLL (FL) t(14;18)+ (89%); and t(8;14)
+ (78%); polysomy
Non-CLL (MCL) t(11;14)+
(93%)
Non-CLL (MALT) t(14q32)+
(94%)
Non-CLL (MZL) t(14q32)+ (94%); 3 and 4 copies of IGH gene (53% and 37%, respectively)
Only cytogenetically altered clones are shown; cytogenetically non-altered clones from monoclonal cases included non-CLL MZL (n=5; 2
MBLlow, 1 MBLhigh and 2 MZL), MALT-lymphoma (n=1), MCL (n=1), DLBCL (n=1) and LPL (n=1). CLL, chronic lymphocytic leukemia/small
lymphocytic lymphoma; MBL, monoclonal B-cell lymphocytosis; DLBCL, diffuse large B-cell lymphoma; FL, follicular lymphoma; LPL,
lymphoplasmacytic lymphoma; MCL, mantle cell lymphoma; MZL, marginal zone B-cell lymphoma; MALT, B-cell lymphoma of mucosa-
associated lymphoid tissue; * t(14;18)+ by molecular studies; ND, not detected ; NA, not analyzed.

176
SUPPORTING INFORMATION
Supplemental Table 6. Monoclonal cases with B-cell clones sharing HCDR3 sequences of the
same length (± 1 amino acid) and belonging to identical or evolutionary highly-related VH
families.
Monoclonal Case
ID
VH families RDCH3
htgnel
aa composition of HCDR3 (% homology)#
149 V3-48 8 _WIDRGRLRSC_ (25)
158 V3-11 8 _WYDGSYFRAC_
66 V3-7 9 _WIDRYVYARGC_ (44)
136 V3-7 9 _WYDGWYGARGC_
113 V3-74 9 _WRQLDMYSLAC_ (11)
121 V3-64 9 _WVDRTGMDVAC_
92 V3-23 12 _WYLDGRQLWSYAKC_ (33)
153 V3-23 12 _WIFDDGFTKDVAKC_
16 V1-2 13 _WIFDGLNTDYGAARC_ (31)
18 V1-2 13 _WYFDAQWLVLENARC_
201 V4-34 13 _WFLDRGFHWGGYYAC_ (23)
206 V4-34 13 _WPFDTNSRESQGWAC_
190 V4-34 14 _WYDIRYYDFSAPAPAC_ (29)
214 V4-34 14 _WYTLIGDKGGYYVRAC_
205 V4-59 14 _WYLDNGGWPDISARGC_ (50)
218 V4-61 14 _WPGWFDDHGEGRYAKC_
124 V3-23 14 _WDIQPNAFIKFYDDAC_ (29)
145 V3-23 14 _WDFSCYGVIFHCCRAC_
24 V1-2 15 _WSFDSQGSRDLEMRYAC_ (60)
35 V1-2 15 _WYFDLQGWRDVELRYGC_
125 V3-7 16 _WLDFTARYLPYADLASAC_ (31)
147 V3-7 16 _WYESSISTTSCPSCQSGC_
105 V3-23 16 _WYFDADGYGGTPRDKDTC_ (35)
142 V3-23 17 _WIFDTDVIQKTRTLAKDAC_
142 V3-23 17 _WFDIRTLATVIQKDTAKDC_ (35)
104 V3-23 18 _WFDILPSTYNWNSGGAAKDC_
151 V3-30 17 _WDYFILPPGVGGIASGSMC_ (18)
120 V3-30 18 _WAIFSWNDACSSMTRPHCSC_
132 V3-30 19 _WVGMDEFRYYLDFGMAGKIAC_ (37)
150 V3-30 19 _WSDGGIGTCCQGLDTSGNRAC_
96 V3-21 20 _WYYGMDVATGHSHHPVRESRAC_ (45)
155 V3-48 20 _WYYGMDVGYPDSSPGYDFWARC_
196 V4-34 20 _WVLDYYGYYTERRYYPSDVRGC_ (40)
202 V4-34 20 _WYFDPFPYYGSGSYLIGAARGC_
198 V4-34 20 _WVMDYYGYYRRTEGSTGYARGC_ (50)
202 V4-34 20 _WYFDPFPYYGSGSAYGLIARGC_
155 V3-48 20 _WYYGMDVPDYDFWSGYSPGARC_ (71)
130 V3-48 21 _WYYGMDVYSYYYYDFWSGYDARC_
96 V3-21 20 _WVMDYGYGHTASHHPVRESARC_ (35)
114 V3-21 21 _WYFDTTLYSCTSSEGGLGYCARC_

177
SUPPORTING INFORMATION
(Supplemental Table 6, continued)
Monoclonal Case ID
VH families RDCH3 htgnel
aa composition of HCDR3 (% homology)#
130 V3-48 21 _WVMDGYYYYYSYGYWSFYDARDC_ (48)
114 V3-21 21 _WYFDTTLYSTSCSCLGYGGAREC_
22 V1-69 21 _WMDVGYYYYYYTGVAGVVYAREC_ (67)
39 V1-69 21 _WGYYYYYYYMDVLMTNWGTARDC_
22 V1-69 21 _WMDVYYYYYGGTYAVGYEVVARC_ (48)
31 V1-69 21 _WFDIARPNDGSYWIDYYGGNARC_
31 V1-69 21 _WFDIRPNDAYSWGNYDYIGGARC_ (43)
39 V1-69 21 _WMDVYYYYYYYWGLMTNGDTARC_
143 V3-30 21 _WYFDSHGTYYYDNSHGPNVSARC_ (28)
138 V3-30 22 _WVMDDGGDFWSGYYYDLKTAYARC_
114 V3-21 21 _WYFDTTLCYSSTSCLGYGGAREC_ (42)
110 V3-21 22 _WPFDNWYLEDPLNFDWGRRNARDC_
114 V3-21 21 _WYFDTTLCYSSTSCGYLGGEARC_ (42)
157 V3-21 22 _WVMDYYYGIYMEGLSAWLLRARGC_
110 V3-21 22 _WPDNWFYPLDEWLRNGNFDRDARC_ (36)
157 V3-21 22 _WVDYYYGMYGIELMWLLSARGARC_
110 V3-21 22 _WPFDYNWLLEDPWDFNGNRRARDC_ (41)
93 V3-11 22 _WYFDPDDKLSGYYFWYYDRPARDC_
157 V3-21 22 _WVMDYYGYYIGGRLSAWLLMEARC_ (32)
93 V3-11 22 _WYFDLPDDKGYYDPRYYDFWSARC_
26 V1-69 22 _WDVMGYYYYTVYITIFGVVTTTAC_ (32)
34 V1-69 22 _WQHYFGVAESVYSTYYYDSSRGAC_
26 V1-69 22 _WYYGMDVYYYTVVVFGTTTITIAC_ (50)
27 V1-69 23 _WYYGMDVNTVYSGSWDFRADGGYAC_
34 V1-69 22 _WEYFQHAGVYYYDSSVYGSSTARC_ (23)
27 V1-69 23 _WNYYGMDVVSTYDFWSGYADGGARC_
129 V3-11 23 _WYYYYGMDVRRDDFWSGYRIYARDC_ (48)
141 V3-48 23 _WYYYYGMDVNTANDIVVVPADARDC_
27 V1-69 23 _WMDVGYYNVYSTYDFWSGGGARADC_ (69)
15 V1-69 24 _WMDVYYYYDVHKGYDFWSGQYARAEC_
Amino acids with an analogous side-chain polarity (highlighted in gray): L,F; A,V; I,L; K,R; L,V; L,M; L,C; T,S; A,I;
D,E; I,M; V,C; L,F; M,F; I,V; H,Y; I,C; F,W. #Number of aa with an analogous side-chain polarity (excluding the
delineating C_ and _W positions)/HCDR3 length*100.

178
SUPPORTING INFORMATION
Supplemental Table 7. Haematological features of B-CLPD cases who received chemotherapy.
No. of case Abs. No. Clonal B-cells (x106/L) Binet Stage MAP
Monoclonal Subjects 33 12 640 A Yes
34 23 134 C No
35 5 314 B No
36 44 428 B Yes
37 18 600 B Yes
38 29 376 B Yes
Multiclonal Subjects 5 Clone A: 11 724 Clone B: 2 078
B Yes
26 Clone A: 49 600
Clone B: 350 B Yes
39 Clone A: 5 438 Clone B: 158
C No
40* Clone A, HCL: 1 029
Clone B, CLL-like MBLlow: 39 Clone C, CLL-like MBLlow: 10
- No
*This case corresponded to a hairy cell leukemia patient. Gray shadowed clonal B-cells represent multiclonal B-CLPD cases with
stereotyped CLL-like B-cell clones. CLL, chronic lymphocytic leukemia; MBL, monoclonal B-cell lymphocytosis; HCL, hairy cell
leukemia; B-CLPD, B-cell chronic lymphoproliferative disorders; MAP, myelodysplasia-associated phenotype; -, not applicable.