blue light from cell phones can cause chronic retinal
TRANSCRIPT

Research ArticleBlue Light from Cell Phones Can Cause Chronic Retinal LightInjury: The Evidence from a Clinical Observational Study and a SDRat Model
Huili Li ,1 Ming Zhang ,2 Dahong Wang ,1 Guojun Dong ,1 Zhiwei Chen ,1
Suilin Li ,1 Xiaohong Sun ,1 Min Zeng ,2,3 Haiyang Liao ,4 Huifang Chen ,5
Shengyan Xiao ,1 and Xiaodan Li 1
1Department of Ophthalmology, Chongqing Hospital of Traditional Chinese Medicine, Chongqing 400021, China2Department of Ophthalmology, Huaxi Hospital, Sichuan University, Chengdu 610041, China3Department of Pathology, Chongqing Hospital of Traditional Chinese Medicine, Chongqing 400021, China4School of Optoelectronic Engineering, Chongqing University, Chongqing 400044, China5Department of Radiology, Chongqing University Cancer Hospital & Chongqing Cancer, Institute & Chongqing Cancer Hospital,Chongqing 400030, China
Correspondence should be addressed to Huili Li; [email protected]
Received 17 July 2020; Revised 7 April 2021; Accepted 21 April 2021; Published 17 May 2021
Academic Editor: Chieko Koike
Copyright © 2021 Huili Li et al. This is an open access article distributed under the Creative Commons Attribution License, whichpermits unrestricted use, distribution, and reproduction in any medium, provided the original work is properly cited.
Background. To investigate the chronic photodamage induced by the low-intensity blue light of phones, we carried out a clinicalpilot study and established an animal model by irradiating SD rats with a homemade illuminator. Methods. Clinicalinvestigation: A total of 25 clinical medical workers in our hospital were selected and divided into a control group and anobservation group according to the daily video terminal use time. Multifocal electrophysiological system (Mf-ERG) was used forretinal functional examination. Animal experiment: A total of sixty SD rats were randomly divided into a control group (n = 6)and an experimental group (n = 54). The experimental rats were divided into nine groups, which were exposed to the blue lightilluminator of the simulated cell phone array for different time. The visual electrophysiology of the rats was tested, and changesin structure were observed by H&E staining and transmission electron microscopy. Results. In clinical investigation, macularcenters near the concave area retinal photoreceptor cells have reduced amplitude. In animal experiments, the amplitude ofphotoreceptor cells decreased, the peak time was delayed, and the amplitudes were lower in the experimental groups. H&Estaining and transmission electron microscope showed retinal tissue structure and functional damage in experimental groups.Conclusions. Long-term exposure to low-illuminance blue light can cause retinal tissue structure and functional damage, and thechronic damage due to low-illuminance light warrants attention. The clinical registration number is 2018-KY-KS-LHL.
1. Introduction
As we know, the blue light of the screens of mobile phonesand computers is harmful to people [1]. Blue light is a lightthat has always existed in nature, and blue light is safe withina certain range. However, if the human eye is exposed to highfrequency and high energy blue light for a long time, retinaldamage is inevitable. Blue light is also known as “high energyvisible light”, referring to wavelengths of 400 to 500nm, andonly short-wavelength blue light is damaging [2] [3].
LED light sources contain different doses of shortwaveblue light (400 nm-480 nm), which widely exists in lightingequipment, computers, mobile phones, and other electronicproducts [4, 5]. Previous studies revealed that exposure toblue light for a long time can cause retinal light damage [6].At present, research on blue light is mainly focused on acutelight injury with high illuminance (>1000 lux) [4, 7, 8]. How-ever, research regarding the effect of low-illuminance (<100lux) blue light on the retinal tissue structure remains scarce,and most of the experiments used irradiation by a blue light
HindawiBioMed Research InternationalVolume 2021, Article ID 3236892, 13 pageshttps://doi.org/10.1155/2021/3236892

point source [9–11]. The irradiance of a point light sourcewill disperse with increasing irradiating distance [12]. How-ever, an area array light source has a large irradiance rangein the same plane, the irradiance of the light source at thesame distance from the vertical center is less different, theirradiance is more uniform, and the experimental data aremore stable [13, 14].
Blue light irradiation increases the reactive oxygen spe-cies in the retina. Excessive reactive oxygen species causesabnormal oxygen metabolism in the cells, forming severeoxidative stress and destroying the body’s normal redoxdynamic balance. Oxidative stress caused lipofuscin deposi-tion in retinal pigment epithelium cells, drusen, and choroi-dal microvascular changes, which ultimately promoted theoccurrence of age-related macular degeneration (AMD) [15].
To evaluate the effect of early macular visual functionobjectively, noninvasively, and quantitatively, the responseof several small retinal regions in the stimulated macular areawas studied. Based on the clinical data survey results, wefound that prolonged use of a video terminal will affect theretina. Then, based on the extensive use of cell phones indaily life in all the user groups, we used animal models tosimulate cell phone area array blue light for further explo-ration. Based on the above information, the current studyis aimed at exploring the role of low-illuminance blue lightin retinal tissue structure and functional damage usingirradiated SD rats with simulated blue light from a cellphone array.
2. Methods
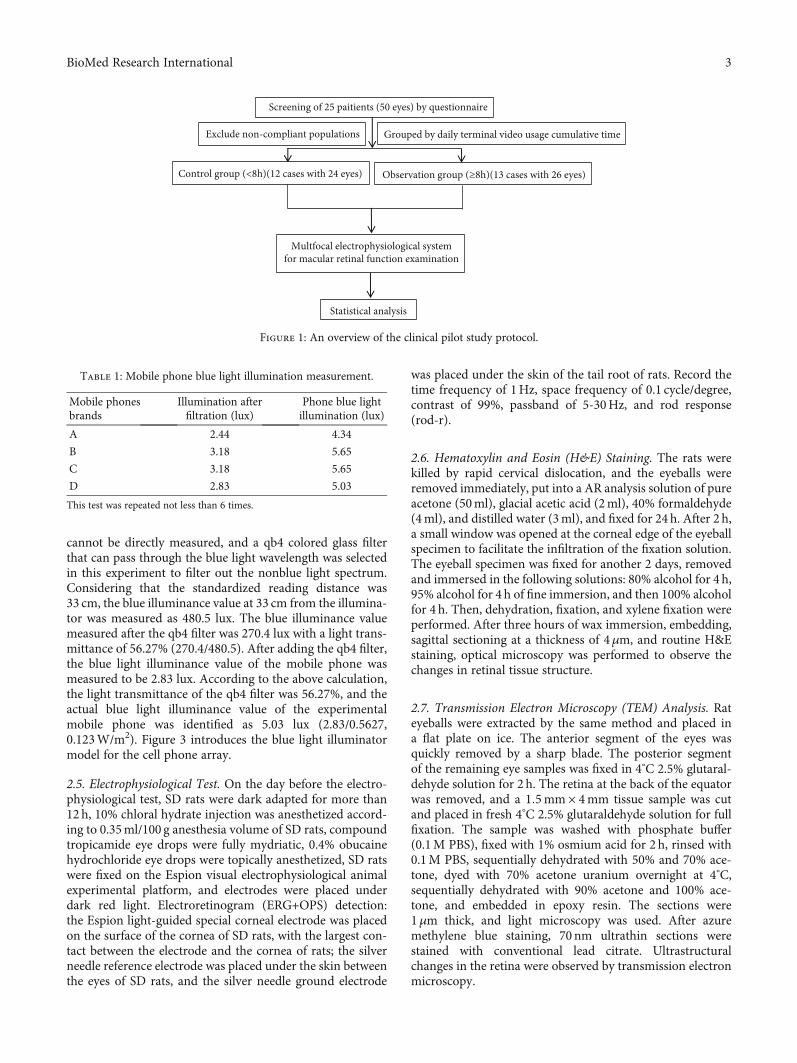
2.1. Subjects. Ethical approval and written informed consentwere obtained for this study. The human and animal experi-ments in this research were approved by the ethical committeeat Chongqing Hospital of Traditional Chinese Medicine.Twenty-five long-term VDT operation volunteers (50 eyes)who worked in our hospital from 2018 to 2019 were selected.Volunteers were between 24 and 36 years old, with an averageage of 28:86 ± 3:50 years. Diopter ≤ −3:00D (astigmatism <−1:00D, half of the astigmatism was included in the equivalentspherical power). The total video duration of using mobilephones, computers, and other terminals was >5 years. Thosewith eye disease or who were pregnant or breastfeeding wereexcluded. This study was approved by the Chongqing Hospitalof Traditional Chinese Medicine. The clinical investigationinclusion criteria and process are shown in Figure 1. There were3males (12.00%) and 22 females (88.00%). The right eyewas thedominant eye in 19 cases (79.17%), and the left eyewas the dom-inant eye in 6 cases (20.83%). The survey file for the daily use ofvideo terminals is shown in supplementary material 1.
2.2. Animals. All rats were provided by the experimental ani-mal center of Chongqing Medical University. SPF (specificpathogen free) SD rats were raised in separate cages at roomtemperature (18-20°C), a relative humidity of 40%-70%, anda ventilation of 8-12 times/h under a 12/12 h light/dark cycle.A total of sixty (male-female ratio, 1 : 1) 6-week-old SD ratswere randomly divided into a normal control group (n = 6)and an experimental group (n = 54). The normal control
group was fed without any intervention. The experimentalgroup was divided into nine groups (3 h, 6 h, and 12 h, testedat 4 weeks, 8 weeks, and 12 weeks). Each day, the rats wereirradiated with a simulated cell phone array blue light illumi-nator (455 nm-470 nm, 5.03 lux (Ee = Ev/Km/V), Ee = 0:123W/m2) for 3 h (08 : 00-11 : 00), 6 h (08 : 00-14 : 00), or 12h(08 : 00-20 : 00), respectively. From 20 : 00 to the next day08 : 00 was dark adapted time. Visual electrophysiology wasperformed at 4 weeks, 8 weeks, or 12 weeks. Then, sampleswere collected. The breeding and use of laboratory animalsfollowed the Use of Animals in Ophthalmic and VisionResearch statement.
2.3. Multifocal Electroretinogram Examination. All inspec-tions are performed by the same technician. AGerman Rollandreti-port/scan 21 multifocal electrophysiological system wasused. The stimulator was 19 color graphic stimulators with aLED background screen, the frame frequency was 50~60Hz,and the stimulus field was 61 hexagons with graduallyincreasing eccentricity, occupying the eye. The horizontaldiameter of the bottom image was 53.2°, while the verticaldiameter was 44.2°. Each hexagon had a pseudorandomlyassigned black and white inversion. The maximum brightnesswas 220CD/m2, the minimum brightness was 3CD/m2, and adiagonal “X” shape was set in the center of the stimulus field.The signal was amplified 150,000 times, with the high frequencyending at 100Hz and the low frequency ending at 10Hz.
2.4. The Manufacture of Blue Light Illuminator from anAnalog Cell Phone Array. The spectrum of the white screenof the mobile phone is composite light. Light other than bluelight will increase the blue light illuminance. The blue lightilluminance value of the mobile phone is equal to the valuemeasured after the mobile phone composite light passesthrough the filter divided by the light transmittance of thefilter. In a dark room, the calibrated illuminance meterequipped with the light-transmitting lens with a wavelengthof only 435-465 nm required for this experiment was placedvertically 33 cm from the mobile phone. The filter was paral-lel to and covered the detection head, and the mobile phoneposition was measured in the same horizontal plane to mea-sure the brightest value of the mobile phone. According tothe measurement results (Table 1), the illuminance of thebrand D after being filtered by the filter at a distance of33 cm from the mobile phone was 2.83 lux, and the lighttransmittance of the filter, as calculated previously, was56.27%. The blue light illuminance of the mobile phone wascalculated to be 2:83/0:5627 = 5:03 lux ð0:123W/m2Þ. Anoverview of the experimental protocol is shown in Figure 2.
Based on the blue light illuminance test of several main-stream mobile phones on the market, the mobile phone withthe lowest blue light illuminance was selected as the experi-mental mobile phone, and the white screen was set to themaximum brightness to generate the white screen spectralradiation. The blue light wavelength of the experimentalmobile phone was between 435nm and 465nm, and the peakwas 449nm, as detected by the Chongqing Medical Equip-ment Quality Inspection Center. Because the white screenspectrum is a composite spectrum, the blue illuminance
2 BioMed Research International
cannot be directly measured, and a qb4 colored glass filterthat can pass through the blue light wavelength was selectedin this experiment to filter out the nonblue light spectrum.Considering that the standardized reading distance was33 cm, the blue illuminance value at 33 cm from the illumina-tor was measured as 480.5 lux. The blue illuminance valuemeasured after the qb4 filter was 270.4 lux with a light trans-mittance of 56.27% (270.4/480.5). After adding the qb4 filter,the blue light illuminance value of the mobile phone wasmeasured to be 2.83 lux. According to the above calculation,the light transmittance of the qb4 filter was 56.27%, and theactual blue light illuminance value of the experimentalmobile phone was identified as 5.03 lux (2.83/0.5627,0.123W/m2). Figure 3 introduces the blue light illuminatormodel for the cell phone array.
2.5. Electrophysiological Test. On the day before the electro-physiological test, SD rats were dark adapted for more than12 h, 10% chloral hydrate injection was anesthetized accord-ing to 0.35ml/100 g anesthesia volume of SD rats, compoundtropicamide eye drops were fully mydriatic, 0.4% obucainehydrochloride eye drops were topically anesthetized, SD ratswere fixed on the Espion visual electrophysiological animalexperimental platform, and electrodes were placed underdark red light. Electroretinogram (ERG+OPS) detection:the Espion light-guided special corneal electrode was placedon the surface of the cornea of SD rats, with the largest con-tact between the electrode and the cornea of rats; the silverneedle reference electrode was placed under the skin betweenthe eyes of SD rats, and the silver needle ground electrode
was placed under the skin of the tail root of rats. Record thetime frequency of 1Hz, space frequency of 0.1 cycle/degree,contrast of 99%, passband of 5-30Hz, and rod response(rod-r).
2.6. Hematoxylin and Eosin (H&E) Staining. The rats werekilled by rapid cervical dislocation, and the eyeballs wereremoved immediately, put into a AR analysis solution of pureacetone (50ml), glacial acetic acid (2ml), 40% formaldehyde(4ml), and distilled water (3ml), and fixed for 24 h. After 2 h,a small window was opened at the corneal edge of the eyeballspecimen to facilitate the infiltration of the fixation solution.The eyeball specimen was fixed for another 2 days, removedand immersed in the following solutions: 80% alcohol for 4 h,95% alcohol for 4 h of fine immersion, and then 100% alcoholfor 4 h. Then, dehydration, fixation, and xylene fixation wereperformed. After three hours of wax immersion, embedding,sagittal sectioning at a thickness of 4μm, and routine H&Estaining, optical microscopy was performed to observe thechanges in retinal tissue structure.
2.7. Transmission Electron Microscopy (TEM) Analysis. Rateyeballs were extracted by the same method and placed ina flat plate on ice. The anterior segment of the eyes wasquickly removed by a sharp blade. The posterior segmentof the remaining eye samples was fixed in 4°C 2.5% glutaral-dehyde solution for 2 h. The retina at the back of the equatorwas removed, and a 1:5mm × 4mm tissue sample was cutand placed in fresh 4°C 2.5% glutaraldehyde solution for fullfixation. The sample was washed with phosphate buffer(0.1M PBS), fixed with 1% osmium acid for 2 h, rinsed with0.1M PBS, sequentially dehydrated with 50% and 70% ace-tone, dyed with 70% acetone uranium overnight at 4°C,sequentially dehydrated with 90% acetone and 100% ace-tone, and embedded in epoxy resin. The sections were1μm thick, and light microscopy was used. After azuremethylene blue staining, 70 nm ultrathin sections werestained with conventional lead citrate. Ultrastructuralchanges in the retina were observed by transmission electronmicroscopy.
Screening of 25 paitients (50 eyes) by questionnaire
Exclude non-compliant populations Grouped by daily terminal video usage cumulative time
Control group (<8h)(12 cases with 24 eyes) Observation group (≥8h)(13 cases with 26 eyes)
Statistical analysis
Multfocal electrophysiological systemfor macular retinal function examination
Figure 1: An overview of the clinical pilot study protocol.
Table 1: Mobile phone blue light illumination measurement.
Mobile phonesbrands
Illumination afterfiltration (lux)
Phone blue lightillumination (lux)
A 2.44 4.34
B 3.18 5.65
C 3.18 5.65
D 2.83 5.03
This test was repeated not less than 6 times.
3BioMed Research International

2.8. Statistical Analysis. The measurement data are repre-sented as x ± s, and the count data were represented by thenumber of cases and composition ratio. For continuous data,a normality test was first performed. If each group met thenormality criteria, and if the variances between the twogroups were homogeneous, a t-test was used for intergroupcomparisons, and a paired t-test was used to compare the leftand right eyes. If the above conditions are not satisfied, anonparametric test and a paired rank sum test were used.P < 0:05 was considered statistically significant. The SPSS24.0 statistical software was used to analyze the variance dif-ferent treatment methods and different radiation doses with amultivariate factorial design between. The test method wastheWilks’ Lambda method. Based on the interaction of treat-ment methods and radiation doses, the multiple mean vec-tors of each group were compared at each time level, andthe Hotelling T2 test was used.
3. Results
3.1. Mf-ERG Showed Blue Light from the Terminal Video for aLong Time Induced Macular Center near the Concave AreaFunctional Damage. In the observation group, there were13 patients (26 eyes), 3 males (23.08%) and 10 females(76.92%). The average age was 27:92 ± 3:35 years. The dom-inant eye was the right eye in 10 cases (76.92%), and in 3cases (23.08%), the dominant eye was the left eye. The con-trol group included 12 female patients (24 eyes). The averageage was 28:83 ± 3:74 years. The dominant eye was the righteye in 9 cases (75.00%) and the left eye in 3 cases (25.00%).Diopter ≤ −3:00D. The half quantity of dispersion isincluded in the equivalent sphericity (SE). There was no sig-nificant difference in gender, age, or dominant eye between
the two groups (P > 0:05). In the comparison of amplitudedensity and peak time of the N1 and P1 waves in each ringof Mf-ERG, there was no significant difference between andwithin the two groups (P > 0:05). Amplitude density andpeak time of N1 and P1 waves in the Mf-ERG 2 ring betweenthe two groups showed a statistically significant difference(P < 0:05). The paired t-test of the left and right eye datashowed that the difference in the P1 wave peak between theleft and right eyes was statistically significant in the observa-tion group (P < 0:05) (Table 2). In the left-right eye matchingt-test, a statistically significant difference in the P1 peakbetween the left and right eyes was found in the observationgroup (P < 0:05) (Table 2). Macular centers near the concavearea retinal photoreceptor cells have reduced amplitude, andthe peak latency uncovered the fact that blue light from theterminal video watched for a long time may cause macularcenter near the concave area function in retinal photorecep-tor cells decreasing. All clinical tests are not less than 6 times.
3.2. ERG Showed Low-Illumination Blue Light InducedRetinal Functional Damage in Rats. To further explore themechanism of long-term low-illumination blue light damageto the retina, we established an animal model by irradiatingSD rats with a homemade illuminator. In the rats’ visual elec-trophysiological examination, the amplitude of the A and Bwaves in the experimental group was lower than that in thenormal control group at different doses (3 h, 6 h, and 12 h),and the incubation period was longer. There was a significantdifference in the interaction of different irradiation times anddoses (P < 0:0001). The amplitudes of wave A and wave Bdecreased with increasing irradiation dose, and the latencyprolonged with increasing irradiation dose in the same irra-diation time group. The decline in the electrophysiological
Daily blue light exposure
60 healthy SD rats
Test group (n=54) Control group (n=6)
Irradiated for 4 weeks, 8 weeks, and 12 weeks
Observation of ultrafine structure of retina by transmission electron
microscope
Observation of retinal tissue with
HE staining
Electrophysiologicalobservation of retinal function
Analysis results
12h (n=18)3h (n=18) 6h (n=18)
Figure 2: An overview of the experimental protocol.
4 BioMed Research International

function of the retina in the experimental group was signifi-cantly positively correlated with the irradiation dose(P < 0:0001) (Tables 3–6). These tests were repeated 3 timesfor each rat, and there were 6 rats per group.
The test method used was the Wilks’ Lambda method. Λis the Wilks statistic, indicating the proportion of each varia-tion source in the total variation (F is the F-test statisticvalue, ν1 is the degree of freedom of the processing factor,and ν2 is the degree of freedom of the error term). These testswere repeated 3 times for each rat, and there were 6 ratsper group.
3.3. H&E Showed Blue Light Induced Retinal MorphologicalChanges of Rat Eyes. As shown in Figures 4(a), 4(e), and4(i), the retina structures of the control rats at 4, 8, and 12weeks were intact, and the loose connective tissues wereobserved. The rats in experimental groups were continuouslyirradiated for 4 weeks, and there were no significant changesin the IS/OS and RPE layer structure of the retina in the dailyexposure of 3 h, 6 h, and 12 h groups (Figures 4(b)–4(d)).And the rats in experimental groups were continuously irra-diated for 8 weeks, at daily exposure of 3 h and 6h, and theIS/OS layers were loose and edematous (green arrow) in
(a) (b)
(c) (d)
(e) (f)
Figure 3: Introduction of the blue light illuminator model for the cell phone array. (a–c) Polyethylene PP feeding cage, with nine blue lightbead illuminators on the top cover. (d) The illumination measured by the zd-10 illuminance meter at the four corners and at the midpoint ofthe four sides of the experimental box bottom 20 cm away from the illuminator light source was 5.0-5.2 lux, with an average illumination of5.0 lux and a fluctuation range of 5%. (e, f) The model simulating the blue light illumination of cell phones.
5BioMed Research International

Table2:Com
parisonof
N1andP1waveam
plitud
edensityandpeak
timeof
Mf-ERG2ring
andMf-ERG3ring.
Group
sn
N1waveam
plitud
edensity
N1peak
P1waveam
plitud
edensity
P1peak
Right
eye
Lefteye
Right
eye
Lefteye
Right
eye
Lefteye
Right
eye
Lefteye
Mf-ERG2ring
Observation
grou
p11
40:16±
17:72
40:62
±15:40
24:80±
2:15
24:16±
2:78
##101:8
0±16:08
109:6
6±14:61
44:47±
2:33
45:19±
2:18
∗#
Con
trol
grou
p11
43:55±
11:06
46:32
±10:09
24:16±
2:02
25:41±
2:36
111:41
±22:10
122:5
6±18:88
43:42±
1:64
42:78±
2:65
Mf-ERG3ring
Observation
grou
p11
26:37±
9:58
21:60±
5:73
∗∗24:35±
1:50
∗24:16±
2:67
65:90±
15:38
67:41±
9:14
42:15±
2:32
43:49±
2:21
#
Con
trol
grou
p11
26:23±
5:47
27:94
±3:7
622:57±
2:22
23:46±
1:92
69:98±
11:95
74:06±
14:96
43:49±
1:59
43:75±
1:25
∗P<0:0
5com
paredwiththecontrolgroup
,∗∗P<0:01
comparedwiththecontrolgroup
,#P<0:05
comparedwiththerighteye,and
##P<0:01
comparedwiththerighteye.T
hesetestswererepeated
notlessthan
6times.
6 BioMed Research International

Table3:Awaveresults
inph
otoreceptors
oftheretina.
Con
trol
4w3h
4w6h
4w12
h8w3h
8w6h
8w12
h12
w3h
12w6h
12w12
h
Amplitud
e146:1
7±5:93
62:80±
3:62
67:45±
3:10
107:7
9±24:28
124:7
3±5:21
77:79±
0:60
108:8
7±3:20
144:3
7±5:56
127:7
2±3:87
110:7
7±6:67
Incubation
period
71:42±
1:13
54:72±
2:16
54:47±
1:18
55:42±
0:92
79:35±
3:26
74:65±
1:87
80:08±
2:64
53:48±
1:35
70:27±
1:39
75:80±
1:76
These
testswererepeated
3times
foreach
rat,andtherewere6ratspergrou
p.
7BioMed Research International

Table4:Bwaveresults
inretinalb
ipolar
cells
andMullercells.
Con
trol
4w3h
4w6h
4w12
h8w3h
8w6h
8w12
h12
w3h
12w6h
12w12
h
Amplitud
e−5
:74±
0:75
−11:82
±0:29
−7:78±
0:33
−25:43
±0:83
−14:96
±0:87
−11:45
±0:43
−5:25±
0:32
−11:23
±0:57
11:37±
0:77
−14:43
±0:91
Incubation
period
12:45±
0:81
35:00±
2:59
17:68±
1:48
11:93±
0:95
23:60±
1:52
22:55±
0:83
23:58±
0:88
32:67±
0:67
30:35±
1:34
30:02
±1:74
These
testswererepeated
3times
foreach
rat,andtherewere6ratspergrou
p.
8 BioMed Research International

Table 5: Statistical analysis of two factors and their interaction in the A wave and B wave.
Λ F ν1 ν2 PA B A B A B A B A B
Irradiation time 0.00061729 0.00002866 210.96 998.63 16 16 86 86 <.0001 <.0001Radiation dose 0.00022726 0.00003931 351.18 851.97 16 16 86 86 <.0001 <.0001Time∗ dose 0.00000011 0.00000182 376.82 175.38 32 32 160.17 160.17 <.0001 <.0001
Table 6: Statistical analysis of the three treatment methods (irradiation time) of controlling dose factors in the A wave and B wave at differentlevels.
Λ F ν1 ν2 PA B A B A B A B A B
3 h 0.00011415 0.0000029 92.60 583.27 16 16 16 16 <.0001 <.00016 h 0.0000017 0.0000005 759.72 1467.82 16 16 16 16 <.0001 <.000112 h 0.0000032 0.0000005 556.47 1467.82 16 16 16 16 <.0001 <.0001These tests were repeated 3 times for each rat, and there were 6 rats per group.
Control 3 h 6 h 12 h
4 weeks
12 weeks
8 weeks
(a) (b) (c) (d)
(e) (f) (g) (h)
(i) (j) (k) (l)
NFL+GCLIPL
INLOPLONL
IS/OSRPE 50.00 𝜇m
50.00 𝜇m
50.00 𝜇m
50.00 𝜇m
50.00 𝜇m
50.00 𝜇m
50.00 𝜇m
50.00 𝜇m
50.00 𝜇m
50.00 𝜇m
50.00 𝜇m
50.00 𝜇m
Figure 4: Histopathological features of the retina in each group. (a–d) The structure and morphology of the retina in the 4-week controlgroup and daily exposure of 3 h, 6 h, and 12 h experimental groups. There was no significant change in the IS/OS and RPE layer structureof the retina in the 3 h, 6 h, and 12 h experimental groups. (e–h) The structure and morphology of the retina in the 8-week control groupand 3 h, 6 h, and 12 h experimental groups. The IS/OS layer was loose and edematous (green arrow) at 3 h, 6 h, and 12 h after 8 weeks withthinning of the RPE layer and the decrease of the number of cells. (i–l) The structure and morphology of the retina in the 12-week normalcontrol group and 3 h, 6 h, and 12 h experimental groups. The IS/OS layer was loose and edematous (green arrow) lightly stained andswollen (green arrow) with thinning of the RPE layer and the decrease of the number of cells. The scale bar is 50 μm. These tests wererepeated 3 times for each rat, and there were 6 rats per group. NFL: nerve fiber layer; GCL: ganglion cell layer; IPL: inner plexiform layer;INL: inner nuclear layer; OPL: outer plexiform layer; ONL: outer nuclear layer; IS/OS: photoreceptor inner/outer segment layers; RPE:retina pigmented epithelium.
9BioMed Research International

some areas with lightly stained, thinning of the RPE layer andthe decrease of the number of cells (Figures 4(f) and 4(g)). Inthe daily exposure of 12 h group, the IS/OS layer was furtherloosened and edematous, and the cytoplasm was transparentwith thinning of the RPE layer and the decrease of the num-ber of cells (Figure 4(h)). After 12 weeks of continuous irra-diation, significant changes occurred in all groups withthinning of the RPE layer and the decrease of the numberof cells. IS/OS layer cytoplasm was lightly stained and swollenafter daily exposure of 3 h (Figure 4(j)). In the daily exposureof 6 h group, IS/OS layer cytoplasm was sparse, lightly, swol-len, and unevenly stained (Figure 4(k)). In the daily exposureof 12 h group, the IS/OS layer cytoplasm was very bright, andonly a few were stained with cytoplasmic powder dyeing(Figure 4(l)). These tests were repeated 3 times for each rat,and there were 6 rats per group.
3.4. Long-Term Cumulative Blue Light Damages the Structureof the Retina. The discs of the external ganglion membrane ofthe photoreceptor in the control rats at 4, 8, and 12 weekswere clear and arranged in an orderly manner, and the chro-matins were symmetrical and abundant (Figures 5(a), 1, 5,and 9 and 5(b), 1, 5, and 9). After 4 weeks of continuous irra-diation, there was no obvious change in the ultrastructure ofthe retina after daily exposure 3 h (Figures 5(a), 2 and 5(b),2). In the daily exposure 6 h group, the arrangement of theouter ganglion membrane disc was loose, a small number ofvacuoles were formed, and the chromatin became light(Figures 5(a), 3 and 5(b), 3). In the daily exposure 12 h group,the membrane disc was loose and edematous, a large numberof vacuoles were formed, and the chromatin became light(Figures 5(a), 4 and 5(b), 4). The outer ganglion disc wasloose, and the chromatin became light after 8 weeks in thedaily exposure 3 h group (Figures 5(a), 6 and 5(b), 6). Inthe daily exposure 6 h group, the outer ganglion disc wasloose and disordered, vacuoles formed, the chromatinbecame light, and the edge gathered (Figures 5(a), 7 and5(b), 7). In the daily exposure 12 h group, the outer gangliondisc was loose and edematous, a large number of vacuolesformed, the chromatin was clearly light, and the organelleswere reduced (Figures 5(a), 8 and 5(b), 8). The outer ganglionmembrane disc was loose, the chromatin became light, andthe cytoplasm decreased after 12 weeks in daily exposure3 h group (Figures 5(a), 10 and 5(b), 10). The outer ganglionmembrane disc was loose and showed edema, vacuole forma-tion, and membrane disc destruction, the chromatin becameobviously light, and organelles decreased in size in the dailyexposure 6 h group (Figures 5(a), 11 and 5(b), 11). The outerganglion membrane disc contained many vacuoles, structuraldestruction, fuzzy cell bodies, decreased organelles, and dis-solved cytoplasm after 12 weeks in the daily exposure 12 h(Figures 5(a), 12 and 5(b), 12). These tests were repeated 3times for each rat, and there were 6 rats per group.
4. Discussion
In this study, the clinical investigation of the multifocal elec-troretinogram of the terminal video of medical staff was firstconducted. The results showed that the daily use of the video
terminal for more than 8 hours reduced the amplitude ofthe retinal photoreceptor cells in the parafoveal region ofthe macula and delayed the peak time. Then, we exploredthe effect of simulated mobile phone blue light (455 nm-470 nm, 5.03 lux, 0.123W/m2) on the morphological struc-ture and function of the optic nerve and retina of SD ratsthrough animal experiments. SD rat retinal photoreceptorcells and pigment epithelial cells showed different degreesof degeneration. The longer the light exposure time and accu-mulation time of the rats, the more severe the damage to ratretinal photoreceptor cells. Blue light chronic photodamagemainly involved photoreceptor cells and ganglion cells ofthe retina. Chronic retinal photodamage mainly involves ret-inal photoreceptor cells, ganglion cells, bipolar cells, andMuller cells, which is positively correlated with time [16,17]. The expression of retinal rhodopsin is reduced, and thelonger the irradiation time, the more serious the damage.
Our experimental results found that in SD rats, the cyto-plasm of the visual cells is transparent, and the RPE layer isthinned. The photoreceptor membrane disk is vacuolated,and the structure is destroyed. The A and B wave amplitudesof visual electrophysiological of dark adaptation to the envi-ronment are reduced, and the incubation period is pro-longed. Long-term low-illumination blue light irradiationcan cause rod cell damage in rats. The apoptosis of photore-ceptors (including rod cells and cone cells) is the essentialcause of blue light damage to the retina. Organisciak andVaughan and other studies [18] [19] have found that afterphotoreceptor cell apoptosis, the outer membranous disc falloff, and the pigment epithelial cells are overwhelmed byphagocytosis and digestion, which will cause the atrophy ofpigment epithelial layer and the destruction of the blood-retinal barrier.
There are two types of retinal light damage: one occursunder long-term low-level light exposure and is called thefirst type of photochemical damage [20]. The second type isthe acute retinal light damage described by Ham et al. [21],which occurs under short-term high-intensity light exposure.This study belongs to the first type of light damage. Thisstudy found that low-illumination blue light caused differentdegrees of chronic damage to the retina, providing a refer-ence for the rational use of mobile phones. Previous experi-mental studies have mostly focused on acute light damagecaused by high-brightness white light [22, 23] and toxic levelsof blue light [24], and these doses are much higher than ourblue light dose. Chronic damage to blue light at low lightlevels is often overlooked because it is difficult to detect. Thisexperiment simulates the degree of damage to human eyescaused by blue light in a low-brightness mobile phone screen.Because the spectrum emitted by the mobile phone screen isa composite spectrum, it is not possible to directly measurethe blue light intensity. In this experiment, the QB4 coloredglass filter that can pass through the blue wavelength isselected to filter the spectrum other than blue light [25], soas to measure the experimental mobile phone screen projec-tion. Pure blue illuminance value at a distance from thenormal viewing screen of the human eye is 5.03 lux(0.123W/m2). This experimental method is unique and morepractical and convincing than the study of high-illumination
10 BioMed Research International

blue light irradiation. In this study, the low illuminationchronic light injury animal model has good stability andrepeatability, which provides a reference for further studyon the prevention and treatment of chronic retinal light
injury and retinal degeneration. No relevant reports havebeen seen before.
The results of H&E showed no change in 4 weeks 6 h and12 h, while the results of electron microscope showed
Control
8 weeks
12 weeks
4 weeks
3 h 6 h 12 h
1 𝜇m1 𝜇m1 𝜇m1 𝜇m
1 𝜇m1 𝜇m1 𝜇m1 𝜇m
1 2 3 4
5 6 7 8
9 10 11 12
RGCROS
(a)
4 weeks
8 weeks
12 weeks
Control 3 h 6 h 12 h1 2 3 4
5 6 7 8
9 10 11 12
1 𝜇m1 𝜇m1 𝜇m1 𝜇m
1 𝜇m1 𝜇m1 𝜇m1 𝜇m
1 𝜇m1 𝜇m1 𝜇m1 𝜇m
(b)
Figure 5: Ultrastructural images of the retinas of rats as observed by transmission electron microscopy. (a) Cross section for ultrastructuralanalysis of the retina of rats. (1, 5, and 9) The outer membrane disc of photoreceptors of rats in the normal control group was clear andcomplete, arranged orderly, with uniform chromatin and abundant cytoplasm; (2) the ultrastructure of retina of rats in the experimentalgroup did not change significantly at 4 weeks 3 h; (3) the outer membrane disc of rats in the experimental group was loose at 4 weeks 6 h.(4) At 4 weeks 12 h, the membrane disc of the experimental group was loose, edema and a large number of vacuoles were formed, and thechromatin of the cell body was clearly thin; (6): at 8 weeks 3 h, the membrane disc of the outer segment of the experimental group wasloose, and the chromatin of the cell body was thin; (7): at 8 weeks 6 h, the membrane disc of the outer segment of the experimental groupwas loose and disordered, vacuole was formed, and the chromatin of the cell body was thin, edge set; (8): at 8 weeks 12 h, the outerganglion membrane disc was loose and edematous, and a large number of vacuoles were formed; the chromatin of the cell body wasclearly diluted, and the organelles were reduced; (10): at 12 weeks 3 h, the outer ganglion membrane disc was loose and edematous,vacuoles were formed, and the membrane disc was destroyed; (11): at 12 weeks 6 h, the outer ganglion membrane disc was loose andshowed edema, vacuole formation, and membrane disc destruction, the chromatin of the cell body became clearly light, and organellesdecreased in size. (12) In the 12 h experimental group, there were a large number of vacuoles and structural damage in the disc of outerganglion membrane, and the cell bodies were fuzzy, organelles were reduced, and the cytoplasm was dissolved. (b) Longitudinalultrastructural section of the retina of rats. The scale bar is 12000μm. These tests were repeated 3 times for each rat, and there were 6 ratsper group.
11BioMed Research International
changes in the structure of retinal in 4 weeks 6 h and 12h.This phenomenon may have the following three reasons. (I)The magnification of H&E is different from the magnifica-tion of electron microscope, and electron microscope cansee more microscopic cell structure. (II) The retinal pigmentepithelium (RPE) does not change, because it takes a certainamount of time to cause pathological changes in RPE. (III)The blue light radiation dose to the retina of freely movingrats depends on the posture of the head of the rat. In ourexperiment, we designed one of the rat’s retinas is used forH&E and the other one for the electron microscope, so thismay also cause slight differences between the H&E experi-mental results and the electron microscope results.
Due to the limitation of conditions, this experiment usesrats as the research object. Rats have no macula, but the RPEis consistent with humans. RPE cells are very sensitive to bluelight stimulation, and blue light is absorbed by autofluores-cent groups in RPE cells, which will trigger the cell and causea series of cascade reactions, dysfunction, and even lead tocell death. Long-term accumulated blue light damage willinduce or even accelerate macular degeneration of the retina[26, 27]. Thus, the rats meet the experimental conditions.
Rats and humans have different retina sizes, differentdiopters [28], and different density gradients of photorecep-tor [29, 30]. Despite these differences between the rat andhuman retinas, the basic organization of the retina is conser-vative. The retinas of rats and humans are comparable to acertain extent [31]. Research showed an action spectrummatching the absorption spectrum of rhodopsin in rat andan action spectrum for photochemical damage from theUV to long visible wavelengths in macaque. Later, such aspectrum was also found in rat [32]. At the same time, ourresearch found that the experimental results of rats are consis-tent with the results of clinical studies, and both will cause adecline in the function of photoreceptor cells. Studies havefound that the diopter of humans is 165 folds (for the sameluminance) than rats [28, 33], but our experimental resultsprove that the degree of damage to the retina of rats is not lin-early related to the diopter. Our experimental results foundthat the rat retinas were loose and edematous in IS/OS layerin 4 weeks 6h blue light irradiation. However, no significantpathological changes were seen in the IS/OS layer of the retinain 4 weeks 3h. Therefore, this dose of blue light is not as highas 165 times for rats, but belongs to low-dose irradiation.
By comparing the results of rat experiments, it was foundthat the morphological and structural changes of the ratomentum were consistent with the functional changes, andthe decline of the omentum function was accompanied bythe morphological and structural degeneration. The chronicdamage caused by blue light is worth noting.
5. Conclusions
The daily use of the video terminal for more than 8 hoursreduced the amplitude of the retinal photoreceptor cells inthe parafoveal region of the macula and delayed the peak time.Long-term exposure to low-illuminance blue light can causeretinal tissue structure and functional damage, and the chronicdamage due to low-illuminance light warrants attention.
Data Availability
The datasets used and/or analyzed during the current studyare available from the corresponding author on reasonablerequest.
Ethical Approval
This study was approved by the Ethics Committee of Chong-qing Hospital of Traditional Chinese Medicine (Chongqing,China). The experiment complied with the Declaration of Hel-sinki. The clinical registration number is 2018-KY-KS-LHL.
Consent
Written informed consent was obtained from all patients.
Conflicts of Interest
No competing financial interests exist.
Authors’ Contributions
LHL, the first author and the corresponding author, providedthe ideas for this article, performed the experiments, andwrote the article. ZM, the expert, provided valuable sugges-tions and helped answer questions during the experiments.WDH, DGJ, and CZW raised animals, collected tissues, andcompleted electrophysiological tests. LSL was mainly respon-sible for making charts and chart modifications. SXH helpedperform the experiments and revise the article. ZM helpedwith the pathological reading of the experimental results.LHY guided the production of the simulated mobile phonearea array blue light emitter. CHF helped revise the article.XSY was responsible for the clinical investigation of the mul-tifocal electroretinogram. LXD participated in the clinicalresearch.
Acknowledgments
This study was supported by the Medical Research Project ofChongqing Municipal Health and Family Planning Commis-sion (2017MSXM059).
Supplementary Materials
Supplementary material related to the survey file for the dailyuse of video terminals in this article can be found in theonline version. (Supplementary Materials)
References
[1] G. Renard and J. Leid, “The dangers of blue light: true story!,”Journal Français d'Ophtalmologie, vol. 39, no. 5, pp. 483–488,2016.
[2] Y. Kuse, K. Ogawa, K. Tsuruma, M. Shimazawa, and H. Hara,“Damage of photoreceptor-derived cells in culture induced bylight emitting diode-derived blue light,” Scientific Reports,vol. 4, no. 1, p. 5223, 2015.
12 BioMed Research International

[3] S. G. Jarrett and M. E. Boulton, “Consequences of oxidativestress in age-related macular degeneration,”Molecular Aspectsof Medicine, vol. 33, no. 4, pp. 399–417, 2012.
[4] A. Krigel, M. Berdugo, E. Picard et al., “Light-induced retinaldamage using different light sources, protocols and rat strainsreveals LED phototoxicity,” Neuroscience, vol. 339, pp. 296–307, 2016.
[5] J. B. O'Hagan, M. Khazova, and L. L. Price, “Low-energy lightbulbs, computers, tablets and the blue light hazard,” Eye(London, England), vol. 30, no. 2, pp. 230–233, 2016.
[6] C. Roehlecke, U. Schumann, M. Ader, L. Knels, and R. H.Funk, “Influence of blue light on photoreceptors in a live reti-nal explant system,” Molecular Vision, vol. 17, pp. 876–884,2011.
[7] J. Vicente-Tejedor, M. Marchena, L. Ramírez et al., “Removalof the blue component of light significantly decreases retinaldamage after high intensity exposure,” PLoS One, vol. 13,no. 3, article e0194218, 2018.
[8] D. Yuan, R. D. Collage, H. Huang et al., “Blue light reducesorgan injury from ischemia and reperfusion,” Proceedings ofthe National Academy of Sciences of the United States of Amer-ica, vol. 113, no. 19, pp. 5239–5244, 2016.
[9] B. J. Putting, J. A. van Best, G. F. J. M. Vrensen, andJ. A. Oosterhuis, “Blue-light-induced dysfunction of theblood-retinal barrier at the pigment epithelium in albino ver-sus pigmented rabbits,” Experimental Eye Research, vol. 58,no. 1, pp. 31–40, 1994.
[10] B. J. Putting, R. C. Zweypfenning, G. F. Vrensen, J. A. Ooster-huis, and J. van Best, “Blood-retinal barrier dysfunction at thepigment epithelium induced by blue light,” Investigative Oph-thalmology & Visual Science, vol. 33, no. 12, pp. 3385–3393,1992.
[11] M. Nakamura, T. Yako, Y. Kuse et al., “Exposure to excessiveblue LED light damages retinal pigment epithelium and pho-toreceptors of pigmented mice,” Experimental Eye Research,vol. 177, pp. 1–11, 2018.
[12] S. Karaoglu, Y. Liu, T. Gevers, and A. W. M. Smeulders, “Pointlight source position estimation from RGB-D images by learn-ing surface attributes,” IEEE Transactions on Image Processing,vol. 26, no. 11, pp. 5149–5159, 2017.
[13] H. M. Kim, M. S. Kim, G. J. Lee, Y. J. Yoo, and Y. M. Song,“Large area fabrication of engineered microlens array withlow sag height for light-field imaging,” Optics Express,vol. 27, no. 4, pp. 4435–4444, 2019.
[14] Z. Zhu, M. Jiang, H. Yu, Y. Hui, H. Lei, and Q. Li, “Generationof blue light by sum-frequency generation of a spectrally com-bined broad-area diode laser array,” Optics Letters, vol. 41,no. 20, pp. 4712–4714, 2016.
[15] M. Marie, P. Gondouin, D. Pagan et al., “Blue-violet lightdecreases VEGFa production in an in vitro model of AMD,”PLoS One, vol. 14, no. 10, article e0223839, 2019.
[16] N. Mat Nor, C. X. Guo, I. D. Rupenthal, Y. S. Chen, C. R.Green, and M. L. Acosta, “Sustained connexin43 mimetic pep-tide release from loaded nanoparticles reduces retinal and cho-roidal photodamage,” Investigative Ophthalmology & VisualScience, vol. 59, no. 8, pp. 3682–3693, 2018.
[17] A. R. Wielgus and J. E. Roberts, “Retinal photodamage byendogenous and xenobiotic agents,” Photochemistry and Pho-tobiology, vol. 88, no. 6, pp. 1320–1345, 2012.
[18] D. T. Organisciak and D. K. Vaughan, “Retinal light damage:mechanisms and protection,” Progress in Retinal and EyeResearch, vol. 29, no. 2, pp. 113–134, 2010.
[19] A. C. Lo, T. T. Y. Woo, R. L. M.Wong, and D.Wong, “Apopto-sis and other cell death mechanisms after retinal detachment:implications for photoreceptor rescue,” Ophthalmologica,vol. 226, no. 1, pp. 10–17, 2011.
[20] W. K. Noell, V. S. Walker, B. S. Kang, and S. Berman, “Retinaldamage by light in rats,” Investigative Ophthalmology, vol. 5,no. 5, pp. 450–473, 1966.
[21] W. T. Ham Jr., “Retinal sensitivity to damage from shortwavelength light,” Nature, vol. 260, no. 5547, pp. 153–155,1976.
[22] H. Ren, N. Y. Liu, X. F. Song, Y. S. Ma, and X. Y. Zhai, “A novelspecific application of pyruvate protects the mouse retinaagainst white light damage: differential stabilization ofHIF-1αandHIF-2α,” Investigative Ophthalmology & Visual Science,vol. 52, no. 6, pp. 3112–3118, 2011.
[23] J. J. Kremers and D. van Norren, “Retinal damage in macaqueafter white light exposures lasting ten minutes to twelve hours,”Investigative Ophthalmology & Visual Science, vol. 30, no. 6,pp. 1032–1040, 1989.
[24] P. Geiger, M. Barben, C. Grimm, and M. Samardzija, “Bluelight-induced retinal lesions, intraretinal vascular leakage andedema formation in the all-cone mouse retina,” Cell Death &Disease, vol. 6, no. 11, article e1985, 2015.
[25] M. Zhang, E. J. R. Kelleher, S. V. Popov, and J. R. Taylor,“Characterization of nonlinear saturation and mode-lockingpotential of ionically-doped colored glass filter for short-pulse fiber lasers,” Optics Express, vol. 21, no. 10, pp. 12562–12569, 2013.
[26] J. H. Kang and S. Y. Choung, “Protective effects of resveratroland its analogs on age-related macular degeneration in vitro,”Archives of Pharmacal Research, vol. 39, no. 12, pp. 1703–1715,2016.
[27] S. C. Tomany, K. J. Cruickshanks, R. Klein, B. E. Klein, andM. D. Knudtson, “Sunlight and the 10-year incidence of age-related maculopathy: the beaver dam eye study,” Archives ofOphthalmology, vol. 122, no. 5, pp. 750–757, 2004.
[28] C. Campbell, “Calculation method for retinal irradiance fromextended sources,” Ophthalmic & Physiological Optics,vol. 14, no. 3, pp. 326–329, 1994.
[29] C. A. Curcio, K. R. Sloan, R. E. Kalina, and A. E. Hendrickson,“Human photoreceptor topography,” The Journal of Compar-ative Neurology, vol. 292, no. 4, pp. 497–523, 1990.
[30] Y. Wang, N. Bensaid, P. Tiruveedhula, J. Ma, S. Ravikumar,and A. Roorda, “Human foveal cone photoreceptor topogra-phy and its dependence on eye length,” eLife, vol. 8, 2019.
[31] U. Grunert and P. R. Martin, “Cell types and cell circuits inhuman and non-human primate retina,” Progress in Retinaland Eye Research, vol. 78, p. 100844, 2020.
[32] D. van Norren and T. G. Gorgels, “The action spectrum ofphotochemical damage to the retina: a review of monochro-matic threshold data,” Photochemistry and Photobiology,vol. 87, no. 4, pp. 747–753, 2011.
[33] I. Jaadane, P. Boulenguez, S. Chahory et al., “Retinal dam-age induced by commercial light emitting diodes (LEDs),”Free Radical Biology & Medicine, vol. 84, pp. 373–384,2015.
13BioMed Research International