figura 1.2 - evolução da população no estado de são paulo...
TRANSCRIPT

10
São Paulo, o mais populoso e próspero Estado bra-sileiro, ocupa a superfície aproximada de 248.000 km2,e abriga uma população superior a 35 milhões de habi-tantes1, o que corresponde a 22% da população brasilei-ra, 17% do Mercosul, 11% da América do Sul e 0,6% dapopulação mundial. O PIB paulista, em 2000, de US$231,2 bilhões2, representa cerca de 35,5% do brasileiro,27% do PIB do Mercosul e 11% do sul-americano. Ape-nas as áreas urbanas das três regiões metropolitanas (SãoPaulo, Baixada Santista e Campinas), concentram cercade 20,8 milhões de habitantes, ou seja, 58,3% da popu-lação do Estado e 13% do total do País3, e apresentam,sozinhas, um PIB correspondente a 63,5% do PIB esta-dual, quase um quarto do nacional, superior ao de mui-tos países, como Dinamarca e Noruega.
A figura 1.1 faz uma análise populacional do Esta-do de São Paulo entre as maiores cidades do mundo. Afigura 1.2 mostra a evolução da população paulista com-parada com a do Brasil, e a figura 1.3 ilustra a magnituderelativa do PIB – Produto Interno Bruto e do IDH –Índice de Desenvolvimento Humano, comparada comoutros países.
STATE OF SÃO PAULO OVERVIEW
The State of São Paulo is today the most heavily
populated and prosperous State in Brazil. Its total popula-
tion is 35 million inhabitants1 –which is approximately 22%
of the Brazilian population, or 17% of Mercosul’s, or 11%
of South America’s – 0.6% of the world’s population. These
are unevenly spread over a territory of 248,000 square km.
Of these, more than 20.8 million inhabitants (or 58.3% of
the State population and 13% of the country’s population2)
occupy its three major metropolitan regions (São Paulo,
Santos Lowlands and Campinas). These metropolitan re-
gions contribute with 63.5% of the State’s GDP. Its value
for the year 2000 amounted to US$ 231,2 billion3 or ap-
proximately one quarter of the national GDP – a value
greater than those of many countries such as Denmark or
Norway.
Figures 1.1 to 1.3 below provide an analysis of the
State population and compare the magnitude of the State
GDP and HDI (Human Development Index) with those
of other countries and cities.
SÃO PAULO NO MUNDO
Figura 1.1. População das maiores cidades do mundo,em 1998. Fonte: SEADE
Figura 1.2 - Evolução da população no Estado de SãoPaulo - Período 1991-2000. Fonte: IBGE.
Figure 1.2 – Populational Statistics for the State of São Paulo
(Source: IBGE 1991-2000)Figure 1.1. Population of major world cities (Source:
Fundação SEADE 1998)
11
1
INDICADORESSOCIOECONÔMICOS
SOCIAL AND ECONOMIC
INDICATORS

12
Por sua vocação histórica, o Estado de São Paulotem sido chamado de “locomotiva do Brasil”, com pa-pel proeminente em vários dos grandes ciclos econômi-cos já vividos no País. Durante a segunda metade doséculo XX, a economia estadual foi influenciada pelosvários períodos de crises econômicas, destacando-se pi-cos na década de 80 e na primeira metade dos anos 90.Em 1994, com o plano de estabilização econômica (Pla-no Real), houve um aquecimento da economia, tambémimpulsionada pela maior abertura dos mercados inter-nos a produtos importados, reflexo da crescente influ-ência do processo de globalização da economia. Já em 1999,a economia brasileira foi marcada pelos impactos resultan-tes de algumas crises internacionais, culminando com aadoção do câmbio flutuante frente ao dólar.
QUALIDADE DE VIDA4
Todo esse progresso vem gerando consideráveispressões sobre os recursos naturais e, em conseqüência,sobre a saúde humana. Embora ostente posição econô-mica privilegiada, o Estado de São Paulo ainda abrigaregiões e cidades com acentuadas diferenças, que reve-lam vários padrões de qualidade de vida, nem semprerefletidos pelos indicadores clássicos. A cidade de SãoPaulo, por exemplo, tem dimensões comparáveis às dealguns países pequenos e, por outro lado, é muito maisheterogênea. Também há casos como o município deCubatão, pólo da indústria petroquímica paulista, queapresenta renda familiar relativamente baixa, o que sepode atribuir ao fato dos salários pagos pela indústrialocal serem considerados em municípios vizinhos, comoSantos ou São Vicente, onde reside grande parte dostrabalhadores.
Due to its historical importance, the State of São Paulo
has been called the “economic locomotive of Brazil.” It has
already played a major role during several of the country’s
economic cycles. In the second half of the 20th century the
State’s economy was strongly affected by several economic
crises especially in the 80s and early 90s. In 1994, the Plano
Real, or Brazilian economic stabilization plan, contributed
to the economic recovery of the State. The increasing open-
ing of the national internal market to import, a result of
increasing influence of the economic globalization process,
was a second factor of this economic recovery In 1999 Bra-
zil has undergone some international crises, the result be-
ing the adoption of a fluctuating exchange rate for the dollar.
Figura 1.3 – Comparação de PIB e IDH no Estado de São Paulo, no Brasil e em outros países, em 1998. Fonte: SEADE
Figure 1.3 – Comparison: GDP and HDI of the State of São Paulo (yellow column), of Brazil and of other countries .Source: SEADE
LIFE QUALITY CONDITIONS 4
The State’s economic development process has put
considerable strain on natural resources and, consequently,
on human health as well. Although the State of São Paulo
enjoys an enviable economic condition, many of its regions
and cities still show a picture of acute economic problems
and poverty, denoting different standards of life quality,
which are not always reflected by using traditional indica-
tors. The city of São Paulo, for instance, is as large as many
of the world’s small countries, being extremely heteroge-
neous; it is not unusual to find many examples of acutely
contrasting districts, finding very rich people living door-
to-door with the very poor. Another example is the city of
Cubatão. Although it is the heart of the State’s petrochemi-
cal industry, Cubatão presents relatively low family incomes,
due to the fact that many local industry employees live (
and spend money) in neighboring cities such as Santos and
São Vicente.

13
Em pesquisa de 1997, sobre questões ambientaisurbanas, uma amostra de municípios paulistas apon-tou seus principais problemas ambientais, apresenta-dos na figura 1.4. Verifica-se que, nas grandes cidades,
Figura 1.4 – Freqüência de problemas observados X População. Resultado da pesquisa sobre cidades sustentáveis porporte de municípios. Entre parênteses, o número de indivíduos por categoria. Fonte: SMA, 1997 .Figure 1.4 – Rate of observed problems x population. Results from study on sustainable cities by size of municipality (SMA 1997).
In parenthesis: the number of individuals per category
In a 1997 study on urban environmental issues, some
municipalities of the State of São Paulo were asked to iden-
tify their major environmental problems (Figure 1.4). It
could be observed that in larger cities, over 100000 inhab.,

14
com mais de 100.000 habitantes, os problemas se tor-nam cada vez mais freqüentes, inter-relacionando-se. János municípios com menos de 40.000 habitantes, aindaé possível identificar os principais problemas, cuja con-centração se dá prioritariamente nas áreas de poluiçãodas águas, resíduos domiciliares e poluição do solo. En-tre essas situações extremas, os problemas acumulam-se de forma gradativa.
EQÜIDADE E POBREZA
O Índice de Desenvolvimento Humano – IDH5,considera o PIB per capita, a longevidade da população(expressa pela esperança de vida ao nascer) e seu graude educação (medido pela combinação entre a taxa dealfabetização de adultos e a taxa global de matrícula nosníveis de ensino fundamental, médio e superior). A fi-gura 1.5 ilustra o apreciável avanço do valor do IDH doEstado, no período 1980-1998, quando comparado aodo País , seguindo as linhas gerais da tendência mundi-al. O principal componente responsável por esse incre-mento foi a renda.
Apesar desse avanço e do grande apelo jornalístico,o IDH não deve ser entendido como o parâmetro defi-nitivo para medida de desenvolvimento, dado que arepresentatividade e a padronização dos dados é extre-mamente complexa. Em 1998, por exemplo, 5,3% dasfamílias no Estado de São Paulo não tinham acesso auma cesta básica mínima de alimentos, com a situaçãoainda mais dramática ao se observar a altavulnerabilidade dessa população. Na Região Metropo-
problems become more frequent and interdependent. As
an example, the synergism of air pollution and acid rain of
thermal power plants or the industrial emissions and motor
vehicle exhaust. In the case of smaller municipalities (fewer
than 40 thousand inhabitants) it is possible to identify scat-
tered problems of water pollution, domestic solid waste and
soil pollution. For intermediate cities, between these two
extremes, it is interesting to note that the recognized prob-
lems tend to gradually accumulate.
Figura 1.5 – Evolução do IDH no Estado de São Paulo e em alguns países, no período 1980-1998. Fonte: SEADE.
Figure 1.5 – Evolution of HDI for the State of São Paulo and for some countries, 1980-1998. Source: SEADE
EQUITY AND POVERTY
The Human Development Index (HDI)5 calculation
takes into account the values of GDP per capita, popula-
tion longevity (expressed in terms of life expectancy, in
years) and its educational level (that considers the adult
literacy rate and enrollment rate figures in all education
levels). Figure 1.5 illustrates an increase in HDI for the
State of São Paulo in the period 1980-1998. When com-
pared to the Brazilian HDI, it is quite higher and following
a worldwide increase trend. Major factors in these HDI in-
creases were the past income improvements.
However, despite all progress and its great media ap-
peal, HDI should not be considered an ultimate and defi-
nite parameter for measuring development, as the task of
representation and standardization of the data is extremely
complex. In 1998, for example, 5.3% of the families in the
State of São Paulo did not earn enough to grant access to a”
basic food package” (or the amount of food considered suf-
ficient to meet the minimum nutritional guidelines set by
the government). In the SPMR, or São Paulo Metropolitan
Region, the richest 5% percentile of the families concen-
trate 26% of the total income. A rich family’s income
15
litana de São Paulo - RMSP, onde vivem aproximada-mente 18 milhões de pessoas (ano 2000), os 5% repre-sentativos de famílias mais ricas auferiam umrendimento 45 vezes superior ao das 5% mais pobres,detendo 26% do total de rendimentos. Dos chefes defamília indigentes, 9% tinham entre 15 e 24 anos (con-tra 5,6% dessa faixa etária na população total) e 40,5%possuíam, no máximo, ensino fundamental completo(contra 21,7% na população total), o que significachances escassas de melhoria das condições de vida des-se grupo, considerando que dispusessem apenas de seuspróprios meios.
Quanto ao interior do Estado, houve uma reduçãonos níveis de riqueza nas populações mais pobres, en-quanto a área dos mais ricos aumentou, especialmenteao longo dos eixos de desenvolvimento que se esten-dem a leste e noroeste da capital. De maneira geral, esseprocesso de irradiação da riqueza ocorre em função dadinâmica de desconcentração produtiva e do progressode cidades turísticas e de municípios que se caracteri-zam por abrigar condomínios fechados e áreas de lazer.O despertar deste novo perfil aponta para a possibilida-de de novas políticas de desenvolvimento regional, nãopassando, necessariamente, pela atração de investimen-tos industriais de grande porte que podem, ao lado dasvantagens de geração de emprego e renda, acarretar pro-blemas relacionados ao tráfego e à degradação ambiental.
amounts to about 45 times that obtained by one of the poor-
est 5%. Among the poorer 9% of the family heads were 15
to 24 years old (this age group representing 5.6% of the
total population) and 40.5% had, at best, completed the
basic education. (21,7% of the total population has this same
educational level), meaning that life quality improvement
possibilities of these families by their own means are scarce.
Regarding the in-country reality of the State’s mu-
nicipalities, there has been noted an increase in the wealth
of the poorest families, especially along the development
axes extending towards the east and northwest of the capi-
tal. Overall, this wealth spread has been a consequence of
the productive segment decentralization, as well as the
progress of tourist cities and municipalities characterized
by closed condominiums and leisure areas. This new pro-
file indicates possibilities for new regional development
policies that not necessarily require large-scale industrial
investments to generate employment, although these might
also bring along road congestion and environmental degra-
dation problems.
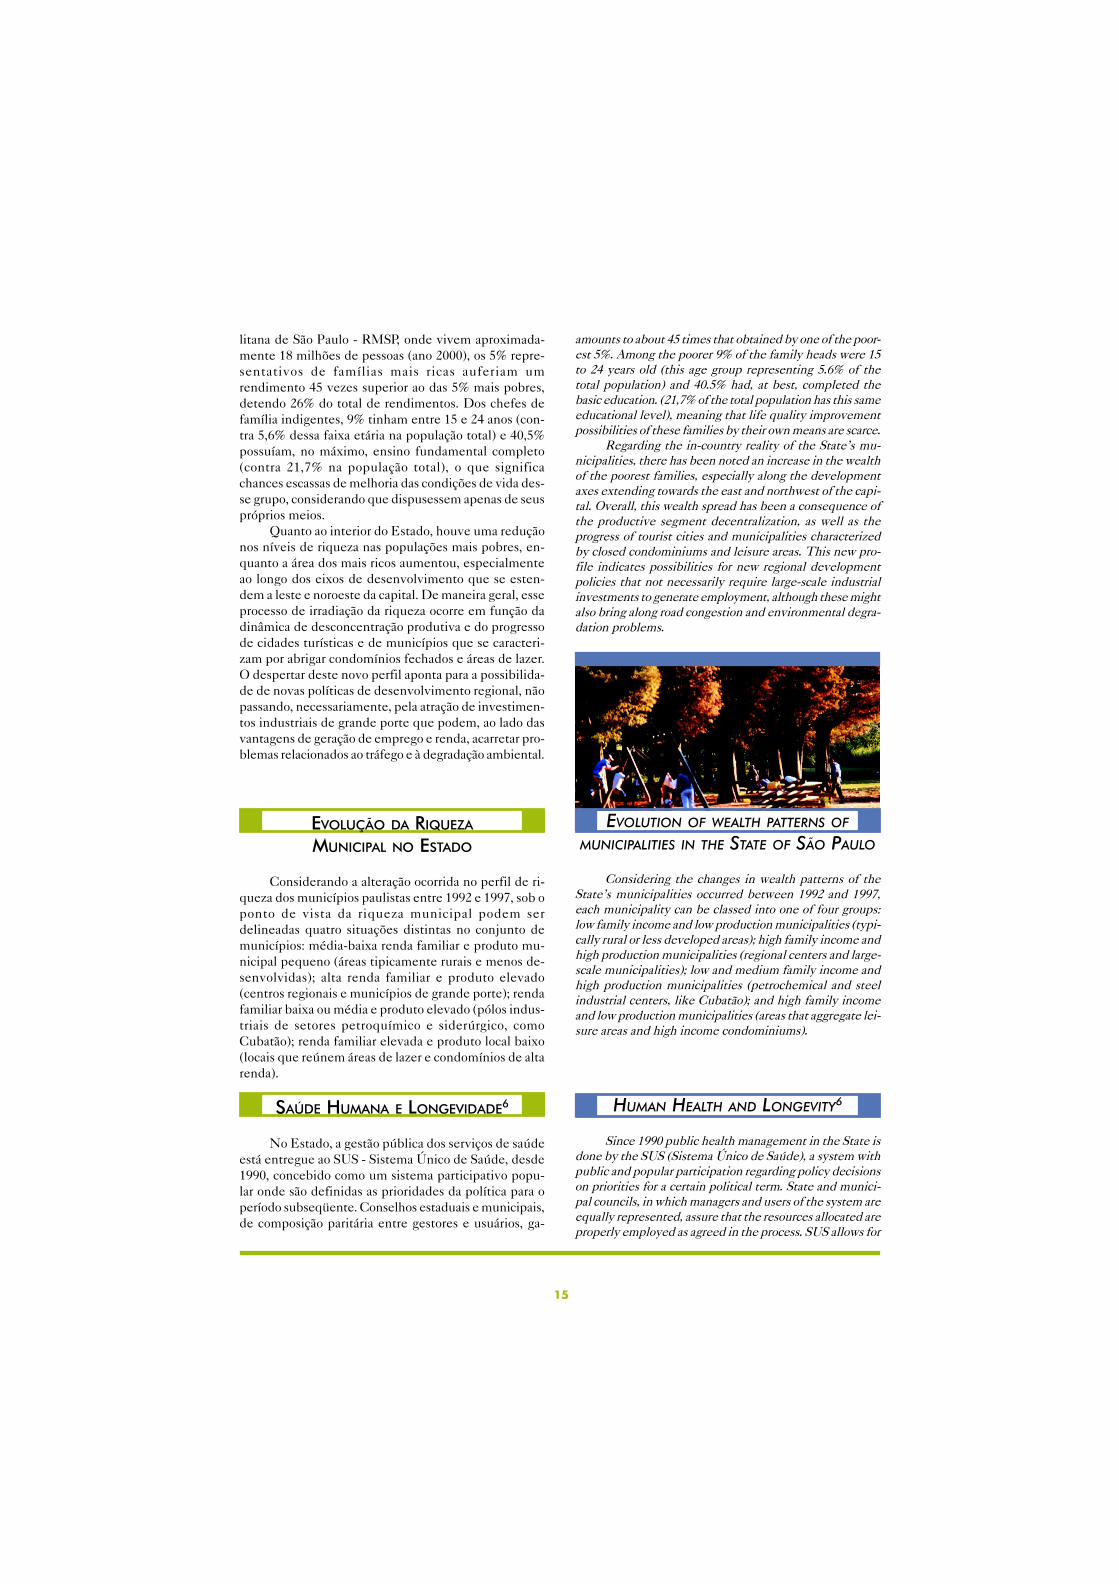
EVOLUTION OF WEALTH PATTERNS OF
MUNICIPALITIES IN THE STATE OF SÃO PAULO
Considering the changes in wealth patterns of the
State’s municipalities occurred between 1992 and 1997,
each municipality can be classed into one of four groups:
low family income and low production municipalities (typi-
cally rural or less developed areas); high family income and
high production municipalities (regional centers and large-
scale municipalities); low and medium family income and
high production municipalities (petrochemical and steel
industrial centers, like Cubatão); and high family income
and low production municipalities (areas that aggregate lei-
sure areas and high income condominiums).
HUMAN HEALTH AND LONGEVITY6
Since 1990 public health management in the State is
done by the SUS (Sistema Único de Saúde), a system with
public and popular participation regarding policy decisions
on priorities for a certain political term. State and munici-
pal councils, in which managers and users of the system are
equally represented, assure that the resources allocated are
properly employed as agreed in the process. SUS allows for
EVOLUÇÃO DA RIQUEZA
MUNICIPAL NO ESTADO
Considerando a alteração ocorrida no perfil de ri-queza dos municípios paulistas entre 1992 e 1997, sob oponto de vista da riqueza municipal podem serdelineadas quatro situações distintas no conjunto demunicípios: média-baixa renda familiar e produto mu-nicipal pequeno (áreas tipicamente rurais e menos de-senvolvidas); alta renda familiar e produto elevado(centros regionais e municípios de grande porte); rendafamiliar baixa ou média e produto elevado (pólos indus-triais de setores petroquímico e siderúrgico, comoCubatão); renda familiar elevada e produto local baixo(locais que reúnem áreas de lazer e condomínios de altarenda).
SAÚDE HUMANA E LONGEVIDADE6
No Estado, a gestão pública dos serviços de saúdeestá entregue ao SUS - Sistema Único de Saúde, desde1990, concebido como um sistema participativo popu-lar onde são definidas as prioridades da política para operíodo subseqüente. Conselhos estaduais e municipais,de composição paritária entre gestores e usuários, ga-

16
rantem que os recursos sejam aplicados da forma defi-nida e que haja lisura nesse processo. A produção deserviços no SUS perfaz uma média de 2,6 consultas porhabitante/ano. O setor público é responsável por 76%dessa produção, enquanto o setor privado responde por15%, e o universitário, por 9%.
Apesar do Estado de São Paulo até aquela datadispor da maior rede de centros de saúde do Brasil, gran-de parte dessa rede foi municipalizada. Subordinadosàs prefeituras municipais estão 92% dos estabelecimen-tos sem internação. Em 19997, 15% dos estabelecimen-tos de saúde do País estavam em São Paulo, a maiorconcentração registrada em uma unidade da federação.Desse total, 69% eram estabelecimentos sem internação,12% com internação e 19% de apoio à diagnose e terapia,com o setor privado detendo 59% das unidades.
Nos primeiros anos após o advento do SUS, à vistada demanda popular, ocorreu uma hegemonia da assis-tência médica em detrimento das ações preventivas. Nosdois últimos anos, no entanto, o Ministério da Saúdevem procurando estabelecer um equilíbrio entre açõesde assistência médica e de medicina preventiva, atra-vés de mudança dos critérios de financiamento, quepassam a incluir indicadores de resultados na manuten-ção da qualidade de vida. São Paulo tem sido referêncianas políticas de saúde pública e na incorporação de de-senvolvimento tecnológico na assistência médica. Sãoexemplos a ampla cobertura vacinal de crianças e de ido-sos, o início do programa de qualidade no sangue paraDST/AIDS e a distribuição gratuita do coquetel para to-dos os infectados, com destaque ainda para a dinamizaçãoda distribuição gratuita de medicamentos aos pacientes.A figura 1.6 mostra a incidência das principais doençasinfecciosas na população do Estado.
an average of 2.6 doctor consultations/inhabitant/year. The
public sector is responsible for 76% of the service provided,
the private sector for 15% and the universities for 9%.
Despite the fact the State of São Paulo owned the
largest network of health centers in the country (up to the
early nineties), a major part of them have since been trans-
ferred to the municipalities. Municipalities are in control
of 92% of the “non-internment-only” centers. In 19997, 15%
of the health centers in the country were located in São
Paulo, the largest percentage for any State. Of these, 69%
were of “non-internment-only” type, 12% were centers with
internment capabilities and 19% were for support to diag-
nosis and therapy. The private sector was in control of 59%
of these centers.
In the few years after the creation of SUS, due to
public demand, medical assistance has predominated over
preventive actions. However, in the last two years, the
Health Ministry has been trying to even medical assistance
and preventive actions through a change in financing crite-
ria, which now include indicators for life quality mainte-
nance. São Paulo has been a reference for public health
policies and for the incorporation of technology develop-
ment for medical assistance, as in the case of the broad vac-
cination coverage for children and elderly, the STD/AIDS
control program and the effective free distribution of anti-
AIDS packages to infected patients. Figure 1.6 shows the
incidence of the main infectious diseases among the popu-
lation of the State of São Paulo.
Figure 1.6 – Incidence of infectious diseases in the State of São Paulo (Note that there was a measles epidemic in 1997).
Figura 1.6 – Incidência de doenças infecciosas no Estado de São Paulo. Note-se a epidemia de sarampo em 1997.

17
A longevidade dos indivíduos de uma dada comu-nidade é conseqüência de complexa cadeia de fatores;destacam-se, entre outros, educação, rendimento fami-liar, condições ambientais locais, hábitos alimentares,consumo de tabaco, álcool e drogas. Esses fatos tam-bém se refletem na taxa de mortalidade infantil, um dosprincipais indicadores das condições de vida e saúde deuma população. No caso de São Paulo, tem diminuídode modo significativo, com 51,2 óbitos por mil nascidosvivos em 1980, 27 em 1991, 22,7 em 1996 e 18,7 em1998. No período 1990-1999, a mortalidade no Estado,com relação ao número de óbitos, aumentou de 204.000para 236.000, resultado, principalmente, do processo deenvelhecimento populacional verificado nas últimasdécadas. A taxa de mortalidade, no entanto, não apre-sentou alteração, continuando em torno de 6,5 óbitospara cada mil habitantes.
MIGRAÇÃO
Nos últimos trinta anos, os movimentos migratóri-os vêm assumindo importância cada vez maior no con-texto da dinâmica populacional brasileira, e serão osmaiores responsáveis pela alteração do tamanho e perfilda população tanto dos estados quanto dos municípios.Cada vez mais as atividades humanas são limitadas por,e limitam, os recursos naturais. A disponibilidade denovos territórios e recursos vem sendo reduzida, o quetorna imperativo o ordenamento das atividades econô-micas e das pessoas.
Em São Paulo, as transformações verificadas nasúltimas décadas revelaram novos processos deredistribuição espacial da população, destacando-seaqueles em âmbito metropolitano e, especialmente, osfluxos migratórios da metrópole para o interior. Umanova dinâmica urbano-regional é determinada por fato-res como desconcentração das atividades industriais naRMSP, incremento da circulação nos eixos de desen-volvimento do Estado, em função de investimentos emtransportes, crescimento dos centros e subcentros regi-onais, formação de pequenos aglomerados urbanos (ci-dades com menos de 20.000 habitantes), cidades deportes intermediário e médio, abrigando áreas para lo-calização industrial, insumos industriais e agrícolas, ouainda áreas para localização populacional. Configuram-se como pólos regionais, as regiões de governo de SãoJosé dos Campos, Sorocaba, Campinas, Ribeirão Preto,Bauru e São José do Rio Preto.
Nesse cenário de dinamismo crescente, a migra-ção assumiu grande importância, refletindo a própriaespacialização desigual das atividades econômicas, deemprego e de renda. As mudanças no setor agrícola, coma intensificação dos complexos agroindustriais e o pro-cesso de interiorização da indústria geraram um interiorforte. Assim, a tendência do fluxo metrópole-interior foiconsolidada na década de 80, caracterizando a expansãoregional fora das fronteiras metropolitanas e revelandonovos padrões sócioespaciais.
The longevity of individuals in a society is a conse-
quence of a complex chain of factors such as education,
family income, local environmental conditions, eating hab-
its, and tobacco, alcohol and drug consumption. These fac-
tors are also reflected in the children mortality rate, one of
the main indicators for life and health conditions of a popu-
lation. In the case of São Paulo, the children mortality rate
has been reduced significantly, from 51.2 deaths per thou-
sand live-born in 1980 to 27 in 1991, 22.7 in 1996 and 18.7
in 1998. In the period 1990-1999, the mortality in the State,
in terms of number of deaths per year, increased from
204,000 to 236,000 mainly as a result of the aging process of
the population observed in the last few decades. The mor-
tality rate, on the other hand, did not change, remaining
around 6.5 deaths per thousand inhabitants.
MIGRATION
In the last thirty years migratory movements have
played an increasingly important role in the context of popu-
lation dynamics in Brazil and will be the main explanation
for changes in size and characteristics of the population,
whether regarding States or municipalities. More and more,
human activities are limited by the natural resource scar-
city. The availability of new territories and resources is be-
ing reduced, a fact that makes it imperative to order social
and economic activities.
In São Paulo the changes in the past decade have re-
vealed new processes of population redistribution dynam-
ics, especially regarding migration towards the larger cities,
especially from the metropolitan regions to the interior zone.
Factors such as the decline of industrial activities in the
São Paulo Metropolitan Region (SPMR), an increase in the
circulation along major development routes (northeast and
northwestwards) of the State, due to investments in trans-
portation, growth of regional centers and sub-centers, for-
mation of small urban conglomerates (cities with fewer than
20 thousand inhabitants), mid-size cities as industrial de-
velopment areas, industrial and agricultural inputs, or popu-
lation settlement, all this indicate the arising of a new
urban-regional dynamics. The State government adminis-
trative regions of São José dos Campos, Sorocaba, Campinas,
Ribeirão Preto, Bauru and São José do Rio Preto are classed
as regional centers.
In this dynamic growth scenario, migration has as-
sumed great importance, resulting in an uneven geographi-
cal distribution of economic activity, employment, and
income. The changes of the agricultural sector, with agro-
industrial complexes and industries moving in-country, has
helped build a strong State countryside. This inland flow
became consolidated in the 80s, representing a regional
expansion outside metropolitan frontiers, pointing out new
socio-geographic patterns.
A decrease in the incoming flow of migrants from
other states resulted in significant decrease in the popula-
tion growth of the SPMR. The growth rate was 3,5% a year
in the 70s, 2,1% in the 80s and 1,8 in the 90s. The lower

18
A diminuição do fluxo de entrada de migrantesvindos de outros Estados ocasionou uma desaceleraçãosignificativa no ritmo de crescimento populacional daárea metropolitana de São Paulo, com uma taxa anualde crescimento de 3,5% nos anos 70, 2,12% entre 1980/91, e 1,8% nos anos 90. O menor crescimento anual daRMSP (1,9% no período 1980/91, 4,5% na década ante-rior e 1, 6% entre 1991-2000) refletiu-se fortemente nataxa estadual (2,1% nos anos 80 e 1,8% na década de90), situada abaixo da média nacional (1,93% e 1,6%,respectivamente). Destaca-se, no entanto, o ritmo decrescimento na periferia da RMSP (3,2%, nos anos 80, e2,8% nos 90). A figura 1.7 evidencia a importância daconcentração populacional na RMSP.
Historicamente, a concentração na macrorregiãoformada pela RMSP e pelas Regiões Administrativas deCampinas, São José dos Campos e Santos, cada umaabrigando mais de 1 milhão de habitantes, tem geradopressões importantes sobre os recursos naturais básicos.A qualidade do ar e a questão dos recursos hídricos sãoas mais evidentes. Vale destacar, ainda, o processo deurbanização marcado pela falta de adequação da infra-estrutura urbana.
annual growth of the SPMR (1,9% in the period 1980-1991,
as compared to 4,5% in the previous decade, plus 1,6 a year
from 1991 to 2000, influenced the state growth rate (2,1%
and 1,8% in the 80s and 90s respectively, what is lower than
the national average (1,93% and 1,6% respectively). A dif-
ferent growthrate on the outskirts of the SPMR, however,
has to be pointed out: 3,2% in the 80s and 2,8 in the 90s,
showing the importance of the populational concentration
in the SPMR.
Historically, the populational concentration in the
macro-region formed by the SPMR and the Administra-
tive Regions of Campinas, São José dos Campos and Santos
has caused significant strain on basic natural resources, es-
pecially air quality and water resources. It may be impor-
tant to note that the urbanization process was characterized
by the lack of appropriate urban infrastructure.
HABITAÇÃO
Após décadas de problemas associados ao déficitda oferta de moradias urbanas motivados pelo intensoprocesso de urbanização, explosão demográfica e êxodorural, e as dificuldades de acesso a financiamentos paraaquisição de domicílios próprios, em 19998 houve ligei-ra melhora na densidade habitacional nas grandes cida-des do Estado de São Paulo, utilizando-se como medidaa relação “número de moradores por dormitório”.
Entretanto, o desenvolvimento habitacional doEstado, nos últimos anos, pode ser melhor avaliado peloIDHab - Índice Nacional de DesenvolvimentoHabitacional, inspirado no conceito de IDH, apresen-tado na figura 1.8. Esse índice considera, para o seu cál-culo, o déficit habitacional qualitativo, o acesso dodomicílio a serviços de água potável, esgoto e energiaelétrica e o espaço físico da habitação (inverso doadensamento domiciliar).
HOUSING
After decades of problems associated with the deficit
in urban housing due to an intense urbanization process,
caused by an explosive population growth and by the rural
exodus and also due to the lack of appropriate financing
mechanisms for home acquisitions, in 19998 there was a sliht
improvement in the populational density in large cities in
the State of São Paulo, if the parameter number of people
per room is used.
On the other hand, the National Index for Housing
Development (IDHab), which was inspired on the HDI
concept, can better be used to evaluate the progresses in
housing development in the State in the past few years (see
Figure 1.8). This index takes into acount the qualitative
housing deficit, the residential access to drinking water,
basic sanitation assets, access to electricity and total living
area.
Figura 1.7 - Evolução da população nas principais áreasmetropolitanas do Estado de São Paulo - Período 1970-2000. Fonte: IBGE.Figure 1.7 - Evolution of total population figures in the
Administrative Regions of the State of São Paulo and the
participation of each region (%) in the State; totals, for 1970,
1980, 1991 and 2000. Source: IBGE Demographic Census,
1970, 1980, 1991 and preliminary results for 2000.

19
O IDHab, de 1997 para 1998, apresentou incre-mento de 1,6% (0,744 para 0,756), refletindo uma ligei-ra melhora nas condições habitacionais no Estado. Em1996, este índice foi 0,87, o maior já observado no País,e retrata condições superiores do nível habitacional, secomparado aos valores obtidos para os demais Estadosbrasileiros. Entretanto, não se pode desprezar outra re-alidade bastante séria e expressiva em todos os centrosurbanos do País: as favelas e moradias informais. As im-plicações ambientais dessas habitações são muito signi-ficativas pois geralmente se estabelecem em regiões quedeveriam ser preservadas, como morros e margens decórregos. O maior impacto, sem dúvida, é na qualidadede vida dos moradores, privados dos direitos básicos deexistência e sobrevivência humana.
O primeiro aumento significativo do número debarracos aconteceu com a migração, em que a ocupaçãode áreas de risco, como fundos de vales e encostas ín-gremes foi e continua sendo uma das alternativas. Atu-almente, esse aumento decorre das característicasexcludentes do processo desenvolvimentista brasileiro.Como solução, vem sendo feita a realocação dos mora-dores das áreas centrais para áreas periféricas, ou suaexpulsão, o que resulta em reincidência na ocupação deáreas irregulares.
Os índices de presença de favelas, população resi-dente e comportamento dessa forma de ocupação urba-na são informações de difícil obtenção, a iniciar peladefinição de ‘favela’; sua classificação varia conforme afonte consultada, sendo os dados disponíveis discrepan-
The IDHab increased from 0.744 in 1997 to 0.756 in
1998 – an increase of 1.6%, reflecting a slight improvement
in the housing conditions in the State. In 1996, this index
was 0.87, the largest value ever observed in the country –
this indicates a superior housing situation in São Paulo when
compared to other Brazilian States. However, it is not pos-
sible to ignore a serious and expressive reality in all urban
centers in the country: the favelas (slums) and illegal set-
tlements. These are population agglomerates built of low
quality materials, without permits and little if any basic
infrastructure (such as sanitation services).
The environmental implications of favelas are very
significant as these settlements, are generally sited in re-
gions that should be preserved, such as hillslopes and nearby
stream banks. Certainly, their major impact is on the life
quality of its own inhabitants, who are kept without basic
living conditions. The first significant increase in the
number of favelas started with the migrants that occupied
risk areas such as valley bottoms and steep hills. This was
and continues to be one of the housing alternatives for new-
comers. Nonetheless, the current increase in the number
of favelas is a consequence of social exclusion caused by
the Brazilian development process, in which the real es-
tate market predominates over government regulatory ac-
tions.
This problem has been historically addressed with
the relocation of the lower-income favela population from
central to periphery areas, or by removing the population
without preventing the irregular occupation of other areas.
The index of existing “favelas”, their population and
trends of this form of urban occupation are difficult infor-
mation to obtain, the appropriate definition of “favela” to
Figura 1.8 – IDHab para São Paulo, o Brasil e Estados brasileiros, em 1992 e 1998. O valor entre 0,6 e 0,7 indica desenvol-vimento habitacional médio. Fonte: Sinduscon.Figure 1.8 – IDHab values for São Paulo and other Brazilian States in 1992 and 1998. The values between 0.6 and 0.7 indicate
average housing development. Source: Sinduscon

20
tes e de difícil comparação. O IBGE, por exemplo, re-gistrava no município de São Paulo, em 1996, 506 fave-las com 177.141 domicílios e 748.455 moradores (índicede ocupação por domicílio de 4,22 pessoas) e, em 2000,registra a presença de 612 favelas. Segundo a Prefeiturado Município de São Paulo, em 1993 existiam 1.592 fa-velas no município, com 378.863 domicílios e 1.901.892moradores (índice de ocupação por moradia de 5,02 pes-soas)9. Essas informações não são comparáveis porque:o IBGE considera favela e assemelhados como aglome-rados subnormais (ou seja, um conjunto de mais de 50unidades habitacionais, como barracos, casas, etc.) loca-lizados em terrenos de propriedade alheia (pública ouparticular), com ocupação desordenada e densa, sendoem geral, carente de serviços essenciais; a Secretaria deHabitação do Município de São Paulo considera favelae assemelhados os agrupamentos de, no mínimo, duasunidades habitacionais precariamente construídas e dis-postas de forma desordenada em um mesmo lote, cujapropriedade não é legalizada para aqueles que o ocu-pam.
Ainda segundo dados da Prefeitura do Municípiode São Paulo, entre 1973 e 1987, enquanto a populaçãototal do município cresceu 60%, o número de residen-tes em favelas aumentou mais de 100%; e, em 1996,7,61% dos paulistanos residiam nessas moradias10, princi-palmente em bairros periféricos. Outra região do Estadoque registra expressivo crescimento de favelas é a BaixadaSantista que, segundo a fonte consultada11, possui umapopulação favelada quatro vezes superior à população ge-ral da região e, de 1996 a 2000, aumentou 43,6%, en-quanto os moradores tradicionais dos quatro maioresmunicípios da região não cresceram mais de 10,5%.
Os casos mais graves encontram-se nos municípi-os de Guarujá e Cubatão onde, respectivamente, 102.600dos 260.000 e 46.098 dos 107.000 habitantes sãofavelados. Levantamento de 199612, apontava 50.644submoradias na região e, atualmente, registra 68.000barracos, um crescimento de 34,1%.
start with, because definitions are different according to the
research source, and so are the available data. IBGE, the
Brazilian Institute for Geography and Statistics, for exam-
ple, registered in 1996 506 favelas in São Paulo, comprising
177,141 “homes”, 748,455 occupants, what means 4.22 oc-
cupants/unit. In 2000, it has registered 612 favelas. The
municipality of São Paulo, however, has registered in 1993,
1592 favelas with 378,863 “homes” and 1,901,892 occupants,
what means 5.02 occupants/unit.9 Obviously, this available
information is not comparable; while IBGE considers that
favelas and the like are subnormal conglomerates (more
than fifty houses), irregularly owned (i.e.: mostly on pub-
licly owned areas), haphazardly and inadequately placed.
The city of São Paulo’s Housing Secretariat considers that
favelas and the like are limited to housing groups of at least
two precariously built and unsafely located housing units
in a same location, whose ownership is not legalized.
Further municipal data for the 1973-1987 period state
that, while total population had increased by 60%, the
number of favela residents had increased by more than
100%. In 1996, 7.61% of São Paulo City’s inhabitants were
living in favela-type settlements10, primarily in uptown dis-
tricts. Other State regions have also been registering huge
problems with the increasing numbers of favela settlements,
such as the Santos Lowlands Metropolitan Region11, with
a rate of favela inhabitants 4 times greater than its regular
urban population. During 1996-2000, this population has
undergone a 43.6% increase, while traditional homeowner
increase was not more than 10.5%.
The most critical municipalities affected have been
Guarujá and Cubatão, with favela inhabitant numbers be-
ing, respectively, 102,600 (in 260,000) and 46,098 (in a
107,000 total) inhabitants. A 1996 survey12 showed 50,644
slums in the region. Nowadays, this has already increased
to 68,000, or a 34.1% increase.
EDUCATION
The educational level also plays an increasingly im-
portant role in human development. In the State of São
Paulo, the largest providers of educational services are the
State and municipal governments – the municipalities play-
ing an increasing role, especially in basic education. The
State participation continues to predominate, although it
has declined from 78% in 1978 to 73% in 1998. In the last
two decades, there was a substantial increase in the
enrollment rate in basic and secondary education - from
approximately 4.9 million students in 1978 to 8.3 million in
1998. Between 1970 and 1996 the average number of school
years completed by Brazilian students increased from 2.2
to 5.7 for women and from 2.6 to 5.4 for males.
EDUCAÇÃO E ESCOLARIDADE
A escolaridade também desempenha importantee crescente papel no desenvolvimento humano. NoEstado de São Paulo, os maiores provedores de serviçoseducacionais são os setores públicos estadual e munici-pal, com a participação dos municípios aumentando es-pecialmente no ensino fundamental. A parcela estadualcontinua predominante, embora sua participação relati-va tenha diminuído de 78%, em 1978, para 73% em 1998.Nas últimas décadas, houve aumento significativo nonúmero de matrículas para os ensinos fundamental emédio, passando de aproximadamente 4,9 milhões dealunos, em 1978, para 8,3 milhões em 1998. Entre 1970 e1996 o número médio de anos de estudo dos brasileiros

21
aumentou, variando de 2,2 para 5,7 entre as mulheres, ede 2,6 para 5,4 para os homens.
Em 1993, o Brasil possuía um dos maiores contin-gentes de analfabetos do mundo e o maior da Américado Sul. Apesar da reduzida melhora observada nos últi-mos anos, a situação ainda pode ser consideradapreocupante. Os baixos índices de permanência e pro-gressão escolar reproduzem continuamente um contin-gente numeroso de analfabetos funcionais, pois apenasum terço da população jovem e adulta conclui os oitoanos de escolaridade básica obrigatória. Apesar da signi-ficativa mudança observada entre 1992 e 1997 eviden-ciando importante evolução nos indicadores médios deriqueza municipal, longevidade e escolaridade, os indi-cadores paulistas de escolaridade ainda são relativamentebaixos se comparados com os de alguns países. De qual-quer modo, as mudanças parecem notáveis em diversasregiões, particularmente no Vale do Ribeira e nas áreascentral e oeste do Estado.
In 1993, Brazil was one of the countries featuring the
largest numbers of illiterate people in the world and the
largest in South America. Although there has been some
improvement in the past few years, the situation is still a
cause for concern. The high rates of school dropouts and
large amounts of students with little interest on schooling
progress continuously produce a large number of function-
ally illiterates, as only one third of the youth and adult popu-
lation has finished the 8 years of mandatory basic education.
Although significant changes have been observed
between 1992 and 1997 in terms of municipal wealth indi-
cators, longevity and schooling, the São Paulo indicators
are still quite low when compared to other countries. Nev-
ertheless, recent changes are very impressive in some State
regions, particularly in the Vale do Ribeira and in the cen-
tral and western areas of the State.
1 SEADE2 EMPLASA3 CNI4 SEADE5 Proposto pelo PNUD6 CVS e Instituto Pasteur7 IBGE8 SEADE9 PRODAM; PMSP10 PRODAM; www.comciencia.br/reportangens/cidades11 www.cosmo.com.br/cidades/santos12 IBGE
1 SEADE2 EMPLASA3 CNI4 SEADE5 As proposed by UNDP6 C SV and Pasteur Institute7 IBGE/CVS8 SEADE9..PRODAM; PMSP10PRODAM;www. comciencia.br/reportagens/cidades11 www.cosmo.com.br/cidades/santos,12 IBGE
NotesNotas