evaluation of the brazilian potential for … · À marcelle, por ser minha alma gêmea em todos os...
TRANSCRIPT

EVALUATION OF THE BRAZILIAN POTENTIAL FOR PRODUCING AVIATION
BIOFUELS THROUGH CONSOLIDATED ROUTES
Francielle Mello de Carvalho
Dissertação de Mestrado apresentada ao Programa
de Pós-graduação em Planejamento Energético,
COPPE, da Universidade Federal do Rio de Janeiro,
como parte dos requisitos necessários à obtenção do
título de Mestre em Planejamento Energético
Orientador(es): Alexandre Salem Szklo
Joana Portugal Pereira
Rio de Janeiro
Fevereiro de 2017

EVALUATION OF THE BRAZILIAN POTENTIAL FOR PRODUCING AVIATION
BIOFUELS THROUGH CONSOLIDATED ROUTES
Francielle Mello de Carvalho
DISSERTAÇÃO SUBMETIDA AO CORPO DOCENTE DO INSTITUTO ALBERTO
LUIZ COIMBRA DE PÓS-GRADUAÇÃO E PESQUISA DE ENGENHARIA (COPPE)
DA UNIVERSIDADE FEDERAL DO RIO DE JANEIRO COMO PARTE DOS
REQUISITOS NECESSÁRIOS PARA A OBTENÇÃO DO GRAU DE MESTRE EM
CIÊNCIAS EM PLANEJAMENTO ENERGÉTICO.
Examinada por:
________________________________________________
Prof. Alexandre Salem Szklo. D.Sc.
________________________________________________
Profa Joana Portugal Pereira, Ph.D.
________________________________________________
Prof. Joaquim Eugênio Abel Seabra, D.Sc.
________________________________________________
Prof. Roberto Schaeffer, Ph.D.
RIO DE JANEIRO, RJ – BRASIL
FEVEREIRO 2017

iii
Carvalho, Francielle Mello de
Evaluation of the Brazilian potential for producing
aviation biofuels through consolidated routes / Francielle
Mello de Carvalho – Rio de Janeiro: UFRJ/COPPE, 2017.
XI, 126 p.: il.; 29,7 cm.
Orientadores: Alexandre Salem Szklo
Joana Portugal Pereira
Dissertação (Mestrado) – UFRJ/ COPPE/ Programa de
Planejamento Energético, 2017.
Referências Bibliográficas: p. 118-126
1. Biocombustíveis 2. Mudanças climáticas 3. Resíduos
de biomassa. I. Szklo, Alexandre Salem et al. II.
Universidade Federal do Rio de Janeiro, COPPE, Programa
de Planejamento Energético. III. Título

iv
AGRADECIMENTOS
Agradeço primeiramente aos meus orientadores Alexandre e Joana, por estarem sempre
dispostos e disponíveis a colaborar com o meu trabalho, sempre muito prestativos e
pacientes. Por toda a segurança e conhecimento que me transmitem e por serem
verdadeiros exemplos de profissionais. Me sinto extremamente orgulhosa de ser vossa
aluna.
Ao professores Roberto Schaeffer e Joaquim Seabra por aceitarem participar da banca
desta dissertação.
Ao meu pai Francisco, minhas irmãs Marcelle e Cintia e minha sobrinha Melissa, por
preencherem a minha vida de amor e por todo apoio e torcida. Família é a base de tudo.
À minha mãe, por ter sido a melhor que eu poderia ter. Por ter me ensinado a ser forte,
responsável e determinada. Saudades eternas.
À Marcelle, por ser minha alma gêmea em todos os sentidos. Por dividir comigo a vida,
preocupações, inseguranças, alegrias.
Ao Felipe, por ser o meu porto seguro, por todo o companheirismo, lealdade, amor e
paciência.
À tia Márcia, por ter me apresentado o PPE e por todo carinho, ajuda e zelo.
Ao Fábio, por ser um grande amigo que este mestrado me deu. Por estar sempre disposto
ajudar, pela parceria nos trabalhos, por todas as caronas e conversas nas viagens Niterói-
Rio.
À todos os demais colegas do PPE, que compartilharam estes dois anos comigo.
Ao CNPq pelo apoio financeiro.
E, principalmente, à Deus, pois sem ele nada disto seria possível.

v
Resumo da Dissertação apresentada à COPPE/UFRJ como parte dos requisitos
necessários para a obtenção do grau de Mestre em Ciências (M.Sc.)
AVALIAÇÃO DO POTENCIAL BRASILEIRO PARA PRODUÇÃO DE
BIOCOMBUSTÍVEIS DE AVIAÇÃO A PARTIR DE ROTAS CONSOLIDADAS
Francielle Mello de Carvalho
Fevereiro/2017
Orientadores: Alexandre Salem Szklo
Joana Portugal Pereira
Programa: Planejamento Energético
A indústria da aviação estabeleceu metas ambiciosas para reduzir o consumo de
combustível, não só para reduzir os custos, mas também para reduzir as emissões de gases
de efeito estufa (GEE). Tais metas incluem melhorias na eficiência, crescimento neutro
em carbono a partir de 2020 e expressivas reduções na pegada de carbono até 2050. Uma
das estratégias estabelecidas para atingir esses objetivos é o desenvolvimento de
combustíveis alternativos sustentáveis, também conhecidos como biojet. O Brasil pode
ser considerado um potencial produtor de biojet devido às condições edáfoclimáticas
favoráveis, que fazem do país um grande produtor agrícola. Além disso, o país possui
elevada disponibilidade de recursos e uma vasta experiência na utilização de biomassa
para a produção de biocombustíveis. Nesse sentido, esta dissertação apresenta um estudo
de caso para avaliar o potencial da produção de biojet no Brasil. Para tal, alguns
indicadores como disponibilidade de matéria-prima, performance ambiental e efetividade
de custo para rotas de produção selecionadas foram avaliados. Os resultados mostraram
que o país tem um potencial expressivo de bioenergia que está favoravelmente
concentrado próximo às principais localidades de manuseio de combustível no país.
Ainda assim, as reduções nas emissões de gases de efeito estufa (GEE) no ciclo de vida
atingiram 94% para uma das rotas selecionadas, em comparação com o combustível
convencional. No entanto, as principais rotas de produção exigem altos investimentos de
capital ou despesas com matéria-prima, resultando em altos custos nivelados para os
combustíveis.
vi
Abstract of Dissertation presented to COPPE/UFRJ as a partial fulfillment of the
requirements for the degree of Master of Science (M.Sc.)
EVALUATION OF THE BRAZILIAN POTENTIAL FOR PRODUCING AVIATION
BIOFUELS THROUGH CONSOLIDATED ROUTES
February/2017
Advisors: Alexandre Salem Szklo
Joana Portugal Pereira
Department: Energy Planning
The aviation industry has set ambitious goals to reduce fuel consumption not only
to reduce costs but also to reduce greenhouse gas (GHG) emissions. These goals include
energy efficiency improvements, a carbon neutral growth from 2020 on and expressive
reductions in carbon footprint by 2050. One of the strategies established for achieving
these goals is the development of alternative sustainable fuels, also known as biojet fuels.
Brazil may be considered a potential producer of biojet fuel given its favorable
edaphoclimatic conditions that makes the country a major agricultural producer.
Furthermore, the country has a high availability of resources and a vast experience in
biomass utilization for biofuels production. In this sense, this dissertation presents a case
study for assessing the potential of biojet fuel production in Brazil. To this end, some
indicators as feedstock availability, environmental performance and the cost-
effectiveness of selected production routes were evaluated. Results has shown that the
country has an expressive bioenergy potential that is favorably concentrated near the main
localities of fuel consumption and handling in the country. Still, reductions in life cycle
GHG emissions reached 94% for one of the selected routes, compared to the conventional
jet fuel. However, the main production routes require high capital investments or
feedstock expenses leading to high levelized fuel costs.

vii
Table of content
1. Introduction ............................................................................................................... 1
2. Jet fuel ....................................................................................................................... 7
2.1 Fuel composition ................................................................................................ 8
2.1.1 Paraffins ...................................................................................................... 8
2.1.2 Olefins ........................................................................................................ 8
2.1.3 Aromatics ................................................................................................... 9
2.1.4 Non hydrocarbon compounds ..................................................................... 9
2.2 Fuel requirements ............................................................................................ 11
2.2.1 Energy content .......................................................................................... 11
2.2.2 Freeze point .............................................................................................. 11
2.2.3 Thermal stability ....................................................................................... 12
2.2.4 Viscosity ................................................................................................... 12
2.2.5 Combustion characteristics ....................................................................... 12
2.2.6 Lubricity ................................................................................................... 12
2.2.7 Material compatibility .............................................................................. 13
2.2.8 Safety properties ....................................................................................... 13
2.3 Fuel certification .............................................................................................. 14
2.4 Aviation industry ............................................................................................. 17
2.5 Brazilian aviation kerosene production and logistics ...................................... 20
2.5.1 Aviation kerosene logistics in Brazilian regions ...................................... 23
3. Biojet fuel ................................................................................................................ 29
3.1 Biojet fuel production routes ........................................................................... 29
3.1.1 Alcohol to Jet ............................................................................................ 30
3.1.2 Oil to Jet ................................................................................................... 33
3.1.3 Gas to jet ................................................................................................... 38
3.1.4 Sugar to Jet ............................................................................................... 42
4. Methodology ........................................................................................................... 47
4.1 Feedstock availability ...................................................................................... 47
4.2 Life cycle assessment ....................................................................................... 56
4.3 Techno-economic feasibility of biojet production routes ................................ 62
4.3.1 HEFA methodological description ........................................................... 63
4.3.2 FT-BTL methodological description ........................................................ 67

viii
5. Results ..................................................................................................................... 71
5.1 Feedstock availability ...................................................................................... 71
5.2 Life cycle assessment results ........................................................................... 91
5.3 Techno-economic feasibility of biojet production routes ................................ 95
5.3.1 HEFA-SPK ............................................................................................... 95
5.3.2 FT-SPK ..................................................................................................... 99
5.4 Discussion ...................................................................................................... 105
6. Conclusion ............................................................................................................. 114
7. References ............................................................................................................. 118

ix
Figures
Figure 1: Jet fuel production scheme in Brazilian refineries ............................................ 7
Figure 2: Aviation fuel efficiency gains ......................................................................... 18
Figure 3: Aviation kerosene and oil prices ..................................................................... 19
Figure 4: Aviation kerosene supply scheme in Brazil (ANP 2014) ............................... 20
Figure 5: Refineries producing aviation kerosene .......................................................... 21
Figure 6: Jet fuel consumption per region in Brazil ....................................................... 23
Figure 7: Aviation kerosene logistics in the North region .............................................. 24
Figure 8: Aviation kerosene logistics in the Northeast region ....................................... 25
Figure 9: Aviation kerosene logistics in Southeast and Midwest regions ...................... 27
Figure 10: Aviation kerosene logistics in South region ................................................. 27
Figure 11: Main steps in the alcohol-to-jet process. Based in (GUELL ET AL. 2012) ..... 30
Figure 12: Biomass feedstocks and technological pathway for the ATJ route. Based on
(GUELL ET AL. 2012) ....................................................................................................... 32
Figure 13: Biomass feedstocks and technological pathway for the HEFA pathway.
Based on (GUELL ET AL. 2012) and (WANG & TAO 2015) ............................................. 35
Figure 14: Biofuel isoconversion process through catalytic hydrothermolysis ............. 37
Figure 15: Main steps in the HDCJ process.. Based on (ELGOWAINY ET AL. 2012; GUELL
ET AL. 2012) .................................................................................................................... 38
Figure 16: Main steps in the FT-SPK process. Based on (GUELL ET AL. 2012) ............. 40
Figure 17: Main steps in gas fermentation route to produce biojet. Based on (WANG &
TAO 2015). ...................................................................................................................... 41
Figure 18: Main steps in catalytic upgrading of sugars to jet fuel. Adapted from (NABC
2011) ............................................................................................................................... 43
Figure 19: Main steps in the FTJ route. Adapted from (NREL 2013) ........................... 45
Figure 20: Different potential of biomass resources classifications ............................... 48
Figure 21: Production chain of forestry and wood sector. ............................................. 52
Figure 22: Bioenergy potential from selected biomass residues in Brazilian territory .. 54
Figure 23: Jet fuel refineries, distribution terminals and main airports in Brazil ........... 55
Figure 24: Biodiesel and ethanol plants and soybean oil refineries in Brazil ................ 56
Figure 25: WTW cycle for conventional jet fuel production ......................................... 57
Figure 26: WTW cycle for biojet fuel production .......................................................... 57
Figure 27: UOP jet fuel production process from natural oils and fats .......................... 60
Figure 28: Life cycle stages of HEFA jet fuel production from soybeans ..................... 60
Figure 29: Life cycle stages for FT-BTL jet fuel production from biomass .................. 61
Figure 30: Contribution of each region for country's bioenergy potential. .................... 71
Figure 31: Bioenergy potential for each crop in country's regions. ............................... 72
Figure 32: Soybean bioenergy potential distributed for each municipality. ................... 73
Figure 33: Sugarcane bioenergy potential distributed for each municipality ................. 73
Figure 34: Eucalyptus bioenergy potential distributed for each municipality................ 74
Figure 35: Maize bioenergy potential distributed for each municipality ....................... 75
Figure 36: Rice bioenergy potential for each municipality ............................................ 75
Figure 37: Pinus bioenergy potential for each municipality .......................................... 76
Figure 38: Forestry extraction bioenergy potential for each municipality ..................... 77
Figure 39: Wheat bioenergy potential for each municipality ......................................... 77
Figure 40: Kernel map for total biomass energy potential ............................................. 78

x
Figure 41: Biomass energy density for agricultural and agro-industrial biomass residues
........................................................................................................................................ 79
Figure 42: Kernel maps for soybeans bioenergy potential ............................................. 80
Figure 43: Kernel maps for sugarcane bioenergy potential ............................................ 80
Figure 44: Kernel map for eucalyptus bioenergy potential ............................................ 81
Figure 45: Kernel map for maize bioenergy potential .................................................... 81
Figure 46: Kernel map for rice bioenergy potential ....................................................... 82
Figure 47: Kernel map for pinus bioenergy potential..................................................... 82
Figure 48: Kernel map for forestry extraction bioenergy potential ................................ 83
Figure 49: Kernel map for wheat bioenergy potential .................................................... 83
Figure 50: Determination of biomass hotspots ............................................................... 84
Figure 51: Biomass energy hotspots for each crop......................................................... 84
Figure 52: Zoom on kernel map ..................................................................................... 85
Figure 53: Total bioenergy potential and important localities for jet fuel logistics ....... 86
Figure 54: Total bioenergy potential hotspot and localities of biofuels and soybean oil
production in Brazil ........................................................................................................ 87
Figure 55: Biomass energy hotspots and important localities for jet fuel logistics ........ 88
Figure 56: Biomass energy hotspots and localities of biofuels and soybean oil
production in Brazil ........................................................................................................ 89
Figure 57: Biomass energy hotspots and important localities for jet fuel logistics in
Southeast and South regions ........................................................................................... 89
Figure 58: Biomass energy hotspots and localities of biofuels and soybean oil
production in Southeast and South regions .................................................................... 90
Figure 59: Soybeans and maize energy hotspots and localities of biodiesel and soybean
oil production in Midwest regions .................................................................................. 91
Figure 60: Life cycle or WTW GHG emissions ............................................................. 92
Figure 61: Life cycle or WTW fossil fuel consumption ................................................. 92
Figure 62: GHG emissions in WTP and PTW stages ..................................................... 93
Figure 63: Emissions from different activities in WTP stage and total GHG emissions
with carbon offset ........................................................................................................... 94
Figure 64: Fossil fuel consumption in WTP and PTW stages ........................................ 94
Figure 65: Contributions to HEFA biojet LCOF ............................................................ 96
Figure 66: Contributions to HEFA biojet LCOF and technological scale gains. ........... 96
Figure 67: Sensibility analysis for HEFA biojet (plant A) ............................................. 98
Figure 68:Sensibility analysis for HEFA biojet (plant B) .............................................. 98
Figure 69: Sensibility analysis for HEFA biojet (plant C) ............................................. 99
Figure 70: Costs components and technological scale gains for FT-BTL pathway ..... 101
Figure 71: Sensibility analysis for FT-BTL biojet fuel (plant A)................................. 102
Figure 72: Sensibility analysis for FT-BTL biojet fuel (plant B) ................................. 103
Figure 73: Sensibility analysis for FT-BTL biojet fuel (plant C) ................................. 103
Figure 74: Sensibility analysis for FT-BTL biojet fuel (plant D)................................. 104
Figure 75: Soybean and maize annual production profile ............................................ 107
Figure 76: GHG emissions for different biojet LCA studies........................................ 109
Figure 77: Historical crude oil and jet fuel prices ........................................................ 112
xi
Tables
Table 1: Additives used in jet fuel .................................................................................. 10
Table 2: Jet fuel requirements. ....................................................................................... 13
Table 3: Jet fuel (QAV-1) specifications in Brazil ......................................................... 16
Table 4: Aviation kerosene production of each refinery ................................................ 22
Table 5: ATJ strengths and challenges. .......................................................................... 33
Table 6: HEFA strengths and challenges. ...................................................................... 35
Table 7: Strengths and challenges for FT-SPK pathway. ............................................... 40
Table 8: Planted area and productivity of the crops selected ......................................... 49
Table 9: Characteristics of evaluated residues ............................................................... 51
Table 10: Input data for agricultural stage of soybean production used in GREET ...... 59
Table 11: Parameters considered in HEFA and FT-BTL cost estimates. ....................... 62
Table 12: Inputs and products profile for HEFA pathway. Based in (PEARLSON 2011) 64
Table 13: Parameters considered in the economic analysis. .......................................... 64
Table 14: Equipment and other expenses included in HEFA plant investment ............. 65
Table 15: Assumptions made in fixed costs estimate. (PEARLSON 2011) ...................... 66
Table 16: Prices of production supplies that compose the variable costs analysed for
HEFA plant ..................................................................................................................... 67
Table 17: Inputs and energy consumption for FT-BTL biojet production. .................... 68
Table 18: Parameters adopted for FT-BTL cost analysis ............................................... 69
Table 19: Prices of production supplies that compose the variable costs analysed for FT-
BTL plant ........................................................................................................................ 69
Table 20: Biomass potential hotspots for each crop ....................................................... 85
Table 21: HEFA biojet fuel costs ................................................................................... 95
Table 22: Jet fuel break-even prices for different HEFA biojet plant capactities. ......... 97
Table 23: FT-BTL jet fuel costs ................................................................................... 100
Table 24: Jet fuel break-even prices for different FT-BTL plant capacities ................ 101
Table 25: Bioenergy from biomass residues for each crop and energy inputs for FT-BTL
pathway ......................................................................................................................... 106
Table 26: Bioenergy and biojet production with residues in the Southeast region ...... 106
Table 27: GHG emissions for different biojet LCA studies ......................................... 109
Table 28: Abatement costs for biojet fuel pathways .................................................... 105

1
1. Introduction
Aviation industry consumes around 1.5 billion barrels of kerosene per year
through 1,397 air companies that serve 3,864 airports through a network of several million
kilometers (ATAG, 2014). In 2015, the world’s airlines transported 3.5 billion people and
51 million metric tonnes of cargo through a fleet of 26,000 aircraft averaging 100,000
flights a day over a global network of 51,000 routes. This industry also contributes with
the global economy with $2.7 trillion of GDP (IATA, 2016). This industry strongly
depends of fossil fuels due to lack of alternatives to airplanes that travel great distances
(CANTARELLA et al., 2015). Jet fuel is produced from crude oil and according to the
U.S. Department of Energy (DOE’s) Bioenergy Technologies Office, 4 gallons1 of jet
fuel are produced from one oil barrel (EIA, 2013a; WANG; TAO, 2015). In 2014,
aviation fuels represented 6.9% of the world refinery output, totalizing approximately 340
million m3 (IEA, 2016). In this year, the jet fuel production in Brazil was around 6.1
million m3, representing almost 2% of world refinery output (ANP, 2015). As air transport
is a growing industry, it is expected that the demand for air transport doubles by 2034
(IATA, 2016).
Jet fuel represents an important share of operational costs of companies.
Approximately one third of these costs are spent on jet fuel: 33%, which is up from 13%
in 2001. The uncertainties related to oil prices fluctuation hamper management and
planning activities. These fluctuations are directly related to volatility in oil prices, caused
by distinct factors. Furthermore, aviation is responsible for about 2% of anthropogenic
CO2 emissions (CREMONEZ et al., 2014). Worldwide, flights produced 781 million
tonnes of CO2 in 2015, while humans produced globally over 36 billion tonnes of CO2.
For this reason, the reduction in fuel consumption is extremely important to ensure the
profitability of air companies and to reduce impacts on climate changes.
Historical trends indicate that a modern aircraft are around 80% more fuel efficient
than 40 years ago. Since then, aviation industry has been measuring its technical progress
according to aircraft and engine efficiency. These were achieved through modifications
in aircraft design together with incremental annual improvements to engine design and
operation (ATAG, 2010a). Efficient improvements have seen a halving of fuel
1 4 gallons are equivalent to approximately 15L (1 gallon = 3.48 L).

2
consumption per tonne kilometer travelled. Current operations generate around 50% less
CO2 per kilometer compared to the same flight back in 1990 (ENVIROAERO, 2016).
This progress has also been promoted by improved operational practices such as weight
reduction, more efficient flight procedures and reduced auxiliary power units usage,
together with improvements in air traffic management (ATM) and airport infrastructure.
Within this context, the International Air Transport Association (IATA) defined
ambitious goals to reduce fuel consumption not only to reduce costs but also to reduce
greenhouse gases (GHG) emissions (CANTARELLA et al., 2015). These goals include
fuel efficiency improvements of 1.5% per year up to 2020, carbon neutral growth from
2020 on, and reductions of 50% of carbon footprint by 2050 in relation to 2005 levels
(IATA, 2013). To accomplish these objectives, the industry relies on a four-pillar strategy
based on efficiency gains, improvements in air traffic management, alternative fuels and
market-based measures. Efficiency gains tend to be incremental, as modern aircrafts are
quite efficient. Furthermore, as air traffic improvements and efficiency gains have
potential to reduce emissions, these measures are insufficient to offset the expected
growth for the aviation sector (MAWHOOD et al., 2014). Hence, the development of
alternative jet fuels (hereafter biojet) has become crucial in the next years.
Through the International Civil Aviation Organization (ICAO) governments took
an important step in agreeing on an efficiency standard for commercial aircraft in
February 2016. After the approval by the ICAO Council, the standard will apply from
2020 and ensure that CO2 emissions from new aircraft do not exceed a limit defined which
is defined according to the size and weight of aircraft. In September of 2016, during the
39th ICAO Assembly, governments developed a proposal for a Carbon Offsetting and
Reduction Scheme for International Aviation (CORSIA) that was supported by industry.
However, this proposal should be adopted by the assembly, formed by the ICAO’s 191
member states, to come into force (IATA, 2016). Additionally, according to the IATA’s
2016 Annual review, a considerable progress in the context of alternative fuels was
achieved in 2015-2016:
United Airlines became the first US operator to launch scheduled commercial
biofuel-powered flights out of Los Angeles International Airport.
In April 2016, KLM airlines benefited from the Oslo airport’s new hydrant biofuel
supply system to promote 80 biofuel flights on its Cityhopper service.

3
Air New Zealand and Virgin Australia start a partnership to find opportunities for
developing biofuels locally.
Boeing launched project of sustainable fuels research and development with
Aeromexico and the Mexican government and started a partnership with Japanese
aviation stakeholders to develop a roadmap for biofuel flights for the 2020 Tokyo
Olympic Games.
The first IATA Alternative Fuel Symposium (AFS) happened together with the
IATA Aviation Fuel Forum in Mexico in November 2015. It brought together
airline customers and alternative fuel suppliers to discuss opportunities to remove
barriers to biojet development.
Recent studies have supported land use for bioenergy production in some regions
of the world, without compromising other uses such as food production and preservation
of the ecosystem (CANTARELLA et al., 2015; CORNELISSEN; KOPER; DENG, 2012;
PRIELER; FISCHER; VAN VELTHUIZEN, 2013). Brazil may be considered one of
these localities given its large experience in biomass utilization for energy purposes and
the high availability of resources throughout its territory. The country has the attractive
combination of available land already cleared for agricultural use, vigorous agriculture
sector, a large amount of legally-protected native vegetation and strong conservation laws
(CORTEZ et al., 2014). The country is a major producer and exporter of several
agricultural commodities such as sugar, soybeans, coffee, wood products, meat, among
others. The extensive territory with favorable edaphoclimatic conditions enables
sufficient agricultural production in terms of both quantity and variety for use as feedstock
for biofuel conversion (CORTEZ et al., 2014). Still, Brazil has a long experience in
producing biofuels with sugarcane ethanol and biodiesel programs. In 2014, Brazil
produced 3.4 Mm3 of biodiesel (77% from soybean and 20% from tallow) and 28.8Mm3
of ethanol (ANP, 2015). These characteristics make the country a potential producer for
advanced fuels, such as biojet.
A large variety of feedstock can be used including sugars, lignocellulosic biomass,
vegetable oils and agricultural and forestry residues. Although different plant species can
be used for bioenergy production, those that are widely cultivated with high yields are
more likely to support a biojet fuel industry in the near future. Sugarcane and soybeans
have already a well-established production chain in the country, as they are used for
ethanol and biodiesel production. Eucalyptus forestry is highly efficient due to favorable

4
climate conditions and investment in research and thus, has the highest hardwood yields
and lowest production costs in the world (ABRAF, 2013; RISI, 2015).The utilization of
oil crops is also interesting due to Brazilian large experience in biodiesel production.
Additionally, the large supply of crop residues such as straw, sugarcane bagasse and
forestry residues besides its low costs, make them an attractive feedstock. There is a huge
potential for bioenergy production from agricultural and agro-industrial residues that are
currently not recovered. This promising feedstock could be collected and processed to
generate bioenergy, instead of being left on the farmland where it decomposes, releasing
GHG emissions (PORTUGAL-PEREIRA et al., 2015). Municipal solid waste, tallow and
used cooking oil (UCO) are also options to biofuel production, not only to recycle
products that would otherwise require costly disposal, but also because they avoid food
security concerns (CORTEZ et al., 2014). Another non-food crop feedstock include
industrial waste residues, which are inherently low value, do not affect land use or
compete with food. However, some of these residual feedstocks are not available in large
amounts or even are disperse, which means that their conversion would not benefit from
scale economies and might suffer from logistic costs.
Notwithstanding, as important as the availability of feedstock, is their capacity of
being harnessed for fuel production according with sustainability requirements. For this
reason, when evaluating energy sources, the whole production chain should be considered
to verify its real potential to achieve environmental benefits and to detect its
disadvantages. To this end, the life cycle assessments (LCA) are performed, including all
lifetime stages of a product from the extraction of raw material, through processing,
manufacturing, distribution, use, disposal and recycling (ELGOWAINY et al., 2012).
Achieving this type of analysis is relevant for biofuel production, since its production
process requires energy from fossil fuels, whether in the form of fertilizers, pesticides and
machinery for agricultural and industrial phases, or for transportation of intermediate and
distribution of final products. From the LCA, the avoided emissions of a novel technology
can be determined. In addition, indirect effects of agricultural expansion for fuel
production are relevant concerns in the biofuels debate. This is the case of indirect land
use changes (iLUC) and competition with food producing. For this reason, the adoption
of instruments and policies are fundamental to ensure a sustainable expansion of biofuels
feedstock production.

5
Some studies found in the literature are related to the production of aviation fuels.
At the national level, Cantarella et al. (2015) assessed the potential feedstock in Brazil to
supply biojet fuel production. Cortez et al. (2014) performed a national assessment of the
technological, economic and sustainability challenges and opportunities regarding the
development and commercialization of sustainable aviation biofuels in Brazil. Their
technological roadmap process was divided into the work fronts of feedstock, refining
technologies and logistics. (CREMONEZ et al., 2014) discussed the current scenario and
prospects for the use of aviation biofuels in Brazil including the main technologies used,
their potential and the impacts generated by their use. (MORAES et al., 2014) assessed
the sustainability challenges for biofuels production and discussed the main barriers faced
by different classes of feedstock to meet sustainability requirements. Finally, Cremonez
et al. (2015) sought to identify the major environmental, economic and social impacts
arising from biojet fuel production in Brazil. On the subject of production routes, Guell
et al. (2012) identified, described and discussed the most promising and suitable
technological pathways and biomass resources for biojet fuel production in Norway. The
Pearlson (2011) thesis quantified the economic costs and environmental impacts of
producing fuels from hydroprocessed of renewable oils (HRO) process. Elia et al. (2013)
introduced a process synthesis framework for the conversion of hardwood biomass to
liquid transportation fuel such as gasoline, diesel and jet fuel. Finally, regarding GHG
emissions and fossil fuel consumption, Elgowainy et al. (2012) and Stratton et al. (2010)
performed a LCA of alternative jet fuels, while Bailis et al. (2010) performed a LCA from
biojet produced from jatropha curcas cultivated in Brazil. However, these studies present
limitations that this work attempted to reach. Such limitations are related to the isolated
and qualitative scope of each work that approached different aspects regarding biojet fuel
without considering the real specificities of its production in a determined place. For this
reason, the present work presents an relevant and original analysis regarding biojet fuel,
since it performs an specific case study for its production in Brazil.
In order to perform a specific case study for Brazil, the main objective of this work
is to evaluate the technical and economic potential for biojet fuel production in the
country, identifying the cost-effectiveness of different technological routes and assessing
the competitive opportunities for a Brazilian growing market of this fuel. For this purpose,
this analysis comprises distinct steps in order to develop indicators such as the feedstock
availability, the techno-economic feasibility and the environmental impact of fuel

6
production and use. Together these assessments are useful to identify areas with major
potential to implement biojet production sites in the country. In this way, the specific
objectives include:
Determine the bioenergy potential from agricultural, agro-industrial and forestry
residues in Brazil and assess its concentration throughout the country.
Perform a life cycle assessment (LCA) to evaluate the environmental performance
of biojet fuels produced in the country from selected feedstock.
Estimate capital and operational costs of biojet fuel according to different
production routes.
This dissertation is structured in 7 chapters, including the introduction. Chapter 2
presents the main aspects of aviation fuels such as their production process, chemical
composition and requirements for specification. Further, this chapter presents the current
context of aviation industry and the aspects regarding production and logistics in Brazil.
Chapter 3 describes different technological pathways for biojet fuel production. Chapter
4 presents the methodology applied and the database used. Chapter 5 reveal the work
findings and its discussion. Chapter 6 contains the final remarks, conclusions and
suggestion for future works. Finally, chapter 7 presents the references used as basis for
the dissertation.

7
2. Jet fuel
Aviation gas turbines are powered by liquid petroleum fuels, obtained by the
refining process and known as jet fuel or aviation kerosene. Petroleum refining is a
process of separating many compounds present in the crude petroleum through the
atmospheric and vacuum fractional distillation process. The crude oil is heated and its
compounds boil at different temperatures producing gases, which are later condensed into
liquids, naphtha that is the lowest boiling fraction compound, and distillate that
corresponds to the second fraction of about 33% of the crude oil input. The distillate is
further processed in the distillate hydrotreater to become kerosene and special solvents
(LIU; YAN; CHEN, 2013). In Brazil, jet fuel is entirely produced by straight run
distillation, followed by chemical treating or hydroprocessing. The chemical treating
processes, known as Merox and Bender, and the hydrotreating aim to remove sulfur
compounds, reduce acidity and stabilize the fuel (PETROBRÁS, 2014). Figure 1 shows
the production scheme of jet fuel in Brazil.
Figure 1: Jet fuel production scheme in Brazilian refineries Adapted from (PETROBRÁS, 2014)
Aviation kerosene is a multi-component fuel with a carbon chain length of C8-
C16, which has been developed from lamp oil. It is composed typically by groups of

8
paraffins, naphtenes or cyclo-paraffins and aromatics, with olefins being present in small
amounts. Approximately 70-85% of fuel is made up of paraffins, which include normal
straight chain, branched chain isoparaffins and cycloparaffins (naphtenes). The
composition of paraffinic compounds is variable according to the type of oil processed in
refineries. The aromatics, unsaturated cyclic hydrocarbons containing one or more six
carbon ring structures, are present at least by 25%. The fuel also contains trace amounts
of sulfur, nitrogen and oxygen, heteroatoms associated with hydrocarbon compounds
from the raw crude oil.
2.1 Fuel composition
As mentioned above, aviation fuels are characterized and controlled by
specifications, based more upon usage requirements than upon the detailed chemistry of
the fuels. Some performance parameters, for example, set limits on particular
hydrocarbons such as aromatics and olefins (CRC, 1983). The system requirements
include parameters such as fluidity, combustion properties, corrosion protection, fuel
stability, contaminant limits, additives, and others.
The jet fuel is formed by four types of compounds, grouped into: paraffins,
cycloparaffins or naphthenes, aromatics and olefins. The fuel components are described
in the sub-sections below.
2.1.1 Paraffins
Paraffins and cyclopraffins are the major components of jet fuel. Paraffins are
chains of carbon fully saturated with hydrogen. They may be straight-chain or branched-
chain molecules, enabling a very stable structure that do not readily reacts with materials
which they come in contact with. They have a high heat release per mass unit and cleaner
burner than other hydrocarbons due to their high hydrogen-to-carbon ratio (CRC, 1983).
Cycloparaffins are hydrocarbons with a saturated ring structure. They have higher
density than normal paraffins, but lower hydrogen-to-carbon ratio, what diminishes their
heat release per unit of mass. They are also stable and clean burning (CRC, 1983). The
main advantage is that they reduce the freeze point of the fuel, a vital parameter for high
altitude flights (SIMON; RYE; WILSON, 2011).
2.1.2 Olefins

9
Olefins are hydrocarbons similar to paraffins, but are unsaturated and so, have
lower hydrogen-to-carbon ratio. Among all classes of hydrocarbons they are the most
reactive, which make them capable of reacting with diverse materials. This feature gives
them a high instability that are not widely found in the crude oil, but may be formed in
the refinery processes. In order to reduce the formation of gums and polymers ensuring
the useful life of fuels in storage and its thermal stability, its content in the final fuel is
limited to 5% (CRC, 1983).
2.1.3 Aromatics
Aromatics are hydrocarbons formed by a six-carbon fully unsaturated ring
structure that may be coupled to form polynuclear aromatics. They have higher heat
content per unit of volume, but a lower heat content per mass unit than the paraffins. Its
content in the final fuel is limited to 20-25% by volume, due to its tendency to form
combustor coking and smoke in burning and to its contribution to high luminosity flames.
On the other side, a minimum aromatic content is required due to material compatibility,
as fuel comes in contact with large range of metals, polymers and elastomers. They also
tend to cause swelling effects ion rubbers and sealants, preventing possible leakages in
the fuel system.
2.1.4 Non hydrocarbon compounds
Sulfur and Sulfur compounds
In general, all crude oils contain sulfur compounds that can be in the form of free
sulfur, mercaptans, sulfides, disulfide and thiophenes. Free sulfur can cause corrosion of
metals in the systems, while mercaptans can deteriorate some types of synthetic rubbers.
The amount of these compounds are controlled by specification limits, while the other
sulfur compounds are constrained by the total sulfur content limits (CRC, 1983).
Gums and gum forming compounds
Gums are compounds with high molecular mass formed by hydrogen, carbon,
oxygen and generally sulfur and nitrogen. They may be produced in storage in the
presence of air and its formation can be accelerated by the exposure to sunlight, high
temperatures and concentration of sulfur compounds. They can cause filter plugging and

10
sticking of fuel valves and controls and plugging of metering orifices. Fuel specifications
limits the amounts of gums in the fuel (CRC, 1983).
Water-soluble materials
Some materials like alcohol, sodium soaps, among others, can contribute to
corrosion in the fuel system, filter clogging, poor water/fuel separation and poor
performance of filter separators. The fuel specifications have a water tolerance test in
order to control these hazards (CRC, 1983).
Naphthenic acid
Naphthenic acids are derived from the crude oil. They can cause corrosion with
aluminum and magnesium in the presence of water, rapidly reacts with zinc to form
compounds that are soluble in the fuel and form surfactants, which can cause free water
to remain in suspension. There is no direct method of limiting its amount in the
specifications, but the total acidity and the water separation index can indirectly control
this contaminant (CRC, 1983).
Additives
The additives are used to improve the properties of fuel and to avoid particular
problems, such as corrosion and formation of gums. Only officially approved additives
are permitted and its amount its controlled by specifications (CRC, 1983). Table 1
describes the additives used in jet fuel, based in CRC (1983).
Table 1: Additives used in jet fuel
Additive Function
Antioxidants Prevent the formation of gums and
peroxides. Peroxides can be found in
heavily hydrotreated fuels, which
requires the addition of antioxidants.
Metal deactivators React with soluble copper and other
metal compounds, preventing problems
with filter-blockage. Its addition of is
allowed in all fuels.

11
Icing inhibitors Prevent the formation of ice from water
coming out of solution at low
temperatures and from water condensing
in fuel tank. They can be used as a barrier
to microbiological growth.
Corrosion inhibitors Diminish the formation of rusting in
pipelines and storage tanks and improve
lubricity.
Static dissipator additives Raise the electrical conductivity of the
fuels, thus preventing the formation of
static charges.
2.2 Fuel requirements
The property requirements for jet fuel developed together with improvements on
engines and catalytic cracking process in refining. As well as most outputs of refining
process, jet fuel is a mixture of different hydrocarbons and the analytical techniques
cannot fully identify its entire individual components. For this reason, jet fuel
specifications and requirements are commonly defined in terms of required performance
(Bauen et al.,2009). The most relevant performance characteristics are described below.
2.2.1 Energy content
The energy content of the fuel have a significant impact on the aircraft
performance due to the limited volume available to store the fuel and the mass of the fuel
that can be carried. The energy content of different hydrocarbon species is different,
varying the composition of jet fuel and therefore, its energy content. For this reason, the
standards define a minimum heat of combustion (BAUEN et al., 2009).
2.2.2 Freeze point
Aircraft can operate for long periods at high altitudes, where air temperature can
be very low. As main fuel tanks in modern aircrafts are located in the wings, it is important
that the fuel remains pumpable even at very low temperatures. For this reason, the
standards define a maximum allowable freezing point (BAUEN et al., 2009).

12
2.2.3 Thermal stability
Besides being burned by aircraft engines, the fuel has the function to cool the
engine lubrication oil and other engine components. At high temperatures, some
components of the fuel can undergo chemical reactions, resulting in the formation of
gums and insoluble coke particulates, which can deposit in the system compounds,
reducing or blocking the fuel flow. It can also clog fuel injection nozzles or small cooling
holes in the turbine, increasing the maintenance frequency. To avoid this situations, the
standards define a performance test to evaluate the deposits formation in the fuel
(BAUEN et al., 2009).
2.2.4 Viscosity
Fuel viscosity affects the spray pattern coming out of the fuel nozzle and in the
size of droplets. The droplet size may cause incomplete combustion and prejudice the
engine relight at altitude, while the spray pattern can result in the sub-optimal combustion
of the fuel and create unequal temperature distributions, damaging the combustor or
turbine downstream. In order to avoid these problems, the standards define a maximum
allowable fuel viscosity (BAUEN et al., 2009).
2.2.5 Combustion characteristics
The aromatic compounds of the fuel tend to form small carbonaceous particles
that may cause harmful effects on engine performance. These particles can increase wall
temperatures at the combustor, be deposited on engine internal surfaces, erode
downstream engine component and be emitted as visible smoke. These effects can
damage the combustor, disrupt the air flow or clog cooling holes. Additionally, the
presence of sulfur results in the emission of particulates that affects air quality. To
minimize these problems, the standards define maximum allowable concentration of
aromatics in the fuel (BAUEN et al., 2009).
2.2.6 Lubricity
The fuel is responsible for lubricating moving parts in the fuel system and engine
controls like fuel pumps, fuel controls and hydraulic engine controls. The presence of
trace amounts of sulfur, oxygen, nitrogen and aromatics defines the ability of fuel to be a

13
good lubricant. As the lubricity cannot be measured based on chemical properties, the
standards define requirements that the fuel must meet (BAUEN et al., 2009).
2.2.7 Material compatibility
Jet fuel is exposed to a wide range of materials, like metals, coatings and
elastomers. Fuel components like organic acids or sulfur compounds may cause corrosion
of metals. In order to avoid this problem, the specifications limits the total acidity of fuel
and the concentrations of its compounds. A corrosion test is also specified. The presence
of aromatics in the fuel cause the swelling of aircraft elastomers. For this reason, there is
a concern in industry that the use of alternative fuels that do not contain aromatics can
lead to leaks in the fuel systems (BAUEN et al., 2009).
2.2.8 Safety properties
The most relevant fuel properties regarding safety are its flash point and electrical
conductivity. The flash point is defined as the lowest temperature at which fuel vapors if
ignition source is applied. The conductivity of jet fuel is extremely low, meaning that this
static charge dissipates slowly and can potentially build up. Enough static charge
development can result in a spark, leading to an explosion if the mixture of air and fuel
vapor above the fuel is in the flammable range. To minimize the risks of explosion in fuel
handling and tanks, the standards defines requirements of minimum flash point and
electrical conductivity (BAUEN et al., 2009). The Table 2 summarizes the fuel
requirements.
Table 2: Jet fuel requirements. Based on Bauen et al. (2009)
Requirement Reason Specification
Energy content Affects aircraft range Minimum energy density
Freeze point Impacts upon ability to
pump up fuel at low
temperature
Maximum allowable freeze
point temperature
Thermal stability Coke and gum deposits can
clog or foul fuel system and
nozzles
Maximum allowable
deposits in standardizes
heating test

14
Viscosity Impacts ability of fuel
nozzles to spray fuel and of
engine to relight at altitude
Maximum allowable
viscosity
Combustion
characteristics
Creation of particulates in
combustor and in exhaust
Maximum allowable sulfur
and aromatics content
Lubricity Impacts upon ability of fuel
to lubricate fuel system and
engine controls
Maximum allowable
amount of wear in
standardized test
Material compatibility Fuel comes in contact with
large range of metals
polymers and elastomers
Maximum acidity,
maximum mercaptan
concentration, minimum
aromatic content
Safety To avoid explosion in fuel
handling and tanks
Minimum fuel electrical
conductivity and minimum
allowable flash point
2.3 Fuel certification
There are three standards for certifying aviation fuel: ASTM D1655, International
Air Transport Association Guidance Material (Kerosene Type), and the United Kingdom
Ministry of Defense, Defence Standard (DefStan) 91-91 (WANG; TAO, 2015). ASTM
Specification D7566 (Standard Specification for Aviation Turbine Fuel Containing
Synthesized Hydrocarbons), which targets alternative jet fuels, lists the fuel properties
and criteria required to control the production and quality of a renewable fuel for aviation
safety (WANG; TAO, 2015). In Brazil, the fuel specification is established by the
National Petroleum Agency (ANP) according to PANP n.137 – 01/08/2000 (AUGUSTO;
NOGUEIRA, 2002). These specifications control the chemical composition of these fuels
and its requirements include characteristics like pour point, combustion properties,
corrosion protection, stability, contaminant and additives content, among others.
In commercial aviation there are two types of fuels used, which differ basically in
the freezing point: (i) Jet-A (used mainly in the USA) is -40°C and (ii) Jet A-1 (used
worldwide) is -47°C (ROSILLO-CALLE et al., 2012). As jet fuel supply arrangements
have become more complex, involving co-mingling of product in joint storage facilities,

15
a number of fuel suppliers developed a document known as the Aviation Fuel Quality
Requirements for Jointly Operated Systems (AFQRJOS2) for the Jet A-1 (SHELL, [s.d.]).
The AFQRJOS embodies the most stringent requirements of the British Ministry of
Defence Standard DEF STAN 91-91 and ASTM Standard Specification D1655 (JIG,
2012).
In Brazil, there are two types of aviation fuels produced and commercialized:
QAV-1, similar to Jet A-1 and QAV-5, for military use. The main difference between
them is major restrictions associated to the presence of lighter compounds to ensure safety
in product handling and storage (PETROBRÁS, 2014).
Table 2 shows the specifications for jet fuel in Brazil. The table contains the
physicochemical characteristics listed in the ANP resolution. It indicates the fuel
characteristics and lists its components, which are classified according to minimum and
maximum levels allowed. The method used for testing each component is also shown.
2 Agip, BP, ChevronTexaco, ExxonMobil, Kuwait Petroleum, Shell, Statoil and Total recognize this
checklist as the basis of their international supply of virtually all civil aviation fuels outside North America
and former Soviet Union (SHELL, [s.d.]).

16
Table 3: Jet fuel (QAV-1) specifications in Brazil
Source: Petrobrás (2014)

17
2.4 Aviation industry
The aviation industry consumes around 1.5 billion barrels of Jet A-1 fuel annually
through 1,397 airlines serving 3,864 airports. If this industry were a country, it would
rank 21st place in the world in terms of gross domestic product (GDP), generating US$664
billion per year (ATAG, 2015).
This industry highly depends on liquid fossil fuels due to lack of alternatives to
aircrafts that fly long distances. Data from U.S Energy Information Administration (EIA)
indicate a jet fuel production in 2012 of 5.4 million barrels per day in the world (EIA,
2013b). The traffic and fleet forecasts developed by the Forecasting and Economic
Analysis Support Group (FESG) of the International Civil Aviation Organization (ICAO)
Committee on Aviation Environmental Protection (CAEP) indicates an annual growth3
of 4.8% in passenger and freight traffic for the 2020-2030 period, 4.2% in 2030-2040 and
3.7% in 2040-20504 (ICAO, 2013). However, economic and political events over the last
years have affected some of the fundamentals for growth. The uncertain developments in
the global economy may dampen this demand forecast for air transport (IATA, 2015).
Air transportation was growing rapidly in Brazil, but in the recent years, the
economic downturn in the country directly affected the demand for aviation services
(ANAC, 2014). In 2012, jet fuel consumption in Brazil were 125 thousand barrels per
day, representing 2.3% of the world (EIA, 2013b). According to the Annual Air
Transport report released by the National Agency of Civil Aviation (ANAC), in 2014, 13
Brazilian companies provided air services in Brazil, 4 of them for freight transport, while
among the 84 foreign companies, 25 were for freight transportation (ANAC, 2014). In
the end of this year, Brazilian companies owned a freight of 549 airplanes, most of them
manufactured by Boeing and Airbus. In 2014, 1.1 million flights were carried out for
Brazilian and foreign companies, considering total domestic and international operations
(ANAC, 2014). Regarding economic aspects, in 2009, aviation contributed with R$32
billion to Brazilian GDP and employed about 684 thousand people. In addition, it is
estimated that there are a further 254 thousand people employed through activities
promoted by aviation (CORTEZ et al., 2014; OXFORD ECONOMICS, 2014).
3 Average annual growth rate of revenue tonne-kilometres [RTK]. 4 Estimates from the Most Likely Scenario (Central Forecast).

18
Aviation industry measures its technical progress by aircraft efficiency and
engines. The historical trends in improving efficiency levels show that modern aircrafts
are about 80% more fuel efficient than 40 years ago, due to step changes in materials and
design coupled with incremental improvements to engine design and operation. Figure 2
shows fuel efficiency gains in the industry over time. Fuel efficiency is a critical factor
for aviation given that fuel is one of the highest costs of an airline operation and that oil
prices are volatile. There is also environmental issues related to fossil fuel depletion and
GHG emissions (ATAG, 2010b), as detailed in following sections.
Figure 2: Aviation fuel efficiency gains Source: ATAG (2010)
Fuel represents the most important operational cost for airline companies. World
average fuel corresponds to about 34% of operational costs. However, in Brazil, it comes
to represent around 40% of operational costs (CORTEZ et al., 2014). It occurs because
the fuel pricing used in Brazil is linked to the cost of importing jet fuel from the US Gulf
Coast. Thais is, the fuel pricing is set up as if 100 percent of the fuel were imported,
adding artificial expenses to the cost of fuel. However, 75% of the fuel that is supplied to
Brazilian airlines is produced domestically (CEDERHOLM, 2014; PEARSON, 2014).
As mentioned above, besides the high share of fuel costs, the uncertainty in oil prices
promotes difficulties for companies to plan and manage. Figure 3 shows the benchmark

19
crude oil and aviation kerosene prices in the past years according to U.S Energy
Information Administration data (EIA, 2016a, 2016b).
Figure 3: Aviation kerosene and oil prices
Nowadays the aviation sector contribution to global anthropogenic GHG
emissions is minor, when compared to other transport modals. Worldwide, flights
produced 770 Mt of CO2 in 2015, equivalent to 2% of humans emissions (ATAG, 2016).
Despite the minor impact, the perspectives indicate a growth in the sector in the next
years, which will lead to increased emissions (ROSILLO-CALLE et al., 2012). For this
reason, the aviation industry (IATA) announced in 2009 its commitment to mitigate
aviation GHG emissions by adopting the following goals: fuel efficiency improvements
of 1.5% per year from 2009 to 2020, achieve carbon neutral growth in 2020, reducing net
CO2 emissions in 50% by 2050 compared to 2005 levels. In order to reach these goals,
the aviation industry established a four-pillar strategy, based on:
Investments in technology, like more efficient airframe, engines and equipment,
sustainable biofuels and new energy sources;
Efficient operations;
Effective infrastructure by improving air routes, air traffic management and
airport procedures;
Economic measures, like carbon offsets and global emissions trading.
Short-term options to reduce air travel emissions are limited. Modern aircraft are
already highly fuel-efficient and so, technological improvements tend to be incremental.
0
0.1
0.2
0.3
0.4
0.5
0.6
0.7
0.8
0.9
1990 1992 1994 1996 1998 2000 2002 2004 2006 2008 2010 2012 2014
US$
/L
U.S. GulfCoastKerosene-Type Jet FuelSpot PriceFOB (Dollarsper L)
Europe BrentSpot PriceFOB (Dollarsper L)
20
Further, since commercial aircraft have a lifetime of around 25 years, the diffusion of
improvements across global fleet tends to be slow (LEE; LIM; OWEN, 2013;
MAWHOOD et al., 2015). Notwithstanding, advances in air traffic management and
engine efficiency have the potential to reduce emissions, this is not sufficient to offset
increases in demand and the aviation industry growth. Therefore, the majority of
emissions reductions will have to come from alternative sustainable biofuels.
2.5 Brazilian aviation kerosene production and logistics
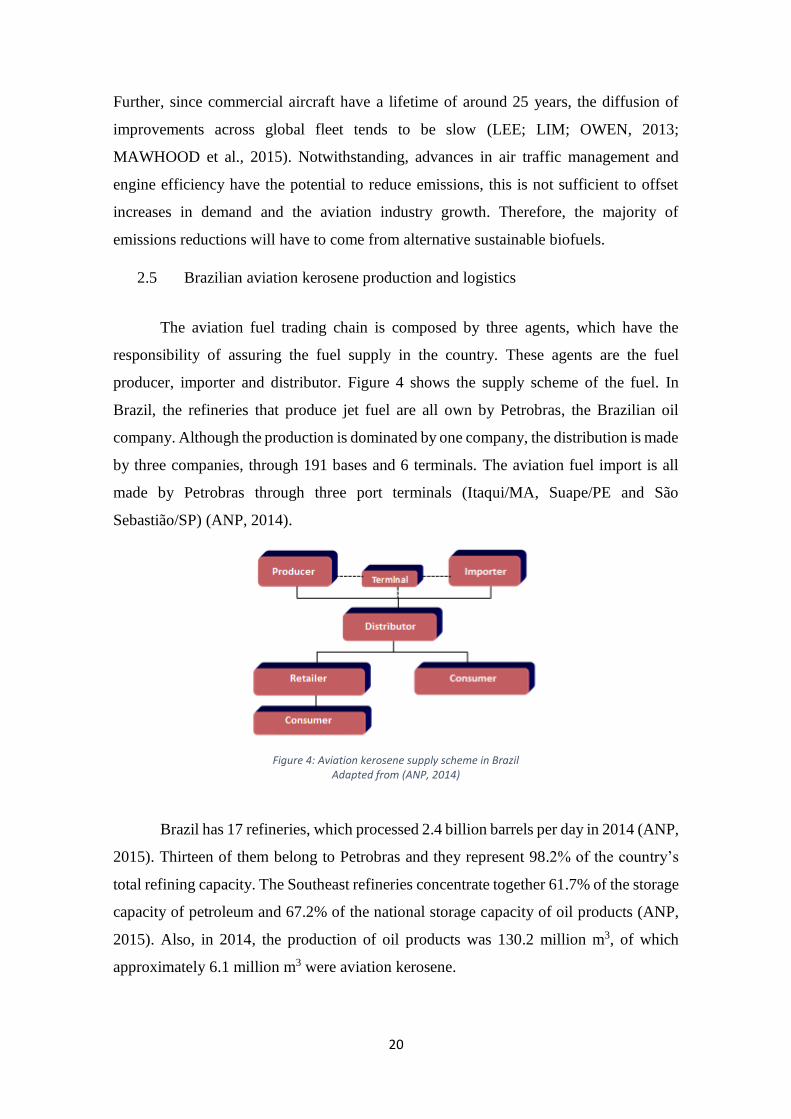
The aviation fuel trading chain is composed by three agents, which have the
responsibility of assuring the fuel supply in the country. These agents are the fuel
producer, importer and distributor. Figure 4 shows the supply scheme of the fuel. In
Brazil, the refineries that produce jet fuel are all own by Petrobras, the Brazilian oil
company. Although the production is dominated by one company, the distribution is made
by three companies, through 191 bases and 6 terminals. The aviation fuel import is all
made by Petrobras through three port terminals (Itaqui/MA, Suape/PE and São
Sebastião/SP) (ANP, 2014).
Figure 4: Aviation kerosene supply scheme in Brazil Adapted from (ANP, 2014)
Brazil has 17 refineries, which processed 2.4 billion barrels per day in 2014 (ANP,
2015). Thirteen of them belong to Petrobras and they represent 98.2% of the country’s
total refining capacity. The Southeast refineries concentrate together 61.7% of the storage
capacity of petroleum and 67.2% of the national storage capacity of oil products (ANP,
2015). Also, in 2014, the production of oil products was 130.2 million m3, of which
approximately 6.1 million m3 were aviation kerosene.

21
Actually, from the 17 refineries in the country, 9 produce aviation kerosene:
REDUC (RJ), REFAP (RS), REGAP (MG), REMAM (AM), REPAR (PR), REPLAN
(SP), REVAP (SP), RLAM (BA), RPCC (RN). All of them belong to Petrobras. REVAP
(SP) was the main producer in 2014, with 33.5% of the total aviation kerosene produced
in the country (ANP, 2015). Figure 5 presents the location of refineries that produce
aviation kerosene in Brazil and Table 4 shows the kerosene production of each refinery
in 2014.
Figure 5: Refineries producing aviation kerosene

22
Table 4: Aviation kerosene production of each refinery
Aviation kerosene production in 2014 (m3)
REDUC (RJ) 1,324,235
REFAP (RS) 240,199
REGAP (MG) 773,814
REMAN (AM) 174,251
REPAR (PR) 325,485
REPLAN (SP) 809,688
REVAP (SP) 2,034,941
RLAM (BA) 283,731
RPCC (RN) 112,770
Total 5,977,621
Source: (ANP, 2015)
The sales of jet fuel in 2014 totaled 7.5 million m3. The consumption of this fuel
showed the following distribution among the country regions (Figure 6): North, 397
thousand m3 (5.3% of total); Northeast, 1.1 million m3 (14.4% of total); Southeast, 4.7
million m3 (62.7% of total); South, 552.1 thousand m3 (7.4% of total), Midwest 758.7
thousand m3 (10.2% of total). The concentration of consumption in the southeast region
occurs due to the presence of the main airports of the country, and also because this region
is the principal origin and destiny of international flights. The state of São Paulo registered
the highest consumption of aviation kerosene (40.6% of total), followed by Rio de Janeiro
(17.0% of total) and the Federal District (7.3% of total) (ANP, 2015).

23
Figure 6: Jet fuel consumption per region in Brazil
As seen above, jet fuel consumption in Brazil is higher than its production,
resulting in an annual deficit of 1.4 million m3. For this reason, importation is necessary
to meet the fuel demand. In 2014, the total aviation kerosene imported was 1.5 million
m3, mostly from Kuwait (72.6%). The total amount of fuel exported was 20 thousand m3
(ANP, 2015).
Although Petrobras is responsible for all jet fuel production, its distribution to the
consumer market is made by three companies: BR (Petrobras Distributor), Shell (Raízen
fuels) and Air BP Brazil. The fuel supply to the distributors can be accomplished in two
ways, according to the structure of the airports. The first is related to airports that have an
aircraft supply unit (UAA/PAA) connected directly with refineries through pipelines.
This is the case of Garulhos airport in São Paulo and Galeão airport in Rio de Janeiro,
connected with the REVAP and REDUC refineries, respectively. The second corresponds
to the airports with no connections with refineries through pipelines. In this case, the
distributor company receives the fuel from refineries in their bases through pipelines or
cabotage. Then, after delivered in the bases, the fuel is transported by trucks to the
distributors bases in the airports and then delivered to fuel the airplanes (PALAURO,
2015).
2.5.1 Jet fuel logistics in Brazilian regions
Among the five Brazilian regions, only Midwest, which do not have an oil
refinery, is completely dependent of jet fuel supply from other regions. North region’s jet
fuel demand is met by one refinery production and cabotage supply from other regions.
5%
15%
63%
10%
7%
NORTH
NORTHEAST
SOUTHEAST
MIDWEST
SOUTH

24
Pipelines, inland waterway and road transport are the modals used to distribute the fuel.
In Northeast region, the demand is attained by two refineries production, cabotage supply
and import. There, the fuel is distributed by road transport and cabotage. Southeast region
is the major jet fuel producer in the country and its demand is met by four refineries
production, cabotage supply and import. Southeast is also responsible for supplying all
Midwest jet fuel demand by road transport. Within the southeast region, pipelines and
road transport distribute the fuel. In the South, the demand is attained by two refineries
production and the fuel is distributed by road transport.
The aviation kerosene supply in the North region comes from REMAN
production, responsible for meeting 40% of regional demand and is complemented by
cabotage to REMAN and Miramar port in Belém (PA). In Amazonas state (AM), the fuel
distribution starts with pipeline transfer from REMAN to two primary bases in Manaus
(AM), from which the fuel is transferred by inland waterway transport to 8 PAAs (two of
them in the states of Roraima (RO) and Pará (PA)), by road transport to one PAA (in
Roraima state) and to the Manaus airport (ANP, 2014). In Pará state (PA), the fuel
received by cabotage by the two primary bases of Belém (PA) is transferred by road
transport to Belém airport and to 8 PAAs, three of them in the states of Maranhão (MA),
Amapá (AP) and Tocantis (TO) that belongs to the Northeast region. In Rondônia state
(RO), the fuel that comes from Manaus (AM) is transferred from the base of Porto Velho
(RO) by road transport to the city airport and to 3 PAAs. Figure 7 shows the logistics in
the North region.
Figure 7: Aviation kerosene logistics in the North region Source: ANP (2014)
BelémManaus
Legenda:
Refinaria
Transbordo
Base primária
Duto
REMAN
Modo aquaviário
Modo rodoviário

25
In the Northeast region, the production of aviation kerosene is made by two
refineries, and as it is insufficient to attain the demand, cabotage and import represent
62% of fuel supply. Suape (PE) and Itaqui (MA) ports are mostly for import, while the
Mucuripe (CE) port is mostly a cabotage point. In the Bahia state (BA), the Madre de
Deus terminal is a cabotage point, whose volume is added to the RLAM production. The
fuel is supplied by road transport by the producer and importer. In the state of Maranhão
(MA), the importation in Itaqui port is received by the primary base of São Luís (MA),
transferred to São Luís airport and to PAA of Teresina (in the state of Piauí), from which
is also transported to another PAA in Piauí. In Ceará state (CE), the cabotage in the
Mucuripe port is drained from the Fortaleza’s primary bases to Fortaleza airport and to 1
PAA. In the Rio Grande do Norte state (RN), the RPCC production is transferred from
the primary base of Guamaré (RN) to the airports of Natal (RN) and João Pessoa (PB). In
the Pernambuco state (PE), jet fuel imported in Suape port is transferred from the primary
base of Ipojuca to the airports of Recife (PE), Maceió (AL), João Pessoa (PB) and to two
airclubs. In Bahia state (BA), the cabotage and RLAM production are transferred from
the two primary bases of São Francisco do Conde to 4 PAA, to Aracajú (SE) and Salvador
(BA) airports, and from this to two PAAs. Figure 8 illustrates the logistics in Northeast
region.
Figure 8: Aviation kerosene logistics in the Northeast region Source: ANP (2014)
Figure 9 shows the fuel logistics in the Southeast region. The two largest Brazilian
airports, Guarulhos and Galeão, are connected through pipelines to refineries, as earlier
stated. The third, fifth sixth and seventh busiest airports of the country are also located at
RLAM
RPCCGuamaré
São Francisco do Conde
Itaqui
São Luis
Fortaleza
IpojucaLegenda:
Refinaria
Transbordo
Base primária
Duto
Terminal
Madre de Deus
Modo rodoviário

26
southeast region. Furthermore, the Brasília airport, the fourth largest airport, located in
the Federal District, is fed by the southeast production. In view of the characteristics,
dependency and the connection of these fluxes, the analysis of jet fuel logistics in the
Southeast and Midwest regions cannot be separated (ANP, 2014).
In 2014, the aviation kerosene production in REGAP (MG) and REDUC (RJ) was
27% bigger than the demand of the states of Minas Gerais (MG) , Rio de Janeiro (RJ) and
Espírito Santo (ES) (ANP, 2015). Besides that, REGAP delivers about half of its
production to the Federal District (ANP, 2014). In the state of Minas Gerais, the fuel
distribution chain begins in the primary base of Betim, which expands REGAP
production by truck transport to the airports of Confins (MG) and Pampulha (MG), to 5
PAAs and to Brasília airport in the Federal District. In the state of Rio de Janeiro, REDUC
production is sent to the primary base of Galeão airport (RJ) through pipelines.
Thenceforth, the fuel is transferred by road transport to Santos Dumont Airport (RJ), to 8
PAAs, one of them in the state of Minas Gerais, and to Vitória airport, in the state of
Espirito Santo (ES) (ANP, 2014).
In São Paulo state, the fuel demand is supplied by the production of 2 refineries:
REPLAN and REVAP. The São Sebastião Port is responsible for the greatest volume of
import received in the country, allowing São Paulo to attend its demand, to make transfers
to Midwest region and, with the exceeding, to perform cabotage operations to another
regions (ANP, 2014). São Paulo has a pipeline network that connects refineries to
terminals and basis; however, the transfer to Midwest region is realized by truck transport.
The REVAP production is sent to the primary base in Guarulhos airport (SP) through
pipelines and from this airport, the fuel is transferred by road transport to airports and
PAAs in 12 locations. The production of REPLAN starts from Paulínia primary base to
airports and PAAs of 32 localities in São Paulo state and in the states of Midwest region
(ANP, 2014).

27
Figure 9: Aviation kerosene logistics in Southeast and Midwest regions Source: ANP (2014)
In the South region, jet fuel is transferred from the refineries (producers) by road
transport. Figure 10 shows the aviation kerosene logistics in the South region. In Paraná
state (PR), the production of REPAR is transferred from the primary base of Araucária
(PR), to the airports of São José dos Pinhais and Curitiba (PR), to 6 PAAs, 2 of them in
Santa Catarina state, and to Florianópolis airport (SC). In the state of Rio Grande do Sul,
the production of REFAP is transferred from the primary bases of Canoas (RS) and Esteio
(RS) to the airport of Porto Alegre (RS), to 6 PAAs, one of them in Santa Catarina state,
and to Florianópolis airport (SC). From this airport, the fuel is also transferred to another
PAA (ANP, 2014).
Figure 10: Aviation kerosene logistics in South region Source: ANP (2014)
Betim
Galeão
Paulínia
Guarulhos
REVAP
São Sebastião
Guararema
Legenda:
Refinaria
Transbordo
Base primária
Duto
Terminal
Transbordo
Legenda:
Refinaria
Base primária
Duto
Terminal
Paranaguá
(Cattalini)
REPAR
REFAPCanoas
Esteio
Araucária
Modo rodoviário

28
Then, it is noteworthy the relevance of Northeast and Southeast regions, whose
terminals receive jet fuel imported in the country. The imported jet fuel is responsible for
the marginal supply in the country. The southeast region is also responsible for supplying
jet fuel to Midwest by truck transport. It is also important to emphasize the relevance of
truck transport in the country, as the majority of the jet fuel distribution is made by road.

29
3. Biojet fuel
Sustainable biomass-derived fuels for aviation can offer a solution to
environmental problems related to the fossil fuel depletion and to the vulnerability of the
sector towards the oil price volatility. In this way, biofuels for aviation represent an
attractive option due to the opportunity to reduce GHG emissions, the necessity to reduce
fossil fuel dependence and the availability of renewable sources. The aviation industry
aims to develop sustainable “drop-in” biofuels, which means, biofuels that use the same
supply infrastructure and that do not require changes in aircraft engines (CORTEZ et al.,
2014). In the case of aviation industry, the “drop-in” concept is relevant due to the
globalization of demand, stricter conditions of use and safety standards.
Nowadays, different technological pathways convert biomass into alternative
fuels to replace jet fuel. Diverse technological processes can be used and the technology
chosen highly depends on the type of biomass. Conversion routes include processes like
hydrotreatment, Fischer-Tropsch (F-T) synthesis, pyrolysis, liquefaction, enzymatic
hydrolysis, fermentation, among others.
3.1 Biojet fuel production routes
The most common routes to produce biojet are hydroprocessing of vegetable oils
and biomass gasification followed by Fischer-Tropsch synthesis. Up until now, biojet fuel
from hydro-processing technologies using vegetable and waste oils are approved by
ASTM International and ready for large scale development. Biojet fuels from Fischer-
Tropsch (F-T) synthesis, known as synthetic paraffinic kerosene (FT-SPK), and from
fermentation route known as synthetizes iso-paraffins (SIP), are also certified by ASTM
and approved for blends up to 50% as 10% (molar basis), respectively, with the
conventional jet fuel (MAWHOOD et al., 2014). Other routes have been developed at
commercial scale and testes in pilot flight, but are yet to be certified by ASTM, as in the
case of conversion of alcohols to jet fuel. Also, jet fuel produced from sugars through
fermentation and catalytic conversion have been developed in joint ventures by biofuel
and oil companies. Additionally, the conversion through pyrolysis process have not yet
been approved by ASTM but it is been developed by several companies and research
institutes (WANG; TAO, 2015).

30
To evaluate the biojet fuel development options, it is important to have an
understanding of all the conversion pathways. In the present study, the pathways were
classified into four groups according to the type of feedstock and based on Wang and Tao
(2015). The following subsections describe the conversion processes of each group,
appointed by: (1) alcohol-to-jet (ATJ), (2) oil-to-jet (OTJ), (3) gas-to-jet (GTJ) and (4)
sugar-to-jet (STJ).
3.1.1 Alcohol to Jet
The Alcohol to Jet (ATJ) pathway is a conversion pathway that produces jet fuel
from biomass via an alcohol intermediate (MAWHOOD et al., 2014), such as methanol,
ethanol, butanol and long-chain fatty alcohols. The process is also named alcohol
oligomerization (WANG; TAO, 2015). ATJ developers are looking forward to develop
drop-in fuels, which include synthetic paraffinic kerosene (ATJ-SPK) and synthetic
paraffinic kerosene with aromatics (ATJ-SKA).
This process does not involve the use of microorganisms or special enzymes for
fermentation, since it begins with alcohol that has already been produced through
fermentation. The conversion process is basically made of four steps: dehydration,
oligomerization, distillation and hydrogenation (HARI; YAAKOB; BINITHA, 2015). All
steps necessary to convert alcohol to jet fuel are based on processes that are currently
used at commercial scale in the petrochemical industry, reducing scale up risks. It is a
catalytic process that is capital efficient and scalable, and the process does not require
external hydrogen and hydroprocessing (ICAO, 2011). Furthermore, the pathway is
considered very economical since the feedstocks are not much expensive5 and the process
does not require large amounts of energy (HARI; YAAKOB; BINITHA, 2015). Figure
11 shows the main steps of ATJ process.
Figure 11: Main steps in the alcohol-to-jet process. Based in (GUELL et al., 2012)
5 Although Hari et al (2015) indicated that the feedstocks are low cost, this is not certain, since alcohols
have other uses either as energy sources or as inputs for chemical reactions. This means that they have an
opportunity cost.
Alcohol Dehydration Olefins Oligomerization Distillation Hydrogenation Jet

31
Using ethanol as feedstock, the dehydration step produces ethylene, which follows
to the catalytic oligomerization step producing linear α-olefins. This process delivers a
wide range of hydrocarbons. The olefins are distillated producing diesel- and jet- range
fuels and light olefins. Light olefins (C4-C8) are recycled back to the oligomerization
step and jet fuel range products (C9-C16) are submitted to hydrogenation producing
alkanes, which are appropriated for renewable jet fuel (WANG; TAO, 2015).
Starting with n-butanol, the dehydration step produces 1-butene and the residual
2-butene formed is isomerizes to 1-butene. Next, the oligomerization step produces
olefins in C8-C32 range, which follows to the hydrogenation process. The resulting
paraffins in C12-C18 range can be blended to jet fuel. Alternatively, n-butanol can be
dehydrogenated in a catalytical process, producing ketones in C5-C11 range. These
ketones can be deoxygenated, producing paraffins similar to jet, gasoline and diesel
components (WANG; TAO, 2015).
Beginning with iso-butanol, the dehydration process produces a mixture of
isobutene, 1-butene and 2-butene, which are converted to olefins through oligomerization
process. To increase diesel and jet fuel yields, the C8 olefins can be distilled and sent to
one additional dimerization process. Alternatively, the C8 olefins can be either converted
into C6H32 through dimerization or reacted with butenes to produce C12 olefins,
increasing C12 and C16 and the jet-range products (WANG; TAO, 2015).
Although there are a wide variety of alcohols that can be used as a feedstock for
the production of biojet fuels, ethanol and isobutanol are the most suitable ones. They can
be produced from a wide variety of biomass feedstocks and technological pathways, such
as fermentation and enzymatic hydrolysis. Figure 12 shows the entire chain for ATJ
pathway.

32
Figure 12: Biomass feedstocks and technological pathway for the ATJ route. Based on (GUELL et al., 2012)
The feedstock can be divided in three groups: sugars, starches and lignocellulosic
biomass. Sugars obtained from plants like sugarcane, for example, can be converted into
alcohols through a fermentation process using yeasts or other microorganisms. On the
other hand, starches from corn, cassava, and potatoes, for exemple, have to be hydrolyzed
before the fermentation process to produce fermentable sugars. The lignocellulosic
biomass, such as wood, agricultural and forestry residues, have to be subjected to more
severe hydrolysis before the fermentations. It is necessary because the sugars are stored
in cellulose and hemicellulose structures, which are more resistant than starches (GUELL
et al., 2012).
The conversion of alcohols into jet-fuel, as main product, also produces significant
amounts of diesel. Other by-products are obtained in the alcohol production. The
unfermented residues left by the fermentation of sugars and starches can be converted
into a product that may be sold as animal feed or converted into power or other bio-
materials (GUELL et al., 2012). Furthermore, the fermentation process releases biogenic
CO2 that can be captured and sold to other industries. Also, the residual cellulose and the
non-fermentable lignin left by the conversion of lignocelullosic biomass in alcohols can
be used for power generation or steam (GUELL et al., 2012). These residues can also be
used to produce fuels by thermochemical processes, and the suitable pathways will be
described in this study.

33
The Table 5 provides a summary of strengths and challenges related to the ATJ
pathway.
Table 5: ATJ strengths and challenges.
Strengths Challenges
All steps necessary to convert alcohol to
jet-fuel are based on processes currently
used at commercial scale in
petrochemical industry
Brazil has a long tradition in producing
ethanol from sugarcane, which is
currently used as automotive fuel,
making ethanol a high cost feedstock Large feedstock flexibility: sugars,
starches and forestry and agricultural
residues (lignocelullosic biomass)
ATJ-SPK contains aromatics and thus it
does not require blends with the
conventional jet fuel There is limited experience with alcohols
other than methanol/ethanol and with
optimizing the process for the production
of jet fuel
The process requires small amounts of
external hydrogen
The fermentation of biomass to alcohols
are high selective reaction, leading to
high conversion of desired products
Adapted from (GUELL et al., 2012)
3.1.2 Oil to Jet
Bio-oils can be converted to biojet fuels through three pathways: hydroprocessing,
known as hydrotreated renewable jet (HRJ) or Hydrotreated Esters and Fatty Acids
(HEFA); Catalytical hydrothermolysis and Fast pyrolysis, known as Hydrotreated
Depolymerized Cellulosic Jet (HDCJ). HEFA and CH processes use triglyceride-based
feedstocks, but the free fatty acids (FFAs) are produced differently by propane cleavage
of glycerides and by thermal hydrolysis, respectively. The bio-oil used in HDCJ pathway
is obtained by pyrolysis of biomass feedstock. Up until now, only HEFA pathway have
been approved for blending and have a defined specification by ASTM (WANG; TAO,
2015).

34
3.1.2.1 Hydroprocessed Esters and Fatty Acids Synthetic Paraffinic Kerosene
The Hydroprocessed Esters and Fatty Acids Synthetic Paraffinic Kerosene
(HEFA-SPK) was certified as jet fuel in July 2011 by ASTM for blends up 50% with
conventional jet fuel, as earlier mentioned. The hydroprocessing is a common process in
conventional oil refineries to remove oxygen and undesirable components like nitrogen
and sulfur. The process involves the deoxygenation, desulfurization and denitrogenation
of oils through catalytic hydrogenation, producing hydrogen-saturated straight-chain
paraffin-rich hydrocarbon liquids. The complete deoxygenation ensures a production of
a renewable jet fuel similar to the conventional one, with good storage stability and
maximum specific energy. In order to meet jet fuel specifications, the fuel should have
good cold flow properties and high flash point. Therefore, hydroisomerization and
cracking reactions are needed to shorten down the hydrocarbon chains and to obtain
highly branched molecules (GUELL et al., 2012). The isomerization process transforms
the straight-chain hydrocarbons into branched structures, reducing the freeze-point to
meet the jet fuel specifications. The hydrocracking reactions results in the production of
lighter liquids and gas products (WANG; TAO, 2015). The product is a synthetic
paraffinic kerosene (SPK) with carbon chain in the range of C9-C15 (PEARLSON). The
hydrotreating process produces around 50-70% jet fuel and the remaining products are
mainly diesel, with fractions of propane, naphtha and LPG (GUELL et al., 2012). It is
noteworthy that naphtha can be submitted to a catalytic reforming process producing,
among other products, aromatics and hydrogen. Aromatics are suitable to compose a
complete biojet blend, while hydrogen is necessary for hydrotreating processes.
The feedstock required for the process are natural oils and fats rich in triglycerides
and free fatty acids. Bio-oils are produced from oil crops and microalgae, which involves
cultivation, drying and extraction steps or can be ready-available, as in the case of used
cooking oils or tallow. A large number of oil crops can be used. First generation feedstock
includes oil crops already used for food or animal feed, such as soybeans, palm oil,
rapeseed, among others. The utilization of non-food crops, like jatropha, camelina and
halophytes, which can be grown on marginal land, may reduce impacts related to fuel
competition with food chains and land use change. Microalgae used as feedstock has
advantages over common oil crops of, including higher oil content, CO2 recycling due to
their CO2 uptake from the atmosphere and minimal impacts on biodiversity and land use
change (GUELL et al., 2012). Residual oils have the advantages of low costs, however

35
their impurities and heterogeneity difficult pre-treatment stage and their disperse
localization increases collecting costs. Overall, dedicated feedstock are generally
expensive related to fossil materials, but their costs can be shared with other co-products.
Figure 13 shows the HEFA-SPK production from biomass feedstocks.
Figure 13: Biomass feedstocks and technological pathway for the HEFA pathway. Based on (GUELL et al., 2012) and (WANG; TAO, 2015)
The hydrotreatment process for biojet production has co-products like, renewable
diesel, propane, naphtha and LPG and a wide range of by-products such as pesticides,
bio-plastics, animal feed, among others, that improve the market economics (GUELL et
al., 2012).
The conversion of vegetable oils in hydrocarbons is already a commercial process.
However, the high cost of feedstock compared to fossil materials, may be a barrier to its
development in large scales. The integration of the plant with conventional oil refineries
could reduce the hydrogenation costs (CORTEZ et al., 2014). The Table 6 provides a
summary of strengths and challenges related to the ATJ pathway.
Table 6: HEFA strengths and challenges.
Strengths Challenges
Wide range of feedstock can be
processed High feedstock prices

36
Life cycle emissions significantly lower
than fossil fuels Feedstock availability (Competition with
biodiesel producers for the same
feedstock)
Very pure and high quality product with
a chemical composition similar to
conventional jet fuel
Possibility of using used cooking oils or
tallow as feedstock, diminishing its costs External hydrogen required in large
amounts
Investment costs considered to be low
Based on (GUELL et al., 2012) and (CORTEZ et al., 2014)
3.1.2.2 Catalytical hydrothermolysis
The Catalytical Hydrothermolysis (CH) process is a pathway developed and patented by
Applied Research Associates, Inc. (ARA) to produce renewable aromatic drop-in fuels,
called ReadiJet and ReadiDiesel. The CH process converts oils directly into high-density
aromatic, cycloparaffin or isoparaffin hydrocarbons, which are ideal for drop-in jet and
diesel fuels (READIFUELS, 2013). The process comprises reactions like cracking,
hydrolysis, decarboxylation, isomerization and cyclization, which are responsible to
convert triglycerides into a mixture of straight chain, branched and cyclic hydrocarbons.
The products of CH are sent to decarboxylation and hydrotreating processes in order to
remove oxygen and saturate the molecules. These two processes form hydrocarbons in
C6-C28 range like n-alkanes, iso-alkanes, cyclo-alkanes, and aromatics, which after a
fractionation step produce naphtha, jet fuel and diesel. The renewable jet fuel produced
meets the ASTM and military specifications and has excellent combustion quality, cold
flow properties and stability (WANG; TAO, 2015).
The entire process is also called biofuels isoconversion (BIC), developed by ARA and
Chevron Lummus Global (CLG) based on the CH process patented by ARA and CLG’s
market-leading hydroprocessing technologies. The advantages of the process are: the
compatibility with a wide range of oils, waste oils and fats and greases, requiring no
pretreatment other than filtering; the production of 100% drop-in fuels and very short
resident times, which means a small footprint and low capital cost (ARA, 2016). Figure
14 shows the steps of the process.

37
Figure 14: Biofuel isoconversion process through catalytic hydrothermolysis
3.1.2.3 Hydrotreated depolymeryzed celullosic jet
The Hydrotreated depolymeryzed celullosic jet (HDCJ) is a process that involves
fast pyrolysis of oils followed by an upgrade to produce a mixture of liquid fuels
compatible with conventional fuel infrastructure and engine technologies. Depending on
the process used, the products may be classified as SPK. However, given the high
aromatic content, the fuel is limited by ASTM jet fuel specifications.
The fast pyrolysis is performed under moderate temperatures (~500°C) and short
residence times in the reactor to maximize the oil yield. The process involves rapid
decomposition of biomass under specific thermal conditions in the absence of oxygen
(ELGOWAINY et al., 2012). As a result, biomass decomposes to generate mostly gases,
vapors, and char. After cooling and condensation, a liquid with a heating value that is
approximately half of that characterizing petroleum-derived oil, known as pyrolysis oil is
formed (GUELL et al., 2012). The oil obtained is unstable due to high oxygen and water
content and has high acidity. Thus, an upgrading step is needed. Pyrolysis oil is stabilized
by oxygen and water removal and acidity reduction through hydrotreating process. It
should be noted that the upgrading step can be performed in a dedicated plant or co-fed
in oil refineries (ELGOWAINY et al., 2012; GUELL et al., 2012). Further,
hydroprocessig (hydrocraking) is needed to produce fuels in the desired range. Additional
hydrogen is also needed for the hydrocraking process and may come from an external
source or internal source (ELGOWAINY et al., 2012). The co-feeding of pyrolysis oil in
oil refineries for upgrading may be an feasible option for renewable jet fuel production to
reduce costs, due to the significant amounts of hydrogen , an expensive input, that would
be required (GUELL et al., 2012). Finally, the liquid products follows to separation step.
Figure 15 shows the main steps related to HDCJ production.
Oils, fats and greases
Catalytic Hydrothermolysis
Hydrotreating Fractionation Jet

38
Figure 15: Main steps in the HDCJ process. Based on (ELGOWAINY et al., 2012; GUELL et al., 2012)
Feedstock for the fast pyrolysis process are lignocelullosic biomass as sugarcane
bagasse, corn stover, agricultural and forest residues. The process does not requires any
biomass pretreatment (WANG; TAO, 2015).
The pyrolysis and subsequent upgrading processes can be self-sufficient with
regard to heat and electricity requirements. The pyrolysis produces other combustible co-
products, such as fuel gas, which is a mixture of carbon monoxide and methane and bio-
char that can be used in a combined heat and power unit. These co-products may satisfy
the heat and power requirements of biomass drying and grinding steps and bio-oil
upgrading processes (ELGOWAINY et al., 2012).
Several companies are working on the development of the pyrolysis technology,
which is at the pilot and/or commercial scale (GUELL et al., 2012; IRIBARREN;
PETERS; DUFOUR, 2012). UOP and Ensyn launched a joint venture named Envergent
Technologies, which offers a practical and commercially proven path to renewable
energy. The process is called RTPTM Technology (ENVERGENTTECH, 2016).
Dynamotive, announced in 2009, the production of renewable diesel and gasoline
through a secondary upgrading step of pyrolysis oil, and that early testing of bench scale
products indicates a fraction of around 30% of jet fuel in the products (GUELL et al.,
2012).
3.1.3 Gas to jet
Gas can be coverted to biojet fuels through two pathways: Fischer-Tropsch
synthesis, known as FT-BTL (Fischer-Tropsch Biomass-to-liquids) and gas fermentation.
3.1.3.1 FT-BTL
BiomassFast pyrolysis
reactorPyrolysis oil
recovery
Bio-oil upgrading
(Hydroprocess)Jet
39
The process known as FT-BTL produces fuels through biomass gasification
followed by Fischer-Tropsch synthesis. The aviation biofuel produced, named FT-SPK
(Fischer-Tropsch Synthetic Paraffinic Kerosene) was approved for certification by
ASTM in 2009 for blend up to 50% due to its paraffin content (GUELL et al., 2012).
The process begins with biomass pre-treatment, which aims to elevate its density
by reducing particle size and humidity. It is suitable to facilitate feedstock logistics and
to ensure a reliable and continuous feeding, due to the heterogeneous nature of biomass.
Torrefaction and pyrolysis processes are the main technologies used for biomass pre-
treatment. Torrefaction converts biomass into a solid higher quality fuel through its
submission to moderate conditions (200-300°C) in an inert atmosphere for short residence
times. This process allows the destruction of biomass fibrous structure and increases its
energy content. The fast pyrolysis thermally decomposes biomass in the absence of
oxygen, moderate temperatures (~500°C) and very short residence times. The liquid
produced has high energy density, known as pyrolysis oil. Other products include coal
and fuel gases, that can be used for heating purposes (GUELL et al., 2012). The pre-
treated biomass follows to the gasification step that occurs under high pressure and
temperature with a controlled volume of oxygen. It produces the syngas, formed by a
mixture of carbon monoxide (CO) and hydrogen (H2). Up until now, many types of
gasifiers have been developed. Fluidized bed and entrained flow gasifiers are considered
the most suitable technologies for biofuel production, however, another technologies as
plasma gasification and hydrothermal gasification are gaining interest (GUELL et al.,
2012).
The syngas should be conditioned to remove CO2 and impurities (MAWHOOD
et al., 2014). After conditioning and the adjustment of H2:CO ratio, the gas follows to
Fischer-Tropsch process that produces liquid hydrocarbons through a series of catalytic
reactions (WANG; TAO, 2015). In the process, the syngas reacts in the presence of a
metal catalyst (commonly iron, cobalt or nickel) (MAWHOOD et al., 2014). The resulting
products are a mixture of saturated hydrocarbons, totally free of sulfur, nickel, nitrogen,
vanadium, asphaltenes and aromatics, typically found in mineral oils (TIJMENSEN et
al., 2002). Conventional refinery processes such as hydrocraking, hydroisomerization and
fractioning can be applied to adjust products in high quality fuels, with low sulfur and
aromatics content (WANG; TAO, 2015). As described in the HEFA route, the
hydrocracking/isomerization process is used to produce hydrocarbons with shorter chains

40
that, after submitted to a separation step, produce jet fuels, diesel and lubricants. Figure
16 shows the main steps in the FT-SPK production.
Figure 16: Main steps in the FT-SPK process. Based on (GUELL et al., 2012)
Feedstock for FT-BTL pathway include lignocellulosic biomass such as woody
energy crops, agricultural, agro-industrial and forestry residues, and waste. However, the
feedstock characteristics affects the quality of syngas produced, the efficiency and the
type of gasifier used. A significant amount of the forest products have a well-established
market so the production of fuels should come from low value materials such as forest
residues, that do not have any market presently (GUELL et al., 2012). For the same reason
agricultural residues should also receive attention.
The main co-products obtained in the FT-SPK process are diesel and naphtha. As
mentioned before, naphtha can be submitted to a catalytic reforming process to produce
aromatics and hydrogen, forming a 100% biojet fuel blend and supplying feedstock to
hydrotreating processes. In addition, gasification and FT synthesis produce heat,
electricity and chemicals such as hydrogen and methanol. Potential chemical include
naphtha, paraffins and lubricants. The co-products may increase the overall process
efficiency. The system configurations determine the co-products obtained influencing the
production costs of FT-SPK (GUELL et al., 2012).
The FT synthesis is currently applied at a commercial sale for the production of
fuel from fossil resources, like coal and natural gas. Companies such as Sasol, Shell and
Total are involved in FT fuels projects. As regards to FT-BTL, the projects are already in
pilot or demonstration scale. NSE Biofuels, Enerkem, Rentech, Solena and Bioliq are
companies involved in the production of FT-BTL fuels (GUELL et al., 2012). Table 7
summarizes the strengths and challenges regarding FT-SPK pathway.
Table 7: Strengths and challenges for FT-SPK pathway.
Strengths Challenges
BiomassPre-
treatmentGasification
Gas conditioning
Fischer-Tropsch
Synthesis
Product upgrading
Jet

41
Wide range of products can be produced Biomass gasification requires
optimization
Feedstock flexibility High capital costs
High carbon conversions Catalysts deactivations due to impurities
Low operation costs
3.1.3.2 Gas fermentation
Another alternative for producing renewable fuels for aviation is the fermentation
of syngas to produce liquid biofuels. The biomass derived syngas can be obtained from
lignocellulosic feedstock as described for FT-BTL route. After cooled, the syngas can be
fermented by acetogenic bacterias, producing a mixture of alcohols such as ethanol and
butanol. These alcohols are converted to jet fuel through the processes described in ATJ
route, which includes steps of dehydration, oligomerization, distillation and
hydrogenation (WANG; TAO, 2015). Figure 17 shows the steps involved in gas
fermentation pathway to produce biojet fuel.
An interesting point of this pathway is that it can convert municipal and industrial
organic waste, besides energy crops and typical agricultural residues. Also, this pathway
is capable of producing more products than the conventional biochemical or
thermodinamical pathways. The process requires lower temperature and pressure and less
expensive enzymes (WANG; TAO, 2015).
Figure 17: Main steps in gas fermentation route to produce biojet. Based on (WANG; TAO, 2015).

42
3.1.4 Sugar to Jet
Liquid transportation fuels can be produced through biological or catalytic
conversion of sugars. The Sugar to Jet (STJ) pathway is divided into catalytic upgrading
of sugars to hydrocarbons also known as aqueous phase reforming (APR) and direct sugar
to hydrocarbons (DSH), which is the fermentation route known as fermentation to jet
(FTJ).
3.1.4.1 Catalytic Upgrading of Sugars
In the catalytic process the lignocellulosic biomass should be firstly pretreated and
hydrolysed to the extraction of carbohydrate fractions which are subsequently dissolved
in water (MAWHOOD et al., 2014). The process requires certain purification levels and
sugar concentration to convert the sugars into hydrocarbons through the aqueous phase
reform (WANG; TAO, 2015). Thence, the second step aims to reduce the oxygen content
of the solution and involves reaction like: reforming to produce hydrogen,
dehydrogenation of alcohol and hydrogenation of carbonyls, deoxygenation,
hydrogenolysis and cyclisation (MAWHOOD et al., 2014). The APR products include
hydrogen, carbon dioxide, alcohols, ketones, aldehydes, alkanes, organic acids and furans
(BLOMMEL; CORTRIGHT, 2008; WANG; TAO, 2015). The hydrogen produced can
support the following hydrotreating process before APR and the hydro-refining processes
after APR. The lighter alkanes (C1-C4) can be sent to a combustor producing heat for the
process (HELD, 2009; WANG; TAO, 2015).
Three alternative secondary steps have been identified to convert the APR
products into jet fuel range hydrocarbons. The first route is acid condensation, which is
responsible to convert the oxygenates into alkanes, isoalkanes and aromatics with a
zeolite ZSM-5 catalyst. It is performed through the dehydration of oxygenates to alkenes,
oligomerization of alkenes to heavier alkenes, cracking, cyclization and dehydration of
heavier alkenes to aromatics, alkene isomerization, and hydrogen-transfer to form
alkanes. The heavier species can be distilled and blended into jet fuels (BLOMMEL;
CORTRIGHT, 2008; DE KLERK; NEL; SCHWARZER, 2007; GOGUEN et al., 1998;
WANG; TAO, 2015). The second route is the direct catalytic condensation over multi-
functional solid base catalysts, whose products are mostly in jet fuel range (KING;

43
KELLY; STITT, 2003; WANG; TAO, 2015). Finally, the third route converts the APR
oxygenates to alkanes and alkenes through dehydration and hydrogenation-dehydration
reactions. The alkenes follow to oligomerization to produce jet fuel (GURBUZ;
DUMESIC, 2013; GÜRBÜZ; KUNKES; DUMESIC, 2010; WANG; TAO, 2015).
Virent’s Bioforming platform is a process that converts sugars into hydrocarbons.
The Bioforming technology combines Virent’s proprietary APR technology with
catalytic steps similar to petroleum refining. The four main steps of Virent’s technologies
are: pretreatment or fractionation, hydrogenation, aqueous phase reforming done under
moderate temperatures and pressures and acid catalyzed dehydrations/condensations
(NABC, 2011). Figure 18 shows the schematic catalytic upgrading of sugars to
hydrocarbons, based on Virent’s process.
Figure 18: Main steps in catalytic upgrading of sugars to jet fuel. Adapted from (NABC, 2011)
Feedstock suitable for this process is soluble plant sugars, obtained from sugar,
starch or lignocellulosic feedstocks like sugarcane, sugar beet, maize, corn stover,
grasses, wood, among others (MAWHOOD et al., 2014; NOVELLI, 2011). As well as in
the FT-SPK and HEFA-SPK, the fuel produced by APR route can not be directly used as
jet fuel, due to its low aromatics content and so should be blended for use in aircraft
(NOVELLI, 2011). However, the Bioforming process can produce also synthetic
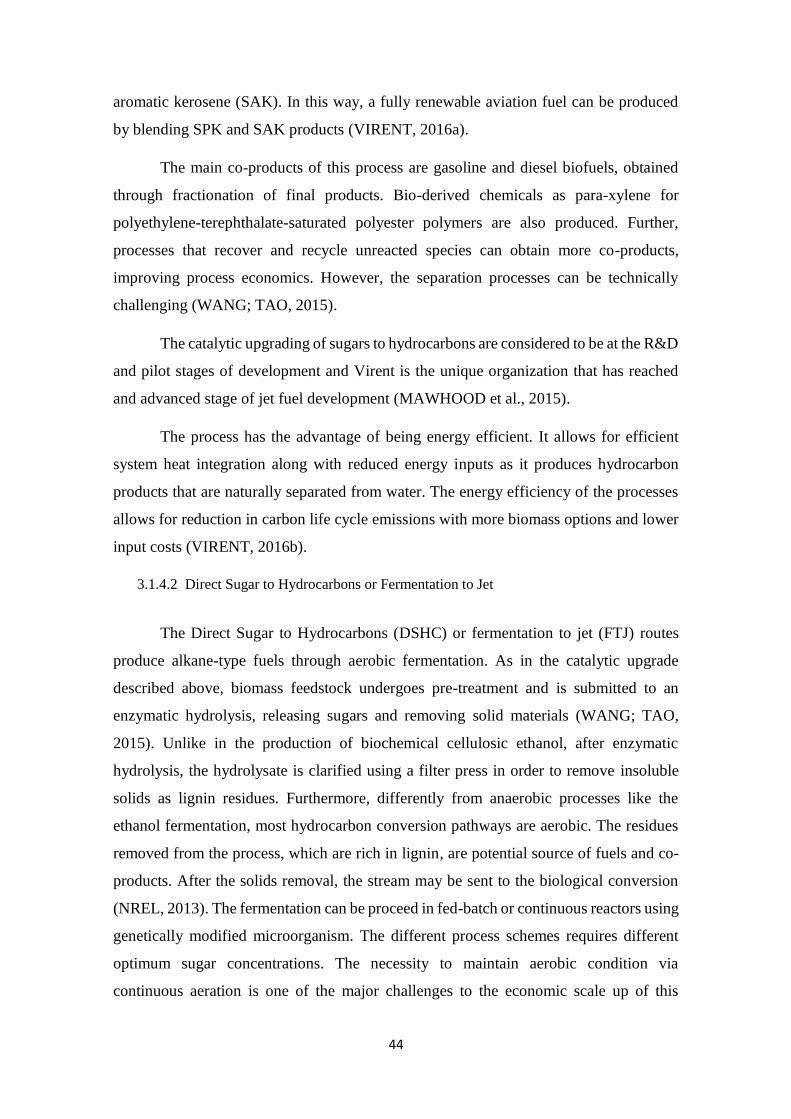
44
aromatic kerosene (SAK). In this way, a fully renewable aviation fuel can be produced
by blending SPK and SAK products (VIRENT, 2016a).
The main co-products of this process are gasoline and diesel biofuels, obtained
through fractionation of final products. Bio-derived chemicals as para-xylene for
polyethylene-terephthalate-saturated polyester polymers are also produced. Further,
processes that recover and recycle unreacted species can obtain more co-products,
improving process economics. However, the separation processes can be technically
challenging (WANG; TAO, 2015).
The catalytic upgrading of sugars to hydrocarbons are considered to be at the R&D
and pilot stages of development and Virent is the unique organization that has reached
and advanced stage of jet fuel development (MAWHOOD et al., 2015).
The process has the advantage of being energy efficient. It allows for efficient
system heat integration along with reduced energy inputs as it produces hydrocarbon
products that are naturally separated from water. The energy efficiency of the processes
allows for reduction in carbon life cycle emissions with more biomass options and lower
input costs (VIRENT, 2016b).
3.1.4.2 Direct Sugar to Hydrocarbons or Fermentation to Jet
The Direct Sugar to Hydrocarbons (DSHC) or fermentation to jet (FTJ) routes
produce alkane-type fuels through aerobic fermentation. As in the catalytic upgrade
described above, biomass feedstock undergoes pre-treatment and is submitted to an
enzymatic hydrolysis, releasing sugars and removing solid materials (WANG; TAO,
2015). Unlike in the production of biochemical cellulosic ethanol, after enzymatic
hydrolysis, the hydrolysate is clarified using a filter press in order to remove insoluble
solids as lignin residues. Furthermore, differently from anaerobic processes like the
ethanol fermentation, most hydrocarbon conversion pathways are aerobic. The residues
removed from the process, which are rich in lignin, are potential source of fuels and co-
products. After the solids removal, the stream may be sent to the biological conversion
(NREL, 2013). The fermentation can be proceed in fed-batch or continuous reactors using
genetically modified microorganism. The different process schemes requires different
optimum sugar concentrations. The necessity to maintain aerobic condition via
continuous aeration is one of the major challenges to the economic scale up of this

45
process. Moreover, aeration is usually costly to implement due to high costs with air
compressors and powerful motors (NREL, 2013). Finally, the resulting products are sent
to a phase separation stage. Their conversion to jet fuel can be performed via
hydroprocessing (WANG; TAO, 2015). Figure 19 shows a scheme of the main step of
FTJ route.
Figure 19: Main steps in the FTJ route. Adapted from (NREL, 2013)
The feedstock suitable for this process are mainly lignocellulosic sugars. The
processes was developed by Amyris and LS9. The development of FTJ route is being led
by a joint venture between Amyris, an American biotechnology company, and Total, a
French oil company. Their technology named Biofene produces the isoprenoid farnesene,
used as the basis for petroleum replacement products. The first commercial plant is
localized in Brotas, Brazil, and has been operational since 2012 (MAWHOOD et al.,
2015). In 2012, Amyris successfully demonstrated the renewable fuel in a flight when an
aircraft operated by Azul Airlines flew in Brazil (AMYRIS, 2016). In 2014, the Biofene
jet fuel was certified for blends up to 10% with petroleum-derived jet (MAWHOOD et
al., 2015).
The lignin-rich residues removed from the process may be a potential source of
fuel and co-products. However, it is necessary the development of cost-effective
technologies to convert this non-sugar components into value-added co-products or fuel
precursors (NREL, 2013).

46
The FTJ pathway leverages prior experience in biochemical conversion
technologies, as in the case of sugar production from cellulosic biomass. The utilization
of genetically engineered microorganism has the advantages of producing fuel
components with high yields and value, improving economic viability. However,
conversion costs associated with the aerobic fermentation step are considered the main
challenges to process scale up (NREL, 2013).

47
4. Methodology
This study applies a methodology to assess the potential for biojet production in
Brazil by identifying the competitive opportunities for a growing market in the country.
For this purpose, this analysis comprises distinct steps in order to assess the availability
of feedstock, the techno-economic feasibility and the environmental impact of fuel
production and use. Together these assessments are useful to identify areas with major
potential to implement biojet production sites in the country.
4.1 Feedstock availability
This section exposes the methodology adopted to evaluate the available potential
of primary bioenergy from agricultural, agroindustrial and forestry residues. The biomass
potentials can be classified according to their theoretical, geographic, technical, economic
and sustainable potentials. For example, the basis to estimate the theoretical biomass
potential are the biophysical and agro-ecological factors that affect the biomass growth
and extension and its residues production (ANGELIS-DIMAKIS et al., 2011). Even
though this is the highest level of potential, it is limited by natural, climatic and
environmental constrains, as agricultural residues are important to the biome regulation.
The geographic potential is the theoretical potential limited by the availability of
resources at geographical locations. The technical potential represents the fraction of the
environmentally sustainable potential available under technological possibilities,
logistics restrictions and competition for non-energy uses (PORTUGAL-PEREIRA et al.,
2015). The economic potential represents the technical potential at cost levels considered
competitive (ECOFYS, 2008). The sustainable potential, on the other side, is a deeper
assessment that evaluates the amount of biomass available considering the socio-
economic and ecological impacts of its use in energy projects (ANGELIS-DIMAKIS et
al., 2011). Figure 20 exposes the characteristics of biomass potentials mentioned above.
This study quantified the technical potential of biomass residues from sugarcane, rice,
soybeans, wheat, maize, eucalyptus and pinus. Sugarcane and soybeans were chosen due
to their current utilization for energetic purposes in the country. The another crops were
chosen due to their relevant planted area, potential for expansion and high residue to
product ratio.

48
Figure 20: Different potential of biomass resources classifications Adapted from PORTUGAL-PEREIRA ET AL. (2015) ECOFYS (2008)
The methodology adopted to estimate the residues production by agricultural and
agro-industrial practices was based in the indirect quantification of the residues produced,
since to this point, there is no information available for the residues produced in farming
and harvest stages. Then, considering the technical constrains described above, this study
follows a bottom-up analysis to determine the technical potential of bioenergy from
agricultural and forestry residues as follows:
𝑅𝑃𝑗 = ∑ 𝐴𝑖 . 𝑃𝑖 . 𝑅𝑃𝑅𝑗,𝑖. 𝐸𝑆𝑅𝑗. 𝐴𝑅𝑗. 𝐿𝐻𝑉𝑗
Where:
RPj: residue potential
Ai: planted area of crop i (ha.year-1)
Pi: productivity of crop i (tonne.ha-1)
RPRj,i : residue of j to product i ratio
ESRj: environmentally sustainable removal rate of residue j (%)
ARj: availability rate of residue j (%)
•Natural and climate factors
•Physical restrictions
•Energy contentTheoretical Potential
•Land use and other constrainsof area availability
Geographic Potential
•Technical limitations
•System performanceTechnical Potential
•Economical constrains
•Cost projections by technology
•Cost projections by fuelEconomic Potential
•Social and environmentalconstrains
Sustainable Potential

49
LHVj: low heating value of residue j (MJ.kg-1)
Data of agricultural harvested area (Ai) and crop productivity (Pi) was obtained in
the database of the Brazilian Institute of Geography and Statistics (IBGE), under the
Municipal Agricultural Survey (PAM) for all Brazilian municipalities in 2014. It should
be noted that the planted and harvested area have different concepts. Sometimes
agricultural areas are planted but not harvested and so, the crop remains on the field. In
this study, it is assumed that the entire planted area is harvested.
Table 8 presents the planted area and total production for the selected crops in the
year of 2014. In 2015, sugarcane and soybeans were the most significant crops in terms
of planted area and production, accounting together to about 56% of total agricultural area
in the country (IBGE, 2016). Other crops as rice, maize and wheat correspond to smaller
planted areas of approximately, 20,500 ha.
Table 8: Planted area and productivity of the crops selected
Crop Planted area (ha/year) Total product (t/year)
Sugarcane 10,438 737,156
Rice 2,341 12,176
Soybeans 30,274 86,761
Maize 15,342 79,878
Wheat 2,835 6,262
The residue-to-product ratio (RPR) varies considerably according to the
biophysical characteristics of species and to the edaphoclimatic conditions of the
agricultural fields (BHATTACHARYA et al., 2005). Evidences suggest that residue
yields increase up to a certain level and then remain constant after that (BENTSEN;
FELBY; THORSEN, 2014). Since there is no specific data regarding residues production
by Brazilian crops, an average factor from data collected in literature and presented in
Portugal-Pereira (2015) was adopted.

50
The environmental sustainable rate (ESR) represents the part of the residues that
should remain in the agricultural fields in order to regulate the ecosystem by protecting
the soil against erosion, retaining soil humidity and recycling the nutrients lost in the
harvest process. This factor varies according to the crop analyzed and to the climate and
soil conditions. As in the case of RPR, specific data of ESR is not available for Brazilian
conditions. Thus, as proposed in Portugal-Pereira et al. (2015), the conservative value of
30% for removal rate was considered.
Further, the available rate of residue (AR) represents the competition with other
non-energy uses and logistic constrains. In other words, it represents the availability of
residues for energy purposes. For the rice, soybeans, maize and wheat crops, it was
assumed full availability of residues, as they are mostly left in the fields with no
utilization.
However, regarding sugarcane, a coefficient that express the fraction of its
residues that are not headed for burning and are available for energy use was adopted.
Traditionally, before the harvest, sugarcane straw is burned to clean the fields and
facilitate the harvesting operations. As this practice is responsible for local pollutants and
GHG emissions, the Brazilian government determined the gradual reduction of the
burning practice by 2021. However, the deadline for burning reductions depends of the
land declivity. Areas with higher declivity have longer deadline periods. In this context,
based on Portugal-Pereira et al. (2015), this study assumed that 65% of sugarcane straw
is available for energetic uses, taking into account the rate of farmland that is harvest
mechanically with no open air burning.
For sugarcane bagasse, an availability factor was also attributed, since part of this
residue is used to generate process heat and electricity. Nowadays, approximately 70%
of sugarcane plants use the bagasse only for heat and power generation for own
consumption. In these cases, only 8-10% of bagasse is available for energetic use (DIAS
et al., 2012; MACEDO; SEABRA; SILVA, 2008; SANTOS, 2013). This study
considered an availability factor of 10% for sugarcane bagasse. Regarding rice husk, it
was assumed an availability of 30% as part of this residue is used for energy generation
in the mills (DIAS et al., 2012).

51
The low heating value (LHV) of the residues was obtained in literature and an
average value was adopted as proposed in Portugal-Pereira (2015). Table 9 shows the
data of RPR, AR and LHV used for each crop residue.
Table 9: Characteristics of evaluated residues
Residue RPR AR (%) LHV (MJ/kg)
Sugarcane
straw
0.22 65% 18.62
Sugarcane
bagasse
0.22 10% 19.81
Rice straw 1.54 100% 17.22
Rice husk 0.26 30% 17.08
Soybeans
straw
2.01 100% 20.09
Corn stover 1.53 100% 18.67
Wheat straw 1.55 100% 19.54
Activities in the forest industry are divided in silviculture (or forestry) and
extraction of native forests. Forestry activities include the development and reproduction
of forests to produce timber and other products, and to promote environmental protection
(IPEA, 2012). On the other side, the forest extraction involves the tree cutting in native
forests for its management.
Wood residues come not only from cutting and peeling activities, but also from
the subsequent steps for manufacturing wood products. Forestry products are currently
used as energy sources, firewood for charcoal and steel industries, and as feedstock for
furniture, paper and pulp, black liquor and building industries, among others. This study
considers the residues produced up until the production of basic product, like charcoal,
wood chips, sawn wood or wood sheets through processes known as mechanical or
primary processes. Figure 21 shows the production chain of forestry and wood sector.

52
Figure 21: Production chain of forestry and wood sector. Source: STCP (2011)
Residues from forest harvesting are timber and other forest products that remain
with no defined used due to technological or market limitations (IPEA, 2012). Usually,
residues are defined as all the organic material, excepting stem, including wood chips,
branches, leaves, stump, roots and bark (SFB, 2011). The utilization of logs and roots is
not usual due to the difficult exploration and possibility of soil damages. Residues from
harvesting activities in forests are twigs and branches, superior and broken parts of the
trees and stumps that have not reached a minimum height for commercialization. The
amount of forest residues ranges from 10% to 20% in planted forests and from 60% to
70% in the natural forests (CANTO, 2009). However, leaving a fraction of organic
material in the fields is required to maintain soil quality and increase fertility. As most
part of nutrients are concentrated in the leaves, leaving only them in the fields may be
advantageous. Another possibility to replace the nutrients that are removed with the
residues harvesting is the application of chemical fertilizers or ashes from the cultivation
(CANTO, 2009). In this way, this study considered a lower limit for the residues
availability, indicating that half part of residues should remain in the fields, and an upper
limit, indicating that all residues are exploited. Thus, the range of residues available in
the forestry sector varies from 5% to 10% and from 30% to 70% in the extractive industry.

53
The wood residues from the primary processes of forest sector may be classified
in sawdust, shavings and firewood or wood chips (IPEA, 2012). The primary process is
the initial transformation of wood logs producing residues, whose characteristics vary
according to the log diameter, size and its final use, for example. The STCP (2011) study
shows that in the mechanical processing of wood there is an initial loss of 45% to planted
forests and of 18% to natural forests. These losses are included in the estimates of residue
production (STCP, 2011).
For the residues quantification, a methodology used in a study from IPEA for
assessing residues availability was adopted (IPEA, 2012). Data of forestry production and
extraction in 2014 from IBGE was used (IBGE, 2014). The production data from IBGE
refers to charcoal, firewood and sawlog. To the residue quantification, it was considered
all log production and it was assumed that for firewood production, the whole tree is
harnessed (IPEA, 2012).
It is noteworthy that this study has not considered current data of wood residues.
Wood chips and sawdust can be used in cables and packages production if they are not
sent to energy uses. Wood shavings have been used in intensive chicken farming in Brazil.
Thus, great part of the residues produced are being used and have a market price. On the
other hand, studies show that a huge amount is sent to composting and may cause negative
environmental impacts (IPEA, 2012).
The methodology described above enabled the quantification of the bioenergy
technical potential of each municipality in Brazilian territory. Moreover, the spatial
localization and concentration of this bioenergy is important to enable its recovery and
utilization. In this way, a GIS analysis was applied in order to identify geographical areas
with great biomass potential and analyze their proximity to strategic locations of
feedstock handling, jet fuel production and consumption. To this end, after the technical
potential was calculated for each municipality, it was allocated to the shape files with
municipalities divisions obtained from IBGE. Thus, it was possible to identify for each
crop and municipality its bioenergy potential, in TJ/year. It was assumed a uniform energy
density for each municipality, being this a limitation of this study. Figure 22 shows the
total bioenergy potential for Brazilian municipalities. The total biomass potential
estimated in Brazil is 3,931,807 TJ/year. Regions with major potential are South and
Southeast, accounting for 1,288,131 and 1,095,003 TJ/year, respectively. Crops with

54
major potential in the country are soybeans and sugarcane, totalizing 1,050,091 and
1,033,683 TJ/year, respectively.
Figure 22: Bioenergy potential from selected biomass residues in Brazilian territory
The next step was the construction of kernel maps from the shape files containing
the bionergy potentials. In geoprocessing technologies, the kernel map represents a
statistical method to estimate density curves. In this method, each one of the potentials is
weighted by a distance to a central point. In other words, Kernel map is a tool for
geographic analysis of behavior patterns. Through interpolation methods, these maps
show the punctual intensity of potentials in all regions analyzed. To construct the maps,
files in raster format were generated from the shape files by defining the municipalities’
centroids as the central points and a distance of 100 kilometers. This value represents an
optimistic estimate for biomass transportation, representing twice the distance
recommended by Hoffmann et al. as an economically feasible radius to transport biomass
for energy purposes. Constructing kernel maps is a useful way to assess the residues
potential without limiting them to defined areas, such as municipalities.
Next, important locations for fuel production, distribution and utilization, such as
refineries that produce jet fuel, terrestrial and waterways terminals of fuel handling and

55
main airports of the country were mapped (Figure 23) in order to help determining
suitable areas for biojet fuel production. Also, biodiesel and etanol plants and soybean oil
refineries were mapped (Figure 24) to identify areas with existing infrastructure for
feedstock and fuel logistics.
Figure 23: Jet fuel refineries, distribution terminals and main airports in Brazil

56
Figure 24: Biodiesel and ethanol plants and soybean oil refineries in Brazil
4.2 Life cycle assessment
The Greenhouse Gases, Regulated Emissions, and Energy Use in Transportation
(GREET) model (Version 1 2015) was used to assess life cycle fossil fuel consumption
and GHG emissions from diverse biojet fuel production pathways. This analysis includes
all steps in a products life, from the raw material extraction to further processing,
manufacture, distribution, use and storage or recycle. The fuel life cycle, also named well-
to-wake (WTW) represents a combination of the well-to-pump (WTP) and pump-to-wake
(PTW) stages. The WTP stage comprises the exploration and recovery activities from the
well to fuel production and the subsequent transportation to the pump. On the other hand,
the combustion of fuel during aircraft operation constitutes the PTW stage. Figure 25 and
Figure 26 shows the WTW cycles for conventional jet fuel and biojet fuel production,
respectively. The GREET model is a useful tool to evaluate the production chain of
advanced fuels and has the advantages of providing results in well-to-pump (WTP) and
pump-to-wake (PTW) phases, including local pollutants and water consumption data,

57
being adjustable by the user and free access. The HEFA and FT-BTL routes were selected
and the life cycle results for each one were compared with the conventional jet fuel.
Figure 25: WTW cycle for conventional jet fuel production Source: Elgowainy et al. (2012)
Figure 26: WTW cycle for biojet fuel production Source: Elgowainy et al. (2012)
Tailored assumptions according to Brazilian conditions were inputted in GREET.
Inputted parameters include application of fertilizers, pesticides, herbicides and energy
consumption in the agricultural stages and land use change emissions (LUC). For HEFA
route, data regarding the soybean farming in Brazil and LUC emissions in Brazilian
savannah were considered. As for FT-BTL route the feedstock considered is a residual
biomass, no farming energy and fertilizer use were considered. Other inputs include the
electricity generation matrix in the country and the fuel yield per feedstock input. It is
noteworthy that although Brazilian diesel contains 7% of biodiesel, this study considered
the utilization of 100% diesel in the analysis.
Functional units adopted for LCA results were MJ for GHG emissions and fossil
fuel consumption. The model allows the user to choose an aircraft type to display the
results. The Large Twin Aisle (LTA), a type of passenger aircraft like Boeing 747 and
Airbus A380 was selected. Although these aircrafts are not representative of the Brazilian

58
aviation fleet, in future advanced aircrafts with innovative engines are more likely to be
used for biojet blendings. The energy allocation method was chosen for all pathways
modelled in this analysis, as this LCA is about an energy product. Activities regarding
biojet fuel distribution were not considered in this analysis. Results include data of energy
consumption and GHG emissions for the biofuel and conventional fuel WTW cycles. The
model also gives the results for each fuel production stages mentioned above, WTP and
PTW. The results obtained are compared to biojets studied in literature and biodiesel from
Brazil and EU.
The petroleum derived jet fuel life cycle begins in the activities of oil recovery in
oil fields, follows to the refining process and ends in the fuel consumption by aircraft.
Activities related to fuel transportation and infrastructure are not included in the model.
The oil recovery activity has as a co-product an associated gas consisted mainly of
methane (CH4), one of the main GHG which has a global warming potential (GWP100) 25
times higher than the CO2, considering a period of 100 years (FORSTER et al., 2007).
The associated gas is burned and vented in the oil recovery process. This study considered
these emissions in the fuel life cycle, even though the burning practice is limited in Brazil,
corresponding to approximately only 3.9% of the gas production (ANP, 2016a).
For the HEFA biojet fuel, the life cycle begins in the soybeans production in the
agricultural fields, as the feedstock chosen in this study for this route is the soybean oil.
Soybean production in Brazil highly depends of land availability, fertilizer and pesticides
use, fuel for transportation, machinery and electricity (PRUDÊNCIO et al., 2010). The
agricultural activities include cultivation, farming, fertilizer (N, P2O5, K2O), CaCO3 for
soil acidity reduction, herbicides and pesticides application, diesel consumption and
electricity. The nitrogenous fertilizers contribute to GHG emissions due to the N2O
emissions from nitrogen mineralization in the soil (LOKESH et al., 2015). The intense
mechanization requires high diesel consumption in the soybean agricultural stages. In this
study, data from fertilizer, pesticides, herbicides and energy for soybean oil extraction
were obtained by an average value in the studies of literature (CAPAZ, 2009;
CAVALETT; ORTEGA, 2010; ROCHA et al., 2014). Data regarding diesel consumption
and electricity were obtained in the agricultural census (IBGE, 2006).
The LUC due to biomass production is a critical point in life cycle assessments.
This work considered only direct land use changes that occur within the agricultural
boundaries of the system as, for example, the replacement of the natural soil cover for

59
energy crops. If these crops induce to an initial carbon loss as a result of the soil cover
replacement, a carbon debt is created (BAILIS; BAKA, 2010). In this work, only the
direct land use changes in Brazilian savannah were considered. The associated GHGs
emissions were calculated from the emission factors from IPCC (IPCC, 2006) for
savannah substitution to soybean cultivation under conventional tillage. Also, according
to Prudêncio et al. (2010), there is a factor of 3.4% of soil transformation for soybean
production in Brazilian savannah (PRUDÊNCIO et al., 2010). It represents an
extrapolated factor that indicates the portion of land transformation from savannah to
soybean production. The uncertainties associated to this factor may affect the LCA
results, once these values may be higher for marginal areas of soybean expansion. Table
10 contains the inputs given for soybean agricultural stage in GREET.
Table 10: Input data for agricultural stage of soybean production used in GREET
Soybeans
Source
Productivity 3 t/ha (CONAB, 2016)
Fertilizers
Nitrogenous 0.32 g/kg soybean (CAPAZ, 2009;
CAVALETT;
ORTEGA, 2010;
ROCHA et al., 2014)
P2O5 12 g/kg soybean
K2O 23.10 g/kg soybean
CaCO3 138 g/kg soybean
Farming energy 2.08 MJ/kg soybean (IBGE, 2006)
Oil extraction
energy
0.86 MJ/kg soybean (CAPAZ, 2009;
CAVALETT;
ORTEGA, 2010;
ROCHA et al., 2014)
LUC emissions
2568.406 g CO2e/kg
soybean
(IPCC, 2011),
(PRUDÊNCIO et al.,
2010)
The following step in HEFA fuel production is the hydroprocessing of soybean
oil. This technology is already well developed and commercially available. Emission in

60
this stage is related to the hydrogen production, used in the hydrotreatment and
hydrocracking processes. The GREET model is based on the UOP process for
hydrodeoxigenation of renewable oils (Figure 27). Figure 28 shows the life cycle stages
for HEFA jet fuel production from soybeans.
Figure 27: UOP jet fuel production process from natural oils and fats Source: Honeywell (2015)
Figure 28: Life cycle stages of HEFA jet fuel production from soybeans Source: Elgowainy et al. (2012)
The FT-BTL biojet life cycle begins in the agricultural phase of biomass. Once
this study considered residual biomass as feedstock for the FT-BTL pathway, no energy
use and emissions associated with farming and collection of biomass were considered.

61
The following step is the conversion of biomass in jet fuel through the Fischer-Tropsch
synthesis. In this process, biomass is fed into a gasifier to produce syngas. The CO2 in
syngas may be vented or captured and sequestered. In addition, unconverted syngas can
be recycled for further FT synthesis or exported for electricity generation (ELGOWAINY
et al., 2012). This study did not consider CO2 capture or export. Finally, to produce jet
fuel, additional hydrocracking and a higher rate of syngas recycling are needed,
increasing hydrogen and power requirements for the plant. As in the HEFA biojet case,
hydrogen production may be responsible for increasing emissions in the fuel production.
Figure 29 shows the life cycle stages of FT-BTL jet fuel production.
Figure 29: Life cycle stages for FT-BTL jet fuel production from biomass Source: (ELGOWAINY et al., 2012)
The GHG emissions during operation are associated with fuel combustion in
aircraft. Major emissions are CO2 and water vapor, as well as methane (CH4) and N2O,
contributing with global climate changes. Water vapor was not accounted in the GHG
emissions in GREET. Emissions were normalized to a CO2 equivalent basis using the
global warming potential metric considering a time horizon of 100 years (GWP100). The
GWP100 values used are 25 and 298 for methane and N2O, respectively. The utilization
of GWP has been debated in literature (FUGLESTVEDT et al., 2010; O’NEILL, 2000;
ROTMANS; DEN ELZEN, 1992; SMITH; WIGLEY, 2000) mainly because GWP is
simply a direct indicator of climate change under a restrictive set of assumptions

62
(DORBIAN; WOLFE; WAITZ, 2011). Also, according to FUGLESTVEDT ET AL. , GWPs
are reliable for calculations of long-lived gases, but problems and uncertainties increase
for short-lived components. Other emissions influencing both local air quality and climate
change are nitrous oxides (NOx), sulfur oxides (SOx), particulate material with 10
micrometers or less (PM10). The volatile organic compounds (VOC) and carbon
monoxide (CO) impact air quality (ELGOWAINY et al., 2012). Even though these
pollutants have significant and detrimental effects in regional air quality and climate, they
are beyond the scope of this study.
4.3 Techno-economic feasibility of biojet production routes
This section presents the description of capital and operational costs estimates for
implementing production units of biojet in Brazil. Given the technological maturity and
approval by ASTM specifications, two pathways for biojet production, described in
Chapter 3, were selected: the Fischer-Tropsch Biomass-to-liquids (FT-BTL) and
Hydroprocessed Esters and Fatty Acids (HEFA). In the case of HEFA route, the existence
of a well-established industry of biodiesel production, which uses the same feedstock,
also contributed to its selection.
For each pathway, different plant capacities were considered in the cost estimates.
For HEFA route three plant capacities were evaluated: 2000 (A), 4000 (B) and 6000 (C)
barrels per day7 (PEARLSON, 2011). For FT-BTL pathway four plant sizes were
considered: 800 (A), 1,000 (B), 2,500 (C) and 10,000 (D) barrels per day (ELIA et al.,
2013). Parameters used in the levelized costs estimates are shown in Table 11.
Table 11: Parameters considered in HEFA and FT-BTL cost estimates.
Parameters HEFA FT-BTL
Operating
hours
(hours/year)a
8,000
8,000
Installed
processing
(A)
348,531
(B)
697,061
(C)
1,045,592
(A)
127,190
(B)
158,987
(C)
397,468
(D)
1,589,873
7 The plant capacity refers to the total amount of fuel produced.

63
capacity
(L/day)b
a Feedstock (soybean oil) has a storage period of 13 days (PEARLSON, 2011).
b Liters of biojet per day.
4.3.1 HEFA methodological description
This sub-section describes the procedures and assumptions made to estimate the
capital and operational costs associated with HEFA biojet production, based on the study
conducted by Pearlson (2011). Monetary values were adjusted to 2014 year according to
GDP deflators given by the U.S. Department of Commerce (BEA, 2016).
As mentioned above, in the case of HEFA pathway, three different plant sizes
were evaluated. The processing unities considered for each plant are:
Feedstock reception and pre-treatment: Storage of vegetable oils. It is assumed
that refined, deodorized and bleached oils are purchased from suppliers.
Hydrodeoxigenation: Hydrotreating is responsible for oxygen removal, double
bonds saturation and propane backbone of triglycerides cleavage by reaction with
hydrogen in the presence of a catalyst.
Selective isomerization and catalytic cracking: Reduction of freezing point,
obtaining products in the desired range.
Heat integration for steam generation and cooling water: Heat removal during the
exothermic processes like hydrotreating and isomerization.
Gas cleanup and recycle: Separation of liquid and gaseous products and separation
and recycle of oxygen to deoxygenation process.
Hydrogen production: A hydrogen plant is necessary to guarantee the amount
required. Steam reforming of methane was considered in this analysis8.
Product separation through atmospheric distillation
Products storage and blending
8 As mentioned in HEFA route description (Chapter 3.1), the reforming of naphtha is an alternative to
produce aromatics and hydrogen (catalytic reforming) or only hydrogen (steam reforming).

64
Feedstock chosen was soybean oil and, once the units receive the refined oil, the
agricultural steps of its production and refining are not included. Table 12 presents a
summary of the energetic consumption and yields for HEFA pathway operations.
Table 12: Inputs and products profile for HEFA pathway. Based in (PEARLSON, 2011)
Inputs
Soybean oil (t) 2.02
Hydrogen (t) 0.08
Natural gas (GJ) 45.04
Electricity (MWh) 0.71
Products
Biojet (t) 1
Propane (t) 0.09
GLP (t) 0.12
Naphtha (t) 0.14
Diesel (t) 0.47
Table 13 below contains the most relevant parameters to the economic evaluation
of biojet production. It was considered a construction time of 3 years9 and lifetime of 20
years (PEARLSON, 2011). The feedstock price is also shown.
Table 13: Parameters considered in the economic analysis.
Parameters
Construction time (years) 3
Plant lifetime (years) 20
Soybean oil prices (US$/t)10 776
The hydrotreating plants analyzed are not pioneer plants and it is assumed that
they will be built from traditional and well-established petrochemical plant and
equipment. These plants require less efforts in engineering, acquisitions, building and
have an optimized operation, reducing their costs (PEARLSON, 2011). It is also assumed
that the plant is built near refineries, reducing infrastructure costs such as building roads,
9 Optimistic approach. For Brazilian reality, values may be higher. 10 Data source: (INDEXMUNDI, [s.d.])

65
offices, laboratories and distribution terminals. For this reason, an optimistic construction
time was adopted, if compared to the average time for complex refining projects of 5
years (NOGUEIRA DE OLIVEIRA et al., 2015). Delays in construction and project
implementation are not considered, as this assessment regards to a small/medium project
size.
Table 14 lists the process equipment and other expenses included in the plant
investment. The capital costs (CAPEX) can be divided in ISBL (Inside battery limits),
which include expenses like acquisition and installation of process and ancillary unities,
and OSBL (Outside battery limits), which include storage and basic processes utilities.
Additional costs include the external costs arising from the associated infrastructure, such
as the construction of roads. The special costs include project management, offices,
among others. Additionally, a contingency of 15% for ISBL, OSBL, external and special
costs subtotal was considered (PEARLSON, 2011). Scaling and localization factors were
applied to adjust regional differences in the expenses.
Table 14: Equipment and other expenses included in HEFA plant investment
Capital costs
ISBL
Hydrotreating
Isomerizer
Hydrogen production
(Reforming)
Saturated gas plant
OSBL
Feed storage
Liquid products storage
Gaseous products storage
Cooling water tower
Special costs
Contingency
Scalability
Location factor

66
The operation and maintenance costs are composed by fixed and variable costs.
Fixed costs (FOM) include the expenses that do not depend on the production levels,
unlike the variable operational costs (VOM), that depend on the production levels. Fixed
costs include insurances, taxes, maintenance and salaries. In the study of Pearlson (2011),
used as reference, the fixed costs were based in literature heuristics and interviews. Table
15 shows the assumptions made to estimate the fixed costs.
Table 15: Assumptions made in fixed costs estimate.
Fixed costs
Catalyst 0.2-0.5 $/L of fuel produced
Insurances 0.5% of Investment
Taxesa 5.0% of Investment
Maintenance 5.5% of Investment
Miscellaneous supplies 0.2% of Investment
Staff and operationb 0.4-0.7% of Investment
Contingency 10% of subtotal
Note:
a,b: Values adapted for Brazilian reality
Source: Pearlson (2011)
Insurances and taxes represent around 0.5% and 5.0% of the plant total
investment. Taxes include the financial cost plus the basic remuneration of the credit
institution and the interest rate risk (BNDES, 2016). Maintenance costs were estimated
around 5.5% of the plant total investment. Miscellaneous supplies costs are low,
representing around 0.2% of the total investment and they include purchase of chemicals,
drinking water, among others. As the units assessed in this study for biojet production do
not have the complexity of an oil refinery, for example, a reduced number of staff was
considered (PEARLSON, 2011). It was assumed an equip containing 12 employees
which salaries were assumed according to Brazilian reality (EXAME, 2016). These
values were converted and related to the total fuel production, resulting in a cost of 0.2 to
0.8 dollars per liter of fuel produced.
Variable costs are directly influenced by the production levels. These costs include
expenses with catalyst, electricity, natural gas, water and feedstock. Catalysts need
periodical replacements or regenerations. Expenses with catalysts were estimated
according to standard parameters for hydrotreating processes. Electricity is used to power

67
pumps, compressors and electrical appliances. Natural gas is a fuel for heating and
feedstock for processes like hydrogen production by steam reforming. This study also
considered the hydrogen production in site and soybean oil as feedstock (Table 16). The
biomass transportation costs were evaluated from a linear regression analysis using data
available in SIFRECA website (SIFRECA, 2016). The analysis results in the equation 1
below (Eq. 1) and is a function of the amount of biomass transported and the distance
travelled.
Table 16: Prices of production supplies that compose the variable costs analysed for HEFA plant
Inputs Prices
Catalyst 0.2-0.5 $/L of fuel produced (PEARLSON, 2011)
Electricity 102.93 US$/MWha (ANEEL, 2012)
Natural gas 15.96 US$/GJ (FIRJAN, 2011)
Soybean oil 776 US$/t (INDEXMUNDI, [s.d.])
Notes:
a Industrial tariff
𝐶𝑇 = 14.40 (𝑈𝑆$
𝑡) + 0.56 (
𝑈𝑆$
𝑡. 𝑘𝑚) 𝑥 𝐷𝑖𝑠𝑡𝑎𝑛𝑐𝑒 (𝐸𝑞. 1)
4.3.2 FT-BTL methodological description
This sub-section describes the proceedings and assumptions made to estimate
capital and operational costs for FT-BTL route to produce biojet fuel based on the study
of Elia et al. (2013). Values were adjusted for 2014 according to GDP deflators given by
the U.S. Department of Commerce (BEA, 2016) and adapted to Brazilian conditions.
As mentioned before, four plant capacities were studied for FT-BTL route to
produce biojet fuel. These plants contain the following process unities:
Biomass handling: the analyzed feedstock is residual forest biomass in wood chips
form. This feedstock should be pretreated prior gasification. Biomass is firstly
screened and then follows to a grinder to reduce particles sizes. Next, the drying
process reduces humidity so the feedstock can feed the process.
Syngas production from biomass: Conversion of pre-treated residual forest
biomass in fluidized bed gasifiers pressurized with oxygen.

68
Syngas conditioning: Removal of acid gases, nitrous compounds and fractions of
CO2.
Hydrocarbon synthesis via Fischer-Tropsch: The FT unities operates with high
pressures and use cobalt catalysts, aiming to maximize the production of medium
distillates.
Hydrocarbon upgrade: Initially the water-soluble oxygenates are removed from
the stream, which follows to a separator to remove the aqueous phase from the
residual steam and from any liquid hydrocarbon. Then, hydrocarbons are sent to
a fractioning column and further hydroprocessing.
Light gases recycle
Hydrogen and oxygen production: Hydrogen demand may be attained by
pressure-swing adsorption or water electrolysis. The oxygen produced in
electrolysis along with the oxygen obtained in air separation unit (ASU) are used
to satisfy the plant requirement.
Table 17 resumes the inputs and energy consumption for FT-BTL route.
Table 17: Inputs and energy consumption for FT-BTL biojet production.
Inputs
Biomassa (t) 5.36
Water (t) 0.82
Electricity (MWh) 0.3-0.5
Outputs
Biojet 1
Gasoline11 0.32
a Dry matter
Table 18 presents the main parameters for the economic analysis of biojet
production. It was considered a construction period of 3 years and a lifetime of 25 years
(ELIA et al., 2013). As the feedstock considered is a residual biomass with no defined
use, it was assumed that there are no costs for its acquisition, except for its collection.
11 As mentioned in FT-BTL route description (Chapter 3), the reforming of naphtha (or gasoline) is an
alternative to produce aromatics and hydrogen (catalytic reforming) or only hydrogen (steam reforming).
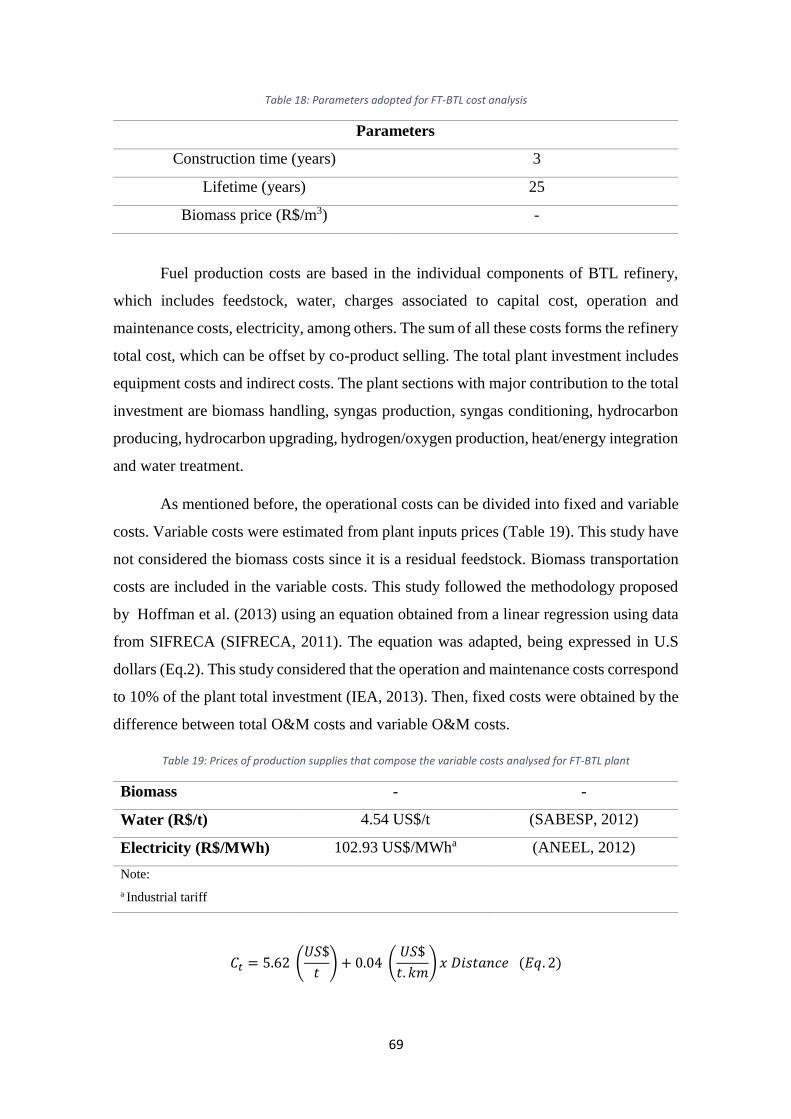
69
Table 18: Parameters adopted for FT-BTL cost analysis
Parameters
Construction time (years) 3
Lifetime (years) 25
Biomass price (R$/m3) -
Fuel production costs are based in the individual components of BTL refinery,
which includes feedstock, water, charges associated to capital cost, operation and
maintenance costs, electricity, among others. The sum of all these costs forms the refinery
total cost, which can be offset by co-product selling. The total plant investment includes
equipment costs and indirect costs. The plant sections with major contribution to the total
investment are biomass handling, syngas production, syngas conditioning, hydrocarbon
producing, hydrocarbon upgrading, hydrogen/oxygen production, heat/energy integration
and water treatment.
As mentioned before, the operational costs can be divided into fixed and variable
costs. Variable costs were estimated from plant inputs prices (Table 19). This study have
not considered the biomass costs since it is a residual feedstock. Biomass transportation
costs are included in the variable costs. This study followed the methodology proposed
by Hoffman et al. (2013) using an equation obtained from a linear regression using data
from SIFRECA (SIFRECA, 2011). The equation was adapted, being expressed in U.S
dollars (Eq.2). This study considered that the operation and maintenance costs correspond
to 10% of the plant total investment (IEA, 2013). Then, fixed costs were obtained by the
difference between total O&M costs and variable O&M costs.
Table 19: Prices of production supplies that compose the variable costs analysed for FT-BTL plant
Biomass - -
Water (R$/t) 4.54 US$/t (SABESP, 2012)
Electricity (R$/MWh) 102.93 US$/MWha (ANEEL, 2012)
Note:
a Industrial tariff
𝐶𝑡 = 5.62 (𝑈𝑆$
𝑡) + 0.04 (
𝑈𝑆$
𝑡. 𝑘𝑚) 𝑥 𝐷𝑖𝑠𝑡𝑎𝑛𝑐𝑒 (𝐸𝑞. 2)

70
Fuel levelized costs were calculated assuming that the total capital investment
would be paid in the construction period (three years). The annual fixed and variable
O&M costs (FOM and VOM) were adjusted according to the plant lifetime. A study made
by Oxera Consulting Ltd. estimated that discount rate would vary from 9% to 13% for
biomass-based low-carbon and renewable technologies (OXERA CONSULTING LTD,
2011). Based on that, a discount rate of 12% was used in the calculations. After
determining the levelized costs of biojet fuel (LCOF) production for HEFA and FT-BTL
pathways, this study evaluated the QAV prices that make the biofuel competitive,
according to different CO2 prices and a fixed biomass transportation distance. Finally, a
sensibility analysis was performed. This analysis aimed to evaluate the major contributors
to the biojet prices and the inclusion of a carbon tax in QAV prices. The parameters
analyzed include the CC, FOM, VOM and a carbon tax represented by CO2 prices.

71
5. Results
5.1 Feedstock availability
This section presents the technical potential of biomass from the selected
feedstock (as described in chapter 4). As mentioned above, the total biomass potential
estimated in Brazil is 3,932 PJ/year. Figure 22 already revealed the spatial distribution of
bioenergy sustainable potential of selected agricultural, agro-industrial and forestry
residues in 2014. This potential is mainly concentrated in South (33%), Southeast (28%)
and Midwest (27%), which contain larger agricultural areas, while North and Northeast
regions shows limited bioenergy potential. Figure 30 shows the potential contribution of
each region in the country.
Figure 30: Contribution of each region for country's bioenergy potential.
In North region, biomass residues with higher potentials are produced from
forestry extraction (37%) and soybeans (23%). Although forestry extraction residues have
least influence in the country’s totals, its representativeness in this region is quite
significant. In the Northeast, soybeans (25%) and sugarcane (24%) reveal the highest
residues bioenergy potentials. In the Southeast, sugarcane residues have the greater

72
potential among all crops (62%), followed by eucalyptus (24%). In South, the region with
major potential in the country, soybean (28%) and rice residues (21%) register major
contributions. It is noteworthy the influence of rice in the south bioenergy potential even
though this crop is not expressive to the country’s total potential. Figure 31 shows the
potentials divided by regions and crops in the country.
Figure 31: Bioenergy potential for each crop in country's regions.
Regarding the selected crops, soybeans and sugarcane register the major
contributions, corresponding together to 53% of the country’s potential. The total
potential for soybean residues is about 1.5 TJ, which are mostly concentrated in the
Midwest region (Figure 32). Sugarcane residues potential totalize 1.0 TJ, being more
expressive in the South-Central region of the country (Figure 33).

73
Figure 32: Soybean bioenergy potential distributed for each municipality.
Figure 33: Sugarcane bioenergy potential distributed for each municipality

74
The eucalyptus residues represent 16% of the country’s potential, followed by
maize (14%) and rice (9%). Eucalyptus residues potential is 631 PJ and municipalities
with highest values are localized in the state of Mato Grosso do Sul (Figure 34). Residues
from maize totalize 568,511 TJ of bioenergy, mostly concentrated in the Midwest
municipalities (Figure 35). Rice residues potential is 340,183 TJ and the South region,
especially the state of Rio Grande do Sul hosts municipalities with the largest potentials
(Figure 36).
Figure 34: Eucalyptus bioenergy potential distributed for each municipality

75
Figure 35: Maize bioenergy potential distributed for each municipality
Figure 36: Rice bioenergy potential for each municipality

76
Crops with less contribution are pinus, forestry extraction and wheat, representing
5%, 2% and 1% of the country’s bioenergy potential, respectively. Pinus and wheat
residues are mostly concentrated in the municipalities of South region (Figure 37 and
Figure 39), while forestry extraction residues are more expressive in the North region
municipalities (Figure 38).
Figure 37: Pinus bioenergy potential for each municipality

77
Figure 38: Forestry extraction bioenergy potential for each municipality
Figure 39: Wheat bioenergy potential for each municipality

78
The next step was the construction of kernel maps to evaluate bioenergy
dispersion in the territory. These maps are useful to assess the bioenergy intensity in the
country without restricting it to each municipality. Figure 40 shows the kernel map for
the total biomass energy potential from residues in Brazil. Areas with more intense colors
represent localities with higher bioenergy potential. Thus, this map emphasizes the
significance of southeast and south regions, which concentrate the major bioenergy
potential in the country, and especially the significance of São Paulo and Paraná states,
which host most of this bioenergy.
Figure 40: Kernel map for total biomass energy potential
In addition, the kernel maps were generated for each crop analyzed in this study.
Figure 41 below, shows the kernel map for bioenergy potential for the agricultural and
agro-industrial residues. As well as in the kernel map for total bioenergy potential, this
map indicates the energy concentration in the Southeast region, precisely in São Paulo
state.

79
Figure 41: Biomass energy density for agricultural and agro-industrial biomass residues
Analyzing the kernel maps of each crop individually, the same trend of bioenergy
concentration is observed as in the case of the maps with bioenergy potential for each
municipality presented above. Figure 41 and Figure 42 show the kernel maps for soybeans
and sugarcane bioenergy potentials, which indicate an energy concentration in the states
of Mato Grosso and São Paulo, respectively. For eucalyptus, Figure 44 shows the energy
concentration in the state of São Paulo. For maize, two localities with highest bioenergy
potential were identified and they are located in the states of Mato Grosso and Paraná
(Figure 45). Figure 46 shows the kernel map for bioenergy potential from rice residues,
which is most expressive in the state of Rio Grande de Sul. Figure 47, Figure 48 and
Figure 49 show the kernel maps for pinus, forestry extraction and wheat, respectively,
which are the crops with less contribution to the total bioenergy potential in the country.
Most expressive areas for these crops are the states of Santa Catarina, Acre and Paraná.

80
Figure 42: Kernel maps for soybeans bioenergy potential
Figure 43: Kernel maps for sugarcane bioenergy potential

81
Figure 44: Kernel map for eucalyptus bioenergy potential
Figure 45: Kernel map for maize bioenergy potential

82
Figure 46: Kernel map for rice bioenergy potential
Figure 47: Kernel map for pinus bioenergy potential

83
Figure 48: Kernel map for forestry extraction bioenergy potential
Figure 49: Kernel map for wheat bioenergy potential
The following step had the objective to identify the hotspots of bioenergy.
Defining hotspots is useful to determine areas with greater biomass potentials. A radius
of 100 km from these points was assumed to delimitate areas with greater potentials and
as a distance to biomass transportation. These areas represent localities with major
potential for biorefineries establishment. Figure 50 below, shows the procedure

84
performed to determine the energy hotspots (red point) and the potential areas using a
radius of 100 km. Next, the Figure 51 reveals the hotspots determined for each crop.
Figure 50: Determination of biomass hotspots
Figure 51: Biomass energy hotspots for each crop

85
Thereafter, the map above was overlaid by the map containing the Brazilian
municipal division, in order to identify which municipalities hosts each hotspot. This step
was performed for the total bioenergy potential and for each crop potential. A zoom was
made on the map, and the municipalities detected for each case listed (Figure 52). Table
20 shows the municipalities that contain the energy hotspots for each crop.
Figure 52: Zoom on kernel map
Table 20: Biomass potential hotspots for each crop
Hotspots
Crop Municipality State Potential (TJ)
Total Taiacu SP 2,202,410
Sugarcane Morro Agudo SP 75,676
Soybeans Sorriso MT 33,396
Maize Sorriso MT 19,359
Tupassi PA 20,452
Wheat Londrina PA 2,612
Rice Alegrete RS 32,455
Eucalyptus Angatuba SP 40,978
Pinus Porto União SC 26,472
Forestry extraction Porto Velho AC 2,759
Total agriculture and agro-
industrial
Morro Agudo SP 78,694

86
Then, the kernel map of total bioenergy potential containing the hotspot and the
area covered by the radius ok 100 km (Figure 50) was firstly overlaid by a layer containing
the main localities of jet fuel production, distribution and use (Figure 53). Next, the kernel
map was overlaid by layers containing biodiesel and ethanol plants and soybean oil
refineries, indicating localities with an existing infrastructure of fuel and feedstock
handling in the country (Figure 54). The analysis of these maps reveals the proximity
between biomass production and fuel handling and consumption areas in the state of São
Paulo.
Figure 53: Total bioenergy potential and important localities for jet fuel logistics

87
Figure 54: Total bioenergy potential hotspot and localities of biofuels and soybean oil production in Brazil
The same procedure described above was performed for each crop hotspot (Figure
55 and Figure 56). A zoom was made in the area with greater concentration of hotspots,
fuel handling and consumption localities for better observation of results (Figure 57 and
Figure 58). These results emphasize the relevance of southeast and south regions,
especially the São Paulo state, as potential areas for biojet production development in
Brazil. The development of biorefineries in these locations would benefit from the
proximity to the feedstock and existing infrastructure, reducing logistics issues and
transportation costs.

88
Figure 55: Biomass energy hotspots and important localities for jet fuel logistics

89
Figure 56: Biomass energy hotspots and localities of biofuels and soybean oil production in Brazil
Figure 57: Biomass energy hotspots and important localities for jet fuel logistics in Southeast and South regions

90
Figure 58: Biomass energy hotspots and localities of biofuels and soybean oil production in Southeast and South regions
On the other hand, results enable considering the establishment of biorefineries in
isolated locations that depends entirely of an external fuel supply. This is the case of
Brazilian Midwest region that does not have any oil refinery, being its jet fuel demand
fully supplied by the Southeast production. The region concentrates the greater bioenergy
potential from soybean and maize residues, accounting together for 52,8 PJ. Such
potential could be harnessed for local biojet production, providing fuel directly to the
Brasilia airport and reducing the external fuel dependence. In this case, the jet fuel supply
coming from the southeast region would be addressed to its internal market, reducing
necessity of importation. Figure 59 represents a zoom in from Figure 56, which reveals
the proximity between soybean and maize hotspots and Brasilia airport. In addition, the
production of biojet fuel from vegetable oils through HEFA route is also an option, due
to the presence of soybean oil refineries and biodiesel plants, indicating an existing
infrastructure in this area. However, the isolated localization adds issues regarding
hydrogen supply, a necessary input for HEFA production pathway.

91
Figure 59: Soybeans and maize energy hotspots and localities of biodiesel and soybean oil production in Midwest regions
5.2 Life cycle assessment results
The results of the environmental analysis performed in GREET model are
presented according to the life cycle stages of the fuel. Fuel life cycle is divided in well-
to-pump (WTP) and pump-to-wake (PTW) stages, which together form the well-to-wake
(WTW) fuel cycle. The WTP stage comprises the exploration and recovery activities from
feedstock harvesting to fuel production and transportation to terminals. The PTW stage
represents the fuel combustion during aircraft operation. Functional units chosen are MJ
for GHG emissions and fossil fuel consumption results. The aircraft model selected was
Large Twin Aisle (LTA), a type of passenger aircraft such as Boeing 747 and Airbus
A380. The choice of aircraft do not affect the final results.
Results for biojet pathways analyzed in this study indicate important life cycle
reduction in GHG emissions and fossil fuel consumption. Biojet from FT pathway from
wood residues had lower emissions and fossil fuel consumption than biojet from HEFA
pathway using soybeans. FT-SPK shows a reduction of 94% in GHG emissions and fossil
fuel consumption compared to the conventional jet fuel, while HEFA biojet from
soybeans registered reductions of 52% in GHG emissions and 69% in fossil fuel
consumption. Figure 60 shows the results of GHG emissions and Figure 61 shows the
results for fossil fuel consumption obtained in GREET for the fuels life cycles.
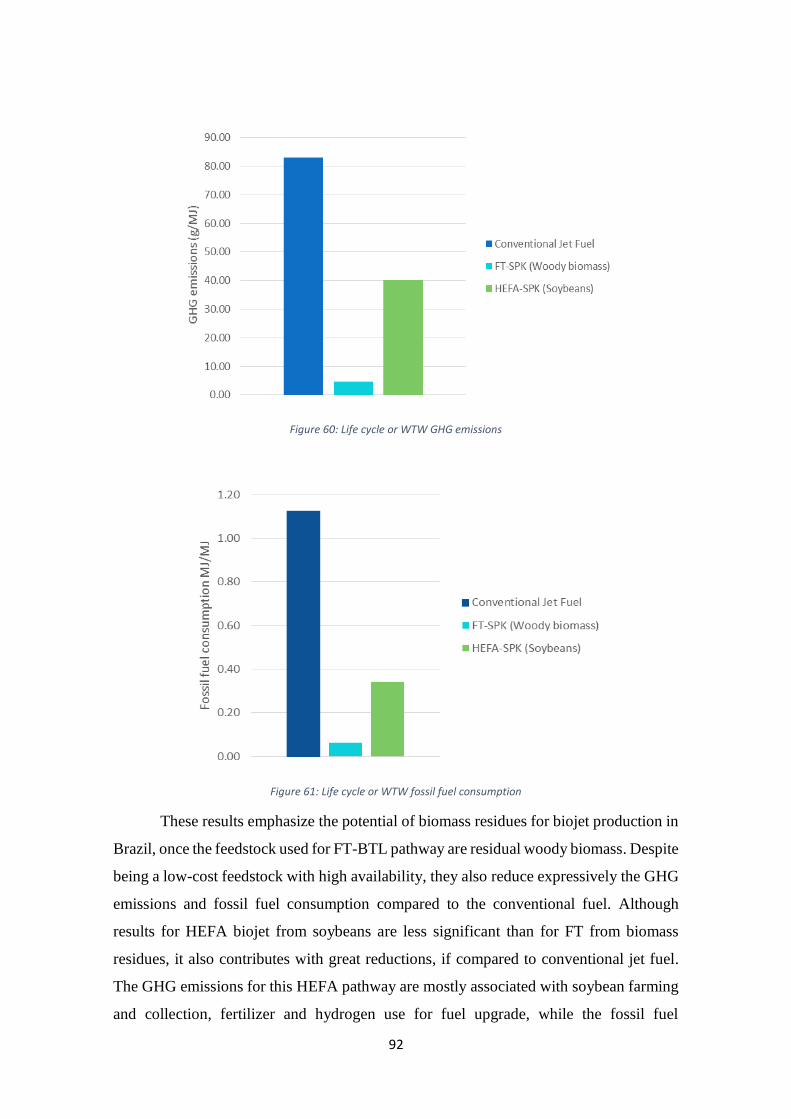
92
Figure 60: Life cycle or WTW GHG emissions
Figure 61: Life cycle or WTW fossil fuel consumption
These results emphasize the potential of biomass residues for biojet production in
Brazil, once the feedstock used for FT-BTL pathway are residual woody biomass. Despite
being a low-cost feedstock with high availability, they also reduce expressively the GHG
emissions and fossil fuel consumption compared to the conventional fuel. Although
results for HEFA biojet from soybeans are less significant than for FT from biomass
residues, it also contributes with great reductions, if compared to conventional jet fuel.
The GHG emissions for this HEFA pathway are mostly associated with soybean farming
and collection, fertilizer and hydrogen use for fuel upgrade, while the fossil fuel

93
consumption is related to diesel consumption in harvesting and transportation activities.
Moreover, this study considered the direct land use changes, which increase the GHG
emissions. However, if the allocation method in GREET is altered in a way that soy oil
is considered a sub-product instead of a co-product of soybean production, HEFA results
could be improved.
As mentioned above, the WTW results can be divided in WTP and PTW stages.
Figure 62 shows the contribution of the WTP and PTW stages to GHG emissions of
conventional and alternative jet fuels evaluated in this study, in grams per MJ of fuel. The
WTP results for the two alternative jet fuel pathways revealed negative values due to CO2
absorption from atmosphere in the growth phase of biomass through the photosynthesis
process. However, the CO2 captured during biomass growth can be offset by emissions
associated with energy use for biomass farming and collection, fertilizer and nitrogen use
in the agricultural stage and fuel upgrading step. As a result, the carbon sequestered in
biomass ends up in the fuel and returns to the atmosphere by the fuel combustion in
aircraft. Figure 63 shows the contribution of each stage for WTP emissions and the total
GHG emissions with the carbon offset. The PTW stage represents the emissions during
aircraft operation.
Figure 62: GHG emissions in WTP and PTW stages

94
Figure 63: Emissions from different activities in WTP stage and total GHG emissions with carbon offset
The fossil fuel consumption in WTP and PTW stages are shown in Figure 64. The
WTP stage of the conventional jet fuel consumes 0.12 MJ of fossil energy per MJ of fuel
produced, which is lower than the average of 0.20 MJ/MJ, for the biojet fuels analyzed.
The fossil energy consumption for the FT biojet was 0.06 MJ/MJ, while the consumption
for HEFA pathway was 0.34 MJ/MJ. Fossil fuel consumption in HEFA pathway is
mostly associated with diesel consumption in soybean harvesting and transportation
activities. The PTW stage represents the fossil energy consumed during aircraft operation.
As there are no fossil energy in biofuels, only the conventional jet fuel registered results
for this stage (1MJ/MJ).
Figure 64: Fossil fuel consumption in WTP and PTW stages

95
5.3 Techno-economic feasibility of biojet production routes
5.3.1 HEFA-SPK
This section presents the results obtained for the economic analysis of biojet fuel
production from HEFA and FT-BTL routes. Data include investment and O&M costs and
a sensitivity analysis to evaluate the parameters that contribute most to the biofuel price.
Main results found for HEFA biojet pathway are shown in Table 21, which also
contain the levelized costs of fuel (LCOF) obtained for each plant capacity in US$/L.
Table 21: HEFA biojet fuel costs
HEFA
Plant (A) Plant (B) Plant (C)
Plant Capacity (L/day) 348,531 697,061 1,045,592
Capital Costs (US$/yr) 64,976,703 86,635,604 101,074,871
Fixed O&M (US$/yr) 27,625,729 38,795,729 38,814,264
Variable O&M (US$/yr) 220,382,306 440,764,611 661,146,917
LCOF (US$/L) 2.22 2.07 2.05
Results reveal that variable O&M costs are the major contributor to HEFA
pathway costs. Annual operational costs for plant (A) totalize US$ 248 million. For plant
(B) these costs add up to US$ 480 million, while for plant (C) these values reach US$
700 million. The O&M costs are mostly related to feedstock purchase (57% to 59%)
followed by expenses with natural gas (25%-27%) and electricity (3%). Figure 65 shows
the contribution of capital costs, fixed and variable O&M costs to the LCOF. As the
variable O&M costs are the main components of fuel production costs, Figure 66 does
not include them for a better observation of the technology scale gains. For plant B, results
reveal a reduction of 38% in capital costs comparing to plant A, while for plant C this
reduction is of 48%.

96
Figure 65: Contributions to HEFA biojet LCOF
Figure 66: Contributions to HEFA biojet LCOF and technological scale gains.
The HEFA biojet levelized costs obtained for the three plant capacities were far
superior than the average jet fuel price in 2014 of 0.71 US$/L (INDEXMUNDI, 2016).
In this way, to evaluate the competitiveness of HEFA biofuels, different jet fuel prices
were calculated assuming a biomass transport distance of 100 km, different CO2 prices
and the GHG emission obtained in the LCA, whose results are presented in section 5.3.
These jet fuel prices represent the prices of the conventional fuel that turns the biofuel
competitive. Equation 2 (Eq. 2) shows the calculation made to determine the jet fuel
prices. Table 22 above shows the jet fuel prices obtained considering each plant capacity
for HEFA biojet production.

97
𝐶𝑏𝑖𝑜𝑗𝑒𝑡 − 𝐶𝑗𝑒𝑡 + $𝐶𝑂2(𝐸𝑏𝑖𝑜𝑗𝑒𝑡 − 𝐸𝑗𝑒𝑡) + $𝐶𝑂2
𝑥 𝐸𝑑𝑖𝑒𝑠𝑒𝑙 𝑥 𝑑 𝑥 𝜂𝑏𝑖𝑜𝑚𝑎𝑠𝑠 = 0 (𝐸𝑞. 2)
Where:
𝐶𝑏𝑖𝑜𝑗𝑒𝑡: Biojet fuel levelized cost (US$/l)
𝐶𝑗𝑒𝑡: Jet fuel price (US$/l)
$𝐶𝑂2: Carbon tax or CO2 price (US$/tCO2)
𝐸𝑏𝑖𝑜𝑗𝑒𝑡: Biojet fuel life cycle emissions (tCO2e/l)
𝐸𝑗𝑒𝑡: Conventional jet fuel life cycle emissions (tCO2e/l)
𝐸𝑑𝑖𝑒𝑠𝑒𝑙: Diesel emissions by medium and heavy duty trucks (tCO2e/t.km)
𝑑: Biomass transport distance (km)
𝜂𝑏𝑖𝑜𝑚𝑎𝑠𝑠: Biomass yield (%) (tbiomass/tfuel)
Table 22: Jet fuel determined prices for different HEFA biojet plant capactities.
Biomass transport
distance 100 km
Jet fuel prices (US$/L)
Plant A Plant B Plant C
CO2 prices
(US$/tCO2e)
0 2.22 2.07 2.05
10 2.19 2.05 2.03
50 2.09 1.94 1.92
100 1.96 1.81 1.79
150 1.83 1.68 1.66
200 1.70 1.55 1.53
The best scenario for the jet fuel price is for a CO2 price of US$200/tCO2e and
considering the plant with greatest production capacity, which leads to a jet fuel price of
US$1.53/tCO2. Even in the best case, the jet fuel price is greater than twice of jet fuel
2014 price (US$ 0.71/L). In this way, it is evident that even with technological scale gains
and application of mitigation measures such as carbon taxes, the insertion of HEFA biojet
fuels in the market would be challenging. To evaluate the difficulties regarding biofuel
competitiveness and propose measures to overcome them, this study performed a
sensibility analysis to identify the major contributors to the biofuel prices. Variables

98
evaluated include capital costs (CC), variable O&M costs (VOM), CO2 prices and
biomass transport distance. Variations of 10%, 25% and 50% in their values were
performed and the three HEFA biojet plant capacities evaluated. Figure 67 shows results
for plant capacity A, while Figure 68 and Figure 69 show results for plant capacities B
and C.
Figure 67: Sensibility analysis for HEFA biojet (plant A)
Figure 68:Sensibility analysis for HEFA biojet (plant B)

99
Figure 69: Sensibility analysis for HEFA biojet (plant C)
Results were similar for all plant capacities and the sensibility analysis confirms
the influence of variable O&M costs to the biofuel prices. Capital costs, CO2 prices and
biomass transport distance almost did not altered the fuel price. Variable costs for HEFA
production are high mostly due to the feedstock price (soybean oil), an edible oil with
high added value used also for biodiesel production in the country. Therefore, this poses
a major challenge to this technology, since soybean oil price is not directly driven by
technological advances in HEFA technology. It can only be indirectly affected through
improved performance resulting in less consumption of vegetal oil per biojet produced.
5.3.2 FT-SPK
Regarding FT-BTL pathway, results for capital and O&M costs and levelized
costs of fuel (LCOF) for each plant capacity are shown in Table 23 above.

100
Table 23: FT-BTL jet fuel costs
FT-BTL
Plant A Plant B Plant C Plant D
Plant capacity
(L/day) 127,190 158,987 397,468 1,589,873
Capital Costs
(Million
US$/yr)
148 173 322 834
Fixed O&M
(Million
US$/yr)
14 15 28 66
Variable O&M
(Million
US$/yr)
3 4 9 38
LCOF (US$/L)
(US$/yr) 0.89 0.82 0.61 0.47
Annual O&M costs for plant A are US$ 17 million, while for plant B, plant C and
plant D annual O&M totalize US$ 19 million, US$ 37 million and US$ 104 million,
respectively. Majority of variable operational costs are related to biomass transportation
(53% to 59%). Figure 70 shows the contribution of capital and O&M costs for the FT-
SPK levelized costs. Differently from the HEFA route, for FT-BTL the capital costs are
the major influencer in the LCOF. Also, in Figure 70 the scale gains can be clearly
observed. In relation to plant A, fuel levelized costs registered a 8% reduction for plant
B, 30% for plant C and 45% for plant D. The scale gains become evident by comparing
plant A and plant D. The production capacity increases 12 times in plant D in relation to
plant A, with a reduction of almost 50% in the fuel levelized cost.

101
Figure 70: Costs components and technological scale gains for FT-BTL pathway
Results for FT-BTL biojet fuel reveal important technological scale gains. Plants
with greater capacities (plant C and plant D) registered lower fuel levelized costs than the
2014 jet fuel average prices of 0.71 US$/L (INDEXMUNDI, 2016). Lower capacity
plants (plant A and plant B) had slightly higher levelized costs than the 2014 jet fuel price.
However, even with the technological scale gains described above, the jet fuel prices that
turns the FT-BTL fuels competitive were determined, as performed for HEFA pathway
using equation 2 (Eq. 2). It was assumed a biomass transport distance of 100 km, different
CO2 prices ranging from 0 to 200 US$/tCO2 and the GHG emissions obtained in the LCA
presented in section 5.3. Table 24 shows the jet fuel prices achieved according to each
plant capacity fof FT-BTL biojet fuel.
Table 24: Jet fuel determined prices for different FT-BTL plant capacities
Biomass transport distance
100 km
Jet fuel prices (US$/L)
Plant A Plant B Plant C Plant D
CO2 prices
(US$/tCO2e)
0 0.89 0.82 0.61 0.47
10 0.86 0.79 0.59 0.45
50 0.75 0.68 0.48 0.34
100 0.62 0.54 0.34 0.20
150 0.48 0.41 0.21 0.07
200 0.35 0.27 0.07 -

102
Determining these jet fuel prices was useful to evaluate the competitiveness of biojet fuel
produced by plants with lower capacities. Results in table 24 show that FT-BTL biojet
fuel from plant B becomes competitive with a CO2 price up to US$ 50/tCO2 that leads to
a jet fuel price of US$0.68/L, lower than the 2014 prices. Regarding biojet fuel from plant
A, a carbon price between US$ 50-100/tCO2 makes the biofuel competitive, with a jet
fuel price of US$0.62/L, lower than the 2014 price. Therefore, these results indicate that
technological scale gains and application of mitigation measures, such as carbon taxes,
are capable of promoting biofuel competitiveness in the near future. However,
optimization in the technological process is required for large-scale plants, which would
also face economic challenges due to high investment costs.
As for the HEFA pathway, a sensibility analysis was performed to identify most
influential factors to the biofuel prices. The same parameters (CC, VOM, CO2 prices and
biomass transport distance) were evaluated from variations of 10%, 25% and 50% in their
values. The four plant capacities for FT-BTL biojet fuel production were considered.
Figure 71 shows the result for plant capacity A, while Figure 72, Figure 73 and Figure 74
show results for plant B, plant C and plant D, respectively.
Figure 71: Sensibility analysis for FT-BTL biojet fuel (plant A)

103
Figure 72: Sensibility analysis for FT-BTL biojet fuel (plant B)
Figure 73: Sensibility analysis for FT-BTL biojet fuel (plant C)
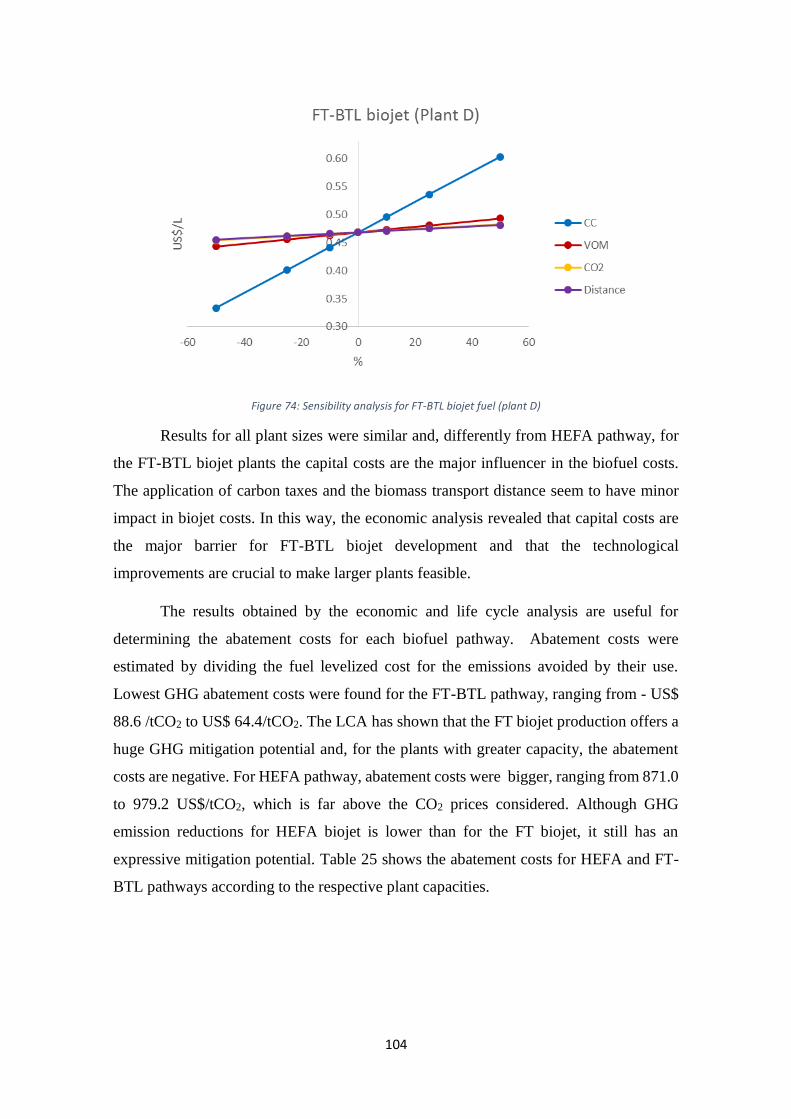
104
Figure 74: Sensibility analysis for FT-BTL biojet fuel (plant D)
Results for all plant sizes were similar and, differently from HEFA pathway, for
the FT-BTL biojet plants the capital costs are the major influencer in the biofuel costs.
The application of carbon taxes and the biomass transport distance seem to have minor
impact in biojet costs. In this way, the economic analysis revealed that capital costs are
the major barrier for FT-BTL biojet development and that the technological
improvements are crucial to make larger plants feasible.
The results obtained by the economic and life cycle analysis are useful for
determining the abatement costs for each biofuel pathway. Abatement costs were
estimated by dividing the fuel levelized cost for the emissions avoided by their use.
Lowest GHG abatement costs were found for the FT-BTL pathway, ranging from - US$
88.6 /tCO2 to US$ 64.4/tCO2. The LCA has shown that the FT biojet production offers a
huge GHG mitigation potential and, for the plants with greater capacity, the abatement
costs are negative. For HEFA pathway, abatement costs were bigger, ranging from 871.0
to 979.2 US$/tCO2, which is far above the CO2 prices considered. Although GHG
emission reductions for HEFA biojet is lower than for the FT biojet, it still has an
expressive mitigation potential. Table 25 shows the abatement costs for HEFA and FT-
BTL pathways according to the respective plant capacities.

105
Table 25: Abatement costs for biojet fuel pathways
Biojet
pathways
HEFA FT-BTL
Plant
A
Plant
B
Plant
C
Plant
A
Plant
B
Plant
C
Plant
D
Plant
Capacity
(L/day)
348,531 697,061 1,045,592 127,190 158,987 397,468 1,589,873
LCOF
(US$/L) 2.22 2.07 2.05 0.89 0.82 0.61 0.47
Emissions
Reduction
(tCO2/L)
0.002 0.003
Abatement
Costs
(US$/tCO2)
979.20 883.87 870.96 64.44 37.95 -36.43 -88.56
5.4 Discussion
This section aims to combine and discuss the results obtained and presented in the
previous sections to assess the Brazilian potential of biojet production.
The assessment of feedstock availability revealed an expressive biomass potential
in the country, especially in the southeast region and in São Paulo state. The development
of biorefineries in these locations would benefit from the proximity to the feedstock and
existing infrastructure, reducing logistics issues and transportation costs. The total energy
from biomass residues would be more than enough to feed the FT-BTL plants for biojet
production. With this total bioenergy, it would be possible to produce an amount of biojet
42% superior than the southeast demand per year. Further, even the bioenergy estimated
for each crop in their defined hotspots would be sufficient to feed the conversion plants.
Table 26 shows the bioenergy estimated in each crop hotspot and the energy required for
each plant capacity for FT-BTL route. Table 27 shows the energy for hotspots located in
the Southeast, an estimate of biojet production from each one and a comparison with the
jet fuel demand in the region. This comparison indicates that the amount of biojet

106
produced from biomass residues in these localities would be suitable to compose the 50%
blends with the conventional fuel. However, these estimates were based in the conversion
yields for FT-BTL route based in Elia et al. (2013) that considered forest residues as
feedstock. The utilization of other biomass residues would lead to different conversion
yields for biojet production. It occurs due to the distinct nature of biomass residues that
alter the technical performance of gasification and conversion processes.
Table 26: Bioenergy from biomass residues for each crop and energy inputs for FT-BTL pathway
Hotspots FT-BTL
Crop State Potential (TJ) Biomass input per year (TJ)
Total (All crops) SP 2,202,410 Plant A 1,400
Sugarcane SP 75,676 Plant B 1,750
Soybeans MT 33,396 Plant C 4,375
Maize MT 19,359 Plant D 17,498
PA 20,452
Wheat PA 2,612
Rice RS 32,455
Eucalyptus SP 40,978
Pinus SC 26,472
Forestry extraction AC 2,759
Total agriculture and
agro-industrial
SP 78,694
Table 27: Bioenergy and biojet production with residues in the Southeast region
Hotspots in
Southeast
Region
Potential
(TJ/year)
Biojet
production
(million L/year)
Southeast Jet
fuel demand
(million L/
year)
Biojet production
/ Southeast jet fuel
demand
Total
(All crops)
2,202,410 6,663 4,700 1.49
Sugarcane 75,676 2,289 0.49
Eucalyptus 40,978 1,240 0.26
On the other side, HEFA route would benefit from biomass potential in the
Midwest region that concentrates soybean and maize (oilseed feedstocks) bioenergy

107
hotspots and hosts soybean oil refineries and biodiesel plants, indicating an existing
industrial infrastructure in this place. In addition, the local concentration of soybean and
maize residues would benefit the feedstock supply over the year and diminish issues
regarding biomass storage, due to the seasonality of these crops. Figure 75 shows the
production profile of these crops over the year and reveals their complementarity.
Figure 75: Soybean and maize annual production profile
Further, this study assessed potential localities with an existing infrastructure that
would benefit biomass harvesting and logistics, but did not evaluate their specific issues
that may alter the fuel production costs. First, the method to collect the biomass residues
in the field was not defined. This decision requires the analysis of some variables such as
which technology to use, the maximum amount allowed for harvesting, energy
consumption, among others. These variables lead to uncertainties on biomass production,
which may increase feedstock costs due to premium risk payments to the farmers
(OLIVEIRA, 2011). Second, this study did not define in which way the residues would
be stored. Biomass storage aims to ensure a continuous supply of feedstock and smooth
seasonality. Different storage methods are available and all of them present losses, given
different feedstock nature, time and storage conditions (OLIVEIRA, 2011). Finally, the
possibility of biomass pretreatment may reduce logistic costs if performed prior to
transport and storage. This process aims to produce a higher energy density feedstock,
improving the transport and conversion conditions. For this reason, the definition of
potential conversion localities was given according to the density of production and the
existing infrastructure in the country.

108
Regarding the life cycle analysis, both HEFA and FT-BTL pathways revealed
important reductions in GHG emissions and fossil fuel consumption indicating that the
country could produce biofuels that reduce the environmental impacts from aviation. All
evaluated biojet routes show a fossil fuel dependence inferior then 1, which reinforces the
fact that these fuels are derived from a renewable source. Results obtained in this study
were compared with another LCA of biofuels for aviation available in literature. Stratton
et al. (2010) and Elgowainy et al. (2012) performed a LCA in GREET model for
alternative aviation fuels, while Bailis et al. (2010) analyzed the GHG emissions and LUC
from jatropha curcas-based jet fuel in Brazil.
Likewise in this study, Elgowainy et al. (2012) found increased fossil fuel
consumption in the WTP stage for alternative fuels. In their work, the conventional jet
fuel registered a fossil consumption of 0.18 MJ/MJ, while results for FT-BTL and HEFA
were 0.70 MJ/MJ and 0.25MJ/MJ. Regarding GHG emissions, results found from
Elgowainy et al. (2012) revealed a reduction of 70% and 85% for HEFA and FT-BTL
biojet fuels in relation to the conventional fuel, respectively. Stratton et al. (2011) found
reductions in GHG emissions of 58% for HEFA from soybeans with no LUC and 80%
from FT-BTL from forest residues. In addition, they modelled a scenario considering
LUC for soybean production and results indicate an increase of 12% in GHG emissions
for HEFA biojet in relation to the conventional jet fuel. The LUC considered was
associated with the conversion of grassland to soybean fields, while this study considered
LUC from savannah (cerrado) conversion to soybean fields. Bailis et al. (2010) performed
a LCA for biojet fuels in Brazil. However, the feedstock chosen for the HEFA pathway
was the bio-oil from jatropha curcas. The results obtained with no LUC considerations
revealed a reduction of 55% in GHG emissions compared to the conventional jet fuel.
However, when LUC from savannah conversion to soybean fields were considered, the
results indicate an increase of 60% in GHG emissions in relation to the conventional fuel.
Table 28 and Figure 76 compare the results for GHG emissions of alternative fuels from
the studies cited above and from the present study.

109
Table 28: GHG emissions for different biojet LCA studies
GHG emissions (g/MJ)
This study
HEFA (Soybeans)
(LUC) 40.09
FT-BTL
(Forest residues) 4.72
Stratton et
al (2010)
HEFA(Soybeans)
(NO LUC) 37.00
HEFA(Soybeans) (LUC) 97.80
FT-BTL
(Forest residues) 12.20
Bailis et al.
(2010)
HEFA (Jatropha)
(NO LUC) 40.00
HEFA (Jatropha) (LUC) 141.00
Figure 76: GHG emissions for different biojet LCA studies
The choice of allocation methods in GREET can significantly impact on the LCA
results, as discussed in Huo et al. (2008) and Han et al. (2014). For fuels derived from
vegetable-oils, the results can be affected by the co-product handling method because: (i)
co-products are produced in two separate processes and (ii) a large amount of meals is
produced during oil extraction. Since the production of soybean based fuels generates

110
various co-products, including protein soymeal, glycerin and energy products as propane
fuel mix and heavy oils, addressing credits for each of them is quite difficult (H. HUO,
M. WANG, C. BLOYD, 2008). This study chose an energy-based allocation method as
the hydrotreating process coproduce hydrocarbon fuels. The choice of a mass-based-
allocation method to deal with co-products would be considered because: (i) an energy-
based allocation is not representative for meals, since they are not energy products, and
(ii) mass is not subject to fluctuations as in the case of market-based-allocation. The
market allocation method is based on the market values of the primary products and co-
products and, as these values vary by region and over time and biojet fuel is not already
in the market, this method would not be suitable for this analysis (HAN et al., 2014).
Some points regarding the environmental sustainability of the biofuels assessed
should be highlighted. First, in relation to HEFA pathway, the competition for resources
may compromise its environmental performance and threat country’s biodiversity, as
soybeans has already important uses in the country. The expansion of soybean cropland
and castle pastures, pushed mainly by the higher demand for biofuels (biodiesel),
contributes to increase the pressure on the Brazilian savannah (cerrado) and the Amazon
forest, ensuing in indirect and direct land use changes and impacting climate change
(PORTUGAL; KOBERLE; SCHAEFFER, 2016). However, as discussed in Rathmann et
al. (2010) and Rathmann et al. (2012), the relation between land use and agro-energy and
biofuels production are extremely complex being influenced by endogenous and
exogenous variables (RATHMANN; SZKLO; SCHAEFFER, 2010, 2012). Stimulating
biojet development would require an expansion in soybean production, either by
replacing other crops or expanding to marginal areas, leading to environmental and social
impacts. Uncertainties regarding the land use change factors used are explained by the
intrinsic complexity in land use dynamics driven by agro-energy production. In principle,
arable lands converted to soybean cropland do not lead to direct deforestation, while its
production in marginal lands may induce the removal of native soil vegetation. Prudêncio
et al (2010) assessed the land use change due to soybean cropland in Brazilian savannah
and considered that 3.4% of soybean cropland areas were derived from savannah, without
distinguish arable and marginal lands. As GREET model also do not require this kind of
distinction, this study used this factor as an average representation of the portion of
soybean cropland derived from savannah.

111
Second, some environmental indicators, such as water footprint, were not
assessed. The substitution of fossil fuels by biofuels requires an increase in agricultural
production, which requires large fresh water demands. Depending on the location, crop
and growing conditions, the water requirements in farming stage vary significantly
(GERBENS-LEENES; HOEKSTRA; VAN DER MEER, 2009). This is another reason
that makes the utilization of biomass residues so advantageous, as it does not require an
increase in agricultural production, besides being highly available in the country.
However, for both pathways, additional water is also required in the conversion processes
as, for example, reforming reactions and hydrogen production, which increases the water
consumption in the biofuel life cycles (BERNDES, 2002).
The economic analysis results indicate that biojet fuels from the HEFA and FT-
BTL pathways are yet to be competitive and only the FT-BTL plants with greater
capacities reached competitiveness with the conventional jet fuel. However, due to the
absence of taxation for jet fuel, an increase in oil prices directly reflects the cost of jet
fuel for airline companies (EUROPEAN PARLIAMENT, 2009). This direct correlation
becomes evident by analyzing the annual variations in oil and jet fuel prices in the past
years. Figure 77 presents the historical European Brent Spot and U.S Kerosene-type jet
fuel prices between 2000 and 2015 according to U.S Energy Information and
Administration data (EIA, 2016a, 2016b). Jet fuel has seen its mark-up over crude oil
prices rising from US$ 0.03/L in 2002 to US$ 0.20/L in 2008. Also, IATA assumes jet
fuel prices will remain 24% higher than crude oil prices in the medium-term
(EUROPEAN PARLIAMENT, 2009). The fluctuations in oil prices and the high
sensitivity of jet fuel prices add uncertainties regarding fuel prices and represent an
opportunity for alternative fuels to become more competitive. Also, in view of the
agreements already defined by the aviation industry, which is committed to reduce GHG
emissions and develop alternative sustainable fuels, the competitiveness must actually
take place between the biofuels, so that the most suitable production route is chosen. In
this way, the different aspects that challenge each route development should be identified,
so that the one with major potential of development according to local conditions is
selected.

112
Figure 77: Historical crude oil and jet fuel prices
The HEFA fuel economic analysis revealed high fuel levelized costs, even for
plants with large production capacity. The high fuel costs are mainly associated with the
feedstock costs, as soybeans oil is a high value product with another competitive uses.
Soybean is a valuable commodity and its price is strongly correlated with the amount of
protein of soybean meals used in livestock feed. In the last decade, the increased demand
for meat, partly driven by emerging economies in Asia, has ramped up the market price
of soybeans. Soybean oil itself is just as expensive as jet fuel and other energy uses, for
instance for biodiesel production, may also increase its price. In addition, biodiesel use in
Brazil will increase to 10 percent in 2019, which would compromise the soybean oil
availability (ANP, 2016b; USDA, 2016). The utilization of residual oils and fats, as used
cooking oil (UCO) and tallow would diminish issues related to feedstock expenses.
However, these feedstocks require additional pre-treatment processes, which may
increase the capital costs.
Regarding FT-BTL pathway, for plants with large capacities, the biofuel
registered lower levelized costs than the conventional jet fuel. The economic analysis
revealed high capital costs, which is the main challenge to its development. The high
CAPEX is mainly associated with biomass gasification units, a complex process that
requires optimization for large-scale developments. In this way, substantial efforts should
be conducted to optimize the process in order to reduce the capital costs. As the most
suitable feedstock for this process is lignocellulosic biomass, the utilization of biomass

113
residues, which is a low-cost feedstock with high availability in Brazil, enhance its
feasibility in the country.
The economic analysis performed relies on a nth plant estimate or nth of a kind
(NOAK), which considers a mature and well-established technology available at
commercial scale. This kind of evaluation tends to underestimate the capital costs and
overestimate the plant performance if compared with values observed for first-of-a kind
plants (FOAK) (DE JONG et al., 2015; MERROW; PHILLIPS; MYERS, 1981;
MORRISON et al., 2016). According to de Jong et al. (2015), as biojet fuel production is
a novel industry, pioneer plants estimates seem more appropriate to assess the short-term
economic feasibility of biojet production pathways. Also, their study considered that the
integration between industrial processes would reduce biojet fuel costs. This integration
could be established through four degrees based on greenfield, co-locating, retro-fitting
and repurposing strategies. Their results found a reduction of 4%-8% for nth plants and 5-
8% for pioneer plants by adoption of co-production strategies. For FT-BTL biojet, they
found that total capital investment for pioneer plants would be 2.2 times higher than for
NOAK plants (DE JONG et al., 2015).

114
6. Conclusion
This study sought to evaluate the technical and economic potential for biojet
production in Brazil and determine potential localities for its production in the country.
Further, the competitive opportunities for a growing market have been assessed and the
cost effectiveness of different technological routes identified. To this end, indicators like
feedstock availability, technological development of production routes, levelized costs of
production, dependence on fossil fuels and GHG emissions were developed. The crops
considered to determine feedstock potential were soybeans, sugarcane, maize, wheat,
rice, eucalyptus, pinus and forest residues. Among different available production routes,
the Fischer-Tropsch Biomass-to-liquids (FT-BTL) and Hydroprocessed Esters and Fatty
Acids (HEFA) pathway were chosen given their technological maturity and approval by
ASTM specifications. Then, their environmental performance were evaluated through a
life cycle analysis performed in GREET model.
Feedstock availability analysis revealed that besides being relatively inexpensive,
the biomass residues are widely available in the country and totalized an expressive
energy potential (3,932 PJ/year). This potential is mainly concentrated in the South,
Southeast and Midwest regions, and residues from sugarcane and soybeans showed major
contribution among all the crops analyzed. The software QGIS were useful to evaluate
the energy distribution in each municipality. The most energy-intensity localities were
identified through the construction of kernel maps, which emphasized the significance of
South and Southeast regions, especially the São Paulo state that hosts most of this energy.
These maps were useful to define the bioenergy hotspots considering each crop
individually and the total biomass residues. Their analysis revealed that São Paulo state
contains four bioenergy hotspots. Further, it also concentrates important localities of jet
fuel production, distribution and use as well as an established infrastructure of feedstock
handling for biofuels production. Alternatively, the establishment of biorefineries in
isolated locations is also a possibility in the country. This is the case of Midwest region,
which concentrates the greater bioenergy potential from soybean and maize residues and
depends of external jet fuel supply. Bringing together the results obtained in the feedstock
availability analysis, the expressive potential for biojet production in Brazil is confirmed,
being São Paulo state the most expressive location for a biorefinery establishment.

115
The LCA performed in this study revealed important reductions in GHG
emissions and fossil fuel consumption, as the two alternative fuels evaluated showed
considerable reductions. The best case was for FT pathway from forest residues, with a
94% reduction in GHG emissions and fossil fuel consumption in relation to conventional
jet fuel. The HEFA route totalized a reduction of 52% in GHG emissions and 69% in
fossil fuel consumption. The GHG emissions from HEFA pathway are mostly associated
with soybean farming and collection, fertilizer and hydrogen use for fuel upgrade, whilst
fossil fuel consumption is related to diesel consumption in harvesting and transportation
activities. Furthermore, both biojet pathways evaluated registered fossil fuel consumption
below 1MJ/MJ, which reinforces that these fuels are, in fact, renewables. Comparing the
results with other studies that performed a LCA for biojet production in other localities
were useful to confirm the advantages for biojet production in Brazil. However, important
environmental indicators such as impacts in biodiversity and water usage were not
considered, which may compromise the sustainability of these biofuels.
Results of the economic analysis indicate that biojet fuels from the HEFA and FT-
BTL pathways are yet to be competitive with the conventional jet fuel, being
advantageous only for the FT-BTL route with greater capacities and considering NOAK
plants. Levelized costs for FT-BTL biojet vary from US$ 0.47/L to US$ 0.89/L according
to four different plant capacities that produce from 42 to 529 million liters per year.
Expressive technological scale gains were observed for plants with greater capacities;
however, the high capital costs are the major barrier to their development. The application
of carbon taxes increases the competitiveness of fuels produced by lower capacity plants.
In addition, a great advantage of this pathway is the possibility of using biomass residues
as feedstock, a low cost resource widely available in Brazil. Results for HEFA biojet vary
from US$ 2.05/L to US$ 2.22/L for plants producing 116 to 348 million liters per year.
These costs are mostly driven by feedstock expenses, as soybean oil is a valuable product
with another competitive uses. In this way, the utilization of residual oils and fats
represent an opportunity to reduce feedstock costs. Even the application of carbon taxes
varying from 50 to 200 US$/tCO2 were not enough to make the HEFA biojet competitive.
Nevertheless, uncertainties regarding the jet fuel price, which is strongly correlated with
the crude oil price, may offer a competitive opportunity for the aviation biofuels. In
addition, as the aviation industry is committed with the development of alternative

116
sustainable biofuels, diverse incentives are expected to encourage its development in the
near future.
In view of the results presented above, it is remarkable that Brazil has great
comparative advantages to establish a growing market for biojet fuel production. The
country is capable to produce great amount of biomass residues that provide enough
energy to feed biojet fuel production facilities. Assessing the dispersion of these energy
resources in the country indicated an expressive concentration in the state of Sao Paulo,
which also hosts important localities of fuel production, distribution and consumption as
well as feedstock handling. In addition, the country’s technical experience in agriculture
and industry makes it an attractive environment to begin a biojet fuel industry worldwide.
Considering the use of biomass residues for the fuel production eliminates concerns
regarding food security and land availability. Further, it should be noticed that there is
not an exclusive and ideal feedstock to produce this biofuel in Brazil. This is the reason
why this study evaluated the total bioenergy potential from residues of all crops selected.
Using a mixture of different feedstock ensures adequate availability and scale production.
Furthermore, beyond the great feedstock availability in Brazil, the biofuels produced
according to the country’s conditions registered expressive reductions in GHG emissions
and fossil fuel consumption. In this way, is seems that the most critical feature hampering
a growing market for biojet fuel is the economic feasibility for its production. Efforts in
R&D are essential to promote the viability of sustainable production pathways, especially
the pioneer ones such as the FT-BTL.
Despite the efforts to conduct an accurate analysis of biojet fuel potential in Brazil,
this study presents limitations that should be revised in future works to enhance results
reliability. First, regarding the evaluation of bioenergy potential, the residue to product
ratio and residue removal ratio are site specific and should be adjusted to Brazilian
farming characteristics, instead of being assumed according to theoretical values. The
density of residues was considered uniform in each municipality when, actually, they are
heterogeneously concentrated. The biomass transport distance of 100 km was considered.
However, this distance may be affected by logistic and infrastructure limitations. Still,
some issues associated with biomass residues harvesting and logistics such as, collection
method, storage and pretreatment were not considered. Secondly, limitations of the
environmental analysis is that some sustainability indicators like water usage and impacts
in biodiversity were not evaluated and the distribution activities of biojet fuels were not

117
considered, which may affect their environmental performance. Also, the choice of
different allocation methods in GREET model can improve LCA analysis results. Thirdly,
the reforming of naphtha, a co-product of both HEFA and FT-BTL pathways, is a
possibility that was not proposed. This process produces hydrogen, which is an essential
input for fuel upgrading, and/or aromatics that would be useful to compose a 100% biojet
fuel blend. Additionally, the cost estimates for biojet production pathways relies on
literature data that are not based in Brazilian conditions, as these technologies are not
available in the country yet. These estimates also relies on nth of a kind plant, which may
underestimate the capital costs and overestimate its performance. Finally, only two
production pathways were assessed. The ATJ and STJ routes may be relevant in view of
the fact that the country already has a well-established ethanol production from biomass.
Also, considering future changes in urban mobility, in which ethanol may lose its market
in the automotive transport, it may be available to feed biojet fuel plants.

118
7. References
ABRAF. Anuário EstatísticoBrasília, 2013. Disponível em:
<http://www.ipef.br/estatisticas/relatorios/anuario-ABRAF13-BR.pdf>
AMYRIS. Products. Jet fuel. Disponível em: <https://amyris.com/products/fuels/>.
Acesso em: 5 ago. 2016.
ANAC. Anuário do transporte aéreo 2014. Brasília: [s.n.]. Disponível em:
<https://www.anac.gov.br/assuntos/dados-e-estatisticas/dados-do-anuario-do-transporte-
aereo>.
ANEEL. Relatório SAS. [s.l: s.n.]. Disponível em:
<http://relatorios.aneel.gov.br/_layouts/xlviewer.aspx?id=/RelatoriosSAS/RelSampReg
CC.xlsx&Source=http://relatorios.aneel.gov.br/RelatoriosSAS/Forms/AllItems.aspx&D
efaultItemOpen=1>.
ANGELIS-DIMAKIS, A. et al. Methods and tools to evaluate the availability of
renewable energy sources. Renewable and Sustainable Energy Reviews, v. 15, n. 2, p.
1182–1200, 2011.
ANP. Nota técnica n°207/ SAB. Formação e manutenção de estoques semanais
médios de querosene de aviação pelo produtor/importador e distribuidor. [s.l: s.n.].
ANP. Anuário estatístico brasileiro de petróleo e gás natural e biocombustíveis
2015. Rio de Janeiro: [s.n.]. Disponível em: <www.anp.gov.br>.
ANP. Anuário Estatístico Brasileiro do Petróleo, Gás Natural e Biocombustíveis
2016. Rio de Janeiro: [s.n.]. Disponível em:
<http://www.anp.gov.br/wwwanp/images/publicacoes/Anuario_Estatistico_ANP_2016.
pdf>.
ANP. Biodiesel. Disponível em:
<http://www.anp.gov.br/wwwanp/biocombustiveis/biodiesel>. Acesso em: 27 dez.
2016b.
ARA. Biofuels ISOCONVERSION. Applied Research Associates Inc. Disponível
em: <https://www.ara.com/products/biofuels-isoconversion>. Acesso em: 20 ago. 2016.
ATAG. Beginner ’ s Guide to Aviation Efficiency. Air Transport Action Group.
Aviation, n. November, 2010a.
ATAG. Beginner ’ s Guide to Aviation Efficiency. Aviation, n. November, 2010b.
ATAG. Facts & Figures. Air Transport Action Group. 2014.
ATAG. Facts and Figures. Air Transport Action Group. Disponível em:
<http://www.atag.org/facts-and-figures.html>. Acesso em: 20 jun. 2016.
ATAG. Facts & Figures. Disponível em: <http://www.atag.org/facts-and-
figures.html>. Acesso em: 20 jul. 2016.
AUGUSTO, L.; NOGUEIRA, H. The Evolution of Fuel Quality in Brazil. Rio de
Janeiro: [s.n.]. Disponível em: <www.anp.gov.br>.
BAILIS, R. E.; BAKA, J. E. Greenhouse Gas Emissions and Land Use Change from

119
Jatropha Curcas -Based Jet Fuel in Brazil. Environmental Science and Technology, v.
44, n. 22, p. 8684–8691, 2010.
BAUEN, A. et al. Review of the potential for biofuels in aviation: Final report For
CCC. Fuel, n. 284, p. 6021–6025, 2009.
BEA. Bureau of economic analysis. Implicit price deflators for gross domestic
product. Disponível em:
<http://bea.gov/iTable/iTable.cfm?reqid=9&step=3&isuri=1&903=13#reqid=9&step=3
&isuri=1&904=2011&903=13&906=a&905=1000&910=x&911=0>. Acesso em: 5 jul.
2016.
BENTSEN, N. S.; FELBY, C.; THORSEN, B. J. Agricultural residue production and
potentials for energy and materials services. Progress in Energy and Combustion
Science, v. 40, p. 59–73, 2014.
BERNDES, G. Bioenergy and water - The implications of large-scale bioenergy
production for water use and supply. Global Environmental Change, v. 12, n. 4, p.
253–271, 2002.
BHATTACHARYA, S. C. et al. An assessment of the potential for non-plantation
biomass resources in selected Asian countries for 2010. Biomass and Bioenergy, v. 29,
n. 3, p. 153–166, 2005.
BLOMMEL, P. G.; CORTRIGHT, R. D. Production of Conventional Liquid Fuels from
Sugars. Energy, v. August 25, n. 1319, p. 1–14, 2008.
BNDES. Fundo Clima - Energias renováveis. Disponível em:
<http://www.bndes.gov.br/wps/portal/site/home/financiamento/produto/programa-
fundo-clima/fundo-clima-energias-renovaveis/!ut/p/z0/hZBBT8JAEIV_C4cem11qS-
BYiLFCiSiS1L2QoWzbwXa27C5V_73bRhMTid7mZWbe92aYYBkTBB2WYFER1E
6_iMl-OU0XySzk6V2wnfB48zi-SZ52wXQXsSUTbiCdrW>. Acesso em: 10 out. 2016.
CANTARELLA, H. et al. Potential feedstock for renewable aviation fuel in Brazil.
Environmental Development, v. 15, p. 52–63, 2015.
CANTO, J. L. DO. Colheita mecanizada de biomassa florestal para energia. Tese
D.Sc.—[s.l.] Universidade Federal de Viçosa, 2009.
CAPAZ, R. S. Estudo do desempenho energético da produção de biocombustíveis:
Aspectos metodológicos e estudo de caso. Dissertação M.Sc.—[s.l.] Universidade
Federal de Itajubá, 2009.
CAVALETT, O.; ORTEGA, E. Integrated environmental assessment of biodiesel
production from soybean in Brazil. Journal of Cleaner Production, v. 18, n. 1, p. 55–
70, 2010.
CEDERHOLM, T. Market Realist. Fuel costs put brazilian airlines at competitive
disadvantage. Disponível em: <http://marketrealist.com/2014/12/fuel-costs-put-
brazilian-airlines-competitive-disadvantage/>. Acesso em: 19 jul. 2016.
CONAB. Acompanhamento da safra brasileira - Grãos. Safra 2015/16. n. safra 2015,
2016.
CORNELISSEN, S.; KOPER, M.; DENG, Y. Y. The role of bioenergy in a fully
sustainable global energy system. Biomass and Bioenergy, v. 41, p. 21–33, jun. 2012.

120
CORTEZ, L. A. B. et al. Roadmap for sustainable aviation biofuels for Brazil — A
Flightpath to Aviation Biofuels in Brazil. [s.l.] Editora Edgard Blücher, 2014.
CRC. Handbook of Aviation Fuel Properties. Atlanta: Society of Automotive
Engineers, Inc., 1983. Disponível em:
<http://www.dtic.mil/dtic/tr/fulltext/u2/a132106.pdf>.
CREMONEZ, P. A. et al. Biofuels in Brazilian aviation: Current scenario and prospects.
Renewable and Sustainable Energy Reviews, v. 43, p. 1063–1072, 2014.
CREMONEZ, P. A. et al. Environmental, economic and social impact of aviation
biofuel production in Brazil. New Biotechnology, v. 32, n. 2, p. 263–271, 2015.
DE JONG, S. et al. The feasibility of short-term production strategies for renewable jet
fuels - a comprehensive techno-economic comparison. Biofuels, Bioproducts and
Biorefining, v. 9, n. 6, p. 778–800, nov. 2015.
DE KLERK, A.; NEL, R. J. J.; SCHWARZER, R. Oxygenate Conversion over Solid
Phosphoric Acid. Industrial & Engineering Chemistry Research, v. 46, n. 8, p.
2377–2382, abr. 2007.
DIAS, J. M. C. D. S. et al. Produção de briquetes e péletes a partir de resíduos agrícolas,
agroindustrais e florestais. Embrapa Agroenergia, p. 132, 2012.
DORBIAN, C. S.; WOLFE, P. J.; WAITZ, I. A. Estimating the climate and air quality
benefits of aviation fuel and emissions reductions. Atmospheric Environment, v. 45,
n. 16, p. 2750–2759, maio 2011.
ECOFYS. Global Potential of Renewable Energy Sources : a literature assessment.
[s.l: s.n.].
EIA. What fuels are made from crude oil? Disponível em:
<http://www.eia.gov/energyexplained/index.cfm/data/index.cfm?page=oil_home>.
Acesso em: 15 out. 2016a.
EIA. International Energy Statistics. Disponível em:
<https://www.eia.gov/cfapps/ipdbproject/iedindex3.cfm?tid=5&pid=63&aid=2&cid=B
R,&syid=2010&eyid=2014&unit=TBPD#>. Acesso em: 20 jun. 2016b.
EIA. Europe Brent Spot Price FOB. Disponível em:
<https://www.eia.gov/dnav/pet/hist/LeafHandler.ashx?n=PET&s=RBRTE&f=A>.
Acesso em: 14 set. 2016a.
EIA. U.S. Gulf Coast Kerosene-Type Jet Fuel Spot Price FOB. Disponível em:
<https://www.eia.gov/dnav/pet/hist/LeafHandler.ashx?n=PET&s=EER_EPJK_PF4_RG
C_DPG&f=A>. Acesso em: 14 set. 2016b.
ELGOWAINY, A. et al. Life-Cycle Analysis of Alternative Aviation Fuels in
GREET. Chicago: [s.n.].
ELIA, J. A. et al. Hardwood Biomass to Gasoline , Diesel , and Jet Fuel : 2 . Supply
Chain Optimization Framework for a Network of Thermochemical Re fi neries. Energy
and Fuels, v. 27, p. 4325–4352, 2013.
ENVERGENTTECH. RTP Green Fuel. Converting low-value biomass into a high
value liquid. Disponível em: <https://www.envergenttech.com/>. Acesso em: 2 jul.
2016.

121
ENVIROAERO. Our climate plan. Environmental efficiency. Disponível em:
<http://aviationbenefits.org/environmental-efficiency/our-climate-plan/>. Acesso em: 9
jan. 2016.
EUROPEAN PARLIAMENT. The Impact of Oil Prices Fluctuations on Transport
and Its Related Sectors. Bruxelas: [s.n.]. Disponível em:
<http://www.europarl.europa.eu/RegData/etudes/etudes/join/2009/419084/IPOL-
TRAN_ET(2009)419084_EN.pdf>.
EXAME. Revista exame. Tabela de salários. Disponível em:
<http://exame.abril.com.br/ferramentas/tabela-de-salarios/>. Acesso em: 15 dez. 2016.
FIRJAN. Quanto custa o Gás Natural para indústria no Brasil? Rio de Janeiro:
[s.n.]. Disponível em:
<http://www.firjan.com.br/lumis/portal/file/fileDownload.jsp?fileId=2C908A8F4EBC4
26A014EC144CB142B50&inline=1>.
FORSTER, P. et al. Changes in Atmospheric Constituents and in Radiative Forcing. In:
Climate Change 2007: The Physical Science Basis. Contribution of Working
Group I to the Fourth Assessment Report of the Intergovernmental Panel on
Climate Change. [s.l: s.n.]. p. 129–234.
FUGLESTVEDT, J. S. et al. Transport impacts on atmosphere and climate: Metrics.
Atmospheric Environment, v. 44, n. 37, p. 4648–4677, dez. 2010.
GERBENS-LEENES, P. W.; HOEKSTRA, A. Y.; VAN DER MEER, T. The water
footprint of energy from biomass: A quantitative assessment and consequences of an
increasing share of bio-energy in energy supply. Ecological Economics, v. 68, n. 4, p.
1052–1060, 2009.
GOGUEN, P. W. et al. Pulse-Quench Catalytic Reactor Studies Reveal a Carbon-Pool
Mechanism in Methanol-to-Gasoline Chemistry on Zeolite HZSM-5. Journal of the
American Chemical Society, v. 120, n. 11, p. 2650–2651, mar. 1998.
GUELL, B. M. et al. Report Benchmark of conversion and production technologies
for synthetic biofuels for aviation. [s.l: s.n.].
GURBUZ, E. I.; DUMESIC, J. A. Catalytic Strategies and Chemistries Involved in the.
In: Catalysis for the Conversion of Biomass and Its Derivatives. [s.l.] Max Planck
Research Library for the History and Development of Knowledge, 2013. p. p.294-355.
GÜRBÜZ, E. I.; KUNKES, E. L.; DUMESIC, J. A. Integration of C-C coupling
reactions of biomass-derived oxygenates to fuel-grade compounds. Applied Catalysis
B: Environmental, v. 94, n. 1–2, p. 134–141, 2010.
H. HUO, M. WANG, C. BLOYD, V. P. Life-Cycle Assessment of Energy and
Greenhouse Gas Effects of Soybean-Derived Biodiesel and Renewable Fuels. 2008.
HAN, J. et al. Update to Soybean Farming and Biodiesel Production in GREET TM. v.
2012, n. Usda 2013, p. 1–7, 2014.
HARI, T. K.; YAAKOB, Z.; BINITHA, N. N. Aviation biofuel from renewable
resources: Routes, opportunities and challenges. Renewable and Sustainable Energy
Reviews, v. 42, p. 1234–1244, 2015.
HELD, A. Catalytic conversion of renewable plant sugars to fungible liquid

122
hydrocarbon fuels using the bioforming process. Memphis: [s.n.].
HOFFMANN, B. S.; SALEM, A.; SCHAEFFER, R. O Potencial termelétrico a
carvão no Rio Grande do Sul diante restrições de disponibilidade de água e
objetivos de redução de emissões de CO2, aplicando a queima em leito fluidizado.
Tese D.Sc.—[s.l.] Universidade Federal do Rio de Janeiro, 2013.
HONEYWELL. UOP Green Jet FuelTM Process. Disponível em:
<http://www.uop.com/green-jet-fuel/>. Acesso em: 8 dez. 2015.
IATA. Technology Roadmap 2013. [s.l: s.n.]. Disponível em:
<https://www.iata.org/whatwedo/environment/Documents/technology-roadmap-
2013.pdf>.
IATA. Pressroom. IATA Air Passenger Forecast Shows Dip in Long-Term
Demand. Disponível em: <http://www.iata.org/pressroom/pr/Pages/2015-11-26-
01.aspx>. Acesso em: 15 jul. 2016.
IATA. Annual Review. Dublin: [s.n.]. Disponível em:
<http://www.iata.org/publications/Documents/iata-annual-review-2016.pdf>.
IBGE. Censo Agropecuário 2006. Rio de Janeiro: [s.n.]. Disponível em:
<http://www.ibge.gov.br/>.
IBGE. Produção da Extração Vegetal e da Silvicultura 2014. Disponível em:
<http://www.sidra.ibge.gov.br/bda/pesquisas/pevs/default.asp?o=30&i=P>. Acesso em:
13 fev. 2016.
IBGE. Dados de previsão de safra. Área plantada. Disponível em:
<http://www.sidra.ibge.gov.br/bda/prevsaf/default.asp?t=2&z=t&o=26&u1=1&u2=1&u
3=1&u4=1>.
ICAO. Aviation and Sustainable Alternative Fuels Workshop. Montreal: [s.n.].
ICAO. Aviation and Climate ChangeEnvironmental Report 2013. Montreal: [s.n.].
IEA. Production of alternative transportation fuels: Influence of crude oil price
and technology maturity. Paris: [s.n.]. Disponível em:
<https://www.iea.org/publications/freepublications/publication/production-costs-of-
alternative-transportation-fuels-influence-of-crude-oil-price-and-technology-maturity-
.html>.
IEA. Key world energy statistics. Paris: [s.n.]. Disponível em:
<https://www.iea.org/publications/freepublications/publication/KeyWorld2016.pdf>.
INDEXMUNDI. Commodities prices. Soybean Oil. Disponível em:
<http://www.indexmundi.com/pt/pre�os-de-mercado/?mercadoria=óleo-de-
soja&meses=60&moeda=brll>. Acesso em: 25 jul. 2016.
INDEXMUNDI. Jet fuel daily prices. Disponível em:
<http://www.indexmundi.com/commodities/?commodity=jet-fuel>. Acesso em: 20 jul.
2016.
IPCC. N2O Emissions From Managed Soils, and CO2 Emissions From Lime and
Urea application - Chapter 112006 IPCC Guidelines for National Greenhouse Gas
Inventories. Geneva: [s.n.]. Disponível em: <http://www.ipcc-

123
nggip.iges.or.jp/public/2006gl/pdf/4_Volume4/V4_11_Ch11_N2O&CO2.pdf>.
IPCC. Emission factor detail (ID:521417). Disponível em: <http://www.ipcc-
nggip.iges.or.jp/EFDB/ef_detail.php>. Acesso em: 10 out. 2016.
IPEA. Diagnóstico dos Resíduos Orgânicos do Setor Agrossilvopastoril e
Agroindústrias Associadas. Brasília: [s.n.].
IRIBARREN, D.; PETERS, J. F.; DUFOUR, J. Life cycle assessment of transportation
fuels from biomass pyrolysis. Fuel, v. 97, p. 812–821, 2012.
JIG. Aviation Fuel Quality Requirements for Jointly Operated Systems
(AFQRJOS)JIG Bulletin No. 51 2012. [s.l: s.n.].
KING, F.; KELLY, G.; STITT, E. 98 Improved base catalysts for industrial
condensation reactions. Fourth Tokyo conference on Advance Catalytic Science and
Technology, p. 443–446, 2003.
LEE, P. D. S.; LIM, L. L.; OWEN, B. Bridging the aviation CO2 emissions gap: why
emissions trading is needed. Dalton Research Institute, p. 29, 2013.
LI, L. et al. Catalytic hydrothermal conversion of triglycerides to non-ester biofuels.
Energy and Fuels, v. 24, n. 2, p. 1305–1315, 2010.
LIU, G.; YAN, B.; CHEN, G. Technical review on jet fuel production. Renewable and
Sustainable Energy Reviews, v. 25, p. 59–70, 2013.
LOKESH, K. et al. Life cycle greenhouse gas analysis of biojet fuels with a technical
investigation into their impact on jet engine performance. Biomass and Bioenergy, v.
77, p. 26–44, 2015.
MACEDO, I. C.; SEABRA, J. E. A.; SILVA, J. E. A. R. Green house gases emissions
in the production and use of ethanol from sugarcane in Brazil: The 2005/2006 averages
and a prediction for 2020. Biomass and Bioenergy, v. 32, n. 7, p. 582–595, 2008.
MAWHOOD, B. et al. Technological and commercial maturity of aviation biofuels :
Emerging options to produce jet from lignocellulosic biomass. 14th International
Conference on Sustainable Energy Technologies –SET2015, n. September, 2015.
MAWHOOD, R. et al. Establishing a European renewable jet fuel supply chain: the
technoeconomic potential of biomass conversion technologiesRENJET Climate
KIC. London: [s.n.]. Disponível em:
<https://workspace.imperial.ac.uk/icept/Public/RENJET WP1_1 IC Technoeconomic
potential jan15.pdf>.
MERROW, E. W.; PHILLIPS, K. E.; MYERS, C. W. Understanding Cost Growth
and Performance Shortfalls in Pioneer Process PlantsLibrary of congress
cataloging in publication data, 1981.
MORAES, M. A. F. D. et al. Jet biofuels in Brazil: Sustainability challenges.
Renewable and Sustainable Energy Reviews, v. 40, p. 716–726, 2014.
MORRISON, G. M. et al. Three routes forward for biofuels: Incremental, leapfrog, and
transitional. Energy Policy, v. 88, p. 64–73, 2016.
NABC. Catalysis of Lignocellulosic Sugars Process Strategy. Disponível em:
<http://www.nabcprojects.org/catalytic_sugar.html>. Acesso em: 10 out. 2016.

124
NOGUEIRA DE OLIVEIRA, L. P. et al. Critical technologies for sustainable energy
development in Brazil: Technological foresight based on scenario modelling. Journal
of Cleaner Production, v. 130, p. 12–24, 2015.
NOVELLI, P. Sustainable Way for Alternative Fuels and Energy in Aviation Final
Report. Palaiseau: [s.n.].
NREL. Biological conversion of sugars to hydrocarbons technology pathway.
Denver: [s.n.].
O’NEILL, B. C. The Jury is Still Out on Global Warming Potentials. Climatic Change,
v. 44, n. 4, p. 427–443, 2000.
OLIVEIRA, L. G. S. DE. Aproveitamento Energético De Resíduos Agrícolas – O
Caso Da Agroeletricidade Distribuída. Dissertação M.Sc.—[s.l.] Universidade
Federal do Rio de Janeiro, 2011.
OXERA CONSULTING LTD. Discount rates for low-carbon and renewable generation
technologies. n. April, p. 52, 2011.
OXFORD ECONOMICS. Economic Benefits from Air Transport in Brazil. p. 28, 2014.
PALAURO, G. R. Caracterização do mercado de combustível de aviação : um
estudo de organização industrial. Dissertação M.Sc.—[s.l.] Universidade de São
Paulo, 2015.
PEARLSON, M. N. A Techno-economic and Environmental Assessment of
Hydroprocessed Renewable Distillate Fuels. M.Sc. Dissertation—[s.l.] Massachusetts
Institute of Technology, 2011.
PEARSON, S. Financial Times. Petrobras blamed for stalling Brazilian airline
growth. Disponível em: <http://www.ft.com/cms/s/0/745222ac-5200-11e4-b55e-
00144feab7de.html#axzz4EtrQQZo1>. Acesso em: 19 jul. 2016.
PETROBRÁS. Querosene de Aviação. Informações Técnicas. Rio de Janeiro: [s.n.].
PORTUGAL-PEREIRA, J. et al. Agricultural and agro-industrial residues-to-energy:
Techno-economic and environmental assessment in Brazil. Biomass and Bioenergy, v.
81, n. April, p. 521–533, 2015.
PORTUGAL, J.; KOBERLE, A.; SCHAEFFER, R. Policy case study : Evaluation of
the Brazilian biodiesel program. v. 642147, n. 642147, p. 1–28, 2016.
PRIELER, S.; FISCHER, G.; VAN VELTHUIZEN, H. Land and the food-fuel
competition: insights from modeling. Wiley Interdisciplinary Reviews: Energy and
Environment, v. 2, n. 2, p. 199–217, mar. 2013.
PRUDÊNCIO, V. et al. Variability in environmental impacts of Brazilian soybean
according to crop production and transport scenarios. Journal of Environmental
Management, v. 91, n. 9, p. 1831–1839, 2010.
RATHMANN, R.; SZKLO, A.; SCHAEFFER, R. Land use competition for production
of food and liquid biofuels: An analysis of the arguments in the current debate.
Renewable Energy, v. 35, n. 1, p. 14–22, 2010.
RATHMANN, R.; SZKLO, A.; SCHAEFFER, R. Targets and results of the Brazilian
Biodiesel Incentive Program - Has it reached the Promised Land? Applied Energy, v.

125
97, p. 91–100, 2012.
READIFUELS. A novel process to convert oils from plants and algae into fuel.
Disponível em: <http://www.readifuels.com/ARA-CH-technology.html>. Acesso em:
24 ago. 2016.
RISI. World Timber Price Quarterly 2015. [s.l: s.n.]. Disponível em:
<www.risi.com/timberland>.
ROCHA, M. H. et al. Life cycle assessment (LCA) for biofuels in Brazilian conditions:
A meta-analysis. Renewable and Sustainable Energy Reviews, v. 37, p. 435–459,
2014.
ROSILLO-CALLE, F. et al. The Potential and Role of Biofuels in Commercial
Aviation. [s.l: s.n.]. Disponível em: <www.bioenergytrade.org>.
ROTMANS, J.; DEN ELZEN, M. G. J. A model-based approach to the calculation of
global warming potentials (GWP). International Journal of Climatology, v. 12, n. 8,
p. 865–874, dez. 1992.
SABESP. Comunicado tarifas 2012. Disponível em:
<http://site.sabesp.com.br/uploads/file/clientes_servicos/comunicado_04_2012.pdf>.
Acesso em: 10 jul. 2016.
SANTOS, V. E. N. Proposta metodológica para a criação de biorrefinaria de
bagaço de cana produtora de bioplataformas químicas: um ensaio preliminar
como parte de um sistema de simbiose industrial em Campos dos Goytacazes - RJ.
Dissertação M.Sc—[s.l.] Universidade Federal do Rio de Janeiro, 2013.
SFB. Gestão de Florestas Públicas. Relatório 2011. Brasília: [s.n.]. Disponível em:
<http://www.mma.gov.br/port/conama/legiabre.cfm?codlegi=691>.
SHELL. Civil Jet Fuel Grades. Disponível em: <http://www.shell.com/business-
customers/aviation/aviation-fuel/civil-jet-fuel-grades.html>. Acesso em: 15 jun. 2016.
SIFRECA. Fretes Rodoviários. Sistema de informação de fretes. Disponível em:
<http://log.esalq.usp.br/sifreca/pt/fretes/rodoviarios>. Acesso em: 15 jul. 2016.
SIFRECA. Fretes Rodoviários. Óleo de soja. Sistema de Informação de fretes.
Disponível em: <http://esalqlog.esalq.usp.br/sifreca/mercado-de-fretes/outros-
produtos/#oleodesoja>. Acesso em: 15 jul. 2016.
SIMON, B.; RYE, L.; WILSON, C. W. Aviation gas turbine alternative fuels: A review.
Proceedings of the Combustion Institute, v. 33, n. 2, p. 2863–2885, 2011.
SMITH, S. J.; WIGLEY, M. L. Global Warming Potentials: 1. Climatic Implications of
Emissions Reductions. Climatic Change, v. 44, n. 4, p. 445–457, 2000.
STCP. Otimização da gestão de resíduos e o desenvolvimento florestalCuritiba:
Encontro Nacional da Gestão de Resíduos – ENEGER, 2011
TIJMENSEN, M. J. A. et al. Exploration of the possibilities for production of Fischer
Tropsch liquids and power via biomass gasification. Biomass and Bioenergy, v. 23, n.
2, p. 129–152, 2002.
USDA. Brazil biofuels annual report. São Paulo: [s.n.]. Disponível em:
<https://gain.fas.usda.gov/Recent GAIN Publications/Biofuels Annual_Sao Paulo

126
ATO_Brazil_8-12-2016.pdf>.
VIRENT. Products - Jet Fuel. Disponível em: <http://www.virent.com/products/jet-
fuel/>. Acesso em: 14 jul. 2016a.
VIRENT. Virent Bioforming. Disponível em:
<http://www.virent.com/technology/bioforming/>. Acesso em: 14 jul. 2016b.
WANG, W.-C.; TAO, L. Bio-jet fuel conversion technologies. Renewable and
Sustainable Energy Reviews, v. 53, p. 801–822, 2015.