coronel, daniel arruda; seii, cristiano hayakawa; lÍrio
TRANSCRIPT
CORONEL, Daniel Arruda; SEII, Cristiano Hayakawa; LÍRIO, Viviani Silva
Revista de Contabilidade e Controladoria, ISSN 1984-6266
Universidade Federal do Paraná, Curitiba, v.5, n.2, p.91-106, maio/ago. 2013. 91
R C & C Revista de Contabilidade e Controladoria
DECISION UNDER RISK CONDITIONS: ADVANTAGES OF
TECHNICAL ANALYSIS FOR ARABIC COFFEE FUTURE
CONTRACTS IN BM&FBOVESPA
DECISÃO SOB CONDIÇÕES DE RISCO: VANTAGENS DA ANÁLISE TÉCNICA PARA CONTRATOS FUTUROS DE CAFÉ ARÁBICA NA BM&FBOVESPA
Recebido em 28.03.2013 | Aceite final em 11.07.2013 |
Nota: este artigo foi aceito pelo Editor Jorge Eduardo Scarpin e passou por uma avaliação double blind review
A reprodução dos artigos, total ou parcial, pode ser feita desde que citada a fonte.
Cristiano Hayakawa Seii
Mestrando em Economia Aplicada | Universidade Federal de Viçosa | Centro de Ciências Agrárias | Departamento de Economia Rural | Avenida P.H. Rolfs, s/n | Prédio Anexo | Sala 236 | Campus Universitário | 36570000 | Vicosa-MG - Brasil | Telefone: (+5531) 38991330 | E-mail: [email protected] |
Viviani Silva Lírio
Bolsista de Produtividade do Conselho Nacional de Desenvolvimento Científico e Tecnológico (CNPq) | Professora Associada | Programa de Pós-Graduação em Economia Aplicada | Universidade Federal de Viçosa | Centro de Ciências Agrárias | Departamento de Economia Rural | Av P.H. Rolfs, s/n | Prédio Anexo | Sala 236 Campus Universitário | 36570000 | Vicosa-MG - Brasil | Telefone: (+5531) 38991330 | E-mail: [email protected] |
Daniel Arruda Coronel
Doutor em Economia Aplicada | Universidade Federal de Viçosa | Professor Adjunto | Programa de Pós-Graduação em Administração | Universidade Federal de Santa Maria | Departamento de Ciências Administrativas | Prédio 74C | Térreo | Sala 4112 Bairro Camobi | km 9 | 97105900 | Santa Maria-RS - Brasil | Telefone: (+5555) 3220-9296 | E-mail: [email protected] |
Abstract:
The objective of this study was to verify the applicability of the technical analysis of Arabica coffee futures contracts negotiated in BM&FBovespa in period 1992 to 2009. In this regard, we used Arithmetic Moving Average (AMA), Exponential Moving Average (EMA), Convergence and Divergence of Moving Averages (CDMA) and the Relative Strength Index (RSI).) The results indicated that the use of technical analysis methods applied to arabica coffee futures contracts reduced, significantly, the variation in returns earned, independently of the normality or not of the market conditions.
DECISION UNDER RISK CONDITIONS: ADVANTAGES OF TECHNICAL ANALYSIS FOR ARABIC COFFEE FUTURE CONTRACTS IN BM&FBOVESPA
Revista de Contabilidade e Controladoria, ISSN 1984-6266
Universidade Federal do Paraná, Curitiba, v.5, n.2, p.91-106, maio/ago. 2013. 92
Consequently, the amount of capital intended to maintain the margin of security of the operations performed was also reduced.
Key-words: Technical Analysis. Arabica Coffee. BM&BOVESPA.
Resumo:
O objetivo deste trabalho foi verificar a aplicabilidade da análise técnica aos contratos futuros de café arábica negociados na BM&FBovespa, no período de 1992 a 2009. Neste sentido, foram utilizadas a Média Móvel Aritmética (MMA), a Média Móvel Exponencial (MME), Convergência e Divergência de Médias Móveis (MACD) e o Índice de Força Relativa (RSI). Os resultados indicaram que o uso de métodos de análise técnica aplicados aos contratos futuros de café arábica reduziu, de forma significativa, a variação nos retornos auferidos, independentemente da normalidade ou não das condições de mercado. Consequentemente, a quantidade de capital destinada para a manutenção da margem de garantia das operações realizadas também foi reduzida.
Palavras-chave: Análise Técnica. Café Arábica. BM&BOVESPA.
1 Introduction
In agroindustrial production chains all agents are forced to make decisions considering some degree of risk. On the side of the producers, the most relevant ones are associated to two factors: price (common to all chain agents) and production (specific by sector). (SCHOUCHANA; MICELI, 2004).
It is known that the coffee market, one of the most important Brazilian agro-industrial markets, has high price volatility caused mainly by expectations of crops and the supply shocks of the product on the market. Therefore, farmers, processing companies and traders often seek instruments of protection against unwanted prices. Among the mechanisms available, these agents find in the futures markets a satisfactory option for protection against price risks. In addition, speculators and arbitrators operate in the futures markets in order to profit from the price variation or the potential market distortions. Thus, it is understood that the futures prices result from the sum of the expectations of these agents, which present the most diverse levels of aversion in relation to risk.
Perobelli (2005), working on volatility in the coffee market, highlights that the more volatile the prices of certain assets are, the greater will be the risks and uncertainties related to its price in the future. Also within this perspective, Campos (2007) states that the agricultural futures contracts are the main mechanism for reducing price risk, available for both producers and processors, since government policies that aimed at restricting or creating protectionist trade barriers internally or externally can cause serious consequences in the present competitive and globalized environment.
Considering, the advantages described, two types of analysis are often used by investors in order to determine the best time to perform an operation at the Stock Exchange. The first one, the fundamental analysis, consists of a complex technique that requires knowledge of economics, management and financial mathematics, in addition to expertise knowledge in sectors of economic activity. The second, the technical (or graphic) analysis, is based on the analysis of the historical prices of certain asset, or, on the evaluation of market based on empirically endorsed indicators. For Matsura (2006), this type of analysis emphasizes that in the search for protection against adverse variations in prices, the most important is to understand the behavior of the market recorded in the price chart, which in turn is a consequence of all truly relevant information.

DECISION UNDER RISK CONDITIONS: ADVANTAGES OF TECHNICAL ANALYSIS FOR ARABIC COFFEE FUTURE CONTRACTS IN BM&FBOVESPA
Revista de Contabilidade e Controladoria, ISSN 1984-6266
Universidade Federal do Paraná, Curitiba, v.5, n.2, p.91-106, maio/ago. 2013. 93
Naturally, this position gives rise to the idea that prices act as efficient flag of market issues. However, Carter (2003) states that the futures markets, because they reflect imperfect
information and are influenced by speculations about future market conditions, do not present perfect efficiency. Due to information asymmetry, investors in possession of privileged information take advantage of that to operate in the market and thus gain greater profitability.
According to Talati (2002), the fundamental analysis attempts to explain the cause of price changes, and because it has no "rigid" rules to be adopted, it provides greater decision flexibility to investors in times of uncertainty. On the other hand, in the case of technical analysis, the main concern lies not in knowing why the changes in futures prices, but rather in identifying the moment that prices are liable to change their trajectory. In this model of analysis, historical price series, negotiation volumes and open contract numbers are the main components used for the formulation of the prediction models. In summary, because they use only technical data, these models more easily detect the action of investors who have privileged information, even though one does not know why or who is acting (CHU; HSIEH; TSE, 1999).
Therefore, even if the technical analysis does not make predictions as to what the price of a particular commodity will be, it can provide an important indicator regarding the best time to carry out purchase and sale operations both in the future and physical markets.
Although the technical analysis has been developed originally focused on the stock market, Neely et al. (1997), maintains its applicability, in one form or another to all types of market. Therefore, this work aims to study the functioning of some measures of Technical Analysis applied to arabica coffee futures Contracts that uses statistical tools in their development and therefore are exempt from subjectivity in their interpretation. This type of approach has as its main advantages in relation to the one based on fundamentalist analysis the low cost of its design and easy access to all market participants.
The use of agricultural futures Contracts in Brazil and, consequently, models of this nature, is still very low, and, according to Müller (2007), they represent only 0.45% of all Contracts traded on the BM&FBovespa. In particular, the author emphasizes the case of the arabica coffee futures Contracts that between 2001 and 2006, although having presented a growth in trading volume on the Stock Exchange of 4.28% p.a., had a ratio between the business value in BM&FBovespa and the value of its national production, during the same period, dropped to a rate of 8.39% p.a., indicating that the growth of the financial volume of these Contracts took place more by speculative action than by hedge activities.
The main causes for the low volume of Contracts traded by hedgers in the stock exchange, according to Aguiar (2000), are the lack of operationalization of futures markets and lack of resources to shoulder the so-called margin calls, among others. Thus, the use of Technical Analysis can alleviate the problem of margin calls, because when identifying the most suitable times for the purchase or sale of Contracts, more investors, whatever they are, will be more willing to operate with these Contracts.
Thus, the general objective of this study is to verify the applicability of technical analysis to arabica coffee futures Contracts traded on the BM&FBovespa of this market over the period 1992 to 2009.
Following this topic, this study is divided into four sections besides this introduction. In the second section we present the theoretical reference; in the following section, we present the methodological procedures; in the fourth section, we analyze and discuss the results obtained, and in the last section we present some final considerations.
DECISION UNDER RISK CONDITIONS: ADVANTAGES OF TECHNICAL ANALYSIS FOR ARABIC COFFEE FUTURE CONTRACTS IN BM&FBOVESPA
Revista de Contabilidade e Controladoria, ISSN 1984-6266
Universidade Federal do Paraná, Curitiba, v.5, n.2, p.91-106, maio/ago. 2013. 94
2 Theoretical Reference
Lamounier (2006) states that the use of mathematical and statistical methods can reveal the existence of systematic behavior of price volatility, and thus provide greater efficiency in the process of decision making and risk management.
It is important to consider, therefore, that market agents differ among themselves as to their preferences regarding risk and may be classified as contradictory, or neutral to risk (VARIAN, 1992). The agents that perform in the coffee agroindustrial chain usually are risk-averse; however, because of lack of knowledge as to how the futures market operates or due to lack of resources to bear eventual margin calls, some of these are risk-prone when they do not hedge their positions with futures Contracts. In addition, speculators and arbitrators operate in the futures markets, each one with his own degree of risk aversion.
Tomek and Peterson (2001) in their work of risk management in agricultural markets set futures prices through the model:
(1)
where t represents the current date, T the maturity date of the Contract, F the future price, I the set of available information, and E the expected value operation. So, in accordance with the available information, the sum of the expectations of the agents involved will make up the futures prices and may result in a consensus or an imbalance of expectations that will favor the rise or fall in prices.
However, Carter (2003) states that the Futures Markets, because they reflect asymmetry information and are influenced by speculations about future market conditions, do not present perfect efficiency. According to Alexander (1964), because the market presents this feature, prices adjust gradually as the news becomes public. Thus, the prices relayed can to some extent, reflect the way the prices will behave in the future.
However, for most hedgers there is considerable difficulty in following the market on a fundamentalist base, since this analysis requires periodic data surveys on the commodity in question, which requires both time and financial resources (NORONHA, 1995). So, according to Murphy (1999), the premise that the price discounts it all, represents what is probably the basic principle of the technical analysis, that is, any event that might affect the price will be reflected on the market price.
Thus, even if there is information asymmetry in the market and that every agent in possession of a privileged relevant information, takes advantage of this to operate, market prices will quickly reflect such information. Therefore, we believe that technical analysis is the only available support instrument to most of the investors to position themselves in the market in order to minimize losses caused by misinformation or delay in the process of disseminating information (TAVARES, 1988)
3 Methodology
Technical analysis consists of the use of nonparametric methods for estimating the prices of assets traded in the market. For the technical analyst, the future price of an asset is a function of its past prices, i.e. prices of assets traded in the market present some level of trend. Under this assumption, various methods of technical analysis have sought to identify, through graphs, points that flag the continuation or reversal of a price trend, based on prices observed previously (TAVARES, 1988).
In this study, following the methodologies traditionally adopted, we will study the most usual methods of technical analysis Arithmetic Moving Average (AMA), Exponential Moving Average (EMA), Convergence and Divergence of Moving Averages (CDMA) and Relative Strength Index (RSI).

DECISION UNDER RISK CONDITIONS: ADVANTAGES OF TECHNICAL ANALYSIS FOR ARABIC COFFEE FUTURE CONTRACTS IN BM&FBOVESPA
Revista de Contabilidade e Controladoria, ISSN 1984-6266
Universidade Federal do Paraná, Curitiba, v.5, n.2, p.91-106, maio/ago. 2013. 95
These methods, because they use statistical tools in their preparation, are free of subjectivity in their interpretation, which allows us to carry out empirical tests with them.
3.1 Moving Averages (MA)
The strategy of Moving Averages (MM) is the calculation of prices averages that dislocate in time, that is, as the latest quotes go into their calculation, the older ones are removed. The main function of this strategy is to reduce fluctuations in price chart, to facilitate both the identification of trends and the levels of support and price resistance (MATSURA, 2006).
To identify the points of trend reversal of market prices is necessary to use two moving averages of different periods. Contract purchase flags are generated whenever the MA value of the shorter period exceeds the value of that of the longer period. On the other hand, the sales flags are generated whenever the opposite occurs. The explanation for the operation of this technique lies in the fact that the MA of the shorter period reacts quicker to price changes than that of the longer term. So when the market is more optimistic (high price trend), the value of MA of the shorter term rises faster than that in the longer term, being a purchase flag generated whenever the value of MA of short term is higher than that of longer term and vice-versa. The types of Moving Averages addressed in this study are the Arithmetic Moving Average (AMA) and the Exponential (EMA) because they are the most commonly used in the market.
3.1.1 Arithmetic Moving Average (AMA)
AMA is the sum of the prices verified during the period (n) analyzed divided by the size of the period, as the following expression:
(2)
Where: n = number of days used in the AMA, and last closing price lagged i days.
3.1.2 Exponential Moving Average (EMA)
EMA is a moving average that assigns a weight that grows exponentially from the oldest price to the most recent price, as in equation (3):
(3)
Where: n = number of days used in the EMA, k = 2 / (n + 1); = last closing price checked;
= Exponential Moving Average checked one day before
3.2 Convergence and Divergence of Moving Averages
(CDMA)
This indicator is the use of three exponential moving averages. Two of these are used on the prices of the studied asset, being one of long-term and another of short-term to generate the values of CDMA. The third EMA is used on the CDMA to generate a flag with the task of identifying the points of purchase and sale of CDMA.

DECISION UNDER RISK CONDITIONS: ADVANTAGES OF TECHNICAL ANALYSIS FOR ARABIC COFFEE FUTURE CONTRACTS IN BM&FBOVESPA
Revista de Contabilidade e Controladoria, ISSN 1984-6266
Universidade Federal do Paraná, Curitiba, v.5, n.2, p.91-106, maio/ago. 2013. 96
The reasoning used for the development of this method is the observation as to when two averages of different periods move in a convergent way they tend to cross, generating purchase and sale flags. After crossing, if the price keeps its trajectory, the two averages will present a divergent behavior, i.e., the difference in value between them will increase until it gets a tendency inversion and then the averages return to converge again (MATSURA, 2006).
To calculate the CDMA simply subtract the value of the AME of long-term from that of short-term. Therefore, when the value of the CDMA switches from negative to positive it is a sign that the asset is valorizing in the short run and vice versa. However, the mere crossing of averages does not always correctly flag a reversal of trend and may generate false signals. In order to improve this technique, we apply a moving average on the actual CDMA (FLAG), whose function is to more accurately identify the points of reversal of a trend (MATSURA, 2006).
Calculations of the CDMA and of the FLAG can be represented by the following equations:
(4)
(5)
According to Saffi (2003), the CDMA variable reflects the market consensus in the short term, while the FLAG, being the Exponential Moving Average of the CDMA, will react more slowly and, therefore, this represents the market consensus for a longer term. Thus, CDMA and FLAG will indicate a point of purchase when the CDMA value exceeds the FLAG value and vice versa for the point of sale.
3.3 Relative Strength Index (RSI)
RSI monitors the strength of buyers and sellers by analyzing the behavior of the closing prices of certain assets. Its calculation is done as follows:
(6)
Where,
(7)
Therefore, it is clear that this index measures the relative strength of buyers (increments of days that went up) in relation to sellers (increments of days that went down). Thus, the higher the relative strength of buyers, the closer to 100 the RSI gets and the higher the relative strength of the sellers, the closest the index gets to zero.
This technique assumes that the higher/lower the value of the RSI, the lower/higher the potential for high prices. Thus, it is necessary to determine support and resistance areas so that purchase and sale flags are generated objectively.
With respect to areas of support and resistance, there is no absolute consensus regarding which is the most suitable for use as a reference. Levels normally used are 10, 20 and 30 for support and 70, 80 and 90 for resistance. Thus, it is up to the investor to define which levels best fit his profile and his needs.
DECISION UNDER RISK CONDITIONS: ADVANTAGES OF TECHNICAL ANALYSIS FOR ARABIC COFFEE FUTURE CONTRACTS IN BM&FBOVESPA
Revista de Contabilidade e Controladoria, ISSN 1984-6266
Universidade Federal do Paraná, Curitiba, v.5, n.2, p.91-106, maio/ago. 2013. 97
3.4 Performance evaluation of the technical analysis
methods
To evaluate the performance of technical analysis methods studied in this work, we will simulate purchase and sales operations for coffee futures Contracts, according to the flags displayed by each of the models studied. Subsequently we will use the Sharpe Ratio (SR) in order to evaluate the performance of each of these models. The SR can be defined as:
(8)
Where, SR is the Sharpe Ratio; rsr is the risk-free interest rate; E (rc) is the expected return from the negotiation;
is the volatility (standard deviation) of returns. Thus, the SI assumes that the standard deviation serves as a measure of risk, and the higher its value, the greater the risk on the investment in question (BRESSAN, 2001).
According to Leismann (2002), SR is the ratio between the return provided by a given option of investment and its risk. Therefore, if the SR is positive, it means that by assuming the relative risk of this investment option there is a greater possibility that the return is higher (premium) than the risk-free option. Thus, when the SR is greater than 1, we have that this premium is proportionally greater than the risk assumed, in the same way that values between 0 and 1 indicate that the risk assumed is made proportionately higher than the premium offered. With respect to negative values for the SR, Varga (1999) states that these do not make sense since the investor has the option to invest at the risk-free rate.
In addition to calculating the basis of the indicators considering that the technical analysis consists of using non-parametric methods of estimation, Brook et al. (1992), question the reliability of statistical inferences made regarding such methods, suggesting the use of Bootstrap data resampling technique proposed by Efron (1979) and revised by Efron and Tibshirani (1986), in order to find a better description of the series under study.
3.5 Operational procedures
In order to simulate the different behaviors of investors with relation to the risk, Filters were used where the decision to initiate or close a position in the stock exchange will depend on the “strength” position indicated by the method of technical analysis in the study. Saffi (2003) uses these Filters in his work in order to reduce the number of orders executed. These Filters consider that the investors may choose between conducting their operations as soon as a purchase or sale flag is generated by the indicator used by these (0.0%Filter), or wait for a "strengthening" of such flag to then effect the operation (Filters 0.1%; 0.5%; 1.0% and 5.0%).
Thus, the buying and selling operations are performed only when a flag is generated to start a bought or sold position and its closing will take place whenever a flag is generated to close the position or the "undefined" flag is generated.
The percentages values of the returns calculated for each period analyzed, according to the Filters used are found by calculating the results of purchase or sale operations of coffee in the future market during the period in question (US$/sc.), multiplied by 100 (size of the Contract), added and

DECISION UNDER RISK CONDITIONS: ADVANTAGES OF TECHNICAL ANALYSIS FOR ARABIC COFFEE FUTURE CONTRACTS IN BM&FBOVESPA
Revista de Contabilidade e Controladoria, ISSN 1984-6266
Universidade Federal do Paraná, Curitiba, v.5, n.2, p.91-106, maio/ago. 2013. 98
divided by the average of the sum of the margins of guarantee deposited for the performance of such operations, as in equation [9].
(9)
Where : percentage value of the return obtained during the period studied; n: number of
operations performed during the studied period; : represents the result of n operations of
purchase or sale of coffee in the future market (US$/sc.) : is the margin of guarantee deposited for the performance of n operations (US$/Contract).
After calculating the percentage values of the returns, the average and the standard deviation of these values are calculated in order to obtain the Sharpe Ratio referring to the technical analysis methods studied here. The Bootstrap technique was used on these returns in order to perform statistical inferences on these.
3.6 Source of Data
The development of this work was done from a secondary data base obtained from BM&FBovespa. We selected the arabica coffee Contract due to characteristics such as volatility, liquidity, among other factors making it one of the most traded contracts on the BM&FBovespa. The database corresponds to the closing prices observed for the arabica coffee open Contract of highest liquidity, negotiated at BM&FBovespa during the period January 1992 to December 2009.
4 Analysis and discussion of results
4.1 Returns of the purchase and sale operations of
futures Contracts of arabica coffee at BM&F based on
technical analysis
The applicability of technical analysis to futures Contracts of arabica coffee traded on the BM&FBovespa was verified through the use of trend indicators (AMA, EMA, CDMA and RSI). All indicators seek to identify the best moments to perform transactions, both of purchase and of sale, of coffee.
The study period was divided into two sub periods, the first being for the years 1992 to 1999 and the second from 2000 to 2009. The first sub period was marked by the occurrence of frost (1994) and drought (1997); the second by the absence of factors that influenced the oscillation of prices and coffee production.
In order to compare the performance of the strategies studied Tables 1 and 2 were prepared. In these tables we present the percentages of average returns verified by different strategies (Table 1) and those that proved to be higher than the benchmark (Table 2). Calculations were made during the higher liquidity period of the Contracts and, for each strategy, simulations were done where different periods of stay of the investors with open contracts were considered (per contract, monthly, bimonthly, quarterly, every 6 months and annual).
Behaviors were also simulated with respect to the moment to take positions in futures markets through Filters. Saffi (2003) suggests the use of Filters in order to reduce the number of operations performed; however, in this work, the Filters are used to simulate the behavior of investors: operations performed with Filter 0.00% are made whenever the indicator indicates purchase or sale and are closed only when it is indicated for the positions to be closed. The other Filters simulate the behavior of investors who expect a higher "confirmation" of the signals emitted by the indicators so

DECISION UNDER RISK CONDITIONS: ADVANTAGES OF TECHNICAL ANALYSIS FOR ARABIC COFFEE FUTURE CONTRACTS IN BM&FBOVESPA
Revista de Contabilidade e Controladoria, ISSN 1984-6266
Universidade Federal do Paraná, Curitiba, v.5, n.2, p.91-106, maio/ago. 2013. 99
that operations are carried out and their positions are closed when the indication for closing of the position is emitted, or a situation of uncertainty in the trend arises. Strategies AMA, EMA and CDMA, in general, showed the best results verified through simulations in the study period.
In all strategies studied it was found that the Filter 5.00% was the worst in performance, except when applied to sales CDMA (Table 1). Such a result was possibly caused both by the delay in assuming a position in the future market and by the early closing of the position assumed.
Table 1: Average returns earned through the use of technical analysis models
PURCHASE OPERATION SALE OPERATION
Filter AMA EMA CDMA RSI AMA EMA CDMA RSI
Co
ntr
act*
*
0.00% 102.58% 100.09% 79.88% -3.66% 26.19% 26.00% 20.63% -49.67%
0.10% 103.15% 99.01% 79.49% -3.77% 26.99% 26.59% 21.60% -54.07%
0.50% 83.72% 96.09% 77.91% -3.82% 26.53% 25.43% 23.80% -50.56%
1.00% 80.30% 92.28% 78.74% -3.58% 30.12% 29.10% 28.10% -50.20%
5.00% 43.90% 41.40% 72.51% -4.63% 13.99% 7.08% 31.04% -54.60%
Mo
nth
ly*
0.00% 17.96% 20.01% 5.79% 0.75% 7.77% 10.92% -8.32% -1.03%
0.10% 17.99% 19.10% 5.62% 0.70% 7.15% 10.70% -6.54% -1.09%
0.50% 11.82% 17.77% 5.54% 0.70% 6.58% 7.34% -5.40% -1.24%
1.00% 11.05% 16.31% 4.78% 0.64% 6.21% 8.66% -3.19% -1.06%
5.00% 12.47% 1.67% -6.77% 0.82% -0.51% 0.49% 0.39% -1.58%
BiM
on
thly
*
0.00% 44.80% 41.89% 39.12% -3.32% 22.75% 24.79% 13.80% -24.75%
0.10% 44.91% 41.30% 38.77% -3.41% 23.15% 23.91% 14.02% -24.88%
0.50% 42.60% 38.90% 37.75% -3.44% 22.69% 22.00% 17.33% -25.30%
1.00% 41.45% 35.79% 37.89% -3.26% 24.21% 25.04% 21.80% -25.02%
5.00% 20.25% 9.03% 28.03% -3.65% 9.37% 5.17% 24.09% -24.95%
Qu
arte
rly*
0.00% 67.08% 64.71% 67.85% -6.10% 38.46% 41.32% 30.07% -37.38%
0.10% 67.42% 63.57% 67.37% -6.24% 39.08% 40.90% 30.87% -37.58%
0.50% 63.34% 60.80% 66.08% -6.29% 37.70% 37.60% 32.92% -38.37%
1.00% 62.76% 55.98% 67.07% -6.06% 40.20% 41.38% 39.28% -37.86%
5.00% 29.41% 19.10% 63.07% -7.11% 17.85% 8.81% 42.79% -40.82%
Ever
y 4
mo
nth
s*
0.00% 90.51% 90.07% 95.87% -8.48% 52.12% 56.79% 44.14% -44.45%
0.10% 91.11% 88.54% 95.26% -8.66% 52.81% 56.28% 44.99% -44.73%
0.50% 82.85% 85.04% 93.55% -8.72% 51.15% 52.54% 47.94% -45.84%
1.00% 81.89% 77.90% 94.84% -8.36% 54.36% 57.36% 56.14% -44.89%
5.00% 36.14% 24.20% 93.99% -10.11% 24.94% 12.56% 60.40% -52.77%
Ever
y 6
mo
nth
s*
0.00% 132.00% 136.39% 138.34% -12.56% 77.51% 83.98% 72.30% -64.39%
0.10% 132.74% 133.91% 137.47% -12.85% 78.13% 83.89% 73.55% -64.76%
0.50% 123.47% 131.48% 133.71% -12.82% 75.92% 77.71% 77.59% -66.93%
1.00% 122.93% 120.64% 135.75% -12.13% 80.23% 83.52% 89.12% -64.74%
5.00% 48.57% 33.68% 135.12% -14.82% 37.63% 18.10% 94.00% -79.69%
An
nu
al*
0.00% 278.84% 300.19% 266.70% -26.94% 145.75% 163.11% 149.52% -126.57%
0.10% 281.35% 289.14% 264.75% -27.59% 145.41% 161.22% 151.46% -127.32%
0.50% 265.14% 277.39% 254.10% -27.18% 143.13% 149.76% 159.19% -132.50%
1.00% 262.80% 252.76% 260.20% -25.09% 151.63% 157.01% 180.39% -124.92%
5.00% 75.57% 55.40% 256.31% -28.48% 73.18% 32.58% 191.08% -162.20%
Source: Research Results. * Lenght of stay with open positions. ** Length of stay with an open position during the period of highest liquidity of the Contract..

DECISION UNDER RISK CONDITIONS: ADVANTAGES OF TECHNICAL ANALYSIS FOR ARABIC COFFEE FUTURE CONTRACTS IN BM&FBOVESPA
Revista de Contabilidade e Controladoria, ISSN 1984-6266
Universidade Federal do Paraná, Curitiba, v.5, n.2, p.91-106, maio/ago. 2013.
100
In Table 2, we compared the results obtained through the use of the strategies studied in relation to the benchmark (strategy to take a stand and wait).
The purchase flags generated, in most simulations, returns higher than those generated by sales flags. A similar result was found by Brock et.al (1992) in their work, indicating that the use of technical analysis mechanisms can be more efficient when used to help decide the moment to make purchase operations.
The RSI strategy had low performance in terms of returns, in all simulations (Table 1) when compared with other strategies. In the present study, the strategy followed the closing criteria of Contract adopted by Saffi (2003), who also noted poor performance of this indicator in his study. This is probably due to the criteria used to define the moment in which investors would close their positions (purchase or sale). Therefore, it is suggested that such criteria be reviewed.
DECISION UNDER RISK CONDITIONS: ADVANTAGES OF TECHNICAL ANALYSIS FOR ARABIC COFFEE FUTURE CONTRACTS IN BM&FBOVESPA
Revista de Contabilidade e Controladoria, ISSN 1984-6266
Universidade Federal do Paraná, Curitiba, v.5, n.2, p.91-106, maio/ago. 2013.
101
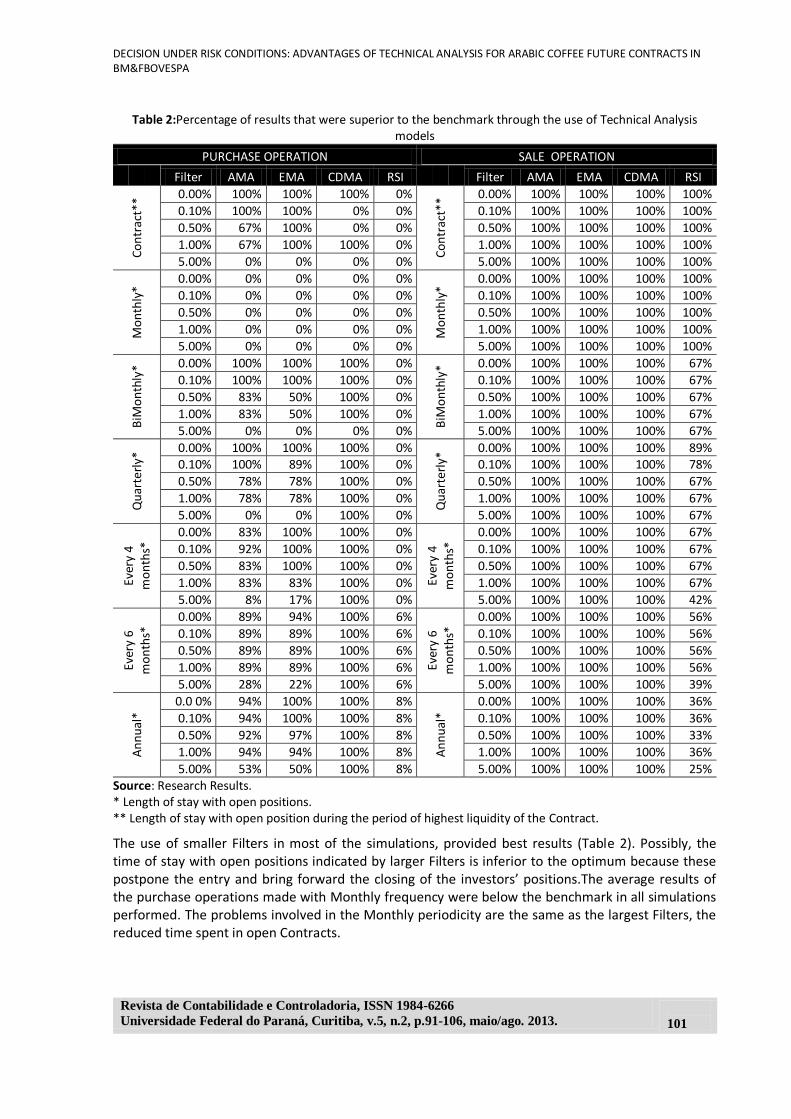
Table 2:Percentage of results that were superior to the benchmark through the use of Technical Analysis models
PURCHASE OPERATION SALE OPERATION
Filter AMA EMA CDMA RSI Filter AMA EMA CDMA RSI
Co
ntr
act*
* 0.00% 100% 100% 100% 0%
Co
ntr
act*
* 0.00% 100% 100% 100% 100%
0.10% 100% 100% 0% 0% 0.10% 100% 100% 100% 100%
0.50% 67% 100% 0% 0% 0.50% 100% 100% 100% 100%
1.00% 67% 100% 100% 0% 1.00% 100% 100% 100% 100%
5.00% 0% 0% 0% 0% 5.00% 100% 100% 100% 100%
Mo
nth
ly*
0.00% 0% 0% 0% 0%
Mo
nth
ly*
0.00% 100% 100% 100% 100%
0.10% 0% 0% 0% 0% 0.10% 100% 100% 100% 100%
0.50% 0% 0% 0% 0% 0.50% 100% 100% 100% 100%
1.00% 0% 0% 0% 0% 1.00% 100% 100% 100% 100%
5.00% 0% 0% 0% 0% 5.00% 100% 100% 100% 100%
BiM
on
thly
* 0.00% 100% 100% 100% 0%
BiM
on
thly
* 0.00% 100% 100% 100% 67%
0.10% 100% 100% 100% 0% 0.10% 100% 100% 100% 67%
0.50% 83% 50% 100% 0% 0.50% 100% 100% 100% 67%
1.00% 83% 50% 100% 0% 1.00% 100% 100% 100% 67%
5.00% 0% 0% 0% 0% 5.00% 100% 100% 100% 67%
Qu
arte
rly*
0.00% 100% 100% 100% 0% Q
uar
terl
y* 0.00% 100% 100% 100% 89%
0.10% 100% 89% 100% 0% 0.10% 100% 100% 100% 78%
0.50% 78% 78% 100% 0% 0.50% 100% 100% 100% 67%
1.00% 78% 78% 100% 0% 1.00% 100% 100% 100% 67%
5.00% 0% 0% 100% 0% 5.00% 100% 100% 100% 67%
Ever
y 4
mo
nth
s* 0.00% 83% 100% 100% 0%
Ever
y 4
mo
nth
s* 0.00% 100% 100% 100% 67%
0.10% 92% 100% 100% 0% 0.10% 100% 100% 100% 67%
0.50% 83% 100% 100% 0% 0.50% 100% 100% 100% 67%
1.00% 83% 83% 100% 0% 1.00% 100% 100% 100% 67%
5.00% 8% 17% 100% 0% 5.00% 100% 100% 100% 42%
Ever
y 6
mo
nth
s* 0.00% 89% 94% 100% 6%
Ever
y 6
mo
nth
s* 0.00% 100% 100% 100% 56%
0.10% 89% 89% 100% 6% 0.10% 100% 100% 100% 56%
0.50% 89% 89% 100% 6% 0.50% 100% 100% 100% 56%
1.00% 89% 89% 100% 6% 1.00% 100% 100% 100% 56%
5.00% 28% 22% 100% 6% 5.00% 100% 100% 100% 39%
An
nu
al*
0.0 0% 94% 100% 100% 8%
An
nu
al*
0.00% 100% 100% 100% 36%
0.10% 94% 100% 100% 8% 0.10% 100% 100% 100% 36%
0.50% 92% 97% 100% 8% 0.50% 100% 100% 100% 33%
1.00% 94% 94% 100% 8% 1.00% 100% 100% 100% 36%
5.00% 53% 50% 100% 8% 5.00% 100% 100% 100% 25% Source: Research Results. * Length of stay with open positions. ** Length of stay with open position during the period of highest liquidity of the Contract.
The use of smaller Filters in most of the simulations, provided best results (Table 2). Possibly, the time of stay with open positions indicated by larger Filters is inferior to the optimum because these postpone the entry and bring forward the closing of the investors’ positions.The average results of the purchase operations made with Monthly frequency were below the benchmark in all simulations performed. The problems involved in the Monthly periodicity are the same as the largest Filters, the reduced time spent in open Contracts.

DECISION UNDER RISK CONDITIONS: ADVANTAGES OF TECHNICAL ANALYSIS FOR ARABIC COFFEE FUTURE CONTRACTS IN BM&FBOVESPA
Revista de Contabilidade e Controladoria, ISSN 1984-6266
Universidade Federal do Paraná, Curitiba, v.5, n.2, p.91-106, maio/ago. 2013.
102
Sales simulations based on methods AMA, EMA, and CDMA, in relation to the time spent with open positions, showed better results than the benchmark (Table 2) at all frequencies studied. These results were favored by average negative returns of the sales benchmark.
Most of the purchase and sale simulations proved to be superior to the strategy of taking a stand and wait. However, it is necessary to check the consistency of these results, as these were checked only for their application on the actual series of prices, and therefore are susceptible to the occurrence of the snooping data bias, i.e., they may be simply a random result. In order to solve this problem, we used the technique of bootstrap resampling, as suggested by Brock et al. (1992). The results found through the application of this technique are presented in the following section.
4.2 Results of the application of the bootstrap
resampling technique on the returns provided by the
use of technical analysis
The bootstrap resampling technique was applied to the returns verified for all simulations performed in order to verify the statistical significance of results found. Two thousand resamples were performed on each of the simulations. The results obtained are shown in Tables 3 and 4.
Table 3: Percentage of the simulation results of purchase and sale of futures Contracts statistically significant at the level of 5%, verified through the Bootstrap resampling technique - sorted by period.
Purchase Operation Sale Operation
AMA EMA CDMA RSI AMA EMA CDMA RSI
Contract 80% 80% 100% 0% 33% 27% 40% 20%
Monthly 13% 27% 0% 0% 7% 7% 0% 0%
BiMonthly 40% 77% 0% 0% 37% 53% 20% 13%
Quarterly 49% 58% 33% 0% 51% 44% 40% 7%
Every 4 months 48% 48% 50% 0% 50% 55% 35% 8% Every 6 months 43% 34% 47% 0% 53% 48% 57% 18%
Annual 57% 76% 83% 7% 54% 51% 67% 23%
Source: Research Results.
It was found, with the application of the Bootstrap on the results, that the use of the strategies studied for the purchase operations the greatest number of statistically significant results was presented (level of 5%) when performed with the contract frequency (Table 3). The justification for this is due, probably to the fact that this frequency covers only one Contract, which reduces the distortions caused by rollover of the Contracts.
The operations in general, when performed during a longer period of time presented a greater number of results statistically significant when compared to those of shorter period. This is due to the fact that the results, when accumulated, tend to mitigate the effects of outliers results seen in shorter frequencies.
Table 4: Percentage of the purchase and sale simulation results of futures Contracts statistically significant at the level of 5%, verified through the Bootstrap resampling technique - sorted by period.
Purchase Operation Sale Operation
Filter AMA EMA CDMA RSI AMA EMA CDMA RSI
0.00% 62% 78% 59% 3% 55% 61% 34% 11%
0.10% 63% 76% 59% 3% 62% 55% 34% 16%
0.50% 56% 77% 59% 3% 48% 44% 38% 24%
1.00% 69% 70% 59% 1% 69% 80% 72% 22%
5.00% 0% 0% 55% 3% 13% 0% 76% 10%
Source: Research Results.
DECISION UNDER RISK CONDITIONS: ADVANTAGES OF TECHNICAL ANALYSIS FOR ARABIC COFFEE FUTURE CONTRACTS IN BM&FBOVESPA
Revista de Contabilidade e Controladoria, ISSN 1984-6266
Universidade Federal do Paraná, Curitiba, v.5, n.2, p.91-106, maio/ago. 2013.
103
The low percentage of statistically significant simulations for transactions performed with Monthly frequency (Table 3) and with Filter at 5.00% (Table 4) reinforces the idea that the time spent with open positions when using these criteria was lower than the optimum.
The RSI strategy had little results statistically (Tables 3 and 4) significant in relation to the frequency as to the Filter used, which suggests that the criteria used in these simulations should be revised.
The average financial returns by not considering the risks involved in adopting a particular investment strategy, are very vague to make a comparison between them. So, in the present work, we used the Sharpe Ratio, according to the criteria adopted by Bressan (2001) in his study. The results are presented in the following section.
4.3 Evaluation of the risk/return ratio (Sharpe Ratio)
Bressan (2001) in his study found results similar to those observed here for the moving average strategies with monthly frequency (Table 5), drawing attention to the low value of these indexes, indicating that the use of such methods should be performed with parsimony, given the high volatility of prices of the product. However, it is clear that by increasing the time spent operating in accordance with the technical analysis strategies studied here, except for the RSI strategy, there was a considerable increase in the index values found, suggesting that the performance of the use of these instruments are positively related with the time used to perform the operations.

DECISION UNDER RISK CONDITIONS: ADVANTAGES OF TECHNICAL ANALYSIS FOR ARABIC COFFEE FUTURE CONTRACTS IN BM&FBOVESPA
Revista de Contabilidade e Controladoria, ISSN 1984-6266
Universidade Federal do Paraná, Curitiba, v.5, n.2, p.91-106, maio/ago. 2013.
104
Table 5: Average Sharpe Ratio of statistically significant purchase and sale futures Contracts at the level of 5%, verified through the Bootstrap resampling technique.
Purchase Operation Sale Operation
Filter AMA EMA CDMA RSI AMA EMA CDMA RSI 0.
00%
Contract 0.252 - 0.261 - 0.240 - - -
Monthly 0.146 - - - - - - -
BiMonthly 0.217 0.214 - - 0.215 0.214 - -
Quarterly 0.285 0.288 0.285 - 0.266 0.288 0.260 -
Every 4 months 0.309 0.341 0.308 - 0.320 0.341 - -0.308
Every 6 months 0.437 0.424 0.471 - 0.302 0.424 0.209 -0.360
Annual 0.563 0.593 0.565 -0.527 0.734 0.593 0.542 -0.561
0.10
%
Contract 0.252 - 0.260 - 0.258 - - -0.216
Monthly 0.145 - - - - - - -
BiMonthly 0.218 0.212 - - 0.215 0.212 - -0.209
Quarterly 0.282 0.288 0.283 - 0.262 0.288 0.261 -
Every 4 months 0.306 0.348 0.320 - 0.310 0.348 - -0.327
Every 6 months 0.459 0.420 0.427 - 0.305 0.420 0.203 -0.379
Annual 0.582 0.591 0.559 -0.528 0.683 0.591 0.544 -0.571
0.50
%
Contract 0.261 - 0.260 - 0.254 - - -0.226
Monthly - - - - - - - - BiMonthly 0.219 0.217 - - 0.228 0.217 - -0.228
Quarterly 0.267 0.292 0.280 - 0.262 0.292 0.269 -0.249
Every 4 months 0.321 0.351 0.319 - 0.326 0.351 - -0.353
Every 6 months 0.435 0.442 0.425 - 0.238 0.442 0.299 -0.283
Annual 0.562 0.607 0.560 -0.513 0.647 0.607 0.565 -0.602
1.00
%
Contract 0.272 - 0.261 - 0.300 - 0.238 -0.226
Monthly - - - - 0.143 - - -
BiMonthly 0.209 0.207 - - 0.285 0.207 0.198 -0.228
Quarterly 0.278 0.274 0.281 - 0.322 0.274 0.341 -0.261
Every 4 months 0.319 0.327 0.320 - 0.365 0.327 0.324 -0.318
Every 6 months 0.440 0.435 0.424 - 0.359 0.435 0.463 -0.414
Annual 0.563 0.592 0.557 -0.561 0.640 0.592 0.633 -0.620
5.0
0%
Contract - - 0.253 - - - 0.268 -
Monthly - - - - - - - -
BiMonthly - - - - - - 0.216 -0.207
Quarterly - - 0.264 - 0.244 - 0.296 -
Every 4 months - - 0.352 - 0.301 - 0.327 -
Every 6 months - - 0.429 - 0.218 - 0.476 -0.243
Annual - - 0.600 -0.534 0.475 - 0.694 -0.546
Source: Research Results.
5 Conclusions
This study aimed at testing the applicability of models of technical analysis to futures Contracts of arabica coffee traded on the BM&FBOVESPA. The models studied were Arithmetic Moving Average (AMA), Exponential Moving Average (EMA), Convergence and Divergence of Moving Averages (CDMA) and the Relative Strength Index (RSI).
Simulations were made of negotiations with coffee futures Contracts using secondary data obtained in the Commodities and Futures Exchange (BM&F) during the period January 1992 to December 2009. The statistical significance of the results obtained was checked through the Bootstrap

DECISION UNDER RISK CONDITIONS: ADVANTAGES OF TECHNICAL ANALYSIS FOR ARABIC COFFEE FUTURE CONTRACTS IN BM&FBOVESPA
Revista de Contabilidade e Controladoria, ISSN 1984-6266
Universidade Federal do Paraná, Curitiba, v.5, n.2, p.91-106, maio/ago. 2013.
105
resampling technique. The Sharpe Ratio was used on these results in order to make a comparison both among the models and these and the benchmark.
Through the calculation of the average returns, it was found that the use of technical analysis methods, applied to arabica coffee futures Contracts reduced, significantly, the variation in returns earned, independently of the normality or not of the market conditions. Consequently, the amount of capital intended to maintain the margin of security of the operations performed was also reduced.
The application of the bootstrap on the results revealed that the Filter 1% and contractual and Annual periodicities had a higher number of statistically significant results at the level of 5% of significance for most simulations made.
The Sharpe ratio showed that only the Relative Strength Index presented results in order to rule out its use as a market indicator. On the other hand, all other methods had better results than the benchmark, demonstrating the potential of the application of these models to arabica coffee futures Contracts to the agents involved in the coffee agribusiness chain.
However, it was not possible to determine the best among them, given the proximity of the observed results and the alternance between them as the best indicator, according to Filter and frequency used.
The limitation of the results presented here is related to the fact that they make reference only to operations performed with futures Contracts, and thus, the results for the hedging operations involving simultaneous negotiations in the physical market are not very clear.
To circumvent this limitation, it is suggested to conduct further studies where the variations in the returns obtained in the physical market are considered in order to better demonstrate the potential application of the models studied in hedging transactions.
References
AGUIAR, D. R. D. Mercados Futuros e a Gestão de Risco no Agronegócio Brasileiro. In: SANTOS, M. L.;
VIEIRA, W. C. (ed.). Agricultura na virada do milênio: velhos e novos desafios. Viçosa, MG: UFV, 2000.
ALEXANDER, S. S. Price movements in speculative markets: trends or random walks, Industrial Management
Review, v. 7, n.26, p. 7-26, 1964.
BRESSAN, A. A. LIMA, J. E. Modelos de previsão de preços aplicados aos contracts futuros agropecuários.
2001.Tese (Doutorado em Economia Rural). Universidade Federal de Viçosa, Viçosa, MG, 2001.
BROCK, W.; LAKONISHOK, J.; LEBARON, B. Simple technical trading rules and the stochastic properties of
stock returns. The Journal of Finance, v. 47, n. 5, p. 1731-1764, 1992.
CAMPOS, K. C.; Análise da volatilidade de preços de produtos agropecuários no Brasil. Revista de Economia e
Agronegócio, v. 5, n. 3, p. 303-328, 2007.
CARTER, C. A. Futures and options markets: an introduction. Upper Saddle River, NJ: Pearson Education Inc.,
2003.
CHU, Q. C.; HSIEH, W. G.; TSE, Y. Price discovery on the S&P 500 index markets: an analysis of spot index,
index futures, and SPDRs. International Review of Financial Analysis, v. 8, n. 1, p. 21-34, 1999.
EFRON, B. Bootstrap methods: another look at the jackknife. The Annals of Statistics, v. 7, n. 1, p. 1-26, Jan.,
1979.
EFRON, B; TIBSHIRANI, R. Bootstrap methods for standard errors, confidence intervals, and others measures
of statistical accuracy. Statistical Science, v.1, n. 1, p. 54 -75, 1986.
LAMOUNIER, W. M. Análise da volatilidade dos preços no mercado spot de cafés do Brasil. Organizações
Rurais & Agroindustriais, v. 8, n. 2, p. 160-175, 2006.

DECISION UNDER RISK CONDITIONS: ADVANTAGES OF TECHNICAL ANALYSIS FOR ARABIC COFFEE FUTURE CONTRACTS IN BM&FBOVESPA
Revista de Contabilidade e Controladoria, ISSN 1984-6266
Universidade Federal do Paraná, Curitiba, v.5, n.2, p.91-106, maio/ago. 2013.
106
MATSURA, E. Comprar ou vender? Como investir na bolsa utilizando análise gráfica. 3.ed. São Paulo, SP:
Saraiva, 2006.
MÜLLER, C. A. S. Análise da efetividade das estratégias estáticas e dinâmicas de hedge para o mercado
brasileiro de Arabica coffee. 2007. Tese (Doutorado em Economia Aplicada). Universidade Federal de Viçosa,
Viçosa, MG, 2007.
MURPHY, J. J. Technical analysis of the financial markets: a comprehensive guide to trading methods and
applications. New York, N. Y.: New York Institute of Finance, 1999,
NEELY, C.; WELLER, P.; DITTMAR, R. Is technical analysis in the foreign exchange market profitable? A
Genetic Programming Aproach. Working Paper, Dez, 1997. Federal Reserve Bank of St. Louis: St. Louis, 1997.
NORONHA, M. Análise técnica: teorias, ferramentas, estratégias. Rio de Janeiro, RJ: Editec. 1995.
PEROBELLI, F. S. A volatilidade no mercado de café. Agroanalysis, v. 25, n. 4, p. 49-50, abril. 2005.
SAFFI, P. A. C. Análise técnica: sorte ou realidade? Revista Brasileira de Economia, v. 57, n. 4, p. 953-974,
out./dez. 2003.
SCHOUCHANA, F.; MICELI, W. M. Introdução aos mercados futuros e de opções agropecuários no Brasil. 3.
ed. São Paulo, SP: Bolsa de Mercadorias & Futuros, 2004.
TALATI, J. Fundamental vs. technical analysis. Futures Magazines. Chicago, p. 58-60, 2002.
TAVARES, M. D. F. Análise técnica aplicada aos mercados futuros. Rio de Janeiro, RJ: Ibmec/BM&F, 1998.
TOMEK, W. G.; PETERSON, H. H. Risk management in agricultural markts. The Journal of Futures Markets,
v. 21, n. 10, p. 951-985. 2001.
VARGA, G. Índice de Sharpe e outros indicadores de performance aplicados a fundos de ações brasileiros.
Working Paper, jun. 1999. Ibmec: São Paulo,1999.
VARIAN, H. R. Microeconomic analysis. 3. ed. New York, N.Y.: Norton & Company, 1992.