2011 departamento de ciÊncias da vida de... · alterações significativas tendo em conta os...
TRANSCRIPT

DEPARTAMENTO DE CIÊNCIAS DA VIDA
FACULDADE DE CIÊNCIAS E TECNOLOGIA UNIVERSIDADE DE COIMBRA
Effects of extreme weather events and large scale factors in the population of Crangon crangon (L.1758) in the Mondego estuary
David Garrido Dinis 2011
Dav
id D
inis
Ef
fect
s of e
xtre
me
wea
ther
eve
nts a
nd la
rge
scal
e fa
ctor
s in
the
popu
latio
n of
Cra
ngon
cr
ango
n (L
.175
8) in
the
Mon
dego
estu
ary
2011

DEPARTAMENTO DE CIÊNCIAS DA VIDA
FACULDADE DE CIÊNCIAS E TECNOLOGIA UNIVERSIDADE DE COIMBRA
Effects of extreme weather events and large scale factors in the population of Crangon crangon (L.1758) in the Mondego estuary
David Garrido Dinis 2011
Dissertação apresentada à Universidade de Coimbra para cumprimento dos requisitos necessários à obtenção do grau de Mestre em Ecologia Aplicada, realizada sob a orientação científica do Professor Doutor Miguel Pardal (Universidade de Coimbra)

! III!
Agradecimentos
A realização deste trabalho não é meramente resultado de um esforço
individual mas sim com a ajuda e apoio de várias pessoas, às quais quero
deixar aqui o meu especial agradecimento.
Ao Professor Doutor Miguel Pardal por me ter deixado entrar num excelente
grupo de trabalho, pela sua orientação científica, disponibilidade e apoio como
meu orientador, mas também pela amizade, paciência e exigência. Obrigado.
Ao Filipe, Ivan e Marina, pessoas que sem dúvida tornaram este trabalho
possível, sempre prontos a partilhar todo o seu conhecimento científico,
sabedoria, amizade e motivação. Por todas as horas de trabalho passadas e
por toda a ajuda, muito obrigado.
Quero agradecer a todas as pessoas do CFE pelo bom ambiente e convívio
que houve e também ao pessoal do IMAR que tornaram melhor todo este
percurso.
Um muito obrigado ao João que foi sem dúvida um amigo fundamental para a
realização desta tese, todo o apoio e incentivo muito obrigado! Obrigado
também ao resto do pessoal Joana Lucas, Ana Varela, Pedro, Rodolfo e muitos
outros que podiam ficar esquecidos se escrevesse a todos.

! IV!
À Marta por tudo o que me deu neste percurso, sugestões, força, apoio e
preocupação. Mas essencialmente por seres para mim quem és. Obrigado.
À minha família, base para tudo na minha vida mas em especial aos meus pais
e irmão, pois sem vocês não estava aqui. Um muito obrigado por tornarem isto
possível.
Para o meu avô João.

! V!
Resumo
Os estuários são usados como zonas de viveiro para uma grande
quantidade de espécies, estando sujeitos a constantes pressões
antropogénicas e ambientais. O objectivo deste trabalho foi verificar em que
medida os eventos climáticos extremos e factores de larga escala influenciam a
população de Crangon crangon no estuário do rio Mondego.
A monitorização no estuário decorreu de Junho de 2003 a Julho de 2010
com uma periodicidade mensal até 2006 e posteriormente bimensal, com
recurso a um arrasto de vara de 2 m, em cinco estações de amostragem ao
longo do gradiente de salinidade.
Entre 2003 e 2010 existiram períodos de seca, períodos de chuva
intensas e ondas de calor, que influenciaram as descargas de água doce no
estuário, tendo sido considerados de seca extrema os anos de 2005, 2007 e
2008. Durante este período, foram observados picos de densidades de juvenis
duas vezes por ano (verão e inverno). A população de C. crangon no estuário é
essencialmente constituída por juvenis e indivíduos adultos até um ano e meio.
Tendo em conta as densidades de C. crangon, os principais picos ocorreram
na primavera e verão e maioritariamente no braço Norte do estuário, tendo sido
o valor mais alto em Junho 2003 (134 indivíduos 1000m-2).
A produção secundária teve o seu valor mais elevado no ano de
2003/2004 (3.45 mg AFDW m-2 y-1) e o valor mais baixo no ano de 2007/2008
(0.62 mg AFDW m-2 y-1). Os valores da relação P/! obtidos foram mais baixos
nas comparado com outras populações existentes mais a norte.

! VI!
Apesar de não terem sido observadas alterações nos padrões de
recrutamento e de produção secundária, foram observadas alterações
espaciais no estuário, nomeadamente no local de fixação dos juvenis, visto
estes serem os que apresentam maior capacidade de osmorregulação,
conseguindo deslocar-se com mais facilidade no estuário até às zonas mais a
montante.
Foi também observado que os juvenis são os mais susceptíveis aos
factores ambientais de larga escala, nomeadamente a temperatura à superfície
da mar (SST), o índice NAO, o escoamento e a intensidade vento na
componente Norte-Sul. Em geral, a totalidade da população foi afectada
apenas pelo vento Norte-Sul, um indicador de eventos de afloramento costeiro.
Com este estudo, podemos concluir que a espécie de C. crangon, ao
contrário de outras espécies que vivem no estuário do Mondego, não sofreu
alterações significativas tendo em conta os factores climáticos extremos que se
verificaram durante o período em causa. No entanto, esta população, e
nomeadamente os juvenis, são influenciados em certa medida pelos factores
ambientais de larga escala, que condicionam o clima em Portugal continental.
Palavras-chave: Crangon cragon, eventos climáticos extremos, estuário do
Mondego, respostas populacionais

! VII!
Abstract
Estuaries are known for being nursery areas for a variety of species,
however, being subject of anthropogenic and environmental pressures, as
extreme weather events. The objective of this study was to assess how extreme
weather events and long-scale factors influence C. crangon populations in the
Mondego estuary.
The monitorization of the estuary was made from June 2003 to July 2010
with a monthly periocity until 2006 and after that bimonthly, by a 2m beam trawl
with a tickler chain and 5mm mesh-size in the cod end, in five sampling stations
along the salinity gradient.
Between 2003 and 2010 existed drought periods, heavy rain periods and
heat waves, which influenced runoff on the estuary, and the years of 2005,
2007 and 2008 were considered extremely dry. During this period, it was
observed density peaks of juveniles twice per year (summer and winter) being
the total density in the estuary higher in spring and summer. The C. crangon
population in the estuary is mainly composed by juveniles and adults up to one
and an half years.
Secondary production presented its highest value in the year of
2003/2004 (3.45 mg AFDW m-2 y-1) and the lowest in the year of 2007/2008
(0.62 mg AFDW m-2 y-1). The P/! ratio obtained were lower compared to those
obtained in other studies.
Despite not being observed modifications in the recruitment patterns and
secondary production, some spatial alterations in the estuary were observed,

! VIII!
mainly in the fixing spot of juveniles, as they were the ones with highest
osmorregulation capacity, being able to dislocate to the stations more upstream.
It was also noticed that juveniles are more susceptible to long-scale
environmental factors, mainly sea surface temperature (SST), NAO index,
runoff and north-south wind intensity. In general the total population was
affected by the north-south wind.
With this studie, we can conclude that C. crangon, unlike other species
that live in the Mondego estuary, did not suffer any significant alteration taking
into account the extreme weather events reported during the study period.
However, this populations, and mainly juveniles, are influenced at least to some
extent by environmental long-scale factors, that condition weather in continental
Portugal.
Keywords: Crangon cragon, extreme weather events, Mondego estuary,
population responses
! IX!
CHAPTER 1 – GENERAL INTRODUCTION 1
1.1. Estuaries 2
1.2. Mondego estuary 3
1.3. Global changes and extreme weather events 5
1.4. Brown shrimp Crangon crangon 6
1.5. Life cycle 7
1.6. Main objectives 8
CHAPTER 2 – MATERIALS AND METHODS 9
2.1. Sampling procedures and data acquisition 10
2.2. Sample analysis 11
2.3. Data analysis 12
CHAPTER 3 – RESULTS 15
3.1. Environment analysis 16
3.2. Population structure 23
3.2.1. General data 23
3.2.2. Abundance and secondary production 23
3.2.3. Population dynamics 25
CHAPTER 4 – DISCUSSION 29
4.1. Extreme weather events on coastal systems 30
4.2. Densities 31
4.3. Population distribution and dynamics 32
4.4. Parameters that influence the C. crangon. Reproduction, settlement and
recruitment 33
CHAPTER 5 – BIBLIOGRAPHIC REFERENCES 38

! 1!
Chapter 1
- GENERAL INTRODUCTION -

! 2!
1. General Introduction
1.1. Estuaries
Known as transition areas connecting the river and the marine system,
estuaries suffer permanent oscillations of temperature, oxygen, turbidity and
salinity from the brackish waters of the upper reaches to the euhaline
downstream areas. This salinity gradient combined with the normal typical
hydrodynamic fluctuations of freshwater flow and seawater invasion are
responsible for the distribution of the organisms in the estuary (Thiel et al.,
1995; Whitfield, 1999; Kimmerer, 2002; Leitão et al., 2007). That is why natural
variations like extreme weather events or man-made changes like dams or
dredging activities have such a huge impact on the estuarine species
(Kimmerer, 2002).
Due to their location, usually near big cities, the goods and services
provided by estuaries such as the tourism, recreational areas, protection
against floods, replenishment of coastal fisheries stocks, sediment and nutrient
cycling, among others, makes the estuaries a valuable ecosystem. All these
goods lead to intense human activity and as consequence the natural
environmental suffers dramatic changes (de Jonge et al., 2002; Dauvin &
Ruellet, 2009).
Another important characteristic of the estuaries is their role as nursery
and shelter areas, providing to the juveniles stages of many species high food
availability, favourable conditions for rapid growth and good survival and finding
refuge from predators (Beck et al., 2001).
Estuaries also have high levels of production (primary and secondary),
supporting a wide range of fishes and invertebrates (Beck et al., 2001). Due to

! 3!
all these features estuaries are placed among the most productive (Kennish,
2002; McLusky & Elliott, 2004; Dolbeth et al., 2007) and heavily populated
areas throughout the world (Nichols et al., 1986).
1.2 Mondego estuary
The Mondego estuary (40º08'N, 8º50'W) is a small estuary of 8.6 km on
the western coast of Portugal and a typical intertidal estuary (Lopes et al.,
2000). It comprises two arms (north and south) with very different hydrologic
features that separate at approximately 7 km from the shore and join again near
the mouth, being divided by the Murraceira Island.
The North arm is deeper, with 5 to 10 m depth at high tide and tidal range
of 2 to 3 m and constitutes the principal navigation channel and the location of
the Figueira da Foz harbour. The south arm is shallower, with 2 to 4 m depth at
high tide and tidal range of 2 to 3 m and it was silted up in the upstream areas
until 2006. Since 2006, the reestablishment of the communication between the
south and north arm led to an improvement in hydrodynamics and consequent
reduction of the residence time in the south arm (Neto et al., 20). Nevertheless,
freshwater flow is still carried mainly by the north arm. In the south arm the
circulation also depends on tides and on the relatively small freshwater input,
carried out through the Pranto River, a small tributary system, which is
regulated by a sluice, according to the water needs in the surrounding rice
fields. These characteristics make this arm particularly susceptible to
eutrophication due to the organic enrichment and low hydrodynamics. In the
south arm, about 75% of the total area consists of intertidal mudflats, while in

! 4!
the north arm they stand for less than 10% (Pardal et al., 2000, 2004; Marques
et al., 2003; Cardoso et al., 2004).
Presently anthropogenic pressure affects the Mondego estuary in several
ways. In the north arm there is the harbour and its maintenance and the
regularization of the river channel led to a rapid degradation in the area. The
northern arm receives the bulk of the discharge of the Mondego. The southern
arm is mostly controlled by the small Pranto River and tidal action (Marques et
al., 2007) suffering from raw sewage disposal and high nutrient inputs from
agricultural and fish farms in the upstream areas. Combined with a high water
residence time, this led to eutrophication processes, resulting in occasional
spring macroalgae blooms of Enteromorpha spp. over the past two decades
(e.g. Pardal et al., 2004; Dolbeth et al., 2007).
The Mondego estuary is an extensively studied system with published
works on fauna and flora, for instance ichthyoplankton (Ligia et al., 2011), fish
communities (Martinho et al., 2007), estuarine production (Dolbeth et al., 2007),
benthic food webs (Baeta et al., 2011), planktonic communities (Cotrim et al.,
2007), benthic species like Hydrobia ulvae or Scobicularia plana (Cardoso et
al., 2008) and macroinvertebrates like Carcinus maenas (Bessa et al., 2010)
and Crangon crangon (Viegas et al., 2007).

! 5!
Figure 1 – Mondego River estuary.
1.3 Global changes and extreme weather events
Despite all the concern about global changing and the consequences of
human impact in the environment, the emissions of greenhouse gases (GHG)
had been increasing in the atmosphere between 1970 and 2004 (~80%), and
the levels of carbon dioxide are at their highest level in at least 65,000 years
and continue to rise. This accumulation of GHG in the atmosphere will lead to
an increase of the global surface temperatures in about 1.1-6.4ºC by 2100 and
to several others problems associated, as the ocean acidification, sea level rise,
reduction in thickness and extent of glaciers, ice sheet and sea ice (IPCC,
2007).
As consequence extreme weather events will occur more often and with
higher intensity (Easterling et al., 2000; Alexander et al., 2006; Houghton,
2009), floods will be more regular (Santos et al., 2002), heat and cold waves
more frequent. Portugal suffered three severe drought periods in the last ten

! 6!
years (2003, 2005 and 2006) (Portuguese Weather Institute; Santos et al.,
2002) having a strong impact on coastal ecosystems, meaning that the normal
parameters of estuaries will change, provoking alterations on the reproduction
and recruitment patterns of estuarine species (Cardoso et al., 2007; Chainho et
al., 2007). There are some described cases of alteration in the Mondego
estuary due the extreme events on the H. ulvae, by wiping out part of its
population (Cardoso et al., 2008), decline on the macrobenthic communities,
degradation of the estuary (Cardoso et al., 2008), decline on the recruitment of
nursery species (Martinho et al., 2009) and compromises the restoration of the
estuary (Grilo et al., 2011).
1.4. Brown shrimp Crangon crangon
Crangon crangon (Linnaeus, 1758) belongs to the Decapoda order and
Crangonidae family. It has a wide distribution range along the Europe coast
from the White Sea in the north Russia to the Mediterranean and Black Seas
(Tiews, 1970; Gelin et al., 2000). It is present in Malta (Micaleff & Evans, 1968)
and Morocco (Campos & Van der Veer, 2008), within the latitude parallels of
34°N and 67°N (Mediterranean, temperate and cold climatic zones).
It has an important role on near-shore ecosystems for being a highly
abundant prey (Nehls & Tiedemann, 1993; Hampel et al., 2005) as well as a
predator (Norkko, 1998; Hiddink et al., 2002; Wennhage, 2002). As a prey it
plays an important role to some juveniles and adult fishes (McLusky & Elliot,
2004). On the Mondego estuary C. crangon is predated by several species with
relevant economic value as Platichthys flesus, Solea solea and Dicentrarchus

! 7!
labrax (Martinho, 2005) and is also an important benthic predator of other
species (Phil & Rosenberg, 1984; Beukema, 1992; Oh et al., 2001).
This species is commercially exploited and consequently it has been
intensively studied in terms of abundance and stock (Phil & Rosenberg, 1982;
Spaargaren, 2000; Siegal et al., 2005), fisheries by-catch and discards
(Berghahan et al., 1992; Berghahn & Purps, 1998; Gamito & Cabral, 2003) and
migratory behavior (Hartsuyker, 1966; Boddeke, 1976; Janssen & Kuipers,
1980). C. crangon is caught in estuaries and inshore areas of the countries
bordering the North Sea and has a market value between €50-70 million per
year (Polet, 2002; Anon, 2006). Along the years there have been some
oscillations in terms of landings but its highest catch occurred in 2006 – 37,000t
(Innes & Pascoe, 2007). In 1997 the estimate earnings were about 98.2 million
euros (Pascoe & Revill, 2004), and in 2006 about 91.3 million euros (Innes &
Pascoe, 2007).
1.5. Life cycle
The reproduction occurs in more saline waters offshore, usually in sandy
or muddy areas in a depth between 10-20m (Tiews, 1954; Henderson &
Holmes, 1987. The reproduction occurs almost continuously throughout the
year, with main spawning seasons in spring/summer (Viegas et al., 2007). The
growth is irregular due the rigid exoskeleton and therefore presents several
moultings (Smaldon et al., 1993). After the hatch of the eggs, a free-floating
planktonic larval stage migrates to coastal waters (van Donk & De Wild, 1981)
developing into benthic post-larvae that invade estuaries and shallow waters,
where they find abundant sources of food and grow (Tiews, 1970; Boddeke et

! 8!
al., 1976; Beukema, 1992). After six months in the estuary they start to be
reproductive active (Viegas et al., 2007), becoming adults and move to deeper
waters, where they reproduce.
1.6. Main objectives
Climate changes are expected to affect ecosystems in many ways and it
is essential to understand and predict the ecosystems’ responses to this new
source of stress. Taking this into account, the main objectives of this study were
to provide information on how climate changes, and consequently the extreme
weather events, will affect the C. crangon population in the Mondego estuary
and compare and extrapolate these changes to other ecosystems. Another goal
was to know with more detail which factors among the hydrological features,
namely coastal wind speed and direction, currents, salinity, turbidity, water
temperature precipitation and large ocean‐atmosphere patterns such as the
North Atlantic Oscillation (NAO), have significant influence on the reproduction,
settlement, recruitment patterns and distribution of C. crangon.

! 9!
Chapter 2
- MATERIALS AND METHODS -

! 10!
2. Materials and methods
2.1. Sampling procedures and data acquisition
Sampling was performed at five stations ranging from marine to
freshwater environments (Fig.2). Surveys took place monthly or every two
months from June 2003 to July 2010 (with exception for September-October
2004 and October-December 2008, due to technical constraints). Samplings
were made during the night, at high tide of spring tides due to better gear
efficiency.
The gear used was a 2 meters beam trawl with one tickler chain and 5
mm mesh size in the cod end. Three trawls were towed at each station for a
mean of 5 minutes each, covering at least an area of 500m2. Bottom water was
analyzed for salinity, temperature, pH and dissolved oxygen.
Hydrological data was obtained from INAG – Portuguese Water Institute
(http://snirh.inag.pt). Both monthly precipitation (from Jane 2003 to July 2010)
and long‐term monthly average precipitation (from 1961 to 1991) was obtained
from the Soure 13F/01G station. Freshwater runoff was acquired from INAG -
Portuguese Water Institute (http://snirh.inag.pt) station Açude Ponte Coimbra
12G/01A, near the city of Coimbra (located 40 km upstream).
North Atlantic Oscillation (NAO) Index (given by the pressure difference
between Lisbon (Portugal) and Reykjavik (Iceland) data was supplied by
NOAA/National Weather Service – Climate Prediction Center
(http://www.cdc.noaa.gov). Sea surface temperature (SST), wind data, both
north‐south and east‐west components, were acquired from the International
Comprehensive Ocean Atmosphere Data Set (ICOADS) online database

! 11!
(http://dss.ucar.edu/pub/coads, Slutz et al., 1985) concerning the 1º Lat x 1º
Long square nearest to the Mondego estuary.
Figure 2 – Location of the five sampling stations in the Mondego
estuary (M, N1, N2, S1 and S2).
2.2. Sample analysis
After sampling the shrimps were frozen and stored. Before analysis,
shrimps were unfrozen and preserved in 4% formaldehyde for 24 hours and
then transferred to 70% ethanol for long-term storage.
Carapace length (CL) was measured as the shortest distance between
the posterior margin of the orbit and the mid-dorsal posterior edge of the
carapace (to the nearest 0.01 mm using a binocular micrometer). The total
length (TL) was measured similarly from the posterior margin of the orbit to the

! 12!
tip of the telson. A regression between the CL and the TL was also used
(Viegas et al., 2007):
TL = 4.7906*CL-1.1295 (r2=0.98, N=702)
To determinate the sex three different morphological characteristics were
observed: the size and shape of the endopodite of the first pleopod and the
presence or absence of the appendix maculina. Shrimps with CL<3.5mm were
considered immature.
2.3. Data analysis
The population structure was defined by tracking recognizable cohorts
from successive sampling dates. Spatial samples were pooled together and
analyzed through size frequency distribution of successive sampling dates and
cohorts determined using FAO-ICLARM Stock Assessment Tools (FiSAT
software, provided in http://www.fao.org/fi/statist/fisoft/fisat/index.html). The
cohorts were identified using Bhattacharya’s and NORMSEP procedure, which
provided the mean length, standard deviation, population sizes and separation
indices for the identified age groups (Gayanilo et al., 2005).
After recognition of the cohorts, the annual production was estimated
with the cohort increment summation method (Winberg, 1971), according to:
!!" =!! + !!!!
2 × !!!! − !!!!!
!!!
where Pcn is the growth production (g WW m-2 y-1 ) of cohort n; N is the
density (ind m-2); ! is the mean individual weight (g WW m-2); t and t+1, are
consecutive sampling dates. Population production estimates correspond to the
sum of each cohort production (Pcn). Negative production values were not

! 13!
accounted for the overall shrimps estimates, which were regarded as no
production.
The mean annual biomass (!) was estimated according to:
! = 1! × (!!"
!!
!!!!!")
where T is the period of study, which is always 365 days (yearly cycles)
as the mean annual biomass is being computed; Nc is the number of cohorts
found in the study period; Bcn is the mean biomass (g WW m-2) of cohort n; tcn is
the time period of the cohort n (days), from the first appearance of individuals
until they disappeared.
The environmental data (precipitation, runoff, sea surface temperature,
estuarine temperature and salinity) was analyzed with Primer, with Principal
Components Analysis (PCA) after data normalized.
The shrimp population was analysed according to two distinct periods:
non-drought years and drought years, defined by reports of the Portuguese
Weather Institute (Portuguese Weather Institute 2010, www.meteo.pt) and
explored through PCA. The population density was divided into juveniles
(individuals!≤ 3.5 mm of CL) males, females and ovigerous females. This data
was explored using 2-way ANOSIM (from PRIMER routines) for the factors
season and year. This allowed to check if there were differences in the density
patterns for drought and non-drought periods. Previously, similarities in the
density data were calculated as the Bray-Curtis coefficient after square-root-
transformation of the raw data to scale down the scores of the most abundant
groups (Clarke & Warwick, 2001).

! 14!
The inter-annual relationship between the densities (juveniles and total
density) and the environmental patterns (predictors) were analyzed with a
Generalized Linear Model (GLM) in R software (R Development Core Team,
2008), where the number of shrimps is related to the environmental parameters.
The GLM was built with an additive methodology: environmental parameters
were tested independently for significance and subsequently, significant
parameters were added to determine the residual deviance, the percentage
explained by each parameter and the total percentage of the deviance
explained. Juvenile and total densities (the response variables) were modelled
as a function of salinity, runoff, precipitation, sea surface temperature, the North
Atlantic Oscillation, dissolved oxygen, wind north-south and wind east-west.
The final model was fitted only with the significant variables. For all the
variables, three distinct scenarios were tested, to the juveniles and to all the
population: one scenario with the parameters values matching with the density
months, other scenario the parameters are one months prior of the
corresponding month of density and a third one were the parameters are two
months prior, since, according the biology of the specie, the
oceanic/atmospheric factors can have a delay influence on the estuarine
colonization, mainly on juveniles and larvae, to the overall population, intrinsic
factors like salinity, temperature, runoff and wind can affect their abundance
and distribution. This approach has already been applied to the fish community
in the estuary (Martinho et al., 2007). A significance level of 0.05 was used in all
test procedures.

! 15!
Chapter 3
- RESULTS -

! 16!
3. Results
3.1. Environment analysis
The study period of seven-years revealed some atypical modifications on
the estuary. Several years of drought with reduced precipitation originated a
significant reduction in freshwater runoff into the estuary (Fig. 4). The hydrologic
years of 2003, 2006 and 2009 were considered as regular, while 2004, 2005,
2007 and 2008 (Fig. 3) were extremely dry years, being the hydrologic year
2004 (from June 2004 to May 2005) the one with the lowest values of
precipitation (422.6 mm against 892.2 mm for 1961–1991 mean, classified as
the worst drought since 1931 by the Portuguese Weather Institute). In autumn,
2006 the levels of precipitation were high, making the salinity levels drop to the
lowest levels during the study period (salinity value: 0) (Fig. 5), and the highest
levels of salinity were in 2007 and 2009, making the station more upstream with
almost the same value of salinity than the station M downstream (23 and 33
respectively).
Some heat waves occurred (Portuguese Weather Institute) in 2003, 2005
and 2009, being 2005 the driest year and the spring of 2009 the driest season
since 1931, affecting the average water temperature on the estuary (the highest
range of average water temperature was 8.8ºC in January and 22.7ºC in July, in
2005) and salinity (period of dry from March to October 2009). 2007 was the
year with the second lowest annual precipitation in the last 60 years
(Portuguese Weather Institute).

! 17!
Figure 3 – PCA with the environmental parameters along the study
period organized per year
!
Figure 4 – Long-term variation of precipitation and river runoff in the
Mondego River basin.
!
0
200000
400000
600000
800000
1000000
1200000
1400000
1600000
0
50
100
150
200
250
Jan/
03
Abr
/03
Jul/0
3 O
ut/0
3 Ja
n/04
A
br/0
4 Ju
l/04
Out
/04
Jan/
05
Abr
/05
Jul/0
5 O
ut/0
5 Ja
n/06
A
br/0
6 Ju
l/06
Out
/06
Jan/
07
Abr
/07
Jul/0
7 O
ut/0
7 Ja
n/08
A
br/0
8 Ju
l/08
Out
/08
Jan/
09
Abr
/09
Jul/0
9 O
ut/0
9 Ja
n/10
A
br/1
0 Ju
l/10
Riv
er R
unof
f (da
m3)
Pre
cipi
tatio
n (m
m)
runoff precipitation avg (1961 - 1991)

! 18!
Figure 5 – Monthly variation of salinity at stations M (most
downstream station), N2 (most upstream station) and estuarine
average salinity values (A); and estuarine average temperature and
sea surface temperature (SST) for the 1º Lat x 1º Long nearest to the
Mondego estuary (B).
0.0 5.0
10.0 15.0 20.0 25.0 30.0 35.0 40.0
Jun-
03
Sep
-03
Dec
-03
Mar
-04
Jun-
04
Sep
-04
Dec
-04
Mar
-05
Jun-
05
Sep
-05
Dec
-05
Mar
-06
Jun-
06
Sep
-06
Dec
-06
Mar
-07
Jun-
07
Sep
-07
Dec
-07
Mar
-08
Jun-
08
Sep
-08
Dec
-08
Mar
-09
Jun-
09
Sep
-09
Dec
-09
Mar
-10
Jun-
10
Salin
ity
M N2 Estuarine average
0.0
5.0
10.0
15.0
20.0
25.0
30.0
Jun-
03
Sep
-03
Dec
-03
Mar
-04
Jun-
04
Sep
-04
Dec
-04
Mar
-05
Jun-
05
Sep
-05
Dec
-05
Mar
-06
Jun-
06
Sep
-06
Dec
-06
Mar
-07
Jun-
07
Sep
-07
Dec
-07
Mar
-08
Jun-
08
Sep
-08
Dec
-08
Mar
-09
Jun-
09
Sep
-09
Dec
-09
Mar
-10
Jun-
10
Wat
er te
mpe
ratu
re ºc
Estuarine average SST
A
B

! 19!
The Sea Surface Temperature (SST) ranged from 10ºC to 23.5ºC, with
the lowest value in March 2004 and the highest value in August 2006 (Fig. 5).
Considering north-south wind, the average values were negative in all
years (hydrologic year, from June to May) during the study period, which
contributed to the occurrence of upwelling, being the months of January 2005,
March 2006 and November 2008 with the most intensive wind from north to
south with values of -17 m s-1, -19.8 m s-1 and -14.5 m s-1 respectively. The year
of 2005 had the lowest value (-4.23 m s-1) and the year of 2008 the nearest zero
value (-0.89 m s-1).
The NAO index reveal to be more near to null values, however almost all
years had negative values between -0.93 and -0.041 except the year of
2003/2004 that had a positive value (0,18) (Fig. 6) The variation along the years
had been from -2.24 in October 2006 and 1.68 in May 2009.
!
A
-25 -20 -15 -10
-5 0 5
10
Jun/
03
Out
/03
Fev/
04
Jun/
04
Out
/04
Fev/
05
Jun/
05
Out
/05
Fev/
06
Jun/
06
Out
/06
Fev/
07
Jun/
07
Out
/07
Fev/
08
Jun/
08
Out
/08
Fev/
09
Jun/
09
Out
/09
Fev/
10
Jun/
10
m s
-1
Wind N-S

! 20!
Figure 6 – Environmental variables Wind north-south (A) and North
Atlantic oscillation index (B).
After knowing that there were no significant differences among the
hydrologic years (two-way Anosim R=0,164, p<0.001), the factors responsible
for the variations on population densities were assessed.
Among all the parameters tested to see if had some significance to
explain the distribution and recruitment of C. crangon, the ones that explain
some part of it are the Runoff, Wind north-south, sea surface temperature (SST)
and the North Atlantic Index (NAO). However they do not have the same impact
among all the population, some of them are significant for juveniles during
recruitment and others to the population in general.
The data was organized by the parameters corresponding to two months
earlier, one month earlier and the corresponding month of the changes.
B
-3 -2 -1 0 1 2
Jun/
03
Out
/03
Fev/
04
Jun/
04
Out
/04
Fev/
05
Jun/
05
Out
/05
Fev/
06
Jun/
06
Out
/06
Fev/
07
Jun/
07
Out
/07
Fev/
08
Jun/
08
Out
/08
Fev/
09
Jun/
09
Out
/09
Fev/
10
Jun/
10
NAO

! 21!
Table I – Analysis of deviance table for the gamma-based GLM fitted
to the total densities and juveniles densities (Res. Dev. – Residual
deviance; % Expl. – Percentage of the deviance explained by the
model).
Parameters
Date of environmental
parameters p-value Res. Dev. Deviance % Exp.
Densities of Juveniles
Runoff same month 0.00629 24.11 36.13 33.27
Wind N-S same month 0.04239 26.52 36.13 26.61
SST 1 month prior 0.0431 27.842 36.13 22.94
SST 2 months prior 0.0319 27.629 36.13 23.53
NAO 2 months prior 0.00238 24.287 36.13 32.78
Total Dens. Wind N-S same month 0.036 12.47 14.63 14.77
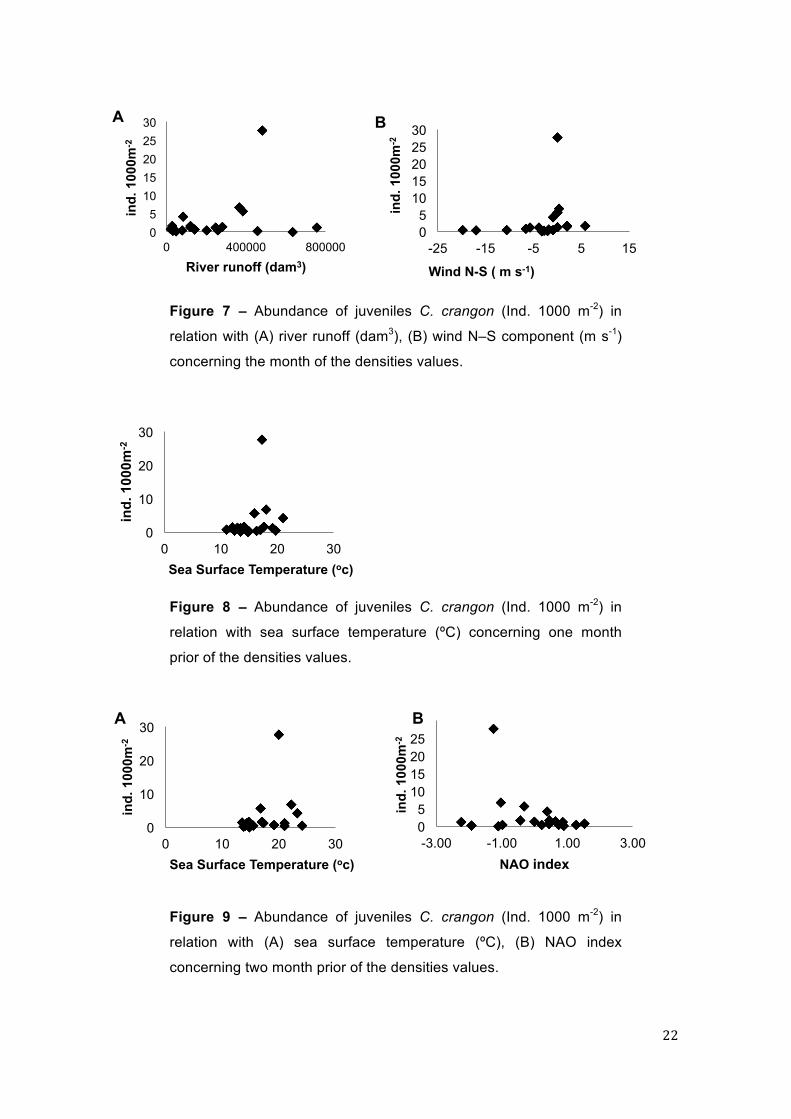
Considering the juvenile population, the runoff explained 33.27% of the
densities, highest runoff, biggest are the densities of juveniles in the estuary,
and with the wind north-sout explained 26.61% of the density, telling that values
nearest zero are the best to recruitment (Table 1; Fig. 7). The SST explained
22.94% and the increases in temperature were beneficial to the juveniles
densities (at least to some extent) (Fig. 8 and 9). The NAO index showed that
negative values are more favourable to the juveniles (Fig.9), and explained
32.78%. To the general population only the wind north-south had a significant
influence explaining 14.77% of the density (Fig.10).
! 22!
0
10
20
30
0 10 20 30
ind.
100
0m-2
Sea Surface Temperature (oc)
0
10
20
30
0 10 20 30
ind.
100
0m-2
Sea Surface Temperature (oc)
0 5
10 15 20 25 30
0 400000 800000
ind.
100
0m-2
River runoff (dam3)
0 5
10 15 20 25 30
-3.00 -1.00 1.00 3.00
ind.
100
0m-2
NAO index
Figure 7 – Abundance of juveniles C. crangon (Ind. 1000 m-2) in
relation with (A) river runoff (dam3), (B) wind N–S component (m s-1)
concerning the month of the densities values.
Figure 8 – Abundance of juveniles C. crangon (Ind. 1000 m-2) in
relation with sea surface temperature (ºC) concerning one month
prior of the densities values.
Figure 9 – Abundance of juveniles C. crangon (Ind. 1000 m-2) in
relation with (A) sea surface temperature (ºC), (B) NAO index
concerning two month prior of the densities values.
0 5
10 15 20 25 30
-25 -15 -5 5 15
ind.
100
0m-2
Wind N-S ( m s-1)
A
A
B
B

! 23!
D
Figure 10 – Abundance of C. crangon (Ind. 1000 m-2) in relation with
wind N–S component (m s-1) concerning the month of the densities
values.
3.2. Population structure
3.2.1. General data
During the study were caught a total of 21417 individuals, 8011 of them
were juveniles, 5098 males, and 8308 females (405 berried females). Most of
them were caught on the stations M and N2 (43.5% and 28.4% respectively.
The smaller juveniles, corresponding to the post-larvae stage, had 1.23mm CL
(5mm TL), the biggest one was a female with 15.00mm CL (70.7mm TL) caught
on February 2010, and the biggest male had 9.14mm CL (42.6mm TL) caught
on November 2009.
3.2.2. Abundance and secondary production
C. crangon reached higher densities mainly on the spring and summer,
presenting highest values in June 2003, April 2004 and July 2005 (134, 112 and
79 individuals per 1000m-2, respectively), staying the rest of the study period
more constant in about approximately 50 individuals per 1000m-2 with two peaks
0 20 40 60 80
100
-25.00 -15.00 -5.00 5.00 15.00
Ind.
100
0 m
-2
Wind N-S (m s-1)

! 24!
per year, in spring and summer. The north arm was the most responsible for
these density peaks (Fig. 11).
The secondary production (Fig. 11) had peaks more defined than the
density peaks, occurring mainly in winter (December) and summer (July)
however there were some peaks in spring too (April and May), matching with
the juvenile peaks.
0 20 40 60 80
100 120 140 160
Jun/
03
Set
/03
Dez
/03
Mar
/04
Jun/
04
Set
/04
Dez
/04
Mar
/05
Jun/
05
Set
/05
Dez
/05
Mar
/06
Jun/
06
Set
/06
Dez
/06
Mar
/07
Jun/
07
Set
/07
Dez
/07
Mar
/08
Jun/
08
Set
/08
Dez
/08
Mar
/09
Jun/
09
Set
/09
Dez
/09
Mar
/10
Jun/
10
Den
sity
(ind
. 100
0 m
-2)
0 10 20 30 40 50 60 70 80
Jun/
03
Set
/03
Dez
/03
Mar
/04
Jun/
04
Set
/04
Dez
/04
Mar
/05
Jun/
05
Set
/05
Dez
/05
Mar
/06
Jun/
06
Set
/06
Dez
/06
Mar
/07
Jun/
07
Set
/07
Dez
/07
Mar
/08
Jun/
08
Set
/08
Dez
/08
Mar
/09
Jun/
09
Set
/09
Dez
/09
Mar
/10
Jun/
10 D
ensi
ty (i
nd.1
000m
-2)
A
B

! 25!
Figure 11 – Density variation (A), juveniles’ density variation (B) and
secondary production (C), in the estuary.
3.2.3. Population dynamics
The number of juveniles was higher in the stations of the north arm,
having the biggest percentage on the M station (35% of all the juveniles along
the study period). However there were some exceptions, for example in 2005
there were more juveniles on the station N2, and after June 2007 the number of
juveniles were almost the same on both north arm stations, being the main
influence on the densities observed in the estuary during the reproduction
season. There are two peaks of juveniles per year, one bigger on the summer
and other with smaller values in the winter (Fig. 12).
0 0.2 0.4 0.6 0.8
1 1.2 1.4
Jun/
03
Set
/03
Dez
/03
Mar
/04
Jun/
04
Set
/04
Dez
/04
Mar
/05
Jun/
05
Set
/05
Dez
/05
Mar
/06
Jun/
06
Set
/06
Dez
/06
Mar
/07
Jun/
07
Set
/07
Dez
/07
Mar
/08
Jun/
08
Set
/08
Dez
/08
Mar
/09
Jun/
09
Set
/09
Dez
/09
Mar
/10
Jun/
10 m
g A
FDW
m-2
mon
th-1
C

! 26!
Figure 12 – Number of juveniles (CL < 3.5 mm) per 1000 m2 on the
five sampling station along the study.
!
!Figure 13 – Crangon crangon estimated growth for each cohort (all
sampling stations combined) during the study period.
0 10 20 30 40 50 60 70 80 90
100
Jun/
03
Set
/03
Dez
/03
Mar
/04
Jun/
04
Set
/04
Dez
/04
Mar
/05
Jun/
05
Set
/05
Dez
/05
Mar
/06
Jun/
06
Set
/06
Dez
/06
Mar
/07
Jun/
07
Set
/07
Dez
/07
Mar
/08
Jun/
08
Set
/08
Dez
/08
Mar
/09
Jun/
09
Set
/09
Dez
/09
Mar
/10
Jun/
10
Ind.
100
0m -2
M S1 S2 N1 N2
N2!187
M!197
M!318
Drought +
Heat wave Heat wave
Heavy rains
Heat wave
Drought
Heat wave
0
2
4
6
8
10
12
14
Jun/
03
Sep
/03
Dec
/03
Mar
/04
Jun/
04
Sep
/04
Dec
/04
Mar
/05
Jun/
05
Set
/05
Dez
/05
Mar
/06
Jun/
06
Set
/06
Dez
/06
Mar
/07
Jun/
07
Set
/07
Dez
/07
Mar
/08
Jun/
08
Set
/08
Dez
/08
Mar
/09
Jun/
09
Set
/09
Dez
/09
Mar
/10
Jun/
10
CL
(mm
)

! 27!
The appearance of juveniles in the estuary were mainly twice per year,
one on the months of November and December and another on February,
March and April (Fig. 13). This appearance is usually few months before the
density peaks. They grow on the estuary during two years into the size of
approximate 10mm CL, however there are some rare cases of adults that get
into the estuary, having a CL around 13mm not making parte the normal
population in the estuary.
The growth rate is almost the same between the two periods of
recruitment, having the individuals of the cohorts of Autumn-Winter 6.45mm CL
±0.37(29.8mm TL) after one year and the individuals of the spring cohorts
6.21mm CL ±0.23 (28.6mm TL). The maturations (CL ≥3.5mm) occur after six
months in the estuary.
Figure 14 – Number of berried females per 1000 m2 on the five
sampling station along the study.
0!1!2!3!4!5!6!7!
Jun-
03
Sep
-03
Dec
-03
Mar
-04
Jun-
04
Sep
-04
Dec
-04
Mar
-05
Jun-
05
Sep
-05
Dec
-05
Mar
-06
Jun-
06
Sep
-06
Dec
-06
Mar
-07
Jun-
07
Sep
-07
Dec
-07
Mar
-08
Jun-
08
Sep
-08
Dec
-08
Mar
-09
Jun-
09
Sep
-09
Dec
-09
Mar
-10
Jun-
10
Ind.
100
0 m
-2
M! S1! S2! N1! N2!
N1 N1 M N1 19 25 10 17
Drought +
Heat wave
Heavy rains
Heat wave
Heat wave
Drought
Heat wave

! 28!
The berried females had some peaks of density (Fig. 14), mainly on the
months with higher temperature. There were five peaks on the station N1 on the
months of June and July of the year’s 2003, 2005, 2006, 2009 and 2010, two on
the station S1 in July 2004 and May 2005, and during the cold months they stay
on the station M, on March 2007 January 2008 and February 2009.
Table II – Year variation of production (P), biomass (B) and P/! ratio
along the seven years of the study period, for the C. crangon, and
corresponding weather events.
hydrologic year
P (mg AFDW m-2 y-1)
B (mg AFDW m-2 y-1)
P/B (mg AFDW m-2 y-1) weather event
2003/2004 3.45 0.85 4.08 Regular 2004/2005 1.43 0.27 5.29 Drought 2005/2006 1.72 0.49 3.48 Drought + Heat wave 2006/2007 2.39 0.65 3.70 Regular 2007/2008 0.62 0.22 2.83 Drought 2008/2009 1.65 0.28 5.93 Drought 2009/2010 2.15 0.56 3.82 Regular
The annual secondary production (P) of the population of C. crangon was
estimated with values between 3.45 mg AFDW m-2 year-1 in 2003/2004 and 0.62
mg AFDW m-2 year-1 in 2007/2008. The annual biomass (!) had values between
0.85 and 0.22 mg AFDW m-2 year-1 giving a relation P/! of 3.4 and 0.62.

! 29!
Chapter 4
- DISCUSSION -

! 30!
4. Discussion
4.1. Extreme weather events on coastal systems
Costal ecosystems are subjected to several anthropogenic stressors and
usually they interact with each other, having an impact on biodiversity and
ecosystem function (Vinebrooke et al., 2004; Dolbeth et al., 2007). Besides
loading impacts such as eutrophication and more recently the recovery phase of
the Mondego estuary, this estuary has been suffering the effect of extreme
weather events that occurred with more frequency and intensity during the last
decade. The drought periods have a huge impact on the aquatic system by
reducing the flow of freshwater in the estuaries (Tallaksen et al., 1997).
C. crangon unlike other species on the Mondego estuary like the Solea
lascaris (Martinho et al., 2007), Hydrobia ulvae (Cardoso et al., 2008),
Scobicularia plana (Cardoso et al., 2008) and Carcinus maenas (Bessa et al.,
2010) did not seem to have suffered any significant alteration along the study
period, having just some spatial adjustments. It is known that C. crangon can
live in temperatures between 6 and 30ºC (Abbott & Perkins 1977; Jeffery &
Revill 2002, Freitas et al., 2007), and in the study period it was only observed
minimum and maximum temperatures of 8.8ºC and 22.7ºC, respectively.
However, the salinity levels directly affect the temperature tolerance of C.
crangon (at low temperatures shrimps prefer high salinities, while at high
temperatures, low salinities are preferred) (Broekema, 1942). Nevertheless, the
mean salinity levels during the study period were never higher than 32 and
lower than 10.

! 31!
4.2. Densities
Densities varied along the period of study and presented peaks of
juveniles in October, November and December and in February, March and
April, which can be related to salinity values inside the estuary. Larvae are
polyhaline (Criales & Anger, 1986), which can suggest that they develop during
the months with low precipitation (therefore high salinity), which are the months
previous to the ones where cohorts appeared. As they take few months to enter
the estuary (Campos & Van der Veer, 2008), they start to appear in autumn and
winter months, as shown by the results.
In general, adult shrimps maintain constant densities in the estuary
(approximately 60 individuals per 1000 m2) along the years, however there are
some tendencies of placement within the estuary and some factors that can
explain a part of our density observations. It is known that there are important
factors that influence the recruitment of the juveniles such as the runoff, wind
north-south, sea surface temperature and the NAO index. However they have a
response on different times of the recruitment. Our observations indicate that
the SST and the NAO index influences the recruitment in an earlier stage and
the runoff and the wind north-south more directly. It is unclear if the larvae are
transported passively (Rijnsdorp et al., 1985) or if they are able to affect this
transport selectively (called selective tidal transport, as observed in flatfish
species) by swimming up from the seabed during flood tides and remaining on
the seabed during ebb tides (Rijnsdorp et al., 1985; Jager 1999). The results
indicate that they can have a selective transport.

! 32!
4.3. Population distribution and dynamics
The distribution of the specie along the estuary was according to the
different environmental characteristics of each station, being the principal
characteristics: temperature (Beukema 1979; Spaargaren 1980; Henderson &
Holmes 1987), salinity (Tiews 1970; Labat 1977a, b; Marques 1982; Henderson
& Holmes 1987; Gelin et al., 2001a, b), light intensity/day length (Spaargaren,
2000) and food conditions (Tiews, 1970; Boddeke, 1976; Spaargaren, 2000). By
affecting the physiological performance of shrimps, this parameters are also
responsible for the migration patterns, both tidally (Janssen & Kuipers, 1980),
daily (Hartsuyker, 1966) and seasonally.
The juveniles, males, females and berried females have different ranges
of optimal levels of salinity, temperature and O2. Males are less capable of
osmorregulating and thus tolerating lower levels of salinity (Lloyd & Yonge,
1947). Due to that, they do not get to the station more upstream (N2).
The juveniles seem to prefer lower salinities than adults (Marques, 1982).
They swim upstream were the competition is lower and the environment is more
favourable. The juveniles had their main distribution in stations M and N1,
although when extreme weather events occur this distribution changed and
juveniles appear in other stations, such as N2 (July 2005). This can be
explained by the fact that when these events occur, the stations M and N1 are
overpopulated by adult males and females, so juveniles migrate upstream,
where they find better conditions (i.e. food availability, shelter, low predation),
although the percentage on the most upstream station (N2) of juveniles is not
too big. Around 10% of juveniles per year, except in 2004/2005 and in
2008/2009 when the percentage were higher on the station N2 (47% and 20%,

! 33!
respectively), having this higher percentages just when the conditions are
favourable, in this case droughts.
The females are more sensitive to the temperature and salinity preferring
high salinity when the temperature is lower and lower salinity when the
temperature is high (Broekema, 1942). So, when temperature was lower the
density on the station M was higher and when the temperature was higher they
moved to the station S2.
Considering the berried females, salinity is the main factor affecting its
distribution. July of 2005 was the month when highest numbers of berried
females were present in the estuary. This was due to the preference of berried
females for high salinity and after these extreme weather events, the salinity in
estuary increased. This pattern was also found in August, 2003, June 2006,
March 2007, September 2009 and July 2010, all months when extreme weather
events occurred, increasing the salinity in the estuary.
4.4. Parameters that influence the C. crangon. Reproduction, settlement
and recruitment
From the GLM analysis, SST, NAO, river runoff and the north-south wind
component were the parameters (predictors) that significantly influenced the
inter-annual peak abundance patterns of juvenile populations. Other
environmental parameters that may influence this species’ abundance, such as
salinity or dissolved oxygen were not considered significant. Taking into account
the species’ biology, which include the migration of newly hatched larvae from
coastal areas to estuaries, three distinct scenarios were evaluated: the direct
response to the environmental parameters, and with a time lag of one and two

! 34!
months between the environmental parameters and the observed densities of
juveniles and the total population.
SST was one of the most important predictors explaining the catches of
C. crangon juveniles, when considering a time lag of one and two months.
Although the total percentage explained was somewhat low, a general trend
could be observed, in which higher SST values corresponded to higher
densities. In fact, temperature is an important factor to the settlement of
juveniles, and it seems that 25ºC is the optimal temperature to their growth
(high limit is about 30ºC) (Freitas et al., 2007; Campos & Van der Veer, 2008).
The temperature has an important role on the life cycle of the C.
Crangon: in his growth (Tiews 1954), incubation eggs period (Boddeke &
Becker, 1979), time to sexually maturity (Meredith 1952), the timing of
immigration and settlement of shrimp larvae (Beukema 1992) and also affects
the salinity tolerance.
The NAO is a large-scale oceanographic process that influences the
general climate patterns over the North Atlantic Ocean, North America and
Europe, such as wind speed and direction, air temperature, sea surface
temperature and rainfall (Hurrel et al., 2003). The negative phase of the NAO
generally induces wet weather in southern Europe and dry weather in northern
Europe, while a positive phase induces an opposite pattern. In addition, the
NAO has been correlated with a range of ecological processes, such as fish
stocks and landings (Attrill & Power, 2002; Teixeira et al., 2009). On the
Portuguese coast, the NAO has been determined to influence not only the sea
surface temperature (SST), but also the wind and current patterns (Henriques et

! 35!
al., 2007), which can have a synergistic effect on the factors that interact
directly with recruitment variability.
In the present work, the NAO significantly influenced the catches of
juveniles with a time lag of two months, with the negative phase being related to
higher juvenile densities. Considering the influence of the NAO on the
environmental conditions described previously, the spawning and recruitment
processes on the coastal area may have been influenced up to some degree. A
similar pattern has been observed in the Thames estuary (United Kingdon) by
Attrill and Power (2002), in which the NAO significantly influenced the
abundance of C. crangon over a 16-year period.
Coastal wind speed and direction, particularly the north-south
component, was also significant in explaining the abundance trends of juveniles
and the whole population, measured in the corresponding month. The negative
values of the north-south wind (which component correspond to northerly
winds), the dominant winds in the Portuguese coast, are usually responsible for
coastal upwelling, inducing also Ekman transport of the surface water away
from the coast (Huthnance, 1995; Smyth et al., 2001; Mason et al., 2005). In
this case, the wind blows parallel to the coast, which tends to drive the ocean
surface currents to the right of the wind direction, pushing surface waters
offshore. As surface waters are pushed offshore, water is drawn from below to
replace them. The upward movement of this deep, colder water is called
upwelling, creating a potential barrier to the migration of shrimps into estuarine
waters. In agreement, in the present work, juvenile and the whole population
higher densities were observed when wind values were close to zero, reducing

! 36!
the possibility of turbulence and advection that can constrain their transport to
the estuary.
The transport processes of C. crangon larvae towards estuaries are still
uncertain. On one hand, some authors stated that larvae are transported
passively, being swirled up in the water column by increasing tidal because of
wind induced currents and sinking down at low current velocities (Rijnsdorp et
al., 1985; Bergman et al., 1989). On the other hand, it has been pointed out that
larvae are also able to control somehow their transport selectively, by swimming
up from the seabed during flood tides and remaining on the seabed during ebb
tides (i.e. selective tidal transport) as observed in flatfish species (Rijnsdorp et
al., 1985; Jager, 1999). Nevertheless, the process of estuarine colonization by
shrimp larvae seems to be influenced by the prevailing weather conditions such
as wind, currents and tides.
The abundance trends of juveniles were also influenced by river runoff.
River runoff was highly variable during the surveyed period, resulting in a series
of drought and non-droughts scenarios. They had responded positively to
higher river runoff, which on one hand might be related with the extension of
river plumes in the coastal areas, which is as observed for several fish species
(e.g. Vinagre et al., 2007; Martinho et al., 2009). On the other hand, juveniles
are more tolerant to lower salinity levels. This means that when the runoff is
high the salinity drops, making the adult population migrate therefore leaving
more space, food availability and reducing the cannibalism (Marchand, 1981),
increasing the density of juveniles.

! 37!
Overall, climate patterns seemed to influence, up to some degree, the
abundance trends of C. crangon over the study period. Since estuaries act as a
nursery area for this species, as well as for several other invertebrates and fish,
they have a potentially critical role in dampening climate-induced stock
fluctuations, as observed by Attrill & Power (2002). Thus, monitoring and
protection measures should be directed towards estuaries, in order to preserve
and enhance their capability of replenishing the coastal (and estuarine) stocks
of commercially exploited estuarine-dependent species.

! 38!
Chapter 5
- BIBLIOGRAPHIC REFERENCES -

! 39!
5. Bibliographic references
Abbott, OJ, Perkins, EJ (1977) The biology of the brown shrimp Crangon
crangon in the Solway Firth. Scientific Report Cumbria Sea Fisheries
Committee 77:1-34.
Alexander, LV, Zhang, X, Peterson, TC, Caesar, J,Gleason, B, Klein Tank,
AMG., Haylock, M, Collins, D, Trewin, B, Rahimzadeh, F, Tagipour, A,
Rupa Kumar, K, Revadekar, J, Griffiths,G, Vincent, L, Stephenson, DB,
Burn, J,Aguilar, E, Brunet,M,Taylor,M,New,M, Amd,M, Rusticucci,
PZ,Vazquez-Aguirre, JL, (2006) Global observed changes in daily
extremes of temperature and precipitation. Journal of Geophysical
Research. 111 22pp.
Aronson, RB, Thatje, A, Clarke, LS, Peck, DB, Blake, Wilga, CD, Seibel, B
(2007) Climate change and invasibility of the Antarctic benthos. The
Annual Review of Ecology, Evolution, and Systematics 38: 129–154.
Attrill, MJ, Power, M (2002) Climatic influence on a marine fish assemblage.
Nature 417: 275-278.
Baeta, A, Niquil, N, Marques, JC, Patrício, J (2011) Modelling the effects of
eutrophication, mitigation measures and an extreme flood event on
estuarine benthic food webs. Ecological Modelling 222: 1209-1221.
Bear, J, Cheng, HD (1999). Seawater Intrusion in Coastal Aquifers – Concepts,
Methods and Practices. Kluwer Academic Publisher, 625.

! 40!
Beck, MW, Heck, KL, Able, KW, Childers, DL, Eggleston, DB, Gillanders, BM,
Halpern, BS, Hays, CG, Hoshino, K, Minello, TJ, Orth, RJ, Sheridan,
PF, Weinstein, MR (2001) The identification, conservation, and
management of estuarine and marine nurseries for fish and
invertebrates. Bioscience 51:633-641.
Berghahn, R, Waltermath, M, Rijnsdorp,D (1992) Mortality of fish from the by-
catch of shrimp vessels in the North Sea. Journal of Applied
Ichthyology. 8: 293-306.
Berghahn, R, Purps, M (1998) Impact of discard mortality in Crangon fisheries
on year-class strength of North Sea flatfish species. Journal of Sea
Research 40: 83–91.
Bessa, F, Baeta, A, Martinho, F, Cotrim, SM, Pardal, MA (2010) Seasonal and
temporal variations in population dynamics of the Carcinus maenas (L.):
the effect of an extreme drought event in a southern European estuary.
90: 867-876.
Beukema, JJ (1979). Biomass and species richness of the macrobenthic
animals living on a tidal flat area in Dutch Wadden Sea. Neatherlands
Journal of Sea Research. 10: 236-261.
Beukema, JJ (1992) Dynamics of juvenile shrimp Crangon cran- gon in a tidal-
flat nursery of the Wadden Sea after mild and cold winters. Marine
Ecology Progress Series 83: 157-165.
Boddeke, R (1976) The seasonal migration of the brown shrimp Crangon
crangon. Netherlands Journal of Sea Research 10: 103–130.

! 41!
Boddeke, R, Dijkema, R, Siemelink, ME (1976) The patterned migration of
shrimp populations: a comparative study of Crangon crangon and
Penaeus brasiliensis. FAO Fisheries Report 200: 31-49.
Boddeke, R, Becker, HB (1979) A quantitative study of the fluctuations of the
stock of brown shrimp (Crangon crangon) along the coast of the
Netherlands. Rapports et Proces-verbaux des Réunions. Conseil
International pour l'Éxploration de la Mer 175: 253-258.
Broekema, MM (1942) Seasonal movements and the osmotic behaviour of the
shrimp Crangon crangon (L.). Archives néerlandaises 6: 1-100.
Campos, J, Van der Veer, HW (2008) Autecology of Cragon crangon (L.) with
an emphasis on latitudinal trends. Oceanography and Marine Biology:
An Annual Review 46: 65-104.
Cardoso, PG, Pardal, MA, Raffaelli, D, Baeta, A, Marques, JC (2004)
Macroinvertebrate response to different species of macroalgal mats and
the role of disturbance history. Journal of Experimental Marine Biology
and Ecology 308: 207-220.
Cardoso, PG, Brandão, A, Pardal, MA, Raffaelli, D, Marques, JC (2005) The
resilience of Hydrobia ulvae populations to anthropogenic and natural
disturbances. Marine Ecology Progress Series 289: 191–199.
Cardoso, PG, Bankovic, M, Raffaelli, D, Pardal, MA (2007) Polychaete
assemblages as indicators of habitat recovery in a temperate estuary
under eutrophication. Estuarine, Coastal and Shelf Science 71: 301–
308.

! 42!
Cardoso, PG, Raffaelli, D, Pardal, MA (2008) The impact of extreme weather
events on the seagrass Zostera noltii and related Hydrobia ulvae
population. Estuarine, Coastal and Shelf Science. 73: 725-734.
Chainho, P, Costa, JL, Chaves, ML, Dauer, DM, Costa, MJ (2007) Influence of
seasonal variability in benthic invertebrate community structure on the
use of biotic indices to assess.
Clarke, KR, Warwick, RM (2001) Change in Marine Communities. An Approach
to Statistical Analysis and Interpretation, second ed. Primer-E,
Plymouth.
Costanza, R, d’Arge, R, de Groot, R, Farber, S, Grasso, M, Hannon, B, Naeem,
S, Limburg, K, Paruelo, J, O'Neill, RV, Raskin, R, Sutton, P, ven den
Belt, M (1997) The value of the world's ecosystem services and natural
capital. Nature 387: 253–60.
Cotrim, SM, Azeiteiro, UM, Martinho, F, Pardal, MA (2007) Climate variability
and planktonic communities: the effect of an extreme event (severe
drought) in a southern European estuary. Estuarine, Coastal and Shef
Science. 73: 725-734.
Criales, MM, Anger, K (1986) Experimental studies on the larval development of
the shrimps Crangon crangon and C. allmanni. Helgol Meeresunters 40:
241-265.
Cunha, PP, Dinis, JL, Reis, RP (1997) Avaliação das modificações antrópicas
actuais nos sub ambientes sedimentares do estuário do Mondego.
Relatório final do projecto PEAM/C/GEN/243/93. Prog. Esp. Ambiente e
JNICT/DGA, 152.

! 43!
Dalley, R (1980) The survival and development of the shrimp Crangon crangon
(L.) reared in the laboratory under non-circadian light-dark cycles.
Journal of Experimental Marine Biology and Ecology. 47: 101-112.
Dauvin, JC (2007) Paradox of estuarine quality: Benthic indicators and indices,
consensus or debate for the future. Marine Pollution Bulletin 55: 271-
281.
Dauvin, JC, Ruellet T (2009) The estuarine quality paradox: It is possible to
define an ecological quality status for specific modified and naturally
stressed estuarine ecosystems? Marine Pollution Bulletin 59: 38-47.
Dolbeth, M, Pardal, MA, Lillebø, AI, Azeiteiro, UM, Marques, JC (2003) Short‐
and long‐term effects of eutrophication on the secondary production of
an intertidal macrobenthic community. Marine Biology 143: 1229‐1238.
Dolbeth, M, Cardoso, PG, Ferreira, SM, Verdelhos, T, Raffaelli, D, Pardal, MA
(2007) Anthropogenic and natural disturbance effects on a
macrobenthic estuarine community over a 10‐year period. Marine
Pollution Bulletin 54: 576-585.
Easterling, DR, Meehl, GA, Parmesan, C, Changnon, SA, Karl, TR, Mearns, LO
(2000) Climate extremes: observations, modeling, and impacts. Science
289: 2068–2074.
Elliott, M (2002) The role of the DPSIR approach and conceptual models in
marine environmental management: an example for offshore wind
power. Marine Pollution Bulletin 44: III-VII.

! 44!
Flemer, DA, Champ, MA (2006) What is the future fate of estuaries given
nutrient over-enrichment, freshwater diversion and low flows? Marine
Pollution Bulletin 52:247-258.
Freitas, V, Campos, J, Fonds, M, Van der Veer, HW (2007) Potential impact of
temperature change on epibenthic predator–bivalve prey interactions in
temperate estuaries . Journal of Thermal Biology 32: 328-340.
Gamito, R, Cabral, H (2003) Mortality of brown-shrimp discards from the beam
trawl fishery in the Tagus estuary, Portugal. Fisheries Research 63:
423–427.
Gayanilo, FCJr, Sparre, P, Pauly, D (2005) FAO-ICLARM Stock Assessment
Tools II (FiSAT II). User’s Guide. FAO Computerized Information Series
(Fisheries). No. 8, Revised version. Food and Agriculture Organisation:
Rome.
Gelin, A, Crivelli, AJ, Rosecchi, E, Kerambrun, P (2000) Is the brown shrimp
Crangon crangon (L.) population of the Vaccares lagoon (Camargue,
France, Rhone delta) an annual population? Comptes Rendus de l
Academie des Sciences. Serie III, Sciences de la Vie 323: 741-748.
Gelin, A, Crivelli, AJ, Rosecchi, E, Kerambrun, P (2001a) Can salinity changes
affect reproductive success in the brown shrimp Crangon crangon.
Journal of Crustacean Biology. 21: 905-911.
Gelin, A, Crivelli, AJ, Rosecchi, E, Kerambrun, P (2001b) The effect of salinity
changes on the population structure and reproductive traits of Crangon
crangon L. populations in the Camargue. Ecoscience. 8:8-17.

! 45!
Gibson, RN (2003) Go with the flow: tidal migration in marine animals.
Hydrobiologia 503: 153-161.
Gleick, PH (2003) Global freshwater resources: Soft‐path solutions for the 21st
century. Science 302: 1524-1528.
Grilo, TF, Cardoso, PG, Dolbeth, M, Bordalo, MD, Pardal, MA (2011) Effects of
extreme climate events on the macrobenthic communities’ structure and
functioning of a temperate estuary. Marine Pollution Bulletin. 62: 303-
311.
Hampel, H, Cattrijsse, A, Elliott, M (2005) Feeding habits of young predatory
fishes in marsh creeks situated along the salinity gradient of the
Schelde estuary, Belgium and The Netherlands. Helgoland Marine
Research 59: 151–162.
Hartsuyker, L (1966) Daily tidal migrations on the shrimp Crangon crangon.
Netherlands Journal of Sea Research 3: 52–67.
Henderson, PA,Holmes, RHA (1987) On the population biology of the common
shrimp Crangon crangon (L.) (Crustacea: Caridea) in the Severn
Estuary and Bristol Channel. Journal of the Marine Biological
Association of the United Kingdom 67: 825–847.
Henriques, M, Gonçalves, EJ, Almada, VC (2007) Rapid shifts in a marine fish
assemblage follow fluctuations in winter sea conditions. Marine Ecology
Progress Series 340: 259-270.

! 46!
Hiddink, JG, Marijnissen, SAE, Troost, K, Wolff, WJ (2002) Predation on O-
group and older year classes of the bivalve Macoma balthica:
interaction of size selection and intertidal distribution of epibenthic
predators. Journal of Experimental Marine Biology and Ecology. 269:
223–248.
Houghton, J (2009) Global Warming — The Complete Briefing, Fourth edition.
Cambridge University Press. 438.
Hoyos, CD, Aqudelo, PA, Webster, PJ, Curry, JA (2006) Deconvolution of the
Factors Contributing to the Increase in Global Hurricane Intensity.
Science 312: 94-97.
Hurrell, JW, Kushnir Y, Ottersen G, Visbeck M (2003) An overview of the North
Atlantic Oscillation. In: Hurrell, J.W., Kushnir, Y., Ottersen, G., Visbeck,
M. (Eds.) The North Atlantic Oscillation: Climatic Significance and
Environmental Impact. Geophysical Monograph Series. 134: 1–35.
Huthnance, JM (1995) Circulation, exchange and water masses at the ocean
margin: the role of physical processes at the shelf edge. Progress in
Oceanography 35: 353-431.
INAG – Instituto Nacional da Água – Portuguese Water Institute
(http://snirh.inag.pt) (04.05.2007).
Innes, J, Pascoe, S (2007) Impact on the profitability of the commercial UK
Crangon fishery . CEMARE Research Paper. pp. 162.
! 47!
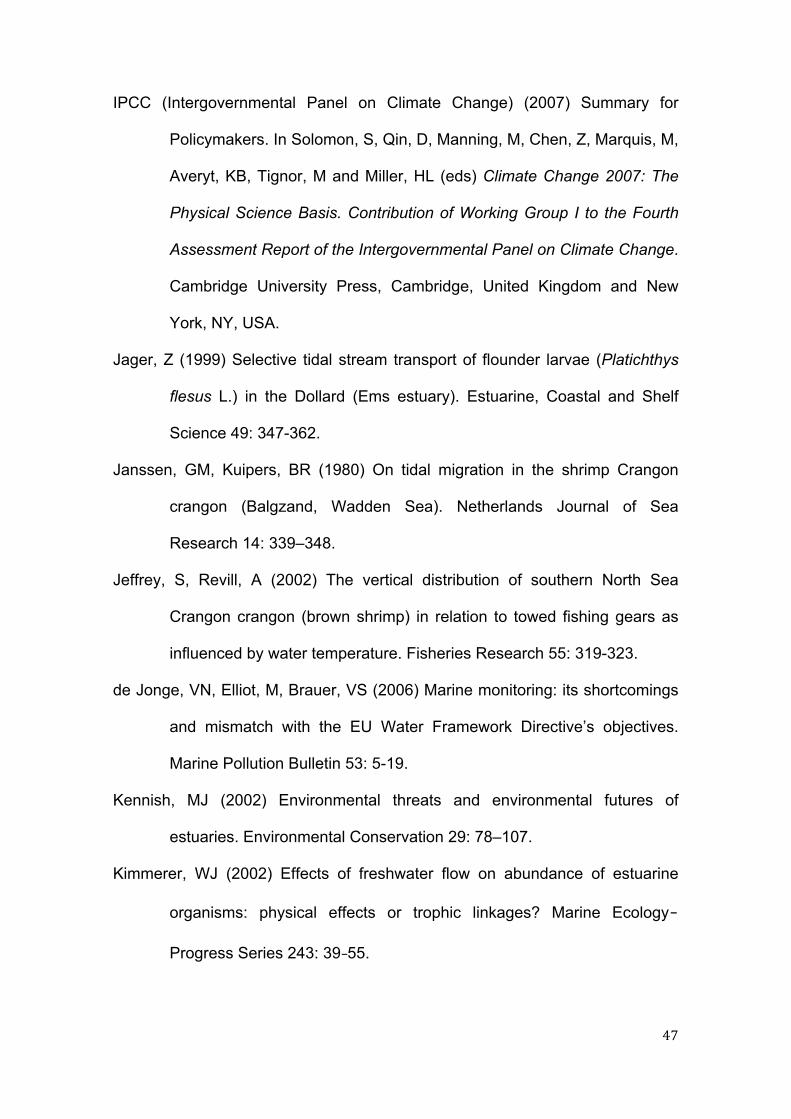
IPCC (Intergovernmental Panel on Climate Change) (2007) Summary for
Policymakers. In Solomon, S, Qin, D, Manning, M, Chen, Z, Marquis, M,
Averyt, KB, Tignor, M and Miller, HL (eds) Climate Change 2007: The
Physical Science Basis. Contribution of Working Group I to the Fourth
Assessment Report of the Intergovernmental Panel on Climate Change.
Cambridge University Press, Cambridge, United Kingdom and New
York, NY, USA.
Jager, Z (1999) Selective tidal stream transport of flounder larvae (Platichthys
flesus L.) in the Dollard (Ems estuary). Estuarine, Coastal and Shelf
Science 49: 347-362.
Janssen, GM, Kuipers, BR (1980) On tidal migration in the shrimp Crangon
crangon (Balgzand, Wadden Sea). Netherlands Journal of Sea
Research 14: 339–348.
Jeffrey, S, Revill, A (2002) The vertical distribution of southern North Sea
Crangon crangon (brown shrimp) in relation to towed fishing gears as
influenced by water temperature. Fisheries Research 55: 319-323.
de Jonge, VN, Elliot, M, Brauer, VS (2006) Marine monitoring: its shortcomings
and mismatch with the EU Water Framework Directive’s objectives.
Marine Pollution Bulletin 53: 5-19.
Kennish, MJ (2002) Environmental threats and environmental futures of
estuaries. Environmental Conservation 29: 78–107.
Kimmerer, WJ (2002) Effects of freshwater flow on abundance of estuarine
organisms: physical effects or trophic linkages? Marine Ecology‐
Progress Series 243: 39-55.
! 48!
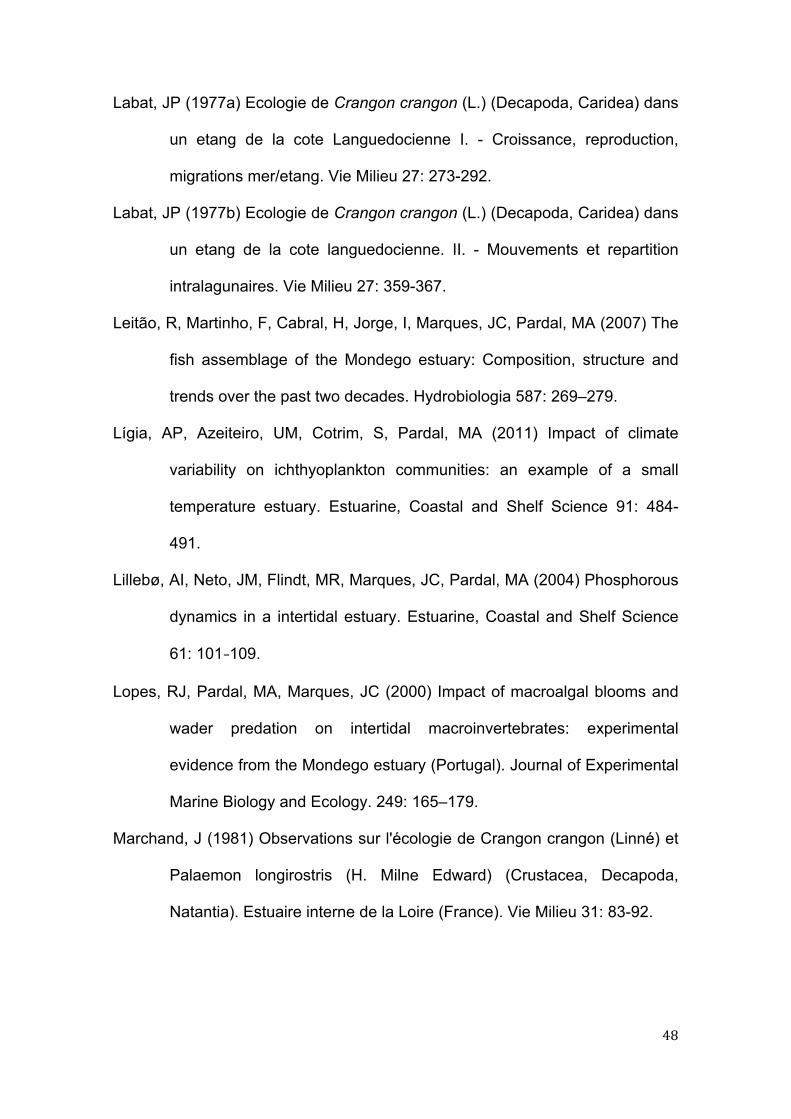
Labat, JP (1977a) Ecologie de Crangon crangon (L.) (Decapoda, Caridea) dans
un etang de la cote Languedocienne I. - Croissance, reproduction,
migrations mer/etang. Vie Milieu 27: 273-292.
Labat, JP (1977b) Ecologie de Crangon crangon (L.) (Decapoda, Caridea) dans
un etang de la cote languedocienne. II. - Mouvements et repartition
intralagunaires. Vie Milieu 27: 359-367.
Leitão, R, Martinho, F, Cabral, H, Jorge, I, Marques, JC, Pardal, MA (2007) The
fish assemblage of the Mondego estuary: Composition, structure and
trends over the past two decades. Hydrobiologia 587: 269–279.
Lígia, AP, Azeiteiro, UM, Cotrim, S, Pardal, MA (2011) Impact of climate
variability on ichthyoplankton communities: an example of a small
temperature estuary. Estuarine, Coastal and Shelf Science 91: 484-
491.
Lillebø, AI, Neto, JM, Flindt, MR, Marques, JC, Pardal, MA (2004) Phosphorous
dynamics in a intertidal estuary. Estuarine, Coastal and Shelf Science
61: 101-109.
Lopes, RJ, Pardal, MA, Marques, JC (2000) Impact of macroalgal blooms and
wader predation on intertidal macroinvertebrates: experimental
evidence from the Mondego estuary (Portugal). Journal of Experimental
Marine Biology and Ecology. 249: 165–179.
Marchand, J (1981) Observations sur l'écologie de Crangon crangon (Linné) et
Palaemon longirostris (H. Milne Edward) (Crustacea, Decapoda,
Natantia). Estuaire interne de la Loire (France). Vie Milieu 31: 83-92.

! 49!
Marques, JC (1982) Estudo ambiental do estuario do Tejo - Decapodes do
estuario do Tejo: distribuicao das especies e estudo da variacao
sazonal e ciclo reprodutivo das populacoes de Carcinus maenas
(Decapoda,Brachyura), Crangon crangon, Palaemon longirostris e
Palaemon serratus (Decapoda, Caridea).Laboratorio Maritimo da Guia,
Lisboa, Portugal.
Marques, JC, Nielsen, SN, Pardal, MA, Jørgensen, SE (2003) Impact of
eutrophication and river management within a frame- work of
ecosystem theories. Ecological Modelling 166: 147-168.
Marques, JC, Neto, JM, Patrício, J, Pinto, R, Teixeira, H, Veríssimo, H (2007)
Monitorização do estuário do Mondego: Alterações antropogénicas e
seu impacto na qualidade ecológica. Resultados preliminares relativos
à primeira avaliação dos efeitos da reabertura da comunicação entre os
braços Norte e Sul no estado de eutrofização do sistema. Relatório
Final, Janeiro 2007. IMAR/INAG, 88p.
Martinho, F (2005) O estuário do Mondego como viveiro para a ictiofauna:
ecologia dos juvenis de Dicentrarchus labrax, Platichthys flesus e Solea
solea. Depto de Zoologia, Faculdade de Ciências e Tecnologia da
Universidade de Coimbra, 66 pp.
Martinho, F, Leitão, R, Viegas, I, Dolbeth, M, Neto, J, Cabral, HN, Pardal, MA
(2007) The influence of an extreme drought event in the fish community
of a southern Europe temperate estuary. 75: 537-546.
! 50!
Martinho, F, Leitão, R, Neto, JM, Cabral, H, Lagardère, F, Pardal, MA (2008)
Estuarine colonization, population structure and nursery functioning for
0-group sea bass (Dicentrarchus labrax), flounder (Platichthys flesus)
and sole (Solea solea) in a mesotidal temperate estuary. Journal of
Applied Ichthyology. 24: 229-237.
Martinho, F, Dolbeth, M, Viegas I,Teixeira, CM, Cabral, HN, Pardal, MA (2009)
Environmental effects on the recruitment variability of nursery species.
Estuarine, Coastal and Shelf Science 83: 460–468.
Martinho, F, Leitão,R, Neto,J, Cabral, HN, Marques JC, Pardal MA (in press)
The use of nursery areas by juvenile fish in a temperate estuary,
Portugal. Hydrobiologia
Mason, E, Santos, AMP, Peliz, AJ (2005) Western Iberian winter wind indices
based on significant wind events. Ocean Science Discussions 2: 105-
127.
McLusky, DS, Elliott, M (2004) The estuarine ecosystem: Ecology, threats and
management. 3rd Ed. Oxford University Press, Oxford, 214pp.
Meredith, SS (1952) A study of Crangon vulgaris in the Liverpool Bay area.
Proc. Trans. Liverpool Biol. Soc. 58: 75-109.
Micaleff, H, Evans, F (1968) The Marine Fauna of Malta. Royal University of
Malta, Biology Department, Malta: Malta University Press.
Miranda, PMA, Valente, MA, Tomé, AR, Trigo, R, Coelho, FES, Aguiar, A,
Azevedo, EB (2006) O Clima de Portugal nos séculos XX e XXI. In:
Santos, F.D., Miranda, P. (Eds.) Alterações climáticas em Portugal,
cenários, impactos e medidas de adaptação ‐ SIAM II Project. Gradiva,
Lisboa, pp. 47-113.

! 51!
Mirza, MMQ (2003) Climate change and extreme weather events: can
developing countries adapt? Climate Policy 3: 233‐248.
Moles, Jr MC (1999) Ecology: Concepts and Applications. 1st Ed. McGraw‐Hill,
United States of America, 509pp.
Muus, BJ (1967) The fauna of Danish estuaries and lagoons. Distribution and
ecology of dominating species in the shallow reaches of the mesohaline
zone. Medd. Kom. Dan. Fisk. Havunders., Fisk 5, 1-316.
Nehls, G, Tiedemann, R (1993) What determines the densities of feeding birds
on tidal flats—a case-study on dunlin, Calidris alpina, in the Wadden
Sea. Netherlands Journal of Sea Research. 31: 375–384.
Nichols, F, Cloern, J, Luoma, S, Peterson, D (1986) The modification of an
estuary. Science 231:567–573.
Norkko, A (1998) The impact of loose-lying algal mats and predation by the
brown shrimp Crangon crangon (L) on infaunal prey dispersal and
survival. Journal of Experimental Marine Biology and Ecology. 221: 99–
116.
Oh, C.-W., R.G. Hartnoll and R. D.M. Nash. – 2001. Feeding ecol- ogy of the
common shrimp Crangon crangon in Port Erin Bay, Isle of Man, Irish
Sea. Mar. Ecol. Prog. Ser., 214: 211-223.
Pardal, MA, Marques, JC, Metelo, I, Lillebø, AI, Flindt, MR (2000) Impact of
eutrophication on the life cycle, population dynamics and production of
Ampithoe valida (Amphipoda) along an estuarine spatial gradient
(Mondego estuary, Portugal). Marine Ecology Progress Series. 196:
207-219.

! 52!
Pardal, MA, Cardoso, PG, Sousa, JP, Marques, JC, Raffaelli, D (2004)
Assessing environmental quality: a novel approach. Marine Ecology
Progress Series 267: 1–8.
Pascoe, S, Revill A (2004) Costs and Benefits of Bycatch Reduction Devices in
European Brown Shrimp Trawl Fisheries. Environmental & Resource
Economics. 27: 43-64.
Pihl, L, Rosenberg, R (1982) Production, abundance and biomass of mobile
epibenthic marine fauna in shallow waters, western Sweden. Journal of
Experimental Marine Biology and Ecology 57: 273–301.
Pihl, L, Rosenberg, R (1984) Food selection and consumption of the shrimp
Crangon crangon in some shallow marine areas in western Sweden.
Marine Ecology Progress Series. 15: 159-168.
Pihl, L, Cattrijsse, A, Codling, I, Mathieson, S, McLusky, DS, Roberts, C (2002)
Habitat use by fishes in estuaries and other brackish areas. In: Elliott,
M., Hemingway, K.L. (Eds.), Fishes in Estuaries. Blackwell Science.
Bodmin, United Kingdom, pp 10-53.
Polet, H (2002) Selectivity experiments with sorting grids in the North Sea
brown shrimp (Crangon crangon) fishery. Fisheries Research. 54: 217-
233.
Richmond, C, Wethey, DS, Woodin, SA (2007) Climate change and increased
environmental variability: demographic responses in an estuarine
harpacticoid copepod. Ecological Modelling 209: 189–202.

! 53!
Risnsdeorp, AD, van Stralen, M, van der Veer, HW (1985) Selective tidal
transport of North Sea plaice larvae Pleuronectes platessa in coastal
nursery areas. Transactions of the American Fisheries Society 114:
461-470.
Santos, FD, Forbes, K, Moita, R (2002) Climate Change in Portugal. Scenarios
Impacts and Adaptation Measures e SIAM Project. Gradiva Publishers,
Lisbon, Portugal. p. 456.
Schockaert, E (1968) Contribuition a l'etude de la croissance et de la
reproduction de la crevette grise (Crangon crangon L.) au large de la
cote belge. Biol. Jaarboek 3: 169-179.
Siegal, V, Groger, J, Neudecker, T, Damn, U, Jansen, S (2005) Long-term
variation in abundance of the brown-shrimp Crangon crangon (L.)
population of the German bighted and possible causes for its
interannual variability. Fisheries Oceanography. 14: 1-16.
Smaldon, G, Holthuis LB, Fransen, CHJM (1993) Coastal Shrimps and prawns.
Second edition. Synopses of British Fauna 15: 142.
Smyth, TJ, Miller, PI, Groom, SB, Lavender, SJ (2001) Remote sensing of sea
surface temperature and chlorophyll during Lagrangian experiments at
the Iberian margin. Progress in Oceanography 51: 269-281.
Spaargaren, DH (2000) Seasonal and annual variations in the catches of
Crangon crangon (L., 1758) (Decapoda, Natantia) near the coast of
Texel, The Netherlands. Crustaceana 73: 547–563.
Spaargaren, DH (1980) The significance of seawater viscosity for the tidal
transport of commom shrimps,Crangon crangon (L.). Ophelia 19: 145-
153.

! 54!
Tallaksen, LM, Madsen, H, Clausen, B (1997) On the definition and model- ling
of streamflow drought duration and volume. Hydrological Sciences
Journal. 42: 1-33.
Teixeira, CM, Cabral, NH (2009) Time series analysis of flatfish landings in the
Portuguese coast. Fisheries Research. 96: 252-258
Thibault, KM, Brown, JH (2008) Impact of an extreme climatic event on
community assembly. Ecology 105: 3410–3415.
Thiel, R, Sepúlveda, A, Kafemann, R, Nellen, W (1995) Environmental factors
as forces structuring the fish community of the Elbe estuary. Journal of
Fish Biology 46: 47-69.
Tiews, K (1954) Die biologischen Grundlagen der Büsumer Garnelenfischerei.
Berichte der Deutschen Wissenschaftlichen Kommission für
Meeresforschung 13: 235–269.
Tiews, K (1970) Synopsis of biological data on the common shrimp Crangon
crangon (Linnaeus, 1758). FAO Fish Synopsis. 57: 1167-1224.
Van Donk, E, De Wilde, PJ (1981) Oxygen consumption and motile activity of
the brown shrimp Crangon crangon related to temperature and body
size. Netherlands Journal of Sea Research. 15: 54-64.
Van der Veer, HW, Berghahn, R, Miller, J, Rijnsdorp, AD (2000) Recruitment in
flatfish, with special emphasis on North Atlantic species: progress made
by the Flatfish Symposia. ICES Journal of Marine Science. 57: 202–
215.

! 55!
Vasconcelos, RP, Reis‐Santos, P, Fonseca, V, Maia, A, Ruano, M, França, S,
Vinagre, C, Costa, MJ, Cabral, H (2007) Assessing anthropogenic
pressures on estuarine fish nurseries along the Portuguese coast: A
multi‐metric index and conceptual approach. Science of the Total
Environment 374: 199-215.
Viegas, I, Martinho, F, Neto, J, Pardal, MA (2007) Population dynamics,
distribution and secondary production of the brown shrimp Crangon
crangon (L.) in a southern European estuary. Latitudinal variations.
Scientia Marina 71: 451-460.
Vinagre, C, Costa, MJ, Cabral, HN (2007) Impact of climate and hydrodynamics
on sole larval immigration towards the Tagus estuary, Portugal.
Estuarine, Coastal and Shelf Science 75: 516-524.
Vinebrooke, RD, Cottingham, KL, Norberg, J, Scheffer, M, Dodson, SI, Maberly,
SC, Sommer, U (2004) Impacts of multiple stressors on biodiversity and
ecosystem functioning: the role of species co- tolerance. Oikos 104:
451-457.
Wennhage, H (2002) Vulnerability of newly settled plaice Pleuronectes platessa
L. to predation: effects of habitat structure and predator functional
response. Journal of Experimental Marine Biology and Ecology. 269:
129– 145.
Whitfield, AK (1999) Ichthyofaunal assemblages in estuaries: a South African
case study. Reviews in Fish Biology and Fisheries 9: 151–186.
Winberg, GG (1971) Methods for the Estimation of Production of Aquatic
Animals. Academic Press: London.